Attached files
Table of Contents
UNITED STATES
SECURITIES AND EXCHANGE COMMISSION
Washington, D.C. 20549
Form 10-K
| x | ANNUAL REPORT PURSUANT TO SECTION 13 OR 15(d) OF THE SECURITIES EXCHANGE ACT OF 1934 |
| For the fiscal year ended December 26, 2009 |
OR
| ¨ | TRANSITION REPORT PURSUANT TO SECTION 13 OR 15(d) OF THE SECURITIES EXCHANGE ACT OF 1934 |
| For the transition period from to |
Commission file number: 001-33486
Infinera Corporation
(Exact name of registrant as specified in its charter)
| Delaware | 77-0560433 | |
| (State or other jurisdiction of incorporation or organization) |
(IRS Employer Identification No.) |
169 Java Drive
Sunnyvale, CA 94089
(Address of principal executive offices, including zip code)
(408) 572-5200
(Registrant’s telephone number, including area code)
Securities registered pursuant to Section 12(b) of the Act:
| Title of Each Class |
Name of Each Exchange on Which Registered | |
| Common Stock, $0.001 Par Value | The NASDAQ Global Select Market |
Securities registered pursuant to Section 12(g) of the Act: None
Indicate by check mark if the registrant is a well-known seasoned issuer, as defined in Rule 405 of the Securities Act. Yes ¨ No x
Indicate by check mark if the registrant is not required to file reports pursuant to Section 13 or 15(d) of the Act. Yes ¨ No x
Indicate by check mark whether the registrant (1) has filed all reports required to be filed by Section 13 or 15(d) of the Securities Exchange Act of 1934 during the preceding 12 months (or for such shorter period that the registrant was required to file such reports), and (2) has been subject to such filing requirements for the past 90 days. Yes x No ¨
Indicate by check mark whether the registrant has submitted electronically and posted on its corporate Web site, if any, every Interactive Data File required to be submitted and posted pursuant to Rule 405 of Regulation S-T (§232.405 of this chapter) during the preceding 12 months (or for such shorter period that the registrant was required to submit and post such files). Yes ¨ No ¨
Indicate by check mark if disclosure of delinquent filers pursuant to Item 405 of Regulation S-K (§229.405 of this chapter) is not contained herein, and will not be contained, to the best of registrant’s knowledge, in definitive proxy or information statements incorporated by reference in Part III of this Form 10-K or any amendment to this Form 10-K. x
Indicate by check mark whether the registrant is a large accelerated filer, an accelerated filer, a non-accelerated filer, or a smaller reporting company. See definition of “accelerated filer, large accelerated filer and smaller reporting company” in Rule 12b-2 of the Exchange Act. (Check one):
| Large accelerated filer ¨ | Accelerated filer x | Non-accelerated filer ¨ | Smaller reporting company ¨ | |||
| (Do not check if a smaller reporting company) | ||||||
Indicate by check mark whether the registrant is a shell company (as defined in Rule 12b-2 of the Exchange Act). Yes ¨ No x
The aggregate market value of the registrant’s common stock, $0.001 par value per share, held by non-affiliates of the registrant on June 26, 2009, the last business day of the registrant’s most recently completed second fiscal quarter, was approximately $585,152,550 (based on the closing sales price of the registrant’s common stock on that date). Shares of the registrant’s common stock held by each officer and director and each person who owns more than 5% or more of the outstanding common stock of the registrant have been excluded in that such persons may be deemed to be affiliates. This determination of affiliate status is not necessarily a conclusive determination for other purposes. As of February 19, 2010, 97,701,546 shares of the registrant’s common stock, $0.001 par value per share, were issued and outstanding.
DOCUMENTS INCORPORATED BY REFERENCE
| (1) | Portions of the registrant’s Proxy Statement for its 2010 Annual Meeting of Stockholders to be filed pursuant to Regulation 14A are incorporated by reference into Part III of this Annual Report on Form 10-K where indicated. |
Table of Contents
ANNUAL REPORT ON FORM 10-K
For the Fiscal Year Ended December 26, 2009
Table of Contents
Table of Contents
Overview
Infinera Corporation (“we” or “Infinera”) is the leading provider of optical networking systems based on Photonic Integration technology. We provide products across the entire range of multi-wavelength optical communications applications, from metro access and metro core through long-haul and submarine transmission. Over 60 customers, including national and multi-national telecom carriers, cable television operators and internet content providers use our products in their fiber optic backbone networks.
Infinera created what we believe to be the world’s only commercially-deployed, large-scale photonic integrated circuit (“PIC”). Our PICs transmit and receive 100 Gigabits per second (“Gbps”) of optical capacity and incorporate the functionality of over 60 discrete optical devices into a pair of indium phosphide chips approximately the size of a child’s fingernail. We use these PICs in our optical telecom system, the Digital Transport Node System (“DTN System”). We believe the DTN System offers customers unique advantages due to its integration of optical transmission with advanced digital bandwidth management and an intelligent software operating system.
Since 2004, we have expanded our product line and are pursuing even more capable PICs for our future products. In 2008, we introduced the Infinera Line System 2 (“ILS2”), which is designed to extend the reach and optical capacity of our DTN System. In 2009, we introduced enhanced functionality applications for the DTN System that enable the use of the DTN System for submarine networks. In 2009, we also introduced the ATN System, a metro access platform that extends Infinera’s digital bandwidth management and intelligent software operating system benefits to the network edge. Both the DTN System and ATN System are designed to operate as a tightly-integrated network with a single management system. In 2009, we also announced continued progress on our 400Gbps PICs, which we plan to use in our future, higher capacity products and which integrate the functionality of over 200 discrete optical devices into a pair of chips.
We believe that growth of communications services including video and the mobile internet will result in continued bandwidth growth and therefore growth of demand for optical network capacity. Our goal is to be the preeminent supplier of multi-wavelength optical networking systems by offering a superior product set based on innovative technology and engineering. We strive to deliver product superiority in several areas: we believe our PICs enable greater scalability and higher reliability than competitive options; we believe our integrated bandwidth management and software intelligence allow lower costs through simpler, more flexible network operations; and we believe the integration of our various products allows more efficient use of bandwidth and other network resources.
“Infinera,” “Infinera DTN,” “ATN,” “IQ,” “I-PIC,” “Infinera Digital Optical Network,” “Bandwidth Virtualization” and other trademarks or service marks of Infinera Corporation appearing in this report are the property of Infinera Corporation. This report contains additional trade names, trademarks and service marks of other companies. We do not intend our use or display of other companies’ trade names, trademarks or service marks to imply a relationship with, or endorsement or sponsorship of us by, these other companies.
Infinera was founded in December 2000, originally operated under the name “Zepton Networks,” and is headquartered in Sunnyvale, California. We began commercial shipment of our DTN System in November 2004. We are incorporated in the State of Delaware. Our principal executive offices are located at 169 Java Drive, Sunnyvale, CA 94089. Our telephone number is (408) 572-5200.
Industry Background
Optical communications equipment carries digital information using light waves over fiber optic networks. The advent of wavelength division multiplexing (“WDM”) systems has enabled the transmission of larger amounts of data by using multiple wavelengths over a single optical fiber. Service providers often use wavelength division multiplexing systems to carry communications traffic between cities, referred to as long-haul networks, and within large metropolitan areas, referred to as metro networks. Fiber optic networks are generally capable of carrying most types of communications traffic, from conventional long-distance telephone calls to e-mails and web sessions to high-definition video streams. As traffic grows, service providers add capacity to existing networks or purchase and deploy additional systems to keep pace with bandwidth demands and service expansion. Fiber optic networks typically are expensive and complex, and service providers have been focused on generating new revenue while continuing to reduce operating and capital costs.
1
Table of Contents
Increased Demand for Network Capacity
We believe that a number of trends in the communications industry are driving growth in demand for network capacity and ultimately will increase demand for optical communications systems, including our DTN System and ATN System. These trends include growth in bandwidth-intensive applications like video, proliferation of the wireless internet due to smartphones and computers with wireless access, as well as continued penetration of broadband Internet connectivity.
We believe that service providers and other network operators are constantly seeking out solutions that allow them to increase their profit margins or expand their service offerings, specifically demanding:
| • | lower costs for deploying, provisioning, and managing bandwidth; |
| • | more efficient use of bandwidth, electrical power, and physical space; |
| • | faster operations to reduce cycle times of common operational tasks; |
| • | improved integration between the Internet Protocol (“IP”) equipment such as routers and optical networking equipment; and |
| • | higher reliability to avoid costs of downtime. |
We believe that the Infinera product set, which includes unique features enabled by our PICs coupled with digital bandwidth management and intelligent software, is uniquely enabled to deliver improvements in these areas compared to conventional WDM systems offered by our competitors.
Our PIC technology facilitates a network architecture, the Digital Optical Network, which allows communications service providers to realize the benefits of both wavelength division multiplexing and digital processing more fully and cost-effectively. We believe that our DTN System and our Digital Optical Network architecture enable the improvement of the economics, operating simplicity, flexibility, reliability and scalability of our customers’ optical networks.
Our PICs enable our DTN System to provide lower-cost optical to electrical to optical conversions at every network access point to provide communications service providers with the ability to digitally process the information being transported across their optical networks. Our DTN System’s software enables our customers to leverage this digital information to simplify and speed the delivery of differentiated services and to optimize the utilization of their optical networks.
The Infinera Strategy
Our goal is to be a preeminent provider of optical systems to communications service providers. Key aspects of our strategy are:
| • | Increase our customer footprint. During 2009, we continued to diversify our customer base in terms of markets served, expanding beyond our original core market of bandwidth wholesalers into the fast-growing cable multiple system operator (“MSO”) and internet content provider markets. We now count all of the top North American MSOs as customers, as well as some of the top internet content providers, many of the North American national footprint bandwidth wholesalers, and a number of service providers with submarine networks. We intend to increase penetration of our installed base of customers while also targeting new U.S. and international communications service providers, including U.S. regional Bell operating companies, international postal, telephone and telegraph companies, and other operators of fiber optic networks around the world. In 2009, our presence outside of North America also grew with an increased portion of our revenue coming from Europe, Middle East and Africa, Other Americas and Asia Pacific. |
| • | Penetrate adjacent markets. We believe that our Digital Optical Network architecture can benefit submarine network operators, government, MSOs, research and educational institutions, and internet content provider markets in the same way it does long-haul or wholesale carriers and independent operator markets. We intend to increase our addressable markets by continually adding functionality to our products and by developing the service and support infrastructure needed to address these markets. |
| • | Maintain and extend our technology lead. We intend to incorporate the functionality of additional discrete devices into our PICs to continue our work on advanced modulation technologies and to pursue further functional integration in our products in order to enhance their performance, scalability and economics. |
2
Table of Contents
| • | Continue investment in PIC manufacturing activities. We believe that our vertical integration and manufacturing capabilities serve as a competitive advantage and intend to continue to invest in the manufacturing capabilities needed to produce new generations of our PICs. |
Products
Infinera DTN System
Our DTN System utilizes our PIC technology to enable digital processing and management of data with the capability both to generate wavelength division multiplexing wavelengths and to add, drop, switch, manage, protect and restore network traffic digitally. The DTN System can automate the connection of circuits and provisioning of new services without costly and cumbersome manual intervention.
Our DTN System is modular in design to provide our customers with the ability to add capacity in a cost-efficient manner. The initial deployment of our DTN System at a customer site involves the installation of a line system (including common equipment, such as a chassis, management controller and related equipment). Customers can add capacity to the DTN System by purchasing our Digital Line Modules, or DLMs, Tributary Adapter Modules, or TAMs and Tributary Optical Modules, or TOMs. We believe that the density and the modular architecture of the DTN System enable significant flexibility and scalability for communications service providers.
Our DTN System is carrier-class, which means that it complies with applicable Telcordia and equivalent major international standards for central office-based network elements. Our DTN System supports a broad range of optical service interfaces including Ethernet (Gigabit Ethernet (“GbE”) and 10GbE) and separate synchronous optical network/synchronous digital hierarchy.
Infinera DTN for Submarine Network Applications
For submarine transport applications, the DTN System can be used as a Submarine Line Terminating Equipment (“SLTE”) node at submarine cable head-end sites, enabling undersea service providers to upgrade existing submarine cables to 25GHz channel spacing, thereby doubling the total optical capacity of many traditional submarine systems to 80 wavelengths or more per fiber for distances up to 6500km. The DTN System also provides dispersion compensation that is significantly simpler and cheaper than the per-channel dispersion management of many existing SLTE systems. Combined with the benefits of our DTN System’s digital operations and software automation, we believe that Infinera’s SLTE solution using the DTN System significantly reduces engineering complexity for submarine cable upgrade deployments and channel adds, allowing submarine network operators to deploy additional capacity on existing cable systems faster, and often at lower cost compared to existing SLTE systems.
Infinera Line System 2
Infinera DTN Systems are built upon and connected to one another using an optical “line system.” The Infinera Line System 2 (“ILS2”) provides optical amplification, and provides the management communications channel between network nodes and allows the customer to deploy optical capacity to carry customer traffic on its network. ILS2, announced in 2008, combines up to 1.6 Terabits per second of optical capacity onto a single fiber. Infinera’s bandwidth management allows our customers to manage and utilize this pool of available capacity to satisfy its customer requirements, including through 40Gbps, 10Gbps or 2.5Gbps wavelengths. In addition to increasing the optical capacity, ILS2 includes new amplifier types that are designed to increase the distance or reach between DTN Systems. ILS2 also lays the foundation for future Infinera systems and is designed to scale in the future to support up to 8 Terabits per second of optical capacity on a single fiber pair. ILS2 is fully integrated into Infinera’s management and control software and can be managed seamlessly within the DTN System.
Infinera ATN System
The Infinera ATN System’s metro edge platform is a state-of-the-art coarse and dense wavelength division multiplexing aggregation and transport solution designed with 400Gbps of total capacity, which can be allocated in various transmission speeds, including for example, using up to 40 wavelengths of 10Gbps. The ATN System’s platform can be used to extend the Digital Optical Network architecture benefits of the Infinera DTN platform, and can also be used as a standalone WDM access system.
Implementing numerous features in support of simplicity of use and operations, the Infinera ATN System is a cost-effective, efficient multiservice aggregation and transport platform. The Infinera ATN System supports direct wavelength connectivity to DTN nodes, reducing equipment costs and providing unique Bandwidth Virtualization capabilities across integrated ATN/DTN networks.
3
Table of Contents
Infinera IQ Network Operating System and Management Suite
The IQ Network Operating System is our embedded software operating system which enables our customers to simplify and speed up the tasks they perform to deliver, differentiate, and manage services and to optimize the utilization of their networks. The IQ Network Operating System for the DTN System generalizes multiprotocol label switching (“GMPLS”) for end-to-end provisioning, protection and restoration services, and a host of performance monitoring and software-definable testing capabilities.
Infinera Management Suite
The Infinera Management Suite is a broad set of standards-based network and element management tools and Operations Support System integration interfaces that are used by our customers to manage their DTN Systems. Our management suite software includes our Digital Network Administrator, a scalable, robust, feature-rich Element Management System, and our Graphical Node Manager, an easy-to-use web-based management interface. Our hardware platforms, the DTN System and ATN System, are managed in an integrated fashion by the Infinera Management Suite.
Technology
Digital Optical Network Architecture
Infinera was founded with a vision of increasing the functionality and improving the economics of optical transport systems. To that end, our core engineering team consists of optical component and systems experts who have collaborated to create an innovative optical communications architecture that is designed to combine enhanced performance, system-wide simplicity and efficiency with the ability to be manufactured in a cost-efficient manner. We have focused our efforts, time and capital on developing our Digital Optical Network architecture and our system products.
Our Digital Optical Network architecture is designed to allow our customers to expand service reach, expedite service provisioning, ensure reliability and more effectively manage, monitor and scale their networks by processing data digitally rather than in analog format. We believe that the key to delivering this capability in a cost-effective manner is integrating the functionality of multiple discrete devices into a single set of semiconductor chips. This integration allows us to eliminate separate optical packages for each discrete optical device, which we believe is the largest cost challenge facing traditional systems. This integration has further enabled us to provide additional functionality and intelligence to our optical communications systems.
Infinera PIC
We believe that our proprietary PICs are a key source of our value proposition and competitive advantage. We manufacture and package our PICs at our own facilities for use exclusively with our DTN System. We began the design and manufacture of our PICs shortly after we were founded in December 2000. We employ a multi-disciplinary approach towards the development and manufacturing of our PICs, with significant interaction between our manufacturing, system engineering and advanced technology groups. As a leader in the development of photonic integration, we have protected the intellectual property associated with our PIC manufacturing through a combination of trade secrets, patents and contractual protections. We believe that as a result of the combination of the multiple disciplines that were required to develop our PIC, together with the intellectual property protections that we have established, it will be difficult for others to duplicate the technology we have developed.
Our DTN System transmits optical capacity, utilizing a pair of PICs, in increments of 100Gbps of optical capacity, based on 10Gbps optical signals. Our transmitter PIC integrates the functionality of 51 optical devices onto a single chip, including lasers and modulators. In addition, our receiver PIC integrates the functionality of 11 optical devices onto a single chip, including photo-detectors and an optical de-multiplexer.
We have designed our next-generation PICs to transmit optical capacity in increments of 400Gbps, based on 40Gbps optical signals. Our next-generation commercial PICs are designed to integrate the functionality of over 200 devices onto a pair of chips. We have predicted a Moore’s law-like “PIC Roadmap” which posits that capacity per PIC will double every three years.
4
Table of Contents
Customers
As of December 26, 2009, we have sold our DTN Systems and ATN Systems for deployment in the optical networks of 69 customers worldwide, including customers in each of the following customer segments:
| • | carrier; |
| • | MSO; |
| • | internet content provider; |
| • | incumbent carrier; |
| • | research and education/government; and |
| • | reseller. |
Our announced customers include Cox Communications, Deutsche Telekom, Global Crossing, Interoute and Level 3. Our most recently announced product, the ATN System, has 6 customer deployments including Deltacom and Tiscali. We do not have long-term purchase commitments with our customers.
In 2009, 2008 and 2007, Level 3 accounted for approximately 17%, 25% and 47% of our revenue, respectively. In 2009 and 2008, the Company had no other customer that represented over 10% of the Company’s revenue. In 2007, the Company had one other customer that represented over 10% of the Company’s revenue.
Support and Services
We offer our customers a range of product support offerings, including 24/7/365 hardware and software technical support, installation and deployment services, spares management, first line maintenance services, on-site technical services, professional services, product technical training and extended product warranties. Our customer support services are provided by our employees and augmented where necessary by third-party strategic support partners. We believe that providing ongoing customer and technical support is critical to successful long-term relationships with, and follow-on sales to, our customers. We are committed to providing our customers with the highest levels of technical support and service on a global scale.
Sales and Marketing
We market and sell our products and related support services primarily through our direct sales force, supported by marketing and product management personnel. We may also use distribution or support partners to enter new markets or when requested by a potential customer. Our sales team has significant previous experience with the buying process and sales cycles typical of high-value telecommunications products. We expect to continue to add sales and support employees as we grow our business.
The sales process for our products entails discussions with prospective customers, analyzing their existing networks and identifying how they can utilize our systems capabilities within their networks. This process requires developing strong customer relationships, and we expect to leverage our sales force and customer support capabilities to establish relationships with both domestic and international service providers.
Over the course of the sales cycle, service providers often test our products before buying. Prior to commercial deployment, the service provider will generally perform a field trial of our products. Upon successful completion, the service provider generally accepts the products installed in its network and may continue with commercial deployment of additional products. We anticipate that our sales cycle, from initial contact with a service provider through the signing of a purchase agreement, may, in some cases, take several quarters.
Direct Sales Force. Our sales team sells directly to service providers worldwide. We maintain sales presences throughout the United States as well as in a number of international locations, including China, Japan, Singapore, France, Germany, Spain, Italy, Netherlands and the United Kingdom.
Indirect Sales Force. We have and will continue to employ business consultants, resale partners and sales agents to assist in our sales efforts to accelerate and strengthen our customer relationships. We expect to work with business partners to assist our customers in the sale, deployment and maintenance of our systems and have entered into distribution and resale agreements to facilitate the sale of our products.
Marketing and Product Management. Our product management team is responsible for defining the product features and roadmap required to maximize our success in the marketplace. Product management supports our sales efforts with product and application expertise. Our marketing team works to create demand for our products by communicating our value proposition and differentiation in direct customer interaction, public relations, tradeshows, events and web and other marketing channels.
5
Table of Contents
Research and Development
Continued investment in research and development is critical to our business. To this end, we have assembled a team of engineers with expertise in various fields, including systems, sub-systems and components. Our research and development efforts are currently focused in Sunnyvale, California, Allentown, Pennsylvania, Beijing, China, Bangalore, India and Kanata, Canada. We have invested significant time and financial resources into the development of our Digital Optical Network architecture, our DTN System and ATN System, including the IQ Network Operating System and Management Suite software, the PIC and our manufacturing capabilities. We will continue to expand our product offerings and capabilities in the future and plan to dedicate significant resources to these continued research and development efforts. We are continually increasing the scalability and software features of our current DTN System, and developing additional functionality and new products, including products for metro applications. We are also working to develop new generations of PICs, and we intend to leverage further integration in our Digital Optical Network architecture and our DTN System through continued research and development and investments in our manufacturing capabilities.
Our research and development expenses were $97.2 million, $80.4 million and $60.9 million in 2009, 2008 and 2007, respectively.
Employees
As of December 26, 2009, we had 974 employees. A total of 291 of those employees were located outside of the United States. None of our employees are represented by labor unions or covered by a collective bargaining agreement. We have not experienced any work stoppages, and we consider our employee relationships to be good.
Manufacturing
We have invested significant time and capital to develop and improve the manufacturing process that we use to produce and package our PICs. This includes significant investments in personnel and the facilities to manufacture and package our PICs in Sunnyvale, California and Allentown, Pennsylvania. We also have invested in automating our manufacturing process and in training and maintaining the quality of our manufacturing workforce. As a leader in the development of photonic integration, we have protected the intellectual property associated with our PIC manufacturing through a combination of trade secrets, patents and contractual provisions. We believe that as a result of the combination of the multiple disciplines that were required to develop our PICs, together with the intellectual property protections that we have established, it will be difficult for others to duplicate the technology we have developed. Our manufacturing process has been developed over several years and is protected by a significant number of trade secrets. We believe that the trade secrets associated with the manufacturing and packaging of our PICs provides us with a significant competitive advantage.
We use both domestic and international manufacturing partners to manufacture certain components of our products. Our contract manufacturers manufacture our products based on our specifications and bill of materials. In addition, the lead times associated with certain components are lengthy and preclude rapid changes in product specifications or delivery schedules. To date, we have not experienced any significant delays or material unanticipated costs resulting from the use of these contract manufacturers; however, such a strategy involves certain risks, including the potential absence of adequate capacity, the unavailability of or interruptions in access to certain process technologies, and reduced control over delivery schedules, manufacturing yields, quality and costs. Despite outsourcing manufacturing operations for cost-effective scale and flexibility, we perform rigorous in-house quality control testing to ensure the reliability of our products.
Shortages in components that we use in our products are possible and our ability to predict the availability of such components may be limited. Some of these components are available only from single or limited sources of supply. Our products include some components that are proprietary in nature and only available from a single source, as well as some components that are generally available from a number of suppliers. In some cases, significant time would be required to establish relationships with alternate suppliers or providers of proprietary components. We do not have any long-term contracts with any component providers that guarantee supply of components or their manufacturing services. If we encounter difficulty continuing our relationship with a supplier, or if a supplier is unable to meet our needs, we may encounter manufacturing delays that could adversely affect our business. Our ability to timely deliver products to our customers would be materially adversely impacted if we needed to qualify replacements for any of a number of the components used in our products.
We believe that our current manufacturing facilities can accommodate an increase in capacity for PIC production sufficient for the foreseeable future. Given the competitive advantage we believe is provided by our PIC product capabilities, we are continually investing in our manufacturing processes; however, we anticipate that increasing and enhancing production at these facilities will not result in significant additional capital expenditures and personnel costs.
6
Table of Contents
Backlog
As of December 26, 2009, our backlog was $51.7 million. These orders are subject to future events that could cause the amount or timing of the related revenue to change, and, in certain cases, may be cancelled without penalty. We do not believe that backlog should be viewed as an indicator of future performance. A backlogged order may not result in revenue in a particular period, and the actual revenue may not be equal to our backlog amounts. Our presentation of backlog may not be comparable with that of other companies in our industry.
Competition
The optical communications network equipment market is highly competitive. Competition in this market is based on any one or a combination of the following factors:
| • | price and other commercial terms; |
| • | functionality; |
| • | existing business and customer relationships; |
| • | the ability of products and services to meet customers’ immediate and future network requirements; |
| • | installation capability; |
| • | services; |
| • | scalability; and |
| • | manufacturing capability. |
Competition in the optical communications market is dominated by a small number of very large, multi-national companies. Many of our competitors have substantially greater name recognition and technical, financial, and marketing resources, and greater manufacturing capacity, as well as better established relationships with the incumbent carriers, than we do. Many of our competitors have more resources to develop or acquire, and more experience in developing or acquiring, new products and technologies and in creating market awareness for these products and technologies. In addition, many of our competitors have the financial resources to offer competitive products at below market pricing levels that could prevent us from competing effectively. Further, many of our competitors have built long-standing relationships with some of our prospective customers and have the ability to provide financing to customers and could, therefore, have an inherent advantage in selling products to those customers.
Our competitors include current wavelength division multiplexing suppliers, such as Alcatel-Lucent, Ciena Corporation, Cisco Systems, Ericsson, Fujitsu Limited, Huawei Technologies Co. Ltd., NEC Corporation, Nokia-Siemens Networks, Tellabs and ZTE Corporation. These companies have historically set the competitive benchmarks for price and functionality. There are also smaller companies, including startups, which have announced plans or developed products that would compete for long-haul and metro optical transport business. In November 2009, Ciena Corporation announced that it had been selected as the successful bidder for substantially all of the optical networking and carrier Ethernet assets of Nortel Networks’ metro Ethernet networks business. Ciena has announced that it expects to close this transaction in the first quarter of 2010.
We also face additional competition in certain market segments from companies which offer one or more products that compete directly or indirectly with our products. In addition, we may compete with other companies as we expand into new markets or as other companies develop products that are competitive with us.
Intellectual Property
Our success as a company depends upon our ability to protect our core technology and intellectual property. To accomplish this, we rely on a combination of intellectual property rights, including patents, trade secrets, copyrights and trademarks, as well as customary contractual protections.
We rely primarily on trade secret protection for our PIC and PIC manufacturing processes, including design, fabrication and testing of our PICs. However, there can be no assurances that trade secrets will be sufficient to provide us with a competitive advantage or that others have not or will not reverse engineer our designs or discover, develop or disclose the same or similar designs and manufacturing processes.
As of December 26, 2009, we held 115 U.S. patents and one international patent expiring between 2021 and 2027, and held 139 U.S. and 30 foreign pending patent applications. We do not know whether any of our pending patent applications will result in the issuance of patents or whether the examination process will require us to narrow our claims.
We may not receive competitive advantages from the rights granted under our patents and other intellectual property. Any patents granted to us may be contested, circumvented or invalidated over the course of our business, and we may not be able to prevent third parties from infringing these patents. Therefore, the exact effect of the protection of these patents cannot be predicted with certainty.
7
Table of Contents
We believe that the frequency of assertions of patent infringement is increasing as patent holders, including entities that are not in our industry and who purchase patents as an investment or to monetize such rights by obtaining royalties, use such actions as a competitive tactic as well as a source of additional revenue. We have been sued by Cheetah Omni LLC for alleged infringement of their patent. See the section titled “—Legal Proceedings” for additional information regarding this lawsuit. Any claim of infringement from a third party, even those without merit, could cause us to incur substantial costs defending against such claims, and could distract our management from running our business. Furthermore, a party making such a claim, if successful, could secure a judgment that requires us to pay substantial damages. A judgment could also include an injunction or other court order that could prevent us from selling our DTN System. In addition, we might be required to seek a license for the use of such intellectual property, which may not be available on commercially reasonable terms or at all. Alternatively, we may be required to develop non-infringing technology, which would require significant effort and expense and may ultimately not be successful.
In addition to these protections, we generally control access to and the use of our proprietary software and other confidential information. This protection is accomplished through a combination of internal and external controls, including contractual protections with employees, contractors, customers, and partners, and through a combination of U.S. and international copyright laws. We incorporate a number of third party software programs into our DTN System pursuant to license agreements.
We license some of our software pursuant to agreements that impose restrictions on our customers’ ability to use such software, such as prohibiting reverse engineering and limiting the use of copies. We also seek to avoid disclosure of our intellectual property by relying on non-disclosure and assignment of intellectual property agreements with our employees and consultants that acknowledge our exclusive ownership of all intellectual property developed by the individual during the course of his or her work with us. The agreements also require that each person maintain the confidentiality of all proprietary information disclosed to them. Other parties may not comply with the terms of their agreements with us, and we may not be able to enforce our rights adequately against these parties. We also rely on contractual rights to establish and protect our proprietary rights in our DTN System.
We incorporate open source software into our products. Although we monitor our use of open source closely, the terms of many open source licenses have not been interpreted by U.S. courts, and there is a risk that such licenses could be construed in a manner that could impose unanticipated conditions or restrictions on our ability to commercialize our products. In such event, we could be required to seek licenses from third parties in order to continue offering our products, to re-engineer our products or to discontinue the sale of our products in the event re-engineering cannot be accomplished on a timely basis, any of which could adversely affect our business, operating results and financial condition.
Environmental Matters
Our business and operations are subject to environmental laws in various jurisdictions around the world including the Waste Electrical and Electronic Equipment (“WEEE”) and Restriction of the Use of Certain Hazardous Substances in Electrical and Electronic Equipment (“RoHS”) regulations adopted by the European Union. We seek to operate our business in compliance with such laws. We are currently subject to laws relating to the materials and content of our products and certain requirements relating to product take back and recycling. Environmental regulation is increasing, particularly outside of the United States, and we expect that our international operations will be subject to additional environmental compliance requirements, which may expose us to additional costs. To date, our compliance costs relating to environmental regulations have not resulted in a material adverse effect on our business, results of operations or financial condition.
Business Segment Data and Our Foreign Operations
We operate in the single industry segment of optical networking systems. Information concerning revenues, results of operations and revenues by geographic area is set forth in Item 7, “Management’s Discussion and Analysis of Financial Condition and Results of Operations” and in Note 14, “Segment Information,” of Notes to Consolidated Financial Statements, both of which are incorporated herein by reference. Information concerning identifiable assets is also set forth in Note 14, “Segment Information,” of Notes to Consolidated Financial Statements. Information on risks attendant to our foreign operations is set forth below in Item 1A, “Risk Factors.”
8
Table of Contents
Executive Officers and Directors
Our executive officers and directors, and their ages and positions as of December 26, 2009, are set forth below:
| Name |
Age | Position | ||
| Jagdeep Singh |
42 | Chairman of the Board of Directors, President and Chief Executive Officer (as of 1/1/2010, Mr. Singh became our Executive Chairman) | ||
| Thomas J. Fallon |
48 | Chief Operating Officer and Director (as of 1/1/2010, Mr. Fallon became our President and Chief Executive Officer) | ||
| David F. Welch, Ph.D. |
48 | Chief Marketing and Strategy Officer | ||
| Duston M. Williams |
51 | Chief Financial Officer | ||
| Ronald D. Martin |
61 | Vice President, Worldwide Sales | ||
| Michael O. McCarthy III |
44 | Chief Legal Officer | ||
| Kenneth A. Goldman(1) |
60 | Director | ||
| Kambiz Y. Hooshmand(2)(3) |
48 | Director | ||
| Reed E. Hundt(2)(3) |
61 | Director | ||
| Philip Koen(1) |
57 | Director (as of February 11, 2010) | ||
| Dan Maydan, Ph.D.(1) |
74 | Director | ||
| Carl Redfield(1)(2)(3) |
62 | Director |
| (1) | Member of Audit Committee |
| (2) | Member of Nominating and Governance Committee |
| (3) | Member of Compensation Committee |
Jagdeep Singh co-founded our company and has served as our Executive Chairman since January 1, 2010 and as Chairman of our board of directors since March 2001. Mr. Singh served as our President and Chief Executive Officer from January 2001 until December 31, 2009. From December 1999 to December 2000, Mr. Singh served as co-founder and Chief Executive Officer of OnFiber Communications, Inc., or OnFiber, an optical telecommunications carrier. From January 1998 to March 1999, Mr. Singh served as co-founder and Chief Executive Officer of Lightera Networks, or Lightera, an optical switching equipment company, and upon Ciena Corporation’s acquisition of Lightera in March 1999, served as President of Ciena’s Core Switching Division. Mr. Singh holds a B.S. in Computer Science from the University of Maryland, an M.S. in Computer Science from Stanford University and an M.B.A. from the University of California, Berkeley.
Thomas J. Fallon has served as our President and Chief Executive Officer since January 1, 2010 and as a member of our board of directors since December 2009. Mr. Fallon served as our Chief Operating Officer from October 2006 until December 31, 2009 and as our Vice President of Engineering and Operations. from April 2004 to September 2006. From August 2003 to March 2004, Mr. Fallon was Vice President, Corporate Quality and Development Operations of Cisco Systems, Inc., a networking and telecommunications company. From May 2001 to August 2003, Mr. Fallon served as Cisco’s General Manager of the Optical Transport Business Unit. Mr. Fallon holds a B.S.M.E. and M.B.A. from the University of Texas at Austin.
David F. Welch, Ph.D. co-founded our company and has served as our Chief Marketing and Strategy Officer since January 2007. From May 2004 to January 2007, Dr. Welch served as our Chief Strategy Officer. From May 2001 to May 2004, he served as our Chief Development Officer/Chief Technology Officer. From May 2001 to November 2006, Dr. Welch also served as a member of our board of directors. From February 2001 to April 2001, Dr. Welch served as Chief Technology Officer of the Transmission Division of JDS Uniphase Corporation, an optical component company. From January 1985 to February 2001, Dr. Welch served in various executive roles, including Chief Technology Officer and Vice President of Corporate Development of SDL, an optical component company. Dr. Welch holds a B.S. in Electrical Engineering from the University of Delaware and a Ph.D. in Electrical Engineering from Cornell University.
Duston M. Williams has served as our Chief Financial Officer since June 2006. From December 2004 to June 2006, Mr. Williams was Executive Vice President and Chief Financial Officer of Maxtor Corporation, an information storage solutions company. From July 2003 to November 2004, Mr. Williams served as Chief Financial Officer of Aruba Networks, Inc., a network infrastructure company. Mr. Williams currently serves on the board of directors of BlueArc, a network storage company and Compellent, a data storage solutions company. Mr. Williams holds a B.S. in Accounting from Bentley College and an M.B.A. from the University of Southern California.
Ronald D. Martin has served as our Vice President of Worldwide Sales since August 2009. From November 2007 to June 2009, Mr. Martin served as Chief Marketing and Strategy Officer and president of ADVA Optical Networking’s North American subsidiary. From May 2001 to November 2007, Mr. Martin served as Vice President and General Manager of the optical business unit of Cisco Systems, a networking and telecommunications company. From May 1987 to May 2001, Mr. Martin served as Chief Operating Officer at Fujitsu Network Communications, a networking and telecommunications company. Mr. Martin holds an A.A. from Iowa Lakes College.
9
Table of Contents
Michael O. McCarthy III has served as our Chief Legal Officer since January 2008. From May 2003 to January 2008, Mr. McCarthy served as our Vice President and General Counsel. From May 2001 to February 2003, Mr. McCarthy served as Senior Vice President of Worldwide Sales and Support at Ciena Corporation, a communications equipment company. From July 1999 to May 2001, Mr. McCarthy served as Ciena’s Senior Vice President and General Counsel. Mr. McCarthy holds a B.A. in Mathematical-Economics from Colgate University and a J.D. from Vanderbilt University’s School of Law.
Kenneth A. Goldman has been a member of our board of directors since February 2005. Mr. Goldman has been the Senior Vice President Finance and Administration and Chief Financial Officer of Fortinet Inc., a provider of unified threat management solutions since September 2007. From November 2006 to August 2007, Mr. Goldman served as Executive Vice President and Chief Financial Officer of Dexterra, Inc., a provider of mobile enterprise software. From August 2000 until March 2006, Mr. Goldman served as Senior Vice President, Finance and Administration and Chief Financial Officer of Siebel Systems, Inc., a supplier of customer software solutions and services. From December 1999 to December 2003, Mr. Goldman served as an advisory council member of the Financial Accounting Standards Board Advisory Council. Mr. Goldman serves on the board of directors of BigBand Networks, Inc., a provider of broadband multimedia infrastructure. Mr. Goldman is currently on the board of trustees of Cornell University and was formerly a member of the Treasury Advisory Committee on the Auditing Profession, a public committee that made recommendations in September 2008 to encourage a more sustainable auditing profession. Mr. Goldman holds a B.S. in Electrical Engineering from Cornell University and an M.B.A. from the Harvard Business School.
Kambiz Y. Hooshmand has been a member of our board of directors since December 2009. From March 2005 to May 2009, Mr. Hooshmand served as President and CEO of Applied Micro Circuits Corporation, a communications solutions company. From February 2000 to March 2005, Mr. Hooshmand served as Vice President and Division General Manager at Cisco Systems, a networking and communications company. From June 1997 to February 2000, Mr. Hooshmand served as Cisco’s Vice President of Engineering. From January 1992 to June 1997, Mr. Hooshmand served as Director of Engineering of StrataCom, a networking solutions company. Mr. Hooshmand holds a B.S. in Electrical Engineering & Computer Science from California State University, Chico and an M.S. in Engineering from Stanford University.
Reed E. Hundt has been a member of our board of directors since February 2007. Mr. Hundt has been a principal of Charles Ross Partners, a private investor, since 1998 and is principal of REH Advisors LLC, a business advisory firm. Since 1998, Mr. Hundt has acted as Co-Chairman of the Forum on Communications and Society at The Aspen Institute, a public policy organization. Since 2009, Mr. Hundt has been an independent advisor on information industries to Skadden, Arps, Slate, Meagher & Flom LLP and Affiliates, a law firm. Mr. Hundt served as Chairman of the Federal Communications Commission from 1993 to 1997. Mr. Hundt currently serves on the board of directors of Intel Corporation, a semiconductor company. Mr. Hundt holds a B.A. in History from Yale University and a J.D. from Yale Law School.
Philip Koen has been a member of our board of directors since February 2010. From March 2006 to January 2010, Mr. Koen served as Chief Executive Officer and Director of SAVVIS, Inc., an IT infrastructure services company. From July 1999 until March 2006, Mr. Koen was employed by Equinix, Inc., a provider of network neutral data centers and Internet exchange services as President and Chief Operating Officer and as Chief Financial Officer. From July 1997 to June 1999, Mr. Koen served in various executive roles at Pointcast, Inc., an Internet company. Mr. Koen holds a B.A. in Economics from Claremont McKenna College and an M.B.A. from the University of Virginia.
Dan Maydan, Ph.D. has been a member of our board of directors since September 2001. From December 1993 to April 2003, Dr. Maydan served as President of Applied Materials Inc., a company that manufactures semiconductor equipment and was appointed President Emeritus of the company in April 2003. Dr. Maydan was a member of the board of directors of Applied Materials Inc. from June 1992 until March 2006. Dr. Maydan serves on the board of directors of Electronics for Imaging, Inc., a digital imaging and print management solutions company. Dr. Maydan holds a B.S. and M.S. in Electrical Engineering from the Israel Institute of Technology and a Ph.D. in Physics from Edinburgh University of Scotland.
Carl Redfield has been a member of our board of directors since August 2006. From September 2004 to his retirement in May 2008, Mr. Redfield served as Senior Vice President, New England executive sponsor, of Cisco Systems, Inc., a networking and telecommunications company. From February 1997 through September 2004, Mr. Redfield served as Cisco’s Senior Vice President, Manufacturing and Logistics. Mr. Redfield serves on the board of directors of SourceForge, Inc., an online media, software and e-commerce company. In December 2008, Mr. Redfield was appointed to the board of directors of Nanosolar Inc., a solar cell power company. Mr. Redfield holds a B.S. in Materials Engineering from Rensselaer Polytechnic Institute and has completed post-graduate studies at the Harvard Business School.
10
Table of Contents
Our board of directors is currently composed of 8 members. Messrs. Goldman, Hooshmand, Hundt, Koen and Redfield and Dr. Maydan qualify as independent directors in accordance with the listing requirements of NASDAQ. The NASDAQ definition of independence includes a series of objective tests, such as that the director is not, and has not been for at least three years, one of our employees and that neither the director, nor any of his family members, has engaged in various types of business dealings with us. In addition, as further required by the NASDAQ rules, our board of directors has made a subjective determination as to each independent director that no relationships exist that, in the opinion of our board of directors, would interfere with his exercise of independent judgment in carrying out the responsibilities of a director. In making these determinations, our directors reviewed and discussed information provided by the directors and us with regard to each director’s business and personal activities as they may relate to us and our management.
Available Information
Our website address is http://www.infinera.com. Information contained on our website is not incorporated by reference into this Form 10-K unless expressly noted. We file reports with the Securities and Exchange Commission (“SEC”), which we make available on our website free of charge. These reports include Annual Reports on Form 10-K, Quarterly Reports on Form 10-Q, current reports on Form 8-K and amendments to such reports, each of which is provided on our website as soon as reasonably practicable after we electronically file such materials with or furnish them to the SEC. You can also read and copy any materials we file with the SEC at the SEC’s Public Reference Room at 100 F Street, N.E., Washington, DC 20549. You can obtain additional information about the operation of the Public Reference Room by calling the SEC at 1-800-SEC-0330. In addition, the SEC maintains a website (http://www.sec.gov) that contains reports, proxy and information statements, and other information regarding issuers that file electronically with the SEC, including us.
11
Table of Contents
Investing in our securities involves a high degree of risk. Set forth below and elsewhere in this Annual Report on Form 10-K, and in other documents we file with the SEC, are risks and uncertainties that could cause our actual results to differ materially from the results contemplated by the forward-looking statements contained in this Annual Report on Form 10-K. Because of the following factors, as well as other variables affecting our operating results, past financial performance should not be considered as a reliable indicator of future performance and investors should not use historical trends to anticipate results or trends in future periods.
We have a history of significant operating losses and may not maintain profitability on an annual basis in the future.
For the year ended December 26, 2009, we recorded a net loss of $86.6 million. As of December 26, 2009, our accumulated deficit was $377.4 million. We expect to continue to make significant expenditures related to the continued development of our business. These expenditures may include the addition of personnel related to the sales, marketing and research and development of our products and other costs related to the maintenance and expansion of our manufacturing facilities and research and development operations. We may therefore sustain significant operating losses and negative cash flows in the future. In addition, as a public company, we have incurred and will continue to incur significant legal, accounting and other expenses. We will have to sustain significant increased revenue and product gross margins to maintain profitability on an annual basis.
Although we achieved profitability for the first time on an annual basis for the year ended December 27, 2008 and generated net income of $78.7 million, this amount included $87.4 million of gross profit deferred from prior periods, as described in the section titled, Management’s Discussion and Analysis of Financial Condition and Results of Operations. Excluding the impact of this prior period amount, our results of operations for the year ended December 27, 2008 would have been a net loss of $8.7 million.
Our revenue and operating results may fluctuate significantly, which could make our future results difficult to predict and could cause our operating results to fall below investor or analyst expectations.
Our revenue and operating results may fluctuate due to a variety of factors, many of which are outside of our control. Over the past eight fiscal quarters, our revenue and operating income (loss), adjusted for 2008, for the reasons as described in the section titled, Management’s Discussion and Analysis of Financial Condition and Results of Operations, has ranged from $66.6 million to $95.5 million and from $4.8 million of operating income to $27.5 million of operating loss, respectively. As a result, comparing our operating results on a period-to-period basis may not be meaningful. Fluctuations in our revenue can lead to even greater fluctuations in our operating results. Our budgeted expense levels are based, in large part, on our expectations of long-term future revenue and the development efforts associated with these future revenues. Given relatively fixed operating costs related to our personnel and facilities, particularly for our engineering personnel, any substantial adjustment to our expenses to account for lower levels of revenue will be difficult and may take time. Consequently, if our revenue does not meet projected levels in the short-term, our inventory levels and operating expenses would be high relative to revenue, resulting in additional operating losses.
In addition to other risks discussed in this section, factors that may contribute to fluctuations in our revenue and our operating results include:
| • | fluctuations in demand, sales cycles and prices for products and services; |
| • | fluctuations in our product mix, including the mix of higher and lower margin products and significant mix changes resulting from new customer deployments; |
| • | reductions in customers’ budgets for optical communications purchases and delays in their purchasing cycles; |
| • | order cancellations or reductions or delays in delivery schedules by our customers; |
| • | timeliness of our customers’ payments for their purchases; |
| • | our ability to control costs, including our operating expenses and the costs of components we purchase for our products; |
| • | readiness of customer sites for installation of our products; |
12
Table of Contents
| • | the timing of product releases or upgrades by us or by our competitors. In particular, if we are required to develop additional features for our product for a customer, we may be required to defer our revenue for such customer until we have developed and delivered such additional features; |
| • | any significant changes in the competitive dynamics of our market, including any new entrants, technological advances or substantial discounting of products; |
| • | availability of third party suppliers to provide contract engineering and installation services for us; |
| • | the timing of recognizing revenue in any given quarter, including the impact of recently announced revenue recognition standards and any future changes in U.S. generally accepted accounting principles or new interpretations of existing accounting rules; and |
| • | general economic conditions in domestic and international markets. |
If our revenue or operating results fall below the expectations of investors or securities analysts or below any guidance we may in the future provide to the market, the price of our common stock may decline substantially.
Our gross margin may fluctuate from quarter to quarter and may be adversely affected by a number of factors, some of which are beyond our control.
Our gross margin fluctuates from period to period and varies by customer and by product specification. Over the past eight fiscal quarters, our gross margins, adjusted for 2008, for the reasons as described in the section titled, Management’s Discussion and Analysis of Financial Condition and Results of Operations, have ranged from 29% to 46%. Our gross margins are likely to continue to fluctuate and will be adversely affected by a number of factors, including:
| • | the mix in any period of the customer’s purchasing our products and the mix of higher and lower margin products and services; |
| • | significant new customer deployments, often with a higher portion of lower or negative margin common equipment; |
| • | price discounts negotiated by our customers; |
| • | sales volume from each customer during the period; |
| • | the amount of equipment we sell or expect to sell for a loss in any given quarter; |
| • | increased price competition, including competition from low-cost producers in China; |
| • | charges for excess or obsolete inventory; |
| • | changes in the price or availability of components for our products; |
| • | changes in our manufacturing costs, including fluctuations in yields and production volumes; |
| • | introduction of new products, with initial sales at relatively small volumes and higher product costs; |
| • | increased warranty or repair costs; and |
| • | the period of time in which revenue is recognized. |
It is likely that the average unit prices of our products will decrease over time in response to competitive pricing pressures, increased negotiated sales discounts, new product introductions by us or our competitors or other factors. In addition, some of our customer contracts contain annual technology discounts that require us to decrease the sales price of our products to these customers. In response, we will need to reduce the cost of our products through manufacturing efficiencies, design improvements and cost reductions. If these efforts are not successful or if we are unable to reduce our costs to a greater extent than the reduction in the price of products, our revenue and gross margin will decline, causing our operating results to decline. Fluctuations in gross margin may make it difficult to manage our business and achieve or maintain profitability.
13
Table of Contents
Aggressive business tactics by our competitors may harm our business.
Increased competition in our markets has resulted in aggressive business tactics by our competitors, including:
| • | aggressively pricing their products, including offering significant one-time discounts and guaranteed future price decreases; |
| • | selling at a discount used equipment or inventory that had previously written down or written off; |
| • | announcing competing products prior to market availability combined with extensive marketing efforts; |
| • | offering to repurchase our equipment from existing customers; |
| • | influencing customer requirements to emphasize different product capabilities, such as greater minimum bandwidth requirements or higher transport speeds (40Gbps and 100Gbps); |
| • | providing financing, marketing and advertising assistance to customers; and |
| • | asserting intellectual property rights. |
If we fail to compete successfully against our current and future competitors, or if our current or future competitors continue or expand aggressive business tactics, including those described above, demand for our products could decline, we could experience delays or cancellations of customer orders, or we could be required to reduce our prices or increase our expenses.
Our ability to increase our revenue will depend upon continued growth of demand by consumers and businesses for additional network capacity.
Our future success depends on factors such as the continued growth of the Internet and IP traffic and the continuing adoption of high capacity, revenue-generating services to increase the amount of data transmitted over communications networks and the growth of optical communications networks to meet the increased demand for bandwidth. If demand for such bandwidth does not continue, or slows down, the need for increased bandwidth across networks and the market for optical communications network products may not continue to grow. If this growth does not continue or slows down, our product sales would be negatively impacted. In addition, if general economic conditions weaken, this may cause our customers and potential customers to slow or delay their purchase decisions, which would have an adverse affect on our business and financial condition.
Recent turmoil in the financial markets and the global recession has adversely affected and may continue to adversely affect our industry, business and gross margins.
The U.S. and world economic markets are undergoing a period of slowdown or recession, and the future economic environment may continue to be less favorable than that of recent years. Our business depends on the overall demand for additional bandwidth capacity and on the economic health and willingness of our customers and potential customers to make capital commitments to purchase our products and services. As a result of this slowdown, we may face new risks that we have not yet identified. In addition, a number of the risks associated with our business, which are disclosed in these risk factors, may increase in likelihood, magnitude or duration. If the conditions in the U.S. and world economic markets remain uncertain or continue to be volatile, or if they deteriorate further, our industry, business and gross margins may be adversely affected.
As a result of this economic slowdown and the continued tightening of credit markets, our customers may be delayed in obtaining, or may not be able to obtain, necessary financing for their purchases of our products. A lack of liquidity in the capital markets or the continued global recession may cause our customers to delay or cancel their purchases, increase the time they take to pay or default on their payment obligations, each of which would negatively affect our results. Continued weakness in the global economy could cause some of our customers to become illiquid, delay payments or adversely affect our collection on their accounts, which could result in a higher level of bad debt expense. In addition, currency fluctuations relating to the financial crisis could negatively affect our international customers’ ability or desire to purchase our products.
14
Table of Contents
Challenging economic conditions have from time to time contributed, and are currently contributing, to slowdowns in the telecommunications industry in which we operate. This slowdown may result in:
| • | reduced demand for our products as a result of constraints on capital spending by our customers, particularly service providers; |
| • | increased price competition for our products, not only from our competitors, but also as a result of our customer’s or potential customer’s utilization of inventoried or underutilized products, which could put additional pressure on our near term gross profits; |
| • | risk of excess or obsolete inventories; |
| • | excess manufacturing capacity and higher associated overhead costs as a percentage of revenue; and |
| • | more limited ability to accurately forecast our business and future financial performance. |
The lack of liquidity and economic slowdown may adversely affect our suppliers or the terms on which we purchase products from these suppliers. It may also cause some of our suppliers to become illiquid. Any of these impacts could limit our ability to obtain components for our products from these suppliers and could adversely impact our supply chain or the delivery schedule to our customers. This also could require us to purchase more expensive components, or re-design our products, which could cause increases in the cost of our systems and delays in the manufacturing and delivery of our systems. Such events could harm our gross margins and harm our reputation and our customer relationships, either of which could harm our business and operating results.
We have a limited operating history and limited history of selling our DTN Systems and ATN Systems, both of which make it difficult to predict our future operating results.
We were incorporated in December 2000 and shipped our first DTN System in November 2004 and our first ATN System in August 2009. Our limited operating history gives very little basis upon which to evaluate our ability to accomplish our business objectives. In making an investment decision, you should evaluate our business in light of the risks, expenses and difficulties frequently encountered by companies in early stages of development, particularly companies in the rapidly changing optical communications market. We may not be successful in addressing these risks. It is difficult to accurately forecast our future revenue and plan expenses accordingly and, therefore, predict our future operating results.
The markets in which we compete are highly competitive and dominated by large corporations, and we may not be able to compete effectively.
Competition in the optical communications equipment market is intense, and we expect such competition to increase. A number of very large companies historically have dominated the optical communications network equipment industry. Our competitors include current wavelength division multiplexing suppliers, such as Alcatel-Lucent, Ciena Corporation, Cisco Systems, Ericsson, Fujitsu Limited, Huawei Technologies Co., NEC Corporation, Nokia-Siemens Networks, Tellabs and ZTE Corporation. In November 2009, Ciena Corporation announced that it had been selected as the successful bidder for substantially all of the optical networking and carrier Ethernet assets of Nortel Networks’ metro Ethernet networks business. Ciena has announced that it expects to close this transaction in the first quarter of 2010. Competition in these markets is based on price, commercial terms, functionality, manufacturing capability, pre-existing installation, services, existing business and customer relationships, scalability and the ability of products and breadth and quality of services to meet our customers’ immediate and future network requirements. Other companies have, or may in the future develop, products that are or could be competitive with our products. In particular, if a competitor develops a photonic integrated circuit with similar functionality, our business could be harmed. Recent mergers from our competitors and any future acquisitions or combinations between or among our competitors may adversely affect our competitive position by strengthening our competitors.
Many of our competitors have substantially greater name recognition and technical, financial and marketing resources, greater manufacturing capacity and better established relationships with incumbent carriers and other potential customers than we have. Many of our competitors have more resources to develop or acquire, and more experience in developing or acquiring, new products and technologies and in creating market awareness for those products and technologies. In addition, many of our competitors have the financial resources to offer competitive products at aggressive pricing levels that could prevent us from competing effectively. Further, many of our competitors have built long-standing relationships with some of our prospective customers and have the ability to provide financing to customers and could, therefore, have an inherent advantage in selling products to those customers.
15
Table of Contents
We also compete with low-cost producers in China that can increase pricing pressure on us and a number of smaller companies that provide competition for a specific product, customer segment or geographic market. These competitors often base their products on the latest available technologies. Due to the narrower focus of their efforts, these competitors may achieve commercial availability of their products more quickly than we can and may provide attractive alternatives to our customers.
We are dependent on a small number of key customers for a significant portion of our revenue and the loss of, or a significant reduction in orders from one or more of our key customers would reduce our revenue and harm our operating results.
A relatively small number of customers account for a large percentage of our net revenue. In particular, for 2009, Level 3 Communications, or Level 3, accounted for approximately 17% of our revenue. Our business will be harmed if we do not generate as much revenue as we expect from our key customers, if we experience a loss of any of our key customers or if we suffer a substantial reduction in orders from these customers. Our business also would be harmed if we fail to maintain our competitive advantage with our key customers.
We expect Level 3 to continue to be an important customer for us but to represent a less significant percentage of our revenue in 2010 than in prior years. On July 29, 2009, we were informed by Level 3 that they intend to use another DWDM vendor in their network. We believe that this vendor will be given a significant portion of Level 3’s new network deployments commencing in 2010 and will impact the revenue we will receive from Level 3 in the future.
Our ability to continue to generate revenue from our key customers will depend on our ability to maintain strong relationships with these customers and introduce new products that are desirable to these customers at competitive prices, and we may not be successful doing so. Because, in most cases, our sales are made to these customers pursuant to standard purchase agreements rather than long-term purchase commitments, orders may be cancelled or reduced readily. In the event of a cancellation or reduction of an order, we may not have enough time to reduce operating expenses to minimize the effect of the lost revenue on our business. Our operating results will continue to depend on our ability to sell our products to our large customers.
Our large customers have substantial negotiating leverage, which may require that we agree to terms and conditions that result in increased cost of sales, decreased revenue and lower average selling prices and gross margins, all of which would harm our operating results.
Substantial changes in the optical communications industry have occurred over the last few years. Many potential customers have confronted static or declining revenue. Many of our customers have substantial debt burdens, many have experienced financial distress, and some have gone out of business or have been acquired by other service providers or announced their withdrawal from segments of the business. Consolidation in the markets in which we compete has resulted in changes in the structure of the communications networking industry, with greater concentration of purchasing power in a small number of large service providers, cable operators and government agencies. In addition, it has resulted in a substantial reduction in the number of our potential customers. For example, service providers, such as Level 3, have acquired a number of other communications service providers, including one of our other customers. This increased concentration among our customer base may also lead to increased negotiating power for our customers and may require us to decrease our average selling prices.
Further, many of our customers are large communications service providers that have substantial purchasing power and leverage in negotiating contractual arrangements with us. Our customers have and may continue to seek advantageous pricing and other commercial terms and may require us to develop additional features in the products we sell to them. If we are required to develop additional features for our product for a customer, we may be required to defer our revenue for such a customer until we have developed and delivered such additional features. We have and may continue to be required to agree to unfavorable commercial terms with these customers, including reducing the average selling price of our products in response to these commercial requirements or competitive pricing pressures. To maintain acceptable operating results, we will need to comply with these commercial terms, develop and introduce new products and product enhancements on a timely basis and continue to reduce our costs.
16
Table of Contents
We expect the factors described above to continue to affect our business and operating results for an indeterminate period, in several ways, including:
| • | overall capital expenditures by many of our customers or potential customers may be flat or reduced; |
| • | we will continue to have only limited ability to forecast the volume and product mix of our sales; |
| • | managing expenditures and inventory will be difficult in light of the uncertainties surrounding our business; and |
| • | increased competition will enable customers to insist on more favorable terms and conditions for sales, including product discounts, extended payment terms or financing assistance, as a condition of procuring their business. |
If we are unable to offset any reductions in our average selling prices with increased sales volumes and reduced production costs, or if we fail to develop and introduce new products and enhancements on a timely basis, or if we disagree on our interpretation and compliance with the commercial terms of our customer agreements, our relationships with our customers and our operating results would be harmed.
We are dependent on a single product, and the lack of continued market acceptance of our DTN System would harm our business.
Although in 2009 we added the ATN System as part of our product offering, our DTN System accounts for substantially all of our revenue and will continue to do so for the foreseeable future. As a result, our business could be harmed by:
| • | any decline in demand for our DTN System; |
| • | the failure of our existing DTN System to achieve continued market acceptance; |
| • | the introduction of products and technologies that serve as a replacement or substitute for, or represent an improvement over, our DTN System; |
| • | technological innovations or new communications standards that our DTN System does not address; and |
| • | our inability to release enhanced versions of our DTN System on a timely basis. |
If we fail to expand sales of our DTN System into international markets or to sell our products to new types of customers, such as U.S. regional Bell operating companies and international postal, telephone and telegraph companies, our revenue will be harmed.
We believe that, in order to grow our revenue and business and to build a large and diverse customer base, we must successfully sell our DTN System in international markets and to new types of customers, such as U.S. regional Bell operating companies and international postal, telephone and telegraph companies. We have limited experience selling our DTN System internationally and to U.S. regional Bell operating companies and international postal, telephone and telegraph companies. Sales cycles for these customers are often very lengthy and competition for these customers is intense. To succeed in these sales efforts, we believe we must hire additional sales personnel to develop our relationships with these potential customers and develop and manage new sales channels through resellers, distributors and systems integrators. If we do not succeed in our efforts to sell to these customers, the size of our total addressable market will be limited. This, in turn, would harm our ability to grow our customer base and revenue.
If we fail to protect our intellectual property rights, our competitive position could be harmed or we could incur significant expense to enforce our rights.
We depend on our ability to protect our proprietary technology. We rely on a combination of trade secret, patent, copyright and trademark laws and confidentiality agreements with employees and third parties, all of which offer only limited protection. The steps we have taken to protect our proprietary rights may be inadequate to preclude misappropriation of our proprietary information or infringement of our intellectual property rights, and our ability to police such misappropriation or infringement is uncertain, particularly in countries outside of the United States. This is likely to become an increasingly important issue as we expand our operations and product development into countries that provide a lower level of intellectual property protection. We do not know whether any of our pending patent applications will result in the issuance of patents or whether the examination process will require us to narrow our claims, and even if patents are issued, they may be contested, circumvented or invalidated. Moreover, the rights granted under any issued patents may not provide us with a competitive advantage, and, as with any technology, competitors may be able to develop similar or superior technologies to our own now or in the future.
17
Table of Contents
Protecting against the unauthorized use of our products, trademarks and other proprietary rights is expensive, difficult, time consuming and, in some cases, impossible. Litigation may be necessary in the future to enforce or defend our intellectual property rights, to protect our trade secrets or to determine the validity or scope of the proprietary rights of others. Such litigation could result in substantial cost and diversion of management resources, either of which could harm our business, financial condition and operating results. Furthermore, many of our current and potential competitors have the ability to dedicate substantially greater resources to enforce their intellectual property rights than we do. Accordingly, despite our efforts, we may not be able to prevent third parties from infringing upon or misappropriating our intellectual property.
Claims by others that we infringe their intellectual property could harm our business.
Our industry is characterized by the existence of a large number of patents and frequent claims and related litigation regarding patent and other intellectual property rights. In particular, many leading companies in the optical communications industry, including our competitors, have extensive patent portfolios with respect to optical communications technology. We expect that infringement claims may increase as the number of products and competitors in our market increases and overlaps occur. From time to time, third parties may assert exclusive patent, copyright, trademark and other intellectual property rights to technologies and related standards that are important to our business or seek to invalidate the proprietary rights that we hold. Competitors or other third parties have, and may continue to assert claims or initiate litigation or other proceedings against us or our manufacturers, suppliers or customers alleging infringement of their proprietary rights, or seeking to invalidate our proprietary rights, with respect to our DTN System and technology. In the event that we are unsuccessful in defending against any such claims, or any resulting lawsuit or proceedings, we could incur liability for damages and/or have valuable proprietary rights invalidated.
Any claim of infringement from a third party, even one without merit, could cause us to incur substantial costs defending against the claim, and could distract our management from running our business. Furthermore, a party making such a claim, if successful, could secure a judgment that requires us to pay substantial damages. A judgment could also include an injunction or other court order that could prevent us from offering our DTN System. In addition, we might be required to seek a license for the use of such intellectual property, which may not be available on commercially reasonable terms or at all. Alternatively, we may be required to develop non-infringing technology, which would require significant effort and expense and may ultimately not be successful. Any of these events could harm our business, financial condition and operating results. Competitors and other third parties have and may continue to assert infringement claims against our customers and sales partners. Any of these claims would require us to initiate or defend potentially protracted and costly litigation on their behalf, regardless of the merits of these claims, because we generally indemnify our customers and sales partners from claims of infringement of proprietary rights of third parties. If any of these claims succeed, we may be forced to pay damages on behalf of our customers or sales partners, which could have an adverse effect on our business, financial condition and operating results.
We incorporate open source software into our products. Although we monitor our use of open source closely, the terms of many open source licenses have not been interpreted by U.S. courts, and there is a risk that such licenses could be construed in a manner that could impose unanticipated conditions or restrictions on our ability to commercialize our products. In such event, we could be required to seek licenses from third parties in order to continue offering our products, to re-engineer our products or to discontinue the sale of our products in the event re-engineering cannot be accomplished on a timely basis, any of which could adversely affect our business, operating results and financial condition.
On May 9, 2006, we and Level 3 were sued by Cheetah in the United States District Court for the Eastern District of Texas Texarkana Division for alleged infringement of patent No. 6,795,605 (the “605 Patent”), and a continuation thereof. On May 16, 2006, Cheetah filed an amended complaint, which requested an order to enjoin the sale of our DTN System, recovery of all damages caused by the alleged infringement and an award of any and all compensatory damages available by law, including damages, attorneys’ fees, associated interest and Cheetah’s costs incurred in the lawsuit. Cheetah’s complaint does not request a specific dollar amount of damages. We are contractually obligated to indemnify Level 3 for damages suffered by Level 3 to the extent our product supplied by us is found to infringe the rights of a third party, and we have assumed the defense of this matter. On July 20, 2006, we and Level 3 filed an amended response. On November 28, 2006, Cheetah filed a second amended complaint and added patent No. 7,142,347 (the “347 Patent”) to the lawsuit. On December 18, 2006, we and Level 3 filed responses to Cheetah’s second amended complaint. On January 30, 2007, Cheetah filed a third amended complaint adding additional assertions of infringement for the two patents in suit. On February 16, 2007, we and Level 3 filed responses to Cheetah’s third amended complaint.
18
Table of Contents
On April 11, 2007, we, Level 3 and Cheetah filed a joint motion with the court, agreeing to the following: (1) to stay all proceedings in the lawsuit pending a determination by the U.S. Patent and Trademark Office as to whether it will reexamine the 605 Patent and the 347 Patent; and (2) if the U.S. Patent and Trademark Office decides to reexamine either the 605 Patent or the 347 Patent, to stay all proceedings in the lawsuit pending final resolution of the reexamination(s) by the U.S. Patent and Trademark Office. On April 12, 2007, the court granted the motion staying all proceedings in the lawsuit. On June 26, 2007, the U.S. Patent and Trademark Office ordered reexamination of the 605 Patent. On August 1, 2007, the U.S. Patent and Trademark Office also ordered reexamination of the 347 Patent. As a result, all proceedings in this lawsuit are stayed until the final resolution of these reexaminations.
In a communication we received from the U.S. Patent and Trademark Office dated December 4, 2009, we were advised that various claims in the 347 Patent reexamination have been allowed, while other claims have been rejected. The pending claims in the 605 Patent reexamination are still being considered by the U.S. Patent and Trademark Office. We will have an opportunity to appeal the U.S. Patent and Trademark Office’s allowance of certain claims in the 347 Patent reexamination to the Board of Patent Appeals and Interferences at the U.S. Patent and Trademark Office and intend to do so. We do not know when the U.S. Patent and Trademark Office reexamination process will be completed.
On January 26, 2010, Cheetah’s counsel filed a motion requesting the Court to lift the stay in order to litigate those claims of the 347 patent reexamination which the U.S. Patent and Trademark Office allowed. On February 22, 2010, the court granted Cheetah’s request for an oral hearing on its motion to lift the stay. We believe that Cheetah’s motion should be denied but we cannot predict whether the Court will grant it.
If the stay is lifted and in the event that Cheetah is successful in obtaining a judgment requiring us to pay damages or obtains an injunction preventing the sale of our DTN System, our business could be harmed.
We have experienced delays in the development and introduction of our DTN System, and any future delays in releasing new products or in releasing enhancements to our existing products may harm our business.
Since our products are based on complex technology, including, in some cases, the development of next-generation PICs, we may experience unanticipated delays in developing, improving, manufacturing or deploying it. Any modification to our PIC, including the development of our 400Gbps PICs, entails significant development risks. At any given time, various new product introductions and enhancements to our existing products, such as our future product based on the 400Gbps PICs, are in the development phase and are not yet ready for commercial manufacturing or deployment. The maturing process from laboratory prototype to customer trials, and subsequently to general availability, involves a significant number of simultaneous development efforts. These efforts often must be completed in a timely manner so that they may be introduced into the product development cycle for the system, and include:
| • | completion of product development, including the completion of any associated PIC development such as our 400Gbps PICs; |
| • | the qualification and multiple sourcing of critical components; |
| • | validation of manufacturing methods and processes; |
| • | extensive quality assurance and reliability testing, and staffing of testing infrastructure; |
| • | validation of software; and |
| • | establishment of systems integration and systems test validation requirements. |
Each of these steps, in turn, presents risks of failure, rework or delay, any one of which could decrease the speed and scope of product introduction and marketplace acceptance of our products. New versions of our PICs, such as our 400Gbps PICs, specialized application-specific integrated circuits and intensive software testing and validation are important to the timely introduction of new product introductions and enhancements to our products and to our ability to enter new markets, and schedule delays are common. In addition, unexpected intellectual property disputes, failure of critical design elements, and a host of other execution risks may delay or even prevent the introduction of enhancements to our products. If we do not develop and successfully introduce products in a timely manner, our competitive position may suffer. In addition, if we do not develop and successfully introduce products in sufficient time so as to satisfy our customer’s expectations, we may lose future business from such customers and harm our reputation and our customer relationships, either of which could harm our business and operating results.
19
Table of Contents
Our manufacturing process is very complex and the partial or complete loss of our manufacturing facility, or a reduction in yields or an inability to scale capacity to meet customer demands could harm our business.
The manufacturing process for certain components of our products, including our PIC, and for our DTN System and ATN System is technically challenging. In the event that any of these manufacturing facilities was fully or partially destroyed, as a result of fire, water damage, or otherwise, it would limit our ability to produce our products. Because of the complex nature of our manufacturing facilities, such loss would take a considerable amount of time to repair or rebuild. The partial or complete loss of any of our manufacturing facilities, or an event causing the interruption in our use of such facility for any extended period of time would cause our business, financial condition and operating results to be harmed.
Minor deviations in the manufacturing process can cause substantial decreases in yields and, in some cases, cause production to be suspended. We have had production interruptions and suspensions in the past and may have additional interruptions or suspensions in the future. We expect our manufacturing yield for our next generation PICs to be lower initially and increase as we achieve full production. Poor yields from our PIC manufacturing process or defects, integration issues or other performance problems in our products could cause us customer relations and business reputation problems, harming our business and operating results.
In July 2009, we announced a restructuring plan under which we closed our Maryland based semiconductor fabrication plant (“FAB”) and consolidated these activities into our primary FAB location in Sunnyvale, California. This consolidation of activities into one location is expected to facilitate collaboration across integration platforms in support of our next generation products. As a result, during 2009, we recorded restructuring and other related costs of $3.9 million related to severance and related expenses, equipment and facilities-related costs, operating lease termination costs, and other exit costs. We substantially completed our restructuring actions in the fourth quarter of 2009. However, additional charges may be incurred in the future related to this restructuring, particularly if the actual costs associated with vacant facilities and other restructured activities are higher than expected.
In addition, our manufacturing facilities may not have adequate capacity to meet the demand for our products or we may not be able to increase our capacity to meet potential increases in demand for our products. Our inability to obtain sufficient manufacturing capacity to meet demand, either in our own facilities or through foundry or similar arrangements with third parties, could harm our relationships with customers, our business and our operating results.
Our leadership transitions may not go smoothly and could adversely impact our future operations.
On January 1, 2010, Jagdeep Singh stepped down as our President and Chief Executive Officer and became our Executive Chairman. On January 1, 2010, Thomas Fallon, our then current Chief Operating Officer became our President and Chief Executive Officer. In January 2010, we announced that Duston Williams, our Chief Financial Officer, will be resigning from this position on June 26, 2010 and will be replaced by Ita Brennan, our current Vice President and Corporate Controller. A significant leadership change is inherently risky and we may be unable to manage these transitions smoothly which could adversely impact our future strategy and ability to function or execute and could materially and adversely affect our business, financial condition and results of operations.
If we fail to accurately forecast demand for our products, we may have excess or insufficient inventory, which may increase our operating costs, decrease our revenue and harm our business.
We are required to generate forecasts of future demands for our products several months prior to the scheduled delivery to our prospective customers, which requires us to make significant investments before we know if corresponding revenue will be recognized. If we overestimate demand for our products or particular elements of our products and increase our inventory in anticipation of customer orders that do not materialize, we will have excess inventory, we will face a risk of obsolescence and significant inventory write-downs and our capital infrastructure will be depreciated across fewer units raising our per unit costs. If we underestimate demand for our products, we will have inadequate inventory, which could slow down or interrupt the manufacturing of our products and result in delays in shipments and our ability to recognize revenue. If actual market conditions are less favorable than our internal projections, additional inventory write-offs may be required. In addition, we may be unable to meet our supply commitments to customers which could result in a breach of our customer agreements and require us to pay damages. Lead times for materials and components, including application-specific integrated circuits, that we need to order for the manufacture of our products vary significantly and depend on factors such as the specific supplier, contract terms and demand for each component at a given time.
20
Table of Contents
Product performance problems, including undetected errors in our hardware or software, or deployment delays could harm our business and reputation.
The development and production of new products with high technology content, such as our DTN System and ATN System, is complicated and often involves problems with software, components and manufacturing methods. Complex hardware and software products, such as our DTN System and ATN System, can often contain undetected errors when first introduced or as new versions are released. We have experienced errors in the past in connection with our DTN System, including failures due to the receipt of faulty components from our suppliers. We suspect that errors, including potentially serious errors, will be found from time to time in our DTN System and ATN System. We have been shipping our DTN System since November 2004 and our ATN System since August 2009, which provides us with limited information on which to judge their reliability. Our DTN System and ATN System may suffer degradation of performance and reliability over time.
If reliability, quality or network monitoring problems develop, a number of negative effects on our business could result, including:
| • | delays in our ability to recognize revenue; |
| • | costs associated with fixing software or hardware defects or replacing products; |
| • | high service and warranty expenses; |
| • | delays in shipments; |
| • | high inventory excess and obsolescence expense; |
| • | high levels of product returns; |
| • | diversion of our engineering personnel from our product development efforts; |
| • | delays in collecting accounts receivable; |
| • | payment of damages for performance failures; |
| • | reduced orders from existing customers; and |
| • | declining interest from potential customers. |
Because we outsource the manufacturing of certain components of our products, we may also be subject to product performance problems as a result of the acts or omissions of these third parties.
From time to time, we encounter interruptions or delays in the activation of our products at a customers’ site. These interruptions or delays may result from product performance problems or from issues with installation and activation, some of which are outside our control. If we experience significant interruptions or delays that we cannot promptly resolve, the associated revenue for these installations may be delayed or confidence in our products could be undermined, which could cause us to lose customers and fail to add new customers.
We must respond to rapid technological change and comply with evolving industry standards and requirements for our products to be successful.
The optical communications equipment market is characterized by rapid technological change, changes in customer requirements and evolving industry standards. The introduction of new communications technologies and the emergence of new industry standards or requirements could render our products obsolete. Further, in developing our products, we have made, and will continue to make, assumptions with respect to which standards or requirements will be adopted by our customers and competitors. If the standards or requirements adopted by our prospective customers are different from those on which we have focused our efforts, market acceptance of our products would be reduced or delayed and our business would be harmed.
We expect our competitors to continue to improve the performance of their existing products and to introduce new products and technologies and to influence customers’ buying criteria so as to emphasize product capabilities that we may not possess, such as capacity greater than 1.6 Terabits per second. To be competitive, we must continue to invest significant resources in research and development, sales and marketing and customer support. We may not have sufficient resources to make these investments, we may not be able to make the technological advances necessary to be competitive and we may not be able to effectively sell our products to customers who have prior relationships with our competitors.
21
Table of Contents
We are dependent on sole source and limited source suppliers for several key components, and if we fail to obtain these components on a timely basis, we will not meet our customers’ product delivery requirements.
We currently purchase several key components from single or limited sources. In particular, we rely on our own production of certain components of our products, such as PICs, and on third parties as sole source suppliers for certain of the components of our systems, including: application-specific integrated circuits, field-programmable gate arrays, processors, and other semiconductor and optical components. We purchase these items on a purchase order basis and have no long-term contracts with most of these sole source suppliers. If any of our sole or limited source suppliers suffer from capacity constraints, lower than expected yields, work stoppages or any other reduction or disruption in output, they may be unable to meet our delivery schedule. Further, our suppliers could enter into exclusive arrangements with our competitors, refuse to sell their products or components to us at commercially reasonable prices or at all, go out of business or discontinue their relationships with us. We may be unable to develop alternative sources for these components.
If we do not receive critical components for our products in a timely manner, we will be unable to deliver those components to our manufacturer in a timely manner and would, therefore, be unable to meet our prospective customers’ product delivery requirements. In addition, the sourcing from new suppliers may require us to re-design our products, which could cause delays in the manufacturing and delivery of our systems. In the past, we have experienced delivery delays because of lack of availability of components or reliability issues with components that we were purchasing. In addition, some of our sole source suppliers have gone out of business, limited their supply of components to us, or indicated that they may be going out of business. These supplier disruptions may continue to occur in the future, which could limit our ability to produce the product and cause us to fail to meet a customer’s delivery requirements. Such events could harm our reputation and our customer relationships, either of which could harm our business and operating results.
Our investments in auction rate securities are subject to risks which may cause losses and affect the liquidity of these investments.
As of December 26, 2009, we held $70.4 million (par value) of investments comprised of auction rate securities, or ARS, which are variable-rate debt securities and have a long-term maturity with the interest rate being reset through auctions that are typically held every 7, 28 or 35 days. These securities have historically traded at par and were callable at par at the option of the issuer. Interest was typically paid at the end of each auction period or semiannually. As of December 26, 2009, most of the ARS we held were AAA rated, except for $11.1 million (par value) of our ARS that were downgraded to A3 rating and $0.8 million (par value) of ARS that were downgraded to Aa1 rating during 2009. Our ARS holdings were mostly collateralized by student loans guaranteed by the U.S. government under the Federal Family Education Loan Program.
Since February 2008, most of the auctions for these securities have failed and there is no assurance that future auctions will succeed. As a result, our ability to liquidate our investment in the near term is limited. Additionally, we may not be able to fully recover the par value of our ARS or it could take until final maturity of the ARS (up to 38 years) to realize our investment. In the event we need to access these funds, we may not be able to do so until a future auction on these investments is successful, a secondary market develops or the securities are redeemed by the broker dealer.
In October 2008, we elected to participate in a rights offering by UBS Financial Services, Inc. (“UBS”), one of our brokers, which provides us with certain rights (the “Put Rights”) to sell back to UBS $60.8 million of our ARS portfolio at par value as of December 26, 2009, which we purchased through UBS, at any time during a two-year sale period beginning June 30, 2010. By electing to participate in the rights offering, we granted UBS the right, exercisable at any time prior to June 30, 2010 or during the two-year sale period, to purchase or cause the sale of our ARS (“Call Right”). As such, in the fourth quarter of 2008, we recorded a gain of $15.9 million related to the Put Rights provided by the settlement and a gross unrealized loss of $16.8 million related to the $65.7 million (par value) portion of our ARS portfolio as of December 27, 2008 which we did not intend to hold until final maturity because of the opportunity provided by the Put Rights. The ARS covered by the UBS settlement and the related Put Rights are revalued on a quarterly basis, and we recorded $4.6 million of unrealized holding gains related to ARS trading securities and a decrease of $3.8 million in the fair value of the Put Rights, for 2009, in Other gain (loss), net in the accompanying consolidated statements of operations. During 2009, $5.2 million of our ARS were called at par value.
22
Table of Contents
As of December 26, 2009, the remaining $9.6 million (par value) of ARS which are not subject to the UBS settlement were deemed to be other-than-temporarily impaired. As of December 26, 2009, we determined that we do not intend to sell these securities and do not believe that it is more likely than not that we will be required to sell the securities before recovery of their amortized cost. However, given that the present value of the expected cash flows for these securities was below their amortized cost basis, a cumulative other-than-temporary impairment (“OTTI”) of $2.0 million, equal to the difference between the fair value and the par value has occurred. We recognized credit impairment losses of $1.1 million in our consolidated statements of operations for 2009. The non-credit related portion of this OTTI of $0.9 million was recognized in Accumulated other comprehensive loss in our consolidated balance sheet as of December 26, 2009.
If the issuers of the auction rate securities are unable to successfully close future auctions or refinance their debt in the near term and their credit ratings deteriorate, we may be required to record further impairment charges on these investments and may liquidate these investments for less than their face value. In addition, if UBS is unable to honor our Put Rights, the fair value of our Put Rights may be reduced to zero, thus adversely affecting our financial position and capital resources.
If we fail to maintain effective internal control over financial reporting in the future, the accuracy and timing of our financial reporting may be adversely affected.
We are required to comply with Section 404 of the Sarbanes-Oxley Act of 2002. The provisions of the act require, among other things, that we maintain effective internal control over financial reporting and disclosure controls and procedures. Preparing our financial statements involves a number of complex processes, many of which are done manually and are dependent upon individual data input or review. These processes include, but are not limited to, calculating revenue, deferred revenue and inventory costs. While we continue to automate our processes and enhance our review and put in place controls to reduce the likelihood for errors, we expect that for the foreseeable future many of our processes will remain manually intensive and thus subject to human error.
In the past, we have identified several material weaknesses in our internal control over financial reporting. We have remediated these identified material weaknesses, but we cannot give any assurances that all material weaknesses have been identified or that additional material weaknesses will not be identified in the future in connection with our compliance with the provisions of Section 404 of the Sarbanes-Oxley Act of 2002. The existence of one or more material weaknesses could preclude a conclusion by management that we maintained effective internal control over financial reporting. The existence or disclosure of any such material weakness could adversely affect our stock price.
If we lose key personnel or fail to attract and retain additional qualified personnel when needed, our business may be harmed.
Our success depends to a significant degree upon the continued contributions of our key management, engineering, sales and marketing, and finance personnel, many of whom would be difficult to replace. For example, senior members of our engineering team have unique technical experience that would be difficult to replace. We do not have long-term employment contracts or key person life insurance covering any of our key personnel. Because our products are complex, we must hire and retain a large number of highly trained customer service and support personnel to ensure that the deployment of our products do not result in network disruption for our customers. We believe our future success will depend in large part upon our ability to identify, attract and retain highly skilled managerial, engineering, sales, marketing, finance and customer service and support personnel. Competition for these individuals is intense in our industry, especially in the San Francisco Bay Area. We may not succeed in identifying, attracting and retaining appropriate personnel. The loss of the services of any of our key personnel, the inability to identify, attract or retain qualified personnel in the future or delays in hiring qualified personnel, particularly engineers and sales personnel, could make it difficult for us to manage our business and meet key objectives, such as timely product introductions.
Our sales cycle can be long and unpredictable, which could result in an unexpected revenue shortfall in any given quarter.
Our products have a lengthy sales cycle, which can extend from six to twelve months and may take even longer for larger prospective customers such as U.S. regional Bell operating companies, international postal, telephone and telegraph companies and U.S. competitive local exchange carriers. Our prospective customers conduct significant evaluation, testing, implementation and acceptance procedures before they purchase our products. We incur substantial sales and marketing expenses and expend significant management effort during this time, regardless of whether we make a sale.
Because the purchase of our equipment involves substantial cost, most of our customers wait to purchase our equipment until they are ready to deploy it in their network. As a result, it is difficult for us to accurately predict the timing of future purchases by our customers. In addition, product purchases are often subject to budget constraints, multiple approvals and unplanned administrative processing and other delays. If sales expected from customers for a particular quarter are not realized in that quarter or at all, our revenue will be negatively impacted.
23
Table of Contents
Our international sales and operations subject us to additional risks that may harm our operating results.
We market, sell and service our products globally. In 2009, 2008 and 2007, we derived approximately 31%, 21% and 19%, respectively, of our revenue from customers outside of the United States. We have sales and support personnel in numerous countries worldwide. In addition, we have a large group of software development personnel located in Bangalore, India and a group of hardware and software development engineers located in Beijing, China. We expect that significant management attention and financial resources will be required for our international activities over the foreseeable future as we continue to expand our international presence. In some countries, our successes in selling our products will depend in part on our ability to form relationships with local partners. Our inability to identify appropriate partners or reach mutually satisfactory arrangements for international sales of our products could impact our ability to maintain or increase international market demand for our products.
Our international operations are subject to inherent risks, and our future results could be adversely affected by a variety of factors, many of which are outside of our control, including:
| • | greater difficulty in collecting accounts receivable and longer collection periods; |
| • | difficulties of managing and staffing international offices, and the increased travel, infrastructure and legal compliance costs associated with multiple international locations; |
| • | the impact of recessions in economies outside the United States; |
| • | tariff and trade barriers and other regulatory requirements or contractual limitations on our ability to sell or develop our products in certain foreign markets; |
| • | certification requirements; |
| • | greater difficulty documenting and testing our internal controls; |
| • | reduced protection for intellectual property rights in some countries; |
| • | potentially adverse tax consequences; |
| • | political and economic instability; |
| • | effects of changes in currency exchange rates which could negatively affect our financial results and cash flows; |
| • | service provider and government spending patterns. |
International customers may also require that we comply with certain testing or customization of our products to conform to local standards. The product development costs to test or customize our products could be extensive and a material expense for us.
As we continue to expand our business globally, our success will depend, in large part, on our ability to anticipate and effectively manage these and other risks associated with our international operations. Our failure to manage any of these risks could harm our international operations and reduce our international sales.
We may be adversely affected by fluctuations in currency exchange rates.
A portion of our sales are from countries outside of the United States, and are in currencies other than U.S. dollars, primarily the Euro. Fluctuations in foreign currency rates, most notably a strengthening of the dollar against the Euro, could have a material impact on our revenue and gross margins in future periods. We have established a hedging program to partially offset our exposure to foreign currency exchange rate fluctuations. We regularly review our hedging program and make adjustments as necessary based on our assessment of the relevant risks and related costs. However, our hedging activities may not fully offset the adverse financial impacts resulting from unfavorable movements in foreign currency exchange rates and these impacts could adversely affect our financial condition or results of operations.
24
Table of Contents
If our contract manufacturers do not perform as we expect, our business may be harmed.
Our future success will depend on our ability to have sufficient volumes of our products manufactured in a cost-effective and quality-controlled manner. We have engaged third parties to manufacture certain elements of our products at multiple contract manufacturing sites. There are a number of risks associated with our dependence on contract manufacturers, including:
| • | reduced control over delivery schedules, particularly for international contract manufacturing sites; |
| • | reliance on the quality assurance procedures of third parties; |
| • | potential uncertainty regarding manufacturing yields and costs; |
| • | potential lack of adequate capacity during periods of excess demand; |
| • | potential uncertainty related to the use of international contract manufacturing sites; |
| • | limited warranties on components supplied to us; |
| • | potential misappropriation of our intellectual property; and |
| • | potential manufacturing disruptions. |
Any of these risks could impair our ability to fulfill orders. Our contract manufacturers may not be able to meet the delivery requirements of our customers, which could decrease customer satisfaction and harm our product sales. We do not have long-term contracts or arrangements with our contract manufacturers that will guarantee product availability, or the continuation of particular pricing or payment terms. If our contract manufacturers are unable or unwilling to continue manufacturing our products or components of our products in required volumes or our relationship with any of our contract manufacturers is discontinued for any reason, we would be required to identify and qualify alternative manufacturers, which could cause us to be unable to meet our supply requirements to our customers and result in the breach of our customer agreements. Qualifying a new contract manufacturer and commencing volume production is expensive and time-consuming and if we are required to change or qualify a new contract manufacturer, we would likely lose sales revenue and damage our existing customer relationships.
Any acquisitions we make could disrupt our business and harm our financial condition and operations.
We have made strategic acquisitions of businesses, technologies and other assets in the past. While we have no current agreements or commitments, we may in the future acquire businesses, product lines or technologies. In the event of any future acquisitions, we may not ultimately strengthen our competitive position or achieve our goals, or they may be viewed negatively by customers, financial markets or investors and we could:
| • | issue stock that would dilute our current stockholders’ percentage ownership; |
| • | incur debt and assume other liabilities; or |
| • | incur amortization expenses related to goodwill and other intangible assets and/or incur large and immediate write-offs. |
Acquisitions also involve numerous risks, including:
| • | problems integrating the acquired operations, technologies or products with our own; |
| • | diversion of management’s attention from our core business; |
| • | assumption of unknown liabilities; |
| • | adverse effects on existing business relationships with suppliers and customers; |
25
Table of Contents
| • | increased accounting compliance risk; |
| • | risks associated with entering new markets; and |
| • | potential loss of key employees. |
We may not be able to successfully integrate any businesses, products, technologies or personnel that we might acquire in the future. Our failure to do so could have an adverse effect on our business, financial condition and operating results.
Our use and reliance upon development resources in India, China and Canada may expose us to unanticipated costs or liabilities.
We have established development centers in India, China and Canada and expect to continue to increase hiring of personnel for these facilities. There is no assurance that our reliance upon development resources in India, China or Canada will enable us to achieve meaningful cost reductions or greater resource efficiency. Further, our development efforts and other operations in these countries involve significant risks, including:
| • | difficulty hiring and retaining appropriate engineering resources due to intense competition for such resources and resulting wage inflation; |
| • | the knowledge transfer related to our technology and exposure to misappropriation of intellectual property or confidential information, including information that is proprietary to us, our customers and other third parties; |
| • | heightened exposure to changes in the economic, security and political conditions of India, China and Canada; |
| • | fluctuation in currency exchange rates and tax risks associated with international operations; and |
| • | development efforts that do not meet our requirements because of language, cultural or other differences associated with international operations, resulting in errors or delays. |
Difficulties resulting from the factors above and other risks related to our operations in these countries could expose us to increased expense, impair our development efforts, harm our competitive position and damage our reputation.
Unforeseen health, safety and environmental costs could harm our business.
Our manufacturing operations use substances that are regulated by various federal, state and international laws governing health, safety and the environment, including the Waste Electrical and Electronic Equipment (“WEEE”) and Restriction of the Use of Certain Hazardous Substances in Electrical and Electronic Equipment (“RoHS”) regulations adopted by the European Union. If we experience a problem with these substances, it could cause an interruption or delay in our manufacturing operations or could cause us to incur liabilities for any costs related to health, safety or environmental remediation. We could also be subject to liability if we do not handle these substances in compliance with safety standards for storage and transportation and applicable laws. If we experience a problem or fail to comply with such safety standards, our business, financial condition and operating results may be harmed.
We are subject to governmental export and import controls that could subject us to liability or impair our ability to compete in international markets.
We are subject to export control laws that limit which products we sell and where and to whom we sell our products. U.S. export control laws also limit our ability to conduct product development activities in certain countries. In addition, various countries regulate the import of certain technologies and have enacted laws that could limit our ability to distribute our products or could limit our customers’ ability to implement our products in those countries. Changes in our products or changes in export and import regulations may create delays in the introduction of our products in international markets, prevent our customers with international operations from deploying our products throughout their global systems or, in some cases, prevent the export or import of our products to certain countries altogether. Any change in export or import regulations or related legislation, shift in approach to the enforcement or scope of existing regulations, or change in the countries, persons or technologies targeted by such regulations, could result in decreased use of our products by, or in our decreased ability to export or sell our products to, existing or potential customers with international operations. Failure to comply with these and similar laws on a timely basis, or at all, decreased use of our products or any limitation on our ability to export or sell our products would adversely affect our business, financial condition and operating results.
26
Table of Contents
If we need additional capital in the future, it may not be available to us on favorable terms, or at all.
Our business requires significant capital. We have historically relied on significant outside debt and equity financing as well as cash flow from operations to fund our operations, capital expenditures and expansion. We may require additional capital from equity or debt financings in the future to fund our operations or respond to competitive pressures or strategic opportunities. We have a history of significant operating losses and for 2009, we had a net loss of $86.6 million. In the event that we require additional capital, we may be unable to liquidate our auction rate securities. We may not be able to secure timely additional financing on favorable terms, or at all. The terms of any additional financing may place limits on our financial and operating flexibility. If we raise additional funds through further issuances of equity, convertible debt securities or other securities convertible into equity, our existing stockholders could suffer dilution in their percentage ownership of our company, and any new securities we issue could have rights, preferences and privileges senior to those of holders of our common stock. If we are unable to obtain adequate financing or financing on terms satisfactory to us, if and when we require it, our ability to grow or support our business and to respond to business challenges could be limited and our business will be harmed.
We are subject to government regulations that could adversely impact our business.
The Federal Communications Commission, or FCC, has jurisdiction over the entire U.S. communications industry and, as a result, our products and our North American customers are subject to FCC rules and regulations. Current and future FCC regulations affecting communications services, our products or our customers’ businesses could negatively affect our business. In addition, international regulatory standards could impair our ability to develop products for international customers in the future. Delays caused by our compliance with regulatory requirements could result in postponements or cancellations of product orders. Further, we may not be successful in obtaining or maintaining any regulatory approvals that may, in the future, be required to operate our business. Any failure to obtain such approvals could harm our business and operating results.
Natural disasters, terrorist attacks or other catastrophic events could harm our operations.
Our headquarters and the majority of our infrastructure, including our PIC manufacturing facility, are located in Northern California, an area that is susceptible to earthquakes and other natural disasters. Further, a terrorist attack aimed at Northern California or at our nation’s energy or telecommunications infrastructure could hinder or delay the development and sale of our products. In the event that an earthquake, terrorist attack or other catastrophe were to destroy any part of our facilities, or certain of our contract manufacturers’ facilities, destroy or disrupt vital infrastructure systems or interrupt our operations for any extended period of time, our business, financial condition and operating results would be harmed.
The trading price of our common stock has been volatile and is likely to be volatile in the future.
The trading prices of our common stock and the securities of other technology companies have been and may continue to be highly volatile. Further, our common stock has limited prior trading history. Factors affecting the trading price of our common stock include:
| • | variations in our operating results; |
| • | announcements of technological innovations, new services or service enhancements, strategic alliances or agreements by us or by our competitors; |
| • | the gain or loss of customers; |
| • | recruitment or departure of key personnel; |
| • | changes in the estimates of our future operating results or external guidance on those results or changes in recommendations by any securities analysts that elect to follow our common stock; |
| • | market conditions in our industry, the industries of our customers and the economy as a whole; and |
27
Table of Contents
| • | adoption or modification of regulations, policies, procedures or programs applicable to our business. |
In addition, if the market for technology stocks or the stock market in general experiences loss of investor confidence, the trading price of our common stock could decline for reasons unrelated to our business, financial condition or operating results. The trading price of our common stock might also decline in reaction to events that affect other companies in our industry even if these events do not directly affect us. Each of these factors, among others, could harm the value of your investment in our common stock. Some companies that have had volatile market prices for their securities have had securities class action lawsuits filed against them. If a suit were filed against us, regardless of its merits or outcome, it could result in substantial costs and divert management’s attention and resources.
If securities or industry analysts do not publish research or publish unfavorable research about our business, our stock price and trading volume could decline.
The trading market for our common stock depends in part on the research and reports that securities or industry analysts publish about us or our business. If no or few securities or industry analysts cover our company, the trading price for our stock would be negatively impacted. If one or more of the analysts who covers us downgrades our stock or publishes misleading or unfavorable research about our business, our stock price would likely decline. If one or more of these analysts ceases coverage of our company or fails to publish reports on us regularly, demand for our stock could decrease, which could cause our stock price or trading volume to decline.
Anti-takeover provisions in our charter documents and Delaware law could discourage delay or prevent a change in control of our company and may affect the trading price of our common stock.
We are a Delaware corporation and the anti-takeover provisions of the Delaware General Corporation Law, which apply to us, may discourage, delay or prevent a change in control by prohibiting us from engaging in a business combination with an interested stockholder for a period of three years after the person becomes an interested stockholder, even if a change of control would be beneficial to our existing stockholders. In addition, our amended and restated certificate of incorporation and amended and restated bylaws may discourage, delay or prevent a change in our management or control over us that stockholders may consider favorable. Our amended and restated certificate of incorporation and amended and restated bylaws:
| • | authorize the issuance of “blank check” convertible preferred stock that could be issued by our board of directors to thwart a takeover attempt; |
| • | establish a classified board of directors, as a result of which the successors to the directors whose terms have expired will be elected to serve from the time of election and qualification until the third annual meeting following their election; |
| • | require that directors only be removed from office for cause and only upon a supermajority stockholder vote; |
| • | provide that vacancies on the board of directors, including newly-created directorships, may be filled only by a majority vote of directors then in office rather than by stockholders; |
| • | prevent stockholders from calling special meetings; and |
| • | prohibit stockholder action by written consent, requiring all actions to be taken at a meeting of the stockholders. |
| ITEM 1B. | UNRESOLVED STAFF COMMENTS |
Not applicable.
28
Table of Contents
| ITEM 2. | PROPERTIES |
Our headquarters are located in Sunnyvale, California. We lease facilities in North America and Asia. The following is a summary of the locations, functions and approximate square footage of those facilities as of December 26, 2009:
| Location |
Function |
Square Footage | ||
| Sunnyvale, CA |
Corporate headquarters and manufacturing | 170,000 | ||
| Allentown, PA |
Manufacturing and research and development | 69,000 | ||
| Annapolis Junction, MD |
Research and development | 47,000 | ||
| Bangalore, India |
Research and development | 39,000 | ||
| Beijing, China |
Research and development | 13,000 | ||
| Kanata, Canada |
Research and development | 1,000 |
The above leases expire between 2010 and 2016. We intend to add new facilities and to expand existing facilities as we add employees, and we believe that suitable additional or substitute space will be available as needed to accommodate any such expansion of our operations. We believe that our existing facilities are adequate to meet our business needs through the next 12 months.
| ITEM 3. | LEGAL PROCEEDINGS |
On May 9, 2006, we and Level 3 were sued by Cheetah Omni LLC, or Cheetah, in the U.S. District Court for the Eastern District of Texas Texarkana Division for alleged infringement of patent No. 6,795,605 (the “605 Patent”), and a continuation thereof. On May 16, 2006, Cheetah filed an amended complaint, which requested an order to enjoin the sale of our DTN System and to recover all damages caused by the alleged willful infringement including any and all compensatory damages available by law, such as actual and punitive damages, attorneys’ fees, associated interest and Cheetah’s costs incurred in the lawsuit. Cheetah’s complaint does not request a specific dollar amount for these compensatory damages. We are contractually obligated to indemnify Level 3 for damages suffered by Level 3 to the extent its product supplied by us is found to infringe, and it has assumed the defense of this matter. On July 20, 2006, we and Level 3 filed an amended response denying all infringement claims under the 605 Patent and asserting that the claims of the patent are invalid and that the DTN System does not infringe the patent. On November 28, 2006, Cheetah filed a second amended complaint and added patent No. 7,142,347 (the “347 Patent”) to the lawsuit. On December 18, 2006, we and Level 3 filed responses to Cheetah’s second amended complaint denying all infringement claims under the 347 Patent and we and Level 3 asserted counterclaims against Cheetah asserting that the claims are invalid and that the DTN System does not infringe the patents.
On January 30, 2007, Cheetah filed a third amended complaint adding additional assertions of infringement for the two patents in suit. On February 16, 2007, we and Level 3 filed responses to Cheetah’s third amended complaint denying all infringement claims, and we and Level 3 asserted counterclaims against Cheetah asserting that the claims of the patents are invalid and that the DTN System does not infringe the patents.
On March 14, 2007, we submitted requests to the U.S. Patent and Trademark Office for inter partes reexamination of the 605 Patent and the 347 Patent asking the U.S. Patent and Trademark Office to reexamine the patents based on prior art in order to invalidate the patents or limit the scope of each patent’s claims. On March 21, 2007, we and Level 3 filed a motion with the court to stay all proceedings in the lawsuit pending the reexamination of the 605 Patent and the 347 Patent.
On April 11, 2007, we, Level 3 and Cheetah filed a joint motion with the court, agreeing to the following: (1) to stay all proceedings in the lawsuit pending a determination by the U.S. Patent and Trademark Office as to whether it will reexamine the 605 Patent and the 347 Patent; and (2) if the U.S. Patent and Trademark Office decides to reexamine either the 605 Patent or the 347 Patent, to stay all proceedings in the lawsuit pending final resolution of the reexamination(s) by the U.S. Patent and Trademark Office. On April 12, 2007, the court granted the motion staying all proceedings in the lawsuit. On June 26, 2007, the U.S. Patent and Trademark Office ordered reexamination of the 605 Patent. On August 1, 2007, the U.S. Patent and Trademark Office ordered reexamination of the 347 Patent. As a result, all proceedings in this lawsuit are stayed until the final resolution of these reexaminations.
In a communication we received from the U.S. Patent and Trademark Office dated December 4, 2009, we were advised that various claims in the 347 Patent reexamination have been allowed, while other claims have been rejected. The pending claims in the 605 Patent reexamination are still being considered by the U.S. Patent and Trademark Office. We will have an opportunity to appeal the U.S. Patent and Trademark Office’s allowance of certain claims in the 347 Patent reexamination to the Board of Patent Appeals and Interferences at the U.S. Patent and Trademark Office and intend to do so. We do not know when the U.S. Patent and Trademark Office reexamination process will be completed.
29
Table of Contents
On January 26, 2010, Cheetah’s counsel filed a motion requesting the Court to lift the stay in order to litigate those claims of the 347 Patent reexamination which the U.S. Patent and Trademark Office allowed. On February 22, 2010, the court granted Cheetah’s request for an oral hearing on its motion to lift the stay. We believe that Cheetah’s motion should be denied but we cannot predict whether the Court will grant it.
We believe the suit is without merit and intend to defend ourselves vigorously, but we are unable to predict the likelihood of an unfavorable outcome.
In addition to the matters described above, we are subject to various legal proceedings, claims and litigation arising in the ordinary course of business. While the outcome of these matters is currently not determinable, we do not expect that the ultimate costs to resolve these matters will have a material effect on our results of operations, financial position or cash flows.
| ITEM 4. | RESERVED |
30
Table of Contents
| ITEM 5. | MARKET FOR REGISTRANT’S COMMON EQUITY, RELATED STOCKHOLDER MATTERS AND ISSUER PURCHASES OF EQUITY SECURITIES |
Our common stock is listed on the NASDAQ Global Select Market under the symbol “INFN.” The following table sets forth, for the time periods indicated, the high and low sales prices of our common stock as reported on the NASDAQ Global Select Market.
| High | Low | |||||
| Fourth Quarter 2009 |
$ | 9.80 | $ | 7.12 | ||
| Third Quarter 2009 |
$ | 9.43 | $ | 6.49 | ||
| Second Quarter 2009 |
$ | 10.53 | $ | 7.00 | ||
| First Quarter 2009 |
$ | 9.28 | $ | 5.69 | ||
| Fourth Quarter 2008 |
$ | 10.39 | $ | 5.81 | ||
| Third Quarter 2008 |
$ | 11.88 | $ | 7.79 | ||
| Second Quarter 2008 |
$ | 16.11 | $ | 8.73 | ||
| First Quarter 2008 |
$ | 15.27 | $ | 8.28 | ||
As of February 19, 2010, there were 212 registered holders of record of Infinera’s common stock. A substantially greater number of holders of Infinera common stock are “street name” or beneficial holders, whose shares are held by banks, brokers and other financial institutions.
We have not paid any cash dividends on our common stock and do not intend to pay any cash dividends on common stock in the foreseeable future.
31
Table of Contents
STOCK PERFORMANCE GRAPH
The following graph compares the cumulative 31-month total return provided stockholders on Infinera Corporation’s common stock relative to the cumulative total returns of the NASDAQ Composite index and the NASDAQ Telecommunications index. An investment of $100 (with reinvestment of all dividends) is assumed to have been made in our common stock and in each of the indexes on June 7, 2007, the first day of trading of our common stock and its relative performance is tracked through December 26, 2009. The NASDAQ Telecommunications Index contains securities of NASDAQ-listed companies classified according to the Industry Classification Benchmark as Telecommunications and Telecommunications Equipment. They include providers of fixed-line and mobile telephone services, and makers and distributors of high-technology communication products. This graph is not deemed to be “filed” with the SEC or subject to the liabilities of Section 18 of the Securities Exchange Act of 1934, and the graph shall not be deemed to be incorporated by reference into any prior or subsequent filing by Infinera under the Securities Act of 1933 or the Exchange Act.
COMPARISON OF 31-MONTH CUMULATIVE TOTAL RETURN*
Based upon an initial investment of $100 on June 7, 2007, the first day of trading of our common stock
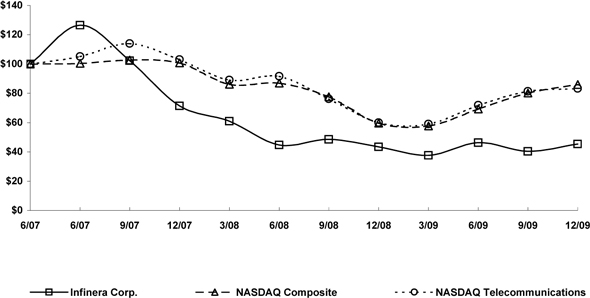
| * | $100 invested on June 7, 2007 in stock or May 31, 2007 in index-including reinvestment of dividends. |
32
Table of Contents
| ITEM 6. | SELECTED FINANCIAL DATA |
You should read the following selected consolidated historical financial data below in conjunction with the section titled “Management’s Discussion and Analysis of Financial Condition and Results of Operations” and the consolidated financial statements, related notes and other financial information included elsewhere in this Annual Report on Form 10-K. The selected financial data in this section is not intended to replace the financial statements and is qualified in its entirety by the consolidated financial statements and related notes thereto included elsewhere in this Annual Report on Form 10-K.
We derived the statements of operations data for the years ended December 26, 2009, December 27, 2008 and December 29, 2007 and the balance sheet data as of December 26, 2009 and December 27, 2008 from our audited consolidated financial statements and related notes, which are included elsewhere in this Annual Report on Form 10-K. We derived the statements of operations data for the years ended December 31, 2006 and December 31, 2005 and the balance sheet data as of December 29, 2007, December 31, 2006 and December 31, 2005 from our audited consolidated financial statements and related notes which are not included in this Annual Report. We have not declared or distributed any cash dividends. Additionally, our historical results are not necessarily indicative of the results that should be expected in the future.
| Years Ended | |||||||||||||||||||
| December 26, 2009 |
December 27, 2008 |
December 29, 2007 |
December 31, 2006 |
December 31, 2005 |
|||||||||||||||
| (In thousands, except per share data) | |||||||||||||||||||
| Revenue |
$ | 309,101 | $ | 519,212 | $ | 245,852 | $ | 58,236 | $ | 4,127 | |||||||||
| Gross profit (loss) |
$ | 102,101 | $ | 233,555 | $ | 76,589 | $ | (13,189 | ) | $ | (23,328 | ) | |||||||
| Net income (loss) |
$ | (86,622 | ) | $ | 78,728 | $ | (55,342 | ) | $ | (89,935 | ) | $ | (64,826 | ) | |||||
| Net income (loss) per common share |
|||||||||||||||||||
| Basic |
$ | (0.91 | ) | $ | 0.85 | $ | (1.09 | ) | $ | (14.90 | ) | $ | (14.08 | ) | |||||
| Diluted |
$ | (0.91 | ) | $ | 0.81 | $ | (1.09 | ) | $ | (14.90 | ) | $ | (14.08 | ) | |||||
| Weighted average number of shares used in computing basic and diluted net income (loss) per common share |
|||||||||||||||||||
| Basic |
95,468 | 92,427 | 50,732 | 6,036 | 4,605 | ||||||||||||||
| Diluted |
95,468 | 97,088 | 50,732 | 6,036 | 4,605 | ||||||||||||||
| Total cash and cash equivalents, investments and restricted cash |
$ | 275,477 | $ | 312,585 | $ | 305,830 | $ | 29,572 | $ | 37,112 | |||||||||
| Total assets |
$ | 491,945 | $ | 507,067 | $ | 529,188 | $ | 230,466 | $ | 100,912 | |||||||||
| Current and long-term debt |
$ | — | $ | — | $ | — | $ | 28,382 | $ | 23,773 | |||||||||
| Convertible preferred stock |
$ | — | $ | — | $ | — | $ | 320,550 | $ | 247,147 | |||||||||
| Common and additional paid-in capital |
$ | 747,677 | $ | 699,799 | $ | 663,962 | $ | 7,920 | $ | 3,529 | |||||||||
| Stockholders’ equity (deficit) |
$ | 368,507 | $ | 405,463 | $ | 294,574 | $ | (306,321 | ) | $ | (220,710 | ) | |||||||
33
Table of Contents
| ITEM 7. | MANAGEMENT’S DISCUSSION AND ANALYSIS OF FINANCIAL CONDITION AND RESULTS OF OPERATIONS |
This Annual Report on Form 10-K contains “forward-looking statements” that involve risks and uncertainties, as well as assumptions that, if they never materialize or prove incorrect, could cause our results to differ materially from those expressed or implied by such forward-looking statements. Such forward-looking statements include any expectation of earnings, revenues, gross margins, expenses or other financial items; any statements of the plans, strategies and objectives of management for future operations and personnel; factors that may affect our operating results; statements concerning new products or services, including future PIC capacity; statements related to future statements regarding capital expenditures; statements related to future economic conditions, performance, market growth or our sales cycle; statements related to repayment of our auction rate securities; statements related to the timing of achieving vendor specific objective evidence; statements as to industry trends and other matters that do not relate strictly to historical facts or statements of assumptions underlying any of the foregoing. These statements are often identified by the use of words such as “anticipate,” “believe,” “continue,” “could,” “estimate,” “expect,” “intend,” “may,” or “will,” and similar expressions or variations. These statements are based on the beliefs and assumptions of our management based on information currently available to management. Such forward-looking statements are subject to risks, uncertainties and other factors that could cause actual results and the timing of certain events to differ materially from future results expressed or implied by such forward-looking statements. Factors that could cause or contribute to such differences include, but are not limited to, those identified below, and those discussed in the section titled “Risk Factors” included in Item 1A of Part I of this Annual Report on Form 10-K. You should review these risk factors for a more complete understanding of the risks associated with an investment in our securities. Such forward-looking statements speak only as of the date of this report. We disclaim any obligation to update any forward-looking statements to reflect events or circumstances after the date of such statements. The following discussion and analysis should be read in conjunction with our “Selected Consolidated Financial Data” and consolidated financial statements and notes thereto included elsewhere in this Annual Report on Form 10-K.
Overview
Infinera was founded in December 2000 with a unique vision for optical networking. Prior to Infinera, service provider optical networks were built from fairly commoditized products, broadly known as dense wavelength division multiplexing (“DWDM”) systems. The pace of bandwidth growth in service provider networks has been significant over the last few years. Thus each year, service providers generally have been consuming more space, more power, and more of their human resources to deploy and manage their optical networks. The Infinera vision is that photonic integration offers a solution to this problem. Photonic integration is predicated upon the belief that, it is possible to generate a “Moore’s Law”-like continuous improvement in capacity per device (or “chip”) to help service providers scale their network bandwidth without significant increases in space, power or operational workload.
Infinera’s flagship product offering is an optical telecom system, the Digital Transport Node System (“DTN System”). The DTN System uses photonic integrated circuits, or PICs, to generate 100 Gigabits per second (“Gbps”) of optical capacity per line card. This capacity is then digitally “virtualized” so that it can be allocated, using software, to a variety of service types. The DTN System includes intelligent software that is designed to simplify and speed the delivery and control of optical services, and to enable advanced feature capabilities. Photonic integration provides the basis for the DTN System’s power and space advantages relative to conventional DWDM systems, while the DTN System’s bandwidth virtualization capability and software intelligence are architected to allow Infinera customers to simplify and speed their operations tasks, and ultimately to improve operational efficiency.
Infinera’s digital optical network architecture is made possible by what we believe to be the world’s only commercially-deployed, large-scale PIC. Our PICs transmit and receive 100 Gbps of optical capacity and incorporate the functionality of over 60 discrete optical devices into a pair of indium phosphide chips. Their function is to convert 100Gbps of optical capacity into electronic signals. Once electronic, these signals can be virtualized and allocated to a number of services using digital technology. The PICs enable the DTN System to deliver a wide range of transport services, with optional advanced features, quickly and easily. By contrast, competitive DWDM platforms, which do not have access to PIC technology, generally require photonics equipment to add new services to the network. Photonic engineering can be considerably slower and more difficult than digital engineering; as a result, we believe competitive platforms have less flexibility, take longer to provision, and are harder to operate than the DTN System.
In 2009, we expanded our addressable market by introducing a new product, the ATN System, which extends the benefits of an Infinera network into smaller locations in the metro access network. We also introduced new submarine network capabilities into the DTN System. As a result, Infinera now offers end-to-end optical networking solutions from the metro edge, through the regional and long-haul terrestrial network, all the way to the submarine network terminal.
34
Table of Contents
Our goal is to be a leading provider of optical communications systems to operators of optical networks, including telecom carriers, cable operators, internet or content service providers, and others. Our revenue growth will depend on the continued acceptance of our products, growth of communications traffic and the proliferation of next-generation bandwidth-intensive services, which are expected to drive the need for increased levels of bandwidth. Our ability to increase revenue and achieve profitability will be directly affected by the level of acceptance of our products in the long-haul and metro DWDM markets and by our ability to cost-effectively develop and sell innovative products that leverage our technology advantages.
As of December 26, 2009, we have sold our network systems for deployment in the optical networks of 69 customers worldwide, including Cox Communications, Deutsche Telekom, Global Crossing, Interoute and Level 3 Communications (“Level 3”). We do not have long-term purchase commitments with our customers. To date, a few of our customers have accounted for a significant portion of our revenue. In particular, Level 3 accounted for approximately 17%, 25% and 47% of our revenue in 2009, 2008 and 2007, respectively. In July 2009, we were informed by Level 3 that they intended to use another DWDM vendor in their network. We believe that this vendor will be given a significant portion of Level 3’s new network deployments commencing in 2010, and will impact the revenue we will receive from Level 3 in the future.
We are headquartered in Sunnyvale, California, with employees located throughout the United States, Europe and the Asia Pacific region. We expect to continue to add personnel in the United States and internationally to develop our product and provide additional geographic sales and technical support coverage. We primarily sell our products through our direct sales force, with a small portion sold indirectly through resellers. We derived 94% of our revenue from direct sales to customers for the year ended December 26, 2009. We derived 97% of our revenue from direct sales to customers for each of the years ended December 27, 2008 and December 29, 2007. We expect to continue generating a substantial majority of our revenue from direct sales in the future.
Our revenue trends prior to December 27, 2008 had been significantly impacted by the timing of our attainment of vendor specific objective evidence (“VSOE”) of fair value for most of our services and are not indicative of revenue trends in 2009 and future periods. Prior to the first quarter of 2008, revenue from product sales sold in combination with services (“bundled product sales”) was deferred and recognized ratably over a period of approximately one year. This resulted in the accumulation of $174.4 million of deferred revenue and $81.6 million of associated deferred inventory costs on the balance sheet as of December 29, 2007. We recognized $165.8 million of this deferred revenue and $78.4 million of associated deferred inventory costs in 2008. In addition, the attainment of VSOE of fair value for most of our services beginning in the first quarter of 2008 required us to recognize a majority of our 2008 product sales as revenue in the period in which the bundled products were accepted by the customer. The combined effect of the recognition of the deferred revenue from prior periods and the upfront recognition of revenue from bundled product sales in 2008 resulted in significantly increased levels of revenue, gross margin and net income for 2008. In 2009, we did not recognize significant amounts of product related deferred revenue and deferred gross profit from prior periods and do not expect to do so in the future.
The table below illustrates our 2008 results as reported and excluding the impact of the recognition of deferred amounts from prior periods:
| Year Ended December 27, 2008 | ||||||||||||
| As Reported Results |
Pre-VSOE Deferred Adjustments |
As Adjusted Results |
||||||||||
| (In thousands, except gross margin) | ||||||||||||
| Revenue |
$ | 519,212 | $ | (165,787 | ) | $ | 353,425 | |||||
| Cost of revenue |
285,657 | (78,401 | ) | 207,256 | ||||||||
| Gross profit |
$ | 233,555 | $ | (87,386 | ) | $ | 146,169 | |||||
| Gross margin |
45 | % | 41 | % | ||||||||
| Income (loss) from operations |
$ | 73,433 | $ | (87,386 | ) | $ | (13,953 | ) | ||||
| Net income (loss) |
$ | 78,728 | $ | (87,386 | ) | $ | (8,658 | ) | ||||
We believe that these adjusted amounts, as presented in the As Adjusted Results column of the table above, are more indicative of the revenue and gross margins generated directly from our 2008 sales and invoiced shipment activities. Our 2009 and future period product revenues and gross margins are expected to more closely approximate our invoiced shipment results with no further significant releases of deferred amounts from prior periods. Our future product revenues will therefore be largely driven by our underlying invoiced shipment trends. Our near term year-over-year and quarter-over-quarter growth in invoiced shipments will likely be volatile and may be impacted by several factors including general economic and market conditions, the timing of large product deployments, acquisitions of new customers and development of new products.
35
Table of Contents
We will continue to make significant investments in the business, and currently management believes that operating expenses will be approximately $225 million to $230 million, including stock-based compensation expense, for 2010.
In July 2009, we announced a restructuring plan under which we closed our Maryland based semiconductor fabrication plant (“FAB”) and consolidated these activities into our primary FAB location in Sunnyvale, California. This consolidation of activities into one location is expected to facilitate collaboration across integration platforms in support of our next generation products. As a result, during 2009, we recorded $3.9 million of restructuring and other related costs including severance and related expenses, equipment and facilities-related costs, operating lease termination costs, and other exit costs. Equipment and facilities-related costs primarily consist of increased depreciation expense related to restructured assets caused by shortening the useful life or updating the salvage value of depreciable fixed assets to coincide with the end of production under the approved restructuring plan. We substantially completed our restructuring actions in the fourth quarter of 2009.
Future payments of approximately $0.7 million primarily associated with severance and related expenses and operating lease termination and related costs are expected to be made through 2010. Additional charges may be incurred in the future related to this restructuring, particularly if the actual costs associated with vacant facilities and other restructured activities are higher than expected. Beginning in the second quarter of fiscal 2010, we currently expect to experience an approximate 2% quarterly gross margin improvement as a result of the closure of the Maryland FAB and the consolidation of those activities with our other operations. See Note 5, “Restructuring and Other Related Costs” to the Notes to Consolidated Financial Statements for more information.
On June 11, 2009, our stockholders approved the Option Exchange Program (the “Program”), and on January 25, 2010, we launched this one-time stock option exchange program pursuant to which eligible employees were able to exchange certain outstanding stock options under our 2007 Equity Incentive Plan with an exercise price greater than or equal to $8.16 per share and a grant date on or before January 25, 2009, for a lesser amount of new RSUs or, for new stock options for senior executives. The Program was approved by our stockholders in June 2009 and was available for employees of the Company residing in the U.S., India and U.K. who held eligible shares. The Program expired on February 22, 2010, and there were 4,926,790 shares tendered for exchange. All surrendered options were cancelled effective as of the expiration of the Program, and immediately thereafter, Infinera granted (i) new options with an exercise price of $7.61 per share to purchase an aggregate of 1,564,727 shares of Infinera common stock and (ii) RSUs of 814,017 shares of Infinera common stock.
Overview of Consolidated Financial Data
Revenue
We derive our revenue from sales of our products, support and services. Our revenue is comprised of three components: (1) product revenue, (2) ratable product and related support and services revenue, or ratable revenue and (3) services revenue. Product revenue primarily relates to bundled products that are sold only with services for which VSOE of fair value has already been established and therefore, is recognized upfront under the residual method. Product revenue also includes products that are sold without services or a small amount of product sales where software is considered incidental.
Our DTN System and ATN System are integrated with software that is more than incidental to the functionality of our equipment. We refer to the integration of our DTN System and ATN System with our software and related support and services as a bundled product. We recognize the majority of our revenue pursuant to the Software – Revenue Recognition Subtopic of the FASB Accounting Standards Codification (“Codification”). For arrangements with multiple elements which include product and services for which VSOE of fair value has been established, we allocate revenue to the undelivered element using the residual method based on VSOE of fair value for each of the undelivered elements. However, when these transactions also include undelivered services for which VSOE has not been established, product revenue is deferred and recognized ratably over the longest remaining service period.
36
Table of Contents
Services revenue is comprised of (1) revenue related to services for which VSOE of fair value has been established, (2) revenue related to services which were sold on a standalone basis or (3) revenue related to extended hardware warranty sales.
The following table illustrates our revenue for the years ended December 26, 2009, December 27, 2008 and December 29, 2007:
| Years Ended | |||||||||
| December 26, 2009 |
December 27, 2008 |
December 29, 2007 | |||||||
| (In thousands) | |||||||||
| Revenue: |
|||||||||
| Product |
$ | 276,012 | $ | 306,808 | $ | 8,107 | |||
| Ratable product and related support and services |
4,231 | 193,705 | 237,745 | ||||||
| Services |
28,858 | 18,699 | — | ||||||
| Total revenue |
$ | 309,101 | $ | 519,212 | $ | 245,852 | |||
Total Revenue. Total revenue for the years ended December 26, 2009 and December 27, 2008 was $309.1 million and $519.2 million, respectively. However, as explained above, revenue for 2008 was unusually high and included $165.8 million of revenue related to reductions in the deferred revenue balances related to prior periods. Excluding this non-recurring deferred revenue impact, revenue in 2008 would have been $353.4 million as compared to revenue in 2009 of $309.1 million, resulting in a decrease in revenue on a year-over-year basis of $44.3 million. This reduction in revenue was primarily due to the impact of the recent economic downturn on sales of our DTN Systems to existing customers in the first half of 2009. This decline in revenue was partially offset by the recognition of revenue on a number of large deployments with new and certain existing customers that were completed and recognized as revenue in the second and third quarters of 2009. In addition, we began to see a recovery in overall product sales in the fourth quarter of 2009.
Product Revenue. Product revenue consists of products that are sold without services or bundled products that are sold with services for which VSOE of fair value has already been established and therefore, is recognized upfront under the residual method. We use the residual method to recognize revenue when a sales agreement includes one or more elements to be delivered at a future date and VSOE of fair value of all undelivered elements exists. VSOE of fair value for software warranty, software subscription, training and installation and deployment services is determined by reference to the price the customer will be required to pay when these services are sold separately.
We attained VSOE of fair value for software subscription services in the first quarter of 2008, for training and installation and deployment services in the second quarter of 2008 and for spares management and on-site hardware replacement services in the fourth quarter of 2008. Product revenue of $306.8 million and $276.0 million was recognized for 2008 and 2009, respectively. The decline in product revenues was primarily due to reduced sales of our DTN Systems to existing customers in the first half of 2009 partially offset by the recognition of revenue on a number of large deployments with new and certain existing customers that were completed and recognized as revenue in the second and third quarters of 2009. In addition, we began to see a recovery in overall product sales in the fourth quarter of 2009 as customer purchases returned to normal levels.
Ratable Product and Related Support and Services Revenue. Substantially all of our product sales are sold in combination with support services, which consist of software warranty or software subscription services. In addition, we have sold training, installation and deployment services, spares management and on-site hardware replacement services with a significant number of these bundled sales.
VSOE of fair value for support services, training and installation and deployment services is determined by reference to the price the customer is required to pay when these services are sold separately. Support services are comprised of software warranty and software subscription services. Software warranty provides customers with maintenance releases and patches during the warranty support period. Software subscription also includes maintenance releases and patches and provides customers with rights to receive unspecified software product upgrades released during the support period. In order to establish VSOE for these services, we were required to establish a history of selling these services separately at a consistent price.
Prior to December 29, 2007, we had not established VSOE of fair value for support services, training or installation and deployment services. As a result, prior to that date, when all other revenue recognition criteria had been met and the only undelivered element was support services, training or installation and deployment services, revenue was deferred and recognized ratably over the longest undelivered service period. The undelivered service period for these services ranged from one to five years and averaged 14 months in the fourth quarter of 2007. This resulted in the majority of our invoiced shipments in 2007 being deferred and recognized over an average period of 14 months. Revenue related to these arrangements in that period was included in ratable product and related support and services revenue.
37
Table of Contents
We attained VSOE of fair value for software subscription services in the first quarter of 2008, for training and installation and deployment services in the second quarter of 2008 and for spares management and on-site hardware replacement services in the fourth quarter of 2008. As a result, throughout 2008, we were no longer required to ratably recognize product revenue for sales transactions where products were sold with services for which VSOE had been attained. This change resulted in a significant increase in product and services revenue recognized at the time of customer acceptance offset by a reduction in ratable revenue and additions to deferred revenue for the year.
Following the attainment of VSOE for most of our services during 2008, we were required to recognize the majority of our invoiced shipments in 2009 as product and services revenue at the time of customer acceptance. Ratable revenue for 2009 reduced significantly and related primarily to a small portion of our shipments where products are sold in combination with software warranty and other services for which VSOE has not yet been established and amounted to $4.2 million in 2009.
Services Revenue. Services revenue is comprised of (1) revenue related to bundled services for which VSOE of fair value has been established, (2) revenue related to services which were sold on a standalone basis or (3) revenue related to extended hardware warranty and other non-bundled services. We attained VSOE of fair value for most of our services during 2008 and have since recognized revenue from delivered training and installation and deployment services, software subscription services, spares management services, and on-site hardware replacement services as services revenue in our consolidated statements of operations. In 2009, we recorded $28.9 million of services revenue of which approximately 52.5% of the services revenue recorded related to software subscription services, with 32.5% related to installation and deployment services and 15.0% related to all other services. We expect to see some growth in services revenue in the future as we sell increasing levels of extended hardware warranty.
Deferred Revenue. Prior to December 29, 2007, a portion of our invoiced shipments of bundled products and services were recognized as revenue in such quarter and the remainder was recorded as deferred revenue. Deferred revenue increased each quarter by the amount of invoiced shipments of bundled products and services in that quarter and decreased by the amount of ratable revenue recognized from invoiced shipments of bundled products and services. Following the attainment of VSOE of fair value on most of our services during 2008, the majority of our invoiced shipments are recognized as revenue in the same period in which they are accepted by the customer. As a result, our deferred revenue balance now represents a smaller portion of our shipments where products are sold in combination with software warranty and other services for which VSOE has not yet been established or shipments where the revenue arrangement is not complete and revenue therefore cannot be recognized.
Our services deferred revenue balance relates to deferred software subscription, extended hardware warranty and spares management and on-site hardware replacement services sales which will be recognized as services revenue on a ratable basis over the remaining contractual period and also relates to deferred training and deployment and installation services which will be recognized as services revenue upon delivery of the services.
38
Table of Contents
The following tables illustrate the net increase (decrease) in deferred revenue for the specified periods:
| Year Ended December 26, 2009 | ||||||||||||||||
| Pre March 29, 2008 Product/Ratable Revenue(1) |
Post March 29, 2008 Product/Ratable Revenue(2) |
Services Revenue |
Total | |||||||||||||
| (In thousands) | ||||||||||||||||
| Beginning balance |
$ | 8,650 | $ | 4,177 | $ | 9,580 | $ | 22,407 | ||||||||
| Additions to deferred revenue |
— | 8,898 | 23,818 | 32,716 | ||||||||||||
| Amortization to revenue |
(3,944 | ) | (5,023 | ) | (19,781 | ) | (28,748 | ) | ||||||||
| Ending balance |
$ | 4,706 | $ | 8,052 | $ | 13,617 | $ | 26,375 | ||||||||
| Net increase (decrease) in deferred revenue balance |
$ | (3,944 | ) | $ | 3,875 | $ | 4,037 | $ | 3,968 | |||||||
| Year Ended December 27, 2008 | Year Ended December 29, 2007 |
|||||||||||||||||||
| Pre March 29, 2008 Product/Ratable Revenue(1) |
Post March 29, 2008 Product/Ratable Revenue(2) |
Services Revenue |
Total | Total | ||||||||||||||||
| (In thousands) | ||||||||||||||||||||
| Beginning balance |
$ | 174,437 | $ | — | $ | — | $ | 174,437 | $ | 110,953 | ||||||||||
| Additions to deferred revenue |
29,639 | 8,140 | 19,356 | 57,135 | 301,229 | |||||||||||||||
| Amortization to revenue |
(195,426 | ) | (3,963 | ) | (9,776 | ) | (209,165 | ) | (237,745 | ) | ||||||||||
| Ending balance |
$ | 8,650 | $ | 4,177 | $ | 9,580 | $ | 22,407 | $ | 174,437 | ||||||||||
| Net increase (decrease) in deferred revenue balance |
$ | (165,787 | ) | $ | 4,177 | $ | 9,580 | $ | (152,030 | ) | $ | 63,484 | ||||||||
| (1) | Represents changes in deferred revenue related to periods prior to the attainment of VSOE of fair value for most of our services. |
| (2) | Represents changes in deferred revenue related to periods after the attainment of VSOE of fair value for most of our services. |
Cost of Revenue
The following table illustrates our cost of revenue for the specified periods:
| Years Ended | |||||||||
| December 26, 2009 |
December 27, 2008 |
December 29, 2007 | |||||||
| (In thousands) | |||||||||
| Cost of revenue: |
|||||||||
| Cost of product |
$ | 189,723 | $ | 184,234 | $ | 4,091 | |||
| Cost of ratable product and related support and services |
1,931 | 91,625 | 165,172 | ||||||
| Cost of services |
12,308 | 9,798 | — | ||||||
| Restructuring and other costs related to cost of revenue |
3,038 | — | — | ||||||
| Total cost of revenue |
$ | 207,000 | $ | 285,657 | $ | 169,263 | |||
Total Cost of Revenue. Total cost of revenue consists primarily of the costs of manufacturing network components, such as personnel costs, stock-based compensation, raw materials, overhead, services costs and period costs. Period costs consist primarily of freight and logistics costs, manufacturing ramp-up costs, expenses for inventory obsolescence, lower of cost or market (“LCM”) adjustments, and warranty obligations, and are recognized in the period in which they are incurred or can be reasonably estimated. All other costs of revenue are recognized in the same period as the corresponding revenue. We continue to develop and introduce new products to the market on an ongoing basis and may experience some increase in inventory write-downs in future periods as we manage these product transitions. In addition, the cost of some of our products may increase in future periods due to changes in yields and production volumes for these products.
The initial deployment of our DTN System and ATN System involve the installation of common equipment, including a chassis, optical line amplifiers and related equipment. This common equipment is typically sold at low or negative gross margins. When we sell equipment at a loss, the losses are recognized in the period in which they are incurred or can be reasonably estimated and often in advance of the recognition of the related revenue. We refer to these losses as lower of cost or market adjustments, or LCM adjustments. The amount of LCM adjustments recorded in our consolidated statements of operations in any period may fluctuate significantly depending on the amount of inventory and purchase commitments in place for these products and the pricing agreed with customers.
39
Table of Contents
In July 2009, we announced a restructuring plan under which we closed our Maryland based semiconductor FAB and consolidated these activities into our primary FAB location in Sunnyvale, California. We substantially completed our restructuring actions in the fourth quarter of 2009. See Note 5, “Restructuring and Other Related Costs” to the Notes to Consolidated Financial Statements for more information.
Cost of Product Revenue. Cost of product revenue consists of the costs of manufacturing network components, such as personnel costs, stock-based compensation, raw materials, overhead and period costs related to those sales recognized as product revenue in the period. Period costs consist primarily of shipping fees, logistics costs, manufacturing ramp-up costs, expenses for inventory obsolescence, LCM adjustments, and warranty obligations, and are recognized in the period in which they are incurred or can be reasonably estimated.
Cost of Ratable Product and Related Support and Services Revenue. Cost of ratable product and related support and services revenue consists primarily of the costs of manufacturing our network equipment, including personnel costs, stock-based compensation, raw materials, overhead and period costs related to those sales recognized as ratable product and related support and services revenue as described above. Period costs associated with ratable product and related support and services revenue are recognized in the period in which they are incurred or can be reasonably estimated. All other costs of ratable product and related support and services revenue are initially recorded as deferred inventory costs and are subsequently recognized in the same period as the corresponding revenue.
Cost of Services Revenue. Cost of services revenue consists primarily of the costs of providing our service offerings, including personnel costs, stock-based compensation and costs associated with third party service providers.
Restructuring and Other Costs Related to Cost of Revenue. Restructuring and other costs related to cost of revenue of $3.0 million comprised of operating lease termination costs, equipment and facilities-related costs, severance and related expenses, and other exit costs related to the closure of our Maryland based semiconductor FAB.
Deferred Inventory Cost. Deferred inventory cost increases by the cost of invoiced shipments deferred in a period and decreases as cost of ratable revenue is amortized or recognized in that period.
The following tables illustrate the net increase (decrease) in our deferred inventory cost for the specified periods:
| Year Ended December 26, 2009 | ||||||||||||
| Pre March 29, 2008 Product/Ratable Revenue(1) |
Post March 29, 2008 Product/Ratable Revenue(2) |
Total | ||||||||||
| (In thousands) | ||||||||||||
| Beginning balance |
$ | 3,221 | $ | 1,016 | $ | 4,237 | ||||||
| Additions to deferred inventory cost |
— | 10,111 | 10,111 | |||||||||
| Amortization to cost of revenue |
(1,299 | ) | (2,720 | ) | (4,019 | ) | ||||||
| Ending balance |
$ | 1,922 | $ | 8,407 | $ | 10,329 | ||||||
| Net increase (decrease) in deferred inventory cost balance |
$ | (1,299 | ) | $ | 7,391 | $ | 6,092 | |||||
40
Table of Contents
| Year Ended December 27, 2008 | Year Ended December 29, 2007 |
|||||||||||||||
| Pre March 29, 2008 Product/Ratable Revenue(1) |
Post March 29, 2008 Product/Ratable Revenue(2) |
Total | Total | |||||||||||||
| (In thousands) |
||||||||||||||||
| Beginning balance |
$ | 81,622 | $ | — | $ | 81,622 | $ | 67,253 | ||||||||
| Additions to deferred inventory cost |
11,162 | 1,202 | 12,364 | 144,374 | ||||||||||||
| Amortization to cost of revenue |
(89,563 | ) | (186 | ) | (89,749 | ) | (130,005 | ) | ||||||||
| Ending balance |
$ | 3,221 | $ | 1,016 | $ | 4,237 | $ | 81,622 | ||||||||
| Net increase (decrease) indeferred inventory cost balance |
$ | (78,401 | ) | $ | 1,016 | $ | (77,385 | ) | $ | 14,369 | ||||||
| (1) | Represents changes in deferred inventory cost related to periods prior to the attainment of VSOE of fair value for most of our services. |
| (2) | Represents changes in deferred inventory cost related to periods after the attainment of VSOE of fair value for most of our services. |
Gross Margin
Gross margins have been and will continue to be affected by a variety of factors, including the product mix, average selling prices of our products, new product introductions and enhancements, changes to our manufacturing costs, including the impact of fluctuations in yields and production volumes, the amount of revenue that is recognized up front versus deferred and the period over which that revenue is recognized, and the amount of common equipment sold at a loss causing an LCM adjustment.
The following table illustrates our gross margin for the specified periods:
| Years Ended | ||||||||||||
| December 26, 2009 |
December 27, 2008 |
December 29, 2007 |
||||||||||
| (In thousands, except gross margin) | ||||||||||||
| Revenue |
$ | 309,101 | $ | 519,212 | $ | 245,852 | ||||||
| Cost of revenue |
207,000 | 285,657 | 169,263 | |||||||||
| Gross profit |
$ | 102,101 | $ | 233,555 | $ | 76,589 | ||||||
| Gross margin |
33 | % | 45 | % | 31 | % | ||||||
The table below illustrates our 2008 results as reported and excluding the impact of the recognition of deferred amounts from prior periods.
| Year Ended December 27, 2008 | ||||||||||||
| As Reported Results |
Pre-VSOE Deferred Adjustments |
As Adjusted Results |
||||||||||
| (In thousands, except %) | ||||||||||||
| Revenue |
$ | 519,212 | $ | (165,787 | ) | $ | 353,425 | |||||
| Cost of revenue |
285,657 | (78,401 | ) | 207,256 | ||||||||
| Gross profit |
$ | 233,555 | $ | (87,386 | ) | $ | 146,169 | |||||
| Gross margin |
45 | % | 41 | % | ||||||||
The prices paid for our DTN Systems vary by customer. In addition, the quantity of DTN Systems purchased by each of our customers varies from quarter-to-quarter depending on our customers’ needs for optical transport equipment. To the extent that a customer with lower contractual prices purchases significant quantities of our DTN Systems that comprise a significant portion of the DTN Systems we sell within a quarter, our gross margin for such a quarter would be lower. In addition, pricing for optical communications systems, such as our DTN System, is very competitive and we must often respond to these competitive pressures by decreasing the initial purchase price of our product. As a result of these competitive pressures and in order to gain new customers, our common equipment is typically sold at low margins or at a loss. Our Digital Line Modules (“DLMs”), Tributary Adapter Modules (“TAMs”), and Tributary Optical Modules (“TOMs”) are typically sold at higher gross margins. These higher margin sales positively impact overall gross margin. Because of the significant impact that changes in product and customer mix and the timing of new customer deployments have on our gross margin levels, we experience significant gross margin volatility on a quarter-over-quarter basis.
41
Table of Contents
In addition, forecasted sales of negative margin common equipment can result in increased LCM adjustments in order to record inventory and purchase commitments at their net realizable value. These LCM adjustments are recognized in advance of the recognition of the related revenue and result in lower gross margins in the periods in which the LCM adjustments are recorded.
As illustrated in the table above, revenue and gross profit in 2008 were unusually high due to the impact of the attainment of VSOE of fair value for software subscription services in the first quarter of 2008 and for training and installation and deployment services in the second quarter of 2008. This change resulted in the recognition of $87.4 million of gross profit related to reductions in the deferred revenue and deferred inventory cost balances in 2008. In addition, the change resulted in the recognition of $146.2 million of gross profit in 2008 from invoiced shipments in the period. Gross profit of $102.1 million for 2009, primarily reflects sales in the period and does not include the recognition of significant amounts of deferred gross profit from prior periods. Excluding the prior period impact described above from the 2008 results, gross margin for 2008 would have been 41% compared to gross margin of 33% for 2009. As further discussed in the section titled, “Results of Operations,” below, gross margin in 2009 as compared to 2008 was significantly impacted by the recognition of revenue related to large lower margin common equipment deployments with new and existing customers and lower sales of our higher margin TAM and DLM products particularly in the first half of the year.
Gross margin in 2007 were 31% as compared to 45% in 2008. However, prior to December 29, 2007, we had not attained VSOE of fair value for most of our services and were required to recognize much of our revenue ratably over the longest undelivered service period. This requirement resulted in the deferral of $63.5 million of revenue and $49.1 million of gross profit related to 2007 invoiced shipments. As described above, these deferral amounts were subsequently recognized as revenue and gross profit in 2008. Excluding the impacts of VSOE related deferrals from 2007 and 2008, adjusted gross margin resulted in 41% for both years.
Although it is difficult to predict gross margin in future periods, we expect to continue to add new customers to our customer base and to continue to win new opportunities with existing customers resulting in significant common equipment deployments in 2010 which may negatively impact gross margin. We expect this to be offset by some continued improvement in TAM sales over the volumes experienced in 2009 as customers continue to grow their existing networks.
Operating expenses consist of sales and marketing, research and development and general and administrative expenses, and are recognized as incurred. Personnel-related costs are the most significant component of each of these expense categories. We expect personnel costs to continue to increase as we hire new employees to support our anticipated long-term growth. We currently expect total operating expenses will be approximately $225 million to $230 million, including stock-based compensation expense, for 2010.
Research and development expenses are the largest component of our operating expenses and primarily include salary and related benefit costs, including stock-based compensation expense, prototype and new product spending, and facilities costs and other related expenses. We expense research and development expenses as incurred. We are devoting substantial resources to the continued development of additional functionality for existing products and the development of new products. We intend to continue to invest significantly in our research and development efforts both in the United States and internationally because we believe that they are essential to maintaining our competitive position.
Sales and marketing expenses primarily include salary and related benefit costs, including stock-based compensation expense, sales commissions, marketing and facilities costs. We expect sales and marketing expenses to increase as we hire additional personnel both in the United States and internationally to support our expected revenue growth.
General and administrative expenses consist primarily of salary and related benefit costs, including stock-based compensation expense and facilities related to our executive, finance, human resource, information technology and legal organizations, and fees for professional services. Professional services principally consist of outside legal, audit and information technology consulting costs.
42
Table of Contents
Restructuring and other related costs include severance and related expenses, equipment and facilities-related costs, operating lease termination costs, and other exit costs related to the restructuring plan announced in July 2009, under which we closed our Maryland based semiconductor FAB.
Other Income (Expense), Net
Other income (expense), net includes interest income on our cash and short-term and long-term investment balances, gains or losses on sale of assets and investments, foreign currency transactions and translations, changes in the fair value of our ARS trading securities and Put Rights, other-than-temporary credit impairment losses on our available-for-sale ARS and realized gains or losses on investments. During 2007, other income (expense), net, also included an adjustment to record our convertible preferred stock warrants at fair value. If interest rates continue to fluctuate due to current global market conditions, we will experience volatility in future interest income from our cash and short-term and long-term investment balances, assuming consistent investment levels.
Provision for Income Taxes
During 2009, we recognized a current tax benefit of approximately $2.1 million for a reversal of the 2008 federal and state tax provision, following a favorable ruling by the Internal Revenue Service in the third quarter of 2009. Exclusive of this one-time benefit, we recognized income tax expense of approximately $0.3 million, on pre-tax book losses of $88.5 million, for 2009. Exclusive of this one-time benefit, the resulting effective tax rate of 0.4% for 2009 differs from the expected statutory rate of 35% based upon unbenefited U.S. losses, non-deductible stock compensation charges and foreign taxes provided on foreign subsidiary earnings, offset by the benefit related to refundable research and development tax credits. This compares to an effective tax rate of approximately 3.3% for 2008, which reflects tax benefits arising from the release of certain valuation allowance on domestic tax attribute carryforwards which was partially offset by the impact of certain non-deductible stock compensation charges, federal alternative minimum tax and state income taxes.
Critical Accounting Policies and Estimates
Our consolidated financial statements are prepared in accordance with United States generally accepted accounting principles, or GAAP. These accounting principles require us to make certain estimates and judgments that can affect the reported amounts of assets and liabilities as of the date of the consolidated financial statements, as well as the reported amounts of revenue and expenses during the periods presented. Significant estimates and assumptions made by management include revenue recognition, stock-based compensation, inventory valuation, allowances for doubtful accounts, accrued warranty, fair value measurement of investments, cash, cash equivalents and short-term and long-term investments, other-than-temporary impairments and accounting for income taxes. By their nature, these estimates and judgments are subject to an inherent degree of uncertainty. We believe that the estimates and judgments upon which we rely are reasonable based upon information available to us at the time that these estimates and judgments are made. To the extent there are material differences between these estimates and actual results, our consolidated financial statements will be affected.
Revenue Recognition
Our networking products are generally integrated with software that is more than incidental to the functionality of the equipment. We recognize product revenue when all of the following have occurred: (1) we have entered into a legally binding arrangement with a customer; (2) delivery has occurred, which is when product title and risk of loss have transferred to the customer; (3) customer payment is deemed fixed or determinable; and (4) collectability is reasonably assured. Revenue is recognized net of cash discounts.
Substantially all of our product sales are sold in combination with software support services comprised of either software warranty or software subscription services. In addition, we periodically sell training, installation and deployment services, spares management and on-site hardware replacement services with our product sales. Software warranty provides customers with maintenance releases and patches during the warranty support period. Software subscription also includes maintenance releases and patches and provides customers with rights to receive unspecified software product upgrades released during the support period. Training services include the right to a specified number of training classes over the term of the arrangement. Installation and deployment services may include customer site assessments, equipment installation and testing. Spares management and on-site hardware replacement services include the replacement of defective units at customer sites in accordance with specified service level agreements. Product revenue consists of products that are sold without services or bundled products that are sold with services for which vendor specific objective evidence (“VSOE”) of fair value has already been established and, therefore, is recognized upfront under the residual method. We use the residual method to recognize revenue when a sales agreement includes one or more elements to be delivered at a future date and VSOE of fair value of all undelivered elements exists. VSOE of fair value for software warranty, software subscription, training and installation and deployment services, spares management and on-site hardware replacement services is determined by reference to the price the customer will be required to pay when these services are sold separately.
43
Table of Contents
Prior to the first quarter of 2008, we had not established VSOE of fair value for our support services and, therefore recognized all revenue for transactions bundled with these services ratably over the longest remaining support period which ranges from one to five years. Revenue related to these arrangements is included in ratable product and related support and services revenue. We determined that we had established VSOE of fair value for software subscription in the first quarter of 2008, for training and installation and deployment services in the second quarter of 2008 and for spares management and on-site hardware replacement services in the fourth quarter of 2008. For arrangements with multiple elements which include product and software subscription services and or training and installation and deployment services, spares management and on-site hardware replacement services, we allocate revenue to the undelivered elements using the residual method based on VSOE of fair value for each such element and the remainder is recognized as product revenue. However, when these transactions also include undelivered services for which VSOE of fair value has not been established, revenue is deferred and recognized ratably over the longest remaining support period. Upon completion of the services for which VSOE of fair value has not been established, the difference between the VSOE of fair value for the remaining related service periods and the remaining unrecognized portion of the arrangement fee is recognized as ratable product and related support and services revenue.
Services revenue includes software subscription services, training, installation and deployment services, spares management and on-site hardware replacement services and extended hardware warranty services. Revenue from software subscription, spares management and on-site hardware replacement services and extended hardware warranty contracts is deferred and is recognized ratably over the contractual support period, which is generally one year. A majority of our customers have exercised the option to purchase software subscription services on an ongoing basis. Revenue related to training and installation and deployment services is recognized as the services are completed.
Contracts and customer purchase orders are generally used to determine the existence of an arrangement. In addition, shipping documents and customer acceptances, when applicable, are used to verify delivery and transfer of title. Revenue is recognized only when title and risk of loss pass to customers. In instances where acceptance of the product occurs upon formal written acceptance, revenue is deferred until such written acceptance has been received. We assess whether the fee is fixed or determinable based on the payment terms associated with the transaction. Payment terms to customers generally range from net 30 to 120 days from invoice, which are considered to be standard payment terms. However, payment terms greater than 120 days but less than or equal to one year from invoice may be considered standard if payment is supported by an irrevocable commercial letter of credit (“LOC”) issued by a creditworthy bank or the LOC has been accepted and confirmed by a creditworthy bank. In the event payment terms are provided that differ from our standard business practices, the fees are deemed to not be fixed or determinable and, therefore, revenue is not recognized until the fees become fixed or determinable which we believe is when they are legally due and payable. We assess our ability to collect from our customers based primarily on the creditworthiness and past payment history of the customer.
For sales to resellers, the same revenue recognition criteria apply. It is our practice to identify an end user prior to shipment to a reseller. We do not offer rights of return or price protection to our resellers.
Shipping charges billed to customers are included in product revenue and related shipping costs are included in product cost.
We report revenue net of any required taxes collected from customers and remitted to government authorities, with the collected taxes recorded as current liabilities until remitted to the relevant government authority.
Stock-Based Compensation
Stock-based compensation cost is measured at the grant date based on the fair value of the award, and is recognized as expense over the requisite service period (generally the vesting period) under the straight-line amortization method.
44
Table of Contents
We estimate the fair value of the stock options granted using the Black-Scholes option pricing formula and a single option award approach. For new-hire grants, options typically vest with respect to 25% of the shares one year after the option’s vesting commencement date and the remainder ratably on a monthly basis over three years, commencing one year after the vesting commencement date. For annual refresh grants, options typically vest ratably on a monthly basis over three, four or five years. In the third quarter of 2009, we granted retention options to executives which vest ratably on a monthly basis over two years. We make a number of estimates and assumptions in determining stock-based compensation related to options including the following:
| • | The expected forfeiture rate is estimated based on our historical forfeiture data and compensation costs are recognized only for those equity awards expected to vest. The estimation of the forfeiture rate requires judgment, and to the extent actual forfeitures differ from expectations, changes in estimate will be recorded as an adjustment in the period when such estimates are revised. Actual results may differ substantially from the estimates. |
| • | Commencing in June 2007, we elected to use the simplified method to estimate the expected term due to increased liquidity of the underlying options in the post-IPO era as compared to our historical grants. We started using our own historical data to estimate the expected term starting in October 2009. |
| • | Expected volatility of our stock is based on the weighted-average implied and historical volatility of Infinera and our peer group. The peer group is comprised of similar companies in the same industrial sector. As we gain more historical volatility data, the weighting of our own data in the expected volatility calculation associated with options will gradually increase. |
We estimate the fair value of the rights to acquire stock under our Employee Stock Purchase Plan (“ESPP”) using the Black-Scholes option pricing formula. Our ESPP typically provides for consecutive six-month offering periods, except for the first such offering period which commenced on June 7, 2007 and ended on February 15, 2008. We use our own historical volatility data in the valuation of ESPP shares.
We accounted for the fair value of restricted stock units (“RSUs”) using the closing market price of our common stock on the date of grant. For new-hire grants, RSUs typically vest ratably on an annual basis over four years. For annual refresh grants, RSUs typically vest ratably on an annual basis over three, four or five years. In 2009, we granted retention RSUs to executives which cliff vest after an approximate two-year period and to other employees which vest ratably on a monthly basis over one or two years.
We estimate the fair value of performance share units (“PSUs”) granted using the Monte Carlo simulation model. We issued PSUs in 2009 as part of our annual refresh grant process. The PSUs entitle our executive officers and members of our Board of Directors to receive a number of shares of our common stock based on our stock price performance over a three-year or four-year period as compared to the NASDAQ Composite Index (“NASDAQ”) for the same period. The PSUs cliff vest after three or four years and the number of shares to be issued upon vesting ranges from 0.5 to 2.0 times the number of PSUs granted depending on the relative performance of our common stock price compared to NASDAQ. This performance metric is classified as a market condition.
The Monte Carlo simulation model is based on a discounted cash flow approach, with the simulation of a large number of possible Company and NASDAQ stock price outcomes. The use of the Monte Carlo simulation model requires the input of a number of assumptions including expected volatility of our stock price, expected volatility of NASDAQ, correlation between changes in our stock price and changes in NASDAQ, risk-free interest rate, and expected dividends. Expected volatility of our stock is based on the weighted-average implied and historical volatility of our peer group in the industry in which we do business. Expected volatility of NASDAQ is based on the historical and implied data. Correlation is based on the historical relationship between our peer group stock price and NASDAQ composite average. The risk-free interest rate is based upon the treasury zero-coupon yield appropriate for the term of the PSU as of the grant date. The expected dividend yield is zero for us as we do not expect to pay dividends in the future. The expected dividend yield for NASDAQ is the annual dividend yield expressed as a percentage of the composite average of NASDAQ on the grant date.
Inventory Valuation
Inventories, net consist of raw materials, work-in-process and finished goods and are stated at standard cost adjusted to approximate the lower of actual cost (first-in, first-out method) or market. Market value is based upon an estimated selling price reduced by the estimated cost of disposal. The determination of market value involves numerous judgments including estimated average selling prices based upon recent sales volumes, industry trends, existing customer orders, current contract price, future demand and pricing and technological obsolescence of our products.
45
Table of Contents
Inventory that is obsolete or in excess of our forecasted demand or is anticipated to be sold at a loss is written down to its estimated net realizable value based on historical usage and expected demand. As of December 26, 2009 and December 27, 2008, our inventory value had been reduced by $2.7 million and $1.3 million, respectively, for excess and obsolescence. In valuing our deferred inventory costs, we considered whether the utility of the products delivered or expected to be delivered at less than cost, primarily comprised of common equipment, had declined. We concluded that, in the instances where the utility of the products delivered or expected to be delivered was less than cost, it was appropriate to value the inventory costs and deferred inventory costs at cost or market, whichever is lower, thereby recognizing the cost of the reduction in utility in the period in which the reduction occurred or can be reasonably estimated. We have, therefore, recognized inventory write-downs as necessary in each period in order to reflect common equipment inventory at the lower of cost or market. As of December 26, 2009 and December 27, 2008, our inventory value had been reduced by $2.6 million and $5.0 million, respectively, for LCM adjustments.
We considered whether we should accrue losses on firm purchase commitments related to inventory items. Given that the expected selling price of common equipment in the future remains below cost, we have also recorded losses on these firm purchase commitments in the period in which the commitment is made. When the inventory parts related to these firm purchase commitments are received, that inventory is recorded at the purchase price less the accrual for the loss on the purchase commitment.
If actual market conditions are less favorable than those projected by management, additional inventory write-downs may be required.
Allowances for Doubtful Accounts
We make judgments as to its ability to collect outstanding receivables and provide allowances for a portion of receivables when collection becomes doubtful. Provisions are made based upon a specific review of all significant outstanding invoices. As of December 26, 2009 and December 27, 2008, our allowance for doubtful accounts was zero and $1.7 million, respectively, associated with accounts receivable deemed uncollectible relating to one customer. In 2009, we recorded a recovery of this doubtful account for $1.7 million.
Accrued Warranty
We warrant that our products will operate substantially in conformity with product specifications. Upon delivery of our products, we provide for the estimated cost to repair or replace products or the related components that may be returned under warranty. Our hardware warranty periods range from 1 to 5 years from date of acceptance for hardware and 90 days to 60 months for software warranty. The hardware warranty accrual is based on actual historical returns experience and the application of those historical return rates to our in-warranty installed base. We periodically assess the adequacy of our recorded warranty liabilities and adjust the amounts as necessary. We have software warranty support obligations to a small number of our customers and the costs associated with providing these software warranties have been immaterial to our consolidated financial statements to date.
Cash, Cash Equivalents and Short-term and Long-term Investments
We consider all highly liquid instruments with an original maturity at the date of purchase of 90 days or less to be cash equivalents. We maintain our cash in bank deposit accounts which, at times, may exceed federally insured limits. We have not experienced any losses in such accounts.
Marketable securities consist principally of certificates of deposit, commercial paper, corporate bonds, U.S. agency notes, U.S. treasuries, auction rate securities (“ARS”) and Put Rights. We consider all debt instruments with original maturities at the date of purchase greater than 90 days and remaining time to maturity of one year or less to be short-term investments. We classify debt instruments with remaining maturities greater than one year as long-term investments, unless we intend to settle our holdings within one year or less and in such case it is considered to be short-term investments. We determine the appropriate classification of our marketable securities at the time of purchase and re-evaluate such designations as of each balance sheet date.
Available-for-sale investments are stated at fair market value with unrealized gains and losses recorded in Accumulated other comprehensive income (loss) in the accompanying consolidated balance sheets and Other income (expense), net in the accompanying consolidated statements of operations. We evaluate our available-for-sale marketable debt securities for other-than-temporary impairments as discussed below and record any credit loss portion in Other income (expense), net in our consolidated statements of operations. The amortized cost of debt securities is adjusted for amortization of premiums and accretion of discounts to maturity and for any credit losses incurred on these securities. Gains and losses are recognized when realized in the consolidated statements of operations under the specific identification method. Trading securities investments are stated at fair value with unrealized gains and losses reported in Other income (expense), net in the consolidated statements of operations, consisting of ARS trading securities and related Put Rights.
46
Table of Contents
Fair Value Measurement of Investments
The fair value of our financial instruments reflects the estimates of amounts that would be received from selling an asset or paid to transfer a liability in an orderly transaction between market participants at the measurement date (exit price). The fair value estimates presented in our consolidated financial statements are based on information available to us as of December 26, 2009.
We apply a fair value hierarchy based on three levels of inputs as follows:
| Level I — |
Quoted prices in active markets for identical assets or liabilities. | |
| Level II — |
Inputs other than Level I that are observable, either directly or indirectly, such as quoted prices for similar assets or liabilities, quoted prices in markets that are not active, or other inputs that are observable or can be corroborated by observable market data for substantially the full term of the assets or liabilities. In addition, Level II could include unobservable inputs that are not significant to the fair value of the assets or liabilities. | |
| Level III — |
Unobservable inputs that are supported by little or no market activity and that are significant to the fair value of the assets or liabilities. | |
We measure our cash equivalents, debt securities and Put Rights at fair value and classify our securities in accordance with a fair value hierarchy. Our money market funds and U.S. treasuries are classified within Level I of the fair value hierarchy and are valued based on quoted prices in active markets for identical securities.
We classify our certificates of deposit, commercial paper, corporate bonds and U.S. agency notes within Level II of the fair value hierarchy as follows:
Certificates of Deposit
We review market pricing and other observable market inputs for the same or similar securities obtained from a number of industry standard data providers. In the event that a transaction is observed for the same or similar security in the marketplace, the price on that transaction reflects the market price and fair value on that day. In the absence of any observable market transactions for a particular security, the fair market value at period end would be equal to the par value. These inputs represent quoted prices for similar assets or these inputs have been derived from observable market data, and result in the classification of these securities as Level II of the fair value hierarchy.
Commercial Paper
We review market pricing and other observable market inputs for the same or similar securities obtained from a number of industry standard data providers. In the event that a transaction is observed for the same or similar security in the marketplace, the price on that transaction reflects the market price and fair value on that day and then follows a revised accretion schedule to determine the fair market value at period end. In the absence of any observable market transactions for a particular security, the fair market value at period end is derived by accreting from the last observable market price. These inputs represent quoted prices for similar assets or these inputs have been derived from observable market data accreted mathematically to par, and result in the classification of these securities as Level II of the fair value hierarchy.
Corporate Bonds
We review trading activity and pricing for each of the corporate bond securities in our portfolio as of the measurement date and determine if pricing data of sufficient frequency and volume in an active market exists in order to support Level I classification of these securities. Since sufficient quoted pricing for identical securities is not available, we obtain market pricing and other observable market inputs for similar securities from a number of industry standard data providers. In instances where multiple prices exist for similar securities, these prices are used as inputs into a distribution-curve to determine the fair market value at period end. As a result, we classify our corporate bonds as Level II of the fair value hierarchy.
U.S. Agency Notes
We review trading activity and pricing for our U.S. agency notes as of the measurement date. When sufficient quoted pricing for identical securities is not available, we use market pricing and other observable market inputs for similar securities obtained from a number of industry standard data providers. These inputs represent quoted prices for similar assets in active markets or these inputs have been derived from observable market data, and result in the classification of these securities as Level II of the fair value hierarchy.
47
Table of Contents
We classify our ARS and related Put Rights within Level III of the fair value hierarchy as follows:
Auction Rate Securities
Our ARS are classified within Level III because they are valued, in part, by using inputs that are unobservable in the market and are significant to the valuation. The recent uncertainties in the credit markets have affected all of our ARS and auctions for these securities have failed to settle on their respective settlement dates. In light of these developments, to determine the fair value for our ARS, we used a combination of the market approach and income approach. The market approach uses pricing based on transactions in an inactive secondary market for similar or comparable securities. In addition, we performed our own discounted cash flow analysis. Management determined that it was most appropriate to value the ARS using the market approach and income approach equally given the facts and circumstances as of December 26, 2009, and therefore incorporated both valuations in our fair value measurement.
The significant unobservable inputs and assumptions used in the discounted cash flow model to determine the fair value of our ARS, as of December 26, 2009, are as follows:
| • | Contractual cash flow |
The model assumed that the principal amount or par value for these securities will be repaid at the end of the estimated workout period. In addition, future interest payments were estimated as described in each individual prospectus and based on the then current U.S. Treasury Bill (“T-Bill”) rate adjusted for a failed auction premium of 120 basis points (“bps”) for all our ARS, except for 150 bps for A3 rated securities.
| • | ARS discount rate |
The model incorporated a discount rate equal to an estimate of the LIBOR rates commensurate with the estimated workout period of the securities. As of the measurement date, these rates were then adjusted by a total of approximately 280 bps to 330 bps which included an estimate of the market student loan spread and a discount factor to reflect the lack of liquidity and the credit risk of the securities. Most of our ARS were AAA rated, except for $11.1 million (par value) of our ARS that were downgraded to A3 rating and $0.8 million (par value) of ARS that were downgraded to Aa1 rating during 2009. Our ARS are mostly collateralized by student loans guaranteed by the U.S. government under the Federal Family Education Loan Program. The discount rate does, however, include a discount factor to reflect the issuer’s credit risk and its potential inability to perform its obligations under the terms of the ARS agreements. Our other-than-temporary impairment analysis for two of our available-for-sale ARS indicates that the estimated credit risk element included in the discount rate for an AAA rated security is approximately 170 bps and 190 bps for an A3 rated security.
| • | Estimated maturity |
We estimated the workout period of our ARS as the weighted-average life of the underlying trust loan portfolio where this information was available from servicing and other trust reports. In a small number of instances where this information was not available, we used the weighted-average life of the loan portfolio of a similar trust. The estimated time to maturity of the securities as of the measurement date ranged from 10.0 years to 18.5 years.
Put Rights
Put Rights associated with our ARS holdings with UBS Financial Services, Inc. (“UBS”) are classified as Level III because they are valued, in part, by using inputs that are unobservable in the market and are significant to the valuation. The fair value of the Put Rights is equal to the difference between the fair value of the UBS ARS calculated as described above and their value including the impact of the Put Rights. We performed our own discounted cash flow analysis to calculate the fair value of the UBS ARS including the impact of the Put Rights.
The significant unobservable inputs and assumptions used in the discounted cash flow model to determine the fair value of the UBS ARS including the impact of the Put Rights as of December 26, 2009 are as follows:
| • | Contractual cash flow |
The model assumed that the principal amount or par value for the ARS would be repaid on June 30, 2010, based on our current intent to exercise our Put Rights and sell these securities to UBS on that date. In addition, future interest payments were estimated as described in each individual prospectus and based on the then current T-Bill rate as adjusted for a failed auction premium of 120 bps for all of our ARS, except for 150 bps for A3 rated securities.
48
Table of Contents
| • | Discount rate |
The model incorporated a discount rate equal to an estimate of the LIBOR rates commensurate with the expected sale date of these securities. As of the measurement date, this rate was adjusted by approximately 50 bps which represented a discount factor to reflect UBS credit risk and UBS’ potential inability to perform its obligations under the Put Rights agreement.
We believe that the fair value of our ARS and Put Rights could change significantly in the future, based on market conditions and continued uncertainties in the financial markets. UBS’ credit risk may be subject to significant volatility and it is difficult to predict future fluctuations. A 10% deterioration in UBS credit risk would result in an immaterial amount of loss in our consolidated statements of operations for 2009. Deterioration in the ARS discount rate or a change in the estimated time to maturity would have no impact on our consolidated statements of operations because a change in fair value of the ARS would be offset by a change in fair value of the Put Rights.
Other-Than-Temporary Impairments
We review our available-for-sale marketable debt securities on a regular basis to evaluate whether or not a security has experienced an other-than-temporary decline in fair value. If a debt security’s market value is below amortized cost and we either intend to sell the security or it is more likely than not that we will be required to sell the security before our anticipated recovery, we record an other-than-temporary impairment (“OTTI”) charge to earnings for the entire amount of the impairment.
When we do not intend to sell an impaired security and it is not more likely than not that we will be required to sell prior to recovery of its amortized cost basis, we separate the OTTI into credit and non-credit loss portions. The amount representing the credit loss is recognized in Other income (expense), net, and the amount related to all other factors is recognized in Accumulated other comprehensive loss.
In determining if a credit loss has occurred, it is our policy to isolate the credit loss related portion of the discount rate used to derive the fair market value of the security and apply this to the expected cash flows in order to determine the portion of the OTTI that is credit loss related. This credit related portion of the discount rate is based on the financial condition of the issuer, changes in rating agency credit ratings for the security or increases in credit related yield spreads on similar securities offered by the same issuer.
Once a credit impairment loss has been recognized in our consolidated statements of operations, the amortized cost basis of that available-for-sale security is reduced by the amount of the credit impairment loss, resulting in a new cost basis for the security. Any non-credit related unrealized gains and losses are recorded in Accumulated other comprehensive loss in our consolidated balance sheets. We will continue to monitor the security’s credit rating and credit spread and will accrete any reduction in the credit impairment loss to interest income over the expected life of the security.
Accounting for Income Taxes
As part of the process of preparing our consolidated financial statements, we are required to estimate our taxes in each of the jurisdictions in which we operate. We estimate actual current tax expense together with assessing temporary differences resulting from different treatment of items, such as accruals and allowances not currently deductible for tax purposes. These differences result in deferred tax assets and liabilities, which are included in our consolidated balance sheets. In general, deferred tax assets represent future tax benefits to be received when certain expenses previously recognized in our consolidated statements of operations become deductible expenses under applicable income tax laws or loss or credit carryforwards are utilized. Accordingly, realization of our deferred tax assets is dependent on future taxable income within the respective jurisdictions against which these deductions, losses and credits can be utilized within the applicable future periods.
We must assess the likelihood that some portion or all of our deferred tax assets will be recovered from future taxable income within the respective jurisdictions, and to the extent we believe that recovery does not meet the “more-likely-than-not” standard, we must establish a valuation allowance. The ultimate realization of deferred tax assets is dependent upon the generation of future taxable income during the periods in which those temporary differences become deductible. Management judgment is required in determining our provision for income taxes, our deferred tax assets and liabilities and any valuation allowance recorded against our net deferred tax assets. At December 26, 2009 and December 27, 2008, certain of our domestic net deferred tax assets were fully reserved with a valuation allowance because, based on the available evidence, we believed at that time it was more likely than not that we would not be able to utilize those deferred tax assets in the future. We intend to maintain a valuation allowance until sufficient evidence exists to support the reversal of the valuation allowance. We make estimates and judgments about our future taxable income, by jurisdiction, based on assumptions that are consistent with our plans and estimates. Should the actual amounts differ from our estimates, the amount of our valuation allowance could be materially impacted.
49
Table of Contents
Results of Operations
Revenue
The following table presents our revenue by type, geography and sales channel for 2009, 2008 and 2007:
| Years Ended | ||||||||||||
| December 26, 2009 |
December 27, 2008 |
December 29, 2007 |
||||||||||
| (In thousands, except %) | ||||||||||||
| Statements of Operations Data: |
||||||||||||
| Total revenue by type |
||||||||||||
| Product |
$ | 276,012 | $ | 306,808 | $ | 8,107 | ||||||
| Ratable product and related support and services |
4,231 | 193,705 | 237,745 | |||||||||
| Services |
28,858 | 18,699 | — | |||||||||
| Total |
$ | 309,101 | $ | 519,212 | $ | 245,852 | ||||||
| % Revenue by type |
||||||||||||
| Product |
89 | % | 59 | % | 3 | % | ||||||
| Ratable product and related support and services |
1 | % | 37 | % | 97 | % | ||||||
| Services |
10 | % | 4 | % | 0 | % | ||||||
| 100 | % | 100 | % | 100 | % | |||||||
| Total revenue by geography |
||||||||||||
| Domestic |
$ | 212,923 | $ | 412,563 | $ | 199,893 | ||||||
| International |
96,178 | 106,649 | 45,959 | |||||||||
| $ | 309,101 | $ | 519,212 | $ | 245,852 | |||||||
| % Revenue by geography |
||||||||||||
| Domestic |
69 | % | 79 | % | 81 | % | ||||||
| International |
31 | % | 21 | % | 19 | % | ||||||
| 100 | % | 100 | % | 100 | % | |||||||
| Total revenue by sales channel |
||||||||||||
| Direct |
$ | 290,972 | $ | 502,763 | $ | 239,146 | ||||||
| Indirect |
18,129 | 16,449 | 6,706 | |||||||||
| $ | 309,101 | $ | 519,212 | $ | 245,852 | |||||||
| % Revenue by sales channel |
||||||||||||
| Direct |
94 | % | 97 | % | 97 | % | ||||||
| Indirect |
6 | % | 3 | % | 3 | % | ||||||
| 100 | % | 100 | % | 100 | % | |||||||
2009 Compared to 2008. Total revenue decreased to $309.1 million in 2009 from $519.2 million in 2008. This decrease primarily reflected $165.8 million of deferred revenue from prior periods recognized in 2008. Excluding this impact, revenue decreased $44.3 million on a year-over-year basis primarily due to the impact of the economic downturn resulting in decreased purchases of our products by existing customers in the first half of 2009. This was partially offset by a number of large deployments with new and certain existing customers in the second and third quarters of 2009. In addition, we began to see a recovery in overall demand in the fourth quarter of 2009. Our customer base increased from 56 customers at the end of 2008 to 69 at the end of 2009. In addition, international revenue increased to 31% in 2009 from 21% in 2008 as we experienced increased levels of sales to international customers during 2009. We expect this trend to continue as we increase our sales activities in Europe and Asia.
50
Table of Contents
Total product revenue decreased to $276.0 million in 2009 from $306.8 million in 2008 primarily due to decreased purchases of our DTN System by existing customers; however, this impact was partially offset by the addition of new domestic and international customers and new deployments with certain existing customers.
Total ratable revenue decreased to $4.2 million in 2009 from $193.7 million in 2008. The majority of the ratable revenue recognized in 2008 related to deferred revenue from the periods prior to the attainment of VSOE of fair value for most of our services. Excluding this impact, ratable revenue for 2008 would have been $4.0 million related to new ratable revenue generated from bundled sales made in the period.
Total services revenue increased to $28.9 million in 2009 from $18.7 million in 2008, reflecting an increase in software subscription revenue from $8.6 million in 2008 to $15.2 million in 2009 and an increase in other non-installation related services revenue from $0.9 million in 2008 to $4.3 million in 2009.
2008 Compared to 2007. Total revenue in 2008 was $519.2 million as compared to $245.9 million in 2007. However, as explained above, prior to December 29, 2007, we had not attained VSOE of fair value for most of our services and were required to recognize much of our revenue ratably over the relevant service period. This requirement resulted in the deferral of $63.5 million of revenue related to 2007 invoiced shipments. This deferral was subsequently recognized as revenue in 2008 and included other deferrals from prior periods. Revenues for 2007 and 2008, excluding the impacts of VSOE related deferrals, would have been $309.3 million and $353.4 million in 2007 and 2008 respectively. This year-over-year increase was primarily due to increased purchases of our DTN System by existing customers and the addition of new customers. Our customer base increased from 41 customers at the end of 2007 to 56 at the end of 2008. In addition, international revenue increased from 19% in 2007 to 21% in 2008 as we experienced increased levels of sales to international customers during 2008.
Total product revenue increased to $306.8 million in 2008 from $8.1 million in 2007 primarily due to the attainment of VSOE on software subscription services and training and installation and deployment services in 2008. This resulted in the classification of increased levels of sales as product revenue during the year.
Total ratable revenue decreased to $193.7 million in 2008 from $237.7 million in 2007. This reflects an increase in the upfront recognition of product revenue following the attainment of VSOE on software subscription services and training and installation and deployment services in 2008. Of the $193.7 million of ratable revenue recognized in 2008, the majority related to deferred revenue from periods prior to the attainment of VSOE of fair value for most of our services and only $4.0 million related to new ratable revenue generated from sales in the year.
Total services revenue was $18.7 million in 2008, reflecting the attainment of VSOE of fair value for most of our services during the year resulting in revenue for these services being disclosed separately.
Cost of Revenue and Gross Margin
The following table presents our revenue, cost of revenue by revenue source, gross profit (loss) and gross margin for 2009, 2008 and 2007:
| Years Ended | ||||||||||||
| December 26, 2009 |
December 27, 2008 |
December 29, 2007 |
||||||||||
| (In thousands, except %) | ||||||||||||
| Total revenue |
$ | 309,101 | $ | 519,212 | $ | 245,852 | ||||||
| Total cost of revenue: |
||||||||||||
| Cost of product |
$ | 189,723 | $ | 184,234 | $ | 4,091 | ||||||
| Cost of ratable product and related support and services |
1,931 | 91,625 | 165,172 | |||||||||
| Cost of services |
12,308 | 9,798 | — | |||||||||
| Restructuring and other costs related to cost of revenue |
3,038 | — | — | |||||||||
| Gross profit |
$ | 102,101 | $ | 233,555 | $ | 76,589 | ||||||
| Gross margin |
33 | % | 45 | % | 31 | % | ||||||
51
Table of Contents
The table below illustrates our 2008 results as reported and excluding the impact of the recognition of deferred amounts from prior periods.
| Year Ended December 27, 2008 | ||||||||||||
| As Reported Results |
Pre-VSOE Deferred Adjustments |
As Adjusted Results |
||||||||||
| (In thousands, except %) | ||||||||||||
| Revenue |
$ | 519,212 | $ | (165,787 | ) | $ | 353,425 | |||||
| Cost of revenue |
285,657 | (78,401 | ) | 207,256 | ||||||||
| Gross profit |
$ | 233,555 | $ | (87,386 | ) | $ | 146,169 | |||||
| Gross margin |
45 | % | 41 | % | ||||||||
2009 Compared to 2008. Gross margin decreased to 33% in 2009 from 45% in 2008. However, as illustrated in the table above, gross profit in 2008 was unusually high due to the recognition of $87.4 million of gross profit related to reductions in the deferred revenue and deferred inventory cost balances from prior periods. Excluding this prior period impact, gross margin for 2008 would have been 41% compared to gross margin of 33% in 2009.
This significant decline in gross margins in 2009 as compared to adjusted gross margins in 2008 was partially due to lower sales of our higher margin TAM and DLM products in the first half of the year and the recognition of revenue related to a number of large lower margin common equipment deployments with new and existing customers in 2009. Gross margins for 2009 also included restructuring and other related costs of $3.0 million related to the closure of our Maryland based semiconductor FAB announced in July 2009.
2008 Compared to 2007. Gross margins in 2007 were 31% as compared to 45% in 2008. However, prior to December 29, 2007, we had not attained VSOE of fair value for most of our services and were required to recognize much of our revenue ratably over the longest undelivered service period. This requirement resulted in the deferral of $63.5 million of revenue and $49.1 million of gross profit related to 2007 invoiced shipments. As described above, these deferral amounts were subsequently recognized as revenue and gross profit in 2008. Excluding the impacts of VSOE related deferrals from 2007 and 2008, adjusted gross margin resulted in 41% for both years.
Operating Expenses
The following table presents our operating expenses for 2009, 2008 and 2007:
| Years Ended | |||||||||
| December 26, 2009 |
December 27, 2008 |
December 29, 2007 | |||||||
| (In thousands) | |||||||||
| Research and development(1) |
$ | 97,178 | $ | 80,428 | $ | 60,851 | |||
| Sales and marketing(1) |
48,391 | 43,262 | 32,721 | ||||||
| General and administrative(1) |
45,269 | 36,282 | 25,965 | ||||||
| Restructuring and other costs |
814 | — | — | ||||||
| Amortization of intangible assets |
110 | 150 | 148 | ||||||
| Total operating expenses |
$ | 191,762 | $ | 160,122 | $ | 119,685 | |||
| (1) | Operating expenses as a percent of total revenue is not a meaningful trend indicator because of the impact of our revenue recognition policy on the timing and amount of revenue recorded in each year. |
Research and Development Expenses
2009 Compared to 2008. Research and development expenses increased $16.8 million in 2009 from 2008 primarily due to increased headcount and personnel-related costs of $12.6 million, including $6.8 million of cash compensation, $3.8 million of stock-based compensation expense and $2.0 million of incremental facilities and infrastructure costs. In addition, in 2009, we incurred $4.2 million of increased prototype and new product spending.
2008 Compared to 2007. Research and development expenses increased $19.6 million in 2008 from 2007 primarily due to increased headcount and personnel-related costs of $12.9 million, including $9.1 million of cash compensation, $2.8 million of stock-based compensation and $1.0 million of incremental facilities and infrastructure costs. In addition, there was $10.5 million of increased prototype and new product related spending. This increase was offset by a reduction of $3.8 million of expenses in 2008 compared to 2007 related to software development services that we purchased from a third party to enable our products to operate in a regional Bell operating company infrastructure.
52
Table of Contents
Sales and Marketing Expenses
2009 Compared to 2008. Sales and marketing expenses increased $5.1 million in 2009 from 2008 primarily due to increased headcount and personnel-related costs of $4.8 million, including $2.5 million of cash compensation, $2.1 million of stock-based compensation expense and $0.2 million of incremental facilities and infrastructure costs. In addition, in 2009, we incurred $0.6 million of increased spending on a mobile demo vehicle in Europe, partially offset by $0.3 million reduction on sales lab trials.
2008 Compared to 2007. Sales and marketing expenses increased $10.5 million in 2008 from 2007 primarily due to an increase in headcount and personnel-related expenses of $8.1 million, including salaries and commissions of $2.6 million, stock-based compensation expense of $2.6 million and facilities, infrastructure and other personnel-related costs of $2.9 million. Additionally, we incurred $2.4 million of incremental expenses in 2008 related to demonstration units for use in customer and trade show demonstrations.
General and Administrative Expenses
2009 Compared to 2008. General and administrative expenses increased $9.0 million in 2009 from 2008 primarily due to $7.6 million of stock-based compensation expense, $3.8 million of cash compensation and $1.3 million of depreciation and amortization expense. These increases were offset by a $3.4 million change in bad debt expense due to $1.7 million of provision for doubtful accounts recorded in 2008 which was subsequently recovered in 2009. Additionally, costs related to facilities and professional services decreased $0.3 million.
2008 Compared to 2007. General and administrative expenses increased $10.3 million in 2008 from 2007 primarily due to $4.2 million in stock-based compensation expense, $1.5 million of cash compensation and $0.7 million of facilities and infrastructure costs. We also had increased bad debt expense of $1.7 million in 2008 associated with accounts receivable deemed uncollectible relating to one customer. In addition, external expenses related to legal, audit, tax and information technology related activities associated with continued growth increased by $2.2 million compared to 2007.
Restructuring and Other Costs
We incurred $0.8 million of restructuring and other related costs in 2009 which comprised of non-cash charges of $0.6 million associated with operating lease termination costs and equipment and facilities-related costs. Additionally, we incurred $0.2 million related to severance and related expenses and other exit costs.
Other Income (Expense), Net
The following table presents our interest income, interest expense, net impairment losses recognized in earnings and other gain (loss), net for 2009, 2008 and 2007:
| Years Ended | ||||||||||||
| December 26, 2009 |
December 27, 2008 |
December 29, 2007 |
||||||||||
| (In thousands) | ||||||||||||
| Interest income |
$ | 2,688 | $ | 8,549 | $ | 6,522 | ||||||
| Interest expense |
— | (3 | ) | (2,251 | ) | |||||||
| Net impairment losses recognized in earnings |
(1,094 | ) | — | — | ||||||||
| Other gain (loss), net |
(426 | ) | (528 | ) | (16,249 | ) | ||||||
| Total other income (expense), net |
$ | 1,168 | $ | 8,018 | $ | (11,978 | ) | |||||
2009 Compared to 2008. Interest income decreased in 2009 from 2008 due to lower interest rates on investments and lower investment balances. We also recognized net credit impairment losses of $1.1 million in 2009 related to the determination that our available-for-sale ARS were other-than-temporarily impaired, as discussed in Note 3, “Fair Value Measurements and Other-Than-Temporary Impairments,” of the Notes to Consolidated Financial Statements. Other gain (loss) net for 2009 included $3.8 million loss due to a decrease in the fair value of the Put Rights offset by a $4.6 million unrealized holding gain to ARS trading securities. Additionally, we recorded $1.7 million of unrealized and realized losses due to foreign currency exchange re-measurement and $0.4 million gain on asset sales in 2009.
2008 Compared to 2007. Interest income increased in 2008 from 2007 due to higher invested balances resulting from the funds raised in our IPO and secondary offerings being invested for a full year for 2008 offset by the impact of declining interest rates due to global market conditions. The decrease in interest expense from 2007 to 2008 was due to the repayment of our outstanding debt following our IPO.
53
Table of Contents
Other loss for 2008 included $1.1 million gain on asset sales, a gross unrealized loss of $16.8 million related to our ARS trading securities offset by a gain of $15.9 million related to the associated Put Rights. Additionally, other loss reflected $0.6 million loss from foreign exchange and $0.1 million net loss from sale of investments. Other loss in 2007 included a $19.8 million charge related to the revaluation of preferred stock warrant liabilities to fair market value in 2007, offset by a $2.7 million gain on asset sales and a $0.3 million gain from foreign currency exchange re-measurement.
Income Tax Provision (Benefit)
During 2009, we recognized a tax benefit of approximately $2.1 million for a reversal of the 2008 federal and state tax provision, following a favorable ruling by the Internal Revenue Service in the third quarter of 2009. Exclusive of this one-time benefit, we recognized income tax expense of approximately $0.3 million, on pre-tax book losses of $88.5 million for 2009. Exclusive of the one-time benefit mentioned above, the resulting effective tax rate of 0.4% for 2009 differs from the expected statutory rate of 35% based upon unbenefited U.S. losses, non-deductible stock compensation charges and foreign taxes provided on foreign subsidiary earnings, offset by the benefit related to refundable research and development tax credits. This compares to an effective tax rate of approximately 3.3% for 2008, which reflects tax benefits arising from the release of certain valuation allowances on domestic tax attribute carryforwards which was partially offset by the impact of certain non-deductible stock compensation charges, federal alternative minimum tax and state income taxes.
As of December 26, 2009, we recorded a full valuation allowance against our net deferred tax assets based upon our cumulative loss incurred since inception. Realization of deferred tax assets is dependent upon future taxable earnings, if any, the timing and amount of which are uncertain. Accordingly, the net deferred tax assets were fully offset by a valuation allowance. As of December 26, 2009, we had net operating loss carryforwards available to offset future taxable income for federal income tax purposes of approximately $285.7 million, which expire beginning in 2021 if not utilized. As of December 26, 2009, we also have state net operating loss carryforwards of approximately $251.2 million, which expire beginning in 2013, if not utilized. The amount of net operating loss carryforwards noted above and related to excess stock option deductions is approximately $27.8 million for federal tax purposes. When the excess stock option deductions are used to offset future taxable income, these estimated tax benefits of approximately $10.6 million will result in a credit to stockholders’ equity. Additionally, we have federal and California research and development tax credits available to reduce future income tax expense of approximately $17.1 million and $12.7 million, respectively. The federal research credits will begin to expire in the year 2021 if not utilized, while the California research credits have no expiration date.
Utilization of these net operating losses and tax credit carryforwards will be subject to an annual limitation due to provisions of the Internal Revenue Code of 1986, as amended, that are applicable if we experience an “ownership change” that may occur, for example, by a change in significant shareholder allocation or equity structure. Based upon our analysis performed, we have determined that an ownership change has occurred, however, the resulting limitation is not significant enough to cause our tax loss and credit carryforwards to expire unutilized.
In determining future taxable income, we make assumptions to forecast federal, state and international operating income, the reversal of temporary differences, and the implementation of any feasible and prudent tax planning strategies. The assumptions require significant judgment regarding the forecasts of future taxable income, and are consistent with our income forecasts used to manage our business. We intend to maintain the remaining valuation allowance until sufficient further positive evidence exists to support a reversal of, or decrease, in the existing valuation allowance.
54
Table of Contents
Liquidity and Capital Resources
| December 26, 2009 |
December 27, 2008 | |||||
| (In thousands) | ||||||
| Working capital |
$ | 306,887 | $ | 289,702 | ||
| Cash and cash equivalents |
109,859 | 166,770 | ||||
| Short-term and long-term investments |
161,605 | 142,916 | ||||
| Short-term and long-term restricted cash |
4,013 | 2,899 | ||||
| Total cash and cash equivalents, investments and restricted cash |
$ | 275,477 | $ | 312,585 | ||
| Years Ended | |||||||||||
| December 26, 2009 |
December 27, 2008 |
December 29, 2007 |
|||||||||
| Net cash flow provided by (used in): | (In thousands) | ||||||||||
| Operating activities |
$ | (32,646 | ) | $ | 19,918 | $ | 23,058 | ||||
| Investing activities |
$ | (33,347 | ) | $ | 44,205 | $ | (230,268 | ) | |||
| Financing activities |
$ | 8,944 | $ | 11,701 | $ | 269,478 | |||||
As of December 26, 2009, we had $109.9 million in cash and cash equivalents, $161.6 million in short-term and long-term investments and $4.0 million in short-term and long-term restricted cash. In comparison, as of December 27, 2008, we had $166.8 million in cash and cash equivalents, $142.9 million in short-term and long-term investments and $2.9 million in short-term and long-term restricted cash. Cash, cash equivalents, short-term and long-term investments and short-term and long-term restricted cash consist generally of highly liquid investments in certificates of deposits, money market funds, commercial paper, corporate bonds, U.S. agency notes and U.S. treasuries. Additionally, short-term and long-term investments also include $70.4 million (par value) of ARS which are illiquid, of which $60.8 million (par value) are included in short-term investments due to their related Put Rights. The Put Rights allow us to sell the securities back to UBS at par value at any time during a two year period beginning June 30, 2010. It is our intention to exercise these Put Rights and liquidate the ARS on June 30, 2010. No agreement has been reached to sell the remaining $9.6 million (par value) of available-for-sale ARS back to the broker. It is therefore unclear how long before these securities become liquid and whether we can recover their full par value. The restricted cash balance amounts are pledged as collateral for certain stand-by and commercial letters of credit.
Our historical revenue and profitability trends have been significantly impacted by our revenue recognition policy and the timing of our attainment of VSOE of fair value for most of our services. Prior to the first quarter of 2008, revenue from bundled product sales was deferred and recognized ratably over a period of approximately one year. This resulted in the accumulation of $174.4 million of deferred revenue, $81.6 million of associated deferred inventory costs and $92.8 million of gross margin on the balance sheet as of December 29, 2007. We recognized $165.8 million of this deferred revenue and $78.4 million of associated deferred inventory costs in 2008, but the cash flow impact of these transactions was recorded in 2006 and 2007 when the transactions occurred and payments were made, not when the majority of the revenue was recognized in the consolidated statements of operations in 2008. This resulted in a cash flow trend that was driven primarily by the timing and profitability of our underlying invoiced shipments rather than the timing of the recognition of revenue and gross margin from these transactions in our consolidated statements of operations. This disconnect between the timing of revenue recognition and the underlying cash collections resulted in higher levels of cash from operations experienced in 2007 when the net loss in our consolidated statements of operations amounted to $55.3 million as compared to 2008 when net income amounted to $78.7 million.
We expect our future product revenues and gross margins to more closely approximate our invoiced shipment results with no further significant releases of deferred amounts from prior periods and therefore also expect cash flow trends that are more consistent with the timing of when revenue and gross profits are recognized in the consolidated statements of operations.
55
Table of Contents
Operating Activities
We experienced negative cash flows from operations of $32.7 million in 2009. We generated a net loss for the period of $86.6 million and we had non-cash charges of $55.0 million consisting primarily of stock-based compensation expense of $37.4 million, depreciation and amortization expenses of $16.5 million, restructuring and other related costs of $3.0 million, offset by $1.7 million recovery of doubtful accounts. We also had $1.1 million of net credit impairment loss and $3.8 million decrease in the fair value of the Put Rights offset by $4.6 million unrealized holding gain from ARS trading securities.
Accrued liabilities increased by $19.0 million primarily due to increases in compensation accruals of $5.8 million related to timing of payroll payments and an increase in management bonuses and sales commissions at the end of 2009. In addition, included in the increase in accrued liabilities is a $6.9 million increase in deferred tax liabilities which is offset by a corresponding increase in long-term deferred tax assets included in other non-current assets in our consolidated balance sheet. The remainder of the increase in accrued liabilities related to accruals for outside services incurred at the end of the year. These favorable changes in working capital were offset by an increase in inventories of $8.6 million related to increased levels of inventory awaiting customer acceptance at customer sites and increased service depot inventory required to support new service contracts sold during the year. In addition, deferred inventory costs increased by $6.2 million primarily due to a number of sales contracts where the earnings process was not complete at the end of 2009.
We generated positive cash flows from operations of $19.9 million in 2008. We generated net income for the period of $78.7 million; however, it reflected reductions in deferred revenue of $152.0 million offset by reductions in deferred inventory costs of $76.5 million. We had total non-cash charges of $37.7 million consisting primarily of stock-based compensation expense of $23.8 million, depreciation and amortization expenses of $13.0 million, provision for doubtful accounts of $1.7 million and $0.9 million loss reflecting the net impact of the gross unrealized loss of $16.8 million related to our ARS trading securities offset by a $15.9 million unrealized gain on the associated Put Rights. These charges were primarily offset by a gain on disposal of fixed assets of $1.1 million and investment discount accretion of $0.9 million. Accounts receivable increased by $31.8 million primarily due to delays in customer payments and a number of customers deciding not to take early pay discounts in the period. This was offset by an increase in accounts payable of $16.8 million reflecting longer payment terms received from key suppliers at the end of the year. Accrued liabilities and other expenses increased by $3.4 million due to the timing of payments made during the period.
We generated positive cash flows from operations of $23.1 million in 2007. We generated a net loss for the period of $55.3 million, and we had non-cash charges of $36.5 million consisting primarily of warrant revaluation expense of $19.8 million, depreciation and amortization of $9.8 million and stock-based compensation expense of $9.7 million. In addition, the net loss reflects an increase in deferred revenue of $63.5 million and in deferred inventory costs of $14.7 million. We experienced improved collections in the period offset by reductions in accounts payable terms.
Investing Activities
Net cash used in investing activities in 2009 was $33.3 million primarily due to the purchase of available-for-sale investments of $163.9 million and additions to property, plant and equipment for the period of $15.4 million. This was offset by proceeds of $144.8 million from maturities and calls of investments, $1.5 million of proceeds from sales of available-for-sale investments during the period and $1.1 million change in restricted cash.
Net cash provided by investing activities was $44.2 million in 2008, primarily consisting of net proceeds from the purchase, maturity and sale of investments in the period of $65.5 million, reflecting the transfer of funds from corporate bonds, agency notes and commercial paper to money market funds during the period. This was offset by additions to property, plant and equipment for the period of $22.9 million.
Cash used in investing activities was $230.3 million in 2007 primarily consisting of $295.8 million of purchases of investments, reflecting the investment of cash raised from our IPO and follow-on offering in June 2007 and November 2007, respectively. Additions to property, plant and equipment amounted to $20.2 million. These investing activities were offset by $85.8 million of proceeds from maturities and sales of investments, $3.3 million of proceeds from the disposal of assets and $3.3 million change in restricted cash.
Financing Activities
Net proceeds from financing activities in 2009 were $8.9 million primarily due to $9.3 million proceeds from the issuance of common stock under our employee stock purchase plan, or ESPP, and other equity plans partially offset by $0.2 million reduction of tax benefit from stock option transactions.
56
Table of Contents
Net proceeds from financing activities in 2008 were $11.7 million due to $11.5 million in proceeds from the issuance of common stock under our employee stock purchase plan, or ESPP and other equity plans and $0.2 million related to excess tax benefit from stock option transactions.
Net proceeds from financing activities in 2007 were $269.5 million. We completed our IPO in June 2007 and generated net proceeds of $190.1 million. Subsequently, in November 2007, we completed our follow-on offering and generated net proceeds of $104.0 million. We paid off $35.4 million of our outstanding debt, including $7.1 million which we had borrowed under an existing facility in the first quarter of 2007. In addition, we received $3.5 million from employee stock options exercised in the period.
Auction Rate Securities
As of December 26, 2009, we held $70.4 million (par value) of investments comprised of ARS, which are variable-rate debt securities and have a long-term maturity with the interest rate being reset through auctions that are typically held every 7, 28 or 35 days. These securities have historically traded at par and were callable at par at the option of the issuer. Interest is typically paid at the end of each auction period or semiannually. Since February 2008, most of the auctions for these securities have failed and there is no assurance that future auctions will succeed. As a result, our ability to liquidate our investment in the near term is limited. Additionally, we may not be able to fully recover the par value of its ARS or, it could take until final maturity of the ARS (up to 38 years) to realize our investment. As of December 26, 2009, most of the ARS we held were AAA rated, except for $11.1 million (par value) of our ARS that were downgraded to A3 rating and $0.8 million (par value) of ARS that were downgraded to Aa1 rating during 2009. Our ARS were mostly collateralized by student loans guaranteed by the U.S. government under the Federal Family Education Loan Program. During 2009, $5.2 million of ARS (par value) were called at par value.
The ARS of $60.8 million (par value) covered by the UBS settlement and the related Put Rights are revalued to fair value on a quarterly basis. We recorded $4.6 million of unrealized holding gains on our ARS trading securities in 2009 in Other gain (loss), net in the accompanying consolidated statements of operations. In addition, we recorded a decrease of $3.8 million in the fair value of the Put Rights in 2009 in Other gain (loss), net in the accompanying consolidated statements of operations.
As of December 26, 2009, we held $9.6 million (par value) of available-for-sale ARS held with two issuers, one of which is AAA rated and the other one is A3 rated. As of December 26, 2009 we determined that we do not intend to sell these securities and do not believe that it is more likely than not that we will be required to sell the securities before recovery of their par value. However, given that the present value of the expected cash flows for these securities was below their par value, a cumulative OTTI of $2.0 million, equal to the difference between the fair value and the par value has occurred. We recognized credit impairment losses of $1.1 million in our consolidated statements of operations for 2009. The non-credit related portion of this OTTI of $0.9 million was recognized in Accumulated other comprehensive loss in our consolidated balance sheet as of December 26, 2009.
These failed auctions result in a lack of liquidity in the ARS but do not affect the underlying collateral of the securities. We do not anticipate that any potential lack of liquidity in our ARS, even for an extended period of time, will affect our ability to finance our operations, including our continued investments in research and development and planned capital expenditures. We continue to monitor efforts by the financial markets to find alternative means for restoring the liquidity of these investments. Our trading ARS, which are subject to the UBS Put Rights have been classified as short-term investments in the accompanying consolidated balance sheets as we intend to sell these securities back to UBS at par value on June 30, 2010. Our available-for-sale ARS investments are classified as non-current assets until we have better visibility as to when their liquidity will be restored.
Liquidity
In the next twelve months, capital expenditures are expected to be in the range of approximately $18 million to $20 million, primarily for product development and manufacturing expansion and upgrades. In addition, we have experienced a lack of liquidity related to $70.4 million (par value) of our ARS as described above. We believe that our current cash and cash equivalents and investments, excluding our ARS, will be sufficient to meet our anticipated cash needs for working capital and capital expenditures for at least 12 months. If these sources of cash are insufficient to satisfy our liquidity requirements beyond 12 months, we may require additional capital from equity or debt financings to fund our operations, respond to competitive pressures or strategic opportunities or otherwise. We may not be able to secure timely additional financing on favorable terms, or at all. The terms of any additional financing may place limits on our financial and operating flexibility. If we raise additional funds through further issuances of equity, convertible debt securities or other securities convertible into equity, our existing stockholders could suffer dilution in their percentage ownership of us, and any new securities we issue could have rights, preferences and privileges senior to those of holders of our common stock.
57
Table of Contents
Contractual Obligations
The following is a summary of our contractual obligations as of December 26, 2009:
| Payments Due by Period | |||||||||||||||
| Total | Less than 1 year |
1 - 3 years | 3 - 5 years | More than 5 years | |||||||||||
| (In thousands) | |||||||||||||||
| Purchase obligations(1) |
$ | 35,021 | $ | 35,021 | $ | — | $ | — | $ | — | |||||
| Operating leases |
12,022 | 4,222 | 5,244 | 1,608 | 948 | ||||||||||
| Total contractual obligations(2) |
$ | 47,043 | $ | 39,243 | $ | 5,244 | $ | 1,608 | $ | 948 | |||||
| (1) | We have service agreements with our major production suppliers under which we are committed to purchase certain parts. |
| (2) | Tax liabilities of $0.8 million related to uncertain tax positions are not included in the table because we are unable to determine the timing of settlement if any, of these future payments with a reasonably reliable estimate. |
We had $4.0 million of standby letters of credit outstanding as of December 26, 2009. These consisted of $1.5 million related to a customer proposal guarantee, $1.5 million related to a value added tax license and duty and $1.0 million related to property leases. We had $2.9 million of standby letters of credit outstanding as of December 27, 2008. These consisted of $1.1 million related to property leases, $1.4 million related to a value added tax license and duty and $0.4 million related to customer proposal guarantee.
Off-Balance Sheet Arrangements
As of December 26, 2009, we did not have any relationships with unconsolidated entities or financial partnerships, such as entities often referred to as structured finance or special purpose entities, which would have been established for the purpose of facilitating off-balance sheet arrangements or other contractually narrow or limited purposes.
Recent Accounting Pronouncements
See Note 2 of Notes to Consolidated Financial Statements for recent accounting standards that could have an effect on us.
| ITEM 7A. QUANTITATIVE | AND QUALITATIVE DISCLOSURES ABOUT MARKET RISK |
Foreign Currency Risk
A majority of our revenue, expense and capital purchasing activities are transacted in U.S. dollars. However, we do incur some immaterial operating costs in other currencies. In addition, certain of our sales contracts are priced in Euros and, therefore, a portion of our revenue is subject to foreign currency risks. Our operating expenses and cash flows are subject to fluctuations due to changes in foreign currency exchange rates, particularly changes in the India Rupee, Chinese Yuan, British pound and the Euro.
The effect of an immediate 10% adverse change in exchange rates on foreign denominated transactions as of December 26, 2009 and December 27, 2008 would result in a loss of approximately $1.3 million and $0.9 million, respectively. Beginning in the second quarter of 2009, we established a foreign currency risk management program to help protect against the impact of foreign currency exchange rate movements on our operating results. We enter into foreign currency exchange forward contracts to reduce the impact of foreign currency fluctuations on accounts receivable denominated in currencies other than our functional currency, which is the U.S. dollar. As a result, we do not expect a significant impact to our results from a change in exchange rates on foreign denominated accounts receivable balances in the near-term. Fluctuations in our currency exchange rates could impact our business in the future.
Interest Rate Sensitivity
We had cash, cash equivalents, short-term and long-term investments and short-term and long-term restricted cash totaling $275.5 million and $312.6 million as of December 26, 2009 and December 27, 2008, respectively. These amounts were invested primarily in certificates of deposit, money market funds, commercial paper, corporate bonds, U.S. agency notes, U.S. treasuries, and ARS and the associated Put Rights. The unrestricted cash and cash equivalents are held for working capital purposes. We do not enter into investments for speculative purposes. We believe that we do not have any material exposure to changes in the fair value as a result of changes in interest rates. Declines in interest rates, however, will reduce future investment income. If overall interest rates fell by 10% in 2009 and 2008, our interest income would have declined approximately $0.2 million and $0.8 million, respectively, assuming consistent investment levels.
58
Table of Contents
As of December 26, 2009 and December 27, 2008, we had no debt outstanding.
Auction Rate Securities and Put Rights
As of December 26, 2009, we held $70.4 million (par value) of investments comprised of ARS marketable securities, which are variable-rate debt securities and have a long-term maturity with the interest rate being reset through auctions that are typically held every 7, 28 or 35 days. These securities have historically traded at par and were callable at par at the option of the issuer. Interest is typically paid at the end of each auction period or semiannually. As of December 26, 2009, most of the ARS we held were AAA rated, except for $11.1 million (par value) of our ARS that were downgraded to A3 rating and $0.8 million (par value) of ARS that were downgraded to Aa1 rating during 2009. Our ARS holdings are mostly collateralized by student loans guaranteed by the U.S. government under the Federal Family Education Loan Program. During 2009, $5.2 million of ARS (par value) were called at par value by two issuers with A3 and Aa1 ratings.
Since February 2008, most of the auctions for these securities have failed and there is no assurance that future auctions will succeed. As a result, our ability to liquidate our investment in the near term is limited. Additionally, we may not be able to fully recover the par value of our ARS or it could take until final maturity of the ARS (up to 38 years) to realize our investment. In the event we need to access these funds, we may not be able to do so until a future auction on these investments is successful, a secondary market develops or the securities are redeemed by the broker dealer.
In October 2008, we elected to participate in a rights offering by UBS, one of our brokers, which provides us with Put Rights to sell back UBS $60.8 million of our ARS portfolio at par value as of December 26, 2009, at any time during a two-year sale period beginning June 30, 2010. By electing to participate in the rights offering, we granted UBS the right, exercisable at any time prior to June 30, 2010 or during the two-year sale period, to purchase or cause the sale of our ARS (“Call Right”). UBS has agreed to pay us the par value of our ARS within one day of settlement of any Call Right transaction. We elected to treat this portion of our ARS portfolio as trading securities and measure the Put Rights at fair value in order to match the changes in the fair value of the ARS. As such, in the fourth quarter of 2008, we recorded a gain of $15.9 million related to the Put Rights provided by the settlement and a gross unrealized loss of $16.8 million on the $65.7 million (par value) portion of our ARS portfolio as of December 27, 2008 which we did not intend to hold until final maturity because of the opportunity provided by the Put Rights. The ARS and Put Rights are revalued to fair market value on a quarterly basis until the sale of these securities has been completed. As of December 26, 2009, $60.8 million (par value) of UBS ARS were recorded at fair value of $49.9 million, with an unrealized loss of $10.9 million. These trading ARS were classified as short-term investments in the accompanying consolidated balance sheets as of December 26, 2009 as we intend to sell these securities back to UBS at par value on June 30, 2010. The related Put Rights had a fair value of $10.9 million and were also classified as short-term investments at December 26, 2009. We recorded $4.6 million of unrealized holding gains related to ARS trading securities in 2009 in Other gain (loss), net in the accompanying consolidated statements of operations. For 2009, we recorded a decrease of $3.8 million in the fair value of the Put Rights in Other gain (loss), net in the accompanying consolidated statements of operations. The fair value of our investment in these securities could change significantly in the future, based on market conditions and continued uncertainties in the financial markets.
As of December 26, 2009, we held $9.6 million (par value) of available-for-sale ARS held with two issuers, one of which is AAA rated and the other one is A3 rated. As of December 26, 2009 we determined that we do not intend to sell these securities and do not believe that it is more likely than not that we will be required to sell the securities before recovery of their par value. We recognized credit impairment losses of $1.1 million in our consolidated statements of operations for 2009. The non-credit related portion of this OTTI of $0.9 million was recognized in Accumulated other comprehensive loss in our consolidated balance sheet as of December 26, 2009.
See Note 3, “Fair Value Measurements and Other-Than-Temporary Impairment,” to the Notes to Consolidated Financial Statements for further information.
We believe that the fair value of our ARS, Put Rights and OTTI could change significantly in the future, based on market conditions and continued uncertainties in the financial markets. UBS’ credit risk may be subject to significant volatility and it is difficult to predict future fluctuations. A 10% deterioration in UBS credit risk would result in an immaterial amount of loss in our consolidated statements of operations for 2009. Deterioration in the ARS discount rate or a change in the estimated time to maturity would have no impact on our consolidated statements of operations. A 10% deterioration in the ARS student loan credit spread would result in $0.2 million of additional OTTI credit loss in our consolidated statements of operations for 2009.
59
Table of Contents
| ITEM 8. | FINANCIAL STATEMENTS AND SUPPLEMENTARY DATA |
INDEX TO CONSOLIDATED FINANCIAL STATEMENTS
| Page | ||
| Reports of Ernst & Young LLP, Independent Registered Public Accounting Firm |
61 | |
| 63 | ||
| 64 | ||
| Consolidated Statements of Convertible Preferred Stock and Stockholders’ Equity (Deficit) |
65 | |
| 67 | ||
| 69 |
60
Table of Contents
REPORT OF ERNST & YOUNG LLP, INDEPENDENT REGISTERED PUBLIC ACCOUNTING FIRM
The Board of Directors and Stockholders, Infinera Corporation
We have audited the accompanying consolidated balance sheets of Infinera Corporation as of December 26, 2009 and December 27, 2008, and the related consolidated statements of operations, convertible preferred stock and stockholders’ equity (deficit) and cash flows for each of the three years in the period ended December 26, 2009. Our audits also included the financial statement schedule listed in the Index at Item 15. These financial statements and schedule are the responsibility of the Company’s management. Our responsibility is to express an opinion on these financial statements and schedule based on our audits.
We conducted our audits in accordance with the standards of the Public Company Accounting Oversight Board (United States). Those standards require that we plan and perform the audit to obtain reasonable assurance about whether the financial statements are free of material misstatement. An audit includes examining, on a test basis, evidence supporting the amounts and disclosures in the financial statements. An audit also includes assessing the accounting principles used and significant estimates made by management, as well as evaluating the overall financial statement presentation. We believe that our audits provide a reasonable basis for our opinion.
In our opinion, the financial statements referred to above present fairly, in all material respects, the consolidated financial position of Infinera Corporation at December 26, 2009 and December 27, 2008, and the consolidated results of its operations and its cash flows for each of the three years in the period ended December 26, 2009, in conformity with U.S. generally accepted accounting principles. Also, in our opinion, the related financial statement schedule, when considered in relation to the basic financial statements taken as a whole, present fairly in all material respects the information set forth therein.
We also have audited, in accordance with the standards of the Public Company Accounting Oversight Board (United States), Infinera Corporation’s internal control over financial reporting as of December 26, 2009, based on criteria established in Internal Control-Integrated Framework issued by the Committee of Sponsoring Organizations of the Treadway Commission and our report dated March 1, 2010 expressed an unqualified opinion thereon.
/s/ ERNST & YOUNG LLP
San Jose, California
March 1, 2010
61
Table of Contents
REPORT OF ERNST & YOUNG LLP, INDEPENDENT REGISTERED PUBLIC ACCOUNTING FIRM
The Board of Directors and Stockholders, Infinera Corporation
We have audited Infinera Corporation’s internal control over financial reporting as of December 26, 2009, based on criteria established in Internal Control—Integrated Framework issued by the Committee of Sponsoring Organizations of the Treadway Commission (the COSO criteria). Infinera Corporation’s management is responsible for maintaining effective internal control over financial reporting, and for its assessment of the effectiveness of internal control over financial reporting included in the accompanying Management’s Report on Internal Control Over Financial Reporting. Our responsibility is to express an opinion on the company’s internal control over financial reporting based on our audit.
We conducted our audit in accordance with the standards of the Public Company Accounting Oversight Board (United States). Those standards require that we plan and perform the audit to obtain reasonable assurance about whether effective internal control over financial reporting was maintained in all material respects. Our audit included obtaining an understanding of internal control over financial reporting, assessing the risk that a material weakness exists, testing and evaluating the design and operating effectiveness of internal control based on the assessed risk, and performing such other procedures as we considered necessary in the circumstances. We believe that our audit provides a reasonable basis for our opinion.
A company’s internal control over financial reporting is a process designed to provide reasonable assurance regarding the reliability of financial reporting and the preparation of financial statements for external purposes in accordance with generally accepted accounting principles. A company’s internal control over financial reporting includes those policies and procedures that (1) pertain to the maintenance of records that, in reasonable detail, accurately and fairly reflect the transactions and dispositions of the assets of the company; (2) provide reasonable assurance that transactions are recorded as necessary to permit preparation of financial statements in accordance with generally accepted accounting principles, and that receipts and expenditures of the company are being made only in accordance with authorizations of management and directors of the company; and (3) provide reasonable assurance regarding prevention or timely detection of unauthorized acquisition, use, or disposition of the company’s assets that could have a material effect on the financial statements.
Because of its inherent limitations, internal control over financial reporting may not prevent or detect misstatements. Also, projections of any evaluation of effectiveness to future periods are subject to the risk that controls may become inadequate because of changes in conditions, or that the degree of compliance with the policies or procedures may deteriorate.
In our opinion, Infinera Corporation maintained, in all material respects, effective internal control over financial reporting as of December 26, 2009, based on the COSO criteria.
We also have audited, in accordance with the standards of the Public Company Accounting Oversight Board (United States), the consolidated balance sheets of Infinera Corporation as of December 26, 2009 and December 27, 2008, and the related consolidated statements of operations, convertible preferred stock and stockholders’ equity (deficit) and cash flows for each of the three years in the period ended December 26, 2009 of Infinera Corporation and our report dated March 1, 2010 expressed an unqualified opinion thereon.
/s/ ERNST & YOUNG LLP
San Jose, California
March 1, 2010
62
Table of Contents
INFINERA CORPORATION
(In thousands, except par values)
| December 26, 2009 |
December 27, 2008 |
|||||||
| ASSETS |
||||||||
| Current assets: |
||||||||
| Cash and cash equivalents |
$ | 109,859 | $ | 166,770 | ||||
| Short-term investments |
143,350 | 68,232 | ||||||
| Short-term restricted cash |
1,533 | 720 | ||||||
| Accounts receivable, net of allowance for doubtful accounts of |
||||||||
| $0 in 2009 and $1,700 in 2008 |
69,483 | 69,354 | ||||||
| Other receivables |
927 | 1,085 | ||||||
| Inventories, net |
68,872 | 58,986 | ||||||
| Deferred inventory costs |
5,891 | 1,744 | ||||||
| Prepaid expenses and other current assets |
8,313 | 6,311 | ||||||
| Total current assets |
408,228 | 373,202 | ||||||
| Property, plant and equipment, net |
43,656 | 46,820 | ||||||
| Intangible assets |
961 | 1,276 | ||||||
| Deferred inventory costs, non-current |
4,438 | 2,493 | ||||||
| Long-term investments |
18,255 | 74,684 | ||||||
| Long-term restricted cash |
2,480 | 2,179 | ||||||
| Deferred tax asset |
12,449 | 5,743 | ||||||
| Other non-current assets |
1,478 | 670 | ||||||
| Total assets |
$ | 491,945 | $ | 507,067 | ||||
| LIABILITIES AND STOCKHOLDERS’ EQUITY |
||||||||
| Current liabilities: |
||||||||
| Accounts payable |
$ | 31,129 | $ | 34,048 | ||||
| Accrued expenses |
13,929 | 10,349 | ||||||
| Accrued compensation and related benefits |
19,248 | 13,472 | ||||||
| Accrued warranty |
6,091 | 5,205 | ||||||
| Deferred revenue |
18,295 | 14,683 | ||||||
| Deferred tax liability |
12,649 | 5,743 | ||||||
| Total current liabilities |
101,341 | 83,500 | ||||||
| Accrued warranty, non-current |
5,049 | 4,735 | ||||||
| Deferred revenue, non-current |
8,080 | 7,724 | ||||||
| Other long-term liabilities |
8,968 | 5,645 | ||||||
| Commitments and contingencies (Note 8) |
||||||||
| Stockholders’ equity: |
||||||||
| Preferred stock, $0.001 par value |
||||||||
| Authorized shares — 25,000 and no shares issued and outstanding |
— | — | ||||||
| Common stock, $0.001 par value |
||||||||
| Authorized shares — 500,000 in 2009 and 2008 |
||||||||
| Issued and outstanding shares — 96,874 in 2009 and 94,163 in 2008 |
97 | 94 | ||||||
| Additional paid-in capital |
747,580 | 699,705 | ||||||
| Accumulated other comprehensive loss |
(1,810 | ) | (3,598 | ) | ||||
| Accumulated deficit |
(377,360 | ) | (290,738 | ) | ||||
| Total stockholders’ equity |
368,507 | 405,463 | ||||||
| Total liabilities and stockholders’ equity |
$ | 491,945 | $ | 507,067 | ||||
The accompanying notes are an integral part of these consolidated financial statements.
63
Table of Contents
INFINERA CORPORATION
CONSOLIDATED STATEMENTS OF OPERATIONS
(In thousands, except per share data)
| Years Ended | ||||||||||||
| December 26, 2009 |
December 27, 2008 |
December 29, 2007 |
||||||||||
| Revenue: |
||||||||||||
| Product |
$ | 276,012 | $ | 306,808 | $ | 8,107 | ||||||
| Ratable product and related support and services |
4,231 | 193,705 | 237,745 | |||||||||
| Services |
28,858 | 18,699 | — | |||||||||
| Total revenue |
309,101 | 519,212 | 245,852 | |||||||||
| Cost of revenue: |
||||||||||||
| Cost of product |
189,723 | 184,234 | 4,091 | |||||||||
| Cost of ratable product and related support and services |
1,931 | 91,625 | 165,172 | |||||||||
| Cost of services |
12,308 | 9,798 | — | |||||||||
| Restructuring and other costs related to cost of revenue |
3,038 | — | — | |||||||||
| Total cost of revenue |
207,000 | 285,657 | 169,263 | |||||||||
| Gross profit |
102,101 | 233,555 | 76,589 | |||||||||
| Operating expenses: |
||||||||||||
| Research and development |
97,178 | 80,428 | 60,851 | |||||||||
| Sales and marketing |
48,391 | 43,262 | 32,721 | |||||||||
| General and administrative |
45,269 | 36,282 | 25,965 | |||||||||
| Restructuring and other costs |
814 | — | — | |||||||||
| Amortization of intangible assets |
110 | 150 | 148 | |||||||||
| Total operating expenses |
191,762 | 160,122 | 119,685 | |||||||||
| Income (loss) from operations |
(89,661 | ) | 73,433 | (43,096 | ) | |||||||
| Other income (expense), net: |
||||||||||||
| Interest income |
2,688 | 8,549 | 6,522 | |||||||||
| Interest expense |
— | (3 | ) | (2,251 | ) | |||||||
| Net impairment losses recognized in earnings(1) |
(1,094 | ) | — | — | ||||||||
| Other gain (loss), net |
(426 | ) | (528 | ) | (16,249 | ) | ||||||
| Total other income (expense), net |
1,168 | 8,018 | (11,978 | ) | ||||||||
| Income (loss) before income taxes |
(88,493 | ) | 81,451 | (55,074 | ) | |||||||
| Provision for (benefit from) income taxes |
(1,871 | ) | 2,723 | 268 | ||||||||
| Net income (loss) |
$ | (86,622 | ) | $ | 78,728 | $ | (55,342 | ) | ||||
| Net income (loss) per common share: |
||||||||||||
| Basic |
$ | (0.91 | ) | $ | 0.85 | $ | (1.09 | ) | ||||
| Diluted |
$ | (0.91 | ) | $ | 0.81 | $ | (1.09 | ) | ||||
| Weighted average shares used in computing net income (loss) per common share: |
||||||||||||
| Basic |
95,468 | 92,427 | 50,732 | |||||||||
| Diluted |
95,468 | 97,088 | 50,732 | |||||||||
|
(1) The following table summarizes the components of net impairment losses recognized in earnings: |
| |||||||||||
| Total other-than-temporary impairment loss |
$ | (2,747 | ) | $ | — | $ | — | |||||
| Change in portion of loss recognized in other comprehensive loss |
1,653 | — | — | |||||||||
| Net impairment losses recognized in earnings |
$ | (1,094 | ) | $ | — | $ | — | |||||
The accompanying notes are an integral part of these consolidated financial statements.
64
Table of Contents
INFINERA CORPORATION
CONSOLIDATED STATEMENTS OF CONVERTIBLE PREFERRED STOCK AND STOCKHOLDERS’ EQUITY (DEFICIT)
For the Years Ended December 29, 2007, December 27, 2008 and December 26, 2009
(In thousands, except per share data)
| Convertible Preferred Stock |
Common Stock | Additional Paid-in Capital |
Accumulated Other Comprehensive Income (Loss) |
Accumulated Deficit |
Total | ||||||||||||||||||||||||||
| Shares | Amount | Shares | Amount | ||||||||||||||||||||||||||||
| Balance at December 31, 2006 |
58,806 | $ | 320,550 | 9,054 | $ | 9 | $ | 7,911 | $ | (153 | ) | $ | (314,088 | ) | $ | (306,321 | ) | ||||||||||||||
| Convertible preferred stock converted to common at IPO |
(58,806 | ) | (320,550 | ) | 59,428 | 59 | 320,491 | — | — | 320,550 | |||||||||||||||||||||
| Proceeds from IPO, net of issuance costs |
— | — | 16,100 | 16 | 190,062 | — | — | 190,078 | |||||||||||||||||||||||
| Proceeds from follow-on offering, net of issuance costs |
— | — | 5,000 | 5 | 104,011 | — | — | 104,016 | |||||||||||||||||||||||
| Stock options exercised |
— | — | 1,603 | 2 | 3,533 | — | — | 3,535 | |||||||||||||||||||||||
| Stock options repurchased |
— | — | (30 | ) | — | (59 | ) | — | — | (59 | ) | ||||||||||||||||||||
| Stock options issued to non-employees |
— | — | — | — | 288 | — | — | 288 | |||||||||||||||||||||||
| Reclassification of options exercised but not vested |
— | — | — | — | (151 | ) | — | — | (151 | ) | |||||||||||||||||||||
| Reclassification of warrant liability upon IPO |
— | — | — | — | 25,170 | — | — | 25,170 | |||||||||||||||||||||||
| Warrants exercised |
— | — | 425 | 1 | 44 | — | — | 45 | |||||||||||||||||||||||
| Stock-based compensation |
— | — | — | — | 12,570 | — | — | 12,570 | |||||||||||||||||||||||
| FIN 48 adoption |
— | — | — | — | — | — | (36 | ) | (36 | ) | |||||||||||||||||||||
| Comprehensive loss: |
|||||||||||||||||||||||||||||||
| Unrealized gain on available-for-sale investments |
— | — | — | — | — | 23 | — | 23 | |||||||||||||||||||||||
| Foreign currency translation adjustment |
— | — | — | — | — | 208 | — | 208 | |||||||||||||||||||||||
| Net loss |
— | — | — | — | — | — | (55,342 | ) | (55,342 | ) | |||||||||||||||||||||
| Total comprehensive loss |
(55,111 | ) | |||||||||||||||||||||||||||||
| Balance at December 29, 2007 |
— | $ | — | 91,580 | $ | 92 | $ | 663,870 | $ | 78 | $ | (369,466 | ) | $ | 294,574 | ||||||||||||||||
The accompanying notes are an integral part of these consolidated financial statements.
65
Table of Contents
INFINERA CORPORATION
CONSOLIDATED STATEMENTS OF CONVERTIBLE PREFERRED STOCK AND STOCKHOLDERS’ EQUITY (DEFICIT)
For the Years Ended December 29, 2007, December 27, 2008 and December 26, 2009—(Continued)
(In thousands, except per share data)
| Common Stock | Additional Paid-in Capital |
Accumulated Other Comprehensive Income (Loss) |
Accumulated Deficit |
Total | ||||||||||||||||||
| Shares | Amount | |||||||||||||||||||||
| Balance at December 29, 2007 (brought forward) |
91,580 | $ | 92 | $ | 663,870 | $ | 78 | $ | (369,466 | ) | $ | 294,574 | ||||||||||
| Stock options exercised |
1,477 | 1 | 3,188 | — | — | 3,189 | ||||||||||||||||
| ESPP shares purchased |
794 | 1 | 8,290 | — | — | 8,291 | ||||||||||||||||
| Stock options repurchased |
(20 | ) | — | (29 | ) | — | — | (29 | ) | |||||||||||||
| Reclassification of options exercised but not vested |
— | — | 1,234 | — | — | 1,234 | ||||||||||||||||
| Restricted stock units released |
101 | — | — | — | — | — | ||||||||||||||||
| Warrants, net exercised |
231 | — | — | — | — | — | ||||||||||||||||
| Stock-based compensation |
— | — | 22,559 | — | — | 22,559 | ||||||||||||||||
| Tax benefit from stock option transactions |
— | — | 593 | — | — | 593 | ||||||||||||||||
| Comprehensive income: |
||||||||||||||||||||||
| Unrealized loss on available-for-sale investments |
— | — | — | (2,835 | ) | — | (2,835 | ) | ||||||||||||||
| Foreign currency translation adjustment |
— | — | — | (841 | ) | — | (841 | ) | ||||||||||||||
| Net income |
— | — | — | — | 78,728 | 78,728 | ||||||||||||||||
| Total comprehensive income |
75,052 | |||||||||||||||||||||
| Balance at December 27, 2008 |
94,163 | $ | 94 | $ | 699,705 | $ | (3,598 | ) | $ | (290,738 | ) | $ | 405,463 | |||||||||
| Stock options exercised |
954 | 1 | 2,108 | — | — | 2,109 | ||||||||||||||||
| ESPP shares purchased |
1,239 | 1 | 7,200 | — | — | 7,201 | ||||||||||||||||
| Stock options repurchased |
(16 | ) | — | (31 | ) | — | — | (31 | ) | |||||||||||||
| Reclassification of options exercised but not vested |
— | — | 640 | — | — | 640 | ||||||||||||||||
| Restricted stock units released |
466 | 1 | (1 | ) | — | — | — | |||||||||||||||
| Warrants, net exercised |
68 | — | — | — | — | — | ||||||||||||||||
| Stock-based compensation |
— | — | 38,552 | — | — | 38,552 | ||||||||||||||||
| Tax benefit from stock option transactions |
— | — | (593 | ) | — | — | (593 | ) | ||||||||||||||
| Comprehensive loss: |
||||||||||||||||||||||
| Unrealized non-credit related other-than-temporary impairment losses on available-for-sale investments, inclusive of tax effect of $315 |
— | — | — | (1,238 | ) | — | (1,238 | ) | ||||||||||||||
| Unrealized gain on all other available-for-sale investments |
— | — | — | 2,805 | — | 2,805 | ||||||||||||||||
| Foreign currency translation adjustment |
— | — | — | 221 | — | 221 | ||||||||||||||||
| Net loss |
— | — | — | — | (86,622 | ) | (86,622 | ) | ||||||||||||||
| Total comprehensive loss |
(84,834 | ) | ||||||||||||||||||||
| Balance at December 26, 2009 |
96,874 | $ | 97 | $ | 747,580 | $ | (1,810 | ) | $ | (377,360 | ) | $ | 368,507 | |||||||||
The accompanying notes are an integral part of these consolidated financial statements.
66
Table of Contents
INFINERA CORPORATION
CONSOLIDATED STATEMENTS OF CASH FLOWS
(In thousands)
| Years Ended | ||||||||||||
| December 26, 2009 |
December 27, 2008 |
December 29, 2007 |
||||||||||
| Cash Flows from Operating Activities: |
||||||||||||
| Net income (loss) |
$ | (86,622 | ) | $ | 78,728 | $ | (55,342 | ) | ||||
| Adjustments to reconcile net income (loss) to net cash provided by (used in) operating activities: |
||||||||||||
| Depreciation and amortization |
16,547 | 12,975 | 9,824 | |||||||||
| Non-cash restructuring and other costs |
2,973 | — | — | |||||||||
| Net credit impairment losses in earnings |
1,094 | — | — | |||||||||
| Provision for (recovery of) doubtful accounts |
(1,700 | ) | 1,700 | — | ||||||||
| Asset impairment charges |
— | — | 393 | |||||||||
| Amortization of debt discount |
— | — | 282 | |||||||||
| Amortization of premium (accretion of discount) on investments |
604 | (893 | ) | (572 | ) | |||||||
| Stock-based compensation expense |
37,375 | 23,819 | 9,656 | |||||||||
| Unrealized (gain) loss on Put Rights |
3,761 | (15,866 | ) | — | ||||||||
| Unrealized holding (gain) loss for trading securities |
(4,584 | ) | 16,762 | — | ||||||||
| Tax benefit (reversal) of stock option transactions |
248 | (248 | ) | — | ||||||||
| Reduction of (excess) tax benefit from stock option transactions |
(593 | ) | 593 | — | ||||||||
| Non-cash tax benefit |
(315 | ) | — | — | ||||||||
| Revaluation of warrant liablities |
— | — | 19,761 | |||||||||
| Gain on disposal of assets |
(284 | ) | (1,107 | ) | (2,776 | ) | ||||||
| Other (gain) loss |
(134 | ) | 7 | (73 | ) | |||||||
| Changes in assets and liabilities: |
||||||||||||
| Accounts receivable |
1,834 | (31,796 | ) | 2,054 | ||||||||
| Inventories, net |
(8,618 | ) | (821 | ) | 2,515 | |||||||
| Prepaid expenses and other current assets |
(2,244 | ) | (2,463 | ) | (770 | ) | ||||||
| Deferred inventory costs |
(6,180 | ) | 76,538 | (14,696 | ) | |||||||
| Other non-current assets |
(7,345 | ) | (6,081 | ) | 706 | |||||||
| Accounts payable |
(2,594 | ) | 16,767 | (24,220 | ) | |||||||
| Accrued liabilities and other expenses |
18,964 | 3,387 | 5,557 | |||||||||
| Deferred revenue |
3,968 | (152,030 | ) | 63,484 | ||||||||
| Accrued warranty |
1,199 | (53 | ) | 7,275 | ||||||||
| Net cash provided by (used in) operating activities |
(32,646 | ) | 19,918 | 23,058 | ||||||||
| Cash Flows from Investing Activities: |
||||||||||||
| Purchase of available-for-sale investments |
(163,870 | ) | (226,014 | ) | (295,821 | ) | ||||||
| Proceeds from sales of available-for-sale investments |
1,536 | 108,190 | 57,200 | |||||||||
| Proceeds from maturities and calls of investments |
144,795 | 183,339 | 28,620 | |||||||||
| Proceeds from disposal of assets |
699 | 1,192 | 3,286 | |||||||||
| Purchase of property and equipment |
(15,394 | ) | (22,941 | ) | (20,215 | ) | ||||||
| Change in restricted cash |
(1,113 | ) | 439 | (3,338 | ) | |||||||
| Net cash provided by (used in) investing activities |
(33,347 | ) | 44,205 | (230,268 | ) | |||||||
The accompanying notes are an integral part of these consolidated financial statements.
67
Table of Contents
INFINERA CORPORATION
CONSOLIDATED STATEMENTS OF CASH FLOWS—(Continued)
(In thousands)
| Years Ended | ||||||||||||
| December 26, 2009 |
December 27, 2008 |
December 29, 2007 |
||||||||||
| Cash Flows from Financing Activities: |
||||||||||||
| Principal payments on loan obligations |
— | — | (35,401 | ) | ||||||||
| Proceeds from loans |
— | — | 7,119 | |||||||||
| Proceeds from initial public offering, net of issuance costs |
— | — | 190,078 | |||||||||
| Proceeds from follow-on offering, net of issuance costs |
— | — | 104,016 | |||||||||
| Proceeds from issuance of common stock |
9,310 | 11,482 | 3,535 | |||||||||
| Proceeds from exercise of warrants |
— | — | 45 | |||||||||
| Proceeds from repayment of non-recourse notes |
— | — | 145 | |||||||||
| Excess (reduction of) tax benefit from stockoption transactions |
(248 | ) | 248 | — | ||||||||
| Repurchase of common stock |
(31 | ) | (29 | ) | (59 | ) | ||||||
| Payments for purchase of assets underfinancing arrangement |
(87 | ) | — | — | ||||||||
| Net cash provided by financing activities |
8,944 | 11,701 | 269,478 | |||||||||
| Effect of exchange rate changes on cash |
138 | (263 | ) | 57 | ||||||||
| Net change in cash and cash equivalents |
(56,911 | ) | 75,561 | 62,325 | ||||||||
| Cash and cash equivalents at beginning of period |
166,770 | 91,209 | 28,884 | |||||||||
| Cash and cash equivalents at end of period |
$ | 109,859 | $ | 166,770 | $ | 91,209 | ||||||
| Supplemental disclosures of cash flow information: |
||||||||||||
| Cash paid for interest |
$ | — | $ | 3 | $ | 2,497 | ||||||
| Cash paid for income taxes |
$ | 1,442 | $ | 1,036 | $ | 121 | ||||||
| Supplemental schedule of non-cash financing activities: |
||||||||||||
| Purchase of assets under financing arrangement |
$ | 567 | $ | — | $ | — | ||||||
The accompanying notes are an integral part of these consolidated financial statements.
68
Table of Contents
INFINERA CORPORATION
NOTES TO CONSOLIDATED FINANCIAL STATEMENTS
1. Organization and Basis of Presentation
Infinera Corporation (“Infinera” or the “Company”), headquartered in Sunnyvale, California, was founded in December 2000 and incorporated in the State of Delaware. Infinera has developed an optical telecom system, the Digital Transport Node System (“DTN System”) and began commercial shipment of its DTN System in November 2004. Infinera’s DTN System is unique in its use of a breakthrough semiconductor technology: the photonic integrated circuit (“PIC”). Infinera’s DTN System and PIC technology are designed to provide optical networks with simpler and more flexible engineering and operations, faster time-to-service, and the ability to rapidly deliver differentiated services without reengineering their optical infrastructure. Since 2004, the Company has expanded its product line and is pursuing even more capable PICs for its future products.
The consolidated financial statements include the accounts of the Company and its wholly-owned subsidiaries. All intercompany balances and transactions have been eliminated. The Company reclassified certain amounts reported in previous periods to conform to the current presentation.
Commencing in 2007, the Company operates and reports financial results on a fiscal year of 52 or 53 weeks ending on the last Saturday of December in each year. In previous years, the Company operated and reported financial results on a calendar year basis. Accordingly, fiscal years 2009, 2008 and 2007 were 52-week years that ended on December 26, 2009, December 27, 2008 and December 29, 2007, respectively. The next 52-week year will end on December 25, 2010 and the next 53-week year will end on December 31, 2011.
2. Significant Accounting Policies
Use of Estimates
The consolidated financial statements are prepared in accordance with United States generally accepted accounting principles (“GAAP”). These accounting principles require the Company to make certain estimates, assumptions and judgments that can affect the reported amounts of assets and liabilities and disclosure of contingent assets and liabilities as of the date of the consolidated financial statements, as well as the reported amounts of revenue and expenses during the periods presented. Significant estimates, assumptions and judgments made by management include revenue recognition, stock-based compensation, inventory valuation, allowances for doubtful accounts, accrued warranty, cash, cash equivalents and short-term and long-term investments, fair value measurement of investments, other-than-temporary impairments and accounting for income taxes. Management believes that the estimates and judgments upon which they rely are reasonable based upon information available to them at the time that these estimates and judgments are made. To the extent there are material differences between these estimates and actual results, the Company’s consolidated financial statements will be affected.
Revenue Recognition
The Company’s networking products are generally integrated with software that is more than incidental to the functionality of the equipment. The Company recognizes product revenue when all of the following have occurred: (1) it has entered into a legally binding arrangement with a customer; (2) delivery has occurred, which is when product title and risk of loss have transferred to the customer; (3) customer payment is deemed fixed or determinable; and (4) collectability is reasonably assured. Revenue is recognized net of cash discounts.
Substantially all of the Company’s product sales are sold in combination with software support services comprised of either software warranty or software subscription services. In addition, the Company periodically sells training, installation and deployment services, spares management and on-site hardware replacement services with its product sales. Software warranty provides customers with maintenance releases and patches during the warranty support period. Software subscription also includes maintenance releases and patches and provides customers with rights to receive unspecified software product upgrades released during the support period. Training services include the right to a specified number of training classes over the term of the arrangement. Installation and deployment services may include customer site assessments, equipment installation and testing. Spares management and on-site hardware replacement services include the replacement of defective units at customer sites in accordance with specified service level agreements. Product revenue consists of products that are sold without services or bundled products that are sold with services for which vendor specific objective evidence (“VSOE”) of fair value has already been established and, therefore, is recognized upfront under the residual method. The Company uses the residual method to recognize revenue when a sales agreement includes one or more elements to be delivered at a future date and VSOE of fair value of all undelivered elements exists. VSOE of fair value for software warranty, software subscription, training and installation and deployment services, spares management and on-site hardware replacement services is determined by reference to the price the customer will be required to pay when these services are sold separately.
69
Table of Contents
INFINERA CORPORATION
NOTES TO CONSOLIDATED FINANCIAL STATEMENTS—(Continued)
Prior to the first quarter of 2008, the Company had not established VSOE of fair value for its support services and, therefore recognized all revenue for transactions bundled with these services ratably over the longest remaining support period which ranges from one to five years. Revenue related to these arrangements is included in ratable product and related support and services revenue. The Company determined that it had established VSOE of fair value for software subscription in the first quarter of 2008, for training and installation and deployment services in the second quarter of 2008 and for spares management and on-site hardware replacement services in the fourth quarter of 2008. For arrangements with multiple elements which include product and software subscription services and or training and installation and deployment services, spares management and on-site hardware replacement services, the Company allocates revenue to the undelivered elements using the residual method based on VSOE of fair value for each such element and the remainder is recognized as product revenue. However, when these transactions also include undelivered services for which VSOE of fair value has not been established, revenue is deferred and recognized ratably over the longest remaining support period. Upon completion of the services for which VSOE of fair value has not been established, the difference between the VSOE of fair value for the remaining related service periods and the remaining unrecognized portion of the arrangement fee is recognized as ratable product and related support and services revenue.
Services revenue includes software subscription services, training, installation and deployment services, spares management and on-site hardware replacement services and extended hardware warranty services. Revenue from software subscription, spares management and on-site hardware replacement services and extended hardware warranty contracts is deferred and is recognized ratably over the contractual support period, which is generally one year. A majority of the Company’s customers have exercised the option to purchase software subscription services on an ongoing basis. Revenue related to training and installation and deployment services is recognized as the services are completed.
Contracts and customer purchase orders are generally used to determine the existence of an arrangement. In addition, shipping documents and customer acceptance, when applicable, are used to verify delivery and transfer of title. Revenue is recognized only when title and risk of loss pass to customers. In instances where acceptance of the product occurs upon formal written acceptance, revenue is deferred until such written acceptance has been received. The Company assesses whether the fee is fixed or determinable based on the payment terms associated with the transaction. Payment terms to customers generally range from net 30 to 120 days from invoice, which are considered to be standard payment terms. However, payment terms greater than 120 days but less than or equal to one year from invoice may be considered standard if payment is supported by an irrevocable commercial letter of credit (“LOC”) issued by a creditworthy bank or the LOC has been accepted and confirmed by a creditworthy bank. In the event payment terms are provided that differ from the Company’s standard business practices, the fees are deemed to not be fixed or determinable and, therefore, revenue is not recognized until the fees become fixed or determinable which the Company believes is when they are legally due and payable. The Company assesses the ability to collect from its customers based primarily on the creditworthiness and past payment history of the customer.
For sales to resellers, the same revenue recognition criteria apply. It is the Company’s practice to identify an end user prior to shipment to a reseller. The Company does not offer rights of return or price protection to its resellers.
Shipping charges billed to customers are included in product revenue and related shipping costs are included in product cost.
The Company reports revenue net of any required taxes collected from customers and remitted to government authorities, with the collected taxes recorded as current liabilities until remitted to the relevant government authority.
Stock-Based Compensation
Stock-based compensation cost is measured at the grant date based on the fair value of the award, and is recognized as expense over the requisite service period (generally the vesting period) under the straight-line amortization method.
70
Table of Contents
INFINERA CORPORATION
NOTES TO CONSOLIDATED FINANCIAL STATEMENTS—(Continued)
The Company estimates the fair value of the stock options granted using the Black-Scholes option pricing formula and a single option award approach. For new-hire grants, options typically vest with respect to 25% of the shares one year after the option’s vesting commencement date and the remainder ratably on a monthly basis over three years, commencing one year after the vesting commencement date. For annual refresh grants, options typically vest ratably on a monthly basis over three, four or five years. In 2009, the Company also granted retention options to executives which vest ratably on a monthly basis over two years. The Company makes a number of estimates and assumptions in determining stock-based compensation related to options including the following:
| • | The expected forfeiture rate is estimated based on the Company’s historical forfeiture data and compensation costs are recognized only for those equity awards expected to vest. The estimation of the forfeiture rate requires judgment, and to the extent actual forfeitures differ from expectations, changes in estimate will be recorded as an adjustment in the period when such estimates are revised. Actual results may differ substantially from the estimates. |
| • | Commencing in June 2007, the Company elected to use the simplified method to estimate the expected term due to increased liquidity of the underlying options in the post-IPO era as compared to the Company’s historical grants. The Company started using its own historical data to estimate the expected term starting in October 2009. |
| • | Expected volatility of the Company’s stock is based on the weighted-average implied and historical volatility of Infinera and its peer group. The peer group is comprised of similar companies in the same industrial sector. As the Company gains more historical volatility data, the weighting of its own data in the expected volatility calculation associated with options will gradually increase. |
The Company estimates the fair value of the rights to acquire stock under its Employee Stock Purchase Plan (“ESPP”) using the Black-Scholes option pricing formula. The Company’s ESPP typically provides for consecutive six-month offering periods, except for the first such offering period which commenced on June 7, 2007 and ended on February 15, 2008. The Company uses its own historical volatility data in the valuation of ESPP shares.
The Company accounted for the fair value of restricted stock units (“RSUs”) using the closing market price of the Company’s common stock on the date of grant. For new-hire grants, RSUs typically vest ratably on an annual basis over four years. For annual refresh grants, RSUs typically vest ratably on an annual basis over three, four or five years. In 2009, the Company also granted retention RSUs to executives which cliff vest after an approximate two-year period and to other employees which vest ratably on a monthly basis over one or two years.
The Company estimates the fair value of performance share units (“PSUs”) granted using the Monte Carlo simulation model. The Company issued PSUs in 2009 as part of the Company’s annual refresh grant process. The PSUs entitle the Company’s executive officers and members of its Board of Directors to receive a number of shares of the Company’s common stock based on the Company’s stock price performance over a three-year or four-year period as compared to the NASDAQ Composite Index (“NASDAQ”) for the same period. The PSUs cliff vest after three or four years and the number of shares to be issued upon vesting ranges from 0.5 to 2.0 times the number of PSUs granted depending on the relative performance of the Company’s common stock price compared to NASDAQ. This performance metric is classified as a market condition.
The Monte Carlo simulation model is based on a discounted cash flow approach, with the simulation of a large number of possible Company and NASDAQ stock price outcomes. The use of the Monte Carlo simulation model requires the input of a number of assumptions including expected volatility of the Company’s stock price, expected volatility of NASDAQ, correlation between changes in the Company’s stock price and changes in NASDAQ, risk-free interest rate, and expected dividends. Expected volatility of the Company’s stock is based on the weighted-average implied and historical volatility of the Company’s peer group in the industry in which the Company does business. Expected volatility of NASDAQ is based on the historical and implied data. Correlation is based on the historical relationship between the Company’s peer group stock price and NASDAQ composite average. The risk-free interest rate is based upon the treasury zero-coupon yield appropriate for the term of the PSU as of the grant date. The expected dividend yield is zero for the Company as it does not expect to pay dividends in the future. The expected dividend yield for NASDAQ is the annual dividend yield expressed as a percentage of the composite average of NASDAQ on the grant date.
Inventory Valuation
Inventories, net consist of raw materials, work-in-process and finished goods and are stated at standard cost adjusted to approximate the lower of actual cost (first-in, first-out method) or market. Market value is based upon an estimated selling price reduced by the estimated cost of disposal. The determination of market value involves numerous judgments including estimated average selling prices based upon recent sales volumes, industry trends, existing customer orders, current contract price, future demand and pricing and technological obsolescence of the Company’s products.
71
Table of Contents
INFINERA CORPORATION
NOTES TO CONSOLIDATED FINANCIAL STATEMENTS—(Continued)
Inventory that is obsolete or in excess of the Company’s forecasted demand or is anticipated to be sold at a loss is written down to its estimated net realizable value based on historical usage and expected demand. As of December 26, 2009 and December 27, 2008, the Company’s inventory value had been reduced by $2.7 million and $1.3 million, respectively, for excess and obsolescence. In valuing its deferred inventory costs, the Company considered whether the utility of the products delivered or expected to be delivered at less than cost, primarily comprised of common equipment, had declined. The Company concluded that, in the instances where the utility of the products delivered or expected to be delivered was less than cost, it was appropriate to value the inventory costs and deferred inventory costs at cost or market, whichever is lower, thereby recognizing the cost of the reduction in utility in the period in which the reduction occurred or can be reasonably estimated. The Company has, therefore, recognized inventory write-downs as necessary in each period in order to reflect common equipment inventory at the lower of cost or market. As of December 26, 2009 and December 27, 2008, the Company’s inventory value had been reduced by $2.6 million and $5.0 million, respectively, for LCM adjustments.
The Company considered whether it should accrue losses on firm purchase commitments related to inventory items. Given that the expected selling price of common equipment in the future remains below cost, the Company has also recorded losses on these firm purchase commitments in the period in which the commitment is made. When the inventory parts related to these firm purchase commitments are received, that inventory is recorded at the purchase price less the accrual for the loss on the purchase commitment.
If actual market conditions are less favorable than those projected by management, additional inventory write-downs may be required.
Allowances for Doubtful Accounts
Management makes judgments as to its ability to collect outstanding receivables and provides allowances for a portion of receivables when collection becomes doubtful. Provisions are made based upon a specific review of all significant outstanding invoices. At December 26, 2009 and December 27, 2008, the Company’s allowance for doubtful accounts was zero and $1.7 million, respectively, associated with accounts receivable deemed uncollectible relating to one customer. In 2009, the Company recorded a recovery of this doubtful account for $1.7 million.
Allowances for Sales Returns
Customer product returns are approved on a case by case basis. Specific reserve provisions are made based upon a specific review of all the approved product returns, where the customer has yet to return the products to generate the related sales return credit at the end of a period. Estimated sales returns are provided for as a reduction to deferred revenue in 2007 and as a reduction to revenue in 2008 and 2009 and were not material for any period presented on the Company’s consolidated financial statements. At December 26, 2009 and December 27, 2008, revenue reserves recorded for potential sales returns were immaterial.
Accrued Warranty
The Company warrants that its products will operate substantially in conformity with product specifications. Upon delivery of the Company’s products, the Company provides for the estimated cost to repair or replace products or the related components that may be returned under warranty. The Company’s hardware warranty periods range from 1 to 5 years from date of acceptance for hardware and 90 days to 60 months for software warranty. The hardware warranty accrual is based on actual historical returns experience and the application of those historical return rates to the Company’s in-warranty installed base. The Company periodically assesses the adequacy of its recorded warranty liabilities and adjusts the amounts as necessary. The Company has software warranty support obligations to a small number of its customers and the costs associated with providing these software warranties have been immaterial to the Company’s consolidated financial statements to date.
Cash, Cash Equivalents and Short-term and Long-term Investments
The Company considers all highly liquid instruments with an original maturity at the date of purchase of 90 days or less to be cash equivalents. The Company maintains its cash in bank deposit accounts which, at times, may exceed federally insured limits. The Company has not experienced any losses in such accounts.
72
Table of Contents
INFINERA CORPORATION
NOTES TO CONSOLIDATED FINANCIAL STATEMENTS—(Continued)
Marketable securities consist principally of certificates of deposit, commercial paper, corporate bonds, U.S. agency notes, U.S. treasuries, auction rate securities (“ARS”) and Put Rights. The Company considers all debt instruments with original maturities at the date of purchase greater than 90 days and remaining time to maturity of one year or less to be short-term investments. The Company classifies debt instruments with remaining maturities greater than one year as long-term investments, unless the Company intends to settle its holdings within one year or less and in such case it is considered to be short-term investments. The Company determines the appropriate classification of its marketable securities at the time of purchase and re-evaluates such designations as of each balance sheet date.
Available-for-sale investments are stated at fair market value with unrealized gains and losses recorded in Accumulated other comprehensive loss in the Company’s consolidated balance sheets and Other income (expense), net in the Company’s consolidated statements of operations. The Company evaluates its available-for-sale marketable debt securities for other-than-temporary impairments as discussed below and records any credit loss portion in Other income (expense), net in the Company’s consolidated statements of operations. The amortized cost of debt securities is adjusted for amortization of premiums and accretion of discounts to maturity and for any credit losses incurred on these securities. Gains and losses are recognized when realized in the Company’s consolidated statements of operations under the specific identification method. Trading securities investments are stated at fair value with unrealized gains and losses reported in Other income (expense), net in the Company’s consolidated statements of operations, consisting of ARS trading securities and related Put Rights.
Fair Value Measurement of Investments
The fair value of the Company’s financial instruments reflects the estimates of amounts that would be received from selling an asset or paid to transfer a liability in an orderly transaction between market participants at the measurement date (exit price). The fair value estimates presented in the Company’s consolidated financial statements are based on information available to us as of December 26, 2009.
The Company applies a fair value hierarchy based on three levels of inputs as follows:
| Level I — | Quoted prices in active markets for identical assets or liabilities. |
| Level II — | Inputs other than Level I that are observable, either directly or indirectly, such as quoted prices for similar assets or liabilities, quoted prices in markets that are not active, or other inputs that are observable or can be corroborated by observable market data for substantially the full term of the assets or liabilities. In addition, Level II could include unobservable inputs that are not significant to the fair value of the assets or liabilities. |
| Level III — | Unobservable inputs that are supported by little or no market activity and that are significant to the fair value of the assets or liabilities. |
The Company measures its cash equivalents, debt securities and Put Rights at fair value and classifies its securities in accordance with a fair value hierarchy. The Company’s money market funds and U.S. treasuries are classified within Level I of the fair value hierarchy and are valued based on quoted prices in active markets for identical securities.
The Company classifies its certificates of deposit, commercial paper, corporate bonds and U.S. agency notes within Level II of the fair value hierarchy as follows:
Certificates of Deposit
The Company reviews market pricing and other observable market inputs for the same or similar securities obtained from a number of industry standard data providers. In the event that a transaction is observed for the same or similar security in the marketplace, the price on that transaction reflects the market price and fair value on that day. In the absence of any observable market transactions for a particular security, the fair market value at period end would be equal to the par value. These inputs represent quoted prices for similar assets or these inputs have been derived from observable market data, and result in the classification of these securities as Level II of the fair value hierarchy.
Commercial Paper
The Company reviews market pricing and other observable market inputs for the same or similar securities obtained from a number of industry standard data providers. In the event that a transaction is observed for the same or similar security in the marketplace, the price on that transaction reflects the market price and fair value on that day and then follows a revised accretion schedule to determine the fair market value at period end. In the absence of any observable market transactions for a particular security, the fair market value at period end is derived by accreting from the last observable market price. These inputs represent quoted prices for similar assets or these inputs have been derived from observable market data accreted mathematically to par, and result in the classification of these securities as Level II of the fair value hierarchy.
73
Table of Contents
INFINERA CORPORATION
NOTES TO CONSOLIDATED FINANCIAL STATEMENTS—(Continued)
Corporate Bonds
The Company reviews trading activity and pricing for each of the corporate bond securities in its portfolio as of the measurement date and determines if pricing data of sufficient frequency and volume in an active market exists in order to support Level I classification of these securities. Since sufficient quoted pricing for identical securities is not available, the Company obtains market pricing and other observable market inputs for similar securities from a number of industry standard data providers. In instances where multiple prices exist for similar securities, these prices are used as inputs into a distribution-curve to determine the fair market value at period end. As a result, the Company classifies its corporate bonds as Level II of the fair value hierarchy.
U.S. Agency Notes
The Company reviews trading activity and pricing for its U.S. agency notes as of the measurement date. When sufficient quoted pricing for identical securities is not available, the Company uses market pricing and other observable market inputs for similar securities obtained from a number of industry standard data providers. These inputs represent quoted prices for similar assets in active markets or these inputs have been derived from observable market data, and result in the classification of these securities as Level II of the fair value hierarchy.
The Company classifies its ARS and related Put Rights within Level III of the fair value hierarchy as follows:
Auction Rate Securities
The Company’s ARS are classified within Level III because they are valued, in part, by using inputs that are unobservable in the market and are significant to the valuation. The recent uncertainties in the credit markets have affected all of the Company’s ARS and auctions for these securities have failed to settle on their respective settlement dates. In light of these developments, to determine the fair value for the Company’s ARS, the Company used a combination of the market approach and income approach. The market approach uses pricing based on transactions in an inactive secondary market for similar or comparable securities. In addition, the Company performed its own discounted cash flow analysis. Management determined that it was most appropriate to value the ARS using the market approach and income approach equally given the facts and circumstances as of December 26, 2009, and therefore incorporated both valuations in the Company’s fair value measurement.
The significant unobservable inputs and assumptions used in the discounted cash flow model to determine the fair value of the Company’s ARS, as of December 26, 2009, are as follows:
| • | Contractual cash flow |
The model assumed that the principal amount or par value for these securities will be repaid at the end of the estimated workout period. In addition, future interest payments were estimated as described in each individual prospectus and based on the then current U.S. Treasury Bill (“T-Bill”) rate adjusted for a failed auction premium of 120 basis points (“bps”) for all the Company’s ARS, except for 150 bps for A3 rated securities.
| • | ARS discount rate |
The model incorporated a discount rate equal to an estimate of the LIBOR rates commensurate with the estimated workout period of the securities. As of the measurement date, these rates were then adjusted by a total of approximately 280 bps to 330 bps which included an estimate of the market student loan spread and a discount factor to reflect the lack of liquidity and the credit risk of the securities. Most of the Company’s ARS were AAA rated, except for $11.1 million (par value) of ARS that were downgraded to A3 rating and $0.8 million (par value) of ARS that were downgraded to Aa1 rating during 2009. The Company’s ARS are mostly collateralized by student loans guaranteed by the U.S. government under the Federal Family Education Loan Program. The discount rate does, however, include a discount factor to reflect the issuer’s credit risk and its potential inability to perform its obligations under the terms of the ARS agreements. The Company’s other-than-temporary impairment analysis for two of its available-for-sale ARS indicates that the estimated credit risk element included in the discount rate for an AAA rated security is approximately 170 bps and 190 bps for an A3 rated security.
74
Table of Contents
INFINERA CORPORATION
NOTES TO CONSOLIDATED FINANCIAL STATEMENTS—(Continued)
| • | Estimated maturity |
The Company estimated the workout period of its ARS as the weighted-average life of the underlying trust loan portfolio where this information was available from servicing and other trust reports. In a small number of instances where this information was not available, the Company used the weighted-average life of the loan portfolio of a similar trust. The estimated time to maturity of the securities as of the measurement date ranged from 10.0 years to 18.5 years.
Put Rights
Put Rights associated with the Company’s ARS holdings with UBS Financial Services, Inc. (“UBS”) are classified as Level III because they are valued, in part, by using inputs that are unobservable in the market and are significant to the valuation. The fair value of the Put Rights is equal to the difference between the fair value of the UBS ARS calculated as described above and their value including the impact of the Put Rights. The Company performed its own discounted cash flow analysis to calculate the fair value of the UBS ARS including the impact of the Put Rights.
The significant unobservable inputs and assumptions used in the discounted cash flow model to determine the fair value of the UBS ARS including the impact of the Put Rights as of December 26, 2009 are as follows:
| • | Contractual cash flow |
The model assumed that the principal amount or par value for the ARS would be repaid on June 30, 2010, based on the Company’s current intent to exercise its Put Rights and sell these securities to UBS on that date. In addition, future interest payments were estimated as described in each individual prospectus and based on the then current T-Bill rate as adjusted for a failed auction premium of 120 bps for all of the Company’s ARS, except for 150 bps for A3 rated securities.
| • | Discount rate |
The model incorporated a discount rate equal to an estimate of the LIBOR rates commensurate with the expected sale date of these securities. As of the measurement date, this rate was adjusted by approximately 50 bps which represented a discount factor to reflect UBS credit risk and UBS’ potential inability to perform its obligations under the Put Rights agreement.
The Company believes that the fair value of its ARS and Put Rights could change significantly in the future, based on market conditions and continued uncertainties in the financial markets. UBS’ credit risk may be subject to significant volatility and it is difficult to predict future fluctuations. A 10% deterioration in UBS credit risk would result in an immaterial amount of loss in the Company’s consolidated statements of operations for 2009. Deterioration in the ARS discount rate or a change in the estimated time to maturity would have no impact on the Company’s consolidated statements of operations because a change in fair value of the ARS would be offset by a change in fair value of the Put Rights.
Other-Than-Temporary Impairments
The Company’s reviews its available-for-sale marketable debt securities on a regular basis to evaluate whether or not a security has experienced an other-than-temporary decline in fair value. If a debt security’s market value is below amortized cost and the Company either intends to sell the security or it is more likely than not that the Company will be required to sell the security before its anticipated recovery, the Company records an other-than-temporary impairment (“OTTI”) charge to earnings for the entire amount of the impairment.
When the Company does not intend to sell an impaired security and it is not more likely than not that the Company will be required to sell prior to recovery of its amortized cost basis, the Company separates the OTTI into credit and non-credit loss portions. The amount representing the credit loss is recognized in Other income (expense), net, and the amount related to all other factors is recognized in Accumulated other comprehensive loss.
In determining if a credit loss has occurred, it is the Company’s policy to isolate the credit loss related portion of the discount rate used to derive the fair market value of the security and apply this to the expected cash flows in order to determine the portion of the OTTI that is credit loss related. This credit related portion of the discount rate is based on the financial condition of the issuer, changes in rating agency credit ratings for the security or increases in credit related yield spreads on similar securities offered by the same issuer.
75
Table of Contents
INFINERA CORPORATION
NOTES TO CONSOLIDATED FINANCIAL STATEMENTS—(Continued)
Once a credit impairment loss has been recognized in the Company’s consolidated statements of operations, the amortized cost basis of that available-for-sale security is reduced by the amount of the credit impairment loss, resulting in a new cost basis for the security. Any non-credit related unrealized gains and losses are recorded in Accumulated other comprehensive loss in the Company’s consolidated balance sheets. The Company will continue to monitor the security’s credit rating and credit spread and will accrete any reduction in the credit impairment loss to interest income over the expected life of the security.
Property, Plant and Equipment
Property, plant and equipment are stated at cost. Depreciation is calculated using the straight-line method over the estimated useful lives of the respective assets. Depreciation expense was $19.3 million, $12.7 million and $9.3 million for 2009, 2008 and 2007, respectively. Leasehold improvements are amortized using the straight-line method over the shorter of the lease term or estimated useful life of the asset. An assumption of lease renewal where a renewal option exists is used only when the renewal has been determined to be reasonably assured. Repair and maintenance costs are expensed as incurred. The estimated useful life for each asset category is as follows:
| Estimated Useful lives | ||
| Laboratory and manufacturing equipment |
1.5 to 10 years | |
| Furniture and fixtures |
3 to 5 years | |
| Computer hardware and software |
1.5 to 3 years | |
| Leasehold improvements |
1 to 7 years |
The Company regularly reviews long-lived assets for impairment whenever events or changes in circumstances indicate that the carrying amount of these assets may not be recoverable or that the useful life is shorter than originally estimated. If impairment indicators are present and the projected future undiscounted cash flows are less than the carrying value of the assets, the carrying values are reduced to the estimated fair value. If assets are determined to be recoverable, but the useful lives are shorter than originally estimated, the carrying value of the assets is depreciated over the newly determined remaining useful lives. In 2009, the Company recognized $3.0 million of depreciation expense caused by the shortening of the useful life of assets associated with the restructuring plan related to the closure of its Maryland based semiconductor fabrication plant (“FAB”).
Valuation of Intangibles
The Company tests for impairment of intangible assets only when events have occurred that may indicate that recoverability of these assets is questionable. When events or circumstances indicate that a potential impairment may have occurred, future undiscounted net cash flows associated with the related asset or group of assets over their remaining lives are compared to the current carrying amounts of such assets. When projected cash flows are less than the carrying amounts of the intangibles, an impairment loss would be recognized by comparing the discounted present value of future cash flows to carrying amounts and writing down the excess of the carrying amounts to their respective fair values.
Deferred Inventory Costs
When the Company’s products have been delivered, but the product revenue associated with the arrangement has been deferred as a result of not meeting the revenue recognition criteria or the costs are related to product sales bundled with training, software warranty or product support services where the revenue is deferred and recognized ratably, the Company also defers the related inventory costs for the delivered items.
Accounting for Income Taxes
As part of the process of preparing the Company’s consolidated financial statements, the Company is required to estimate its taxes in each of the jurisdictions in which it operates. The Company estimates actual current tax expense together with assessing temporary differences resulting from different treatment of items, such as accruals and allowances not currently deductible for tax purposes. These differences result in deferred tax assets and liabilities, which are included in the Company’s consolidated balance sheets. In general, deferred tax assets represent future tax benefits to be received when certain expenses previously recognized in the Company’s consolidated statements of operations become deductible expenses under applicable income tax laws or loss or credit carryforwards are utilized. Accordingly, realization of the Company’s deferred tax assets is dependent on future taxable income within the respective jurisdictions against which these deductions, losses and credits can be utilized within the applicable future periods.
76
Table of Contents
INFINERA CORPORATION
NOTES TO CONSOLIDATED FINANCIAL STATEMENTS—(Continued)
The Company must assess the likelihood that some portion or all of its deferred tax assets will be recovered from future taxable income within the respective jurisdictions, and to the extent the Company believes that recovery does not meet the “more-likely-than-not” standard, it must establish a valuation allowance. The ultimate realization of deferred tax assets is dependent upon the generation of future taxable income during the periods in which those temporary differences become deductible. Management judgment is required in determining the Company’s provision for income taxes, its deferred tax assets and liabilities and any valuation allowance recorded against its net deferred tax assets. At December 26, 2009 and December 27, 2008, certain of the Company’s domestic net deferred tax assets were fully reserved with a valuation allowance because, based on the available evidence, the Company believed at that time it was more likely than not that it would not be able to utilize those deferred tax assets in the future. The Company intends to maintain a valuation allowance until sufficient evidence exists to support the reversal of the valuation allowance. The Company makes estimates and judgments about its future taxable income, by jurisdiction, based on assumptions that are consistent with its plans and estimates. Should the actual amounts differ from the Company’s estimates, the amount of its valuation allowance could be materially impacted.
Concentration of Credit Risk
Financial instruments that are potentially subject to concentrations of credit risk consist primarily of cash equivalents, short-term investments, long-term investments and accounts receivable. Investment policies have been implemented that limit investments to investment grade securities.
As of December 26, 2009, the Company held $70.4 million (par value) of investments comprised of ARS, which are variable-rate debt securities and have a long-term maturity with the interest rate being reset through auctions that are typically held every 7, 28 or 35 days. These securities have historically traded at par and are callable at par at the option of the issuer. Interest is typically paid at the end of each auction period or semiannually. Since February 2008, most of the auctions for these securities have failed and there is no assurance that future auctions will succeed. As a result, the Company’s ability to liquidate its investment in the near term is limited.
As of December 26, 2009, most of the ARS that the Company held were AAA rated, except for $11.1 million (par value) of ARS that were downgraded to A3 rating and $0.8 million (par value) of ARS that were downgraded to Aa1 rating during 2009. The Company’s ARS are mostly collateralized by student loans guaranteed by the U.S. government under the Federal Family Education Loan Program.
In addition, $60.8 million (par value) of the Company’s ARS are subject to Put Rights with UBS, whereby the Company can sell back these ARS to UBS at par value on or after June 30, 2010. The remaining $9.6 million (par value) of ARS were purchased from a single broker who to date has not offered to repurchase these ARS from the Company. During 2009, two of the issuers called $5.2 million (par value) of the Company’s ARS. There is however no assurance that UBS will perform its obligations under its Put Rights or that liquidity will return to the ARS market. Additionally, the Company may not be able to fully recover the par value of its ARS or it could take until final maturity of the ARS (up to 38 years) to realize the Company’s investment. See Note 3, “Fair Value Measurements and Other-Than-Temporary Impairments,” to the Notes to Consolidated Financial Statements for more information.
The risk with respect to accounts receivable is mitigated by ongoing credit evaluations that the Company performs on its customers. As the Company expands its sales internationally, it may experience increased levels of customer credit risk associated with those regions. Collateral is generally not required for accounts receivable but may be used in the future to mitigate credit risk associated with customers located in certain geographical regions. Level 3 Communications (“Level 3”) accounted for approximately 17%, 25% and 47% of the Company’s revenue in 2009, 2008 and 2007, respectively. In July 2009, the Company was informed by Level 3 that they intended to use another dense wavelength division multiplexing (“DWDM”) vendor in their network. The Company believes that this vendor will be given a significant portion of Level 3’s new network deployments commencing in 2010, and will impact the revenue the Company will receive from Level 3 in the future. In 2009 and 2008, the Company had no other customer that represented over 10% of the Company’s revenue. In 2007, the Company had one other customer that represented over 10% of the Company’s revenue.
As of December 26, 2009 and December 27, 2008, the Company had amounts due from two customers that each represented greater than 10% of the Company’s accounts receivable balance. The combined amount of the two customer balances as of December 26, 2009 and December 27, 2008, represented approximately 34% and 43%, respectively, of the Company’s accounts receivable balance.
77
Table of Contents
INFINERA CORPORATION
NOTES TO CONSOLIDATED FINANCIAL STATEMENTS—(Continued)
The Company depends on a single or limited number of suppliers for components and raw materials. The Company generally purchases these single or limited source components and materials through standard purchase orders and has no long-term guarantee supply agreements with its suppliers. While the Company seeks to maintain sufficient reserve stock of such products, the Company’s business and results of operations could be adversely affected by a stoppage or delay in receiving such components and materials, the receipt of defective parts, an increase in the price of such components and materials or the Company’s inability to obtain reduced pricing from its suppliers in response to competitive pressures.
Derivative Instruments
Derivatives are financial instruments whose values are derived from one or more underlying financial instruments, such as foreign currency exchange forward contracts. All derivatives, whether designated in a hedging relationship or not, are required to be recorded on the balance sheet at fair value. Beginning in the second quarter of 2009, the Company established a foreign currency risk management program to reduce the impact of foreign exchange fluctuations on earnings. The Company does not enter into or hold derivatives for trading or speculative purposes. The Company enters into derivative transactions, specifically foreign currency exchange forward contracts, to manage its exposure to fluctuations in foreign exchange rates that arise primarily from its Euro denominated receivables. Gains and losses on these contracts are intended to offset the impact of foreign exchange rate changes on the underlying foreign currency denominated accounts receivable, and therefore, do not subject the Company to material balance sheet risk. The forward contracts are with one high quality institution and the Company monitors the creditworthiness of the counterparty consistently. The forward contracts entered into during 2009 were primarily denominated in Euro and typically had maturities of no more than 30 days. The contracts were settled for U.S. dollars at maturity at rates agreed to at inception of the contracts. As of December 26, 2009, the Company did not designate foreign currency exchange forward contracts as hedges for accounting purposes, and accordingly changes in the fair value of these instruments are included in Other gain (loss), net in the accompanying consolidated statements of operations.
As of December 26, 2009, there was a $14.0 million notional amount of Euro denominated currency exchange forward contract outstanding with an immaterial fair value amount due to the fact that the contract was entered and valued at the end of the period.
| December 26, 2009 | |||
| (In thousands) | |||
| Derivatives not designated as hedging instruments: |
|||
| Notional amount of foreign currency exchange forward contracts |
$ | 13,987 | |
| Fair value of foreign currency exchange forward contracts |
$ | — | |
Foreign Currency Translation and Transactions
The Company considers the functional currencies of its foreign subsidiaries to be the local currency. Assets and liabilities recorded in foreign currencies are translated at the exchange rate as of the balance sheet date, and costs and expenses are translated at average exchange rates in effect during the period. Equity transactions are translated using historical exchange rates. The effects of foreign currency translation adjustments are recorded as a separate component of Stockholders’ equity in the accompanying consolidated balance sheets.
For all non-functional currency account balances, the re-measurement of such balances to the functional currency will result in either a foreign exchange transaction gain or loss which is recorded to Other gain (loss), net in the same period that the remeasurement occurred. Aggregate foreign currency transaction losses recorded in 2009 and 2008 were $1.7 million and $0.8 million, respectively. Aggregate foreign currency transaction losses recorded in 2007 were immaterial. Beginning in the second quarter of 2009, the Company entered into foreign currency exchange forward contracts to reduce the impact of foreign exchange fluctuations on earnings from accounts receivable balances primarily denominated in Euro. The foreign currency transaction loss on these forward contracts amounted to $1.0 million in 2009, and substantially offset the transaction gains and losses from the re-measurement of the related accounts receivable.
78
Table of Contents
INFINERA CORPORATION
NOTES TO CONSOLIDATED FINANCIAL STATEMENTS—(Continued)
Comprehensive Income (Loss)
Total comprehensive income (loss) consists of other comprehensive income (loss) and net income (loss). Other comprehensive income (loss) includes certain changes in equity that are excluded from net income (loss). Specifically, cumulative foreign currency translation adjustments and unrealized holding gains (losses) on available-for-sale investments are included in Accumulated other comprehensive income (loss) in the consolidated balance sheets.
The components of accumulated other comprehensive income (loss) are as follows:
| December 26, 2009 |
December 27, 2008 |
December 29, 2007 | |||||||||
| (In thousands) | |||||||||||
| Accumulated net unrealized loss on foreign currency translation adjustment |
$ | (565 | ) | $ | (786 | ) | $ | 55 | |||
| Accumulated unrealized non-credit related other-than-temporary impairment losses on available-for-sale investments, inclusive of tax effect of $315 |
(1,238 | ) | — | — | |||||||
| Accumulated unrealized holding gain (loss) on all other available-for-sale investments |
(7 | ) | (2,812 | ) | 23 | ||||||
| Total accumulated other comprehensive income (loss) |
$ | (1,810 | ) | $ | (3,598 | ) | $ | 78 | |||
The following table reconciles net income (loss) to comprehensive income (loss) for 2009, 2008 and 2007:
| Years Ended | ||||||||||||
| December 26, 2009 |
December 27, 2008 |
December 29, 2007 |
||||||||||
| (In thousands) | ||||||||||||
| Net income (loss) |
$ | (86,622 | ) | $ | 78,728 | $ | (55,342 | ) | ||||
| Change in foreign currency translation gain (loss) |
221 | (841 | ) | 208 | ||||||||
| Change in unrealized non-credit related other-than-temporary impairment losses on available-for-sale investments, inclusive of tax effect of $315 |
(1,238 | ) | — | — | ||||||||
| Change in unrealized gains (losses) on all other available-for-sale investments |
2,805 | (2,835 | ) | 23 | ||||||||
| Total comprehensive income (loss) |
$ | (84,834 | ) | $ | 75,052 | $ | (55,111 | ) | ||||
Restructuring and Other Related Costs
In July 2009, the Company announced a restructuring plan under which it closed its Maryland based semiconductor FAB and consolidated these activities into its primary FAB location in Sunnyvale, California. In 2009, the Company recorded restructuring and other related costs of $3.9 million consisting of severance and related expenses, equipment and facilities-related costs, operating lease termination costs and other exit costs. Equipment and facilities-related costs consist of increased depreciation expense related to restructured assets caused by shortening the useful life or updating the salvage value of depreciable fixed assets to coincide with the end of production under the approved restructuring plan.
Advertising
All advertising costs are expensed as incurred. Advertising expenses in 2009, 2008 and 2007 were $0.8 million, $0.5 million and $0.4 million, respectively.
Research and Development
All costs to develop the Company’s hardware products are expensed as incurred. Software development costs are capitalized beginning when a product’s technological feasibility has been established and ending when a product is available for general release to customers. Generally, the Company’s software products are released soon after technological feasibility has been established. As a result, costs subsequent to achieving technological feasibility have not been significant and all software development costs have been expensed as incurred.
79
Table of Contents
INFINERA CORPORATION
NOTES TO CONSOLIDATED FINANCIAL STATEMENTS—(Continued)
Recent Accounting Standards
In the second quarter of 2009, the Company adopted new standards that provide guidance on how to determine the fair value of assets and liabilities when the volume and level of activity for the asset/liability has significantly decreased. These new standards also provide guidance on identifying circumstances that indicate a transaction is not orderly. In addition, the Company is required to disclose in interim and annual periods the inputs and valuation techniques used to measure fair value and a discussion of changes in valuation techniques. The adoption of these new standards did not have a significant impact on the Company’s consolidated financial statements.
In the second quarter of 2009, the Company adopted new standards for the recognition and measurement of other-than-temporary impairments for debt securities that replaced the pre-existing “intent and ability” indicator. These new standards specify that if the fair value of a debt security is less than its amortized cost basis, an other-than-temporary impairment (“OTTI”) is triggered in circumstances where (1) an entity has an intent to sell the security, (2) it is more likely than not that the entity will be required to sell the security before recovery of its amortized cost basis, or (3) the entity does not expect to recover the entire amortized cost basis of the security (that is, a credit loss exists). Other-than-temporary impairments are separated into amounts representing credit losses, which are recognized in earnings, and amounts related to all other factors, which are recognized in other comprehensive income (loss). This standard was effective for interim and annual reporting periods ending after June 15, 2009. See Note 3, “Fair Value Measurements and Other-Than-Temporary Impairments,” to the Notes to Consolidated Financial Statements for further discussion on the Company’s impact from the adoption of this standard.
During the fourth quarter of fiscal 2009, the Company adopted the FASB Accounting Standards Codification and the Hierarchy of Generally Accepted Accounting Principles which only affected the specific references to GAAP literature in the notes to the Company’s consolidated financial statements.
Accounting Standards Update (“ASU”) 2009-05 includes amendments to Subtopic 820-10, Fair Value Measurements and Disclosures—Overall, related to the fair value measurement of liabilities and provides clarification of the techniques to be used to measure fair value, when a quoted price in an active market for the identical liability is not available. FASB ASU 2009-05 is effective for the first reporting periods beginning after its issuance on August 2009, and the adoption in the fourth quarter of 2009 did not have a material effect on the Company’s consolidated financial statements.
FASB ASU 2009-13 updates the existing guidance on accounting for multiple-element revenue arrangements. Specifically, this guidance expands the criteria in Subtopic 605-25, Revenue Recognition-Multiple-Element Arrangements, for when individual deliverables within a multiple-element arrangement may be treated as separate units of accounting. In addition, the guidance modifies the manner in which the transaction consideration is allocated across the separately identified deliverables or units of accounting by no longer permitting the residual method of allocating arrangement consideration. FASB ASU 2009-13 is effective for the first annual period beginning on or after June 15, 2010 and may be applied retrospectively, for all periods presented or prospectively, with early adoption permitted. The Company is currently evaluating the timing and potential impact of the adoption of this Standard on its consolidated financial position, results of operations or cash flows.
FASB ASU 2009-14 significantly changes the accounting for revenue arrangements that include both tangible product and software elements. This new standard amends the scope of pre-existing software revenue guidance by excluding non-software components of software-reliant tangible products in addition to software products bundled with tangible products where the software components and non-software components function together to deliver the products’ essential functionality. FASB ASU 2009-14 is effective for the first annual period beginning on or after June 15, 2010 and may be applied retrospectively, for all periods presented or prospectively, with early adoption permitted. The Company is currently evaluating the timing of its adoption of ASU 2009-13 and ASU 2009-14 and the potential impact that these new standards will have on its consolidated financial position, results of operations or cash flows.
80
Table of Contents
INFINERA CORPORATION
NOTES TO CONSOLIDATED FINANCIAL STATEMENTS—(Continued)
3. Fair Value Measurements and Other-Than-Temporary Impairments
Fair Value Measurements
A summary of the carrying values and balance sheet classification of cash, cash equivalents, investments and restricted cash was as follows as of December 26, 2009 and December 27, 2008:
| December 26, 2009 |
December 27, 2008 | |||||
| (In thousands) | ||||||
| Cash in banks |
$ | 24,847 | $ | 26,885 | ||
| Restricted cash |
4,013 | 2,899 | ||||
| Total cash and restricted cash |
$ | 28,860 | $ | 29,784 | ||
| Available-for-sale investments |
185,842 | 218,047 | ||||
| ARS—trading |
49,911 | 48,888 | ||||
| Put Rights |
10,864 | 15,866 | ||||
| Total investments |
$ | 246,617 | $ | 282,801 | ||
| Total cash and cash equivalents, investments and restricted cash |
$ | 275,477 | $ | 312,585 | ||
| Reported as: |
||||||
| Cash and cash equivalents |
$ | 109,859 | $ | 166,770 | ||
| Short-term investments |
143,350 | 68,232 | ||||
| Short-term restricted cash |
1,533 | 720 | ||||
| Long-term investments |
18,255 | 74,684 | ||||
| Long-term restricted cash |
2,480 | 2,179 | ||||
| Total cash and cash equivalents, investments and restricted cash |
$ | 275,477 | $ | 312,585 | ||
Investments were as follows as of December 26, 2009 and December 27, 2008:
| December 26, 2009 | |||||||||||||||||||
| Adjusted Amortized Cost |
Non-credit OTTI |
Gross Unrealized Gains |
Gross Unrealized Losses |
Estimated Fair Value |
|||||||||||||||
| (In thousands) | |||||||||||||||||||
| Money market funds |
$ | 69,691 | $ | — | $ | — | $ | — | $ | 69,691 | |||||||||
| Certificates of deposit |
720 | — | — | — | 720 | ||||||||||||||
| Commercial paper |
33,436 | — | — | (1 | ) | 33,435 | |||||||||||||
| Corporate bonds |
42,426 | — | 22 | (38 | ) | 42,410 | |||||||||||||
| U.S. agency notes |
31,905 | — | 10 | — | 31,915 | ||||||||||||||
| ARS |
8,594 | (1) | (923 | ) | — | — | 7,671 | (2) | |||||||||||
| Total available-for-sale investments |
$ | 186,772 | $ | (923 | ) | $ | 32 | $ | (39 | ) | $ | 185,842 | |||||||
| ARS—trading |
60,775 | — | — | (10,864 | ) | 49,911 | (2) | ||||||||||||
| Put Rights |
— | — | 10,864 | — | 10,864 | ||||||||||||||
| Total investments |
$ | 247,547 | $ | (923 | ) | $ | 10,896 | $ | (10,903 | ) | $ | 246,617 | |||||||
| (1) | Amount represents the par value less $1.1 million of credit-related OTTI recognized through earnings as of December 26, 2009. |
| (2) | Amount reflects investments in a continuous loss position for twelve months or longer. |
81
Table of Contents
INFINERA CORPORATION
NOTES TO CONSOLIDATED FINANCIAL STATEMENTS—(Continued)
| December 27, 2008 | |||||||||||||
| Amortized Cost |
Gross Unrealized Gains |
Gross Unrealized Losses |
Estimated Fair Value | ||||||||||
| (In thousands) | |||||||||||||
| Money market funds |
$ | 92,257 | $ | — | $ | — | $ | 92,257 | |||||
| Commercial paper |
51,581 | — | (52 | ) | 51,529 | ||||||||
| Corporate bonds |
25,578 | 49 | (183 | ) | 25,444 | ||||||||
| U.S. treasuries |
41,443 | 13 | — | 41,456 | |||||||||
| ARS |
10,000 | — | (2,639 | ) | 7,361 | ||||||||
| Total available-for-sale investments |
$ | 220,859 | $ | 62 | $ | (2,874 | ) | $ | 218,047 | ||||
| ARS—trading |
65,650 | — | (16,762 | ) | 48,888 | ||||||||
| Put Rights |
— | 15,866 | — | 15,866 | |||||||||
| Total investments |
$ | 286,509 | $ | 15,928 | $ | (19,636 | ) | $ | 282,801 | ||||
Investments in certificates of deposit, commercial paper, corporate bonds, U.S. agency notes and U.S. treasuries have a contractual maturity term of less than one year, while ARS have contractual maturity terms of up to 38 years. The Company recorded credit-related OTTI for available-for-sale investments in Other income (expense), net beginning in the second quarter of 2009. Realized gains (losses) on short-term and long-term investments were immaterial for 2009, 2008 and 2007.
As of December 26, 2009, the Company held $70.4 million (par value) of investments comprised of ARS marketable securities, which are variable-rate debt securities and have a long-term maturity with the interest rate being reset through auctions that are typically held every 7, 28 or 35 days. The securities have historically traded at par and are callable at par at the option of the issuer. Interest is typically paid at the end of each auction period or semiannually. Since February 2008, most of the auctions for these securities have failed. As of December 26, 2009, most of the ARS that the Company held were AAA rated, except for $11.1 million (par value) of ARS that were downgraded to an A3 rating and $0.8 million (par value) of ARS that were downgraded to Aa1 rating during 2009. The Company’s ARS are mostly collateralized by student loans guaranteed by the U.S. government under the Federal Family Education Loan Program.
In October 2008, the Company elected to participate in a rights offering by UBS, one of the Company’s brokers, which provides the Company with the Put Rights to sell back to UBS $60.8 million of the Company’s ARS portfolio at par value as of December 26, 2009, at any time during a two-year sale period beginning June 30, 2010. By electing to participate in the rights offering, the Company granted UBS the right, exercisable at any time prior to June 30, 2010 or during the two-year sale period, to purchase or cause the sale of the Company’s ARS (“Call Right”). UBS has agreed to pay the Company the par value of its ARS within one day of settlement of any Call Right transaction. The Company’s Put Rights are required to be recognized as a free-standing asset, separate from the Company’s ARS. The Company elected to treat this portion of the ARS portfolio as trading securities and elected to measure the Put Rights at fair value in order to match the changes in the fair value of the ARS. This allows any changes in the fair value of the Put Rights to be offset partially with changes in the fair value of the related ARS in the Company’s consolidated statements of operations. The ARS covered by the UBS settlement and the related Put Rights are revalued to fair market value on a quarterly basis until the sale of these securities has been completed. As of December 26, 2009, $60.8 million (par value) of UBS ARS were recorded at fair value of $49.9 million, with an unrealized loss of $10.9 million. These trading ARS were classified as short-term investments in the accompanying consolidated balance sheets at December 26, 2009 as the Company intends to sell these securities back to UBS at par value on June 30, 2010. The related Put Rights had a fair value of $10.9 million and were also classified as short-term investments at December 26, 2009.
The Company recorded $4.6 million of unrealized holding gains related to ARS trading securities in 2009 in Other gain (loss), net in the accompanying consolidated statements of operations. For 2009, the Company recorded a decrease of $3.8 million in the fair value of the Put Rights in Other gain (loss), net in the accompanying consolidated statements of operations. During 2009, $5.2 million of the Company’s ARS trading securities were called at par value. The fair values of these securities and their related Put Rights as of the transaction date were $3.6 million and $1.2 million, respectively, for 2009.
As of December 26, 2009, the remaining $9.6 million (par value) of ARS which are not subject to the UBS settlement were deemed to be other-than-temporarily impaired. See the section below titled, “Other-Than-Temporary Impairments” for further discussion.
82
Table of Contents
INFINERA CORPORATION
NOTES TO CONSOLIDATED FINANCIAL STATEMENTS—(Continued)
The following table represents the Company’s fair value hierarchy for its marketable securities measured at fair value as of December 26, 2009 and December 27, 2008:
| December 26, 2009 | ||||||||||||
| Level I | Level II | Level III | Total | |||||||||
| (In thousands) | ||||||||||||
| Money market funds |
$ | 69,691 | $ | — | $ | — | $ | 69,691 | ||||
| Certificates of deposit |
— | 720 | — | 720 | ||||||||
| Commercial paper |
— | 33,435 | — | 33,435 | ||||||||
| Corporate bonds |
— | 42,410 | — | 42,410 | ||||||||
| U.S. agency notes |
— | 31,915 | — | 31,915 | ||||||||
| ARS |
— | — | 7,671 | 7,671 | ||||||||
| Total available-for-sale investments |
$ | 69,691 | $ | 108,480 | $ | 7,671 | $ | 185,842 | ||||
| ARS—trading |
— | — | 49,911 | 49,911 | ||||||||
| Put Rights |
— | — | 10,864 | 10,864 | ||||||||
| Total investments measured at fair value |
$ | 69,691 | $ | 108,480 | $ | 68,446 | $ | 246,617 | ||||
| December 27, 2008 | ||||||||||||
| Level I | Level II | Level III | Total | |||||||||
| (In thousands) | ||||||||||||
| Money market funds |
$ | 92,257 | $ | — | $ | — | $ | 92,257 | ||||
| Commercial paper |
— | 51,529 | — | 51,529 | ||||||||
| Corporate bonds |
— | 25,444 | — | 25,444 | ||||||||
| U.S. treasuries |
41,456 | — | — | 41,456 | ||||||||
| ARS |
— | — | 7,361 | 7,361 | ||||||||
| Total available-for-sale investments |
$ | 133,713 | $ | 76,973 | $ | 7,361 | $ | 218,047 | ||||
| ARS—trading |
— | — | 48,888 | 48,888 | ||||||||
| Put Rights |
— | — | 15,866 | 15,866 | ||||||||
| Total investments measured at fair value |
$ | 133,713 | $ | 76,973 | $ | 72,115 | $ | 282,801 | ||||
The following table summarizes the change in balance sheet fair value associated with Level III financial instruments during 2009 and 2008:
| December 27, 2008 |
Total Net Gains (Losses) Included In |
Purchases (Calls), Net |
December 26, 2009 | |||||||||||||||
| Other Income (Expense), Net |
Other Comprehensive Income (Loss) |
|||||||||||||||||
| (In thousands) | ||||||||||||||||||
| ARS—available-for-sale |
$ | 7,361 | $ | (1,094 | )(1) | $ | 1,663 | (2) | $ | (259 | )(5) | $ | 7,671 | |||||
| ARS—trading securities |
48,888 | 4,585 | (3) | — | (3,562 | )(5) | 49,911 | |||||||||||
| Put Rights |
15,866 | (3,761 | )(4) | — | (1,241 | )(5) | 10,864 | |||||||||||
| Total |
$ | 72,115 | $ | (270 | ) | $ | 1,663 | $ | (5,062 | ) | $ | 68,446 | ||||||
| (1) | Amount represents the credit loss related OTTI recorded as Other income (expense), net in the accompanying consolidated statements of operations. |
| (2) | Amount includes the reversal of $2.6 million of an unrealized loss balance as of December 27, 2008 and a $1.1 million non-credit loss related to OTTI recorded in Accumulated other comprehensive loss in the accompanying consolidated balance sheets. |
| (3) | Amount represents the increase in the fair value of ARS trading securities recorded as Other gain (loss), net in the accompanying consolidated statements of operations. |
| (4) | Amount represents the decrease in the fair value of the Put Rights recorded as Other gain (loss), net in the accompanying consolidated statements of operations. |
| (5) | Amount represents the fair market value of the securities called on the transaction date and the related Put Rights. Realized gains on these calls for 2009 were immaterial. |
83
Table of Contents
INFINERA CORPORATION
NOTES TO CONSOLIDATED FINANCIAL STATEMENTS—(Continued)
| December 29, 2007 |
Total Unrealized Gains (Losses) Included In |
Payment, Purchases (Sales), Net |
Transfers In (Out), Net |
December 27, 2008 | ||||||||||||||||||
| Other Income (Expense), Net |
Other Comprehensive Income (Loss) |
|||||||||||||||||||||
| (In thousands) | ||||||||||||||||||||||
| ARS—available-for-sale |
$ | 96,150 | $ | — | $ | (2,639 | ) | $ | (20,500 | ) | $ | (65,650 | ) | $ | 7,361 | |||||||
| ARS—trading securities |
— | (16,762 | ) | — | — | 65,650 | 48,888 | |||||||||||||||
| Put Rights |
— | 15,866 | — | — | — | 15,866 | ||||||||||||||||
| Total |
$ | 96,150 | $ | (896 | ) | $ | (2,639 | ) | $ | (20,500 | ) | $ | — | $ | 72,115 | |||||||
Other-Than-Temporary Impairments
As of December 26, 2009, the Company held $9.6 million (par value) of available-for-sale ARS with two issuers, one of which is AAA rated and the other one is A3 rated. As of December 26, 2009, the Company determined that it does not intend to sell these securities and does not believe that it is more likely than not that it will be required to sell the securities before recovery of their par value. However, given that the present value of the expected cash flows for these securities was below their par value, as of December 26, 2009, a cumulative OTTI of $2.0 million, equal to the difference between the fair value and par value has occurred.
This OTTI write-down has been separated into an amount representing credit loss, which is recognized as Other gain (loss), net in the Company’s consolidated statements of operations, and an amount related to all other factors, which is recorded in Accumulated other comprehensive loss in the Company’s consolidated balance sheets. In determining if a credit loss has occurred, the Company isolated the credit loss related portion of the discount rate used to derive the fair market value of the securities and applied this to the expected cash flows in order to determine the portion of the OTTI that was credit loss related. This credit related portion of the discount rate is based on the financial condition of the issuer, rating agency credit ratings for the security and credit related yield spreads on similar securities offered by the same issuer. On this basis, credit impairment losses of $1.1 million were reclassified from Accumulated other comprehensive loss to Other income (expense), net in the Company’s consolidated statements of operations for 2009. In addition, the amortized cost basis for these securities was reduced to reflect this credit impairment loss resulting in a new cost basis for these securities of $8.6 million as of December 26, 2009.
The Company did not recognize credit impairment losses on any of its securities prior to the second quarter of 2009. A roll-forward of amortized cost, cumulative OTTI recognized in earnings and Accumulated other comprehensive loss is as follows:
| (In thousands) |
Amortized Cost |
Cumulative OTTI in Earnings |
Unrealized Gain |
OTTI Loss in Accumulated Other Comprehensive Loss |
Accumulated Other Comprehensive Loss |
|||||||||||||||||
| Balance at December 27, 2008 |
$ | 10,000 | $ | — | $ | — | $ | 2,639 | $ | 2,639 | ||||||||||||
| Unrealized gain |
— | — | (569 | ) | — | (569 | ) | |||||||||||||||
| Realized gain |
(312 | ) | (37 | ) | — | (53 | ) | (53 | ) | |||||||||||||
| Reclassification to earnings |
(1,094 | ) | 1,094 | — | (1,094 | ) | (1,094 | ) | ||||||||||||||
| Balance at December 26, 2009 |
$ | 8,594 | $ | 1,057 | $ | (569 | ) | $ | 1,492 | $ | 923 | |||||||||||
The Company believes that the credit risk associated with its available-for-sale ARS could change significantly in the future based on market conditions and continued uncertainties in the financial markets. The ARS student loan credit spread may be subject to significant volatility and it is difficult to predict future fluctuations. A 10% deterioration in the ARS student loan credit spread would result in $0.2 million of additional OTTI credit loss recognized in earnings in the Company’s consolidated statements of operations for 2009.
84
Table of Contents
INFINERA CORPORATION
NOTES TO CONSOLIDATED FINANCIAL STATEMENTS—(Continued)
4. Balance Sheet Components
Restricted Cash
The Company’s restricted cash balances are comprised of certificates of deposit, of which the majority are not FDIC insured. These amounts primarily collateralize the Company’s issuances of stand-by and commercial letters of credit.
Inventories, Net
Inventories, net is comprised of the following:
| December 26, 2009 |
December 27, 2008 | |||||
| (In thousands) | ||||||
| Raw materials |
$ | 6,870 | $ | 9,107 | ||
| Work in process |
32,054 | 37,902 | ||||
| Finished goods |
29,948 | 11,977 | ||||
| Total inventory |
$ | 68,872 | $ | 58,986 | ||
Included in finished goods inventory at December 26, 2009 and December 27, 2008 were $8.0 million and $2.4 million, respectively, of inventory at customer locations for which product acceptance had not occurred.
Property, Plant and Equipment, Net
Property, plant and equipment, net is comprised of the following:
| December 26, 2009 |
December 27, 2008 |
|||||||
| (In thousands) | ||||||||
| Computer hardware |
$ | 5,976 | $ | 5,304 | ||||
| Computer software |
5,984 | 4,083 | ||||||
| Laboratory and manufacturing equipment |
77,831 | 68,830 | ||||||
| Furniture and fixtures |
651 | 644 | ||||||
| Leasehold improvements |
16,384 | 14,203 | ||||||
| $ | 106,826 | $ | 93,064 | |||||
| Less accumulated depreciation and amortization |
(63,170 | ) | (46,244 | ) | ||||
| Property, plant and equipment, net |
$ | 43,656 | $ | 46,820 | ||||
Intangible Assets
Purchased and other intangible assets are carried at cost less accumulated amortization. Amortization expenses are recorded to the appropriate cost and expense categories. The Company expects amortization expense on purchased intangible assets to be $0.2 million for each year from 2010 through 2012 and approximately $0.1 million from 2013 through 2021, at which time purchased intangible assets will be fully amortized. Amortization of intangible assets was $0.3 million in each of the years 2009, 2008 and 2007, respectively.
Intangible assets, net are comprised of the following:
| December 26, 2009 | December 27, 2008 | |||||||||||||||||||
| Gross Carrying Amount |
Accumulated Amortization |
Net | Gross Carrying Amount |
Accumulated Amortization |
Net | |||||||||||||||
| (In thousands) | (In thousands) | |||||||||||||||||||
| Patents & developed technology |
$ | 1,628 | $ | (667 | ) | $ | 961 | $ | 1,628 | $ | (495 | ) | $ | 1,133 | ||||||
| Assembled workforce and other |
370 | (370 | ) | — | 370 | (227 | ) | 143 | ||||||||||||
| Total intangible assets |
$ | 1,998 | $ | (1,037 | ) | $ | 961 | $ | 1,998 | $ | (722 | ) | $ | 1,276 | ||||||
85
Table of Contents
INFINERA CORPORATION
NOTES TO CONSOLIDATED FINANCIAL STATEMENTS—(Continued)
Accrued Expenses
Accrued expenses are comprised of the following:
| December 26, 2009 |
December 27, 2008 | |||||
| (In thousands) | ||||||
| Loss contingency related to non-cancelable purchase commitments |
$ | 2,029 | $ | 2,257 | ||
| Taxes payable |
3,907 | 1,589 | ||||
| Restructuring liability |
644 | — | ||||
| Other accrued expenses |
7,349 | 6,503 | ||||
| Total accrued expenses |
$ | 13,929 | $ | 10,349 | ||
5. Restructuring and Other Related Costs
In July 2009, the Company announced a restructuring plan under which it closed its Maryland based semiconductor FAB and consolidated these activities into its primary FAB location in Sunnyvale, California. This consolidation of activities into one location is expected to facilitate collaboration across integration platforms in support of the Company’s next generation products. As a result, during 2009, the Company recorded $3.9 million of restructuring and other related costs including severance and related expenses, equipment and facilities-related costs, operating lease termination costs, and other exit costs. Equipment and facilities-related costs consist of increased depreciation expense related to restructured assets caused by shortening the useful life or updating the salvage value of depreciable fixed assets to coincide with the end of production under the approved restructuring plan. The Company substantially completed its restructuring actions in the fourth quarter of 2009.
The types of restructuring and other related costs recorded during 2009 were:
| Year Ended December 26, 2009 | |||||||||
| Cost of Revenue |
Operating Expenses |
Total | |||||||
| (In thousands) | |||||||||
| Severance and related expenses |
$ | 647 | $ | 154 | $ | 801 | |||
| Equipment and facilities-related costs |
2,359 | 160 | 2,519 | ||||||
| Lease termination |
— | 411 | 411 | ||||||
| Other |
32 | 89 | 121 | ||||||
| Total |
$ | 3,038 | $ | 814 | 3,852 | ||||
Included in these costs were non-cash charges of $3.0 million primarily comprised of equipment and facilities-related costs and operating lease termination costs.
The following table sets forth the activity and balance of the restructuring liability account for severance and operating lease termination costs for 2009:
| Restructuring Liability |
||||
| (In thousands) | ||||
| Balance at December 27, 2008 |
$ | — | ||
| Provision |
1,212 | |||
| Payments |
(568 | ) | ||
| Balance at December 26, 2009 |
$ | 644 | ||
6. Basic and Diluted Net Income (Loss) Per Common Share
Basic net income (loss) per common share is computed by dividing net income (loss) by the weighted average number of vested common shares outstanding during the period. Diluted net income (loss) per common share was computed using net income (loss) and the weighted average number of common shares outstanding plus potentially dilutive common shares outstanding during the period. Potentially dilutive common shares include the assumed exercise of outstanding stock options, assumed vesting of outstanding restricted stock units, assumed exercise of outstanding warrants, and assumed issuance of stock under the stock purchase plan using the treasury stock method.
86
Table of Contents
INFINERA CORPORATION
NOTES TO CONSOLIDATED FINANCIAL STATEMENTS—(Continued)
The following table sets forth the computation of net income (loss) per common share:
| Years Ended | |||||||||||
| December 26, 2009 |
December 27, 2008 |
December 29, 2007 |
|||||||||
| (In thousands, except per share amounts) | |||||||||||
| Numerator—Basic and Diluted |
|||||||||||
| Net income (loss) |
$ | (86,622 | ) | $ | 78,728 | $ | (55,342 | ) | |||
| Denominator |
|||||||||||
| Basic weighted average common shares outstanding |
95,468 | 92,427 | 50,732 | ||||||||
| Effect of dilutive securities: |
|||||||||||
| Employee equity plans |
— | 4,288 | — | ||||||||
| Warrants to purchase common stock |
— | 373 | — | ||||||||
| Diluted weighted average common shares outstanding |
$ | 95,468 | $ | 97,088 | $ | 50,732 | |||||
| Net income (loss) per common share—basic |
$ | (0.91 | ) | $ | 0.85 | $ | (1.09 | ) | |||
| Net income (loss) per common share—diluted |
$ | (0.91 | ) | $ | 0.81 | $ | (1.09 | ) | |||
The Company incurred a net loss for 2009. For the year ended December 26, 2009, potential common shares from stock awards and warrants totaling 22.2 million shares, were not included in the net loss per common share calculation, as their inclusion would have been antidilutive. For the year ended December 27, 2008, the Company excluded 6.0 million shares relating to outstanding stock options from the calculation of diluted earnings per common share because the exercise prices of these stock options were greater than the average market value of the Company’s common stock. For the year ended December 29, 2007, 0.4 million shares were excluded. These options could be included in the calculation in the future if the average market value of the Company’s common stock increases and is greater than the exercise price of these options and if the Company generates net income in the period.
7. Deferred Revenue and Deferred Inventory Costs
Deferred revenue and deferred inventory costs consist of the following:
| December 26, 2009 |
December 27, 2008 | |||||
| (In thousands) | ||||||
| Deferred product and ratable product and related support and services, current |
$ | 6,523 | $ | 6,413 | ||
| Deferred services revenue, current |
11,772 | 8,270 | ||||
| Deferred revenue—current |
$ | 18,295 | $ | 14,683 | ||
| Deferred ratable product and related support and services, non-current |
6,235 | 7,724 | ||||
| Deferred services revenue, non-current |
1,845 | — | ||||
| Deferred revenue—non-current |
8,080 | 7,724 | ||||
| Total deferred revenue |
$ | 26,375 | $ | 22,407 | ||
| Deferred inventory costs, current |
$ | 5,891 | $ | 1,744 | ||
| Deferred inventory costs, non-current |
4,438 | 2,493 | ||||
| Total deferred inventory costs |
$ | 10,329 | $ | 4,237 | ||
Deferred ratable product and related support and services revenue primarily consists of revenue on transactions where VSOE of fair value of support and other services has not been established at the time of shipment and, therefore, the entire arrangement is being recognized ratably over the longest bundled support or service period.
8. Commitments and Contingencies
Operating Leases
The Company leases facilities under non-cancelable operating lease agreements. The Company leases space in Sunnyvale, California, Allentown, Pennsylvania, Annapolis Junction, Maryland, Bangalore, India, Beijing, China, Kanata, Canada, and in the United Kingdom. These leases have varying terms, predominantly no longer than eight years each and contain renewal options and escalation clauses that range from 1 to 7 years. The Company also has contractual commitments to remove leasehold improvements and return certain properties to a specified condition when the leases terminate. Asset retirement obligations were $1.4 million and $0.8 million as of December 26, 2009 and December 27, 2008, respectively.
87
Table of Contents
INFINERA CORPORATION
NOTES TO CONSOLIDATED FINANCIAL STATEMENTS—(Continued)
The Company recognizes rent expense on a straight-line basis over the lease period and has accrued for rent expense incurred but not paid. Rent expense for all leases was $5.1 million, $4.0 million and $3.6 million for 2009, 2008, and 2007, respectively. Sublease rental income was $0.1 million for each of the years 2009, 2008 and 2007.
Future annual minimum operating lease payments at December 26, 2009 were as follows:
| 2010 | 2011 | 2012 | 2013 | 2014 | Thereafter | Total | |||||||||||||||
| (In thousands) | |||||||||||||||||||||
| Operating lease payments |
$ | 4,222 | $ | 3,047 | $ | 2,197 | $ | 872 | $ | 736 | $ | 948 | $ | 12,022 | |||||||
Purchase Commitments
The Company has service agreements with its major production suppliers, where the Company is committed to purchase certain parts. As of December 26, 2009 and December 27, 2008, these non-cancelable purchase commitments were $35.0 million and $17.3 million, respectively.
Future purchase commitments at December 26, 2009 were as follows:
| 2010 | 2011 | 2012 | 2013 | 2014 | Thereafter | Total | |||||||||||||||
| (In thousands) | |||||||||||||||||||||
| Purchase obligations |
$ | 35,021 | $ | — | $ | — | $ | — | $ | — | $ | — | $ | 35,021 | |||||||
The contractual obligation tables above exclude tax liabilities of $0.8 million related to uncertain tax positions because the Company is unable to determine the timing of settlement if any, of these future payments with a reasonably reliable estimate.
Indemnification Obligations
From time to time, the Company enters into certain types of contracts that contingently require it to indemnify parties against third-party claims. These contracts primarily relate to: (i) certain real estate leases under which the Company may be required to indemnify property owners for environmental and other liabilities, and other claims arising from the Company’s use of the applicable premises; (ii) certain agreements with the Company’s officers, directors and certain key employees, under which the Company may be required to indemnify such persons for liabilities; and (iii) certain provisions in the Company’s customer agreements that may require the Company to indemnify their customers and their affiliated parties against certain liabilities, including if the Company’s products infringe a third party’s intellectual property rights.
The terms of such indemnification obligations vary. Because the maximum obligated amounts under these agreements generally are not explicitly stated, the maximum potential amount of future payments the Company could be required to make under these indemnification agreements is generally unlimited.
To date, the Company has not incurred any material costs as a result of the indemnification obligations and has not accrued any liabilities related to such obligations in the Company’s consolidated financial statements. The Company has agreed to indemnify Level 3 in connection with the lawsuit filed by Cheetah Omni LLC on May 9, 2006 (see Note 10 of Notes to Consolidated Financial Statements for Legal Matters). The Company is contractually obligated to indemnify Level 3 for damages suffered by Level 3 to the extent the Company’s product is found to infringe the two Cheetah Omni LLC patents at issue (patent No. 6,795,605 and 7,142,347), and the Company has assumed the defense of this matter.
As permitted under Delaware law and the Company’s charter and bylaws, the Company has agreements whereby it indemnifies certain of its officers and each of its directors for certain events or occurrences while the officer or director is, or was, serving at the Company’s request in such capacity. The term of the indemnification period is for the officer’s or director’s lifetime. The maximum potential amount of future payments the Company could be required to make under these indemnification agreements is unlimited; however, the Company has a Director and Officer insurance policy that may reduce its exposure and enable it to recover all or a portion of any future amounts paid. As a result of its insurance policy coverage, the Company believes the estimated fair value of these indemnification agreements is minimal. The Company has no liabilities recorded for these agreements as of December 26, 2009 and December 27, 2008, as this liability is not reasonably estimable even though liability under these agreements is not remote.
88
Table of Contents
INFINERA CORPORATION
NOTES TO CONSOLIDATED FINANCIAL STATEMENTS—(Continued)
9. Guarantees
Product Warranties
Upon delivery of products, the Company provides for the estimated cost to repair or replace products or the related components that may be returned under the hardware warranty. In general, hardware warranty periods range from 1 to 5 years. Hardware warranties provide the purchaser with protection in the event that the product does not perform to product specifications. During the warranty period, the purchaser’s sole and exclusive remedy in the event of such defect or failure to perform is limited to the correction of the defect or failure by repair, refurbishment or replacement, at the Company’s sole option and expense. The Company estimates its hardware warranty obligations based on the Company’s historical experience of known product failure rates, use of materials to repair or replace defective products, and service delivery costs incurred in correcting product failures. In addition, from time to time, specific hardware warranty accruals may be made if unforeseen technical problems arise with specific products. Management periodically assesses the adequacy of the Company’s recorded warranty liabilities and adjusts the amounts as necessary. Changes in product warranty liability in 2009 and 2008 are summarized below.
| December 26, 2009 |
December 27, 2008 |
|||||||
| (In thousands) | ||||||||
| Beginning balance |
$ | 9,940 | $ | 9,992 | ||||
| Charges to operations |
13,981 | 10,632 | ||||||
| Utilization |
(6,542 | ) | (7,306 | ) | ||||
| Change in estimate(1) |
(6,239 | ) | (3,378 | ) | ||||
| Balance at the end of the period |
$ | 11,140 | $ | 9,940 | ||||
| (1) | The Company records hardware warranty liabilities based on the latest quality and cost information available as of that date. The favorable changes in estimate shown here are due to continued improvements in overall actual failure rates and the impact of these improvements on the Company’s estimate of expected future returns and changes in the estimated cost of replacing failed units using either repaired or new units. |
The Company’s agreements with customers, as well as its reseller agreements, generally include certain provisions for indemnifying customers and resellers and their affiliated parties against liabilities if the Company’s products infringe a third party’s intellectual property rights. To date, the Company has not incurred any material costs as a result of such indemnification obligations and has not accrued any liabilities related to such obligations in the Company’s consolidated financial statements.
Letters of Credit
The Company had $4.0 million of standby letters of credit outstanding as of December 26, 2009. These consisted of $1.5 million related to a customer proposal guarantee, $1.5 million related to a value added tax license and duty and $1.0 million related to property leases. The Company had $2.9 million of standby letters of credit outstanding as of December 27, 2008. These consisted of $1.1 million related to property leases, $1.4 million related to a value added tax license and duty and $0.4 million related to customer guarantees.
10. Legal Matters
On May 9, 2006, the Company and Level 3 were sued by Cheetah in the U.S. District Court for the Eastern District of Texas Texarkana Division for alleged infringement of patent No. 6,795,605 (the “605 Patent”), and a continuation thereof. On May 16, 2006, Cheetah filed an amended complaint, which requested an order to enjoin the sale of the Company’s DTN System and to recover all damages caused by the alleged willful infringement including any and all compensatory damages available by law, such as actual and punitive damages, attorneys’ fees, associated interest and Cheetah’s costs incurred in the lawsuit. Cheetah’s complaint does not request a specific dollar amount for these compensatory damages. The Company is contractually obligated to indemnify Level 3 for damages suffered by Level 3 to the extent its product supplied by us is found to infringe, and it has assumed the defense of this matter. On July 20, 2006, the Company and Level 3 filed an amended response denying all infringement claims under the 605 Patent and asserting that the claims of the patent are invalid and that the DTN System does not infringe the patent. On November 28, 2006, Cheetah filed a second amended complaint and added patent No. 7,142,347 (the “347 Patent”) to the lawsuit. On December 18, 2006, the Company and Level 3 filed responses to Cheetah’s second amended complaint denying all infringement claims under the 347 Patent and the Company and Level 3 asserted counterclaims against Cheetah asserting that the claims are invalid and that the DTN System does not infringe the patents.
89
Table of Contents
INFINERA CORPORATION
NOTES TO CONSOLIDATED FINANCIAL STATEMENTS—(Continued)
On January 30, 2007, Cheetah filed a third amended complaint adding additional assertions of infringement for the two patents in suit. On February 16, 2007, the Company and Level 3 filed responses to Cheetah’s third amended complaint denying all infringement claims, and the Company and Level 3 asserted counterclaims against Cheetah asserting that the claims of the patents are invalid and that the DTN System does not infringe the patents.
On March 14, 2007, the Company submitted requests to the U.S. Patent and Trademark Office for inter partes reexamination of the 605 Patent and the 347 Patent asking the U.S. Patent and Trademark Office to reexamine the patents based on prior art in order to invalidate the patents or limit the scope of each patent’s claims. On March 21, 2007, the Company and Level 3 filed a motion with the court to stay all proceedings in the lawsuit pending the reexamination of the 605 Patent and the 347 Patent.
On April 11, 2007, the Company, Level 3 and Cheetah filed a joint motion with the court, agreeing to the following: (1) to stay all proceedings in the lawsuit pending a determination by the U.S. Patent and Trademark Office as to whether it will reexamine the 605 Patent and the 347 Patent; and (2) if the U.S. Patent and Trademark Office decides to reexamine either the 605 Patent and the 347 Patent, to stay all proceedings in the lawsuit pending final resolution of the reexamination(s) by the U.S. Patent and Trademark Office. On April 12, 2007, the court granted the motion staying all proceedings in the lawsuit. On June 26, 2007, the U.S. Patent and Trademark Office also ordered reexamination of the 605 Patent. On August 1, 2007, the U.S. Patent and Trademark Office ordered reexamination of the 347 Patent. As a result, all proceedings in this lawsuit are stayed until the final resolution of these reexaminations.
In a communication the Company received from the U.S. Patent and Trademark Office dated December 4, 2009, the Company was advised that various claims in the 347 Patent reexamination have been allowed, while other claims have been rejected. The pending claims in the 605 Patent reexamination are still being considered by the U.S. Patent and Trademark Office. The Company will have an opportunity to appeal the U.S. Patent and Trademark Office’s allowance of certain claims in the 347 Patent reexamination to the Board of Patent Appeals and Interferences at the U.S. Patent and Trademark Office and intends to do so. The Company does not know when the U.S. Patent and Trademark Office reexamination process will be completed.
On January 26, 2010, Cheetah’s counsel filed a motion requesting the Court to lift the stay in order to litigate those claims of the 347 patent reexamination which the U.S. Patent and Trademark Office allowed. On February 22, 2010, the court granted Cheetah’s request for an oral hearing on its motion to lift the stay. The Company believes that Cheetah’s motion should be denied but the Company cannot predict whether the Court will grant it.
The Company believes the suit is without merit and intends to defend itself vigorously, but it is unable to predict the likelihood of an unfavorable outcome.
In addition to the matters described above, the Company is subject to various legal proceedings, claims and litigation arising in the ordinary course of business. While the outcome of these matters is currently not determinable, the Company does not expect that the ultimate costs to resolve these matters will have a material effect on its consolidated financial position, results of operations, or cash flows.
11. Stockholders’ Equity
2000 Stock Plan, 2007 Equity Incentive Plan and Employee Stock Purchase Plan
In December 2000, the Company adopted the 2000 Stock Plan (“2000 Plan”). Under the 2000 Plan, as amended, the Company has reserved an aggregate of 14.2 million shares of its common stock for issuance. As of December 26, 2009, options to purchase 4.5 million shares of the Company’s common stock were outstanding. The Company’s Board of Directors has decided not to grant any additional options or other awards under the plan following the IPO and the 2000 Plan was terminated. However, the plan will continue to govern the terms and conditions of the outstanding awards previously granted under the plan.
In February 2007, the Company’s Board of Directors adopted the 2007 Equity Incentive Plan (“2007 Plan”) and the Company’s stockholders approved the plan in May 2007. As of December 26, 2009, the Company reserved a total of 22.9 million shares of common stock for issuance of options, RSUs and PSUs to employees, non-employees and members of the Company’s board of directors, pursuant to the 2007 Plan. This plan has maximum term of 10 years from the date of adoption, or it can be terminated by the Company’s Board of Directors earlier.
Additionally, in February 2007, the Company’s Board of Directors established, and in May 2007, its stockholders approved the Company’s ESPP. The ESPP has a twenty year term, and as of December 26, 2009, the Company had authorized the issuance of approximately 3.7 million shares of common stock.
90
Table of Contents
INFINERA CORPORATION
NOTES TO CONSOLIDATED FINANCIAL STATEMENTS—(Continued)
Equity Incentive Plans
As December 26, 2009, there were a total of 3.7 million shares available for grant under the Company’s 2007 Equity Incentive Plan. The following tables summarize the Company’s stock award activity and related information for 2007, 2008 and 2009:
| Number of Options |
Weighted- Average Exercise Price Per Share |
Aggregate Intrinsic Value | |||||||
| (In thousands, except per share data) | |||||||||
| Outstanding at December 31, 2006 |
7,872 | $ | 1.77 | $ | 1,927 | ||||
| Options granted |
5,148 | $ | 11.88 | ||||||
| Options exercised |
(1,602 | ) | $ | 2.19 | $ | 17,605 | |||
| Options canceled |
(292 | ) | $ | 4.53 | |||||
| Outstanding at December 29, 2007 |
11,126 | $ | 6.31 | $ | 89,148 | ||||
| Options granted |
2,453 | $ | 12.78 | ||||||
| Options exercised |
(1,477 | ) | $ | 2.13 | $ | 14,451 | |||
| Options canceled |
(736 | ) | $ | 8.12 | |||||
| Outstanding at December 27, 2008 |
11,366 | $ | 8.13 | $ | 34,125 | ||||
| Options granted |
4,697 | $ | 7.60 | ||||||
| Options exercised |
(954 | ) | $ | 2.31 | $ | 5,514 | |||
| Options canceled |
(541 | ) | $ | 10.59 | |||||
| Outstanding at December 26, 2009 |
14,568 | $ | 8.25 | $ | 35,462 | ||||
| Vested and expected to vest |
14,343 | $ | 35,219 | ||||||
| Number of Restricted Stock Units |
Weighted- Average Grant Date Fair Value Per Share |
Aggregate Intrinsic Value | |||||||
| (In thousands, except per share data) | |||||||||
| Outstanding at December 31, 2006 |
— | $ | — | $ | — | ||||
| RSUs granted |
630 | $ | 20.07 | ||||||
| RSUs released |
— | $ | — | $ | — | ||||
| RSUs canceled |
(14 | ) | $ | 19.81 | |||||
| Outstanding at December 29, 2007 |
616 | $ | 20.07 | $ | 8,661 | ||||
| RSUs granted |
1,880 | $ | 12.01 | ||||||
| RSUs released |
(100 | ) | $ | 19.80 | $ | 865 | |||
| RSUs canceled |
(98 | ) | $ | 14.85 | |||||
| Outstanding at December 27, 2008 |
2,298 | $ | 13.71 | $ | 19,646 | ||||
| RSUs granted |
3,584 | $ | 7.45 | ||||||
| RSUs released |
(466 | ) | $ | 14.15 | $ | 3,933 | |||
| RSUs canceled |
(350 | ) | $ | 10.83 | |||||
| Outstanding at December 26, 2009 |
5,066 | $ | 9.44 | $ | 45,287 | ||||
| Expected to vest |
4,683 | $ | 41,866 | ||||||
91
Table of Contents
INFINERA CORPORATION
NOTES TO CONSOLIDATED FINANCIAL STATEMENTS—(Continued)
| Number of Performance Stock Units |
Weighted- Average Grant Date Fair Value Per Share |
Aggregate Intrinsic Value | |||||||
| (In thousands, except per share data) | |||||||||
| Outstanding at December 27, 2008 |
— | $ | — | $ | — | ||||
| PSUs granted |
3,334 | $ | 10.51 | ||||||
| PSUs released |
— | $ | — | ||||||
| PSUs canceled |
(30 | ) | $ | 10.09 | |||||
| Outstanding at December 26, 2009 |
3,304 | $ | 10.51 | $ | 29,541 | ||||
| Expected to vest |
3,119 | $ | 27,886 | ||||||
The aggregate intrinsic value of unexercised options, unreleased RSUs and PSUs is calculated as the difference between the closing price of the Company’s common stock of $8.94 at December 26, 2009 and the exercise prices of the underlying equity awards. The aggregate intrinsic value of the options which have been exercised and RSUs released is calculated as the difference between the fair market value of the common stock at the date of exercise or release and the exercise price of the underlying equity awards.
The following table summarizes information about options outstanding at December 26, 2009.
| Options Outstanding | Vested and Exercisable Options(1) | |||||||||||
| Exercise Price | Number of Shares |
Weighted- Average Remaining Contractual Life |
Weighted- Average Exercise Price |
Number of Shares |
Weighted- Average Exercise Price | |||||||
| (In thousands) | (In years) | (In thousands) | ||||||||||
| $0.76 - $1.84 |
1,272 | 4.93 | $ | 1.38 | 1,266 | $ | 1.38 | |||||
| $2.00 - $4.04 |
2,972 | 6.36 | $ | 2.35 | 2,400 | $ | 2.31 | |||||
| $6.53 - $19.14 |
9,987 | 8.14 | $ | 10.44 | 3,414 | $ | 11.45 | |||||
| $20.30 - $23.86 |
337 | 7.74 | $ | 21.54 | 185 | $ | 21.56 | |||||
| 14,568 | 7.49 | $ | 8.25 | 7,265 | $ | 6.94 | ||||||
| (1) | All options under the 2000 Plan may be exercised prior to vesting but are subject to repurchase at the original issuance price in the event the optionees’ employment is terminated prior to vesting in its entirety. |
Employee Stock Options
During 2009, the Company granted options to employees and directors to purchase an aggregate of 4.7 million shares of common stock, at a weighted-average price of $7.60 per share. During 2008, the Company granted options to employees and directors to purchase an aggregate of 2.5 million shares of common stock at a weighted average exercise price of $12.78 per share. These options have exercise prices equal to the closing market prices of the Company’s common stock on the dates these options were granted. The weighted-average remaining contractual term of options exercisable was 6.8 years as of December 26, 2009. The aggregate intrinsic value of options currently exercisable was $27.0 million as of December 26, 2009. Amortization of stock-based compensation in 2009 and 2008 was approximately $17.9 million and $14.1 million, respectively, net of estimated forfeitures.
At December 26, 2009 and December 27, 2008, the total stock-based compensation cost related to options granted to employees and directors but not yet amortized was $42.2 million and $43.2 million, respectively, net of estimated forfeitures of $1.8 million and $5.3 million, respectively. These costs will be amortized on a straight-line basis over a weighted average period of approximately 2.4 years. Total fair value of stock options granted to employees that vested during 2009 and 2008 was approximately $17.1 million and $13.2 million, respectively, based on the grant date fair value.
92
Table of Contents
INFINERA CORPORATION
NOTES TO CONSOLIDATED FINANCIAL STATEMENTS—(Continued)
The ranges of estimated values of employee stock options granted under the 2000 Stock Plan and the 2007 Equity Incentive Plan, as well as ranges of assumptions used in calculating these values during 2009, 2008 and 2007, were based on estimates as follows:
| Years Ended | ||||||
| December 26, 2009 |
December 27, 2008 |
December 29, 2007 | ||||
| Employee and Director Stock Options |
(In thousands) | |||||
| Volatility |
60% - 73% | 65% - 74% | 62% - 84% | |||
| Risk-free interest rate |
1.6% - 3.1% | 2.6% - 3.5% | 4.2% - 4.9% | |||
| Expected life |
3.8 - 6.1 years | 5.3 - 6.3 years | 4.3 - 6.3 years | |||
| Estimated fair value |
$3.86 - $5.87 | $4.70 - $9.44 | $2.12 - $17.04 | |||
Employee Stock Purchase Plan
Stock-based compensation costs related to the ESPP were approximately $3.2 million and $2.8 million for 2009 and 2008, respectively. The fair value of the ESPP shares was estimated at the date of grant using the following assumptions:
| Years Ended | ||||||
| December 26, 2009 |
December 27, 2008 |
December 29, 2007 | ||||
| Employee Stock Purchase Plan |
(In thousands) | |||||
| Volatility |
63% - 95% | 55% - 65% | 49% | |||
| Risk-free interest rate |
0.36% - 0.54% | 1.92% - 2.12% | 4.97% | |||
| Expected life |
0.5 years | 0.5 years | 0.7 years | |||
| Estimated fair value |
$2.32 - $2.83 | $3.51 - $4.42 | $4.17 | |||
Restricted Stock Units
During 2009 and 2008, the Company granted RSUs to employees to purchase an aggregate of 3.6 million and 1.9 million shares of common stock, respectively, at no cost. The Company accounted for the fair value of the RSUs using the closing market price of the Company’s common stock on the date of grant. Amortization of RSU stock-based compensation in 2009 and 2008 was approximately $10.8 million and $5.3 million, respectively. As of December 26, 2009 and December 27, 2008, total stock-based compensation cost related to RSU awards granted to employees but not yet amortized was approximately $34.7 million and $23.1 million, respectively, net of estimated forfeitures of $4.1 million and $4.8 million, respectively.
Performance Stock Units
During 2009, the Company granted 3.3 million shares of PSUs mainly to members of the Company’s board of directors and executive officers, with the shares cliff vesting at the end of a three-year or four-year period. The number of shares to be issued upon vesting of these PSUs range from 0.5 to 2.0 times the number of PSUs granted depending on the relative performance of the Company’s common stock price compared to NASDAQ over a three-year or four-year period. Amortization of stock-based compensation related to PSUs in 2009 was approximately $6.7 million. As of December 26, 2009, total stock-based compensation cost related to PSUs granted to members of the Company’s board of directors and executive officers, but not yet amortized was approximately $26.1 million, net of estimated forfeitures of $1.6 million. These costs will be amortized on a straight-line basis over a weighted-average period of 2.5 years.
| Year Ended | ||
| December 26, 2009 | ||
| Performance Stock Unit Grants |
||
| Infinera volatility |
70% - 75% | |
| NASDAQ volatility |
28% - 35% | |
| Risk-free interest rate |
1.25% - 1.71% | |
| Correlation between Infinera and NASDAQ |
0.60 - 0.62 | |
| Estimated fair value |
$9.65 - $12.46 |
93
Table of Contents
INFINERA CORPORATION
NOTES TO CONSOLIDATED FINANCIAL STATEMENTS—(Continued)
Common Stock Warrants
During 2009, warrants to purchase 0.1 million shares of common stock were net exercised. The aggregate consideration for such exercises was approximately $0.3 million. As of December 26, 2009, there were warrants to purchase 0.1 million shares of common stock outstanding with exercise prices ranging from $5.40 to $8.96 per share and a weighted average price of $6.30 per share. These warrants expire between 2011 and 2013.
Stock-based Compensation Expense
The following table summarizes the effects of stock-based compensation related to awards granted to employees, members of the Company’s board of directors and other non-employees on the Company’s consolidated balance sheets and statements of operations for 2009, 2008 and 2007:
| Years Ended | ||||||||||||
| December 26, 2009 |
December 27, 2008 |
December 29, 2007 |
||||||||||
| (In thousands) | ||||||||||||
| Stock-based compensation effects in inventory |
||||||||||||
| Beginning balance |
$ | 1,801 | $ | 2,215 | $ | 82 | ||||||
| Stock-based compensation expense added to inventory |
4,824 | 3,027 | 3,384 | |||||||||
| Stock-based compensation expenses recognized as cost of revenue |
(3,556 | ) | (3,188 | ) | (38 | ) | ||||||
| Stock-based compensation expense released from inventory to deferred inventory costs |
(190 | ) | (253 | ) | (1,213 | ) | ||||||
| Ending balance |
$ | 2,879 | $ | 1,801 | $ | 2,215 | ||||||
| Stock-based compensation effects in deferred inventory cost |
||||||||||||
| Beginning balance |
$ | 101 | $ | 947 | $ | 23 | ||||||
| Stock-based compensation expense added from inventory |
190 | 253 | 1,213 | |||||||||
| Stock-based compensation expense recognized as cost of revenue |
(90 | ) | (1,099 | ) | (289 | ) | ||||||
| Ending balance |
$ | 201 | $ | 101 | $ | 947 | ||||||
| Stock-based compensation effects in income (loss) before income taxes |
||||||||||||
| Cost of revenue |
$ | 1,861 | $ | 1,086 | $ | 410 | ||||||
| Research and development |
10,302 | 6,543 | 3,751 | |||||||||
| Sales and marketing |
6,505 | 4,440 | 1,854 | |||||||||
| General and administrative |
15,061 | 7,463 | 3,314 | |||||||||
| 33,729 | 19,532 | 9,329 | ||||||||||
| Cost of revenue—amortization from balance sheet* |
3,646 | 4,287 | 327 | |||||||||
| Total stock-based compensation expense |
$ | 37,375 | $ | 23,819 | $ | 9,656 | ||||||
| * | Represents stock-based compensation expense deferred to inventory and deferred inventory costs in prior periods and recognized in the current period. |
94
Table of Contents
INFINERA CORPORATION
NOTES TO CONSOLIDATED FINANCIAL STATEMENTS—(Continued)
12. Shares Reserved for Future Issuances
Common stock reserved for future issuance was as follows:
| December 26, 2009 | ||
| (In thousands) | ||
| Outstanding stock options and awards |
22,938 | |
| Reserved for future option and award grants |
3,743 | |
| Reserved for future ESPP |
1,637 | |
| Total common stock reserved for stock options and awards |
28,318 | |
| Warrants to purchase common stock |
124 | |
| Total common stock rserved for future issuances |
28,442 | |
13. Income Taxes
The following is a geographic breakdown of the provision for (benefit from) income taxes:
| Years Ended | ||||||||||
| December 26, 2009 |
December 27, 2008 |
December 29, 2007 | ||||||||
| (In thousands) | ||||||||||
| Current: |
||||||||||
| Federal |
$ | (1,131 | ) | $ | 551 | $ | — | |||
| State |
(1,145 | ) | 1,346 | 3 | ||||||
| Foreign |
520 | 748 | 265 | |||||||
| Total Current |
$ | (1,756 | ) | $ | 2,645 | $ | 268 | |||
| Deferred: |
||||||||||
| Federal |
$ | (76 | ) | $ | — | $ | — | |||
| State |
(39 | ) | — | — | ||||||
| Foreign |
— | 78 | — | |||||||
| Total Deferred |
$ | (115 | ) | $ | 78 | $ | — | |||
| Total Provision |
$ | (1,871 | ) | $ | 2,723 | $ | 268 | |||
Income before provision for income taxes from international operations was $2.4 million, $1.9 million and $1.5 million for the years ended December 26, 2009, December 27, 2008 and December 29, 2007, respectively.
The provisions for income taxes differ from the amount computed by applying the statutory federal income tax rates as follows:
| Years Ended | |||||||||
| December 26, 2009 |
December 27, 2008 |
December 29, 2007 |
|||||||
| Expected tax provision/(benefit) at federal statutory rate |
(35.0 | )% | 35.0 | % | (35.0 | )% | |||
| State taxes, net of federal benefit |
0.1 | 1.1 | (4.7 | ) | |||||
| Research credits |
(3.6 | ) | (2.2 | ) | (2.8 | ) | |||
| Warrant interest |
— | — | 12.6 | ||||||
| Stock-based compensation |
4.9 | 4.8 | 5.9 | ||||||
| Release in prior year taxes following IRS ruling |
(2.4 | ) | — | — | |||||
| Change in valuation allowance |
34.6 | (35.6 | ) | 25.0 | |||||
| Other |
(0.7 | ) | 0.2 | (0.5 | ) | ||||
| Effective tax rate |
(2.1 | )% | 3.3 | % | 0.5 | % | |||
95
Table of Contents
INFINERA CORPORATION
NOTES TO CONSOLIDATED FINANCIAL STATEMENTS—(Continued)
During 2009, the Company recognized a tax benefit of approximately $2.1 million for a reversal of the 2008 federal and state tax provision, following a favorable ruling by the Internal Revenue Service in the third quarter of 2009. Exclusive of this one-time benefit, the Company recognized income tax expense of approximately $0.3 million, on pre-tax book losses of $88.5 million for 2009. Exclusive of this one-time benefit, the resulting effective tax rate of 0.4% for 2009 differs from the expected statutory rate of 35% based upon unbenefited U.S. losses, non-deductible stock compensation charges and foreign taxes provided on foreign subsidiary earnings, offset by the benefit related to refundable research and development tax credits. This compares to an effective tax rate of approximately 3.3% for 2008, which reflects tax benefits arising from the release of certain valuation allowance on domestic tax attribute carryforwards which was partially offset by the impact of certain non-deductible stock compensation charges, federal alternative minimum tax and state income taxes.
During 2009, an income tax benefit of $0.3 million was allocated to the tax provision from continuing operations, related to the tax effects of items credited directly to other comprehensive income (“OCI”). Generally, the amount of tax expense or benefit allocated to continuing operations is determined without regard to the tax effects of other categories of income or loss, such as OCI. However, an exception to the general rule is provided within the intra-period tax allocations rules when there is a pre-tax loss from continuing operations and there are items charged or credited to other categories, including OCI, in the current year. The intra-period tax allocation rules related to items charged or credited directly to OCI can result in disproportionate tax effects that remain in OCI until certain events occur. As a result of items credited directly to OCI during the year, approximately $0.3 million of tax benefit was allocated to the income tax provision.
Deferred income taxes reflect the net effects of temporary differences between the carrying amounts of assets and liabilities for financial reporting purposes and the amounts used for income tax purposes. Significant components of the Company’s deferred tax assets are as follows:
| Years Ended | ||||||||
| December 26, 2009 |
December 27, 2008 |
|||||||
| (In thousands) | ||||||||
| Deferred tax assets: |
||||||||
| Net operating losses |
$ | 102,711 | $ | 74,917 | ||||
| Research credits |
18,967 | 13,640 | ||||||
| Nondeductible accruals |
18,212 | 15,230 | ||||||
| Property, plant and equipment |
4,721 | 1,426 | ||||||
| Intangible assets |
17,702 | 21,774 | ||||||
| Stock-based compensation |
12,077 | 4,758 | ||||||
| Total deferred tax assets |
$ | 174,390 | $ | 131,745 | ||||
| Valuation allowance |
(142,420 | ) | (109,637 | ) | ||||
| Net deferred tax assets |
$ | 31,970 | $ | 22,108 | ||||
| Deferred tax liabilities: |
||||||||
| Deferred revenue tax accounting method change |
$ | (32,170 | ) | $ | (22,108 | ) | ||
| Depreciation |
(78 | ) | (78 | ) | ||||
| Total deferred tax liabilities |
$ | (32,248 | ) | $ | (22,186 | ) | ||
| Net deferred tax liabilities |
$ | (278 | ) | $ | (78 | ) | ||
The realization of tax benefits of deferred tax assets is dependent upon future levels of taxable income, of an appropriate character, in the periods the items are scheduled to be deductible or taxable. Based on the available objective evidence, management believes it is more likely than not that the domestic net deferred tax assets will not be realizable. Accordingly, the Company has provided a full valuation allowance against its domestic deferred tax assets, net of deferred tax liabilities, as of December 26, 2009 and December 27, 2008. The valuation allowance for deferred tax assets as of December 26, 2009 and December 27, 2008 was $142.4 million and $109.6 million, respectively. The net change in the valuation allowance was an increase of $32.8 million and a decrease of $30.0 million for the years ended December 26, 2009 and December 27, 2008, respectively. Of the total valuation allowance at December 26, 2009, approximately $0.4 million relates to items of other comprehensive income and, if released, will be credited to such.
As of December 26, 2009, the Company has net operating loss carryforwards of approximately $285.7 million for federal tax purposes and $251.2 million for state tax purposes. If not utilized, these carryforwards will begin to expire in 2021 for federal tax purposes and 2013 for state tax purposes.
96
Table of Contents
INFINERA CORPORATION
NOTES TO CONSOLIDATED FINANCIAL STATEMENTS—(Continued)
The Company maintains net operating losses and credits generated from excess tax benefits associated with the accumulated stock award attributes in a memo account, not included in the deferred tax inventory balances. The additional tax benefit associated with these stock award attributes, of which the net operating loss amounts are included in the carryforward amounts noted above, is not recognized until the deduction reduces cash taxes payable. At December 26, 2009, the Company had unbenefited stock option deductions for federal and California tax purposes of $27.8 million and $15.8 million, respectively. When utilized, the estimated tax benefits of approximately $10.6 million will result in a credit to stockholders’ equity.
The Company has federal and California research and development credits available to reduce future income tax expense of approximately $17.1 million and $12.7 million, respectively. The federal research credits will begin to expire in the year 2021 if not utilized, while the California research credits have no expiration date.
Under the Tax Reform Act of 1986, the amount of benefit from net operating loss and tax credit carryforwards may be impaired or limited in certain circumstances. Events which cause limitations in the amount of net operating losses that the Company may utilize in any one year include, but are not limited to, a cumulative ownership change of more than 50 percent as defined, over a three-year testing period. As of December 26, 2009, the Company has determined that ownership changes have occurred that would result in limitations on the current and future utilization of its net operating loss carryforwards. However, based on the work performed, the limitations are not significant enough to impact the future utilization of the tax attributes.
The Company’s policy with respect to its undistributed foreign subsidiaries’ earnings is to consider those earnings to be indefinitely reinvested and, accordingly, no related provision for U.S. federal and state income taxes has been provided. Upon distribution of those earnings in the form of dividends or otherwise, the Company may be subject to both U.S. income taxes (subject to an adjustment for foreign tax credits) and withholding taxes in the various foreign countries. At December 26, 2009, the undistributed earnings approximated $5.5 million. The determination of the future tax consequence of the remittance of these earnings is not practicable.
The Company’s India subsidiary currently operates under a tax holiday, which will expire on March 31, 2011, based upon current statute. This holiday may be extended by Indian tax legislation. The net impact of this tax holiday was to decrease the Company’s net loss by approximately $0.4 million in fiscal 2009, resulting in no per share effect.
The aggregate changes in the balance of gross unrecognized tax benefits for 2009 and 2008 were as follows:
| December 26, 2009 |
December 27, 2008 |
December 29, 2007 | |||||||||
| (In thousands) | |||||||||||
| Beginning balance |
$ | 6,350 | $ | 6,749 | $ | 6,400 | |||||
| Tax position related to current year: |
|||||||||||
| Additions |
1,881 | 1,245 | 237 | ||||||||
| Tax positions related to prior years |
|||||||||||
| Additions |
171 | 255 | 112 | ||||||||
| Reductions |
(107 | ) | (1,899 | ) | — | ||||||
| Ending balance |
$ | 8,295 | $ | 6,350 | $ | 6,749 | |||||
At December 26, 2009, the cumulative unrecognized tax benefit was $8.3 million, of which $7.5 million was netted against deferred tax assets, which would have otherwise been subjected with a full valuation allowance. Of the total unrecognized tax benefit as of December 26, 2009, approximately $0.8 million, if recognized, would impact the Company’s effective tax rate.
The Company reduced the amount of unrecognized tax benefits during the year ended December 27, 2008, related to tax positions taken in prior years due to further analysis performed with respect to the qualitative aspects of certain tax attribute carryforwards. Since the income tax provision benefits of these tax attributes have not yet been recognized in the financial statements, there was no financial statement effect of this change in unrecognized tax benefits other than the disclosure noted in the table above.
At December 26, 2009, the Company had $0.1 million of accrued interest or penalties related to unrecognized tax benefits, of which an immaterial amount was included in the Company’s provision for income taxes for the year ended December 26, 2009. The Company’s policy is to include interest and penalties related to unrecognized tax benefits within the Company’s provision for income taxes.
97
Table of Contents
INFINERA CORPORATION
NOTES TO CONSOLIDATED FINANCIAL STATEMENTS—(Continued)
The Company is potentially subject to examination by the Internal Revenue Service and the relevant state income taxing authorities under the statute of limitations for years 2001 and forward.
During the year ended December 27, 2008, the Company received an assessment of tax resulting from an examination in India for the 2006 tax year. The Company is appealing the assessment and does not expect a significant adjustment to unrecognized tax benefits as a result of this inquiry. Fiscal years subsequent to March 2006 remain open to examination in India.
The Company does not currently believe there to be a reasonable possibility of a significant change in total unrecognized tax benefits that would occur within the next 12 months and, as such, amounts are classified as other long-term liabilities on the accompanying consolidated balance sheets as of December 26, 2009.
14. Segment Information
Operating segments are defined as components of an enterprise about which separate financial information is available that is evaluated regularly by the chief operating decision maker, or decision making group, in deciding how to allocate resources and in assessing performance. The Company’s chief operating decision maker is the Company’s chief executive officer. The Company’s chief executive officer reviews financial information presented on a consolidated basis, accompanied by information about revenue by geographic region for purposes of allocating resources and evaluating financial performance. The Company has one business activity, and there are no segment managers who are held accountable for operations, operating results and plans for levels or components below the consolidated unit level. Accordingly, the Company is considered to be in a single reporting segment and operating unit structure.
Revenue by geographic region is based on the shipping address of the customer. The following table sets forth revenue and long-lived assets by geographic region:
Revenue
| Years Ended | |||||||||
| December 26, 2009 |
December 27, 2008 |
December 29, 2007 | |||||||
| (In thousands) | |||||||||
| Americas: |
|||||||||
| United States |
$ | 212,923 | $ | 412,563 | $ | 199,893 | |||
| Other Americas |
9,837 | — | — | ||||||
| $ | 222,760 | $ | 412,563 | $ | 199,893 | ||||
| Europe, Middle East and Africa |
77,928 | 91,262 | 43,368 | ||||||
| Asia Pacific |
8,413 | 15,387 | 2,591 | ||||||
| Total revenue |
$ | 309,101 | $ | 519,212 | $ | 245,852 | |||
Property, plant and equipment, net
| December 26, 2009 |
December 27, 2008 | |||||
| (In thousands) | ||||||
| United States |
$ | 41,405 | $ | 45,489 | ||
| Asia Pacific |
2,251 | 1,331 | ||||
| Total property, plant and equipment, net |
$ | 43,656 | $ | 46,820 | ||
15. Employee Benefit Plan
In July 2001, the Company’s Board of Directors approved the adoption of a savings plan under Section 401(k) of the Internal Revenue Code. Expenses related to the Company’s 401(k) plan were immaterial for 2009, 2008 and 2007.
98
Table of Contents
INFINERA CORPORATION
NOTES TO CONSOLIDATED FINANCIAL STATEMENTS—(Continued)
16. Subsequent Event
On June 11, 2009, our stockholders approved the Option Exchange Program (the “Program”), and on January 25, 2010, we launched this one-time stock option exchange program pursuant to which eligible employees were able to exchange certain outstanding stock options under our 2007 Equity Incentive Plan with an exercise price greater than or equal to $8.16 per share and a grant date on or before January 25, 2009, for a lesser amount of new RSUs or, for new stock options for senior executives. The Program was approved by our stockholders in June 2009 and was available for employees of the Company residing in the U.S., India and U.K. who held eligible shares. The Program expired on February 22, 2010, and there were 4,926,790 shares tendered for exchange. All surrendered options were cancelled effective as of the expiration of the Program, and immediately thereafter, Infinera granted (i) new options with an exercise price of $7.61 per share to purchase an aggregate of 1,564,727 shares of Infinera common stock and (ii) RSUs of 814,017 shares of Infinera common stock.
17. Financial Information by Quarter (Unaudited)
The following table sets forth the Company’s unaudited quarterly consolidated statements of operations data for each of the eight quarters ended December 26, 2009. The data has been prepared on the same basis as the audited consolidated financial statements and related notes included in this report and you should read the following table in conjunction with such financial statements. The table includes all necessary adjustments, consisting only of normal recurring adjustments that the Company considers necessary for a fair presentation of this data. The results of historical periods are not necessarily indicative of the results of operations for a full year or any future period.
| For the Three Months Ended (Unaudited) | |||||||||||||||||||||||||||||
| 2009 | 2008 | ||||||||||||||||||||||||||||
| Dec. 26 | Sep. 26 | Jun. 27 | Mar. 28 | Dec. 27 | Sep. 27 | Jun. 28 | Mar. 29 | ||||||||||||||||||||||
| (In thousands, except per share data) | |||||||||||||||||||||||||||||
| Revenue: |
|||||||||||||||||||||||||||||
| Product |
$ | 82,100 | $ | 73,690 | $ | 61,074 | $ | 59,148 | $ | 80,045 | $ | 76,130 | $ | 86,505 | $ | 64,128 | |||||||||||||
| Ratable product and related support and services |
1,025 | 892 | 845 | 1,469 | 12,243 | 39,495 | 69,581 | 72,386 | |||||||||||||||||||||
| Services |
7,056 | 8,826 | 7,013 | 5,963 | 7,056 | 4,881 | 5,023 | 1,739 | |||||||||||||||||||||
| Total revenue |
90,181 | 83,408 | 68,932 | 66,580 | 99,344 | 120,506 | 161,109 | 138,253 | |||||||||||||||||||||
| Cost of revenue: |
|||||||||||||||||||||||||||||
| Cost of product |
52,686 | 47,473 | 45,699 | 43,865 | 52,306 | 45,139 | 47,124 | 39,665 | |||||||||||||||||||||
| Cost of ratable product and related support and services |
399 | 444 | 358 | 730 | 5,088 | 18,537 | 32,169 | 35,831 | |||||||||||||||||||||
| Cost of services |
2,627 | 5,049 | 2,617 | 2,015 | 3,984 | 2,592 | 2,032 | 1,190 | |||||||||||||||||||||
| Restructuring and other costs related to cost of revenue |
302 | 2,736 | — | — | — | — | — | — | |||||||||||||||||||||
| Total cost of revenue |
56,014 | 55,702 | 48,674 | 46,610 | 61,378 | 66,268 | 81,325 | 76,686 | |||||||||||||||||||||
| Gross profit |
34,167 | 27,706 | 20,258 | 19,970 | 37,966 | 54,238 | 79,784 | 61,567 | |||||||||||||||||||||
| Operating expenses |
53,793 | 46,949 | 47,736 | 43,284 | 44,930 | 41,013 | 37,186 | 36,993 | |||||||||||||||||||||
| Income (loss) from operations |
(19,626 | ) | (19,243 | ) | (27,478 | ) | (23,314 | ) | (6,964 | ) | 13,225 | 42,598 | 24,574 | ||||||||||||||||
| Other income (expense), net |
444 | 1,150 | 470 | (896 | ) | (428 | ) | 1,712 | 2,554 | 4,180 | |||||||||||||||||||
| Income (loss) before income taxes |
(19,182 | ) | (18,093 | ) | (27,008 | ) | (24,210 | ) | (7,392 | ) | 14,937 | 45,152 | 28,754 | ||||||||||||||||
| Provision for (benefit from) income taxes |
(531 | ) | (1,561 | ) | 103 | 118 | (704 | ) | — | 2,267 | 1,160 | ||||||||||||||||||
| Net income (loss) |
(18,651 | ) | (16,532 | ) | (27,111 | ) | (24,328 | ) | (6,688 | ) | 14,937 | 42,885 | 27,594 | ||||||||||||||||
| Net income (loss) per common share |
|||||||||||||||||||||||||||||
| Basic |
$ | (0.19 | ) | $ | (0.17 | ) | $ | (0.28 | ) | $ | (0.26 | ) | $ | (0.07 | ) | $ | 0.16 | $ | 0.47 | $ | 0.30 | ||||||||
| Diluted |
$ | (0.19 | ) | $ | (0.17 | ) | $ | (0.28 | ) | $ | (0.26 | ) | $ | (0.07 | ) | $ | 0.15 | $ | 0.44 | $ | 0.29 | ||||||||
The Company’s operating results may fluctuate due to a variety of factors, many of which are outside of the Company’s control. As a result, comparing the Company’s operating results on a period-to-period basis may not be meaningful. You should not rely on the Company’s past results as an indication of its future performance.
99
Table of Contents
INFINERA CORPORATION
NOTES TO CONSOLIDATED FINANCIAL STATEMENTS—(Continued)
Quarterly historical revenue trends are not a meaningful trend indicator as they were directly impacted by the establishment of VSOE of fair value for the Company’s services offerings. Prior to the attainment of VSOE of fair value on software subscription services in the first quarter of 2008 and for training and installation and deployment services in the second quarter of 2008 the Company recognized the majority of its revenue on a ratable basis. In periods subsequent to the attainment of VSOE, an increased portion of current period shipments were recognized as revenue at the time of acceptance and there was a significant reduction in the deferred revenue balance. This resulted in significantly increased levels of revenue being recognized in 2008 however, the Company’s levels for 2009 more closely approximated the revenue generated on the underlying invoiced shipments.
In October 2008, the Company elected to participate in a rights offering by UBS, one of the Company’s brokers, which provides the Company with the Put Rights to sell UBS $60.8 million of the Company’s ARS portfolio at par value as of December 26, 2009, at any time during a two-year sale period beginning June 30, 2010. As of December 26, 2009, $60.8 million (par value) of UBS ARS were recorded at fair value of $49.9 million with an unrealized loss of $10.9 million.
The Company recorded $4.6 million of unrealized holding gains related to ARS trading securities in 2009 in Other gain (loss), net. For 2009, the Company recorded a decrease of $3.8 million in the fair value of the Put Rights in Other gain (loss), net.
In July 2009, the Company announced a restructuring plan under which it closed its Maryland based semiconductor fabrication plant (“FAB”) and consolidated these activities into its primary FAB location in Sunnyvale, California. This consolidation of activities into one location was expected to facilitate collaboration across integration platforms in support of the Company’s next generation products. As a result, during the third and fourth quarters of 2009, the Company recorded $3.4 million and $0.5 million, respectively, of restructuring and other related costs including severance and related expenses, equipment and facilities-related costs, operating lease termination costs, and other exit costs. Equipment and facilities-related costs primarily consist of increased depreciation expense related to restructured assets caused by shortening the useful life or updating the salvage value of depreciable fixed assets to coincide with the end of production under the approved restructuring plan.
100
Table of Contents
| ITEM 9. | CHANGES IN AND DISAGREEMENTS WITH ACCOUNTANTS ON ACCOUNTING AND FINANCIAL DISCLOSURE |
None.
| ITEM 9A. CONTROLS | AND PROCEDURES |
Attached as exhibits to this Form 10-K are certifications of Infinera’s Chief Executive Officer (“CEO”) and Chief Financial Officer (“CFO”), which are required in accordance with Rule 13a-14 of the Securities Exchange Act of 1934, as amended (“the Exchange Act”). This “Controls and Procedures” section includes information concerning the controls and controls evaluation referred to in the certifications.
Evaluation of Disclosure Controls and Procedures
As of December 26, 2009, the end of the period covered by this Annual Report on Form 10-K, an evaluation was performed by management, with the participation of our CEO and our CFO, of the effectiveness of our disclosure controls and procedures (as defined in Rules 13a-15(e) and 15d-15(e) under the Exchange Act). Disclosure controls and procedures are controls and procedures that are designed to ensure that information required to be disclosed in our reports filed or submitted under the 1934 Act is recorded, processed, summarized and reported within the time periods specified in the SEC’s rules and forms.
Based on this evaluation, our CEO and CFO have concluded that our disclosure controls and procedures (as defined in Rules 13a-15(e) and 15d-15(e) under the Exchange Act ), were effective as of December 26, 2009 to provide reasonable assurance that information required to be disclosed by us in reports that we file or submit under the Exchange Act is recorded, processed, summarized, and reported within the time periods specified in Securities and Exchange Committee rules and forms, and is accumulated and communicated to management, including our CEO and CFO, as appropriate to allow timely decisions regarding required disclosure.
Changes in Internal Control Over Financial Reporting
There were no changes to our internal control over financial reporting (as defined in Rules 13a-15(f) and 15d-15(f) under the Exchange Act) that occurred during our most recent fiscal quarter that have materially affected, or are reasonably likely to materially affect, our internal control over financial reporting.
Management’s Report on Internal Control Over Financial Reporting
Our management, including our CEO and CFO, is responsible for establishing and maintaining adequate internal control over financial reporting (as defined in Rules 13a-15(f) and 15d-15(f) under the Exchange Act) to provide reasonable assurance regarding the reliability of our financial reporting and the preparation of financial statements for external purposes in accordance with U.S. generally accepted accounting principles.
Management assessed the effectiveness of our internal control over financial reporting as of December 26, 2009, the end of our fiscal year. Management based its assessment on criteria established in Internal Control—Integrated Framework issued by the Committee of Sponsoring Organizations of the Treadway Commission (“COSO”). Management’s assessment included evaluation of elements such as the design and operating effectiveness of key financial reporting controls, process documentation, accounting policies, and our overall control environment.
Based on this assessment, management has concluded that our internal control over financial reporting was effective as of the end of the fiscal year to provide reasonable assurance regarding the reliability of financial reporting and the preparation of financial statements for external reporting purposes in accordance with U.S. generally accepted accounting principles.
The attestation report concerning the effectiveness of our internal control over financial reporting as of December 26, 2009, issued by Ernst & Young, LLP, Independent Registered Public Accounting Firm, appears in Part II, Item 8 of this Annual Report on Form 10-K.
101
Table of Contents
Inherent Limitations of Internal Controls
Our management, including our CEO and CFO, does not expect that our disclosure controls and procedures or our internal controls will prevent all error and all fraud. A control system, no matter how well conceived and operated, can provide only reasonable, not absolute, assurance that the objectives of the control system are met. Because of the inherent limitations in all control systems, no evaluation of controls can provide absolute assurance that all control issues and instances of fraud, if any, within us have been detected. These inherent limitations include the realities that judgments in decision-making can be faulty, and that breakdowns can occur because of a simple error or mistake. Additionally, controls can be circumvented by the individual acts of some persons, by collusion of two or more people, or by management override of the control. The design of any system of controls also is based in part upon certain assumptions about the likelihood of future events, and there can be no assurance that any design will succeed in achieving its stated goals under all potential future conditions. Over time, controls may become inadequate because of changes in conditions, or the degree of compliance with the policies or procedures may deteriorate. Because of the inherent limitations in a cost-effective control system, misstatements due to error or fraud may occur and not be detected.
None.
102
Table of Contents
| ITEM 10. | DIRECTORS, EXECUTIVE OFFICERS AND CORPORATE GOVERNANCE |
The information required by this item with respect to Infinera’s directors and executive officers is incorporated by reference to the information set forth in Infinera’s proxy statement for the 2010 Annual Meeting of Stockholders to be filed with the Commission within 120 days after the end of Infinera’s fiscal year ended December 26, 2009. For information pertaining to executive offers and directors of Infinera, refer to the “Executive Officers and Directors” section of Part 1, Item 1 of this Annual Report on Form 10-K.
As part of our system of corporate governance, our board of directors has adopted a code of business conduct and ethics. The code applies to all of our employees, officers (including our principal executive officer, principal financial officer, principal accounting officer or controller, or persons performing similar functions), agents and representatives, including our independent directors and consultants, who are not employees of Infinera, with regard to their Infinera-related activities. The full text of our code of business conduct and ethics is posted on our web site at http://www.infinera.com. We intend to disclose future amendments to certain provisions of our code of business conduct and ethics, or waivers of such provisions, applicable to any principal executive officer, principal financial officer, principal accounting officer or controller, or persons performing similar functions or our directors on our web site identified above. The inclusion of our web site address in this report does not include or incorporate by reference the information on our web site into this report.
| ITEM 11. | EXECUTIVE COMPENSATION |
Information responsive to this item is incorporated herein by reference to Infinera’s definitive proxy statement with respect to our 2010 Annual Meeting of Stockholders to be filed with the SEC within 120 days after the end of the fiscal year covered by this Annual Report on Form 10-K.
| ITEM 12. | SECURITY OWNERSHIP OF CERTAIN BENEFICIAL OWNERS AND MANAGEMENT AND RELATED STOCKHOLDER MATTERS |
Information responsive to this item is incorporated herein by reference to Infinera’s definitive proxy statement with respect to our 2010 Annual Meeting of Stockholders to be filed with the SEC within 120 days after the end of the fiscal year covered by this Annual Report on Form 10-K.
| ITEM 13. | CERTAIN RELATIONSHIPS AND RELATED TRANSACTIONS, AND DIRECTOR INDEPENDENCE |
Information responsive to this item is incorporated herein by reference to Infinera’s definitive proxy statement with respect to our 2010 Annual Meeting of Stockholders to be filed with the SEC within 120 days after the end of the fiscal year covered by this Annual Report on Form 10-K.
| ITEM 14. | PRINCIPAL ACCOUNTING FEES AND SERVICES |
Information responsive to this item is incorporated herein by reference to Infinera’s definitive proxy statement with respect to our 2010 Annual Meeting of Stockholders to be filed with the SEC within 120 days after the end of the fiscal year covered by this Annual Report on Form 10-K.
103
Table of Contents
| ITEM 15. | EXHIBITS, FINANCIAL STATEMENT SCHEDULES |
(a)(1) Consolidated Financial Statements
This Annual Report on Form 10-K contains the following financial statements which appear under Part II, Item 8 of this Form 10-K on the pages noted below:
| Page | ||
| Reports of Ernst & Young LLP, Independent Registered Public Accounting Firm |
61 | |
| 63 | ||
| 64 | ||
| Consolidated Statements of Convertible Preferred Stock and Stockholders’ Equity (Deficit) |
65 | |
| 67 | ||
| 69 |
(a)(2) Financial Statement Schedule
Schedule II: Valuation and Qualifying Accounts
| Years Ended | |||||||||||
| December 26, 2009 |
December 27, 2008 |
December 29, 2007 | |||||||||
| (In thousands) | |||||||||||
| Deferred tax asset, valuation allowance |
|||||||||||
| Beginning balance |
$ | 109,637 | $ | 139,639 | $ | 128,555 | |||||
| Additions |
32,783 | — | 11,084 | ||||||||
| Reductions |
— | (30,002 | ) | — | |||||||
| Ending balance |
$ | 142,420 | $ | 109,637 | $ | 139,639 | |||||
| Allowance for doubtful accounts |
|||||||||||
| Beginning balance |
$ | 1,700 | $ | — | $ | — | |||||
| Additions |
— | 1,700 | — | ||||||||
| Reductions |
(1,700 | ) | — | — | |||||||
| Ending balance |
$ | — | $ | 1,700 | $ | — | |||||
Schedules not listed above have been omitted because the information required to be set forth therein is not applicable or is shown in the consolidated financial statements or notes thereto.
(a)(3) Exhibits.
See Index to Exhibits. The Exhibits listed in the accompanying Index to Exhibits are filed or incorporated by reference as part of this Annual Report on Form 10-K.
104
Table of Contents
INDEX TO EXHIBITS
| Exhibit No. |
Description | |
| 3.1 | Amended and Restated Certificate of Incorporation of the Registrant.(1) | |
| 3.2 | Amended and Restated Bylaws.(2) | |
| 4.1 | Form of Common Stock certificate of the Registrant.(3) | |
| 10.1* | Form of Indemnification Agreement between Registrant and each of its directors and executive officers.(4) | |
| 10.2* | 2000 Stock Plan, as amended, and forms of stock option agreements thereunder.(4) | |
| 10.3* | 2007 Equity Incentive Plan and forms of stock option agreements thereunder.(4) | |
| 10.4* | 2007 Employee Stock Purchase Plan.(4) | |
| 10.5* | 2007 Executive Bonus Plan.(5) | |
| 10.6* | Form of Amended and Restated Change of Control Severance Agreement for Registrant’s executive officers.(6) | |
| 10.7* | Form of Amended and Restated Change of Control Severance Agreement for Registrant’s other officers, as amended.(7) | |
| 10.8 | Lease Agreement between Legacy Partners I Sunnyvale, LLC and Registrant dated December 20, 2005, as amended on February 2, 2006 for Bordeaux Drive, Sunnyvale, CA premises.(4) | |
| 10.9 | Lease Agreement between SCM Properties, LLC and Registrant, dated July 17, 2006, as amended on November 2, 2006 for Java Drive, Sunnyvale, CA premises.(4) | |
| 10.10 | Amendment 2 to Lease Agreement with SCM Properties, LLC dated May 29, 2007.(8) | |
| 10.11 | Addendum No. 1 to Amendment 2 to Lease Agreement with SCM Properties, LLC dated May 29, 2007.(8) | |
| 10.12* | Offer Letter Agreement by and between Registrant and Duston M. Williams dated May 1, 2006.(4) | |
| 10.13* | Offer Letter Agreement by and between Registrant and Michael O. McCarthy III dated January 16, 2003.(3) | |
| 10.14* | Form of Restricted Stock Unit Agreement under the 2007 Equity Incentive Plan of Registrant.(7) | |
| 10.15* | Form of Restricted Stock Unit Agreement for International Based Employees under the 2007 Equity Incentive Plan of Registrant.(7) | |
105
Table of Contents
| Exhibit No. |
Description | |
| 10.16* | Form of Restricted Phantom Unit Agreement for China Based Employees under the 2007 Equity Incentive Plan of Registrant.(9) | |
| 10.17* | Form of Annual Performance Share Agreement for Eligible Employees under the 2007 Equity Incentive Plan of Registrant.(9) | |
| 10.18* | Form of Annual Performance Share Agreement for the Board of Directors under the 2007 Equity Incentive Plan of Registrant.(9) | |
| 10.19* | Form of 3-Year Retention Performance Share Agreement for Eligible Employees under the 2007 Equity Incentive Plan of Registrant.(9) | |
| 10.20* | Form of 4-Year Retention Performance Share Agreement for Eligible Employees under the 2007 Equity Incentive Plan of Registrant.(9) | |
| 10.21* | Consulting Agreement by and between Registrant and Duston M. Williams dated January 26, 2010. (10) | |
| 14.1 | Code of Ethics.(11) | |
| 21.1 | Subsidiaries of Registrant. | |
| 23.1 | Consent of Ernst & Young, LLP, Independent Registered Public Accounting Firm. | |
| 31.1 | Certification of Chief Executive Officer pursuant to Rule 13a-14(a) and Rule 15d-14(a) of the Securities Exchange Act of 1934, as amended, as adopted pursuant to Section 302 of the Sarbanes-Oxley Act of 2002. | |
| 31.2 | Certification of Chief Financial Officer pursuant to Rule 13a-14(a) and Rule 15d-14(a) of the Securities Exchange Act of 1934, as amended, as adopted pursuant to Section 302 of the Sarbanes-Oxley Act of 2002. | |
| 32.1 | Certification of Chief Executive Officer pursuant to 18 U.S.C. Section 1350, as adopted pursuant to Section 906 of the Sarbanes-Oxley Act of 2002. | |
| 32.2 | Certification of Chief Financial Officer pursuant to 18 U.S.C. Section 1350, as adopted pursuant to Section 906 of the Sarbanes-Oxley Act of 2002. | |
| * | Management contracts or compensation plans or arrangements in which directors or executive officers are eligible to participate. |
| (1) | Incorporated by reference to exhibit filed with Registrant’s Current Report on Form 8-K (No. 001-33486) filed with the SEC on June 12, 2007. |
| (2) | Incorporated by reference to exhibit filed with Registrant’s Current Report on Form 8-K (No. 001-33486) filed with the SEC on February 17, 2009. |
| (3) | Incorporated by reference to exhibit filed with Registrant’s Form S-1/A (No. 333-140876), filed with the SEC on April 27, 2007. |
| (4) | Incorporated by reference to exhibit filed with Registrant’s Form S-1 (No. 333-140876), filed with the SEC on February 26, 2007. |
| (5) | Incorporated by reference to exhibit filed with Registrant’s Form S-1/A (No. 333-140876), filed with the SEC on April 4, 2007. |
| (6) | Incorporated by reference to exhibit filed with Registrant’s Current Report on Form 8-K (No. 001-33486) filed with the SEC on November 24, 2009. |
| (7) | Incorporated by reference to exhibit filed with Registrant’s Quarterly Report on Form 10-Q (No. 001-33486), filed with the SEC on July 25, 2008. |
| (8) | Incorporated by reference to exhibit filed with Registrant’s Quarterly Report on Form 10-Q (No. 001-33486), filed with the SEC on August 1, 2007. |
106
Table of Contents
| (9) | Incorporated by reference to exhibit filed with Registrant’s Quarterly Report on Form 10-Q (No. 001-33486), filed with the SEC on May 7, 2009. |
| (10) | Incorporated by reference to exhibit filed with Registrant’s Current Report on Form 8-K (No. 001-33486), filed with the SEC on January 26, 2010. |
| (11) | Incorporated by reference to exhibit filed with Registrant’s Annual Report on Form 10-K (No. 001-33486), filed with the SEC on February 19, 2008. |
107
Table of Contents
SIGNATURES
Pursuant to the requirements of Section 13 or 15(d) of the Securities Exchange Act of 1934, the Registrant has duly caused this report to be signed on its behalf by the undersigned, thereunto duly authorized.
Dated: March 1, 2010
| Infinera Corporation Registrant | ||
| By: | /S/ DUSTON M. WILLIAMS | |
| Duston M. Williams Chief Financial Officer Principal Financial and Accounting Officer | ||
Pursuant to the requirements of the Securities Exchange Act of 1934, this report has been signed below by the following persons on behalf of the Registrant and in the capacities and on the dates indicated.
| /S/ THOMAS J. FALLON | /S/ KENNETH A. GOLDMAN | |||
| Thomas J. Fallon Director, President, Chief Executive Officer and Principal Executive Officer March 1, 2010 |
Kenneth A. Goldman Director March 1, 2010 | |||
| /S/ DUSTON M. WILLIAMS | /S/ JAGDEEP SINGH | |||
| Duston M. Williams Chief Financial Officer, Principal Financial and Accounting Officer March 1, 2010 |
Jagdeep Singh Executive Chairman March 1, 2010 | |||
| /S/ REED E. HUNDT | /S/ KAMBIZ Y. HOOSHMAND | |||
| Reed E. Hundt Director March 1, 2010 |
Kambiz Y. Hooshmand Director March 1, 2010 | |||
| /S/ PHILIP KOEN | /S/ DAN MAYDAN, PH.D. | |||
| Philip Koen Director March 1, 2010 |
Dan Maydan, Ph.D. Director March 1, 2010 | |||
| /S/ CARL REDFIELD | ||||
| Carl Redfield Director March 1, 2010 |
||||
108