Attached files
Table of Contents
UNITED STATES
SECURITIES AND EXCHANGE COMMISSION
WASHINGTON, D.C. 20549
FORM 10-K
| x | ANNUAL REPORT PURSUANT TO SECTION 13 or 15(d) OF THE SECURITIES EXCHANGE ACT OF 1934 |
For the fiscal year ended December 31, 2009
OR
| ¨ | TRANSITION REPORT PURSUANT TO SECTION 13 or 15(d) OF THE SECURITIES EXCHANGE ACT OF 1934 |
For the transition period from to
Commission file number 1-10890
HORACE MANN EDUCATORS CORPORATION
(Exact name of registrant as specified in its charter)
| Delaware | 37-0911756 | |
| (State or other jurisdiction of incorporation or organization) |
(I.R.S. Employer Identification No.) |
1 Horace Mann Plaza, Springfield, Illinois 62715-0001
(Address of principal executive offices, including Zip Code)
Registrant’s Telephone Number, Including Area Code: 217-789-2500
Securities Registered Pursuant to Section 12(b) of the Act:
| Title of each class |
Name of each exchange on which registered | |
| Common Stock, par value $0.001 per share | New York Stock Exchange |
Securities Registered Pursuant to Section 12(g) of the Act: None
Indicate by check mark if the registrant is a well-known seasoned issuer, as defined in Rule 405 of the Securities Act. Yes ¨ No x
Indicate by check mark if the registrant is not required to file reports pursuant to Section 13 or Section 15(d) of the Exchange Act. Yes ¨ No x
Indicate by check mark whether the registrant (1) has filed all reports required to be filed by Section 13 or 15(d) of the Securities Exchange Act of 1934 during the preceding 12 months (or for such shorter period that the registrant was required to file such reports), and (2) has been subject to such filing requirements for the past 90 days. Yes x No ¨
Indicate by check mark whether the registrant has submitted electronically and posted on its corporate Website, if any, every Interactive Data File required to be submitted and posted pursuant to Rule 405 of Regulation S-T during the preceding 12 months (or for such shorter period that the registrant was required to submit and post such files). Yes ¨ No ¨
Indicate by check mark if disclosure of delinquent filers pursuant to Item 405 of Regulation S-K is not contained herein, and will not be contained, to the best of registrant’s knowledge, in definitive proxy or information statements incorporated by reference in Part III of this Form 10-K or any amendment to this Form 10-K. ¨
Indicate by check mark the registrant’s filer status, as such terms are defined in Rule 12b-2 of the Exchange Act.
| Large accelerated filer | ¨ | Accelerated filer | x | |||
| Non-accelerated filer | ¨ | Smaller reporting company | ¨ | |||
Indicate by check mark whether the registrant is a shell company, as defined in Rule 12b-2 of the Act. Yes ¨ No x
The aggregate market value of the registrant’s Common Stock held by non-affiliates of the registrant based on the closing price of the registrant’s Common Stock on the New York Stock Exchange and the shares outstanding on June 30, 2009, was $390.6 million.
As of February 16, 2010, 39,213,771 shares of the registrant’s Common Stock, par value $0.001 per share, were outstanding, net of 21,813,196 shares of treasury stock.
DOCUMENTS INCORPORATED BY REFERENCE
Certain portions of the registrant’s Proxy Statement for the 2010 Annual Meeting of Shareholders are incorporated by reference into Part II Item 5 and Part III Items 10, 11, 12, 13 and 14 of Form 10-K as specified in those Items and will be filed with the Securities and Exchange Commission within 120 days after December 31, 2009.
Table of Contents
HORACE MANN EDUCATORS CORPORATION
FORM 10-K
YEAR ENDED DECEMBER 31, 2009
INDEX
| Page | ||||||
| Part | Item | |||||
| I | 1. | 1 | ||||
| 1 | ||||||
| 1 | ||||||
| 2 | ||||||
| 3 | ||||||
| 4 | ||||||
| 7 | ||||||
| 15 | ||||||
| 18 | ||||||
| 19 | ||||||
| 20 | ||||||
| 23 | ||||||
| 23 | ||||||
| 26 | ||||||
| 1A. | 26 | |||||
| 1B. | 40 | |||||
| 2. | 40 | |||||
| 3. | 40 | |||||
| 4. | 40 | |||||
| II | 5. | 40 | ||||
| 6. | 42 | |||||
| 7. | Management’s Discussion and Analysis of Financial Condition and Results of Operations |
42 | ||||
| 7A. | 42 | |||||
| 8. | 42 | |||||
| 9. | Changes in and Disagreements with Accountants on Accounting and Financial Disclosure |
42 | ||||
| 9A. | 42 | |||||
| 9B. | 44 | |||||
| III | 10. | 44 | ||||
| 11. | 44 | |||||
| 12. | Security Ownership of Certain Beneficial Owners and Management, and Related Stockholder Matters |
44 | ||||
| 13. | Certain Relationships and Related Transactions, and Director Independence |
44 | ||||
| 14. | 44 | |||||
| IV | 15. | 45 | ||||
| 52 | ||||||
| F-1 | ||||||
Table of Contents
| ITEM 1. | Business |
It is important to note that the Company’s actual results could differ materially from those projected in forward-looking statements. Additional information concerning factors that could cause actual results to differ materially from those in the forward-looking statements is contained in “Item 1A. Risk Factors” and in “Management’s Discussion and Analysis of Financial Condition and Results of Operations — Forward-looking Information”.
Overview and Available Information
Horace Mann Educators Corporation (“HMEC”; and together with its subsidiaries, the “Company” or “Horace Mann”) is an insurance holding company incorporated in Delaware. Through its subsidiaries, HMEC markets and underwrites personal lines of property and casualty (primarily private passenger automobile and homeowners) insurance, retirement annuities (primarily tax-qualified products) and life insurance in the United States of America (“U.S.”). HMEC’s principal insurance subsidiaries are Horace Mann Life Insurance Company (“HMLIC”), Horace Mann Insurance Company (“HMIC”) and Teachers Insurance Company (“TIC”), each of which is an Illinois corporation; Horace Mann Property & Casualty Insurance Company (“HMPCIC”), a California corporation; and Horace Mann Lloyds (“HM Lloyds”), an insurance company domiciled in Texas.
The Company markets its products primarily to K-12 teachers, administrators and other employees of public schools and their families. The Company’s nearly one million customers typically have moderate annual incomes, with many belonging to two-income households. Their financial planning tends to focus on retirement, security, savings and primary insurance needs. Management believes that Horace Mann is the largest national multiline insurance company focused on the nation’s educators as its primary market.
Horace Mann markets and services its products primarily through a dedicated sales force of full-time agents trained to sell the Company’s multiline products. These agents sell Horace Mann’s products and limited additional third-party vendor products authorized by the Company. Some of these agents are former educators or individuals with close ties to the educational community who utilize their contacts within, and knowledge of, the target market. This dedicated agent sales force is supplemented by an independent agent distribution channel for the Company’s annuity products.
The Company’s insurance premiums written and contract deposits for the year ended December 31, 2009 were $1.0 billion and net income was $73.5 million. The Company’s total assets were $6.3 billion at December 31, 2009. The Company’s investment portfolio had an aggregate fair value of $4.6 billion at December 31, 2009. Investments consist principally of investment grade, publicly traded fixed income securities.
1
Table of Contents
The Company conducts and manages its business through four segments. The three operating segments, representing the major lines of insurance business, are: property and casualty insurance, annuity products, and life insurance. The Company does not allocate the impact of corporate level transactions to the insurance segments, consistent with the basis for management’s evaluation of the results of those segments, but classifies those items in the fourth segment, corporate and other. The property and casualty segment accounted for 55% of the Company’s insurance premiums written and contract deposits for the year ended December 31, 2009; the annuity and life insurance segments together accounted for 45% of insurance premiums written and contract deposits for the year ended December 31, 2009 (35% and 10%, respectively).
The Company is one of the largest participants in the 403(b) tax-qualified annuity market, measured by 403(b) net written premium on a statutory accounting basis. The Company’s 403(b) tax-qualified annuities are voluntarily purchased by individuals employed by public school systems or other tax-exempt organizations through the employee benefit plans of those entities. The Company has approved 403(b) payroll reduction capabilities in approximately one-third of the 15,400 school districts in the U.S.
The Company’s annual report on Form 10-K, quarterly reports on Form 10-Q, current reports on Form 8-K, proxy statements, and all amendments to those reports are available free of charge through the Investor Relations section of the Company’s Internet Web site, www.horacemann.com, as soon as reasonably practicable after such reports are electronically filed with, or furnished to, the Securities and Exchange Commission (“SEC”). The EDGAR filings of such reports are also available at the SEC’s Web site, www.sec.gov.
Also available in the Investor Relations section of the Company’s Web site are its corporate governance principles, code of conduct and code of ethics as well as the charters of the Board’s Audit Committee, Compensation Committee, Executive Committee, Investment and Finance Committee, and Nominating and Governance Committee.
Louis G. Lower II, Chief Executive Officer of HMEC, timely submitted the Annual Section 12(a) CEO Certification to the New York Stock Exchange (“NYSE”) on June 25, 2009 without any qualifications. The Company filed with the SEC, as exhibits to the Annual Report on Form 10-K for the year ended December 31, 2008, the CEO and CFO certifications required under Section 302 of the Sarbanes-Oxley Act.
The Company’s business was founded in Springfield, Illinois in 1945 by two school teachers to sell automobile insurance to other teachers within the State of Illinois. The Company expanded its business to other states and broadened its product line to include life insurance in 1949, 403(b) tax-qualified retirement annuities in 1961 and homeowners insurance in 1965. In November 1991, HMEC completed an initial public offering of its common stock (the “IPO”). The common stock is traded on the New York Stock Exchange under the symbol “HMN”.
2
Table of Contents
SELECTED HISTORICAL CONSOLIDATED FINANCIAL DATA
The following consolidated statement of operations and balance sheet data have been derived from the consolidated financial statements of the Company, which have been prepared in accordance with U.S. generally accepted accounting principles (“GAAP”). The consolidated financial statements of the Company for each of the years in the five-year period ended December 31, 2009 have been audited by KPMG LLP, an independent registered public accounting firm. The following selected historical consolidated financial data should be read in conjunction with the consolidated financial statements of HMEC and its subsidiaries and “Management’s Discussion and Analysis of Financial Condition and Results of Operations”.
| Year Ended December 31, | ||||||||||||||||||||
| 2009 | 2008 | 2007 | 2006 | 2005 | ||||||||||||||||
| (Dollars in millions, except per share data) | ||||||||||||||||||||
| Statement of Operations Data: |
||||||||||||||||||||
| Insurance premiums and contract charges earned |
$ | 659.6 | $ | 658.5 | $ | 654.3 | $ | 653.9 | $ | 664.9 | ||||||||||
| Net investment income |
246.8 | 230.3 | 223.8 | 209.0 | 194.6 | |||||||||||||||
| Realized investment gains (losses) |
26.3 | (63.9 | ) | (3.4 | ) | 10.9 | 9.8 | |||||||||||||
| Total revenues |
937.4 | 834.8 | 887.0 | 885.8 | 880.2 | |||||||||||||||
| Amortization of intangible assets (1) |
0.2 | 5.3 | 5.4 | 6.1 | 5.1 | |||||||||||||||
| Interest expense |
14.0 | 14.5 | 14.1 | 13.1 | 8.9 | |||||||||||||||
| Income before income taxes |
103.5 | 0.2 | 117.1 | 140.3 | 94.0 | |||||||||||||||
| Net income (2) |
73.5 | 10.9 | 82.8 | 98.7 | 77.3 | |||||||||||||||
| Ratio of earnings to fixed charges (3) |
1.7 | x | 1.0 | x | 1.8 | x | 2.0 | x | 1.8 | x | ||||||||||
| Per Share Data (4): |
||||||||||||||||||||
| Net income per share: |
||||||||||||||||||||
| Basic |
$ | 1.88 | $ | 0.27 | $ | 1.92 | $ | 2.29 | $ | 1.80 | ||||||||||
| Diluted |
$ | 1.81 | $ | 0.27 | $ | 1.86 | $ | 2.19 | $ | 1.67 | ||||||||||
| Shares of Common Stock (in millions): |
||||||||||||||||||||
| Weighted average - basic |
39.2 | 39.8 | 43.1 | 43.0 | 42.9 | |||||||||||||||
| Weighted average - diluted |
40.5 | 40.6 | 44.6 | 45.8 | 47.9 | |||||||||||||||
| Ending outstanding |
39.2 | 39.1 | 42.2 | 43.1 | 43.0 | |||||||||||||||
| Cash dividends per share |
$ | 0.2375 | $ | 0.3675 | $ | 0.4200 | $ | 0.4200 | $ | 0.4200 | ||||||||||
| Book value per share |
$ | 18.36 | $ | 11.49 | $ | 16.41 | $ | 15.25 | $ | 13.51 | ||||||||||
| Balance Sheet Data, at Year End: |
||||||||||||||||||||
| Total investments |
$ | 4,574.6 | $ | 3,901.8 | $ | 4,180.3 | $ | 4,302.2 | $ | 3,996.5 | ||||||||||
| Total assets |
6,343.1 | 5,507.7 | 6,259.3 | 6,329.7 | 5,840.6 | |||||||||||||||
| Total policy liabilities |
3,794.6 | 3,563.2 | 3,383.3 | 3,301.4 | 3,172.1 | |||||||||||||||
| Short-term debt |
38.0 | 38.0 | — | — | — | |||||||||||||||
| Long-term debt |
199.6 | 199.5 | 199.5 | 232.0 | 190.9 | |||||||||||||||
| Total shareholders’ equity |
719.5 | 448.8 | 693.3 | 657.1 | 580.6 | |||||||||||||||
| Segment Information (5): |
||||||||||||||||||||
| Insurance premiums written and contract deposits |
||||||||||||||||||||
| Property and casualty |
$ | 553.5 | $ | 545.9 | $ | 535.2 | $ | 539.8 | $ | 546.9 | ||||||||||
| Annuity |
349.8 | 311.7 | 337.1 | 325.7 | 320.1 | |||||||||||||||
| Life |
100.4 | 102.5 | 102.4 | 103.9 | 105.6 | |||||||||||||||
| Total |
1,003.7 | 960.1 | 974.7 | 969.4 | 972.6 | |||||||||||||||
| Net income (loss) |
||||||||||||||||||||
| Property and casualty |
$ | 30.0 | $ | 28.1 | $ | 61.2 | $ | 74.3 | $ | 45.0 | ||||||||||
| Annuity |
21.2 | 17.3 | 17.6 | 13.2 | 15.1 | |||||||||||||||
| Life |
18.4 | 16.4 | 17.3 | 14.5 | 13.4 | |||||||||||||||
| Corporate and other (6) |
3.9 | (50.9 | ) | (13.3 | ) | (3.3 | ) | 3.8 | ||||||||||||
| Total |
73.5 | 10.9 | 82.8 | 98.7 | 77.3 | |||||||||||||||
| (1) | Amortization of intangible assets is comprised of amortization of acquired value of insurance in force and is the result of purchase accounting adjustments related to the 1989 acquisition of the Company. These intangible assets were fully amortized by December 31, 2009. |
| (2) | In 2008, the Company’s federal income tax expense reflected a reduction of $4.2 million from the closing of tax years 2002, 2004, 2005 and 2006 with favorable resolution of the contingent tax liabilities related to those prior year taxes. For similar reasons, in 2005, the Company’s federal income tax expense reflected a reduction of $9.1 million from the closing of tax years 1996 through 2001. |
| (3) | For the purpose of determining the ratio of earnings to fixed charges, “earnings” consist of income before income taxes or benefits and fixed charges, and “fixed charges” consist of interest expense (including amortization of debt issuance cost) and interest credited to policyholders on interest-sensitive contracts. |
| (4) | Basic earnings per share is computed based on the weighted average number of shares outstanding. Diluted earnings per share is computed based on the weighted average number of shares and common stock equivalents outstanding. The Company’s common stock equivalents relate to outstanding common stock options, Director Stock Plan units, Employee Stock Plan units and restricted stock units. The Company’s Senior Convertible Notes, which were issued in May 2002, were considered potentially dilutive securities and were included in the calculation of diluted earnings per share, to the extent dilutive. In May 2007, the Company redeemed all remaining Senior Convertible Notes. |
| (5) | Information regarding assets by segment at December 31, 2009, 2008 and 2007 is contained in “Notes to Consolidated Financial Statements — Note 13 — Segment Information” listed on page F-1 of this report. |
| (6) | The corporate and other segment primarily includes interest expense on debt and the impact of realized investment gains and losses, debt retirement costs and gains and certain public company expenses. |
3
Table of Contents
Corporate Strategy and Marketing
The Horace Mann Value Proposition
The Horace Mann Value Proposition articulates the Company’s overarching strategy and business purpose: Provide lifelong financial well-being for educators and their families through personalized service, advice, and a full range of tailored insurance and financial products.
Target Market
Management believes that Horace Mann is the largest national multiline insurance company focused on the nation’s educators as its primary market. The Company’s target market consists primarily of K-12 teachers, administrators and other employees of public schools and their families located throughout the U.S. The U.S. Department of Education estimates that there are approximately 6.2 million teachers, school administrators and education support personnel in public schools in the U.S.; approximately 3.2 million of these individuals are elementary and secondary teachers.
Dedicated Agency Force
A cornerstone of Horace Mann’s marketing strategy is its dedicated sales force of full-time agents trained to sell the Company’s multiline products. As of December 31, 2009, the Company had 715 agents, approximately 75% of which are licensed by the Financial Industry Regulatory Authority (“FINRA”), formerly the National Association of Securities Dealers, Inc. (“NASD”), to sell variable annuities and variable universal life policies. Some individuals in the agency force were previously teachers, other members of the education profession or persons with close ties to the educational community. The Company’s dedicated agents are under contract to market only the Company’s products and limited additional third-party vendor products authorized by the Company. Collectively, the Company’s principal insurance subsidiaries are licensed to write business in 49 states and the District of Columbia.
In 2006, the Company began the transition from a single-person agent operation to its Agency Business Model (“ABM”), with agents in outside offices with support personnel and licensed producers, designed to remove capacity constraints and increase productivity. The first Agency Business School (“ABS”) session was conducted in October 2006, beginning the formal roll-out of this model. Subsequently, ABS attendance has been offered to those agents who meet the Company’s qualifications and demonstrate they are able to successfully migrate into the ABM model or begin their association with Horace Mann directly in the ABM model. On an ongoing basis, the Company will also provide follow-up training and support to those agents who have completed the school, to further embed repeatable processes and fully maximize the potential of ABM. Property and casualty initiatives to support that transition and drive business growth include the Company’s Educator Segmentation Model — a more precise approach to pricing automobile and homeowners business — and its Product Management Organization — focused on localized approaches to pricing, underwriting and marketing. Also, the Company is developing a new property and casualty policy administration system with an automated point-of-sale front end. Annuity and life initiatives to support the transition to ABM included the roll out of additional Horace Mann manufactured and branded products, as described in “Annuity Segment” and “Life Segment”.
4
Table of Contents
Building on the foundation of ABM, in the fourth quarter of 2008 the Company introduced its Exclusive Agent (“EA”) agreement which is designed to place agents in the position to become business owners and invest their own capital to grow their agencies. These independent contractors will be under contract and trained to market only the Company’s multiline products and limited additional third-party vendor products authorized by the Company. By January 1, 2009, the first 71 individuals migrated from being employee agents to functioning as independent Exclusive Agents. Throughout 2009, additional employee agents migrated and other individuals were recruited and appointed directly into the EA agreement. By December 31, 2009, 249, or 35%, of the Company’s dedicated agents were EAs. Going forward, the EA agreement will be offered to additional qualified employee agents. Management expects that all future agent recruits will be under the EA agreement.
As indicated above, agents operating in the ABM model, both employee agents and EAs, utilize licensed producers in their operations. As of December 31, 2009, there were 571 licensed producers, resulting in a total of 1,286 points of distribution for the Company’s products.
Broadening Distribution Options
To complement and extend the reach of the Company’s agency force and to more fully utilize its approved payroll reduction slots in school systems across the country, the Company utilizes a network of independent agents to distribute the Company’s 403(b) tax-qualified annuity products. In addition to serving educators in areas where the Company does not have dedicated agents, the independent agents complement the annuity capabilities of the Company’s agency force in under-penetrated areas. At December 31, 2009, there were 832 independent agents approved to market the Company’s annuity products throughout the U.S. During 2009, collected contract deposits from this distribution channel were approximately $64 million.
5
Table of Contents
Geographic Composition of Business
The Company’s business is geographically diversified. For the year ended December 31, 2009, based on direct premiums and contract deposits for all product lines, the top five states and their portion of total direct insurance premiums and contract deposits were California, 7.6%; Florida, 6.9%; North Carolina, 6.7%; Illinois, 6.4%; and Texas, 5.4%.
HMEC’s property and casualty subsidiaries are licensed to write business in 48 states and the District of Columbia. The following table sets forth the Company’s top ten property and casualty states based on total direct premiums in 2009:
Property and Casualty Segment Top Ten States
(Dollars in millions)
| Property and Casualty Segment |
||||||
| Direct Premiums (1) |
Percent of Total |
|||||
| State | ||||||
| Florida |
$ | 51.4 | 9.0 | % | ||
| California |
50.4 | 8.8 | ||||
| North Carolina |
41.0 | 7.2 | ||||
| Minnesota |
36.4 | 6.4 | ||||
| Texas |
34.3 | 6.0 | ||||
| Louisiana |
31.6 | 5.5 | ||||
| South Carolina |
26.5 | 4.6 | ||||
| Pennsylvania |
22.7 | 4.0 | ||||
| Georgia |
18.2 | 3.2 | ||||
| Maine |
16.8 | 3.0 | ||||
| Total of top ten states |
329.3 | 57.7 | ||||
| All other areas |
241.3 | 42.3 | ||||
| Total direct premiums |
$ | 570.6 | 100.0 | % | ||
| (1) | Defined as earned premiums before reinsurance and is determined under statutory accounting principles. |
HMEC’s principal life insurance subsidiary is licensed to write business in 48 states and the District of Columbia. The following table sets forth the Company’s top ten combined life and annuity states based on total direct premiums and contract deposits in 2009:
Combined Life and Annuity Segments Top Ten States
(Dollars in millions)
| Direct Premiums and Contract Deposits (1) |
Percent of Total |
|||||
| State | ||||||
| Illinois |
$ | 52.7 | 11.6 | % | ||
| Virginia |
29.2 | 6.4 | ||||
| North Carolina |
27.6 | 6.1 | ||||
| California |
27.4 | 6.0 | ||||
| South Carolina |
24.3 | 5.3 | ||||
| Pennsylvania |
22.5 | 4.9 | ||||
| Texas |
20.7 | 4.5 | ||||
| Florida |
19.4 | 4.2 | ||||
| Minnesota |
18.4 | 4.1 | ||||
| Tennessee |
16.2 | 3.6 | ||||
| Total of top ten states |
258.4 | 56.7 | ||||
| All other areas |
197.7 | 43.3 | ||||
| Total direct premiums |
$ | 456.1 | 100.0 | % | ||
| (1) | Defined as collected premiums before reinsurance and is determined under statutory accounting principles. |
6
Table of Contents
National, State and Local Education Associations
The Company has had a long relationship with the National Education Association (“NEA”), the nation’s largest confederation of state and local teachers’ associations, and many of the state and local education associations affiliated with the NEA. The NEA has approximately 3.2 million members. The Company maintains a special advisory board, primarily composed of leaders of state education associations, that meets with Company management at least annually. The NEA and its affiliated state and local associations sponsor various insurance products and services of the Company and its competitors. The Company does not pay the NEA or any affiliated associations any consideration in exchange for sponsorship of Company products. The Company does pay for certain special functions and advertising that appears in NEA and state education association publications.
The Company also has established relationships with a number of other educator groups, such as school administrator and principal associations, throughout the U.S. The Company does not pay these other educator groups any consideration in exchange for sponsorship of Company products. The Company does pay for certain special functions and advertising that appears in publications of these organizations.
The property and casualty segment represented 55% of the Company’s total insurance premiums written and contract deposits in 2009.
The primary property and casualty product offered by the Company is private passenger automobile insurance, which in 2009 represented 37% of the Company’s total insurance premiums written and contract deposits and 67% of property and casualty net written premiums. As of December 31, 2009, the Company had approximately 528,000 voluntary automobile policies in force with annual premiums of approximately $375 million. The Company’s automobile business is primarily preferred risk, defined as a household whose drivers have had no recent accidents and no more than one recent moving violation.
In 2009, homeowners insurance represented 18% of the Company’s total insurance premiums written and contract deposits and 32% of property and casualty net written premiums. As of December 31, 2009, the Company had approximately 262,000 homeowners policies in force with annual premiums of approximately $198 million. The Company insures primarily residential homes.
The Company has programs in a majority of states to provide higher-risk automobile and homeowners coverages, with third-party vendors underwriting and bearing the risk of such insurance and the Company receiving commissions on the sales. As an example, in Florida the Company has authorized its agents to write certain third-party vendors’ homeowners policies to help control the Company’s coastal risk exposure.
7
Table of Contents
Selected Historical Financial Information For Property and Casualty Segment
The following table sets forth certain financial information with respect to the property and casualty segment for the periods indicated.
Property and Casualty Segment
Selected Historical Financial Information
(Dollars in millions)
| Year Ended December 31, | ||||||||||||
| 2009 | 2008 | 2007 | ||||||||||
| Operations Data: |
||||||||||||
| Insurance premiums written |
$ | 553.5 | $ | 545.9 | $ | 535.2 | ||||||
| Insurance premiums earned |
547.3 | 541.1 | 535.1 | |||||||||
| Net investment income |
34.4 | 35.7 | 38.0 | |||||||||
| Income before income taxes |
35.7 | 33.7 | 84.7 | |||||||||
| Net income |
30.0 | 28.1 | 61.2 | |||||||||
| Catastrophe costs, pretax (1) |
33.1 | 73.9 | 23.6 | |||||||||
| Operating Statistics: |
||||||||||||
| Loss and loss adjustment expense ratio |
74.4 | % | 76.9 | % | 67.4 | % | ||||||
| Expense ratio |
25.1 | % | 23.8 | % | 24.5 | % | ||||||
| Combined loss and expense ratio |
99.5 | % | 100.7 | % | 91.9 | % | ||||||
| Effect of catastrophe costs on the combined ratio (1) |
6.1 | % | 13.7 | % | 4.4 | % | ||||||
| Automobile and Homeowners (Voluntary): |
||||||||||||
| Insurance premiums written |
||||||||||||
| Automobile |
$ | 372.5 | $ | 367.8 | $ | 365.3 | ||||||
| Homeowners |
177.7 | 174.4 | 165.3 | |||||||||
| Total |
550.2 | 542.2 | 530.6 | |||||||||
| Insurance premiums earned |
||||||||||||
| Automobile |
369.8 | 365.5 | 364.6 | |||||||||
| Homeowners |
174.3 | 172.3 | 160.5 | |||||||||
| Total |
544.1 | 537.8 | 525.1 | |||||||||
| Policies in force (in thousands) |
||||||||||||
| Automobile |
528 | 535 | 535 | |||||||||
| Homeowners |
262 | 263 | 266 | |||||||||
| Total |
790 | 798 | 801 | |||||||||
| (1) | These measures are used by the Company’s management to evaluate performance against historical results and establish targets on a consolidated basis. These measures are components of net income but are considered non-GAAP financial measures under applicable SEC rules because they are not displayed as separate line items in the Consolidated Statements of Operations and require inclusion or exclusion of certain items not ordinarily included or excluded in a GAAP financial measure. In the opinion of the Company’s management, a discussion of these measures is meaningful to provide investors with an understanding of the significant factors that comprise the Company’s periodic results of operations. |
| • | Catastrophe costs — The sum of catastrophe losses and property and casualty catastrophe reinsurance reinstatement premiums. |
| • | Catastrophe losses — In categorizing property and casualty claims as being from a catastrophe, the Company utilizes the designations of the Property Claims Service, a subsidiary of Insurance Services Office, Inc. (“ISO”), and additionally beginning in 2007, includes losses from all such events that meet the definition of covered loss in the Company’s primary catastrophe excess of loss reinsurance contract, and reports loss and loss adjustment expense amounts net of reinsurance recoverables. A catastrophe is a severe loss resulting from natural and man-made events within a particular territory, including risks such as hurricane, fire, earthquake, windstorm, explosion, terrorism and other similar events, that causes $25 million or more in insured property and casualty losses for the industry and affects a significant number of property and casualty insurers and policyholders. Each catastrophe has unique characteristics. Catastrophes are not predictable as to timing or amount of loss in advance. Their effects are not included in earnings or claim and claim adjustment expense reserves prior to occurrence. In the opinion of the Company’s management, a discussion of the impact of catastrophes is meaningful for investors to understand the variability in periodic earnings. |
8
Table of Contents
Catastrophe Costs
The level of catastrophe costs can fluctuate significantly from year to year. Catastrophe costs before federal income tax benefits for the Company and the property and casualty industry for the ten years ended December 31, 2009 were as follows:
Catastrophe Costs
(Dollars in millions)
| The Company (1) |
Property and Casualty Industry (2) | |||||
| Year Ended December 31, |
||||||
| 2009 |
$ | 33.1 | $ | 10,600.0 | ||
| 2008 |
73.9 | 25,200.0 | ||||
| 2007 |
23.6 | 6,700.0 | ||||
| 2006 |
19.8 | 9,200.0 | ||||
| 2005 |
69.2 | 62,300.0 | ||||
| 2004 |
75.5 | 27,500.0 | ||||
| 2003 |
33.2 | 12,900.0 | ||||
| 2002 |
11.9 | 5,900.0 | ||||
| 2001 |
11.2 | 26,500.0 | ||||
| 2000 |
16.2 | 4,600.0 | ||||
| (1) | Net of reinsurance and before federal income tax benefits. Includes allocated loss adjustment expenses and reinsurance reinstatement premiums. The Company’s individually significant catastrophe losses net of reinsurance were as follows: |
| 2009 |
— | $9.3 million, July wind/hail/tornadoes; $6.3 million, June wind/hail/tornadoes. | ||
| 2008 |
— | $16.5 million, Hurricane Gustav; $15.5 million, Hurricane Ike; $9.8 million, May wind/hail/tornadoes; $7.0 million, June wind/hail/tornadoes; $3.0 million, December winter storm. | ||
| 2007 |
— | $4.7 million, August wind/hail/tornadoes; $4.5 million, October California wildfires; $3.5 million, June wind/hail/tornadoes. | ||
| 2006 |
— | $5.0 million, August wind/hail/tornadoes; $3.9 million, April wind/hail/tornadoes. | ||
| 2005 |
— | $23.7 million, Hurricane Katrina; $15.0 million, Hurricane Wilma; $10.8 million, Hurricane Rita; $6.5 million, September Minnesota tornadoes; $5.0 million, Hurricane Dennis. | ||
| 2004 |
— | $19.9 million, Hurricane Charley; $11.9 million, Hurricane Frances; $19.2 million, Hurricane Ivan; $18.2 million, Hurricane Jeanne. | ||
| 2003 |
— | $12.0 million, California wildfires; $9.6 million, May hail/tornadoes/wind; $5.0 million, Hurricane Isabel; $2.7 million, early April winter storms. | ||
| 2002 |
— | $4.2 million, Hurricane Lili; $1.7 million, April Eastern states hail, tornadoes, wind and heavy rain; $1.2 million, Eastern states winter storms. | ||
| 2001 |
— | $3.7 million, June Midwest wind/hail/tornadoes; $2.3 million, April tornadoes; $2.2 million, Tropical Storm Allison. | ||
| 2000 |
— | $5.0 million, May tornadoes; $2.7 million, December winter storms. | ||
| (2) | Source: ISO Catastrophe History Reporter for 2009 amount; ISO news release dated January 20, 2009 for 2008 and prior years’ amounts. These amounts represent anticipated insured losses from catastrophes for personal and commercial property items, business interruption, terrorism, workers compensation and additional living expenses and exclude all loss adjustment expenses and are before federal income tax benefits. |
9
Table of Contents
Fluctuations from year to year in the level of catastrophe losses impact a property and casualty insurance company’s loss and loss adjustment expenses incurred and paid. For comparison purposes, the following table provides amounts for the Company excluding catastrophe losses:
Impact of Catastrophe Losses (1)
(Dollars in millions)
| Year Ended December 31, | |||||||||
| 2009 | 2008 | 2007 | |||||||
| Claims and claim expense incurred (2) |
$ | 407.1 | $ | 416.1 | $ | 360.4 | |||
| Amount attributable to catastrophes |
33.1 | 73.9 | 23.6 | ||||||
| Excluding catastrophes (2) |
$ | 374.0 | $ | 342.2 | $ | 336.8 | |||
| Claims and claim expense payments |
$ | 404.9 | $ | 423.4 | $ | 365.5 | |||
| Amount attributable to catastrophes |
39.5 | 65.7 | 22.3 | ||||||
| Excluding catastrophes |
$ | 365.4 | $ | 357.7 | $ | 343.2 | |||
| (1) | Net of reinsurance and before federal income tax benefits. Includes allocated loss adjustment expenses. |
| (2) | Includes the impact of development of prior years’ reserves as quantified in “Property and Casualty Reserves”. |
Property and Casualty Reserves
Property and casualty unpaid claims and claim settlement expenses (“loss reserves”) represent management’s estimate of ultimate unpaid costs of losses and settlement expenses for claims that have been reported and claims that have been incurred but not yet reported. The Company calculates and records a single best estimate of the reserve as of each balance sheet date in conformity with generally accepted actuarial standards. For additional information regarding the process used to estimate property and casualty reserves, the risk factors involved and reserve development recorded in each of the three years ended December 31, 2009, see “Notes to Consolidated Financial Statements — Note 4 — Property and Casualty Unpaid Claims and Claim Expenses” and “Management’s Discussion and Analysis of Financial Condition and Results of Operations — Critical Accounting Policies — Liabilities for Property and Casualty Claims and Claim Settlement Expenses”.
All of the Company’s property and casualty reserves for unpaid claims and claim settlement expenses are carried at the full value of estimated liabilities and are not discounted for interest expected to be earned on reserves. Due to the nature of the Company’s personal lines business, the Company has no exposure to claims for toxic waste cleanup, other environmental remediation or asbestos-related illnesses other than claims under homeowners insurance policies for environmentally related items such as mold.
10
Table of Contents
The following table is a summary reconciliation of the beginning and ending property and casualty insurance claims and claim expense reserves for each of the last three years. The table presents reserves on a net (after reinsurance) basis. The total net property and casualty insurance claims and claim expense incurred amounts are reflected in the Consolidated Statements of Operations listed on page F-1 of this report. The end of the year gross reserve (before reinsurance) balances are reflected in the Consolidated Balance Sheets also listed on page F-1 of this report.
Reconciliation of Property and Casualty Claims and Claim Expense Reserves
(Dollars in millions)
| Year Ended December 31, | ||||||||||||
| 2009 | 2008 | 2007 | ||||||||||
| Gross reserves, beginning of year (1) |
$ | 297.8 | $ | 306.2 | $ | 317.8 | ||||||
| Less reinsurance recoverables |
14.8 | 15.9 | 22.4 | |||||||||
| Net reserves, beginning of year (2) |
283.0 | 290.3 | 295.4 | |||||||||
| Incurred claims and claim expenses: |
||||||||||||
| Claims occurring in the current year |
418.8 | 434.2 | 380.4 | |||||||||
| Decrease in estimated reserves for claims occurring in prior years (3) |
(11.7 | ) | (18.1 | ) | (20.0 | ) | ||||||
| Total claims and claim expenses incurred (4) |
407.1 | 416.1 | 360.4 | |||||||||
| Claims and claim expense payments for claims occurring during: |
||||||||||||
| Current year |
265.6 | 289.3 | 236.2 | |||||||||
| Prior years |
139.3 | 134.1 | 129.3 | |||||||||
| Total claims and claim expense payments |
404.9 | 423.4 | 365.5 | |||||||||
| Net reserves, end of year (2) |
285.2 | 283.0 | 290.3 | |||||||||
| Plus reinsurance recoverables |
15.8 | 14.8 | 15.9 | |||||||||
| Reported gross reserves, end of year (1) |
$ | 301.0 | $ | 297.8 | $ | 306.2 | ||||||
| (1) | Unpaid claims and claim expenses as reported in the Consolidated Balance Sheets, listed on page F-1 of this report, also include life, annuity, and group accident and health reserves of $11.7 million, $13.4 million, $9.2 million and $8.9 million at December 31, 2009, 2008, 2007 and 2006, respectively, in addition to property and casualty reserves. |
| (2) | Reserves net of anticipated reinsurance recoverables. |
| (3) | Shows the amounts by which the Company decreased its reserves in each of the periods indicated for claims occurring in previous periods to reflect subsequent information on such claims and changes in their projected final settlement costs. For discussion of the reserve development recorded by the Company in 2009, 2008 and 2007, see “Notes to Consolidated Financial Statements — Note 4 — Property and Casualty Unpaid Claims and Claim Expenses” listed on page F-1 of this report. |
| (4) | Benefits, claims and settlement expenses as reported in the Consolidated Statements of Operations, listed on page F-1 of this report, also include life, annuity and group accident and health amounts of $51.6 million, $55.4 million and $48.1 million for the years ended December 31, 2009, 2008 and 2007, respectively, in addition to the property and casualty amounts. |
The claim reserve development table below illustrates the change over time in the Net Reserves (defined in footnote 2 to the table above) established for property and casualty insurance claims and claim expenses at the end of various calendar years. The first section shows the reserves as originally reported at the end of the stated year. The second section, reading down, shows the cumulative amounts of claims for which settlements have been made in cash as of the end of successive years with respect to that reserve liability. The third section, reading down, shows retroactive reestimates of the original recorded reserve as of the end of each successive year which is the result of the Company learning additional facts that pertain to the unsettled claims. The fourth section compares the latest reestimated reserve to the reserve originally established, and indicates whether or not the original reserve was adequate or inadequate to cover the estimated costs of unsettled claims. The table also presents the gross reestimated liability as of the end of the latest reestimation period, with separate disclosure of the related reestimated reinsurance recoverable. The claim reserve development table is cumulative and, therefore, ending balances should not be added since the amount at the end of each calendar year includes activity for both the current and prior years.
11
Table of Contents
In evaluating the information in the table below, it should be noted that each amount includes the effects of all changes in amounts of prior periods. For example, if a claim determined in 2008 to be $150 thousand was first reserved in 1999 at $100 thousand, the $50 thousand deficiency (actual claim minus original estimate) would be included in the cumulative deficiency in each of the years 1999-2007 shown below. This table presents development data by calendar year and does not relate the data to the year in which the accident actually occurred. Conditions and trends that have affected the development of these reserves in the past will not necessarily recur in the future. It may not be appropriate to use this cumulative history in the projection of future performance.
Property and Casualty
Claims and Claims Expense Reserve Development
(Dollars in millions)
| December 31, | |||||||||||||||||||||||||||||||||||||||||||
| 1999 | 2000 | 2001 | 2002 | 2003 | 2004 | 2005 | 2006 | 2007 | 2008 | 2009 | |||||||||||||||||||||||||||||||||
| Gross reserves for property and casualty claims and claim expenses |
$ | 271.2 | $ | 272.1 | $ | 275.7 | $ | 275.7 | $ | 304.3 | $ | 335.0 | $ | 342.7 | $ | 317.8 | $ | 306.2 | $ | 297.8 | $ | 301.0 | |||||||||||||||||||||
| Deduct: Reinsurance recoverables |
64.4 | 49.1 | 34.1 | 44.7 | 20.6 | 25.7 | 31.6 | 22.4 | 15.9 | 14.8 | 15.8 | ||||||||||||||||||||||||||||||||
| Net Reserves for property and casualty claims and claim expenses (1) |
206.8 | 223.0 | 241.6 | 231.0 | 283.7 | 309.3 | 311.1 | 295.4 | 290.3 | 283.0 | 285.2 | ||||||||||||||||||||||||||||||||
| Paid cumulative as of: |
|||||||||||||||||||||||||||||||||||||||||||
| One year later |
135.9 | 139.0 | 153.4 | 160.4 | 145.2 | 143.9 | 138.3 | 129.8 | 134.1 | 139.4 | |||||||||||||||||||||||||||||||||
| Two years later |
191.6 | 202.6 | 226.0 | 222.3 | 209.5 | 202.5 | 196.5 | 184.1 | 184.2 | ||||||||||||||||||||||||||||||||||
| Three years later |
225.4 | 243.3 | 258.4 | 258.6 | 244.1 | 236.6 | 225.0 | 209.5 | |||||||||||||||||||||||||||||||||||
| Four years later |
246.9 | 256.1 | 276.3 | 278.7 | 264.1 | 252.7 | 239.1 | ||||||||||||||||||||||||||||||||||||
| Five years later |
252.7 | 264.1 | 286.5 | 291.4 | 272.4 | 259.7 | |||||||||||||||||||||||||||||||||||||
| Six years later |
257.6 | 268.6 | 294.2 | 296.1 | 276.9 | ||||||||||||||||||||||||||||||||||||||
| Seven years later |
259.8 | 273.6 | 296.9 | 298.5 | |||||||||||||||||||||||||||||||||||||||
| Eight years later |
264.1 | 275.4 | 298.2 | ||||||||||||||||||||||||||||||||||||||||
| Nine years later |
265.0 | 275.8 | |||||||||||||||||||||||||||||||||||||||||
| Ten years later |
264.9 | ||||||||||||||||||||||||||||||||||||||||||
| Net Reserves reestimated as of (1): |
|||||||||||||||||||||||||||||||||||||||||||
| End of year |
206.8 | 223.0 | 241.6 | 231.0 | 283.7 | 309.3 | 311.1 | 295.4 | 290.3 | 283.0 | 285.2 | ||||||||||||||||||||||||||||||||
| One year later |
229.5 | 239.5 | 265.6 | 287.3 | 287.5 | 296.2 | 291.8 | 275.4 | 272.2 | 271.3 | |||||||||||||||||||||||||||||||||
| Two years later |
248.3 | 260.5 | 294.7 | 297.1 | 283.1 | 282.7 | 279.7 | 262.1 | 263.0 | ||||||||||||||||||||||||||||||||||
| Three years later |
256.0 | 277.0 | 301.3 | 297.9 | 283.5 | 278.2 | 270.2 | 255.3 | |||||||||||||||||||||||||||||||||||
| Four years later |
266.9 | 280.2 | 298.5 | 301.8 | 281.3 | 272.8 | 256.3 | ||||||||||||||||||||||||||||||||||||
| Five years later |
269.3 | 277.9 | 301.8 | 300.6 | 280.6 | 268.4 | |||||||||||||||||||||||||||||||||||||
| Six years later |
268.1 | 279.9 | 299.4 | 300.2 | 281.1 | ||||||||||||||||||||||||||||||||||||||
| Seven years later |
269.2 | 276.6 | 299.0 | 301.1 | |||||||||||||||||||||||||||||||||||||||
| Eight years later |
265.9 | 276.3 | 299.8 | ||||||||||||||||||||||||||||||||||||||||
| Nine years later |
265.6 | 276.7 | |||||||||||||||||||||||||||||||||||||||||
| Ten years later |
265.4 | ||||||||||||||||||||||||||||||||||||||||||
| Net Reserve redundancy (deficiency) - initial net reserves in excess of (less than) reestimated reserves: |
|||||||||||||||||||||||||||||||||||||||||||
| Amount (2) |
$ | (58.6 | ) | $ | (53.7 | ) | $ | (58.2 | ) | $ | (70.1 | ) | $ | 2.6 | $ | 40.9 | $ | 54.8 | $ | 40.1 | $ | 27.3 | $ | 11.7 | |||||||||||||||||||
| Percent |
-28.3 | % | -24.1 | % | -24.1 | % | -30.3 | % | 0.9 | % | 13.2 | % | 17.6 | % | 13.6 | % | 9.4 | % | 4.1 | % | |||||||||||||||||||||||
| Gross reestimated liability - latest |
$ | 320.3 | $ | 333.8 | $ | 361.0 | $ | 368.0 | $ | 329.8 | $ | 323.5 | $ | 324.2 | $ | 288.3 | $ | 286.8 | $ | 290.1 | |||||||||||||||||||||||
| Reestimated reinsurance recoverables - latest |
54.9 | 57.1 | 61.2 | 66.9 | 48.7 | 55.1 | 67.9 | 33.0 | 23.8 | 18.8 | |||||||||||||||||||||||||||||||||
| Net Reserve reestimated - latest (1) |
$ | 265.4 | $ | 276.7 | $ | 299.8 | $ | 301.1 | $ | 281.1 | $ | 268.4 | $ | 256.3 | $ | 255.3 | $ | 263.0 | $ | 271.3 | |||||||||||||||||||||||
| Gross cumulative excess (deficiency) (2) |
$ | (49.1 | ) | $ | (61.7 | ) | $ | (85.3 | ) | $ | (92.3 | ) | $ | (25.5 | ) | $ | 11.5 | $ | 18.5 | $ | 29.5 | $ | 19.4 | $ | 7.7 | ||||||||||||||||||
| (1) | Reserves net of anticipated reinsurance recoverables (“Net Reserves”). Net Reserves is a measure used by the Company’s management to evaluate the overall adequacy of the property and casualty loss reserves and management believes it provides an alternative view of the Company’s anticipated liabilities after reflecting expected recoveries from its reinsurers. This is considered a non-GAAP financial measure under applicable SEC rules because it is not displayed as a separate item in the Consolidated Balance Sheets. For balance sheet reporting, GAAP does not permit the Company to offset expected reinsurance recoveries against liabilities, yet management believes it is useful to investors to take these expected recoveries into account. These adjustments only affect the classification of these items in the Consolidated Balance Sheets and the Consolidated Statements of Cash Flows and there is no impact on the Company’s benefits, claims and settlement expenses incurred as reported in the Consolidated Statements of Operations. |
| (2) | For discussion of the reserve development, see “Notes to Consolidated Financial Statements — Note 4 — Property and Casualty Unpaid Claims and Claim Expenses” listed on page F-1 of this report. |
12
Table of Contents
Property and Casualty Reinsurance
All reinsurance is obtained through contracts which generally are renewed each calendar year. Although reinsurance does not legally discharge the Company from primary liability for the full amount of its policies, it does allow for recovery from assuming reinsurers to the extent of the reinsurance ceded. Historically, the Company’s losses from uncollectible reinsurance recoverables have been insignificant due to the Company’s emphasis on the credit worthiness of its reinsurers. Past due reinsurance recoverables as of December 31, 2009 were insignificant.
The Company maintains catastrophe excess of loss reinsurance coverage. For 2009, the excess of loss coverage consisted of three contracts in addition to coverage with the Florida Hurricane Catastrophe Fund (“FHCF”). The primary contract (“first event”) provided 95% coverage of catastrophe losses above a retention of $25.0 million per occurrence up to $170.0 million per occurrence. This contract consisted of four layers, each of which provided for one mandatory reinstatement unless noted otherwise. The layers were $25.0 million excess of $25.0 million (82.5% provided for one mandatory reinstatement), $40.0 million excess of $50.0 million (92.25% provided for one mandatory reinstatement), $60.0 million excess of $90.0 million, and $20.0 million excess of $150.0 million. The second excess of loss contract (“second event”) provided 95% coverage of catastrophe losses above a retention of $15.0 million per occurrence up to $25.0 million per occurrence, after the Company retained $10.0 million of losses above $15.0 million per occurrence. The third excess of loss contract (“third event”) provided 95% coverage of catastrophe losses above a retention of $15.0 million per occurrence up to $25.0 million per occurrence, after the Company retained $10.0 million of losses above $15.0 million per occurrence and less than $25.0 million per occurrence, and after the second excess of loss contract described above was exhausted. Neither the second nor the third excess of loss contract provided for a reinstatement. In addition, the Company’s predominant insurance subsidiary for property and casualty business written in Florida reinsured 90% of hurricane losses in that state above an estimated retention of $14.4 million up to $52.4 million, based on the FHCF’s financial resources. The FHCF contract is a one-year contract, effective June 1, 2009. The decrease in FHCF coverage for the 2009-2010 contract period primarily reflects the Company’s election not to purchase additional coverage as it did for the 2008-2009 contract period. This election was anticipated based on the Company’s increase in coverage under its primary reinsurance contracts, which were finalized and priced prior to January 1, 2009. Additional coverage made available by the FHCF to the industry in future contract periods could increase the likelihood of assessments in periods following significant hurricane losses.
For 2010, the Company’s catastrophe excess of loss coverage consists of three contracts in addition to the FHCF. The primary contract (“first event”) provides 95% coverage of catastrophe losses above a retention of $25.0 million per occurrence up to $170.0 million per occurrence. This contract consists of three layers, each of which provide for one mandatory reinstatement. The layers are $25.0 million excess of $25.0 million, $40.0 million excess of $50.0 million, and $80.0 million excess of $90.0 million. The second excess of loss contract (“second event”) provides 95% coverage of catastrophe losses above a retention of $15.0 million per occurrence up to $25.0 million per occurrence, after the Company retains $10.0 million of losses above $15.0 million per occurrence. The third excess of loss contract (“third event”) provides 95% coverage of catastrophe losses above a retention of $15.0 million per occurrence up to $25.0 million per occurrence, after the Company retains $10.0 million of losses above $15.0 million per occurrence and less than $25.0 million per occurrence, and after the second excess of loss contract described above is exhausted. Neither the second
13
Table of Contents
nor the third excess of loss contract provide for a reinstatement. The FHCF limits described in the previous paragraph continue through June 1, 2010, at which time a new annual contract may begin.
The Company has not joined the California Earthquake Authority (“CEA”). The Company’s exposure to losses from earthquakes is managed through its underwriting standards, its earthquake policy coverage limits and deductible levels, and the geographic distribution of its business, as well as its reinsurance program. After reviewing the exposure to earthquake losses from the Company’s own policies and from what it would be with participation in the CEA, including estimated start-up and ongoing costs related to CEA participation, management believes it is in the Company’s best economic interest to offer earthquake coverage directly to its homeowners policyholders.
For liability coverages, in 2009 the Company reinsured each loss above a retention of $700,000 up to $2.5 million per occurrence and $20.0 million in a clash event. (A clash cover is a reinsurance casualty excess contract requiring two or more casualty coverages or policies issued by the Company to be involved in the same loss occurrence for coverage to apply.) For property coverages, in 2009 the Company reinsured each loss above a retention of $750,000 up to $2.5 million on a per risk basis, including catastrophe losses that in the aggregate were less than the retention levels above. Also, the Company could submit to the reinsurers three per risk losses from the same occurrence for a total of $5,250,000 of property recovery in any one event. Effective January 1, 2010, the retention for liability coverages is $750,000 up to $2.5 million on a per occurrence basis and $20.0 million in a clash event. Retention for property coverages remains $750,000, with no change to the maximum limits, including the ability to submit three per risk losses from the same occurrence.
The following table identifies the Company’s most significant reinsurers under the catastrophe first event excess of loss reinsurance program, their percentage participation in this program and their ratings by A.M. Best Company (“A.M. Best”) and Standard & Poor’s Corporation (“S&P” or “Standard & Poor’s”) as of January 1, 2010. No other single reinsurer’s percentage participation in 2010 or 2009 exceeds 5%. For 2009, the Company’s catastrophe second event and third event excess of loss reinsurance was each provided by four reinsurers, although not the same four for both contracts, all rated “A- (Excellent)” or above by A.M. Best. For 2010, the Company’s catastrophe second event and third event excess of loss reinsurance is provided by four reinsurers, all rated “A- (Excellent)” or above by A.M. Best.
Property Catastrophe First Event Excess of Loss Reinsurance Participants In Excess of 5%
| A.M. Best | S&P | Participation | ||||||||||
| Rating |
Rating | Reinsurer |
Parent |
2010 | 2009 | |||||||
| A+ | AA | Tokio Millennium Reinsurance Limited |
Tokio Marine Holdings, Inc. |
19 | % | 24 | % | |||||
| A- | NR | Flagstone Reassurance Suisse SA |
Flagstone Reinsurance Holdings Limited |
13 | % | 11 | % | |||||
| A | A+ | AXIS Specialty Limited |
AXIS Capital Holdings Limited |
10 | % | 10 | % | |||||
| A | A+ | Transatlantic Reinsurance Company |
Transatlantic Holdings, Inc. |
7 | % | 5 | % | |||||
| A | A | Aspen Insurance Limited |
Aspen Insurance Holdings Limited |
6 | % | 6 | % | |||||
| A- | A+ | Paris Re, France |
PartnerRe Ltd. |
6 | % | 6 | % | |||||
| A | A+ | Swiss Re Underwriters Agency, Inc |
Swiss Reinsurance Company Ltd. |
6 | % | 6 | % | |||||
NR Not rated.
For 2010, property catastrophe reinsurers representing 100% of the Company’s total reinsured catastrophe coverage were rated “A- (Excellent)” or above by A.M. Best.
14
Table of Contents
Beginning in 1961, educators in the Company’s target market benefit from the provisions of Section 403(b) of the Internal Revenue Code (the “Code”). This section of the Code allows public school employees and employees of other tax-exempt organizations, such as not-for-profit private schools, to reduce their pretax income by making periodic contributions to a qualified retirement plan. (Also see “Regulation — Regulation at Federal Level”.) The Company entered the educators retirement annuity market in 1961 and is one of the largest participants in the 403(b) tax-qualified annuity market, measured by 403(b) net written premium on a statutory accounting basis. The Company has approved 403(b) payroll reduction capabilities in approximately one-third of the 15,400 school districts in the U.S. Approximately 61% of the Company’s new annuity contract deposits in 2009 were for 403(b) tax-qualified annuities; approximately 73% of accumulated annuity value on deposit is 403(b) tax-qualified. In 2009, annuities represented 35% of the Company’s total insurance premiums written and contract deposits.
The Company markets tax-qualified annuities utilizing both fixed account only and combination contracts. The combination contract allows the contractholder to allocate funds to both fixed and variable alternatives. Under the fixed account option, both the principal and a rate of return are guaranteed. Contractholders of this product can change at any time their allocation of deposits between the guaranteed interest rate fixed account and available variable investment options. In general, the contractholder bears the investment risk related to funds allocated to variable investment options. Variable annuity contracts with a guaranteed minimum death benefit (“GMDB”) provide a benefit if the contractholder dies and the contract value is less than a contractually defined amount. The Company has a relatively low exposure to GMDB because approximately 27% of contract values have no guarantee; approximately 67% have only a return of premium guarantee; and only 6% have a guarantee of premium roll-up at an annual interest rate of 3% or 5%.
In 2006, the Company introduced new Horace Mann manufactured and branded annuity products. The Goal Planning Annuity (“GPA”) offers educators a variable annuity product with a fixed interest account option and two optional riders that enhance the death benefit feature of the product. Developed with Wilshire Associates, the Company’s funds advisor, GPA provides educators the opportunity to invest with fund families such as T. Rowe Price, Fidelity, Alliance, Davis, Ariel Capital Management and Putnam, among others. By utilizing tools that provide assistance in determining needs and making asset allocation decisions, educators are able to choose the investment mix that matches their personal risk tolerance and retirement goals. Expanding Horizon is a fixed interest rate annuity contract for more conservative investors. This product offers educators a competitive rate of interest on their retirement dollars and the choice of bonuses to optimize their benefits at retirement. Also in 2006, the Company added additional investment options to its variable annuity products. This included lifecycle funds, with assets allocated among multiple investment classes within each fund based on its specific target date.
In August 2007, the Company completed development of group variable and fixed annuity products that allow greater flexibility in customizing 403(b) annuity programs to meet the needs of school districts. The first sales of these new group annuity products occurred in January 2008.
15
Table of Contents
As of December 31, 2009, the Company’s 56 variable account options included funds managed by some of the best-known names in the mutual fund industry, such as Wilshire, Fidelity, JPMorgan, T. Rowe Price, Neuberger Berman, AllianceBernstein, Rainier, Davis, Credit Suisse, BlackRock, Goldman Sachs, Dreyfus, Franklin Templeton, Ariel, Wells Fargo, Royce, Lord Abbett, Putnam and Delaware, offering the Company’s customers multiple investment options to address their personal investment objectives and risk tolerance. Total accumulated fixed and variable annuity cash value on deposit at December 31, 2009 was $3.7 billion.
To assist agents in delivering the Horace Mann Value Proposition, the Company has entered into a third-party vendor agreement with American Funds Distributors, Inc. (“AFD”) to market their retail mutual funds. In addition to retail mutual funds accounts, the Company’s agents can also offer a 529 college savings program and Coverdell Education Savings Accounts utilizing AFD funds. The Company has also expanded its product offerings to include fixed indexed annuities and single premium immediate annuities through additional marketing alliances. Third-party vendors underwrite these accounts or contracts and the Company receives commissions on the sales of these products.
16
Table of Contents
Selected Historical Financial Information For Annuity Segment
The following table sets forth certain information with respect to the Company’s annuity products for the periods indicated.
Annuity Segment
Selected Historical Financial Information
(Dollars in millions, unless otherwise indicated)
| Year Ended December 31, | ||||||||||||
| 2009 | 2008 | 2007 | ||||||||||
| Operations Data: |
||||||||||||
| Contract deposits: |
||||||||||||
| Variable |
$ | 112.2 | $ | 134.4 | $ | 149.9 | ||||||
| Fixed |
237.6 | 177.3 | 187.2 | |||||||||
| Total |
349.8 | 311.7 | 337.1 | |||||||||
| Contract charges earned |
14.5 | 17.7 | 21.8 | |||||||||
| Net investment income |
149.7 | 136.2 | 128.9 | |||||||||
| Net interest margin (without realized investment gains and losses) |
49.7 | 42.7 | 38.9 | |||||||||
| Income before income taxes |
32.3 | 20.6 | 25.9 | |||||||||
| Net income |
21.2 | 17.3 | 17.6 | |||||||||
| Operating Statistics: |
||||||||||||
| Fixed: |
||||||||||||
| Accumulated value |
$ | 2,487.2 | $ | 2,297.1 | $ | 2,151.9 | ||||||
| Accumulated value persistency |
94.4 | % | 93.5 | % | 91.6 | % | ||||||
| Variable: |
||||||||||||
| Accumulated value |
$ | 1,226.4 | $ | 965.2 | $ | 1,562.2 | ||||||
| Accumulated value persistency |
93.4 | % | 93.2 | % | 90.9 | % | ||||||
| Number of contracts in force |
178,102 | 171,055 | 166,980 | |||||||||
| Average accumulated cash value (in dollars) |
$ | 20,851 | $ | 19,072 | $ | 22,243 | ||||||
| Average annual deposit by contractholders (in dollars) |
$ | 2,405 | $ | 2,390 | $ | 2,427 | ||||||
| Annuity contracts terminated due to surrender, death, maturity or other: |
||||||||||||
| Number of contracts |
7,807 | 7,994 | 9,578 | |||||||||
| Amount |
$ | 226.5 | $ | 258.0 | $ | 345.0 | ||||||
| Fixed accumulated cash value grouped by applicable surrender charge: |
||||||||||||
| 0% |
$ | 891.5 | $ | 766.4 | $ | 700.1 | ||||||
| Greater than 0% but less than 5% |
193.9 | 170.6 | 157.4 | |||||||||
| 5% and greater but less than 10% |
1,264.7 | 1,225.9 | 1,165.2 | |||||||||
| 10% and greater |
26.5 | 21.1 | 15.6 | |||||||||
| Supplementary contracts with life contingencies not subject to discretionary withdrawal |
110.6 | 113.1 | 113.6 | |||||||||
| Total |
$ | 2,487.2 | $ | 2,297.1 | $ | 2,151.9 | ||||||
17
Table of Contents
The Company entered the individual life insurance business in 1949 with traditional term and whole life insurance products. In 2006, the Company introduced Life by Design, a new portfolio of Horace Mann manufactured and branded life insurance products to better address the financial planning needs of educators. The Life by Design portfolio features new individual and joint whole life, and individual and joint term products, including 10-, 20- and 30-year level term policies. The Life by Design policies have premiums that are guaranteed for the duration of the contract and offer lower minimum face amounts. After December 31, 2006, the Company no longer issues new policies for its “Experience Life” product, a flexible, adjustable-premium life insurance contract that includes availability of an interest-bearing account. In 2009, the Company introduced a new discount for educator customers to improve the competitiveness of its life product portfolio. New marketing support tools were also introduced to aid the agency force.
The Company’s traditional term, whole life and group life business in force consists of approximately 145,000 policies, representing approximately $9.3 billion of life insurance in force, with annual insurance premiums and contract deposits of approximately $43.9 million as of December 31, 2009. In addition, the Company also had in force approximately 68,000 Experience Life policies, representing approximately $4.5 billion of life insurance in force, with annual insurance premiums and contract deposits of approximately $54.1 million.
In 2009, the life segment represented 10% of the Company’s total insurance premiums written and contract deposits, including less than 1 percentage point attributable to the Company’s group life and group disability income business.
During 2009, the average face amount of ordinary life insurance policies issued by the Company was $165,901 and the average face amount of all ordinary life insurance policies in force at December 31, 2009 was $75,845.
The maximum individual life insurance risk retained by the Company is $200,000 on any individual life, while either $100,000 or $125,000 is retained on each group life policy depending on the type of coverage. The excess of the amounts retained are reinsured with life reinsurers that are rated “A- (Excellent)” or above by A.M. Best. The Company also maintains a life catastrophe reinsurance program. The Company reinsures 100% of the catastrophe risk in excess of $1 million up to $25 million per occurrence, with one reinstatement. The Company’s catastrophe risk reinsurance program covers acts of terrorism and includes nuclear, biological and chemical explosions but excludes other acts of war.
The Company has programs to offer long-term care policies, variable universal life policies and fixed interest rate universal life insurance with three third-party vendors underwriting such insurance. Under these programs, the third-party vendors underwrite and bear the risk of these insurance policies and the Company receives a commission on the sale of that business.
18
Table of Contents
Selected Historical Financial Information For Life Segment
The following table sets forth certain information with respect to the Company’s life products for the periods indicated.
Life Segment
Selected Historical Financial Information
(Dollars in millions, unless otherwise indicated)
| Year Ended December 31, | ||||||||||||
| 2009 | 2008 | 2007 | ||||||||||
| Operations Data: |
||||||||||||
| Insurance premiums and contract deposits |
$ | 100.4 | $ | 102.5 | $ | 102.4 | ||||||
| Insurance premiums and contract charges earned |
97.8 | 99.7 | 97.4 | |||||||||
| Net investment income |
63.8 | 59.3 | 57.0 | |||||||||
| Income before income taxes |
28.9 | 25.6 | 26.6 | |||||||||
| Net income |
18.4 | 16.4 | 17.3 | |||||||||
| Operating Statistics: |
||||||||||||
| Life insurance in force: |
||||||||||||
| Ordinary life |
$ | 12,541 | $ | 12,293 | $ | 12,093 | ||||||
| Group life |
1,220 | 1,379 | 1,484 | |||||||||
| Total |
$ | 13,761 | $ | 13,672 | $ | 13,577 | ||||||
| Number of policies in force: |
||||||||||||
| Ordinary life |
165,350 | 167,637 | 170,388 | |||||||||
| Group life |
47,906 | 53,717 | 56,114 | |||||||||
| Total |
213,256 | 221,354 | 226,502 | |||||||||
| Average face amount in force (in dollars): |
||||||||||||
| Ordinary life |
$ | 75,845 | $ | 73,331 | $ | 70,973 | ||||||
| Group life |
25,467 | 25,672 | 26,446 | |||||||||
| Total |
64,528 | 61,765 | 59,942 | |||||||||
| Lapse ratio (ordinary life insurance in force) |
5.4 | % | 5.4 | % | 5.8 | % | ||||||
| Ordinary life insurance terminated due to death, surrender, lapse or other: |
||||||||||||
| Face amount of insurance surrendered or lapsed |
$ | 646.0 | $ | 618.7 | $ | 659.4 | ||||||
| Number of policies |
5,213 | 5,429 | 5,690 | |||||||||
| Amount of death claims opened |
$ | 39.7 | $ | 38.6 | $ | 34.8 | ||||||
| Number of death claims opened |
1,395 | 1,330 | 1,344 | |||||||||
The Company operates in a highly competitive environment. The insurance industry consists of a large number of insurance companies, some of which have substantially greater financial resources, more diversified product lines, greater economies of scale and/or lower-cost marketing approaches, such as direct marketing, mail, Internet and telemarketing, compared to the Company. In the Company’s target market, management believes that the principal competitive factors in the sale of property and casualty insurance products are price, service, name recognition and education association sponsorships. Management believes that the principal competitive factors in the sale of life insurance and annuity products are product features, perceived stability of the insurer, service, name recognition, price and education association sponsorships.
The Company competes in its target market with a number of national providers of personal automobile, homeowners and life insurance such as State Farm, Allstate, Farmers and Nationwide as well as several regional companies. The Company also competes for automobile business with other companies such as GEICO, Progressive and USAA, many of which feature direct marketing distribution.
19
Table of Contents
Among the major national providers of annuities to educators, Variable Annuity Life Insurance Company (“VALIC”), a subsidiary of American International Group (“AIG”), is one of the Company’s major tax-qualified annuity competitors, as are ING US Financial Services, The Hartford Financial Services Group, Inc., MetLife and Security Benefit. For independent agents distributing the Company’s 403(b) tax-qualified annuity products, Life Insurance Company of the Southwest, a subsidiary of National Life Insurance Company, is a major competitor. Mutual fund families, independent agent companies and financial planners also compete in this marketplace.
The market for tax-deferred annuity products has been impacted by the new Internal Revenue Service Section 403(b) regulations, which made the 403(b) market more comparable to the 401(k) market than it has been in the past. While this may drive some competitors out of this market, it may make the 403(b) market more attractive to some of the larger 401(k) providers, including both insurance and mutual fund companies, that had not previously been active competitors in this business.
The Company’s investments are selected to balance the objectives of protecting principal, minimizing exposure to interest rate risk and providing a high current yield. These objectives are implemented through a portfolio that emphasizes investment grade, publicly traded fixed income securities. When impairment of the value of an investment is considered other than temporary, the decrease in value is recorded and a new cost basis is established. At December 31, 2009, fixed income securities represented 89.6% of the Company’s total investment portfolio, at fair value. Of the fixed income investment portfolio, 94.8% was investment grade and nearly 100% was publicly traded. At December 31, 2009, the average quality and average option-adjusted duration of the total fixed income portfolio were A+ and 6.8 years, respectively. At December 31, 2009, investments in non-investment grade fixed income securities represented 4.7% of the total investment portfolio, at fair value. There are no significant investments in mortgage whole loans, real estate, foreign securities, privately placed securities, or common stocks. As of December 31, 2009 and as of the time of this Annual Report on Form 10-K, the Company’s securities lending program is suspended and no securities are on loan.
The Company has separate investment strategies and guidelines for its property and casualty, annuity and life assets, which recognize different characteristics of the associated insurance liabilities, as well as different tax and regulatory environments. The Company manages interest rate exposure for its portfolios through asset/liability management techniques which attempt to coordinate the duration of the assets with the duration of the insurance policy liabilities. Duration of assets and liabilities will generally differ only because of opportunities to significantly increase yields or because policy values are not interest-sensitive, as is the case in the property and casualty segment.
The investments of each insurance subsidiary must comply with the insurance laws of such insurance subsidiary’s domiciliary state. These laws prescribe the type and amount of investments that may be purchased and held by insurance companies. In general, these laws permit investments, within specified limits and subject to certain qualifications, in federal, state and municipal obligations, corporate bonds, mortgage-backed bonds, other asset-backed bonds, preferred stocks, common stocks, real estate mortgages and real estate.
20
Table of Contents
The following table sets forth the carrying values and amortized cost of the Company’s investment portfolio as of December 31, 2009:
Investment Portfolio
(Dollars in millions)
| Percentage of Total |
Carrying Value | Amortized Cost | |||||||||||||
| Carrying Value |
Total | Life and Annuity |
Property and Casualty |
||||||||||||
| Publicly Traded Fixed Maturity Securities, Equity Securities and Short-term Investments: |
|||||||||||||||
| U.S. government and agency obligations (1): |
|||||||||||||||
| Mortgage-backed securities |
10.0 | % | $ | 455.1 | $ | 438.3 | $ | 16.8 | $ | 436.8 | |||||
| Other |
7.6 | 347.2 | 334.9 | 12.3 | 361.0 | ||||||||||
| Investment grade corporate and public utility bonds |
34.9 | 1,595.5 | 1,522.4 | 73.1 | 1,515.2 | ||||||||||
| Municipal bonds |
20.0 | 913.9 | 341.8 | 572.1 | 891.1 | ||||||||||
| Other mortgage-backed securities (2) |
11.0 | 503.2 | 498.6 | 4.6 | 566.3 | ||||||||||
| Non-investment grade corporate and public utility bonds (3) |
4.1 | 186.5 | 128.5 | 58.0 | 191.6 | ||||||||||
| Foreign government bonds |
0.9 | 41.9 | 39.7 | 2.2 | 39.9 | ||||||||||
| Investment grade redeemable preferred stock |
1.2 | 56.5 | 54.7 | 1.8 | 60.0 | ||||||||||
| Non-investment grade redeemable preferred stocks (3) |
— | — | — | — | — | ||||||||||
| Equity securities: |
|||||||||||||||
| Investment grade non-redeemable preferred stocks |
1.1 | 47.7 | 35.1 | 12.6 | 52.3 | ||||||||||
| Non-investment grade non-redeemable preferred stocks (3) |
0.2 | 10.3 | 4.3 | 6.0 | 8.3 | ||||||||||
| Common stocks |
— | 1.7 | 1.1 | 0.6 | 0.9 | ||||||||||
| Short-term investments (4) |
6.5 | 299.0 | 252.6 | 46.4 | 299.0 | ||||||||||
| Short-term investments, loaned securities collateral (4) |
— | — | — | — | — | ||||||||||
| Total publicly traded securities |
97.5 | 4,458.5 | 3,652.0 | 806.5 | 4,422.4 | ||||||||||
| Other Investments: |
|||||||||||||||
| Private placements, investment grade (5) |
— | — | — | — | — | ||||||||||
| Private placements, non-investment grade (3) (5) |
— | 0.1 | 0.1 | — | 0.1 | ||||||||||
| Mortgage loans (6) |
— | 2.5 | 2.5 | — | 2.5 | ||||||||||
| Policy loans |
2.5 | 113.5 | 113.5 | — | 113.5 | ||||||||||
| Total other investments |
2.5 | 116.1 | 116.1 | — | 116.1 | ||||||||||
| Total investments (7) |
100.0 | % | $ | 4,574.6 | $ | 3,768.1 | $ | 806.5 | $ | 4,538.5 | |||||
| (1) | Includes $370.5 million fair value of investments guaranteed by the full faith and credit of the U.S. government and $431.8 million fair value of federally sponsored agency securities which are not backed by the full faith and credit of the U.S. government. |
| (2) | Includes commercial mortgage-backed securities, asset-backed securities, other mortgage-backed securities and collateralized debt obligations. See also “Management’s Discussion and Analysis of Financial Condition and Results of Operations — Results of Operations for the Three Years Ended December 31, 2009 — Net Realized Investment Gains and Losses” listed on page F-1 of this report. |
| (3) | A non-investment grade rating is assigned to a security when it is acquired or when it is downgraded from investment grade, primarily on the basis of the Standard & Poor’s Corporation (“Standard & Poor’s” or “S&P”) rating for such security, or if there is no S&P rating, the Moody’s Investors Service, Inc. (“Moody’s”) rating for such security, or if there is no S&P or Moody’s rating, the National Association of Insurance Commissioners’ (the “NAIC”) rating for such security. The rating agencies monitor securities, and their issuers, regularly and make changes to the ratings as necessary. The Company incorporates rating changes on a monthly basis. |
| (4) | Short-term investments mature within one year of being acquired and are carried at cost, which approximates fair value. Short-term investments represent $299.0 million in money market funds rated “AAA”. As of December 31, 2009 and the time of this Annual Report on Form 10-K, the Company’s securities lending program is suspended. |
| (5) | Fair values for private placements are estimated by the Company with the assistance of its investment advisors. |
| (6) | Mortgage loans are carried at amortized cost or unpaid principal balance. |
| (7) | Approximately 7% of the Company’s investment portfolio, having a carrying value of $322.3 million as of December 31, 2009, consisted of securities with some form of credit support, such as insurance. Of the securities with credit support as of December 31, 2009, municipal bonds represented $266.8 million carrying value. Of the securities with credit support 29% have the highest investment grade rating. |
21
Table of Contents
Fixed Maturity Securities and Equity Securities
The following table sets forth the composition of the Company’s fixed maturity securities and equity securities portfolios by rating as of December 31, 2009:
Rating of Fixed Maturity Securities and Equity Securities(1)
(Dollars in millions)
| Percent of Total Carrying Value |
Carrying Value |
Amortized Cost | |||||||
| Fixed maturity securities |
|||||||||
| AAA |
32.8 | % | $ | 1,346.6 | $ | 1,326.7 | |||
| AA |
14.3 | 587.8 | 584.0 | ||||||
| A |
26.2 | 1,072.1 | 1,053.0 | ||||||
| BBB |
21.5 | 880.2 | 856.0 | ||||||
| BB |
3.2 | 129.5 | 146.8 | ||||||
| B |
1.9 | 77.6 | 87.7 | ||||||
| CCC or lower |
0.1 | 6.0 | 7.7 | ||||||
| Not rated (2) |
— | 0.1 | 0.1 | ||||||
| Total fixed maturity securities |
100.0 | % | $ | 4,099.9 | $ | 4,062.0 | |||
| Equity securities |
|||||||||
| AAA |
10.1 | % | $ | 6.0 | $ | 6.0 | |||
| AA |
— | — | — | ||||||
| A |
27.5 | 16.4 | 18.4 | ||||||
| BBB |
44.0 | 26.3 | 29.0 | ||||||
| BB |
15.4 | 9.2 | 7.2 | ||||||
| B |
— | — | — | ||||||
| CCC or lower |
0.2 | 0.1 | — | ||||||
| Not rated (3) |
2.8 | 1.7 | 0.9 | ||||||
| Total equity securities |
100.0 | % | $ | 59.7 | $ | 61.5 | |||
| (1) | Ratings are as assigned primarily by S&P when available, with remaining ratings as assigned on an equivalent basis by Moody’s. Ratings for publicly traded securities are determined when the securities are acquired and are updated monthly to reflect any changes in ratings. |
| (2) | Included in this category is $0.1 million fair value of private placement securities not rated by either S&P or Moody’s. |
| (3) | This category represents common stocks that are not rated by either S&P or Moody’s. |
At December 31, 2009, 25.2% of the Company’s fixed maturity securities portfolio was expected to mature within the next 5 years. Mortgage-backed securities, including mortgage-backed securities of U.S. governmental agencies, represented 20.5% of the total investment portfolio at December 31, 2009. These securities typically have average lives shorter than their stated maturities due to unscheduled prepayments on the underlying mortgages. Mortgages are prepaid for a variety of reasons, including sales of existing homes, interest rate changes over time that encourage homeowners to refinance their mortgages and defaults by homeowners on mortgages that are then paid by guarantors.
For financial reporting purposes, the Company has classified the entire fixed maturity portfolio as “available for sale”. Fixed maturities to be held for indefinite periods of time and not intended to be held to maturity are classified as available for sale and carried at fair value. The net adjustment for unrealized gains and losses on securities available for sale is recorded as a separate component of shareholders’ equity, net of applicable deferred tax asset or liability and the related impact on deferred policy acquisition costs associated with interest-sensitive life and annuity contracts. Fixed maturities held for indefinite periods of time include securities that management intends to use as part of its asset/liability management strategy and that may be sold in response to changes in interest rates, resultant prepayment risk and other related factors, other than securities that are in an unrealized loss position for which management has the stated intent to hold until recovery.
22
Table of Contents
As a holding company, HMEC conducts its principal operations through its subsidiaries. Payment by HMEC of principal and interest with respect to HMEC’s indebtedness, and payment by HMEC of dividends to its shareholders, are dependent upon the ability of its insurance subsidiaries to pay cash dividends or make other cash payments to HMEC, including tax payments pursuant to tax sharing agreements. Restrictions on the subsidiaries’ ability to pay dividends or to make other cash payments to HMEC may materially affect HMEC’s ability to pay principal and interest on its indebtedness and dividends on its common stock.
The ability of the insurance subsidiaries to pay cash dividends to HMEC is subject to state insurance department regulations which generally permit dividends to be paid for any 12 month period in amounts equal to the greater of (i) net income for the preceding calendar year or (ii) 10% of surplus, determined in conformity with statutory accounting principles, as of the preceding December 31st. Any dividend in excess of these levels requires the prior approval of the Director or Commissioner of the state insurance department of the state in which the dividend paying insurance subsidiary is domiciled. The aggregate amount of dividends that may be paid in 2010 from all of HMEC’s insurance subsidiaries without prior regulatory approval is approximately $64 million.
Notwithstanding the foregoing, if insurance regulators otherwise determine that payment of a dividend or any other payment to an affiliate would be detrimental to an insurance subsidiary’s policyholders or creditors, because of the financial condition of the insurance subsidiary or otherwise, the regulators may block dividends or other payments to affiliates that would otherwise be permitted without prior approval.
General Regulation at State Level
As an insurance holding company, HMEC is subject to extensive regulation by the states in which its insurance subsidiaries are domiciled or transact business. In addition, the laws of the various states establish regulatory agencies with broad administrative powers to grant and revoke licenses to transact business, regulate trade practices, license agents, require statutory financial statements, and prescribe the type and amount of investments permitted.
The NAIC has adopted risk-based capital guidelines to evaluate the adequacy of statutory capital and surplus in relation to an insurance company’s risks. State insurance regulations prohibit insurance companies from making any public statements or representations with regard to their risk-based capital levels. Based on current guidelines, the risk-based capital statutory requirements are not expected to have a negative regulatory impact on the Company’s insurance subsidiaries. At December 31, 2009 and 2008, statutory capital and surplus of each of the Company’s insurance subsidiaries was above required levels.
23
Table of Contents
Assessments Against Insurers
Under insurance insolvency or guaranty laws in most states in which the Company operates, insurers doing business therein can be assessed for policyholder losses related to insolvencies of other insurance companies. The amount and timing of any future assessments on the Company under these laws cannot be reasonably estimated and are beyond the control of the Company. Most of these laws do provide, however, that an assessment may be excused or deferred if it would threaten an insurer’s financial strength, and many assessments paid by the Company pursuant to these laws may be used as credits for a portion of the Company’s premium taxes in certain states. For the three years ended December 31, 2009, the Company’s assessments, net of the related premium tax credits, were not significant.
Insurers may also be assessed by entities such as the Citizens Property Insurance Corporation of Florida (“Florida Citizens”) and the Louisiana Citizens Fair and Coastal Plan (“Louisiana Citizens”) as a result of significant hurricane events. Related to such assessments levied in 2005 and 2006, insurers were permitted to in turn assess its policyholders in the respective states to recoup the amounts remitted to Florida Citizens and Louisiana Citizens.
Mandatory Insurance Facilities
The Company is required to participate in various mandatory insurance facilities in proportion to the amount of the Company’s direct writings in the applicable state.
In 2009, 2008 and 2007, the Company reflected pretax net gains (losses) from participation in such mandatory pools and underwriting associations of $(0.8) million, $0.9 million and $2.3 million, respectively.
In addition to the pretax net loss from these mandatory participations in 2009, the Company recorded a pretax charge of $3.8 million to write off its equity interest in the accumulated surplus of the North Carolina Beach Plan. See “Management’s Discussion and Analysis of Financial Condition and Results of Operations — Results of Operations for the Three Years Ended December 31, 2009 — Other Income” listed on page F-1 of this report.
Regulation at Federal Level
Although the federal government generally does not directly regulate the insurance industry, federal initiatives often impact the insurance business. Current and proposed federal measures which may significantly affect insurance and annuity business include employee benefits regulation, controls on the costs of medical care, medical entitlement programs such as Medicare, structure of retirement plans and accounts, changes to the insurance industry anti-trust exemption, and minimum solvency requirements. Other federal regulation such as the Fair Credit Reporting Act, Gramm-Leach-Bliley Act and USA PATRIOT Act, including its anti-money laundering regulations, also impact the Company’s business.
The variable annuities underwritten by HMLIC are regulated by the SEC. Horace Mann Investors, Inc., the broker-dealer subsidiary of HMEC, also is regulated by the SEC, FINRA, the Municipal Securities Rule-making Board (“MSRB”) and various state securities regulators.
24
Table of Contents
Federal income taxation of the build-up of cash value within a life insurance policy or an annuity contract could have a materially adverse impact on the Company’s ability to market and sell such products. Various legislation to this effect has been proposed in the past, but has not been enacted. Although no such legislative proposals are known to exist at this time, such proposals may be made again in the future.
Changes in other federal and state laws and regulations could also affect the relative tax and other advantages of the Company’s life and annuity products to customers. For instance, new Internal Revenue Service (“IRS”) Section 403(b) regulations were effective January 1, 2009 with limited exceptions. The new regulations altered the nature of 403(b) arrangements causing them to more closely resemble other traditional employer sponsored plans, compared to the historical view of 403(b) arrangements being individual plans funded by salary reduction. Under the new regulations, contributions to Section 403(b) tax-qualified arrangements, including annuities, are required to be made pursuant to a written plan which includes all of the terms and conditions for eligibility, limitations and benefits under the plan, and which may incorporate other documents by reference including annuity contracts issued by approved product providers. Other highlights of the new regulations include modified distribution and transfer rules and the incorporation of numerous positions previously taken by the IRS since last issuing formal comprehensive Section 403(b) regulations in 1964. While the deadline for plan sponsors to have a formal written plan in place was extended until December 31, 2009, such plans were required to satisfy the regulations that were in effect as of January 1, 2009, and sponsors had to correct operations that were in conflict with the terms of the plan as of the plan’s effective date. Since the proposed new regulations were promulgated in 2004, the Company, and many other providers of 403(b) arrangements, had been adapting its administrative systems, products and services offered to better meet the changing needs of the school district sponsors of 403(b) plans. The lead time to the effective date, combined with preparations made by the Company since the new regulations were first proposed, provided time to assist the key school districts where Horace Mann has Section 403(b) payroll slots with the development of their written plans and to implement the new products and services required to enable the Company to continue to effectively serve this market.
One immediate impact of the new Section 403(b) regulations has been that previous rules governing a participant’s ability to exchange one 403(b) annuity or funding agreement for another without incurring income tax liability were changed effective September 25, 2007. Under the new regulations, plan sponsors control whether such exchanges are even permitted within their plan, and which providers are eligible to receive them. The fact that this change occurred prior to the effective date of the remainder of the new regulations created some confusion among plan sponsors and product providers in the period from September 25, 2007 through December 2008, which slowed the pace of such exchanges. This contributed to both reduced sales and improved retention for the Company in 2008 and also impacted the industry as a whole. As anticipated, a return to a more normal flow of exchanges was experienced during 2009 as sponsors and providers became more comfortable with the new rules, resulting in a significant increase in overall single premium and rollover sales compared to 2008 and 2007.
25
Table of Contents
Proposed Federal Oversight of Financial Institutions
As of the time of this Annual Report on Form 10-K, consideration of significant reform of the federal oversight of financial institutions is underway by the 111th Congress and the Obama Administration. A central objective of this reform is establishment of new federal oversight of the systemic risk posed by the various financial institutions and their products and services to the broader U.S. economy. The question of the extent to which the insurance industry poses such risk and whether it should be the subject of federal regulation is unsettled in these reform debates. Proposals for federal oversight of the insurance industry range from comprehensive supervision through an optional federal charter to a more circumspect approach of establishing a federal insurance information office. Management will closely monitor these developments for impact on the Company, insurers of similar size and the insurance industry as a whole.
At December 31, 2009, the Company had approximately 1,400 non-agent employees and 466 full-time employee agents. (This does not include 249 Exclusive Agent independent contractors that were part of the Company’s total dedicated agency force at December 31, 2009.) The Company has no collective bargaining agreement with any employees.
| ITEM 1A. | Risk Factors |
The following are certain risk factors that could affect the Company’s business, financial results and results of operations. In addition, refer to the risk factors disclosed in “Management’s Discussion and Analysis of Financial Condition and Results of Operations — Forward-looking Information”, listed on page F-1 of this report for certain important factors that may cause our financial condition and results of operations to differ materially from current expectations. The risks that the Company has highlighted in these two sections of this report are not the only ones that the Company faces. In this discussion, the Company is also referred to as “our”, “we” and “us”.
The Company’s business involves various risks and uncertainties which are based on the lines of business the Company writes as well as more global risks associated with the general business and insurance industry environments.
Volatile financial markets and economic environments can impact financial markets risk as well as our financial condition and results of operations.
Financial markets in the U.S. and elsewhere can experience extreme volatility and disruption for uncertain periods of time. In 2008 and 2009, volatility occurred largely due to the stresses affecting the global banking system, which accelerated significantly in the second half of 2008. The U.S. entered a severe recession that, while moderating, is likely to persist well into and perhaps even beyond 2010, despite governmental intervention in the economy. These circumstances exerted significant downward pressure on prices of equity securities and many other investment asset classes and resulted in substantially increased market volatility, severely constrained credit and capital markets, particularly for financial institutions, and an overall loss of investor confidence. Like other financial institutions, which face significant financial markets risk in their operations, the Company was adversely affected by these conditions and could be adversely impacted by similar circumstances in the future.
26
Table of Contents
In addition to the effects of financial markets volatility, a prolonged economic recession may have other adverse impacts on our financial condition and results of operations such as: our volume of new business for automobile, homeowners, annuity and life products could be diminished; our policy renewal rates could decrease; the inflow of annuity contract deposit receipts could decrease; surrenders of annuity contracts and related withdrawals of accumulated deposits could increase; property and casualty claims related to uninsured motorists, arson or fraudulent information may increase; the market value of our investment portfolio could be impacted by economic effects on the issuers of the securities we hold; and taxing authorities could increase rates or implement new tax elements in efforts to offset their declining revenues.
If our investment strategy is not successful, we could suffer unexpected losses.
The success of our investment strategy is crucial to the success of our business. Specifically, our fixed income portfolio is subject to a number of risks including:
| • | market value risk, which is the risk that our invested assets will decrease in value due to a change in the yields realized on our assets and prevailing market yields for similar assets, an unfavorable change in the liquidity of the investment or an unfavorable change in the financial prospects or a downgrade in the credit rating of the issuer of the investment; |
| • | credit risk, which is the risk that the value of certain investments becomes impaired due to deterioration in financial condition of one or more issuers of those instruments or the deterioration in performance or credit quality of the underlying collateral of certain structured securities and, ultimately, the risk of permanent loss in the event of default by an issuer or underlying credit; |
| • | market fundamentals risk, which is the risk that there are changes in the market that can have an unfavorable impact on securities valuation such as availability of credit in the capital markets, re-pricing of credit risk, reduced market liquidity, and increased market volatility; |
| • | reinvestment risk, which is the risk that interest rates will decline and funds reinvested will earn less than expected; |
| • | concentration risk, which is the risk that the portfolio may be too heavily concentrated in the securities of one or more issuers, sectors or industries, which could result in a significant decrease in the value of the portfolio in the event of deterioration in the financial condition of those issuers or the market value of their securities; |
| • | liquidity risk, which is the risk that liabilities are surrendered or mature sooner than anticipated requiring us to sell assets at an undesirable time to provide for policyholder surrenders, withdrawals or claims; and |
| • | regulatory risk, which is the risk that regulatory bodies or governments, in the U.S. or in other countries, may make substantial investments or take significant ownership positions in, or ultimately nationalize, financial institutions or other issuers of securities held in the Company’s investment portfolio, which could adversely impact the seniority or contractual terms of the securities. |
In addition to significant steps taken to attempt to mitigate these risks through our investment guidelines, policies and procedures, we also attempt to mitigate these risks through product pricing, product features and the establishment of policy reserves, but we cannot provide assurance that assets will be properly matched to meet anticipated liabilities or that our investments will provide sufficient returns to enable us to satisfy our guaranteed fixed benefit obligations.
27
Table of Contents
Although historically the Company has not been a party to these transactions, from time to time we could also enter into foreign currency, interest rate, credit derivative and other hedging transactions in an effort to manage risks. We cannot provide assurance that we will successfully structure those derivatives and hedges so as to effectively manage these risks. If our calculations are incorrect, or if we do not properly structure our derivatives or hedges, we may have unexpected losses and our assets may not be adequate to meet our needed reserves, which could adversely affect our financial condition and results of operations.
Declining financial markets could also cause, and in the past have caused, the value of the investments in our defined benefit pension plan to decrease, resulting in additional pension expense, a reduction in other comprehensive income and an increase in required contributions to the defined benefit pension plan.
Our annuity business may be, and in the past has been, adversely affected by volatile or declining financial market conditions.
Conditions in the U.S. and international financial markets affect the sale and profitability of our annuity products. In general, sales of variable annuities decrease when financial markets are declining or experiencing a higher than normal level of volatility over an extended period of time. Therefore, weak and/or volatile financial market performance may adversely affect sales of our variable annuity products to potential customers, may cause current customers to withdraw or reduce the amounts invested in our variable annuity products and may reduce the market value of existing customers’ investments in our variable annuity products, in turn reducing the amount of variable annuity fee revenues generated. In addition, some of our variable annuity contracts offer guaranteed minimum death benefit features, which provide for a benefit if the contractholder dies and the contract value is less than a specified amount. A decline in the financial markets could cause the contract value to fall below this specified amount, increasing our exposure to losses from variable annuity products featuring guaranteed minimum death benefits. Declining or volatile financial markets may also impact the valuations of deferred policy acquisition costs.
Interest rate fluctuations could negatively affect the income we derive from the difference between the interest rates we earn on our investments and the interest we pay under our fixed annuity and interest-sensitive life contracts.
Significant changes in interest rates expose us to the risk of not earning income or experiencing losses based on the differences between the interest rates earned on our investments and the credited interest rates paid on our outstanding fixed annuity and interest-sensitive life contracts. Significant changes in interest rates may affect:
| • | the unrealized gains and losses in our investment portfolio and the related after-tax effect on our shareholders’ equity and total capital; |
| • | the book yield of our investment portfolio; and |
| • | the ability of our insurance subsidiaries to maintain appropriate interest rate spreads over the fixed rates guaranteed in their life and annuity products. |
Both rising and declining interest rates can negatively affect the income we derive from these interest rate spreads. During periods of falling interest rates, our investment earnings will be lower because new investments in fixed maturity securities will likely bear lower interest rates. We may not be able to fully offset the decline in investment earnings with lower crediting rates on our annuity contracts. During periods of rising interest rates, there may be competitive pressure to increase the crediting rates on our annuity contracts. We may not,
28
Table of Contents
however, have the ability immediately to acquire investments with interest rates sufficient to offset an increase in crediting rates under our annuity contracts. Although we develop and maintain asset/liability management programs and procedures designed to reduce the volatility of our income when interest rates are rising or falling, changes in interest rates can affect our interest rate spreads.
Changes in interest rates may also affect our business in other ways. For example, a rapidly changing interest rate environment may result in less competitive crediting rates on certain of our fixed-rate products which could make those products less attractive, leading to lower sales and/or increases in the level of life insurance and annuity product surrenders and withdrawals. Interest rate fluctuations may also impact the valuations of deferred policy acquisition costs.
Losses due to defaults by others could reduce our profitability or negatively affect the value of our investments.
Third parties that owe us money, securities or other assets may not pay or perform their obligations. These parties may include the issuers whose securities we hold, borrowers under mortgage loans, customers, trading counterparties, counterparties under swaps and other derivative contracts, reinsurers, clearing agents, exchanges, clearing houses and other financial intermediaries. These parties may default on their obligations to us due to bankruptcy, lack of liquidity, downturns in the economy or real estate values, operational failure or other reasons.
The default of a major market participant could disrupt the securities markets or clearance and settlement systems in the U.S. or abroad. A failure of a major market participant could cause some clearance and settlement systems to assess members of that system, including our broker-dealer subsidiary, or could lead to a chain of defaults that could adversely affect us. A default of a major market participant could disrupt various markets, which could in turn cause market declines or volatility and negatively impact our financial condition and results of operations.
Catastrophic events can have a material adverse effect on our financial condition and results of operations.
Underwriting results of property and casualty insurers are subject to weather and other conditions prevailing in an accident year. While one year may be relatively free of major weather or other disasters, another year may have numerous such events causing results for such a year to be materially worse than for other years.
Our property and casualty insurance subsidiaries have experienced, and we anticipate that in the future they will continue to experience, catastrophe losses. A catastrophic event or a series of multiple catastrophic events could have a material adverse effect on the financial condition and results of operations of our insurance subsidiaries.
29
Table of Contents
Various events can cause catastrophes, including hurricanes, windstorms, earthquakes, hail, terrorism, explosions, severe winter weather and wildfires. The frequency and severity of these catastrophes are inherently unpredictable. The extent of losses from a catastrophe is a function of both the total amount of insured exposures in the area affected by the event and the severity of the event. Although catastrophes can cause losses in a variety of property and casualty lines, most of the catastrophe-related claims of our insurance subsidiaries are related to homeowners’ coverages. Our ability to provide accurate estimates of ultimate catastrophe costs is based on several factors, including:
| • | the proximity of the catastrophe occurrence date to the date of our estimate; |
| • | potential inflation of property repair costs in the affected area; |
| • | the occurrence of multiple catastrophes in a geographic area over a relatively short period of time; and |
| • | the outcome of litigation which may be filed against the Company by policyholders, state attorneys general and other parties relative to loss coverage disputes and loss settlement payments. |
Based on 2009 direct premiums earned, approximately 58% of the total annual premiums for our property and casualty business were for policies issued in the ten largest states in which our insurance subsidiaries write property and casualty coverage. Included in this top ten group are certain states which are considered to be more prone to catastrophe occurrences: Florida, California, North Carolina, Texas, Louisiana, South Carolina and Georgia.
As an ongoing practice, but particularly following the significant catastrophic claims from hurricanes in 2005 and 2004, we attempt to manage our exposure to catastrophes. Reductions in property and casualty business written in catastrophe-prone areas, including an additional risk reduction program initiated in Florida in 2010, may have a negative impact on near-term business growth and results of operations.
In addition to the potential impact on our property and casualty subsidiaries, our life subsidiary could experience claims of a catastrophic magnitude from events such as pandemics; terrorism; nuclear, biological or chemical explosions; or other acts of war.
Our insurance subsidiaries seek to reduce their exposure to catastrophe losses through their underwriting strategies and the purchase of catastrophe reinsurance. Nevertheless, reinsurance may prove inadequate if:
| • | a major catastrophic loss exceeds the reinsurance limit; |
| • | a series of major catastrophic events in a single year exhaust the reinsurance coverage; or |
| • | an insurance subsidiary incurs multiple, smaller catastrophic losses which, individually, do not exceed the subsidiary’s loss retention level. |
30
Table of Contents
Uncollectible reinsurance, as well as reinsurance availability and pricing, can have a material adverse effect upon our business volume and profitability.
Reinsurance is a contract by which one insurer, called a reinsurer, agrees to cover a portion of the losses incurred by a second insurer in the event a claim is made under a policy issued by the second insurer. Our insurance subsidiaries obtain reinsurance to help manage their exposure to property, casualty and life insurance risks. Although a reinsurer is liable to our insurance subsidiaries according to the terms of its reinsurance policy, the insurance subsidiaries remain primarily liable as the direct insurers on all risks reinsured. As a result, reinsurance does not eliminate the obligation of our insurance subsidiaries to pay all claims, and each insurance subsidiary is subject to the risk that one or more of its reinsurers will be unable or unwilling to honor its obligations.
Although we limit participation in our reinsurance programs to reinsurers with high financial strength ratings, our insurance subsidiaries cannot guarantee that their reinsurers will pay in a timely fashion, if at all. Reinsurers may become financially unsound by the time that they are called upon to pay amounts due, which may not occur for many years. In the case of the Florida Hurricane Catastrophe Fund (“FHCF”), financial deficits and difficulties in accessing the capital markets may require the FHCF to make additional assessments against participating insurers. Additional coverage made available by the FHCF to the insurance industry in future contract periods, as was done for the 2007 through 2009 contract periods, could increase the likelihood of assessments in periods following significant hurricane losses.
Additionally, the availability and cost of reinsurance are subject to prevailing market conditions beyond our control. For example, significant losses from hurricanes or terrorist attacks or an increase in capital requirements could have a significant adverse impact on the reinsurance market.
If one of our insurance subsidiaries is unable to obtain adequate reinsurance at reasonable rates, that insurance subsidiary would have to increase its risk exposure and/or reduce the level of its underwriting commitments, which could have a material adverse effect upon the business volume and profitability of the subsidiary. Alternately, the insurance subsidiary could elect to pay the higher than reasonable rates for reinsurance coverage, which could have a material adverse effect upon its profitability until policy premium rates could be raised, in some cases subject to approval by state regulators, to incorporate this additional cost.
Our property and casualty loss reserves may not be adequate.
Our property and casualty insurance subsidiaries maintain loss reserves to provide for their estimated ultimate liability for losses and loss adjustment expenses with respect to reported and unreported claims incurred as of the end of each accounting period. If these loss reserves prove inadequate, we will record a loss measured by the amount of the shortfall and, as a result, the financial condition and results of operations of our insurance subsidiaries will be adversely affected, potentially affecting their ability to distribute cash to the holding company.
31
Table of Contents
Reserves do not represent an exact calculation of liability. Reserves represent estimates, generally involving actuarial projections at a given time, of what our insurance subsidiaries expect the ultimate settlement and adjustment of claims will cost, net of salvage and subrogation. Estimates are based on assessments of known facts and circumstances, assumptions related to the ultimate cost to settle such claims, estimates of future trends in claims severity and frequency, changing judicial theories of liability and other factors. These variables are affected by both internal and external events, including changes in claims handling procedures, economic inflation, unpredictability of court decisions, plaintiffs’ expanded theories of liability, risks inherent in major litigation and legislative changes. Many of these items are not directly quantifiable, particularly on a prospective basis. Significant reporting lags may exist between the occurrence of an insured event and the time it is actually reported. Our insurance subsidiaries adjust their reserve estimates regularly as experience develops and further claims are reported and settled.
Due to the inherent uncertainty in estimating reserves for losses and loss adjustment expenses, we cannot be certain that the ultimate liability will not exceed amounts reserved, with a resulting adverse effect on our financial condition and results of operations.
Changing climate conditions may adversely affect our financial condition, results of operations or cash flows.
Many scientists indicate that the world is getting warmer. Climate change, to the extent it produces rising temperatures and changes in weather patterns, could impact the frequency and/or severity of weather events and wildfires, the affordability and availability of our catastrophe reinsurance coverage, and our results of operations. Our risks related to catastrophic events and reinsurance are disclosed in more detail above. If an increase in weather events and/or wildfires were to occur, in addition to the attendant increase in claim costs, which could adversely impact our results of operations and financial condition, concentrations of insurance risk could impact our ability to make homeowners insurance available to our clients. This could adversely impact our volume of business and our results of operations or cash flows. New laws and regulations that may be implemented as a result of climate change also could have an adverse impact on our cost of doing business and our results of operations or cash flows.
Deviations from assumptions regarding future market appreciation, interest spreads, persistency, mortality and morbidity used in calculating life and annuity reserves and deferred policy acquisition expense amounts could have a material adverse impact on our financial condition and results of operations.
The processes of calculating reserve and deferred policy acquisition expense amounts for our life and annuity businesses involve the use of a number of assumptions, including those related to market appreciation (the rate of growth in market value of the underlying variable annuity subaccounts due to price appreciation), interest spreads (the interest rates expected to be received on investments less the rate of interest credited to contractholders), persistency (how long a contract stays with the company), mortality (the relative incidence of death over a given period of time) and morbidity (the relative incidence of disability resulting from disease or physical impairment). We periodically review the adequacy of these reserves and deferred policy acquisition expenses on an aggregate basis and, if future experience is estimated to differ significantly from previous assumptions, adjustments to reserves and deferred policy acquisition expenses may be required which could have a material adverse effect on our financial condition and results of operations.
32
Table of Contents
An impairment of all or part of our goodwill could adversely affect our results of operations and financial condition.
At December 31, 2009, we had $47.4 million of goodwill recorded on our consolidated balance sheet. Goodwill was recorded when the Company was acquired in 1989 and when Horace Mann Property & Casualty Insurance Company was acquired in 1994, in both instances reflecting the excess of cost over the fair market value of net assets acquired. The December 31, 2009 balance was evaluated for impairment, as described in “Notes to Consolidated Financial Statements — Note 1 — Summary of Significant Accounting Policies”, with no impairment charge resulting from such assessment. If an evaluation of the Company’s fair value or of the Company’s segments’ fair value indicated that all or a portion of the goodwill balance was impaired, the Company would be required to write off the impaired portion. Such a write-off could have an adverse effect on our results of operations and financial condition.
Any downgrade in or adverse change in outlook for our claims-paying ratings, financial strength ratings or credit ratings could adversely affect our financial condition and results of operations.
Claims-paying ratings and financial strength ratings have become an increasingly important factor in establishing the competitive position of insurance companies. In the evolving 403(b) annuity market, school districts and benefit consultants have been placing increased emphasis on the relative financial strength ratings of competing companies. Each rating agency reviews its ratings periodically and from time to time may modify its rating criteria including, among other factors, its expectations regarding capital adequacy, profitability and revenue growth. A downgrade in the ratings or adverse change in the ratings outlook of any of our insurance subsidiaries by a major rating agency could result in a substantial loss of business for that subsidiary if school districts, policyholders or independent agents move their business to other companies having higher claims-paying ratings and financial strength ratings than we do. This loss of business could have a material adverse effect on the financial condition and results of operations of that subsidiary.
The financial covenants related to the Company’s outstanding indebtedness, including the Bank Credit Agreement, consist primarily of relationships of (1) debt to capital, (2) insurance subsidiaries’ insurance financial strength ratings issued by A.M. Best and (3) net worth, as defined in the financial covenants. For instance, if the insurance subsidiaries’ A.M. Best financial strength rating is lowered beneath the A- rating assigned at the time of this Annual Report on Form 10-K, the Company would be in default under its Bank Credit Agreement. This could adversely impact our liquidity, financial condition and results of operations.
A downgrade in our holding company debt rating could adversely impact our cost and flexibility of borrowing which could have an adverse impact on our liquidity, financial condition and results of operations.
33
Table of Contents
Reduction of the statutory surplus of our insurance subsidiaries could adversely affect their ability to write insurance business.
Insurance companies write business based, in part, upon guidelines including a ratio of premiums to surplus for property and casualty insurance companies and a ratio of reserves to surplus for life insurance companies. If our insurance subsidiaries cannot maintain profitability in the future or if significant investment valuation losses are incurred, they may be required to draw on their surplus in order to pay dividends to us to enable us to meet our financial obligations. As their surplus is reduced by the payment of dividends, continuing losses or both, our insurance subsidiaries’ ability to write business and maintain acceptable financial strength ratings could also be reduced. This could have a material adverse effect upon the business volume and profitability of our insurance subsidiaries.
If we are not able to effectively develop and expand our marketing operations, including agents and other points of distribution, our financial condition and results of operations could be adversely affected.
Our success in marketing and selling our products is largely dependent upon the efforts of our full-time, dedicated agent sales force and the success of their agency operations. As we expand our business, we may need to expand the number of agencies marketing our products. If we are unable to appoint additional agents, fail to retain current agents or are unable to increase the productivity of agency operations, sales of our products would likely decline and our financial condition and results of operations would be adversely affected.
Since 2006, the Company has been transitioning from a single-person agent operation to its Agency Business Model, with agents in outside offices with support personnel and licensed producers, designed to remove capacity constraints and increase productivity. Building on this foundation, in 2009 the Company began offering the opportunity for agents to be appointed by the Company as non-employee, independent contractor, Exclusive Agents. If we and the agency force are unable to successfully implement these approaches to expanding our points of distribution and further increasing the productivity of agents, our financial condition and results of operations could be adversely affected.
If we are not able to maintain and secure (1) payroll reduction authorizations and (2) product sponsorships and other relationships with the educational community, our financial condition and results of operations could be adversely affected.
Our ability to successfully grow new business in the educator market is largely dependent on our ability to effectively access educators either in their school buildings or through other approaches. While this is especially true for the sale of 403(b) tax-qualified annuity products via payroll reduction, any significant decrease in access, either through fewer payroll slots, increased security measures or other causes could potentially adversely affect the sale of all lines of our business and require us to change our traditional worksite marketing and advertising approach. With the changes in the IRS regulations regarding Section 403(b) arrangements, including annuities, our ability to maintain and grow our share of the 403(b) market, and the access it gives us for other product lines, will depend on our ability to successfully adapt our products, services offered, and administrative systems, which could potentially increase our cost of doing business in this market. School districts and benefit consultants have been placing additional emphasis on the relative financial strength ratings of competing companies, which may put us at a competitive disadvantage relative to other more highly-rated insurance companies. See also “Business — Regulation — Regulation at Federal Level”.
34
Table of Contents
Our ability to maintain and obtain product sponsorships from local, state and national education associations is important to our marketing strategy. Horace Mann has had a long relationship with the NEA, the nation’s largest confederation of state and local teachers’ associations, and many of the state and local education associations affiliated with the NEA. In addition to these organizations, we have established relationships with various other educator, principal and school administrator groups. These contacts and endorsements help to establish our brand name and presence in the educational community and to enhance our access to educators.
The insurance industry is highly regulated.
We are subject to extensive regulation and supervision in the jurisdictions in which we do business. Each jurisdiction has a unique and complex set of laws and regulations. Furthermore, certain federal laws impose additional requirements on businesses, including insurers. Regulation generally is designed to protect the interests of policyholders, as opposed to stockholders and non-policyholder creditors. Such regulations, among other things, impose restrictions on the amount and type of investments our subsidiaries may hold. Certain states also regulate the rates insurers may charge for certain property and casualty products. Legislation and voter initiatives have expanded, in some instances, the states’ regulation of rates and have increased data reporting requirements. Consumer-related pressures to roll back rates, even if not enacted by legislation or upheld upon judicial appeal, may affect our ability to obtain timely rate increases or operate at desired levels of profitability. Changes in insurance regulations, including those affecting the ability of our insurance subsidiaries to distribute cash to us and those affecting the ability of our insurance subsidiaries to write profitable property and casualty insurance policies in one or more states, may adversely affect the financial condition and results of operations of our insurance subsidiaries. In addition, consumer privacy requirements may increase our cost of processing business. Our ability to comply with laws and regulations, at a reasonable cost, and to obtain necessary regulatory action in a timely manner, is and will continue to be critical to our success.
Examples of governmental regulation that has adversely affected the operations of our insurance subsidiaries include:
| • | the adoption in several states of legislation and other regulatory action intended to reduce the premiums paid for automobile and homeowners insurance by residents of those states; |
| • | limitations on the use of key underwriting information, such as consumer credit or occupation, to properly price the assumed risk; |
| • | restrictions on a company’s ability to achieve pricing adequacy and/or reduce their volume of business in catastrophe prone areas; and |
| • | requirements that insurance companies: |
| • | pay assessments to support associations that fund state-sponsored insurance operations, or |
| • | involuntarily issue policies for high-risk automobile drivers. |
35
Table of Contents
Regulation that could adversely affect our insurance subsidiaries also includes statutory surplus and risk-based capital requirements. Maintaining appropriate levels of surplus, as measured by statutory accounting principles, is considered important by state insurance regulatory authorities and the private agencies that rate insurers’ claims-paying abilities and financial strength. The failure of an insurance subsidiary to maintain levels of statutory surplus that are sufficient for the amount of its insurance written could result in increased regulatory scrutiny, action by state regulatory authorities or a downgrade by rating agencies.
Similarly, the NAIC has adopted a system of assessing minimum capital adequacy that is applicable to our insurance subsidiaries. This system, known as risk-based capital, is used to identify companies that may merit further regulatory action by analyzing the adequacy of the insurer’s surplus in relation to statutory requirements.
Because state legislatures remain concerned about the availability and affordability of property and casualty insurance and the protection of policyholders, our insurance subsidiaries expect that they will continue to face efforts by those legislatures to expand regulations to address these concerns. Resulting new legislation could adversely affect the financial condition and results of operations of our insurance subsidiaries.
In the event of the insolvency, liquidation or other reorganization of any of our insurance subsidiaries, our creditors and stockholders would have no right to proceed against any such insurance subsidiary or to cause the liquidation or bankruptcy of any such insurance subsidiary under federal or state bankruptcy laws. The insurance laws of the domiciliary state would govern such proceedings and the relevant insurance commissioner would act as liquidator or rehabilitator for the insurance subsidiary. Creditors and policyholders of any such insurance subsidiary would be entitled to payment in full from the assets of the insurance subsidiary before we, as a stockholder, would be entitled to receive any distribution.
The financial position of our insurance subsidiaries also may be affected by court decisions that expand insurance coverage beyond the intention of the insurer at the time it originally issued an insurance policy.
In 2008, the United States Treasury Department issued a report, “Blueprint for Financial Regulatory Reform”, including recommendations to improve regulatory oversight of the financial services sector. The report includes a proposal that would establish a federal insurance regulatory structure and allow individual insurance companies the option of obtaining a federal charter, similar to the current dual-chartering system for banking. Congress also has pending proposals regarding optional federal chartering of insurance companies and other various insurance-related matters which have been subject to congressional hearings in 2008 and 2009. Due to the volatility in the financial markets which accelerated in the last half of 2008 and continued in 2009, and in particular volatility for companies in the financial services sector, it is possible that additional oversight or regulation could be imposed at the federal and/or state levels. Management will continue to monitor the existing proposals and any new proposals. Additional regulations could adversely affect the efficiency and effectiveness of business processes, financial condition and results of operations of the Company, insurers of similar size and/or the insurance industry as a whole.
36
Table of Contents
The insurance industry is highly cyclical.
The results of companies in the insurance industry historically have been subject to significant fluctuations due to competition, economic conditions, interest rates and other factors. In particular, companies in the property and casualty insurance segment of the industry historically have experienced pricing and profitability cycles. With respect to these cycles, the factors having the greatest impact include significant and/or rapid changes in loss costs, including changes in loss frequency and/or severity; prior approval and restrictions in certain states for price increases; intense price competition; less restrictive underwriting standards; aggressive marketing; and increased advertising, which have resulted in higher industry-wide combined loss and expense ratios.
The personal lines insurance and annuity markets are highly competitive and our financial condition and results of operations may be adversely affected by competitive forces.
We operate in a highly competitive environment and compete with numerous insurance companies, as well as mutual fund families, independent agent companies and financial planners. In some instances and geographic locations, competitors have specifically targeted the educator marketplace with specialized products and programs. We compete in our target market with a number of national providers of personal automobile and homeowners insurance and life insurance and annuities.
The insurance industry consists of a large number of insurance companies, some of which have substantially greater financial resources, more diversified product lines, greater economies of scale and/or lower-cost marketing approaches, such as direct marketing, mail, Internet and telemarketing, compared to us. In our target market, we believe that the principal competitive factors in the sale of property and casualty insurance products are price, service, name recognition and education association sponsorships. We believe that the principal competitive factors in the sale of life insurance and annuity products are product features, perceived stability of the insurer, service, name recognition, price and education association sponsorships.
Particularly in the property and casualty business, our insurance subsidiaries have experienced, and expect to experience in the future, periods of intense competition during which they may be unable to increase policyholders and revenues without adversely impacting profit margins. The inability of an insurance subsidiary to compete successfully in the property and casualty business would adversely affect its financial condition and results of operations and its resulting ability to distribute cash to us.
In our annuity business, the new Internal Revenue Service (“IRS”) Section 403(b) regulations, which generally took effect January 1, 2009, make the 403(b) market more similar to the 401(k) market than it has been in the past. While this may drive some competitors out of this market, it may make the 403(b) market more attractive to some of the larger 401(k) providers, including both insurance and mutual fund companies, that had not previously been active competitors in this business. The inability of an insurance subsidiary to compete successfully in these markets would adversely affect its financial condition and results of operations and its resulting ability to distribute cash to the holding company.
37
Table of Contents
Economic and other factors affecting our niche market could adversely impact our financial condition and results of operations.
Horace Mann’s strategic objective is to become the company of choice in meeting the insurance and financial services needs of the educational community. With K-12 teachers, administrators, and support personnel representing a significant percentage of our business, the financial condition and results of operations of our subsidiaries could be more prone than many of our competitors to the effects of economic forces and other issues affecting the educator market including, but not limited to, state budget deficits and cut-backs and adverse changes in state and local tax revenues.
A reduction or elimination of the tax advantages of life and annuity products and/or a change in the tax benefits of various government-authorized retirement programs, such as 403(b) annuities and individual retirement accounts (“IRAs”), could make our products less attractive to clients and adversely affect our operating results.
A significant part of our annuity business involves fixed and variable 403(b) tax-qualified annuities, which are annuities purchased voluntarily by individuals employed by public school systems or other tax-exempt organizations. While the recent changes in IRS regulations governing 403(b) plans did not change the relative tax advantages of 403(b) annuities, our financial condition and results of operations could be adversely affected by changes in federal and state laws and regulations that do affect the relative tax and other advantages of our life and annuity products to clients or the tax benefits of programs utilized by our clients. As a result of economic conditions in 2008, 2009 and as of the time of this Annual Report on Form 10-K, revenue challenges exist at federal, state and local government levels. These challenges could increase the risk of future adverse impacts on current tax advantaged products. See also “Business — Regulation — Regulation at Federal Level”.
Current federal income tax laws generally permit the tax-deferred accumulation of earnings on the premiums paid by the holders of annuities and life insurance products. Taxes, if any, are payable on income attributable to a distribution under the contract for the year in which the distribution is made. From time to time, Congress has considered legislation that would reduce or eliminate the benefit of such deferral of taxation on the accretion of value with life insurance and non-qualified annuity contracts. Enactment of this legislation, including a simplified “flat tax” income structure with an exemption from taxation for investment income, could result in fewer sales of our life insurance and annuity products.
Litigation may harm our financial strength or reduce our profitability.
Companies in the insurance industry have been subject to substantial litigation resulting from claims, disputes and other matters. Most recently, they have faced expensive claims, including class action lawsuits, alleging, among other things, improper sales practices and improper claims settlement procedures. Negotiated settlements of certain such actions have had a material adverse effect on many insurance companies. The resolution of such claims against any of our insurance subsidiaries, including the potential adverse effect on our reputation and charges against the earnings of our insurance subsidiaries as a result of legal defense costs, a settlement agreement or an adverse finding or findings against our insurance subsidiaries in such a claim, could have a material adverse effect on the financial condition and results of operations of our insurance subsidiaries.
38
Table of Contents
Data security breaches could have an adverse impact on the Company’s business and reputation.
Unauthorized access to our client or employee data or other breaches of data security in our facilities, networks or databases, or those of our agents or third-party vendors, could result in loss or theft of data and information or systems interruptions that may expose the Company to liability and/or regulatory action and may have an adverse impact on the Company’s clients, employees and business. In addition, any compromise of the security of our data could harm the Company’s reputation and business. We have designed, implemented and routinely test industry-compliant procedures for protection of confidential information and sensitive corporate data, including rapid response procedures to help contain or prevent data loss if a breach were to occur. We have also implemented multiple technical security protections and contractual obligations regarding security breaches for our agents and third-party vendors. Even with these efforts, there can be no absolute assurances that security breaches will be prevented.
Successful execution of our growth strategy is highly dependent on effective implementation of new technology solutions.
Our ability to effectively execute our growth strategy and leverage potential economies of scale is dependent on our ability to provide the requisite technology components of that strategy. While we have effectively upgraded our infrastructure technologies with improvements in our data center, a new communications platform and enhanced disaster recovery capabilities, our ability to build upon this foundation and replace dated, single-function legacy systems with fully functional, flexible, maintainable and user-friendly technology solutions, including current efforts underway to replace major components of our property and casualty administrative system, will be necessary to achieve our plans. The inherent difficulty in implementing large technology solutions, coupled with the Company’s lack of experience in these types of endeavors, presents increased risk to delivering these technology solutions in a timely and cost-effective manner. Utilization of third-party vendors can augment the Company’s internal capacity for these implementations, but may not reduce the risks of timely and cost effective delivery.
Loss of key vendor relationships could affect our operations.
We rely on services and products provided by a number of vendors in the United States and abroad. These include, for example, vendors of computer hardware and software and vendors of services such as claim adjustment services, investment management advisement, information technology consulting and employee benefits consulting/actuarial services. In the event that one or more of our vendors suffers a bankruptcy or otherwise becomes unable to continue to provide products or services, we may suffer operational difficulties and financial losses. In addition, in some instances certain individuals working for vendors have provided services to us for extended periods of time, gaining substantial knowledge of the Company and our operations. The loss of continued service by those individuals could adversely impact our operations.
39
Table of Contents
| ITEM 1B. | Unresolved Staff Comments |
None.
| ITEM 2. | Properties |
HMEC’s home office property at 1 Horace Mann Plaza in Springfield, Illinois, consists of an office building totaling 230,000 square feet, approximately 200,000 square feet of which is office space, which is owned by the Company. Also in Springfield, the Company owns and leases some smaller buildings at other locations. In addition, the Company leases office space in suburban Dallas, Texas, and Raleigh, North Carolina, for its claims operations and leases office space in a number of states related to its field marketing operations. These properties, which are utilized by all of the Company’s business segments, are adequate and suitable for the Company’s current and anticipated future needs.
| ITEM 3. | Legal Proceedings |
The Company is not currently party to any material pending legal proceedings other than routine litigation incidental to its business.
| ITEM 4. | [Reserved] |
| ITEM 5. | Market for Registrant’s Common Equity, Related Stockholder Matters and Issuer Purchases of Equity Securities |
Market Information and Dividends
HMEC’s common stock began trading on the NYSE in November 1991 under the symbol of HMN at a price of $9 per share. The following table sets forth the high and low sales prices of the common stock on the NYSE Composite Tape and the cash dividends paid per share of common stock during the periods indicated.
| Fiscal Period |
Market Price | Dividend Paid | |||||||
| High | Low | ||||||||
| 2009: |
|||||||||
| Fourth Quarter |
$ | 14.81 | $ | 11.51 | $ | 0.0800 | |||
| Third Quarter |
14.76 | 9.53 | 0.0525 | ||||||
| Second Quarter |
10.70 | 7.76 | 0.0525 | ||||||
| First Quarter |
11.33 | 6.09 | 0.0525 | ||||||
| 2008: |
|||||||||
| Fourth Quarter |
$ | 14.00 | $ | 4.00 | $ | 0.0525 | |||
| Third Quarter |
17.00 | 11.95 | 0.1050 | ||||||
| Second Quarter |
18.64 | 14.01 | 0.1050 | ||||||
| First Quarter |
19.12 | 16.08 | 0.1050 | ||||||
The payment of dividends in the future is subject to the discretion of the Board of Directors of HMEC and will depend upon general business conditions, legal restrictions and other factors the Board of Directors may deem to be relevant. See also “Business — Cash Flow”.
40
Table of Contents
Stock Price Performance Graph
The graph below compares cumulative total return* of Horace Mann Educators Corporation, the S&P 500 Insurance Index and the S&P 500 Index. The graph assumes $100 invested on December 31, 2004 in HMEC, the S&P 500 Insurance Index and the S&P 500 Index.
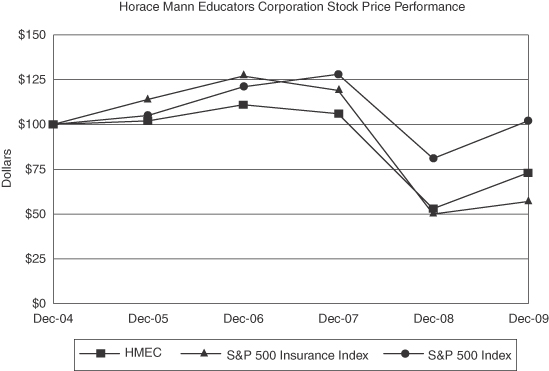
| 12/04 | 12/05 | 12/06 | 12/07 | 12/08 | 12/09 | |||||||||||||
| HMEC |
$ | 100 | $ | 102 | $ | 111 | $ | 106 | $ | 53 | $ | 73 | ||||||
| S&P 500 Insurance Index |
$ | 100 | $ | 114 | $ | 127 | $ | 119 | $ | 50 | $ | 57 | ||||||
| S&P 500 Index |
$ | 100 | $ | 105 | $ | 121 | $ | 128 | $ | 81 | $ | 102 | ||||||
| * | The S&P 500 Index and the S&P 500 Insurance Index, as published by Standard and Poor’s Corporation (“S&P”), assume an annual reinvestment of dividends in calculating total return. Horace Mann Educators Corporation assumes reinvestment of dividends when paid. |
Holders and Shares Issued
As of February 16, 2010, the approximate number of holders of HMEC’s common stock was 2,700.
During 2009, no stock options were exercised.
The equity compensation plan information required by Item 201(d) of Regulation S-K is incorporated by reference to the Company’s Proxy Statement for the 2010 Annual Meeting of Shareholders.
41
Table of Contents
| ITEM 6. | Selected Financial Data |
The information required by Item 301 of Regulation S-K is contained in the table in Item 1 — “Business — Selected Historical Consolidated Financial Data”.
| ITEM 7. | Management’s Discussion and Analysis of Financial Condition and Results of Operations |
The information required by Item 303 of Regulation S-K is listed on page F-1 of this report.
| ITEM 7A. | Quantitative and Qualitative Disclosures About Market Risk |
The information required by Item 305 of Regulation S-K is contained in “Management’s Discussion and Analysis of Financial Condition and Results of Operations” listed on page F-1 of this report.
| ITEM 8. | Consolidated Financial Statements and Supplementary Data |
The Company’s consolidated financial statements, financial statement schedules, the report of its independent registered public accounting firm and the selected quarterly financial data required by Item 302 of Regulation S-K are listed on page F-1 of this report.
| ITEM 9. | Changes in and Disagreements with Accountants on Accounting and Financial Disclosure |
None.
| ITEM 9A. | Controls and Procedures |
a.) Management’s Conclusion Regarding the Effectiveness of Disclosure Controls and Procedures
Under the supervision and with the participation of our management, including our chief executive officer and chief financial officer, we conducted an evaluation of our disclosure controls and procedures, as such term is defined under Rule 13a-15(e) of the Securities and Exchange Act of 1934 as amended (the “Exchange Act”). Based on this evaluation, our chief executive officer and our chief financial officer concluded that our disclosure controls and procedures were effective as of December 31, 2009, the end of the period covered by this Annual Report on Form 10-K.
42
Table of Contents
b.) Management’s Annual Report on Internal Control Over Financial Reporting
Management of Horace Mann is responsible for establishing and maintaining adequate internal control over financial reporting, as such term is defined in Rule 13a-15(f) of the Exchange Act. Internal control over financial reporting is a process designed to provide reasonable assurance regarding the reliability of financial reporting and the preparation of financial statements for external purposes in accordance with U.S. generally accepted accounting principles. A company’s internal control over financial reporting includes those policies and procedures that:
| (i) | Pertain to the maintenance of records that, in reasonable detail, accurately and fairly reflect the transactions and dispositions of the assets of the company; |
| (ii) | Provide reasonable assurance that transactions are recorded as necessary to permit preparation of financial statements in accordance with U.S. generally accepted accounting principles, and that receipts and expenditures of the company are being made only in accordance with authorizations of management and directors of the company; and |
| (iii) | Provide reasonable assurance regarding prevention or timely detection of unauthorized acquisition, use, or disposition of the company’s assets that could have a material effect on the consolidated financial statements. |
Management of Horace Mann conducted an evaluation of the effectiveness of the Company’s internal control over financial reporting as of December 31, 2009, using the criteria set forth in Internal Control – Integrated Framework issued by the Committee of Sponsoring Organizations of the Treadway Commission (“COSO”). Because of its inherent limitations, internal control over financial reporting may not prevent or detect misstatements. Also, projections of any evaluation of effectiveness to future periods are subject to the risk that controls may become inadequate because of changes in conditions, or that the degree of compliance with the policies or procedures may deteriorate. Based on this evaluation, management, including our chief executive officer and our chief financial officer, determined that, as of December 31, 2009, the Company maintained effective internal control over financial reporting.
The Company’s internal control over financial reporting as of December 31, 2009 has been audited by KPMG LLP, the independent registered public accounting firm that audited the Company’s consolidated financial statements, as stated in their report listed on page F-1 of this Annual Report on Form 10-K.
c.) Independent Registered Public Accounting Firm’s Report on Internal Control Over Financial Reporting
The information required by Item 308(b) of Regulation S-K is contained in the “Report of Independent Registered Public Accounting Firm” listed on page F-1 of this report.
d). Changes in Internal Control Over Financial Reporting
There were no changes in the Company’s internal control over financial reporting that occurred during the Company’s last fiscal quarter that have materially affected, or are reasonably likely to materially affect, the Company’s internal control over financial reporting.
43
Table of Contents
| ITEM 9B. | Other Information |
None.
| ITEM 10. | Directors, Executive Officers and Corporate Governance |
The information required by Items 401, 405, 407(d)(4) and 407(d)(5) of Regulation S-K is incorporated by reference to the Company’s Proxy Statement for the 2010 Annual Meeting of Shareholders.
Horace Mann Educators Corporation has adopted a code of ethics that applies to its principal executive officer, principal financial officer, principal accounting officer and all other employees of the Company. In addition, the Board of Directors of Horace Mann Educators Corporation has adopted the code of ethics for its Board members as it applies to each Board member’s business conduct on behalf of the Company. The code of ethics is posted on the Company’s Web site, www.horacemann.com, under “Investor Relations — Corporate Governance”.
| ITEM 11. | Executive Compensation |
The information required by Items 402, 407(e)(4) and 407(e)(5) of Regulation S-K is incorporated by reference to the Company’s Proxy Statement for the 2010 Annual Meeting of Shareholders.
| ITEM 12. | Security Ownership of Certain Beneficial Owners and Management, and Related Stockholder Matters |
The information required by Items 201(d) and 403 of Regulation S-K is incorporated by reference to the Company’s Proxy Statement for the 2010 Annual Meeting of Shareholders.
| ITEM 13. | Certain Relationships and Related Transactions, and Director Independence |
The information required by Items 404 and 407(a) of Regulation S-K is incorporated by reference to the Company’s Proxy Statement for the 2010 Annual Meeting of Shareholders.
| ITEM 14. | Principal Accounting Fees and Services |
The information required by Item 9(e) of Schedule 14A is incorporated by reference to the Company’s Proxy Statement for the 2010 Annual Meeting of Shareholders.
44
Table of Contents
| ITEM 15. | Exhibits and Financial Statement Schedules |
(a)(1) The following consolidated financial statements of the Company are contained in the Index to Financial Information on Page F-1 of this report:
Consolidated Balance Sheets as of December 31, 2009 and 2008.
Consolidated Statements of Operations for the Years Ended December 31, 2009, 2008 and 2007.
Consolidated Statements of Comprehensive Income (Loss) for the Years Ended December 31, 2009, 2008 and 2007.
Consolidated Statements of Changes in Shareholders’ Equity for the Years Ended December 31, 2009, 2008 and 2007.
Consolidated Statements of Cash Flows for the Years Ended December 31, 2009, 2008 and 2007.
(a)(2) The following financial statement schedules of the Company are contained in the Index to Financial Information on page F-1 of this report:
Schedule I — Summary of Investments — Other than Investments in Related Parties.
Schedule II — Condensed Financial Information of Registrant.
Schedules III and VI Combined — Supplementary Insurance Information and Supplemental Information Concerning Property and Casualty Insurance Operations.
Schedule IV — Reinsurance.
45
Table of Contents
(a)(3) The following items are filed as Exhibits. Management contracts and compensatory plans are indicated by an asterisk (*).
| Exhibit |
Description | |
| (3) Articles of incorporation and bylaws: | ||
| 3.1 |
Restated Certificate of Incorporation of HMEC, filed with the Delaware Secretary of State on June 24, 2003, incorporated by reference to Exhibit 3.1 to HMEC’s Quarterly Report on Form 10-Q for the quarter ended June 30, 2003, filed with the Securities and Exchange Commission (the “SEC”) on August 14, 2003. | |
| 3.2 |
Form of Certificate for shares of Common Stock, $0.001 par value per share, of HMEC, incorporated by reference to Exhibit 4.5 to HMEC’s Registration Statement on Form S-3 (Registration No. 33-53118) filed with the SEC on October 9, 1992. | |
| 3.3 |
Bylaws of HMEC, incorporated by reference to Exhibit 3.2 to HMEC’s Quarterly Report on Form 10-Q for the quarter ended June 30, 2003, filed with the SEC on August 14, 2003. | |
| (4) Instruments defining the rights of security holders, including indentures: | ||
| 4.1 |
Indenture, dated as of June 9, 2005, between HMEC and The Bank of New York Mellon Trust Company, N.A., as trustee (formerly JPMorgan Chase Bank, N.A. was trustee), incorporated by reference to Exhibit 4.1 to HMEC’s Current Report on Form 8-K dated June 6, 2005, filed with the SEC on June 9, 2005. | |
| 4.1(a) |
First Supplemental Indenture, dated as of June 9, 2005, between HMEC and The Bank of New York Mellon Trust Company, N.A., as trustee (formerly JPMorgan Chase Bank, N.A. was trustee), incorporated by reference to Exhibit 4.2 to HMEC’s Current Report on Form 8-K dated June 6, 2005, filed with the SEC on June 9, 2005. | |
| 4.1(b) |
Form of HMEC 6.05% Senior Notes Due 2015 (included in Exhibit 4.1(a)). | |
| 4.1(c) |
Second Supplemental Indenture, dated as of April 21, 2006, between HMEC and The Bank of New York Mellon Trust Company, N.A., as trustee (formerly JPMorgan Chase Bank, N.A. was trustee), incorporated by reference to Exhibit 4.3 to HMEC’s Current Report on Form 8-K dated April 18, 2006, filed with the SEC on April 21, 2006. | |
| 4.1(d) |
Form of HMEC 6.85% Senior Notes due April 15, 2016 (included in Exhibit 4.1(c)). | |
46
Table of Contents
| Exhibit |
Description | |
| 4.2 |
Certificate of Designations for HMEC Series A Cumulative Convertible Preferred Stock, incorporated by reference to Exhibit 4.3 to HMEC’s Annual Report on Form 10-K for the year ended December 31, 2005, filed with the SEC on March 16, 2006. | |
| (10) Material contracts: | ||
| 10.1 |
Amended and Restated Credit Agreement dated as of December 19, 2006 among HMEC, certain financial institutions named therein and Bank of America, N.A., as administrative agent, incorporated by reference to Exhibit 10.1 to HMEC’s Annual Report on Form 10-K for the year ended December 31, 2006, filed with the SEC on March 1, 2007. | |
| 10.2* |
Amended and Restated Horace Mann Educators Corporation Deferred Equity Compensation Plan for Directors, incorporated by reference to Exhibit 10.2 to HMEC’s Annual Report on Form 10-K for the year ended December 31, 2008, filed with the SEC on March 2, 2009. | |
| 10.3* |
Amended and Restated Horace Mann Educators Corporation Deferred Compensation Plan for Employees, incorporated by reference to Exhibit 10.3 to HMEC’s Annual Report on Form 10-K for the year ended December 31, 2008, filed with the SEC on March 2, 2009. | |
| 10.4* |
Amended and Restated Horace Mann Educators Corporation 1991 Stock Incentive Plan, incorporated by reference to Exhibit 10.5 to HMEC’s Annual Report on Form 10-K for the year ended December 31, 1999, filed with the SEC on March 30, 2000. | |
| 10.4(a)* |
Amendment to Amended and Restated Horace Mann Educators Corporation 1991 Stock Incentive Plan, incorporated by reference to Exhibit 10.1(a) to HMEC’s Quarterly Report on Form 10-Q for the quarter ended June 30, 2000, filed with the SEC on August 11, 2000. | |
| 10.4(b)* |
Specimen Employee Stock Option Agreement under the Horace Mann Educators Corporation 1991 Stock Incentive Plan, incorporated by reference to Exhibit 10.5(a) to HMEC’s Annual Report on Form 10-K for the year ended December 31, 1999, filed with the SEC on March 30, 2000. | |
| 10.4(c)* |
Specimen Director Stock Option Agreement under the Horace Mann Educators Corporation 1991 Stock Incentive Plan, incorporated by reference to Exhibit 10.5(b) to HMEC’s Annual Report on Form 10-K for the year ended December 31, 1999, filed with the SEC on March 30, 2000. | |
| 10.5* |
Horace Mann Educators Corporation 2001 Stock Incentive Plan, incorporated by reference to Exhibit 10.6 to HMEC’s Annual Report on Form 10-K for the year ended December 31, 2001, filed with the SEC on March 29, 2002. | |
47
Table of Contents
| Exhibit |
Description | |
| 10.5(a)* |
Specimen Employee Stock Option Agreement under the Horace Mann Educators Corporation 2001 Stock Incentive Plan, incorporated by reference to Exhibit 10.6(a) to HMEC’s Annual Report on Form 10-K for the year ended December 31, 2001, filed with the SEC on March 29, 2002. | |
| 10.5(b)* |
Specimen Director Stock Option Agreement under the Horace Mann Educators Corporation 2001 Stock Incentive Plan, incorporated by reference to Exhibit 10.6(b) to HMEC’s Annual Report on Form 10-K for the year ended December 31, 2001, filed with the SEC on March 29, 2002. | |
| 10.6* |
Horace Mann Educators Corporation Amended and Restated 2002 Incentive Compensation Plan (“2002 Incentive Compensation Plan”), incorporated by reference to Exhibit 10.2 to HMEC’s Quarterly Report on Form 10-Q for the quarter ended June 30, 2005, filed with the SEC on August 9, 2005. | |
| 10.6(a)* |
Specimen Employee Stock Option Agreement under the 2002 Incentive Compensation Plan, incorporated by reference to Exhibit 10.2(a) to HMEC’s Quarterly Report on Form 10-Q for the quarter ended June 30, 2002, filed with the SEC on August 14, 2002. | |
| 10.6(b)* |
Revised Specimen Employee Stock Option Agreement under the 2002 Incentive Compensation Plan, incorporated by reference to Exhibit 10.6(b) to HMEC’s Annual Report on Form 10-K for the year ended December 31, 2008, filed with the SEC on March 2, 2009. | |
| 10.6(c)* |
Specimen Regular Employee Stock Option Agreement under the 2002 Incentive Compensation Plan, incorporated by reference to Exhibit 10.2(b) to HMEC’s Quarterly Report on Form 10-Q for the quarter ended June 30, 2002, filed with the SEC on August 14, 2002. | |
| 10.6(d)* |
Specimen Director Stock Option Agreement under the 2002 Incentive Compensation Plan, incorporated by reference to Exhibit 10.2(c) to HMEC’s Quarterly Report on Form 10-Q for the quarter ended June 30, 2002, filed with the SEC on August 14, 2002. | |
| 10.6(e)* |
Specimen Employee Restricted Stock Unit Agreement under the 2002 Incentive Compensation Plan, incorporated by reference to Exhibit 10.6(d) to HMEC’s Annual Report on Form 10-K for the year ended December 31, 2005, filed with the SEC on March 16, 2006. | |
| 10.6(f)* |
Revised Specimen Employee Restricted Stock Unit Agreement under the 2002 Incentive Compensation Plan, incorporated by reference to Exhibit 10.6(f) to HMEC’s Annual Report on Form 10-K for the year ended December 31, 2008, filed with the SEC on March 2, 2009. | |
48
Table of Contents
| Exhibit |
Description | |
| 10.6(g)* |
Specimen Non-employee Director Restricted Stock Unit Agreement under the 2002 Incentive Compensation Plan, incorporated by reference to Exhibit 10.6(e) to HMEC’s Annual Report on Form 10-K for the year ended December 31, 2005, filed with the SEC on March 16, 2006. | |
| 10.6(h)* |
Revised Specimen Non-employee Director Restricted Stock Unit Agreement under the 2002 Incentive Compensation Plan, incorporated by reference to Exhibit 10.6(h) to HMEC’s Annual Report on Form 10-K for the year ended December 31, 2008, filed with the SEC on March 2, 2009. | |
| 10.6(i)* |
Specimen Restricted Stock Unit Deferral Election Form under the 2002 Incentive Compensation Plan, incorporated by reference to Exhibit 10.6(f) to HMEC’s Annual Report on Form 10-K for the year ended December 31, 2005, filed with the SEC on March 16, 2006. | |
| 10.6(j)* |
Revised Specimen Restricted Stock Unit Deferral Election Forms under the 2002 Incentive Compensation Plan, incorporated by reference to Exhibit 10.6(j) to HMEC’s Annual Report on Form 10-K for the year ended December 31, 2008, filed with the SEC on March 2, 2009. | |
| 10.6(k)* |
Specimen Modification to Stock Options outstanding as of June 30, 2004, incorporated by reference to Exhibit 10.2(d) to HMEC’s Quarterly Report on Form 10-Q for the quarter ended June 30, 2004, filed with the SEC on August 9, 2004. | |
| 10.7* |
Horace Mann Supplemental Employee Retirement Plan, 2002 Restatement, incorporated by reference to Exhibit 10.1 to HMEC’s Quarterly Report on Form 10-Q for the quarter ended March 31, 2002, filed with the SEC on May 15, 2002. | |
| 10.8* |
Horace Mann Executive Supplemental Employee Retirement Plan, 2002 Restatement, incorporated by reference to Exhibit 10.2 to HMEC’s Quarterly Report on Form 10-Q for the quarter ended March 31, 2002, filed with the SEC on May 15, 2002. | |
| 10.9* |
Amended and Restated Horace Mann Nonqualified Supplemental Money Purchase Pension Plan, incorporated by reference to Exhibit 10.9 to HMEC’s Annual Report on Form 10-K for the year ended December 31, 2008, filed with the SEC on March 2, 2009. | |
| 10.10* |
Summary of HMEC Non-Employee Director Compensation, incorporated by reference to Exhibit 10.10 to HMEC’s Current Report on Form 8-K dated May 28, 2009, filed with the SEC on June 2, 2009. | |
49
Table of Contents
| Exhibit |
Description | |
| 10.11* |
Summary of HMEC Named Executive Officer Annualized Salaries, incorporated by reference to Exhibit 10.11 to HMEC’s Quarterly Report on Form 10-Q for the quarter ended March 31, 2009, filed with the SEC on May 8, 2009. | |
| 10.12* |
Form of Severance Agreement between HMEC, Horace Mann Service Corporation (“HMSC”) and certain officers of HMEC and/or HMSC, incorporated by reference to Exhibit 10.12 to HMEC’s Annual Report on Form 10-K for the year ended December 31, 2008, filed with the SEC on March 2, 2009. | |
| 10.12(a)* |
Revised Schedule to Severance Agreements between HMEC, HMSC and certain officers of HMEC and/or HMSC, incorporated by reference to Exhibit 10.12(a) to HMEC’s Annual Report on Form 10-K for the year ended December 31, 2008, filed with the SEC on March 2, 2009. | |
| 10.13* |
Form of Change in Control Agreement between HMEC, HMSC and certain officers of HMEC and/or HMSC, incorporated by reference to Exhibit 10.13 to HMEC’s Annual Report on Form 10-K for the year ended December 31, 2008, filed with the SEC on March 2, 2009. | |
| 10.13(a)* |
Revised Schedule to Change in Control Agreement between HMEC, HMSC and certain officers of HMEC and/or HMSC, incorporated by reference to Exhibit 10.13(a) to HMEC’s Quarterly Report on Form 10-Q for the quarter ended March 31, 2009, filed with the SEC on May 8, 2009. | |
| 10.14* |
Employment Agreement between HMEC and Louis G. Lower II as of December 31, 1999, incorporated by reference to Exhibit 10.12 to HMEC’s Annual Report on Form 10-K for the year ended December 31, 1999, filed with the SEC on March 30, 2000. | |
| 10.14(a)* |
Amendment to Employment Agreement between HMEC and Louis G. Lower II as of January 1, 2008, incorporated by reference to Exhibit 10.14(a) to HMEC’s Annual Report on Form 10-K for the year ended December 31, 2008, filed with the SEC on March 2, 2009. | |
| 10.14(b)* |
Second Amendment to Employment Agreement between HMEC and Louis G. Lower II as of September 30, 2009, incorporated by reference to Exhibit 10.14(b) to HMEC’s Quarterly Report on Form 10-Q for the quarter ended September 30, 2009, filed with the SEC on November 6, 2009. | |
| 10.15* |
Employment Agreement between HMSC and Stephen P. Cardinal as of November 20, 2008, incorporated by reference to Exhibit 10.15 to HMEC’s Annual Report on Form 10-K for the year ended December 31, 2008, filed with the SEC on March 2, 2009. | |
50
Table of Contents
| Exhibit No. |
Description | |||
| 10.16* | Letter of Employment between HMSC and Brent H. Hamann effective February 9, 2009, incorporated by reference to Exhibit 10.16 to HMEC’s Quarterly Report on Form 10-Q for the quarter ended March 31, 2009, filed with the SEC on May 8, 2009. | |||
| (11) | Statement regarding computation of per share earnings. | |||
| (12) | Statement regarding computation of ratios. | |||
| (21) | Subsidiaries of HMEC. | |||
| (23) | Consent of KPMG LLP. | |||
| (31) | Certification pursuant to Section 302 of the Sarbanes-Oxley Act of 2002. | |||
| 31.1 | Certification by Louis G. Lower II, Chief Executive Officer of HMEC. | |||
| 31.2 | Certification by Peter H. Heckman, Chief Financial Officer of HMEC. | |||
| (32) | Certification pursuant to Section 906 of the Sarbanes-Oxley Act of 2002. | |||
| 32.1 | Certification by Louis G. Lower II, Chief Executive Officer of HMEC. | |||
| 32.2 | Certification by Peter H. Heckman, Chief Financial Officer of HMEC. | |||
| (99) | Additional exhibits | |||
| 99.1 | Glossary of Selected Terms. | |||
| (b) | See list of exhibits in this Item 15. | |||
| (c) | See list of financial statement schedules in this Item 15. | |||
Copies of Form 10-K, Exhibits to Form 10-K, Horace Mann Educators Corporation’s Code of Ethics and charters of the committees of the Board of Directors are available through the Investor Relations section of the Company’s Internet Web site, www.horacemann.com. Copies also may be obtained by writing to Investor Relations, Horace Mann Educators Corporation, 1 Horace Mann Plaza, C-120, Springfield, Illinois 62715-0001.
51
Table of Contents
Pursuant to the requirements of Section 13 or 15(d) of the Securities Exchange Act of 1934, Horace Mann Educators Corporation has duly caused this report to be signed on its behalf by the undersigned, thereunto duly authorized.
| HORACE MANN EDUCATORS CORPORATION |
| /S/ LOUIS G. LOWER II |
| Louis G. Lower II President and Chief Executive Officer |
Pursuant to the requirements of the Securities Exchange Act of 1934, this report has been signed below by the following persons on behalf of Horace Mann Educators Corporation and in the capacities and on the date indicated.
| Principal Executive Officer: | Directors: | |||
| /S/ LOUIS G. LOWER II |
/S/ JOSEPH J. MELONE | |||
| Louis G. Lower II President, Chief Executive Officer and a Director |
Joseph J. Melone, Chairman of the Board of Directors | |||
| /S/ MARY H. FUTRELL | ||||
| Mary H. Futrell, Director | ||||
| Principal Financial Officer: | /S/ STEPHEN J. HASENMILLER | |||
| Stephen J. Hasenmiller, Director | ||||
| /S/ PETER H. HECKMAN |
/S/ RONALD J. HELOW Ronald J. Helow, Director | |||
| Peter H. Heckman Executive Vice President and Chief Financial Officer |
||||
| /S/ CHARLES A. PARKER | ||||
| Charles A. Parker, Director | ||||
| Principal Accounting Officer: | /S/ GABRIEL L. SHAHEEN | |||
| Gabriel L. Shaheen, Director | ||||
| /S/ BRET A. CONKLIN |
||||
| Bret A. Conklin Senior Vice President and Controller |
/S/ ROGER J. STEINBECKER | |||
| Roger J. Steinbecker, Director | ||||
| /S/ ROBERT STRICKER | ||||
| Robert Stricker, Director | ||||
| /S/ CHARLES R. WRIGHT | ||||
| Charles R. Wright, Director | ||||
Dated: March 1, 2010
52
Table of Contents
HORACE MANN EDUCATORS CORPORATION
INDEX TO FINANCIAL INFORMATION
| Page | ||
| Management’s Discussion and Analysis of Financial Condition and Results of Operations |
F-2 | |
| F-42 | ||
| F-44 | ||
| F-45 | ||
| F-46 | ||
| F-47 | ||
| F-48 | ||
| Notes to Consolidated Financial Statements |
||
| F-49 | ||
| F-65 | ||
| F-71 | ||
| Note 4 — Property and Casualty Unpaid Claims and Claim Expenses |
F-77 | |
| F-81 | ||
| F-83 | ||
| F-86 | ||
| Note 8 — Statutory Surplus and Subsidiary Dividend Restrictions |
F-89 | |
| F-90 | ||
| F-98 | ||
| F-101 | ||
| F-101 | ||
| F-102 | ||
| F-104 | ||
| Financial Statement Schedules: |
||
| Schedule I — Summary of Investments — Other than Investments in Related Parties |
F-105 | |
| F-106 | ||
| F-110 | ||
| F-111 | ||
F-1
Table of Contents
MANAGEMENT’S DISCUSSION AND ANALYSIS OF
FINANCIAL CONDITION AND RESULTS OF OPERATIONS
(Dollars in millions, except per share data)
Forward-looking Information
Statements made in the following discussion that are not historical in nature are forward-looking within the meaning of the Private Securities Litigation Reform Act of 1995 and are subject to known and unknown risks, uncertainties and other factors. Horace Mann is not under any obligation to (and expressly disclaims any such obligation to) update or revise any forward-looking statements, whether as a result of new information, future events or otherwise. It is important to note that the Company’s actual results could differ materially from those projected in forward-looking statements due to, among other risks and uncertainties inherent in the Company’s business, the following important factors:
| • | Changes in the composition of the Company’s assets and liabilities which may result from occurrences such as acquisitions, divestitures, impairment in asset values or changes in estimates of insurance reserves. |
| • | Fluctuations in the fair value of securities in the Company’s investment portfolio and the related after-tax effect on the Company’s shareholders’ equity and total capital through either realized or unrealized investment losses, as well as the potential impact on the ability of the Company’s insurance subsidiaries to distribute cash to the holding company and/or need for the holding company to make capital contributions to the insurance subsidiaries. In addition, the impact of fluctuations in the financial markets on the Company’s defined benefit pension plan assets and the related after-tax effect on the Company’s operating expenses, shareholders’ equity and total capital. |
| • | The impact of fluctuations in the financial markets on the Company’s variable annuity fee revenues, valuations of deferred policy acquisition costs, and the level of guaranteed minimum death benefit reserves. |
| • | The impact of fluctuations in the capital markets on the Company’s ability to refinance outstanding indebtedness or repurchase shares of the Company’s common stock. |
| • | Defaults on interest or dividend payments in the Company’s investment portfolio due to credit issues and the resulting impact on investment income. |
| • | Prevailing interest rate levels, including the impact of interest rates on (1) unrealized gains and losses in the Company’s investment portfolio and the related after-tax effect on the Company’s shareholders’ equity and total capital, (2) the book yield of the Company’s investment portfolio, (3) the Company’s ability to maintain appropriate interest rate spreads over the fixed rates guaranteed in the Company’s life and annuity products and (4) valuations of deferred policy acquisition costs. |
| • | The cyclicality of the insurance industry and the related effects of changes in price competition and industry-wide underwriting results. |
| • | The impact that a prolonged economic recession may have on the Company’s investment portfolio; volume of new business for automobile, homeowners, annuity and life products; policy renewal rates; and additional annuity contract deposit receipts. |
F-2
Table of Contents
| • | The frequency and severity of catastrophes such as hurricanes, earthquakes, storms and wildfires and the ability of the Company to provide accurate estimates of ultimate catastrophe costs in its consolidated financial statements in light of such factors as: the proximity of the catastrophe occurrence date to the date of the consolidated financial statements; potential inflation of property repair costs in the affected area; the occurrence of multiple catastrophes in a geographic area over a relatively short period of time; the outcome of litigation which may be filed against the Company by policyholders, state attorneys general and other parties relative to loss coverage disputes and loss settlement payments; and the ability of state insurance facilities to assess participating insurers when financial deficits occur. |
| • | The Company’s risk exposure to catastrophe-prone areas. Based on full year 2009 property and casualty direct earned premiums, the Company’s ten largest states represented 58% of the segment total. Included in this top ten group are certain states which are considered more prone to catastrophe occurrences: Florida, California, North Carolina, Texas, Louisiana, South Carolina and Georgia. |
| • | The potential near-term, adverse impact of underwriting actions to mitigate the Company’s risk exposure to catastrophe-prone areas on premium, policy and earnings growth. |
| • | The ability of the Company to maintain a favorable catastrophe reinsurance program considering both availability and cost; and the collectibility of reinsurance receivables. |
| • | Adverse development of property and casualty loss and loss adjustment expense reserve experience and its impact on estimated claims and claim settlement expenses for losses occurring in prior years. |
| • | Adverse changes in market appreciation, interest spreads, business persistency and policyholder mortality and morbidity rates and the resulting impact on both estimated reserves and the valuations of deferred policy acquisition costs. |
| • | Changes in insurance regulations, including (1) those affecting the ability of the Company’s insurance subsidiaries to distribute cash to the holding company and (2) those impacting the Company’s ability to profitably write property and casualty insurance policies in one or more states. |
| • | Changes in federal and state tax laws, including changes in elements of taxation, and changes resulting from tax audits affecting corporate tax rates. |
| • | Changes in federal and state laws and regulations, which affect the relative tax and other advantages of the Company’s life and annuity products to customers, including, but not limited to, changes in IRS regulations governing Section 403(b) plans. |
| • | The resolution of legal proceedings and related matters including the potential adverse impact on the Company’s reputation and charges against the Company’s earnings resulting from legal defense costs, a settlement agreement and/or an adverse finding or findings against the Company from the proceedings. |
| • | The Company’s ability to maintain favorable claims-paying ability ratings. |
| • | The Company’s ability to maintain favorable financial strength and debt ratings. |
| • | The Company’s ability to profitably expand its property and casualty business in highly competitive environments. |
| • | The competitive impact of the new Section 403(b) tax-qualified annuity regulations, including (1) their potential to lead plan sponsors to restrict the number of providers and (2) the possible entry into the 403(b) market of larger competitors experienced in 401(k) plans. |
F-3
Table of Contents
| • | The Company’s ability to develop and expand its marketing operations, including agents and other points of distribution, as well as the Company’s ability to maintain and secure sponsorships by local, state and national education associations. |
| • | The Company’s dated and complex information systems, which are difficult to upgrade and more prone to error than advanced technology systems. |
| • | Disruptions of the general business climate, investments, capital markets and consumer attitudes caused by pandemics or geopolitical acts such as terrorism, war or other similar events. |
Executive Summary
Horace Mann Educators Corporation (“HMEC”; and together with its subsidiaries, the “Company” or “Horace Mann”) is an insurance holding company. Through its subsidiaries, HMEC markets and underwrites personal lines of property and casualty insurance, retirement annuities and life insurance in the U.S. The Company markets its products primarily to K-12 teachers, administrators and other employees of public schools and their families.
For 2009, the Company’s net income of $73.5 million represented an increase of $62.6 million compared to 2008. After-tax net realized investment gains and losses improved by $58.7 million between years. Catastrophe costs decreased $26.6 million after tax, with the entire amount in 2009 representing non-hurricane catastrophe costs which were at higher-than-average levels. Net income in 2009 was adversely impacted by an increase in large property losses, primarily sinkhole claims in Florida, and a late-year increase in automobile loss frequency. In addition, compared to 2008, net income in the current year decreased by $4.2 million due to a modest decrease in the level of favorable prior years’ property and casualty reserve development. Including all factors, the property and casualty combined ratio was 99.5% for 2009 compared to 100.7% for 2008. Beyond underwriting results, in 2009 net income for the property and casualty segment was reduced by $2.5 million after tax as a result of writing off the Company’s equity interest in the accumulated surplus of the North Carolina Coastal Property Insurance Pool. Annuity segment net income increased $3.9 million compared to 2008, as current year improvements in the interest margin and the favorable impact of the financial markets on the valuations of deferred policy acquisition costs and the guaranteed minimum death benefit reserve offset the adverse impact of the financial markets on the level of contract charges earned during the year. Life segment net income increased $2.0 million compared to a year earlier, reflecting growth in investment income partially offset by an increase in mortality costs. As described in “Results of Operations for the Three Years Ended December 31, 2009 — Income Tax Expense (Benefit)”, in 2008 the Company’s net income benefited by $4.2 million as a result of the completion of Internal Revenue Service (“IRS”) examination, with $2.6 million of that amount benefiting the annuity segment. The current year included transition costs of approximately $3.5 million after tax related to the Company’s property and casualty claims office consolidation and distribution strategies, comparable to the amount incurred in 2008 related to the property and casualty claims office consolidation.
Premiums written and contract deposits of $1.0 billion increased 5% compared to 2008, primarily reflecting an increase in annuity single premium and rollover deposit receipts in 2009. Total annuity contract deposits received increased 12% compared to 2008. New automobile sales units for 2009 were 4% less than 2008, although average agent true new automobile sales productivity increased compared to a year earlier. The automobile new business decrease was offset by favorable policy retention and growth in average premium per policy. Life segment insurance premiums and contract deposits decreased 2% compared to 2008.
F-4
Table of Contents
Critical Accounting Policies
The preparation of consolidated financial statements in conformity with U.S. generally accepted accounting principles (“GAAP”) requires the Company’s management to make estimates and assumptions based on information available at the time the consolidated financial statements are prepared. These estimates and assumptions affect the reported amounts of the Company’s consolidated assets, liabilities, shareholders’ equity and net income. Certain accounting estimates are particularly sensitive because of their significance to the Company’s consolidated financial statements and because of the possibility that subsequent events and available information may differ markedly from management’s judgements at the time the consolidated financial statements were prepared. Management has discussed with the Audit Committee the quality, not just the acceptability, of the Company’s accounting principles as applied in its financial reporting. The discussions generally included such matters as the consistency of the Company’s accounting policies and their application, and the clarity and completeness of the Company’s consolidated financial statements, which include related disclosures. For the Company, the areas most subject to significant management judgements include: fair value measurements, other-than-temporary impairment of investments, goodwill, deferred policy acquisition costs for annuity and interest-sensitive life products, deferred taxes, liabilities for property and casualty claims and claim settlement expenses, liabilities for future policy benefits and valuation of assets and liabilities related to the defined benefit pension plan.
Fair Value Measurements
The Company utilizes the prescribed framework for measuring fair value that includes a hierarchy for classifying the inputs used in measuring fair value. The hierarchy prioritizes the inputs to valuation techniques used to measure fair value into three levels. When the inputs used to measure fair value fall within different levels of the hierarchy, the level within which the fair value measurement is categorized is based on the lowest level input that is significant to the fair value measurement in its entirety. The levels of the fair value hierarchy are as follows:
| Level 1 | Unadjusted quoted prices in active markets for identical assets or liabilities. Level 1 assets and liabilities include debt and equity securities (both common stock and preferred stock) that are traded in an active exchange market, as well as U.S. Treasury securities. | |
| Level 2 | Unadjusted observable inputs other than Level 1 prices such as quoted prices for similar assets or liabilities; quoted prices in markets that are not active; or other inputs that are observable or can be corroborated by observable market data for the assets or liabilities. Level 2 assets and liabilities include debt securities with quoted prices that are traded less frequently than exchange-traded instruments. This category generally includes certain U.S. Government and agency mortgage-backed debt securities, non-agency structured securities, corporate debt securities and preferred stocks. | |
| Level 3 | Unobservable inputs that are supported by little or no market activity and that are significant to the fair value of the assets or liabilities. Level 3 assets and liabilities include financial instruments whose value is determined using pricing models, discounted cash flow methodologies, or similar techniques, as well as instruments for which the determination of fair value requires significant management judgment or estimation. This category generally includes certain private debt and equity investments. | |
F-5
Table of Contents
At December 31, 2009, Level 3 invested assets comprised approximately 0.2% of the Company’s total investment portfolio fair value. For additional detail, see “Notes to Consolidated Financial Statements — Note 3 — Fair Value of Financial Instruments” listed on page F-1 of this report.
Valuation of Fixed Maturity and Equity Securities
For fixed maturity securities, each month the Company receives prices from its custodian bank and investment manager. Fair values for the Company’s fixed maturity securities are based on prices provided by its investment manager. The prices from the custodian bank are compared to prices from the investment manager. Differences in prices between the sources that the Company considers significant are researched and the Company utilizes the price that it considers most representative of an exit price. Both the investment managers and the custodian bank use a variety of independent, nationally recognized pricing sources to determine market valuations. Each designate specific pricing services or indexes for each sector of the market based upon the provider’s expertise. Typical inputs used by these pricing sources include, but are not limited to, reported trades, benchmark yields, issuer spreads, bids, offers, and/or estimated cash flows and prepayment speeds. When the pricing sources cannot provide fair value determinations, the Company obtains non-binding price quotes from broker-dealers. The broker-dealers’ valuation methodology is sometimes matrix-based, using indicative evaluation measures and adjustments for specific security characteristics and market sentiment. The Company analyzes price and market valuations received to verify reasonableness, to understand the key assumptions used and their sources, to conclude the prices obtained are appropriate, and to determine an appropriate fair value hierarchy level based upon trading activity and the observability of market inputs. Based on this evaluation and investment class analysis, each price is classified into Level 1, 2 or 3. The Company has in place certain control processes to determine the reasonableness of the financial asset fair values. These processes are designed to ensure the values received are accurately recorded and that the data inputs and valuation techniques utilized are appropriate, consistently applied, and that the assumptions are reasonable and consistent with the objective of determining fair value. For example, on a continuing basis, the Company assesses the reasonableness of individual security values received from pricing sources that vary from certain thresholds. Historically, the control processes have not resulted in adjustments to the valuations provided by pricing sources. The Company’s fixed maturity securities portfolio is primarily publicly traded, which allows for a high percentage of the portfolio to be priced through pricing services. Approximately 93% of the portfolio was priced through pricing services or index priced as of December 31, 2009. The remainder of the portfolio was priced by broker-dealers, and these inputs were generally Level 2. There were no significant changes to the valuation process during 2009.
Fair values of equity securities have been determined by the Company from observable market quotations, when available. Private placement securities and equity securities where a public quotation is not available are valued by using non-binding broker quotes or through the use of internal models or analysis. These inputs are based on assumptions deemed appropriate given the circumstances and are believed to be consistent with what other market participants would use when pricing such securities.
F-6
Table of Contents
Other-than-temporary Impairment of Investments
The Company’s methodology of assessing other-than-temporary impairments is based on security-specific facts and circumstances as of the date of the reporting period. Based on these facts, if the Company has the intent to sell the debt security, or if it is more likely than not the Company will be required to sell the debt security before the anticipated recovery in fair value or if management does not expect to recover the entire cost basis of the debt security, an other-than-temporary impairment is considered to have occurred. For equity securities, if the Company does not have the ability and intent to hold the security for the recovery of cost within a reasonable period of time or if recovery of cost is not expected within a reasonable period of time, an other-than-temporary impairment is considered to have occurred. Additionally, if events become known that call into question whether the security issuer has the ability to honor its contractual commitments, such security holding will be evaluated to determine whether or not such security has suffered an other-than-temporary decline in value.
The Company reviews the fair value of all investments in its portfolio on a monthly basis to assess whether an other-than-temporary decline in value has occurred. These reviews, in conjunction with the Company’s investment managers’ monthly credit reports and relevant factors such as (1) the financial condition and near-term prospects of the issuer, (2) the length of time and extent to which the fair value has been less than amortized cost for fixed maturity securities or cost for equity securities, (3) for debt securities, the Company’s intent to sell a security or whether it is more likely than not the Company will be required to sell the security before the anticipated recovery in fair value or maturity; and for equity securities, the Company’s ability and intent to hold the security for the recovery of cost within a reasonable period of time or if recovery of cost is not expected within a reasonable period of time, (4) the stock price trend of the issuer, (5) the market leadership position of the issuer, (6) the debt ratings of the issuer, and (7) the cash flows and liquidity of the issuer or the underlying cash flows for asset-backed securities, are all considered in the impairment assessment. A write-down of an investment is recorded when a decline in the fair value of that investment is deemed to be other-than-temporary, with a realized investment loss charged to income for the period for all equity securities and for credit related losses associated with impaired debt securities. The amount of the total other-than-temporary impairment related to non-credit factors for debt securities is recognized in other comprehensive income, net of applicable taxes.
With respect to fixed income securities involving securitized financial assets — primarily asset backed and commercial mortgage-backed securities in the Company’s portfolio — all fair values are determined by observable inputs. In addition, the securitized financial asset securities’ underlying collateral cash flows are stress tested to determine if there has been any adverse change in the expected cash flows.
A decline in fair value below amortized cost is not assumed to be other-than-temporary for fixed maturity investments with unrealized losses due to spread widening, market illiquidity or changes in interest rates where there exists a reasonable expectation based on the Company’s consideration of all objective information available that the Company will recover the entire cost basis of the security and the Company does not have the intent to sell the investment before maturity or a market recovery is realized and it is more likely than not the Company will not be required to sell the investment. An other-than-temporary impairment loss will be recognized based upon all relevant facts and circumstances for each investment, as appropriate.
F-7
Table of Contents
Goodwill
Goodwill represents the excess of the amounts paid to acquire a business over the fair value of its net assets at the date of acquisition. Goodwill is not amortized, but is tested for impairment at least annually or more frequently if events occur or circumstances change that would more likely than not reduce the fair value of a reporting unit below its carrying amount. A reporting unit is defined as an operating segment or one level below an operating segment. The Company’s reporting units, for which goodwill has been allocated, are equivalent to the Company’s operating segments.
The goodwill impairment test, as defined in the accounting guidance, follows a two-step process. In the first step, the fair value of a reporting unit is compared to its carrying value. If the carrying value of a reporting unit exceeds its fair value, the second step of the impairment test is performed for purposes of confirming and measuring the impairment. In the second step, the fair value of the reporting unit is allocated to all of the assets and liabilities of the reporting unit to determine an implied goodwill value. If the carrying amount of the reporting unit goodwill exceeds the implied goodwill value, an impairment loss would be recognized in an amount equal to that excess, and the charge could have a material adverse effect on the Company’s results of operations and financial position.
The Company completed its annual goodwill assessment for the individual reporting units as of December 31, 2009. The first step of the Company’s analysis indicated that fair value exceeded carrying value for each reporting unit. Management’s determination of the fair value of each reporting unit incorporated multiple inputs including discounted cash flow calculations, the level of the Company’s own share price and assumptions that market participants would make in valuing each reporting unit. Fair value estimates were based primarily on an in-depth analysis of historical experience, projected future cash flows and relevant discount rates, which considered market participant inputs and the relative risk associated with the projected cash flows. Other assumptions included levels of economic capital, future business growth, earnings projections and assets under management for each reporting unit. Estimates of fair value are subject to assumptions that are sensitive to change and represent the Company’s reasonable expectation regarding future developments. The Company also considered other valuation techniques such as peer company price-to-earnings and price-to-book multiples.
As part of the Company’s December 31, 2009 goodwill analysis, the Company compared the fair value of the aggregated reporting units to the market capitalization of the Company. The difference between the aggregated fair value of the reporting units and the market capitalization of the Company was attributed to transaction premium. The amount of the transaction premium was determined to be reasonable based on insurance industry and Company-specific facts and circumstances.
Subsequent reviews of goodwill could result in impairment due to the impact of volatile financial markets on earnings, discount rate assumptions, liquidity and market capitalization (stock price).
F-8
Table of Contents
Deferred Policy Acquisition Costs for Annuity and Interest-sensitive Life Products
Policy acquisition costs, consisting of commissions, policy issuance and other costs, which vary with and are primarily related to the production of business, are capitalized and amortized on a basis consistent with the type of insurance coverage. For all investment (annuity) contracts, acquisition costs are amortized over 20 years in proportion to estimated gross profits. Capitalized acquisition costs for interest-sensitive life contracts are also amortized over 20 years in proportion to estimated gross profits.
The most significant assumptions that are involved in the estimation of annuity gross profits include interest rate spreads, future financial market performance, business surrender/lapse rates, expenses and the impact of realized investment gains and losses. For the variable deposit portion of the annuity segment, the Company amortizes policy acquisition costs utilizing a future financial market performance assumption of a 10% reversion to the mean approach with a 200 basis point corridor around the mean during the reversion period, representing a cap and a floor on the Company’s long-term assumption. The Company’s practice with regard to returns on Separate Accounts assumes that long-term appreciation in equity markets is not changed by short-term market fluctuations, but is only changed when sustained interim deviations are experienced. The Company monitors these changes and only changes the assumption when its long-term expectation changes. The effect of an increase/(decrease) by 100 basis points in the assumed future rate of return is reasonably likely to result in a decrease/(increase) in the deferred policy acquisition costs amortization expense of approximately $1 million. At December 31, 2009, the ratio of capitalized annuity policy acquisition costs to the total annuity accumulated cash value was approximately 4%.
In the event actual experience differs significantly from assumptions or assumptions are significantly revised, the Company may be required to record a material charge or credit to amortization expense for the period in which the adjustment is made. As noted above, there are key assumptions involved in the valuation of capitalized policy acquisition costs. In terms of the sensitivity of this amortization to two of the more significant assumptions, assuming all other assumptions are met, (1) a 10 basis point deviation in the annual targeted interest rate spread assumption would currently impact amortization between $0.10 million and $0.20 million and (2) a 1% deviation from the targeted financial market performance for the underlying mutual funds of the Company’s variable annuities would currently impact amortization between $0.15 million and $0.25 million. These results may change depending on the magnitude and direction of the deviations but represent a range of reasonably likely experience for the noted assumptions. Detailed discussion of the impact of adjustments to the amortization of capitalized acquisition costs is included in “Results of Operations for the Three Years Ended December 31, 2009 — Policy Acquisition Expenses Amortized”.
F-9
Table of Contents
Deferred Taxes
Deferred tax assets and liabilities represent the tax effect of the differences between the financial statement carrying value of existing assets and liabilities and their respective tax bases. The Company evaluates deferred tax assets periodically to determine if they are realizable. Factors in the determination include the performance of the business including the ability to generate capital gains from a variety of sources and tax planning strategies. If, based on available information, it is more likely than not that the deferred income tax asset will not be realized, then a valuation allowance must be established with a corresponding charge to net income. Charges to establish a valuation allowance could have a material adverse effect on the Company’s results of operations and financial position.
Liabilities for Property and Casualty Claims and Claim Settlement Expenses
Underwriting results of the property and casualty segment are significantly influenced by estimates of the Company’s ultimate liability for insured events. There is a high degree of uncertainty inherent in the estimates of ultimate losses underlying the liability for unpaid claims and claim settlement expenses. This inherent uncertainty is particularly significant for liability-related exposures due to the extended period, often many years, that transpires between a loss event, receipt of related claims data from policyholders and ultimate settlement of the claim. Reserves for property and casualty claims include provisions for payments to be made on reported claims (“case reserves”), claims incurred but not yet reported (“IBNR”) and associated settlement expenses (together, “loss reserves”). The process by which these reserves are established requires reliance upon estimates based on known facts and on interpretations of circumstances, including the Company’s experience with similar cases and historical trends involving claim payments and related patterns, pending levels of unpaid claims and product mix, as well as other factors including court decisions, economic conditions and public attitudes.
Reserves are reestimated quarterly. Changes to reserves are recorded in the period in which development factor changes result in reserve reestimates. Detailed discussion of the process utilized to estimate loss reserves, risk factors considered and the impact of adjustments recorded during recent years is included in “Notes to Consolidated Financial Statements — Note 4 — Property and Casualty Unpaid Claims and Claim Expenses” listed on page F-1 of this report. Due to the nature of the Company’s personal lines business, the Company has no exposure to claims for toxic waste cleanup, other environmental remediation or asbestos-related illnesses other than claims under homeowners insurance policies for environmentally related items such as mold.
F-10
Table of Contents
Based on the Company’s products and coverages, historical experience, and modeling of various actuarial methodologies used to develop reserve estimates, the Company estimates that the potential variability of the property and casualty loss reserves within a reasonable probability of other possible outcomes may be approximately plus or minus 6%, which equates to plus or minus approximately $12 million of net income based on reserves as of December 31, 2009. Although this evaluation reflects the most likely outcomes, it is possible the final outcome may fall below or above these estimates.
There are a number of assumptions involved in the determination of the Company’s property and casualty loss reserves. Among the key factors affecting recorded loss reserves for both long-tail and short-tail related coverages, claim severity and claim frequency are of particular significance. Management estimates that a 2% change in claim severity or claim frequency for the most recent 36-month period is a reasonably likely scenario based on recent experience and would result in a change in the estimated loss reserves of between $6.0 million and $10.0 million for long-tail liability related exposures (automobile liability coverages) and between $3.0 million and $4.0 million for short-tail liability related exposures (homeowners and automobile physical damage coverages). Actual results may differ, depending on the magnitude and direction of the deviation.
The Company’s loss and loss adjustment expense actuarial analysis is discussed with management. As part of this discussion, the indicated point estimate of the IBNR loss reserve by line of business (coverage) is reviewed. The Company actuaries also discuss any indicated changes to the underlying assumptions used to calculate the indicated point estimate. Review of the variance between the indicated reserves from these changes in assumptions and the previously carried reserves takes place. After discussion of these analyses and all relevant risk factors, management determines whether the reserve balances require adjustment. The Company’s best estimate of loss reserves may change depending on a revision in the underlying assumptions.
The Company’s liabilities for property and casualty unpaid claims and claim settlement expenses were as follows:
| December 31, 2009 | December 31, 2008 | |||||||||||||||||
| Case Reserves |
IBNR Reserves |
Total (1) | Case Reserves |
IBNR Reserves |
Total (1) | |||||||||||||
| Automobile liability |
$ | 74.0 | $ | 133.7 | $ | 207.7 | $ | 70.3 | $ | 129.5 | $ | 199.8 | ||||||
| Automobile other |
5.3 | 1.8 | 7.1 | 6.1 | 1.6 | 7.7 | ||||||||||||
| Homeowners |
10.3 | 49.6 | 59.9 | 15.1 | 46.6 | 61.7 | ||||||||||||
| All other |
5.9 | 20.4 | 26.3 | 3.9 | 24.7 | 28.6 | ||||||||||||
| Total |
$ | 95.5 | $ | 205.5 | $ | 301.0 | $ | 95.4 | $ | 202.4 | $ | 297.8 | ||||||
| (1) | These amounts are gross, before reduction for ceded reinsurance reserves. |
The facts and circumstances leading to the Company’s reestimate of reserves relate to revisions of the development factors used to predict how losses are likely to develop from the end of a reporting period until all claims have been paid. Reestimates occur because actual loss amounts are different than those predicted by the estimated development factors used in prior reserve estimates. At December 31, 2009, the impact of a reserve reestimation resulting in a 1% increase in net reserves would be a decrease of approximately $2 million in net income. A reserve reestimation resulting in a 1% decrease in net reserves would increase net income by approximately $2 million.
F-11
Table of Contents
Favorable prior years’ reserve reestimates increased net income in 2009 by approximately $7.6 million, primarily the result of favorable frequency and severity trends in voluntary automobile loss and loss adjustment expense emergence for accident years 2006 and prior. The lower than expected claims and expense emergence and resultant lower expected loss ratios caused the Company to lower its reserve estimate at December 31, 2009.
Information regarding the Company’s property and casualty claims and claims settlement expense reserve development table as of December 31, 2009 is located in “Business — Property and Casualty Segment — Property and Casualty Reserves”. Information regarding property and casualty reserve reestimates for each of the three years ended December 31, 2009 is located in “Results of Operations for the Three Years Ended December 31, 2009 — Benefits, Claims and Settlement Expenses”.
Liabilities for Future Policy Benefits
Liabilities for future benefits on life and annuity policies are established in amounts adequate to meet the estimated future obligations on policies in force. Liabilities for future policy benefits on certain life insurance policies are computed using the net level premium method and are based on assumptions as to future investment yield, mortality and withdrawals. Mortality and withdrawal assumptions for all policies have been based on actuarial tables which are consistent with the Company’s own experience. In the event actual experience is worse than the assumptions, additional reserves may be required. This would result in a charge to income for the period in which the increase in reserves occurred. Liabilities for future benefits on annuity contracts and certain long-duration life insurance contracts are carried at accumulated policyholder values without reduction for potential surrender or withdrawal charges.
Valuation of Assets and Liabilities Related to the Defined Benefit Pension Plan
Effective April 1, 2002, participants stopped accruing benefits under the defined benefit pension plan but continue to retain the benefits they had accrued to that date.
The Company’s cost estimates for its defined benefit pension plan are determined annually based on assumptions which include the discount rate, expected return on plan assets, anticipated retirement rate and estimated lump sum distributions. A discount rate of 5.27% was used by the Company for estimating accumulated benefits under the plan at December 31, 2009, which was based on the average yield for long-term, high grade securities having maturities generally consistent with the defined benefit pension payout period. To set its discount rate, the Company looks to leading indicators, including the Citigroup Pension Discount Curve. The expected annual return on plan assets assumed by the Company at December 31, 2009 was 7.5%. The assumption for the long-term rate of return on plan assets was determined by considering actual investment experience during the lifetime of the plan, balanced with reasonable expectations of future growth considering the various classes of assets and percentage allocation for each asset class. Management believes that it has adopted reasonable assumptions for investment returns, discount rates and other key factors used in the estimation of pension costs and asset values.
F-12
Table of Contents
To the extent that actual experience differs from the Company’s assumptions, subsequent adjustments may be required, with the effects of those adjustments charged or credited to income and/or shareholders ’ equity for the period in which the adjustments are made. Generally, a change of 50 basis points in the discount rate would inversely impact pension expense and accumulated other comprehensive income (“AOCI”) by approximately $0.1 million and $1.0 million, respectively. In addition, for every $1 million increase (decrease) in the value of pension plan assets, there is a comparable increase (decrease) in AOCI.
Results of Operations for the Three Years Ended December 31, 2009
Insurance Premiums and Contract Charges
Insurance Premiums Written and Contract Deposits
(Includes annuity and life contract deposits)
| Year Ended December 31, |
Change From Prior Year |
Year Ended December 31, | ||||||||||||||
| 2009 | 2008 | Percent | Amount | 2007 | ||||||||||||
| Property & casualty |
||||||||||||||||
| Automobile and property (voluntary) |
$ | 550.2 | $ | 542.2 | 1.5 | % | $ | 8.0 | $ | 530.6 | ||||||
| Involuntary and other property & casualty |
3.3 | 3.7 | -10.8 | % | (0.4 | ) | 4.6 | |||||||||
| Total property & casualty |
553.5 | 545.9 | 1.4 | % | 7.6 | 535.2 | ||||||||||
| Annuity deposits |
349.8 | 311.7 | 12.2 | % | 38.1 | 337.1 | ||||||||||
| Life |
100.4 | 102.5 | -2.0 | % | (2.1 | ) | 102.4 | |||||||||
| Total |
$ | 1,003.7 | $ | 960.1 | 4.5 | % | $ | 43.6 | $ | 974.7 | ||||||
Insurance Premiums and Contract Charges Earned
(Excludes annuity and life contract deposits)
| Year Ended December 31, |
Change From Prior Year |
Year Ended December 31, | ||||||||||||||
| 2009 | 2008 | Percent | Amount | 2007 | ||||||||||||
| Property & casualty |
||||||||||||||||
| Automobile and property (voluntary) |
$ | 544.1 | $ | 537.8 | 1.2 | % | $ | 6.3 | $ | 525.1 | ||||||
| Involuntary and other property & casualty |
3.2 | 3.3 | -3.0 | % | (0.1 | ) | 10.0 | |||||||||
| Total property & casualty |
547.3 | 541.1 | 1.1 | % | 6.2 | 535.1 | ||||||||||
| Annuity |
14.5 | 17.7 | -18.1 | % | (3.2 | ) | 21.8 | |||||||||
| Life |
97.8 | 99.7 | -1.9 | % | (1.9 | ) | 97.4 | |||||||||
| Total |
$ | 659.6 | $ | 658.5 | 0.2 | % | $ | 1.1 | $ | 654.3 | ||||||
For 2009, the Company’s premiums written and contract deposits increased $43.6 million, or 4.5%, compared to 2008, primarily reflecting increases in annuity single premium and rollover deposit receipts in 2009. For 2008, the Company’s premiums written and contract deposits decreased $14.6 million, or 1.5%, compared to 2007, largely due to decreases in single premium annuity deposit receipts in 2008. The reduced costs associated with the Company’s property and casualty catastrophe reinsurance program, as described below, represented a $6.9 million increase to premiums for 2008. Voluntary property and casualty business represents policies sold through the Company’s marketing organization and issued under the Company’s underwriting guidelines. Involuntary property and casualty business consists of allocations of business from state mandatory insurance facilities and assigned risk business.
The Company’s dedicated agency force totaled 715 at December 31, 2009, reflecting an increase of 6.7% compared to 670 agents at December 31, 2008. At December 31, 2007, the Company had 790 agents. In addition to agents, the Company’s total points of distribution include licensed producers who work with the agents. At December 31, 2009, there were 571 licensed producers, compared to 394 at December 31, 2008 and 253 at December 31, 2007.
F-13
Table of Contents
Including these licensed producers, the Company’s total points of distribution increased to 1,286 at December 31, 2009, a growth of 20.9% compared to 12 months earlier. At the time of this Annual Report on Form 10-K, management anticipates that the year-end 2010 agent count will increase modestly as the Company continues its transition to its Agency Business Model and Exclusive Agent agreement, with a further increase in total points of distribution resulting from the growing number of licensed producers supporting agents who adopt the new models.
In 2006, the Company began the transition from a single-person agent operation to its Agency Business Model, with agents in outside offices with support personnel and licensed producers, designed to remove capacity constraints and increase productivity. Building on the foundation of the Agency Business Model, in the fourth quarter of 2008 the Company introduced its Exclusive Agent agreement which is designed to place agents in the position to become business owners and invest their own capital to grow their agencies. By January 1, 2009, the first 71 individuals migrated from being employee agents to functioning as independent Exclusive Agents. By December 31, 2009, 249 individuals were appointed as Exclusive Agents, including both individuals migrating from employee agent status and individuals newly appointed to market the Company’s products. See additional description in “Business — Corporate Strategy and Marketing — Dedicated Agency Force”.
For the Company, as well as other personal lines property and casualty companies, new business levels have been impacted by the economy and the overall decreases in automobile and home sales. In 2009, total new automobile sales units were 4.1% less than the prior year, including a 1.7% decrease in true new automobile sales units. Fourth quarter 2009 true new automobile sales units were 4.0% greater than the same period in 2008, helping to narrow the gap for the full year comparison. New homeowners sales units decreased 1.4% compared to 2008, after also reflecting positive sales growth in the fourth quarter of 2009. Annuity new business increased 31.4% compared to 2008, reflecting new business growth in the Company’s core scheduled deposit business (on an annualized basis at the time of sale, compared to the reporting of new contract deposits which are recorded when cash is received) of 21.9% coupled with a 34.5% increase in single premium and rollover deposits, including both Horace Mann and third-party vendor products. Both the Company’s dedicated agency force and the independent agent distribution channel contributed to the growth in sales of Horace Mann annuity products. Growth in annuity new business has been supported by the Company’s approved 403(b) payroll reduction capabilities. The Company has payroll slots in approximately one-third of the 15,400 public school districts in the United States. Sales of new life insurance products have been adversely impacted by current economic conditions industry wide. In spite of these conditions, the Company’s introduction of a new educator-focused portfolio of term and whole life products in the third quarter of 2009 led to life new business levels for 2009 that were comparable to 2008. Within that 2009 life sales comparison, a decline in sales of third-party vendor products more than offset the 4.1% increase in sales of Horace Mann’s life products. For 2009, total new business sales increased 22.8% compared to 2008. In total, dedicated agent sales for 2009 increased 11.4% compared to the prior year. Average overall productivity per agent increased compared to 2008, reflecting improvements in the Company’s lead lines of business — voluntary automobile and annuity. Average agent productivity is measured as new sales premiums or new business units from the dedicated agent force per the average number of dedicated agents for the period.
F-14
Table of Contents
Total voluntary automobile and homeowners premium written increased 1.5%, or $8.0 million, in 2009, including a $3.2 million increase in catastrophe reinsurance premiums for 2009. The automobile and homeowners average written premium per policy each increased compared to 2008, with the change in average premium for both lines moderated by the improved quality of the books of business. For 2009, approved rate increases for the Company’s automobile and homeowners business were minimal, but slightly more than rate actions in 2008. At December 31, 2009, there were 528,000 voluntary automobile and 262,000 homeowners policies in force, for a total of 790,000 policies, compared to a total of 798,000 policies at December 31, 2008 and 801,000 at December 31, 2007.
Based on policies in force, the voluntary automobile 6-month retention rate for new and renewal policies was 91.3% at December 31, 2009 compared to 91.1% at December 31, 2008 and 91.0% at December 31, 2007. The property 12-month new and renewal policy retention rate was 88.8% at December 31, 2009 compared to 88.6% and 88.3% at December 31, 2008 and 2007, respectively.
Voluntary automobile premium written increased 1.3% ($4.7 million) compared to 2008. In 2008, voluntary automobile premium written increased 0.7% ($2.5 million) compared to 2007. In 2009, the premium growth was driven by a modest increase in average written premium per policy. Average earned premium per policy also increased modestly. In 2008, automobile average written premium per policy and average earned premium per policy increased modestly, while policies in force were equal to December 31, 2007. Automobile policies in force at December 31, 2009 decreased 7,000 compared to both December 31, 2008 and December 31, 2007. The number of educator policies increased throughout the periods.
Voluntary homeowners premium written increased 1.9% ($3.3 million) compared to 2008 including the higher amount of catastrophe reinsurance premiums noted above. In 2008, voluntary homeowners premium written increased 5.5% ($9.1 million) compared to 2007 including a reduction in catastrophe reinsurance premiums of $6.9 million benefitting the 2008 comparison. Homeowners average written and earned premium per policy each increased 4% in 2009 compared to 2008. Homeowners average written premium per policy increased 3% in 2008, while average earned premium per policy increased 5% in 2008. Homeowners policies in force at December 31, 2009 decreased 1,000 compared to December 31, 2008; and homeowners policies in force at December 31, 2008 decreased 3,000 compared to December 31, 2007. Over both years, growth in the number of educator policies was offset by expected reductions, primarily in non-educator policies, due to the Company’s risk mitigation programs, including actions in catastrophe-prone coastal areas. The Company continues to evaluate and implement actions to further mitigate its risk exposure in hurricane-prone areas, as well as other areas of the country. Such actions could include, but are not limited to, non-renewal of homeowners policies, restricted agent geographic placement, limitations on agent new business sales, further tightening of underwriting standards and increased utilization of third-party vendor products.
As an example, in early 2010 the Company began a program to address homeowners profitability and hurricane exposure issues in Florida. The Company ceased writing new homeowner (including home, condo, renters and dwelling fire) policies in that state and initiated a program to non-renew about 9,600 policies, over half of the Company’s Florida book of property business, starting with August 2010 policy effective dates. The Company’s dedicated agents will continue to work closely with customers to find coverage with other third-party companies that are continuing to underwrite property risks in Florida. While this action will likely impact the overall policy in force count and premiums in the short-term, it is expected
F-15
Table of Contents
to reduce risk exposure concentration, reduce overall catastrophe reinsurance costs and improve underwriting results by 2012.
During 2009, ongoing and recurring proceedings occurred in North Carolina challenging private passenger automobile rates. Notification received by the Company indicates that the proceedings are complete, resulting in a rate increase for the Company that is slightly lower than the rate the Company submitted. For 2009, the Company escrowed $0.6 million of premiums received related to these proceedings which will be refunded to policyholders.
Annuity deposits received increased 12.2% in 2009 after decreasing 7.5% in 2008, compared to the respective prior years. In both comparisons, the primary driver was the change in single premium and rollover deposit receipts. In 2009, single premium and rollover deposits increased 42.3%, more than offsetting the 3.2% decline in scheduled annuity deposit receipts. In 2009, new deposits to variable accounts decreased 16.5%, or $22.2 million, and new deposits to fixed accounts increased 34.0%, or $60.3 million, compared to the prior year. Management continues to see benefits of becoming a stronger presence in the educator annuity market subsequent to the implementation of new Internal Revenue Service Section 403(b) regulations, effective January 1, 2009. Also, management believes that educators view the Company as having a recognized brand and providing personalized advice through agents with a local presence, leading to new business growth and strong annuity business persistency. In 2008, new deposits to variable accounts decreased 10.3%, or $15.5 million, and new deposits to fixed accounts decreased 5.3%, or $9.9 million, compared to 2007. In addition to external contractholder deposits, annuity new deposits include contributions and transfers by the Company’s employees in the Company’s 401(k) group annuity contract.
The Company utilizes a nationwide network of independent agents who comprise a supplemental distribution channel for the Company’s 403(b) tax-qualified annuity products. The independent agent distribution channel included 832 authorized agents at December 31, 2009. During 2009, this channel generated $52.6 million in annualized new annuity sales for the Company compared to $21.3 million in 2008 and $32.9 million in 2007, reflecting increases in single and rollover deposit business as well as scheduled deposit business.
Total annuity accumulated cash value of $3.7 billion at December 31, 2009 increased 13.8% compared to a year earlier, as the increase from new deposits received and favorable retention were accompanied by favorable financial market performance over the 12 months. Total annuity accumulated cash value of $3.3 billion at December 31, 2008 decreased 12.2% compared to a year earlier, as the increase from new deposits received and favorable retention was more than offset by unfavorable financial market performance over the 12 months ended December 31, 2008. At December 31, 2009, the number of annuity contracts outstanding of 178,000 increased 4.1%, or 7,000 contracts, compared to December 31, 2008 and increased 6.6%, or 11,000 contracts, compared to December 31, 2007.
Variable annuity accumulated balances at December 31, 2009 reflected growth of 27.1% compared to December 31, 2008, reflecting financial market performance — which improved somewhat during the second and third quarters of 2009, followed by more notable improvement in the fourth quarter. Full year annuity segment contract charges earned decreased 18.1%, or $3.2 million, compared to 2008, reflecting the reduced account values throughout much of 2009. Variable annuity accumulated balances were 38.2% lower at December 31, 2008 than at December 31, 2007, primarily reflecting financial market performance, and annuity segment contract charges earned decreased 18.8%, or $4.1 million, compared to 2007.
F-16
Table of Contents
Life segment premiums and contract deposits decreased 2.0% compared to 2008. In 2008, life segment premiums and contract deposits were comparable to 2007. The ordinary life insurance in force lapse ratio was 5.4% for both the 12 months ended December 31, 2009 and 2008, compared to 5.8% for the 12 months ended December 31, 2007.
Net Investment Income
For 2009, pretax investment income of $246.8 million increased 7.2%, or $16.5 million, (7.2%, or $11.2 million, after tax) compared to 2008. For 2008, pretax investment income of $230.3 million increased 2.9%, or $6.5 million, (2.8%, or $4.2 million, after tax) compared to 2007. The increase in 2009 primarily reflected growth in the size of the average investment portfolio on an amortized cost basis, and was accompanied by improvement in the average pretax yield. Average invested assets (excluding securities lending collateral) increased 5.2% over the 12 months ended December 31, 2009. The average pretax yield on the investment portfolio was 5.63% (3.82% after tax) for 2009, compared to a pretax yield of 5.52% (3.75% after tax) and 5.53% (3.76% after tax) for 2008 and 2007, respectively. For 2009, the Company’s investment portfolio yield reflected the adverse impact of the elevated level of short-term investments in the portfolio related to the Company’s opportunistic capital gains programs during the year, selective reinvestment of the sales proceeds and strong operational cash flows throughout the year. While the short-term position was somewhat reduced during the fourth quarter of 2009, management anticipates reinvesting the majority of these funds in intermediate and long term bonds throughout 2010.
Net Realized Investment Gains and Losses
For 2009, net realized investment gains (pretax) were $26.3 million compared to net realized investment losses of $63.9 million in 2008 and $3.4 million in 2007. The net gains and losses in all periods were realized from the recording of impairment charges and ongoing investment portfolio management activity. In addition, 2009, 2008 and 2007 included $1.5 million, $1.1 million and $0.3 million, respectively, of litigation proceeds primarily on previously impaired Enron Corp. and WorldCom, Inc. debt securities.
In the fourth quarter of 2009, pretax net realized investment gains of $4.6 million included (1) a $0.2 million credit-related impairment write-down related to one issuer and (2) $2.3 million of realized impairment losses on securities that were disposed of during the quarter. The impairment amounts were more than offset by $5.7 million of realized gains on other security disposals, including $1.4 million of realized gains on previously impaired securities that were disposed of during the quarter — primarily financial sector securities, and $1.4 million of litigation proceeds on debt securities.
In the third quarter of 2009, pretax net realized investment gains of $11.5 million included (1) $1.3 million of impairment write-downs, attributable to three issuers, and (2) $0.5 million of realized impairment losses on securities that were disposed of during the quarter. The impairment amounts were more than offset by $13.3 million of realized gains on other security disposals.
F-17
Table of Contents
In the second quarter of 2009, pretax net realized investment gains were $11.0 million, which included (1) $3.4 million of credit related impairment write-downs, primarily related to a single collateralized debt obligation security, (2) $0.6 million of impairment write-downs on equity securities and securities the Company intended to sell, and (3) $4.1 million of realized losses on securities that were disposed of during the quarter, primarily financial institution and telecommunications sector securities. The impairment amounts were largely offset by $6.1 million of realized gains on previously impaired securities that were disposed of during the quarter, primarily financial sector securities. In addition, the second quarter reflected $13.0 million of realized gains on other security disposals.
In the first quarter of 2009, pretax net realized investment losses were $0.8 million, including $15.8 million of impairment charges. These charges were comprised of $13.4 million of impairment write-downs, primarily below investment grade perpetual preferred stocks, and $2.4 million of impairments on securities that the Company no longer intended to hold until the value fully recovered, primarily high-yield bonds. In addition, the Company recorded $1.9 million of realized losses on securities that were disposed of during the quarter, primarily high-yield investments. These losses were largely offset by $16.9 million of realized gains on security disposals.
The fourth quarter 2008 write-downs of $5.8 million were related primarily to high-yield and preferred stock investments that the Company no longer intended to hold for a period of time necessary to recover the decline in value, with the remainder related to securities for which impairment write-downs were previously recorded.
The third quarter 2008 write-downs of $33.4 million included approximately $23.7 million related to fixed maturity security and preferred stock impairments for which the issuer’s ability to pay future interest and principal based upon contractual terms was compromised — namely, Lehman Brothers Holdings, Inc., the Federal National Mortgage Association (“Fannie Mae”), the Federal Home Loan Mortgage Corporation (“Freddie Mac”), and American International Group, Inc. The remaining amount of write-downs — primarily of financial institution securities and high yield bonds — was primarily attributable to the Company no longer having the intent to hold the securities for a period of time necessary to recover the decline in value. In addition, net realized losses in the third quarter of 2008 included $14.2 million of realized impairment losses primarily on financial institution securities that were disposed of during the quarter.
The second quarter 2008 write-downs of $11.2 million were primarily related to 2 collateralized debt obligation securities and 5 equity securities, including 4 financial industry preferred stock issues. In addition, net realized losses in the second quarter of 2008 included $0.3 million of realized impairment losses on securities that were disposed of during the period.
In the first quarter 2008, impairment write-downs of $2.7 million were recorded, primarily related to certain below investment grade fixed maturity securities, with $2.3 million of the write-downs attributable to 6 securities of telecommunications and telecommunications-related media issuers, which at March 31, 2008 the Company no longer intended to hold until the value fully recovered. In addition to write-downs, net realized losses in the first quarter of 2008 included $3.9 million of realized other-than-temporary impairment losses, primarily on financial institution and below investment grade fixed maturity securities that were disposed of during the quarter.
F-18
Table of Contents
In the fourth quarter of 2007, the Company recorded impairment charges of $5.9 million, $3.8 million of which was attributable to one sub-prime residential mortgage-backed security, 2006 vintage, having a fair value of $1.1 million at December 31, 2007. The remaining $2.1 million of the impairment charge in the quarter was attributable to non-mortgage related securities, primarily corporate high yield bonds and preferred stocks, which the Company intended to sell. In the third quarter of 2007, the Company recorded impairment charges of $0.3 million related to fixed income securities from one issuer in the paper sector, and a portion of these securities were subsequently sold in October 2007. In the second quarter of 2007, the Company recorded impairment charges of $2.3 million from the home builder sector of its fixed income security portfolio, and these securities were subsequently sold in July 2007.
The Company, from time to time, sells invested assets subsequent to the balance sheet date that were considered temporarily impaired at the balance sheet date. Such sales are generally due to events occurring subsequent to the balance sheet date that result in a change in the Company’s intent to sell an invested asset.
There were securities priced below 80% of book value at December 31, 2009 that were not impaired. While the credit markets and credit spreads continued to improve across virtually all asset classes in 2009 resulting in significant improvement in the Company’s gross unrealized loss position, the persisting uncertainty and concern over prolonged economic weakness continue to have an adverse effect on the liquidity and fair value of certain asset classes and securities. With respect to fixed income securities involving securitized financial assets, the underlying collateral cash flows were stress tested to determine there was no adverse change in the expected cash flows. Management views the decrease in value of all of these securities as temporary. For debt securities, management does not have the intent to sell the securities and it is not more likely than not the Company will be required to sell the securities before the anticipated recovery in fair value or maturity. In addition, management expects to recover the entire cost basis of the debt securities. For equity securities, the Company has the ability and intent to hold the securities for the recovery of cost within a reasonable period of time.
F-19
Table of Contents
The table below presents the Company’s fixed maturity securities and equity securities portfolios as of December 31, 2009 by major asset class, including the ten largest sectors of the Company’s corporate bond holdings (based on fair value) and the sectors of the equity securities holdings. Compared to December 31, 2008, credit spreads improved across virtually all asset classes in 2009, with the Company’s investment grade corporate bond portfolio showing the most significant improvement in net unrealized gains. Some of the more highly stressed asset classes also showed improvement during 2009, including the Company’s commercial mortgage-backed securities portfolio and its financial institution bond and preferred stock holdings. However, the persisting uncertainty and resultant volatility in the financial markets continued to have an adverse effect on the fair value of investments. The Company’s commercial mortgage-backed securities continue to be the most impacted.
| Number of Issuers |
Fair Value |
Amortized Cost or Cost |
Pretax Unrealized Gain(Loss) |
|||||||||
| Fixed Maturity Securities |
||||||||||||
| Corporate bonds |
||||||||||||
| Utilities |
50 | $ | 306.1 | $ | 289.4 | $ | 16.7 | |||||
| Banking and Finance |
46 | 275.2 | 271.0 | 4.2 | ||||||||
| Energy |
43 | 221.9 | 207.0 | 14.9 | ||||||||
| Health Care |
36 | 130.0 | 125.8 | 4.2 | ||||||||
| Insurance |
25 | 114.5 | 114.4 | 0.1 | ||||||||
| Telecommunications |
23 | 112.0 | 105.8 | 6.2 | ||||||||
| Metal and Mining |
12 | 68.5 | 68.3 | 0.2 | ||||||||
| Broadcasting and Media |
12 | 61.2 | 57.4 | 3.8 | ||||||||
| Transportation |
14 | 59.5 | 58.5 | 1.0 | ||||||||
| Natural Gas |
12 | 57.6 | 53.9 | 3.7 | ||||||||
| All Other Corporates (1) |
135 | 432.1 | 415.4 | 16.7 | ||||||||
| Total corporate bonds |
408 | 1,838.6 | 1,766.9 | 71.7 | ||||||||
| Mortgage-backed securities |
||||||||||||
| U.S. government and federally sponsored agencies |
322 | 455.1 | 436.8 | 18.3 | ||||||||
| Commercial |
127 | 267.4 | 334.9 | (67.5 | ) | |||||||
| Other |
14 | 16.6 | 16.3 | 0.3 | ||||||||
| Municipal bonds |
277 | 913.9 | 891.1 | 22.8 | ||||||||
| Government bonds |
||||||||||||
| U.S. |
6 | 347.2 | 361.0 | (13.8 | ) | |||||||
| Foreign |
8 | 41.9 | 39.9 | 2.0 | ||||||||
| Collateralized debt obligations (2) |
9 | 14.3 | 18.4 | (4.1 | ) | |||||||
| Asset-backed securities |
58 | 204.9 | 196.7 | 8.2 | ||||||||
| Total fixed maturity securities |
1,229 | $ | 4,099.9 | $ | 4,062.0 | $ | 37.9 | |||||
| Equity Securities |
||||||||||||
| Non-redeemable preferred stocks |
||||||||||||
| Banking and Finance |
18 | $ | 40.3 | $ | 42.8 | $ | (2.5 | ) | ||||
| Insurance |
8 | 7.5 | 7.9 | (0.4 | ) | |||||||
| Real Estate |
2 | 5.1 | 4.9 | 0.2 | ||||||||
| Utilities |
4 | 5.0 | 5.0 | * | ||||||||
| U.S. federally sponsored agencies |
2 | 0.1 | * | 0.1 | ||||||||
| Common stocks |
||||||||||||
| Cable |
3 | 1.1 | 0.9 | 0.2 | ||||||||
| Technology and other |
2 | 0.6 | * | 0.6 | ||||||||
| Total equity securities |
39 | $ | 59.7 | $ | 61.5 | $ | (1.8 | ) | ||||
| Total |
1,268 | $ | 4,159.6 | $ | 4,123.5 | $ | 36.1 | |||||
| * | Less than $0.1 million. |
| (1) | The All Other Corporates category contains 19 additional industry classifications. Technology, industrial, food and beverage, miscellaneous, retail and automobile represented $258.7 million of fair value at December 31, 2009, with the remaining 13 classifications each representing less than $31 million. |
| (2) | Based on fair value, 76.9% of the collateralized debt obligation securities were rated investment grade by Standard and Poor’s Corporation (“S&P”) and/or Moody’s Investors Service, Inc. (“Moody’s”) at December 31, 2009. |
F-20
Table of Contents
At December 31, 2009, the Company’s diversified fixed maturity securities portfolio consisted of 1,487 investment positions, issued by 1,229 entities, and totaled approximately $4.1 billion in fair value. This portfolio was 94.8% investment grade, based on fair value, with an average quality rating of A+.
At December 31, 2009, the Company had limited exposure to subprime and “Alt-A” mortgage loans. The Company had two subprime securities with a fair value of $0.5 million and an unrealized gain of less than $0.1 million at December 31, 2009. The “Alt-A” mortgage loan exposure was comprised of one security with a total fair value of approximately $0.5 million, vintage year 2004, with an unrealized loss of approximately $0.1 million at December 31, 2009.
At December 31, 2009, the Company had $267.4 million fair value in commercial mortgage-backed securities (“CMBS”), primarily in the annuity and life portfolios, with a net unrealized loss of $67.5 million. CMBS spreads remained wide as of December 31, 2009, particularly for the more recent vintages with lower ratings. The Company’s CMBS portfolio is 95% investment grade, with an overall credit rating of AA-, and is well diversified by property type, geography and sponsor. The Company uses an estimate of future cash flows expected to be collected to evaluate the CMBS portfolio. The determination of cash flow estimates is inherently subjective and methodologies may vary depending on facts and circumstances specific to the security. All reasonably available information relevant to the collectability of the security, including past events, current conditions, and reasonable and supportable assumptions and forecasts, are considered when developing the estimate of cash flows expected to be collected. Information includes, but is not limited to, debt-servicing, missed refinancing opportunities and geography. Loan level characteristics such as issuer, payment terms, property type, and economic outlook are also utilized in financial models, along with historical performance, to estimate or measure the loan’s propensity to default. Additionally, financial models take into account loan age, lease rollovers, rent volatilities, vacancy rates and exposure to refinancing as additional drivers of default. For transactions where loan level data is not available, financial models use a proxy based on the collateral characteristics. Loss severity is a function of multiple factors including, but not limited to, the unpaid balance, interest rate, assessed property value at origination, change in property valuation and loan-to-value ratio at origination. Cost of capital rates and debt service ratios are also considered. The cash flows generated by the collateral securing these securities are then estimated with these default and loss severity assumptions. These collateral cash flows are then utilized, along with consideration for the issue’s position in the overall structure, to estimate the cash flows associated with the commercial mortgage-backed security held by the Company.
F-21
Table of Contents
The table below presents rating, vintage year and property type information for the Company’s CMBS portfolio.
| December 31, 2009 | December 31, 2008 | |||||||||||||
| Fair Value |
Pretax Unrealized Gain (Loss) |
Fair Value |
Pretax Unrealized Gain (Loss) |
|||||||||||
| Rating |
||||||||||||||
| AAA |
$ | 104.3 | $ | (3.7 | ) | $ | 133.4 | $ | (32.1 | ) | ||||
| AA |
68.7 | (9.1 | ) | 57.4 | (17.4 | ) | ||||||||
| A |
65.1 | (28.1 | ) | 30.4 | (58.9 | ) | ||||||||
| BBB |
16.5 | (7.1 | ) | 0.5 | (0.1 | ) | ||||||||
| BB and below |
12.8 | (19.5 | ) | — | — | |||||||||
| Total |
$ | 267.4 | $ | (67.5 | ) | $ | 221.7 | $ | (108.5 | ) | ||||
| Vintage |
||||||||||||||
| 2003 and prior |
$ | 18.2 | $ | (1.4 | ) | $ | 25.9 | $ | (4.2 | ) | ||||
| 2004 |
14.9 | (3.9 | ) | 14.5 | (8.6 | ) | ||||||||
| 2005 |
67.5 | (45.0 | ) | 58.4 | (71.2 | ) | ||||||||
| 2006 |
43.9 | (13.7 | ) | 32.7 | (21.8 | ) | ||||||||
| 2007 |
41.0 | (0.7 | ) | 27.0 | (1.6 | ) | ||||||||
| 2008 |
42.3 | (2.2 | ) | 63.2 | (1.1 | ) | ||||||||
| 2009 |
39.6 | (0.6 | ) | — | — | |||||||||
| Total |
$ | 267.4 | $ | (67.5 | ) | $ | 221.7 | $ | (108.5 | ) | ||||
| Property type |
||||||||||||||
| Conduit/Fusion |
$ | 126.7 | $ | (62.4 | ) | $ | 120.8 | $ | (106.4 | ) | ||||
| Military housing |
54.4 | (5.4 | ) | 40.4 | (2.6 | ) | ||||||||
| GNMA project loans |
52.3 | (0.4 | ) | 40.2 | 4.9 | |||||||||
| Cell tower |
25.2 | 2.0 | 9.9 | (1.8 | ) | |||||||||
| Timber |
4.8 | * | 3.7 | (1.0 | ) | |||||||||
| Single borrower |
4.0 | (1.3 | ) | 6.7 | (1.6 | ) | ||||||||
| Total |
$ | 267.4 | $ | (67.5 | ) | $ | 221.7 | $ | (108.5 | ) | ||||
| * | Less than $0.1 million. |
At December 31, 2009, the Company had $315.5 million fair value in financial institution bonds and preferred stocks with a net unrealized gain of $1.7 million. The Company’s holdings in this sector are primarily large, well recognized institutions, which have been broadly supported by government intervention and credit enhancement programs.
At December 31, 2009, the Company had $913.9 million fair value invested in municipal bonds with a net unrealized gain of $22.8 million. Approximately 68% of the municipal bonds are tax-exempt and 72% are revenue bonds. The overall credit quality of these securities was AA, with approximately 44% of the value insured at December 31, 2009. This represents approximately 9% of the Company’s total investment portfolio that is guaranteed by the mono-line credit insurers. When selecting securities, the Company focuses primarily on the quality of the underlying security and does not place significant reliance on the additional insurance benefit. Excluding the effect of insurance, the credit quality of the underlying municipal bond portfolio was AA at December 31, 2009.
F-22
Table of Contents
At December 31, 2009, the fixed maturity securities and equity securities portfolio had $141.8 million pretax of gross unrealized losses related to 480 positions. The following table provides information regarding all fixed maturity securities and equity securities that had an unrealized loss at December 31, 2009, including the length of time that the securities continuously have been in an unrealized loss position.
Investment Positions With Unrealized Losses Segmented by
Quality and Period of Continuous Unrealized Loss
As of December 31, 2009
| Number of Positions |
Fair Value |
Amortized Cost or Cost |
Pretax Unrealized Loss |
|||||||||
| Fixed Maturity Securities |
||||||||||||
| Investment grade |
||||||||||||
| 3 Months or less |
159 | $ | 779.6 | $ | 801.8 | $ | (22.2 | ) | ||||
| 4 through 6 months |
6 | 38.9 | 40.4 | (1.5 | ) | |||||||
| 7 through 9 months |
7 | 41.6 | 44.6 | (3.0 | ) | |||||||
| 10 through 12 months |
12 | 22.7 | 26.1 | (3.4 | ) | |||||||
| 13 through 24 months |
107 | 210.8 | 236.6 | (25.8 | ) | |||||||
| 25 through 36 months |
61 | 166.2 | 210.5 | (44.3 | ) | |||||||
| 37 through 48 months |
3 | 7.3 | 8.0 | (0.7 | ) | |||||||
| Greater than 48 months |
3 | 11.5 | 13.4 | (1.9 | ) | |||||||
| Total |
358 | $ | 1,278.6 | $ | 1,381.4 | $ | (102.8 | ) | ||||
| Non-investment grade |
||||||||||||
| 3 Months or less |
2 | $ | 1.9 | $ | 1.9 | * | ||||||
| 4 through 6 months |
— | — | — | — | ||||||||
| 7 through 9 months |
— | — | — | — | ||||||||
| 10 through 12 months |
1 | 0.8 | 2.4 | $ | (1.6 | ) | ||||||
| 13 through 24 months |
34 | 44.3 | 51.4 | (7.1 | ) | |||||||
| 25 through 36 months |
37 | 54.4 | 73.2 | (18.8 | ) | |||||||
| 37 through 48 months |
6 | 6.5 | 11.8 | (5.3 | ) | |||||||
| Greater than 48 months |
7 | 8.2 | 8.6 | (0.4 | ) | |||||||
| Total |
87 | $ | 116.1 | $ | 149.3 | $ | (33.2 | ) | ||||
| Not rated |
— | — | — | — | ||||||||
| Total fixed maturity securities |
445 | $ | 1,394.7 | $ | 1,530.7 | $ | (136.0 | ) | ||||
| Equity Securities (1) |
||||||||||||
| Investment grade |
||||||||||||
| 3 Months or less |
1 | $ | 0.5 | $ | 0.5 | * | ||||||
| 4 through 6 months |
— | — | — | — | ||||||||
| 7 through 9 months |
— | — | — | — | ||||||||
| 10 through 12 months |
2 | 3.3 | 4.2 | $ | (0.9 | ) | ||||||
| 13 through 24 months |
16 | 14.8 | 17.7 | (2.9 | ) | |||||||
| 25 through 36 months |
10 | 7.2 | 8.7 | (1.5 | ) | |||||||
| 37 through 48 months |
1 | 4.4 | 4.5 | (0.1 | ) | |||||||
| Greater than 48 months |
— | — | — | — | ||||||||
| Total |
30 | $ | 30.2 | $ | 35.6 | $ | (5.4 | ) | ||||
| Non-investment grade, all 25 through 36 months |
4 | $ | 1.8 | $ | 2.2 | $ | (0.4 | ) | ||||
| Not rated, all 4 through 6 months |
1 | * | * | * | ||||||||
| Total equity securities |
35 | $ | 32.0 | $ | 37.8 | $ | (5.8 | ) | ||||
| Total fixed maturity securities and equity securities |
480 | $ | 1,426.7 | $ | 1,568.5 | $ | (141.8 | ) | ||||
| * | Less than $0.1 million. |
| (1) | Includes nonredeemable (perpetual) preferred stocks and common stocks. |
F-23
Table of Contents
Of the investment positions (fixed maturity securities and equity securities) with unrealized losses, 60 were trading below 80% of book value at December 31, 2009 and the table below provides additional information regarding these securities. These positions were structured securities, investment grade bonds, preferred stock (both fixed maturity securities and equity securities in nature), and below investment grade bonds.
Investment Positions With Fair Value Below 80% of Amortized Cost
Segmented by Quality and Period of Continuous Valuation Below 80%
As of December 31, 2009
| Number of Positions |
Fair Value |
Amortized Cost or Cost |
Pretax Unrealized Loss |
|||||||||
| Fixed Maturity Securities |
||||||||||||
| Investment grade |
||||||||||||
| 3 Months or less |
12 | $ | 16.5 | $ | 21.6 | $ | (5.1 | ) | ||||
| 4 through 6 months |
— | — | — | — | ||||||||
| 7 through 9 months |
2 | 1.9 | 2.7 | (0.8 | ) | |||||||
| 10 through 12 months |
2 | 3.7 | 4.9 | (1.2 | ) | |||||||
| 13 through 24 months |
25 | 50.7 | 90.2 | (39.5 | ) | |||||||
| Greater than 24 months |
— | — | — | — | ||||||||
| Total |
41 | $ | 72.8 | $ | 119.4 | $ | (46.6 | ) | ||||
| Non-investment grade |
||||||||||||
| 3 Months or less |
4 | $ | 4.0 | $ | 5.2 | $ | (1.2 | ) | ||||
| 4 through 6 months |
— | — | — | — | ||||||||
| 7 through 9 months |
— | — | — | — | ||||||||
| 10 through 12 months |
3 | 4.3 | 7.1 | (2.8 | ) | |||||||
| 13 through 24 months |
8 | 14.3 | 37.4 | (23.1 | ) | |||||||
| Greater than 24 months |
— | — | — | — | ||||||||
| Total |
15 | $ | 22.6 | $ | 49.7 | $ | (27.1 | ) | ||||
| Not rated |
— | — | — | — | ||||||||
| Total fixed maturity securities |
56 | $ | 95.4 | $ | 169.1 | $ | (73.7 | ) | ||||
| Equity Securities (1) |
||||||||||||
| Investment grade |
||||||||||||
| 3 Months or less |
— | — | — | — | ||||||||
| 4 through 6 months |
— | — | — | — | ||||||||
| 7 through 9 months |
— | — | — | — | ||||||||
| 10 through 12 months |
1 | $ | 2.8 | $ | 3.7 | $ | (0.9 | ) | ||||
| 13 through 24 months |
3 | 3.8 | 5.7 | (1.9 | ) | |||||||
| Greater than 24 months |
— | — | — | — | ||||||||
| Non-investment grade |
— | — | — | — | ||||||||
| Not rated |
— | — | — | — | ||||||||
| Total equity securities |
4 | $ | 6.6 | $ | 9.4 | $ | (2.8 | ) | ||||
| Total fixed maturity securities and equity securities |
60 | $ | 102.0 | $ | 178.5 | $ | (76.5 | ) | ||||
| (1) | Includes nonredeemable (perpetual) preferred stocks and common stocks. |
The 60 securities with fair values below 80% of book value at December 31, 2009 represented approximately 2.2% of the Company’s total investment portfolio at fair value. Approximately 20.1% of those securities have been below 80% of book value for three months or less as of December 31, 2009. Of the total securities trading below 80% of book value, 15 securities had fair values less than 50% of book value, representing 0.6% of the Company’s total investment portfolio, with a pretax unrealized loss of $44.8 million. Commercial mortgage-backed securities represented $39.3 million of the pretax unrealized loss from securities with fair value less than 50% of book value at December 31, 2009.
F-24
Table of Contents
While the credit markets and credit spreads continued to improve across virtually all asset classes in 2009 resulting in significant improvement in the Company’s gross unrealized loss position, the persisting uncertainty and concern over prolonged economic weakness continue to have an adverse effect on the liquidity and fair value of certain asset classes and securities. The Company’s commercial mortgage-backed securities continue to be the most impacted. The Company views the decrease in value of all of the securities with unrealized losses at December 31, 2009 — which has been driven largely by spread widening, market illiquidity and changes in interest rates from the date of acquisition — as temporary. For debt securities, management does not have the intent to sell the securities and it is not more likely than not the Company will be required to sell the securities before the anticipated recovery in fair value or maturity. In addition, management expects to recover the entire cost basis of the debt securities. For equity securities, the Company has the ability and intent to hold the securities for the recovery of cost within a reasonable period of time. Therefore, no impairment of these securities was recorded at December 31, 2009. Future changes in circumstances related to these and other securities could require subsequent recognition of other-than-temporary impairment losses. Following revisions in September 2009 to further reduce issuer concentrations, the Company’s investment guidelines generally limit single corporate issuer concentrations to 0.5% of invested assets for “AA” or “AAA” rated securities, 0.35% of invested assets for “A” or “BBB” rated securities, and 0.2% of invested assets for non-investment grade securities.
F-25
Table of Contents
The following table provides information regarding the fixed maturity securities and equity securities that were trading below 80% of book value at December 31, 2008.
Investment Positions With Fair Value Below 80% of Amortized Cost
Segmented by Quality and Period of Continuous Valuation Below 80%
As of December 31, 2008
| Number of Positions |
Fair Value |
Amortized Cost or Cost |
Pretax Unrealized Loss |
|||||||||
| Fixed Maturity Securities |
||||||||||||
| Investment grade |
||||||||||||
| 3 Months or less |
130 | $ | 253.6 | $ | 375.8 | $ | (122.2 | ) | ||||
| 4 through 6 months |
42 | 72.5 | 127.3 | (54.8 | ) | |||||||
| 7 through 9 months |
13 | 12.8 | 45.6 | (32.8 | ) | |||||||
| 10 through 12 months |
4 | 7.5 | 26.0 | (18.5 | ) | |||||||
| Greater than 12 months |
— | — | — | — | ||||||||
| Total |
189 | $ | 346.4 | $ | 574.7 | $ | (228.3 | ) | ||||
| Non-investment grade |
||||||||||||
| 3 Months or less |
78 | $ | 47.3 | $ | 68.3 | $ | (21.0 | ) | ||||
| 4 through 6 months |
11 | 5.5 | 9.8 | (4.3 | ) | |||||||
| 7 through 9 months |
3 | 4.0 | 7.6 | (3.6 | ) | |||||||
| 10 through 12 months |
1 | 0.5 | 0.9 | (0.4 | ) | |||||||
| Greater than 12 months |
— | — | — | — | ||||||||
| Total |
93 | $ | 57.3 | $ | 86.6 | $ | (29.3 | ) | ||||
| Not rated |
— | — | — | — | ||||||||
| Total fixed maturity securities |
282 | $ | 403.7 | $ | 661.3 | $ | (257.6 | ) | ||||
| Equity Securities (1) |
||||||||||||
| Investment grade |
||||||||||||
| 3 Months or less |
10 | $ | 5.2 | $ | 8.2 | $ | (3.0 | ) | ||||
| 4 through 6 months |
31 | 23.3 | 40.0 | (16.7 | ) | |||||||
| 7 through 9 months |
5 | 0.8 | 2.2 | (1.4 | ) | |||||||
| 10 through 12 months |
1 | 0.8 | 1.9 | (1.1 | ) | |||||||
| Greater than 12 months |
— | — | — | — | ||||||||
| Non-investment grade, all 3 months or less |
2 | 1.1 | 1.7 | (0.6 | ) | |||||||
| Not rated, all 3 months or less |
3 | 0.1 | 0.1 | * | ||||||||
| Total equity securities |
52 | $ | 31.3 | $ | 54.1 | $ | (22.8 | ) | ||||
| Total fixed maturity securities and equity securities |
334 | $ | 435.0 | $ | 715.4 | $ | (280.4 | ) | ||||
| * | Less than $0.1 million. |
| (1) | Includes nonredeemable (perpetual) preferred stocks and common stocks. |
Other Income
In August 2009, the State of North Carolina adopted legislation that created uncertainty about the ownership status of the accumulated surplus of the North Carolina Beach Plan (the “Plan”), hereafter to be known as the North Carolina Coastal Property Pool. The legislation provides that the accumulated surplus held shall be retained from year to year and members shall not be entitled to distributions of any portion of the surplus. The legislation also caps future assessments that may be levied against insurers. Based on the legislation and information available as of December 31, 2009, management determined that the Company’s $3.8 million equity interest in the accumulated surplus of the Plan was unrecoverable and recorded a write-off charge reflected within Other Income in the Consolidated Statements of Operations. There was no comparable charge in 2008 or 2007.
F-26
Table of Contents
Benefits, Claims and Settlement Expenses
| Year Ended December 31, |
Change From Prior Year |
Year Ended December 31, | |||||||||||||||
| 2009 | 2008 | Percent | Amount | 2007 | |||||||||||||
| Property and casualty |
$ | 407.1 | $ | 416.1 | -2.2 | % | $ | (9.0 | ) | $ | 360.4 | ||||||
| Annuity |
(0.5 | ) | 1.7 | N.M. | (2.2 | ) | 0.2 | ||||||||||
| Life |
52.1 | 53.7 | -3.0 | % | (1.6 | ) | 47.9 | ||||||||||
| Total |
$ | 458.7 | $ | 471.5 | -2.7 | % | $ | (12.8 | ) | $ | 408.5 | ||||||
| Property and casualty catastrophe losses, included above (1) |
$ | 33.1 | $ | 73.9 | -55.2 | % | $ | (40.8 | ) | $ | 23.6 | ||||||
N.M. - Not meaningful.
| (1) | See footnote (2) to the table below. |
Property and Casualty Claims and Claim Expenses (“losses”)
| Year Ended December 31, | ||||||||||||
| 2009 | 2008 | 2007 | ||||||||||
| Incurred claims and claim expenses: |
||||||||||||
| Claims occurring in the current year |
$ | 418.8 | $ | 434.2 | $ | 380.4 | ||||||
| Decrease in estimated reserves for claims occurring in prior years (1) (2) |
(11.7 | ) | (18.1 | ) | (20.0 | ) | ||||||
| Total claims and claim expenses incurred |
$ | 407.1 | $ | 416.1 | $ | 360.4 | ||||||
| Property and casualty loss ratio: |
||||||||||||
| Total |
74.4 | % | 76.9 | % | 67.4 | % | ||||||
| Effect of catastrophe costs, included above (2) |
6.1 | % | 13.7 | % | 4.4 | % | ||||||
| (1) | Shows the amounts by which the Company decreased its reserves in each of the periods indicated for claims occurring in previous periods to reflect subsequent information on such claims and changes in their projected final settlement costs. |
| (2) | (Favorable)/unfavorable development of prior years’ reserves was recorded as follows: |
| 2009 | 2008 | 2007 | ||||||||||
| Three months ended |
||||||||||||
| March 31 |
$ | (3.4 | ) | $ | (2.7 | ) | $ | (5.5 | ) | |||
| June 30 |
(2.1 | ) | (2.4 | ) | (5.6 | ) | ||||||
| September 30 |
(2.8 | ) | (6.3 | ) | (3.7 | ) | ||||||
| December 31 |
(3.4 | ) | (6.7 | ) | (5.2 | ) | ||||||
| Total full year |
$ | (11.7 | ) | $ | (18.1 | ) | $ | (20.0 | ) | |||
Property and casualty catastrophe losses were incurred as follows:
| Three months ended |
||||||||||
| March 31 |
$ | 4.5 | $ | 5.4 | $ | 2.5 | ||||
| June 30 |
15.1 | 22.4 | 4.9 | |||||||
| September 30 |
12.3 | 36.2 | * | 10.3 | ||||||
| December 31 |
1.2 | 9.9 | ** | 5.9 | ||||||
| Total full year |
$ | 33.1 | $ | 73.9 | $ | 23.6 | ||||
| * | Included approximately $5 million related to reserve development for catastrophe activity in the second quarter of 2008. |
| ** | Included approximately $7 million related to reserve development for hurricane catastrophe activity in the third quarter of 2008. |
F-27
Table of Contents
In 2009, the Company’s benefits, claims and settlement expenses of $458.7 million decreased 2.7%, or $12.8 million, compared to 2008. The change reflected a decrease in catastrophe losses partially offset by increases in large property losses, primarily sinkhole claims in Florida, automobile loss frequency, and non-catastrophe weather-related losses; a smaller decrease in estimated reserves for property and casualty claims occurring in prior years; and an increase in life mortality costs. In addition, for the automobile line the adverse prior year variance included favorable loss experience in 2008, which reflected the impact of higher gas prices on miles driven that year. In 2008, the Company’s benefits, claims and settlement expenses of $471.5 million increased 15.4%, or $63.0 million, compared to 2007. This increase included a $50.3 million increase in catastrophe losses, largely resulting from Hurricanes Gustav and Ike. Property and casualty claims in 2008 also reflected a significant increase in non-catastrophe weather-related losses compared to 2007.
For 2009, the favorable development of prior years’ property and casualty reserves of $11.7 million was the result of actual and remaining projected losses for prior years being below the level anticipated in the December 31, 2008 loss reserve estimate, primarily the result of favorable frequency and severity trends in voluntary automobile loss and loss adjustment expense emergence for accident years 2006 and prior. In 2008, favorable development of prior years’ property and casualty reserves of $18.1 million was the result of actual and remaining projected losses for prior years being below the level anticipated in the December 31, 2007 loss reserve estimate, primarily driven by favorable voluntary automobile loss and loss adjustment expense emergence for accident years 2005 and prior. In 2007, the current period favorable development of prior years’ reserves of $20.0 million was the result of actual and remaining projected losses for prior years, primarily accident years 2006 and 2005, being below the level anticipated in the December 31, 2006 loss reserve estimate for both the voluntary automobile and homeowners lines of business. The favorable development was driven primarily by emerging claim trends related to voluntary automobile claim severity and homeowners claim frequency.
For 2009, the voluntary automobile loss ratio of 72.4% increased by 4.4 percentage points compared to 2008, including a 1.9 percentage point increase due to the lower level of favorable development of prior years’ reserves in the current period. In addition, in the fourth quarter of 2009 the Company experienced an increase in frequency of automobile losses which impacted the full year result. The homeowners loss ratio of 78.6% for 2009 decreased 18.6 percentage points compared to a year earlier, including a 22.8 percentage point decrease due to the lower level of catastrophe costs. Catastrophe costs represented 17.6 percentage points of the homeowners loss ratio for 2009 compared to 40.4 percentage points for 2008. The homeowners loss ratio reflected a moderate increase in non-catastrophe weather-related losses in 2009, as well as an increase in large property losses, primarily sinkhole claims in Florida. In addition to the above factors, the loss ratios in 2009 and 2008 included costs of consolidating the Company’s claims offices which management expects to be non-recurring in nature. For total property and casualty, the $3.9 million and $4.4 million of claims office consolidation costs incurred in 2009 and 2008, respectively, represented 0.7 percentage point and 0.8 percentage point of the loss ratio for the respective years. For 2007, the voluntary automobile loss ratio was 69.7% and the homeowners loss ratio was 60.4%, including 13.6 percentage points due to catastrophe costs.
F-28
Table of Contents
For the annuity segment, benefits for 2009 decreased compared to 2008. The Company’s guaranteed minimum death benefit (“GMDB”) reserve was $0.5 million at December 31, 2009, compared to $1.3 million at December 31, 2008 and less than $0.1 million at December 31, 2007. The changes in this reserve in both 2009 and 2008 reflected the impact of volatile financial markets performance.
For the life segment, benefits in 2009 decreased $1.6 million compared to 2008, as an increase in mortality costs in the current period was more than offset by the change in benefit reserves. Life segment benefits increased $5.8 million in 2008 compared to 2007, primarily reflecting higher mortality costs in 2008.
Interest Credited to Policyholders
| Year Ended December 31, |
Change From Prior Year |
Year Ended December 31, | |||||||||||||
| 2009 | 2008 | Percent | Amount | 2007 | |||||||||||
| Annuity |
$ | 100.0 | $ | 93.5 | 7.0 | % | $ | 6.5 | $ | 90.0 | |||||
| Life |
39.4 | 38.3 | 2.9 | % | 1.1 | 37.2 | |||||||||
| Total |
$ | 139.4 | $ | 131.8 | 5.8 | % | $ | 7.6 | $ | 127.2 | |||||
Compared to 2008, the current year increase in annuity segment interest credited reflected a 7.5% increase in average accumulated fixed deposits, partially offset by a 2 basis point decline in the average annual interest rate credited to 4.26%. Compared to 2007, the 2008 increase in annuity segment interest credited reflected a 5.0% increase in average accumulated fixed deposits, partially offset by a 6 basis point decline in the average annual interest rate credited to 4.28%. Life insurance interest credited increased in both 2009 and 2008 as a result of the growth in interest-sensitive life insurance reserves.
The net interest spread on fixed annuity account value on deposit measures the difference between the rate of income earned on the underlying invested assets and the rate of interest which policyholders are credited on their account values. The net interest spreads for the years ended December 31, 2009, 2008 and 2007 were 169 basis points, 154 basis points and 143 basis points, respectively.
As of December 31, 2009, fixed annuity account values totaled $2.5 billion, including $2.2 billion of deferred annuities. Of the deferred annuity account values, 24% had minimum guaranteed interest rates of 3% or lower while 66% had minimum guaranteed rates of 4.5% or greater. For $1.7 billion of the deferred annuity account values, the credited interest rate was equal to the minimum guaranteed rate. The annuity net interest spread increased 15 basis points compared to 2008, reflecting improvements in the Company’s investment portfolio yields. In 2009, the Company’s total investment portfolio yield reflected the adverse impact of the elevated level of short-term investments in the portfolio related to the Company’s opportunistic capital gains programs during the year, selective reinvestment of the sales proceeds and strong operational cash flows throughout the year. While the short-term position was somewhat reduced during the fourth quarter of 2009, management anticipates reinvesting the majority of these funds in intermediate or long term bonds throughout 2010. The 2008 annuity net interest spread increased 11 basis points compared to 2007, due to improvements in the Company’s investment portfolio yield and continued decreases in average interest crediting rates.
F-29
Table of Contents
Policy Acquisition Expenses Amortized
Amortized policy acquisition expenses were $80.4 million for 2009 compared to $79.1 million and $75.7 million for the years ended December 31, 2008 and 2007, respectively. For December 31, 2009, the valuation of annuity deferred policy acquisition costs resulted in a decrease in amortization of $1.3 million, primarily due to the impact of financial market performance more than offsetting the impact of investment gains related to this segment recognized during the year, compared to a $4.0 million increase in amortization from a similar valuation at December 31, 2008. Within the 2008 valuation impact, the approximately $7 million favorable impact of investment losses recognized in 2008 was more than offset by the approximately $11 million adverse impact of financial market performance. For the life segment, the December 31, 2009 valuation of deferred policy acquisition costs resulted in a $0.9 million increase in amortization compared to a $0.2 million increase recorded at December 31, 2008. The December 31, 2007 valuations of annuity and life deferred policy acquisition costs resulted in amortization increases of $1.2 million and $0.2 million, respectively.
Operating Expenses
In 2009, operating expenses increased 6.6%, or $8.8 million, compared to 2008. The expense growth was driven primarily by higher incentive compensation expense, partly due to the increase in Horace Mann’s common stock price in 2009. Operating expenses in 2008 reflected significant reductions in incentive compensation, due in part to the decline in Horace Mann’s stock price during the year. The current period increase also was attributable to increased strategic investments in distribution initiatives in 2009. In 2008, operating expenses decreased 4.7%, or $6.6 million, compared to 2007, with the decline attributable primarily to lower incentive compensation, partially offset by the impact of increased strategic investments in distribution and technology initiatives. The property and casualty expense ratio of 25.1% for 2009 increased 1.3 percentage points compared to 2008, reflecting the items above impacting the total Company. The property and casualty expense ratio was 24.5% in 2007.
Amortization of Intangible Assets
Amortization of intangible assets was $0.2 million, $5.3 million and $5.4 million for the years ended December 31, 2009, 2008 and 2007, respectively. The amortization of the value of annuity business acquired in the 1989 acquisition of the Company was completed as of December 31, 2008. The remaining $0.2 million of value of acquired insurance in force for the life segment was amortized in the first three months of 2009.
Income Tax Expense (Benefit)
The effective income tax rate on the Company’s pretax income, including net realized investment gains and losses, was 29.0% for the year ended December 31, 2009. Income from investments in tax-advantaged securities reduced the effective income tax rate 7.4 percentage points for 2009. For the year ended December 31, 2008, the Company recorded a tax benefit of $10.7 million on pretax income of $0.2 million, including net realized investment gains and losses. The 2008 amount included a reduction of $4.2 million as a result of the IRS completing its examination of the 2002, 2004, 2005 and 2006 tax years in 2008. This reduction benefited the net income of the Company’s segments as follows: annuity segment $2.6 million, corporate and other segment $1.2 million, and property and casualty segment $0.4 million. Due to the reduced level of income in 2008, expression of the impact of income from
F-30
Table of Contents
investments in tax-advantaged securities as a percentage was not meaningful for that year. For 2007, the effective income tax rate on the Company’s pretax income including net realized investment gains and losses was 29.3%, reflecting a reduction of 6.4 percentage points due to income from investments in tax-advantaged securities.
The Company records liabilities for uncertain tax filing positions where it is more-likely-than-not that the position will not be sustainable upon audit by taxing authorities. These liabilities are reevaluated routinely and are adjusted appropriately based upon changes in facts or law. The Company has no unrecorded liabilities from uncertain tax filing positions.
At December 31, 2009, the Company had federal income tax returns for the 2006 through 2009 tax years still open and subject to examination by taxing authorities. The Company has recorded $1.6 million of uncertain tax position liabilities including interest related to all open tax years.
Net Income
For 2009, the Company’s net income of $73.5 million represented an increase of $62.6 million compared to 2008. After-tax net realized investment gains and losses improved by $58.7 million between years. Catastrophe costs decreased $26.6 million after tax, with the entire amount in 2009 representing non-hurricane catastrophe costs which were at higher-than-average levels. Net income in 2009 was adversely impacted by an increase in large property losses, primarily sinkhole claims in Florida, and a late-year increase in automobile loss frequency. In addition, compared to 2008, net income in the current year decreased by $4.2 million due to a modest decrease in the level of favorable prior years’ property and casualty reserve development. Including all factors, the property and casualty combined ratio was 99.5% for 2009 compared to 100.7% for 2008. Beyond underwriting results, in 2009 net income for the property and casualty segment was reduced by $2.5 million after tax as a result of writing off the Company’s equity interest in the accumulated surplus of the North Carolina Coastal Property Insurance Pool. Annuity segment net income increased $3.9 million compared to 2008, as current year improvements in the interest margin and the favorable impact of the financial markets on the valuations of deferred policy acquisition costs and the guaranteed minimum death benefit reserve offset the adverse impact of the financial markets on the level of contract charges earned during the year. Life segment net income increased $2.0 million compared to a year earlier, reflecting growth in investment income partially offset by an increase in mortality costs. As described in “Results of Operations for the Three Years Ended December 31, 2009 — Income Tax Expense (Benefit)”, in 2008 the Company’s net income benefited by $4.2 million as a result of the completion of Internal Revenue Service (“IRS”) examination, with $2.8 million of that amount benefiting the annuity segment. The current year included transition costs of approximately $3.5 million after tax related to the Company’s property and casualty claims office consolidation and distribution strategies, comparable to the amount incurred in 2008 related to the property and casualty claims office consolidation.
For 2008, the Company’s net income of $10.9 million represented a decrease of $71.9 million compared to 2007, including a $39.3 million reduction in after-tax net realized investment gains and losses. Catastrophe costs increased $32.8 million after tax and non-catastrophe weather-related losses also increased significantly compared to the prior year. In addition, compared to 2007, net income in 2008 was negatively impacted by $1.2 million due to a modestly reduced level of favorable prior years’ property and casualty reserve development. Including all factors, the property and casualty combined ratio was 100.7% for
F-31
Table of Contents
2008 compared to 91.9% for 2007. As described above in “Income Tax Expense (Benefit)”, net income for 2008 benefited by $4.2 million as a result of the completion of IRS examinations. Annuity segment net income decreased slightly compared to 2007, due to a decline in contract charges and fees nearly offset by the federal income tax benefit described above. On a pretax basis for the annuity segment, improvements in the interest margin in 2008 were offset by the adverse impact of the financial markets on the level of contract charges earned, the valuation of deferred policy acquisition costs and the Company’s guaranteed minimum death benefit reserve. Life segment net income decreased $0.9 million, or 5.2%, compared to a year earlier, as growth in earned premium of $2.3 million and investment income of $2.3 million was more than offset by higher mortality costs.
For 2007, the Company’s net income included $2.2 million of after tax realized investment losses. Consistent with management’s expectations and industry experience at the time, the increase in property and casualty average loss costs per policy that year exceeded the increase in average premium per policy for the 2007 accident period, which adversely impacted the combined ratio and net income. Results in 2007 were positively impacted by favorable development of prior years’ property and casualty non-catastrophe reserves but were negatively impacted by an increase in the cost of the Company’s catastrophe reinsurance program. Including all of these factors, the property and casualty combined ratio was 91.9% for 2007.
Net income (loss) by segment and net income per share were as follows:
| Year Ended December 31, |
Change From Prior Year |
Year Ended December 31, |
|||||||||||||||||
| 2009 | 2008 | Percent | Amount | 2007 | |||||||||||||||
| Analysis of net income (loss) by segment: |
|||||||||||||||||||
| Property and casualty |
$ | 30.0 | $ | 28.1 | 6.8 | % | $ | 1.9 | $ | 61.2 | |||||||||
| Annuity |
21.2 | 17.3 | 22.5 | % | 3.9 | 17.6 | |||||||||||||
| Life |
18.4 | 16.4 | 12.2 | % | 2.0 | 17.3 | |||||||||||||
| Corporate and other (1) |
3.9 | (50.9 | ) | N.M. | 54.8 | (13.3 | ) | ||||||||||||
| Net income |
$ | 73.5 | $ | 10.9 | N.M. | $ | 62.6 | $ | 82.8 | ||||||||||
| Effect of catastrophe costs, after tax, included above |
$ | (21.5 | ) | $ | (48.1 | ) | -55.3 | % | $ | 26.6 | $ | (15.3 | ) | ||||||
| Effect of realized investment gains (losses), after tax, included above |
$ | 17.2 | $ | (41.5 | ) | N.M. | $ | 58.7 | $ | (2.2 | ) | ||||||||
| Diluted: |
|||||||||||||||||||
| Net income per share |
$ | 1.81 | $ | 0.27 | N.M. | $ | 1.54 | $ | 1.86 | ||||||||||
| Weighted average number of shares and equivalent shares (in millions) |
40.5 | 40.6 | -0.2 | % | (0.1 | ) | 44.6 | ||||||||||||
| Property and casualty combined ratio: |
|||||||||||||||||||
| Total |
99.5 | % | 100.7 | % | N.M. | -1.2 | % | 91.9 | % | ||||||||||
| Effect of catastrophe costs, included above |
6.1 | % | 13.7 | % | N.M. | -7.6 | % | 4.4 | % | ||||||||||
N.M. - Not meaningful.
| (1) | The corporate and other segment includes interest expense on debt, realized investment gains and losses, certain public company expenses and other corporate level items. The Company does not allocate the impact of corporate level transactions to the insurance segments, consistent with the basis for management’s evaluation of the results of those segments. |
For the three years ended December 31, 2009, the changes in net income for the property and casualty, annuity and life segments are described above.
F-32
Table of Contents
For the corporate and other segment, net income in 2009 compared to the net losses in 2008 and 2007 was due to net realized investment gains in 2009 compared to net realized losses in the two prior years.
Return on average shareholders’ equity based on net income was 13%, 2% and 12% for the years ended December 31, 2009, 2008 and 2007, respectively.
The accounting guidance adopted by the Company in 2009 is described in “Notes to Consolidated Financial Statements — Note 1 — Summary of Significant Accounting Policies — Adopted Accounting Standards”. The adoptions did not have a material effect on the results of operations or financial position of the Company.
Outlook for 2010
At the time of this Annual Report on Form 10-K, management estimates that 2010 full year net income before realized investment gains and losses will be within a range of $1.65 to $1.85 per diluted share. This projection anticipates: for the property and casualty segment, a moderation in automobile frequency trends experienced in the later portion of 2009 and a continuing high level of property sinkhole losses in Florida; for the annuity segment, continued strong increases in fixed annuity spreads and an 8% to 10% increase in the S&P 500 Index; and for the life segment, continued growth in investment income and more normal mortality levels. As described in “Critical Accounting Policies”, certain of the Company’s significant accounting measurements require the use of estimates and assumptions. As additional information becomes available, adjustments may be required. Those adjustments are charged or credited to income for the period in which the adjustments are made and may impact actual results compared to management’s current estimate. Additionally, see “Forward-looking Information” concerning other important factors that could impact actual results. A projection of net income including realized investment gains and losses is not accessible on a forward-looking basis because it is not possible to provide a reliable forecast of realized investment gains and losses, which can vary substantially from one period to another and may have a significant impact on net income.
Liquidity and Financial Resources
Off-Balance Sheet Arrangements
At December 31, 2009, 2008 and 2007, the Company did not have any relationships with unconsolidated entities or financial partnerships, such as entities often referred to as structured finance or special purpose entities, which would have been established for the purpose of facilitating off-balance sheet arrangements or for other contractually narrow or limited purposes. As such, the Company is not exposed to any financing, liquidity, market or credit risk that could arise if the Company had engaged in such relationships.
Investments
Information regarding the Company’s investment portfolio, which is comprised primarily of investment grade, fixed income securities, is located in “Results of Operations for the Three Years Ended December 31, 2009 — Net Realized Investment Gains and Losses”, “Business — Investments” and in the “Notes to Consolidated Financial Statements — Note 2 — Investments” listed on page F-1 of this report.
F-33
Table of Contents
Cash Flow
The short-term liquidity requirements of the Company, within a 12-month operating cycle, are for the timely payment of claims and benefits to policyholders, operating expenses, interest payments and federal income taxes. Cash flow generated from operations has been, and is expected to be, adequate to meet the Company’s operating cash needs in the next 12 months. Cash flow in excess of operational needs has been used to fund business growth, retire short-term debt, pay dividends to shareholders and repurchase shares of the Company’s common stock. Long-term liquidity requirements, beyond one year, are principally for the payment of future insurance policy claims and benefits and retirement of long-term debt.
Operating Activities
As a holding company, HMEC conducts its principal operations in the personal lines segment of the property and casualty and life insurance industries through its subsidiaries. HMEC’s insurance subsidiaries generate cash flow from premium and investment income, generally well in excess of their immediate needs for policy obligations, operating expenses and other cash requirements. Cash provided by operating activities primarily reflects net cash generated by the insurance subsidiaries. For 2009, net cash provided by operating activities increased compared to 2008, primarily reflecting a reduction in policyholder benefit and claim payments, including a reduction in payments attributable to property and casualty catastrophe losses.
Payment of principal and interest on debt, dividends to shareholders and parent company operating expenses are dependent upon the ability of the insurance subsidiaries to pay cash dividends or make other cash payments to HMEC, including tax payments pursuant to tax sharing agreements. Payments for share repurchase programs also have this dependency. The insurance subsidiaries are subject to various regulatory restrictions which limit the amount of annual dividends or other distributions, including loans or cash advances, available to HMEC without prior approval of the insurance regulatory authorities. The aggregate amount of dividends that may be paid in 2010 from all of HMEC’s insurance subsidiaries without prior regulatory approval is approximately $64 million. Although regulatory restrictions exist, dividend availability from subsidiaries has been, and is expected to be, adequate for HMEC’s capital needs.
Investing Activities
HMEC’s insurance subsidiaries maintain significant investments in fixed maturity securities to meet future contractual obligations to policyholders. In conjunction with its management of liquidity and other asset/liability management objectives, the Company, from time to time, will sell fixed maturity securities prior to maturity and reinvest the proceeds in other investments with different interest rates, maturities or credit characteristics. Accordingly, the Company has classified the entire fixed maturity securities and equity securities portfolios as “available for sale”.
Financing Activities
Financing activities include primarily payment of dividends, the receipt and withdrawal of funds by annuity contractholders, repurchases of the Company’s common stock, fluctuations in bank overdraft balances, and borrowings, repayments and repurchases related to its debt facilities.
F-34
Table of Contents
The Company’s annuity business produced net positive cash flows in 2009. For the year ended December 31, 2009, receipts from annuity contracts increased $38.1 million, or 12.2% compared to 2008, as described in “Results of Operations for the Three Years Ended December 31, 2009 — Insurance Premiums and Contract Charges”. Annuity contract benefits and withdrawals decreased $9.8 million, or 5.5%, compared to 2008. Cash value retentions for variable and fixed annuity options were 93.4% and 94.4%, respectively, for the year ended December 31, 2009. Net transfers to variable annuity accumulated cash values increased $4.1 million, or 5.6%, compared to 2008.
Contractual Obligations
| Payments Due By Period As of December 31, 2009 | |||||||||||||||
| Total | Less Than 1 Year (2010) |
1 - 3 Years (2011 and 2012) |
3 - 5 Years (2013 and 2014) |
More Than 5 Years (2015 and beyond) | |||||||||||
| Fixed annuities and fixed option of variable annuities (1) |
$ | 3,663.2 | $ | 146.6 | $ | 306.5 | $ | 322.9 | $ | 2,887.2 | |||||
| Supplemental contracts (1) |
776.2 | 37.4 | 64.5 | 55.0 | 619.3 | ||||||||||
| Life insurance policies (1) |
2,346.5 | 81.2 | 169.8 | 173.0 | 1,922.5 | ||||||||||
| Property and casualty claims and claim adjustment expenses (1) |
301.0 | 170.7 | 104.0 | 21.8 | 4.5 | ||||||||||
| Short-term Debt Obligations (2): |
|||||||||||||||
| Bank Credit Facility (expires December 19, 2011) |
38.8 | 0.4 | 38.4 | — | — | ||||||||||
| Long-Term Debt Obligations (2): |
|||||||||||||||
| Senior Notes Due June 15, 2015 |
100.0 | 4.5 | 9.1 | 9.1 | 77.3 | ||||||||||
| Senior Notes Due April 15, 2016 |
180.7 | 8.6 | 17.1 | 17.1 | 137.9 | ||||||||||
| Operating lease obligations (3) |
23.8 | 3.0 | 4.8 | 4.4 | 11.6 | ||||||||||
| Purchase obligations |
1.4 | 1.4 | — | — | — | ||||||||||
| Total |
$ | 7,431.6 | $ | 453.8 | $ | 714.2 | $ | 603.3 | $ | 5,660.3 | |||||
| (1) | This information represents estimates of both the amounts to be paid to policyholders and the timing of such payments. |
| (2) | Includes principal and interest. |
| (3) | The Company has entered into various operating lease agreements, primarily for real estate (claims and marketing offices across the country and portions of the home office complex) and also for computer equipment and copy machines. |
Estimated Future Policy Benefit and Claim Payments - Annuity and Life Segments
The following table duplicates information above and summarizes the Company’s annuity and life contractual obligations and commitments as of December 31, 2009 expected to be paid in the periods presented. Payment amounts reflect the Company’s estimate of undiscounted cash flows related to these obligations and commitments. Balance sheet amounts were determined in accordance with GAAP and in many cases differ significantly from the summation of undiscounted cash flows. The most significant difference relates to future policy benefits related to life insurance, which includes discounting.
| Estimated Payments by Period As of December 31, 2009 | |||||||||||||||
| Total | Less Than 1 Year (2010) |
1 - 3 Years (2011 and 2012) |
3 - 5 Years (2013 and 2014) |
More Than 5 Years (2015 and beyond) | |||||||||||
| Fixed annuities and fixed option of variable annuities |
$ | 3,663.2 | $ | 146.6 | $ | 306.5 | $ | 322.9 | $ | 2,887.2 | |||||
| Supplemental contracts |
776.2 | 37.4 | 64.5 | 55.0 | 619.3 | ||||||||||
| Life insurance |
2,346.5 | 81.2 | 169.8 | 173.0 | 1,922.5 | ||||||||||
| Total |
$ | 6,785.9 | $ | 265.2 | $ | 540.8 | $ | 550.9 | $ | 5,429.0 | |||||
F-35
Table of Contents
For the majority of the Company’s annuity and life insurance operations, the estimated contractual obligations for future policyholder benefits as presented in the table above were derived from the annual cash flow testing analysis used to develop actuarial opinions of statutory reserve adequacy for state regulatory purposes. These cash flows are materially representative of the cash flows under generally accepted accounting principles. Actual amounts may vary, potentially in a significant manner, from the amounts indicated due to deviations between assumptions and actual results and the addition of new business in future periods.
Amounts presented in the table above represent the estimated cash payments to be made to policyholders undiscounted by interest and including assumptions related to the receipt of future premiums and deposits, future interest credited, full and partial withdrawals, policy lapses, surrender charges, annuitization, mortality, and other contingent events as appropriate to the respective product types. Additionally, coverage levels are assumed to remain unchanged from those provided under contracts in force at December 31, 2009. Separate Account payments are not reflected due to the matched nature of these obligations and the fact that the contract owners maintain the investment risk on such deposits.
See “Note 1 — Summary of Significant Accounting Policies — Future Policy Benefits, Interest-sensitive Life Contract Liabilities and Annuity Contract Liabilities” listed on page F-1 of this report for a description of the Company’s method for establishing life and annuity reserves in accordance with GAAP.
Estimated Claims and Claim Related Payments - Property and Casualty Segment
The table below duplicates information above and presents the amount and estimated future timing of claims and claim related payments for property and casualty insurance. Both the total liability and the estimated payments are based on actuarial projection techniques, at a given accounting date. These estimates include assumptions of the ultimate settlement and administrative costs based on the Company’s assessment of facts and circumstances then known, review of historical settlement patterns, estimates of trends in claims severity, frequency and other factors. Variables in the reserve estimation process can be affected by both internal and external events, such as changes in claims handling procedures, economic inflation, legal trends and legislative changes. Many of these items are not directly quantifiable, particularly on a prospective basis. Additionally, there may be significant reporting lags between the occurrence of a claim and the time it is actually reported to the Company. The future cash flows related to the items contained in the table below required estimation of both amount (including severity considerations) and timing. Amount and timing are frequently estimated separately. An estimation of both amount and timing of future cash flows related to claims and claim related payments is generally reliable only in the aggregate with some unavoidable estimation uncertainty.
The following table includes estimated future claims and claims related payments at December 31, 2009. The amounts reported in the table are presented on a nominal basis, have not been discounted and represent the estimated timing of future payments for both reported and unreported claims incurred and related claim adjustment expenses.
| Estimated Payments by Period As of December 31, 2009 | |||||||||||||||
| Total | Less Than 1 Year (2010) |
1 - 3 Years (2011 and 2012) |
3 - 5 Years (2013 and 2014) |
More Than 5 Years (2015 and beyond) | |||||||||||
| Claims and claim adjustment expenses |
$ | 301.0 | $ | 170.7 | $ | 104.0 | $ | 21.8 | $ | 4.5 | |||||
F-36
Table of Contents
Capital Resources
The Company has determined the amount of capital which is needed to adequately fund and support business growth, primarily based on risk-based capital formulas including those developed by the National Association of Insurance Commissioners (“NAIC”). Historically, the Company’s insurance subsidiaries have generated capital in excess of such needed capital. These excess amounts have been paid to HMEC through dividends. HMEC has then utilized these dividends and its access to the capital markets to service and retire long-term debt, pay dividends to its shareholders, fund growth initiatives, repurchase shares of its common stock and for other corporate purposes. Management anticipates that the Company’s sources of capital will continue to generate sufficient capital to meet the needs for business growth, debt interest payments and shareholder dividends.
The total capital of the Company was $957.1 million at December 31, 2009, including $199.6 million of long-term debt and $38.0 million of short-term debt outstanding. Total debt represented 25.4% of total capital excluding unrealized investment gains and losses (24.8% including unrealized investment gains and losses) at December 31, 2009, which was slightly above the Company’s long-term target of 25% and within a range consistent with the Company’s debt ratings assigned as of December 31, 2009.
Shareholders’ equity was $719.5 million at December 31, 2009, including a net unrealized gain in the Company’s investment portfolio of $22.3 million after taxes and the related impact on deferred policy acquisition costs associated with annuity and interest-sensitive life policies. The market value of the Company’s common stock and the market value per share were $489.8 million and $12.50, respectively, at December 31, 2009. Book value per share was $18.36 at December 31, 2009 ($17.79 excluding investment fair value adjustments).
Additional information regarding the net unrealized gain in the Company’s investment portfolio at December 31, 2009 is included in “Results of Operations for the Three Years Ended December 31, 2009 — Net Realized Investment Gains and Losses”.
In 2007 and 2008, HMEC’s Board of Directors (“Board”) authorized share repurchase programs that authorized the repurchase of common shares in open market or privately negotiated transactions, from time to time, depending on market conditions. The Company repurchased shares in 2007 and 2008. As of June 30, 2008, the Company had completed all of its authorized share repurchase programs. See also “Notes to Consolidated Financial Statements — Note 6 — Shareholders’ Equity and Stock Options — Share Repurchase Program and Treasury Shares Held”.
As of December 31, 2009, the Company had outstanding $75.0 million aggregate principal amount of 6.05% Senior Notes (“Senior Notes due 2015”), which will mature on June 15, 2015, issued at a discount resulting in an effective yield of 6.1%. Interest on the Senior Notes due 2015 is payable semi-annually at a rate of 6.05%. Detailed information regarding the redemption terms of the Senior Notes due 2015 is contained in the “Notes to Consolidated Financial Statements — Note 5 — Debt” listed on page F-1 of this report.
The Senior Notes due 2015 have an investment grade rating from S&P (BBB), Moody’s (Baa3), and A.M. Best Company, Inc. (“A.M. Best”) (bbb-). See also “Financial Ratings”. The Senior Notes due 2015 are traded in the open market (HMN 6.05).
F-37
Table of Contents
As of December 31, 2009, the Company had outstanding $125.0 million aggregate principal amount of 6.85% Senior Notes (“Senior Notes due 2016”), which will mature on April 15, 2016, issued at a discount resulting in an effective yield of 6.893%. Interest on the Senior Notes due 2016 is payable semi-annually at a rate of 6.85%. Detailed information regarding the redemption terms of the Senior Notes due 2016 is contained in “Notes to Consolidated Financial Statements — Note 5 — Debt” listed on page F-1 of this report.
The Senior Notes due 2016 have an investment grade rating from S&P (BBB), Moody’s (Baa3), and A.M. Best (bbb-). See also “Financial Ratings”. The Senior Notes due 2016 are traded in the open market (HMN 6.85).
As of December 31, 2009, the Company had $38.0 million outstanding under its Bank Credit Facility. The Bank Credit Facility provides for unsecured borrowings of up to $125.0 million and expires on December 19, 2011. Interest accrues at varying spreads relative to corporate or Eurodollar base rates and is payable monthly or quarterly depending on the applicable base rate (London Interbank Offered Rate (“LIBOR”) plus 0.6%, or 0.9%, at December 31, 2009). The unused portion of the Bank Credit Facility is subject to a variable commitment fee, which was 0.125% on an annual basis at December 31, 2009.
To provide additional capital management flexibility, the Company filed a “universal shelf” registration on Form S-3 with the SEC in November 2008. The registration statement, which registers the offer and sale by the Company from time to time of up to $300 million of various securities, which may include debt securities, common stock, preferred stock, depositary shares, warrants and/or delayed delivery contracts, was declared effective on January 7, 2009. Unless fully utilized or withdrawn by the Company earlier, this registration statement will remain effective through January 7, 2012. No securities associated with the registration statement have been issued as of the date of this Annual Report on Form 10-K.
The Company’s ratio of earnings to fixed charges (with fixed charges including interest credited to policyholders on interest-sensitive contracts) for the years ended December 31, 2009, 2008 and 2007 was 1.7x, 1.0x and 1.8x, respectively. See also “Exhibit 12 — Statement Regarding Computation of Ratios”. The Company’s ratio of earnings before interest expense to interest expense was 8.4x, 1.0x and 9.3x for the years ended December 31, 2009, 2008 and 2007, respectively.
Total shareholder dividends were $9.6 million for the year ended December 31, 2009. In March, May, September and December 2009, the Board of Directors announced regular quarterly dividends per share of $0.0525, $0.0525, $0.0525 and $0.08, respectively.
Information regarding the reinsurance program for the Company’s property and casualty segment is located in “Business — Property and Casualty Segment — Property and Casualty Reinsurance”.
Information regarding the reinsurance program for the Company’s life segment is located in “Business — Life Segment”.
F-38
Table of Contents
Financial Ratings
The Company’s principal insurance subsidiaries are rated by S&P, Moody’s and A.M. Best. These rating agencies have also assigned ratings to the Company’s long-term debt securities.
Assigned ratings as of February 16, 2010 were unchanged from the disclosure in the Company’s Annual Report on Form 10-K for the year ended December 31, 2008. All of the ratings and their associated outlooks as of December 31, 2008 were affirmed during the first six months of 2009. In addition, on January 29, 2010, S&P affirmed the Company’s ratings and revised its outlook for those ratings from negative to stable citing the significantly improved performance of the Company’s relatively conservative investment portfolio in 2009 and the stabilizing effect of strong life and annuity operating results on the Company’s overall profitability, as well as S&P’s expectations of improvements in the property and casualty segment’s results. Assigned ratings as of February 16, 2010 were as follows (the insurance financial strength ratings for the Company’s property and casualty insurance subsidiaries and the Company’s principal life insurance subsidiary are the same):
| Insurance Financial |
Debt
Ratings | |||||||||
| As of February 16, 2010 |
||||||||||
| S&P (1) |
A |
(stable) | BBB | (stable) | ||||||
| Moody’s (1) |
A3 |
(stable) | Baa3 | (stable) | ||||||
| A.M. Best |
A- |
(stable) | bbb- | (stable) | ||||||
| (1) | This agency has not yet rated Horace Mann Lloyds. |
Market Value Risk
Market value risk, the Company’s primary market risk exposure, is the risk that the Company’s invested assets will decrease in value. This decrease in value may be due to (1) a change in the yields realized on the Company’s assets and prevailing market yields for similar assets, (2) an unfavorable change in the liquidity of the investment, (3) an unfavorable change in the financial prospects of the issuer of the investment, or (4) a downgrade in the credit rating of the issuer of the investment. See also “Results of Operations for the Three Years Ended December 31, 2009 — Net Realized Investment Gains and Losses”.
Significant changes in interest rates expose the Company to the risk of experiencing losses or earning a reduced level of income based on the difference between the interest rates earned on the Company’s investments and the credited interest rates on the Company’s insurance liabilities. See also “Results of Operations for the Three Years Ended December 31, 2009 — Interest Credited to Policyholders”.
The Company seeks to manage its market value risk by coordinating the projected cash inflows of assets with the projected cash outflows of liabilities. For all its assets and liabilities, the Company seeks to maintain reasonable durations, consistent with the maximization of income without sacrificing investment quality, while providing for liquidity and diversification. The investment risk associated with variable annuity deposits and the underlying mutual funds is assumed by those contractholders, and not by the Company. Certain fees that the Company earns from variable annuity deposits are based on the market value of the funds deposited.
F-39
Table of Contents
Through active investment management, the Company invests available funds with the objective of funding future obligations to policyholders, subject to appropriate risk considerations, and maximizing shareholder value. This objective is met through investments that (1) have similar characteristics to the liabilities they support; (2) are diversified among industries, issuers and geographic locations; and (3) are predominately investment-grade fixed maturity securities classified as available for sale. No derivatives are used to manage the exposure to interest rate risk in the investment portfolios. At December 31, 2009, approximately 20% of the fixed investment portfolio represented investments supporting the property and casualty operations and approximately 80% supported the annuity and life business. For discussions regarding the Company’s investments see “Results of Operations for the Three Years Ended December 31, 2009 — Net Realized Investment Gains and Losses” and “Business — Investments”.
The Company’s annuity and life earnings are affected by the spreads between interest yields on investments and rates credited or accruing on fixed annuity and life insurance liabilities. Although substantially all credited rates on fixed annuities may be changed annually (subject to minimum guaranteed rates), competitive pricing and other factors, including the impact on the level of surrenders and withdrawals, may limit the Company’s ability to adjust or to maintain crediting rates at levels necessary to avoid narrowing of spreads under certain market conditions. See also “Results of Operations for the Three Years Ended December 31, 2009 — Interest Credited to Policyholders”.
Using financial modeling and other techniques, the Company regularly evaluates the appropriateness of investments relative to the characteristics of the liabilities that they support. Simulations of cash flows generated from existing business under various interest rate scenarios measure the potential gain or loss in fair value of interest-rate sensitive assets and liabilities. Such estimates are used to closely match the duration of assets to the duration of liabilities. The overall duration of liabilities of the Company’s multiline insurance operations combines the characteristics of its long duration annuity and interest-sensitive life liabilities with its short duration non-interest-sensitive property and casualty liabilities. Overall, at December 31, 2009, the duration of both the fixed income securities portfolio and the Company’s insurance liabilities was estimated to be approximately 6.5 years.
The annuity and life operations participate in the cash flow testing procedures imposed by statutory insurance regulations, the purpose of which is to insure that such liabilities are adequate to meet the Company’s obligations under a variety of interest rate scenarios. Based on these procedures, the Company’s assets and the investment income expected to be received on such assets are adequate to meet the insurance policy obligations and expenses of the Company’s insurance activities in all but the most extreme circumstances.
The Company periodically evaluates its sensitivity to interest rate risk. Based on commonly used models, the Company projects the impact of interest rate changes, assuming a wide range of factors, including duration and prepayment, on the fair value of assets and liabilities. Fair value is estimated based on the net present value of cash flows or duration estimates. At December 31, 2009, assuming an immediate decrease of 100 basis points in interest rates, the net fair value of the Company’s assets and liabilities would increase by approximately $18 million after tax, or 3% of shareholders’ equity. A 100 basis point increase would decrease the fair value of assets and liabilities by approximately $38 million after tax, or 5% of shareholders’ equity. At December 31, 2008, assuming an immediate decrease of 100 basis points in interest rates, the net fair value of the Company’s assets and liabilities would decrease by approximately $20 million after tax, or 4% of shareholders’ equity. A 100 basis
F-40
Table of Contents
point increase would decrease the fair value of assets and liabilities by approximately $7 million after tax, or 2% of shareholders’ equity. In each case, these changes in interest rates assume a parallel shift in the yield curve.
While the Company believes that these assumed market rate changes are reasonably possible, actual results may differ, particularly as a result of any management actions that would be taken to attempt to mitigate such hypothetical losses in fair value of shareholders’ equity. Based on the Company’s overall exposure to interest rate risk, the Company believes that these changes in interest rates would not materially affect its consolidated near-term financial position, results of operations or cash flows.
Recent Accounting Changes
Fair Value Measurements and Disclosures
In January 2010, the Financial Accounting Standards Board (“FASB”) issued accounting guidance to improve disclosure requirements related to fair value measurements. The guidance requires disclosures pertaining to transfers of assets between Levels 1 and 2 of the three-tier fair value hierarchy as defined in “Note 3 — Fair Value of Financial Instruments” and a reconciliation reporting purchase, sale, issuance and settlement transactions of recurring and nonrecurring fair value measurement assets and liabilities utilizing Level 3 fair value inputs. The guidance also clarifies existing requirements regarding the measurement disclosures for each class of assets and liabilities and disclosure about inputs and valuation techniques. The amendments are effective for interim and annual periods beginning after December 15, 2010. Management believes the adoption of this accounting guidance will have no effect on the results of operations or financial position of the Company.
Other Matters
As reported in HMEC’s Proxy Statement for the 2009 Annual Meeting of Shareholders, Ariel Capital Management, Inc., (“Ariel”) was HMEC’s largest shareholder with 12.0% of the common shares outstanding per their SEC filing on Form 13G as of December 31, 2008. During 2009, Ariel reduced the number of HMEC common shares held below the 5% reporting threshold. Ariel is the investment adviser for two of the mutual funds offered to the Company’s annuity customers.
Effects of Inflation and Changes in Interest Rates
The Company’s operating results are affected significantly in at least three ways by changes in interest rates and inflation. First, inflation directly affects property and casualty claims costs. Second, the investment income earned on the Company’s investment portfolio and the fair value of the investment portfolio are related to the yields available in the fixed-income markets. An increase in interest rates will decrease the fair value of the investment portfolio, but will increase investment income as investments mature and proceeds are reinvested at higher rates. Third, as interest rates increase, competitors will typically increase crediting rates on annuity and interest-sensitive life products, and may lower premium rates on property and casualty lines to reflect the higher yields available in the market. The risk of interest rate fluctuation is managed through asset/liability management techniques, including cash flow analysis.
F-41
Table of Contents
REPORT OF INDEPENDENT REGISTERED PUBLIC ACCOUNTING FIRM
The Board of Directors and Shareholders
Horace Mann Educators Corporation:
We have audited the accompanying consolidated balance sheets of Horace Mann Educators Corporation and subsidiaries (the Company) as of December 31, 2009 and 2008, and the related consolidated statements of operations, comprehensive income (loss), changes in shareholders’ equity and cash flows for each of the years in the three-year period ended December 31, 2009. In connection with our audits of the consolidated financial statements, we also have audited financial statement schedules I to IV and VI. We also have audited the Company’s internal control over financial reporting as of December 31, 2009, based on criteria established in Internal Control - Integrated Framework issued by the Committee of Sponsoring Organizations of the Treadway Commission (COSO). The Company’s management is responsible for these consolidated financial statements, for maintaining effective internal control over financial reporting, and for its assessment of the effectiveness of internal control over financial reporting, included in the accompanying Management’s Annual Report on Internal Control Over Financial Reporting (Item 9A.b.). Our responsibility is to express an opinion on these consolidated financial statements and financial statement schedules, and an opinion on the Company’s internal control over financial reporting based on our audits.
We conducted our audits in accordance with the standards of the Public Company Accounting Oversight Board (United States). Those standards require that we plan and perform the audits to obtain reasonable assurance about whether the financial statements are free of material misstatement and whether effective internal control over financial reporting was maintained in all material respects. Our audits of the consolidated financial statements included examining, on a test basis, evidence supporting the amounts and disclosures in the financial statements, assessing the accounting principles used and significant estimates made by management, and evaluating the overall financial statement presentation. Our audit of internal control over financial reporting included obtaining an understanding of internal control over financial reporting, assessing the risk that a material weakness exists, and testing and evaluating the design and operating effectiveness of internal control based on the assessed risk. Our audits also included performing such other procedures as we considered necessary in the circumstances. We believe that our audits provide a reasonable basis for our opinions.
A company’s internal control over financial reporting is a process designed to provide reasonable assurance regarding the reliability of financial reporting and the preparation of financial statements for external purposes in accordance with generally accepted accounting principles. A company’s internal control over financial reporting includes those policies and procedures that (1) pertain to the maintenance of records that, in reasonable detail, accurately and fairly reflect the transactions and dispositions of the assets of the company; (2) provide reasonable assurance that transactions are recorded as necessary to permit preparation of financial statements in accordance with generally accepted accounting principles, and that receipts and expenditures of the company are being made only in accordance with authorizations of management and directors of the company; and (3) provide reasonable assurance regarding prevention or timely detection of unauthorized acquisition, use, or disposition of the company’s assets that could have a material effect on the financial statements.
F-42
Table of Contents
Because of its inherent limitations, internal control over financial reporting may not prevent or detect misstatements. Also, projections of any evaluation of effectiveness to future periods are subject to the risk that controls may become inadequate because of changes in conditions, or that the degree of compliance with the policies or procedures may deteriorate.
In our opinion, the consolidated financial statements referred to above present fairly, in all material respects, the financial position of the Company as of December 31, 2009 and 2008, and the results of its operations and its cash flows for each of the years in the three-year period ended December 31, 2009, in conformity with U.S. generally accepted accounting principles. Also in our opinion, the related financial statement schedules, when considered in relation to the basic consolidated financial statements taken as a whole, present fairly, in all material respects, the information set forth therein.
As discussed in note 1 to the consolidated financial statements, the Company changed its method of accounting for other-than-temporary impairments of debt securities due to the adoption of FASB Staff Position No. FAS 115-2 and FAS 124-2, “Recognition and Presentation of Other-Than-Temporary Impairments,” (included in FASB ASC Topic 320, Investments-Debt and Equity Securities), as of April 1, 2009.
Also in our opinion, the Company maintained, in all material respects, effective internal control over financial reporting as of December 31, 2009, based on criteria established in Internal Control - Integrated Framework issued by the Committee of Sponsoring Organizations of the Treadway Commission.
| /s/ KPMG LLP |
| KPMG LLP |
| Chicago, Illinois |
| March 1, 2010 |
F-43
Table of Contents
HORACE MANN EDUCATORS CORPORATION
CONSOLIDATED BALANCE SHEETS
As of December 31, 2009 and 2008
(Dollars in thousands)
| 2009 | 2008 | |||||||
| ASSETS | ||||||||
| Investments |
||||||||
| Fixed maturities, available for sale, at fair value |
$ | 4,099,865 | $ | 3,485,261 | ||||
| Equity securities, available for sale, at fair value |
59,678 | 61,569 | ||||||
| Short-term and other investments |
415,081 | 354,925 | ||||||
| Total investments |
4,574,624 | 3,901,755 | ||||||
| Cash |
7,848 | 9,204 | ||||||
| Accrued investment income and premiums receivable |
113,058 | 103,534 | ||||||
| Deferred policy acquisition costs |
276,124 | 312,046 | ||||||
| Goodwill |
47,396 | 47,396 | ||||||
| Other assets |
97,633 | 168,566 | ||||||
| Separate Account (variable annuity) assets |
1,226,430 | 965,217 | ||||||
| Total assets |
$ | 6,343,113 | $ | 5,507,718 | ||||
| LIABILITIES AND SHAREHOLDERS’ EQUITY | ||||||||
| Policy liabilities |
||||||||
| Fixed annuity contract liabilities |
$ | 2,367,170 | $ | 2,166,518 | ||||
| Interest-sensitive life contract liabilities |
706,067 | 685,854 | ||||||
| Unpaid claims and claim expenses |
312,738 | 311,243 | ||||||
| Future policy benefits |
197,870 | 193,000 | ||||||
| Unearned premiums |
210,765 | 206,578 | ||||||
| Total policy liabilities |
3,794,610 | 3,563,193 | ||||||
| Other policyholder funds |
117,349 | 128,359 | ||||||
| Other liabilities |
247,565 | 164,555 | ||||||
| Short-term debt |
38,000 | 38,000 | ||||||
| Long-term debt |
199,614 | 199,549 | ||||||
| Separate Account (variable annuity) liabilities |
1,226,430 | 965,217 | ||||||
| Total liabilities |
5,623,568 | 5,058,873 | ||||||
| Preferred stock, $0.001 par value, authorized 1,000,000 shares; none issued |
— | — | ||||||
| Common stock, $0.001 par value, authorized 75,000,000 shares; issued, 2009, 60,997,917; 2008, 60,874,984 |
61 | 61 | ||||||
| Additional paid-in capital |
358,081 | 355,542 | ||||||
| Retained earnings |
758,343 | 694,492 | ||||||
| Accumulated other comprehensive income (loss), net of taxes: |
||||||||
| Net unrealized gains and losses on fixed maturities and equity securities |
22,266 | (182,065 | ) | |||||
| Net funded status of pension and other postretirement benefit obligations |
(11,543 | ) | (11,522 | ) | ||||
| Treasury stock, at cost, 21,813,196 shares |
(407,663 | ) | (407,663 | ) | ||||
| Total shareholders’ equity |
719,545 | 448,845 | ||||||
| Total liabilities and shareholders’ equity |
$ | 6,343,113 | $ | 5,507,718 | ||||
See accompanying Notes to Consolidated Financial Statements.
F-44
Table of Contents
HORACE MANN EDUCATORS CORPORATION
CONSOLIDATED STATEMENTS OF OPERATIONS
(Dollars in thousands, except per share data)
| Year Ended December 31, | ||||||||||||
| 2009 | 2008 | 2007 | ||||||||||
| Revenues |
||||||||||||
| Insurance premiums and contract charges earned |
$ | 659,590 | $ | 658,532 | $ | 654,257 | ||||||
| Net investment income |
246,834 | 230,269 | 223,762 | |||||||||
| Net realized investment gains (losses) |
26,310 | (63,859 | ) | (3,418 | ) | |||||||
| Other income |
4,693 | 9,876 | 12,404 | |||||||||
| Total revenues |
937,427 | 834,818 | 887,005 | |||||||||
| Benefits, losses and expenses |
||||||||||||
| Benefits, claims and settlement expenses |
458,660 | 471,532 | 408,490 | |||||||||
| Interest credited |
139,421 | 131,798 | 127,247 | |||||||||
| Policy acquisition expenses amortized |
80,399 | 79,134 | 75,659 | |||||||||
| Operating expenses |
141,246 | 132,392 | 139,099 | |||||||||
| Amortization of intangible assets |
223 | 5,329 | 5,379 | |||||||||
| Interest expense |
13,971 | 14,455 | 14,060 | |||||||||
| Total benefits, losses and expenses |
833,920 | 834,640 | 769,934 | |||||||||
| Income before income taxes |
103,507 | 178 | 117,071 | |||||||||
| Income tax expense (benefit) |
30,021 | (10,739 | ) | 34,283 | ||||||||
| Net income |
$ | 73,486 | $ | 10,917 | $ | 82,788 | ||||||
| Earnings per share |
||||||||||||
| Basic |
$ | 1.88 | $ | 0.27 | $ | 1.92 | ||||||
| Diluted |
$ | 1.81 | $ | 0.27 | $ | 1.86 | ||||||
| Weighted average number of shares and equivalent shares |
||||||||||||
| Basic |
39,175,258 | 39,819,548 | 43,145,163 | |||||||||
| Diluted |
40,532,174 | 40,588,575 | 44,610,496 | |||||||||
| Net realized investment gains (losses) |
||||||||||||
| Total other-than-temporary impairment losses on securities |
$ | (31,596 | ) | $ | (76,163 | ) | $ | (19,651 | ) | |||
| Portion of losses recognized in other comprehensive income (loss) |
1,430 | — | — | |||||||||
| Net other-than-temporary impairment losses on securities recognized in earnings |
(30,166 | ) | (76,163 | ) | (19,651 | ) | ||||||
| Realized gains |
56,476 | 12,304 | 16,233 | |||||||||
| Total |
$ | 26,310 | $ | (63,859 | ) | $ | (3,418 | ) | ||||
See accompanying Notes to Consolidated Financial Statements.
F-45
Table of Contents
HORACE MANN EDUCATORS CORPORATION
CONSOLIDATED STATEMENTS OF COMPREHENSIVE INCOME (LOSS)
(Dollars in thousands)
| Year Ended December 31, | ||||||||||||
| 2009 | 2008 | 2007 | ||||||||||
| Comprehensive income (loss) |
||||||||||||
| Net income |
$ | 73,486 | $ | 10,917 | $ | 82,788 | ||||||
| Other comprehensive income (loss), net of taxes: |
||||||||||||
| Change in net unrealized gains and losses on fixed maturities and equity securities |
204,331 | (179,444 | ) | (13,691 | ) | |||||||
| Change in net funded status of pension and other postretirement benefit obligations |
(21 | ) | (8,305 | ) | 239 | |||||||
| Other comprehensive income (loss) |
204,310 | (187,749 | ) | (13,452 | ) | |||||||
| Total |
$ | 277,796 | $ | (176,832 | ) | $ | 69,336 | |||||
See accompanying Notes to Consolidated Financial Statements.
F-46
Table of Contents
HORACE MANN EDUCATORS CORPORATION
CONSOLIDATED STATEMENTS OF CHANGES IN SHAREHOLDERS’ EQUITY
(Dollars in thousands, except per share data)
| Year Ended December 31, | ||||||||||||
| 2009 | 2008 | 2007 | ||||||||||
| Common stock |
||||||||||||
| Beginning balance |
$ | 61 | $ | 61 | $ | 61 | ||||||
| Options exercised, 2009 and 2008, 0 shares; 2007, 240,352 shares |
— | — | — | |||||||||
| Conversion of Director Stock Plan units, 2009, 84,562 shares; 2008, 16,355 shares; 2007, 18,362 shares |
— | — | — | |||||||||
| Conversion of restricted stock units, 2009, 38,371 shares; 2008, 3,174 shares; 2007, 2,115 shares |
— | — | — | |||||||||
| Ending balance |
61 | 61 | 61 | |||||||||
| Additional paid-in capital |
||||||||||||
| Beginning balance |
355,542 | 353,841 | 347,873 | |||||||||
| Options exercised and conversion of Director Stock Plan units and restricted stock units |
1,366 | 369 | 4,866 | |||||||||
| Share-based compensation expense |
1,173 | 1,332 | 1,102 | |||||||||
| Ending balance |
358,081 | 355,542 | 353,841 | |||||||||
| Retained earnings |
||||||||||||
| Beginning balance |
694,492 | 698,539 | 634,110 | |||||||||
| Cumulative effect of adoption of accounting principle, net of taxes |
— | — | — | |||||||||
| Net income |
73,486 | 10,917 | 82,788 | |||||||||
| Cash dividends, 2009, $0.2375 per share; 2008, $0.3675 per share and 2007, $0.42 per share |
(9,635 | ) | (14,964 | ) | (18,359 | ) | ||||||
| Ending balance |
758,343 | 694,492 | 698,539 | |||||||||
| Accumulated other comprehensive income (loss), net of taxes: |
||||||||||||
| Beginning balance |
(193,587 | ) | (5,838 | ) | 7,614 | |||||||
| Cumulative effect of adoption of accounting principle, net of taxes |
— | — | — | |||||||||
| Change in net unrealized gains and losses on fixed maturities and equity securities |
204,331 | (179,444 | ) | (13,691 | ) | |||||||
| Change in net funded status of pension and other postretirement benefit obligations |
(21 | ) | (8,305 | ) | 239 | |||||||
| Ending balance |
10,723 | (193,587 | ) | (5,838 | ) | |||||||
| Treasury stock, at cost |
||||||||||||
| Beginning balance, 2009, 21,813,196 shares; 2008, 18,614,971 shares; 2007, 17,503,371 shares |
(407,663 | ) | (353,325 | ) | (332,577 | ) | ||||||
| Purchase of 0 shares in 2009; 3,198,225 shares in 2008; 1,111,600 shares in 2007 |
— | (54,338 | ) | (20,748 | ) | |||||||
| Ending balance, 2009 and 2008, 21,813,196 shares; 2007,18,614,971 shares |
(407,663 | ) | (407,663 | ) | (353,325 | ) | ||||||
| Shareholders’ equity at end of period |
$ | 719,545 | $ | 448,845 | $ | 693,278 | ||||||
See accompanying Notes to Consolidated Financial Statements.
F-47
Table of Contents
HORACE MANN EDUCATORS CORPORATION
CONSOLIDATED STATEMENTS OF CASH FLOWS
(Dollars in thousands)
| Year Ended December 31, | ||||||||||||
| 2009 | 2008 | 2007 | ||||||||||
| Cash flows - operating activities |
||||||||||||
| Premiums collected |
$ | 667,524 | $ | 666,139 | $ | 664,133 | ||||||
| Policyholder benefits paid |
(479,484 | ) | (496,277 | ) | (449,519 | ) | ||||||
| Policy acquisition and other operating expenses paid |
(221,920 | ) | (214,800 | ) | (212,115 | ) | ||||||
| Federal income taxes paid |
(6,577 | ) | (5,909 | ) | (15,016 | ) | ||||||
| Investment income collected |
240,555 | 230,879 | 225,877 | |||||||||
| Interest expense paid |
(14,052 | ) | (13,683 | ) | (13,772 | ) | ||||||
| Contribution to defined benefit pension plan trust fund |
(2,700 | ) | — | — | ||||||||
| Other |
(4,444 | ) | (3,497 | ) | 2,057 | |||||||
| Net cash provided by operating activities |
178,902 | 162,852 | 201,645 | |||||||||
| Cash flows - investing activities |
||||||||||||
| Fixed maturities |
||||||||||||
| Purchases |
(2,018,457 | ) | (903,601 | ) | (1,389,677 | ) | ||||||
| Sales |
1,445,053 | 597,666 | 776,421 | |||||||||
| Maturities, paydowns, calls and redemptions |
353,301 | 337,493 | 538,989 | |||||||||
| Net cash used in short-term and other investments |
(47,809 | ) | (221,809 | ) | (56,203 | ) | ||||||
| Net cash used in investing activities |
(267,912 | ) | (190,251 | ) | (130,470 | ) | ||||||
| Cash flows - financing activities |
||||||||||||
| Dividends paid to shareholders |
(9,635 | ) | (14,964 | ) | (18,359 | ) | ||||||
| Purchase of treasury stock |
— | (54,338 | ) | (20,748 | ) | |||||||
| Exercise of stock options |
— | — | 4,477 | |||||||||
| Principal borrowings on Bank Credit Facility |
— | 38,000 | — | |||||||||
| Repurchase of Senior Convertible Notes |
— | — | (32,563 | ) | ||||||||
| Annuity contracts, variable and fixed |
||||||||||||
| Deposits |
349,804 | 311,747 | 337,148 | |||||||||
| Benefits and withdrawals |
(168,311 | ) | (178,079 | ) | (195,102 | ) | ||||||
| Net transfer to Separate Account |
(77,408 | ) | (73,328 | ) | (144,545 | ) | ||||||
| Life policy accounts |
||||||||||||
| Deposits |
1,762 | 1,896 | 1,333 | |||||||||
| Withdrawals and surrenders |
(5,475 | ) | (5,636 | ) | (6,347 | ) | ||||||
| Change in bank overdrafts |
(3,083 | ) | (1,904 | ) | 3,302 | |||||||
| Net cash provided by (used in) financing activities |
87,654 | 23,394 | (71,404 | ) | ||||||||
| Net decrease in cash |
(1,356 | ) | (4,005 | ) | (229 | ) | ||||||
| Cash at beginning of period |
9,204 | 13,209 | 13,438 | |||||||||
| Cash at end of period |
$ | 7,848 | $ | 9,204 | $ | 13,209 | ||||||
See accompanying Notes to Consolidated Financial Statements.
F-48
Table of Contents
HORACE MANN EDUCATORS CORPORATION
NOTES TO CONSOLIDATED FINANCIAL STATEMENTS
(Dollars in thousands, except per share data)
NOTE 1 - Summary of Significant Accounting Policies
Basis of Presentation
The accompanying consolidated financial statements have been prepared in accordance with United States (“U.S.”) generally accepted accounting principles (“GAAP”) and with the rules and regulations of the Securities and Exchange Commission (“SEC”), specifically Regulation S-X and the instructions to Form 10-K. The preparation of consolidated financial statements in conformity with GAAP requires management to make estimates and assumptions that affect (1) the reported amounts of assets and liabilities, (2) disclosure of contingent assets and liabilities at the date of the consolidated financial statements, and (3) the reported amounts of revenues and expenses during the reporting period. Actual results could differ from those estimates.
The consolidated financial statements include the accounts of Horace Mann Educators Corporation and its wholly-owned subsidiaries (“HMEC”; and together with its subsidiaries, the “Company” or “Horace Mann”). HMEC and its subsidiaries have common management, share office facilities and are parties to several intercompany service agreements for management, administrative, data processing, agent commissions, agency services, utilization of personnel and investment advisory services. Under these agreements, costs have been allocated among the companies in conformity with GAAP consistently applied. In addition, certain of the subsidiaries have entered into intercompany reinsurance agreements. HMEC and its subsidiaries file a consolidated federal income tax return, and there are related tax sharing agreements. The tax sharing agreements provide that tax on income is charged to the subsidiaries as if they were filing separate federal income tax returns and the subsidiaries receive the benefits of any losses or tax credits to the extent utilized in the consolidated return. All significant intercompany balances and transactions have been eliminated in consolidation.
The subsidiaries of HMEC market and underwrite tax-qualified retirement annuities and private passenger automobile, homeowners, and life insurance products, primarily to K-12 teachers, administrators and other employees of public schools and their families. HMEC’s principal operating subsidiaries are Horace Mann Life Insurance Company, Horace Mann Insurance Company, Teachers Insurance Company, Horace Mann Property & Casualty Insurance Company and Horace Mann Lloyds.
The Company has evaluated subsequent events through the date these consolidated financial statements were issued.
F-49
Table of Contents
NOTE 1 - Summary of Significant Accounting Policies-(Continued)
Investments
The Company invests primarily in fixed maturity securities. This category includes primarily bonds and notes, but also includes redeemable preferred stocks. These securities are classified as available for sale and carried at fair value. The net adjustment for unrealized gains and losses on all securities available for sale, carried at fair value, is recorded as a separate component of shareholders’ equity, net of applicable deferred tax asset or liability and the related impact on deferred policy acquisition costs (and also value of acquired insurance in force for years prior to 2009) associated with interest-sensitive life and annuity contracts that would have occurred if the securities had been sold at their aggregate fair value and the proceeds reinvested at current yields.
Equity securities are classified as available for sale and carried at fair value. This category includes primarily nonredeemable preferred stocks and also common stocks.
Short-term and other investments are comprised of short-term fixed income securities, carried at cost which approximates fair value; policy loans, carried at unpaid principal balances; and mortgage loans, carried at unpaid principal less a valuation allowance for estimated uncollectible amounts.
Interest income is recognized as earned. Investment income reflects amortization of premiums and accrual of discounts on an effective-yield basis.
Realized gains and losses arising from the sale (recorded on a trade date basis) or impairment of securities are determined based upon specific identification of securities. The Company evaluates all investments in its portfolio for other-than-temporary declines in value as described in the following section.
Other-than-temporary Impairments
The Company’s methodology of assessing other-than-temporary impairments is based on security-specific facts and circumstances as of the date of the reporting period. Based on these facts, if the Company has the intent to sell the debt security, or if it is more likely than not the Company will be required to sell the debt security before the anticipated recovery in fair value or if management does not expect to recover the entire cost basis of the debt security, an other-than-temporary impairment is considered to have occurred. For equity securities, if the Company does not have the ability and intent to hold the security for the recovery of cost within a reasonable period of time or if recovery of cost is not expected within a reasonable period of time, an other-than-temporary impairment is considered to have occurred. Additionally, if events become known that call into question whether the security issuer has the ability to honor its contractual commitments, such security holding will be evaluated to determine whether or not such security has suffered an other-than-temporary decline in value.
F-50
Table of Contents
NOTE 1 - Summary of Significant Accounting Policies-(Continued)
The Company reviews the fair value of all investments in its portfolio on a monthly basis to assess whether an other-than-temporary decline in value has occurred. These reviews, in conjunction with the Company’s investment managers’ monthly credit reports and relevant factors such as (1) the financial condition and near-term prospects of the issuer, (2) the length of time and extent to which the fair value has been less than amortized cost for fixed maturity securities or cost for equity securities, (3) for debt securities, the Company’s intent to sell a security or whether it is more likely than not the Company will be required to sell the security before the anticipated recovery in fair value or maturity; and for equity securities, the Company’s ability and intent to hold the security for the recovery of cost within a reasonable period of time or if recovery of cost is not expected within a reasonable period of time, (4) the stock price trend of the issuer, (5) the market leadership position of the issuer, (6) the debt ratings of the issuer, and (7) the cash flows and liquidity of the issuer or the underlying cash flows for asset-backed securities, are all considered in the impairment assessment. A write-down of an investment is recorded when a decline in the fair value of that investment is deemed to be other-than-temporary, with a realized investment loss charged to income for the period for all equity securities and for credit related losses associated with impaired debt securities. The amount of the total other-than-temporary impairment related to non-credit factors for debt securities is recognized in other comprehensive income, net of applicable taxes. For securities that are other-than-temporarily impaired, the credit loss portion of the other-than-temporary impairment is recognized in earnings.
Additional considerations for certain types of securities include the following:
Corporate Debt Securities
Judgments regarding whether a corporate debt security is other-than-temporarily impaired include analyzing the issuer’s financial condition and whether there has been a decline in the issuer’s ability to service the specific security. The analysis of the security issuer is based on asset coverage, cash flow multiples or other industry standards. Several factors assessed include, but are not limited to, credit quality ratings, cash flow sustainability, liquidity, financial strength, industry and market position. Sources of information include, but are not limited to, management projections, independent consultants, external analysts’ research, peer analysis and the Company’s internal analysis.
If the Company has concerns regarding the viability of the issuer or its ability to service the specific security after this analysis, a cash flow analysis is prepared to determine if the recovery value has declined below the amortized cost of the debt security. This analysis to determine an estimate of ultimate recovery value is combined with the estimated timing to recovery and any other applicable cash flows that are expected. If a cash flow analysis estimate is not feasible, then the market’s view of cash flows implied by the period end fair value, market discount rates and effective yield are the primary factors used to estimate recovery.
F-51
Table of Contents
NOTE 1 - Summary of Significant Accounting Policies-(Continued)
Mortgage-Backed Securities Not Issued By the U.S. Government and Federally Sponsored Agencies
The Company uses an estimate of future cash flows expected to be collected to evaluate its mortgage-backed securities for other-than-temporary impairment. The determination of cash flow estimates is inherently subjective and methodologies may vary depending on facts and circumstances specific to the security. All reasonably available information relevant to the collectability of the security, including past events, current conditions, and reasonable and supportable assumptions and forecasts, are considered when developing the estimate of cash flows expected to be collected. Information includes, but is not limited to, debt-servicing, missed refinancing opportunities and geography. Loan level characteristics such as issuer, FICO score, payment terms, level of documentation, property or residency type, and economic outlook are also utilized in financial models, along with historical performance, to estimate or measure the loan’s propensity to default. Additionally, financial models take into account loan age, lease rollovers, rent volatilities, vacancy rates and exposure to refinancing as additional drivers of default. For transactions where loan level data is not available, financial models use a proxy based on the collateral characteristics. Loss severity is a function of multiple factors including, but not limited to, the unpaid balance, interest rate, mortgage insurance ratios, assessed property value at origination, change in property valuation and loan-to-value ratio at origination. Prepayment speeds, both actual and estimated, cost of capital rates, and debt service ratios are also considered. The cash flows generated by the collateral securing these securities are then estimated with these default, loss severity and prepayment assumptions. These collateral cash flows are then utilized, along with consideration for the issue’s position in the overall structure, to estimate the cash flows associated with the residential or commercial mortgage-backed security held by the Company.
Municipal Bonds
The Company’s municipal bond portfolio consists primarily of special revenue bonds, which present unique considerations in evaluating other-than-temporary impairments, but also includes general obligation bonds. The Company evaluates special revenue bonds for other-than-temporary impairment based on guarantees associated with the repayment from revenues generated by the specified revenue-generating activity associated with the purpose of the bonds. Judgments regarding whether a municipal debt security is other-than-temporarily impaired include analyzing the issuer’s financial condition and whether there has been a decline in the overall value of the issuer or its ability to service the specific security. Security credit ratings are reviewed with emphasis on the economy, finances, debt and management of the municipal issuer. Municipalities possess unique powers, along with a special legal standing and protections, that enable them to act quickly to restore budgetary balance and fiscal integrity. These powers include the sovereign power to tax, access one-time revenue sources, capacity to issue or restructure debt and ability to shift spending to other authorities. State governments often provide secondary support to local governments in times of financial stress and the federal government has provided assistance to state governments during recessions.
F-52
Table of Contents
NOTE 1 - Summary of Significant Accounting Policies-(Continued)
If the Company has concerns regarding the viability of the municipal issuer or its ability to service the specific security after this analysis, a recovery value analysis is prepared to determine if the recovery value has declined below the amortized cost of the security. This analysis to determine an estimate of ultimate recovery value is combined with the estimated timing to recovery and any other applicable cash flows that are expected. If a recovery estimate is not feasible, then the market’s view of cash flows implied by the period end fair value, market discount rates and effective yield are the primary factors used to estimate recovery value.
Credit Losses
The Company estimates the amount of the credit loss component of a debt security impairment as the difference between amortized cost and the present value of the expected cash flows of the security. The present value is determined using the best estimate cash flows discounted at the effective interest rate implicit to the security at the date of purchase or the current yield to accrete an asset-backed or floating rate security. The methodology and assumptions for establishing the best estimate cash flows vary depending on the type of security. Corporate debt security and municipal bond cash flow estimates are derived from scenario-based outcomes of expected restructurings or the disposition of assets using specific facts and other circumstances, including timing, security interests and loss severity. The cash flow estimates for mortgage-backed and other structured securities are based on bond specific facts and circumstances that may include collateral characteristics, expectations of delinquency and default rates, loss severity and prepayment speeds, and structural support, including subordination and guarantees.
Deferred Policy Acquisition Costs
Policy acquisition costs, consisting of commissions, policy issuance and other costs, which vary with and are primarily related to the production of business, are capitalized and amortized on a basis consistent with the type of insurance coverage. For all investment (annuity) contracts, acquisition costs are amortized over 20 years in proportion to estimated gross profits. Capitalized acquisition costs for interest-sensitive life contracts are amortized over 20 years in proportion to estimated gross profits. For other individual life contracts, acquisition costs are amortized in proportion to anticipated premiums over the terms of the insurance policies (10, 15, 20 and 30 years). For property and casualty policies, acquisition costs are amortized over the terms of the insurance policies (six and twelve months). The Company periodically reviews the assumptions and estimates used in capitalizing policy acquisition costs and also periodically reviews its estimations of gross profits. The most significant assumptions that are involved in the estimation of annuity gross profits include interest rate spreads, future financial market performance, business surrender/lapse rates, expenses and the impact of realized investment gains and losses. In the event actual experience differs significantly from assumptions or assumptions are significantly revised, the Company may be required to record a material charge or credit to amortization expense for the period in which the adjustment is made.
Deferred policy acquisition costs (“DAC”) for interest-sensitive life and investment contracts are adjusted for the impact on estimated future gross profits as if net unrealized investment gains and losses had been realized at the balance sheet date. The impact of this adjustment is included in net unrealized gains and losses within shareholders’ equity.
F-53
Table of Contents
NOTE 1 - Summary of Significant Accounting Policies-(Continued)
DAC is reviewed for recoverability from future income, including investment income, and costs which are deemed unrecoverable are expensed in the period in which the determination is made. No such costs have been deemed unrecoverable during the periods reported.
Accounting guidance defines an internal replacement of an insurance or investment contract as a modification in product benefits, features, rights or coverages that occurs by the exchange of a contract for a new contract, or by amendment, endorsement or rider to a contract, or by the election of a feature or coverage within a contract. Modifications that result in a replacement contract that is substantially unchanged from the replaced contract are accounted for as a continuation of the replaced contract. When modifications represent a substantial change compared to the replaced contract, the transaction is accounted for as an extinguishment of the replaced contract, and unamortized DAC and unearned revenue liabilities from the replaced contract are written off. For the years ended December 31, 2009, 2008 and 2007, internal replacements of traditional non-interest-sensitive life insurance contracts which represented substantial changes compared to the replaced contracts resulted in $186, $172 and $207 of additional DAC amortization for the respective years.
Goodwill and Value of Acquired Insurance In Force
When the Company was acquired in 1989, intangible assets were recorded in the application of purchase accounting to recognize the value of acquired insurance in force and goodwill. In addition, goodwill was recorded in 1994 related to the purchase of Horace Mann Property & Casualty Insurance Company. Prior to amortization completion in 2009, the value of acquired insurance in force was amortized over the following periods, utilizing the indicated methods for life and annuity, respectively, as follows: 20 years, in proportion to coverage provided; 20 years, in proportion to estimated gross profits.
The Company’s value of acquired insurance in force was an intangible asset with a definite life and was amortized over its useful life. Goodwill is evaluated for impairment at the reporting unit level at least annually or whenever events or changes in circumstances would more likely than not reduce the fair value of a reporting unit below its carrying amount. A reporting unit is the operating segment or a business unit one level below the operating segment, if separate financial information is prepared and regularly reviewed by management at that level. The Company’s reporting units, for which goodwill has been allocated, are equivalent to the Company’s operating segments. The goodwill impairment test, as defined in the accounting guidance, follows a two-step process. In the first step, the fair value of a reporting unit is compared to its carrying value. If the carrying value of a reporting unit exceeds its fair value, the second step of the impairment test is performed for purposes of confirming and measuring the impairment. In the second step, the fair value of the reporting unit is allocated to all of the assets and liabilities of the reporting unit to determine an implied goodwill value. If the carrying amount of the reporting unit goodwill exceeds the implied goodwill value, an impairment loss would be recognized in an amount equal to that excess.
The allocation of goodwill by reporting unit is as follows:
| Annuity |
$ | 28,025 | |
| Life |
9,911 | ||
| Property and casualty |
9,460 | ||
| Total |
$ | 47,396 | |
F-54
Table of Contents
NOTE 1 - Summary of Significant Accounting Policies-(Continued)
The Company completed its annual goodwill assessment for the individual reporting units as of December 31, 2009. The process of evaluating goodwill for impairment requires judgments and assumptions to be made to determine the fair value of each reporting unit, including discounted cash flow calculations, the level of the Company’s own share price and assumptions that market participants would make in valuing each reporting unit. Fair value estimates were based primarily on an in-depth analysis of historical experience, projected future cash flows and relevant discount rates, which considered market participant inputs and the relative risk associated with the projected cash flows. Other assumptions include levels of economic capital, future business growth, earnings projections, and assets under management for each reporting unit. Estimates of fair value are subject to assumptions that are sensitive to change and represent the Company’s reasonable expectation regarding future developments. The Company also considered other valuation techniques such as peer company price-to-earnings and price-to-book multiples.
Any amount of goodwill determined to be impaired will be recorded as an expense in the period in which the impairment determination is made. During each year from 2007 through 2009, the Company completed the required annual testing; no impairment charges were necessary as a result of such assessments. Subsequent reviews of goodwill could result in impairment due to the impact of volatile financial markets on earnings, discount rate assumptions, liquidity and market capitalization (stock price).
For the amortization of the value of acquired insurance in force, the Company periodically reviewed its estimates of gross profits. The most significant assumptions that were involved in the estimation of gross profits included interest rate spreads, future financial market performance, business surrender/lapse rates, expenses and the impact of realized investment gains and losses. In the event actual experience differed significantly from assumptions or assumptions were significantly revised, the Company was required to record a charge or credit to amortization expense for the period in which the adjustment was made.
The value of acquired insurance in force for investment contracts was adjusted for the impact on estimated future gross profits as if net unrealized investment gains and losses had been realized at the balance sheet date. The impact of this adjustment was included in net unrealized gains and losses within shareholders’ equity.
The Company amortized the $223 December 31, 2008 balance of value of acquired insurance in force related to the life segment in 2009. The value of acquired insurance in force related to the annuity segment was fully amortized as of December 31, 2008. The balances of value of acquired insurance in force by segment at December 31, 2009 and 2008 were as follows:
| December 31, 2009 | December 31, 2008 | |||||||||||||||||
| Cost | Accumulated Amortization |
Net Balance |
Cost | Accumulated Amortization |
Net Balance | |||||||||||||
| Life |
$ | 48,746 | $ | 48,746 | $ | — | $ | 48,746 | $ | 48,523 | $ | 223 | ||||||
| Annuity |
87,553 | 87,553 | — | 87,553 | 87,553 | — | ||||||||||||
| Subtotal |
$ | 136,299 | $ | 136,299 | — | $ | 136,299 | $ | 136,076 | 223 | ||||||||
| Impact of unrealized investment gains and losses |
— | — | ||||||||||||||||
| Total |
$ | — | $ | 223 | ||||||||||||||
F-55
Table of Contents
NOTE 1 - Summary of Significant Accounting Policies-(Continued)
By segment, the amount of interest accrued on the unamortized balance of value of acquired insurance in force and the interest accrual rates were as follows:
| Year Ended December 31, | ||||||||
| 2008 | 2007 | |||||||
| Interest accrued on the unamortized balance of value of acquired insurance in force |
||||||||
| Life |
$ | 70 | $ | 175 | ||||
| Annuity |
— | 287 | ||||||
| Total |
$ | 70 | $ | 462 | ||||
| Interest accrual rate |
||||||||
| Life |
8.0 | % | 8.0 | % | ||||
| Annuity |
* | 5.1 | % | |||||
| * | Not Applicable |
The accumulated amortization of intangibles as of December 31, 2009 and 2008 was $185,276 and $185,053, respectively.
Property and Equipment
Property and equipment are carried at cost less accumulated depreciation and are included in Other Assets in the Consolidated Balance Sheets. Depreciation and amortization are calculated on the straight-line method based on the estimated useful lives of the assets. The estimated useful lives of property and equipment by asset type are generally as follows: real estate, identified by specific property, 20-45 years; furniture, 10 years; leasehold improvements, the lesser of 10 years or the life of the lease; telephones, 5 years; vehicles, 2.5 to 3 years; and data processing hardware and software and personal computers, 2 to 5 years or 10 years.
| December 31, | ||||||
| 2009 | 2008 | |||||
| Property and equipment |
$ | 106,541 | $ | 100,176 | ||
| Less: accumulated depreciation |
60,869 | 54,541 | ||||
| Total |
$ | 45,672 | $ | 45,635 | ||
Separate Account (Variable Annuity) Assets and Liabilities
Separate Account (variable annuity) assets and liabilities represent variable annuity funds invested in various mutual funds. Separate Account assets are recorded at fair value primarily based on market quotations of the underlying securities. The investment income, gains and losses of these accounts accrue directly to the contractholders and are not included in the operations of the Company. The activity of the Separate Accounts is not reflected in the Consolidated Statements of Operations except for (1) contract charges earned, (2) the activity related to contract guarantees, which are benefits on existing variable annuity contracts, and (3) the impact of financial markets performance on the valuation of deferred policy acquisition costs. The Company’s contract charges earned include fees charged to the Separate Accounts, including mortality charges, risk charges, policy administration fees, investment management fees and surrender charges.
F-56
Table of Contents
NOTE 1 - Summary of Significant Accounting Policies-(Continued)
Future Policy Benefits, Interest-sensitive Life Contract Liabilities and Annuity Contract Liabilities
Liabilities for future benefits on life and annuity policies are established in amounts adequate to meet the estimated future obligations on policies in force. Liabilities for future policy benefits on certain life insurance policies are computed using the net level premium method and are based on assumptions as to future investment yield, mortality and withdrawals. As a result of the application of purchase accounting, future policy benefits for direct individual life insurance policies issued through August 29, 1989 were revalued using interest rates of 9% graded to 8% over 10 years. For policies issued from August 30, 1989 through December 31, 1992, future policy benefits are computed using an interest rate of 6.5%. An interest rate of 5.5% is used to compute future policy benefits for policies issued after December 31, 1992. The Life by Design product portfolio introduced in February 2006 uses an interest rate of 5% for future policy benefits. Mortality and withdrawal assumptions for all policies have been based on actuarial tables which are consistent with the Company’s own experience. In the event actual experience is worse than the assumptions, additional reserves may be required. This would result in a charge to income for the period in which the increase in reserves occurred. Liabilities for future benefits on annuity contracts and certain long-duration life insurance contracts are carried at accumulated policyholder values without reduction for potential surrender or withdrawal charges. The liability also includes provisions for the unearned portion of certain policy charges.
A guaranteed minimum death benefit (“GMDB”) generally provides a benefit if the contractholder dies and the variable annuity contract value is less than a contractually defined amount. The Company has established a GMDB reserve on variable annuity contracts in accordance with prescribed accounting guidance. Contractually defined amounts vary from contract to contract based on the date the contract was entered into as well as the GMDB feature elected by the contractholder. The Company regularly monitors the GMDB reserve considering fluctuations in the financial markets. At December 31, 2009 and 2008, the GMDB reserve was $490 and $1,265, respectively. The Company has a relatively low exposure to GMDB because approximately 27% of contract values have no guarantee; approximately 67% have only a return of premium guarantee; and only approximately 6% have a guarantee of premium roll-up at an annual interest rate of 3% or 5%. The aggregate in-the-money death benefits under the GMDB provision totaled $69,538 and $206,268 at December 31, 2009 and 2008, respectively.
Unpaid Claims and Claim Expenses
Liabilities for property and casualty unpaid claims and claim expenses include provisions for payments to be made on reported claims, claims incurred but not yet reported and associated settlement expenses. All of the Company’s reserves for property and casualty unpaid claims and claim expenses are carried at the full value of estimated liabilities and are not discounted for interest expected to be earned on reserves. Estimated amounts of salvage and subrogation on unpaid property and casualty claims are deducted from the liability for unpaid claims. Due to the nature of the Company’s personal lines business, the Company has no exposure to claims for toxic waste cleanup, other environmental remediation or asbestos-related illnesses other than claims under homeowners insurance policies for environmentally related items such as mold.
F-57
Table of Contents
NOTE 1 - Summary of Significant Accounting Policies-(Continued)
Insurance Premiums and Contract Charges Earned
Property and casualty insurance premiums are recognized as revenue ratably over the related contract periods in proportion to the risks insured. The unexpired portions of these property and casualty premiums are recorded as unearned premiums, using the monthly pro rata method.
Premiums and contract charges for interest-sensitive life and investment (annuity) contracts consist of charges for the cost of insurance, policy administration and withdrawals. Premiums for long-term traditional life policies are recognized as revenues when due over the premium-paying period. Annuity and interest-sensitive life contract deposits represent funds deposited by policyholders and are not included in the Company’s premiums or contract charges earned.
Stock Based Compensation
The Company grants stock options to executive officers, other employees and directors. The exercise price of the option is equal to the fair market value of the Company’s common stock on the date of grant. Additional information regarding the Company’s stock-based compensation plans is contained in “Note 6 — Shareholders’ Equity and Stock Options”. As allowed by accounting guidance prior to January 1, 2006, the Company accounted for stock option grants using the intrinsic value based method, and accordingly, recognized no compensation expense for the stock option grants which had an exercise price equal to market price on the date of grant resulting in an intrinsic value of $0.
Effective January 1, 2006, the Company recognizes compensation cost for share-based compensation plans based on the fair value at the grant dates. For the years ended December 31, 2009, 2008 and 2007, the Company recognized $1,173, $1,332 and $1,102, respectively, in expense as a result of the vesting of stock options during the respective periods.
In 2009, 2008 and 2007, the Company granted stock options as quantified in the table below, which also provides the weighted average grant date fair value for options granted in each year. The fair value of options granted was estimated on the dates of grant using the Black-Scholes option pricing model with the following weighted-average assumptions:
| Year Ended December 31, | ||||||||||||
| 2009 | 2008 | 2007 | ||||||||||
| Number of options granted |
479,332 | 622,828 | 276,280 | |||||||||
| Weighted average grant date fair value of options granted |
$ | 2.50 | $ | 3.47 | $ | 5.49 | ||||||
| Weighted average assumptions: |
||||||||||||
| Risk-free interest rate |
1.5 | % | 3.1 | % | 4.7 | % | ||||||
| Expected dividend yield |
2.2 | % | 2.2 | % | 2.2 | % | ||||||
| Expected life, in years |
6.0 | 5.6 | 5.4 | |||||||||
| Expected volatility (based on historical volatility) |
45.5 | % | 28.0 | % | 27.8 | % | ||||||
The weighted average fair value of nonvested options outstanding on December 31, 2009 was $3.27. Total unrecognized compensation expense relating to the nonvested options outstanding as of December 31, 2009 was approximately $2,500, which will be recognized over the remainder of the vesting period currently scheduled to be completed in August 2013. Expense is reflected on a straight-line basis over the vesting period for the entire award.
F-58
Table of Contents
NOTE 1 - Summary of Significant Accounting Policies-(Continued)
HMEC’s Board of Directors approved the acceleration of vesting of all outstanding stock options effective June 30, 2004 in an effort to recognize employees’ significant contributions to increasing shareholder value and improving underlying Company operating trends. The Board placed certain restrictions on the transfer of shares obtained by this vesting acceleration for members of the Board of Directors and 10 of HMEC’s key executive officers. By December 31, 2009, these restrictions had expired. At June 30, 2004, the majority of the options vested were out-of-the-money. The accelerated vesting did not have a material effect on the Company’s operating expenses.
Income Taxes
The Company uses the asset and liability method for calculating deferred federal income taxes. Income tax provisions are generally based on income reported for financial statement purposes. The provisions for federal income taxes for the years ended December 31, 2009, 2008 and 2007 included amounts currently payable and deferred income taxes resulting from the cumulative differences in the Company’s assets and liabilities, determined on a tax return versus financial statement basis.
Deferred tax assets and liabilities include provisions for unrealized investment gains and losses as well as the net funded status of pension and other postretirement benefit obligations adjustment with the changes for each period included in the respective components of accumulated other comprehensive income (loss) in shareholders’ equity.
Earnings Per Share
Basic earnings per share is computed based on the weighted average number of common shares outstanding. Diluted earnings per share is computed based on the weighted average number of common shares and common stock equivalents outstanding, to the extent dilutive. The common stock equivalents relate to outstanding common stock options, Director Stock Plan units, Employee Stock Plan units and Incentive Compensation Plan restricted common stock units. In addition, prior to the final redemption on May 14, 2007, the Company’s Senior Convertible Notes were considered potentially dilutive securities and were included in the calculation of diluted earnings per share, to the extent dilutive.
F-59
Table of Contents
NOTE 1 - Summary of Significant Accounting Policies-(Continued)
The computations of net income per share on both basic and diluted bases, including reconciliations of the numerators and denominators, were as follows:
| Year Ended December 31, | |||||||||
| 2009 | 2008 | 2007 | |||||||
| Basic - assumes no dilution: |
|||||||||
| Net income for the period |
$ | 73,486 | $ | 10,917 | $ | 82,788 | |||
| Weighted average number of common shares outstanding during the period (in thousands) |
39,175 | 39,820 | 43,145 | ||||||
| Net income per share – basic |
$ | 1.88 | $ | 0.27 | $ | 1.92 | |||
| Diluted - assumes full dilution: |
|||||||||
| Net income for the period |
$ | 73,486 | $ | 10,917 | $ | 82,788 | |||
| Interest expense, net of tax, on dilutive Senior Convertible Notes |
— | — | 279 | ||||||
| Adjusted net income for the period |
$ | 73,486 | $ | 10,917 | $ | 83,067 | |||
| Weighted average number of common shares outstanding during the period (in thousands) |
39,175 | 39,820 | 43,145 | ||||||
| Weighted average number of common equivalent shares to reflect the dilutive effect of common stock equivalent securities (in thousands): |
|||||||||
| Stock options |
113 | 7 | 233 | ||||||
| Common stock units related to Deferred Equity Compensation Plan for Directors |
232 | 254 | 228 | ||||||
| Common stock units related to Deferred Compensation Plan for Employees |
191 | 215 | 219 | ||||||
| Restricted common stock units related to Incentive Compensation Plan |
821 | 293 | 342 | ||||||
| Weighted average number of common equivalent shares to reflect the dilutive effect of Senior Convertible Notes (in thousands) |
— | — | 444 | ||||||
| Total common and common equivalent shares adjusted to calculate diluted earnings per share (in thousands) |
40,532 | 40,589 | 44,611 | ||||||
| Net income per share – diluted |
$ | 1.81 | $ | 0.27 | $ | 1.86 | |||
Options to purchase 2,761,002 shares of common stock at $13.88 to $21.77 per share were granted in 2000 through 2008 but were not included in the computation of 2009 diluted earnings per share because the options’ exercise price was greater than the average market price of the common shares during 2009. The options, which expire in 2010 through 2015, were still outstanding at December 31, 2009.
Comprehensive Income (Loss)
Comprehensive income (loss) represents the change in shareholders’ equity during a reporting period from transactions and other events and circumstances from non-shareholder sources. For the Company, comprehensive income (loss) is equal to net income plus or minus the change in net unrealized gains and losses on fixed maturities and equity securities and the change in net funded status of pension and other postretirement benefit obligations for the period as shown in the Consolidated Statements of Changes in Shareholders’ Equity.
In the Consolidated Balance Sheets, the Company recognizes the funded status of defined benefit pension plans and other postretirement benefit plans as a component of accumulated other comprehensive income (loss), net of tax.
F-60
Table of Contents
NOTE 1 - Summary of Significant Accounting Policies-(Continued)
The components of comprehensive income (loss) were as follows:
| Year Ended December 31, | ||||||||||||
| 2009 | 2008 | 2007 | ||||||||||
| Net income |
$ | 73,486 | $ | 10,917 | $ | 82,788 | ||||||
| Other comprehensive income (loss): |
||||||||||||
| Change in net unrealized gains and losses on fixed maturities and equity securities |
||||||||||||
| Net unrealized holding gains and losses on fixed maturities and equity securities arising during the period |
342,836 | (339,259 | ) | (24,516 | ) | |||||||
| Less: reclassification adjustment for gains (losses) included in income before income tax |
27,510 | (61,871 | ) | (3,453 | ) | |||||||
| Total, before tax |
315,326 | (277,388 | ) | (21,063 | ) | |||||||
| Income tax expense (benefit) |
110,995 | (97,944 | ) | (7,372 | ) | |||||||
| Total, net of tax |
204,331 | (179,444 | ) | (13,691 | ) | |||||||
| Change in net funded status of pension and other postretirement benefit obligations |
||||||||||||
| Before tax |
(70 | ) | (12,852 | ) | 368 | |||||||
| Income tax expense (benefit) |
(49 | ) | (4,547 | ) | 129 | |||||||
| Total, net of tax |
(21 | ) | (8,305 | ) | 239 | |||||||
| Total comprehensive income (loss) |
$ | 277,796 | $ | (176,832 | ) | $ | 69,336 | |||||
Statements of Cash Flows
For purposes of the Consolidated Statements of Cash Flows, cash constitutes cash on deposit at banks.
Adopted Accounting Standards
Investments in Certain Entities That Calculate Net Asset Value Per Share
Effective December 31, 2009, the Company adopted new accounting guidance related to investments that are required or permitted to be measured or disclosed at fair value when the investment does not have a readily determinable fair value and is accounted for under the measurement principles pertaining to investment companies. The guidance is applied on an investment-by-investment basis and consistently to the entire position in the investment. The guidance also requires additional disclosures for interim and annual periods ending after December 15, 2009, with early application permitted. The adoption of this guidance did not have an effect on the results of operations or financial position of the Company.
Employers’ Disclosures about Postretirement Benefit Plan Assets
Effective December 31, 2009, the Company adopted new accounting guidance related to an employer’s disclosures about plan assets of a defined benefit pension or other postretirement benefit plan. To increase transparency surrounding the types of assets and associated risks in the employer approved benefit plans, companies are required to disclose additional information about investment allocation decisions, the fair value of each major category of plan assets, and valuation inputs and techniques used to measure plan assets for fiscal years ending after December 15, 2009. Disclosures are not required for earlier periods that are presented for comparative purposes. The adoption of this guidance did not have an effect on the results of operations or financial position of the Company.
F-61
Table of Contents
NOTE 1 - Summary of Significant Accounting Policies-(Continued)
Fair Value Measurement of Liabilities
Effective October 1, 2009, the Company adopted new accounting guidance related to measuring liabilities at fair value when a quoted market price in an active market for an identical liability is not available. A reporting entity must measure fair value of the liability using one of the following techniques: (1) the quoted price of the identical liability when traded as an asset; (2) quoted prices for similar liabilities or similar liabilities when traded as assets; or (3) another valuation technique, such as a present value technique or the amount that the reporting entity would pay to transfer the identical liability or would receive to enter into the identical liability that is consistent with existing fair value measurement and disclosure provisions. The guidance was effective for interim and annual periods beginning after August 27, 2009. The adoption of this guidance did not have an effect on the results of operations or financial position of the Company.
FASB Accounting Standards CodificationTM
Effective July 1, 2009, the Company adopted new accounting guidance related to the codification of accounting standards and the hierarchy of U.S. generally accepted accounting principles (“GAAP”) established by the Financial Accounting Standards Board (“FASB”). The FASB Accounting Standards CodificationTM (“Codification”) is the authoritative source, along with SEC guidance, for GAAP recognized by the FASB to be applied by nongovernmental entities. All guidance contained in the Codification carries an equal level of authority. Rules and interpretive releases of the SEC under authority of federal securities laws are also sources of authoritative GAAP for SEC registrants. The Codification was effective on a prospective basis for interim and annual reporting periods ending after September 15, 2009. The adoption of this guidance did not have an effect on the results of operations or financial position of the Company.
Subsequent Events
Effective June 30, 2009, the Company adopted new accounting guidance related to subsequent events, which established general standards of accounting for and disclosure of events that occur after the balance sheet date but before the financial statements are issued or are available to be issued. The guidance addresses the period after the balance sheet date during which management of a reporting entity should evaluate events or transactions that may occur for potential recognition or disclosure in the financial statements, the circumstances under which an entity should recognize events or transactions occurring after the balance sheet date in its financial statements and the disclosures that an entity should make about events or transactions that occurred after the balance sheet date. The adoption of this guidance did not have an effect on the results of operations or financial position of the Company.
Effective February 24, 2010, the FASB modified its guidance related to subsequent events and the Company has adopted the change. This guidance continues to require entities that file or furnish financial statements with the SEC to evaluate subsequent events through the date the financial statements are issued; however, this guidance removed the requirement for these entities to disclose the date through which events have been evaluated. The adoption of this guidance did not have an effect on the results of operations or financial position of the Company.
F-62
Table of Contents
NOTE 1 - Summary of Significant Accounting Policies-(Continued)
Fair Value Measurements
Effective April 1, 2009, the Company prospectively adopted new accounting guidance for estimating fair value when the volume and level of activity for the asset or liability have significantly decreased and also for identifying circumstances that indicate a transaction is not orderly. Under this guidance, if there has been a significant decrease in the volume and level of activity for the asset or the liability in relation to the normal market activity for the asset or liability (or similar assets or liabilities), then transactions or quoted prices may not accurately reflect fair value. In addition, if there is evidence that the transaction for the asset or liability is not orderly, little weight, if any, should be placed on that transaction price as an indicator of fair value. The adoption of this guidance did not have a material effect on the results of operations or financial position of the Company.
Recognition and Presentation of Other-than-temporary Impairments
Effective April 1, 2009, the Company prospectively adopted new accounting guidance for the recognition and presentation of other-than-temporary impairments of debt securities. The new guidance requires an other-than-temporary impairment of a debt security be separated into two components when there are credit related losses associated with the impaired debt security for which management asserts that it does not have the intent to sell the security, and it is more likely than not that it will not be required to sell the security before recovery of its cost basis.
The new guidance expands disclosure requirements for both debt and equity securities; requires a more detailed, risk-oriented breakdown of security types and related information; and requires that the annual disclosures be made for interim periods. In addition, new disclosures are required about significant inputs used in determining credit losses as well as a rollforward of credit losses each period. The disclosures are not required for earlier periods presented for comparative purposes. The new guidance applies to existing and new investments held as of the beginning of the interim period of adoption.
The amount of the total other-than-temporary impairment related to non-credit factors is recognized in other comprehensive income, net of applicable taxes, while the credit related portion is recognized in net income. Other-than-temporary impairments prior to April 1, 2009 were the result of the Company’s intent to sell securities prior to the recovery of fair value or the result of credit losses. Accordingly, the Company’s adoption of this guidance did not require a cumulative-effect adjustment to the opening balance of retained earnings or accumulated other comprehensive income in the period of adoption. See “Note 2 — Investments” for additional disclosures required by this guidance.
Interim Disclosures about Fair Value of Financial Instruments
Effective April 1, 2009, the Company adopted new accounting guidance requiring expanded disclosures about the fair value of financial instruments for interim reporting periods as well as in annual financial statements. See “Note 3 — Fair Value of Financial Instruments” for additional disclosures required by this guidance.
F-63
Table of Contents
NOTE 1 - Summary of Significant Accounting Policies-(Continued)
Financial Guarantee Insurance Contracts
Effective January 1, 2009, the Company adopted new accounting guidance regarding financial guarantee insurance contracts, including the recognition and measurement of premium revenue and claim liabilities. The guidance also requires expanded disclosures to include such items as a company’s method of tracking insured financial obligations with credit deterioration, financial information about the insured financial obligations, and management’s policies for placing and monitoring the insured financial obligations. The adoption of this guidance did not have an effect on the results of operations or financial position of the Company.
Accounting for Convertible Debt Instruments
Effective January 1, 2009, the Company adopted new accounting guidance related to the accounting and reporting of convertible debt. This guidance requires issuers of convertible debt instruments that may be settled in cash upon conversion to separately account for the liability and equity components in a manner that will reflect the entity’s nonconvertible debt borrowing rate when interest cost is recognized in subsequent periods. The adoption of this guidance did not have a material effect on the results of operations or financial position of the Company.
Useful Life of Intangible Assets
Effective January 1, 2009, the Company adopted new accounting guidance which requires companies estimating the useful life of a recognized intangible asset to consider their historical experience in renewing or extending similar arrangements or, in the absence of historical experience, to consider assumptions that market participants would use about renewal or extension. The adoption of this guidance did not have an effect on the results of operations or financial position of the Company.
Transfers of Financial Assets and Repurchase Financing Transactions
Effective January 1, 2009, the Company adopted new accounting guidance which presumes that an initial transfer of a financial asset and a repurchase financing are considered part of the same arrangement unless four conditions are all met. Transactions that meet all four criteria are accounted for separately from repurchase financings. The adoption of this guidance did not have an effect on the results of operations or financial position of the Company.
F-64
Table of Contents
Net Investment Income
The components of net investment income for the following periods were:
| Year Ended December 31, | |||||||||
| 2009 | 2008 | 2007 | |||||||
| Fixed maturities |
$ | 240,429 | $ | 220,520 | $ | 213,426 | |||
| Equity securities |
5,569 | 6,327 | 3,410 | ||||||
| Short-term and other investments |
7,598 | 9,017 | 11,370 | ||||||
| Total investment income |
253,596 | 235,864 | 228,206 | ||||||
| Less investment expenses |
6,762 | 5,595 | 4,444 | ||||||
| Net investment income |
$ | 246,834 | $ | 230,269 | $ | 223,762 | |||
Realized Investment Gains (Losses)
Realized investment gains (losses) for the following periods were:
| Year Ended December 31, | ||||||||||||
| 2009 | 2008 | 2007 | ||||||||||
| Fixed maturities |
$ | 38,707 | $ | (44,991 | ) | $ | (2,441 | ) | ||||
| Equity securities |
(11,197 | ) | (16,879 | ) | (1,012 | ) | ||||||
| Short-term and other investments |
(1,200 | ) | (1,989 | ) | 35 | |||||||
| Realized investment gains (losses) |
$ | 26,310 | $ | (63,859 | ) | $ | (3,418 | ) | ||||
The Company, from time to time, sells invested assets subsequent to the balance sheet date that were considered temporarily impaired at the balance sheet date. Such sales are generally due to events occurring subsequent to the balance sheet date that result in a change in the Company’s intent or ability to hold an invested asset. The types of events that may result in a sale include significant changes in the economic facts and circumstances related to the invested asset, significant unforeseen changes in liquidity needs, or changes in the Company’s investment strategy.
In 2009, the Company’s net realized investment gains of $26,310 included $56,476 of realized gains on security sales and calls partially offset by other-than-temporary impairment losses on securities recognized in earnings of $30,166. These impairment losses were comprised of $21,294 of impairment write-downs and $8,872 of realized impairment losses on securities that were disposed of during 2009.
In the fourth quarter of 2009, pretax net realized investment gains of $4,652 included (1) a $194 credit-related impairment write-down related to one issuer and (2) $2,326 of realized impairment losses on securities that were disposed of during the quarter. The impairment amounts were more than offset by $5,746 of realized gains on other security disposals, including $1,395 of realized gains on previously impaired securities that were disposed of during the quarter — primarily financial sector securities, and $1,426 of litigation proceeds on debt securities.
In the third quarter of 2009, pretax net realized investment gains of $11,410 included (1) $1,290 of impairment write-downs attributable to three issuers and (2) $518 of realized losses on securities that were disposed of during the quarter. The impairment amounts were more than offset by $13,218 of realized gains on other security disposals.
F-65
Table of Contents
NOTE 2 - Investments-(Continued)
In the second quarter of 2009, pretax net realized investment gains were $11,095, which included (1) $3,355 of credit related impairment write-downs, primarily related to a collateralized debt obligation security, (2) $597 of impairment write-downs on equity securities and securities the Company intended to sell, and (3) $4,134 of realized losses on securities that were disposed of during the quarter, primarily financial institution and telecommunications sector securities. The impairment amounts were largely offset by $6,099 of realized gains on previously impaired securities that were disposed of during the quarter, primarily financial sector securities. In addition, the second quarter reflected $13,082 of realized gains on other security disposals.
In the first quarter of 2009, pretax net realized investment losses were $847, including $15,857 of impairment charges. These charges were comprised of $13,450 of impairment write-downs, primarily below investment grade perpetual preferred stocks, and $2,407 of impairments on securities that the Company no longer intended to hold until the value fully recovered, primarily high-yield bonds. In addition, the Company recorded $1,895 of realized losses on securities that were disposed of during the quarter, primarily high-yield investments. These losses were largely offset by $16,905 of realized gains on security disposals.
In 2008, the Company recorded a total of $53,080 of impairment write-downs — $5,772 in the three months ended December 31, 2008, $33,400 in the three months ended September 30, $11,170 in the three months ended June 30 and $2,738 in the three months ended March 31.
The fourth quarter 2008 write-downs were related primarily to high-yield and preferred stock investments that the Company no longer intended to hold for a period of time necessary to recover the decline in value, with the remainder related to securities for which impairment write-downs were previously recorded.
The third quarter 2008 write-downs included $23,706 related to fixed maturity security and preferred stock impairments for which the issuer’s ability to pay future interest and principal based upon contractual terms has been compromised — namely, Lehman Brothers Holdings, Inc., the Federal National Mortgage Association, the Federal Home Loan Mortgage Corporation, and American International Group, Inc. The remaining amount of write-downs — primarily of financial institution securities and high yield bonds — was primarily attributable to the Company no longer having the intent to hold the securities for a period of time necessary to recover the decline in value.
The second quarter 2008 write-downs were primarily related to 2 collateralized debt obligation securities and 5 equity securities, including 4 financial industry preferred stock issues.
The first quarter 2008 write-downs were primarily related to certain below investment grade fixed maturity securities, with $2,291 of the write-downs attributable to 6 securities of telecommunications and telecommunications-related media issuers, which at March 31, 2008 the Company no longer intended to hold until the value fully recovered. In addition, net realized losses in 2008 included $23,084 of realized other-than-temporary impairment losses, primarily on financial institution and below investment grade fixed maturity securities, that were disposed of during the period.
F-66
Table of Contents
NOTE 2 - Investments-(Continued)
In 2007, the Company recorded investment impairment charges of $8,471. In the three months ended December 31, 2007, $5,867 of impairment charges were recorded for the fixed maturity securities portfolio as follows: $3,778 from one sub-prime residential mortgage-backed security, $1,082 from preferred stocks and $1,007 from corporate high-yield bonds. Certain of these securities were subsequently sold in January 2008. In the three months ended September 30, 2007, the Company recorded impairment charges of $285 from the paper sector of its fixed maturity securities portfolio, and certain of these securities were subsequently sold in October 2007. In the three months ended June 30, 2007, the Company recorded impairment charges of $2,319 from the home builder sector of its fixed maturity securities portfolio, and these securities were subsequently sold in July 2007. There were no other impairment charges recorded in 2007.
Fixed Maturity Securities (“fixed maturities”) and Equity Securities
The following table presents the fair value and gross unrealized losses of fixed maturity securities and equity securities in an unrealized loss position at December 31, 2009 and 2008, respectively. The Company views the decrease in value of all of the securities with unrealized losses at December 31, 2009 — which has been driven largely by spread widening, market illiquidity and changes in interest rates from the date of acquisition — as temporary. For debt securities, management does not have the intent to sell the securities and it is not more likely than not the Company will be required to sell the securities before the anticipated recovery in fair value or maturity. In addition, management expects to recover the entire cost basis of the debt securities. For equity securities, the Company has the ability and intent to hold the securities for the recovery of cost within a reasonable period of time. Therefore, no impairment of these securities was recorded at December 31, 2009.
| 12 months or less | More than 12 months | Total | ||||||||||||||||
| Fair Value | Unrealized Losses |
Fair Value | Unrealized Losses |
Fair Value | Unrealized Losses | |||||||||||||
| As of December 31, 2009 |
||||||||||||||||||
| Fixed maturity securities |
||||||||||||||||||
| U.S. government and federally sponsored agency obligations |
||||||||||||||||||
| Mortgage-backed securities |
$ | 78,577 | $ | 604 | $ | 2,399 | $ | 69 | $ | 80,976 | $ | 673 | ||||||
| Other |
311,917 | 14,674 | — | — | 311,917 | 14,674 | ||||||||||||
| Municipal bonds |
235,320 | 5,420 | 52,289 | 4,301 | 287,609 | 9,721 | ||||||||||||
| Foreign government bonds |
12,665 | 413 | — | — | 12,665 | 413 | ||||||||||||
| Corporate bonds |
158,749 | 4,708 | 272,673 | 25,856 | 431,422 | 30,564 | ||||||||||||
| Other mortgage-backed securities |
88,325 | 5,856 | 181,797 | 74,122 | 270,122 | 79,978 | ||||||||||||
| Totals |
$ | 885,553 | $ | 31,675 | $ | 509,158 | $ | 104,348 | $ | 1,394,711 | $ | 136,023 | ||||||
| Equity securities |
$ | 3,836 | $ | 932 | $ | 28,168 | $ | 4,834 | $ | 32,004 | $ | 5,766 | ||||||
| As of December 31, 2008 |
||||||||||||||||||
| Fixed maturity securities |
||||||||||||||||||
| U.S. government and federally sponsored agency obligations |
||||||||||||||||||
| Mortgage-backed securities |
$ | 37,982 | $ | 212 | $ | 6,780 | $ | 135 | $ | 44,762 | $ | 347 | ||||||
| Other |
2,317 | 83 | — | — | 2,317 | 83 | ||||||||||||
| Municipal bonds |
165,004 | 9,140 | 101,890 | 13,577 | 266,894 | 22,717 | ||||||||||||
| Foreign government bonds |
3,996 | 188 | — | — | 3,996 | 188 | ||||||||||||
| Corporate bonds |
739,703 | 115,299 | 456,149 | 103,317 | 1,195,852 | 218,616 | ||||||||||||
| Other mortgage-backed securities |
167,567 | 58,340 | 70,776 | 70,115 | 238,343 | 128,455 | ||||||||||||
| Totals |
$ | 1,116,569 | $ | 183,262 | $ | 635,595 | $ | 187,144 | $ | 1,752,164 | $ | 370,406 | ||||||
| Equity securities |
$ | 22,880 | $ | 9,263 | $ | 23,250 | $ | 15,947 | $ | 46,130 | $ | 25,210 | ||||||
F-67
Table of Contents
NOTE 2 - Investments-(Continued)
At December 31, 2009, the gross unrealized loss position in the fixed maturity and equity securities portfolio was $141,789 (480 positions and 3% of the portfolio). Fixed maturity and equity securities with an investment grade rating represented 76% of the unrealized loss. The largest single unrealized loss was $4,316 on a commercial mortgage-backed security issued by Bear Stearns in 2005. The fixed maturity and equity securities portfolio included 289 securities that have been in an unrealized loss position for greater than 12 months, with an unrealized loss totaling $109,182. With respect to fixed income securities involving securitized financial assets, the underlying collateral cash flows were stress tested to determine there was no adverse change in the expected cash flows.
The amortized cost, unrealized investment gains and losses, fair values and other-than-temporary impairment (“OTTI”) included in accumulated other comprehensive income (loss) (“AOCI”) of all fixed maturities and equity securities in the portfolio as of December 31, 2009 and 2008 were as follows:
| Amortized Cost |
Unrealized Gains |
Unrealized Losses |
Fair Value | OTTI in AOCI (2) |
||||||||||||
| As of December 31, 2009 |
||||||||||||||||
| Fixed maturity securities |
||||||||||||||||
| U.S. government and federally sponsored agency obligations (1) |
||||||||||||||||
| Mortgage-backed securities |
$ | 436,856 | $ | 18,942 | $ | 673 | $ | 455,125 | ||||||||
| Other |
360,977 | 847 | 14,674 | 347,150 | ||||||||||||
| Municipal bonds |
891,174 | 32,496 | 9,721 | 913,949 | ||||||||||||
| Foreign government bonds |
39,931 | 2,424 | 413 | 41,942 | ||||||||||||
| Corporate bonds |
1,766,835 | 102,270 | 30,564 | 1,838,541 | ||||||||||||
| Other mortgage-backed securities |
566,247 | 16,889 | 79,978 | 503,158 | $ | (476 | ) | |||||||||
| Totals |
$ | 4,062,020 | $ | 173,868 | $ | 136,023 | $ | 4,099,865 | $ | (476 | ) | |||||
| Equity securities |
$ | 61,507 | $ | 3,937 | $ | 5,766 | $ | 59,678 | ||||||||
| As of December 31, 2008 |
||||||||||||||||
| Fixed maturity securities |
||||||||||||||||
| U.S. government and federally sponsored agency obligations (1) |
||||||||||||||||
| Mortgage-backed securities |
$ | 828,907 | $ | 20,886 | $ | 347 | $ | 849,446 | ||||||||
| Other |
134,161 | 4,933 | 83 | 139,011 | ||||||||||||
| Municipal bonds |
507,466 | 8,591 | 22,717 | 493,340 | ||||||||||||
| Foreign government bonds |
14,380 | 716 | 188 | 14,908 | ||||||||||||
| Corporate bonds |
1,830,684 | 22,890 | 218,616 | 1,634,958 | ||||||||||||
| Other mortgage-backed securities |
472,259 | 9,794 | 128,455 | 353,598 | ||||||||||||
| Totals |
$ | 3,787,857 | $ | 67,810 | $ | 370,406 | $ | 3,485,261 | ||||||||
| Equity securities |
$ | 86,184 | $ | 595 | $ | 25,210 | $ | 61,569 | ||||||||
| (1) | Fair value includes securities issued by Federal National Mortgage Association (“FNMA”) of $360,026 and $494,604; Federal Home Loan Mortgage Association (“FHLMA”) of $330,279 and $390,217; and Government National Mortgage Association (“GNMA”) of $41,508 and $35,778 as of December 31, 2009 and 2008, respectively. |
| (2) | Represents the amount of other-than-temporary impairment losses in AOCI which, beginning April 1, 2009, was not included in earnings under current accounting guidance. |
The Company’s investment portfolio includes no derivative financial instruments (futures, forwards, swaps, option contracts or other financial instruments with similar characteristics).
F-68
Table of Contents
NOTE 2 - Investments-(Continued)
Credit Losses
The following table summarizes the cumulative amounts related to the Company’s credit loss component of the other-than-temporary impairment losses on fixed maturity securities held as of December 31, 2009 that the Company does not intend to sell, and it is not more likely than not that the Company will be required to sell the securities before the anticipated recovery in fair value or maturity, for which a portion of the other-than-temporary impairment losses were recognized in other comprehensive income:
| Period Ended December 31, 2009 (2) | |||
| Cumulative credit loss (1) |
|||
| Beginning of period |
$ | — | |
| New credit losses |
3,355 | ||
| Losses related to securities sold or paid down during the period |
480 | ||
| End of period |
$ | 2,875 | |
| (1) | The cumulative credit loss amounts exclude other-than-temporary impairment losses on securities held as of the periods indicated that the Company intended to sell or it was more likely than not that the Company would be required to sell the security before the recovery of fair value or maturity. |
| (2) | Effective April 1, 2009, the Company prospectively adopted the required accounting guidance regarding credit loss disclosures. |
Maturities/Sales Of Investments
The following table presents the distribution of the Company’s fixed maturity securities portfolio by estimated expected maturity. Estimated expected maturities differ from contractual maturities, reflecting assumptions regarding borrowers’ utilization of the right to call or prepay obligations with or without call or prepayment penalties. For structured securities, including mortgage-backed securities and other asset-backed securities, estimated expected maturities consider broker dealer survey prepayment assumptions and are verified for consistency with the interest rate and economic environments.
| December 31, 2009 | |||||||||
| Amortized Cost |
Fair Value |
Percent of Total Fair Value |
|||||||
| Due in 1 year or less |
$ | 195,502 | $ | 197,323 | 4.8 | % | |||
| Due after 1 year through 5 years |
830,168 | 837,903 | 20.4 | ||||||
| Due after 5 years through 10 years |
1,257,514 | 1,269,230 | 31.1 | ||||||
| Due after 10 years through 20 years |
611,029 | 616,722 | 15.0 | ||||||
| Due after 20 years |
1,167,807 | 1,178,687 | 28.7 | ||||||
| Total |
$ | 4,062,020 | $ | 4,099,865 | 100.0 | % | |||
The average option-adjusted duration for the Company’s fixed maturity securities was 6.8 years at December 31, 2009.
F-69
Table of Contents
NOTE 2 - Investments-(Continued)
Proceeds from sales of fixed maturities, determined using the specific identification method, and gross gains and gross losses realized as a result of those sales for each year were:
| Year Ended December 31, | ||||||||||||
| 2009 | 2008 | 2007 | ||||||||||
| Proceeds |
$ | 1,445,053 | $ | 597,666 | $ | 776,421 | ||||||
| Gross gains realized |
53,865 | 10,471 | 12,630 | |||||||||
| Gross losses realized |
(8,648 | ) | (23,084 | ) | (10,589 | ) | ||||||
Unrealized Gains and Losses on Fixed Maturities and Equity Securities
Net unrealized gains and losses are computed as the difference between fair value and amortized cost for fixed maturities or cost for equity securities. The following table reconciles the net unrealized investment gains and losses, net of tax, included in accumulated other comprehensive income (loss), before the valuation impact on deferred policy acquisition costs:
| Year Ended December 31, | ||||||||||||
| 2009 | 2008 | 2007 | ||||||||||
| Net unrealized investment gains (losses) on fixed maturity securities, net of tax |
||||||||||||
| Beginning of period |
$ | (196,687 | ) | $ | 1,779 | $ | 11,703 | |||||
| Effect of change in accounting principles |
— | — | — | |||||||||
| Change in unrealized investment gains (losses) |
196,126 | (169,222 | ) | (8,337 | ) | |||||||
| Reclassification of realized investment (gains) losses to net income |
25,160 | (29,244 | ) | (1,587 | ) | |||||||
| End of period |
$ | 24,599 | $ | (196,687 | ) | $ | 1,779 | |||||
| Net unrealized investment gains (losses) on equity securities, net of tax |
||||||||||||
| Beginning of period |
$ | (16,000 | ) | $ | (4,898 | ) | $ | 656 | ||||
| Effect of change in accounting principles |
— | — | — | |||||||||
| Change in unrealized investment gains (losses) |
22,088 | (131 | ) | (4,896 | ) | |||||||
| Reclassification of realized investment (gains) losses to net income |
(7,277 | ) | (10,971 | ) | (658 | ) | ||||||
| End of period |
$ | (1,189 | ) | $ | (16,000 | ) | $ | (4,898 | ) | |||
Securities Lending
The Company loans fixed income securities to third parties, primarily major brokerage firms; however, the Company’s securities lending program is suspended as of December 31, 2009 and the time of this Annual Report on Form 10-K. As of December 31, 2009 and 2008, there were no fixed maturities on loan. Loans of securities are required at all times to be secured by collateral from borrowers at least equal to 102% of the fair value of the securities loaned. The Company maintains effective control over the loaned securities and therefore reports them as Fixed Maturity Securities in the Consolidated Balance Sheets. Securities lending collateral is classified as short-term investments with a corresponding liability in the Company’s Consolidated Balance Sheets.
Investment in Entities Exceeding 10% of Shareholders’ Equity
At December 31, 2009 and 2008, there were no investments which exceeded 10% of total shareholders’ equity in entities other than obligations of the U.S. Government and federally sponsored government agencies and authorities.
F-70
Table of Contents
NOTE 2 - Investments-(Continued)
Deposits
At December 31, 2009, securities with a carrying value of $19,061 were on deposit with governmental agencies as required by law in various states in which the insurance subsidiaries of HMEC conduct business.
NOTE 3 - Fair Value of Financial Instruments
The Company is required under GAAP to disclose estimated fair values for certain financial and non-financial assets and liabilities. Fair values of the Company’s insurance contracts other than annuity contracts are not required to be disclosed. However, the estimated fair values of liabilities under all insurance contracts are taken into consideration in the Company’s overall management of interest rate risk through the matching of investment maturities with amounts due under insurance contracts. Effective January 1, 2008, the Company adopted the prescribed framework for measuring fair value in accordance with GAAP; however, the effective date for applying the framework to nonfinancial assets and nonfinancial liabilities that are not presented at fair value in the consolidated financial statements on a recurring basis was deferred for one year. Effective January 1, 2009, the Company adopted the fair value disclosure requirements for these nonfinancial assets and nonfinancial liabilities.
F-71
Table of Contents
NOTE 3 - Fair Value of Financial Instruments-(Continued)
Fair value is defined as the exchange price that would be received for an asset or paid to transfer a liability (an exit price) in the principal or most advantageous market for the asset or liability in an orderly transaction between market participants on the measurement date. In determining fair value, the Company utilizes valuation techniques that maximize the use of observable inputs and minimize the use of unobservable inputs. The Company categorizes its financial and non-financial assets and liabilities into a three-level hierarchy based on the priority of the inputs to the valuation technique. The three levels of inputs that may be used to measure fair value are:
| Level 1 | Unadjusted quoted prices in active markets for identical assets or liabilities. Level 1 assets and liabilities include debt and equity securities (both common stock and preferred stock) that are traded in an active exchange market, as well as U.S. Treasury securities. | |
| Level 2 | Unadjusted observable inputs other than Level 1 prices such as quoted prices for similar assets or liabilities; quoted prices in markets that are not active; or other inputs that are observable or can be corroborated by observable market data for the assets or liabilities. Level 2 assets and liabilities include debt securities with quoted prices that are traded less frequently than exchange-traded instruments. This category generally includes certain U.S. Government and agency mortgage-backed debt securities, non-agency structured securities, corporate debt securities and preferred stocks. | |
| Level 3 | Unobservable inputs that are supported by little or no market activity and that are significant to the fair value of the assets or liabilities. Level 3 assets and liabilities include financial instruments whose value is determined using pricing models, discounted cash flow methodologies, or similar techniques, as well as instruments for which the determination of fair value requires significant management judgment or estimation. This category generally includes certain private debt and equity investments. | |
When the inputs used to measure fair value fall within different levels of the hierarchy, the level within which the fair value measurement is categorized is based on the lowest level input that is significant to the fair value measurement in its entirety. As a result, a Level 3 fair value measurement may include inputs that are observable (Level 1 or Level 2) and unobservable (Level 3). Net transfers into or out of Level 3 are reported as having occurred at the end of the reporting period in which the transfers were determined.
The following discussion describes the valuation methodologies used for financial assets and financial liabilities measured at fair value. The techniques utilized in estimating the fair values are affected by the assumptions used, including discount rates and estimates of the amount and timing of future cash flows. The use of different methodologies, assumptions and inputs may have a material effect on the estimated fair values of the Company’s securities holdings. Care should be exercised in deriving conclusions about the Company’s business, its value or financial position based on the fair value information of financial and nonfinancial assets and liabilities presented below.
F-72
Table of Contents
NOTE 3 - Fair Value of Financial Instruments-(Continued)
Fair value estimates are made at a specific point in time, based on available market information and judgments about the financial asset or financial liability, including estimates of timing, amount of expected future cash flows and the credit standing of the issuer. In some cases, the fair value estimates cannot be substantiated by comparison to independent markets. In addition, the disclosed fair value may not be realized in the immediate settlement of the financial asset or financial liability. The disclosed fair values do not reflect any premium or discount that could result from offering for sale at one time an entire holding of a particular financial asset or financial liability. In periods of market disruption, the ability to observe prices and inputs may be reduced for many instruments. This condition could cause an instrument to be reclassified from Level 1 to Level 2 or from Level 2 to Level 3. Potential taxes and other expenses that would be incurred in an actual sale or settlement are not reflected in amounts disclosed.
Investments
For fixed maturity securities, each month the Company receives prices from its custodian bank and investment manager. Fair values for the Company’s fixed maturity securities are based on prices provided by its investment manager. The prices from the custodian bank are compared to prices from the investment manager. Differences in prices between the sources that the Company considers significant are researched and the Company utilizes the price that it considers most representative of an exit price. Both the investment managers and the custodian bank use a variety of independent, nationally recognized pricing sources to determine market valuations. Each designate specific pricing services or indexes for each sector of the market based upon the provider’s expertise. Typical inputs used by these pricing sources include, but are not limited to, reported trades, benchmark yields, issuer spreads, bids, offers, and/or estimated cash flows and prepayment speeds. When the pricing sources cannot provide fair value determinations, the Company obtains non-binding price quotes from broker-dealers. The broker-dealers’ valuation methodology is sometimes matrix-based, using indicative evaluation measures and adjustments for specific security characteristics and market sentiment. The Company analyzes price and market valuations received to verify reasonableness, to understand the key assumptions used and their sources, to conclude the prices obtained are appropriate, and to determine an appropriate fair value hierarchy level based upon trading activity and the observability of market inputs. Based on this evaluation and investment class analysis, each price is classified into Level 1, 2, or 3. The Company has in place certain control processes to determine the reasonableness of the financial asset fair values. These processes are designed to ensure the values received are accurately recorded and that the data inputs and valuation techniques utilized are appropriate, consistently applied, and that the assumptions are reasonable and consistent with the objective of determining fair value. For example, on a continuing basis, the Company assesses the reasonableness of individual security values received from pricing sources that vary from certain thresholds. Historically, the control processes have not resulted in adjustments to the valuations provided by pricing sources. The Company’s fixed maturity securities portfolio is primarily publicly traded, which allows for a high percentage of the portfolio to be priced through pricing services. Approximately 93% of the portfolio was priced through pricing services or index priced as of December 31, 2009. The remainder of the portfolio was priced by broker-dealers, and these inputs were generally Level 2. There were no significant changes to the valuation process during 2009.
F-73
Table of Contents
NOTE 3 - Fair Value of Financial Instruments-(Continued)
Fair values of equity securities have been determined by the Company from observable market quotations, when available. Private placement securities and equity securities where a public quotation is not available are valued by using non-binding broker quotes or through the use of internal models or analysis. These inputs are based on assumptions deemed appropriate given the circumstances and are believed to be consistent with what other market participants would use when pricing such securities.
Short-term and other investments are comprised of policy loans, short-term fixed income securities and mortgage loans. The fair value of policy loans is based on estimates using discounted cash flow analysis and current interest rates being offered for new loans. For short-term fixed income securities, because of the nature of these assets, carrying amounts approximate fair values, which have been determined from public quotations, when available. The fair value of mortgage loans is estimated by discounting the future cash flows using the current rates at which similar loans would be made to borrowers with similar credit ratings and the same remaining maturities.
Separate Account Assets
Separate Account assets are carried at fair value and represent variable annuity contractholder funds invested in various mutual funds. Fair values of these assets are based on public quotations. Investment performance related to Separate Account assets is fully offset by corresponding amounts credited to contractholders with the liability reflected within Separate Account liabilities. Separate Account liabilities are equal to the estimated fair value of Separate Account assets.
Annuity Contract Liabilities and Policyholder Account Balances on Interest-sensitive Life Contracts
The fair values of annuity contract liabilities and policyholder account balances on interest-sensitive life contracts are equal to the discounted estimated future cash flows (using the Company’s current interest rates for similar products including consideration of minimum guaranteed interest rates). The Company carries these financial liabilities at cost.
Other Policyholder Funds
Other policyholder funds are liabilities related to supplementary contracts without life contingencies and dividend accumulations, which represent deposits that do not have defined maturities. Other policyholder funds are carried at cost, which management believes is a reasonable estimate of fair value due to the relatively short duration of these deposits, based on the Company’s past experience.
Short-term Debt
Short-term debt is carried at amortized cost, which management believes is a reasonable estimate of fair value due to the liquidity and short duration of these instruments.
Long-term Debt
The Company carries long-term debt at amortized cost. The fair value of long-term debt is estimated based on unadjusted quoted market prices of identical publicly traded issues.
F-74
Table of Contents
NOTE 3 - Fair Value of Financial Instruments-(Continued)
The following table presents the Company’s fair value hierarchy for those assets and liabilities measured at fair value on a recurring and nonrecurring basis as of December 31, 2009. At December 31, 2009, Level 3 invested assets comprised approximately 0.2% of the Company’s total investment portfolio fair value.
| Carrying Amount |
Fair Value |
Fair Value Measurements at Reporting Date Using (1) | |||||||||||||
| Level 1 | Level 2 | Level 3 | |||||||||||||
| December 31, 2009 |
|||||||||||||||
| Financial Assets |
|||||||||||||||
| Investments |
|||||||||||||||
| Fixed maturities |
|||||||||||||||
| U.S. government and federally sponsored agency obligations |
|||||||||||||||
| Mortgage-backed securities |
$ | 455,125 | $ | 455,125 | $ | — | $ | 455,125 | $ | — | |||||
| Other |
347,150 | 347,150 | 12,472 | 334,678 | — | ||||||||||
| Municipal bonds |
913,949 | 913,949 | — | 913,949 | — | ||||||||||
| Foreign government bonds |
41,942 | 41,942 | — | 41,942 | — | ||||||||||
| Corporate bonds |
1,838,541 | 1,838,541 | 42,364 | 1,793,738 | 2,439 | ||||||||||
| Other mortgage-backed securities |
503,158 | 503,158 | — | 495,298 | 7,860 | ||||||||||
| Totals |
4,099,865 | 4,099,865 | 54,836 | 4,034,730 | 10,299 | ||||||||||
| Equity securities |
59,678 | 59,678 | 28,917 | 30,222 | 539 | ||||||||||
| Short-term and other investments (2) |
415,081 | 396,344 | 299,109 | — | — | ||||||||||
| Total investments |
4,574,624 | 4,555,887 | 382,862 | 4,064,952 | 10,838 | ||||||||||
| Separate Account (variable annuity) assets |
1,226,430 | 1,226,430 | — | 1,226,430 | — | ||||||||||
| Financial Liabilities |
|||||||||||||||
| Policyholder account balances on interest-sensitive life contracts |
79,688 | 71,766 | |||||||||||||
| Annuity contract liabilities |
2,367,170 | 2,084,267 | |||||||||||||
| Other policyholder funds |
117,349 | 117,349 | |||||||||||||
| Short-term debt |
38,000 | 38,000 | |||||||||||||
| Long-term debt |
199,614 | 199,545 | |||||||||||||
| December 31, 2008 |
|||||||||||||||
| Financial Assets |
|||||||||||||||
| Investments |
|||||||||||||||
| Fixed maturities (3) |
$ | 3,485,261 | $ | 3,485,261 | $ | 49,101 | $ | 3,405,721 | $ | 30,439 | |||||
| Equity securities |
61,569 | 61,569 | 31,675 | 29,439 | 455 | ||||||||||
| Short-term and other investments (2) |
354,925 | 358,510 | 244,579 | 1,097 | — | ||||||||||
| Total investments |
3,901,755 | 3,905,340 | 325,355 | 3,436,257 | 30,894 | ||||||||||
| Separate Account (variable annuity) assets |
965,217 | 965,217 | — | 965,217 | — | ||||||||||
| Financial Liabilities |
|||||||||||||||
| Policyholder account balances on interest-sensitive life contracts |
80,250 | 70,580 | |||||||||||||
| Annuity contract liabilities |
2,166,518 | 1,877,400 | |||||||||||||
| Other policyholder funds |
128,359 | 128,359 | |||||||||||||
| Short-term debt |
38,000 | 38,000 | |||||||||||||
| Long-term debt |
199,549 | 189,480 | |||||||||||||
| (1) | This information is not required for financial and nonfinancial assets and liabilities not recognized at fair value in the consolidated balance sheets. |
| (2) | Fair value of “Short-term and other investments” includes investments, primarily policy loans, for which inputs to fair value measurements are not required. Inputs to fair value measurements are provided only for those investments carried at fair value. |
| (3) | At December 31, 2008, disclosure by major classification for investments was not required. |
F-75
Table of Contents
NOTE 3 - Fair Value of Financial Instruments-(Continued)
The following table presents a reconciliation for all Level 3 assets measured at fair value on a recurring basis.
| Fixed Maturities |
Equity Securities |
Total | ||||||||||
| Financial Assets |
||||||||||||
| Beginning balance, January 1, 2009 |
$ | 30,439 | $ | 455 | $ | 30,894 | ||||||
| Net realized gains (losses) included in net income |
(4,624 | ) | — | (4,624 | ) | |||||||
| Net unrealized gains (losses) included in other comprehensive income |
(2,748 | ) | 84 | (2,664 | ) | |||||||
| Paydowns and maturities |
(2,657 | ) | — | (2,657 | ) | |||||||
| Purchases, sales, issuances and settlements |
(7,436 | ) | — | (7,436 | ) | |||||||
| Transfers in (out) of Level 3 (1) |
(2,675 | ) | — | (2,675 | ) | |||||||
| Ending balance, December 31, 2009 |
$ | 10,299 | $ | 539 | $ | 10,838 | ||||||
| Beginning balance, January 1, 2008 |
$ | 688 | $ | 457 | $ | 1,145 | ||||||
| Net unrealized gains (losses) included in other comprehensive income |
2 | (2 | ) | — | ||||||||
| Paydowns and maturities |
(598 | ) | — | (598 | ) | |||||||
| Purchases, sales, issuances and settlements |
— | — | — | |||||||||
| Transfers in (out) of Level 3 (1) |
30,347 | — | 30,347 | |||||||||
| Ending balance, December 31, 2008 |
$ | 30,439 | $ | 455 | $ | 30,894 | ||||||
| (1) | Transfers into and out of Level 3 during the periods ended December 31, 2009 and 2008 were attributable to a change in the availability of observable market information for individual fixed maturity securities. |
At December 31, 2009 and 2008, there were no realized gains or losses, attributable to the change in unrealized gains or losses, included in earnings that were attributable to Level 3 assets still held.
F-76
Table of Contents
NOTE 4 - Property and Casualty Unpaid Claims and Claim Expenses
The following table sets forth an analysis of property and casualty unpaid claims and claim expenses and provides a reconciliation of beginning and ending reserves for the periods indicated.
| Year Ended December 31, | ||||||||||||
| 2009 | 2008 | 2007 | ||||||||||
| Gross reserves, beginning of year (1) |
$ | 297,758 | $ | 306,190 | $ | 317,730 | ||||||
| Less reinsurance recoverables |
14,793 | 15,930 | 22,352 | |||||||||
| Net reserves, beginning of year (2) |
282,965 | 290,260 | 295,378 | |||||||||
| Incurred claims and claim expenses: |
||||||||||||
| Claims occurring in the current year |
418,803 | 434,206 | 380,399 | |||||||||
| Decrease in estimated reserves for claims occurring in prior years (3) |
(11,727 | ) | (18,100 | ) | (19,968 | ) | ||||||
| Total claims and claim expenses incurred (4) |
407,076 | 416,106 | 360,431 | |||||||||
| Claims and claim expense payments for claims occurring during: |
||||||||||||
| Current year |
265,561 | 289,341 | 236,176 | |||||||||
| Prior years |
139,274 | 134,060 | 129,373 | |||||||||
| Total claims and claim expense payments |
404,835 | 423,401 | 365,549 | |||||||||
| Net reserves, end of year (2) |
285,206 | 282,965 | 290,260 | |||||||||
| Plus reinsurance recoverables |
15,769 | 14,793 | 15,930 | |||||||||
| Gross reserves, end of year (1) |
$ | 300,975 | $ | 297,758 | $ | 306,190 | ||||||
| (1) | Unpaid claims and claim expenses as reported in the Consolidated Balance Sheets also include life, annuity, and group accident and health reserves of $11,763, $13,485, $9,192 and $8,931 at December 31, 2009, 2008, 2007 and 2006, respectively, in addition to property and casualty reserves. |
| (2) | Reserves net of anticipated reinsurance recoverables. |
| (3) | Shows the amounts by which the Company decreased its reserves in each of the periods indicated for claims occurring in previous periods to reflect subsequent information on such claims and changes in their projected final settlement costs. Also refer to the paragraphs below for additional information regarding the reserve development recorded in 2009, 2008 and 2007. |
| (4) | Benefits, claims and settlement expenses as reported in the Consolidated Statements of Operations also include life, annuity, and group accident and health amounts of $51,584, $55,426 and $48,059 for the years ended December 31, 2009, 2008 and 2007, respectively, in addition to the property and casualty amounts. |
Underwriting results of the property and casualty segment are significantly influenced by estimates of the Company’s ultimate liability for insured events. There is a high degree of uncertainty inherent in the estimates of ultimate losses underlying the liability for unpaid claims and claim settlement expenses. This inherent uncertainty is particularly significant for liability-related exposures due to the extended period, often many years, that transpires between a loss event, receipt of related claims data from policyholders and ultimate settlement of the claim. Reserves for property and casualty claims include provisions for payments to be made on reported claims (“case reserves”), claims incurred but not yet reported (“IBNR”) and associated settlement expenses (together, “loss reserves”). The process by which these reserves are established requires reliance upon estimates based on known facts and on interpretations of circumstances, including the Company’s experience with similar cases and historical trends involving claim payments and related patterns, pending levels of unpaid claims and product mix, as well as other factors including court decisions, economic conditions and public attitudes.
F-77
Table of Contents
NOTE 4 - Property and Casualty Unpaid Claims and Claim Expenses-(Continued)
The Company believes the property and casualty loss reserves are appropriately established based on available facts, laws, and regulations. The Company calculates and records a single best estimate of the reserve as of each balance sheet date, in conformity with generally accepted actuarial standards, for each line of business and its components (coverages and perils) for reported losses and for IBNR losses and as a result believes no other estimate is better than the recorded amount. Due to uncertainties involved, the ultimate cost of losses may vary materially from recorded amounts.
The Company continually updates loss estimates using both quantitative and qualitative information from its reserving actuaries and information derived from other sources. Adjustments may be required as information develops which varies from experience, or, in some cases, augments data which previously were not considered sufficient for use in determining liabilities. The effects of these adjustments may be significant and are charged or credited to income in the period in which the adjustments are made.
Numerous risk factors will affect more than one product line. One of these factors is changes in claim department practices, including claim closure rates, number of claims closed without payment, the use of third-party claims adjusters and the level of needed case reserve estimated by the adjuster. Other risk factors include changes in claim frequency, changes in claim severity, regulatory and legislative actions, court actions, changes in economic conditions and trends (e.g. medical costs, labor rates and the cost of materials), the occurrence of unusually large or frequent catastrophic loss events, timeliness of claim reporting, the state in which the claim occurred and degree of claimant fraud. The extent of the impact of a risk factor will also vary by coverages within a product line. Individual risk factors are also subject to interactions with other risk factors within product line coverages.
While all product lines are exposed to these risks, there are some loss types or product lines for which the financial effect will be more significant. For instance, the use of third-party adjusters for large catastrophe losses adds a level of risk to this loss type not present when employee adjusters handle claims. Also, given the relatively large proportion (approximately 70% at December 31, 2009) of the Company’s reserves that are in the longer-tail automobile liability coverages, regulatory and court actions and changes in economic conditions and trends could be expected to impact this product line more extensively than others.
Reserves are established for claims as they occur for each line of business based on estimates of the ultimate cost to settle the claims. The actual loss results are compared to prior estimates and differences are recorded as reestimates. The primary actuarial techniques (development of paid loss dollars, development of reported loss dollars, methods based on expected loss ratios and methods utilizing frequency and severity of claims) used to estimate reserves and provide for losses are applied to actual paid losses and reported losses (paid losses plus individual case reserves set by claim adjusters) for an accident year or a calendar year to create an estimate of how losses are likely to develop over time. An accident year refers to classifying claims based on the year in which the claim occurred. A calendar year refers to classifying claims based on the year in which the claims are reported. Both classifications are used to prepare estimates of required reserves for payments to be made in the future. For estimating short-tail coverage reserves (e.g. homeowners and automobile physical damage), which comprise approximately 30% of the Company’s total loss reserves at
F-78
Table of Contents
NOTE 4 - Property and Casualty Unpaid Claims and Claim Expenses-(Continued)
December 31, 2009, the primary actuarial technique utilized is the development of paid loss dollars due to the relatively quick claim settlement period. As it relates to estimating long-tail coverage reserves (e.g. automobile liability), which comprise approximately 70% of the Company’s total loss reserves at December 31, 2009, the primary actuarial technique utilized is the development of reported loss dollars due to the relatively long claim settlement period.
In all of the loss estimation techniques referred to above, a ratio (development factor) is calculated which compares current results to results in the prior period for each accident year. Various development factors, based on historical results, are multiplied by the current experience to estimate the development of losses of each accident year from the current time period into the next time period. The development factors for the next time period for each accident year are compounded over the remaining calendar years to calculate an estimate of ultimate losses for each accident year. Occasionally, unusual aberrations in loss patterns are caused by factors such as changes in claim reporting, settlement patterns, unusually large losses, process changes, legal or regulatory environment changes, and other influences. In these instances, analyses of alternate development factor selections are performed to evaluate the effect of these factors, and actuarial judgment is applied to make appropriate development factor assumptions needed to develop a best estimate of ultimate losses. Paid losses are then subtracted from estimated ultimate losses to determine the indicated loss reserves. The difference between indicated reserves and recorded reserves is the amount of reserve reestimate.
Reserves are reestimated quarterly. When new development factors are calculated from actual losses, and they differ from estimated development factors used in previous reserve estimates, assumptions about losses and required reserves are revised based on the new development factors. Changes to reserves are recorded in the period in which development factor changes result in reserve reestimates.
Numerous actuarial estimates of the types described above are prepared each quarter to monitor losses for each line of business and its components (coverages and perils) and for reported losses and IBNR. Often, several different estimates are prepared for each detailed component, incorporating alternative analyses of changing claim settlement patterns and other influences on losses, from which the Company selects the best estimate for each component, occasionally incorporating additional analyses and actuarial judgment, as described above. These estimates also incorporate the historical impact of inflation into reserve estimates, the implicit assumption being that a multi-year average development factor represents an adequate provision. Based on the Company’s review of these estimates, as well as the review of the independent reserve studies, the best estimate of required reserves for each line of business and its components (coverages and perils) is determined by management and is recorded for each accident year, and the required reserves for each component are summed to create the reserve balances carried on the Company’s Consolidated Balance Sheets.
F-79
Table of Contents
NOTE 4 - Property and Casualty Unpaid Claims and Claim Expenses-(Continued)
Based on the Company’s products and coverages, historical experience and modeling of various actuarial methodologies used to develop reserve estimates, the Company estimates that the potential variability of the property and casualty loss reserves within a reasonable probability of other possible outcomes may be approximately plus or minus 6% of reserves as of December 31, 2009, which equates to plus or minus approximately $12,000 of net income. Although this evaluation reflects the most likely outcomes, it is possible the final outcome may fall below or above these estimates.
Net favorable development of total reserves for property and casualty claims occurring in prior years was $11,727 in 2009, primarily the result of favorable frequency and severity trends in voluntary automobile loss and settlement expense emergence for accident years 2006 and prior. Net favorable development of total reserves for property and casualty claims occurring in prior years was $18,100 in 2008, primarily the result of favorable frequency and severity trends in voluntary automobile loss and loss settlement expense emergence for accident years 2005 and prior. In 2007, net favorable development of total reserves for property and casualty claims occurring in prior years was $19,968 reflecting the emergence of favorable voluntary automobile severity trends in accident years 2005 and prior and favorable frequency trends in homeowners for accident year 2006.
The Company completes a detailed study of property and casualty reserves based on information available at the end of each quarter and year. Trends of reported losses (paid amounts and case reserves on claims reported to the Company) for each accident year are reviewed and ultimate loss costs for those accident years are estimated. The Company engages an independent property and casualty actuarial consulting firm to prepare an independent study of the Company’s property and casualty reserves at December 31 of each year, supplemented by other analyses throughout the year. The result of the independent actuarial study at December 31, 2009 was consistent with management’s analyses and selected estimates and did not result in any adjustments to the Company’s recorded property and casualty reserves.
Based on an assessment of the relative weight given to emerging trends resulting from recent business process changes, pricing, underwriting and claims handling, at both December 31, 2009 and 2008 the Company recorded property and casualty reserves toward the higher end (upper quartile) of a reasonable range of reserve estimates, due primarily to reserves related to the automobile liability coverages.
At the time each of the reserve analyses were performed, the Company believed that each estimate was based upon sound and correct methodology and such methodology was appropriately applied and that there were no trends which indicated the likelihood of future loss reserve development. The financial impact of the net reserve development was therefore accounted for in the period that the development was determined.
No other adjustments were made in the determination of the liabilities during the periods covered by these consolidated financial statements. Management believes that, based on data currently available, it has reasonably estimated the Company’s ultimate losses.
F-80
Table of Contents
Indebtedness and scheduled maturities at December 31, 2009 and 2008 consisted of the following:
| Effective Interest Rates |
Final Maturity |
December 31, | |||||||||
| 2009 | 2008 | ||||||||||
| Short-term debt: |
|||||||||||
| Bank Credit Facility |
Variable | 2011 | $ | 38,000 | $ | 38,000 | |||||
| Long-term debt: |
|||||||||||
| 6.05% Senior Notes, Face amount of $75,000 less unaccrued discount of $145 and $172 |
6.1 | % | 2015 | 74,855 | 74,828 | ||||||
| 6.85% Senior Notes, Face amount of $125,000 less unaccrued discount of $241 and $279 |
6.9 | % | 2016 | 124,759 | 124,721 | ||||||
| Total |
$ | 237,614 | $ | 237,549 | |||||||
Credit Agreement with Financial Institutions (“Bank Credit Facility”)
On May 31, 2005, HMEC entered into a new Bank Credit Agreement (the “Current Bank Credit Facility”). As amended and restated on December 19, 2006, the Current Bank Credit Facility agreement provides for unsecured borrowings of up to $125,000 and expires on December 19, 2011. Interest accrues at varying spreads relative to corporate or Eurodollar base rates and is payable monthly or quarterly depending on the applicable base rate (London Interbank Offered Rate (“LIBOR”) plus 0.6%, or 0.9%, at December 31, 2009). The unused portion of the Current Bank Credit Facility is subject to a variable commitment fee, which was 0.125% on an annual basis at December 31, 2009.
6.05% Senior Notes due 2015 (“Senior Notes due 2015”)
On June 9, 2005, the Company issued $75,000 aggregate principal amount of 6.05% senior notes, which will mature on June 15, 2015, issued at a discount of 0.357% resulting in an effective yield of 6.098%. Interest on the Senior Notes due 2015 is payable semi-annually at a rate of 6.05%. The Senior Notes due 2015 are redeemable in whole or in part, at any time, at the Company’s option, at a redemption price equal to the greater of (1) 100% of the principal amount of the notes being redeemed or (2) the sum of the present values of the remaining scheduled payments of principal and interest thereon discounted, on a semi-annual basis, at the Treasury yield (as defined in the indenture) plus 30 basis points, plus, in either of the above cases, accrued interest to the date of redemption.
6.85% Senior Notes due 2016 (“Senior Notes due 2016”)
On April 21, 2006, the Company issued $125,000 aggregate principal amount of 6.85% senior notes, which will mature on April 15, 2016, issued at a discount of 0.305% resulting in an effective yield of 6.893%. Interest on the Senior Notes due 2016 is payable semi-annually at a rate of 6.85%. The Senior Notes due 2016 are redeemable in whole or in part, at any time, at the Company’s option, at a redemption price equal to the greater of (1) 100% of the principal amount of the notes being redeemed or (2) the sum of the present values of the remaining scheduled payments of principal and interest thereon discounted, on a semi-annual basis, at the Treasury yield (as defined in the indenture) plus 30 basis points, plus, in either of the above cases, accrued interest to the date of redemption.
F-81
Table of Contents
NOTE 5 - Debt-(Continued)
A portion of the net proceeds from the issuance of the Senior Notes due 2016 was used to redeem the remaining outstanding Senior Convertible Notes on May 14, 2007, as described below.
1.425% Senior Convertible Notes (“Senior Convertible Notes”)
On May 14, 2007, pursuant to provisions of the indenture, HMEC redeemed its remaining outstanding Senior Convertible Notes ($68,553 aggregate principal amount; $32,563 carrying value) at $475.00 per $1,000.00 principal amount. The $32,563 aggregate cost was funded with a portion of the remaining cash proceeds from HMEC’s April 2006 issuance of Senior Notes Due 2016. None of the Senior Convertible Notes were converted into shares of HMEC’s common stock. No early termination penalties were incurred as a result of this redemption. All of the Senior Convertible Notes have been canceled.
The redemption of the remaining outstanding Senior Convertible Notes on May 14, 2007 resulted in neither a gain nor a loss.
Universal Shelf Registration
To provide additional capital management flexibility, the Company filed a “universal shelf” registration on Form S-3 with the SEC in November 2008. The registration statement, which registers the offer and sale by the Company from time to time of up to $300,000 of various securities, which may include debt securities, common stock, preferred stock, depositary shares, warrants and/or delayed delivery contracts, was declared effective on January 7, 2009. Unless fully utilized or withdrawn by the Company earlier, this registration statement will remain effective through January 7, 2012. No securities associated with the registration statement have been issued as of the date of this Annual Report on Form 10-K.
Covenants
The Company is in compliance with all of the financial covenants contained in the Senior Notes due 2015 indenture, the Senior Notes due 2016 indenture and the Current Bank Credit Facility agreement, consisting primarily of relationships of (1) debt to capital, (2) insurance subsidiaries’ insurance financial strength ratings issued by A.M. Best Company, Inc. (“A.M. Best”) and (3) net worth, as defined in the financial covenants. For instance, compliance with the Current Bank Credit Facility agreement requires the Company’s insurance subsidiaries’ A.M. Best financial strength ratings to be at or above the “A-” rating assigned at the time of this Annual Report on Form 10-K. A lower rating would result in default under this agreement, which could adversely impact the Company’s liquidity, financial condition and results of operations.
F-82
Table of Contents
NOTE 6 - Shareholders’ Equity and Stock Options
Share Repurchase Program and Treasury Shares Held (Common Stock)
As disclosed in the Company’s Annual Report on Form 10-K for the year ended December 31, 2007, on September 12, 2007, the Company’s Board of Directors (“Board”) authorized a new share repurchase program allowing repurchases up to $50,000 and ended the May 1999 authorization. The new share repurchase program authorized the repurchase of common shares in open market or privately negotiated transactions, from time to time, depending on market conditions.
From September 12, 2007 through December 31, 2007, the Company repurchased 1,111,600 shares of its common stock, or 2.6% of the outstanding shares on December 31, 2006, at an aggregate cost of $20,748, or an average cost of $18.66 per share, under its new share repurchase program. From January 1, 2008 through February 19, 2008, the Company completed the new program by repurchasing an additional 1,626,776 shares of its common stock, or 3.9% of the outstanding shares on December 31, 2007. In total, 2,738,376 shares were repurchased under the $50,000 program at an average cost of $18.28 per share. The repurchase of shares was financed through use of cash.
On March 7, 2008, the Board authorized an additional $25,000 share repurchase program allowing for repurchase of common shares in open market or privately negotiated transactions, from time to time, depending on market conditions (the “March 2008 Program”). As of June 30, 2008, the Company completed the March 2008 Program resulting in a total of 1,571,449 shares of its common stock repurchased under this program at an average cost of $15.93 per share. Shares repurchased under the March 2008 Program represented 3.7% of the outstanding shares on December 31, 2007. The repurchase of shares was financed through use of cash.
At December 31, 2009, the Company held 21,813,196 shares in treasury. As of June 30, 2008, the Company had completed its authorized share repurchase programs.
Authorization of Preferred Stock
In 1996, the shareholders of HMEC approved authorization of 1,000,000 shares of $0.001 par value preferred stock. The Board of Directors is authorized to (1) direct the issuance of the preferred stock in one or more series, (2) fix the dividend rate, conversion or exchange rights, redemption price and liquidation preference, of any series of the preferred stock, (3) fix the number of shares for any series and (4) increase or decrease the number of shares of any series. No shares of preferred stock were outstanding at December 31, 2009 and 2008.
F-83
Table of Contents
NOTE 6 - Shareholders’ Equity and Stock Options-(Continued)
Director Stock Plan
In 1996, the shareholders of HMEC approved the Deferred Equity Compensation Plan (“Director Stock Plan”) for directors of the Company and reserved 600,000 shares for issuance pursuant to the Director Stock Plan. Shares of the Company’s common stock issued under the Director Stock Plan may be either authorized and unissued shares or shares that have been reacquired by the Company. As of December 31, 2009, 2008 and 2007, 231,824 units, 254,060 units and 227,757 units, respectively, were outstanding under this plan representing an equal number of common shares to be issued in the future. The outstanding units of currently serving directors accrue dividends at the same rate as dividends paid to HMEC’s shareholders; outstanding units of retired directors do not accrue dividends. These dividends are reinvested into additional common stock units.
Employee Stock Plan
In 1997, the Board of Directors of HMEC approved the Deferred Compensation Plan for Employees (“Employee Stock Plan”). Shares of the Company’s common stock issued under the Employee Stock Plan may be either authorized and unissued shares or shares that have been reacquired by the Company. As of December 31, 2009, 2008 and 2007, 191,081 units, 215,200 units and 219,030 units, respectively, were outstanding under this plan representing an equal number of common shares to be issued in the future. The Employee Stock Plan allows distributions to be either in common shares or cash. Through December 31, 2009, all distributions under the Employee Stock Plan have been in cash. The outstanding units accrue dividends at the same rate as dividends paid to HMEC’s shareholders. These dividends are reinvested into additional common stock units.
Stock Options and Restricted Common Stock Units
The shareholders of HMEC approved the 1991 Stock Incentive Plan (the “1991 Plan”), the 2001 Stock Incentive Plan (the “2001 Plan”), and the 2002 Incentive Compensation Plan and the Amended and Restated 2002 Incentive Compensation Plan (together, the “2002 Plan”) and reserved a total of 9,000,000 shares of common stock for issuance under these plans. Under the 1991 Plan, the 2001 Plan and the 2002 Plan, options to purchase shares of HMEC common stock may be granted to executive officers, other employees and directors. The options become exercisable in installments based on service generally beginning in the first year from the date of grant and generally become fully vested 4 to 5 years from the date of grant. The options generally expire 7 to 10 years from the date of grant. The exercise price of the option is equal to the market price of HMEC’s common stock on the date of grant resulting in a grant date intrinsic value of $0. Shares issued upon exercise of options may be either new shares or treasury shares; however, the Company has historically issued new shares.
Beginning in 2005, restricted common stock units also were issued under the 2002 Plan. As of December 31, 2009, 2008 and 2007, 821,421 units, 293,379 units and 341,801 units, respectively, were outstanding representing an equal number of common shares to be issued in the future. The outstanding units accrue dividends at the same rate as dividends paid to HMEC’s shareholders. These dividends are reinvested into additional restricted common stock units.
F-84
Table of Contents
NOTE 6 - Shareholders’ Equity and Stock Options-(Continued)
Changes in outstanding options and shares available for grant under the 1991 Plan, the 2001 Plan and the 2002 Plan were as follows:
| Weighted Average Option Price per Share |
Range of Option Prices per Share |
Options | |||||||||||||
| Outstanding | Vested and Exercisable |
Available for Grant |
|||||||||||||
| At December 31, 2006 |
$ | 19.00 | $ | 13.88-$33.87 | 4,304,250 | 3,900,441 | 2,081,686 | ||||||||
| Granted |
$ | 20.13 | $ | 19.16-$20.23 | 276,280 | — | (276,280 | ) | |||||||
| Vested |
$ | 18.76 | $ | 16.66-$20.23 | — | 149,155 | — | ||||||||
| Exercised |
$ | 17.27 | $ | 13.88-$20.80 | (240,352 | ) | (240,352 | ) | — | ||||||
| Forfeited |
$ | 24.69 | $ | 15.32-$33.87 | (79,998 | ) | (79,998 | ) | 79,998 | ||||||
| Expired |
$ | 22.42 | $ | 22.42 | (19,500 | ) | (19,500 | ) | 19,500 | ||||||
| At December 31, 2007 |
$ | 19.05 | $ | 13.88-$33.87 | 4,240,680 | 3,709,746 | 1,904,904 | ||||||||
| Granted |
$ | 14.11 | $ | 9.04-$16.81 | 622,828 | 50,676 | (622,828 | ) | |||||||
| Vested |
$ | 18.90 | $ | 16.66-$20.23 | — | 314,862 | — | ||||||||
| Forfeited |
$ | 19.18 | $ | 13.88-$23.31 | (492,654 | ) | (492,654 | ) | 492,654 | ||||||
| Expired |
$ | 33.29 | $ | 29.21-$33.87 | (71,100 | ) | (71,100 | ) | 71,100 | ||||||
| At December 31, 2008 |
$ | 18.09 | $ | 9.04-$25.63 | 4,299,754 | 3,511,530 | 1,845,830 | ||||||||
| Granted |
$ | 6.94 | $ | 6.91-$ 9.11 | 479,332 | 9,430 | (479,332 | ) | |||||||
| Vested |
$ | 16.66 | $ | 9.04-$20.23 | — | 293,503 | — | ||||||||
| Forfeited |
$ | 17.40 | $ | 13.88-$23.31 | (137,948 | ) | (137,948 | ) | 137,948 | ||||||
| Expired |
$ | 20.66 | $ | 15.92-$25.63 | (1,198,100 | ) | (1,198,100 | ) | 1,198,100 | ||||||
| At December 31, 2009 |
$ | 15.67 | $ | 6.91-$21.77 | 3,443,038 | 2,478,415 | 2,702,546 | * | |||||||
| Cumulative common stock shares issued for restricted common stock units |
(47,726 | ) | |||||||||||||
| Restricted common stock units outstanding at December 31, 2009 |
(821,421 | ) | |||||||||||||
| Available for grant at December 31, 2009 |
1,833,399 | ||||||||||||||
| * | The Company’s stock options and restricted common stock units are subject to a common pool of authorized shares. Common stock shares issued and issuable for the restricted common stock units outstanding at December 31, 2009 would also draw on this available for grant balance. |
The weighted average grant date fair values were $2.50, $3.47 and $5.49 for options granted in 2009, 2008 and 2007, respectively. The weighted average prices of vested and exercisable options as of December 31, 2008 and 2007 were $18.53 and $19.00, respectively.
F-85
Table of Contents
NOTE 6 - Shareholders’ Equity and Stock Options-(Continued)
For options outstanding at December 31, 2009, information segregated by ranges of exercise prices was as follows:
| Total Outstanding Options | Vested and Exercisable Options | ||||||||||||||||
| Range of Option Prices per Share |
Options | Weighted Average Option Price per Share |
Weighted Average Remaining Term |
Options | Weighted Average Option Price per Share |
Weighted Average Remaining Term | |||||||||||
| $ | 6.91-$ 9.11 | 682,036 | $ | 7.57 | 6.1 years | 110,782 | $ | 8.90 | 6.0 years | ||||||||
| $ | 13.88-$20.23 | 2,636,002 | $ | 17.48 | 2.1 years | 2,242,633 | $ | 17.48 | 1.6 years | ||||||||
| $ | 21.64-$21.77 | 125,000 | $ | 21.67 | 1.9 years | 125,000 | $ | 21.67 | 1.9 years | ||||||||
| Total |
$ | 6.91-$21.77 | 3,443,038 | $ | 15.67 | 2.9 years | 2,478,415 | $ | 17.31 | 1.8 years | |||||||
As of December 31, 2009, based on a closing stock price of $12.50 per share, the aggregate intrinsic (in-the-money) values of vested options and all options outstanding were $399 and $3,364, respectively.
The income tax assets and liabilities included in Other Assets and Other Liabilities, respectively, in the Consolidated Balance Sheets as of December 31, 2009 and 2008 were as follows:
| December 31, | ||||||||
| 2009 | 2008 | |||||||
| Income tax (asset) liability |
||||||||
| Current |
$ | (6,951 | ) | $ | (11,356 | ) | ||
| Deferred |
67,641 | (62,754 | ) | |||||
Deferred tax assets and liabilities are recognized for all future tax consequences attributable to “temporary differences” between the financial statement carrying amounts of existing assets and liabilities and their respective tax bases. There are no deferred tax liabilities that have not been recognized. The “temporary differences” that give rise to the deferred tax balances at December 31, 2009 and 2008 were as follows:
| December 31, | |||||||
| 2009 | 2008 | ||||||
| Deferred tax assets |
|||||||
| Unearned premium reserve reduction |
$ | 14,427 | $ | 14,123 | |||
| Impaired securities |
12,482 | 18,525 | |||||
| Compensation accruals |
7,712 | 7,190 | |||||
| Other comprehensive income – net funded status of pension and other postretirement benefit obligations |
6,255 | 6,231 | |||||
| Discounting of unpaid claims and claim expenses tax reserves |
5,997 | 5,697 | |||||
| Postretirement benefits other than pension |
3,672 | 4,216 | |||||
| Other comprehensive income – unrealized losses on securities |
— | 114,523 | |||||
| Unutilized capital loss carryforward |
— | 3,736 | |||||
| Other, net |
— | 1,078 | |||||
| Total gross deferred tax assets |
50,545 | 175,319 | |||||
| Deferred tax liabilities |
|||||||
| Deferred policy acquisition costs |
87,943 | 99,840 | |||||
| Other comprehensive income – unrealized gains on securities |
12,610 | — | |||||
| Life insurance future policy benefit reserve revaluation |
8,262 | 8,739 | |||||
| Intangible assets |
4,262 | 3,986 | |||||
| Other, net |
5,109 | — | |||||
| Total gross deferred tax liabilities |
118,186 | 112,565 | |||||
| Net deferred tax (asset) liability |
$ | 67,641 | $ | (62,754 | ) | ||
F-86
Table of Contents
NOTE 7 - Income Taxes-(Continued)
The Company evaluated sources and character of income, including historical earnings, loss carryback potential, taxable income from future reversals of existing taxable temporary differences, future taxable income exclusive of reversing temporary differences, and taxable income from prudent and feasible tax-planning strategies. Although realization of deferred tax assets is not assured, the Company believes it is more-likely-than-not that gross deferred tax assets will be fully realized and that a valuation allowance with respect to the realization of the total gross deferred tax assets was not necessary as of December 31, 2009 and 2008.
The components of income tax expense (benefit) were as follows:
| Year Ended December 31, | ||||||||||
| 2009 | 2008 | 2007 | ||||||||
| Current |
$ | 11,025 | $ | (4,359 | ) | $ | 24,429 | |||
| Deferred |
18,996 | (6,380 | ) | 9,854 | ||||||
| Total income tax expense (benefit) |
$ | 30,021 | $ | (10,739 | ) | $ | 34,283 | |||
Income tax expense for the following periods differed from the expected tax computed by applying the federal corporate tax rate of 35% to income before income taxes as follows:
| Year Ended December 31, | ||||||||||||
| 2009 | 2008 | 2007 | ||||||||||
| Expected federal tax on income |
$ | 36,228 | $ | 62 | $ | 40,975 | ||||||
| Add (deduct) tax effects of: |
||||||||||||
| Tax-exempt interest |
(6,497 | ) | (5,854 | ) | (6,265 | ) | ||||||
| Resolution of contingent tax liabilities |
— | (4,180 | ) | — | ||||||||
| Dividend received deduction |
(1,173 | ) | (1,652 | ) | (1,265 | ) | ||||||
| Other, net |
1,463 | 885 | 838 | |||||||||
| Income tax expense (benefit) provided on income |
$ | 30,021 | $ | (10,739 | ) | $ | 34,283 | |||||
At December 31, 2009, the Company had federal income tax returns for the 2006 through 2009 tax years still open and subject to examination by taxing authorities. In 2008, the Internal Revenue Service (“IRS”) completed its examination of tax years 2002, 2004, 2005 and 2006. As a result, the Company recorded a reduction in its liability for uncertain tax positions, including interest, of $4,180.
The Company recognizes tax benefits from tax return positions only if it is more likely than not the position will be sustainable, upon examination, on its technical merits and any relevant administrative practices or precedents. As a result, the Company applies a more-likely-than-not recognition threshold for all tax uncertainties.
The Company records liabilities for uncertain tax filing positions where it is more-likely-than-not that the position will not be sustainable upon audit by taxing authorities. These liabilities are reevaluated routinely and are adjusted appropriately based upon changes in facts or law. The Company has no unrecorded liabilities from uncertain tax filing positions.
F-87
Table of Contents
NOTE 7 - Income Taxes-(Continued)
A reconciliation of the beginning and ending amount of unrecognized tax benefits, excluding interest and penalties, is as follows:
| Year Ended December 31, | ||||||||
| 2009 | 2008 | |||||||
| Balance as of the beginning of the year |
$ | 1,085 | $ | 4,367 | ||||
| Additions based on tax positions related to the current year |
360 | 505 | ||||||
| Additions for tax positions for prior years |
— | 81 | ||||||
| Settlements |
— | (3,722 | ) | |||||
| Reductions for tax positions for prior years |
(10 | ) | (146 | ) | ||||
| Balance as of the end of the year |
$ | 1,435 | $ | 1,085 | ||||
All of the liability for unrecognized tax benefits would affect the effective tax rate if recognized. There are no positions for which it is reasonably possible that the total amount of unrecognized tax benefits will significantly increase or decrease within the next 12 months.
The Company classifies all tax related interest and penalties as income tax expense. The 2009 expense for interest and penalties was $94 ($62 net of tax benefits); for 2008 and 2007, this amount was $12 ($8 net of tax benefits) and $306 ($199 net of tax benefits), respectively. The Company has recorded $257 and $163 in liabilities for tax related interest and penalties on its Consolidated Balance Sheets at December 31, 2009 and 2008, respectively.
F-88
Table of Contents
NOTE 8 - Statutory Surplus and Subsidiary Dividend Restrictions
The insurance departments of various states in which the insurance subsidiaries of HMEC are domiciled recognize as net income and surplus those amounts determined in conformity with statutory accounting principles prescribed or permitted by the insurance departments, which differ in certain respects from GAAP.
Reconciliations of statutory capital and surplus and net income, as determined using statutory accounting principles, to the amounts included in the accompanying consolidated financial statements are as follows:
| (Unaudited) December 31, |
||||||||
| 2009 | 2008 | |||||||
| Statutory capital and surplus of insurance subsidiaries |
$ | 627,277 | $ | 556,835 | ||||
| Increase (decrease) due to: |
||||||||
| Deferred policy acquisition costs |
276,124 | 312,046 | ||||||
| Difference in policyholder reserves |
45,465 | 43,535 | ||||||
| Goodwill |
47,396 | 47,396 | ||||||
| Value of acquired insurance in force |
— | 223 | ||||||
| Liability for postretirement benefits, other than pensions |
(4,470 | ) | (4,549 | ) | ||||
| Investment fair value adjustments on fixed maturities |
40,508 | (289,389 | ) | |||||
| Difference in investment reserves |
50,938 | 26,686 | ||||||
| Federal income tax asset (liability) |
(101,867 | ) | 37,005 | |||||
| Net funded status of pension and other postretirement benefit obligations |
(17,872 | ) | (17,802 | ) | ||||
| Non-admitted assets and other, net |
1,599 | (16,268 | ) | |||||
| Shareholders’ equity (deficit) of parent company and non-insurance subsidiaries |
(7,939 | ) | (9,324 | ) | ||||
| Parent company short-term and long-term debt |
(237,614 | ) | (237,549 | ) | ||||
| Shareholders’ equity as reported herein |
$ | 719,545 | $ | 448,845 | ||||
| (Unaudited) Year Ended December 31, |
||||||||||||
| 2009 | 2008 | 2007 | ||||||||||
| Statutory net income of insurance subsidiaries |
$ | 69,295 | $ | 2,616 | $ | 88,839 | ||||||
| Net income (loss) of non-insurance companies |
(4,678 | ) | 40 | (284 | ) | |||||||
| Interest expense |
(13,971 | ) | (14,455 | ) | (14,060 | ) | ||||||
| Tax benefit of interest expense and other parent company current tax adjustments |
6,779 | 6,737 | 5,707 | |||||||||
| Combined net income (loss) |
57,425 | (5,062 | ) | 80,202 | ||||||||
| Increase (decrease) due to: |
||||||||||||
| Deferred policy acquisition costs |
12,895 | 6,513 | 10,791 | |||||||||
| Policyholder benefits |
7,550 | 19,186 | 12,201 | |||||||||
| Federal income tax benefit (expense) |
(19,385 | ) | 5,782 | (9,854 | ) | |||||||
| Amortization of intangible assets |
(223 | ) | (5,329 | ) | (5,379 | ) | ||||||
| Investment reserves |
21,188 | (3,819 | ) | (171 | ) | |||||||
| Other adjustments, net |
(5,964 | ) | (6,354 | ) | (5,002 | ) | ||||||
| Net income as reported herein |
$ | 73,486 | $ | 10,917 | $ | 82,788 | ||||||
F-89
Table of Contents
NOTE 8 - Statutory Surplus and Subsidiary Dividend Restrictions-(Continued)
The Company has principal insurance subsidiaries domiciled in Illinois, California and Texas. The statutory financial statements of these subsidiaries are prepared in accordance with accounting principles prescribed or permitted by the Illinois Department of Insurance, the California Department of Insurance and the Texas Department of Insurance, as applicable. Prescribed statutory accounting principles include a variety of publications of the National Association of Insurance Commissioners (“NAIC”), as well as state laws, regulations and general administrative rules.
The Company’s insurance subsidiaries are subject to various regulatory restrictions which limit the amount of annual dividends or other distributions, including loans or cash advances, available to HMEC without prior approval of the insurance regulatory authorities. The aggregate amount of dividends that may be paid in 2010 from all of HMEC’s insurance subsidiaries without prior regulatory approval is approximately $64,000.
The NAIC has adopted risk-based capital guidelines to evaluate the adequacy of statutory capital and surplus in relation to risks assumed in investments, reserving policies, and volume and types of insurance business written. State insurance regulations prohibit insurance companies from making any public statements or representations with regard to their risk-based capital levels. Based on current guidelines, the risk-based capital statutory requirements are not expected to have a negative regulatory impact on the Company’s insurance subsidiaries. At December 31, 2009 and 2008, statutory capital and surplus of each of the Company’s insurance subsidiaries was above required levels.
At the time of this Annual Report on Form 10-K and during each of the years in the three year period ended December 31, 2009, the Company had no financial reinsurance agreements in effect.
NOTE 9 - Pension Plans and Other Postretirement Benefits
The Company has the following retirement plans: a defined contribution plan; a 401(k) plan; a defined benefit plan for employees hired on or before December 31, 1998; and certain employees participate in a supplemental defined contribution plan or a supplemental defined benefit plan or both.
After completing the first year of employment, all employees participate in the defined contribution plan. Under this plan, the Company makes contributions to each participant’s account based on eligible compensation and years of service. Contribution percentages are currently as follows: (1) employees hired on or after April 1, 1997, 5% of eligible compensation; (2) employees hired prior to April 1, 1997 with less than 15 years of service, 6% of eligible compensation; and (3) employees hired prior to April 1, 1997 with 15 or more years of service, 7% of eligible compensation. Through December 31, 2006, participants were 100% vested in this plan after 5 years of service. Effective January 1, 2007, participants are 100% vested in this plan after 3 years of service.
All employees of the Company participate in a 401(k) plan. Beginning January 1, 2002, the Company automatically contributes 3% of eligible compensation to each employee’s account, which is 100% vested at the time of the contribution. In addition, employees may voluntarily contribute up to 20% of their eligible compensation into their account.
F-90
Table of Contents
NOTE 9 - Pension Plans and Other Postretirement Benefits-(Continued)
Effective April 1, 2002, participants stopped accruing benefits under the defined benefit and supplemental defined benefit plans but continue to retain the benefits they had accrued to date. Amounts earned under the defined benefit and supplemental defined benefit plans were frozen based on years of service and the highest 36 consecutive months of earnings while under the plan (through March 31, 2002). Participants were 100% vested in these defined benefit plans effective April 1, 2007.
The Company’s policy with respect to funding the defined benefit plan is to contribute to the plan trust amounts which are actuarially determined to provide the plan with sufficient assets to meet future benefit payments consistent with the funding requirements of federal laws and regulations. For the defined contribution, 401(k) and defined benefit plans, investments have been set aside in separate trust funds. The supplemental retirement plans are unfunded, non-qualified plans.
Employees whose compensation exceeds the limits covered under the qualified plans participate in an unfunded, non-qualified defined contribution plan. The Company accrues an amount for each participant based on their compensation, years of service and account balance. Participants are 100% vested in this plan after 3 years of service.
Total expense recorded for the qualified and non-qualified defined contribution, 401(k), defined benefit and supplemental retirement plans was $11,717, $12,947 and $13,089 for the years ended December 31, 2009, 2008 and 2007, respectively.
Qualified Defined Contribution Plan, 401(k) Plan and Non-qualified Defined Contribution Plan
Pension benefits under the qualified defined contribution plan are fully funded. Contributions to employees’ accounts under this plan were expensed in the Company’s Consolidated Statements of Operations. Investments for this plan are set aside in a trust fund and none of the trust fund assets for the plan have been invested in shares of HMEC’s common stock.
The 401(k) plan is fully funded. Contributions to employees’ accounts under this plan were expensed in the Company’s Consolidated Statements of Operations. Investments for this plan are set aside through an annuity contract underwritten by the Company’s principal life insurance subsidiary. The annuity contract includes a fixed return account option and several variable return account options, with the account options selected by the individual plan participants for both the Company and participant portions contributed. One of the variable return account options invests in shares of HMEC common stock.
The non-qualified defined contribution plan is an unfunded plan. Contributions to employees’ accounts under the non-qualified defined contribution plan are equal to cash payments to retirees for the period.
F-91
Table of Contents
NOTE 9 - Pension Plans and Other Postretirement Benefits-(Continued)
Contributions to employees’ accounts under the qualified defined contribution plan, the 401(k) plan and the non-qualified defined contribution plan, as well as total assets of the plans, were as follows:
| Year Ended December 31, | |||||||||
| 2009 | 2008 | 2007 | |||||||
| Qualified defined contribution plan: |
|||||||||
| Contributions to employees’ accounts |
$ | 5,516 | $ | 6,867 | $ | 6,824 | |||
| Total assets at the end of the year |
148,833 | 145,021 | 139,570 | ||||||
| 401(k) plan: |
|||||||||
| Contributions to employees’ accounts |
3,413 | 3,815 | 3,817 | ||||||
| Total assets at the end of the year |
112,470 | 100,389 | 127,099 | ||||||
| Non-qualified defined contribution plan: |
|||||||||
| Contributions to employees’ accounts |
— | — | — | ||||||
| Total assets at the end of the year |
— | — | — | ||||||
F-92
Table of Contents
NOTE 9 - Pension Plans and Other Postretirement Benefits-(Continued)
Defined Benefit Plan and Supplemental Retirement Plans
The following tables summarize the funding status of the defined benefit and supplemental retirement pension plans at December 31, 2009, 2008 and 2007 (the measurement dates) and identify (1) the assumptions used to determine the projected benefit obligation and (2) the components of net pension cost for the defined benefit plan and supplemental retirement plans for the following periods:
| Defined Benefit Plan | Supplemental Retirement Plans |
|||||||||||||||||||||||
| December 31, | December 31, | |||||||||||||||||||||||
| 2009 | 2008 | 2007 | 2009 | 2008 | 2007 | |||||||||||||||||||
| Change in benefit obligation: |
||||||||||||||||||||||||
| Projected benefit obligation at beginning of year |
$ | 37,448 | $ | 40,916 | $ | 45,164 | $ | 14,818 | $ | 15,279 | $ | 16,215 | ||||||||||||
| Service cost |
— | — | — | (57 | ) | (45 | ) | (43 | ) | |||||||||||||||
| Interest cost |
2,150 | 2,337 | 2,364 | 886 | 905 | 895 | ||||||||||||||||||
| Plan amendments |
— | — | — | 529 | — | — | ||||||||||||||||||
| Actuarial loss (gain) |
2,640 | (1,433 | ) | (2,461 | ) | 667 | (190 | ) | (664 | ) | ||||||||||||||
| Benefits paid |
(3,750 | ) | (1,564 | ) | (1,531 | ) | (1,136 | ) | (1,131 | ) | (1,124 | ) | ||||||||||||
| Settlements |
— | (2,808 | ) | (2,620 | ) | — | — | — | ||||||||||||||||
| Projected benefit obligation at end of year |
$ | 38,488 | $ | 37,448 | $ | 40,916 | $ | 15,707 | $ | 14,818 | $ | 15,279 | ||||||||||||
| Change in plan assets: |
||||||||||||||||||||||||
| Fair value of plan assets at beginning of year |
$ | 25,173 | $ | 40,068 | $ | 41,775 | $ | — | $ | — | $ | — | ||||||||||||
| Actual return on plan assets |
5,154 | (10,523 | ) | 2,444 | — | — | — | |||||||||||||||||
| Employer contributions |
2,700 | — | — | 1,136 | 1,131 | 1,124 | ||||||||||||||||||
| Benefits paid |
(3,750 | ) | (1,564 | ) | (1,531 | ) | (1,136 | ) | (1,131 | ) | (1,124 | ) | ||||||||||||
| Expenses paid |
(271 | ) | — | — | — | — | — | |||||||||||||||||
| Settlements |
— | (2,808 | ) | (2,620 | ) | — | — | — | ||||||||||||||||
| Fair value of plan assets at end of year |
$ | 29,006 | $ | 25,173 | $ | 40,068 | $ | — | $ | — | $ | — | ||||||||||||
| Funded status |
$ | (9,483 | ) | $ | (12,275 | ) | $ | (848 | ) | $ | (15,707 | ) | $ | (14,818 | ) | $ | (15,279 | ) | ||||||
| Prepaid (accrued) benefit expense |
$ | 7,747 | $ | 6,557 | $ | 7,572 | $ | (12,855 | ) | $ | (12,935 | ) | $ | (12,973 | ) | |||||||||
| Amounts recognized in balance sheet: |
||||||||||||||||||||||||
| Other liabilities |
$ | (9,483 | ) | $ | (12,275 | ) | $ | (848 | ) | $ | (15,707 | ) | $ | (14,818 | ) | $ | (15,279 | ) | ||||||
| Total amount recognized in balance sheet |
$ | (9,483 | ) | $ | (12,275 | ) | $ | (848 | ) | $ | (15,707 | ) | $ | (14,818 | ) | $ | (15,279 | ) | ||||||
| Amounts recognized in accumulated other comprehensive income (loss) (“AOCI”): |
||||||||||||||||||||||||
| Prior service cost |
$ | — | $ | — | $ | — | $ | 498 | $ | — | $ | — | ||||||||||||
| Net actuarial loss |
17,230 | 18,832 | 8,420 | 2,354 | 1,883 | 2,306 | ||||||||||||||||||
| Total amount recognized in AOCI |
$ | 17,230 | $ | 18,832 | $ | 8,420 | $ | 2,852 | $ | 1,883 | $ | 2,306 | ||||||||||||
| Information for pension plans with an accumulated benefit obligation greater than plan assets: |
||||||||||||||||||||||||
| Projected benefit obligation |
$ | 38,488 | $ | 37,448 | $ | 40,916 | $ | 15,707 | $ | 14,818 | $ | 15,279 | ||||||||||||
| Accumulated benefit obligation |
38,488 | 37,448 | 40,916 | 15,707 | 14,818 | 15,279 | ||||||||||||||||||
| Fair value of plan assets |
29,006 | 25,173 | 40,068 | — | — | — | ||||||||||||||||||
F-93
Table of Contents
NOTE 9 - Pension Plans and Other Postretirement Benefits-(Continued)
The decrease in the Company’s 2009 AOCI for the defined benefit plan of $1,602 was attributable primarily to the improvement in plan asset performance. The increase in the Company’s 2008 AOCI for the defined benefit plan of $10,412 was attributable primarily to the decline in performance of plan assets. The decrease in the 2007 AOCI for the defined benefit plan of $3,991 was primarily attributable to improvements in asset performance and decreases in settlements. In addition, the 2007 AOCI was favorably impacted by the increase in the discount rate used to determine the benefit obligations as of December 31, 2007. These changes were recorded to a separate component of shareholders’ equity.
| Defined Benefit Plan | Supplemental Retirement Plans |
|||||||||||||||||||||||
| Year Ended December 31, | Year Ended December 31, | |||||||||||||||||||||||
| 2009 | 2008 | 2007 | 2009 | 2008 | 2007 | |||||||||||||||||||
| Components of net periodic pension (income) expense: |
||||||||||||||||||||||||
| Service cost |
$ | 250 | $ | — | $ | — | $ | (57 | ) | $ | (45 | ) | $ | (43 | ) | |||||||||
| Interest cost |
2,150 | 2,337 | 2,364 | 886 | 905 | 895 | ||||||||||||||||||
| Expected return on plan assets |
(2,213 | ) | (2,725 | ) | (2,742 | ) | — | — | — | |||||||||||||||
| Settlement loss |
— | 928 | 539 | — | — | — | ||||||||||||||||||
| Amortization of: |
||||||||||||||||||||||||
| Prior service cost |
— | — | — | 31 | — | — | ||||||||||||||||||
| Actuarial loss |
1,323 | 475 | 1,290 | 196 | 234 | 556 | ||||||||||||||||||
| Net periodic pension expense |
$ | 1,510 | $ | 1,015 | $ | 1,451 | $ | 1,056 | $ | 1,094 | $ | 1,408 | ||||||||||||
| Changes in plan assets and benefit obligations included in other comprehensive income (loss): |
||||||||||||||||||||||||
| Prior service cost |
$ | — | $ | — | $ | — | $ | 529 | $ | — | $ | — | ||||||||||||
| Net actuarial loss (gain) |
(279 | ) | 10,887 | (2,701 | ) | 667 | (190 | ) | (663 | ) | ||||||||||||||
| Amortization of: |
||||||||||||||||||||||||
| Prior service cost |
— | — | — | (31 | ) | — | — | |||||||||||||||||
| Actuarial loss |
(1,323 | ) | (475 | ) | (1,290 | ) | (196 | ) | (234 | ) | (556 | ) | ||||||||||||
| Total recognized in other comprehensive income (loss) |
$ | (1,602 | ) | $ | 10,412 | $ | (3,991 | ) | $ | 969 | $ | (424 | ) | $ | (1,219 | ) | ||||||||
| Weighted-average assumptions used to determine expense: |
||||||||||||||||||||||||
| Discount rate |
6.27 | % | 6.45 | % | 5.65 | % | 6.35 | % | 6.20 | % | 5.75 | % | ||||||||||||
| Expected return on plan assets |
7.50 | % | 7.50 | % | 7.50 | % | * | * | * | |||||||||||||||
| Annual rate of salary increase |
* | * | * | * | * | * | ||||||||||||||||||
| Weighted-average assumptions used to determine benefit obligations as of December 31: |
||||||||||||||||||||||||
| Discount rate |
5.27 | % | 6.27 | % | 6.05 | % | 5.54 | % | 6.35 | % | 6.20 | % | ||||||||||||
| Expected return on plan assets |
7.50 | % | 7.50 | % | 7.50 | % | * | * | * | |||||||||||||||
| Annual rate of salary increase |
* | * | * | * | * | * | ||||||||||||||||||
| * | Not applicable. |
The assumption for the long-term rate of return on plan assets was determined by considering actual investment experience during the lifetime of the plan, balanced with reasonable expectations of future growth considering the various classes of assets and percentage allocation for each asset class.
F-94
Table of Contents
NOTE 9 - Pension Plans and Other Postretirement Benefits-(Continued)
The Company has an investment policy for the defined benefit pension plan that aligns the assets within the plan’s trust to an approximate 70% equity and 30% stable value funds allocation. Management believes this allocation will produce the targeted long-term rate of return on assets necessary for payment of future benefit obligations, while providing adequate liquidity for payments to current beneficiaries. Assets are reviewed against the defined benefit pension plan’s investment policy and the trustee has been directed to adjust invested assets at least quarterly to maintain the target allocation percentages.
Fair values of the equity security funds, fixed income funds and short-term investments have been determined from quoted market prices in active markets. The following table presents the fair value hierarchy for the Company’s defined benefit pension plan assets at December 31, 2009.
| Fair Value Measurements December 31, 2009 | ||||||||||||
| Total | Level 1 | Level 2 | Level 3 | |||||||||
| Asset category |
||||||||||||
| Equity security funds (1) |
||||||||||||
| United States |
$ | 15,808 | $ | 15,808 | $ | — | $ | — | ||||
| International |
4,395 | 4,395 | — | — | ||||||||
| Fixed income funds |
8,608 | 8,608 | — | — | ||||||||
| Cash and short-term investments |
195 | 195 | — | — | ||||||||
| Total |
$ | 29,006 | $ | 29,006 | $ | — | $ | — | ||||
| (1) | None of the trust fund assets for the defined benefit pension plan have been invested in shares of HMEC’s common stock. |
For the period January 1, 2009 to December 31, 2009, there were no realized gains or losses included in earnings that were attributable to Level 3 assets still held at December 31, 2009. There were no Level 3 assets held during the period January 1, 2009 to December 31, 2009.
There is a minimum funding requirement of approximately $500 for the Company’s defined benefit plan in 2010. The Company expects to contribute $1,000 to the defined benefit plan and expects to contribute $1,146 to the supplemental retirement plans in 2010. In addition, the Company expects amortization of net losses of $1,801 and $278 for the defined benefit plan and the supplemental retirement plans, respectively, and expects amortization of prior service cost of $124 for the supplemental retirement plans to be included in net periodic pension expense in 2010.
Postretirement Benefits Other than Pensions
In addition to providing pension benefits, the Company also provides certain health care and life insurance benefits to eligible employees. Only employees who were at least age 55 with at least 20 years of service by December 31, 2008 are eligible to participate in this program. Postretirement benefits other than pensions of active and retired employees are accrued as expense over the employees’ service years.
F-95
Table of Contents
NOTE 9 - Pension Plans and Other Postretirement Benefits-(Continued)
Effective January 1, 2007, the Company eliminated the previous group health insurance benefits for retirees 65 years of age and over and established a Health Reimbursement Account (“HRA”) for each eligible participant. Health care benefits for eligible retirees under 65 years of age will continue to be provided as a bridge to Medicare eligibility. Eligible participants will receive a one-time credit of $10 to their HRA account to use for covered expenses incurred on or after age 65. As of December 31, 2006, HRA accounts were established for eligible participants and totaled $7,310. As of December 31, 2009, the balance of the HRA accounts was $3,907. Also, the new plan does not provide life insurance benefits to individuals who retired after December 31, 1993.
As a result of the changes in the plan for other postretirement benefits, the Company recorded a reduction in its expenses of $339, $2,304 and $4,550 in 2009, 2008 and 2007, respectively.
The following table presents the funded status of postretirement benefits other than pensions of active and retired employees (including employees on disability more than 2 years) as of December 31, 2009, 2008 and 2007 (the measurement dates) reconciled with amounts recognized in the Company’s Consolidated Balance Sheets:
| December 31, | ||||||||||||
| 2009 | 2008 | 2007 | ||||||||||
| Change in accumulated postretirement benefit obligations: |
||||||||||||
| Accumulated postretirement benefit obligations at beginning of year |
$ | 4,549 | $ | 5,095 | $ | 6,138 | ||||||
| Changes during fiscal year |
||||||||||||
| Service cost |
— | 1 | 8 | |||||||||
| Interest cost |
250 | 266 | 291 | |||||||||
| Medicare prescription reimbursements |
— | — | 39 | |||||||||
| Net loss |
287 | 119 | — | |||||||||
| Employer payments net of participant contributions |
(616 | ) | (932 | ) | (1,376 | ) | ||||||
| Actuarial (gain) loss |
— | — | (5 | ) | ||||||||
| Accumulated postretirement benefit obligations at end of year |
$ | 4,470 | $ | 4,549 | $ | 5,095 | ||||||
| Unfunded status |
$ | (4,470 | ) | $ | (4,549 | ) | $ | (5,095 | ) | |||
| Amounts recognized in balance sheet: |
||||||||||||
| Other liabilities |
$ | (4,470 | ) | $ | (4,549 | ) | $ | (5,095 | ) | |||
| Total amount recognized in balance sheet |
$ | (4,470 | ) | $ | (4,549 | ) | $ | (5,095 | ) | |||
| Amounts recognized in accumulated other comprehensive income (loss) (“AOCI”): |
||||||||||||
| Prior service credit |
$ | — | $ | — | $ | (1,902 | ) | |||||
| Net actuarial gain |
(2,210 | ) | (2,913 | ) | (3,874 | ) | ||||||
| Total amount recognized in AOCI |
$ | (2,210 | ) | $ | (2,913 | ) | $ | (5,776 | ) | |||
| Year Ended December 31, | ||||||||||||
| 2009 | 2008 | 2007 | ||||||||||
| Components of net periodic benefit: |
||||||||||||
| Service cost |
$ | — | $ | 1 | $ | 8 | ||||||
| Interest cost |
250 | 266 | 291 | |||||||||
| Amortization of prior service cost |
— | (1,902 | ) | (4,010 | ) | |||||||
| Amortization of prior losses |
(589 | ) | (669 | ) | (839 | ) | ||||||
| Net periodic benefit |
$ | (339 | ) | $ | (2,304 | ) | $ | (4,550 | ) | |||
The Company expects to contribute $681 to the postretirement benefit plans other than pensions in 2010. In addition, the Company expects amortization of net gains and losses of $497 to be included in net periodic pension expense in 2010.
F-96
Table of Contents
NOTE 9 - Pension Plans and Other Postretirement Benefits-(Continued)
Sensitivity Analysis for Postretirement Benefits Other than Pensions
A one percentage point change in the assumed health care cost trend rate for each year would change the accumulated postretirement benefit obligations as follows:
| December 31, | ||||||||||||
| 2009 | 2008 | 2007 | ||||||||||
| Accumulated postretirement benefit obligations |
||||||||||||
| Effect of a one percentage point increase |
$ | 91 | $ | 91 | $ | 98 | ||||||
| Effect of a one percentage point decrease |
(85 | ) | (85 | ) | (92 | ) | ||||||
| Service and interest cost components of the net periodic postretirement benefit expense |
||||||||||||
| Effect of a one percentage point increase |
$ | 4 | $ | 5 | $ | 6 | ||||||
| Effect of a one percentage point decrease |
(4 | ) | (5 | ) | (5 | ) | ||||||
| Weighted-average assumptions used to determine benefit obligations as of December 31: |
||||||||||||
| Discount rate |
4.49 | % | 5.98 | % | 5.65 | % | ||||||
| Healthcare cost trend rate |
8.50 | % | 9.00 | % | 10.00 | % | ||||||
| Rate to which the cost trend rate is assumed to decline (ultimate trend rate) |
5.00 | % | 5.50 | % | 5.50 | % | ||||||
| Year the rate is assumed to reach the ultimate trend rate |
2017 | 2013 | 2013 | |||||||||
| Expected return on plan assets |
* | * | * | |||||||||
| Weighted-average assumptions used to determine net periodic benefit cost for the years ended December 31: |
||||||||||||
| Discount rate |
5.98 | % | 5.65 | % | 5.50 | % | ||||||
| Healthcare cost trend rate |
9.00 | % | 10.00 | % | 11.00 | % | ||||||
| Rate to which the cost trend rate is assumed to decline (ultimate trend rate) |
5.50 | % | 5.50 | % | 5.50 | % | ||||||
| Year the rate is assumed to reach the ultimate trend rate |
2013 | 2013 | 2013 | |||||||||
| Expected return on plan assets |
* | * | * | |||||||||
| * | Not applicable. |
The discount rates at December 31, 2009 were based on the average yield for long-term, high-grade securities available during the benefit payout period. To set its discount rate, the Company looks to leading indicators, including the Citigroup Pension Discount Curve.
Estimated Future Benefit Payments
The Company’s defined benefit plan may be subject to settlement accounting. Assumptions for both the number of individuals retiring in a calendar year and their elections regarding lump sum distributions are significant factors impacting the payout patterns for these plans. Therefore, actual results could vary from the estimates below. Estimated future benefit payments at December 31, 2009 are as follows:
| 2010 | 2011 | 2012 | 2013 | 2014 | 2015-2019 | |||||||||||||
| Pension plans: |
||||||||||||||||||
| Defined benefit plan |
$ | 5,364 | $ | 3,732 | $ | 3,383 | $ | 3,282 | $ | 3,482 | $ | 14,692 | ||||||
| Supplemental retirement plans |
1,146 | 1,147 | 1,145 | 1,143 | 1,308 | 6,321 | ||||||||||||
| Other postretirement benefits |
681 | 676 | 594 | 545 | 477 | 1,676 | ||||||||||||
F-97
Table of Contents
NOTE 10 - Catastrophes and Reinsurance
In the normal course of business, the Company’s insurance subsidiaries assume and cede reinsurance with other insurers. Reinsurance is ceded primarily to limit losses from large exposures and to permit recovery of a portion of direct losses; however, such a transfer does not relieve the originating insurance company of contingent liability.
The Company is a national underwriter and therefore has exposure to catastrophic losses in certain coastal states and other regions throughout the U.S. Catastrophes can be caused by various events including hurricanes, windstorms, earthquakes, hail, severe winter weather and wildfires, and the frequency and severity of catastrophes are inherently unpredictable. The financial impact from catastrophic losses results from both the total amount of insured exposure in the area affected by the catastrophe as well as the severity of the event. The Company seeks to reduce its exposure to catastrophe losses through the geographic diversification of its insurance coverage, deductibles, maximum coverage limits and the purchase of catastrophe reinsurance.
The Company’s net catastrophe losses incurred of approximately $33,065 for the year ended December 31, 2009 reflected losses primarily from wind/hail/tornado events in the spring and summer months. The Company’s net catastrophe losses incurred of approximately $73,931 for the year ended December 31, 2008 reflected losses from Hurricane Gustav, Hurricane Ike, wind/hail/tornado events in May and June, and winter storms in December. The Company’s net catastrophe losses incurred of approximately $23,538 for the year ended December 31, 2007 reflected losses in October from wildfires in California and wind/hail/tornado events in June and August as well as other smaller weather events.
The total amounts of reinsurance recoverable on unpaid insurance reserves classified as assets and reported in Other Assets in the Consolidated Balance Sheets were as follows:
| December 31, | ||||||
| 2009 | 2008 | |||||
| Reinsurance recoverables on reserves and unpaid claims |
||||||
| Life and health |
$ | 8,473 | $ | 7,578 | ||
| Property and casualty |
||||||
| State insurance facilities |
3,117 | 2,999 | ||||
| Other insurance companies |
12,652 | 11,794 | ||||
| Total |
$ | 24,242 | $ | 22,371 | ||
F-98
Table of Contents
NOTE 10 - Catastrophes and Reinsurance-(Continued)
The Company recognizes the cost of reinsurance premiums over the contract periods for such premiums in proportion to the insurance protection provided. Amounts recoverable from reinsurers for unpaid claims and claim settlement expenses, including estimated amounts for unsettled claims, claims incurred but not yet reported and policy benefits, are estimated in a manner consistent with the insurance liability associated with the policy. The effects of reinsurance on premiums written and contract deposits; premiums and contract charges earned; and benefits, claims and settlement expenses were as follows:
| Gross Amount |
Ceded to Other Companies |
Assumed from Other Companies |
Net Amount | |||||||||
| Year ended December 31, 2009 |
||||||||||||
| Premiums written and contract deposits |
$ | 1,034,654 | $ | 35,104 | $ | 4,103 | $ | 1,003,653 | ||||
| Premiums and contract charges earned |
690,631 | 35,169 | 4,128 | 659,590 | ||||||||
| Benefits, claims and settlement expenses |
467,088 | 12,152 | 3,724 | 458,660 | ||||||||
| Year ended December 31, 2008 |
||||||||||||
| Premiums written and contract deposits |
986,985 | 31,864 | 4,976 | 960,097 | ||||||||
| Premiums and contract charges earned |
685,870 | 32,207 | 4,869 | 658,532 | ||||||||
| Benefits, claims and settlement expenses |
480,799 | 12,126 | 2,859 | 471,532 | ||||||||
| Year ended December 31, 2007 |
||||||||||||
| Premiums written and contract deposits |
1,007,566 | 39,993 | 7,172 | 974,745 | ||||||||
| Premiums and contract charges earned |
686,414 | 39,584 | 7,427 | 654,257 | ||||||||
| Benefits, claims and settlement expenses |
415,653 | 9,450 | 2,287 | 408,490 | ||||||||
Ceded premiums written and earned for the years ended December 31, 2009, 2008 and 2007 included approximately $3, $15 and $30, respectively, of catastrophe reinsurance reinstatement premium.
There were no losses from uncollectible reinsurance recoverables in the three years ended December 31, 2009. Past due reinsurance recoverables as of December 31, 2009 were not material.
The Company maintains catastrophe excess of loss reinsurance coverage. For 2009, the excess of loss coverage consisted of three contracts in addition to coverage with the Florida Hurricane Catastrophe Fund (“FHCF”). The primary contract (“first event”) provided 95% coverage of catastrophe losses above a retention of $25,000 per occurrence up to $170,000 per occurrence. This contract consisted of four layers, each of which provided for one mandatory reinstatement unless noted otherwise. The layers were $25,000 excess of $25,000 (82.5% provided for one mandatory reinstatement), $40,000 excess of $50,000 (92.25% provided for one mandatory reinstatement), $60,000 excess of $90,000, and $20,000 excess of $150,000. The second excess of loss contract (“second event”) provided 95% coverage of catastrophe losses above a retention of $15,000 per occurrence up to $25,000 per occurrence, after the Company retained $10,000 of losses above $15,000 per occurrence. The third excess of loss contract (“third event”) provided 95% coverage of catastrophe losses above a retention of $15,000 per occurrence up to $25,000 per occurrence, after the Company retained $10,000 of losses above $15,000 per occurrence and less than $25,000 per occurrence, and after the second excess of loss contract described above was exhausted. Neither the second nor the third excess of loss contract provided for a reinstatement. In addition, the Company’s predominant insurance subsidiary for property and casualty business written in Florida reinsured 90% of hurricane losses in that state above an estimated retention
F-99
Table of Contents
NOTE 10 - Catastrophes and Reinsurance-(Continued)
of $14,400 up to $52,400, based on the FHCF’s financial resources. The FHCF contract is a one year contract, effective June 1, 2009. The decrease in FHCF coverage for the 2009-2010 contract period primarily reflects the Company’s election not to purchase additional coverage as it did for the 2008-2009 contract period. This election was anticipated based on the Company’s increase in coverage under its primary reinsurance contracts, which were finalized and priced prior to January 1, 2009. Additional coverage made available by the FHCF to the industry in future contract periods could increase the likelihood of assessments in periods following significant hurricane losses.
For liability coverages, in 2009 the Company reinsured each loss above a retention of $700 up to $2,500 per occurrence and $20,000 in a clash event. (A clash cover is a reinsurance casualty excess contract requiring two or more casualty coverages or policies issued by the Company to be involved in the same loss occurrence for coverage to apply.) For property coverages, in 2009 the Company reinsured each loss above a retention of $750 up to $2,500 on a per risk basis, including catastrophe losses that in the aggregate were less than the retention levels above. Also, the Company could submit to the reinsurers three per risk losses from the same occurrence for a total of $5,250 of property recovery in any one event.
The maximum individual life insurance risk retained by the Company is $200 on any individual life, while either $100 or $125 is retained on each group life policy depending on the type of coverage. Excess amounts are reinsured. The Company also maintains a life catastrophe reinsurance program. The Company reinsured 100% of the catastrophe risk in excess of $1,000 up to $15,000 per occurrence with one reinstatement in 2009. The Company’s life catastrophe risk reinsurance program covers acts of terrorism and includes nuclear, biological and chemical explosions but excludes other acts of war.
F-100
Table of Contents
NOTE 11 - Contingencies and Commitments
Lawsuits and Legal Proceedings
Companies in the insurance industry have been subject to substantial litigation resulting from claims, disputes and other matters. Most recently, they have faced expensive claims, including class action lawsuits, alleging, among other things, improper sales practices and improper claims settlement procedures. Negotiated settlements of certain such actions have had a material adverse effect on many insurance companies.
There are various lawsuits and legal proceedings against the Company. Management and legal counsel are of the opinion that the ultimate disposition of such litigation will have no material adverse effect on the Company’s financial position.
Assessments for Insolvencies of Unaffiliated Insurance Companies
The Company is also contingently liable for possible assessments under regulatory requirements pertaining to potential insolvencies of unaffiliated insurance companies. Liabilities, which are established based upon regulatory guidance, have generally been insignificant.
Leases
The Company has entered into various operating lease agreements, primarily for real estate (claims and marketing offices across the country and portions of the home office complex) and also for computer equipment and copy machines. Rental expenses were $5,399, $4,651 and $4,766 for the years ended December 31, 2009, 2008 and 2007, respectively. Future minimum lease payments under leases expiring subsequent to December 31, 2009 are as follows:
| As of December 31, 2009 | |||||||||||||||||||||
| 2010 | 2011 | 2012 | 2013 | 2014 | 2015-2019 | 2020 and beyond | |||||||||||||||
| Minimum operating lease payments |
$ | 3,045 | $ | 2,529 | $ | 2,241 | $ | 2,220 | $ | 2,189 | $ | 11,215 | $ | 375 | |||||||
NOTE 12 - Supplementary Data on Cash Flows
A reconciliation of net income to net cash provided by operating activities as presented in the Consolidated Statements of Cash Flows is as follows:
| Year Ended December 31, | ||||||||||||
| 2009 | 2008 | 2007 | ||||||||||
| Cash flows from operating activities |
||||||||||||
| Net income |
$ | 73,486 | $ | 10,917 | $ | 82,788 | ||||||
| Adjustments to reconcile net income to net cash provided by operating activities: |
||||||||||||
| Realized investment (gains) losses |
(26,310 | ) | 63,859 | 3,418 | ||||||||
| Depreciation and amortization |
8,352 | 13,955 | 12,778 | |||||||||
| Increase in insurance liabilities |
118,164 | 114,809 | 92,046 | |||||||||
| (Increase) decrease in premium receivables |
(3,245 | ) | (2,717 | ) | 4,048 | |||||||
| Increase in deferred policy acquisition costs |
(11,528 | ) | (5,539 | ) | (9,761 | ) | ||||||
| (Increase) decrease in reinsurance recoverable |
4,982 | (575 | ) | 1,806 | ||||||||
| Increase (decrease) in income tax liabilities |
23,352 | (21,578 | ) | 19,070 | ||||||||
| Other |
(8,351 | ) | (10,279 | ) | (4,548 | ) | ||||||
| Total adjustments |
105,416 | 151,935 | 118,857 | |||||||||
| Net cash provided by operating activities |
$ | 178,902 | $ | 162,852 | $ | 201,645 | ||||||
F-101
Table of Contents
The Company conducts and manages its business through four segments. The three operating segments, representing the major lines of insurance business, are: property and casualty insurance, principally personal lines automobile and homeowners products; annuity products, principally individual, tax-qualified fixed and variable deposits; and life insurance. The Company does not allocate the impact of corporate level transactions to the insurance segments, consistent with the basis for management’s evaluation of the results of those segments, but classifies those items in the fourth segment, corporate and other. In addition to ongoing transactions such as debt service, realized investment gains and losses and certain public company expenses, within the past five years such items have included debt retirement costs/gains and restructuring charges.
The accounting policies of the segments are the same as those described in “Note 1 — Summary of Significant Accounting Policies”. The Company accounts for intersegment transactions, primarily the allocation of agent and overhead costs from the corporate and other segment to the property and casualty, annuity and life segments, on a direct cost basis.
Summarized financial information for these segments is as follows:
| Year Ended December 31, | ||||||||||||
| 2009 | 2008 | 2007 | ||||||||||
| Insurance premiums and contract charges earned |
||||||||||||
| Property and casualty |
$ | 547,317 | $ | 541,125 | $ | 535,109 | ||||||
| Annuity |
14,472 | 17,754 | 21,760 | |||||||||
| Life |
97,801 | 99,653 | 97,388 | |||||||||
| Total |
$ | 659,590 | $ | 658,532 | $ | 654,257 | ||||||
| Net investment income |
||||||||||||
| Property and casualty |
$ | 34,407 | $ | 35,716 | $ | 38,002 | ||||||
| Annuity |
149,677 | 136,182 | 128,904 | |||||||||
| Life |
63,792 | 59,327 | 57,029 | |||||||||
| Corporate and other |
16 | 123 | 926 | |||||||||
| Intersegment eliminations |
(1,058 | ) | (1,079 | ) | (1,099 | ) | ||||||
| Total |
$ | 246,834 | $ | 230,269 | $ | 223,762 | ||||||
| Net income (loss) |
||||||||||||
| Property and casualty |
$ | 29,799 | $ | 28,087 | $ | 61,234 | ||||||
| Annuity |
21,258 | 17,342 | 17,560 | |||||||||
| Life |
18,431 | 16,415 | 17,275 | |||||||||
| Corporate and other |
3,998 | (50,927 | ) | (13,281 | ) | |||||||
| Total |
$ | 73,486 | $ | 10,917 | $ | 82,788 | ||||||
| December 31, | ||||||||||||
| 2009 | 2008 | 2007 | ||||||||||
| Assets |
||||||||||||
| Property and casualty |
$ | 916,347 | $ | 867,590 | $ | 908,209 | ||||||
| Annuity |
4,075,872 | 3,509,119 | 4,086,619 | |||||||||
| Life |
1,250,146 | 1,035,739 | 1,199,147 | |||||||||
| Corporate and other |
127,399 | 133,172 | 102,250 | |||||||||
| Intersegment eliminations |
(26,651 | ) | (37,902 | ) | (36,912 | ) | ||||||
| Total |
$ | 6,343,113 | $ | 5,507,718 | $ | 6,259,313 | ||||||
F-102
Table of Contents
NOTE 13 - Segment Information-(Continued)
Additional significant financial information for these segments is as follows:
| Year Ended December 31, | |||||||||||
| 2009 | 2008 | 2007 | |||||||||
| Policy acquisition expenses amortized |
|||||||||||
| Property and casualty |
$ | 62,181 | $ | 57,948 | $ | 58,583 | |||||
| Annuity |
6,572 | 10,781 | 7,310 | ||||||||
| Life |
11,646 | 10,405 | 9,766 | ||||||||
| Total |
$ | 80,399 | $ | 79,134 | $ | 75,659 | |||||
| Amortization of intangible assets |
|||||||||||
| Value of acquired insurance in force |
|||||||||||
| Annuity |
$ | — | $ | 4,037 | $ | 4,041 | |||||
| Life |
223 | 1,292 | 1,338 | ||||||||
| Total |
$ | 223 | $ | 5,329 | $ | 5,379 | |||||
| Income tax expense (benefit) |
|||||||||||
| Property and casualty |
$ | 5,919 | $ | 5,608 | $ | 23,437 | |||||
| Annuity |
11,020 | 3,225 | 8,366 | ||||||||
| Life |
10,422 | 9,235 | 9,321 | ||||||||
| Corporate and other |
2,660 | (28,807 | ) | (6,841 | ) | ||||||
| Total |
$ | 30,021 | $ | (10,739 | ) | $ | 34,283 | ||||
F-103
Table of Contents
NOTE 14 - Unaudited Selected Quarterly Financial Data
Selected quarterly financial data is presented below.
| Three Months Ended | |||||||||||||
| December 31, | September 30, | June 30, | March 31, | ||||||||||
| 2009 |
|||||||||||||
| Insurance premiums written and contract deposits |
$ | 245,907 | $ | 271,750 | $ | 264,679 | $ | 221,317 | |||||
| Total revenues |
235,886 | 241,530 | 237,642 | 222,369 | |||||||||
| Net income |
22,170 | 19,281 | 18,604 | 13,431 | |||||||||
| Per share information |
|||||||||||||
| Basic |
|||||||||||||
| Net income |
$ | 0.57 | $ | 0.49 | $ | 0.48 | $ | 0.34 | |||||
| Shares of common stock - weighted average (a) |
39,185 | 39,180 | 39,172 | 39,164 | |||||||||
| Diluted |
|||||||||||||
| Net income |
$ | 0.54 | $ | 0.48 | $ | 0.46 | $ | 0.33 | |||||
| Shares of common stock and equivalent shares - weighted average (a) |
40,613 | 40,640 | 40,532 | 40,385 | |||||||||
| 2008 |
|||||||||||||
| Insurance premiums written and contract deposits |
$ | 239,088 | $ | 251,420 | $ | 245,002 | $ | 224,587 | |||||
| Total revenues |
221,101 | 178,204 | 216,245 | 219,268 | |||||||||
| Net income (loss) |
22,927 | (30,808 | ) | 4,542 | 14,256 | ||||||||
| Per share information |
|||||||||||||
| Basic |
|||||||||||||
| Net income (loss) |
$ | 0.59 | $ | (0.79 | ) | $ | 0.11 | $ | 0.35 | ||||
| Shares of common stock - weighted average (a) |
39,062 | 39,062 | 40,116 | 41,055 | |||||||||
| Diluted |
|||||||||||||
| Net income (loss) |
$ | 0.58 | $ | (0.79 | ) | $ | 0.11 | $ | 0.34 | ||||
| Shares of common stock and equivalent shares - weighted average (a) |
39,824 | 39,062 | 41,225 | 42,146 | |||||||||
| 2007 |
|||||||||||||
| Insurance premiums written and contract deposits |
$ | 239,246 | $ | 254,422 | $ | 250,799 | $ | 230,278 | |||||
| Total revenues |
221,545 | 221,874 | 221,531 | 222,055 | |||||||||
| Net income |
18,032 | 18,322 | 23,166 | 23,268 | |||||||||
| Per share information |
|||||||||||||
| Basic |
|||||||||||||
| Net income |
$ | 0.42 | $ | 0.42 | $ | 0.54 | $ | 0.54 | |||||
| Shares of common stock - weighted average (a) |
42,953 | 43,288 | 43,223 | 43,118 | |||||||||
| Diluted |
|||||||||||||
| Net income |
$ | 0.41 | $ | 0.41 | $ | 0.52 | $ | 0.52 | |||||
| Shares of common stock and equivalent shares - weighted average (a) |
43,924 | 44,268 | 44,924 | 45,396 | |||||||||
| (a) | Rounded to thousands. |
F-104
Table of Contents
HORACE MANN EDUCATORS CORPORATION
SUMMARY OF INVESTMENTS-OTHER THAN INVESTMENTS IN RELATED PARTIES
December 31, 2009
(Dollars in thousands)
| Type of Investments |
Cost(1) | Fair Value | Amount shown in Balance Sheet | ||||||
| Fixed maturities: |
|||||||||
| U.S. Government and federally sponsored agency obligations |
$ | 797,833 | $ | 802,275 | $ | 802,275 | |||
| States, municipalities and political subdivisions |
891,174 | 913,949 | 913,949 | ||||||
| Foreign government bonds |
39,931 | 41,942 | 41,942 | ||||||
| Public utilities |
289,335 | 306,032 | 306,032 | ||||||
| Other corporate bonds |
2,043,747 | 2,035,667 | 2,035,667 | ||||||
| Total fixed maturity securities |
4,062,020 | 4,099,865 | 4,099,865 | ||||||
| Equity securities: |
|||||||||
| Non-redeemable preferred stocks |
60,652 | 58,006 | 58,006 | ||||||
| Common stocks |
855 | 1,672 | 1,672 | ||||||
| Total equity securities |
61,507 | 59,678 | 59,678 | ||||||
| Mortgage loans |
2,469 | XXX | 2,469 | ||||||
| Short-term investments |
299,109 | XXX | 299,109 | ||||||
| Short-term investments, loaned securities collateral |
— | XXX | — | ||||||
| Policy loans |
113,503 | XXX | 113,503 | ||||||
| Total investments |
$ | 4,538,608 | XXX | $ | 4,574,624 | ||||
| (1) | Bonds at original cost reduced by repayments and adjusted for amortization of premiums or accrual of discounts and impairment in value of specifically identified investments. |
See accompanying Report of Independent Registered Public Accounting Firm.
F-105
Table of Contents
HORACE MANN EDUCATORS CORPORATION
(Parent Company Only)
CONDENSED FINANCIAL INFORMATION OF REGISTRANT
BALANCE SHEETS
As of December 31, 2009 and 2008
(Dollars in thousands, except per share data)
| December 31, | ||||||||
| 2009 | 2008 | |||||||
| ASSETS | ||||||||
| Investments and cash |
$ | 21,420 | $ | 25,711 | ||||
| Investment in subsidiaries |
891,101 | 617,994 | ||||||
| Other assets |
49,766 | 48,992 | ||||||
| Total assets |
$ | 962,287 | $ | 692,697 | ||||
| LIABILITIES AND SHAREHOLDERS’ EQUITY | ||||||||
| Short-term debt |
$ | 38,000 | $ | 38,000 | ||||
| Long-term debt |
199,614 | 199,549 | ||||||
| Other liabilities |
5,128 | 6,303 | ||||||
| Total liabilities |
242,742 | 243,852 | ||||||
| Preferred stock, $0.001 par value, authorized 1,000,000 shares; none issued |
— | — | ||||||
| Common stock, $0.001 par value, authorized 75,000,000 shares; issued, 2009, 60,997,917; 2008, 60,874,984 |
61 | 61 | ||||||
| Additional paid-in capital |
358,081 | 355,542 | ||||||
| Retained earnings |
758,343 | 694,492 | ||||||
| Accumulated other comprehensive income (loss), net of taxes: |
||||||||
| Net unrealized gains and losses on fixed maturities and equity securities |
22,266 | (182,065 | ) | |||||
| Net funded status of pension and other postretirement benefit obligations |
(11,543 | ) | (11,522 | ) | ||||
| Treasury stock, at cost, 2009 and 2008, 21,813,196 shares |
(407,663 | ) | (407,663 | ) | ||||
| Total shareholders’ equity |
719,545 | 448,845 | ||||||
| Total liabilities and shareholders’ equity |
$ | 962,287 | $ | 692,697 | ||||
See accompanying note to condensed financial statements.
See accompanying Report of Independent Registered Public Accounting Firm.
F-106
Table of Contents
SCHEDULE II
HORACE MANN EDUCATORS CORPORATION
(Parent Company Only)
CONDENSED FINANCIAL INFORMATION OF REGISTRANT
STATEMENTS OF OPERATIONS
(Dollars in thousands)
| Year Ended December 31, | ||||||||||||
| 2009 | 2008 | 2007 | ||||||||||
| Revenues |
||||||||||||
| Net investment income |
$ | 21 | $ | 131 | $ | 925 | ||||||
| Realized investment gains |
— | 29 | 33 | |||||||||
| Total revenues |
21 | 160 | 958 | |||||||||
| Expenses |
||||||||||||
| Interest |
13,971 | 14,455 | 14,060 | |||||||||
| Other |
4,657 | 462 | 2,542 | |||||||||
| Total expenses |
18,628 | 14,917 | 16,602 | |||||||||
| Loss before income taxes and equity in net earnings of subsidiaries |
(18,607 | ) | (14,757 | ) | (15,644 | ) | ||||||
| Income tax benefit |
(6,047 | ) | (6,006 | ) | (5,090 | ) | ||||||
| Loss before equity in net earnings of subsidiaries |
(12,560 | ) | (8,751 | ) | (10,554 | ) | ||||||
| Equity in net earnings of subsidiaries |
86,046 | 19,668 | 93,342 | |||||||||
| Net income |
$ | 73,486 | $ | 10,917 | $ | 82,788 | ||||||
See accompanying note to condensed financial statements.
See accompanying Report of Independent Registered Public Accounting Firm.
F-107
Table of Contents
SCHEDULE II
HORACE MANN EDUCATORS CORPORATION
(Parent Company Only)
CONDENSED FINANCIAL INFORMATION OF REGISTRANT
STATEMENTS OF CASH FLOWS
(Dollars in thousands)
| Year Ended December 31, | ||||||||||||
| 2009 | 2008 | 2007 | ||||||||||
| Cash flows – operating activities |
||||||||||||
| Interest expense paid |
$ | (14,052 | ) | $ | (13,683 | ) | $ | (13,772 | ) | |||
| Federal income taxes recovered |
4,245 | 4,729 | 5,551 | |||||||||
| Cash dividends received from subsidiaries |
24,000 | 74,500 | 40,500 | |||||||||
| Other, net |
(8,848 | ) | (8,780 | ) | 2,850 | |||||||
| Net cash provided by operating activities |
5,345 | 56,766 | 35,129 | |||||||||
| Cash flows - investing activities |
||||||||||||
| Net (increase) decrease in investments |
4,591 | (25,538 | ) | 32,089 | ||||||||
| Net cash provided by (used in) investing activities |
4,591 | (25,538 | ) | 32,089 | ||||||||
| Cash flows - financing activities |
||||||||||||
| Dividends paid to shareholders |
(9,635 | ) | (14,964 | ) | (18,359 | ) | ||||||
| Purchase of treasury stock |
— | (54,338 | ) | (20,748 | ) | |||||||
| Exercise of stock options |
— | — | 4,477 | |||||||||
| Principal borrowings on Bank Credit Facility |
— | 38,000 | — | |||||||||
| Repurchase of Senior Convertible Notes |
— | — | (32,563 | ) | ||||||||
| Net cash used in financing activities |
(9,635 | ) | (31,302 | ) | (67,193 | ) | ||||||
| Net increase (decrease) in cash |
301 | (74 | ) | 25 | ||||||||
| Cash at beginning of period |
99 | 173 | 148 | |||||||||
| Cash at end of period |
$ | 400 | $ | 99 | $ | 173 | ||||||
See accompanying note to condensed financial statements.
See accompanying Report of Independent Registered Public Accounting Firm.
F-108
Table of Contents
SCHEDULE II
HORACE MANN EDUCATORS CORPORATION
(Parent Company Only)
CONDENSED FINANCIAL INFORMATION OF REGISTRANT
NOTE TO CONDENSED FINANCIAL STATEMENTS
The accompanying condensed financial statements should be read in conjunction with the Consolidated Financial Statements and the accompanying notes thereto.
F-109
Table of Contents
HORACE MANN EDUCATORS CORPORATION
SCHEDULE III: SUPPLEMENTARY INSURANCE INFORMATION
SCHEDULE VI: SUPPLEMENTAL INFORMATION CONCERNING PROPERTY AND CASUALTY INSURANCE OPERATIONS
(Dollars in thousands)
| Column identification for |
||||||||||||||||||||||||||||||||||||||||||||||
| Schedule III: |
A | B | C | D | E | F | G | H | I | J | K | |||||||||||||||||||||||||||||||||||
| Schedule VI: |
A | B | C | D | E | F | G |
|
H |
|
I | J | K | |||||||||||||||||||||||||||||||||
| Deferred policy acquisition costs |
Future policy benefits, claims and claims expenses |
Discount, if any, deducted in previous column |
Unearned premiums |
Other policy claims and benefits payable |
Premium revenue/ premium earned |
Net investment income |
Benefits, claims and settlement expenses |
Claims and claims adjustment expense incurred related to |
Amortization of deferred policy acquisition costs |
Other operating expenses |
Paid claims and claims adjustment expense |
Premiums written | ||||||||||||||||||||||||||||||||||
| Segment |
Current year |
Prior years |
||||||||||||||||||||||||||||||||||||||||||||
| Year Ended December 31, 2009 |
||||||||||||||||||||||||||||||||||||||||||||||
| Property and casualty |
$ | 22,846 | $ | 300,975 | $ | 0 | $ | 205,337 | $ | — | $ | 547,317 | $ | 34,407 | $ | 407,076 | $ | 418,803 | $ | (11,727 | ) | $ | 62,181 | $ | 75,468 | $ | 404,835 | $ | 553,498 | |||||||||||||||||
| Annuity |
163,722 | 2,373,555 | xxx | — | 113,588 | 14,472 | 149,677 | 99,458 | xxx | xxx | 6,572 | 28,947 | xxx | xxx | ||||||||||||||||||||||||||||||||
| Life |
89,556 | 909,315 | xxx | 5,428 | 3,761 | 97,801 | 63,792 | 91,547 | xxx | xxx | 11,646 | 32,398 | xxx | xxx | ||||||||||||||||||||||||||||||||
| Other, including consolidating eliminations |
N/A | — | xxx | N/A | N/A | — | (1,042 | ) | — | xxx | xxx | — | 18,627 | xxx | xxx | |||||||||||||||||||||||||||||||
| Total |
$ | 276,124 | $ | 3,583,845 | xxx | $ | 210,765 | $ | 117,349 | $ | 659,590 | $ | 246,834 | $ | 598,081 | xxx | xxx | $ | 80,399 | $ | 155,440 | xxx | xxx | |||||||||||||||||||||||
| Year Ended December 31, 2008 |
||||||||||||||||||||||||||||||||||||||||||||||
| Property and casualty |
$ | 21,331 | $ | 297,758 | $ | 0 | $ | 200,382 | $ | — | $ | 541,125 | $ | 35,716 | $ | 416,106 | $ | 434,206 | $ | (18,100 | ) | $ | 57,948 | $ | 70,596 | $ | 423,401 | $ | 545,873 | |||||||||||||||||
| Annuity |
193,459 | 2,172,533 | xxx | — | 124,529 | 17,754 | 136,182 | 95,165 | xxx | xxx | 10,781 | 32,291 | xxx | xxx | ||||||||||||||||||||||||||||||||
| Life |
97,256 | 886,324 | xxx | 6,196 | 3,830 | 99,653 | 59,327 | 92,059 | xxx | xxx | 10,405 | 34,036 | xxx | xxx | ||||||||||||||||||||||||||||||||
| Other, including consolidating eliminations |
N/A | — | xxx | N/A | N/A | — | (956 | ) | — | xxx | xxx | — | 15,253 | xxx | xxx | |||||||||||||||||||||||||||||||
| Total |
$ | 312,046 | $ | 3,356,615 | xxx | $ | 206,578 | $ | 128,359 | $ | 658,532 | $ | 230,269 | $ | 603,330 | xxx | xxx | $ | 79,134 | $ | 152,176 | xxx | xxx | |||||||||||||||||||||||
| Year Ended December 31, 2007 |
||||||||||||||||||||||||||||||||||||||||||||||
| Property and casualty |
$ | 20,624 | $ | 306,191 | $ | 0 | $ | 195,635 | $ | — | $ | 535,109 | $ | 38,002 | $ | 360,431 | $ | 380,399 | $ | (19,968 | ) | $ | 58,583 | $ | 72,343 | $ | 365,549 | $ | 535,217 | |||||||||||||||||
| Annuity |
146,177 | 2,018,024 | xxx | — | 133,863 | 21,760 | 128,904 | 90,172 | xxx | xxx | 7,310 | 32,974 | xxx | xxx | ||||||||||||||||||||||||||||||||
| Life |
94,988 | 856,582 | xxx | 6,892 | 4,607 | 97,388 | 57,029 | 85,134 | xxx | xxx | 9,766 | 36,601 | xxx | xxx | ||||||||||||||||||||||||||||||||
| Other, including consolidating eliminations |
N/A | — | xxx | N/A | N/A | — | (173 | ) | — | xxx | xxx | — | 16,620 | xxx | xxx | |||||||||||||||||||||||||||||||
| Total |
$ | 261,789 | $ | 3,180,797 | xxx | $ | 202,527 | $ | 138,470 | $ | 654,257 | $ | 223,762 | $ | 535,737 | xxx | xxx | $ | 75,659 | $ | 158,538 | xxx | xxx | |||||||||||||||||||||||
N/A Not applicable.
See accompanying Report of Independent Registered Public Accounting Firm.
F-110
Table of Contents
HORACE MANN EDUCATORS CORPORATION
REINSURANCE
(Dollars in thousands)
| Column A |
Column B | Column C | Column D | Column E | Column F | ||||||||||
| Gross Amount |
Ceded to Other Companies |
Assumed from Other Companies |
Net Amount | Percentage of Amount Assumed to Net |
|||||||||||
| Year ended December 31, 2009 |
|||||||||||||||
| Life insurance in force |
$ | 13,761,252 | $ | 2,397,121 | — | $ | 11,364,131 | — | |||||||
| Premiums |
|||||||||||||||
| Property and casualty |
$ | 572,887 | $ | 29,698 | $ | 4,128 | $ | 547,317 | 0.8 | % | |||||
| Annuity |
14,472 | — | — | 14,472 | — | ||||||||||
| Life |
103,272 | 5,471 | — | 97,801 | — | ||||||||||
| Total premiums |
$ | 690,631 | $ | 35,169 | $ | 4,128 | $ | 659,590 | 0.6 | % | |||||
| Year ended December 31, 2008 |
|||||||||||||||
| Life insurance in force |
$ | 13,671,845 | $ | 2,022,559 | — | $ | 11,649,286 | — | |||||||
| Premiums |
|||||||||||||||
| Property and casualty |
$ | 563,385 | $ | 27,129 | $ | 4,869 | $ | 541,125 | 0.9 | % | |||||
| Annuity |
17,754 | — | — | 17,754 | — | ||||||||||
| Life |
104,731 | 5,078 | — | 99,653 | — | ||||||||||
| Total premiums |
$ | 685,870 | $ | 32,207 | $ | 4,869 | $ | 658,532 | 0.7 | % | |||||
| Year ended December 31, 2007 |
|||||||||||||||
| Life insurance in force |
$ | 13,576,538 | $ | 1,800,836 | — | $ | 11,775,702 | — | |||||||
| Premiums |
|||||||||||||||
| Property and casualty |
$ | 562,061 | $ | 34,379 | $ | 7,427 | $ | 535,109 | 1.4 | % | |||||
| Annuity |
21,760 | — | — | 21,760 | — | ||||||||||
| Life |
102,593 | 5,205 | — | 97,388 | — | ||||||||||
| Total premiums |
$ | 686,414 | $ | 39,584 | $ | 7,427 | $ | 654,257 | 1.1 | % | |||||
NOTE: Premiums above include insurance premiums earned and contract charges earned.
See accompanying Report of Independent Registered Public Accounting Firm.
F-111
Table of Contents
HORACE MANN EDUCATORS CORPORATION
EXHIBITS
To
FORM 10-K
For the Year Ended December 31, 2009
VOLUME 1 OF 1
Table of Contents
The following items are filed as Exhibits to Horace Mann Educators Corporation’s (“HMEC”) Annual Report on Form 10-K for the year ended December 31, 2009. Management contracts and compensatory plans are indicated by an asterisk (*).
EXHIBIT INDEX
| Exhibit No. |
Description | |||
| (3) | Articles of incorporation and bylaws: | |||
| 3.1 | Restated Certificate of Incorporation of HMEC, filed with the Delaware Secretary of State on June 24, 2003, incorporated by reference to Exhibit 3.1 to HMEC’s Quarterly Report on Form 10-Q for the quarter ended June 30, 2003, filed with the Securities and Exchange Commission (the “SEC”) on August 14, 2003. | |||
| 3.2 | Form of Certificate for shares of Common Stock, $0.001 par value per share, of HMEC, incorporated by reference to Exhibit 4.5 to HMEC’s Registration Statement on Form S-3 (Registration No. 33-53118) filed with the SEC on October 9, 1992. | |||
| 3.3 | Bylaws of HMEC, incorporated by reference to Exhibit 3.2 to HMEC’s Quarterly Report on Form 10-Q for the quarter ended June 30, 2003, filed with the SEC on August 14, 2003. | |||
| (4) | Instruments defining the rights of security holders, including indentures: | |||
| 4.1 | Indenture, dated as of June 9, 2005, between HMEC and The Bank of New York Mellon Trust Company, N.A., as trustee (formerly JPMorgan Chase Bank, N.A. was trustee), incorporated by reference to Exhibit 4.1 to HMEC’s Current Report on Form 8-K dated June 6, 2005, filed with the SEC on June 9, 2005. | |||
| 4.1(a) | First Supplemental Indenture, dated as of June 9, 2005, between HMEC and The Bank of New York Mellon Trust Company, N.A., as trustee (formerly JPMorgan Chase Bank, N.A. was trustee), incorporated by reference to Exhibit 4.2 to HMEC’s Current Report on Form 8-K dated June 6, 2005, filed with the SEC on June 9, 2005. | |||
| 4.1(b) | Form of HMEC 6.05% Senior Notes Due 2015 (included in Exhibit 4.1(a)). | |||
| 4.1(c) | Second Supplemental Indenture, dated as of April 21, 2006, between HMEC and The Bank of New York Mellon Trust Company, N.A., as trustee (formerly JPMorgan Chase Bank, N.A. was trustee), incorporated by reference to Exhibit 4.3 to HMEC’s Current Report on Form 8-K dated April 18, 2006, filed with the SEC on April 21, 2006. | |||
| 4.1(d) | Form of HMEC 6.85% Senior Notes due April 15, 2016 (included in Exhibit 4.1(c)). | |||
-1-
Table of Contents
| Exhibit No. |
Description | |||
| 4.2 | Certificate of Designations for HMEC Series A Cumulative Convertible Preferred Stock, incorporated by reference to Exhibit 4.3 to HMEC’s Annual Report on Form 10-K for the year ended December 31, 2005, filed with the SEC on March 16, 2006. | |||
| (10) | Material contracts: | |||
| 10.1 | Amended and Restated Credit Agreement dated as of December 19, 2006 among HMEC, certain financial institutions named therein and Bank of America, N.A., as administrative agent, incorporated by reference to Exhibit 10.1 to HMEC’s Annual Report on Form 10-K for the year ended December 31, 2006, filed with the SEC on March 1, 2007. | |||
| 10.2* | Amended and Restated Horace Mann Educators Corporation Deferred Equity Compensation Plan for Directors, incorporated by reference to Exhibit 10.2 to HMEC’s Annual Report on Form 10-K for the year ended December 31, 2008, filed with the SEC on March 2, 2009. | |||
| 10.3* | Amended and Restated Horace Mann Educators Corporation Deferred Compensation Plan for Employees, incorporated by reference to Exhibit 10.3 to HMEC’s Annual Report on Form 10-K for the year ended December 31, 2008, filed with the SEC on March 2, 2009. | |||
| 10.4* | Amended and Restated Horace Mann Educators Corporation 1991 Stock Incentive Plan, incorporated by reference to Exhibit 10.5 to HMEC’s Annual Report on Form 10-K for the year ended December 31, 1999, filed with the SEC on March 30, 2000. | |||
| 10.4(a)* | Amendment to Amended and Restated Horace Mann Educators Corporation 1991 Stock Incentive Plan, incorporated by reference to Exhibit 10.1(a) to HMEC’s Quarterly Report on Form 10-Q for the quarter ended June 30, 2000, filed with the SEC on August 11, 2000. | |||
| 10.4(b)* | Specimen Employee Stock Option Agreement under the Horace Mann Educators Corporation 1991 Stock Incentive Plan, incorporated by reference to Exhibit 10.5(a) to HMEC’s Annual Report on Form 10-K for the year ended December 31, 1999, filed with the SEC on March 30, 2000. | |||
| 10.4(c)* | Specimen Director Stock Option Agreement under the Horace Mann Educators Corporation 1991 Stock Incentive Plan, incorporated by reference to Exhibit 10.5(b) to HMEC’s Annual Report on Form 10-K for the year ended December 31, 1999, filed with the SEC on March 30, 2000. | |||
| 10.5* | Horace Mann Educators Corporation 2001 Stock Incentive Plan, incorporated by reference to Exhibit 10.6 to HMEC’s Annual Report on Form 10-K for the year ended December 31, 2001, filed with the SEC on March 29, 2002. | |||
-2-
Table of Contents
| Exhibit No. |
Description | |||
| 10.5(a)* |
Specimen Employee Stock Option Agreement under the Horace Mann Educators Corporation 2001 Stock Incentive Plan, incorporated by reference to Exhibit 10.6(a) to HMEC’s Annual Report on Form 10-K for the year ended December 31, 2001, filed with the SEC on March 29, 2002. | |||
| 10.5(b)* |
Specimen Director Stock Option Agreement under the Horace Mann Educators Corporation 2001 Stock Incentive Plan, incorporated by reference to Exhibit 10.6(b) to HMEC’s Annual Report on Form 10-K for the year ended December 31, 2001, filed with the SEC on March 29, 2002. | |||
| 10.6* |
Horace Mann Educators Corporation Amended and Restated 2002 Incentive Compensation Plan (“2002 Incentive Compensation Plan”), incorporated by reference to Exhibit 10.2 to HMEC’s Quarterly Report on Form 10-Q for the quarter ended June 30, 2005, filed with the SEC on August 9, 2005. | |||
| 10.6(a)* |
Specimen Employee Stock Option Agreement under the 2002 Incentive Compensation Plan, incorporated by reference to Exhibit 10.2(a) to HMEC’s Quarterly Report on Form 10-Q for the quarter ended June 30, 2002, filed with the SEC on August 14, 2002. | |||
| 10.6(b)* |
Revised Specimen Employee Stock Option Agreement under the 2002 Incentive Compensation Plan, incorporated by reference to Exhibit 10.6(b) to HMEC’s Annual Report on Form 10-K for the year ended December 31, 2008, filed with the SEC on March 2, 2009. | |||
| 10.6(c)* |
Specimen Regular Employee Stock Option Agreement under the 2002 Incentive Compensation Plan, incorporated by reference to Exhibit 10.2(b) to HMEC’s Quarterly Report on Form 10-Q for the quarter ended June 30, 2002, filed with the SEC on August 14, 2002. | |||
| 10.6(d)* |
Specimen Director Stock Option Agreement under the 2002 Incentive Compensation Plan, incorporated by reference to Exhibit 10.2(c) to HMEC’s Quarterly Report on Form 10-Q for the quarter ended June 30, 2002, filed with the SEC on August 14, 2002. | |||
| 10.6(e)* |
Specimen Employee Restricted Stock Unit Agreement under the 2002 Incentive Compensation Plan, incorporated by reference to Exhibit 10.6(d) to HMEC’s Annual Report on Form 10-K for the year ended December 31, 2005, filed with the SEC on March 16, 2006. | |||
| 10.6(f)* |
Revised Specimen Employee Restricted Stock Unit Agreement under the 2002 Incentive Compensation Plan, incorporated by reference to Exhibit 10.6(f) to HMEC’s Annual Report on Form 10-K for the year ended December 31, 2008, filed with the SEC on March 2, 2009. | |||
-3-
Table of Contents
| Exhibit No. |
Description | |||
| 10.6(g)* |
Specimen Non-employee Director Restricted Stock Unit Agreement under the 2002 Incentive Compensation Plan, incorporated by reference to Exhibit 10.6(e) to HMEC’s Annual Report on Form 10-K for the year ended December 31, 2005, filed with the SEC on March 16, 2006. | |||
| 10.6(h)* |
Revised Specimen Non-employee Director Restricted Stock Unit Agreement under the 2002 Incentive Compensation Plan, incorporated by reference to Exhibit 10.6(h) to HMEC’s Annual Report on Form 10-K for the year ended December 31, 2008, filed with the SEC on March 2, 2009. | |||
| 10.6(i)* |
Specimen Restricted Stock Unit Deferral Election Form under the 2002 Incentive Compensation Plan, incorporated by reference to Exhibit 10.6(f) to HMEC’s Annual Report on Form 10-K for the year ended December 31, 2005, filed with the SEC on March 16, 2006. | |||
| 10.6(j)* |
Revised Specimen Restricted Stock Unit Deferral Election Forms under the 2002 Incentive Compensation Plan, incorporated by reference to Exhibit 10.6(j) to HMEC’s Annual Report on Form 10-K for the year ended December 31, 2008, filed with the SEC on March 2, 2009. | |||
| 10.6(k)* |
Specimen Modification to Stock Options outstanding as of June 30, 2004, incorporated by reference to Exhibit 10.2(d) to HMEC’s Quarterly Report on Form 10-Q for the quarter ended June 30, 2004, filed with the SEC on August 9, 2004. | |||
| 10.7* |
Horace Mann Supplemental Employee Retirement Plan, 2002 Restatement, incorporated by reference to Exhibit 10.1 to HMEC’s Quarterly Report on Form 10-Q for the quarter ended March 31, 2002, filed with the SEC on May 15, 2002. | |||
| 10.8* |
Horace Mann Executive Supplemental Employee Retirement Plan, 2002 Restatement, incorporated by reference to Exhibit 10.2 to HMEC’s Quarterly Report on Form 10-Q for the quarter ended March 31, 2002, filed with the SEC on May 15, 2002. | |||
| 10.9* |
Amended and Restated Horace Mann Nonqualified Supplemental Money Purchase Pension Plan, incorporated by reference to Exhibit 10.9 to HMEC’s Annual Report on Form 10-K for the year ended December 31, 2008, filed with the SEC on March 2, 2009. | |||
| 10.10* |
Summary of HMEC Non-Employee Director Compensation, incorporated by reference to Exhibit 10.10 to HMEC’s Current Report on Form 8-K dated May 28, 2009, filed with the SEC on June 2, 2009. | |||
-4-
Table of Contents
| Exhibit No. |
Description | |||
| 10.11* |
Summary of HMEC Named Executive Officer Annualized Salaries, incorporated by reference to Exhibit 10.11 to HMEC’s Quarterly Report on Form 10-Q for the quarter ended March 31, 2009, filed with the SEC on May 8, 2009. | |||
| 10.12* |
Form of Severance Agreement between HMEC, Horace Mann Service Corporation (“HMSC”) and certain officers of HMEC and/or HMSC, incorporated by reference to Exhibit 10.12 to HMEC’s Annual Report on Form 10-K for the year ended December 31, 2008, filed with the SEC on March 2, 2009. | |||
| 10.12(a)* |
Revised Schedule to Severance Agreements between HMEC, HMSC and certain officers of HMEC and/or HMSC, incorporated by reference to Exhibit 10.12(a) to HMEC’s Annual Report on Form 10-K for the year ended December 31, 2008, filed with the SEC on March 2, 2009. | |||
| 10.13* |
Form of Change in Control Agreement between HMEC, HMSC and certain officers of HMEC and/or HMSC, incorporated by reference to Exhibit 10.13 to HMEC’s Annual Report on Form 10-K for the year ended December 31, 2008, filed with the SEC on March 2, 2009. | |||
| 10.13(a)* |
Revised Schedule to Change in Control Agreement between HMEC, HMSC and certain officers of HMEC and/or HMSC, incorporated by reference to Exhibit 10.13(a) to HMEC’s Quarterly Report on Form 10-Q for the quarter ended March 31, 2009, filed with the SEC on May 8, 2009. | |||
| 10.14* |
Employment Agreement between HMEC and Louis G. Lower II as of December 31, 1999, incorporated by reference to Exhibit 10.12 to HMEC’s Annual Report on Form 10-K for the year ended December 31, 1999, filed with the SEC on March 30, 2000. | |||
| 10.14(a)* |
Amendment to Employment Agreement between HMEC and Louis G. Lower II as of January 1, 2008, incorporated by reference to Exhibit 10.14(a) to HMEC’s Annual Report on Form 10-K for the year ended December 31, 2008, filed with the SEC on March 2, 2009. | |||
| 10.14(b)* |
Second Amendment to Employment Agreement between HMEC and Louis G. Lower II as of September 30, 2009, incorporated by reference to Exhibit 10.14(b) to HMEC’s Quarterly Report on Form 10-Q for the quarter ended September 30, 2009, filed with the SEC on November 6, 2009. | |||
| 10.15* |
Employment Agreement between HMSC and Stephen P. Cardinal as of November 20, 2008, incorporated by reference to Exhibit 10.15 to HMEC’s Annual Report on Form 10-K for the year ended December 31, 2008, filed with the SEC on March 2, 2009. | |||
-5-
Table of Contents
| Exhibit No. |
Description | |||
| 10.16* |
Letter of Employment between HMSC and Brent H. Hamann effective February 9, 2009, incorporated by reference to Exhibit 10.16 to HMEC’s Quarterly Report on Form 10-Q for the quarter ended March 31, 2009, filed with the SEC on May 8, 2009. | |||
| (11) | Statement regarding computation of per share earnings. |
| (12) | Statement regarding computation of ratios. |
| (21) | Subsidiaries of HMEC. |
| (23) | Consent of KPMG LLP. |
| (31) | Certification pursuant to Section 302 of the Sarbanes-Oxley Act of 2002. |
| 31.1 | Certification by Louis G. Lower II, Chief Executive Officer of HMEC. |
| 31.2 | Certification by Peter H. Heckman, Chief Financial Officer of HMEC. |
| (32) | Certification pursuant to Section 906 of the Sarbanes-Oxley Act of 2002. |
| 32.1 | Certification by Louis G. Lower II, Chief Executive Officer of HMEC. |
| 2.2 | Certification by Peter H. Heckman, Chief Financial Officer of HMEC. |
| (99) | Additional exhibits |
| 99.1 | Glossary of Selected Terms. |
-6-