UNITED STATES SECURITIES AND EXCHANGE COMMISSION
Washington, D.C. 20549
Form 10-K
| |
|
|
| þ |
|
ANNUAL REPORT PURSUANT TO SECTION 13 OR 15(d) OF THE SECURITIES EXCHANGE ACT OF 1934 |
For the fiscal year ended December 31, 2009
or
| |
|
|
| o |
|
TRANSITION REPORT PURSUANT TO SECTION 13 OR 15(d) OF THE SECURITIES EXCHANGE ACT OF 1934 |
For the transition period from to
Commission file number: 000-50536
CROSSTEX ENERGY, INC.
(Exact name of registrant as specified in its charter)
| |
|
|
Delaware
(State or other jurisdiction of
incorporation or organization)
|
|
52-2235832
(I.R.S. Employer
Identification No.) |
| |
|
|
2501 CEDAR SPRINGS
DALLAS, TEXAS
(Address of principal executive offices)
|
|
75201
(Zip Code) |
(214) 953-9500
(Registrant’s telephone number, including area code)
Securities registered pursuant to Section 12(b) of the Act:
| |
|
|
| Title of Each Class
|
|
Name of Exchange on Which Registered |
|
|
|
|
| Common Stock, Par Value $0.01 Per Share
|
|
The NASDAQ Global Select Market |
Securities registered pursuant to Section 12(g) of the Act:
None.
Indicate by check mark if registrant is a well-known seasoned issuer, as defined in Rule 405
of the Securities Act. Yes o No þ
Indicate by check mark if registrant is not required to file reports pursuant to Section 13 or
Section 15(d) of the Act. Yes o No þ
Indicate by check mark whether registrant (1) has filed all reports required to be filed by
Section 13 or 15(d) of the Securities Exchange Act of 1934 during the preceding 12 months (or for
such shorter period that the registrant was required to file such reports), and (2) has been
subject to such filing requirements for the past 90 days. Yes þ No o
Indicate by check mark whether the registrant has submitted electronically and posted on its
corporate Web site, if any, every Interactive Data File required to be submitted and posted
pursuant to Rule 405 of Regulation S-T during the preceding 12 months (or for such shorter period
that the registrant was required to submit and post such files). Yes o No o
Indicate by check mark if disclosure of delinquent filers pursuant to Item 405 of Regulation
S-K is not contained herein, and will not be contained, to the best of registrant’s knowledge, in
definitive proxy or information statements incorporated by reference in Part III of this Form 10-K
or any amendment to this Form 10-K. o
Indicate by check mark whether the registrant is a large accelerated filer, an accelerated
filer, a non-accelerated filer or a smaller reporting company. See the definitions of “large
accelerated filer,” “accelerated filer” and “smaller reporting company” in Rule 12b-2 of the
Exchange Act. (Check one):
| |
|
|
|
|
|
|
| Large accelerated filer o
|
|
Accelerated filer þ
|
|
Non-accelerated filer o
|
|
Smaller reporting company o |
|
|
|
|
|
(Do not check if a smaller reporting company) |
|
|
Indicate by check mark whether the registrant is a shell company (as defined in Rule 12b-2 of
the Act). Yes o No þ
The aggregate market value of the voting and non-voting common equity held by non-affiliates
of the registrant was approximately $96,476,248 on June 30, 2009, based on $4.17 per share, the
closing price of the Common Stock as reported on the NASDAQ Global Select Market on such date.
At February 16, 2010, there were 46,541,360 shares of common stock outstanding.
DOCUMENTS INCORPORATED BY REFERENCE:
Portions of the Registrant’s Proxy Statement relating to its 2010 Annual Stockholders’ Meeting
to be filed with the Securities and Exchange Commission are incorporated by reference herein into
Part III of this Report.
TABLE OF CONTENTS
DESCRIPTION
2
CROSSTEX ENERGY, INC.
PART I
Item 1. Business
General
Crosstex Energy, Inc. is a Delaware corporation, formed in April 2000. We completed our
initial public offering in January 2004. Our shares of common stock are listed on the NASDAQ Global
Select Market under the symbol “XTXI”. Our executive offices are located at 2501 Cedar Springs,
Dallas, Texas 75201, and our telephone number is (214) 953-9500. Our Internet address is
www.crosstexenergy.com. In the “Investors” section of our web site, we post the following
filings as soon as reasonably practicable after they are electronically filed with or furnished to
the Securities and Exchange Commission: our annual report on Form 10-K; our quarterly reports on
Form 10-Q; our current reports on Form 8-K; and any amendments to those reports or statements filed
or furnished pursuant to Section 13(a) or 15(d) of the Securities Exchange Act of 1934, as amended.
All such filings on our web site are available free of charge. In this report, the term “Crosstex
Energy, Inc.” as well as the terms “our,” “we,” and “us,” or like terms, are sometimes used as
references to Crosstex Energy, Inc. and its consolidated subsidiaries. References in this report to
“Crosstex Energy, L.P.,” the “Partnership,” “CELP” or like terms refer to Crosstex Energy, L.P.
itself or Crosstex Energy, L.P. together with its consolidated subsidiaries.
CROSSTEX ENERGY, INC.
Our assets consist almost exclusively of partnership interests in Crosstex Energy, L.P., a
publicly traded limited partnership engaged in the gathering, transmission, processing and
marketing of natural gas and natural gas liquids, or NGLs. These partnership interests consist of
the following:
| |
• |
|
16,414,830 common units representing an aggregate 25.0% limited partner interest in the
Partnership as of January 31, 2010, and |
| |
• |
|
100.0% ownership interest in Crosstex Energy GP, L.P., the general partner of the
Partnership, which owns a 2.0% general partner interest and all of the incentive
distribution rights in the Partnership. |
Our cash flows consist almost exclusively of distributions from the Partnership on the
partnership interests we own. The Partnership is required by its partnership agreement to
distribute all its cash on hand at the end of each quarter, less reserves established by its
general partner in its sole discretion to provide for the proper conduct of the Partnership’s
business or to provide for future distributions.
The incentive distribution rights entitle us to receive an increasing percentage of cash
distributed by the Partnership as certain target distribution levels are reached. Specifically,
they entitle us to receive 13.0% of all cash distributed in a quarter after each unit has received
$0.25 for that quarter, 23.0% of all cash distributed after each unit has received $0.3125 for that
quarter and 48.0% of all cash distributed after each unit has received $0.375 for that quarter.
Prior to 2009, we received quarterly distributions from the Partnership with the last
distribution for the fourth quarter of 2008 received in February 2009. During 2009, the
Partnership’s ability to distribute available cash was contractually restricted by the terms of its
credit facility due to its high leverage ratios and it ceased making distributions. Although the
Partnership’s new credit facility should not limit its ability to make distributions during 2010
and in the future, any decision to resume cash distributions on its units and the amount of any
such distributions would consider maintaining sufficient cash flow in excess of the distribution to
continue to move the Partnership towards lower leverage ratios. The Partnership has established a
target over the next couple of years of achieving a ratio of total debt to Adjusted EBITDA
(earnings before interest, income taxes, depreciation and amortization, non-cash mark-to-market
items and other miscellaneous non-cash items) of less than 4.0 to 1.0, and the Partnership does not
currently expect to resume cash distributions on its outstanding units until it achieves such a
ratio of less than 4.5 to 1.0 (pro forma for any distribution). The Partnership will also consider
general economic conditions and its outlook for business as it determines to pay any distribution.
Since our cash flows consist almost exclusively of distributions from the Partnership on the
partnership interests we own, we do not expect to receive any significant cash flows until the
Partnership is able to improve its leverage ratio and begin making distributions again. As of
December 31, 2009, we have cash of $9.9 million which we expect to be sufficient to pay our
expenses and federal income taxes and to fund our general partner contributions over the next
several years based on our forecasted cash flows. We do not anticipate making any future dividend
payments until we begin receiving distributions from the Partnership again.
3
Historically we have paid dividends to our stockholders on a quarterly basis equal to the cash
we receive from our Partnership distributions, less reserves for expenses, future dividends and
other uses of cash, including:
| |
• |
|
federal income taxes, which we are required to pay because we are taxed as a
corporation; |
| |
• |
|
the expenses of being a public company; |
| |
• |
|
other general and administrative expenses; |
| |
• |
|
capital contributions to the Partnership upon the issuance by it of additional
partnership securities in order to maintain the general partner’s 2.0% general partner
interest; and |
| |
• |
|
cash reserves our board of directors believed were prudent to maintain. |
Our ability to pay dividends is limited by the Delaware General Corporation Law, which
provides that a corporation may only pay dividends out of existing “surplus,” which is defined as
the amount by which a corporation’s net assets exceeds its stated capital. While our ownership of
the general partner and the common units of the Partnership are included in our calculation of net
assets, the value of these assets may decline to a level where we have no “surplus,” thus
prohibiting us from paying dividends under Delaware law.
So long as we own the Partnership’s general partner, under the terms of an omnibus agreement
with the Partnership we are prohibited from engaging in the business of gathering, transmitting,
treating, processing, storing and marketing natural gas and transporting, fractionating, storing
and marketing NGLs, except to the extent that the Partnership, with the concurrence of a majority
of its independent directors comprising its conflicts committee, elects not to engage in a
particular acquisition or expansion opportunity. The Partnership may elect to forego an opportunity
for several reasons, including:
| |
• |
|
the nature of some or all of the target’s assets or income might affect the
Partnership’s ability to be taxed as a partnership for federal income tax purposes; |
| |
• |
|
the board of directors of Crosstex Energy GP, LLC, the general partner of the general
partner of the Partnership, may conclude that some or all of the target assets are not a
good strategic opportunity for the Partnership; or |
| |
• |
|
the seller may desire equity, rather than cash, as consideration or may not want to
accept the Partnership’s units as consideration. |
We have no present intention of engaging in additional operations or pursuing the types of
opportunities that we are permitted to pursue under the omnibus agreement, although we may decide
to pursue them in the future, either alone or in combination with the Partnership. In the event
that we pursue the types of opportunities that we are permitted to pursue under the omnibus
agreement, our board of directors, in its sole discretion, may retain all, or a portion of, the
cash distributions we receive on our partnership interests in the Partnership to finance all, or a
portion of, such transactions, which may reduce or eliminate dividends paid to our stockholders.
CROSSTEX ENERGY, L.P.
Crosstex Energy, L.P. is an independent midstream energy company engaged in the gathering,
transmission, processing and marketing of natural gas and NGLs. It connects the wells of natural
gas producers in its market areas to its gathering systems, processes natural gas for the removal
of NGLs, fractionates NGLs into purity products and markets those products for a fee, transports
natural gas and ultimately provides natural gas to a variety of markets. It purchases natural gas
from natural gas producers and other supply points and sells that natural gas to utilities,
industrial consumers, other marketers and pipelines. It operates processing plants that process gas
transported to the plants by major interstate pipelines or from its own gathering systems under a
variety of fee arrangements. In addition, it purchases natural gas from producers not connected to
its gathering systems for resale and sells natural gas on behalf of producers for a fee.
As generally used in the energy industry and in this document, the following terms have the
following meanings:
/d = per day
Bbls = barrels
Bcf = billion cubic feet
Btu = British thermal units
Mcf = thousand cubic feet
MMBtu = million British thermal units
MMcf = million cubic feet
NGL = natural gas liquid
4
Capacity volumes for the Partnership’s facilities are measured based on physical volume and
stated in cubic feet (Bcf, Mcf or MMcf). Throughput volumes are measured based on energy content
and stated in British thermal units (Btu or MMBtu). A volume capacity of 100 MMcf generally
correlates to volume throughput of 100,000 MMBtu.
Operations of the Partnership
The Partnership focuses on the gathering, processing, transmission and marketing of natural
gas and NGLs. Its combined midstream assets consist of over 3,300 miles of natural gas gathering
and transmission pipelines, nine natural gas processing plants and three fractionators located in
two primary regions: north Texas and Louisiana. Its gathering systems consist of a network of
pipelines that collect natural gas from points near producing wells and transport it to larger
pipelines for further transmission. The Partnership’s transmission pipelines primarily receive
natural gas from its gathering systems and from third party gathering and transmission systems and
deliver natural gas to industrial end-users, utilities and other pipelines. Its processing plants
remove NGLs from a natural gas stream and its fractionators separate the NGLs into separate NGL
products, including ethane, propane, iso- and normal butanes and natural gasoline.
The Partnership assets include the following:
| |
• |
|
North Texas Assets. The North Texas Assets are comprised of gathering, processing and
transmission assets serving producers active in the Barnett Shale. The gathering systems in
north Texas consist of approximately 600 miles of gathering lines with total capacity of
approximately 1,100 MMcf/d and total throughput of approximately 793,000 MMBtu/d for the
year ended December 31, 2009. Processing facilities in north Texas include three gas
processing plants with a total processing capacity of 280 MMcf/d. Total processing
throughput averaged 219,000 MMBtu/d for the year ended December 31, 2009. Transmission
assets consist of a 140-mile pipeline from an area near Fort Worth, Texas to a point near
Paris, Texas, and related facilities. The capacity on the North Texas Pipeline, or NTP, is
approximately 375 MMcf/d. The NTP connects production from the Barnett Shale to markets in
north Texas and to markets accessed by the Natural Gas Pipeline Company, or NGPL, Kinder
Morgan, Houston Pipeline, or HPL, Atmos, Gulf Crossing and other markets. For the year
ended December 31, 2009, the total throughput on the NTP was approximately 318,000 MMBtu/d. |
| |
• |
|
Crosstex LIG System. The Crosstex LIG system is one of the largest intrastate pipeline
systems in Louisiana, consisting of approximately 2,100 miles of gathering and transmission
pipeline, with an average total throughput of approximately 900,000 MMBtu/d for the year
ended December 31, 2009. The system also includes two operating, on-system processing
plants, Plaquemine and Gibson, with an average throughput of approximately 269,000 MMBtu/d
for the year ended December 31, 2009. The system has access to both rich and lean gas
supplies. These supplies reach from the Haynesville Shale in north Louisiana to new onshore
production in south central and southeast Louisiana. Crosstex LIG has a variety of
transportation and industrial sales customers, with the majority of its sales being made
into the industrial Mississippi River corridor between Baton Rouge and New Orleans. |
| |
• |
|
South Louisiana Processing and NGL Assets. The Partnership’s south Louisiana natural
gas processing and liquids assets include a total of 2.0 Bcf/d of processing capacity,
66,000 Bbls/d of fractionation capacity, 2.4 million barrels of underground storage and
approximately 400 miles of liquids transport lines. The assets include the Eunice
processing plant and fractionation facility; the Pelican, Sabine and Blue Water processing
plants; the Riverside fractionation plant; the Napoleonville storage facility; the Cajun
Sibon pipeline system and the Intracoastal Pipeline. Total processing throughput averaged
856,000 MMBtu/d during December 2009. The Eunice plant is connected to onshore gas supply,
as well as continental shelf and deepwater gas production. The Pelican and Sabine plants
are connected with continental shelf and deepwater gas. The various plants have downstream
connections to the ANR Pipeline, Florida Gas Transmission, Texas Gas Transmission,
Tennessee Gas Pipeline and Transco. |
5
Business Strategy
From the inception of the Partnership in 2002 until the second half of 2008, the Partnership’s
long-term strategy had been to increase distributable cash flow per unit by accomplishing economies
of scale through new construction or expansion in core operating areas and making accretive
acquisitions of assets that are essential to the production, transportation and marketing of
natural gas and NGLs. In response to volatility in the commodity and capital markets over the last 18
months and other events, including the substantial decline in commodity prices, the Partnership
adjusted its business strategy in the fourth quarter 2008 and in 2009 to focus on maximizing
liquidity, improving the balance sheet through debt reduction and other methods, maintaining a
stable asset base, improving the profitability of its assets by increasing their utilization while
controlling costs and reducing capital expenditures. Consistent with this strategy, the Partnership
divested non-core assets since October 2008 for aggregate sale proceeds of $618.7 million and
substantially reduced its outstanding debt. During 2010 the Partnership plans to continue its focus
on (i) improving existing system profitability, (ii) continuing to improve the balance sheet and
financial flexibility and (iii) pursuing strategic acquisitions and undertaking selective
construction and expansion opportunities. Key elements of the strategy will include the following:
| |
• |
|
Improve existing system profitability. The Partnership intends to operate its existing
asset base to enhance profitability by continuing initiatives to maximize utilization by
improving operations, reducing operating costs and renegotiating contracts, when
appropriate, to improve economics. The Partnership has a solid base of assets that are well
located to benefit from the continued growth in the Barnett Shale in north Texas and the
new growth anticipated from the Haynesville Shale located in northern Louisiana. It markets
services directly to both producers and end users in order to connect new supplies of
natural gas, contract new end user deliveries, improve margins and manage operations to
fully utilize its systems’ capacities. As part of this process, the Partnership focuses on
providing a full range of services to producers and end users, including supply aggregation
and transportation and hedging, which it believes provides a competitive advantage when
competing for sources of natural gas supply. |
| |
• |
|
Continue to improve the balance sheet and financial flexibility. The Partnership
intends to continue to improve its balance sheet and financial flexibility. It has
established a target over the next couple of years of achieving a ratio of total debt to
Adjusted EBITDA (earnings before interest, income taxes, depreciation and amortization, non-cash
mark-to-market items and other miscellaneous non-cash items) of less than 4.0 to 1.0, and it does not currently expect to resume cash
distributions on its outstanding units until it achieves such a ratio of less than 4.5 to
1.0 (pro forma for any distribution). In addition, any decision to resume cash
distributions on partnership units and the amount of any such distributions would consider
maintaining sufficient cash flow in excess of the distribution to continue to move towards
lower leverage levels. The Partnership will also consider general economic conditions and
the outlook for its business as it determines to pay any distribution. The Partnership’s
2010 capital expenditure budget includes approximately $25.0 million of identified growth
projects, and it expects to fund such expenditures with internally generated cash flow,
with any excess cash flow applied towards debt, working capital or new projects. The
Partnership will also consider the use of alternative financing strategies such as entering
into joint venture arrangements. As of February 12, 2010, after repayment of existing debt
and borrowings under new debt agreements in January and early February 2010 discussed under
“Recent Developments,” the Partnership has approximately $193.1 million of available
capacity for additional borrowings and potential letters of credit under its new credit
facility. The Partnership believes that availability under its new credit facility, its
ability to issue additional partnership units and enter into strategic joint venture
arrangements should provide it with the financial flexibility to facilitate the execution
of its business strategy. |
| |
• |
|
Pursue strategic acquisitions and undertake selective construction and expansion
opportunities (“organic growth”). |
| |
• |
|
The Partnership intends to use its acquisition and integration experience to
continue to make strategic acquisitions of assets that offer the opportunity for
operational efficiencies and the potential for increased utilization and expansion of
the acquired asset. It pursues acquisitions that it believes will add to existing core
areas in order to capitalize on existing infrastructure, personnel and producer and
consumer relationships. The Partnership also examines opportunities to establish
positions in new areas in regions with significant natural gas reserves and high levels
of drilling activity or with growing demand for natural gas, primarily through the
acquisition or development of key assets that will serve as a platform for further
growth. |
| |
• |
|
The Partnership also intends to leverage its existing infrastructure and producer
and customer relationships by expanding existing systems to meet new or increased demand
for gathering, transmission, processing and marketing services. Substantially all of its
capital projects during 2009 and its planned projects for 2010 target these types of
opportunities. |
| |
• |
|
The Partnership will consider the construction of facilities and systems in new
areas in regions with significant natural gas reserves and high levels of drilling
activity or with growing demand for natural gas that lack midstream infrastructure to
process and/or transport the natural gas. It believes its existing infrastructure and
construction experience provide a competitive advantage for such expansion
opportunities. For example: |
| |
• |
|
The Partnership established a new core area through the acquisition of
LIG Pipeline Company and subsidiaries, which is collectively referred to as Crosstex
LIG, in 2004, thereby acquiring one of the largest intrastate pipeline systems in
Louisiana. As a result of this acquisition, in 2006 and 2007 the Partnership had the
opportunity to expand
the system in north Louisiana in response to increasing production from the Cotton
Valley formation, from a capacity of approximately 40 MMcf/d to approximately 275
MMcf/d. It further expanded the system in north Louisiana during 2008 and 2009,
increasing its capacity to 410 MMcf/d as of December 31, 2009 to take advantage of the
increasing production and producer needs in the Haynesville Shale. |
6
| |
• |
|
In 2006, the Partnership established a new core area in north Texas by
adding the natural gas gathering pipeline systems and related facilities acquired
from Chief Holdings LLC, or Chief, to its NTP, and other operations in the Barnett
Shale area. Immediately prior to the acquisition, the Partnership had completed
construction on its NTP. Since the 2006 acquisition, the Partnership has expanded
its gathering system in north Texas and connected in excess of 500 new wells and
significantly increased acreage dedicated to its systems. The Partnership has also
constructed three gas processing plants with total processing capacity in the
Barnett Shale of 280 MMcf/d. |
| |
• |
|
In 2005, the Partnership acquired the south Louisiana processing business
from El Paso Corporation, which included a lease of the Eunice NGL processing plant
and fractionation facility. In October 2009, it acquired the Eunice NGL processing
plant and fractionation facility, which will eliminate $12.2 million per year in
lease expense and provide opportunities for optimization of the facility. In
December 2009, the Partnership acquired the Intracoastal Pipeline, which it was
using under a lease arrangement and which is integrated with its NGL system in south
Louisiana. Not only will the acquisition of the Intracoastal Pipeline eliminate
lease expense, but at the time of the acquisition the partnership also received
additional dedications of liquids volumes into its systems from another operator in
the area. |
Recent Developments
In the fourth quarter of 2008, the Partnership adjusted its business strategy to focus on
maximizing liquidity, reducing debt, maintaining a stable asset base, improving the profitability
of assets by increasing their utilization while controlling costs and reducing capital
expenditures. The Partnership is successfully executing its plan as highlighted by the following
accomplishments:
| |
• |
|
Sold Non-Core Assets. The Partnership sold $618.7 million of non-core assets and
repaid approximately $500.0 million in long-term indebtedness from the sales proceeds over
the last 15 months. In November 2008, the Partnership sold its 12.4% interest in the
Seminole gas processing plant for $85.0 million. In the first quarter of 2009, the
Partnership sold its Arkoma system for approximately $10.7 million. In August 2009, the
Partnership sold its midstream assets in Alabama, Mississippi and south Texas for
approximately $217.6 million. In addition, in October 2009, the Partnership sold its
natural gas treating business for $265.4 million. The Partnership also sold its east Texas
midstream assets on January 15, 2010 for $40.0 million. |
| |
• |
|
Reduced Capital Expenditures. The Partnership reduced its capital expenditures from
over $275.6 million in 2008 to $101.4 million in 2009 and focused its capital projects on
lower risk projects with higher expected returns. |
| |
• |
|
Reduced Operating and General and Administrative Expenses. The Partnership reduced its
operating expenses from continuing operations to $110.4 million for the year ended December
31, 2009 from $125.8 million for the year ended December 31, 2008 and general and
administrative expenses from continuing operations to $59.9 million for the year ended
December 31, 2009 from $68.9 million for the year ended December 31, 2008 by reducing
staffing and controlling costs. General and administrative expenses for the year ended
December 31, 2009 also include non-recurring costs totaling $4.4 million associated with
severance payments, lease termination costs and bad debt expense due to the SemStream, L.P.
bankruptcy. |
| |
• |
|
Acquired Certain Assets in Our Core Areas. The Partnership acquired the Eunice NGL
processing plant and fractionation facility in October 2009 for $23.5 million in cash and
the assumption of $18.1 million in debt. It originally acquired the contract rights
associated with the Eunice plant as part of the south Louisiana acquisition in November
2005 and operated and managed the plant under an operating lease with an unaffiliated third
party prior to the recent acquisition. This acquisition will eliminate lease obligations of
$12.2 million per year. The Partnership also acquired the Intracoastal Pipeline located in
southern Louisiana for approximately $10.3 million in December 2009. Both of these
acquisitions were designed to enhance its NGL business. |
| |
• |
|
Sale of Preferred Units. On January 19, 2010, the Partnership issued approximately
$125.0 million of Series A Convertible Preferred Units to an affiliate of Blackstone/GSO
Capital Solutions. The 14,705,882 preferred units are convertible at any time into common
units on a one-for-one basis, subject to certain adjustments in the event of certain
dilutive issuances of common units. The Partnership has the right to force conversion of
the preferred units after three years, subject to certain conditions. The preferred units
are not redeemable but will pay a quarterly distribution that will be the greater of
$0.2125 per unit or the amount of the quarterly distribution per unit paid to common unitholders, subject
to certain adjustments. Such quarterly distribution may be paid in cash, in additional
preferred units issued in kind or any combination thereof, provided that the distribution may
not be paid in additional preferred units if the Partnership pays a cash distribution on
common units. |
7
| |
• |
|
Issuance of Senior Unsecured Notes. On February 10, 2010, the Partnership issued
$725.0 million in aggregate principal amount of 8.875% senior unsecured notes due 2018 (the
“notes” or “senior unsecured notes”) at an issue price of 97.907% to yield 9.25% to
maturity. Net proceeds from the sale of the notes of $689.7 million (net of transaction
costs and original issue discount), together with borrowings under its new credit facility
discussed below, were used to repay in full amounts outstanding under the existing bank
credit facility and senior secured notes and to pay related fees, costs and expenses,
including the settlement of interest rate swaps associated with the existing credit
facility. The notes are unsecured and unconditionally guaranteed on a senior basis by
certain of the Partnership’s direct and indirect subsidiaries, including substantially all
of its current subsidiaries. Interest payments will be paid semi-annually in arrears
starting in August 2010. The Partnership has the option to redeem all or a portion of the
notes at any time on or after February 15, 2014, at the specified redemption prices. Prior
to February 15, 2014, it may redeem the notes, in whole or in part, at a “make-whole”
redemption price. In addition, it may redeem up to 35% of the notes prior to February 15,
2013 with the cash proceeds from certain equity offerings. |
| |
• |
|
New Credit Facility. In February 2010, the Partnership amended and restated its
existing secured bank credit facility with a new syndicated secured bank credit facility
(the “new credit facility”), which will be guaranteed by substantially all of its
subsidiaries. The new credit facility has a borrowing capacity of $420.0 million, and
matures in February 2014. Obligations under the new credit facility will be secured by
first priority liens on substantially all of the Partnership assets and those of the
guarantors, including all material pipeline, gas gathering and processing assets, all
material working capital assets and a pledge of all of its equity interests in
substantially all of its subsidiaries. Under the new credit facility, borrowings will bear
interest at the Partnership’s option at the British Bankers Association LIBOR Rate plus an
applicable margin, or the highest of the Federal Funds Rate plus 0.50%, the 30-day
Eurodollar Rate plus 1.0%, or the administrative agent’s prime rate, in each case plus an
applicable margin. The Partnership will pay a per annum fee on all letters of credit issued
under the new credit facility, and it will pay a commitment fee of 0.50% per annum on the
unused availability under the new credit facility. The letter of credit fee and the
applicable margins for its interest rate vary quarterly based on its leverage ratio. |
Partnership Assets
North Texas Assets. The Partnership’s NTP which commenced service in April 2006, consists of
a 140-mile pipeline and associated gathering lines from an area near Fort Worth, Texas to a point
near Paris, Texas. The initial capacity of the NTP was approximately 250 MMcf/d. In 2007, the
capacity on the NTP was expanded to a total of approximately 375 MMcf/d. The NTP connects
production from the Barnett Shale to markets in north Texas and to markets accessed by the Natural
Gas Pipeline Company, or NGPL, Kinder Morgan, Houston Pipeline, or HPL, Atmos, Gulf Crossing and
other markets. For the year ended December 31, 2009, the total throughput on the NTP was
approximately 318,000 MMBtu/d. The new interconnect with Gulf Crossing Pipeline, which commenced
service in August 2009, provides customers access to mid-west and east coast markets.
On June 29, 2006, the Partnership acquired the natural gas gathering pipeline systems and
related facilities of Chief in the Barnett Shale for $475.3 million. The acquired systems included
gathering pipelines, a 125 MMcf/d carbon dioxide treating plant and compression facilities with
26,000 horsepower. At the closing of that transaction, approximately 160,000 net acres previously
owned by Chief and acquired by Devon simultaneously with the acquisition, as well as 60,000 net
acres owned by other producers, were dedicated to the systems. Immediately following the closing of
the Chief acquisition, the Partnership began expanding its north Texas gathering system.
| |
• |
|
Gathering System. Since the date of the acquisition through December 31, 2009, the
Partnership expanded its gathering system and connected in excess of 500 new wells to the
north Texas gathering system and significantly increased the productive acreage dedicated
to the system. As of December 31, 2009, total capacity on the north Texas gathering system
was approximately 1,100 MMcf/d and total throughput averaged
approximately 793,000 MMBtu/d
for the year ended December 31, 2009. |
| |
• |
|
Processing Facilities. Since 2006, the Partnership has constructed three gas
processing plants with a total processing capacity in the Barnett Shale of 280 MMcf/d,
including the Silver Creek plant, which is a 200 MMcf/d cryogenic processing plant, the
Azle plant, which is a 50 MMcf/d cryogenic processing plant and the Goforth plant, which is
a 30 MMcf/d processing plant. Total processing throughput averaged 219,000 MMBtu/d for the
year ended December 31, 2009. |
The Partnership has budgeted approximately $15.0 million for continued development of its
north Texas assets during 2010.
These capital projects represent system expansions that are planned to handle volume growth as
well as projects required pursuant to existing obligations with producers to connect new wells to
its gathering systems in north Texas.
8
Louisiana Assets. The Partnership’s Louisiana assets include its Crosstex LIG intrastate
pipeline system and its gas processing and liquids business in south Louisiana, referred to as the
south Louisiana processing assets.
| |
• |
|
Crosstex LIG System. The Crosstex LIG system is one of the largest intrastate pipeline
systems in Louisiana, consisting of approximately 2,100 miles of gathering and transmission
pipeline, with an average throughput of approximately 900,000 MMBtu/d for the year ended
December 31, 2009. The system also includes two operating, on-system processing plants, the
Plaquemine and Gibson plants, with an average throughput of 269,000 MMBtu/d for the year
ended December 31, 2009. The system has access to both rich and lean gas supplies. These
supplies reach from north Louisiana to new onshore production in south central and
southeast Louisiana. Crosstex LIG has a variety of transportation and industrial sales
customers, with the majority of its sales being made into the industrial Mississippi River
corridor between Baton Rouge and New Orleans. |
In 2007, the Partnership extended the Crosstex LIG system to the north to reach additional
productive areas in the developing natural gas fields south of Shreveport, Louisiana, primarily in
the Cotton Valley formation. This extension, referred to as the north Louisiana expansion, consists
of 63 miles of 24” mainline with 9 miles of gathering lateral pipeline. The north Louisiana
expansion bisects the developing Haynesville Shale gas play in north Louisiana. The north Louisiana
expansion was operating at near capacity during 2008 as the Haynesville gas was beginning to
develop so the Partnership added 35 MMcf/d of capacity by adding compression during the third
quarter of 2008 bringing the total capacity of the north Louisiana expansion to approximately 275
MMcf/d. The Partnership continued the expansion of its north Louisiana system during 2009
increasing capacity by 100 MMcf/d in July 2009 by adding compression. It increased capacity by
another 35 MMcf/d with a new interconnect into an interstate pipeline in December 2009 and bringing
total capacity to 410 MMcf/d by the end of 2009. The Partnership has long-term firm transportation
agreements subscribing to all of the incremental capacity added during 2009. In addition, it added
compression during 2009 between the southern portion of the Crosstex LIG system and the northern
expansion of the Crosstex LIG system, which increased the capacity for moving gas from the north
LIG system to markets in the south to 145 MMcf/d. Interconnects on the north Louisiana expansion
include connections with the interstate pipelines of ANR Pipeline, Columbia Gulf Transmission,
Texas Gas Transmission, Trunkline Gas and Tennessee Gas Pipeline.
The
Partnership has budgeted approximately $10.0 million to add an
additional 30 MMcf/d of fully
contracted capacity in north Louisiana during 2010.
| |
• |
|
South Louisiana Processing and NGL Assets. Natural gas processing capacity available
to the Gulf Coast producers continues to exceed demand. During 2007, 2008, and 2009 the
Partnership completed a number of operational changes at its Eunice facility and other
plants to idle certain equipment, reduce operating expenses and reconfigure operations to
manage the lower utilization. In addition, the Partnership increased focus on upstream
markets and opportunities through integration of the Crosstex LIG system and south
Louisiana processing assets to improve overall performance. In 2008, its south Louisiana
assets were negatively impacted by hurricanes Gustav and Ike, which came ashore in
September 2008. Although the Partnership assets did not sustain substantial physical
damage, several offshore platforms and pipelines owned by third parties transporting gas
production to Pelican, Eunice, Sabine Pass and Blue Water processing plants were damaged by
the storms. Substantially all of the production from the pipeline systems supplying
Partnership plants was restored to pre-hurricane levels by September 2009. The south
Louisiana processing assets include the following: |
| |
• |
|
Eunice Processing Plant and Fractionation Facility. The Eunice processing plant
is located in south central Louisiana, has a capacity of 750 MMcf/d and processed
approximately 380,000 MMBtu/d during December 2009. The plant is connected to onshore
gas supply, as well as continental shelf and deepwater gas production and has downstream
connections to the ANR Pipeline, Florida Gas Transmission and Texas Gas Transmission, or
TGT. The Eunice fractionation facility, which was idled in August 2007, has a capacity
of 36,000 barrels per day of liquid products. Beginning in August 2007, the liquids from
the Eunice processing plant were transported through the Cajun Sibon pipeline system to
the Riverside plant for fractionation. The Eunice fractionation facility, when
operational, produces ethane, propane, iso-butane, normal butane and natural gasoline
for various customers. The fractionation facility is directly connected to the southeast
propane market and pipelines to the Anse La Butte storage facility. The Partnership
owned the contract rights associated with the Eunice plant and operated and managed the
plant under an operating lease with an unaffiliated third party through October 2009. In
October 2009, it acquired the Eunice plant for $23.5 million in cash and the assumption
of $18.1 million in debt by buying out the operating lease, thereby eliminating $12.2
million of annual lease obligations. |
9
| |
• |
|
Pelican Processing Plant. The Pelican processing plant complex is located in
Patterson, Louisiana and has a designed capacity of 600 MMcf/d of natural gas. During
December 2009, the plant processed approximately 340,000 MMBtu/d. The Pelican plant is
connected with continental shelf and deepwater production and has downstream connections
to the ANR Pipeline. |
| |
• |
|
Sabine Pass Processing Plant. The Sabine Pass processing plant is located east
of the Sabine River at Johnson’s Bayou, Louisiana and has a processing capacity of 300
MMcf/d of natural gas. The Sabine Pass plant is connected to continental shelf and
deepwater gas production with downstream connections to Florida Gas Transmission,
Tennessee Gas Pipeline (TGP) and Transco. The plant processed approximately 107,000
MMBtu/d during December 2009. |
| |
• |
|
Blue Water Gas Processing Plant. The Partnership acquired a 23.85% interest in
the Blue Water gas processing plant in the November 2005 El Paso acquisition and
acquired an additional 35.42% interest in May 2006, at which time it became the operator
of the plant. The plant has a net capacity to the Partnership’s interest of 186 MMcf/d.
During 2008, TGP acquired Columbia Gulf Transmission’s ownership share in the Blue Water
pipeline. In January 2009, TGP reversed the flow of the gas on the pipeline thereby
removing access to all the gas processed at the Blue Water plant from the Blue Water
offshore system and the plant did not operate during the nine months ended September 30,
2009. In November 2009, the plant was restarted to process the reverse flow stream on
TGP. The gas composition of the reverse TGP stream is leaner in NGL content, but may be
profitable to process during periods of high fractionation spreads. The plant is
expected to operate in this mode periodically as fractionation spread and volumes
dictate. When the reverse stream is processed, the Partnership earns all of the margin
from processing the gas under a straddle agreement with TGP. |
| |
• |
|
Riverside Fractionation Plant. The Riverside fractionator and loading facility
is located on the Mississippi River upriver from Geismar, Louisiana. The Riverside plant
has a fractionation capacity of approximately 30,000 Bbls/d of liquids products and
fractionates liquids delivered by the Cajun Sibon pipeline system from the Eunice,
Pelican and Blue Water plants or by truck. The Riverside facility has above-ground
storage capacity of approximately 102,000 barrels. |
| |
• |
|
Napoleonville Storage Facility. The Napoleonville NGL storage facility is
connected to the Riverside facility and has a total capacity of approximately 2.4
million barrels of underground storage from two existing caverns. The caverns are
currently operated in propane and butane service and space is sold to customers for a
fee. |
| |
• |
|
Cajun Sibon Pipeline System. The Cajun Sibon pipeline system consists of
approximately 400 miles of 6” and 8” pipelines with a system capacity of approximately
28,000 Bbls/d. The pipeline transports unfractionated NGLs, referred to as raw make,
from the Eunice, Pelican and Blue Water plants to either the Riverside fractionator or
to third party fractionators when necessary. Alternate deliveries can be made to the
Eunice fractionation facility when operational. |
| |
• |
|
Intracoastal Pipeline. In December 2009, the Partnership acquired the
Intracoastal Pipeline from a subsidiary of Chevron Midstream Pipelines LLC. The pipeline
consists of approximately 62 miles of six and eight inch pipeline and extends from
Patterson to Henry in southern Louisiana. The pipeline connects the Pelican processing
plant to the Cajun Sibon pipeline system and accesses other third party processing
plants in the region. Prior to the Partnership’s acquisition, it utilized portions of
the Intracoastal Pipeline under a long-term lease arrangement. This acquisition
eliminates approximately $1.3 million of annual lease expense. The Partnership has also
entered into an agreement to use the system to bring additional liquids into its NGL
system. |
Industry Overview
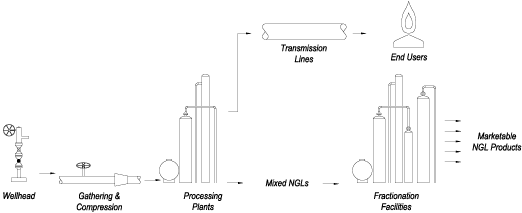
The following diagram illustrates the gathering, processing, fractionation and transmission
process.
The midstream natural gas industry is the link between exploration and production of natural
gas and the delivery of its components to end-user markets. The midstream industry is generally
characterized by regional competition based on the proximity of gathering systems and processing
plants to natural gas producing wells.
Natural gas gathering. The natural gas gathering process follows the drilling of wells into
gas bearing rock formations. Once a well has been completed, the well is connected to a gathering
system. Gathering systems typically consist of a network of small diameter pipelines and, if
necessary, compression systems that collect natural gas from points near producing wells and
transport it to larger pipelines for further transmission.
10
Compression. Gathering systems are operated at pressures that will maximize the total
throughput from all connected wells. Because wells produce at progressively lower field pressures
as they age, it becomes increasingly difficult to deliver the remaining production in the ground
against the higher pressure that exists in the connected gathering system. Natural gas compression
is a mechanical process in which a volume of gas at an existing pressure is compressed to a desired
higher pressure, allowing gas that no longer naturally flows into a higher-pressure downstream
pipeline to be brought to market. Field compression is typically used to allow a gathering system
to operate at a lower pressure or provide sufficient discharge pressure to deliver gas into a
higher-pressure downstream pipeline. If field compression is not installed, then the remaining
natural gas in the ground will not be produced because it will be unable to overcome the higher
gathering system pressure. In contrast, if field compression is installed, a declining well can
continue delivering natural gas.
Natural gas processing. The principal components of natural gas are methane and ethane, but
most natural gas also contains varying amounts of NGLs and contaminants, such as water, sulfur
compounds, nitrogen or helium. Natural gas produced by a well may not be suitable for long-haul
pipeline transportation or commercial use and may need to be processed to remove the heavier
hydrocarbon components and contaminants. Natural gas in commercial distribution systems is composed
almost entirely of methane and ethane, with moisture and other contaminants removed to very low
concentrations. Natural gas is processed not only to remove unwanted contaminants that would
interfere with pipeline transportation or use of the natural gas, but also to separate from the gas
those hydrocarbon liquids that have higher value as NGLs. The removal and separation of individual
hydrocarbons by processing is possible because of differences in weight, boiling point, vapor
pressure and other physical characteristics. Natural gas processing involves the separation of
natural gas into pipeline quality natural gas and a mixed NGL stream, as well as the removal of
contaminants.
NGL fractionation. Fractionation is the process by which NGLs are further separated into
individual, more valuable components. NGL fractionation facilities separate mixed NGL streams into
discrete NGL products: ethane, propane, isobutane, normal butane, natural gasoline and stabilized
condensate. Ethane is primarily used in the petrochemical industry as feedstock for ethylene, one
of the basic building blocks for a wide range of plastics and other chemical products. Propane is
used both as a petrochemical feedstock in the production of ethylene and propylene and as a heating
fuel, an engine fuel and industrial fuel. Isobutane is used principally to enhance the octane
content of motor gasoline. Normal butane is used as a petrochemical feedstock in the production of
ethylene and butylene (a key ingredient in synthetic rubber), as a blend stock for motor gasoline
and to derive isobutene through isomerization. Natural gasoline, a mixture of pentanes and heavier
hydrocarbons, is used primarily as motor gasoline blend stock or petrochemical feedstock.
Natural gas transmission. Natural gas transmission pipelines receive natural gas from
mainline transmission pipelines, processing plants, and gathering systems and deliver it to
industrial end-users, utilities and to other pipelines.
Balancing of Supply and Demand
As the Partnership purchases natural gas, it establishes a margin normally by selling natural
gas for physical delivery to third-party users. It can also use over-the-counter derivative
instruments or enter into a future delivery obligation under futures contracts on the NYMEX.
Through these transactions, the Partnership seeks to maintain a position that is substantially
balanced between purchases, on the one hand, and sales or future delivery obligations, on the other
hand. Its policy is not to acquire and hold natural gas futures contracts or derivative products
for the purpose of speculating on price changes.
Competition
The business of providing gathering, transmission, processing and marketing services for
natural gas and NGLs is highly competitive. The Partnership faces strong competition in obtaining
natural gas supplies and in the marketing and transportation of natural gas and NGLs. Its
competitors include major integrated oil companies, natural gas producers, interstate and
intrastate pipelines and other natural gas gatherers and processors. Competition for natural gas
supplies is primarily based on geographic location of facilities in relation to production or
markets, the reputation, efficiency and reliability of the gatherer and the pricing arrangements
offered by the gatherer. Many of the Partnership’s competitors offer more services or have greater
financial resources and access to larger natural gas supplies than it does. The competition differs
in different geographic areas.
In marketing natural gas and NGLs, the Partnership has numerous competitors, including
marketing affiliates of interstate pipelines, major integrated oil and gas companies, and local and
national natural gas producers, gatherers, brokers and marketers of widely varying sizes, financial
resources and experience. Local utilities and distributors of natural gas are, in some cases,
engaged directly, and through affiliates, in marketing activities that compete with the
Partnership’s marketing operations.
11
The Partnership faces strong competition for acquisitions and development of new projects from
both established and start-up companies. Competition increases the cost to acquire existing
facilities or businesses, and results in fewer commitments and lower returns for new pipelines or
other development projects. Many of its competitors have greater financial resources or lower
capital costs, or are willing to accept lower returns or greater risks. The Partnership’s
competition differs by region and by the nature of the business or the project involved.
Natural Gas Supply
The Partnership’s transmission pipelines have connections with major interstate and intrastate
pipelines, which it believes have ample supplies of natural gas in excess of the volumes required
for these systems. In connection with the construction and acquisition of its gathering systems,
the Partnership evaluates well and reservoir data publicly available or furnished by producers or
other service providers to determine the availability of natural gas supply for the systems and/or
obtain a minimum volume commitment from the producer that results in a rate of return on
investment. Based on these facts, the Partnership believes that there should be adequate natural
gas supply to recoup its investment with an adequate rate of return. The Partnership does not
routinely obtain independent evaluations of reserves dedicated to its systems due to the cost and
relatively limited benefit of such evaluations. Accordingly, it does not have estimates of total
reserves dedicated to its systems or the anticipated life of such producing reserves.
Credit Risk and Significant Customers
The Partnership is diligent in attempting to ensure that it issues credit to only
credit-worthy customers. However, the purchase and resale of gas exposes it to significant credit
risk, as the margin on any sale is generally a very small percentage of the total sale price.
Therefore, a credit loss can be very large relative to overall profitability.
During the year ended December 31, 2009, the Partnership had one customer that accounted for
approximately 12.2% of consolidated revenues from continuing operations. While this customer
represents a significant percentage of consolidated revenues, the loss of this customer would not
have a material impact on results of operations.
Regulation
Regulation by FERC of Interstate Natural Gas Pipelines. The Partnership does not own any
interstate natural gas pipelines, so the Federal Energy Regulatory Commission, or FERC, does not
directly regulate its operations under the National Gas Act, or NGA. However, FERC’s regulation of
interstate natural gas pipelines influences certain aspects of the Partnership’s business and the
market for its products. In general, FERC has authority over natural gas companies that provide
natural gas pipeline transportation services in interstate commerce and its authority to regulate
those services includes:
| |
• |
|
the certification and construction of new facilities; |
| |
• |
|
the extension or abandonment of services and facilities; |
| |
• |
|
the maintenance of accounts and records; |
| |
• |
|
the acquisition and disposition of facilities; |
| |
• |
|
maximum rates payable for certain services; and |
| |
• |
|
the initiation and discontinuation of services. |
While the Partnership does not own any interstate pipelines, it does transport gas in
interstate commerce. The rates, terms and conditions of service under which the Partnership
transports natural gas in its pipeline systems in interstate commerce is subject to FERC
jurisdiction under Section 311 of the Natural Gas Policy Act, or NGPA. In addition, FERC has
adopted, or is in the process of adopting, various regulations concerning natural gas market
transparency that will apply to some of the pipeline operations. The maximum rates for services
provided under Section 311 of the NGPA may not exceed a “fair and equitable rate”, as defined in
the NGPA. The rates are generally subject to review every three years by FERC or by an appropriate
state agency. The inability to obtain approval of rates at acceptable levels could result in refund
obligations, the inability to achieve adequate returns on investments in new facilities and the
deterrence of future investment or growth of the regulated facilities.
Intrastate Pipeline Regulation. The Partnership’s intrastate natural gas pipeline operations
are subject to regulation by various agencies of the states in which they are located. Most states
have agencies that possess the authority to review and authorize natural
gas transportation transactions and the construction, acquisition, abandonment and
interconnection of physical facilities. Some states also have state agencies that regulate
transportation rates, service terms and conditions and contract pricing to ensure their
reasonableness and to ensure that the intrastate pipeline companies that they regulate do not
discriminate among similarly situated customers.
12
Gathering Pipeline Regulation. Section 1(b) of the NGA exempts natural gas gathering
facilities from the jurisdiction of FERC under the NGA. The Partnership owns a number of natural
gas pipelines that it believes meet the traditional tests FERC has used to establish a pipeline’s
status as a gatherer not subject to FERC jurisdiction. State regulation of gathering facilities
generally includes various safety, environmental and, in some circumstances, nondiscriminatory take
requirements, and in some instances complaint-based rate regulation.
The Partnership is subject to some state ratable take and common purchaser statutes. The
ratable take statutes generally require gatherers to take, without undue discrimination, natural
gas production that may be tendered to the gatherer for handling. Similarly, common purchaser
statutes generally require gatherers to purchase without undue discrimination as to source of
supply or producer. These statutes are designed to prohibit discrimination in favor of one producer
over another producer or one source of supply over another source of supply.
Sales of Natural Gas. The price at which the Partnership sells natural gas currently is not
subject to federal regulation and, for the most part, is not subject to state regulation. Its sales
of natural gas are affected by the availability, terms and cost of pipeline transportation. As
noted above, the price and terms of access to pipeline transportation are subject to extensive
federal and state regulation. FERC is continually proposing and implementing new rules and
regulations affecting those segments of the natural gas industry, most notably interstate natural
gas transmission companies that remain subject to FERC’s jurisdiction. These initiatives also may
affect the intrastate transportation of natural gas under certain circumstances. The Partnership
cannot predict the ultimate impact of these regulatory changes on its natural gas marketing
operations but does not believe that it will be affected by any such FERC action materially
differently than other natural gas marketers with whom it competes.
Environmental Matters
General. The Partnership’s operation of processing and fractionation plants, pipelines and
associated facilities in connection with the gathering and processing of natural gas and the
transportation, fractionation and storage of NGLs is subject to stringent and complex federal,
state and local laws and regulations relating to release of hazardous substances or wastes into the
environment or otherwise relating to protection of the environment. As with the industry generally,
compliance with existing and anticipated environmental laws and regulations increases its overall
costs of doing business, including costs of planning, constructing, and operating plants, pipelines
and other facilities. Included in the Partnership’s construction and operation costs are capital
cost items necessary to maintain or upgrade equipment and facilities. Similar costs are likely upon
any future acquisition of operating assets.
Any failure to comply with applicable environmental laws and regulations, including those
relating to obtaining required governmental approvals, may result in the assessment of
administrative, civil or criminal penalties, imposition of investigatory or remedial activities
and, in less common circumstances, issuance of injunctions or construction bans or delays. We
believe that the Partnership currently holds all material governmental approvals required to
operate its major facilities. As part of the regular overall evaluation of its operations, the
Partnership has implemented procedures to review and update governmental approvals as necessary. We
believe that the Partnership’s operations and facilities are in substantial compliance with
applicable environmental laws and regulations and that the cost of compliance with such laws and
regulations will not have a material adverse effect on its operating results or financial
condition.
The clear trend in environmental regulation is to place more restrictions and limitations on
activities that may affect the environment, and thus there can be no assurance as to the amount or
timing of future expenditures for environmental compliance or remediation, and actual future
expenditures may be different from the amounts we currently anticipate. Moreover, risks of process
upsets, accidental releases or spills are associated with the Partnership’s possible future
operations, and we cannot assure you that the Partnership will not incur significant costs and
liabilities, including those relating to claims for damage to property and persons as a result of
any such upsets, releases, or spills. In the event of future increases in environmental costs, the
Partnership may be unable to pass on those cost increases to its customers. A discharge of
hazardous substances or wastes into the environment could, to the extent losses related to the
event are not insured, subject the Partnership to substantial expense, including both the cost to
comply with applicable laws and regulations and to pay fines or penalties that may be assessed and
the cost related to claims made by neighboring landowners and other third parties for personal
injury or damage to property. The Partnership will attempt to anticipate future regulatory
requirements that might be imposed and plan accordingly to comply with changing environmental laws
and regulations and to minimize costs.
13
Hazardous Substance and Waste. To a large extent, the environmental laws and regulations
affecting the Partnership’s operations relate to the release of hazardous substances or solid wastes into soils, groundwater and
surface water, and include measures to prevent and control pollution. These laws and regulations
generally regulate the generation, storage, treatment, transportation and disposal of solid and
hazardous wastes, and may require investigatory and corrective actions at facilities where such
waste may have been released or disposed. For instance, the Comprehensive Environmental Response,
Compensation and Liability Act, or CERCLA, also known as the “Superfund” law, and comparable state
laws, impose liability without regard to fault or the legality of the original conduct, on certain
classes of persons that contributed to a release of “hazardous substance” into the environment.
Potentially liable persons include the owner or operator of the site where a release occurred and
companies that disposed or arranged for the disposal of the hazardous substances found at the site.
Under CERCLA, these persons may be subject to joint and several liability for the costs of cleaning
up the hazardous substances that have been released into the environment, for damages to natural
resources, and for the costs of certain health studies. CERCLA also authorizes the EPA and, in some
cases, third parties to take actions in response to threats to the public health or the environment
and to seek to recover from the potentially responsible classes of persons the costs they incur. It
is not uncommon for neighboring landowners and other third parties to file claims for personal
injury and property damage allegedly caused by hazardous substances or other wastes released into
the environment. Although “petroleum” as well as natural gas and NGLs are excluded from CERCLA’s
definition of a “hazardous substance,” in the course of future, ordinary operations, the
Partnership may generate wastes that may fall within the definition of a “hazardous substance.”
However, there are other laws and regulations that can create liability for releases of petroleum,
natural gas or NGLs. Moreover, the Partnership may be responsible under CERCLA or other laws for
all or part of the costs required to clean up sites at which such wastes have been disposed. The
Partnership has not received any notification that it may be potentially responsible for cleanup
costs under CERCLA or any analogous federal or state laws.
The Partnership also generates, and may in the future generate, both hazardous and
nonhazardous solid wastes that are subject to requirements of the Federal Resource Conservation and
Recovery Act, or RCRA, and comparable state statutes. The Partnership is not currently required to
comply with a substantial portion of the RCRA requirements because its operations generate minimal
quantities of hazardous wastes. From time to time, the Environmental Protection Agency, or EPA, has
considered the adoption of stricter disposal standards for nonhazardous wastes, including crude oil
and natural gas wastes. Moreover, it is possible that some wastes generated by it that are
currently classified as nonhazardous may in the future be designated as “hazardous wastes,”
resulting in the wastes being subject to more rigorous and costly management and disposal
requirements. Changes in applicable regulations may result in an increase in the Partnership’s
capital expenditures or plant operating expenses.
The Partnership currently owns or leases, and has in the past owned or leased, and in the
future may own or lease, properties that have been used over the years for natural gas gathering,
treating or processing and for NGL fractionation, transportation or storage. Solid waste disposal
practices within the NGL industry and other oil and natural gas related industries have improved
over the years with the passage and implementation of various environmental laws and regulations.
Nevertheless, some hydrocarbons and other solid wastes have been disposed of on or under various
properties owned or leased by the Partnership during the operating history of those facilities. In
addition, a number of these properties may have been operated by third parties over whom the
Partnership had no control as to such entities’ handling of hydrocarbons or other wastes and the
manner in which such substances may have been disposed of or released. These properties and wastes
disposed thereon may be subject to CERCLA, RCRA, and analogous state laws. Under these laws, the
Partnership could be required to remove or remediate previously disposed wastes or property
contamination, including groundwater contamination, or to take action to prevent future
contamination.
Air Emissions. The Partnership’s current and future operations are subject to the federal
Clean Air Act and comparable state laws and regulations. These laws and regulations regulate
emissions of air pollutants from various industrial sources, including the Partnership’s
facilities, and impose various monitoring and reporting requirements. Pursuant to these laws and
regulations, the Partnership may be required to obtain environmental agency pre-approval for the
construction or modification of certain projects or facilities expected to produce air emissions or
result in an increase in existing air emissions, obtain and comply with the terms of air permits,
which include various emission and operational limitations, or use specific emission control
technologies to limit emissions. The Partnership likely will be required to incur certain capital
expenditures in the future for air pollution control equipment in connection with maintaining or
obtaining governmental approvals addressing air-emission related issues. Failure to comply with
applicable air statutes or regulations may lead to the assessment of administrative, civil or
criminal penalties, and may result in the limitation or cessation of construction or operation of
certain air emission sources. Although we can give no assurances, we believe such requirements will
not have a material adverse effect on the Partnership’s financial condition or operating results,
and the requirements are not expected to be more burdensome to the Partnership than any similarly
situated company.
Air emissions associated with operations in the Barnett Shale area have come under recent
scrutiny. In 2009, the Texas Commission on Environmental Quality (TCEQ) conducted comprehensive
monitoring of air emissions in the Barnett Shale area, in response to public concerns about high
concentrations of benzene in the air near drilling sites and natural gas processing facilities. A
comprehensive report detailing the monitoring results and their potential health impacts is
expected to be finalized in early 2010. Environmental groups have advocated increased regulation in
the Barnett Shale area and these groups as well as at least one state representative have further
advocated a moratorium on permits for new gas wells until TCEQ completes its analysis. Also, the
EPA recently entered into a settlement that requires it to reevaluate regulations for the control
of air emissions from natural gas production facilities. Changes in laws or regulations imposing
emission limitations, pollution control technology requirements or other regulatory
requirements or any restriction on permitting of natural gas production facilities in the
Barnett Shale area could have an adverse effect on the Partnership’s business.
14
Climate Change. In response to concerns suggesting that emissions of certain gases, commonly
referred to as “greenhouse gases” (including carbon dioxide and methane), may be contributing to
warming of the Earth’s atmosphere, the U.S. Congress is actively considering legislation to reduce
such emissions. In addition, at least one-third of the states, either individually or through
multi-state regional initiatives, have already taken legal measures intended to reduce greenhouse
gas emissions, primarily through the planned development of greenhouse gas emission inventories
and/or greenhouse gas cap and trade programs. In addition, EPA is taking steps that would result in the regulation of greenhouse gases as
pollutants under the federal Clean Air Act. Furthermore, in September 2009, EPA finalized
regulations that require monitoring and reporting of greenhouse gas emissions on an annual basis,
including extensive greenhouse gas monitoring and reporting requirements, beginning in 2010.
Although the greenhouse gas reporting rule does not control greenhouse gas emission levels from any
facilities, it will still cause the Partnership to incur monitoring and reporting costs for
emissions that are subject to the rule. Some of the Partnership’s facilities include source
categories that are subject to the greenhouse gas reporting requirements included in the final
rule. However, EPA postponed a decision on proposed Subpart W to 40 CFR part 98, which would have
applied to fugitive and vented methane emissions from the oil and gas sector, including natural gas
transmission compression. The prospect remains that EPA will adopt regulations that require
reporting of fugitive and vented methane emissions from the oil and gas industry, which will
increase the Partnership’s monitoring and reporting costs. In December 2009, EPA also issued
findings that greenhouse gases in the atmosphere endanger public health and welfare, and that
emissions from mobile sources cause or contribute to greenhouse gases in the atmosphere. The
endangerment findings will not immediately affect the Partnership’s operations, but standards
eventually promulgated pursuant to these findings could affect its operations and ability to obtain
air permits for new or modified facilities. Legislation and regulations relating to control or
reporting of greenhouse gas emissions are also in various stages of discussions or implementation
in about one-third of the states. Lawsuits have been filed seeking to force the federal government
to regulate greenhouse gases emissions under the Clean Air Act and to require individual companies
to reduce greenhouse gas emissions from their operations. These and other lawsuits may result in
decisions by state and federal courts and agencies that could impact the Partnership’s operations
and ability to obtain certifications and permits to construct future projects.
Passage of climate change legislation or other federal or state legislative or regulatory
initiatives that regulate or restrict emissions of greenhouse gases in areas in which the
Partnership conducts business could adversely affect the demand for the products it stores,
transports and processes, and depending on the particular program adopted could increase the costs
of its operations, including costs to operate and maintain its facilities, install new emission
controls on its facilities, acquire allowances to authorize its greenhouse gas emissions, pay any
taxes related to its greenhouse gas emissions and/or administer and manage a greenhouse gas
emissions program. The Partnership may be unable to recover any such lost revenues or increased
costs in the rates it charges its customers, and any such recovery may depend on events beyond its
control, including the outcome of future rate proceedings before the FERC or state regulatory
agencies and the provisions of any final legislation or regulations. Reductions in the
Partnership’s revenues or increases in its expenses as a result of climate control initiatives
could have adverse effects on its business, financial position, results of operations and
prospects.
Clean Water Act. The Federal Water Pollution Control Act, also known as the Clean Water Act,
and comparable state laws impose restrictions and strict controls regarding the discharge of
pollutants, including natural gas liquid related wastes, into state waters or waters of the United
States. Regulations promulgated pursuant to these laws require that entities that discharge into
federal and state waters obtain National Pollutant Discharge Elimination System, or NPDES, and/or
state permits authorizing these discharges. The Clean Water Act and analogous state laws assess
administrative, civil and criminal penalties for discharges of unauthorized pollutants into the
water and impose substantial liability for the costs of removing spills from such waters. In
addition, the Clean Water Act and analogous state laws require that individual permits or coverage
under general permits be obtained by covered facilities for discharges of storm water runoff. The
Partnership believes that it is in substantial compliance with Clean Water Act permitting
requirements as well as the conditions imposed thereunder, and that continued compliance with such
existing permit conditions will not have a material effect on its results of operations.
It is customary to recover natural gas from deep shale formations through the use of hydraulic
fracturing, combined with sophisticated horizontal drilling. Hydraulic fracturing is an important
and commonly used process in the completion of wells by the Partnership’s customers, particularly
in Barnett Shale and Haynesville Shale regions of its operations. Hydraulic fracturing involves the
injection of water, sand and chemical additives under pressure into rock formations to stimulate
gas production. Due to public concerns raised regarding potential impacts of hydraulic fracturing
on groundwater quality, legislative and regulatory efforts at the federal level and in some states
have been initiated to require or make more stringent the permitting and compliance requirements
for hydraulic fracturing operations. In particular, the U.S. Congress is currently considering
legislation to amend the federal Safe Drinking Water Act to subject hydraulic fracturing operations
to regulation under that Act and to require the disclosure of chemicals used by the oil and gas
industry in the hydraulic fracturing process. Sponsors of bills currently pending before the U.S.
Senate and House of Representatives have asserted that chemicals used in the fracturing process
could adversely affect drinking water supplies. Proposed legislation would require, among other
things, the reporting and public disclosure of chemicals used in the fracturing process, which
could make it easier for third parties opposing the hydraulic fracturing process to initiate legal
proceedings against producers and service providers. In addition, these bills, if adopted, could establish an additional level
of regulation and permitting of hydraulic fracturing operations at the federal level, which could
lead to operational delays, increased operating costs and additional regulatory burdens that could
make it more difficult for the Partnership’s customers to perform hydraulic fracturing. Any
increased federal, state or local regulation could reduce the volumes of natural gas that the
Partnership’s customers move through its gathering systems which would materially adversely affect
its revenues and results of operations.
15
Employee Safety. The Partnership is subject to the requirements of the Occupational Safety
and Health Act, referred to as OSHA, and comparable state laws that regulate the protection of the
health and safety of workers. In addition, the OSHA hazard communication standard requires that
information be maintained about hazardous materials used or produced in operations and that this
information be provided to employees, state and local government authorities and citizens. The
Partnership believes that its operations are in substantial compliance with the OSHA requirements,
including general industry standards, record keeping requirements, and monitoring of occupational
exposure to regulated substances.
Safety Regulations. The Partnership’s pipelines are subject to regulation by the U.S.
Department of Transportation under the Hazardous Liquid Pipeline Safety Act, as amended, or HLPSA,
and the Pipeline Integrity Management in High Consequence Areas (Gas Transmission Pipelines)
amendment to 49 CFR Part 192, effective February 14, 2004 relating to the design, installation,
testing, construction, operation, replacement and management of pipeline facilities. The HLPSA
covers crude oil, carbon dioxide, NGL and petroleum products pipelines and requires any entity
which owns or operates pipeline facilities to comply with the regulations under the HLPSA, to
permit access to and allow copying of records and to make certain reports and provide information
as required by the Secretary of Transportation. The Pipeline Integrity Management in High
Consequence Areas (Gas Transmission Pipelines) amendment to 49 CFR Part 192 (PIM) requires
operators of gas transmission pipelines to ensure the integrity of their pipelines through
hydrostatic pressure testing, the use of in-line inspection tools or through risk-based direct
assessment techniques. In addition, the Railroad Commission of Texas, or TRRC, regulates the
Partnership’s pipelines in Texas under its own pipeline integrity management rules. The Texas rule
includes certain transmission and gathering lines based upon pipeline diameter and operating
pressures. The Partnership believes that its pipeline operations are in substantial compliance with
applicable HLPSA and PIM requirements; however, due to the possibility of new or amended laws and
regulations or reinterpretation of existing laws and regulations, there can be no assurance that
future compliance with the HLPSA or PIM requirements will not have a material adverse effect on its
results of operations or financial positions.
Office Facilities
We occupy approximately 95,400 square feet of space at our executive offices in Dallas, Texas
under a lease expiring in June 2014, approximately 25,100 square feet of office space for the
Partnership’s south Louisiana operations in Houston, Texas with lease terms expiring in January
2013 and approximately 11,800 square feet of office space for its north Texas operations in Fort
Worth, Texas, with lease terms expiring in April 2013.
Employees
As of December 31, 2009, the Partnership (through its subsidiaries) employed approximately 456
full-time employees. Approximately 244 of the employees were general and administrative,
engineering, accounting and commercial personnel and the remainders were operational employees. The
Partnership is not party to any collective bargaining agreements, and has not had any significant
labor disputes in the past. We believe that the Partnership has good relations with its employees.
Item 1A. Risk Factors
The following risk factors and all other information contained in this report should be
considered carefully when evaluating us. These risk factors could affect our actual results. Other
risks and uncertainties, in addition to those that are described below, may also impair our
business operations. If any of the following risks occur, our business, financial condition or
results of operations could be affected materially and adversely. In that case, we may be unable to
pay dividends to our shareholders and the trading price of our common shares could decline. These
risk factors should be read in conjunction with the other detailed information concerning us set
forth in our accompanying financial statements and notes and
contained in “Item 7. Management’s
Discussion and Analysis of Financial Condition and Results of Operations” included herein.
Our cash flow consists almost exclusively of distributions from Crosstex Energy, L.P.
Our only cash-generating assets are our partnership interests in Crosstex Energy, L.P. Our
cash flow is therefore completely dependent upon the ability of the Partnership to make
distributions to its partners. Prior to 2009, we received quarterly distributions from the
Partnership with the last distribution for the fourth quarter of 2008 received in February 2009.
During 2009, the Partnership’s ability to distribute available cash was contractually restricted by the terms of its credit
facility due to its high leverage ratios and it ceased making distributions. Although the
Partnership’s new credit facility should not limit its ability to make distributions during 2010
and in the future, any decision to resume cash distributions on its units and the amount of any
such distributions would consider maintaining sufficient cash flow in excess of the distribution to
continue to move the Partnership towards lower leverage ratios. The Partnership has established a
target over the next couple of years of achieving a ratio of total debt to Adjusted EBITDA of less
than 4.0 to 1.0, and the Partnership does not currently expect to resume cash distributions on its
outstanding units until it achieves such a ratio of less than 4.5 to 1.0 (pro forma for any
distribution). The Partnership will also consider general economic conditions and its outlook for
business as it determines to pay any distribution.
16
The Partnership may not have sufficient available cash each quarter to pay distributions to
unitholders. The amount of cash that the Partnership can distribute to its partners, including us,
each quarter principally depends upon the amount of cash it generates from its operations, which
will fluctuate from quarter to quarter based on, among other things:
| |
• |
|
the amount of natural gas transported in its gathering and transmission pipelines; |
| |
• |
|
the level of the Partnership’s processing operations; |
| |
• |
|
the fees the Partnership charges and the margins it realizes for its services; |
| |
• |
|
the price of natural gas; |
| |
• |
|
the relationship between natural gas and NGL prices; and |
| |
• |
|
its level of operating costs; |
In addition, the actual amount of cash the Partnership will have available for distribution
will depend on other factors, some of which are beyond its control, including:
| |
• |
|
the level of capital expenditures the Partnership makes; |
| |
• |
|
the cost of acquisitions, if any; |
| |
• |
|
its debt service requirements; |
| |
• |
|
fluctuations in its working capital needs; |
| |
• |
|
its ability to make working capital borrowings under its bank credit facility to pay
distributions; |
| |
• |
|
prevailing economic conditions; and |
| |
• |
|
the amount of cash reserves established by the general partner in its sole discretion
for the proper conduct of its business. |
Because of these factors, the Partnership may not be able, or may not have sufficient
available cash to pay distributions to unitholders each quarter. Furthermore, you should also be
aware that the amount of cash the Partnership has available for distribution depends primarily upon
its cash flow, including cash flow from financial reserves and working capital borrowings, and is
not solely a function of profitability, which will be affected by non-cash items. As a result, the
Partnership may make cash distributions during periods when it records losses and may not make cash
distributions during periods when it records net income.
We are largely prohibited from engaging in activities that compete with the Partnership.
So long as we own the general partner of the Partnership, we are prohibited by an omnibus
agreement with the Partnership from engaging in the business of gathering, transmitting, treating,
processing, storing and marketing natural gas and transporting, fractionating, storing and
marketing NGLs, except to the extent that the Partnership, with the concurrence of its independent
directors comprising its conflicts committee, elects not to engage in a particular acquisition or
expansion opportunity. This exception for competitive activities is relatively limited. Although we
have no current intention of pursuing the types of opportunities that we are permitted to pursue
under the omnibus agreement such as competitive opportunities that the Partnership declines to
pursue or permitted activities that are not competition with the Partnership, the provisions of the
omnibus agreement may, in the future, limit activities that we would otherwise pursue.
17
In our corporate charter, we have renounced business opportunities that may be pursued by the
Partnership or by certain stockholders.
In our restated charter and in accordance with Delaware law, we have renounced any interest or
expectancy we may have in, or being offered an opportunity to participate in, any business
opportunities, including any opportunities within those classes of opportunity currently pursued by
the Partnership, presented to:
| |
• |
|
persons who are officers or directors of the company or who, on October 1, 2003, were,
and at the time of presentation are, stockholders of the company (or to persons who are
affiliates or associates of such officers, directors or stockholders), if the company is
prohibited from participating in such opportunities by the omnibus agreement; or |
| |
• |
|
any investment fund sponsored or managed by Yorktown Partners LLC, including any fund
still to be formed, or to any of our directors who is an affiliate or designate of these
entities. |
As a result of this renunciation, these officers, directors and stockholders should not be
deemed to be breaching any fiduciary duty to us if they or their affiliates or associates pursue
opportunities presented as described above.
Although we control the Partnership, the general partner owes fiduciary duties to the
Partnership and the unitholders.
Conflicts of interest exist and may arise in the future as a result of the relationship
between us and our affiliates, including the general partner, on the one hand, and the Partnership
and its limited partners, on the other hand. The directors and officers of Crosstex Energy GP, LLC
have fiduciary duties to manage the general partner in a manner beneficial to us, its owner. At the
same time, the general partner has a fiduciary duty to manage the Partnership in a manner
beneficial to the Partnership and its limited partners. The board of directors of Crosstex Energy
GP, LLC will resolve any such conflict and has broad latitude to consider the interests of all
parties to the conflict. The resolution of these conflicts may not always be in our best interest
or that of our stockholders.
For example, conflicts of interest may arise in the following situations:
| |
• |
|
the allocation of shared overhead expenses to the Partnership and us; |
| |
• |
|
the interpretation and enforcement of contractual obligations between us and our
affiliates, on the one hand, and the Partnership, on the other hand, including obligations
under the omnibus agreement; |
| |
• |
|
the determination of the amount of cash to be distributed to the Partnership’s partners
and the amount of cash to be reserved for the future conduct of the Partnership’s business; |
| |
• |
|
the determination whether to make borrowings under the capital facility to pay
distributions to partners; and |
| |
• |
|
any decision we make in the future to engage in activities in competition with the
Partnership as permitted under our omnibus agreement with the Partnership. |
If the general partner is not fully reimbursed or indemnified for obligations and liabilities it
incurs in managing the business and affairs of the Partnership, its value, and therefore the
value of our common stock, could decline.
The general partner may make expenditures on behalf of the Partnership for which it will seek
reimbursement from the Partnership. In addition, under Delaware partnership law, the general
partner, in its capacity as the general partner of the Partnership, has unlimited liability for the
obligations of the Partnership, such as its debts and environmental liabilities, except for those
contractual obligations of the Partnership that are expressly made without recourse to the general
partner. To the extent the general partner incurs obligations on behalf of the Partnership, it is
entitled to be reimbursed or indemnified by the general partner. In the event that the Partnership
is unable or unwilling to reimburse or indemnify the general partner, the general partner may be
unable to satisfy these liabilities or obligations, which would reduce its value and therefore the
value of our common stock.
The Partnership’s profitability is dependent upon prices and market demand for natural gas and
NGLs, which are beyond its control and have been volatile.
The Partnership’s business is subject to significant risks due to fluctuations in commodity
prices. It is directly exposed to these risks primarily in the gas processing component of its
business. It is also indirectly exposed to commodity prices due to the negative
impacts on production and the development of production of natural gas and NGLs connected to
or near its assets and on its margins for transportation between certain market centers. A large
percentage of its processing fees are realized under percent of liquids (POL) contracts that are
directly impacted by the market price of NGLs. It also realizes processing gross margins under
processing margin (margin) contracts. These settlements are impacted by the relationship between
NGL prices and the underlying natural gas prices, which is also referred to as the fractionation
spread.
18
A significant volume of inlet gas at the Partnership’s south Louisiana and north Texas
processing plants is settled under POL agreements. The POL fees are denominated in the form of a
share of the liquids extracted and it is not responsible for the fuel or shrink associated with
processing. Therefore, revenue under a POL agreement is directly impacted by NGL prices, and the
decline of these prices in the second half of 2008 and early 2009 contributed to a significant
decline in the Partnership’s gross margin from processing.
The Partnership has a number of contracts on its Plaquemine and Gibson processing plants that
expose it to the fractionation spread. Under these margin contracts its gross margin is based upon
the difference in the value of NGLs extracted from the gas less the value of the product in its
gaseous state (“shrink”) and the cost of fuel to extract during processing. During the second half
of 2008 and early 2009, the fractionation spread narrowed significantly as the value of NGLs
decreased more than the value of the gas and fuel associated with the processed gas. Thus the gross
margin realized under these margin contracts was negatively impacted due to the commodity price
environment. Such a decline may negatively impact its gross margin in the future if such declines
again.
In the past, the prices of natural gas and NGLs have been extremely volatile and the
Partnership expects this volatility to continue. For example, prices of oil, natural gas and NGLs
in 2009 were below the market price realized throughout most of 2008. Crude oil prices (based on
the New York Mercantile Exchange (the “NYMEX”) futures daily close prices for the prompt month)
improved during 2009 with prices ranging from a low of $33.98 per Bbl in February 2009 to a high of
$81.37 per Bbl in October 2009. Weighted average NGL prices (based on the Oil Price Information
Service (OPIS) Mt. Belvieu daily average spot liquids prices) have also improved with prices
ranging from a low of $0.58 per gallon in March 2009 to a high of $1.21 per gallon in December
2009. Natural gas prices declined during 2009 with prices ranging from a high of $6.10 per MMBtu in
January 2009 to a low of $1.85 per MMBtu in September 2009. Natural gas prices improved during the
fourth quarter of 2009, with prices reaching a high of $6.00 per MMBtu in December 2009.
The markets and prices for natural gas and NGLs depend upon factors beyond the Partnership’s
control. These factors include the supply and demand for oil, natural gas and NGLs, which fluctuate
with changes in market and economic conditions and other factors, including:
| |
• |
|
the impact of weather on the demand for oil and natural gas; |
| |
• |
|
the level of domestic oil and natural gas production; |
| |
• |
|
technology, including improved production techniques (particularly with respect to
shale development); |
| |
• |
|
the level of domestic industrial and manufacturing activity; |
| |
• |
|
the availability of imported oil, natural gas and NGLs; |
| |
• |
|
international demand for oil and NGLs; |
| |
• |
|
actions taken by foreign oil and gas producing nations; |
| |
• |
|
the availability of local, intrastate and interstate transportation systems; |
| |
• |
|
the availability of downstream NGL fractionation facilities; |
| |
• |
|
the availability and marketing of competitive fuels; |
| |
• |
|
the impact of energy conservation efforts; and |
| |
• |
|
the extent of governmental regulation and taxation, including the regulation of
“greenhouse gases.” |
19
Changes in commodity prices may also indirectly impact the Partnership’s profitability by
influencing drilling activity and well operations, and thus the volume of gas it can gather and process. This volatility may cause
the Partnership’s gross margin and cash flows to vary widely from period to period. Hedging
strategies may not be sufficient to offset price volatility risk and, in any event, do not cover
all of the Partnership’s throughput volumes. Moreover, hedges are subject to inherent risks, which
we describe in “—The Partnership’s use of derivative financial instruments does not eliminate its
exposure to fluctuations in commodity prices and interest rates and has in the past and could in
the future result in financial losses or reduced income.” For a discussion of the Partnership’s
risk management activities, please read “Item 7A. Qualitative and Quantitative Disclosure about
Market Risk.”
The Partnership’s substantial indebtedness could limit its flexibility and adversely affect its
financial health.
The Partnership has a substantial amount of indebtedness. As of December 31, 2009, the
Partnership had approximately $873.7 million of indebtedness outstanding. As of February 12, 2010,
after repayment of existing debt with proceeds from the sale of preferred units together with
proceeds from the issuance of its senior unsecured notes and borrowings under its new credit
facility, the Partnership had approximately $790.6 million (including $15.2 million of original
issue discount on the senior unsecured notes) of indebtedness outstanding, including $725.0 million
of senior unsecured notes and $47.5 million of secured indebtedness outstanding under our new
credit facility and $18.1 million of series B secured note associated with the Eunice lease
acquisition. The Partnership also had approximately $179.4 million of letters of credit outstanding
under its old credit facility as of February 12, 2010 that were subsequently replaced by letters of
credit under the new credit facility.
The Partnership’s substantial indebtedness could limit its flexibility and adversely affect
its financial health. For example, it could:
| |
• |
|
make the Partnership more vulnerable to general adverse economic and industry
conditions; |
| |
• |
|
require the Partnership to dedicate a substantial portion of its cash flow from
operations to payments on its indebtedness, thereby reducing the availability of its cash
flow for operations and other purposes; |
| |
• |
|
limit the Partnership’s flexibility in planning for, or reacting to, changes in its
business and the industry in which it operates; and |
| |
• |
|
place the Partnership at a competitive disadvantage compared to competitors that may
have proportionately less indebtedness. |
In addition, the Partnership’s ability to make scheduled payments or to refinance obligations
depends on its successful financial and operating performance. The Partnership cannot assure you
that its operating performance will generate sufficient cash flow or
that its capital resources will be sufficient for payment of its indebtedness obligations in the future. The Partnership’s
financial and operating performance, cash flow and capital resources depend upon prevailing
economic conditions and certain financial, business and other factors, many of which are beyond its
control.
If the Partnership’s cash flow and capital resources are insufficient to fund its debt service
obligations, the Partnership may be forced to sell material assets or operations, obtain additional
capital or restructure its debt. In the event that the Partnership is required to dispose of
material assets or operations or restructure its debt to meet debt service and other obligations,
it cannot assure you as to the terms of any such transaction or how quickly any such transaction
could be completed, if at all.
The Partnership may not be able to obtain additional funding for future capital needs or to
refinance its debt, either on acceptable terms or at all.
Global financial markets and economic conditions have been, and continue to be, disrupted and
volatile, which has caused substantial contraction in the credit and capital markets. These
conditions, along with significant write-offs in the financial services sector and current weak
economic conditions, have made, and will likely continue to make, it difficult to obtain funding
for the Partnership’s capital needs. As a result, the cost of raising money in the debt and equity
capital markets has increased substantially while the availability of funds from those markets has
diminished significantly. Due to these factors, the Partnership cannot be certain that new debt or
equity financing will be available to it on acceptable terms or at all. If funding is not available
when needed, or is available only on unfavorable terms, the Partnership may be unable to meet its
obligations as they come due. Without adequate funding, the Partnership may be unable to execute
its growth strategy, complete future acquisitions or future construction projects or other capital
expenditures, take advantage of other business opportunities or respond to competitive pressures,
any of which could have a material adverse effect on its revenues and results of operations.
Further, its customers may increase collateral requirements from the Partnership, including letters
of credit which reduce available borrowing capacity, or reduce the business they transact with the
Partnership to reduce their credit exposure.
Due to current economic conditions, the Partnership’s ability to obtain funding under its new
credit facility could be impaired.
The Partnership operates in a capital-intensive industry and relies on its new credit facility
to assist in financing a significant portion of its capital expenditures. The Partnership’s ability
to borrow under its new credit facility may be impaired. Specifically, the Partnership may be
unable to obtain adequate funding under its new credit facility because:
| |
• |
|
one or more of the Partnership’s lenders may be unable or otherwise fail to meet its
funding obligations; |
| |
• |
|
the lenders do not have to provide funding if there is a default under the credit
agreement or if any of the representations or warranties included in the agreement are
false in any material respect; and |
| |
• |
|
if any lender refuses to fund its commitment for any reason, whether or not valid, the
other lenders are not required to provide additional funding to make up for the unfunded portion. |
20
If the Partnership is unable to access funds under its new credit facility, the Partnership
will need to meet its capital requirements, including some of its short-term capital requirements,
using other sources. Alternative sources of liquidity may not be available on acceptable terms, if
at all. If the cash generated from its operations or the funds the Partnership is able to obtain
under its new credit facility or other sources of liquidity are not sufficient to meet its capital
requirements, then it may need to delay or abandon capital projects or other business
opportunities, which could have a material adverse effect on its results of operations and
financial condition.
Due to the Partnership’s lack of asset diversification, adverse developments in its gathering,
transmission, processing and producer services businesses would materially impact its financial
condition.
The Partnership relies exclusively on the revenues generated from its gathering, transmission,
processing and producer services businesses and as a result its financial condition depends upon
prices of, and continued demand for, natural gas and NGLs. Due to its lack of asset
diversification, an adverse development in one of these businesses would have a significantly
greater impact on its financial condition and results of operations than if the Partnership
maintained more diverse assets.
Many of the Partnership’s customers’ drilling activity levels and spending for transportation on
its pipeline system or gathering and processing at its facilities have been, and may continue to
be, impacted by the current deterioration in the credit markets.
Many of the Partnership’s customers finance their drilling activities through cash flow from
operations, the incurrence of debt or the issuance of equity. During the last half of 2008 and
during 2009, there was a significant decline in the credit markets and the availability of credit.
Adverse price changes, coupled with the overall downturn in the economy and the constrained capital
markets, put downward pressure on drilling budgets for gas producers, which has resulted in lower
volumes that the Partnership otherwise would have seen being transported on its pipeline and
gathering systems and processing through its processing plants. The Partnership saw a decline in
drilling activity by gas producers in its Barnett Shale area of operation in north Texas during the
fourth quarter of 2008 and during 2009. A continued decline in drilling activity or low drilling
activity could have a material adverse effect on its operations.
The Partnership is exposed to the credit risk of its customers and counterparties, and a general
increase in the nonpayment and nonperformance by its customers could have an adverse effect on
its financial condition and results of operations.
Risks of nonpayment and nonperformance by the Partnership’s customers are a major concern in
its business. The Partnership is subject to risks of loss resulting from nonpayment or
nonperformance by its customers and other counterparties, such as lenders and hedging
counterparties. Any increase in the nonpayment and nonperformance by its customers could adversely
affect the results of operations and reduce the Partnership’s ability to make distributions to its
unitholders. Many of the Partnership’s customers finance their activities through cash flow from
operations, the incurrence of debt or the issuance of equity. Recently, there has been a
significant decline in the credit markets and the availability of credit. Additionally, many of the
Partnership’s customers’ equity values have substantially declined. The combination of reduction of
cash flow resulting from declines in commodity prices, a reduction in borrowing bases under reserve
based credit facilities and the lack of availability of debt or equity financing may result in a
significant reduction in customers’ liquidity and ability to make payment or perform on their
obligations to the Partnership. Furthermore, some of the customers may be highly leveraged and
subject to their own operating and regulatory risks, which increases the risk that they may default
on their obligations to the Partnership.
The Partnership’s use of derivative financial instruments does not eliminate its exposure to
fluctuations in commodity prices and interest rates and has in the past and could in the future
result in financial losses or reduced income.
The Partnership’s operations expose it to fluctuations in commodity prices, and its new credit
facility exposes the Partnership to fluctuations in interest rates. The Partnership uses
over-the-counter price and basis swaps with other natural gas merchants and financial institutions
and interest rate swaps with financial institutions. Use of these instruments is intended to reduce
its exposure to short-term volatility in commodity prices and interest rates. As of December 31,
2009, the Partnership had hedged only portions of its variable-rate debt and expected natural gas
supply, NGL production and natural gas requirements, and had direct interest rate and commodity
price risk with respect to the unhedged portions. In addition, to the extent the Partnership hedges
its commodity price and interest rate risks using swap instruments, it will forego the benefits of
favorable changes in commodity prices or interest rates. In February 2010, the Partnership settled
all of its interest rate swaps associated with its existing credit facility when the Partnership
repaid the debt outstanding under this facility.
21
Even though monitored by management, the Partnership’s hedging activities may fail to protect
it and could reduce earnings and cash flow. Its hedging activity may be ineffective or adversely affect cash flow and earnings
because, among other factors:
| |
• |
|
hedging can be expensive, particularly during periods of volatile prices; |
| |
• |
|
the Partnership’s counterparty in the hedging transaction may default on its obligation
to pay or otherwise fail to perform; and |
| |
• |
|
available hedges may not correspond directly with the risks against which the
Partnership seeks protection. For example: |
| |
• |
|
the duration of a hedge may not match the duration of the risk against which the
Partnership seeks protection; |
| |
• |
|
variations in the index used to price a commodity hedge may not adequately
correlate with variations in the index used to sell the physical commodity (known as
basis risk); and |
| |
• |
|
the Partnership may not produce or process sufficient volumes to cover swap
arrangements it enters into for a given period. If its actual volumes are lower than the
volumes it estimated when entering into a swap for the period, the Partnership might be
forced to satisfy all or a portion of its derivative obligation without the benefit of
cash flow from its sale or purchase of the underlying physical commodity, which could
adversely affect liquidity. |
The Partnership’s financial statements may reflect gains or losses arising from exposure to
commodity prices or interest rates for which it is unable to enter into fully effective hedges. In
addition, the standards for cash flow hedge accounting are rigorous. Even when the Partnership
engages in hedging transactions that are effective economically, these transactions may not be
considered effective cash flow hedges for accounting purposes. Partnership earnings could be
subject to increased volatility to the extent its derivatives do not continue to qualify as cash
flow hedges, and, if the Partnership assumes derivatives as part of an acquisition, to the extent
it cannot obtain or choose not to seek cash flow hedge accounting for the derivatives it assumes.
Please read “Item 7A. Quantitative and Qualitative Disclosure about Market Risk” for a summary of
the Partnership’s hedging activities.
The Partnership may not be successful in balancing its purchases and sales.
The Partnership is a party to certain long-term gas sales commitments that it satisfies
through supplies purchased under long-term gas purchase agreements. When the Partnership enters
into those arrangements, its sales obligations generally match its purchase obligations. However,
over time the supplies that the Partnership has under contract may decline due to reduced drilling
or other causes and it may be required to satisfy the sales obligations by buying additional gas at
prices that may exceed the prices received under the sales commitments. In addition, a producer
could fail to deliver contracted volumes or deliver in excess of contracted volumes, or a consumer
could purchase more or less than contracted volumes. Any of these actions could cause the
Partnership’s purchases and sales not to be balanced. If the Partnership’s purchases and sales are
not balanced, it will face increased exposure to commodity price risks and could have increased
volatility in operating income.
The Partnership makes certain commitments to purchase natural gas in production areas based on
production-area indices and to sell the natural gas into market areas based on market-area indices,
pay the costs to transport the natural gas between the two points and capture the difference
between the indices as margin. Changes in the index prices relative to each other (also referred to
as basis spread) can significantly affect the Partnership’s margins or even result in losses. For
example, the Partnership is a party to one contract where it buys gas on several different
production-area indices on its NTP and sells the gas into a different market area index. For the
fourth quarter of 2009, this imbalance resulted in a loss of approximately $1.8 million due to
basis differentials between the various market prices.
The Partnership must continually compete for natural gas supplies, and any decrease in its
supplies of natural gas could adversely affect its financial condition and results of
operations.
If the Partnership is unable to maintain or increase the throughput on its systems by
accessing new natural gas supplies to offset the natural decline in reserves, its business and
financial results could be materially, adversely affected. In addition, the Partnership’s future
growth will depend, in part, upon whether it can contract for additional supplies at a greater rate
than the rate of natural decline in its currently connected supplies.
In order to maintain or increase throughput levels in the Partnership’s natural gas gathering
systems and asset utilization rates at the Partnership’s processing plants and to fulfill its
current sales commitments, it must continually contract for new natural gas supplies. The
Partnership may not be able to obtain additional contracts for natural gas supplies. The primary
factors affecting its ability to connect new wells to its gathering facilities include the
Partnership’s success in contracting for existing natural gas supplies that are not committed to
other systems and the level of drilling activity near its gathering systems. Fluctuations in energy
prices can greatly affect production rates and investments by third parties in the development of
new oil and natural gas reserves. For example, as oil and natural gas prices decreased during the last half of 2008 and the first half of 2009,
there was a corresponding decrease in drilling activity. Tax policy changes or additional
regulatory restrictions on development could also have a negative impact on drilling activity,
reducing supplies of natural gas available to the Partnership’s systems. The Partnership has no
control over producers and depends on them to maintain sufficient levels of drilling activity. A
material decrease in natural gas production or in the level of drilling activity in the
Partnership’s principal geographic areas for a prolonged period, as a result of depressed commodity
prices or otherwise, likely would have a material adverse effect on results of operations and
financial position.
22
The Partnership is vulnerable to operational, regulatory and other risks due to its
concentration of assets in south Louisiana and the Gulf of Mexico, including the effects of
adverse weather conditions such as hurricanes.
The Partnership’s operations and revenues will be significantly impacted by conditions in
south Louisiana and the Gulf of Mexico because it has a significant portion of its assets located
in south Louisiana and the Gulf of Mexico. In 2008, the Partnership’s business was negatively impacted by hurricanes
Gustav and Ike, which came ashore in the Gulf Coast in September. These storms resulted in an
adverse impact to the Partnership’s gross margins of approximately $22.9 million in the last half
of 2008. Although the Partnership’s assets did not sustain substantial physical damage, several
offshore production platforms and pipelines owned by third parties that transport gas production to
our Pelican, Eunice, Sabine Pass and Blue Water processing plants in south Louisiana were damaged
by the storms. Some of the repairs to these offshore facilities were completed during the fourth
quarter of 2008, but gas production to the Partnership’s south Louisiana plants did not recover to
pre-hurricane levels until September 2009.
The Partnership’s concentration of activity in Louisiana and the Gulf of Mexico makes it more
vulnerable than many of its competitors to the risks associated with these areas, including:
| |
• |
|
adverse weather conditions, including hurricanes and tropical storms; |
| |
• |
|
delays or decreases in production, the availability of equipment, facilities or
services; and |
| |
• |
|
changes in the regulatory environment. |
Because a significant portion of the Partnership’s operations could experience the same
condition at the same time, these conditions could have a relatively greater impact on its results
of operations than they might have on other midstream companies who have operations in more
diversified geographic areas.
In addition, the Partnership’s operations in south Louisiana are dependent upon continued
conventional and deep shelf drilling in the Gulf of Mexico. The deep shelf in the Gulf of Mexico is
an area that has had limited historical drilling activity. This is due, in part, to its geological
complexity and depth. Deep shelf development is more expensive and inherently more risky than
conventional shelf drilling. A decline in the level of deep shelf drilling in the Gulf of Mexico
could have an adverse effect on the Partnership’s financial condition and results of operations.
Increased regulation of hydraulic fracturing could result in reductions or delays in natural gas
production by the Partnership’s customers, which could adversely impact its revenues.
The U.S. Congress is currently considering legislation to amend the federal Safe Drinking
Water Act to subject hydraulic fracturing operations to regulation under that Act and to require
the disclosure of chemicals used by the oil and gas industry in the hydraulic fracturing process.
Hydraulic fracturing is an important and commonly used process in the completion of oil and gas
wells by our customers, particularly in Barnett Shale and Haynesville Shale regions of the
Partnership’s operations. Hydraulic fracturing involves the injection of water, sand and chemicals
under pressure into rock formations to stimulate gas production. Sponsors of bills currently
pending before the U.S. Senate and House of Representatives have asserted that chemicals used in
the fracturing process could adversely affect drinking water supplies. Proposed legislation would
require, among other things, the reporting and public disclosure of chemicals used in the
fracturing process, which could make it easier for third parties opposing the hydraulic fracturing
process to initiate legal proceedings against producers and service providers. In addition, these
bills, if adopted, could establish an additional level of regulation and permitting of hydraulic
fracturing operations at the federal level, which could lead to operational delays, increased
operating costs and additional regulatory burdens that could make it more difficult for our
customers to perform hydraulic fracturing. Many producers make extensive use of hydraulic
fracturing in the areas that the Partnership serves and any increased federal, state or local
regulation could reduce the volumes of natural gas that they move through the Partnership’s
gathering systems which would materially adversely affect revenues and results of operations.
23
A substantial portion of the Partnership’s assets are connected to natural gas reserves that
will decline over time, and the cash flows associated with those assets will decline
accordingly.
A substantial portion of the Partnership’s assets, including its gathering systems, is
dedicated to certain natural gas reserves and wells for which the production will naturally decline
over time. Accordingly, cash flows associated with these assets will also decline. If the
Partnership is unable to access new supplies of natural gas either by connecting additional
reserves to its existing assets or by constructing or acquiring new assets that have access to
additional natural gas reserves, cash flows may decline.
Growing the Partnership’s business by constructing new pipelines and processing facilities
subjects it to construction risks, risks that natural gas supplies will not be available upon
completion of the facilities and risks of construction delay and additional costs due to
obtaining rights-of-way and complying with federal, state and local laws.
One of the ways the Partnership intends to grow its business is through the construction of
additions to our existing gathering systems and construction of new pipelines and gathering and
processing facilities. The construction of pipelines and gathering and processing facilities
requires the expenditure of significant amounts of capital, which may exceed our expectations.
Generally, the Partnership may have only limited natural gas supplies committed to these facilities
prior to their construction. Moreover, it may construct facilities to capture anticipated future
growth in production in a region in which anticipated production growth does not materialize. The
Partnership may also rely on estimates of proved reserves in its decision to construct new
pipelines and facilities, which may prove to be inaccurate because there are numerous uncertainties
inherent in estimating quantities of proved reserves. As a result, new facilities may not be able
to attract enough natural gas to achieve the expected investment return, which could adversely
affect the Partnership’s results of operations and financial condition. In addition, the
Partnership faces the risks of construction delay and additional costs due to obtaining
rights-of-way and local permits and complying with federal or state laws and city ordinances,
particularly as the Partnership expands its operations into more urban, populated areas such as the
Barnett Shale.
Acquisitions typically increase the Partnership’s debt and subjects it to other substantial
risks, which could adversely affect its results of operations.
From time to time, the Partnership may evaluate and seek to acquire assets or businesses that
it believes complement existing business and related assets. The Partnership may acquire assets or
businesses that it plans to use in a manner materially different from their prior owner’s use. Any
acquisition involves potential risks, including:
| |
• |
|
the inability to integrate the operations of recently acquired businesses or assets; |
| |
• |
|
the diversion of management’s attention from other business concerns; |
| |
• |
|
the loss of customers or key employees from the acquired businesses; |
| |
• |
|
a significant increase in the Partnership’s indebtedness; and |
| |
• |
|
potential environmental or regulatory liabilities and title problems. |
Management’s assessment of these risks is necessarily inexact and may not reveal or resolve
all existing or potential problems associated with an acquisition. Realization of any of these
risks could adversely affect the Partnership’s operations and cash flows. If Partnership
consummates any future acquisition, its capitalization and results of operations may change
significantly, and you will not have the opportunity to evaluate the economic, financial and other
relevant information that the Partnership will consider in determining the application of these
funds and other resources.
Additionally, the Partnership’s ability to grow its asset base in the near future through
acquisitions may be limited due to its lack of access to capital markets.
The Partnership expects to encounter significant competition in any new geographic areas into
which it seeks to expand and its ability to enter such markets may be limited.
If the Partnership expands its operations into new geographic areas, it expects to encounter
significant competition for natural gas supplies and markets. Competitors in these new markets will
include companies larger than the Partnership, which have both lower capital costs and greater
geographic coverage, as well as smaller companies, which have lower total cost structures. As a
result, the Partnership may not be able to successfully develop acquired assets and markets located
in new geographic areas and its results of operations could be adversely affected.
24
The Partnership may not be able to retain existing customers or acquire new customers, which
would reduce its revenues and limit its future profitability.
The renewal or replacement of existing contracts with the Partnership’s customers at rates
sufficient to maintain current revenues and cash flows depends on a number of factors beyond its
control, including competition from other pipelines, and the price of, and demand for, natural gas
in the markets the Partnership serves. The inability of the Partnership’s management to renew or
replace its current contracts as they expire and to respond appropriately to changing market
conditions could have a negative effect on its profitability.
In particular, the Partnership’s ability to renew or replace its existing contracts with
industrial end-users and utilities impacts its profitability. For the year ended December 31, 2009,
approximately 48.5% of the Partnership’s sales of natural gas that was transported using its
physical facilities were to industrial end-users and utilities. As a consequence of the increase in
competition in the industry and volatility of natural gas prices, end-users and utilities are
reluctant to enter into long-term purchase contracts. Many end-users purchase natural gas from more
than one natural gas company and have the ability to change providers at any time. Some of these
end-users also have the ability to switch between gas and alternate fuels in response to relative
price fluctuations in the market. Because there are numerous companies of greatly varying size and
financial capacity that compete with the Partnership in the marketing of natural gas, the
Partnership often competes in the end-user and utilities markets primarily on the basis of price.
The Partnership depends on certain key customers, and the loss of any of its key customers could
adversely affect its financial results.
The Partnership derives a significant portion of its revenues from contracts with key
customers. To the extent that these and other customers may reduce volumes of natural gas purchased
or transported under existing contracts, the Partnership would be adversely affected unless it was
able to make comparably profitable arrangements with other customers. Certain agreements with key
customers provide for minimum volumes of natural gas or natural gas services that require the
customer to transport, process or purchase until the expiration of the term of the applicable
agreement, subject to certain force majeure provisions. Customers may default on their obligations
to transport, process or purchase the minimum volumes of natural gas or natural gas services
required under the applicable agreements.
The Partnership’s business involves many hazards and operational risks, some of which may not be
fully covered by insurance.
The Partnership’s operations are subject to the many hazards inherent in the gathering,
compressing, processing and storage of natural gas and NGLs, including:
| |
• |
|
damage to pipelines, related equipment and surrounding properties caused by hurricanes,
floods, fires and other natural disasters and acts of terrorism; |
| |
• |
|
inadvertent damage from construction and farm equipment; |
| |
• |
|
leaks of natural gas, NGLs and other hydrocarbons; and |
These risks could result in substantial losses due to personal injury and/or loss of life,
severe damage to and destruction of property and equipment and pollution or other environmental
damage and may result in curtailment or suspension of the Partnership’s related operations. The
Partnership is not fully insured against all risks incident to its business. In accordance with
typical industry practice, the Partnership does not have any property insurance on any of it
underground pipeline systems that would cover damage to the pipelines. It is not insured against
all environmental accidents that might occur, other than those considered to be sudden and
accidental. If a significant accident or event occurs that is not fully insured, it could adversely
affect the Partnership’s operations and financial condition.
The threat of terrorist attacks has resulted in increased costs, and future war or risk of war
may adversely impact the Partnership’s results of operations and its ability to raise capital.
Terrorist attacks or the threat of terrorist attacks cause instability in the global financial
markets and other industries, including the energy industry. Infrastructure facilities, including
pipelines, production facilities, and transmission and distribution facilities, could be direct
targets, or indirect casualties, of an act of terror. The Partnership’s insurance policies
generally exclude acts of terrorism. Such insurance is not available at what it believes to be
acceptable pricing levels.
25
Federal, state or local regulatory measures could adversely affect the Partnership’s business.
The Partnership’s natural gas gathering and processing activities generally are exempt from
FERC regulation under the Natural Gas Act. However, the distinction between FERC-regulated transmission services and federally
unregulated gathering services is the subject of substantial, on-going litigation, so the
classification and regulation of our gathering facilities are subject to change based on future
determinations by FERC and the courts. Natural gas gathering may receive greater regulatory
scrutiny at both the state and federal levels since FERC has less extensively regulated the
gathering activities of interstate pipeline transmission companies and a number of such companies
have transferred gathering facilities to unregulated affiliates. The Partnership’s gathering
operations also may be or become subject to safety and operational regulations relating to the
design, installation, testing, construction, operation, replacement and management of gathering
facilities. Additional rules and legislation pertaining to these matters are considered or adopted
from time to time. The Partnership cannot predict what effect, if any, such changes might have on
its operations, but the industry could be required to incur additional capital expenditures and
increased costs depending on future legislative and regulatory changes.
The rates, terms and conditions of service under which the Partnership transports natural gas
in its pipeline systems in interstate commerce are subject to FERC regulation under the Section 311
of the Natural Gas Policy Act. Under these regulations, the Partnership is required to justify its
rates for interstate transportation service on a cost-of-service basis, every three years. The
Partnership’s intrastate natural gas pipeline operations are subject to regulation by various
agencies of the states in which they are located. Should FERC or any of these state agencies
determine that the Partnership’s rates for Section 311 transportation service or intrastate
transportation service should be lowered, its business could be adversely affected.
Other state and local regulations also affect the Partnership’s business. It is subject to
some ratable take and common purchaser statutes in the states where it operate. Ratable take
statutes generally require gatherers to take, without undue discrimination, natural gas production
that may be tendered to the gatherer for handling. Similarly, common purchaser statutes generally
require gatherers to purchase without undue discrimination as to source of supply or producer.
These statutes have the effect of restricting the Partnership’s right as an owner of gathering
facilities to decide with whom it will contract to purchase or transport natural gas. Federal law
leaves any economic regulation of natural gas gathering to the states, and some of the states in
which the Partnership operates have adopted complaint-based or other limited economic regulation of
natural gas gathering activities. States in which the Partnership operates that have adopted some
form of complaint-based regulation, like Texas, generally allow natural gas producers and shippers
to file complaints with state regulators in an effort to resolve grievances relating to natural gas
gathering access and rate discrimination.
The states in which the Partnership conducts operations administer federal pipeline safety
standards under the Pipeline Safety Act of 1968. The “rural gathering exemption” under the Natural
Gas Pipeline Safety Act of 1968 presently exempts substantial portions of its gathering facilities
from jurisdiction under that statute, including those portions located outside of cities, towns, or
any area designated as residential or commercial, such as a subdivision or shopping center. The
“rural gathering exemption,” however, may be restricted in the future, and it does not apply to the
Partnership’s natural gas transmission pipelines. In response to recent pipeline accidents in other
parts of the country, Congress and the Department of Transportation, or DOT, have passed or are
considering heightened pipeline safety requirements.
Compliance with pipeline integrity regulations issued by the United States Department of
Transportation in December 2003 or those issued by the TRRC could result in substantial
expenditures for testing, repairs and replacement. TRRC regulations require periodic testing of all
intrastate pipelines meeting certain size and location requirements. The Partnership’s costs
relating to compliance with the required testing under the TRRC regulations, adjusted to exclude
costs associated with discontinued operations, were approximately at $1.1 million, $1.4 million,
and $0.1 million for the years ended December 31, 2009, 2008, and 2007, respectively. The
Partnership expects the costs for compliance with TRRC and DOT regulations to be approximately $3.7
million during 2010. If the Partnership’s pipelines fail to meet the safety standards mandated by
the TRRC or the DOT regulations, then it may be required to repair or replace sections of such
pipelines, the cost of which cannot be estimated at this time.
As the Partnership’s operations continue to expand into and around urban, or more populated
areas, such as the Barnett Shale, it may incur additional expenses to mitigate noise, odor and
light that may be emitted in its operations, and expenses related to the appearance of its
facilities. Municipal and other local or state regulations are imposing various obligations,
including, among other things, regulating the location of our facilities, imposing limitations on
the noise levels of the Partnership’s facilities and requiring certain other improvements that
increase the cost of its facilities. The Partnership is also subject to claims by neighboring
landowners for nuisance related to the construction and operation of its facilities, which could
subject it to damages for declines in neighboring property values due to its construction and
operation of facilities.
26
The Partnership’s business involves hazardous substances and may be adversely affected by
environmental regulation.
Many of the operations and activities of the Partnership’s gathering systems, processing
plants, fractionators and other facilities are subject to significant federal, state and local
environmental laws and regulations. The obligations imposed by these laws and regulations include
obligations related to air emissions and discharge of pollutants from facilities and the cleanup of
hazardous substances and other wastes that may have been released at properties currently or
previously owned or operated by the Partnership or locations to which it has sent wastes for treatment or disposal. Various governmental
authorities have the power to enforce compliance with these laws and regulations and the permits
issued under them, and violators are subject to administrative, civil and criminal penalties,
including civil fines, injunctions or both. Strict, joint and several liability may be incurred
under these laws and regulations for the remediation of contaminated areas. Private parties,
including the owners of properties near the Partnership’s facilities or upon or through which the
Partnership’s gathering systems traverse, may also have the right to pursue legal actions to
enforce compliance as well as to seek damages for non-compliance with environmental laws and
regulations for releases of contaminants or for personal injury or property damage.
There is inherent risk of the incurrence of significant environmental costs and liabilities in
the Partnership’s business due to its handling of natural gas and other petroleum substances, air
emissions related to its operations, historical industry operations, waste disposal practices and
the prior use of natural gas flow meters containing mercury. In addition, the possibility exists
that stricter laws, regulations or enforcement policies could significantly increase compliance
costs and the cost of any remediation that may become necessary. The Partnership may incur material
environmental costs and liabilities. Furthermore, its insurance may not provide sufficient coverage
in the event an environmental claim is made against it.
The Partnership’s business may be adversely affected by increased costs due to stricter
pollution control requirements or liabilities resulting from non-compliance with required operating
or other regulatory permits. New environmental laws or regulations, including, for example,
legislation being considered by the U.S. Congress relating to the control of greenhouse gas
emissions or changes in existing environmental laws or regulations might adversely affect products
and activities, including processing, storage and transportation, as well as waste management and
air emissions. Federal and state agencies could also impose additional safety requirements, any of
which could affect the Partnership’s profitability. Changes in laws or regulations could also limit
production or the operation of the Partnership’s assets or adversely affect its ability to comply
with applicable legal requirements or the demand for natural gas, which could adversely affect
business and the Partnership’s profitability.
The Partnership’s success depends on key members of its management, the loss or replacement of
whom could disrupt business operations.
The Partnership depends on the continued employment and performance of the officers of the
general partner of its general partner and key operational personnel. The general partner of its
general partner has entered into employment agreements with each of its executive officers. If any
of these officers or other key personnel resign or become unable to continue in their present roles
and are not adequately replaced, the Partnership’s business operations could be materially
adversely affected. The Partnership does not maintain any “key man” life insurance for any
officers.
Item 1B. Unresolved Staff Comments
We do not have any unresolved staff comments.
Item 2. Properties
A description of the Partnership’s properties is contained in “Item 1. Business.”
Title to Properties
Substantially all of the Partnership’s pipelines are constructed on rights-of-way granted by
the apparent record owners of the property. Lands over which pipeline rights-of-way have been
obtained may be subject to prior liens that have not been subordinated to the right-of-way grants.
The Partnership has obtained, where necessary, easement agreements from public authorities and
railroad companies to cross over or under, or to lay facilities in or along, watercourses, county
roads, municipal streets, railroad properties and state highways, as applicable. In some cases,
property on which the Partnership’s pipeline was built was purchased in fee. The Partnership’s
processing plants are located on land that it leases or owns in fee.
We believe that the Partnership has satisfactory title to all of its rights-of-way and land
assets. Title to these assets may be subject to encumbrances or defects. We believe that none of
such encumbrances or defects should materially detract from the value of the Partnership’s assets
or from the Partnership’s interest in these assets or should materially interfere with their use in
the operation of the business.
27
Item 3. Legal Proceedings
Our operations and those of the Partnership are subject to a variety of risks and disputes
normally incident to our business. As a result, at any given time we or the Partnership may be a
defendant in various legal proceedings and litigation arising in the ordinary course of business,
including litigation on disputes related to contracts, property use or damage and personal injury.
Additionally, as the Partnership continues to expand operations into more urban, populated areas,
such as the Barnett Shale, it may see an increase in claims brought by area landowners, such as
nuisance claims and other claims based on property rights. Except as otherwise set forth herein, we
do not believe that any pending or threatened claim or dispute is material to our financial results
or our operations. We maintain insurance policies with insurers in amounts and with coverage and
deductibles as our general partner believes are reasonable and prudent. However, we cannot assure
that this insurance will be adequate to protect us from all material expenses related to potential
future claims for personal and property damage or that these levels of insurance will be available
in the future at economical prices.
In December 2008, Denbury Onshore, LLC (“Denbury”) initiated formal arbitration proceedings
against Crosstex CCNG Processing Ltd. (“Crosstex Processing”), Crosstex Energy Services, L.P.
(“Crosstex Energy”), Crosstex North Texas Gathering, L.P. (“Crosstex Gathering”) and Crosstex Gulf
Coast Marketing, Ltd. (“Crosstex Marketing”), all wholly-owned subsidiaries of the Partnership,
asserting a claim for breach of contract under a gas processing agreement. Denbury alleged damages
in the amount of $16.2 million, plus interest and attorneys’ fees. Crosstex denied any liability
and sought to have the action dismissed. A three-person arbitration panel conducted a hearing on
the merits in December 2009. At the close of the evidence at the hearing, the panel granted
judgment for Crosstex on one of Denbury’s claims, and on February 16, 2010, the panel granted
judgment for Denbury on its remaining claims in the amount of $3.0 million plus interest,
attorneys’ fees and costs. The panel will conduct
additional proceedings to determine the amount of attorneys’
fees and costs, if any, that should be awarded to Denbury. We estimate that the
total award will be between $3.0 million and $4.0 million at the conclusion of these additional
proceedings and a liability for this award was accrued as of December 31, 2009.
At times, the Partnership’s gas-utility subsidiaries acquire pipeline easements and other
property rights by exercising rights of eminent domain provided under state law. As a result, the
Partnership (or its subsidiaries) is a party to a number of lawsuits under which a court will
determine the value of pipeline easements or other property interests obtained by the Partnership’s
gas utility subsidiaries by condemnation. Damage awards in these suits should reflect the value of
the property interest acquired and the diminution in the value of the remaining property owned by
the landowner. However, some landowners have alleged unique damage
theories to increase their
damage claims or assert valuation methodologies that could result in damage awards in excess of the
amounts anticipated. Although it is not possible to predict the ultimate outcomes of these
matters, the Partnership does not expect that awards in these matters will have a material adverse
impact on its consolidated results of operations or financial condition.
The Partnership (or its subsidiaries) is defending several lawsuits filed by owners of
property located near processing facilities or compression facilities constructed by the
Partnership as part of its systems. The suits generally allege that the facilities create a private
nuisance and have damaged the value of surrounding property. Claims of this nature have arisen as a
result of the industrial development of natural gas gathering, processing and treating facilities
in urban and occupied rural areas. Although it is not possible to predict the ultimate outcomes of
these matters, the Partnership does not believe that these claims will have a material adverse
impact on its consolidated results of operations or financial condition.
On July 22, 2008, SemStream, L.P. and certain of its subsidiaries filed voluntary petitions
for reorganization under Chapter 11 of the U.S. Bankruptcy Code. As of July 22, 2008, SemStream,
L.P. owed the Partnership approximately $6.2 million, including approximately $3.9 million for June
2008 sales and approximately $2.3 million for July 2008 sales. The Partnership believes the July
sales of $2.3 million will receive “administrative claim” status in the bankruptcy proceeding. The
debtor’s schedules acknowledge its obligation to Crosstex for an administrative claim in the amount
of $2.3 million, but it remains subject to an objection by the lenders’ agent. The Partnership
evaluated these receivables for collectibility and recorded a provision for bad debt of $3.1
million during the year ended December 31, 2008 and $0.8 million during the year ended December 31,
2009.
Item 4.
Reserved
PART II
Item 5. Market for Registrant’s Common Equity, Related Stockholder Matters and Issuer Purchases of
Equity Securities
Our common stock is listed on the NASDAQ Global Select Market under the symbol “XTXI”. Our
common stock began trading on January 12, 2004. On
February 16, 2010, the closing market price for
our common stock was $7.75 per share and there were
approximately 13,500 record holders and
beneficial owners (held in street name) of the shares of our common stock.
28
The following table shows the high and low closing sales prices per share, as reported by the
NASDAQ Global Select Market, for the periods indicated:
| |
|
|
|
|
|
|
|
|
|
|
|
|
| |
|
Common Stock |
|
|
|
|
| |
|
Price Range |
|
|
Cash Dividends |
|
| |
|
High |
|
|
Low |
|
|
Paid per Share |
|
2009: |
|
|
|
|
|
|
|
|
|
|
|
|
Quarter Ended December 31 |
|
$ |
6.57 |
|
|
$ |
4.13 |
|
|
|
— |
|
Quarter Ended September 30 |
|
|
5.60 |
|
|
|
3.13 |
|
|
|
— |
|
Quarter Ended June 30 |
|
|
5.40 |
|
|
|
1.79 |
|
|
|
— |
|
Quarter Ended March 31 |
|
|
6.71 |
|
|
|
0.79 |
|
|
|
— |
|
2008: |
|
|
|
|
|
|
|
|
|
|
|
|
Quarter Ended December 31 |
|
$ |
20.93 |
|
|
$ |
2.19 |
|
|
$ |
0.090 |
|
Quarter Ended September 30 |
|
|
34.13 |
|
|
|
24.26 |
|
|
|
0.320 |
|
Quarter Ended June 30 |
|
|
36.79 |
|
|
|
33.54 |
|
|
|
0.380 |
|
Quarter Ended March 31 |
|
|
37.37 |
|
|
|
31.55 |
|
|
|
0.360 |
|
Historically, we have paid to our stockholders, on a quarterly basis, dividends equal to the
cash we receive from our Partnership distributions, less reserves for expenses, future dividends
and other uses of cash, including:
| |
• |
|
federal income taxes, which we are required to pay because we are taxed as a
corporation; |
| |
• |
|
the expenses of being a public company; |
| |
• |
|
other general and administrative expenses; |
| |
• |
|
capital contributions to the Partnership upon the issuance by it of additional
partnership securities in order to maintain the general partner’s 2.0% general partner
interest; and |
| |
• |
|
reserves our board of directors believes prudent to maintain. |
The determination of the amount of cash dividends, including the quarterly dividend referred
to above, if any, to be declared and paid will depend upon our financial condition, results of
operations, cash flow, the level of our capital expenditures, future business prospects and any
other matters that our board of directors deems relevant. Prior to 2009, we received quarterly
distributions from the Partnership with the last distribution for the fourth quarter of 2008
received in February 2009. During 2009, the Partnership’s ability to distribute available cash was
contractually restricted by the terms of its credit facility due to its high leverage ratios and it
ceased making distributions. Although the Partnership’s new
credit facility does not limit its
ability to make distributions as long as the Partnership is not in default of its facility (and the indenture governing its
senior unsecured notes requires it to meet a ratio test), any decision to resume cash
distributions on its units and the amount of any such distributions would consider maintaining
sufficient cash flow in excess of the distribution to continue to move the Partnership towards
lower leverage ratios. The Partnership has established a target over the next couple of years of
achieving a ratio of total debt to Adjusted EBITDA of less than 4.0 to 1.0, and the Partnership
does not currently expect to resume cash distributions on its outstanding units until it achieves
such a ratio of less than 4.5 to 1.0 (pro forma for any distribution). The Partnership will also
consider general economic conditions and its outlook for business as it determines to pay any
distribution. We do not anticipate making any future dividend payments until we begin receiving
distributions from the Partnership again.
29
Performance Graph
The following graph sets forth the cumulative total stockholder return for our common stock,
the Standard & Poor’s 500 Stock Index, and a peer group of publicly traded partners of publicly
traded limited partnerships in the Midstream natural gas, natural gas liquids and propane
industries from January 12, 2004, the date of our initial public offering, through December 31,
2009. The chart assumes that $100 was invested on January 12, 2004, with dividends reinvested. The
peer group includes Atlas Pipeline Holdings, L.P., Inergy Holdings, L.P., Enterprise GP Holdings,
L.P., Alliance Holdings GP, L.P. and Magellan Midstream Holdings, L.P. (Inergy Holdings, L.P.’s
initial public offering was in June 2005, Enterprise GP Holdings L.P.’s initial public offering was
in August 2005, Atlas Pipeline Holdings, L.P.’s initial public offering was in July 2006, Alliance
Holdings GP, L.P.’s initial public offering was in May 2006, and Magellan Midstream Holdings,
L.P.’s initial public offering was in February 2006, and it has been assumed that these companies
performed in accordance with the peer group average prior to such dates).
Item 6. Selected Financial Data
The following table sets forth selected historical financial and operating data of Crosstex
Energy, Inc. as of and for the dates and periods indicated. The revised selected historical
financial data are derived from the audited financial statements of Crosstex Energy, Inc. and have
been revised to reflect 2009 asset disposition as discontinued operations and to move letter of
credit fees to interest expense and from purchased gas expense. The summary historical financial
and operating data include the results of operations, the south Louisiana processing assets
beginning November 2005, the NTP beginning April 2006, the midstream assets acquired from Chief
beginning June 2006 and other smaller acquisitions completed during 2006.
30
The
table should be read together with “Item 7. Management’s Discussion and Analysis of
Financial Condition and Results of Operations.”
| |
|
|
|
|
|
|
|
|
|
|
|
|
|
|
|
|
|
|
|
|
| |
|
Crosstex Energy, Inc. |
|
| |
|
Years Ended December 31, |
|
| |
|
2009 |
|
|
2008 |
|
|
2007 |
|
|
2006 |
|
|
2005 |
|
| |
|
(In thousands, except per share data) |
|
Statement of Operations Data: |
|
|
|
|
|
|
|
|
|
|
|
|
|
|
|
|
|
|
|
|
Revenues: |
|
|
|
|
|
|
|
|
|
|
|
|
|
|
|
|
|
|
|
|
Midstream |
|
$ |
1,453,346 |
|
|
$ |
3,072,646 |
|
|
$ |
2,380,224 |
|
|
$ |
1,534,800 |
|
|
$ |
1,212,864 |
|
Gas and NGL
marketing activities |
|
|
5,744 |
|
|
|
3,365 |
|
|
|
4,105 |
|
|
|
2,535 |
|
|
|
1,599 |
|
|
|
|
|
|
|
|
|
|
|
|
|
|
|
|
|
Total revenues |
|
|
1,459,090 |
|
|
|
3,076,011 |
|
|
|
2,384,329 |
|
|
|
1,537,335 |
|
|
|
1,214,463 |
|
|
|
|
|
|
|
|
|
|
|
|
|
|
|
|
|
Operating costs and expenses: |
|
|
|
|
|
|
|
|
|
|
|
|
|
|
|
|
|
|
|
|
Purchased gas |
|
|
1,147,868 |
|
|
|
2,768,225 |
|
|
|
2,124,503 |
|
|
|
1,378,979 |
|
|
|
1,154,345 |
|
Operating expenses |
|
|
110,394 |
|
|
|
125,762 |
|
|
|
91,236 |
|
|
|
65,916 |
|
|
|
28,989 |
|
General and administrative |
|
|
62,491 |
|
|
|
72,377 |
|
|
|
62,270 |
|
|
|
45,724 |
|
|
|
32,141 |
|
(Gain) loss on derivatives |
|
|
(2,994 |
) |
|
|
(8,619 |
) |
|
|
(4,147 |
) |
|
|
(174 |
) |
|
|
10,399 |
|
Gain on sale of property |
|
|
(666 |
) |
|
|
(947 |
) |
|
|
(1,024 |
) |
|
|
(1,936 |
) |
|
|
(8,289 |
) |
Impairments |
|
|
2,894 |
|
|
|
30,177 |
|
|
|
— |
|
|
|
— |
|
|
|
— |
|
Depreciation and amortization |
|
|
119,162 |
|
|
|
107,652 |
|
|
|
83,361 |
|
|
|
56,410 |
|
|
|
15,168 |
|
|
|
|
|
|
|
|
|
|
|
|
|
|
|
|
|
Total operating costs and expenses |
|
|
1,439,149 |
|
|
|
3,094,627 |
|
|
|
2,356,199 |
|
|
|
1,544,919 |
|
|
|
1,232,753 |
|
|
|
|
|
|
|
|
|
|
|
|
|
|
|
|
|
Operating income (loss) |
|
|
19,941 |
|
|
|
(18,616 |
) |
|
|
28,130 |
|
|
|
(7,584 |
) |
|
|
(18,290 |
) |
Other income: |
|
|
|
|
|
|
|
|
|
|
|
|
|
|
|
|
|
|
|
|
Interest expense, net |
|
|
(95,078 |
) |
|
|
(74,861 |
) |
|
|
(47,649 |
) |
|
|
(19,512 |
) |
|
|
(11,972 |
) |
Loss on extinguishment of debt |
|
|
(4,669 |
) |
|
|
— |
|
|
|
— |
|
|
|
— |
|
|
|
— |
|
Other income |
|
|
1,449 |
|
|
|
27,898 |
|
|
|
538 |
|
|
|
1,802 |
|
|
|
391 |
|
|
|
|
|
|
|
|
|
|
|
|
|
|
|
|
|
Total other income (expense) |
|
|
(98,298 |
) |
|
|
(46,963 |
) |
|
|
(47,111 |
) |
|
|
(17,710 |
) |
|
|
(11,581 |
) |
|
|
|
|
|
|
|
|
|
|
|
|
|
|
|
|
Loss from continuing operations before income taxes
and gain on issuance of Partnership units |
|
|
(78,357 |
) |
|
|
(65,579 |
) |
|
|
(18,981 |
) |
|
|
(25,294 |
) |
|
|
(29,871 |
) |
Income tax benefit (provision) |
|
|
6,020 |
|
|
|
1,375 |
|
|
|
(6,319 |
) |
|
|
(7,833 |
) |
|
|
(23,095 |
) |
Gain on issuance of Partnership units(1) |
|
|
— |
|
|
|
14,748 |
|
|
|
7,461 |
|
|
|
18,955 |
|
|
|
65,070 |
|
|
|
|
|
|
|
|
|
|
|
|
|
|
|
|
|
Income (loss) from continuing operations before
cumulative effect of change in accounting principle,
net of tax |
|
|
(72,337 |
) |
|
|
(49,456 |
) |
|
|
(17,839 |
) |
|
|
(14,172 |
) |
|
|
12,104 |
|
Discontinued Operations: |
|
|
|
|
|
|
|
|
|
|
|
|
|
|
|
|
|
|
|
|
Income (loss) from discontinued operations-net of tax |
|
|
(1,519 |
) |
|
|
21,466 |
|
|
|
26,817 |
|
|
|
17,429 |
|
|
|
41,684 |
|
Gain from sale of discontinued operations-net of tax |
|
|
159,961 |
|
|
|
42,753 |
|
|
|
— |
|
|
|
— |
|
|
|
— |
|
|
|
|
|
|
|
|
|
|
|
|
|
|
|
|
|
Discontinued operations-net of tax |
|
|
158,442 |
|
|
|
64,219 |
|
|
|
26,817 |
|
|
|
17,429 |
|
|
|
41,684 |
|
|
|
|
|
|
|
|
|
|
|
|
|
|
|
|
|
Net income (loss) before cumulative effect of change
in accounting principle |
|
|
86,105 |
|
|
|
14,763 |
|
|
|
8,978 |
|
|
|
3,257 |
|
|
|
53,788 |
|
|
|
|
|
|
|
|
|
|
|
|
|
|
|
|
|
Cumulative effect of change in accounting principle |
|
|
— |
|
|
|
— |
|
|
|
— |
|
|
|
170 |
|
|
|
— |
|
Net income (loss) |
|
|
86,105 |
|
|
|
14,763 |
|
|
|
8,978 |
|
|
|
3,427 |
|
|
|
53,788 |
|
Less: Interest of non-controlling partners in the
Partnership’s net income (loss): |
|
|
|
|
|
|
|
|
|
|
|
|
|
|
|
|
|
|
|
|
Interest of non-controlling partners in the
Partnership’s continuing operations |
|
|
(48,069 |
) |
|
|
(55,704 |
) |
|
|
(22,331 |
) |
|
|
(24,881 |
) |
|
|
(24,885 |
) |
Interest of non-controlling partners in the
Partnership’s discontinued operations |
|
|
(1,137 |
) |
|
|
15,454 |
|
|
|
19,133 |
|
|
|
11,853 |
|
|
|
29,537 |
|
Interest of non-controlling partners in the
Partnership’s gain on sale of discontinued operations |
|
|
119,669 |
|
|
|
30,780 |
|
|
|
— |
|
|
|
— |
|
|
|
— |
|
|
|
|
|
|
|
|
|
|
|
|
|
|
|
|
|
Total interest of non-controlling partners in the
Partnership’s net income (loss) |
|
|
70,463 |
|
|
|
(9,470 |
) |
|
|
(3,198 |
) |
|
|
(13,028 |
) |
|
|
4,652 |
|
|
|
|
|
|
|
|
|
|
|
|
|
|
|
|
|
Net income attributable to Crosstex Energy, Inc. |
|
$ |
15,642 |
|
|
$ |
24,233 |
|
|
$ |
12,176 |
|
|
$ |
16,455 |
|
|
$ |
49,136 |
|
|
|
|
|
|
|
|
|
|
|
|
|
|
|
|
|
Net income per common share-basic(2) |
|
$ |
0.33 |
|
|
$ |
0.52 |
|
|
$ |
0.26 |
|
|
$ |
0.39 |
|
|
$ |
1.30 |
|
Net income per common share-diluted(2) |
|
$ |
0.33 |
|
|
$ |
0.51 |
|
|
$ |
0.26 |
|
|
$ |
0.39 |
|
|
$ |
1.26 |
|
Dividends per share(2)(3): |
|
|
|
|
|
|
|
|
|
|
|
|
|
|
|
|
|
|
|
|
Common |
|
$ |
0.09 |
|
|
$ |
1.32 |
|
|
$ |
0.91 |
|
|
$ |
0.807 |
|
|
$ |
0.563 |
|
31
| |
|
|
|
|
|
|
|
|
|
|
|
|
|
|
|
|
|
|
|
|
| |
|
Crosstex Energy, Inc. |
|
| |
|
Years Ended December 31, |
|
| |
|
2009 |
|
|
2008 |
|
|
2007 |
|
|
2006 |
|
|
2005 |
|
| |
|
(In thousands, except per share data) |
|
Balance Sheet Data (end of period): |
|
|
|
|
|
|
|
|
|
|
|
|
|
|
|
|
|
|
|
|
Working capital surplus (deficit) |
|
$ |
(41,791 |
) |
|
$ |
(20,431 |
) |
|
$ |
(39,330 |
) |
|
$ |
(70,091 |
) |
|
$ |
4,872 |
|
Property and equipment, net |
|
|
1,280,197 |
|
|
|
1,528,490 |
|
|
|
1,426,546 |
|
|
|
1,107,242 |
|
|
|
668,632 |
|
Total assets |
|
|
2,080,233 |
|
|
|
2,546,743 |
|
|
|
2,602,829 |
|
|
|
2,206,698 |
|
|
|
1,445,325 |
|
Long-term debt |
|
|
873,702 |
|
|
|
1,263,706 |
|
|
|
1,223,118 |
|
|
|
987,130 |
|
|
|
522,650 |
|
Interest of non-controlling partners in the Partnership |
|
|
587,624 |
|
|
|
522,961 |
|
|
|
489,034 |
|
|
|
391,103 |
|
|
|
264,726 |
|
Stockholders’ equity |
|
|
815,910 |
|
|
|
738,390 |
|
|
|
246,366 |
|
|
|
279,413 |
|
|
|
111,247 |
|
Cash Flow Data: |
|
|
|
|
|
|
|
|
|
|
|
|
|
|
|
|
|
|
|
|
Net cash flow provided by (used in (4)): |
|
|
|
|
|
|
|
|
|
|
|
|
|
|
|
|
|
|
|
|
Operating activities |
|
$ |
78,850 |
|
|
$ |
170,154 |
|
|
$ |
112,578 |
|
|
$ |
113,839 |
|
|
$ |
12,842 |
|
Investing activities |
|
|
379,874 |
|
|
|
(186,768 |
) |
|
|
(411,382 |
) |
|
|
(885,825 |
) |
|
|
(614,822 |
) |
Financing activities |
|
|
(461,980 |
) |
|
|
22,720 |
|
|
|
296,022 |
|
|
|
769,717 |
|
|
|
592,365 |
|
Other Financial Data: |
|
|
|
|
|
|
|
|
|
|
|
|
|
|
|
|
|
|
|
|
Gross margin(5) |
|
$ |
311,222 |
|
|
$ |
307,786 |
|
|
$ |
259,826 |
|
|
$ |
158,356 |
|
|
$ |
60,118 |
|
Operating Data: |
|
|
|
|
|
|
|
|
|
|
|
|
|
|
|
|
|
|
|
|
Pipeline throughput (MMBtu/d) |
|
|
2,040,000 |
|
|
|
2,002,000 |
|
|
|
1,555,000 |
|
|
|
845,000 |
|
|
|
582,000 |
|
Natural gas processed (MMBtu/d)(6) |
|
|
1,235,000 |
|
|
|
1,608,000 |
|
|
|
1,835,000 |
|
|
|
1,817,000 |
|
|
|
1,707,000 |
|
Producer services (MMBtu/d) |
|
|
75,000 |
|
|
|
85,000 |
|
|
|
94,000 |
|
|
|
138,000 |
|
|
|
111,010 |
|
| |
|
|
| (1) |
|
We recognized gains of $14.7 million in 2008, $7.5 million in 2007, $19.0 million in 2006 and $65.1 million in 2005
as a result of the Partnership issuing additional units in public offerings at prices per unit greater than our
equivalent carrying value. |
| |
| (2) |
|
Per share amounts have been adjusted for the three-for-one stock split effected in December 2006. |
| |
| (3) |
|
Dividends paid. |
| |
| (4) |
|
Cash flow data includes cash flows from discontinued operations. |
| |
| (5) |
|
Gross margin is defined as
revenue, including Gas and NGL marketing activities, less related cost of purchased gas. |
| |
| (6) |
|
Processed volumes during 2005 include a daily average for the south Louisiana processing plants for November 2005 and
December 2005, the two-month period these assets were operated by the Partnership. |
Item 7. Management’s Discussion and Analysis of Financial Condition and Results of Operations
You should read the following discussion of our financial condition and results of operations
in conjunction with the financial statements and notes thereto included elsewhere in this report.
For more detailed information regarding the basis of presentation for the following information,
you should read the notes to the financial statements included in this report.
Overview
Crosstex Energy, Inc. is a Delaware corporation formed on April 28, 2000 to engage in the
gathering, transmission, processing and marketing of natural gas and NGLs through its subsidiaries.
On July 12, 2002, we formed Crosstex Energy, L.P., a Delaware limited partnership, to acquire
indirectly substantially all of the assets, liabilities and operations of its predecessor, Crosstex
Energy Services, Ltd. Our assets consist almost exclusively of partnership interests in Crosstex
Energy, L.P., a publicly traded limited partnership engaged in the gathering, transmission,
processing and marketing of natural gas and NGLs. These partnership interests consist of (i)
16,414,830 common units, representing approximately 33% of the limited partner interests in
Crosstex Energy, L.P. as of December 31, 2009 (representing 25% of the limited partner interest as
of January 31, 2010 after the Partnership’s issuance of Series A convertible preferred units) and
(ii) 100% ownership interest in Crosstex Energy GP, L.P., the general partner of Crosstex Energy,
L.P., which owns a 2.0% general partner interest and all of the incentive distribution rights in
Crosstex Energy, L.P.
Our cash flows consist almost exclusively of distributions from the Partnership on the
partnership interests we own. The Partnership is required by its partnership agreement to
distribute all its cash on hand at the end of each quarter, less reserves established by its
general partner in its sole discretion to provide for the proper conduct of the Partnership’s
business or to provide for future distributions.
The incentive distribution rights entitle us to receive an increasing percentage of cash
distributed by the Partnership as certain target distribution levels are reached. Specifically,
they entitle us to receive 13.0% of all cash distributed in a quarter after each unit has received
$0.25 for that quarter, 23.0% of all cash distributed after each unit has received $0.3125 for that
quarter, and 48.0% of all cash distributed after each unit has received $0.375 for that quarter.
32
Prior to 2009, we received quarterly distributions from the Partnership with the last
distribution for the fourth quarter of 2008 received in February 2009. During 2009, the
Partnership’s ability to distribute available cash was contractually restricted by the terms of its
credit facility due to its high leverage ratios and it ceased making distributions. Although the
Partnership’s new credit facility should not limit its ability to make distributions during 2010
and in the future, any decision to resume cash distributions on its units and the amount of any
such distributions would consider maintaining sufficient cash flow in excess of the distribution to
continue to move the Partnership towards lower leverage ratios. The Partnership has established a
target over the next couple of years of achieving a ratio of total debt to Adjusted EBITDA of less
than 4.0 to 1.0, and the Partnership does not currently expect to resume cash distributions on its
outstanding units until it achieves such a ratio of less than 4.5 to 1.0 (pro forma for any
distribution). The Partnership will also consider general economic conditions and its outlook for
business as it determines to pay any distribution.
Since our cash flows consist almost exclusively of distributions from the Partnership on the
partnership interests we own, we do not expect to receive any cash flows until the Partnership is
able to improve its leverage ratio and begin making distributions again. As of December 31, 2009,
we have $9.9 million of cash (excluding cash held by the Partnership) which we expect to be
sufficient to pay our expenses and federal income taxes and to fund our general partner
contributions over the next several years based on our forecasted cash flows. We do not anticipate
making any future dividend payments until we begin receiving distributions from the Partnership
again.
Since we control the general partner interest in the Partnership, we reflect our ownership
interest in the Partnership on a consolidated basis, which means that our financial results are
combined with the Partnership’s financial results and the results of our other subsidiaries. The
interest owned by non-controlling partners’ share of income is reflected separately in our results
of operations. We have no separate operating activities apart from those conducted by the
Partnership, and our cash flows consist almost exclusively of distributions from the Partnership on
the partnership interests we own. Our consolidated results of operations are derived from the
results of operations of the Partnership and also include our gains on the issuance of units in the
Partnership, deferred taxes, interest of non-controlling partners in the Partnership’s net income,
interest income (expense) and general and administrative expenses not reflected in the
Partnership’s results of operation. Accordingly, the discussion of our financial position and
results of operations in this “Management’s Discussion and Analysis of Financial Condition and
Results of Operations” primarily reflects the operating activities and results of operations of the
Partnership.
Historically, the Partnership has operated two industry segments, Midstream and Treating, with
a geographic focus along the Texas Gulf Coast, in the north Texas Barnett Shale area, and in
Louisiana and Mississippi. In February 2009, the Oklahoma assets were sold; in August 2009 the
Alabama, Mississippi and south Texas Midstream properties were sold; and in October 2009 the
Treating assets were sold, as more fully described under “Recent Developments and Business
Strategy.” The Partnership’s primary focus for continuing operations is on the gathering,
processing, transmission and marketing of natural gas and NGLs, as well as providing certain
producer services, which constitute one reporting segment of midstream activity. Currently, the
geographic focus is in the north Texas Barnett shale area and in Louisiana. The Partnership focuses
on gross margin to manage its operations because its business is generally to purchase and resell
natural gas for a margin, or to gather, process, transport or market natural gas or NGLs for a fee.
The Partnership buys and sells most of its natural gas at a fixed relationship to the relevant
index price. In addition, the Partnership receives certain fees for processing based on a
percentage of the liquids produced and enters into hedge contracts for its expected share of the
liquids produced to protect margins from changes in liquids prices.
The Partnership’s margins are determined primarily by the volumes of natural gas gathered,
transported, purchased and sold through its pipeline systems, processed at its processing
facilities and the volumes of NGLs handled at its fractionation facilities. The Partnership
generates revenues from four primary sources:
| |
• |
|
purchasing and reselling or transporting natural gas on the pipeline systems it owns; |
| |
• |
|
processing natural gas at its processing plants and fractionating and marketing the
recovered NGLs; |
| |
• |
|
providing compression services; and |
| |
• |
|
providing off-system marketing services for producers. |
33
The Partnership generally gathers or transports gas owned by others through its facilities for
a fee, or it buys natural gas from a producer, plant or shipper at either a fixed discount to a
market index or a percentage of the market index, then transports and resells the natural gas. The
Partnership attempts to execute all purchases and sales substantially concurrently, or it enters
into a future delivery obligation, thereby establishing the basis for the margin it will receive
for each natural gas transaction. Gathering and transportation margins related to a percentage of
the index price can be adversely affected by declines in the price of natural gas. The Partnership
is also party to certain long-term gas sales commitments that it satisfies through supplies
purchased under long-term gas purchase agreements. When the Partnership enters into those arrangements, its sales
obligations generally match its purchase obligations. However, over time the supplies that are
under contract may decline due to reduced drilling or other causes and the Partnership may be
required to satisfy the sales obligations by buying additional gas at prices that may exceed the
prices received under the sales commitments. In the Partnership’s purchase/sale transactions, the
resale price is generally based on the same index at which the gas was purchased. However, the
Partnership has certain purchase/sale transactions in which the purchase price is based on a
production-area index and the sales price is based on a market-area index, and it captures the
difference in the indices (also referred to as basis spread), less the transportation expenses from
the two areas, as its margin. Changes in the basis spread can increase or decrease margins (or even
be negative at times).
The Partnership realizes margins from processing services primarily through three different
contract arrangements: processing margins (margin), percentage of liquids (POL) or fee based.
Under the margin contract arrangements the Partnership’s margins are higher during periods of high
liquid prices relative to natural gas prices. Gross margin results under a POL contract are
impacted only by the value of the liquids produced. Under fee based contracts the Partnership’s
margins are driven by throughput volume. See “—Commodity Price Risk.”
Operating expenses are costs directly associated with the operations of a particular asset.
Among the most significant of these costs are those associated with direct labor and supervision
and associated transportation and communication costs, property insurance, ad valorem taxes, repair
and maintenance expenses, measurement and utilities. These costs are normally fairly stable across
broad volume ranges, and therefore, do not normally decrease or increase significantly in the short
term with decreases or increases in the volume of gas moved through the asset.
Recent Developments and Business Strategy
From the Partnership’s inception in 2002 until the second half of 2008, its long-term strategy
had been to increase distributable cash flow per unit by accomplishing economies of scale through
new construction or expansion in core operating areas and making accretive acquisitions of assets
that are essential to the production, transportation and marketing of natural gas and NGLs. In
response to the volatility in the commodity and capital markets over the last 18 months and other
events, including the substantial decline in commodity prices, the Partnership adjusted its
business strategy in the fourth quarter 2008 and in 2009 to focus on maximizing liquidity,
improving its balance sheet through debt reduction and other methods, maintaining a stable asset
base, improving the profitability of its assets by increasing their utilization while controlling
costs and reducing capital expenditures. Consistent with this strategy, the Partnership divested
non-core assets since October 2008 for aggregate sale proceeds of $618.7 million and
substantially reduced outstanding debt. It plans to continue the focus on (i) improving existing
system profitability, (ii) continuing to improve the balance sheet and financial flexibility and
(iii) pursuing strategic acquisitions and undertaking selective construction and expansion
opportunities. The Partnership is successfully executing its plan as highlighted by the following
accomplishments:
| |
• |
|
Sold Non-Core Assets. The Partnership sold $618.7 million of non-core assets and
repaid approximately $500 million in long-term indebtedness from the sales proceeds over
the last 15 months. In November 2008 the Partnership sold its 12.4% interest in the
Seminole gas processing plant for $85.0 million. In the first quarter of 2009, the
Partnership sold the Arkoma system for approximately $10.7 million. In August 2009, it sold
the midstream assets in Alabama, Mississippi and south Texas for approximately $217.6
million. In addition, in October 2009, the Partnership sold its natural gas treating
business for $265.4 million. The Partnership also sold its east Texas midstream assets on
January 15, 2010 for $40.0 million. |
| |
• |
|
Reduced Capital Expenditures. The Partnership reduced capital expenditures from over
$275.6 million for 2008 to $101.4 million in 2009 and focused the capital projects spending
on lower risk projects with higher expected returns. |
| |
• |
|
Reduced Operating and General and Administrative Expenses. The Partnership reduced
operating expenses from continuing operations to $110.4 million for the year ended December
31, 2009 from $125.8 million for the year December 31, 2008 and general and administrative
expenses from continuing operations to $59.9 million for the year ended December 31, 2009
from $68.9 million for the year December 31, 2008 by reducing staffing and controlling
costs. General and administrative expenses for the year ended December 31, 2009 also
include non-recurring costs totaling $4.4 million associated with severance payments, lease
termination costs and bad debt expense due to the SemStream, L.P. bankruptcy. |
| |
• |
|
Acquired Certain Assets in Our Core Areas. The Partnership acquired the Eunice NGL
processing plant and fractionation facility in October 2009 for $23.5 million in cash and
the assumption of $18.1 million in debt. It originally acquired the contract rights
associated with the Eunice plant as part of the south Louisiana acquisition in November
2005 and operated and managed the plant under an operating lease with an unaffiliated third
party prior to the recent acquisition. This acquisition will eliminate lease obligations of
$12.2 million per year. The Partnership also acquired the Intracoastal Pipeline located in
southern Louisiana for approximately $10.3 million in December 2009. Both of these
acquisitions were designed to enhance the NGL business. |
34
| |
• |
|
Sale of Preferred Units. On January 19, 2010, the Partnership issued approximately
$125.0 million of Series A Convertible Preferred Units to an affiliate of Blackstone/GSO
Capital Solutions. The 14,705,882 preferred units are convertible at any time into common
units of the Partnership on a one-for-one basis, subject to certain adjustments in the
event of certain dilutive issuances of common units. The Partnership has the right to force
conversion of the preferred units after three years if
(i) the daily volume-weighted average trading price of the common units is greater than 150%
of the then-applicable conversion price for 20 out of the trailing 30 days ending on two
trading days before the date on which the notice is delivered of such conversion, and (ii)
the average daily trading volume of common units must have exceeded 250,000 common units for
20 out of the trailing 30 trading days ending on two trading days before the date on which
the notice is delivered of such conversion. The preferred units are not redeemable but will
pay a quarterly distribution that will be the greater of $0.2125 per unit or the amount of
the quarterly distribution per unit paid to common unitholders, subject to certain
adjustments. Such quarterly distribution may be paid in cash, in additional preferred units
issued in kind or any combination thereof, provided that the distribution may not be paid in
additional preferred units if the Partnership pays a cash distribution on common units. |
| |
• |
|
Issuance of Senior Unsecured Notes. On February 10, 2010, the Partnership issued
$725.0 million in aggregate principal amount of 8.875% senior unsecured notes due 2018 at
an issue price of 97.907% to yield 9.25% to maturity. Net proceeds from the sale of the
notes of $689.7 million (net of transaction costs and original issue discount), together
with borrowings under its new credit facility discussed below, were used to repay in full
amounts outstanding under its existing bank credit facility and senior secured notes and to
pay related fees, costs and expenses, including the settlement of interest rate swaps
associated with its existing credit facility. The notes are unsecured and unconditionally
guaranteed on a senior basis by certain of our direct and indirect subsidiaries, including
substantially all of our current subsidiaries. Interest payments will be paid
semi-annually in arrears starting in August 2010. The Partnership has the option to redeem
all or a portion of the notes at any time on or after February 15, 2014, at the specified
redemption prices. Prior to February 15, 2014, it may redeem the notes, in whole or in
part, at a “make-whole” redemption price. In addition, the Partnership may redeem up to
35% of the notes prior to February 15, 2013 with the cash proceeds from certain equity
offerings. |
| |
• |
|
New Credit Facility. In February 2010, the Partnership amended and restated its
existing secured bank credit facility with a new syndicated secured bank credit facility
which will be guaranteed by substantially all of the Partnership’s subsidiaries. The size
of the new credit facility is $420.0 million and matures in February 2014. Obligations
under the new credit facility will be secured by first priority liens on substantially all
of the Partnership’s assets and those of the guarantors, including all material pipeline,
gas gathering and processing assets, all material working capital assets and a pledge of
all of the equity interests in substantially all of the Partnership’s subsidiaries. Under
the new credit facility, borrowings will bear interest at the Partnership’s option at the
British Bankers Association LIBOR Rate plus an applicable margin, or the highest of the
Federal Funds Rate plus 0.50%, the 30-day Eurodollar Rate plus 1.0%, or the administrative
agent’s prime rate, in each case plus an applicable margin. It will pay a per annum fee on
all letters of credit issued under the new credit facility, and will pay a commitment fee
of 0.50% per annum on the unused availability under the new credit facility. The letter of
credit fee and the applicable margins for its interest rate vary quarterly based on the
Partnership’s leverage ratio. |
Acquisitions and Expansion Prior to 2009
The Partnership grew significantly through asset purchases and construction and expansion
projects in years prior to 2009. As discussed above, it disposed of certain assets during late 2008
and 2009 to refocus its business on the gathering, processing, transmission and marketing of
natural gas and NGLs in the north Texas Barnett Shale area and in Louisiana. These acquisitions and
dispositions create many of the major differences when comparing operating results from one period
to another. The most significant asset purchase since January 2006 was the acquisition of midstream
assets from Chief in June 2006. In addition, internal expansion projects in north Texas and
Louisiana have contributed to the increase in business during 2006, 2007, 2008 and 2009. The
Partnership also acquired treating assets during 2006 that were included in the sale of its
Treating business in 2009 as discussed above.
On June 29, 2006, the Partnership expanded operations in the north Texas area through the
acquisition of the natural gas gathering pipeline systems and related facilities of Chief in the
Barnett Shale for $475.3 million. Immediately following the closing of the Chief acquisition, it
began expanding its north Texas pipeline gathering system. The continued expansion of the
Partnership’s north Texas gathering systems to handle the growing production in the Barnett Shale
was one of its core areas for internal growth during 2006, 2007, 2008 and 2009. Since the date of
the acquisition through December 31, 2009, the Partnership has expanded its gathering system,
connected in excess of 500 new wells to its north Texas gathering system and significantly
increased the productive acreage dedicated to its systems. As of December 31, 2009, total capacity
on its north Texas gathering system was approximately 1,100 MMcf/d and total throughput was
approximately 793,000 MMBtu/d for the year ended December 31, 2009. Since 2006, the Partnership has
constructed three gas processing plants with a total processing capacity in the Barnett Shale of
280 MMcf/d, including its Silver Creek plant, which is a 200 MMcf/d cryogenic processing plant, its
Azle plant, which is a 50 MMcf/d cryogenic processing plant and its Goforth plant, which is a 30
MMcf/d processing plant. Total processing throughput averaged 219,000 MMBtu/d for the year ended
December 31, 2009.
35
In 2007, the Partnership extended its Crosstex LIG system to the north to reach additional
productive areas in the developing natural gas fields south of Shreveport, Louisiana, primarily in
the Cotton Valley formation. This extension, referred to as the north
Louisiana expansion, consists of 63 miles of 24” mainline with 9 miles of gathering lateral
pipeline. The Partnership’s north Louisiana expansion bisects the developing Haynesville Shale gas
play in north Louisiana. The north Louisiana expansion was operating at near capacity during 2008
as Haynesville gas was beginning to develop so the Partnership added 35 MMcf/d of capacity by
adding compression during the third quarter of 2008 bringing the total capacity of the north
Louisiana expansion to approximately 275 MMcf/d. The Partnership continued the expansion of its
north Louisiana system during 2009 increasing capacity by 100 MMcf/d in July 2009 by adding
compression. It increased capacity by another 35 MMcf/d with a new interconnect into an interstate
pipeline in December 2009 and bringing total capacity to 410 MMcf/d by the end of 2009. The
Partnership has long-term firm transportation agreements subscribing to all of the incremental
capacity added during 2009. In addition, the Partnership added compression during 2009 between the
southern portion of its Crosstex LIG system and the northern expansion of its Crosstex LIG system
which increased the capacity to bring gas from the north to its markets in the south to 145 MMcf/d.
Interconnects on the north Louisiana expansion include connections with the interstate pipelines of
ANR Pipeline, Columbia Gulf Transmission, Texas Gas Transmission, Trunkline Gas and Tennessee Gas
Pipeline.
Impact of Federal Income Taxes
Crosstex Energy, Inc. is a corporation for federal income tax purposes. As such, our federal
taxable income is subject to tax at a maximum rate of 35.0% under current law. We expect to have
taxable income allocated to us as a result of our investment in the Partnership’s units,
particularly because of remedial allocations that will be made among the unitholders. Taxable
income allocated to us by the Partnership will increase over the years as the results of operation
increase and as the ratio of income to distributions increases for all of the unitholders.
As of December 31, 2009 we have a net operating loss carry forward of $47.5 million for
federal income taxes and state loss carry forwards of $30.1 million. We believe it is more likely
than not that our future results of operations will generate sufficient taxable income to utilize
these net operating loss carry forwards before they expire. Once these net operating loss carry
forwards are fully utilized, we will have to pay tax on our federal taxable income at a maximum
rate of 35.0% under current law.
Our use of this net operating loss carry forward will be limited if there is a greater than
50.0% change in our stock ownership over a three year period.
Commodity Price Risk
The Partnership’s business is subject to significant risks due to fluctuations in commodity
prices. Its exposure to these risks is primarily in the gas processing component of its business. A
large percentage of the processing fees are realized under POL contracts that are directly impacted
by the market price of NGLs. It also realizes processing gross margins under margin contracts.
These settlements are impacted by the relationship between NGL prices and the underlying natural
gas prices, which is also referred to as the fractionation spread.
A significant volume of inlet gas at the Partnership’s south Louisiana and north Texas
processing plants is settled under POL agreements. The POL fees are denominated in the form of a
share of the liquids extracted and the Partnership is not responsible for the fuel or shrink
associated with processing. Therefore, fee revenue under a POL agreement is directly impacted by
NGL prices, and the decline of these prices in 2008 and early 2009, contributed to a significant
decline in gross margin from processing. The Partnership has a number of fractionation margin
contracts on its Plaquemine and Gibson processing plants that expose it to the fractionation
spread. Under these margin contracts its gross margin is based upon the difference in the value of
NGLs extracted from the gas less the value of the product in its gaseous state (“shrink”) and the
cost of fuel to extract during processing. During the last half of 2008 and early 2009, the
fractionation spread narrowed significantly as the value of NGLs decreased more than the value of
the gas and fuel associated with the processed gas. Thus the gross margin realized under these
margin contracts was negatively impacted due to the commodity price environment. Such a decline may
negatively impact its gross margin in the future if such declines continue.
The Partnership is also subject to price risk to a lesser extent for fluctuations in natural
gas prices with respect to a portion of its gathering and transportation services. Approximately
8.0% of the natural gas it markets is purchased at a percentage of the relevant natural gas index
price, as opposed to a fixed discount to that price. As a result of purchasing the natural gas at a
percentage of the index price, resale margins are higher during periods of high natural gas prices
and lower during periods of lower natural gas prices.
See
“Item 7A. Quantitative and Qualitative Disclosures about Market Risk — Commodity Price
Risk” for additional information on Commodity Price Risk.
36
Results of Operations
Set forth in the table below is certain financial and operating data for the periods
indicated.
| |
|
|
|
|
|
|
|
|
|
|
|
|
| |
|
Years Ended December 31, |
|
| |
|
2009 |
|
|
2008 |
|
|
2007 |
|
| |
|
(Dollars in millions) |
|
Midstream revenues |
|
$ |
1,453.3 |
|
|
$ |
3,072.6 |
|
|
$ |
2,380.2 |
|
Purchased gas |
|
|
(1,147.8 |
) |
|
|
(2,768.2 |
) |
|
|
(2,124.5 |
) |
Gas and NGL
marketing activities |
|
|
5.7 |
|
|
|
3.4 |
|
|
|
4.1 |
|
|
|
|
|
|
|
|
|
|
|
Total gross margin |
|
$ |
311.2 |
|
|
$ |
307.8 |
|
|
$ |
259.8 |
|
|
|
|
|
|
|
|
|
|
|
Volumes (MMBtu/d): |
|
|
|
|
|
|
|
|
|
|
|
|
Gathering and transportation |
|
|
2,040,000 |
|
|
|
2,002,000 |
|
|
|
1,555,000 |
|
Processing |
|
|
1,235,000 |
|
|
|
1,608,000 |
|
|
|
1,835,000 |
|
Producer services |
|
|
75,000 |
|
|
|
85,000 |
|
|
|
94,000 |
|
Year Ended December 31, 2009 Compared to Year Ended December 31, 2008
Gross Margin and Gas and NGL Marketing Activities. Midstream gross margin was $311.2
million for the year ended December 31, 2009 compared to $307.8 million for the year ended December
31, 2008, an increase of $3.4 million, or 1.1%. The increase was primarily due to higher margins on
gathering and transmission throughput volume. These increases were partially offset by gross
margin declines in the processing business due to a less favorable NGL market. Gas and NGL marketing activities increased for the comparative periods by approximately $2.4 million primarily
due to an improved fee structure and an increase in activity in the liquids marketing business.
The LIG gathering and transmission system contributed gross margin growth of $14.0 million for
the twelve months ended December 31, 2009 over the same period in 2008 primarily due to improved
pricing and higher volumes on the northern part of the system offsetting a decrease in sales volume
at southern delivery points. The north Texas region contributed $13.9 million of gross margin
growth for the comparative periods primarily due to increased volume on the gathering systems. The
gross margin increase contributed by the north Texas region was partially offset by an increase in
purchased gas costs of $3.7 million related to the arbitration award to Denbury discussed under
“Contingencies.” The weaker processing environment contributed to a significant decline in the
gross margins for processing plants in Louisiana for the twelve months ended December 31, 2009.
Overall the plants in the region reported a margin decrease of approximately $15.1 million. The
primary contributors to this decrease were the Gibson, Plaquemine and Blue Water processing plants
which had gross margin declines of $9.8 million, $7.6 million and $3.5 million, respectively.
These declines were partially offset by an increase of approximately $8.3 million in the
fractionation and liquids marketing activities in the region. The Arkoma system, which was sold in
April 2009, created a negative gross margin variance of $4.0 million when compared to the same
period in 2008. The Crosstex Pipeline system in east Texas had a gross margin decline of $1.7
million primarily due to a decline in throughput volumes.
Operating Expenses. Operating expenses were $110.4 million for the year ended December 31,
2009 compared to $125.8 million for the year ended December 31, 2008, a decrease of $15.4 million,
or 12.2%, resulting primarily from initiatives undertaken in late 2008 and early 2009 to reduce
expenses.
General and Administrative Expenses. General and administrative expenses were $62.5 million
for the year ended December 31, 2009 compared to $72.4 million for the year ended December 31,
2008, a decrease of $9.9 million, or 13.7%. The decrease is a result of strategic initiatives
undertaken to reduce expenses and primarily relate to workforce reductions. The 2009 amount
includes $4.4 million of non-recurring costs consisting of
$3.1 million of severance payments, $0.8 million of lease
termination costs and $0.5 million of bad debt expense due to the SemStream, L.P. bankruptcy.
Gain/Loss on Derivatives. Gains on derivatives were $3.0 million for the year ended December
31, 2009 compared to gains of $8.6 million for the year ended December 31, 2008. The derivative
transaction types contributing to the net gain are as follows (in millions):
| |
|
|
|
|
|
|
|
|
|
|
|
|
|
|
|
|
| |
|
Years Ended December 31, |
|
| |
|
2009 |
|
|
2008 |
|
| |
|
Total |
|
|
Realized |
|
|
Total |
|
|
Realized |
|
(Gain)/Loss on Derivatives: |
|
|
|
|
|
|
|
|
|
|
|
|
|
|
|
|
Basis swaps |
|
$ |
(4.4 |
) |
|
$ |
(2.5 |
) |
|
$ |
(8.7 |
) |
|
$ |
(8.8 |
) |
Processing margin hedges |
|
|
1.4 |
|
|
|
(2.2 |
) |
|
|
(3.6 |
) |
|
|
(3.6 |
) |
Storage |
|
|
(0.3 |
) |
|
|
(1.1 |
) |
|
|
(0.7 |
) |
|
|
(0.1 |
) |
Third-party on-system swaps |
|
|
(0.1 |
) |
|
|
(0.3 |
) |
|
|
(0.6 |
) |
|
|
(0.8 |
) |
Other |
|
|
0.1 |
|
|
|
— |
|
|
|
(0.1 |
) |
|
|
— |
|
|
|
|
|
|
|
|
|
|
|
|
|
|
|
|
|
(3.3 |
) |
|
|
(6.1 |
) |
|
|
(13.7 |
) |
|
|
(13.3 |
) |
Derivative gains included in income from discontinued operations |
|
|
0.3 |
|
|
|
0.5 |
|
|
|
5.1 |
|
|
|
5.4 |
|
|
|
|
|
|
|
|
|
|
|
|
|
|
|
|
$ |
(3.0 |
) |
|
$ |
(5.6 |
) |
|
$ |
(8.6 |
) |
|
$ |
(7.9 |
) |
|
|
|
|
|
|
|
|
|
|
|
|
|
37
Impairments. During the year ended December 31, 2009, the Partnership had impairment expense of
$2.9 million compared to $30.2 million for the year ended December 31, 2008. During 2009,
impairments totaling $2.9 million were taken on the Bear Creek processing plant and the Vermillion
treating plant to bring the fair value of the plants to a marketable value for these idle assets.
The impairment expense during 2008 is comprised of:
| |
• |
|
$17.8 million related to the Blue Water gas processing plant located in south Louisiana
— The impairment on the Partnership’s 59.27% interest in the Blue Water gas processing
plant was recognized because the pipeline company which owns the offshore Blue Water system
and supplies gas to the Blue Water plant reversed the flow of the gas on its pipeline in
early January 2009 thereby removing access to all the gas processed at the Blue Water plant
from the Blue Water offshore system. As of January 2009, an alternative source of new gas
for the Blue Water plant had not been found so the plant ceased operation from January 2009
until November 2009. An impairment of $17.8 million was recognized for the carrying amount
of the plant in excess of its estimated fair value as of December 31, 2008. |
| |
• |
|
$5.7 million related to goodwill — It was determined that the carrying amount of
goodwill attributable to the Midstream segment was impaired because of the significant
decline in Midstream operations due to negative impacts on cash flows caused by the
significant declines in natural gas and NGL prices during the last half of 2008 coupled
with the global economic decline. |
| |
• |
|
$4.1 million related to
leasehold improvements — The Partnership had planned to relocate
its corporate headquarters during 2008 to a larger office facility. The Partnership had leased office
space and was close to completing the renovation of this office space when the global
economic decline began impacting operations in October 2008. On December 31, 2008, the
decision was made to cancel the new office lease and not relocate the corporate offices
from its existing office location. The impairment relates to the leasehold improvements on
the office space for the cancelled lease. |
| |
• |
|
$2.6 million related to the Arkoma gathering system — The impairment on the Arkoma
gathering system was recognized because the asset was sold in February 2009 for $10.7
million and the carrying amount of the plant exceeded the sale price by approximately $2.6
million. |
Depreciation and Amortization. Depreciation and amortization expenses were $119.2 million for
the year ended December 31, 2009 compared to $107.7 million for the year ended December 31, 2008,
an increase of $11.5 million, or 10.7%, resulting primarily from growth and expansion in the NTP,
NTG and north Louisiana areas.
Interest Expense. Interest expense was $95.1 million for the year ended December 31, 2009
compared to $74.9 million for the year ended December 31, 2008, an increase of 20.2 million, or
27.0%. Net interest expense consists of the following (in millions):
| |
|
|
|
|
|
|
|
|
| |
|
Years Ended December 31, |
|
| |
|
2009 |
|
|
2008 |
|
Senior notes |
|
$ |
28.3 |
|
|
$ |
22.5 |
|
PIK |
|
|
4.9 |
|
|
|
— |
|
Credit facility |
|
|
30.7 |
|
|
|
20.8 |
|
Series B secured note |
|
|
0.4 |
|
|
|
— |
|
Capitalized interest |
|
|
(1.1 |
) |
|
|
(2.7 |
) |
Mark to market interest rate swaps |
|
|
(0.8 |
) |
|
|
22.1 |
|
Realized interest rate swaps |
|
|
19.0 |
|
|
|
4.6 |
|
Interest income |
|
|
(0.2 |
) |
|
|
(0.4 |
) |
Amortization of debt issue cost |
|
|
7.6 |
|
|
|
2.9 |
|
Other |
|
|
6.3 |
|
|
|
5.1 |
|
|
|
|
|
|
|
|
Total |
|
$ |
95.1 |
|
|
$ |
74.9 |
|
|
|
|
|
|
|
|
Loss on Extinguishment of Debt. The Partnership recognized a loss on extinguishment of debt
during the year ended December 31, 2009 of $4.7 million due to the February 2009 amendment to the
senior secured notes agreement. The modifications to this agreement pursuant to this amendment were
substantive as defined in FASB ASC 470-50 and were accounted for as the extinguishment of the old
debt and the creation of new debt. As a result, the unamortized costs associated with the senior
secured notes prior to the amendment as well as the fees paid to the senior secured lenders for the
February 2009 amendment were expensed during the year ended December 31, 2009.
38
Other Income. Other income was $1.4 million for the year ended December 31, 2009 compared to
$27.9 million for the year ended December 31, 2008. In November 2008, the Partnership sold a
contract right for firm transportation capacity on a third party pipeline to an unaffiliated third
party for $20.0 million. The entire amount of such proceeds is reflected in other income because
the Partnership had no basis in this contract right. In February 2008, the Partnership recorded
$7.0 million from the settlement of disputed liabilities that were assumed with an acquisition.
Income Taxes. We provide for income taxes using the liability method. Accordingly, deferred
taxes are recorded for the differences between the tax and book basis of assets and liabilities
that will reverse in future periods. Income tax benefit was $6.0 million and $1.4 million for the
years ended December 31, 2009 and 2008, respectively.
Gain on Issuance of Units of the Partnership. As a result of the Partnership issuing common
units in April 2008 to unrelated parties at a price per unit greater than our equivalent carrying
value, our share of net assets of the Partnership increased by $14.7 million and we recognized a
gain on issuance of such units.
Discontinued Operations. The Partnership sold the following non-strategic assets over the
past year and used the proceeds from such sales to repay long-term indebtedness:
| |
|
|
| Assets |
|
Date of Sale |
12.4% interest in the Seminole Gas Processing Plant |
|
November 2008 |
Oklahoma assets (Arkoma system) |
|
February 2009 |
Alabama, Mississippi and south Texas assets |
|
August 2009 |
Treating assets |
|
October 2009 |
In accordance with FASB ASC 360-10-05-4, the results of operations related to each of the
assets listed above (except the Arkoma assets which were immaterial to the financial statement
presentations) are presented in income from discontinued operations for the comparative periods in
the statements of operations. Revenues, operating expenses, general and administrative expenses
associated directly to the assets sold, depreciation and amortization, allocated Texas margin tax
and allocated interest are reflected in the income from discontinued operations. During the year
ended December 31, 2009, the Partnership expensed $4.3 million of unamortized debt issuance costs
associated with the bank credit facility and the senior secured notes due to the repayments in
borrowings of $316.3 million and $153.8 million, respectively, from proceeds of the Alabama,
Mississippi and south Texas assets and Treating assets dispositions. In addition, we incurred
make-whole interest and call premiums of $5.2 million in the year ended December 31, 2009 to the
holders of the senior secured notes due to the call premiums on the repayments. These additional
interest costs are included in discontinued operations for the year ended December 31, 2009. No
corporate office general and administrative expenses have been allocated to income from
discontinued operations. Following are the components of revenues and earnings from discontinued
operations and operating data (dollars in millions):
| |
|
|
|
|
|
|
|
|
| |
|
Year Ended |
|
| |
|
December 31, |
|
| |
|
2009 |
|
|
2008 |
|
Midstream revenues |
|
$ |
368.1 |
|
|
$ |
1,766.1 |
|
Treating revenues |
|
$ |
45.5 |
|
|
$ |
73.5 |
|
Income (loss) from discontinued operations, net of tax |
|
$ |
(1.5 |
) |
|
$ |
21.5 |
|
Gain from sale of discontinued operations, net of tax |
|
$ |
160.0 |
|
|
$ |
42.8 |
|
Gathering and Transmission Volumes (MMBtu/d) |
|
|
564,000 |
|
|
|
617,000 |
|
Processing Volumes (MMBtu/d) |
|
|
191,000 |
|
|
|
204,000 |
|
Interest of Non-Controlling Partners in the Partnership’s Net Income (Loss) from Continuing
Operations. The interest of non-controlling partners in the Partnership’s net loss was $48.1
million for the year ended December 31, 2009 compared to a net loss of $55.7 million for the year
ended December 31, 2008 due to the changes shown in the following summary (in millions):
| |
|
|
|
|
|
|
|
|
| |
|
Years Ended December 31, |
|
| |
|
2009 |
|
|
2008 |
|
Net loss from continuing operations for the Partnership |
|
$ |
(77.5 |
) |
|
$ |
(63.7 |
) |
(Income) allocation to CEI for the general partner incentive distribution |
|
|
— |
|
|
|
(30.8 |
) |
Stock-based compensation costs allocated to CEI for its stock options and
restricted stock granted to Partnership officers, employees and directors |
|
|
3.0 |
|
|
|
4.7 |
|
Loss allocation to CEI for its 2% general partner share of Partnership loss |
|
|
1.5 |
|
|
|
1.2 |
|
|
|
|
|
|
|
|
Net loss allocable to limited partners |
|
|
(73.0 |
) |
|
|
(88.6 |
) |
Less: CEI’s share of net (income) loss allocable to limited partners |
|
|
24.9 |
|
|
|
32.6 |
|
Plus: Non-controlling partners’ share of net income in Denton County Joint Venture |
|
|
— |
|
|
|
0.3 |
|
|
|
|
|
|
|
|
Non-controlling partners’ share of Partnership net loss from continuing operations |
|
$ |
(48.1 |
) |
|
$ |
(55.7 |
) |
|
|
|
|
|
|
|
39
Year Ended December 31, 2008 Compared to Year Ended December 31, 2007
Gross
Margin and Gas and NGL Marketing Activities. Midstream gross margin was $307.8
million for the year ended December 31, 2008 compared to $259.8 million for the year ended December
31, 2007, an increase of $48.0 million, or 18.5%. The increase was primarily due to system
expansion projects and increased throughput on the Partnership’s gathering and transmission
systems. These increases were partially offset by margin decreases in the processing business due
to a less favorable NGL market and operating downtime resulting from the impact of hurricanes in
the last half of the year. Gas and NGL marketing activities decreased for the comparative
periods by approximately $0.7 million.
System expansion in the north Texas region and increased throughput on the NTP contributed
$58.9 million of gross margin growth for the year ended December 31, 2008 over the same period in
2007. The Partnership’s gathering systems in the region and NTP accounted for $41.3 million and
$9.1 million of this increase, respectively. The Partnership’s processing facilities in the region
contributed an additional $8.5 million of gross margin increase. System expansion and volume
increases on the LIG system contributed margin growth of $8.2 million during the year ended
December 31, 2008 over the same period in 2007. Processing plants in Louisiana experienced a margin
decline of $20.2 million for the comparative twelve-month period in 2008 due to a less favorable
NGL processing environment in the last half of the year and business interruptions resulting from
the impact of hurricanes along the Gulf Coast.
The Partnership’s processing and gathering systems were negatively impacted by events beyond
our control during the third quarter that had a significant effect on gross margin results for the
year ended December 31, 2008. Hurricanes Gustav and Ike came ashore along the Gulf coast in
September 2008. The Partnership estimates that these storms resulted in approximately $22.9 million
gross margin decrease for the year. The lost margin was primarily experienced at gas processing
facilities along the Gulf Coast. However, processing facilities further inland in Louisiana and
north Texas were indirectly impacted due to disruption in the NGL markets. In addition,
approximately $0.9 million in gross margin was lost at the Sabine Pass plant in August 2008 due to
downtime from fire damage. The fire occurred during an attempt to bring the plant back on line
following tropical storm Edouard.
Operating Expenses. Operating expenses were $125.8 million for the year ended December 31,
2008 compared to $91.2 million for the year ended December 31, 2007, an increase of $34.5 million,
or 37.8%, resulting primarily from growth and expansion in the NTP, NTG, north Louisiana and east
Texas areas. The increase is primarily attributable to the following factors:
| |
• |
|
Contractor services and labor costs increased $12.3 million; |
| |
• |
|
Chemicals and materials increased $6.2 million; |
| |
• |
|
Equipment rental increased $5.8 million; |
| |
• |
|
Ad valorem taxes increased $2.2 million; and |
| |
• |
|
Technical services increased $0.7 million. |
General and Administrative Expenses. General and administrative expenses were $72.4 million
for the year ended December 31, 2008 compared to $62.3 million for the year ended December 31,
2007, an increase of $10.1 million, or 16.2%. The increase is primarily attributable to the
following factors:
| |
• |
|
$5.5 million increase in rental expense resulting primarily from additional office rent
and including $3.4 million related to lease termination fees for the cancelled relocation
of our corporate headquarters; |
| |
• |
|
$3.1 million increase in bad debt expense due to the SemStream, L.P. bankruptcy; |
| |
• |
|
$1.8 million increase in professional fees and services; and |
| |
• |
|
$0.9 million decrease in stock-based compensation expense resulting primarily from the
reduction of estimated performance-based restricted units and restricted shares. |
40
Gain/Loss on Derivatives. Gains on derivatives were $8.6 million for the year ended December
31, 2008 compared to gains of $4.1 million for the year ended December 31, 2007. The derivative
transaction types contributing to the net gain are as follows (in millions):
| |
|
|
|
|
|
|
|
|
|
|
|
|
|
|
|
|
| |
|
Years Ended December 31, |
|
| |
|
2008 |
|
|
2007 |
|
| |
|
Total |
|
|
Realized |
|
|
Total |
|
|
Realized |
|
(Gain) Loss on Derivatives: |
|
|
|
|
|
|
|
|
|
|
|
|
|
|
|
|
Basis swaps |
|
$ |
(8.7 |
) |
|
$ |
(8.8 |
) |
|
$ |
(8.1 |
) |
|
$ |
(7.0 |
) |
Processing margin hedges |
|
|
(3.6 |
) |
|
|
(3.6 |
) |
|
|
1.3 |
|
|
|
1.3 |
|
Storage |
|
|
(0.7 |
) |
|
|
(0.1 |
) |
|
|
(0.5 |
) |
|
|
(1.6 |
) |
Third-party on-system swaps |
|
|
(0.6 |
) |
|
|
(0.8 |
) |
|
|
(0.2 |
) |
|
|
(0.6 |
) |
Puts |
|
|
— |
|
|
|
— |
|
|
|
0.8 |
|
|
|
— |
|
Other |
|
|
(0.1 |
) |
|
|
— |
|
|
|
0.1 |
|
|
|
— |
|
|
|
|
|
|
|
|
|
|
|
|
|
|
|
|
|
(13.7 |
) |
|
|
(13.3 |
) |
|
|
(6.6 |
) |
|
|
(7.9 |
) |
Derivative gains included in income from discontinued operations |
|
|
5.1 |
|
|
|
5.4 |
|
|
|
2.5 |
|
|
|
2.8 |
|
|
|
|
|
|
|
|
|
|
|
|
|
|
|
|
$ |
(8.6 |
) |
|
$ |
(7.9 |
) |
|
$ |
(4.1 |
) |
|
$ |
(5.1 |
) |
|
|
|
|
|
|
|
|
|
|
|
|
|
Impairments. During the year ended December 31, 2008, the Partnership had an impairment
expense of $30.2 million compared to no impairment expense for the year ended December 31, 2007.
The 2008 impairment expense is described under “Year Ended December 31, 2009 Compared to Year Ended
December 31, 2008.”
Depreciation and Amortization. Depreciation and amortization expenses were $107.7 million for
the year ended December 31, 2008 compared to $83.4 million for the year ended December 31, 2007, an
increase of $24.3 million, or 29.1%. Depreciation and amortization increased $22.5 million due to
the NTP, NTG and north Louisiana expansion project assets. Accelerated depreciation of the Dallas
office leasehold due to the planned, but subsequently cancelled, relocation accounted for an
increase between periods of $1.4 million.
Interest Expense. Interest expense was $74.9 million for the year ended December 31, 2008
compared to $47.6 million for the year ended December 31, 2007, an increase of $27.2 million, or
57.1%. The increase relates primarily to the negative impact of declining interest rates on the
interest rate swaps. Net interest expense consists of the following (in millions):
| |
|
|
|
|
|
|
|
|
| |
|
Years Ended December 31, |
|
| |
|
2008 |
|
|
2007 |
|
Senior notes |
|
$ |
22.5 |
|
|
$ |
23.0 |
|
Credit facility |
|
|
20.8 |
|
|
|
24.8 |
|
Capitalized interest |
|
|
(2.7 |
) |
|
|
(4.8 |
) |
Mark to market interest rate swaps |
|
|
22.1 |
|
|
|
1.2 |
|
Realized interest rate swaps |
|
|
4.6 |
|
|
|
(0.7 |
) |
Interest income |
|
|
(0.4 |
) |
|
|
(1.2 |
) |
Amortization of debt issue cost |
|
|
2.9 |
|
|
|
2.6 |
|
Other |
|
|
5.1 |
|
|
|
2.7 |
|
|
|
|
|
|
|
|
Total |
|
$ |
74.9 |
|
|
$ |
47.6 |
|
|
|
|
|
|
|
|
Other Income. Other income was $27.9 million for the year ended December 31, 2008 compared to
$0.5 million for the year ended December 31, 2007. In November 2008, the Partnership sold a
contract right for firm transportation capacity on a third party pipeline to an unaffiliated third
party for $20.0 million. In February 2008, the Partnership recorded $7.0 million from the
settlement of disputed liabilities that were assumed with an acquisition.
Income Taxes. We provide for income taxes using the liability method. Accordingly, deferred
taxes are recorded for the differences between the tax and book basis of assets and liabilities
that will reverse in future periods. We had an income tax benefit of $1.4 million in the year ended
December 31, 2008. Income tax benefit of $1.4 million and income tax expense of $6.3 million was
recorded for the years ended December 31, 2008 and 2007, respectively.
Gain on Issuance of Units of the Partnership. As a result of the Partnership issuing common
units in April 2008 and December 2007 to unrelated parties at a price per unit greater than our
equivalent carrying value, our share of net assets of the Partnership increased by $14.7 million
and $7.5 million, respectively, and we recognized a gain on issuance of such units.
Discontinued Operations. Income from discontinued operations were $64.2 million for the year
ended December 31, 2008 compared to $26.8 million for the year ended December 31, 2007.
Discontinued operations includes income related to the Seminole gas processing plant disposed of in
November 2008, income related to the Alabama, Mississippi and south Texas assets disposed of in
August 2009 and income related to the Treating assets disposed of in October 2009. The
reported income for the comparative periods has been recast to include 2009 dispositions in income
from discontinued operations.
41
Interest of Non-Controlling Partners in the Partnership’s Net Income (Loss) from Continuing
Operations. The interest of non-controlling partners in the Partnership’s net loss was $55.7
million for the year ended December 31, 2008 compared to a net loss of $22.3 million for the year
ended December 31, 2007 due to the changes shown in the following summary (in millions):
| |
|
|
|
|
|
|
|
|
| |
|
Years Ended December 31, |
|
| |
|
2008 |
|
|
2007 |
|
Net loss from continuing operations for the Partnership |
|
$ |
(63.7 |
) |
|
$ |
(17.3 |
) |
(Income) allocation to CEI for the general partner incentive distribution |
|
|
(30.8 |
) |
|
|
(24.8 |
) |
Stock-based compensation costs allocated to CEI for its stock options and
restricted stock granted to Partnership officers, employees and directors |
|
|
4.7 |
|
|
|
5.4 |
|
Loss allocation to CEI for its 2% general partner share of Partnership loss |
|
|
1.2 |
|
|
|
0.7 |
|
|
|
|
|
|
|
|
Net loss allocable to limited partners |
|
|
(88.6 |
) |
|
|
(36.0 |
) |
Less: CEI’s share of net (income) loss allocable to limited partners |
|
|
32.6 |
|
|
|
13.5 |
|
Plus: Non-controlling partners’ share of net income in Denton County Joint Venture |
|
|
0.3 |
|
|
|
0.2 |
|
|
|
|
|
|
|
|
Non-controlling partners’ share of Partnership net loss from continuing operations |
|
$ |
(55.7 |
) |
|
$ |
(22.3 |
) |
|
|
|
|
|
|
|
Critical Accounting Policies
The selection and application of accounting policies is an important process that has
developed as our business activities have evolved and as the accounting rules have developed.
Accounting rules generally do not involve a selection among alternatives, but involve an
implementation and interpretation of existing rules, and the use of judgment to the specific set of
circumstances existing in our business. Compliance with the rules necessarily involves reducing a
number of very subjective judgments to a quantifiable accounting entry or valuation. We make every
effort to properly comply with all applicable rules on or before their adoption, and we believe the
proper implementation and consistent application of the accounting rules is critical. Our critical
accounting policies are discussed below. See Note 2 of the Notes to Consolidated Financial
Statements for further details on our accounting policies and a discussion of new accounting
pronouncements.
Revenue Recognition and Commodity Risk Management. The Partnership recognizes revenue for
sales or services at the time the natural gas or NGLs are delivered or at the time the service is
performed. It generally accrues one month of sales and the related gas purchases and reverses these
accruals when the sales and purchases are actually invoiced and recorded in the subsequent months.
Actual results could differ from the accrual estimates.
The Partnership utilizes extensive estimation procedures to determine the sales and cost of
gas purchase accruals for each accounting cycle. Accruals are based on estimates of volumes flowing
each month from a variety of sources. It uses actual measurement data, if it is available, and will
use such data as producer/shipper nominations, prior month average daily flows, estimated flow for
new production and estimated end-user requirements (all adjusted for the estimated impact of
weather patterns) when actual measurement data is not available. Throughout the month or two
following production, actual measured sales and transportation volumes are received and invoiced
and used in a process referred to as “actualization”. Through the actualization process, any
estimation differences recorded through the accrual are reflected in the subsequent month’s
accounting cycle when the accrual is reversed and actual amounts are recorded. Actual volumes
purchased, processed or sold may differ from the estimates due to a variety of factors including,
but not limited to: actual wellhead production or customer requirements being higher or lower than
the amount nominated at the beginning of the month; liquids recoveries being higher or lower than
estimated because gas processed through the plants was richer or leaner than estimated; the
estimated impact of weather patterns being different from the actual impact on sales and purchases;
and pipeline maintenance or allocation causing actual deliveries of gas to be different than
estimated. The Partnership believes that its accrual process for sales and purchases provides a
reasonable estimate of such sales and purchases.
The Partnership engages in price risk management activities in order to minimize the risk from
market fluctuations in the price of natural gas and natural gas liquids. The Partnership manages
its price risk related to future physical purchase or sale commitments by entering into either
corresponding physical delivery contracts or financial instruments with an objective to balance its
future commitments and significantly reduce its risk to the movement in natural gas prices.
The Partnership uses derivatives to hedge against changes in cash flows related to product
prices and interest rate risk, as opposed to their use for trading purposes. FASB ASC 815, requires
that all derivatives and hedging instruments are recognized as assets or liabilities at fair value.
If a derivative qualifies for hedge accounting, changes in the fair value can be offset against the
change in the fair value of the hedged item through earnings or recognized in other comprehensive
income until such time as the hedged item is recognized in earnings.
42
The Partnership conducts “off-system” gas marketing operations as a service to producers on
systems that it does not own. The Partnership refers to these activities as part of energy trading
activities. In some cases, the Partnership earns an agency fee from the producer for arranging the
marketing of the producer’s natural gas. In other cases, the Partnership purchases the natural gas
from the producer and enters into a sales contract with another party to sell the natural gas. The
revenue and cost of sales for these activities are shown net in the statement of operations.
The Partnership manages its price risk related to future physical purchase or sale commitments
for energy trading activities by entering into either corresponding physical delivery contracts or
financial instruments with an objective to balance future commitments and significantly reduce risk
related to the movement in natural gas prices. However, the Partnership is subject to counter-party
risk for both the physical and financial contracts. The Partnership’s energy trading contracts
qualify as derivatives, and it uses mark-to-market accounting for both physical and financial
contracts of the energy trading business. Accordingly, any gain or loss associated with changes in
the fair value of derivatives and physical delivery contracts relating to energy trading activities
are recognized in earnings as gain or loss on derivatives immediately.
Sales of Securities by Subsidiaries. We recognize gains and losses in the consolidated
statements of operations resulting from subsidiary sales of additional equity interest, including
the Partnership’s limited partnership units, to unrelated parties.
Impairment of Long-Lived Assets. In accordance with FASB ASC 360-10-05, the Partnership
evaluates the long-lived assets, including related intangibles, of identifiable business activities
for impairment when events or changes in circumstances indicate, in management’s judgment, that the
carrying value of such assets may not be recoverable. The determination of whether impairment has
occurred is based on management’s estimate of undiscounted future cash flows attributable to the
assets as compared to the carrying value of the assets. If impairment has occurred, the amount of
the impairment recognized is determined by estimating the fair value for the assets and recording a
provision for loss if the carrying value is greater than fair value.
When determining whether impairment of one of the Partnership’s long-lived assets has
occurred, it must estimate the undiscounted cash flows attributable to the asset. The estimate of
cash flows is based on assumptions regarding the purchase and resale margins on natural gas, volume
of gas available to the asset, markets available to the asset, operating expenses, and future
natural gas prices and NGL product prices. The amount of availability of gas to an asset is
sometimes based on assumptions regarding future drilling activity, which may be dependent in part
on natural gas prices. Projections of gas volumes and future commodity prices are inherently
subjective and contingent upon a number of variable factors, including but not limited to:
| |
• |
|
changes in general economic conditions in regions in which our markets are located; |
| |
• |
|
the availability and prices of natural gas supply; |
| |
• |
|
the Partnership’s ability to negotiate favorable sales agreements; |
| |
• |
|
the risks that natural gas exploration and production activities will not occur or be
successful; |
| |
• |
|
the Partnership’s dependence on certain significant customers, producers, and
transporters of natural gas; and |
| |
• |
|
competition from other midstream companies, including major energy producers. |
Any significant variance in any of the above assumptions or factors could materially affect
the Partnership’s cash flows, which could require us to record an impairment of an asset.
Depreciation Expense and Cost Capitalization. Our assets consist primarily of natural gas
gathering pipelines, processing plants, and transmission pipelines owned by the Partnership. The
Partnership capitalizes all construction-related direct labor and material costs, as well as
indirect construction costs. Indirect construction costs include general engineering and the costs
of funds used in construction. Capitalized interest represents the cost of funds used to finance
the construction of new facilities and is expensed over the life of the constructed assets through
the recording of depreciation expense. The Partnership capitalizes the costs of renewals and
betterments that extend the useful life, while we expense the costs of repairs, replacements and
maintenance projects as incurred.
The Partnership generally computes depreciation using the straight-line method over the
estimated useful life of the assets. Certain assets such as land, NGL line pack and natural gas
line pack are non-depreciable. The computation of depreciation expense requires judgment regarding
the estimated useful lives and salvage value of assets. As circumstances warrant, depreciation
estimates may be reviewed to determine if any changes are needed. Such changes could involve an
increase or decrease in estimated useful lives or salvage values, which would impact future depreciation expense.
43
Liquidity and Capital Resources
Cash flow presented in liquidity discussions includes cash flow from discontinued operations.
Cash Flows from Operating Activities. Net cash provided by operating activities was $78.9
million, $170.2 million and $112.6 million for the years ended December 31, 2009, 2008 and 2007,
respectively. Income before non-cash income and expenses and changes in working capital for 2009,
2008 and 2007 were as follows (in millions):
| |
|
|
|
|
|
|
|
|
|
|
|
|
| |
|
Years Ended December 31, |
|
| |
|
2009 |
|
|
2008 |
|
|
2007 |
|
Income before non-cash income and expenses |
|
$ |
87.3 |
|
|
$ |
157.6 |
|
|
$ |
136.4 |
|
Changes in working capital |
|
|
(8.4 |
) |
|
|
12.5 |
|
|
|
(23.9 |
) |
The primary reason for the decreased cash flow from income before non-cash income and expenses
of $70.3 million from 2008 to 2009 was increased interest
expense of $19.4 million, decreased
operating income of $11.2 million, decreased other income of $26.8 million, and decreased gain on
derivatives of $7.2 million. The primary reason for the increased cash flow from income before
non-cash income and expenses of $21.2 million from 2007 to 2008 was increased operating income from
the Partnership’s expansion in north Texas and north Louisiana during 2007 and 2008.
Cash Flows from Investing Activities. Net cash provided in investing activities was $379.9
million for the year ended December 31, 2009 primarily due to proceeds from asset sales. Net cash
used in investing activities was $186.8 million and $411.4 million for the years ended December 31,
2008 and 2007, respectively. Cash flows from investing activities for the years ended December 31,
2009, 2008 and 2007 include proceeds from property sales of $503.9 million, $88.8 million and $3.1
million, respectively. Sales in 2009 primarily relate to the sale of the Partnership’s Alabama,
Mississippi, south Texas and Treating assets. Sales in 2008 relate to the sale of the Partnership’s
interest in the Seminole gas processing plant. The 2007 sales primarily relate to sales in inactive
properties. Our primary investing activities for 2009, 2008 and 2007 were capital expenditures and
acquisitions in the Partnership, net of accrued amounts, as follows (in millions):
| |
|
|
|
|
|
|
|
|
|
|
|
|
| |
|
Years Ended December 31, |
|
| |
|
2009 |
|
|
2008 |
|
|
2007 |
|
Growth capital expenditures |
|
$ |
90.5 |
|
|
$ |
257.2 |
|
|
$ |
403.7 |
|
Acquisitions and asset purchases |
|
|
35.1 |
|
|
|
— |
|
|
|
— |
|
Maintenance capital expenditures |
|
|
10.9 |
|
|
|
18.3 |
|
|
|
10.8 |
|
|
|
|
|
|
|
|
|
|
|
Total |
|
$ |
136.5 |
|
|
$ |
275.5 |
|
|
$ |
414.5 |
|
|
|
|
|
|
|
|
|
|
|
Net cash invested in Midstream assets was $123.8 million, $222.4 million and $385.8 million
for the years ended December 31, 2009, 2008 and 2007, respectively. Net cash invested in Treating
assets was $11.1 million, $41.8 million and $23.5 million for the years ended December 31, 2009,
2008 and 2007 respectively. Net cash invested in other corporate assets was $1.6 million, $11.4
million and $5.2 million for the years ended December 31, 2009, 2008 and 2007 respectively.
Cash Flows from Financing Activities. The Partnership disposed of non-core assets and repaid
outstanding debt which resulted in net cash used by financing activities of $462.0 million for the
year ended December 31, 2009. Net cash provided in financing activities was $22.7 million and
$296.0 million for the years ended December 31, 2008 and 2007, respectively. Our financing
activities primarily relate to funding of capital expenditures and acquisitions in the Partnership.
Our financings have primarily consisted of borrowings and repayments under the Partnership’s bank
credit facility, payments on senior secured notes, borrowings under capital lease obligations,
equity offerings and senior note issuances in the Partnership in 2009, 2008 and 2007 as follows (in
millions):
| |
|
|
|
|
|
|
|
|
|
|
|
|
| |
|
Years Ended December 31, |
|
| |
|
2009 |
|
|
2008 |
|
|
2007 |
|
Net borrowings under bank credit facility (1) |
|
$ |
(254.4 |
) |
|
$ |
50.0 |
|
|
$ |
246.0 |
|
Senior secured note issuances (net of repayments) (2) |
|
|
(163.2 |
) |
|
|
(9.4 |
) |
|
|
(9.4 |
) |
Common unit offerings |
|
|
— |
|
|
|
101.9 |
|
|
|
58.8 |
|
Net borrowings (payments) under capital lease obligations |
|
|
(0.7 |
) |
|
|
23.9 |
|
|
|
3.6 |
|
Debt refinancing costs |
|
|
(15.0 |
) |
|
|
(4.9 |
) |
|
|
(0.9 |
) |
Senior subordinated unit offerings |
|
|
— |
|
|
|
— |
|
|
|
102.6 |
|
| |
|
|
| (1) |
|
Includes a $143.0 million and $173.3 million payment due to the sale
of the Alabama, Mississippi and south Texas assets and the Treating
assets. |
| |
| (2) |
|
Includes a $69.0 million and $84.8 million payment due to sale of the
Alabama, Mississippi and south Texas assets and the Treating assets. |
44
Dividends to shareholders and distributions to non-controlling partners in the Partnership
represent our primary use of cash in financing activities. Total cash distributions made during the
last three years were as follows (in millions):
| |
|
|
|
|
|
|
|
|
|
|
|
|
| |
|
Years Ended December 31, |
|
| |
|
2009 |
|
|
2008 |
|
|
2007 |
|
Dividends to shareholders |
|
$ |
4.2 |
|
|
$ |
62.0 |
|
|
$ |
42.6 |
|
Non-controlling partners |
|
|
7.6 |
|
|
|
63.2 |
|
|
|
39.0 |
|
|
|
|
|
|
|
|
|
|
|
Total |
|
$ |
11.8 |
|
|
$ |
125.2 |
|
|
$ |
81.6 |
|
|
|
|
|
|
|
|
|
|
|
In order to reduce our interest costs, the Partnership does not borrow money to fund
outstanding checks until they are presented to the bank. Fluctuations in drafts payable are caused
by timing of disbursements, cash receipts and draws on our revolving credit facility. Changes in
drafts payable for 2009, 2008 and 2007 were as follows (in millions):
| |
|
|
|
|
|
|
|
|
|
|
|
|
| |
|
Years Ended December 31, |
|
| |
|
2009 |
|
|
2008 |
|
|
2007 |
|
Decrease in drafts payable |
|
$ |
(16.3 |
) |
|
$ |
(7.4 |
) |
|
$ |
(19.0 |
) |
Working Capital Deficit. We had a working capital deficit of $41.8 million as of December 31,
2009, primarily due to a net liability for the fair value of derivatives of $21.3 million and the
current portion of long-term debt of $28.6 million related to the senior secured notes. The fair
value of derivatives reflects the mark-to-market of such derivatives including a net current
liability of $18.0 million related to interest rate swaps and a net current liability of $3.3
million related to commodity derivatives. In February 2010, the senior secured notes were repaid
in full and the interest rate swaps were settled. Changes in working capital may fluctuate
significantly between periods even though the Partnership’s trade receivables and payables are
typically collected and paid in 30 to 60 day pay cycles. A large volume of its revenues are
collected and a large volume of its gas purchases are paid near each month end or the first few
days of the following month so receivable and payable balances at any month end may fluctuate
significantly depending on the timing of these receipts and payments. In addition, although the
Partnership strives to minimize natural gas and NGLs in inventory, these working inventory balances
may fluctuate significantly from period to period due to operational reasons and due to changes in
natural gas and NGL prices. Working capital also includes mark to market derivative assets and
liabilities associated with commodity derivatives which may fluctuate significantly due the changes
in natural gas and NGL prices and associated with interest rate swap derivatives which may
fluctuate significantly due to changes in interest rates. The changes in working capital during the
years ended December 31, 2009, 2008 and 2007 are due to the impact of the fluctuations discussed
above.
Off-Balance Sheet Arrangements. We had no off-balance sheet arrangements as of December 31,
2009 and 2008.
January 2010 Sale of Preferred Units. On January 19, 2010, the Partnership issued
approximately $125.0 million of Series A Convertible Preferred Units to an affiliate of
Blackstone/GSO Capital Solutions. The 14,705,882 preferred units are convertible at any time into
Partnership common units on a one-for-one basis, subject to certain adjustments in the event of
certain dilutive issuances of common units. The Partnership has the right to force conversion of
the preferred units after three years if (i) the daily volume-weighted average trading price of the
common units is greater than 150% of the then-applicable conversion price for 20 out of the
trailing 30 days ending on two trading days before the date on which the Partnership delivers
notice of such conversion, and (ii) the average daily trading volume of common units must have
exceeded 250,000 common units for 20 out of the trailing 30 trading days ending on two trading days
before the date on which the Partnership delivers notice of such conversion. The preferred units
are not redeemable but will pay a quarterly distribution that will be the greater of $0.2125 per
unit or the amount of the quarterly distribution per unit paid to common unitholders, subject to
certain adjustments. Such quarterly distribution may be paid in cash, in additional preferred units
issued in kind or any combination thereof, provided that the distribution may not be paid in
additional preferred units if the Partnership pays a cash distribution on common units.
April 2008 Sale of Common Units. On April 9, 2008, the Partnership issued 3,333,334 common
units in a private offering at $30.00 per unit, which represented an approximate 7% discount from
the market price on such date. Net proceeds from the issuance, including our general partner
contribution less expenses associated with the issuance, were approximately $102.0 million.
December 2007 Sale of Common Units. On December 19, 2007, the Partnership issued 1,800,000
common units at a price of $33.28 per unit for net proceeds of $57.6 million. We made a general
partner contribution of $1.2 million in connection with the issuance to maintain our 2% general
partner interest.
45
March 2007 Sale of Senior Subordinated Series D Units. On March 23, 2007, the Partnership
issued an aggregate of 3,875,340 senior subordinated series D units representing limited partner
interests in a private offering for net proceeds of approximately $99.9 million. The senior
subordinated series D units were issued at $25.80 per unit, which represented a discount of
approximately 25% to the market value of common units on such date. The discount represented an
underwriting discount plus the fact that the units would not receive a distribution nor be readily
transferable for two years. We made a general partner contribution of $2.7 million in connection
with this issuance to maintain our 2% general partner interest. The senior subordinated series D
units automatically converted into common units on March 23, 2009 at a ratio of 1.05 common unit
for a total issuance of 4,069,106 common units. The senior subordinated series D units were not
entitled to distributions of available cash or allocations of net income/loss from the Partnership
until March 23, 2009.
Capital Requirements of the Partnership. The Partnership reduced its capital expenditures for 2009
to improve liquidity. Total capital expenditures in the calendar year
2009 were less than $101.4
million. The Partnership utilized cash flow from operations and existing capacity under its bank
credit facility to fund such expenditures. The Partnership’s 2010 capital budget includes
approximately $25.0 million of identified growth projects, and it expects to fund such expenditures
with internally generated cash flow, with any excess cash flow applied toward debt, working capital
or new projects. Although the Partnership expects to identify more growth projects during 2010 in
addition to projects currently budgeted, it does not anticipate that its capital expenditures
during 2010 will exceed $100.0 million.
Total Contractual Cash Obligations: A summary of the Partnership’s total contractual cash
obligations as of December 31, 2009 is as follows (in millions):
| |
|
|
|
|
|
|
|
|
|
|
|
|
|
|
|
|
|
|
|
|
|
|
|
|
|
|
|
|
| |
|
Payments Due by Period |
|
| |
|
Total |
|
|
2010 |
|
|
2011 |
|
|
2012 |
|
|
2013 |
|
|
2014 |
|
|
Thereafter |
|
Long-Term Debt |
|
$ |
873.7 |
|
|
$ |
28.6 |
|
|
$ |
578.2 |
|
|
$ |
93.0 |
|
|
$ |
83.6 |
|
|
$ |
67.4 |
|
|
$ |
22.9 |
|
Interest Payable on Fixed Long-Term Debt Obligations |
|
|
101.8 |
|
|
|
30.9 |
|
|
|
27.2 |
|
|
|
22.0 |
|
|
|
13.9 |
|
|
|
6.4 |
|
|
|
1.4 |
|
PIK Interest payable |
|
|
19.0 |
|
|
|
— |
|
|
|
19.0 |
|
|
|
— |
|
|
|
— |
|
|
|
— |
|
|
|
— |
|
Capital Lease Obligations |
|
|
27.9 |
|
|
|
3.1 |
|
|
|
3.0 |
|
|
|
3.0 |
|
|
|
3.0 |
|
|
|
3.0 |
|
|
|
12.8 |
|
Operating Leases |
|
|
56.6 |
|
|
|
15.9 |
|
|
|
12.1 |
|
|
|
9.3 |
|
|
|
6.2 |
|
|
|
4.7 |
|
|
|
8.4 |
|
Uncertain Tax Position Obligations |
|
|
3.1 |
|
|
|
3.1 |
|
|
|
— |
|
|
|
— |
|
|
|
— |
|
|
|
— |
|
|
|
— |
|
|
|
|
|
|
|
|
|
|
|
|
|
|
|
|
|
|
|
|
|
|
|
Total Contractual Obligations |
|
$ |
1,082.1 |
|
|
$ |
81.6 |
|
|
$ |
639.5 |
|
|
$ |
127.3 |
|
|
$ |
106.7 |
|
|
$ |
81.5 |
|
|
$ |
45.5 |
|
|
|
|
|
|
|
|
|
|
|
|
|
|
|
|
|
|
|
|
|
|
|
The above table does not include any physical or financial contract purchase commitments for
natural gas due to the nature of both the price and volume components of such purchases, which vary
on a daily or monthly basis. Additionally, we do not have contractual commitments for fixed price
and/or fixed quantities of any material amount.
The contractual obligations reflected above have been presented without adjustment for changes
in obligations due to the February 2010 repayment in full of obligations associated with our
existing credit facility and senior secured notes with proceeds from the new credit facility and
the new senior unsecured notes.
Description of Indebtedness
As of December 31, 2009 and 2008, long-term debt consisted of the following (in millions):
| |
|
|
|
|
|
|
|
|
| |
|
2009 |
|
|
2008 |
|
Bank credit facility, interest based on Prime or LIBOR plus an applicable margin, interest rates
at December 31, 2009 and 2008 were 6.75% and 3.9%, respectively |
|
$ |
529.6 |
|
|
$ |
784.0 |
|
Senior secured notes (including PIK notes as defined below of $9.5 million), weighted average
interest rates at December 31, 2009 and 2008 of 10.5% and 8.0%, respectively |
|
|
326.0 |
|
|
|
479.7 |
|
Series B secured note assumed in the Eunice transaction, which bears interest at the rate of 9.5% |
|
|
18.1 |
|
|
|
— |
|
|
|
|
|
|
|
|
|
|
|
873.7 |
|
|
|
1,263.7 |
|
Less current portion |
|
|
(28.6 |
) |
|
|
(9.4 |
) |
|
|
|
|
|
|
|
Debt classified as long-term |
|
$ |
845.1 |
|
|
$ |
1,254.3 |
|
|
|
|
|
|
|
|
The balance of the bank credit facility and senior secured notes was paid in full on February
10, 2010 with the proceeds from the new credit facility and the senior unsecured notes.
Credit Facility. As of December 31, 2009, the Partnership had a bank credit facility with a
borrowing capacity of $859.9 million that matures in June 2011. As of December 31, 2009, $683.0
million was outstanding under the bank credit facility, including $153.4 million of letters of
credit, leaving approximately $176.9 million available for future borrowing.
46
New Credit Facility. In February 2010, the Partnership amended and restated its existing
secured bank credit facility with a new syndicated secured bank credit facility. The new credit
facility has a borrowing capacity of $420.0 million and matures in February 2014. Net proceeds from
the new credit facility along with net proceeds from the senior unsecured notes were used to, among
other things, repay the bank credit facility and the senior secured notes.
The new credit facility will be guaranteed by substantially all of the Partnership’s
subsidiaries. Obligations under the new credit facility will be secured by first priority liens on
substantially all of the Partnership’s assets and those of the guarantors, including all material
pipeline, gas gathering and processing assets, all material working capital assets and a pledge of
all of the Partnership’s equity interests in substantially all of its subsidiaries.
The Partnership may prepay all loans under the new credit facility at any time without premium
or penalty (other than customary LIBOR breakage costs), subject to certain notice requirements. The
new credit facility will require mandatory prepayments of amounts outstanding thereunder with the
net proceeds of certain asset sales, extraordinary receipts, equity issuances and debt incurrences,
but these mandatory prepayments will not require any reduction of the lenders’ commitments under
the new credit facility.
Under the new credit facility, borrowings will bear interest at our option at the Eurodollar
Rate (the British Bankers Association LIBOR Rate) plus an applicable margin or the Base Rate (the
highest of the Federal Funds Rate plus 0.50%, the 30-day Eurodollar Rate plus 1.0%, or the
administrative agent’s prime rate) plus an applicable margin. The Partnership will pay a per annum
fee on all letters of credit issued under the new credit facility, and a commitment fee of 0.50%
per annum on the unused availability under the new credit facility. The letter of credit fee and
the applicable margins for its interest rate will vary quarterly based on the leverage ratio (as
defined in the new credit facility, being generally computed as the ratio of total funded debt to
consolidated earnings before interest, taxes, depreciation, amortization and certain other non-cash
charges) and will be as follows:
| |
|
|
|
|
|
|
|
|
|
|
|
|
| |
|
|
|
|
|
Eurodollar Rate |
|
|
Letter of Credit |
|
| Leverage Ratio |
|
Base Rate Loans |
|
|
Loans |
|
|
Fees |
|
Greater than or equal to 5.00 to 1.00 |
|
|
3.25 |
% |
|
|
4.25 |
% |
|
|
4.25 |
% |
Greater than or equal to 4.50 to 1.00 and less than 5.00 to 1.00 |
|
|
3.00 |
% |
|
|
4.00 |
% |
|
|
4.00 |
% |
Greater than or equal to 4.00 to 1.00 and less than 4.50 to 1.00 |
|
|
2.75 |
% |
|
|
3.75 |
% |
|
|
3.75 |
% |
Greater than or equal to 3.50 to 1.00 and less than 4.00 to 1.00 |
|
|
2.50 |
% |
|
|
3.50 |
% |
|
|
3.50 |
% |
Less than 3.50 to 1.00 |
|
|
2.25 |
% |
|
|
3.25 |
% |
|
|
3.25 |
% |
Based on the forecasted leverage ratio for 2010, the Partnership expects the applicable margin
for the interest rate and letter of credit fee to be at the higher end of these ranges. The new
credit facility will not have a floor for the Base Rate or the Eurodollar Rate.
The new credit facility includes financial covenants that will be tested on a quarterly basis,
based on the rolling four-quarter period that ends on the last day of each fiscal quarter (except
for the interest coverage ratio, which builds to a four-quarter test during 2010).
The maximum permitted leverage ratio will be as follows:
| |
• |
|
5.75 to 1.00 for the fiscal quarters ending March 31, 2010 and June 30, 2010; |
| |
• |
|
5.50 to 1.00 for the fiscal quarter ending September 30, 2010; |
| |
• |
|
5.25 to 1.00 for the fiscal quarter ending December 31, 2010; |
| |
• |
|
5.00 to 1.00 for the fiscal quarter ending March 31, 2011; |
| |
• |
|
4.75 to 1.00 for the fiscal quarter ending June 30, 2011; and |
| |
• |
|
4.50 to 1.00 for the fiscal quarter ending September 30, 2011 and each fiscal quarter
thereafter. |
The maximum permitted senior leverage ratio (as defined in the new credit facility, but
generally computed as the ratio of total secured funded debt to consolidated earnings before
interest, taxes, depreciation, amortization and certain other non-cash charges), will be 2.50 to
1.00.
47
The minimum consolidated interest coverage ratio (as defined in the new credit facility, but
generally computed as the ratio of consolidated earnings before interest, taxes, depreciation,
amortization and certain other non-cash charges to consolidated interest
charges) will be as follows:
| |
• |
|
1.50 to 1.00 for the fiscal quarter ending March 31, 2010; |
| |
• |
|
1.75 to 1.00 for the fiscal quarters ending June 30, 2010 through December 31, 2010; |
| |
• |
|
2.00 to 1.00 for the fiscal quarter ending March 31, 2011; |
| |
• |
|
2.25 to 1.00 for the fiscal quarter ending June 30, 2011; and |
| |
• |
|
2.50 to 1.00 for the fiscal quarter ending September 30, 2011 and each fiscal quarter
thereafter. |
In addition, the new credit facility will contain various covenants that, among other
restrictions, will limit the Partnership’s ability to:
| |
• |
|
incur or assume indebtedness; |
| |
• |
|
engage in mergers or acquisitions; |
| |
• |
|
sell, transfer, assign or convey assets, |
| |
• |
|
repurchase its equity, make distributions and certain other restricted payments; |
| |
• |
|
change the nature of its business; |
| |
• |
|
engage in transactions with affiliates. |
| |
• |
|
enter into certain burdensome agreements; |
| |
• |
|
make certain amendments to the omnibus agreement or its subsidiaries’ organizational
documents; |
| |
• |
|
prepay the senior unsecured notes and certain other indebtedness; and |
| |
• |
|
enter into certain hedging contracts. |
The new credit facility will permit the Partnership to make quarterly distributions to
unitholders so long as no default exists under the new credit facility.
Each of the following will be an event of default under the new credit facility:
| |
• |
|
failure to pay any principal, interest, fees, expenses or other amounts when due; |
| |
• |
|
failure to meet the quarterly financial covenants; |
| |
• |
|
failure to observe any other agreement, obligation, or covenant in the new credit
facility or any related loan document, subject to cure periods for certain failures; |
| |
• |
|
the failure of any representation or warranty to be materially true and correct when
made; |
| |
• |
|
the Partnership or any of its subsidiaries’ default under other indebtedness that
exceeds a threshold amount; |
| |
• |
|
judgments against the Partnership or any of its material subsidiaries, in excess of a
threshold amount; |
| |
• |
|
certain ERISA events involving the Partnership or any of its material subsidiaries, in
excess of a threshold amount; |
48
| |
• |
|
bankruptcy or other insolvency events involving the Partnership or any of its material
subsidiaries; and |
| |
• |
|
a change in control (as defined in the new credit facility). |
If an event of default relating to bankruptcy or other insolvency events occurs, all
indebtedness under the new credit facility will immediately become due and payable. If any other
event of default exists under the new credit facility, the lenders may accelerate the maturity of
the obligations outstanding under the new credit facility and exercise other rights and remedies.
In addition, if any event of default exists under the new credit facility, the lenders may commence
foreclosure or other actions against the collateral.
If any default occurs under the new credit facility, or if the Partnership is unable to make
any of the representations and warranties in the new credit facility, the Partnership will be
unable to borrow funds or have letters of credit issued under the new credit facility.
The Partnership will be subject to interest rate risk on the new credit facility and may enter
into interest rate swaps to reduce this risk.
The Partnership expects to be in compliance with the covenants in the new credit facility for
the next twelve months.
Senior Secured Notes. The Partnership entered into a master shelf agreement with an
institutional lender in 2003 that was amended in subsequent years to increase availability under
the agreement, pursuant to which it issued the following senior secured notes (dollars in
thousands):
| |
|
|
|
|
|
|
|
|
| Month Issued |
|
Amount |
|
|
Interest Rate |
|
June 2003 |
|
$ |
1,607 |
|
|
|
9.45 |
% |
July 2003 |
|
|
1,000 |
|
|
|
9.38 |
% |
June 2004 |
|
|
50,629 |
|
|
|
9.46 |
% |
November 2005 |
|
|
57,380 |
|
|
|
8.73 |
% |
March 2006 |
|
|
40,504 |
|
|
|
8.82 |
% |
July 2006 |
|
|
165,390 |
|
|
|
9.46 |
% |
|
|
|
|
|
|
|
|
Total Outstanding |
|
|
316,510 |
|
|
|
|
|
PIK Notes Payable (1) |
|
|
9,524 |
|
|
|
|
|
|
|
|
|
|
|
|
|
Balance as of December 31, 2009 (2) |
|
$ |
326,034 |
|
|
|
|
|
|
|
|
|
|
|
|
|
| |
|
|
| (1) |
|
The senior secured notes began accruing additional interest of 1.25%
per annum in February 2009 (the “PIK notes”) in the form of an
increase in the principal amounts unless our leverage ratio is less
than 4.25 to 1.00 as of the end of any fiscal quarter. |
| |
| (2) |
|
The senior secured notes were paid in full on February 10, 2010. |
Series B Secured Note. On October 20, 2009, the Partnership acquired the Eunice natural gas
liquids processing plant and fractionation facility which includes $18.1 million in series B
secured note. This note bears an interest rate of 9.5%. Payments including interest of $12.2
million and $7.4 million are due in 2010 and 2011, respectively.
Senior Unsecured Notes. On February 10, 2010, the Partnership issued $725.0 million in
aggregate principal amount of 8.875% senior unsecured notes due on February 15, 2018 at an issue
price of 97.907% to yield 9.25% to maturity. Net proceeds from the sale of the notes of $689.7
million (net of transaction costs and original issue discount), together with borrowings under the
new credit facility discussed above, were used to repay in full amounts outstanding under the
existing bank credit facility and senior secured notes and to pay related fees, costs and expenses,
including the settlement of interest rate swaps associated with the existing credit facility. The
notes are unsecured and unconditionally guaranteed on a senior basis by certain of our direct and
indirect subsidiaries, including all of the Partnership’s current subsidiaries other than Crosstex
LIG, LLC and Crosstex Tuscaloosa, LLC, our Louisiana regulated entities, and Crosstex DC Gathering,
J.V. Interest payments will be paid semi-annually in arrears starting on August 15, 2010.
The indenture governing the notes contains covenants that, among other things, will limit the
Partnership’s ability and the ability of certain of the Partnership’s subsidiaries to:
| |
• |
|
sell assets including equity interests in its subsidiaries; |
| |
• |
|
pay distributions on, redeem or repurchase its units or redeem or repurchase its
subordinated debt; |
49
| |
• |
|
incur or guarantee additional indebtedness or issue preferred units; |
| |
• |
|
create or incur certain liens; |
| |
• |
|
enter into agreements that restrict distributions or other payments from its restricted
subsidiaries to the Partnership; |
| |
• |
|
consolidate, merge or transfer all or substantially all of its assets; |
| |
• |
|
engage in transactions with affiliates; |
| |
• |
|
create unrestricted subsidiaries; |
| |
• |
|
enter into sale and leaseback transactions; or |
| |
• |
|
engage in certain business activities. |
If the notes achieve an investment grade rating from each of Moody’s Investors Service, Inc.
and Standard & Poor’s Ratings Services, many of these covenants will terminate.
The Partnership may redeem up to 35% of the notes at any time prior to February 15, 2013 with
the cash proceeds from equity offerings at a redemption price of
108.875% (of the principal amount plus accrued and unpaid interest
to the redemption date), provided that:
| |
• |
|
at least 65% of the aggregate principal amount of the senior notes remains outstanding
immediately after the occurrence of such redemption; and |
| |
• |
|
the redemption occurs within 120 days of the date of the closing of the equity offering. |
Prior to February 15, 2014, the Partnership may redeem the notes, in whole or in part, at a
“make-whole” redemption price. On or after February 15, 2014, the Partnership may redeem all or a part of the notes at redemption
prices (expressed as percentages of principal amount) equal to 104.438% for the twelve-month period
beginning on February 15, 2014, 102.219% for the twelve-month period beginning February 15, 2015
and 100.00% for the twelve-month period beginning on February 15, 2016 and at any time thereafter,
plus accrued and unpaid interest, if any, to the applicable redemption date on the notes.
Each of the following will be an event of default under the indenture:
| |
• |
|
failure to pay any principal or interest when due; |
| |
• |
|
failure to observe any other agreement, obligation, or other covenant in the indenture,
subject to the cure periods for certain failures; and |
| |
• |
|
the Partnership or any of its subsidiaries’ default under other indebtedness that exceeds a
certain threshold amount; |
| |
• |
|
failures by the Partnership or any of its subsidiaries to pay final judgments that exceed a
certain threshold amount; and |
| |
• |
|
bankruptcy or other insolvency events involving the Partnership or any of its material
subsidiaries. |
If an event of default relating to bankruptcy or other insolvency events occurs, the senior
unsecured notes will immediately become due and payable. If any other event of default exists under
the indenture, the trustee under the indenture or
the holders of the senior unsecured notes may accelerate the maturity of the senior unsecured notes and exercise
other rights and remedies.
50
Credit Risk
Risks of nonpayment and nonperformance by the Partnership’s customers are a major concern in
its business. The Partnership is subject to risks of loss resulting from nonpayment or
nonperformance by its customers and other counterparties, such as lenders and hedging
counterparties. Any increase in the nonpayment and nonperformance by its customers could adversely
affect the results of operations and reduce the Partnership’s ability to make distributions to its
unitholders. Many of the Partnership’s customers finance their activities through cash flow from
operations, the incurrence of debt or the issuance of equity. Recently, there has been a
significant decline in the credit markets and the availability of credit. Additionally, many of the
Partnership’s customers’ equity values have substantially declined. The combination of reduction of
cash flow resulting from declines in commodity prices, a reduction in borrowing bases under reserve
based credit facilities and the lack of availability of debt or equity financing may result in a
significant reduction in customers’ liquidity and ability to make payments or perform on their
obligations to the Partnership. Furthermore, some of the customers may be highly leveraged and
subject to their own operating and regulatory risks, which increases the risk that they may default
on their obligations to the Partnership.
Inflation
Inflation in the United States has been relatively low in recent years in the economy as a
whole. The midstream natural gas industry has experienced an increase in labor and material costs
during 2008 but 2009 remained relatively unchanged. These increases did not have a material impact
on our results of operations for the periods presented. Although the impact of inflation has been
insignificant in recent years, it is still a factor in the United States economy and may increase
the cost to acquire or replace property, plant and equipment and may increase the costs of labor
and supplies. To the extent permitted by competition, regulation and our existing agreements, we
have and will continue to pass along increased costs to our customers in the form of higher fees.
Environmental
The Partnership’s operations are subject to environmental laws and regulations adopted by
various governmental authorities in the jurisdictions in which these operations are conducted. We
believe the Partnership is in material compliance with all applicable laws and regulations. For a
more complete discussion of the environmental laws and regulations that impact us, see Item 1.
“Business — Environmental Matters.”
Contingencies
In December 2008, Denbury initiated formal arbitration proceedings against Crosstex
Processing, Crosstex Energy, Crosstex Gathering and Crosstex Marketing, all wholly-owned
subsidiaries of the Partnership, asserting a claim for breach of contract under a gas processing
agreement. Denbury alleged damages in the amount of $16.2 million, plus interest and attorneys’
fees. Crosstex denied any liability and sought to have the action dismissed. A three-person
arbitration panel conducted a hearing on the merits in December 2009. At the close of the evidence
at the hearing, the panel granted judgment for Crosstex on one of Denbury’s claims, and on February
16, 2010, the panel granted judgment for Denbury on its remaining claims in the amount of $3.0
million plus interest, attorneys’ fees and costs. The panel will conduct additional proceedings to
determine the amount of attorneys’ fees and costs, if any, that should be awarded to Denbury. The
Partnership estimates that the total award will be between $3.0 million and $4.0 million at the
conclusion of these additional proceedings. The Partnership has accrued $3.7 million in other
current liabilities for this award as of December 31, 2009 and reflected the related expense in
purchased gas costs.
At times, the Partnership’s gas-utility subsidiaries acquire pipeline easements and other
property rights by exercising rights of eminent domain provided under state law. As a result, the
Partnership (or its subsidiaries) is a party to a number of lawsuits under which a court will
determine the value of pipeline easements or other property interests obtained by the Partnership’s
gas utility subsidiaries by condemnation. Damage awards in these suits should reflect the value of
the property interest acquired and the diminution in the value of the remaining property owned by
the landowner. However, some landowners have alleged unique damage theories to inflate their
damage claims or assert valuation methodologies that could result in damage awards in excess of the
amounts anticipated. Although it is not possible to predict the ultimate outcomes of these
matters, the Partnership does not expect that awards in these matters will have a material adverse
impact on its consolidated results of operations or financial condition.
The Partnership (or its subsidiaries) is defending several lawsuits filed by owners of
property located near processing facilities or compression facilities constructed by the
Partnership as part of its systems. The suits generally allege that the facilities create a private
nuisance and have damaged the value of surrounding property. Claims of this nature have arisen as a
result of the industrial development of natural gas gathering, processing and treating facilities
in urban and occupied rural areas. Although it is not possible to predict the ultimate outcomes of
these matters, the Partnership does not believe that these claims will have a material adverse
impact on its consolidated results of operations or financial condition.
51
On July 22, 2008, SemStream, L.P. and certain of its subsidiaries filed voluntary petitions
for reorganization under Chapter 11 of the U.S. Bankruptcy Code. As of July 22, 2008, SemStream,
L.P. owed the Partnership approximately $6.2 million, including approximately $3.9 million for June
2008 sales and approximately $2.3 million for July 2008 sales. The Partnership believes the July
sales of $2.3 million will receive “administrative claim” status in the bankruptcy proceeding. The
debtor’s schedules acknowledge its obligation to Crosstex for an administrative claim in the amount
of $2.3 million, but it remains subject to an objection by the lenders’ agent. The Partnership
evaluated these receivables for collectibility and provided a valuation allowance of $3.1 million
and $0.8 million during the years ended December 31, 2008 and 2009, respectively.
Recent Accounting Pronouncements
As a result of the recent credit crisis, FASB ASC 820-10-35-15A was issued October 2008 and
clarifies the application of FASB ASC 820 in a market that is not active and provides guidance on
how observable market information in a market that is not active should be considered when
measuring fair value, as well as how the use of market quotes should be considered when assessing
the relevance of observable and unobservable data available to measure fair value. FASB ASC
820-10-35-15A is effective upon issuance, for companies that have adopted FASB ASC 820. We have
evaluated FASB ASC 820-10-35-15A and determined that this standard has no impact on our results of
operations, cash flows or financial position for this reporting period.
FASB ASC 260-10-45-60 was issued June 2008 and requires unvested share-based payment awards
that contain nonforfeitable rights to dividends or dividend equivalents to be treated as
participating securities as defined in FASB ASC 260-10-20 and, therefore, included in the earnings
allocation in computing earnings per share under the two-class method described in FASB ASC 260.
FASB ASC 260-10-45-60 is effective for financial statements issued for fiscal years beginning after
December 15, 2008 and interim periods within those years. We have adopted FASB ASC 260-10-45-60
effective January 1, 2009 and adjusted all prior periods to conform to the requirements.
FASB ASC 805 and FASB ASC 810-10-65-1 were issued December 2007. FASB ASC 805 requires most
identifiable assets, liabilities, non-controlling interests and goodwill acquired in a business
combination to be recorded at “full fair value.” The Statement applies to all business
combinations, including combinations among mutual entities and combinations by contract alone.
Under FASB ASC 805 all business combinations will be accounted for by applying the acquisition
method. FASB ASC 805 is effective for periods beginning on or after December 15, 2008. FASB ASC
810-10-65-1 requires non-controlling interests (previously referred to as minority interests) to be
treated as a separate component of equity, not as a liability or other item outside of permanent
equity. Additionally, gains and losses related to any subsidiary sales, if any, are to be
reflected as equity transactions rather than reflected in net income as previously allowed.
FASB ASC 810-10-65-1 was adopted effective January 1, 2009 and comparative period
information has been recast to classify non-controlling interests in equity, and attribute net
income and other comprehensive income to non-controlling interests.
FASB ASC 105 was released July 1, 2009 and intended to improve financial reporting by
identifying a consistent framework, or hierarchy, for selecting accounting principles to be used in
preparing financial statements of non-governmental entities that are presented in conformity with
generally accepted accounting principles (GAAP) in the United States of America. SFAS No. 162 has
been superseded by SFAS No. 168, “The FASB Accounting Standards Codification and the Hierarchy of
Generally Accepted Accounting Principles” (the Codification) released July 1, 2009. The
Codification became the exclusive authoritative reference for non-governmental U.S. GAAP for use in
financial statements issued for interim and annual periods ending after September 15, 2009, except
for Securities and Exchange Commission (SEC) rules and interpretive releases, which are also
authoritative GAAP for SEC registrants. The change establishes non-governmental U.S. GAAP into the
authoritative Codification and guidance that is non-authoritative. The contents of the Codification
carry the same level of authority, eliminating the four-level GAAP hierarchy previously set forth
in Statement 162. The Codification supersedes all existing non-SEC accounting and reporting
standards. All other non-grandfathered, non-SEC accounting literature not included in the
Codification has become non-authoritative. We have revised all GAAP references to reflect the
Codification for the year ended December 31, 2009.
FASB ASC 815-10-65-1 was issued March 2008 and requires entities to provide greater
transparency about how and why the entity uses derivative instruments, how the instruments and
related hedged items are accounted for under FASB ASC 815 and how the instruments and related
hedged items affect the financial position, results of operations and cash flows of the entity.
FASB ASC 815-10-65-1 is effective for fiscal years beginning after November 15, 2008. FASB ASC
815-10-65-1 was adopted effective January 1, 2009. Required disclosures were added to Note 13.
In June 2009 FASB ASC 810-10-05-8 was issued. It requires reporting entities to evaluate
former Qualifying Special Purpose Entities or QSPEs for consolidation, changes the approach to
determining a variable interest entity’s (VIE) primary beneficiary from a quantitative assessment
to a qualitative assessment designed to identify a controlling financial interest, and increases
the frequency of required reassessments to determine whether a company is the primary beneficiary
of a VIE. It also clarifies, but does not significantly change, the characteristics that identify a
VIE. This statement requires additional year-end and interim disclosures for public and
nonpublic companies that are similar to the disclosures required by FASB ASC 860-10-65-2. The
statement is effective for fiscal years beginning after November 15, 2009 and for subsequent
interim and annual reporting periods. We do not expect this statement to have a significant impact
to our financial statements.
52
FASB ASC 855 was issued June 2009 and is effective for interim or annual financial periods
ending after June 15, 2009 and addresses accounting and disclosure requirements related to
subsequent events. The statement requires management to evaluate subsequent events through the date
the financial statements are issued. Companies are required to disclose the date through which
subsequent events have been evaluated. We have taken this statement into consideration in Note 19.
FASB ASC 825-10-65-1 requires publicly traded companies to disclose the fair value of
financial instruments within the scope of FASB ASC 825 in interim financial statements, adding to
the current requirement to make those disclosures in annual financial statements. FASB ASC
825-10-65-1 is effective for interim and annual periods ending after June 15, 2009. We have added
the required footnote disclosure in interim financial statements.
Disclosure Regarding Forward-Looking Statements
This Annual Report on Form 10-K contains forward-looking statements within the meaning of
Section 27A of the Securities Act of 1933, as amended, and Section 21E of the Securities Exchange
Act of 1934, as amended, that are based on information currently available to management as well as
management’s assumptions and beliefs. All statements, other than statements of historical fact,
included in this Form 10-K constitute forward-looking statements, including but not limited to
statements identified by the words “may,” “will,” “should,” “plan,” “predict,” “anticipate,”
“believe,” “intend,” “estimate” and “expect” and similar expressions. Such statements reflect our
current views with respect to future events, based on what we believe are reasonable assumptions;
however, such statements are subject to certain risks and uncertainties. In addition to the
specific uncertainties discussed elsewhere in this Form 10-K, the risk factors set forth in “Item
1A. Risk Factors” may affect our performance and results of operations. Should one or more of these
risks or uncertainties materialize, or should underlying assumptions prove incorrect, actual
results may differ materially from those in the forward-looking statements. We disclaim any
intention or obligation to update or review any forward-looking statements or information, whether
as a result of new information, future events or otherwise.
Item 7A. Quantitative and Qualitative Disclosures about Market Risk
Market risk is the risk of loss arising from adverse changes in market rates and prices. The
Partnership’s primary market risk is the risk related to changes in the prices of natural gas and
NGLs. In addition, it is also exposed to the risk of changes in interest rates on floating rate
debt.
Interest Rate Risk
The Partnership is exposed to interest rate risk on its variable rate bank credit facility. At
December 31, 2009 and 2008, the bank credit facility had outstanding borrowings of $529.6 million
and $784.0 million, respectively, which approximated fair value. The Partnership has managed a
portion of its interest rate exposure on variable rate debt by utilizing interest rate swaps, which
allow it to convert a portion of variable rate interest expense into fixed rate interest expense.
As of December 31, 2009, the fair value of these interest rate swaps was reflected as a liability
of $24.7 million ($17.9 million in net current liabilities and $6.8 million in long-term
liabilities) on the Company’s financial statements. We estimate that a 1% increase or decrease in
the interest rate would increase or decrease the fair value of these interest rate swaps by
approximately $12.7 million. Considering the amount outstanding on the Partnership’s bank credit
facility as of December 31, 2009, we estimate that a 1% increase or decrease in the interest rate
would change its annual interest expense by approximately $5.3 million.
At December 31, 2009 and 2008, the Partnership had total fixed rate debt obligations of $344.1
million and $479.7 million, respectively, consisting of senior secured notes with a weighted
average interest rate of 10.5% and a series B secured note with a fixed rate of 9.5%. The fair
value of these fixed rate obligations was approximately $342.7 million and $374.4 million as of
December 31, 2009 and 2008, respectively. We estimate that a 1% increase or decrease in interest
rates would increase or decrease the fair value of the fixed rated debt (the senior secured notes)
by $9.6 million based on the debt obligations as of December 31, 2009.
The debt obligations discussed above and the related interest rate swaps were liquidated
during February 2010 in the completion of the Partnership’s long-term recapitalization plan as
discussed in Item 7. Management’s Discussion and Analysis of Financial Condition and Results of
Operations — “Recent Developments and Business Strategy” under
“Description of Indebtedness — Senior Unsecured Notes” and
“Description of Indebtedness — New Credit Facility.”
53
Commodity Price Risk
The Partnership is subject to significant risks due to fluctuations in commodity prices. Its
exposure to these risks is primarily in the gas processing component of its business. The
Partnership currently processes gas under three main types of contractual arrangements:
| |
1. |
|
Processing margin contracts: Under this type of contract, the Partnership pays the
producer for the full amount of inlet gas to the plant, and makes a margin based on the
difference between the value of liquids recovered from the processed natural gas as
compared to the value of the natural gas volumes lost (“shrink”) at the cost of fuel used
in processing. The shrink and fuel losses are referred to as plant thermal reduction or
PTR. The Partnership’s margins from these contracts are high during periods of high
liquids prices relative to natural gas prices, and can be negative during periods of high
natural gas prices relative to liquids prices. However, the Partnership mitigates its risk
of processing natural gas when its margins are negative under its current processing margin
contracts primarily through its ability to bypass processing when it is not profitable for
the Partnership, or by contracts that revert to a minimum fee for processing if the natural
gas must be processed to meet pipeline quality specifications. |
| |
2. |
|
Percent of liquids contracts: Under these contracts, the Partnership receives a fee in
the form of a percentage of the liquids recovered, and the producer bears all the cost of
the natural gas shrink. Therefore, its margins from these contracts are greater during
periods of high liquids prices. The Partnership’s margins from processing cannot become
negative under percent of liquids contracts, but do decline during periods of low NGL
prices. |
| |
3. |
|
Fee based contracts: Under these contracts the Partnership has no commodity price
exposure, and is paid a fixed fee per unit of volume that is processed. |
The gross margin presentation in the table below is calculated net of results from
discontinued operations. Gas processing margins by contract types and gathering and transportation
margins as a percent of total gross margin for the comparative year-to-date periods are as follows:
| |
|
|
|
|
|
|
|
|
|
|
|
|
| |
|
Years Ended December 31, |
|
| |
|
2009 |
|
|
2008 |
|
|
2007 |
|
Gathering and transportation margin |
|
|
65.8 |
% |
|
|
57.6 |
% |
|
|
45.1 |
% |
Gas processing margins: |
|
|
|
|
|
|
|
|
|
|
|
|
Processing margin |
|
|
8.9 |
% |
|
|
15.4 |
% |
|
|
16.8 |
% |
Percent of liquids |
|
|
13.2 |
% |
|
|
17.9 |
% |
|
|
28.1 |
% |
Fee based |
|
|
12.1 |
% |
|
|
9.1 |
% |
|
|
10.0 |
% |
|
|
|
|
|
|
|
|
|
|
Total gas processing |
|
|
34.2 |
% |
|
|
42.4 |
% |
|
|
54.9 |
% |
|
|
|
|
|
|
|
|
|
|
Total |
|
|
100.0 |
% |
|
|
100.0 |
% |
|
|
100.0 |
% |
|
|
|
|
|
|
|
|
|
|
The Partnership has hedges in place at December 31, 2009 covering a portion of the liquids
volumes it expects to receive under percent of liquids (POL) contracts as set forth in the
following table. The relevant payment index price is the monthly average of the daily closing price
for deliveries of commodities into Mont Belvieu, Texas as reported by the Oil Price Information
Service (OPIS).
| |
|
|
|
|
|
|
|
|
|
|
|
|
| |
|
|
|
Notional |
|
|
|
|
|
Fair Value |
|
| Period |
|
Underlying |
|
Volume |
|
We Pay |
|
We Receive* |
|
Asset/(Liability) |
|
| |
|
|
|
|
|
|
|
|
|
(In thousands) |
|
January 2010-December 2010 |
|
Ethane |
|
63 (MBbls) |
|
Index |
|
$0.5981/gal |
|
$ |
(280 |
) |
January 2010-December 2010 |
|
Propane |
|
109 (MBbls) |
|
Index |
|
$0.9584/gal |
|
|
(1,236 |
) |
January 2010-December 2010 |
|
Normal Butane |
|
40 (MBbls) |
|
Index |
|
$1.2580/gal |
|
|
(420 |
) |
January 2010-December 2010 |
|
Natural Gasoline |
|
21 (MBbls) |
|
Index |
|
$1.4815/gal |
|
|
(231 |
) |
|
|
|
|
|
|
|
|
|
|
|
|
|
|
|
|
|
|
|
|
|
|
$ |
(2,167 |
) |
|
|
|
|
|
|
|
|
|
|
|
|
The Partnership has hedged its exposure to declines in prices for a portion of the NGL volumes
produced for its account. The NGL volumes hedged, as set forth above, focus on POL contracts. The
Partnership hedges POL exposure based on volumes considered hedgeable (volumes committed under
contracts that are long term in nature) versus total POL volumes that include volumes that may
fluctuate due to contractual terms, such as contracts with month to month processing options. The
Partnership hedged 63.7% of its hedgeable volumes at risk through the end of 2010 (24.5% of total
volumes at risk ).
54
The Partnership also has hedges in place at December 31, 2009 covering the fractionation
spread risk related to its processing margin contracts as set forth in the following table:
| |
|
|
|
|
|
|
|
|
|
|
|
|
| |
|
|
|
Notional |
|
|
|
|
|
Fair Value |
|
| Period |
|
Underlying |
|
Volume |
|
We Pay |
|
We Receive |
|
Asset/(Liability) |
|
| |
|
|
|
|
|
|
|
|
|
(In thousands) |
|
January 2010-December 2010 |
|
Ethane |
|
193 (MBbls) |
|
Index |
|
$0.5009/gal* |
|
$ |
(1,467 |
) |
January 2010-December 2010 |
|
Propane |
|
85 (MBbls) |
|
Index |
|
$0.9226/gal* |
|
|
(1,063 |
) |
January 2010-December 2010 |
|
Normal Butane |
|
57 (MBbls) |
|
Index |
|
$1.2007/gal* |
|
|
(712 |
) |
January 2010-December 2010 |
|
Natural Gasoline |
|
56 (MBbls) |
|
Index |
|
$1.5305/gal* |
|
|
(476 |
) |
January 2010-December 2010 |
|
Natural Gas |
|
4,695 (MMbtu/d) |
|
$5.7096/MMBtu* |
|
Index |
|
|
92 |
|
|
|
|
|
|
|
|
|
|
|
|
|
|
|
|
|
|
|
|
|
|
|
$ |
(3,626 |
) |
|
|
|
|
|
|
|
|
|
|
|
|
In relation to its fractionation spread risk, as set forth above, the Partnership has hedged
59.2% of its hedgeable liquids volumes at risk through the end of 2010 (32.7% of total liquids
volumes at risk) and 62.6% of the related hedgeable PTR volumes through the end of 2010 (32.7% of
total PTR volumes).
The Partnership is also subject to price risk to a lesser extent for fluctuations in natural
gas prices with respect to a portion of its gathering and transport services. Approximately 8.0% of
the natural gas the Partnership markets is purchased at a percentage of the relevant natural gas
index price, as opposed to a fixed discount to that price. As a result of purchasing the natural
gas at a percentage of the index price, resale margins are higher during periods of high natural
gas prices and lower during periods of lower natural gas prices.
Another price risk the Partnership faces is the risk of mismatching volumes of gas bought or
sold on a monthly price versus volumes bought or sold on a daily price. The Partnership enters each
month with a balanced book of natural gas bought and sold on the same basis. However, it is normal
to experience fluctuations in the volumes of natural gas bought or sold under either basis, which
leaves it with short or long positions that must be covered. The Partnership uses financial swaps
to mitigate the exposure at the time it is created to maintain a balanced position.
The Partnership’s primary commodity risk management objective is to reduce volatility in its
cash flows. The Partnership maintains a risk management committee, including members of senior
management, which oversees all hedging activity. The Partnership enters into hedges for natural gas
and NGLs using over-the-counter derivative financial instruments with only certain well-capitalized
counterparties which have been approved by its risk management committee.
The use of financial instruments may expose the Partnership to the risk of financial loss in
certain circumstances, including instances when (1) sales volumes are less than expected requiring
market purchases to meet commitments or (2) counterparties fail to purchase the contracted
quantities of natural gas or otherwise fail to perform. To the extent that the Partnership engages
in hedging activities it may be prevented from realizing the benefits of favorable price changes in
the physical market. However, the Partnership is similarly insulated against unfavorable changes in
such prices.
As of December 31, 2009, outstanding natural gas swap agreements, NGL swap agreements, swing
swap agreements, storage swap agreements and other derivative instruments were a net fair value
liability of $2.9 million. The aggregate effect of a hypothetical 10% increase in gas and NGLs
prices would result in an increase of approximately $2.3 million in the net fair value liability of
these contracts as of December 31, 2009.
Item 8. Financial Statements and Supplementary Data
The Report of Independent Registered Public Accounting Firm, Consolidated Financial Statements
and supplementary financial data required by this Item are set forth
on pages F-1 through F-43 of
this Report and are incorporated herein by reference.
Item 9. Changes in and Disagreements With Accountants on Accounting and Financial Disclosure
None.
Item 9A. Controls and Procedures
(a) Evaluation of Disclosure Controls and Procedures
We carried out an evaluation, under the supervision and with the participation of our
management, including our Chief Executive Officer and Chief Financial Officer, of the effectiveness
of our disclosure controls and procedures as of the end of the period covered by this report
pursuant to Exchange Act Rules 13a-15 and 15d-15. Based on that evaluation, our Chief Executive
Officer and Chief Financial Officer concluded that our disclosure controls and procedures were effective as of
December 31, 2009 in alerting them in a timely manner to material information required to be
disclosed in our reports filed with the Securities and Exchange Commission.
55
(b) Changes in Internal Control Over Financial Reporting
There has been no change in our internal control over financial reporting that occurred in the
three months ended December 31, 2009 that has materially affected, or is reasonably likely to
materially affect, our internal control over financial reporting.
Internal Control Over Financial Reporting
See “Management’s Report on Internal Control over Financial Reporting” on page F-2.
Item 9B. Other Information
None.
PART III
Item 10. Directors, Executive Officers and Corporate Governance
The following table shows information about our executive officers. Executive officers serve
until their successors are elected or appointed.
| |
|
|
|
|
|
|
| Name |
|
Age |
|
Position with Crosstex Energy GP, LLC |
Barry E. Davis(1)
|
|
|
48 |
|
|
President, Chief Executive Officer and Director |
William W. Davis(1)
|
|
|
56 |
|
|
Executive Vice President and Chief Financial Officer |
Joe A. Davis(1)
|
|
|
49 |
|
|
Executive Vice President, General Counsel and Secretary |
Michael J. Garberding
|
|
|
41 |
|
|
Senior Vice President—Finance |
Stan Golemon
|
|
|
46 |
|
|
Senior Vice President of Engineering and Operations |
Barry E. Davis, President, Chief Executive Officer and Director, led the management buyout of
the midstream assets of Comstock Natural Gas, Inc. in December 1996, which transaction resulted in
the formation of the Partnership’s predecessor. Mr. Davis has served as director since the
Partnership’s initial public offering in December 2002. Mr. Davis was President and Chief Operating
Officer of Comstock Natural Gas and founder of Ventana Natural Gas, a gas marketing and pipeline
company that was purchased by Comstock Natural Gas. Mr. Davis started Ventana Natural Gas in June
1992. Prior to starting Ventana, he was Vice President of Marketing and Project Development for
Endevco, Inc. Before joining Endevco, Mr. Davis was employed by Enserch Exploration in the
marketing group. Mr. Davis also serves as a director of Crosstex Energy GP, LLC, the general
partner of the general partner of the Partnership. Mr. Davis holds a B.B.A. in Finance from Texas
Christian University. Mr. Davis also serves as the Chairman of the Board for Crosstex Energy, Inc.
William W. Davis, Executive Vice President and Chief Financial Officer, joined the
Partnership’s predecessor in September 2001, and has over 30 years of finance and accounting
experience. Mr. Davis has served as Chief Financial Officer since joining the Partnership’s
predecessor. Prior to joining the Partnership’s predecessor, Mr. Davis held various positions with
Sunshine Mining and Refining Company from 1983 to September 2001, including Vice
President-Financial Analysis from 1983 to 1986, Senior Vice President and Chief Accounting Officer
from 1986 to 1991 and Executive Vice President and Chief Financial Officer from 1991 to 2001. In
addition, Mr. Davis served as Chief Operating Officer in 2000 and 2001. Mr. Davis graduated magna
cum laude from Texas A&M University with a B.B.A. in Accounting and is a Certified Public
Accountant.
Joe A. Davis, Executive Vice President, General Counsel and Secretary, joined Crosstex in
October 2005. He began his legal career in 1985 with the Dallas firm of Worsham Forsythe, which
merged with the international law firm of Hunton & Williams in 2002. Most recently, he served as a
partner in the firm’s Energy Practice Group, and served on the firm’s Executive Committee. Mr.
Davis specialized in facility development, sales, acquisitions and financing for the energy
industry, representing entrepreneurial start up/development companies, growth companies, large
public corporations and large electric and gas utilities. He received his J.D. from Baylor Law
School in Waco and his bachelor of science from the University of Texas in Dallas.
Michael J. Garberding, Senior Vice President — Finance joined Crosstex Energy GP, LLC in
February 2008. Mr. Garberding has 20 years experience in finance and accounting. Prior to joining
Crosstex, Mr. Garberding was assistant treasurer at TXU Corporation. In addition, Mr. Garberding
worked at Enron North America as a Finance Manager and Arthur Andersen LLP as an Audit Manager.
He received his Masters in Business Administration from the University of Michigan in 1999 and
his B.B.A. in Accounting from Texas A&M University in 1991.
56
Stan Golemon, Senior Vice President of Engineering and Operations, joined Crosstex Energy GP,
LLC in May of 2008. Mr. Golemon has 25 years of experience in engineering, operations, and
commercial development in the midstream and E&P industries. Immediately prior to joining Crosstex,
Mr. Golemon held various midstream engineering, commercial, and management positions with Union
Pacific Resources and its successor company Anadarko Petroleum Corporation. Mr. Golemon also spent
3 years with The Arrington Corporation consulting on sulfur recovery operations and Process Safety
Management. Mr. Golemon began his career with ARCO Oil and Gas Company where he worked in plant,
onshore facilities, and offshore facilities engineering. Mr. Golemon graduated summa cum laude from
Louisiana Tech University in 1985 with a Bachelor of Science degree in Chemical Engineering.
Code of Ethics
We adopted a Code of Business Conduct and Ethics (the “Code of Ethics”) applicable to all of
our employees, officers, and directors, with regard to company-related activities. The Code of
Ethics incorporates guidelines designed to deter wrongdoing and to promote honest and ethical
conduct and compliance with applicable laws and regulations. The Code of Ethics also incorporates
our expectations of our employees that enable us to provide accurate and timely disclosure in our
filings with the Securities and Exchange Commission and other public communications. A copy of the
Code of Ethics is available to any person, free of charge, at our web site: www.crosstexenergy.com.
If any substantive amendments are made to the Code of Ethics or if we grant any waiver, including
any implicit waiver, from a provision of the Code of Ethics to any of our executive officers and
directors, we will disclose the nature of such amendment or waiver on our web site.
Other
The sections entitled “Proposal One: Election of Directors”, “Additional Information Regarding
the Board of Directors”, “Section 16(a) Beneficial Ownership Reporting Compliance”, and
“Stockholder Proposals and Other Matters” that will appear in our proxy statement for the 2010
annual meeting of stockholders, which we expect to file with the Securities and Exchange Commission
within 120 days after December 31, 2009 (the “2010 Proxy Statement”), will set forth certain
information with respect to our directors and with respect to reporting under Section 16(a) of the
Securities Exchange Act of 1934, and are incorporated herein by reference.
Item 11. Executive Compensation
The section entitled “Executive Compensation” that will appear in the 2010 Proxy Statement
will set forth certain information with respect to the compensation of our management, and is
incorporated herein by reference.
Item 12. Security Ownership of Certain Beneficial Owners and Management and Related Stockholder
Matters
The sections entitled “Equity Compensation Plans” and “Security Ownership of Certain
Beneficial Owners and Management” that appears in the 2010 Proxy Statement will set forth certain
information with respect to securities authorized for issuance under equity compensation plans and
the ownership of voting securities and equity securities of us, and are incorporated herein by
reference.
Item 13. Certain Relationships and Related Transactions and Director Independence
The sections entitled “Certain Relationships and Related Party Transactions” and “Additional
Information Regarding the Board of Directors” that will appear in the 2010 Proxy Statement will set
forth certain information with respect to certain relationships and related party transactions, and
are incorporated herein by reference.
Item 14. Principal Accounting Fees and Services
The section entitled “Fees Paid to Independent Public Accounting Firm” that will appear in the
2010 Proxy Statement will set forth certain information with respect to accounting fees and
services, and is incorporated herein by reference.
PART IV
Item 15. Exhibits and Financial Statement Schedules
(a) Financial Statements and Schedules
(1) See the Index to Financial Statements on page F-1.
57
(2) See
Schedule I — Parent Company Statements on page F-37 and Schedule II — Valuation and
Qualifying Accounts on Page F-40.
(3) Exhibits
The exhibits filed as part of this report are as follows (exhibits incorporated by reference
are set forth with the name of the registrant, the type of report and registration number or last
date of the period for which it was filed, and the exhibit number in such filing):
| |
|
|
|
|
|
|
| Number |
|
|
|
Description |
| |
|
|
|
|
|
|
| |
2.1** |
|
|
—
|
|
Partnership Interest Purchase and Sale Agreement, dated
as of June 9, 2009, among Crosstex Energy Services,
L.P., Crosstex Energy Services GP, LLC, Crosstex CCNG
Gathering, Ltd., Crosstex CCNG Transmission Ltd.,
Crosstex Gulf Coast Transmission Ltd., Crosstex
Mississippi Pipeline, L.P., Crosstex Mississippi
Gathering, L.P., Crosstex Mississippi Industrial Gas
Sales, L.P., Crosstex Alabama Gathering System, L.P.,
Crosstex Midstream Services, L.P., Javelina Marketing
Company Ltd., Javelina NGL Pipeline Ltd. and Southcross
Energy LLC (incorporated by reference to Exhibit 2.1 to
Crosstex Energy, L.P.’s Current Report on Form 8-K
dated June 9, 2009, filed with the Commission on June
11, 2009, file No. 000-50067). |
| |
|
|
|
|
|
|
| |
2.2** |
|
|
—
|
|
Partnership Interest Purchase and Sale Agreement, dated
as of August 28, 2009, among Crosstex Energy Services,
L.P., Crosstex Energy Services GP, LLC, Crosstex
Treating Services, L.P. and KM Treating GP LLC
(incorporated by reference to Exhibit 2.1 to Crosstex
Energy, L.P.’s Current Report on Form 8-K dated August
28, 2009, filed with the Commission on September 3,
2009, file No. 000-50067). |
| |
|
|
|
|
|
|
| |
3.1 |
|
|
—
|
|
Amended and Restated Certificate of Incorporation of
Crosstex Energy, Inc. (incorporated by reference to
Exhibit 3.1 to our Current Report on Form 8-K dated
October 26, 2006, filed with the Commission on October
31, 2006, file No. 000-50536). |
| |
|
|
|
|
|
|
| |
3.2 |
|
|
—
|
|
Third Amended and Restated Bylaws of Crosstex Energy,
Inc. (incorporated by reference to Exhibit 3.1 to our
Current Report on Form 8-K dated March 22, 2006, filed
with the Commission on March 28, 2006, file No.
000-50536). |
| |
|
|
|
|
|
|
| |
3.3 |
|
|
—
|
|
Certificate of Limited Partnership of Crosstex Energy,
L.P. (incorporated by reference to Exhibit 3.1 to
Crosstex Energy, L.P.’s Registration Statement on Form
S-1, file No. 333-97779). |
| |
|
|
|
|
|
|
| |
3.4 |
|
|
—
|
|
Sixth Amended and Restated Agreement of Limited
Partnership of Crosstex Energy, L.P., dated as of March
23, 2007 (incorporated by reference to Exhibit 3.1 to
Crosstex Energy, L.P.’s Current Report on Form 8-K
dated March 23, 2007, filed with the Commission on
March 27, 2007, file No. 000-50067). |
| |
|
|
|
|
|
|
| |
3.5 |
|
|
—
|
|
Amendment No. 1 to Sixth Amended and Restated Agreement
of Limited Partnership of Crosstex Energy, L.P., dated
December 20, 2007 (incorporated by reference to Exhibit
3.1 to Crosstex Energy, L.P.’s Current Report on Form
8-K dated December 20, 2007, filed with the Commission
on December 21, 2007, file No. 000-50067). |
| |
|
|
|
|
|
|
| |
3.6 |
|
|
—
|
|
Amendment No. 2 to Sixth Amended and Restated Agreement
of Limited Partnership of Crosstex Energy, L.P.
(incorporated by reference to Exhibit 3.1 to Crosstex
Energy, L.P.’s Current Report on Form 8-K dated March
27, 2008, filed with the Commission on March 28, 2008,
file No. 000-50067). |
| |
|
|
|
|
|
|
| |
3.7 |
|
|
—
|
|
Amendment No. 3 to Sixth Amended and Restated Agreement
of Limited Partnership of Crosstex Energy, L.P., dated
as of January 19, 2010 (incorporated by reference to
Exhibit 3.1 to Crosstex Energy, L.P.’s Current Report
on Form 8-K dated January 19, 2010, filed with the
Commission on January 22, 2010, file No. 000-50067). |
| |
|
|
|
|
|
|
| |
3.8 |
|
|
—
|
|
Certificate of Limited Partnership of Crosstex Energy
Services, L.P. (incorporated by reference to Exhibit
3.3 to Crosstex Energy, L.P.’s Registration Statement
on Form S-1, file No. 333-97779). |
| |
|
|
|
|
|
|
| |
3.9 |
|
|
—
|
|
Second Amended and Restated Agreement of Limited
Partnership of Crosstex Energy Services, L.P., dated as
of April 1, 2004 (incorporated by reference to Exhibit
3.5 to Crosstex Energy, L.P.’s Quarterly Report on Form
10-Q for the quarterly period ended March 31, 2004,
file No. 000-50067). |
| |
|
|
|
|
|
|
| |
3.10 |
|
|
—
|
|
Certificate of Limited Partnership of Crosstex Energy
GP, L.P. (incorporated by reference to Exhibit 3.5 to
Crosstex Energy, L.P.’s Registration Statement on Form
S-1, file No. 333-97779). |
| |
|
|
|
|
|
|
| |
3.11 |
|
|
—
|
|
Agreement of Limited Partnership of Crosstex Energy GP,
L.P., dated as of July 12, 2002 (incorporated by
reference to Exhibit 3.6 to Crosstex Energy, L.P.’s
Registration Statement on Form S-1, file No.
333-97779). |
| |
|
|
|
|
|
|
| |
3.12 |
|
|
—
|
|
Certificate of Formation of Crosstex Energy GP, LLC
(incorporated by reference to Exhibit 3.7 to Crosstex
Energy, L.P.’s Registration Statement on Form S-1, file
No. 333-97779). |
| |
|
|
|
|
|
|
| |
3.13 |
|
|
—
|
|
Amended and Restated Limited Liability Company
Agreement of Crosstex Energy GP, LLC, dated as of
December 17, 2002 (incorporated by reference to Exhibit
3.8 to Crosstex Energy, L.P.’s Registration Statement
on Form S-1, file No. 333-97779). |
58
| |
|
|
|
|
|
|
| Number |
|
|
|
Description |
| |
|
|
|
|
|
|
| |
3.14 |
|
|
—
|
|
Amendment No. 1 to Amended and Restated Limited
Liability Company Agreement of Crosstex Energy GP, LLC,
dated as of January 19, 2010 (incorporated by reference
to Exhibit 3.2 to Crosstex Energy, L.P.’s Current
Report on Form 8-K dated January 19, 2010, filed with
the Commission on January 22, 2010, file No.
000-50067). |
| |
|
|
|
|
|
|
| |
4.1 |
|
|
—
|
|
Specimen Certificate representing shares of common
stock (incorporated by reference from Exhibit 4.1 to
our Registration Statement on Form S-1, file No.
333-110095). |
| |
|
|
|
|
|
|
| |
4.2 |
|
|
—
|
|
Registration Rights Agreement, dated as of March 23,
2007, by and among Crosstex Energy, L.P. and each of
the Purchasers set forth on Schedule A thereto
(incorporated by reference to Exhibit 4.1 to Crosstex
Energy, L.P.’s Current Report on Form 8-K dated March
23, 2007, filed with the Commission on March 27, 2007,
file No. 000-50067). |
| |
|
|
|
|
|
|
| |
4.3 |
|
|
—
|
|
Registration Rights Agreement, dated as of January 19,
2010, by and among Crosstex Energy, L.P. and GSO
Crosstex Holdings LLC (incorporated by reference to
Exhibit 4.1 to Crosstex Energy, L.P.’s Current Report
on Form 8-K dated January 19, 2010, filed with the
Commission on January 22, 2010, file No. 000-50067). |
| |
|
|
|
|
|
|
| |
4.4 |
|
|
—
|
|
Indenture, dated as of February 10, 2010, by and among
Crosstex Energy, L.P., Crosstex Energy Finance
Corporation, the Guarantors named therein and Wells
Fargo Bank, National Association, as trustee
(incorporated by reference to Exhibit 4.1 to Crosstex
Energy, L.P.’s Current Report on Form 8-K dated
February 10, 2010, filed with the Commission on
February 16, 2010, file No. 000-50067). |
| |
|
|
|
|
|
|
| |
4.5 |
|
|
—
|
|
Registration Rights Agreement, dated as of February 10,
2010, by and among Crosstex Energy, L.P., Crosstex
Energy Finance Corporation, the Guarantors named
therein and the Initial Purchasers named therein
(incorporated by reference to Exhibit 4.2 to Crosstex
Energy, L.P.’s Current Report on Form 8-K dated
February 10, 2010, filed with the Commission on
February 16, 2010, file No. 000-50067). |
| |
|
|
|
|
|
|
| |
10.1 |
† |
|
—
|
|
Crosstex Energy, Inc. Amended and Restated Long-Term
Incentive Plan effective as of September 6, 2006
(incorporated by reference to Exhibit 10.1 to our
Current Report on Form 8-K dated October 26, 2006,
filed with the Commission on October 31, 2006, file No.
000-50536). |
| |
|
|
|
|
|
|
| |
10.2 |
† |
|
—
|
|
Crosstex Energy GP, LLC Amended and Restated Long-Term
Incentive Plan, dated March 17, 2009 (incorporated by
reference to Exhibit 10.3 to Crosstex Energy, L.P.’s
Quarterly Report on Form 10-Q for the quarter ended
March 31, 2009, file No. 000-50067). |
| |
|
|
|
|
|
|
| |
10.3 |
† |
|
—
|
|
Crosstex Energy, Inc. 2009 Long-Term Incentive Plan,
effective March 17, 2009 (incorporated by reference to
Exhibit 10.3 to our Quarterly Report on Form 10-Q for
the quarter ended March 31, 2009, file No. 000-50536). |
| |
|
|
|
|
|
|
| |
10.4 |
|
|
—
|
|
Omnibus Agreement, dated December 17, 2002, among
Crosstex Energy, L.P. and certain other parties
(incorporated by reference to Exhibit 10.5 to Crosstex
Energy, L.P.’s Annual Report on Form 10-K for the year
ended December 31, 2002, file No. 000-50067). |
| |
|
|
|
|
|
|
| |
10.5 |
† |
|
—
|
|
Form of Employment Agreement (incorporated by reference
to Exhibit 10.6 to Crosstex Energy, L.P.’s Annual
Report on Form 10-K for the year ended December 31,
2002, file No. 000-50067). |
| |
|
|
|
|
|
|
| |
10.6 |
† |
|
—
|
|
Form of Severance Agreement (incorporated by reference
to Exhibit 10.6 to Crosstex Energy, L.P.’s Annual
Report on Form 10K for the year ended December 31,
2009, file No. 000-50067). |
| |
|
|
|
|
|
|
| |
10.7 |
† |
|
—
|
|
Form of Performance Unit Agreement (incorporated by
reference to Exhibit 10.1 to Crosstex Energy, L.P.’s
Current Report on Form 8-K dated June 27, 2007, filed
with the Commission on July 3, 2007, file No.
000-50067). |
| |
|
|
|
|
|
|
| |
10.8 |
† |
|
—
|
|
Form of Performance Share Agreement (incorporated by
reference to Exhibit 10.1 to our Current Report on Form
8-K dated June 27, 2007, filed with the Commission on
July 3, 2007, file No. 000-50536). |
| |
|
|
|
|
|
|
| |
10.9 |
†* |
|
—
|
|
Form
of Restricted Stock Agreement. |
| |
|
|
|
|
|
|
| |
10.10 |
† |
|
—
|
|
Form of Restricted Unit Agreement (incorporated
by reference to Exhibit 10.9 to Crosstex Energy,
L.P.’s Annual Report on Form 10-K for the year
ended December 31, 2009, file No. 000-50067). |
| |
|
|
|
|
|
|
| |
10.11 |
|
|
—
|
|
Senior Subordinated Series D Unit Purchase Agreement,
dated as of March 23, 2007, by and among Crosstex
Energy, L.P. and each of the Purchasers set forth on
Schedule A thereto (incorporated by reference to
Exhibit 10.1 to Crosstex Energy, L.P.’s Current Report
on Form 8-K dated March 23, 2007, filed with the
Commission on March 27, 2007, file No. 000-50067). |
| |
|
|
|
|
|
|
| |
10.12 |
|
|
—
|
|
Common Unit Purchase Agreement, dated as of April 8,
2008, by and among Crosstex Energy, L.P. and each of
the Purchasers set forth Schedule A thereto
(incorporated by reference to Exhibit 10.1 to Crosstex
Energy, L.P.’s Current Report on Form 8-K dated April
9, 2008, file No. 000-50067). |
| |
|
|
|
|
|
|
| |
10.13 |
|
|
—
|
|
Form of Indemnity Agreement (incorporated by reference
to Exhibit 10.2 to our Annual Report on Form 10-K for
the year ended December 31, 2003, file No. 000-50536). |
59
| |
|
|
|
|
|
|
| Number |
|
|
|
Description |
| |
|
|
|
|
|
|
| |
10.14 |
|
|
—
|
|
Board Representation Agreement, dated as of January 19,
2010, by and among Crosstex Energy GP, LLC, Crosstex
Energy GP, L.P., Crosstex Energy, L.P., Crosstex
Energy, Inc. and GSO Crosstex Holdings LLC
(incorporated by reference to Exhibit 10.1 to Crosstex
Energy, L.P.’s Current Report on Form 8-K dated January
19, 2010, filed with the Commission on January 22,
2010, file No. 000-50067). |
| |
|
|
|
|
|
|
| |
10.15 |
|
|
—
|
|
Purchase Agreement, dated as of February 3, 2010, by
and among Crosstex Energy, L.P., Crosstex Energy
Finance Corporation, the Guarantors named therein and
the Initial Purchasers named therein (incorporated by
reference to Exhibit 10.1 to Crosstex Energy, L.P.’s
Current Report on Form 8-K dated February 3, 2010,
filed with the Commission on February 5, 2010, file No.
000-50067). |
| |
|
|
|
|
|
|
| |
10.16 |
|
|
—
|
|
Amended and Restated Credit Agreement, dated as of
February 10, 2010, by and among Crosstex Energy, L.P.,
Bank of America, N.A., as Administrative Agent and L/C
Issuer thereunder, and the other lenders party thereto
(incorporated by reference to Exhibit 10.1 to Crosstex
Energy, L.P.’s Current Report on Form 8-K dated
February 10, 2010, filed with the Commission on
February 16, 2010, file No. 000-50067). |
| |
|
|
|
|
|
|
| |
10.17 |
|
|
—
|
|
Agreement Regarding 2003 Registration Statement and
Waiver and Termination of Stockholders’ Agreement,
dated October 27, 2003 (incorporated by reference from
Exhibit 10.4 to our Annual Report on Form 10-K for the
year ended December 31, 2003, file No. 000-50536). |
| |
|
|
|
|
|
|
| |
10.18 |
|
|
—
|
|
Registration Rights Agreement, dated December 31, 2003
(incorporated by reference from Exhibit 10.6 to our
Annual Report on Form 10-K for the year ended December
31, 2003, file No. 000-50536). |
| |
|
|
|
|
|
|
| |
21.1 |
* |
|
—
|
|
List of Subsidiaries. |
| |
|
|
|
|
|
|
| |
23.1 |
* |
|
—
|
|
Consent of KPMG LLP. |
| |
|
|
|
|
|
|
| |
31.1 |
* |
|
—
|
|
Certification of the Principal Executive Officer. |
| |
|
|
|
|
|
|
| |
31.2 |
* |
|
—
|
|
Certification of the Principal Financial Officer. |
| |
|
|
|
|
|
|
| |
32.1 |
* |
|
—
|
|
Certification of the Principal Executive Officer and
the Principal Financial Officer of the Company pursuant
to 18 U.S.C. Section 1350. |
| |
|
|
| * |
|
Filed herewith. |
| |
| ** |
|
In accordance with the
instructions to item 601(b)(2) of Regulation S-K, the exhibits and
schedules to Exhibits 2.1 and 2.2 are not filed herewith. The
agreements identify such exhibits and schedules, including the
general nature of their content. We undertake to provide such
exhibits and schedules to the Commission upon request. |
| |
| † |
|
As required by Item 15(a)(3), this exhibit is identified as a
compensatory benefit plan or arrangement. |
60
SIGNATURES
Pursuant to the requirements of Section 13 or 15(d) of the Securities Exchange Act of 1934,
the Registrant has duly caused this report to be signed on its behalf by the undersigned, thereunto
duly authorized, on the 26th day of February 2010.
| |
|
|
|
|
| |
CROSSTEX ENERGY, INC.
|
|
| |
By: |
/s/ Barry E. Davis
|
|
| |
|
Barry E. Davis, |
|
| |
|
President and Chief Executive Officer |
|
Pursuant to the requirements of the Securities Exchange Act of 1934, this report has been
signed below by the following persons on behalf of the Registrant and in the capacities and on the
dates indicated.
| |
|
|
|
|
| Signature |
|
Title |
|
Date |
|
|
|
|
|
/s/ Barry E. Davis
Barry E. Davis
|
|
President, Chief Executive Officer and
Chairman of the Board
(Principal Executive Officer)
|
|
February 26, 2010 |
|
|
|
|
|
/s/ Leldon E. Echols
Leldon E. Echols
|
|
Director
|
|
February 26, 2010 |
|
|
|
|
|
/s/ James C. Crain
James C. Crain
|
|
Director
|
|
February 26, 2010 |
|
|
|
|
|
/s/ Bryan H. Lawrence
Bryan H. Lawrence
|
|
Lead Director
|
|
February 26, 2010 |
|
|
|
|
|
/s/ Sheldon B. Lubar
Sheldon B. Lubar
|
|
Director
|
|
February 26, 2010 |
|
|
|
|
|
/s/ Cecil E. Martin
Cecil E. Martin
|
|
Director
|
|
February 26, 2010 |
|
|
|
|
|
/s/ Robert F. Murchison
Robert F. Murchison
|
|
Director
|
|
February 26, 2010 |
|
|
|
|
|
/s/ William W. Davis
William W. Davis
|
|
Executive Vice President and
Chief Financial Officer
(Principal Financial and Accounting
Officer)
|
|
February 26, 2010 |
61
INDEX TO FINANCIAL STATEMENTS
| |
|
|
|
|
| |
|
Page |
|
Crosstex Energy, Inc. Consolidated Financial Statements: |
|
|
|
|
|
|
|
|
|
|
|
|
F-2 |
|
|
|
|
|
|
|
|
|
F-3 |
|
|
|
|
|
|
|
|
|
F-5 |
|
|
|
|
|
|
|
|
|
F-6 |
|
|
|
|
|
|
|
|
|
F-7 |
|
|
|
|
|
|
|
|
|
F-8 |
|
|
|
|
|
|
|
|
|
F-9 |
|
|
|
|
|
|
|
|
|
F-10 |
|
|
|
|
|
|
Crosstex Energy, Inc. Financial Statement Schedules: |
|
|
|
|
|
|
|
|
|
Schedule I—Parent Company Statements: |
|
|
|
|
|
|
|
|
|
|
|
|
F-37 |
|
|
|
|
|
|
|
|
|
F-38 |
|
|
|
|
|
|
|
|
|
F-39 |
|
|
|
|
|
|
Schedule II—Valuation and Qualifying Accounts: |
|
|
|
|
|
|
|
|
|
|
|
|
F-40 |
|
F-1
MANAGEMENT’S REPORT ON
INTERNAL CONTROL OVER FINANCIAL REPORTING
Management of Crosstex Energy, Inc. is responsible for establishing and maintaining adequate
internal control over financial reporting (Rule 13a-15(f) under the Securities Exchange Act of
1934, as amended) and for the assessment of the effectiveness of internal control over financial
reporting for Crosstex Energy, Inc. (the “Company”). As defined by the Securities and Exchange
Commission (Rule 13a-15(f) under the Securities Exchange Act of 1934, as amended), internal control
over financial reporting is a process designed by, or under the supervision of Crosstex Energy,
Inc.’s principal executive and principal financial officers and effected by its Board of Directors,
management and other personnel, to provide reasonable assurance regarding the reliability of
financial reporting and the preparation of the consolidated financial statements in accordance with
U.S. generally accepted accounting principles.
The Company’s internal control over financial reporting is supported by written policies and
procedures that (1) pertain to the maintenance of records that, in reasonable detail, accurately
and fairly reflect the Company’s transactions and dispositions of the Company’s assets; (2) provide
reasonable assurance that transactions are recorded as necessary to permit preparation of the
consolidated financial statements in accordance with U.S. generally accepted accounting principles,
and that receipts and expenditures of the Partnership are being made only in accordance with
authorization of the Company’s management and directors; and (3) provide reasonable assurance
regarding prevention or timely detection of unauthorized acquisition, use or disposition of the
Company’s assets that could have a material effect on the consolidated financial statements.
Because of its inherent limitations, internal control over financial reporting may not prevent
or detect misstatements. Also, projections of any evaluation of effectiveness to future periods are
subject to the risk that controls may become inadequate because of changes in conditions, or that
the degree of compliance with the policies or procedures may deteriorate.
In connection with the preparation of the Company’s annual consolidated financial statements,
management has undertaken an assessment of the effectiveness of the Company’s internal control over
financial reporting as of December 31, 2009, based on criteria established in Internal Control —
Integrated Framework issued by the Committee of Sponsoring Organizations of the Treadway Commission
(the COSO Framework). Management’s assessment included an evaluation of the design of the Company’s
internal control over financial reporting and testing of the operational effectiveness of those
controls.
Based on this assessment, management has concluded that as of December 31, 2009, the Company’s
internal control over financial reporting was effective to provide reasonable assurance regarding
the reliability of financial reporting and the preparation of financial statements for external
purposes in accordance with U.S. generally accepted accounting principles.
KPMG LLP, the independent registered public accounting firm that audited the Company’s
consolidated financial statements included in this report, has issued an attestation report on the
Company’s internal control over financial reporting, a copy of which appears on page F-4 of this
Annual Report on Form 10-K.
F-2
Report of Independent Registered Public Accounting Firm
To the Board of Directors and the Stockholders of Crosstex Energy, Inc.:
We have audited the accompanying consolidated balance sheets of Crosstex Energy, Inc. (a
Delaware corporation) and subsidiaries as of December 31, 2009 and 2008, and the related
consolidated statements of operations, changes in stockholders’ equity, comprehensive income, and
cash flows for each of the years in the three-year period ended December 31, 2009. In connection
with our audits of the consolidated financial statements, we also have audited the accompanying
financial statement schedules. These consolidated financial statements and financial statement
schedules are the responsibility of the Company’s management. Our responsibility is to express an
opinion on these consolidated financial statements and financial statement schedules based on our
audits.
We conducted our audits in accordance with the standards of the Public Company Accounting
Oversight Board (United States). Those standards require that we plan and perform the audit to
obtain reasonable assurance about whether the financial statements are free of material
misstatement. An audit includes examining, on a test basis, evidence supporting the amounts and
disclosures in the financial statements. An audit also includes assessing the accounting principles
used and significant estimates made by management, as well as evaluating the overall financial
statement presentation. We believe that our audits provide a reasonable basis for our opinion.
In our opinion, the consolidated financial statements referred to above present fairly, in all
material respects, the financial position of Crosstex Energy, Inc. and subsidiaries as of December
31, 2009 and 2008, and the results of their operations and their cash flows for each of the years
in the three-year period ended December 31, 2009, in conformity with U.S. generally accepted
accounting principles. Also in our opinion, the related financial statement schedules, when
considered in relation to the basic consolidated financial statements taken as a whole, present
fairly, in all material respects, the information set forth therein.
We also have audited, in accordance with the standards of the Public Company Accounting
Oversight Board (United States), the Company’s internal control over financial reporting as of
December 31, 2009, based on criteria established in Internal Control — Integrated Framework issued
by the Committee of Sponsoring Organizations of the Treadway Commission (COSO), and our report
dated February 26, 2010, expressed an unqualified opinion on the effectiveness of the Company’s
internal control over financial reporting.
KPMG LLP
Dallas, Texas
February 26, 2010
F-3
Report of Independent Registered Public Accounting Firm
The Board of Directors and Stockholders
Crosstex Energy, Inc.:
We have audited Crosstex Energy, Inc.’s internal control over financial reporting as of
December 31, 2009, based on criteria established in Internal Control — Integrated Framework issued
by the Committee of Sponsoring Organizations of the Treadway Commission (COSO). The Company’s
management is responsible for maintaining effective internal control over financial reporting and
for its assessment of the effectiveness of internal control over financial reporting, included in
the accompanying Management’s Report on Internal Control over Financial Reporting. Our
responsibility is to express an opinion on the Company’s internal control over financial reporting
based on our audit.
We conducted our audit in accordance with the standards of the Public Company Accounting
Oversight Board (United States). Those standards require that we plan and perform the audit to
obtain reasonable assurance about whether effective internal control over financial reporting was
maintained in all material respects. Our audit included obtaining an understanding of internal
control over financial reporting, assessing the risk that a material weakness exists, and testing
and evaluating the design and operating effectiveness of internal control based on the assessed
risk. Our audit also included performing such other procedures as we considered necessary in the
circumstances. We believe that our audit provides a reasonable basis for our opinion.
A company’s internal control over financial reporting is a process designed to provide
reasonable assurance regarding the reliability of financial reporting and the preparation of
financial statements for external purposes in accordance with generally accepted accounting
principles. A company’s internal control over financial reporting includes those policies and
procedures that (1) pertain to the maintenance of records that, in reasonable detail, accurately
and fairly reflect the transactions and dispositions of the assets of the company; (2) provide
reasonable assurance that transactions are recorded as necessary to permit preparation of financial
statements in accordance with generally accepted accounting principles, and that receipts and
expenditures of the company are being made only in accordance with authorizations of management and
directors of the company; and (3) provide reasonable assurance regarding prevention or timely
detection of unauthorized acquisition, use, or disposition of the company’s assets that could have
a material effect on the financial statements.
Because of its inherent limitations, internal control over financial reporting may not prevent
or detect misstatements. Also, projections of any evaluation of effectiveness to future periods are
subject to the risk that controls may become inadequate because of changes in conditions, or that
the degree of compliance with the policies or procedures may deteriorate.
In our opinion, the Company maintained, in all material respects, effective internal control
over financial reporting as of December 31, 2009, based on criteria established in Internal Control
— Integrated Framework issued by the Committee of Sponsoring Organizations of the Treadway
Commission.
We also have audited, in accordance with the standards of the Public Company Accounting
Oversight Board (United States), the consolidated balance sheets of the Company as of December 31,
2009 and 2008, and the related consolidated statements of operations, stockholders’ equity,
comprehensive income, and cash flows for each of the years in the three-year period ended December
31, 2009, and our report dated February 26, 2010, expressed an unqualified opinion on those
consolidated financial statements.
KPMG LLP
Dallas, Texas
February 26, 2010
F-4
CROSSTEX ENERGY, INC.
Consolidated Balance Sheets
| |
|
|
|
|
|
|
|
|
| |
|
December 31, |
|
| |
|
2009 |
|
|
2008 |
|
| |
|
(In thousands, except share data) |
|
ASSETS
|
Current assets: |
|
|
|
|
|
|
|
|
Cash and cash equivalents |
|
$ |
10,703 |
|
|
$ |
13,959 |
|
Accounts receivable: |
|
|
|
|
|
|
|
|
Trade, net of allowance for bad debts of $410 and $3,655, respectively |
|
|
27,434 |
|
|
|
49,185 |
|
Accrued revenues |
|
|
180,221 |
|
|
|
292,668 |
|
Imbalances |
|
|
6,020 |
|
|
|
3,893 |
|
Other |
|
|
1,075 |
|
|
|
7,618 |
|
Fair value of derivative assets |
|
|
9,112 |
|
|
|
27,166 |
|
Natural gas and natural gas liquids, prepaid expenses and other |
|
|
14,692 |
|
|
|
9,658 |
|
|
|
|
|
|
|
|
Total current assets |
|
|
249,257 |
|
|
|
404,147 |
|
|
|
|
|
|
|
|
Property and equipment: |
|
|
|
|
|
|
|
|
Transmission assets |
|
|
382,965 |
|
|
|
474,771 |
|
Gathering systems |
|
|
605,981 |
|
|
|
614,572 |
|
Gas plants |
|
|
457,139 |
|
|
|
577,250 |
|
Other property and equipment |
|
|
80,476 |
|
|
|
72,106 |
|
Construction in process |
|
|
12,693 |
|
|
|
86,462 |
|
|
|
|
|
|
|
|
Total property and equipment |
|
|
1,539,254 |
|
|
|
1,825,161 |
|
Accumulated depreciation |
|
|
(259,057 |
) |
|
|
(296,671 |
) |
|
|
|
|
|
|
|
Total property and equipment, net |
|
|
1,280,197 |
|
|
|
1,528,490 |
|
|
|
|
|
|
|
|
Fair value of derivative assets |
|
|
5,665 |
|
|
|
4,628 |
|
Intangible assets, net of accumulated amortization of $115,813 and $89,231, respectively |
|
|
534,897 |
|
|
|
578,096 |
|
Goodwill |
|
|
— |
|
|
|
19,673 |
|
Other assets, net |
|
|
10,217 |
|
|
|
11,709 |
|
|
|
|
|
|
|
|
Total assets |
|
$ |
2,080,233 |
|
|
$ |
2,546,743 |
|
|
|
|
|
|
|
|
LIABILITIES AND STOCKHOLDERS’ EQUITY
|
Current liabilities: |
|
|
|
|
|
|
|
|
Drafts payable |
|
$ |
5,214 |
|
|
$ |
21,514 |
|
Accounts payable |
|
|
17,978 |
|
|
|
23,879 |
|
Accrued gas purchases |
|
|
150,816 |
|
|
|
270,229 |
|
Accrued imbalances payable |
|
|
5,702 |
|
|
|
7,100 |
|
Fair value of derivative liabilities |
|
|
30,337 |
|
|
|
28,506 |
|
Current portion of long-term debt |
|
|
28,602 |
|
|
|
9,412 |
|
Other current liabilities |
|
|
52,399 |
|
|
|
63,938 |
|
|
|
|
|
|
|
|
Total current liabilities |
|
|
291,048 |
|
|
|
424,578 |
|
|
|
|
|
|
|
|
Long-term debt |
|
|
845,100 |
|
|
|
1,254,294 |
|
Other long-term liabilities |
|
|
20,797 |
|
|
|
24,708 |
|
Deferred tax liability |
|
|
95,272 |
|
|
|
81,998 |
|
Fair value of derivative liabilities |
|
|
12,106 |
|
|
|
22,775 |
|
Commitments and contingencies |
|
|
— |
|
|
|
— |
|
Stockholders’ equity: |
|
|
|
|
|
|
|
|
Common stock (150,000,000 shares authorized, $.01 par value, 46,524,177 and 46,341,621
issued and outstanding in 2009 and 2008, respectively) |
|
|
464 |
|
|
|
464 |
|
Additional paid-in capital |
|
|
271,669 |
|
|
|
268,988 |
|
Accumulated deficit |
|
|
(43,279 |
) |
|
|
(54,693 |
) |
Interest of non-controlling partners in the Partnership |
|
|
587,624 |
|
|
|
522,961 |
|
Accumulated other comprehensive income (loss) |
|
|
(568 |
) |
|
|
670 |
|
|
|
|
|
|
|
|
Total stockholders’ equity |
|
|
815,910 |
|
|
|
738,390 |
|
|
|
|
|
|
|
|
Total liabilities and stockholders’ equity |
|
$ |
2,080,233 |
|
|
$ |
2,546,743 |
|
|
|
|
|
|
|
|
See accompanying notes to consolidated financial statements
F-5
CROSSTEX ENERGY, INC.
Consolidated Statements of Operations
| |
|
|
|
|
|
|
|
|
|
|
|
|
| |
|
Years Ended December 31, |
|
| |
|
2009 |
|
|
2008 |
|
|
2007 |
|
| |
|
(In thousands, except per share data) |
|
Revenues: |
|
|
|
|
|
|
|
|
|
|
|
|
Midstream |
|
$ |
1,453,346 |
|
|
$ |
3,072,646 |
|
|
$ |
2,380,224 |
|
Gas and NGL
marketing activities |
|
|
5,744 |
|
|
|
3,365 |
|
|
|
4,105 |
|
|
|
|
|
|
|
|
|
|
|
Total revenues |
|
|
1,459,090 |
|
|
|
3,076,011 |
|
|
|
2,384,329 |
|
|
|
|
|
|
|
|
|
|
|
Operating costs and expenses: |
|
|
|
|
|
|
|
|
|
|
|
|
Purchased gas |
|
|
1,147,868 |
|
|
|
2,768,225 |
|
|
|
2,124,503 |
|
Operating expenses |
|
|
110,394 |
|
|
|
125,762 |
|
|
|
91,236 |
|
General and administrative |
|
|
62,491 |
|
|
|
72,377 |
|
|
|
62,270 |
|
Gain on derivatives |
|
|
(2,994 |
) |
|
|
(8,619 |
) |
|
|
(4,147 |
) |
Gain on sale of property |
|
|
(666 |
) |
|
|
(947 |
) |
|
|
(1,024 |
) |
Impairments |
|
|
2,894 |
|
|
|
30,177 |
|
|
|
— |
|
Depreciation and amortization |
|
|
119,162 |
|
|
|
107,652 |
|
|
|
83,361 |
|
|
|
|
|
|
|
|
|
|
|
Total operating costs and expenses |
|
|
1,439,149 |
|
|
|
3,094,627 |
|
|
|
2,356,199 |
|
|
|
|
|
|
|
|
|
|
|
Operating income (loss) |
|
|
19,941 |
|
|
|
(18,616 |
) |
|
|
28,130 |
|
Other income (expense): |
|
|
|
|
|
|
|
|
|
|
|
|
Interest expense, net |
|
|
(95,078 |
) |
|
|
(74,861 |
) |
|
|
(47,649 |
) |
Loss on extinguishment of debt |
|
|
(4,669 |
) |
|
|
— |
|
|
|
— |
|
Other income |
|
|
1,449 |
|
|
|
27,898 |
|
|
|
538 |
|
|
|
|
|
|
|
|
|
|
|
Total other income (expense) |
|
|
(98,298 |
) |
|
|
(46,963 |
) |
|
|
(47,111 |
) |
|
|
|
|
|
|
|
|
|
|
Loss from continuing operations before income taxes and gain on issuance of Partnership units |
|
|
(78,357 |
) |
|
|
(65,579 |
) |
|
|
(18,981 |
) |
Income tax benefit (provision) from continuing operations |
|
|
6,020 |
|
|
|
1,375 |
|
|
|
(6,319 |
) |
Gain on issuance of Partnership units |
|
|
— |
|
|
|
14,748 |
|
|
|
7,461 |
|
|
|
|
|
|
|
|
|
|
|
Income (loss) from continuing operations |
|
|
(72,337 |
) |
|
|
(49,456 |
) |
|
|
(17,839 |
) |
Discontinued operations: |
|
|
|
|
|
|
|
|
|
|
|
|
Income (loss) from discontinued operations-net of tax of $225, $(3,541) and $(4,527),
respectively |
|
|
(1,519 |
) |
|
|
21,466 |
|
|
|
26,817 |
|
Gain from sale of discontinued operations-net of tax of $(23,735) and $(7,053), respectively |
|
|
159,961 |
|
|
|
42,753 |
|
|
|
— |
|
|
|
|
|
|
|
|
|
|
|
Discontinued operations-net of tax |
|
|
158,442 |
|
|
|
64,219 |
|
|
|
26,817 |
|
|
|
|
|
|
|
|
|
|
|
Net income |
|
|
86,105 |
|
|
|
14,763 |
|
|
|
8,978 |
|
Less: Interest of non-controlling partners in the Partnership’s net income (loss): |
|
|
|
|
|
|
|
|
|
|
|
|
Interest of non-controlling partners in the Partnership’s continuing operations |
|
|
(48,069 |
) |
|
|
(55,704 |
) |
|
|
(22,331 |
) |
Interest of non-controlling partners in the Partnership’s discontinued operations |
|
|
(1,137 |
) |
|
|
15,454 |
|
|
|
19,133 |
|
Interest of non-controlling partners in the Partnership’s gain on sale of discontinued operations |
|
|
119,669 |
|
|
|
30,780 |
|
|
|
— |
|
|
|
|
|
|
|
|
|
|
|
Total interest of non-controlling partners in the Partnership’s net income (loss) |
|
|
70,463 |
|
|
|
(9,470 |
) |
|
|
(3,198 |
) |
|
|
|
|
|
|
|
|
|
|
Net income attributable to Crosstex Energy, Inc. |
|
$ |
15,642 |
|
|
$ |
24,233 |
|
|
$ |
12,176 |
|
|
|
|
|
|
|
|
|
|
|
Net income from continuing operations per common share: |
|
|
|
|
|
|
|
|
|
|
|
|
Basic |
|
$ |
(0.52 |
) |
|
$ |
0.13 |
|
|
$ |
0.10 |
|
|
|
|
|
|
|
|
|
|
|
Diluted |
|
$ |
(0.52 |
) |
|
$ |
0.13 |
|
|
$ |
0.09 |
|
|
|
|
|
|
|
|
|
|
|
Net income from discontinued operations per common share: |
|
|
|
|
|
|
|
|
|
|
|
|
Basic |
|
$ |
0.85 |
|
|
$ |
0.38 |
|
|
$ |
0.16 |
|
|
|
|
|
|
|
|
|
|
|
Diluted |
|
$ |
0.85 |
|
|
$ |
0.38 |
|
|
$ |
0.16 |
|
|
|
|
|
|
|
|
|
|
|
Net income per common share: |
|
|
|
|
|
|
|
|
|
|
|
|
Basic |
|
$ |
0.33 |
|
|
$ |
0.52 |
|
|
$ |
0.26 |
|
|
|
|
|
|
|
|
|
|
|
Diluted |
|
$ |
0.33 |
|
|
$ |
0.51 |
|
|
$ |
0.26 |
|
|
|
|
|
|
|
|
|
|
|
Weighted-average shares outstanding: |
|
|
|
|
|
|
|
|
|
|
|
|
Basic |
|
|
46,476 |
|
|
|
46,298 |
|
|
|
45,988 |
|
Diluted |
|
|
46,535 |
|
|
|
46,589 |
|
|
|
46,607 |
|
Dividends per share: |
|
|
|
|
|
|
|
|
|
|
|
|
Common |
|
$ |
0.09 |
|
|
$ |
1.32 |
|
|
$ |
0.91 |
|
Amounts attributable to Crosstex Energy, Inc. common shareholders: |
|
|
|
|
|
|
|
|
|
|
|
|
Income (loss) from continuing operations, net of tax and non-controlling interest |
|
$ |
(24,267 |
) |
|
$ |
6,249 |
|
|
$ |
4,492 |
|
Income (loss) from discontinued operations, net of tax and non-controlling interest |
|
|
(383 |
) |
|
|
6,011 |
|
|
|
7,684 |
|
Gain on sale of discontinued operations, net of tax and non-controlling interest |
|
|
40,292 |
|
|
|
11,973 |
|
|
|
— |
|
|
|
|
|
|
|
|
|
|
|
Net income attributable to Crosstex Energy, Inc. |
|
$ |
15,642 |
|
|
$ |
24,233 |
|
|
$ |
12,176 |
|
|
|
|
|
|
|
|
|
|
|
See accompanying notes to consolidated financial statements.
F-6
CROSSTEX ENERGY, INC.
Consolidated Statements of Changes in Stockholders’ Equity
Years Ended December 31, 2009, 2008 and 2007
| |
|
|
|
|
|
|
|
|
|
|
|
|
|
|
|
|
|
|
|
|
|
|
|
|
|
|
|
|
| |
|
|
|
|
|
|
|
|
|
|
|
|
|
|
|
|
|
Accumulated |
|
|
|
|
|
|
|
| |
|
|
|
|
|
|
|
|
|
Additional |
|
|
Retained |
|
|
Other |
|
|
Non- |
|
|
Total |
|
| |
|
Common Stock |
|
|
Paid-In |
|
|
Earnings |
|
|
Comprehensive |
|
|
Controlling |
|
|
Stockholders’ |
|
| |
|
Shares |
|
|
Amount |
|
|
Capital |
|
|
(Deficit) |
|
|
Income (Loss) |
|
|
Interest |
|
|
Equity |
|
Balance, December 31, 2006 |
|
|
45,941 |
|
|
$ |
463 |
|
|
$ |
263,264 |
|
|
$ |
13,535 |
|
|
$ |
2,151 |
|
|
$ |
391,103 |
|
|
$ |
670,516 |
|
Conversion of restricted stock to common, net
of shares withheld for taxes |
|
|
63 |
|
|
|
— |
|
|
|
(919 |
) |
|
|
— |
|
|
|
— |
|
|
|
|
|
|
|
(919 |
) |
Proceeds from exercise of stock options |
|
|
15 |
|
|
|
— |
|
|
|
98 |
|
|
|
— |
|
|
|
— |
|
|
|
|
|
|
|
98 |
|
Stock-based compensation |
|
|
— |
|
|
|
— |
|
|
|
5,416 |
|
|
|
— |
|
|
|
— |
|
|
|
6,843 |
|
|
|
12,259 |
|
Common dividends |
|
|
— |
|
|
|
— |
|
|
|
— |
|
|
|
(42,589 |
) |
|
|
— |
|
|
|
— |
|
|
|
(42,589 |
) |
Net income |
|
|
— |
|
|
|
— |
|
|
|
— |
|
|
|
12,176 |
|
|
|
— |
|
|
|
(3,198 |
) |
|
|
8,978 |
|
Non-controlling partners’ share of other
comprehensive income in Partnership |
|
|
— |
|
|
|
— |
|
|
|
— |
|
|
|
— |
|
|
|
281 |
|
|
|
|
|
|
|
281 |
|
Hedging gains or losses reclassified to earnings |
|
|
— |
|
|
|
— |
|
|
|
— |
|
|
|
— |
|
|
|
(963 |
) |
|
|
(2,179 |
) |
|
|
(3,142 |
) |
Adjustment in fair value of derivatives |
|
|
— |
|
|
|
— |
|
|
|
— |
|
|
|
— |
|
|
|
(6,547 |
) |
|
|
(15,553 |
) |
|
|
(22,100 |
) |
Contributions
from non-controlling interest |
|
|
|
|
|
|
|
|
|
|
|
|
|
|
|
|
|
|
|
|
|
|
150,978 |
|
|
|
150,978 |
|
Distribution to non-controlling interest |
|
|
— |
|
|
|
— |
|
|
|
— |
|
|
|
— |
|
|
|
— |
|
|
|
(38,960 |
) |
|
|
(38,960 |
) |
|
|
|
|
|
|
|
|
|
|
|
|
|
|
|
|
|
|
|
|
|
|
Balance, December 31, 2007 |
|
|
46,019 |
|
|
|
463 |
|
|
|
267,859 |
|
|
|
(16,878 |
) |
|
|
(5,078 |
) |
|
|
489,034 |
|
|
|
735,400 |
|
Conversion of restricted stock to common, net
of shares withheld for taxes |
|
|
285 |
|
|
|
— |
|
|
|
(3,815 |
) |
|
|
— |
|
|
|
— |
|
|
|
|
|
|
|
(3,815 |
) |
Proceeds from exercise of stock options |
|
|
38 |
|
|
|
1 |
|
|
|
243 |
|
|
|
— |
|
|
|
— |
|
|
|
|
|
|
|
244 |
|
Stock-based compensation |
|
|
— |
|
|
|
— |
|
|
|
4,701 |
|
|
|
— |
|
|
|
— |
|
|
|
6,578 |
|
|
|
11,279 |
|
Common dividends |
|
|
— |
|
|
|
— |
|
|
|
— |
|
|
|
(62,048 |
) |
|
|
— |
|
|
|
— |
|
|
|
(62,048 |
) |
Net income |
|
|
— |
|
|
|
— |
|
|
|
— |
|
|
|
24,233 |
|
|
|
— |
|
|
|
(9,470 |
) |
|
|
14,763 |
|
Non-controlling partners’ share of other
comprehensive income in Partnership |
|
|
— |
|
|
|
— |
|
|
|
— |
|
|
|
— |
|
|
|
431 |
|
|
|
|
|
|
|
431 |
|
Hedging gains or losses reclassified to earnings |
|
|
— |
|
|
|
— |
|
|
|
— |
|
|
|
— |
|
|
|
4,689 |
|
|
|
13,402 |
|
|
|
18,091 |
|
Adjustment in fair value of derivatives |
|
|
— |
|
|
|
— |
|
|
|
— |
|
|
|
— |
|
|
|
628 |
|
|
|
2,747 |
|
|
|
3,375 |
|
Contributions
from non-controlling interest |
|
|
|
|
|
|
|
|
|
|
|
|
|
|
|
|
|
|
|
|
|
|
83,820 |
|
|
|
83,820 |
|
Distribution to non-controlling interest |
|
|
— |
|
|
|
— |
|
|
|
— |
|
|
|
— |
|
|
|
— |
|
|
|
(63,150 |
) |
|
|
(63,150 |
) |
|
|
|
|
|
|
|
|
|
|
|
|
|
|
|
|
|
|
|
|
|
|
Balance, December 31, 2008 |
|
|
46,342 |
|
|
|
464 |
|
|
|
268,988 |
|
|
|
(54,693 |
) |
|
|
670 |
|
|
|
522,961 |
|
|
|
738,390 |
|
Offering costs |
|
|
— |
|
|
|
— |
|
|
|
(42 |
) |
|
|
— |
|
|
|
— |
|
|
|
— |
|
|
|
(42 |
) |
Conversion of restricted stock to common, net
of shares withheld for taxes |
|
|
182 |
|
|
|
— |
|
|
|
(354 |
) |
|
|
— |
|
|
|
— |
|
|
|
|
|
|
|
(354 |
) |
Stock-based compensation |
|
|
— |
|
|
|
— |
|
|
|
3,077 |
|
|
|
— |
|
|
|
— |
|
|
|
5,778 |
|
|
|
8,855 |
|
Common dividends |
|
|
— |
|
|
|
— |
|
|
|
— |
|
|
|
(4,228 |
) |
|
|
— |
|
|
|
— |
|
|
|
(4,228 |
) |
Net income |
|
|
— |
|
|
|
— |
|
|
|
— |
|
|
|
15,642 |
|
|
|
— |
|
|
|
70,463 |
|
|
|
86,105 |
|
Hedging gains or losses reclassified to earnings |
|
|
— |
|
|
|
— |
|
|
|
— |
|
|
|
— |
|
|
|
(550 |
) |
|
|
(1,537 |
) |
|
|
(2,087 |
) |
Adjustment in fair value of derivatives |
|
|
— |
|
|
|
— |
|
|
|
— |
|
|
|
— |
|
|
|
(688 |
) |
|
|
(2,276 |
) |
|
|
(2,964 |
) |
Distribution to non-controlling interest |
|
|
— |
|
|
|
— |
|
|
|
— |
|
|
|
— |
|
|
|
— |
|
|
|
(7,765 |
) |
|
|
(7,765 |
) |
|
|
|
|
|
|
|
|
|
|
|
|
|
|
|
|
|
|
|
|
|
|
Balance, December 31, 2009 |
|
|
46,524 |
|
|
$ |
464 |
|
|
$ |
271,669 |
|
|
$ |
(43,279 |
) |
|
$ |
(568 |
) |
|
$ |
587,624 |
|
|
$ |
815,910 |
|
|
|
|
|
|
|
|
|
|
|
|
|
|
|
|
|
|
|
|
|
|
|
See accompanying notes to consolidated financial statements.
F-7
CROSSTEX ENERGY, INC.
Consolidated Statements of Comprehensive Income
| |
|
|
|
|
|
|
|
|
|
|
|
|
| |
|
Years Ended December 31, |
|
| |
|
2009 |
|
|
2008 |
|
|
2007 |
|
| |
|
(In thousands) |
|
Net income |
|
$ |
86,105 |
|
|
$ |
14,763 |
|
|
$ |
8,978 |
|
Non-controlling partners’ share of other comprehensive income in the Partnership, net of taxes
of $0, $254, and $103, respectively |
|
|
— |
|
|
|
431 |
|
|
|
281 |
|
Hedging gains or losses reclassified to earnings, net of taxes of $(324), $2,765, and $(564),
respectively |
|
|
(550 |
) |
|
|
4,689 |
|
|
|
(963 |
) |
Adjustment in fair value of derivatives, net of taxes of $(406), $372, and $(3,783) respectively |
|
|
(688 |
) |
|
|
628 |
|
|
|
(6,547 |
) |
|
|
|
|
|
|
|
|
|
|
Comprehensive income |
|
|
84,867 |
|
|
|
20,511 |
|
|
|
1,749 |
|
Comprehensive income (loss) attributable to non-controlling interest |
|
|
70,463 |
|
|
|
(9,470 |
) |
|
|
(3,198 |
) |
|
|
|
|
|
|
|
|
|
|
Comprehensive income attributable to Crosstex Energy, Inc. |
|
$ |
14,404 |
|
|
$ |
29,981 |
|
|
$ |
4,947 |
|
|
|
|
|
|
|
|
|
|
|
See accompanying notes to consolidated financial statements.
F-8
CROSSTEX ENERGY, INC.
Consolidated Statements of Cash Flows
| |
|
|
|
|
|
|
|
|
|
|
|
|
| |
|
Years Ended December 31, |
|
| |
|
2009 |
|
|
2008 |
|
|
2007 |
|
| |
|
(In thousands) |
|
Cash flows from operating activities: |
|
|
|
|
|
|
|
|
|
|
|
|
Net income |
|
$ |
86,105 |
|
|
$ |
14,763 |
|
|
$ |
8,978 |
|
Adjustments to reconcile net income to net cash provided by operating activities: |
|
|
|
|
|
|
|
|
|
|
|
|
Depreciation and amortization |
|
|
129,812 |
|
|
|
133,030 |
|
|
|
108,926 |
|
Non-cash stock-based compensation |
|
|
8,855 |
|
|
|
11,279 |
|
|
|
12,259 |
|
Gain on sale of property |
|
|
(184,412 |
) |
|
|
(51,325 |
) |
|
|
(1,667 |
) |
Impairment |
|
|
2,894 |
|
|
|
31,240 |
|
|
|
— |
|
Deferred tax expense |
|
|
15,229 |
|
|
|
7,022 |
|
|
|
10,338 |
|
Gain on issuance of units of the Partnership |
|
|
— |
|
|
|
(14,748 |
) |
|
|
(7,461 |
) |
Non-cash derivatives loss |
|
|
2,184 |
|
|
|
23,510 |
|
|
|
2,418 |
|
Non-cash loss on debt extinguishment |
|
|
4,669 |
|
|
|
— |
|
|
|
— |
|
Interest paid-in-kind |
|
|
10,134 |
|
|
|
— |
|
|
|
— |
|
Amortization of debt issue costs |
|
|
11,812 |
|
|
|
2,854 |
|
|
|
2,639 |
|
Changes in assets and liabilities net of acquisition effects: |
|
|
|
|
|
|
|
|
|
|
|
|
Accounts receivable, accrued revenue, and other |
|
|
127,981 |
|
|
|
156,280 |
|
|
|
(121,285 |
) |
Natural gas and natural gas liquids, prepaid expenses and other |
|
|
(5,275 |
) |
|
|
5,199 |
|
|
|
(5,498 |
) |
Accounts payable, accrued gas purchases, and other accrued liabilities |
|
|
(131,126 |
) |
|
|
(148,950 |
) |
|
|
102,096 |
|
Fair value of derivatives |
|
|
(12 |
) |
|
|
— |
|
|
|
835 |
|
|
|
|
|
|
|
|
|
|
|
Net cash provided by operating activities |
|
|
78,850 |
|
|
|
170,154 |
|
|
|
112,578 |
|
|
|
|
|
|
|
|
|
|
|
Cash flows from investing activities: |
|
|
|
|
|
|
|
|
|
|
|
|
Additions to property and equipment |
|
|
(101,370 |
) |
|
|
(275,548 |
) |
|
|
(414,452 |
) |
Insurance recoveries on property and equipment |
|
|
12,458 |
|
|
|
— |
|
|
|
— |
|
Acquisitions and asset purchases |
|
|
(35,142 |
) |
|
|
— |
|
|
|
— |
|
Proceeds from sale of property |
|
|
503,928 |
|
|
|
88,780 |
|
|
|
3,070 |
|
|
|
|
|
|
|
|
|
|
|
Net cash provided by (used in) investing activities |
|
|
379,874 |
|
|
|
(186,768 |
) |
|
|
(411,382 |
) |
|
|
|
|
|
|
|
|
|
|
Cash flows from financing activities: |
|
|
|
|
|
|
|
|
|
|
|
|
Proceeds from borrowings |
|
|
632,807 |
|
|
|
1,743,580 |
|
|
|
1,189,500 |
|
Payments on borrowings |
|
|
(1,050,389 |
) |
|
|
(1,702,992 |
) |
|
|
(953,512 |
) |
Proceeds from capital lease obligations |
|
|
1,695 |
|
|
|
28,010 |
|
|
|
3,553 |
|
Payments on capital lease obligations |
|
|
(2,414 |
) |
|
|
(4,101 |
) |
|
|
— |
|
Increase (decrease) in drafts payable |
|
|
(16,300 |
) |
|
|
(7,417 |
) |
|
|
(19,017 |
) |
Debt refinancing costs |
|
|
(15,031 |
) |
|
|
(4,903 |
) |
|
|
(892 |
) |
Distributions to non-controlling partners in the Partnership |
|
|
(7,601 |
) |
|
|
(63,149 |
) |
|
|
(38,960 |
) |
Common dividends paid |
|
|
(4,228 |
) |
|
|
(62,048 |
) |
|
|
(42,589 |
) |
Proceeds from exercise of common stock option |
|
|
— |
|
|
|
244 |
|
|
|
98 |
|
Conversion of restricted units, net of units withheld for taxes |
|
|
(232 |
) |
|
|
(1,536 |
) |
|
|
(329 |
) |
Conversion of restricted stock, net of shares withheld for taxes |
|
|
(354 |
) |
|
|
(3,815 |
) |
|
|
(919 |
) |
Net proceeds from issuance of units of the Partnership |
|
|
— |
|
|
|
99,888 |
|
|
|
157,491 |
|
Proceeds from exercise of Partnership unit options |
|
|
67 |
|
|
|
850 |
|
|
|
1,598 |
|
Contributions from non-controlling partners in the Partnership |
|
|
— |
|
|
|
109 |
|
|
|
— |
|
|
|
|
|
|
|
|
|
|
|
Net cash provided by (used in) financing activities |
|
|
(461,980 |
) |
|
|
22,720 |
|
|
|
296,022 |
|
|
|
|
|
|
|
|
|
|
|
Net increase (decrease) in cash and cash equivalents |
|
|
(3,256 |
) |
|
|
6,106 |
|
|
|
(2,782 |
) |
Cash and cash equivalents, beginning of period |
|
|
13,959 |
|
|
|
7,853 |
|
|
|
10,635 |
|
|
|
|
|
|
|
|
|
|
|
Cash and cash equivalents, end of period |
|
$ |
10,703 |
|
|
$ |
13,959 |
|
|
$ |
7,853 |
|
|
|
|
|
|
|
|
|
|
|
Cash paid for interest |
|
$ |
85,466 |
|
|
$ |
76,291 |
|
|
$ |
79,648 |
|
Cash paid (refunded) for income taxes |
|
$ |
926 |
|
|
$ |
1,821 |
|
|
$ |
(45 |
) |
See accompanying notes to consolidated financial statements.
F-9
CROSSTEX ENERGY, INC.
Notes to Consolidated Financial Statements
December 31, 2009 and 2008
(1) Organization and Summary of Significant Agreements:
(a) Description of Business
CEI, a Delaware corporation formed on April 28, 2000, is engaged, through its subsidiaries, in
the gathering, transmission, processing and marketing of natural gas and natural gas liquids
(NGLs). The Company connects the wells of natural gas producers in the geographic areas of its
gathering systems in order to purchase the gas production, processes natural gas for the removal of
NGLs, transports natural gas and NGLs and ultimately provides natural gas and NGLs to a variety of
markets. In addition, the Company purchases natural gas and NGLs from producers not connected to
its gathering systems for resale and markets natural gas and NGLs on behalf of producers for a fee.
(b) Organization
On July 12, 2002, the Company formed Crosstex Energy, L.P. (herein referred to as the
Partnership or CELP), a Delaware limited partnership. Crosstex Energy GP, L.P., a wholly owned
subsidiary of the Company, is the general partner of the Partnership. The Company owns 16,414,830
common units in the Partnership through its wholly-owned subsidiaries on December 31, 2009 which
represented 33.0% of the limited partner interests in the Partnership.
After the Partnership’s January 2010 issuance of Series A Convertible Preferred Units as
discussed in Note 19, the common units owned by CEI represent 25.0% of the limited partner
interests in the Partnership.
(c) Basis of Presentation
The accompanying consolidated financial statements include the assets, liabilities and results
of operations of the Company and its majority owned subsidiaries, including the Partnership. The
Company proportionately consolidates the Partnership’s undivided 59.27% interest in a gas
processing plant. In accordance with FASB ASC 810-10-05-8 the Company consolidates its joint
venture interest in Crosstex DC Gathering, J.V. (CDC) as discussed more fully in Note 6. The
consolidated operations are hereafter referred to collectively as the Company. All material
intercompany balances and transactions have been eliminated. Certain reclassifications have been
made to the consolidated financial statements for the prior years to conform to the current
presentation.
(2) Significant Accounting Policies
(a) Management’s Use of Estimates
The preparation of financial statements in accordance with accounting principles generally
accepted in the United States of America requires management of the Company to make estimates and
assumptions that affect the reported amounts of assets and liabilities and disclosure of contingent
assets and liabilities at the date of the financial statements and the reported amounts of revenues
and expenses during the period. Actual results could differ from these estimates.
(b) Cash and Cash Equivalents
The Company considers all highly liquid investments with an original maturity of three months
or less to be cash equivalents.
(c) Natural Gas and Natural Gas Liquids Inventory
Inventories of products consist of natural gas and natural gas liquids. The Company reports
these assets at the lower of cost or market.
F-10
(d) Property, Plant, and Equipment
Property, plant and equipment consist of intrastate gas transmission systems, gas gathering
systems, industrial supply pipelines, NGL pipelines, natural gas processing plants and NGL
fractionation plants. Gas required to maintain pipeline minimum pressures is capitalized and
classified as property, plant and equipment. Other property and equipment is primarily comprised of
idle gas plants, computer software and equipment, furniture, fixtures, leasehold improvements and
office equipment. Property, plant and equipment are recorded at cost. Repairs and maintenance are
charged against income when incurred. Renewals and betterments, which extend the useful life of the
properties, are capitalized. Interest costs are capitalized to property, plant and equipment during
the period the assets are undergoing preparation for intended use. Interests costs totaling $1.1
million, $2.7 million and $4.8 million were capitalized for the years ended December 31, 2009, 2008
and 2007, respectively.
Depreciation is provided using the straight-line method based on the estimated useful life of
each asset, as follows:
| |
|
|
|
|
| |
|
Useful Lives |
|
Transmission assets |
|
20-30 years |
Gathering systems |
|
15-20 years |
Gas processing plants |
|
20 years |
Other property and equipment |
|
3-15 years |
Depreciation expense of $82.5 million, $76.3 million and $57.0 million was recorded for the
years ended December 31, 2009, 2008 and 2007, respectively. During the fourth quarter of 2009, the
Partnership reviewed the estimated useful lives and salvage values of its assets in light of the
capital improvements made to its assets over the past years. As a result of this review, the
Partnership extended the depreciable lives on some of its transmission assets, gathering systems
and gas processing plants by five years. This change in estimated depreciable lives is being
applied prospectively and will result in lower depreciation expense of approximately $9.3 million
annually in future periods.
FASB ASC 360-10-05-4 requires long-lived assets to be reviewed whenever events or changes in
circumstances indicate that the carrying value of such assets may not be recoverable. In order to
determine whether an impairment has occurred, the Company compares the net book value of the asset
to the undiscounted expected future net cash flows. If an impairment has occurred, the amount of
such impairment is determined based on the expected future net cash flows discounted using a rate
commensurate with the risk associated with the asset.
When determining whether impairment of one of our long-lived assets has occurred, we must
estimate the undiscounted cash flows attributable to the asset. The Company’s estimate of cash
flows is based on assumptions regarding the purchase and resale margins on natural gas, volume of
gas available to the asset, markets available to the asset, operating expenses, and future natural
gas prices and NGL product prices. The amount of availability of gas to an asset is sometimes based
on assumptions regarding future drilling activity, which may be dependent in part on natural gas
prices. Projections of gas volumes and future commodity prices are inherently subjective and
contingent upon a number of variable factors. Any significant variance in any of the above
assumptions or factors could materially affect our cash flows, which could require us to record an
impairment of an asset.
The Company recorded impairments to long-lived assets of $2.9 and $24.6 million during the
years ending December 31, 2009 and 2008 respectively. See Note 4(c) for further details on the
long-lived assets impaired.
(e) Goodwill and Intangibles
Goodwill created in the formation of the Partnership of $5.7 million net book value associated
with the Midstream assets was impaired during the year ending December 31, 2008. The goodwill
related to the acquisition of Treating assets and was eliminated in the disposition of all Treating
assets during 2009.
Intangible assets consist of customer relationships and the value of the dedicated and
non-dedicated acreage attributable to pipeline, gathering and processing systems. Intangible assets
associated with customer relationships are amortized on a straight-line basis over the expected
period of benefits of the customer relationships, which range from three to 15 years. The
intangible assets associated with non-dedicated acreage attributable to pipeline, gathering and
processing systems are being amortized using the units of throughput method of amortization. The
weighted average amortization period for intangible assets is
18.0 years. Amortization expense for
intangibles was approximately $36.6 million, $31.4 million and $26.4 million for the years ended
December 31, 2009, 2008 and 2007, respectively.
F-11
The following table summarizes the Company’s estimated aggregate amortization expense for the
next five years (in thousands):
| |
|
|
|
|
2010 |
|
$ |
40,646 |
|
2011 |
|
|
42,642 |
|
2012 |
|
|
45,303 |
|
2013 |
|
|
46,731 |
|
2014 |
|
|
46,701 |
|
Thereafter |
|
|
312,874 |
|
|
|
|
|
Total |
|
$ |
534,897 |
|
|
|
|
|
(f) Other Assets
Unamortized debt issuance costs totaling $10.2 million, and $11.7 million as of December 31,
2009 and 2008, respectively, are included in other assets, net. Debt issuance costs are amortized
into interest expense over the term of the related debt. Debt issuance costs are amortized into
interest expense using the effective-interest method over the term of the debt for the senior
secured notes. Debt issuance costs are amortized using the straight-line method over the term of
the debt for the bank credit facility because borrowings under the bank credit facility cannot be
forecasted for an effective-interest computation.
(g) Gas Imbalance Accounting
Quantities of natural gas and NGLs over-delivered or under-delivered related to imbalance
agreements are recorded monthly as receivables or payables using weighted average prices at the
time of the imbalance. These imbalances are typically settled with deliveries of natural gas or
NGLs. The Company had imbalance payables of $5.7 million, and $7.1 million at December 31, 2009 and
2008, respectively, which approximates the fair value for these imbalances. The Company had
imbalance receivables of $6.0 million and $3.9 million at December 31, 2009 and 2008, which are
carried at the lower of cost or market value.
(h) Asset Retirement Obligations
FASB ASC 410-20-25-16 was issued March 2005, which became effective at December 31, 2005. FASB
ASC 410-20-25-16 clarifies that the term “conditional asset retirement obligation” as used in FASB
ASC 410-20 refers to a legal obligation to perform an asset retirement activity in which the timing
and/or method of settlement are conditional on a future event that may or may not be within the
control of the entity. Since the obligation to perform the asset retirement activity is
unconditional, FASB ASC 410-20-25-16 provides that a liability for the fair value of a conditional
asset retirement activity should be recognized if that fair value can be reasonably estimated, even
though uncertainty exists about the timing and/or method of settlement. FASB ASC 410-20-25-16 also
clarifies when an entity would have sufficient information to reasonably estimate the fair value of
an asset retirement obligation under FASB ASC 410-20. The Company did not provide any asset
retirement obligations as of December 31, 2008 or 2007 because it does not have sufficient
information as set forth in FASB ASC 410-20-25-16 to reasonably estimate such obligations and the
Company has no current intention of discontinuing use of any significant assets.
(i) Revenue Recognition
The Company recognizes revenue for sales or services at the time the natural gas or NGLs are
delivered or at the time the service is performed. The Company generally accrues one month of sales
and the related gas purchases and reverses these accruals when the sales and purchases are actually
invoiced and recorded in the subsequent months. Actual results could differ from the accrual
estimates. Purchase and sale arrangements are generally reported in revenues and costs on a gross
basis in the statements of operations in accordance with FASB ASC 605-45-45-1. Except for fee based
arrangements and energy trading activities related to “off-system” gas marketing operations
discussed in Note 2(k), the Partnership acts as the principal in these purchase and sale
transactions, has the risk and reward of ownership as evidenced by title transfer, and schedules
the transportation and assumes credit risk.
The Company accounts for taxes collected from customers attributable to revenue transactions
and remitted to government authorities on a net basis (excluded from revenues).
(j) Derivatives
The Partnership uses derivatives to hedge against changes in cash flows related to product
price and interest rate risks, as opposed to their use for trading purposes. FASB ASC 815 requires
that all derivatives be recorded on the balance sheet at fair value. It generally determines the
fair value of futures contracts and swap contracts based on the difference between the derivative’s
fixed contract price and the underlying market price at the determination date. The asset or
liability related to the derivative instruments is recorded on the balance sheet in fair value of
derivative assets or liabilities.
F-12
Realized and unrealized gains and losses on commodity related derivatives that are not
designated as hedges, as well as the ineffective portion of hedge derivatives, are recorded as gain
or loss on derivatives in the consolidated statement of operations. Realized and unrealized gains
and losses on interest rate derivatives that are not designated as hedges are included in interest
expense in the consolidated statement of operations. Unrealized gains and losses on effective cash
flow hedge derivatives are recorded as a component of accumulated other comprehensive income. When
the hedged transaction occurs, the realized gain or loss on the hedge derivative is transferred
from accumulated other comprehensive income to earnings. Realized gains and losses on commodity
hedge derivatives are recognized in revenues, and realized gains and losses on interest hedge
derivatives are recorded as adjustments to interest expense. Settlements of derivatives are
included in cash flows from operating activities.
(k) Gas
and NGL Marketing Activities
The Company conducts “off-system” gas marketing operations as a service to producers on
systems that the Company does not own. The Company refers to these
activities as part of its Gas and NGL marketing activities. In some cases, the Company earns an agency fee from the producer for arranging
the marketing of the producer’s natural gas or NGLs. In other cases, the Company purchases the
natural gas or NGLs from the producer and enters into a sales contract with another party to sell
the natural gas or NGLs. The revenue and cost of sales for Gas and
NGL marketing activities are shown net
in the consolidated statements of operations.
The Company manages its price risk related to future physical purchase or sale commitments for
its Gas and
NGL marketing activities by entering into either corresponding physical delivery contracts or
financial instruments with an objective to balance the Company’s future commitments and
significantly reduce its risk to the movement in natural gas and NGL prices. However, the Company
is subject to counterparty risk for both the physical and financial contracts. The Company’s Gas and
NGL marketing contracts qualify as derivatives, and accordingly, the Company continues to use
mark-to-market accounting for both physical and financial contracts of its Gas and
NGL marketing
activities. Accordingly, any gain or loss associated with changes in the fair value of derivatives
and physical delivery contracts relating to the Company’s Gas and
NGL marketing activities are recognized
in earnings as gain or loss on derivatives immediately.
Net margins earned on settled contracts from the Company’s Gas and
NGL marketing activities included
in Gas and
NGL marketing activities in the consolidated statement of operations were $5.7
million, $3.4 million, and $4.1 million for the years ended December 31, 2009, 2008 and 2007,
respectively.
Gas and
NGL marketing contract volumes that were physically settled were as follows (in MMBtus):
| |
|
|
|
|
|
|
|
|
|
|
|
|
| |
|
Years Ended December 31, |
|
| |
|
2009 |
|
|
2008 |
|
|
2007 |
|
Volumes purchased and sold |
|
|
27,375,000 |
|
|
|
31,003,000 |
|
|
|
34,432,000 |
|
(l) Comprehensive Income (Loss)
Comprehensive income includes net income and other comprehensive income, which includes,
unrealized gains and losses on derivative financial instruments.
Pursuant to FASB ASC 815, the Company records deferred hedge gains and losses on its
derivative financial instruments that qualify as cash flow hedges, net of income tax and minority
interest, as other comprehensive income.
(m) Legal Costs Expected to be Incurred in Connection with a Loss Contingency
Legal costs incurred in connection with a loss contingency are expensed as incurred.
(n) Concentrations of Credit Risk
Financial instruments, which potentially subject the Company to concentrations of credit risk,
consist primarily of trade accounts receivable and derivative financial instruments. Management
believes the risk is limited since the Company’s customers represent a broad and diverse group of
energy marketers and end users. In addition, the Company continually monitors and reviews credit
exposure to its marketing counterparties and letters of credit or other appropriate security are
obtained as considered necessary to limit the risk of loss. The Company records reserves for
uncollectible accounts on a specific identification basis since there is not a large volume of late
paying customers. The Company had a reserve for uncollectible receivables as of December 31, 2009,
2008 and 2007 of $0.4 million, $3.7 million, and $1.0 million, respectively. The increase in
reserve in 2008 primarily relates to SemStream, L. P. The decrease in the reserve during 2009
primarily relates to the write-off of the Semstream reserve and related receivable. See
Note 16(e) for a discussion of the bankruptcy of SemStream, L. P. and related subsidiaries.
F-13
During 2009, 2008 and 2007, Dow Hydrocarbons accounted for 12.2%, 11.0%, and 11.8%,
respectively, of the consolidated revenue of the Company including discontinued operations. As the
Company continues to grow and expand, this relationship between individual customer sales and
consolidated total sales is expected to continue to change. While this customer represents a
significant percentage of revenues, the loss of this customer would not have a material adverse
impact on the Company’s results of operations.
(o) Environmental Costs
Environmental expenditures are expensed or capitalized as appropriate, depending on the nature
of the expenditures and their future economic benefit. Expenditures that related to an existing
condition caused by past operations that do not contribute to current or future revenue generation
are expensed. Liabilities for these expenditures are recorded on an undiscounted basis (or a
discounted basis when the obligation can be settled at fixed and determinable amounts) when
environmental assessments or clean-ups are probable and the costs can be reasonably estimated. For
the years ended December 31, 2009, 2008 and 2007, such expenditures were not significant.
(p) Option Plans
The Company recognizes compensation cost related to all stock-based awards, including stock
options, in its consolidated financial statements in accordance with FASB ASC 718. The Partnership
and CEI each have similar unit or share-based payment plans for employees, which are described
below. Amounts recognized in the consolidated financial statements with respect to these plans are
as follows (in thousands):
| |
|
|
|
|
|
|
|
|
|
|
|
|
| |
|
Years Ended December 31, |
|
| |
|
2009 |
|
|
2008 |
|
|
2007 |
|
Cost of share-based compensation charged to general and administrative expense |
|
$ |
7,075 |
|
|
$ |
9,364 |
|
|
$ |
10,417 |
|
Cost of share-based compensation charged to operating expense |
|
|
1,667 |
|
|
|
1,879 |
|
|
|
1,842 |
|
|
|
|
|
|
|
|
|
|
|
Total amount charged to income before cumulative effect of accounting change |
|
$ |
8,742 |
|
|
$ |
11,243 |
|
|
$ |
12,259 |
|
|
|
|
|
|
|
|
|
|
|
Interest of non-controlling partners in share-based compensation |
|
$ |
3,729 |
|
|
$ |
4,014 |
|
|
$ |
4,214 |
|
|
|
|
|
|
|
|
|
|
|
Amount of related income tax benefit recognized in income |
|
$ |
1,871 |
|
|
$ |
2,685 |
|
|
$ |
2,982 |
|
|
|
|
|
|
|
|
|
|
|
The fair value of each option is estimated on the date of grant using the Black Scholes
option-pricing model as disclosed in Note 11 — Employee Incentive Plans.
(q) Sales of Securities by Subsidiaries
Prior to January 1, 2009, the Company recognized gains and losses in its consolidated
statements of operations resulting from subsidiary sales of additional equity interests, including
exercises of unit options and issuance of CELP limited partnership units, to unrelated parties as
discussed in Note 3(a). Pursuant to new accounting guidance, effective January 1, 2009, gains and
losses related to any subsidiary sales, if any, are reflected as equity transactions in the
Company’s consolidated statements of changes in stockholders’ equity.
(r) Financial Statement Recast for Discontinued Operations and Letter of Credit Fees
The consolidated statements of operations and related earnings per unit for the years ended
December 31, 2008 and 2007 have been recast to segregate income related to assets sold in 2009 to
discontinued operations and reclassify letter of credit fees from purchased gas expense to interest
expense. During 2008 and 2009 the Partnership disposed of assets and the financial activities of
these assets have now been included in discontinued operations in the recast consolidated
statements of operations for all periods presented. See Note 4(a). Additionally, letter of credit
fees of $1.5 million and $1.3 million for the years ended December 31, 2008 and 2007, respectively,
were reclassified from purchased gas expense to interest expense in the consolidated statements of
operations.
(s) Recent Accounting Pronouncements
As a result of the recent credit crisis, FASB ASC 820-10-35-15A was issued in October 2008 and
clarifies the application of FASB ASC 820 in a market that is not active and provides guidance on
how observable market information in a market that is not active should be considered when
measuring fair value, as well as how the use of market quotes should be considered when assessing
the relevance of observable and unobservable data available to measure fair value. FASB ASC
820-10-35-15A is effective upon issuance, for companies that have adopted FASB ASC 820. The Company
has evaluated FASB ASC 820-10-35-15A and determined that this standard has no impact on its results
of operations, cash flows or financial position for this reporting period.
F-14
FASB ASC 260-10-45-60 was issued June 2008 and requires unvested share-based payment awards
that contain nonforfeitable rights to dividends or dividend equivalents to be treated as
participating securities as defined in FASB ASC 260-10-20 and, therefore, included in the earnings
allocation in computing earnings per share under the two-class method described in FASB ASC 260.
FASB ASC 260-10-45-60 is effective for financial statements issued for fiscal years beginning after
December 15, 2008 and interim periods within those years. The Company adopted FASB ASC 260-10-45-60
effective January 1, 2009 and adjusted all prior periods to conform to the requirements.
FASB ASC 805 and FASB ASC 810-10-65-1 were issued December 2007. FASB ASC 805 requires most
identifiable assets, liabilities, non-controlling interests and goodwill acquired in a business
combination to be recorded at “full fair value.” The Statement applies to all business
combinations, including combinations among mutual entities and combinations by contract alone.
Under FASB ASC 805 all business combinations will be accounted for by applying the acquisition
method. FASB ASC 805 is effective for periods beginning on or after December 15, 2008. FASB ASC
810-10-65-1 requires non-controlling interests (previously referred to as minority interests)
to be
treated as a separate component of equity, not as a liability or other item outside of permanent
equity.
Additionally, gains and losses related to any subsidiary sales, if any, are to be
reflected as equity transactions rather than reflected in net income as previously allowed.
FASB ASC 810-10-65-1 was adopted effective January 1, 2009 and comparative period
information has been recast to classify non-controlling interests in equity, and attribute net
income and other comprehensive income to non-controlling interests.
FASB ASC 105 was released July 1, 2009 and intended to improve financial reporting by
identifying a consistent framework, or hierarchy, for selecting accounting principles to be used in
preparing financial statements of non-governmental entities that are presented in conformity with
generally accepted accounting principles (GAAP) in the United States of America. SFAS No. 162 has
been superseded by SFAS No. 168, “The FASB Accounting Standards Codification and the Hierarchy of
Generally Accepted Accounting Principles” (the Codification) released July 1, 2009. The
Codification became the exclusive authoritative reference for non-governmental U.S. GAAP for use in
financial statements issued for interim and annual periods ending after September 15, 2009, except
for Securities and Exchange Commission (SEC) rules and interpretive releases, which are also
authoritative GAAP for SEC registrants. The change establishes non-governmental U.S. GAAP into the
authoritative Codification and guidance that is non-authoritative. The contents of the Codification
carry the same level of authority, eliminating the four-level GAAP hierarchy previously set forth
in Statement 162. The Codification supersedes all existing non-SEC accounting and reporting
standards. All other non-grandfathered, non-SEC accounting literature not included in the
Codification has become non-authoritative. The Company has revised all GAAP references to reflect
the Codification for the year ended December 31, 2009.
FASB ASC 815-10-65-1 was issued March 2008 and requires entities to provide greater
transparency about how and why the entity uses derivative instruments, how the instruments and
related hedged items are accounted for under FASB ASC 815 and how the instruments and related
hedged items affect the financial position, results of operations and cash flows of the entity.
FASB ASC 815-10-65-1 is effective for fiscal years beginning after November 15, 2008. FASB ASC
815-10-65-1 was adopted effective January 1, 2009. Required disclosures were added to Note 13.
In June 2009 FASB ASC 810-10-05-8 was issued. It requires reporting entities to evaluate
former Qualifying Special Purpose Entities or QSPEs for consolidation, changes the approach to
determining a variable interest entity’s (VIE) primary beneficiary from a quantitative assessment
to a qualitative assessment designed to identify a controlling financial interest, and increases
the frequency of required reassessments to determine whether a company is the primary beneficiary
of a VIE. It also clarifies, but does not significantly change, the characteristics that identify a
VIE. This statement requires additional year-end and interim disclosures for public and nonpublic
companies that are similar to the disclosures required by FASB ASC 860-10-65-2. The statement is
effective for fiscal years beginning after November 15, 2009 and for subsequent interim and annual
reporting periods. The Company does not expect this statement to have a significant impact to its
financial statements.
FASB ASC 855 was issued June 2009 and is effective for interim or annual financial periods
ending after June 15, 2009 and addresses accounting and disclosure requirements related to
subsequent events. The statement requires management to evaluate subsequent events through the date
the financial statements are issued. Companies are required to disclose the date through which
subsequent events have been evaluated. The Company has taken this statement into consideration in
Note 19.
FASB ASC 825-10-65-1 requires publicly traded companies to disclose the fair value of
financial instruments within the scope of FASB ASC 825 in interim financial statements, adding to
the current requirement to make those disclosures in annual financial statements. FASB ASC
825-10-65-1 is effective for interim and annual periods ending after June 15, 2009. The Company has
added the required footnote disclosure in interim financial statements.
F-15
(3) Public Offerings of Units by CELP and Certain Provisions of the Partnership Agreement
(a) Issuance of Common Units
On December 19, 2007, the Partnership issued 1,800,000 common units representing limited
partner interests in the Partnership at a price of $33.28 per unit for net proceeds of $57.6
million. In addition, CEI made a general partner contribution of $1.2 million in connection with
the issuance to maintain its 2% general partner interest. As a result of this offering, the Company
recognized a gain of $7.5 million due to the Partnership issuing additional units at prices per
unit greater than the Company’s equivalent carrying value.
On April 9, 2008, the Partnership issued 3,333,334 common units in private offering at $30.00
per unit, which represented an approximate 7% discount from the market price. Net proceeds from the
issuance, including our general partner contribution less expenses associated with the issuance,
were approximately $102.0 million. As a result of this offering, the Company recognized a gain of
$14.7 million due to the Partnership issuing additional units at prices per unit greater than the
Company’s equivalent carrying value.
(b) Conversion of Subordinated and Senior Subordinated Series C Units
The subordination period for the Partnership’s subordinated units ended and the remaining
4,668,000 subordinated units converted into common units representing limited partner interests of
the Partnership effective February 16, 2008. We own all 4,668,000 of the units that converted.
On June 29, 2006, the Partnership issued an aggregate of 12,829,650 senior subordinated series
C units representing limited partner interests of the units representing limited partner interest
of all partnership in a private equity offering and proceeds of approximately $359.3 million. The
senior subordinated series C units of the Partnership converted into common units representing
limited partner interests of the Partnership effective February 16, 2008. The Company owns
6,414,830 of the senior subordinated series C units that converted to common units. The senior
subordinated series C units were not entitled to distributions of available cash from the
Partnership until conversion.
(c) Senior Subordinated Series D Units
On March 23, 2007, the Partnership issued an aggregate of 3,875,340 senior subordinated series
D units representing limited partner interests of the Partnership in a private offering. These
senior subordinated series D units converted into common units representing limited partner
interests of the Partnership on March 23, 2009. The Partnership did not make distributions of
available cash from operating surplus, as defined in the partnership agreement, of at least $0.62
per unit on each outstanding common units for the quarter ending December 31, 2008, therefore each
senior subordinated series D unit converted into 1.05 common units for a total issuance of
4,069,106 common units.
(d) Cash Distributions
Unless
restricted by the terms of the Partnership’s credit facility, the Partnership must make distributions
of 100.0% of available cash, as defined in the partnership agreement, within 45 days following the
end of each quarter commencing with the quarter ending on March 31, 2003. Distributions will
generally be made 98.0% to the common and subordinated unitholders and 2.0% to the general partner,
subject to the payment of incentive distributions as described below to the extent that certain
target levels of cash distributions are achieved.
Under the quarterly incentive distribution provisions, generally its general partner is
entitled to 13.0% of amounts the Partnership distributes in excess of $0.25 per unit, 23.0% of the
amounts the Partnership distributes in excess of $0.3125 per unit and 48.0% of amounts the
Partnership distributes in excess of $0.375 per unit. No incentive distributions were earned by the
general partner for the year ended December 31, 2009. Incentive distributions totaling $30.8
million, and $24.8 million were earned by the Company for the years ended December 31, 2008 and
2007, respectively. The Partnership paid annual per common unit distributions of $0.25, $2.36, and
$2.28 in the years ended December 31, 2009, 2008 and 2007, respectively.
F-16
(e) Allocation of Partnership Income
Net income is allocated to Crosstex Energy GP, L.P., a wholly-owned subsidiary of the Company,
as the Partnership’s general partner in an amount equal to its incentive distributions as described
in Note 3(d) above. The general partner’s share of the Partnership’s net income is reduced by
stock-based compensation expense attributed to the Company’s stock options and restricted
stock awarded to officers and employees of the Partnership. The remaining net income after
incentive distributions and Company-related stock-based compensation is allocated pro rata between
the 2.0% general partner interest, the subordinated units (excluding senior subordinated units),
and the common units. The following table reflects the Company’s general partner share of the
Partnership’s net income (in thousands):
| |
|
|
|
|
|
|
|
|
|
|
|
|
| |
|
Year Ended December 31, |
|
| |
|
2009 |
|
|
2008 |
|
|
2007 |
|
Income allocation for incentive distributions |
|
$ |
¾ |
|
|
$ |
30,772 |
|
|
$ |
24,802 |
|
Stock-based compensation attributable to CEI’s stock options and restricted shares |
|
|
(2,966 |
) |
|
|
(4,665 |
) |
|
|
(5,441 |
) |
2.0% general partner interest in net income (loss) |
|
|
2,147 |
|
|
|
308 |
|
|
|
(109 |
) |
|
|
|
|
|
|
|
|
|
|
General partner share of net income |
|
$ |
(819 |
) |
|
$ |
26,415 |
|
|
$ |
19,252 |
|
|
|
|
|
|
|
|
|
|
|
The Company also owned limited partner common units, limited partner subordinated units and
limited partner senior subordinated series C units in the Partnership. The Company’s share of the
Partnership’s net income attributable to its limited partner common and subordinated units was a
net income of $34.8 million and $5.9 million for the years ended December 31, 2009 and 2008
respectively, and a net loss of $2.0 million for the year ended December 31, 2007.
(4) Discontinued Operations, Impairments and Dispositions
(a) Discontinued Operations
The Partnership sold its Midstream assets in Alabama, Mississippi and south Texas for $217.6
million in August 2009. Sales proceeds, net of transaction costs and other obligations associated
with the sale, of $212.0 million were used to repay long-term indebtedness and the Partnership
recognized a gain on sale of $97.2 million. On October 1, 2009, the Partnership sold its Treating
assets for net proceeds of $265.4 million (after final purchase price adjustments). Sales
proceeds, net of transaction costs and other obligations associated with the sale, of $258.1
million were used to repay long-term indebtedness and the Partnership recognized a gain on sale of
$86.3 million.
In November 2008, the Partnership disposed of its undivided 12.4% interest in the Seminole gas
processing plant to a third party for $85.0 million and recognized a gain of $49.8 million. This
asset was previously presented in the Partnership’s Treating segment and its values are included in
the Treating revenues and net income from discontinued operations presented in the years ended
December 31, 2008 and 2007 in the table below.
The revenues, operating expenses, general and administrative expenses associated directly with
the sold assets, depreciation and amortization expense, Treating inventory impairment of $1.0
million during 2009, allocated Texas margin tax and an allocated interest expense related to the
operations of the sold assets have been segregated from continuing operations and reported as
discontinued operations for all periods. Interest expense of $34.4 million, $29.2 million and $32.7 million
for the years ended December 31, 2009, 2008 and 2007, respectively, was allocated to
discontinued operations related to the debt repaid from the proceeds from the asset
dispositions using average historical interest rates for each of the three years.
The interest allocation for 2009 also included make-whole interest payments and the write-off of unamortized debt
issue costs related to the debt repaid. No corporate office general and administrative expenses
have been allocated to income from discontinued operations. Following are revenues and income from
discontinued operations (in thousands):
| |
|
|
|
|
|
|
|
|
|
|
|
|
| |
|
Years Ended December 31, |
|
| |
|
2009 |
|
|
2008 |
|
|
2007 |
|
Midstream revenues |
|
$ |
368,142 |
|
|
$ |
1,766,101 |
|
|
$ |
1,411,092 |
|
Treating revenues |
|
$ |
45,534 |
|
|
$ |
73,492 |
|
|
$ |
65,025 |
|
Income (loss) from discontinued operations, net of tax |
|
$ |
(1,519 |
) |
|
$ |
21,466 |
|
|
$ |
26,817 |
|
Gain from sale of discontinued operations, net of tax |
|
$ |
159,961 |
|
|
$ |
42,753 |
|
|
$ |
¾ |
|
(b) Other Dispositions
In November 2008, the Partnership sold a contract right for firm transportation capacity on a
third party pipeline to an unaffiliated third party for $20.0 million. The entire amount of such
proceeds is reflected in other income in the consolidated statement of operations.
F-17
(c) Long-Lived Asset Impairments
Impairments of $2.9 million and $24.6 million were recorded in the year ended December 31,
2009 and 2008, respectively related to long-lived assets. During 2009, impairments totaling $2.9
million were taken on the Bear Creek processing plant and the Vermillion treating plant to bring
the fair value of the plants to a marketable value for these idle assets. The impairment expense
during 2008 was:
| |
• |
|
$17.8 million related to the Blue Water gas processing plant located in south Louisiana
— The impairment on the Partnership’s 59.27% interest in the Blue Water gas processing
plant was recognized because the pipeline company which owns the offshore Blue Water system
and supplies gas to the Partnership’s Blue Water plant reversed the flow of the gas on its
pipeline in early January 2009 thereby removing access to all the gas processed at the Blue
Water plant from the Blue Water offshore system. At this time, the Partnership has not
found an alternative source of new gas for the Blue Water plant so the plant ceased
operations in January 2009. An impairment of $17.8 million was recognized for the carrying
amount of the plant in excess of the estimated fair value of the plant as of December 31,
2008. The fair value of the Blue Water plant was determined by using the market and cost
approach for valuing the plant. The income approach was not considered because the plant is
not in operation. |
| |
• |
|
$4.1 million related to leasehold improvements — The Partnership had planned to
relocate its corporate office during 2008 to a larger office facility. The Partnership had
leased office space and was close to completing the renovation of this office space when
the global economic decline began impacting its operations in October 2008. On December 31,
2008, the decision was made to cancel the new office lease and not relocate the corporate
offices from its existing office location. The impairment relates to the leasehold
improvements on the office space for the cancelled lease. |
| |
• |
|
$2.6 million related to the Arkoma gathering system — The impairment on the Arkoma
gathering system was recognized because the Partnership sold this asset in February 2009
for approximately $10.7 million and the carrying amount of the asset exceeded the sale
price by approximately $2.6 million. |
(5) Goodwill
Goodwill on the Company’s books as of December 31, 2008 related solely to the Treating assets
which were sold in October 2009. In the fourth quarter of 2008, the Company determined that the
carrying amount of goodwill attributable to the Midstream segment was impaired because of the
significant decline in its Midstream operations. As a result, the Company recognized an impairment
loss of $5.7 million in the Midstream segment for the year ended December 31, 2008.
(6) Investment in Limited Partnerships and Note Receivable
The Partnership owns a majority interest in Crosstex Denton County Joint Venture (CDC) and
consolidates its investment in CDC pursuant to FASB ASC 810-10-05-8. The Partnership manages the
business affairs of CDC. The other joint venture partner (the CDC partner) is an unrelated third
party who owns and operates a natural gas field located in Denton County, Texas.
In connection with the formation of CDC, the Partnership agreed to loan the CDC Partner up to
$1.5 million for their initial capital contribution. The loan bears interest at an annual rate of
prime plus 2.0%. CDC makes payments directly to the Partnership attributable to CDC Partner’s
majority share of distributable cash flow to repay the loan. The balance remaining on the note of
less than $0.1 million is included in current notes receivable as of December 31, 2009. The note
was completely repaid in February 2010.
(7) Long-Term Debt
As of December 31, 2009 and 2008, long-term debt consisted of the following (in thousands):
| |
|
|
|
|
|
|
|
|
| |
|
2009 |
|
|
2008 |
|
Bank credit facility, interest based on Prime or LIBOR plus an applicable margin, interest
rates at December 31, 2009 and 2008 were 6.75% and 3.9%, respectively |
|
$ |
529,614 |
|
|
$ |
784,000 |
|
Senior secured notes (including PIK notes as defined below of $9.5 million), weighted average
interest rates at December 31, 2009 and 2008 of 10.5% and 8.0%, respectively |
|
|
326,034 |
|
|
|
479,706 |
|
Series B secured note assumed in the Eunice transaction, which bears interest at the rate of 9.5% |
|
|
18,054 |
|
|
|
— |
|
|
|
|
|
|
|
|
|
|
|
873,702 |
|
|
|
1,263,706 |
|
Less current portion |
|
|
(28,602 |
) |
|
|
(9,412 |
) |
|
|
|
|
|
|
|
Debt classified as long-term |
|
$ |
845,100 |
|
|
$ |
1,254,294 |
|
|
|
|
|
|
|
|
F-18
Maturities. Maturities for the long-term debt as of December 31, 2009 are as follows (in
thousands):
| |
|
|
|
|
2010 |
|
|
28,602 |
|
2011 |
|
|
578,197 |
|
2012 |
|
|
93,000 |
|
2013 |
|
|
83,630 |
|
2014 |
|
|
67,380 |
|
Thereafter |
|
|
22,893 |
|
The balance of the bank credit facility and senior secured notes was paid in full February 10,
2010 with the proceeds from the new credit facility and the senior unsecured notes.
Credit Facility. As of December 31, 2009, the Partnership had a bank credit facility with a
borrowing capacity of $859.9 million that matures in June 2011. As of December 31, 2009, $683.0
million was outstanding under the bank credit facility, including $153.4 million of letters of
credit, leaving approximately $176.9 million available for future borrowing.
New Credit Facility. In February 2010, the Partnership amended and restated its existing
secured bank credit facility with a new syndicated secured bank credit facility (the “new credit
facility”). The new credit facility has a borrowing capacity of $420.0 million and matures in
February 2014. Net proceeds from the new credit facility along with net proceeds from the senior
unsecured notes discussed under “Senior Unsecured Notes” below were used to, among other things,
retire the Partnership’s existing indebtedness.
The new credit facility will be guaranteed by substantially all of the Partnership’s
subsidiaries. Obligations under the new credit facility will be secured by first priority liens on
substantially all of the Partnership’s assets and those of the guarantors, including all material
pipeline, gas gathering and processing assets, all material working capital assets and a pledge of
all of the Partnership’s equity interests in substantially all of its subsidiaries.
The Partnership may prepay all loans under the new credit facility at any time without premium
or penalty (other than customary LIBOR breakage costs), subject to certain notice requirements. The
new credit facility will require mandatory prepayments of amounts outstanding thereunder with the
net proceeds of certain asset sales, extraordinary receipts, equity issuances and debt incurrences,
but these mandatory prepayments will not require any reduction of the lenders’ commitments under
the new credit facility.
Under the new credit facility, borrowings will bear interest at the Partnership’s option at
the Eurodollar Rate (the British Bankers Association LIBOR Rate) plus an applicable margin or the
Base Rate (the highest of the Federal Funds Rate plus 0.50%, the 30-day Eurodollar Rate plus 1.0%,
or the administrative agent’s prime rate) plus an applicable margin. The Partnership will pay a per
annum fee on all letters of credit issued under the new credit facility, and a commitment fee of
0.50% per annum on the unused availability under the new credit facility. The letter of credit fee
and the applicable margins for its interest rate will vary quarterly based on the leverage ratio
(as defined in the new credit facility, being generally computed as the ratio of total funded debt
to consolidated earnings before interest, taxes, depreciation, amortization and certain other
non-cash charges) and will be as follows:
| |
|
|
|
|
|
|
|
|
|
|
|
|
| |
|
|
|
|
|
Eurodollar Rate |
|
|
Letter of Credit |
|
| Leverage Ratio |
|
Base Rate Loans |
|
|
Loans |
|
|
Fees |
|
Greater than or equal to 5.00 to 1.00 |
|
|
3.25 |
% |
|
|
4.25 |
% |
|
|
4.25 |
% |
Greater than or equal to 4.50 to 1.00 and less than 5.00 to 1.00 |
|
|
3.00 |
% |
|
|
4.00 |
% |
|
|
4.00 |
% |
Greater than or equal to 4.00 to 1.00 and less than 4.50 to 1.00 |
|
|
2.75 |
% |
|
|
3.75 |
% |
|
|
3.75 |
% |
Greater than or equal to 3.50 to 1.00 and less than 4.00 to 1.00 |
|
|
2.50 |
% |
|
|
3.50 |
% |
|
|
3.50 |
% |
Less than 3.50 to 1.00 |
|
|
2.25 |
% |
|
|
3.25 |
% |
|
|
3.25 |
% |
Based on the forecasted leverage ratio for 2010, the Partnership expects the applicable margin
for the interest rate and letter of credit fee to be at the higher end of these ranges. The new
credit facility will not have a floor for the Base Rate or the Eurodollar Rate.
The new credit facility includes financial covenants that will be tested on a quarterly basis,
based on the rolling four-quarter period that ends on the last day of each fiscal quarter (except
for the interest coverage ratio, which builds to a four-quarter test during 2010).
The maximum permitted leverage ratio will be as follows:
| |
• |
|
5.75 to 1.00 for the fiscal quarters ending March 31, 2010 and June 30, 2010; |
| |
• |
|
5.50 to 1.00 for the fiscal quarter ending September 30, 2010; |
F-19
| |
• |
|
5.25 to 1.00 for the fiscal quarter ending December 31, 2010; |
| |
• |
|
5.00 to 1.00 for the fiscal quarter ending March 31, 2011; |
| |
• |
|
4.75 to 1.00 for the fiscal quarter ending June 30, 2011; and |
| |
• |
|
4.50 to 1.00 for the fiscal quarter ending September 30, 2011 and each fiscal quarter
thereafter. |
The maximum permitted senior leverage ratio (as defined in the new credit facility, but
generally computed as the ratio of total secured funded debt to consolidated earnings before
interest, taxes, depreciation, amortization and certain other non-cash charges), will be 2.50 to
1.00.
The minimum consolidated interest coverage ratio (as defined in the new credit facility, but
generally computed as the ratio of consolidated earnings before interest, taxes, depreciation,
amortization and certain other non-cash charges to consolidated interest charges) will be as
follows:
| |
• |
|
1.50 to 1.00 for the fiscal quarter ending March 31, 2010; |
| |
• |
|
1.75 to 1.00 for the fiscal quarters ending June 30, 2010 through December 31, 2010; |
| |
• |
|
2.00 to 1.00 for the fiscal quarter ending March 31, 2011; |
| |
• |
|
2.25 to 1.00 for the fiscal quarter ending June 30, 2011; and |
| |
• |
|
2.50 to 1.00 for the fiscal quarter ending September 30, 2011 and each fiscal quarter
thereafter. |
In addition, the new credit facility will contain various covenants that, among other
restrictions, will limit the Partnership’s ability to:
| |
• |
|
incur or assume indebtedness; |
| |
• |
|
engage in mergers or acquisitions; |
| |
• |
|
sell, transfer, assign or convey assets, |
| |
• |
|
repurchase its equity, make distributions and certain other restricted payments; |
| |
• |
|
change the nature of its business; |
| |
• |
|
engage in transactions with affiliates. |
| |
• |
|
enter into certain burdensome agreements; |
| |
• |
|
make certain amendments to the omnibus agreement or its subsidiaries’ organizational
documents; |
| |
• |
|
prepay the senior unsecured notes and certain other indebtedness; and |
| |
• |
|
enter into certain hedging contracts. |
The new credit facility will permit the Partnership to make quarterly distributions to
unitholders so long as no default exists under the new credit facility.
F-20
Each of the following will be an event of default under the new credit facility:
| |
• |
|
failure to pay any principal, interest, fees, expenses or other amounts when due; |
| |
• |
|
failure to meet the quarterly financial covenants; |
| |
• |
|
failure to observe any other agreement, obligation, or covenant in the new credit
facility or any related loan document, subject to cure periods for certain failures; |
| |
• |
|
the failure of any representation or warranty to be materially true and correct when
made; |
| |
• |
|
the Partnership or any of its subsidiaries’ default under other indebtedness that
exceeds a threshold amount; |
| |
• |
|
judgments against the Partnership or any of its material subsidiaries, in excess of a
threshold amount; |
| |
• |
|
certain ERISA events involving the Partnership or any of its material subsidiaries, in
excess of a threshold amount; |
| |
• |
|
bankruptcy or other insolvency events involving the Partnership or any of its material
subsidiaries; and |
| |
• |
|
a change in control (as defined in the new credit facility). |
If an event of default relating to
bankruptcy or other insolvency events occurs,
all indebtedness under the new credit facility will immediately become due and payable. If
any other event of default exists under the new credit facility, the lenders may accelerate the maturity
of the obligations outstanding under the new credit facility and exercise other rights and remedies.
In addition, if any event of default exists under the new credit facility, the lenders may commence foreclosure
or other actions against the collateral.
If any default occurs under the new credit facility, or if the Partnership is unable to make
any of the representations and warranties in the new credit facility, the Partnership will be
unable to borrow funds or have letters of credit issued under the new credit facility.
The Partnership will be subject to interest rate risk on its new credit facility and may enter
into interest rate swaps to reduce this risk.
The Partnership expects to be in compliance with the covenants in the new credit facility for
the next twelve months.
Senior Secured Notes. The Partnership entered into a master shelf agreement with an
institutional lender in 2003 that was amended in subsequent years to increase availability under
the agreement, pursuant to which it issued the following senior secured notes (dollars in
thousands):
| |
|
|
|
|
|
|
|
|
| Month Issued |
|
Amount |
|
|
Interest Rate |
|
June 2003 |
|
$ |
1,607 |
|
|
|
9.45 |
% |
July 2003 |
|
|
1,000 |
|
|
|
9.38 |
% |
June 2004 |
|
|
50,629 |
|
|
|
9.46 |
% |
November 2005 |
|
|
57,380 |
|
|
|
8.73 |
% |
March 2006 |
|
|
40,504 |
|
|
|
8.82 |
% |
July 2006 |
|
|
165,390 |
|
|
|
9.46 |
% |
|
|
|
|
|
|
|
|
Total Outstanding |
|
|
316,510 |
|
|
|
|
|
PIK Notes Payable (1) |
|
|
9,524 |
|
|
|
|
|
|
|
|
|
|
|
|
|
Balance as of December 31, 2009 (2) |
|
$ |
326,034 |
|
|
|
|
|
|
|
|
|
|
|
|
|
| |
|
|
| (1) |
|
The senior secured notes began accruing additional interest of 1.25%
per annum in February 2009 (the “PIK notes”) in the form of an
increase in the principal amounts unless our leverage ratio is less
than 4.25 to 1.00 as of the end of any fiscal quarter. |
| |
| (2) |
|
The balance of senior secured notes was paid in full on February 10, 2010. |
Series B Secured Note. On October 20, 2009, the Partnership acquired Eunice natural gas
liquids processing plant and fractionation facility which includes $18.1 million in series B
secured note. This note bears an interest rate of 9.5%. Payments
including interest of $12.2 million and $7.4 million are due in 2010 and 2011, respectively.
F-21
Senior Unsecured
Notes. On February 10, 2010, the Partnership issued $725.0 million in
aggregate principal amount of 8.875% senior unsecured notes (the “notes”) due on February 15, 2018
at an issue price of 97.907% to yield 9.25% to maturity. Net proceeds from the sale of the notes
of $689.7 million (net of transaction costs and original issue discount), together with borrowings
under the credit facility discussed above, were used to repay in full amounts outstanding under the
existing bank credit facility and senior secured notes and to pay related fees, costs and expenses,
including the settlement of interest rate swaps associated with the existing credit facility. The
notes are unsecured and unconditionally guaranteed on a senior basis by certain of our direct and
indirect subsidiaries, including all of the Partnership’s current subsidiaries other than Crosstex
LIG, LLC and Crosstex Tuscaloosa, LLC, our Louisiana regulated entities, and Crosstex DC Gathering,
J.V. Interest payments will be paid semi-annually in arrears starting on August 15, 2010.
The indenture governing the notes contains covenants that, among other things, will limit the
Partnership’s ability and the ability of certain of the Partnership’s subsidiaries to:
| |
• |
|
sell assets including equity interests in its subsidiaries; |
| |
• |
|
pay distributions on, redeem or repurchase or units or redeem or repurchase its subordinated
debt; |
| |
• |
|
incur or guaranteed additional indebtedness or issue preferred units; |
| |
• |
|
create or incur certain liens; |
| |
• |
|
enter into agreements that restrict distributions or other payments from its restricted
subsidiaries to the Partnership; |
| |
• |
|
consolidate, merge or transfer all or substantially all of its assets; |
| |
• |
|
engage in transactions with affiliates; |
| |
• |
|
create unrestricted subsidiaries; |
| |
• |
|
enter into sale and leaseback transactions; or |
| |
• |
|
engage in certain business activities. |
If the notes achieve an investment grade rating from each of Moody’s Investors Service, Inc.
and Standard & Poor’s Ratings Services, many of these covenants will terminate.
The Partnership may redeem up to 35% of the notes at any time prior to February 15, 2013 with
the cash proceeds from equity offerings at a redemption price of 108.875%, provided that:
| |
• |
|
at least 65% of the aggregate principal amount of the senior notes remains outstanding
immediately after the occurrence of such redemption; and |
| |
• |
|
the redemption occurs within 120 days of the date of the closing of the equity offering. |
The Partnership has the option to redeem all or a portion of the notes at any time on or after
February 15, 2014, at a redemption price (expressed as a percentage of principal amount) of:
| |
• |
|
100.000% in 2016 and thereafter. |
F-22
Prior to February 15, 2014, the Partnership may redeem the notes, in whole or in part, at a
“make-whole” redemption price.
Each of the following will be an event of default under the indenture:
| |
• |
|
failure to pay any principal or interest when due; |
| |
• |
|
failure to observe any other agreement, obligation, or other covenant in the indenture,
subject to the cure periods for certain failures; and |
| |
• |
|
the Partnership or any of its subsidiaries’ default under other indebtedness that exceeds a
certain threshold amount; |
| |
• |
|
failures by the Partnership or any of its subsidiaries to pay final judgments that exceed a
certain threshold amount; and |
| |
• |
|
bankruptcy or other insolvency events involving the Partnership or any of its material
subsidiaries. |
If an event of
default relating to bankruptcy or other insolvency events occurs,
the senior unsecured notes will immediately become due and payable. If any other event
of default exists under the indenture, the trustee under the indenture or the holders of
the senior unsecured notes may accelerate the maturity of the senior unsecured notes and
exercise other rights and remedies.
(8) Other Long-Term Liabilities
The Partnership entered into 9 and 10-year capital leases for certain compressor equipment.
Assets under capital leases are summarized as follows (in thousands):
| |
|
|
|
|
|
|
|
|
| |
|
Years Ended |
|
| |
|
December 31, |
|
| |
|
2009 |
|
|
2008 |
|
Compressor equipment |
|
$ |
27,192 |
|
|
$ |
28,890 |
|
Less: Accumulated amortization |
|
|
(3,655 |
) |
|
|
(1,523 |
) |
|
|
|
|
|
|
|
Net assets under capital lease |
|
$ |
23,537 |
|
|
$ |
27,367 |
|
|
|
|
|
|
|
|
The following are the minimum lease payments to be made in each of the following years
indicated for the capital lease in effect as of December 31, 2009 (in thousands):
| |
|
|
|
|
| Fiscal Year |
|
|
|
|
2010 through 2014 |
|
$ |
15,200 |
|
Thereafter |
|
|
12,746 |
|
Less: Interest |
|
|
(4,147 |
) |
|
|
|
|
Net minimum lease payments under capital lease |
|
|
23,799 |
|
Less: Current portion of net minimum lease payments |
|
|
(3,002 |
) |
|
|
|
|
Long-term portion of net minimum lease payments |
|
$ |
20,797 |
|
|
|
|
|
F-23
(9) Income Taxes
The Company provides for income taxes using the liability method. Accordingly, deferred taxes
are recorded for the differences between the tax and book basis that will reverse in future periods
(in thousands).
| |
|
|
|
|
|
|
|
|
|
|
|
|
| |
|
2009 |
|
|
2008 |
|
|
2007 |
|
Current tax provision |
|
$ |
3,394 |
|
|
$ |
2,593 |
|
|
$ |
711 |
|
Deferred tax provision |
|
|
15,229 |
|
|
|
7,022 |
|
|
|
10,338 |
|
|
|
|
|
|
|
|
|
|
|
|
|
$ |
18,623 |
|
|
$ |
9,615 |
|
|
$ |
11,049 |
|
|
|
|
|
|
|
|
|
|
|
A reconciliation of the provision for income taxes is as follows (in thousands):
| |
|
|
|
|
|
|
|
|
|
|
|
|
| |
|
2009 |
|
|
2008 |
|
|
2007 |
|
Federal income tax at statutory rate (35)% |
|
$ |
11,993 |
|
|
$ |
11,847 |
|
|
$ |
8,129 |
|
State income taxes, net |
|
|
709 |
|
|
|
1,329 |
|
|
|
682 |
|
Tax basis adjustment in Partnership related to issuance of common units |
|
|
4,475 |
|
|
|
(5,209 |
) |
|
|
2,118 |
|
Non-deductible expenses |
|
|
235 |
|
|
|
510 |
|
|
|
144 |
|
Other |
|
|
1,211 |
|
|
|
1,138 |
|
|
|
(24 |
) |
|
|
|
|
|
|
|
|
|
|
Tax provision |
|
$ |
18,623 |
|
|
$ |
9,615 |
|
|
$ |
11,049 |
|
|
|
|
|
|
|
|
|
|
|
The following table summarizes the components of the income tax provision (in thousands):
| |
|
|
|
|
|
|
|
|
|
|
|
|
| |
|
Years Ended December 31, |
|
| |
|
2009 |
|
|
2008 |
|
|
2007 |
|
From continuing operations |
|
$ |
(6,020 |
) |
|
$ |
(1,375 |
) |
|
$ |
6,319 |
|
From discontinued operations |
|
|
24,643 |
|
|
|
10,990 |
|
|
|
4,730 |
|
|
|
|
|
|
|
|
|
|
|
Total tax provision |
|
$ |
18,623 |
|
|
$ |
9,615 |
|
|
$ |
11,049 |
|
|
|
|
|
|
|
|
|
|
|
The principal components of the Company’s net deferred tax liability are as follows (in
thousands):
| |
|
|
|
|
|
|
|
|
| |
|
Years Ended December 31, |
|
| |
|
2009 |
|
|
2008 |
|
Deferred income tax assets: |
|
|
|
|
|
|
|
|
Net operating loss carryforward — current |
|
$ |
— |
|
|
$ |
41 |
|
Net operating loss carryforward — non-current |
|
|
18,148 |
|
|
|
40,310 |
|
Investment in the Partnership |
|
|
8,013 |
|
|
|
3,892 |
|
Other comprehensive income |
|
|
361 |
|
|
|
— |
|
Alternative minimum tax carry forward (AMT) |
|
|
1,241 |
|
|
|
41 |
|
|
|
|
|
|
|
|
|
|
|
27,763 |
|
|
|
44,284 |
|
Less: valuation allowance |
|
|
(8,013 |
) |
|
|
(3,892 |
) |
|
|
|
|
|
|
|
|
|
|
19,750 |
|
|
|
40,392 |
|
|
|
|
|
|
|
|
Deferred income tax liabilities: |
|
|
|
|
|
|
|
|
Property, plant, equipment, and intangible assets — current |
|
|
(501 |
) |
|
|
(501 |
) |
Property, plant, equipment, and intangible assets — non-current |
|
|
(114,524 |
) |
|
|
(121,457 |
) |
Other comprehensive income |
|
|
— |
|
|
|
(367 |
) |
Other |
|
|
(497 |
) |
|
|
(524 |
) |
|
|
|
|
|
|
|
|
|
|
(115,522 |
) |
|
|
(122,849 |
) |
|
|
|
|
|
|
|
Net deferred tax liability |
|
$ |
(95,772 |
) |
|
$ |
(82,457 |
) |
|
|
|
|
|
|
|
At December 31, 2009, the Company had a net operating loss carryforward of approximately $47.5
million that expires from 2026 through 2028. The Company also has various state net operating loss
carryforwards of approximately $30.1 million which will begin expiring in 2021. Management believes
that it is more likely than not that the future results of operations will generate sufficient
taxable income to utilize these net operating loss carryforwards before they expire. Although the
Company has generated net operating losses in the past, the Company expects to have future taxable
income from its investment in the Partnership, generated by the remedial allocations of income
among the unitholders and the income generated by operations.
Deferred tax liabilities relating to property, plant, equipment and intangible assets
represent, primarily, the Company’s share of the book basis in excess of tax basis for assets
inside of the Partnership. The Company has also recorded a deferred tax asset in the amount of $8.0
million relating to the difference between its book and tax basis of its investment in the
Partnership. Because the Company can only realize this deferred tax asset upon the liquidation of
the Partnership and to the extent of capital gains, the Company has provided a full valuation
allowance against this deferred tax asset. The deferred tax asset and the related valuation
allowance increased $4.1 million in 2009 due to the conversion of the Partnership’s senior
subordinated series D units to common units.
F-24
Effective as of January 1, 2007, the Company is subject to the Texas margin tax. The new tax
law had no significant impact on the Company’s 2009 net deferred tax liability.
The Company adopted the provisions of FASB ASC 740-10-25-16 on January 1, 2007. A
reconciliation of the beginning and ending amount of the unrecognized tax benefits is as follows
(In thousands):
| |
|
|
|
|
Balance as of December 31, 2007 |
|
$ |
— |
|
Increases related to prior year tax positions |
|
|
569 |
|
Increases related to current year tax positions |
|
|
451 |
|
|
|
|
|
Balance as of December 31, 2008 |
|
|
1,020 |
|
Increases related to prior year tax positions |
|
|
242 |
|
Increases related to current year tax positions |
|
|
704 |
|
|
|
|
|
Balance as of December 31, 2009 |
|
$ |
1,966 |
|
|
|
|
|
Unrecognized tax benefit of $2.0 million, if recognized, would affect the effective tax rate.
Resolution of this uncertain issue is expected in 2010. In the event additional interest and
penalties are incurred prior to resolution, per company policy, such penalties and interest will be
recorded to income tax expense.
At December 31, 2009, tax years 2006 through 2009 remain subject to examination by the
Internal Revenue Services and tax years 2005 through 2009 remain subject to examination by various
state taxing authorities.
(10) Retirement Plans
The Company sponsors a single employer 401(k) plan for employees who become eligible upon the
date of hire. The Partnership makes contributions at each compensation calculation period based on
the annual discretionary contribution rate. Contributions to the plan for the years ended December
31, 2009, 2008 and 2007 were $3.1 million, $3.4 million and $1.6 million, respectively.
(11) Employee Incentive Plans
(a) Long-Term Incentive Plan
In December 2002, the Partnership adopted a long-term incentive plan for its employees,
directors, and affiliates who perform services for the Partnership. The plan currently permits the
grant of awards covering an aggregate of 5,600,000 common unit options and restricted units. The
plan is administered by the compensation committee of the Partnership’s board of directors. The
units issued upon exercise or vesting are newly issued units.
(b) Partnership Restricted Units
A restricted unit is a “phantom” unit that entitles the grantee to receive a common unit upon
the vesting of the phantom unit, or in the discretion of the compensation committee, cash
equivalent to the value of a common unit. In addition, the restricted units will become exercisable
upon a change of control of the Partnership, its general partner, or its general partner’s general
partner.
The restricted units are intended to serve as a means of incentive compensation for
performance and not primarily as an opportunity to participate in the equity appreciation of the
common units. Therefore, plan participants will not pay any consideration for the common units they
receive and the Partnership will receive no remuneration for the units. The restricted units
include a tandem award that entitles the participant to receive cash payments equal to the cash
distributions made by the Partnership with respect to its outstanding common units until the
restriction period is terminated or the restricted units are forfeited. The restricted units
granted in 2009, 2008 and 2007 generally cliff vest after three years of service.
F-25
The restricted units are valued at their fair value at the date of grant which is equal to the
market value of common units on such date. A summary of the restricted unit activity for the year
ended December 31, 2009 is provided below:
| |
|
|
|
|
|
|
|
|
| |
|
|
|
|
|
Weighted |
|
| |
|
|
|
|
|
Average |
|
| |
|
Number of |
|
|
Grant-Date |
|
| Crosstex Energy, L.P. Restricted Units: |
|
Units |
|
|
Fair Value |
|
Non-vested, beginning of period |
|
|
544,067 |
|
|
$ |
31.90 |
|
Granted |
|
|
1,971,127 |
|
|
|
3.92 |
|
Vested* |
|
|
(239,719 |
) |
|
|
17.34 |
|
Forfeited |
|
|
(187,470 |
) |
|
|
10.64 |
|
|
|
|
|
|
|
|
Non-vested, end of period |
|
|
2,088,005 |
|
|
$ |
7.31 |
|
|
|
|
|
|
|
|
Aggregate intrinsic value, end of period (in thousands) |
|
$ |
17,957 |
|
|
|
|
|
|
|
|
|
|
|
|
|
| |
|
|
| * |
|
Vested units include 56,067 units withheld for payroll taxes paid on
behalf of employees. |
The Partnership issued performance-based restricted units in 2007 and 2008 to executive
officers. The minimum level of performance-based awards is included in restricted units outstanding
and is included in the current share-based compensation cost calculations at December 31, 2009. The
achievement of greater than the minimum performance targets in the current business environment is
less than probable. All performance-based awards are subject to reevaluation and adjustment until
the restricted units vest.
The Partnership awarded 803,632 restricted unit grants during the year ended December 31, 2009
to certain of the management team. Half of these units vest January 1, 2010. The remaining fifty
percent of the units are performance-based awards that vest January 1, 2010 if the Partnership
achieves certain performance metrics. As of December 31, 2009, the Partnership met the performance
objectives stated in the grant with adjustments deemed necessary due to the disposition of assets
in 2009. The performance-based units are shown in the balance of outstanding restricted units and
included in the current share-based compensation calculations for the year ended December
31, 2009.
A summary of the restricted units aggregate intrinsic value (market value at vesting date) and
fair value (market value at date of grant) of units vested during the years ended December 31,
2009, 2008 and 2007 are provided below (in thousands):
| |
|
|
|
|
|
|
|
|
|
|
|
|
| |
|
Years Ended December 31, |
|
| Crosstex Energy, L.P. Restricted Units: |
|
2009 |
|
|
2008 |
|
|
2007 |
|
Aggregate intrinsic value of units vested |
|
$ |
1,023 |
|
|
$ |
5,907 |
|
|
$ |
1,342 |
|
Fair value of units vested |
|
$ |
4,158 |
|
|
$ |
6,815 |
|
|
$ |
888 |
|
As of December 31, 2009, there was $7.3 million of unrecognized compensation cost related to
non-vested restricted units. That cost is expected to be recognized over a weighted-average period
of 2.3 years.
(c) Partnership Unit Options
Unit options will have an exercise price that is not less than the fair market value of the
units on the date of grant. In general, unit options granted will become exercisable over a period
determined by the compensation committee. In addition, unit options will become exercisable upon a
change in control of the Partnership, its general partner or its general partner’s general partner.
The fair value of each unit option award is estimated at the date of grant using the
Black-Scholes-Merton model. This model is based on the assumptions summarized below. Expected
volatilities are based on historical volatilities of the Partnership’s traded common units. The
Partnership has used historical data to estimate share option exercise and employee departure
behavior to estimate expected forfeiture rates. The expected life of unit options represents the
period of time that unit options granted are expected to be outstanding. The risk-free interest
rate for periods within the expected term of the unit option is based on the U.S. Treasury yield
curve in effect at the time of the grant. The Partnership used the simplified method to calculate
the expected term.
F-26
Unit options are generally awarded with an exercise price equal to the market price of the
Partnership’s common units at the date of grant. The unit options granted in 2009, 2008 and 2007
generally vest based on 3 years of service (one-third after each year of service). The following
weighted average assumptions were used for the Black-Scholes option-pricing model for grants in
2009, 2008 and 2007:
| |
|
|
|
|
|
|
|
|
|
|
|
|
| |
|
Years Ended December 31, |
|
| Crosstex Energy, L.P. Unit Options Granted: |
|
2009 |
|
|
2008 |
|
|
2007 |
|
Weighted average distribution yield |
|
|
0 |
% |
|
|
7.15 |
% |
|
|
5.75 |
% |
Weighted average expected volatility |
|
|
76.2 |
% |
|
|
30.0 |
% |
|
|
32.0 |
% |
Weighted average risk free interest rate |
|
|
2.34 |
% |
|
|
1.81 |
% |
|
|
4.39 |
% |
Weighted average expected life |
|
6 years |
|
|
6 years |
|
|
6 years |
|
Weighted average contractual life |
|
10 years |
|
|
10 years |
|
|
10 years |
|
Weighted average of fair value of unit options granted |
|
$ |
2.89 |
|
|
$ |
3.48 |
|
|
$ |
6.73 |
|
A summary of the unit option activity for the years ended December 31, 2009, 2008 and 2007 is
provided below:
| |
|
|
|
|
|
|
|
|
|
|
|
|
|
|
|
|
|
|
|
|
|
|
|
|
| |
|
Years Ended December 31, |
|
| |
|
2009 |
|
|
2008 |
|
|
2007 |
|
| |
|
|
|
|
|
Weighted |
|
|
|
|
|
|
Weighted |
|
|
|
|
|
|
Weighted |
|
| |
|
|
|
|
|
Average |
|
|
|
|
|
|
Average |
|
|
|
|
|
|
Average |
|
| |
|
Number of |
|
|
Exercise |
|
|
Number of |
|
|
Exercise |
|
|
Number of |
|
|
Exercise |
|
| |
|
Units |
|
|
Price |
|
|
Units |
|
|
Price |
|
|
Units |
|
|
Price |
|
Outstanding, beginning of period |
|
|
1,304,194 |
|
|
$ |
30.64 |
|
|
|
1,107,309 |
|
|
$ |
29.65 |
|
|
|
926,156 |
|
|
$ |
25.70 |
|
Granted (b) |
|
|
636,122 |
|
|
|
4.46 |
|
|
|
402,185 |
|
|
|
31.58 |
|
|
|
347,599 |
|
|
|
37.29 |
|
Issued in exchange |
|
|
344,319 |
|
|
|
4.80 |
|
|
|
— |
|
|
|
— |
|
|
|
— |
|
|
|
— |
|
Rendered in exchange |
|
|
(1,032,403 |
) |
|
|
31.34 |
|
|
|
— |
|
|
|
— |
|
|
|
— |
|
|
|
— |
|
Exercised |
|
|
(2,013 |
) |
|
|
4.08 |
|
|
|
(56,678 |
) |
|
|
14.16 |
|
|
|
(90,032 |
) |
|
|
18.20 |
|
Forfeited |
|
|
(328,295 |
) |
|
|
27.51 |
|
|
|
(90,208 |
) |
|
|
31.29 |
|
|
|
(67,688 |
) |
|
|
29.84 |
|
Expired |
|
|
(39,088 |
) |
|
|
30.30 |
|
|
|
(58,414 |
) |
|
|
32.93 |
|
|
|
(8,726 |
) |
|
|
31.60 |
|
|
|
|
|
|
|
|
|
|
|
|
|
|
|
|
|
|
|
|
Outstanding, end of period |
|
|
882,836 |
|
|
$ |
6.43 |
|
|
|
1,304,194 |
|
|
$ |
30.64 |
|
|
|
1,107,309 |
|
|
$ |
29.65 |
|
|
|
|
|
|
|
|
|
|
|
|
|
|
|
|
|
|
|
|
Options exercisable at end of period |
|
|
159,929 |
|
|
$ |
12.51 |
|
|
|
540,782 |
|
|
$ |
29.12 |
|
|
|
281,973 |
|
|
$ |
28.05 |
|
Weighted average contractual term (years) end of period: |
|
|
|
|
|
|
|
|
|
|
|
|
|
|
|
|
|
|
|
|
|
|
|
|
Options outstanding |
|
|
8.7 |
|
|
|
— |
|
|
|
7.4 |
|
|
|
— |
|
|
|
7.6 |
|
|
|
— |
|
Options exercisable |
|
|
4.5 |
|
|
|
— |
|
|
|
6.5 |
|
|
|
— |
|
|
|
7.1 |
|
|
|
— |
|
Aggregate intrinsic value end of period (in thousands): |
|
|
|
|
|
|
|
|
|
|
|
|
|
|
|
|
|
|
|
|
|
|
|
|
Options outstanding |
|
$ |
3,143 |
|
|
|
— |
|
|
$ |
(a |
) |
|
|
— |
|
|
$ |
4,681 |
|
|
|
— |
|
Options exercisable |
|
$ |
336 |
|
|
|
— |
|
|
$ |
(a |
) |
|
|
— |
|
|
$ |
1,322 |
|
|
|
— |
|
| |
|
|
| (a) |
|
Exercise price on all outstanding options exceeds current market price. |
| |
| (b) |
|
No options were granted with an exercise price less than or equal to
market value at grant during 2009, 2008 and 2007. |
In May 2009, the Partnership’s unitholders approved an amendment to the Partnership’s
long-term incentive plan to allow an option exchange program. This option exchange program was
offered to all eligible employees excluding executive officers and directors because options held
by employees were “underwater,” meaning the exercise price of the options were higher than the
current market price of the common units. The terms of the offer included an exchange ratio of 3
old options for 1 replacement option with an exercise price of $4.80 per common unit (120% of the
average closing sales price for five trading days prior to the date of grant) which will vest over
2 years (50% after year 1 and 50% after year 2). In June 2009, a total of 453 employees elected to
exchange 1,032,403 old options for 344,319 replacement options pursuant to this option exchange
program. There was no incremental compensation cost resulting from the modifications under this
option exchange program.
A summary of the unit options intrinsic value exercised (market value in excess of exercise
price at date of exercise) and fair value (value per Black-Scholes option pricing model at date of
grant) of units vested during the years ended December 31, 2009, 2008 and 2007 are provided below
(in thousands):
| |
|
|
|
|
|
|
|
|
|
|
|
|
| |
|
Years Ended December 31, |
|
| Crosstex Energy, L.P. Unit Options: |
|
2009 |
|
|
2008 |
|
|
2007 |
|
Intrinsic value of units options exercised |
|
$ |
5 |
|
|
$ |
746 |
|
|
$ |
1,675 |
|
Fair value of units vested |
|
$ |
1,675 |
|
|
$ |
279 |
|
|
$ |
197 |
|
As of December 31, 2009, there was $1.5 million of unrecognized compensation cost related to
non-vested unit options. That cost is expected to be recognized over a weighted-average period of 2.2 years.
F-27
(d) Crosstex Energy, Inc.’s Restricted Stock and Option Plans
The Crosstex Energy, Inc. long-term incentive plans provide for the award of stock options and
restricted stock (collectively, “Awards”) for up to 7,190,000 shares of Crosstex Energy, Inc.’s
common stock. As of January 1, 2010, approximately 2,230,800 shares remained available under the
long-term incentive plans for future issuance to participants. A participant may not receive in any
calendar year options relating to more than 250,000 shares of common stock. The maximum number of
shares set forth above are subject to appropriate adjustment in the event of a recapitalization of
the capital structure of Crosstex Energy, Inc. or reorganization of Crosstex Energy, Inc. Shares of
common stock underlying. Awards that are forfeited, terminated or expire unexercised become
immediately available for additional awards under the long-term incentive plan.
The Company’s restricted shares are included at their fair value at the date of grant which is
equal to the market value of the common stock on such date. CEI’s restricted stock granted in 2009,
2008 and 2007 generally cliff vest after three years of service. A summary of the restricted stock,
which activity for the year ended December 31, 2009, is provided below:
| |
|
|
|
|
|
|
|
|
| |
|
|
|
|
|
Weighted |
|
| |
|
|
|
|
|
Average |
|
| |
|
Number of |
|
|
Grant-Date Fair |
|
| Crosstex Energy, Inc. Restricted Shares: |
|
Shares |
|
|
Value |
|
Non-vested, beginning of period |
|
|
604,313 |
|
|
$ |
27.62 |
|
Granted |
|
|
1,157,454 |
|
|
|
4.48 |
|
Vested* |
|
|
(258,377 |
) |
|
|
16.96 |
|
Forfeited |
|
|
(111,417 |
) |
|
|
16.30 |
|
|
|
|
|
|
|
|
Non-vested, end of period |
|
|
1,391,973 |
|
|
$ |
9.37 |
|
|
|
|
|
|
|
|
Aggregate intrinsic value, end of period (in thousands) |
|
$ |
8,421 |
|
|
|
|
|
|
|
|
|
|
|
|
|
| |
|
|
| * |
|
Vested shares include 75,821 shares withheld for payroll taxes paid on
behalf of employees. |
The Company issued performance-based restricted shares in 2007 and 2008 to executive officers.
The minimum level of performance-based awards is included in restricted shares outstanding and is
included in the current share-based compensation cost calculations at December 31, 2009. The
achievement of greater than the minimum performance targets in the current business environment is
less than probable. All performance-based awards are subject to reevaluation and adjustment until
the restricted shares vest.
A summary of the restricted shares’ aggregate intrinsic value (market value at vesting date)
and fair value (market value at date of grant) of shares vested during the years ended December 31,
2009, 2008 and 2007 are provided below (in thousands):
| |
|
|
|
|
|
|
|
|
|
|
|
|
| |
|
Years Ended December 31, |
|
| Crosstex Energy, Inc. Restricted Shares: |
|
2009 |
|
|
2008 |
|
|
2007 |
|
Aggregate intrinsic value of shares vested |
|
$ |
1,038 |
|
|
$ |
13,493 |
|
|
$ |
3,067 |
|
Fair value of shares vested |
|
$ |
4,382 |
|
|
$ |
7,382 |
|
|
$ |
1,275 |
|
Restricted shares in CEI totaling 244,915 and 205,983 were issued to directors, officers and
employees of the Partnership with a weighted-average grant-date fair value of $32.41 and $26.13 per
share in 2008 and 2007, respectively. As of December 31, 2009 there was $6.4 million of
unrecognized compensation costs related to non-vested CEI restricted stock. The cost is expected to
be recognized over a weighted average period of 2.1 years.
CEI Stock Options
CEI stock options have not been granted since 2005. A summary of the stock option activity for
the years ended December 31, 2009, 2008 and 2007, is provided below:
| |
|
|
|
|
|
|
|
|
|
|
|
|
|
|
|
|
|
|
|
|
|
|
|
|
| |
|
Years Ended December 31, |
|
| |
|
2009 |
|
|
2008 |
|
|
2007 |
|
| |
|
Number |
|
|
Weighted Average |
|
|
Number |
|
|
Weighted Average |
|
|
Number |
|
|
Weighted Average |
|
| |
|
of Shares |
|
|
Exercise Price |
|
|
of Shares |
|
|
Exercise Price |
|
|
of Shares |
|
|
Exercise Price |
|
Outstanding, beginning of period |
|
|
67,500 |
|
|
$ |
9.54 |
|
|
|
105,000 |
|
|
$ |
8.45 |
|
|
|
120,000 |
|
|
$ |
8.21 |
|
Exercised |
|
|
— |
|
|
|
— |
|
|
|
(37,500 |
) |
|
|
6.50 |
|
|
|
(15,000 |
) |
|
|
6.50 |
|
|
|
|
|
|
|
|
|
|
|
|
|
|
|
|
|
|
|
|
Outstanding, end of period |
|
|
67,500 |
|
|
$ |
9.54 |
|
|
|
67,500 |
|
|
$ |
9.54 |
|
|
|
105,000 |
|
|
$ |
8.45 |
|
|
|
|
|
|
|
|
|
|
|
|
|
|
|
|
|
|
|
|
Options exercisable at end of period |
|
|
67,500 |
|
|
$ |
9.54 |
|
|
|
22,500 |
|
|
$ |
11.05 |
|
|
|
37,500 |
|
|
$ |
7.87 |
|
As of December 31, 2009, there were 30,000 exercisable outstanding CEI stock options at a
weighted average exercise price of $13.33 attributable to the Partnership’s officers and employees.
On January 1, 2010 these outstanding stock options were forfeited.
F-28
A summary of the stock options intrinsic value exercised (market value in excess of exercise
price at date of exercise) and fair value (value per Black-Scholes option pricing model at date of
grant) of units vested during the years ended December 31, 2009, 2008 and 2007 is provided below
(in thousands):
| |
|
|
|
|
|
|
|
|
|
|
|
|
| |
|
Years Ended December 31, |
|
| Crosstex Energy, Inc. Stock Options: |
|
2009 |
|
|
2008 |
|
|
2007 |
|
Intrinsic value of stock options exercised |
|
$ |
— |
|
|
$ |
1,089 |
|
|
$ |
366 |
|
Fair value of shares vested |
|
$ |
49 |
|
|
$ |
38 |
|
|
$ |
66 |
|
(12) Fair Value of Financial Instruments
The estimated fair value of the Company’s financial instruments has been determined by the
Company using available market information and valuation methodologies. Considerable judgment is
required to develop the estimates of fair value; thus, the estimates provided below are not
necessarily indicative of the amount the Company could realize upon the sale or refinancing of such
financial instruments (in thousands).
| |
|
|
|
|
|
|
|
|
|
|
|
|
|
|
|
|
| |
|
December 31,
2009 |
|
|
December 31,
2008 |
|
| |
|
Carrying |
|
|
Fair |
|
|
Carrying |
|
|
Fair |
|
| |
|
Value |
|
|
Value |
|
|
Value |
|
|
Value |
|
Cash and cash equivalents |
|
$ |
10,703 |
|
|
$ |
10,703 |
|
|
$ |
13,959 |
|
|
$ |
13,959 |
|
Trade accounts receivable and accrued revenues |
|
|
207,655 |
|
|
|
207,655 |
|
|
|
341,853 |
|
|
|
341,853 |
|
Fair value of derivative assets |
|
|
14,777 |
|
|
|
14,777 |
|
|
|
31,794 |
|
|
|
31,794 |
|
Accounts payable, drafts payable and accrued gas purchases |
|
|
174,008 |
|
|
|
174,008 |
|
|
|
315,622 |
|
|
|
315,622 |
|
Long-term debt |
|
|
873,702 |
|
|
|
872,340 |
|
|
|
1,263,706 |
|
|
|
1,158,351 |
|
Obligations under capital lease |
|
|
23,799 |
|
|
|
22,399 |
|
|
|
27,896 |
|
|
|
27,269 |
|
Fair value of derivative liabilities |
|
|
42,443 |
|
|
|
42,443 |
|
|
|
51,281 |
|
|
|
51,281 |
|
The carrying amounts of the Company’s cash and cash equivalents, accounts receivable, and
accounts payable approximate fair value due to the short-term maturities of these assets and
liabilities.
The Partnership’s long-term debt was comprised of borrowings under a revolving credit facility
totaling $529.6 million and $784.0 million as of December 31, 2009 and 2008, respectively, which
accrues interest under a floating interest rate structure. Accordingly, the carrying value of such
indebtedness approximates fair value for the amounts outstanding under the credit facility. As of
December 31, 2009, the Partnership also had borrowings totaling $326.0 million under senior secured
notes with a weighted average interest rate of 10.5% and a series B secured note with a fixed rate
of 9.5%. The fair value of these borrowings as of December 31, 2009 and 2008 were adjusted to
reflect current market interest rate for such borrowings as of December 31, 2009 and 2008,
respectively. The fair value of derivative contracts included in assets or liabilities for risk
management activities represents the amount at which the instruments could be exchanged in a
current arms-length transaction adjusted for credit risk of the Partnership and/or counterparty as
required under FASB ASC 820.
(13) Derivatives
Interest Rate Swaps
The Partnership is subject to interest rate risk on its credit facility and entered into
interest rate swaps to reduce this risk. The Partnership originally entered into eight interest
rate swaps to fix the three month Libor rate, prior to credit margin, at rates between
2.83% and 4.69% on notional amounts totaling $550.0 million with maturities as early as
January 2009 and as late as October 31, 2011, as amended January 2008. In September 2008, the
Partnership entered into four additional interest rate swaps to convert the floating rate portion
of the original swaps on a notional amount of $450.0 million from three month LIBOR to one month
LIBOR. These swaps were not designated as cash flow hedges and therefore the impact of the
interest rate swaps on net income is included in other income (expense) in the consolidated
statements of operations as a part of interest expense, net.
F-29
The Partnership originally elected to designate all but one of the original eight interest
rate swaps as cash flow hedges for FASB ASC 815 accounting treatment resulting in unrealized gains
and losses booked in accumulated other comprehensive income. As a result of the January 2008
amendments, these swaps were de-designated as cash flow hedges. The unrealized loss in accumulated
other comprehensive income of $17.0 million at the de-designation date was to be reclassified to
earnings over the remaining original terms of the swaps using the effective interest method. During
2009 the unrealized loss reclassified to earnings and included in other income (expense) as a part
of interest expense, net, was $10.0 million which consisted of $6.7 million under the effective
interest method and $3.3 million due to the Partnership’s decision to reduce its credit facility in
February 2010. The remaining unamortized balance in accumulated other comprehensive income is $0.6
million at December 31, 2009. This balance is associated with
one swap of $50.0 million that as of December 31, 2009 the
Partnership anticipated being in place to its original term.
The impact of the interest rate swaps on net income is included in other income (expense) in
the consolidated statements of operations as a part of interest expense, net, as follows (in
thousands):
| |
|
|
|
|
|
|
|
|
|
|
|
|
| |
|
Years Ended December 31, |
|
| |
|
2009 |
|
|
2008 |
|
|
2007 |
|
Change in fair value of derivatives that do not qualify for hedge accounting |
|
$ |
797 |
|
|
$ |
(22,105 |
) |
|
$ |
(1,185 |
) |
Realized gains (losses) on derivatives |
|
|
(19,044 |
) |
|
|
(4,608 |
) |
|
|
707 |
|
|
|
|
|
|
|
|
|
|
|
|
|
$ |
(18,247 |
) |
|
$ |
(26,713 |
) |
|
$ |
(478 |
) |
|
|
|
|
|
|
|
|
|
|
The fair value of derivative assets and liabilities relating to interest rate swaps are as
follows (in thousands):
| |
|
|
|
|
|
|
|
|
| |
|
Years Ended December 31, |
|
| |
|
2009 |
|
|
2008 |
|
Fair value of derivative assets — current |
|
$ |
¾ |
|
|
$ |
149 |
|
Fair value of derivative liabilities — current |
|
|
(17,960 |
) |
|
|
(17,217 |
) |
Fair value of derivative liabilities — long-term |
|
|
(6,768 |
) |
|
|
(18,391 |
) |
|
|
|
|
|
|
|
Net fair value of interest rate swaps |
|
$ |
(24,728 |
) |
|
$ |
(35,459 |
) |
|
|
|
|
|
|
|
During the recapitalization of the Partnership in February 2010, all interest rates swaps held
by the Partnership were settled and all remaining asset and liability balances on the books related
to the interest rate swaps at December 31, 2009 have been removed and the impact of the transaction
on net income has been included in other income (expense) in the first quarter of 2010.
Commodity Swaps
The Partnership manages its exposure to fluctuations in commodity prices by hedging the impact
of market fluctuations. Swaps are used to manage and hedge prices and location risk related to
these market exposures. Swaps are also used to manage margins on offsetting fixed-price purchase or
sale commitments for physical quantities of natural gas and NGLs.
The Partnership commonly enters into various derivative financial transactions which it does
not designate as hedges. These transactions include swing swaps, third party on-system financial
swaps, marketing financial swaps, storage swaps, basis swaps, processing margin swaps, and liquids
swaps. Swing swaps are generally short-term in nature (one month), and are usually entered into to
protect against changes in the volume of daily versus first-of-month index priced gas supplies or
markets. Third party on-system financial swaps are hedges that the Partnership enters into on
behalf of its customers who are connected to its systems, wherein the Partnership fixes a supply or
market price for a period of time for its customers, and simultaneously enters into the derivative
transaction. Marketing financial swaps are similar to on-system financial swaps, but are entered
into for customers not connected to the Partnership’s systems. Storage swaps transactions protect
against changes in the value of gas that the Partnership has stored to serve various operational
requirements. Basis swaps are used to hedge basis location price risk due to buying gas into one of
our systems on one index and selling gas off that same system on a different index. Processing
margin financial swaps are used to hedge fractionation spread risk at our processing plants
relating to the option to process versus bypassing our equity gas. Liquids financial swaps are used
to hedge price risk on percent of liquids (POL) contracts.
The components of (gain) loss on derivatives in the consolidated statements of operations
relating to commodity swaps are (in thousands):
| |
|
|
|
|
|
|
|
|
|
|
|
|
| |
|
Years Ended December 31, |
|
| |
|
2009 |
|
|
2008 |
|
|
2007 |
|
Change in fair value of derivatives that do not qualify for hedge accounting |
|
$ |
2,816 |
|
|
$ |
(246 |
) |
|
$ |
1,197 |
|
Realized gains on derivatives |
|
|
(6,139 |
) |
|
|
(13,352 |
) |
|
|
(7,918 |
) |
Ineffective portion of derivatives qualifying for hedge accounting |
|
|
65 |
|
|
|
(72 |
) |
|
|
104 |
|
|
|
|
|
|
|
|
|
|
|
Net gains related to commodity swaps |
|
$ |
(3,258 |
) |
|
$ |
(13,670 |
) |
|
$ |
(6,617 |
) |
Net gains included in income from discontinued operations |
|
|
264 |
|
|
|
5,051 |
|
|
|
2,470 |
|
|
|
|
|
|
|
|
|
|
|
Gain on derivatives included in continuing operations |
|
$ |
(2,994 |
) |
|
$ |
(8,619 |
) |
|
$ |
(4,147 |
) |
|
|
|
|
|
|
|
|
|
|
F-30
The fair value of derivative assets and liabilities relating to commodity swaps are as follows
(in thousands):
| |
|
|
|
|
|
|
|
|
| |
|
Years Ended December 31, |
|
| |
|
2009 |
|
|
2008 |
|
Fair value of derivative assets — current, designated |
|
$ |
369 |
|
|
$ |
13,714 |
|
Fair value of derivative assets — current, non-designated |
|
|
8,743 |
|
|
|
13,303 |
|
Fair value of derivative assets — long term, non-designated |
|
|
5,665 |
|
|
|
4,628 |
|
Fair value of derivative liabilities — current, designated |
|
|
(2,536 |
) |
|
|
¾ |
|
Fair value of derivative liabilities — current, non-designated |
|
|
(9,841 |
) |
|
|
(11,289 |
) |
Fair value of derivative liabilities — long term, non-designated |
|
|
(5,338 |
) |
|
|
(4,384 |
) |
|
|
|
|
|
|
|
Net fair value of derivatives |
|
$ |
(2,938 |
) |
|
$ |
15,972 |
|
|
|
|
|
|
|
|
Set forth below is the summarized notional volumes and fair values of all instruments held for
price risk management purposes and related physical offsets at December 31, 2009 (all gas volumes
are expressed in MMBtu’s and liquids are expressed in gallons). The remaining terms of the
contracts extend no later than December 2010 for derivatives, except for certain basis swaps that
extend to March 2012. Changes in the fair value of the Partnership’s mark to market derivatives are
recorded in earnings in the period the transaction is entered into. The effective portion of
changes in the fair value of cash flow hedges is recorded in accumulated other comprehensive income
until the related anticipated future cash flow is recognized in earnings. The ineffective portion
is recorded in earnings immediately.
| |
|
|
|
|
|
|
|
|
| December 31, 2009 |
|
| Transaction Type |
|
Volume |
|
|
Fair Value |
|
| |
|
(In thousands) |
|
|
|
|
|
|
|
|
|
|
Cash Flow Hedges:* |
|
|
|
|
|
|
|
|
Liquids swaps (short contracts) |
|
|
(11,033 |
) |
|
$ |
(2,536 |
) |
Liquids swaps (long contracts) |
|
|
1,247 |
|
|
|
369 |
|
|
|
|
|
|
|
|
|
Total swaps designated as cash flow hedges |
|
|
|
|
|
$ |
(2,167 |
) |
|
|
|
|
|
|
|
|
|
|
|
|
|
|
|
|
|
Mark to Market Derivatives:* |
|
|
|
|
|
|
|
|
Swing swaps (long contracts) |
|
|
155 |
|
|
$ |
1 |
|
Physical offsets to swing swap transactions (short contracts) |
|
|
(155 |
) |
|
|
¾ |
|
Swing swaps (short contracts) |
|
|
(682 |
) |
|
|
(3 |
) |
Physical offsets to swing swap transactions (long contracts) |
|
|
682 |
|
|
|
¾ |
|
|
|
|
|
|
|
|
|
|
Basis swaps (long contracts) |
|
|
61,831 |
|
|
|
11,766 |
|
Physical offsets to basis swap transactions (short contracts) |
|
|
(3,194 |
) |
|
|
18,553 |
|
Basis swaps (short contracts) |
|
|
(47,938 |
) |
|
|
(8,626 |
) |
Physical offsets to basis swap transactions (long contracts) |
|
|
3,194 |
|
|
|
(18,582 |
) |
|
|
|
|
|
|
|
|
|
Third-party on-system financial swaps (long contracts) |
|
|
72 |
|
|
|
(184 |
) |
Third-party on-system financial swaps (short contracts) |
|
|
(74 |
) |
|
|
(41 |
) |
|
|
|
|
|
|
|
|
|
Processing margin hedges — liquids (short contracts) |
|
|
(16,422 |
) |
|
|
(3,718 |
) |
Processing margin hedges — gas (long contracts) |
|
|
1,714 |
|
|
|
92 |
|
|
|
|
|
|
|
|
|
|
Storage swap transactions (short contracts) |
|
|
(360 |
) |
|
|
(29 |
) |
|
|
|
|
|
|
|
|
|
|
|
|
|
|
|
|
|
Total Mark to market derivatives |
|
|
|
|
|
$ |
(771 |
) |
|
|
|
|
|
|
|
|
| |
|
|
| * |
|
All are gas contracts, volume in MMBtu’s, except for processing margin hedges — liquids and
liquids swaps (volume in gallons). |
F-31
On all transactions where the Partnership is exposed to counterparty risk, the Partnership
analyzes the counterparty’s financial condition prior to entering into an agreement, establishes
limits and monitors the appropriateness of these limits on an ongoing basis. The Partnership
primarily deals with two types of counterparties, financial institutions and other energy
companies, when entering into financial derivatives on commodities. The Partnership has entered
into Master International Swaps and Derivatives Association Agreements that allow for netting of
swap contract receivables and payables in the event of default by either party. If the
Partnership’s counterparties failed to perform under existing swap contracts, the Partnership’s
maximum loss of $34.5 million would be reduced to $15.2 million due to the netting feature. If the
counterparties failed to completely perform according to the terms of the contracts the maximum
loss the Partnership would sustain is $15.2 million with other energy companies.
Impact of Cash Flow Hedges
The impact of realized gains or losses from derivatives designated as cash flow hedge
contracts in the consolidated statements of operations is summarized below (in thousands):
| |
|
|
|
|
|
|
|
|
|
|
|
|
| |
|
Years Ended December 31, |
|
| Increase (Decrease) in Midstream Revenue |
|
2009 |
|
|
2008 |
|
|
2007 |
|
Natural gas |
|
$ |
2,156 |
|
|
$ |
63 |
|
|
$ |
5,533 |
|
Liquids |
|
|
9,707 |
|
|
|
(10,402 |
) |
|
|
(4,066 |
) |
Realized (gain) loss included in income from discontinued operations |
|
|
(759 |
) |
|
|
3,127 |
|
|
|
(474 |
) |
|
|
|
|
|
|
|
|
|
|
|
|
$ |
11,104 |
|
|
$ |
(7,212 |
) |
|
$ |
993 |
|
|
|
|
|
|
|
|
|
|
|
Natural Gas
As of December 31, 2009, there is no remaining balance in accumulated other comprehensive
income related to natural gas.
Liquids
As of December 31, 2009, an unrealized derivative fair value net loss of $2.1 million related
to cash flow hedges of liquids price risk was recorded in accumulated other comprehensive income
(loss). Of this amount, a $2.1 million loss is expected to be reclassified into earnings through
December 2010. The actual reclassification to earnings will be based on mark to market prices at
the contract settlement date, along with the realization of the gain or loss on the related
physical volume, which amount is not reflected above.
Derivatives Other Than Cash Flow Hedges
Assets and liabilities related to third party derivative contracts, swing swaps, basis swaps,
storage swaps and processing margin swaps are included in the fair value of derivative assets and
liabilities and the profit and loss on the mark to market value of these contracts are recorded net
as (gain) loss on derivatives in the consolidated statement of operations. The Partnership
estimates the fair value of all of its energy trading contracts using actively quoted prices. The
estimated fair value of energy trading contracts by maturity date was as follows (in thousands):
| |
|
|
|
|
|
|
|
|
|
|
|
|
|
|
|
|
| |
|
Maturity Periods |
|
| |
|
Less Than One Year |
|
|
One to Two Years |
|
|
More Than Two Years |
|
|
Total Fair Value |
|
December 31, 2009 |
|
$ |
(1,098 |
) |
|
$ |
316 |
|
|
$ |
11 |
|
|
$ |
(771 |
) |
(14) Fair Value Measurements
FASB ASC 820 sets forth a framework for measuring fair value and required disclosures about
fair value measurements of assets and liabilities. Fair value under FASB ASC 820 is defined as the
price at which an asset could be exchanged in a current transaction between knowledgeable, willing
parties. A liability’s fair value is defined as the amount that would be paid to transfer the
liability to a new obligor, not the amount that would be paid to settle the liability with the
creditor. Where available, fair value is based on observable market prices or parameters or derived from such prices or parameters. Where
observable prices or inputs are not available, use of unobservable prices or inputs are used to
estimate the current fair value, often using an internal valuation model. These valuation
techniques involve some level of management estimation and judgment, the degree of which is
dependent on the item being valued.
FASB ASC 820 establishes a three-tier fair value hierarchy, which prioritizes the inputs used
in measuring fair value. These tiers include: Level 1, defined as observable inputs such as quoted
prices in active markets; Level 2, defined as inputs other than quoted prices in active markets
that are either directly or indirectly observable; and Level 3, defined as unobservable inputs in
which little or no market data exists, therefore requiring an entity to develop its own
assumptions.
F-32
The Partnership’s derivative contracts primarily consist of commodity swaps and interest rate
swap contracts which are not traded on a public exchange. The fair values of commodity swap
contracts are determined based on inputs that are readily available in public markets or can be
derived from information available in publicly quoted markets. The Partnership determines the value
of interest rate swap contracts by utilizing inputs and quotes from the counterparties to these
contracts. The reasonableness of these inputs and quotes is verified by comparing similar inputs
and quotes from other counterparties as of each date for which financial statements are prepared.
The Partnership’s contracts are all level two contracts under FASB ASC 820.
Net assets (liabilities) measured at fair value on a recurring basis are summarized below (in
thousands):
| |
|
|
|
|
| |
|
Level 2 |
|
Interest rate swaps* |
|
$ |
(24,728 |
) |
Commodity swaps* |
|
|
(2,938 |
) |
|
|
|
|
Total |
|
$ |
(27,666 |
) |
|
|
|
|
| |
|
|
| * |
|
Unrealized gains or losses on commodity derivatives qualifying for
hedge accounting are recorded in accumulated other comprehensive
income (loss) at each measurement date. Accumulated other
comprehensive income (loss) also includes the unrealized losses on
interest rate swaps of $17.0 million recorded prior to de-designation
in January 2008, of which $16.4 million has been recognized in
earnings through December 2009. |
(15) Transactions with Related Parties -Distribution of Assets for Cash
During 2008 we transferred two inactive processing plants to the Partnership at net book value
for a cash price of $0.4 million which represented the fair value of the plants.
(16) Commitments and Contingencies
(a) Leases — Lessee
The Partnership has operating leases for office space, office and field equipment. The Eunice
plant operating lease is no longer included in lease obligations. The Partnership acquired the
Eunice, NGL processing plant and fractionation facility in October 2009, and will no longer have
the lease obligation to an outside third party.
The following table summarizes our remaining non-cancelable future payments under operating
leases with initial or remaining non-cancelable lease terms in excess of one year (in thousands):
| |
|
|
|
|
2010 |
|
$ |
15,888 |
|
2011 |
|
|
12,111 |
|
2012 |
|
|
9,299 |
|
2013 |
|
|
6,145 |
|
2014 |
|
|
4,702 |
|
Thereafter |
|
|
8,419 |
|
|
|
|
|
|
|
$ |
56,564 |
|
|
|
|
|
Operating lease rental expense for the years ended December 31, 2009, 2008 and 2007 was
approximately $30.7 million, $39.4 million and $27.9 million, respectively.
(b) Employment Agreements
Certain members of management of the Company are parties to employment contacts with the
general partner of the Partnership. The employment agreements provide those senior managers with
severance payments in certain circumstances and prohibit each such person from competing with the
general partner of the Partnership or its affiliates for a certain period of time following the
termination of such person’s employment.
F-33
(c) Environmental Issues
The Partnership acquired the south Louisiana processing assets from the El Paso Corporation in
November 2005. One of the acquired locations, the Cow Island Gas Processing Facility, has a known
active remediation project for benzene contaminated groundwater. The cause of contamination was
attributed to a leaking natural gas condensate storage tank. The site investigation and active
remediation being conducted at this location is under the guidance of the Louisiana Department of
Environmental Quality (LDEQ) based on the Risk-Evaluation and Corrective Action Plan Program
(RECAP) rules. On April 17, 2009, the Partnership completed the remediation and obtained written
confirmation from the LDEQ that “no further action” was needed and that the impaired groundwater
quality at the Cow Island gas processing facility site has been restored to the proper standard.
This matter is now officially resolved.
The Partnership acquired LIG Pipeline Company and its subsidiaries on April 1, 2004.
Contamination from historical operations was identified during due diligence at a number of sites
owned by the acquired companies. The seller, AEP, has indemnified the Partnership for these
identified sites. Moreover, AEP has entered into an agreement with a third-party company pursuant
to which the remediation costs associated with these sites have been assumed by this third party
company that specializes in remediation work. The Company does not expect to incur any material
liability with these sites. In addition, the Partnership has disclosed possible Clean Air Act
monitoring deficiencies it has discovered to the Louisiana Department of Environmental Quality and
is working with the department to correct these deficiencies and to address modifications to
facilities to bring them into compliance. The Company does not expect to incur any material
environmental liability associated with these issues.
(e) Other
The Company is involved in various litigation and administrative proceedings arising in the
normal course of business. In the opinion of management, any liabilities that may result from these
claims would not individually or in the aggregate have a material adverse effect on its financial
position or results of operations.
In December 2008, Denbury Onshore, LLC (“Denbury”) initiated formal arbitration proceedings
against Crosstex CCNG Processing Ltd. (“Crosstex Processing”), Crosstex Energy Services, L.P.
(“Crosstex Energy”), Crosstex North Texas Gathering, L.P. (“Crosstex Gathering”) and Crosstex Gulf
Coast Marketing Ltd. (“Crosstex Marketing”), all wholly-owned subsidiaries of the Partnership,
asserting a claim for breach of contract under a gas processing agreement. Denbury alleged damages
in the amount of $16.2 million, plus interest and attorneys’ fees. Crosstex denied any liability
and sought to have the action dismissed. A three-person arbitration panel conducted a hearing on
the merits in December 2009. At the close of the evidence at the hearing, the panel granted
judgment for Crosstex on one of Denbury’s claims, and on February 16, 2010, the panel granted
judgment for Denbury on its remaining claims in the amount of $3.0 million plus interest,
attorneys’ fees and costs. The panel will conduct additional proceedings to determine the amount
of attorneys’ fees and costs, if any, that should be awarded to Denbury. The Company estimates
that the total award will be between $3.0 million and $4.0 million at the conclusion of these
additional proceedings. The Company has accrued $3.7 million in other current liabilities for this
award as of December 31, 2009 and reflected the related expense in purchased gas costs.
At times, the Partnership’s gas-utility subsidiaries acquire pipeline easements and other
property rights by exercising rights of eminent domain provided under state law. As a result, the
Partnership (or its subsidiaries) is a party to a number of lawsuits under which a court will
determine the value of pipeline easements or other property interests obtained by the Partnership’s
gas utility subsidiaries by condemnation. Damage awards in these suits should reflect the value of
the property interest acquired and the diminution in the value of the remaining property owned by
the landowner. However, some landowners have alleged unique damage theories to inflate their
damage claims or assert valuation methodologies that could result in damage awards in excess of the
amounts anticipated. Although it is not possible to predict the ultimate outcomes of these
matters, the Partnership does not expect that awards in these matters will have a material adverse
impact on its consolidated results of operations or financial condition.
The Partnership (or its subsidiaries) is defending several lawsuits filed by owners of
property located near processing facilities or compression facilities constructed by the
Partnership as part of its systems. The suits generally allege that the facilities create a private
nuisance and have damaged the value of surrounding property. Claims of this nature have arisen as a
result of the industrial development of natural gas gathering, processing and treating facilities
in urban and occupied rural areas. Although it is not possible to predict the ultimate outcomes of
these matters, the Partnership does not believe that these claims will have a material adverse
impact on its consolidated results of operations or financial condition.
On July 22, 2008, SemStream, L.P. and certain of its subsidiaries filed voluntary petitions
for reorganization under Chapter 11 of the U.S. Bankruptcy Code. As of July 22, 2008, SemStream,
L.P. owed the Partnership approximately $6.2 million, including approximately $3.9 million for June
2008 sales and approximately $2.3 million for July 2008 sales. The Partnership believes the July
sales of $2.3 million will receive “administrative claim” status in the bankruptcy proceeding. The
debtor’s schedules acknowledge its obligation to Crosstex for an administrative claim in the amount
of $2.3 but it remains subject to objection by the lenders’ agent. The Partnership evaluated these
receivables for collectibility and provided a valuation allowance of $3.1 million and $0.8 million
during the years ended December 31, 2008 and 2009, respectively.
F-34
(17) Capital Stock
(a) Common Stock
In October 2006, the Company’s stockholders approved an increase in the number of authorized
shares of capital stock from 20 million shares, consisting of 19 million shares of common stock and
1 million shares of preferred stock, to 150 million shares, consisting of 140 million shares of
common stock and 10 million shares of preferred stock.
(b) Earnings per Share and Anti-Dilutive Computations
Basic earnings per common share was computed by dividing net income by the weighted-average
number of common shares outstanding for the periods presented. The computation of diluted earnings
per common share further assumes the dilutive effect of common share options and restricted shares.
The following are the share amounts used to compute the basic and diluted earnings per share
for the years ended December 31, 2009, 2008 and 2007 (in thousands):
| |
|
|
|
|
|
|
|
|
|
|
|
|
| |
|
Years Ended December 31, |
|
| |
|
2009 |
|
|
2008 |
|
|
2007 |
|
Basic shares: |
|
|
|
|
|
|
|
|
|
|
|
|
Weighted average common shares outstanding |
|
|
46,476 |
|
|
|
46,298 |
|
|
|
45,988 |
|
Dilutive shares: |
|
|
|
|
|
|
|
|
|
|
|
|
Weighted average common shares outstanding |
|
|
46,476 |
|
|
|
46,298 |
|
|
|
45,988 |
|
Dilutive effect of restricted shares |
|
|
59 |
|
|
|
248 |
|
|
|
537 |
|
Dilutive effect of exercise of options |
|
|
¾ |
|
|
|
43 |
|
|
|
82 |
|
|
|
|
|
|
|
|
|
|
|
Dilutive shares |
|
|
46,535 |
|
|
|
46,589 |
|
|
|
46,607 |
|
|
|
|
|
|
|
|
|
|
|
(18) Quarterly Financial Data (Unaudited)
Summarized unaudited quarterly financial data is presented below.
| |
|
|
|
|
|
|
|
|
|
|
|
|
|
|
|
|
|
|
|
|
| |
|
First |
|
|
Second |
|
|
Third |
|
|
Fourth |
|
|
Total |
|
| |
|
(In thousands, except per share amount) |
|
2009: |
|
|
|
|
|
|
|
|
|
|
|
|
|
|
|
|
|
|
|
|
Revenues |
|
$ |
353,158 |
|
|
$ |
349,255 |
|
|
$ |
350,900 |
|
|
$ |
405,777 |
|
|
$ |
1,459,090 |
|
Operating income |
|
$ |
2,954 |
|
|
$ |
6,289 |
|
|
$ |
7,703 |
|
|
$ |
2,995 |
|
|
$ |
19,941 |
|
Discontinued operations — net of tax |
|
$ |
3,265 |
|
|
$ |
3,908 |
|
|
$ |
81,466 |
|
|
$ |
69,803 |
|
|
$ |
158,442 |
|
Net income (loss) attributable to the non-controlling
partners |
|
$ |
(9,205 |
) |
|
$ |
(6,223 |
) |
|
$ |
48,872 |
|
|
$ |
37,019 |
|
|
$ |
70,463 |
|
Net income (loss) attributable to Crosstex Energy, Inc. |
|
$ |
(8,842 |
) |
|
$ |
(3,086 |
) |
|
$ |
15,466 |
|
|
$ |
12,104 |
|
|
$ |
15,642 |
|
Basic earnings per common share |
|
$ |
(0.19 |
) |
|
$ |
(0.07 |
) |
|
$ |
0.33 |
|
|
$ |
0.26 |
|
|
$ |
0.33 |
|
Diluted earnings per common share |
|
$ |
(0.19 |
) |
|
$ |
(0.07 |
) |
|
$ |
0.33 |
|
|
$ |
0.25 |
|
|
$ |
0.33 |
|
2008: |
|
|
|
|
|
|
|
|
|
|
|
|
|
|
|
|
|
|
|
|
Revenues |
|
$ |
799,761 |
|
|
$ |
996,832 |
|
|
$ |
855,687 |
|
|
$ |
423,731 |
|
|
$ |
3,076,011 |
|
Operating income (loss) |
|
$ |
11,799 |
|
|
$ |
9,100 |
|
|
$ |
3,932 |
|
|
$ |
(43,447 |
) |
|
$ |
(18,616 |
) |
Discontinued operations — net of tax |
|
$ |
4,765 |
|
|
$ |
8,474 |
|
|
$ |
5,302 |
|
|
$ |
45,678 |
|
|
$ |
64,219 |
|
Net income (loss) attributable to the non-controlling
partners |
|
$ |
(4,073 |
) |
|
$ |
6,568 |
|
|
$ |
(6,966 |
) |
|
$ |
(4,999 |
) |
|
$ |
(9,470 |
) |
Net income (loss) attributable to Crosstex Energy, Inc. |
|
$ |
10,706 |
|
|
$ |
17,452 |
|
|
$ |
540 |
|
|
$ |
(4,465 |
) |
|
$ |
24,233 |
|
Basic earnings (loss) per common share |
|
$ |
0.23 |
|
|
$ |
0.37 |
|
|
$ |
0.01 |
|
|
$ |
(0.09 |
) |
|
$ |
0.52 |
|
Diluted earnings (loss) per common share |
|
$ |
0.23 |
|
|
$ |
0.37 |
|
|
$ |
0.01 |
|
|
$ |
(0.09 |
) |
|
$ |
0.51 |
|
F-35
(19) Subsequent Events
The Company evaluated events subsequent to the year ended December 31, 2009 through the date
of the issuance of the financial statements on February 26, 2010.
Sale of Preferred Units. On January 19, 2010, the Partnership issued approximately $125.0
million of Series A Convertible Preferred Units to the Blackstone / GSO Capital Solutions funds.
The preferred units are priced at $8.50 per unit and are convertible at any time into common units
on a one-for-one basis, subject to certain adjustments and to its right to force conversion of the
preferred units if certain conditions are met. The preferred units will pay a quarterly
distribution that will be the greater of $0.2125 per unit or the amount of the quarterly
distribution per unit paid to common unitholders, subject to certain adjustments. Such quarterly
distribution may be paid in cash, in additional preferred units issued in kind or any combination
thereof, provided that the distribution may not be paid in additional preferred units if the
Partnership pays a cash distribution on common units.
Disposition
of Assets. On January 19, 2010 the Partnership completed the sale of its east
Texas assets to a third party for $40.0 million and will recognize a $14.0 million gain on
disposition. These assets were not included in discontinued
operations nor were they shown as
assets held for sale at December 31, 2009 due
to the fact that they were immaterial to the
Partnership.
Long-Term Recapitalization. On February 10, 2010, the Partnership entered into a new $420.0
million senior secured revolving credit facility with a four-year term and completed the private
placement of $725.0 million principal amount of 8.875% senior unsecured notes due February 15, 2018
in a private placement. The Partnership used the net proceeds from the senior unsecured notes
offering, together with borrowings under its new credit facility, to repay all borrowings
outstanding under its previous revolving credit facility, and retire its senior secured notes and
to pay related fees, costs and expenses.
F-36
SCHEDULE I
CROSSTEX ENERGY, INC. (PARENT COMPANY)
CONDENSED BALANCE SHEETS
| |
|
|
|
|
|
|
|
|
| |
|
December 31, |
|
| |
|
2009 |
|
|
2008 |
|
| |
|
(In thousands) |
|
ASSETS
|
Current assets: |
|
|
|
|
|
|
|
|
Cash and cash equivalents |
|
$ |
9,923 |
|
|
$ |
12,323 |
|
Prepaid expenses and other |
|
|
— |
|
|
|
463 |
|
|
|
|
|
|
|
|
Total current assets |
|
|
9,923 |
|
|
|
12,786 |
|
|
|
|
|
|
|
|
Investment in the Partnership |
|
|
306,793 |
|
|
|
276,221 |
|
|
|
|
|
|
|
|
Total assets |
|
$ |
316,716 |
|
|
$ |
289,007 |
|
|
|
|
|
|
|
|
LIABILITIES AND STOCKHOLDERS’ EQUITY
|
Current liabilities: |
|
|
|
|
|
|
|
|
Payable to the Partnership |
|
$ |
8 |
|
|
$ |
110 |
|
Other accrued liabilities |
|
|
1,384 |
|
|
|
197 |
|
|
|
|
|
|
|
|
Total current liabilities |
|
|
1,392 |
|
|
|
307 |
|
|
|
|
|
|
|
|
Deferred tax liability |
|
|
87,038 |
|
|
|
73,271 |
|
Stockholders’ equity: |
|
|
|
|
|
|
|
|
Common stock |
|
|
464 |
|
|
|
464 |
|
Additional paid-in capital |
|
|
271,669 |
|
|
|
268,988 |
|
Retained earnings |
|
|
(43,279 |
) |
|
|
(54,693 |
) |
Accumulated other comprehensive income (loss) |
|
|
(568 |
) |
|
|
670 |
|
|
|
|
|
|
|
|
Total stockholders’ equity |
|
|
228,286 |
|
|
|
215,429 |
|
|
|
|
|
|
|
|
Total liabilities and stockholders’ equity |
|
$ |
316,716 |
|
|
$ |
289,007 |
|
|
|
|
|
|
|
|
See “Notes to Consolidated Financial Statements” of Crosstex Energy, Inc. included in this report.
F-37
CROSSTEX ENERGY, INC. (PARENT COMPANY)
CONDENSED STATEMENTS OF OPERATIONS
| |
|
|
|
|
|
|
|
|
|
|
|
|
| |
|
Years Ended December 31, |
|
| |
|
2009 |
|
|
2008 |
|
|
2007 |
|
| |
|
(In thousands except share data) |
|
Operating income and expenses: |
|
|
|
|
|
|
|
|
|
|
|
|
Income (loss) from investment in the Partnership |
|
$ |
33,875 |
|
|
$ |
20,468 |
|
|
$ |
17,202 |
|
Loss from investment in subsidiary |
|
|
— |
|
|
|
(139 |
) |
|
|
(35 |
) |
General and administrative expense |
|
|
(2,584 |
) |
|
|
(3,429 |
) |
|
|
(2,776 |
) |
Impairment of goodwill |
|
|
— |
|
|
|
(804 |
) |
|
|
— |
|
|
|
|
|
|
|
|
|
|
|
Operating income (loss) |
|
|
31,291 |
|
|
|
16,096 |
|
|
|
14,391 |
|
|
|
|
|
|
|
|
|
|
|
Other income (expense): |
|
|
|
|
|
|
|
|
|
|
|
|
Interest and other income |
|
|
48 |
|
|
|
238 |
|
|
|
410 |
|
|
|
|
|
|
|
|
|
|
|
Income (loss) before gain on issuance of units by the Partnership and income taxes |
|
|
31,339 |
|
|
|
16,334 |
|
|
|
14,801 |
|
Gain on issuance of units in the Partnership |
|
|
— |
|
|
|
14,748 |
|
|
|
7,461 |
|
Income tax provision expense |
|
|
(15,697 |
) |
|
|
(6,849 |
) |
|
|
(10,086 |
) |
|
|
|
|
|
|
|
|
|
|
Net income |
|
$ |
15,642 |
|
|
$ |
24,233 |
|
|
$ |
12,176 |
|
|
|
|
|
|
|
|
|
|
|
Net income per common share: |
|
|
|
|
|
|
|
|
|
|
|
|
Basic |
|
$ |
0.33 |
|
|
$ |
0.52 |
|
|
$ |
0.26 |
|
|
|
|
|
|
|
|
|
|
|
Diluted |
|
$ |
0.33 |
|
|
$ |
0.51 |
|
|
$ |
0.26 |
|
|
|
|
|
|
|
|
|
|
|
Weighted average common shares outstanding: |
|
|
|
|
|
|
|
|
|
|
|
|
Basic |
|
|
46,476 |
|
|
|
46,298 |
|
|
|
45,988 |
|
|
|
|
|
|
|
|
|
|
|
Diluted |
|
|
46,535 |
|
|
|
46,589 |
|
|
|
46,607 |
|
|
|
|
|
|
|
|
|
|
|
See “Notes to Consolidated Financial Statements” of Crosstex Energy, Inc. included in this report.
F-38
CROSSTEX ENERGY, INC. (PARENT COMPANY)
CONDENSED STATEMENTS OF CASH FLOWS
| |
|
|
|
|
|
|
|
|
|
|
|
|
| |
|
Years Ended December 31, |
|
| |
|
2009 |
|
|
2008 |
|
|
2007 |
|
| |
|
(In thousands) |
|
Cash flows from operating activities: |
|
|
|
|
|
|
|
|
|
|
|
|
Net income |
|
$ |
15,642 |
|
|
$ |
24,233 |
|
|
$ |
12,176 |
|
Adjustments to reconcile net income (loss) to net cash flow provided by (used
in) operating activities: |
|
|
|
|
|
|
|
|
|
|
|
|
Income from investment in the Partnership, including discontinued operations |
|
|
(33,929 |
) |
|
|
(20,428 |
) |
|
|
(17,202 |
) |
Loss from investment in subsidiary |
|
|
— |
|
|
|
139 |
|
|
|
35 |
|
Impairment |
|
|
— |
|
|
|
804 |
|
|
|
— |
|
Deferred taxes |
|
|
15,697 |
|
|
|
6,849 |
|
|
|
10,086 |
|
Stock-based compensation |
|
|
113 |
|
|
|
36 |
|
|
|
(25 |
) |
Gain on issuance of units in the Partnership |
|
|
— |
|
|
|
(14,748 |
) |
|
|
(7,461 |
) |
Changes in assets and liabilities: |
|
|
|
|
|
|
|
|
|
|
|
|
Accounts receivable, prepaid expenses and other |
|
|
463 |
|
|
|
(467 |
) |
|
|
68 |
|
Accounts payable and other accrued liabilities |
|
|
(116 |
) |
|
|
118 |
|
|
|
116 |
|
|
|
|
|
|
|
|
|
|
|
Net cash used in operating activities |
|
|
(2,130 |
) |
|
|
(3,464 |
) |
|
|
(2,207 |
) |
|
|
|
|
|
|
|
|
|
|
Cash flows from investing activities: |
|
|
|
|
|
|
|
|
|
|
|
|
Investment in the Partnership |
|
|
(21 |
) |
|
|
(2,193 |
) |
|
|
(4,014 |
) |
Distributions from the Partnership |
|
|
4,333 |
|
|
|
76,026 |
|
|
|
47,565 |
|
Contributions to subsidiary |
|
|
— |
|
|
|
(139 |
) |
|
|
(35 |
) |
|
|
|
|
|
|
|
|
|
|
Net cash provided by investing activities |
|
|
4,312 |
|
|
|
73,694 |
|
|
|
43,516 |
|
|
|
|
|
|
|
|
|
|
|
Cash flows from financing activities: |
|
|
|
|
|
|
|
|
|
|
|
|
Proceeds from exercise of common stock options |
|
|
— |
|
|
|
244 |
|
|
|
98 |
|
Conversion of restricted stock, net of shares withheld for taxes |
|
|
(354 |
) |
|
|
(3,815 |
) |
|
|
(919 |
) |
Common dividends paid |
|
|
(4,228 |
) |
|
|
(62,048 |
) |
|
|
(42,588 |
) |
|
|
|
|
|
|
|
|
|
|
Net cash used in financing activities |
|
|
(4,582 |
) |
|
|
(65,619 |
) |
|
|
(43,409 |
) |
|
|
|
|
|
|
|
|
|
|
Net increase (decrease) in cash |
|
|
(2,400 |
) |
|
|
4,611 |
|
|
|
(2,100 |
) |
Cash, beginning of year |
|
|
12,323 |
|
|
|
7,712 |
|
|
|
9,812 |
|
|
|
|
|
|
|
|
|
|
|
Cash, end of year |
|
$ |
9,923 |
|
|
$ |
12,323 |
|
|
$ |
7,712 |
|
|
|
|
|
|
|
|
|
|
|
See “Notes to Consolidated Financial Statements” of Crosstex Energy, Inc. included in this report.
F-39
SCHEDULE II
CROSSTEX ENERGY, INC.
VALUATION AND QUALIFYING ACCOUNTS
| |
|
|
|
|
|
|
|
|
|
|
|
|
|
|
|
|
| |
|
Balance at |
|
|
Charged to |
|
|
|
|
|
|
Balance at |
|
| |
|
Beginning |
|
|
Costs and |
|
|
|
|
|
|
End of |
|
| |
|
of Period |
|
|
Expenses |
|
|
Deductions |
|
|
Period |
|
| |
|
(In thousands) |
|
Year Ended December 31, 2009: |
|
|
|
|
|
|
|
|
|
|
|
|
|
|
|
|
Allowance for doubtful accounts |
|
$ |
3,655 |
|
|
$ |
1,070 |
|
|
$ |
4,315 |
|
|
$ |
410 |
|
Year Ended December 31, 2008: |
|
|
|
|
|
|
|
|
|
|
|
|
|
|
|
|
Allowance for doubtful accounts |
|
$ |
985 |
|
|
$ |
2,670 |
|
|
$ |
— |
|
|
$ |
3,655 |
|
Year Ended December 31, 2007: |
|
|
|
|
|
|
|
|
|
|
|
|
|
|
|
|
Allowance for doubtful accounts |
|
$ |
618 |
|
|
$ |
367 |
|
|
$ |
— |
|
|
$ |
985 |
|
F-40
EXHIBIT INDEX
| |
|
|
|
|
|
|
| Number |
|
|
|
Description |
| |
|
|
|
|
|
|
| |
2.1** |
|
|
—
|
|
Partnership Interest Purchase and Sale Agreement,
dated as of June 9, 2009, among Crosstex Energy
Services, L.P., Crosstex Energy Services GP, LLC,
Crosstex CCNG Gathering, Ltd., Crosstex CCNG
Transmission Ltd., Crosstex Gulf Coast Transmission
Ltd., Crosstex Mississippi Pipeline, L.P., Crosstex
Mississippi Gathering, L.P., Crosstex Mississippi
Industrial Gas Sales, L.P., Crosstex Alabama Gathering
System, L.P., Crosstex Midstream Services, L.P.,
Javelina Marketing Company Ltd., Javelina NGL Pipeline
Ltd. and Southcross Energy LLC (incorporated by
reference to Exhibit 2.1 to Crosstex Energy, L.P.’s
Current Report on Form 8-K dated June 9, 2009, filed
with the Commission on June 11, 2009, file No.
000-50067). |
| |
|
|
|
|
|
|
| |
2.2** |
|
|
—
|
|
Partnership Interest Purchase and Sale Agreement,
dated as of August 28, 2009, among Crosstex Energy
Services, L.P., Crosstex Energy Services GP, LLC,
Crosstex Treating Services, L.P. and KM Treating GP
LLC (incorporated by reference to Exhibit 2.1 to
Crosstex Energy, L.P.’s Current Report on Form 8-K
dated August 28, 2009, filed with the Commission on
September 3, 2009, file No. 000-50067). |
| |
|
|
|
|
|
|
| |
3.1 |
|
|
—
|
|
Amended and Restated Certificate of Incorporation of
Crosstex Energy, Inc. (incorporated by reference to
Exhibit 3.1 to our Current Report on Form 8-K dated
October 26, 2006, filed with the Commission on October
31, 2006, file No. 000-50536). |
| |
|
|
|
|
|
|
| |
3.2 |
|
|
—
|
|
Third Amended and Restated Bylaws of Crosstex Energy,
Inc. (incorporated by reference to Exhibit 3.1 to our
Current Report on Form 8-K dated March 22, 2006, filed
with the Commission on March 28, 2006, file No.
000-50536). |
| |
|
|
|
|
|
|
| |
3.3 |
|
|
—
|
|
Certificate of Limited Partnership of Crosstex Energy,
L.P. (incorporated by reference to Exhibit 3.1 to
Crosstex Energy, L.P.’s Registration Statement on Form
S-1, file No. 333-97779). |
| |
|
|
|
|
|
|
| |
3.4 |
|
|
—
|
|
Sixth Amended and Restated Agreement of Limited
Partnership of Crosstex Energy, L.P., dated as of
March 23, 2007 (incorporated by reference to Exhibit
3.1 to Crosstex Energy, L.P.’s Current Report on Form
8-K dated March 23, 2007, filed with the Commission on
March 27, 2007, file No. 000-50067). |
| |
|
|
|
|
|
|
| |
3.5 |
|
|
—
|
|
Amendment No. 1 to Sixth Amended and Restated
Agreement of Limited Partnership of Crosstex Energy,
L.P., dated December 20, 2007 (incorporated by
reference to Exhibit 3.1 to Crosstex Energy, L.P.’s
Current Report on Form 8-K dated December 20, 2007,
filed with the Commission on December 21, 2007, file
No. 000-50067). |
| |
|
|
|
|
|
|
| |
3.6 |
|
|
—
|
|
Amendment No. 2 to Sixth Amended and Restated
Agreement of Limited Partnership of Crosstex Energy,
L.P. (incorporated by reference to Exhibit 3.1 to
Crosstex Energy, L.P.’s Current Report on Form 8-K
dated March 27, 2008, filed with the Commission on
March 28, 2008, file No. 000-50067). |
| |
|
|
|
|
|
|
| |
3.7 |
|
|
—
|
|
Amendment No. 3 to Sixth Amended and Restated
Agreement of Limited Partnership of Crosstex Energy,
L.P., dated as of January 19, 2010 (incorporated by
reference to Exhibit 3.1 to Crosstex Energy, L.P.’s
Current Report on Form 8-K dated January 19, 2010,
filed with the Commission on January 22, 2010, file
No. 000-50067). |
| |
|
|
|
|
|
|
| |
3.8 |
|
|
—
|
|
Certificate of Limited Partnership of Crosstex Energy
Services, L.P. (incorporated by reference to Exhibit
3.3 to Crosstex Energy, L.P.’s Registration Statement
on Form S-1, file No. 333-97779). |
| |
|
|
|
|
|
|
| |
3.9 |
|
|
—
|
|
Second Amended and Restated Agreement of Limited
Partnership of Crosstex Energy Services, L.P., dated
as of April 1, 2004 (incorporated by reference to
Exhibit 3.5 to Crosstex Energy, L.P.’s Quarterly
Report on Form 10-Q for the quarterly period ended
March 31, 2004, file No. 000-50067). |
| |
|
|
|
|
|
|
| |
3.10 |
|
|
—
|
|
Certificate of Limited Partnership of Crosstex Energy
GP, L.P. (incorporated by reference to Exhibit 3.5 to
Crosstex Energy, L.P.’s Registration Statement on Form
S-1, file No. 333-97779). |
| |
|
|
|
|
|
|
| |
3.11 |
|
|
—
|
|
Agreement of Limited Partnership of Crosstex Energy
GP, L.P., dated as of July 12, 2002 (incorporated by
reference to Exhibit 3.6 to Crosstex Energy, L.P.’s
Registration Statement on Form S-1, file No.
333-97779). |
| |
|
|
|
|
|
|
| |
3.12 |
|
|
—
|
|
Certificate of Formation of Crosstex Energy GP, LLC
(incorporated by reference to Exhibit 3.7 to Crosstex
Energy, L.P.’s Registration Statement on Form S-1,
file No. 333-97779). |
| |
|
|
|
|
|
|
| |
3.13 |
|
|
—
|
|
Amended and Restated Limited Liability Company
Agreement of Crosstex Energy GP, LLC, dated as of
December 17, 2002 (incorporated by reference to
Exhibit 3.8 to Crosstex Energy, L.P.’s Registration
Statement on Form S-1, file No. 333-97779). |
| |
|
|
|
|
|
|
| |
3.14 |
|
|
—
|
|
Amendment No. 1 to Amended and Restated Limited
Liability Company Agreement of Crosstex Energy GP,
LLC, dated as of January 19, 2010 (incorporated by
reference to Exhibit 3.2 to Crosstex Energy, L.P.’s
Current Report on Form 8-K dated January 19, 2010,
filed with the Commission on January 22, 2010, file
No. 000-50067). |
| |
|
|
|
|
|
|
| |
4.1 |
|
|
—
|
|
Specimen Certificate representing shares of common
stock (incorporated by reference from Exhibit 4.1 to
our Registration Statement on Form S-1, file No.
333-110095). |
| |
|
|
|
|
|
|
| Number |
|
|
|
Description |
| |
|
|
|
|
|
|
| |
4.2 |
|
|
—
|
|
Registration Rights Agreement, dated as of March 23,
2007, by and among Crosstex Energy, L.P. and each of
the Purchasers set forth on Schedule A thereto
(incorporated by reference to Exhibit 4.1 to Crosstex
Energy, L.P.’s Current Report on Form 8-K dated March
23, 2007, filed with the Commission on March 27, 2007,
file No. 000-50067). |
| |
|
|
|
|
|
|
| |
4.3 |
|
|
—
|
|
Registration Rights Agreement, dated as of January 19,
2010, by and among Crosstex Energy, L.P. and GSO
Crosstex Holdings LLC (incorporated by reference to
Exhibit 4.1 to Crosstex Energy, L.P.’s Current Report
on Form 8-K dated January 19, 2010, filed with the
Commission on January 22, 2010, file No. 000-50067). |
| |
|
|
|
|
|
|
| |
4.4 |
|
|
—
|
|
Indenture, dated as of February 10, 2010, by and among
Crosstex Energy, L.P., Crosstex Energy Finance
Corporation, the Guarantors named therein and Wells
Fargo Bank, National Association, as trustee
(incorporated by reference to Exhibit 4.1 to Crosstex
Energy, L.P.’s Current Report on Form 8-K dated
February 10, 2010, filed with the Commission on
February 16, 2010, file No. 000-50067). |
| |
|
|
|
|
|
|
| |
4.5 |
|
|
—
|
|
Registration Rights Agreement, dated as of February
10, 2010, by and among Crosstex Energy, L.P., Crosstex
Energy Finance Corporation, the Guarantors named
therein and the Initial Purchasers named therein
(incorporated by reference to Exhibit 4.2 to Crosstex
Energy, L.P.’s Current Report on Form 8-K dated
February 10, 2010, filed with the Commission on
February 16, 2010, file No. 000-50067). |
| |
|
|
|
|
|
|
| |
10.1 |
† |
|
—
|
|
Crosstex Energy, Inc. Amended and Restated Long-Term
Incentive Plan effective as of September 6, 2006
(incorporated by reference to Exhibit 10.1 to our
Current Report on Form 8-K dated October 26, 2006,
filed with the Commission on October 31, 2006, file
No. 000-50536). |
| |
|
|
|
|
|
|
| |
10.2 |
† |
|
—
|
|
Crosstex Energy GP, LLC Amended and Restated Long-Term
Incentive Plan, dated March 17, 2009 (incorporated by
reference to Exhibit 10.3 to Crosstex Energy, L.P.’s
Quarterly Report on Form 10-Q for the quarter ended
March 31, 2009, file No. 000-50067). |
| |
|
|
|
|
|
|
| |
10.3 |
† |
|
—
|
|
Crosstex Energy, Inc. 2009 Long-Term Incentive Plan,
effective March 17, 2009 (incorporated by reference to
Exhibit 10.3 to our Quarterly Report on Form 10-Q for
the quarter ended March 31, 2009, file No. 000-50536). |
| |
|
|
|
|
|
|
| |
10.4 |
|
|
—
|
|
Omnibus Agreement, dated December 17, 2002, among
Crosstex Energy, L.P. and certain other parties
(incorporated by reference to Exhibit 10.5 to Crosstex
Energy, L.P.’s Annual Report on Form 10-K for the year
ended December 31, 2002, file No. 000-50067). |
| |
|
|
|
|
|
|
| |
10.5 |
† |
|
—
|
|
Form of Employment Agreement (incorporated by
reference to Exhibit 10.6 to Crosstex Energy, L.P.’s
Annual Report on Form 10-K for the year ended December
31, 2002, file No. 000-50067). |
| |
|
|
|
|
|
|
| |
10.6 |
† |
|
—
|
|
Form of Severance Agreement (incorporated by reference
to Exhibit 10.6 to Crosstex Energy, L.P.’s Annual
Report on Form 10K for the year ended December 31,
2009, file No. 000-50067). |
| |
|
|
|
|
|
|
| |
10.7 |
† |
|
—
|
|
Form of Performance Unit Agreement (incorporated by
reference to Exhibit 10.1 to Crosstex Energy, L.P.’s
Current Report on Form 8-K dated June 27, 2007, filed
with the Commission on July 3, 2007, file No.
000-50067). |
| |
|
|
|
|
|
|
| |
10.8 |
† |
|
—
|
|
Form of Performance Share Agreement (incorporated by
reference to Exhibit 10.1 to our Current Report on
Form 8-K dated June 27, 2007, filed with the
Commission on July 3, 2007, file No. 000-50536). |
| |
|
|
|
|
|
|
| |
10.9 |
†* |
|
—
|
|
Form
of Restricted Stock Agreement. |
| |
|
|
|
|
|
|
| |
10.10 |
† |
|
—
|
|
Form of Restricted Unit Agreement (incorporated
by reference to Exhibit 10.9 to Crosstex Energy,
L.P.’s Annual Report on Form 10-K for the year
ended December 31, 2009, file No. 000-50067). |
| |
|
|
|
|
|
|
| |
10.11 |
|
|
—
|
|
Senior Subordinated Series D Unit Purchase Agreement,
dated as of March 23, 2007, by and among Crosstex
Energy, L.P. and each of the Purchasers set forth on
Schedule A thereto (incorporated by reference to
Exhibit 10.1 to Crosstex Energy, L.P.’s Current Report
on Form 8-K dated March 23, 2007, filed with the
Commission on March 27, 2007, file No. 000-50067). |
| |
|
|
|
|
|
|
| |
10.12 |
|
|
—
|
|
Common Unit Purchase Agreement, dated as of April 8,
2008, by and among Crosstex Energy, L.P. and each of
the Purchasers set forth Schedule A thereto
(incorporated by reference to Exhibit 10.1 to Crosstex
Energy, L.P.’s Current Report on Form 8-K dated April
9, 2008, file No. 000-50067). |
| |
|
|
|
|
|
|
| |
10.13 |
|
|
—
|
|
Form of Indemnity Agreement (incorporated by reference
to Exhibit 10.2 to our Annual Report on Form 10-K for
the year ended December 31, 2003, file No. 000-50536). |
| |
|
|
|
|
|
|
| |
10.14 |
|
|
—
|
|
Board Representation Agreement, dated as of January
19, 2010, by and among Crosstex Energy GP, LLC,
Crosstex Energy GP, L.P., Crosstex Energy, L.P.,
Crosstex Energy, Inc. and GSO Crosstex Holdings LLC
(incorporated by reference to Exhibit 10.1 to Crosstex
Energy, L.P.’s Current Report on Form 8-K dated
January 19, 2010, filed with the Commission on January
22, 2010, file No. 000-50067). |
| |
|
|
|
|
|
|
| |
10.15 |
|
|
—
|
|
Purchase Agreement, dated as of February 3, 2010, by
and among Crosstex Energy, L.P., Crosstex Energy
Finance Corporation, the Guarantors named therein and
the Initial Purchasers named therein (incorporated by
reference to Exhibit 10.1 to Crosstex Energy, L.P.’s
Current Report on Form 8-K dated February 3, 2010,
filed with the Commission on February 5, 2010, file
No. 000-50067). |
| |
|
|
|
|
|
|
| Number |
|
|
|
Description |
| |
|
|
|
|
|
|
| |
10.16 |
|
|
—
|
|
Amended and Restated Credit Agreement, dated as of
February 10, 2010, by and among Crosstex Energy, L.P.,
Bank of America, N.A., as Administrative Agent and L/C
Issuer thereunder, and the other lenders party thereto
(incorporated by reference to Exhibit 10.1 to Crosstex
Energy, L.P.’s Current Report on Form 8-K dated
February 10, 2010, filed with the Commission on
February 16, 2010, file No. 000-50067). |
| |
|
|
|
|
|
|
| |
10.17 |
|
|
—
|
|
Agreement Regarding 2003 Registration Statement and
Waiver and Termination of Stockholders’ Agreement,
dated October 27, 2003 (incorporated by reference from
Exhibit 10.4 to our Annual Report on Form 10-K for the
year ended December 31, 2003, file No. 000-50536). |
| |
|
|
|
|
|
|
| |
10.18 |
|
|
—
|
|
Registration Rights Agreement, dated December 31, 2003
(incorporated by reference from Exhibit 10.6 to our
Annual Report on Form 10-K for the year ended December
31, 2003, file No. 000-50536). |
| |
|
|
|
|
|
|
| |
21.1 |
* |
|
—
|
|
List of Subsidiaries. |
| |
|
|
|
|
|
|
| |
23.1 |
* |
|
—
|
|
Consent of KPMG LLP. |
| |
|
|
|
|
|
|
| |
31.1 |
* |
|
—
|
|
Certification of the Principal Executive Officer. |
| |
|
|
|
|
|
|
| |
31.2 |
* |
|
—
|
|
Certification of the Principal Financial Officer. |
| |
|
|
|
|
|
|
| |
32.1 |
* |
|
—
|
|
Certification of the Principal Executive Officer and
the Principal Financial Officer of the Company
pursuant to 18 U.S.C. Section 1350. |
| |
|
|
| * |
|
Filed herewith. |
| |
| ** |
|
In accordance with the
instructions to item 601(b)(2) of Regulation S-K, the exhibits and
schedules to Exhibits 2.1 and 2.2 are not filed herewith. The
agreements identify such exhibits and schedules, including the
general nature of their content. We undertake to provide such
exhibits and schedules to the Commission upon request. |
| |
| † |
|
As required by Item 15(a)(3), this exhibit is identified as a
compensatory benefit plan or arrangement. |