Attached files
| file | filename |
|---|---|
| EX-23 - EXHIBIT 23 - CLEAN HARBORS INC | a2196913zex-23.htm |
| EX-32 - EXHIBIT 32 - CLEAN HARBORS INC | a2196913zex-32.htm |
| EX-24 - EXHIBIT 24 - CLEAN HARBORS INC | a2196913zex-24.htm |
| EX-31.2 - EXHIBIT 31.2 - CLEAN HARBORS INC | a2196913zex-31_2.htm |
| EX-31.1 - EXHIBIT 31.1 - CLEAN HARBORS INC | a2196913zex-31_1.htm |
| EX-4.37A - EXHIBIT 4,37A - CLEAN HARBORS INC | a2196913zex-4_37a.htm |
| EX-4.33C - EXHIBIT 4.33C - CLEAN HARBORS INC | a2196913zex-4_33c.htm |
| EX-21 - EXHIBIT 21 - CLEAN HARBORS INC | a2196913zex-21.htm |
| EX-4.35A - EXHIBIT 4.35A - CLEAN HARBORS INC | a2196913zex-4_35a.htm |
UNITED STATES
SECURITIES AND EXCHANGE COMMISSION
Washington, D.C. 20549
FORM 10-K
| ý | ANNUAL REPORT PURSUANT TO SECTION 13 OR 15(d) OF THE SECURITIES EXCHANGE ACT OF 1934 | |
For the fiscal year ended December 31, 2009 |
||
OR |
||
o |
TRANSITION REPORT PURSUANT TO SECTION 13 OR 15(d) OF THE SECURITIES EXCHANGE ACT OF 1934 |
|
For the transition period from to . |
||
COMMISSION FILE NO. 001-34223
CLEAN HARBORS, INC.
(Exact name of registrant as specified in its charter)
| Massachusetts (State or other jurisdiction of incorporation or organization) |
04-2997780 (IRS Employer Identification No.) |
|
42 Longwater Drive, Norwell, MA (Address of principal executive offices) |
02061-9149 (Zip Code) |
|
Registrant's telephone number: (781) 792-5000 |
||
Securities registered pursuant to Section 12(b) of the Securities Exchange Act of 1934:
| Title of each class: | Name of each exchange on which registered: | |
|---|---|---|
| Common Stock, $.01 par value | New York Stock Exchange |
Securities registered pursuant to Section 12(g) of the Securities Exchange Act of 1934:
None
Indicate by check mark if the registrant is a well-known seasoned issuer, as defined in Rule 405 of the Securities Act. Yes ý No o
Indicate by check mark if the registrant is not required to file reports pursuant to Section 13 or Section 15(d) of the Exchange Act. Yes o No ý
Indicate by check mark whether the registrant (1) has filed all reports required to be filed by Section 13 or 15(d) of the Securities Exchange Act of 1934 during the preceding twelve months (or for such shorter period that the registrant was required to file such reports) and (2) has been subject to such filing requirements for the past 90 days. Yes ý No o
Indicate by check mark whether the registrant has submitted electronically and posted on its corporate Web site, if any, every Interactive Data File required to be submitted and posted pursuant to Rule 405 of Regulation S-T during the preceding 12 months (or for such shorter period that the registrant was required to submit and post such files). Yes o No o
Indicate by check mark if disclosure of delinquent filers pursuant to Item 405 of Regulation S-K is not contained herein, and will not be contained, to the best of the registrant's knowledge, in definitive proxy or information statements incorporated by reference in Part III of this Form 10-K or any amendment to this Form 10-K. o
Indicate by check mark whether the registrant is a large accelerated filer, an accelerated filer, a non-accelerated filer, or a smaller reporting company. See the definitions of "large accelerated filer," accelerated filer" and "smaller reporting company" in Rule 12b-2 of the Exchange Act. (Check one):
| Large accelerated filer ý | Accelerated filer o | Non-accelerated filer o (Do not check if a smaller reporting company) |
Smaller reporting company o |
Indicate by check mark whether the registrant is a shell company (as defined in Rule 12b-2 of the Exchange Act). Yes o No ý
On June 30, 2009 (the last business day of the registrant's most recently completed second fiscal quarter), the aggregate market value of the voting and non-voting common stock of the registrant held by non-affiliates of the registrant was approximately $1.1 billion, based on the closing price of such common stock as of that date on the New York Stock Exchange. Reference is made to Part III of this report for the assumptions on which this calculation is based.
On February 25, 2010, there were outstanding 26,249,155 shares of Common Stock, $.01 par value.
DOCUMENTS INCORPORATED BY REFERENCE
Certain portions of the registrant's definitive proxy statement for its 2010 annual meeting of stockholders (which will be filed with the Commission not later than April 30, 2010) are incorporated by reference into Part III of this report.
CLEAN HARBORS, INC.
ANNUAL REPORT ON FORM 10-K
YEAR ENDED DECEMBER 31, 2009
TABLE OF CONTENTS
Disclosure Regarding Forward-Looking Statements
In addition to historical information, this annual report contains forward-looking statements, which are generally identifiable by use of the words "believes," "expects," "intends," "anticipates," "plans to," "estimates," "projects," or similar expressions. These forward-looking statements are subject to certain risks and uncertainties that could cause actual results to differ materially from those reflected in such forward-looking statements. Factors that might cause such a difference include, but are not limited to, those discussed in this report under Item 1A, "Risk Factors." Readers are cautioned not to place undue reliance on these forward-looking statements, which reflect managements' opinions only as of the date hereof. We undertake no obligation to revise or publicly release the results of any revision to these forward-looking statements. Readers should also carefully review the risk factors described in other documents which we file from time to time with the Securities and Exchange Commission (the "SEC"), including the quarterly reports on Form 10-Q to be filed by us during 2010.
General
Clean Harbors, Inc. and its subsidiaries (collectively, "we," "Clean Harbors" or the "Company") is a leading provider of environmental, energy and industrial services throughout North America. We serve over 50,000 customers, including a majority of Fortune 500 companies, thousands of smaller private entities and numerous federal, state, provincial and local governmental agencies. We have more than 175 locations, including over 50 waste management facilities, throughout North America in 36 U.S. states, seven Canadian provinces, Mexico and Puerto Rico. We also operate international locations in Bulgaria, China, Singapore, Sweden, Thailand and the United Kingdom.
On July 31, 2009, we acquired 100% of the outstanding common shares of Eveready Inc. ("Eveready"), an Alberta corporation headquartered in Edmonton, Alberta. Eveready provides industrial maintenance and production, lodging, and exploration services to the oil and gas, chemical, pulp and paper, manufacturing and power generation industries. We anticipate this acquisition will enhance our presence in the energy and industrial services market, broaden the range of services we can offer customers, and advance our position in the Canadian marketplace.
The purchase price of the acquisition totaled $410 million and included the issuance of 2.4 million shares of our common stock, assumption of $237 million of Eveready debt, and a cash payment of $56 million to the former Eveready shareholders. The acquisition was announced in April 2009, and as a condition to the approval of the acquisition by the Canadian Commissioner of Competition, we agreed to divest Eveready's Pembina Area Landfill, located near Drayton Valley, Alberta, due to its proximity to our existing landfill in the region.
In connection with the closing of the Eveready acquisition, we re-aligned and expanded our reportable segments. This new structure reflects the way our management makes operating decisions and manages the growth and profitability of our business. The amounts presented for all prior periods throughout this report have been recast to reflect the impact of such changes. Under the new structure, we report our business in four operating segments, including:
- •
- Technical Services—provide a broad range of hazardous material management services including the packaging, collection, transportation, treatment and disposal of hazardous and non-hazardous waste at Company-owned incineration, landfill, wastewater, and other treatment facilities.
1
- •
- Field Services—provide a wide variety of environmental cleanup
services on customer sites or other locations on a scheduled or emergency response basis including tank cleaning, decontamination, remediation, and spill cleanup.
- •
- Industrial Services—provide industrial and specialty services,
such as high-pressure and chemical cleaning, catalyst handling, decoking, material processing and industrial lodging services to refineries, chemical plants, pulp and paper mills, and
other industrial facilities.
- •
- Exploration Services—provide exploration and directional boring services to the energy sector serving oil and gas exploration and production, and power generation.
Technical Services and Field Services are included as part of Clean Harbors Environmental Services, and Industrial Services and Exploration Services are included as part of Clean Harbors Energy and Industrial Services.
In connection with our acquisition of Eveready, we were required to obtain waivers from the lenders under our and Eveready's respective then existing credit agreements to allow for the completion of the acquisition and the repayment of Eveready's then outstanding 7% convertible subordinated debentures, and also concurrently with or following the acquisition to secure financing sufficient to pay off or restructure substantially all of the then remaining Eveready indebtedness. We obtained the necessary waivers prior to the closing of the acquisition and subsequently met the financing requirement on August 14, 2009 by issuing $300.0 million principal amount of 75/8% senior secured notes for net proceeds of $292.1 million. We used most of the net proceeds of the offering to repay and terminate substantially all of the then outstanding Eveready debt (other than certain capital leases) assumed in connection with the acquisition and to pay related fees and expenses.
Clean Harbors, Inc. was incorporated in Massachusetts in 1980 and our principal office is located in Norwell, Massachusetts. Effective December 15, 2008, shares of our common stock began trading on the New York Stock Exchange under the symbol CLH. Prior to that time, our stock was traded on The NASDAQ Global Select Market under the symbol CLHB. We maintain a website at the following Internet address: http://www.cleanharbors.com. Through a link on this website to the SEC website, http://www.sec.gov, we provide free access to our annual reports on Form 10-K, quarterly reports on Form 10-Q, current reports on Form 8-K and amendments to those reports filed or furnished pursuant to Section 13(a) or 15(d) of the Securities Exchange Act of 1934 as soon as reasonably practicable after electronic filing with the SEC. Our guidelines on corporate governance, the charters for our Board Committees, and our code of ethics for members of the Board of Directors, senior officers and the chief executive officer are also available on our website, and we will post on our website any waivers of, or amendments to, such code of ethics. Our website and the information contained therein or connected thereto are not incorporated by reference into this annual report.
Health & Safety
Health & Safety is our #1 priority—companywide. Employees at all levels of the Company share this philosophy and are committed to ensuring our safety goals are met. Our commitment to health and safety benefits everyone—our employees, our customers, the community, and the environment. Through the efforts of all our employees, we have implemented a successful health and safety-based culture that has continued to lower our Total Recordable Incident Rate ("TRIR"); Days Away, Restricted Activity and Transfer Rate ("DART"); and Experience Modification Rate ("EMR").
In order to protect our employees, continue to lower our incident rates, and satisfy our customers' demands to retain the best service providers with the lowest TRIR, DART and EMR rates, we must continuously improve on our health and safety performance. To meet all of these requirements we launched SafetyFirst!, a comprehensive program companywide. SafetyFirst! is an employee-based program. All employees recognize the importance of protecting themselves, their fellow employees,
2
their customers, and all those around them from harm. They demonstrate through their words and actions that they will reinforce acceptable safety practices and stop unsafe acts before those acts become a statistic. SafetyFirst! is not just a slogan—it's our commitment to keep the protection of our fellow workers in the forefront of everything we do.
Compliance
We regard compliance with applicable environmental regulations as critical components of our overall operations. We strive to maintain the highest professional standards in our compliance activities. Our internal operating requirements are in many instances more stringent than those imposed by regulation. Our compliance program has been developed for each of our waste management facilities and service centers under the direction of our corporate staff. The compliance staff is responsible for facilities permitting and regulatory compliance, compliance training, transportation compliance, and related record keeping. To ensure the effectiveness of our regulatory compliance program, our compliance staff monitors daily operational activities and issues a monthly report to senior management concerning the status of environmental compliance and health and safety programs. We also have an Environmental Health and Safety Compliance Internal Audit Program designed to identify any weaknesses or opportunities for improvement in our ongoing compliance programs. We also perform periodic audits and inspections of the disposal facilities of other firms which we utilize.
Our facilities are frequently inspected and audited by regulatory agencies, as well as by customers. Although our facilities have been cited on occasion for regulatory violations, we believe that each of our facilities is currently in substantial compliance with applicable requirements. Each of our major facilities and service centers has a full-time compliance representative to oversee the implementation of our compliance program at the facility or service center.
Strategy
Our strategy is to develop and maintain ongoing relationships with a diversified group of customers who have recurring needs for environmental, energy or industrial services. We strive to be recognized as the premier supplier of a broad range of value-added services based upon quality, responsiveness, customer service, information technologies, breadth of service offerings and cost effectiveness.
The principal elements of our business strategy are to:
- •
- Expand Service Offerings and Geographic Coverage—We believe
our Technical and Field Services segments have a competitive advantage, particularly in areas where service centers are located at or near a treatment, storage and disposal facility ("TSDF"). By
opening additional service centers in close proximity to our TSDFs, we believe that we can, with minimal capital expenditures, increase our market share within the Field Services segment. We believe
this will drive additional waste to our existing facilities, thereby increasing utilization and enhancing overall profitability. Furthermore, we believe we can expand our Industrial and Exploration
Services segments across a broader geographic area, thereby providing additional services to new markets.
- •
- Cross-Sell Across Segments—We believe the breadth
of our service offerings allows us to provide additional services to existing customers. In particular, we believe we can provide energy and industrial services to customers which traditionally have
only used our environmental services and environmental services to customers which traditionally have only used our energy and industrial services. We believe leveraging our ability to
cross-sell environmental and energy and industrial services will drive increased revenue within our existing customer base.
- •
- Capture Large-Scale Projects—We provide turnkey offsite transportation and landfill or incineration disposal services for soil and other contaminated media generated from remediation
3
- •
- Expand Throughput Capacity of Existing Waste Facilities—We
operate an extensive network of hazardous waste management facilities and have made substantial investments in these facilities to date, which provide us with significant operating leverage as volumes
increase. In addition, there are opportunities to expand waste handling capacity at these facilities by modifying the terms of the existing permits and by adding equipment and new technology. Through
selected permit modifications, we can expand the range of treatment services offered to our customers without the large capital investment necessary to acquire or build new waste management
facilities.
- •
- Pursue Selective Acquisitions—We actively pursue accretive
"bolt-on" acquisitions in certain services or market sectors where we believe such acquisitions can enhance and expand our business with minimal capital outlay. We believe that we can
expand existing services, especially in our non-disposal services, through strategic acquisitions in order to generate incremental revenues from existing and new customers and to obtain
greater market share. We also continue to review other acquisition possibilities on a case-by-case basis.
- •
- Focus on Cost, Pricing and Productivity Initiatives—We continually seek to increase efficiency and to reduce costs in our business through enhanced technology, process efficiencies and stringent expense management.
activities. We also assist remediation contractors and project managers with support services including groundwater disposal, investigation derived waste disposal, rolloff container management, and many other related services. We believe this will drive incremental waste volume to our existing facilities, thereby increasing utilization and enhancing overall profitability.
Competitive Strengths
- •
- Leading Provider of Environmental, Energy and Industrial
Services—We are one of the largest providers of environmental, energy and industrial services and the largest operator of non-nuclear hazardous waste
treatment facilities in North America based on 2008 industry reports. We provide multi-faceted and low cost services to a broad mix of customers. We attract and better serve our customers because of
our capabilities and the size, scale and geographic location of our assets, which allow us to serve multiple locations.
- •
- Large and Diversified Customer Base—Our customers range from
Fortune 500 companies to midsize and small public and private entities that span multiple industries and business types, including governmental entities. This diversification limits our credit
exposure to any one customer or industry.
- •
- Stable and Recurring Revenue Base—We have
long-standing relationships with our customers. Our diversified customer base also provides stable and recurring revenues as a majority of our revenues are derived from previously served
customers with recurring needs for our services. In addition, the costs to many of our customers of switching providers are high. This is due to many customers' desire to audit disposal facilities
prior to their qualification as approved sites and to limit the number of facilities to which their wastes are shipped in order to reduce their potential liability under U.S. and Canadian
environmental regulations. We have been selected as an approved vendor by large generators of waste because we possess comprehensive collection, recycling, treatment, transportation, disposal, and
waste tracking capabilities and have the expertise necessary to comply with applicable environmental laws and regulations. Those customers that have selected us as an approved vendor typically
continue to use our services on a recurring basis.
- •
- Comprehensive Service Capabilities—Our comprehensive service offerings allow us to act as a full-service provider to our customers. Our full-service orientation creates incremental revenue
4
- •
- Integrated Network of Assets—We operate, in the aggregate, the
largest number of incinerators, landfills, treatment facilities and TSDFs in North America. Our broad service network enables us to effectively handle a waste stream from origin through disposal and
to efficiently direct and internalize our waste streams to reduce costs. As our processing of wastes increase, our size allows us to increase our cash flow and earnings as we can internalize a greater
volume of waste in our incinerators and landfills.
- •
- Regulatory Compliance—We continue to make capital investments
in our facilities to ensure that they are in compliance with current federal, state, provincial and local regulations. Companies that rely on in-house disposal may find the current
regulatory requirements to be too capital-intensive or complicated, and may choose to outsource many of their hazardous waste disposal needs.
- •
- Effective Cost Management—Our significant scale allows us to
maintain low costs through standardized compliance procedures, significant purchasing power, research and development capabilities and our ability to efficiently utilize logistics and transportation
to economically direct waste streams to the most efficient facility. We also have the ability to transport and process with internal resources the substantial majority of all hazardous waste that we
manage for our customers. Finally, we are committed to reducing costs and have reduced headcount and other operating costs.
- •
- Proven and Experienced Management Team—Our executive management team provides depth and continuity. Our 16 executive officers collectively have over 194 years of experience in the environmental, energy and industrial services industries. Our Chief Executive Officer founded our Company in 1980, and the average tenure of the 15 other members of the executive management team exceeds 11 years.
growth as customers seek to minimize the number of outside vendors and demand "one-stop" service providers. We also have the ability to cross-sell our energy and industrial services to customers who have traditionally used our environmental services, while also cross-selling environmental services to customers who have traditionally used our energy and industrial services. Our expanded geographic coverage maximizes the number of customer facilities that we can service.
Operations
General
We report our business in the previously discussed four operating segments, which are Technical Services, Field Services, Industrial Services and Exploration Services.
Seasonality and Cyclical Nature of Business. Our operations may be affected by seasonal fluctuations due to weather and budgetary cycles influencing the timing of customers' spending for remedial activities. Typically during the first quarter of each year there is less demand for environmental services due to the cold weather, particularly in the Northern and Midwestern United States and Canada. Accordingly, reduced volumes of waste are received at our facilities and higher operating costs are associated with operating in sub-freezing weather and high levels of snowfall. In addition, factory closings for the year-end holidays reduce the volume of industrial waste generated, which results in lower volumes of waste handled by us during the first quarter of the following year.
Conversely, typically during the first quarter of each year there is more demand for energy and industrial services due to the cold weather, particularly in Alberta, Canada, and less demand during the warmer months. The main reason for this is that the areas we service in Alberta are easier to access when the cold conditions make the terrain more suitable for companies to deploy their equipment. During the warmer months, thawing and mud conditions may impede deployment of equipment.
5
Geographical Information. For the year ended December 31, 2009, we derived $787.9 million or 73.3% of revenues from customers located in the United States and Puerto Rico, $285.7 million or 26.6% of revenues from customers located in Canada, and less than 1.0% of revenues from customers in other international locations. For the year ended December 31, 2008, we derived approximately $897.2 million or 87.0% of revenues from customers located in the United States and Puerto Rico, approximately $132.8 million or 12.9% of revenues from customers located in Canada, and less than 1.0% of revenues from customers in Mexico.
Technical Services
These services involve the collection, transport, treatment and disposal of hazardous and non-hazardous wastes, and include resource recovery, physical treatment, fuels blending, incineration, landfill disposal, wastewater treatment, lab chemical disposal, explosives management, and CleanPack® services. Our CleanPack services include the collection, identification and categorization, specialized packaging, transportation and disposal of laboratory chemicals and household hazardous wastes. Our technical services are provided through a network of service centers from which a fleet of trucks are dispatched to pick up customers' waste either on a predetermined schedule or on-demand, and to deliver the waste to permitted facilities, which are usually Company-owned. Our service centers can also dispatch chemists to a customer location for the collection of chemical and laboratory waste for disposal.
Collection, Transportation and Logistics Management. As an integral part of our services, we collect industrial wastes from customers and transport such wastes to and between our facilities for treatment or bulking for shipment to final disposal locations. Customers typically accumulate waste in containers, such as 55 gallon drums, bulk storage tanks or 20 cubic yard roll-off containers. In providing this service, we utilize a variety of specially designed and constructed tank trucks and semi-trailers as well as third-party transporters, including railroads.
Treatment and Disposal. We recycle, treat and dispose of hazardous and non-hazardous industrial wastes. The wastes handled include substances, which are classified as "hazardous" because of their corrosive, ignitable, infectious, reactive or toxic properties, and other substances subject to federal, state and provincial environmental regulation. We provide final treatment and disposal services designed to manage wastes which cannot be otherwise economically recycled or reused. The wastes we handle come in solid, sludge, liquid and gas form.
We operate a network of TSDFs that collect, temporarily store and/or consolidate compatible waste streams for more efficient transportation to final recycling, treatment or disposal destinations. These facilities hold special permits, such as Part B permits under the Resource Conservation and Recovery Act ("RCRA") in the United States, which allows them to process waste through various technologies including recycling, incineration, and landfill and wastewater treatment. The types of waste we handle include:
- •
- Flammables, combustibles and other organics;
- •
- Acids and caustics;
- •
- Reactive waste;
- •
- Cyanides and sulfides;
- •
- Industrial wastewaters;
- •
- Items containing polychlorinated biphenyls ("PCBs"), such as utility transformers and electrical light ballasts;
- •
- Other regulated wastes; and
- •
- Non-hazardous industrial waste.
6
We receive detailed waste profiles prepared by our customers to document the nature of the waste. A sample of the delivered waste is tested to ensure that it conforms to the customer generated waste profile record and to select an appropriate method of treatment and disposal. Once the wastes are characterized, compatible wastes are consolidated to achieve economies in storage, handling, transportation and ultimate treatment and disposal. At the time of acceptance of a customer's waste at our facility, a unique computer "bar code" identification label is assigned to each container of waste, enabling the use of sophisticated computer systems to track and document the status, location and disposition of the waste.
Resource Recovery and Fuels Blending. We operate recycling systems for the reclamation and reuse of certain wastes, particularly solvent-based wastes generated by industrial cleaning operations, metal finishing and other manufacturing processes. Resource recovery involves the treatment of wastes using various methods, which effectively remove contaminants from the original material to restore its fitness for its intended purpose and to reduce the volume of waste requiring disposal.
Spent solvents that can be recycled are processed through fractional distillation, thin film evaporation and other processes and are recovered into usable products. Upon recovery of these products, we either return the recovered solvents to the original generator or sell them to third parties. Organic liquids and solids with sufficient heat value are blended to meet strict specifications for use as supplemental fuels for incinerators, cement kilns, industrial furnaces and other high efficiency boilers. We have installed fuels blending equipment at some TSDFs to prepare these supplemental fuels. When possible, we burn fuel blended material at our incinerators. Otherwise, we send the fuel blended material to supplemental fuel users that are licensed to accept the blended fuel material. Although we pay a fee to the users that accept this product, this disposal method is substantially less costly than other disposal methods.
Incineration. Incineration is the preferred method for the treatment of organic hazardous waste, because it effectively destroys the contaminants at high temperatures. High temperature incineration effectively eliminates organic wastes such as herbicides, halogenated solvents, pesticides, and pharmaceutical and refinery wastes, regardless of whether they are gases, liquids, sludge or solids. Federal and state incineration regulations require a destruction and removal efficiency of 99.99% for most organic wastes and 99.9999% for PCBs and dioxins.
We have six active incineration facilities that offer a wide range of technological capabilities to customers through this network. In the United States, we operate a fluidized bed thermal oxidation unit for maximum destruction efficiency of hazardous waste with an estimated annual capacity of 58,808 tons and three solids and liquids capable incineration facilities with a combined estimated annual capacity of 327,400 tons. We also operate two hazardous waste liquid injection incinerators in Canada with total annual capacity of approximately 165,000 tons.
Our incineration facilities in Kimball, Nebraska, Deer Park, Texas, El Dorado, Arkansas and Aragonite, Utah are designed to process liquid organic wastes, sludge, solids, soil and debris. The Deer Park facility has two kilns and a rotary reactor. Our El Dorado, Arkansas incineration facility specializes in the treatment of bulk and containerized hazardous liquids, solids and sludge through two rotary kilns. Our incineration facilities in Kimball, Nebraska and Deer Park, Texas have on-site landfills for the disposal of ash produced as a result of the incineration process.
Our incineration facilities in Mercier, Quebec and Lambton, Ontario are liquid injection incinerators, designed primarily for the destruction of liquid organic waste. Typical waste streams include wastewater with low levels of organics and other higher concentration organic liquid wastes not amenable to conventional physical or chemical waste treatment.
Landfills. Landfills are used primarily for the disposal of inorganic wastes. In the United States and Canada, we operate nine commercial landfills, excluding the Pembina Area Landfill which
7
Eveready owned and operated but which we have agreed to divest. Seven of our commercial landfills are designed and permitted for the disposal of hazardous wastes and two of our landfills are operated for non-hazardous industrial waste disposal and, to a lesser extent, municipal solid waste. In addition to our commercial landfills, we also own and operate two non-commercial landfills that only accept waste from our on-site incinerators.
Of our seven commercial landfills used for disposal of hazardous waste, five are located in the United States and two are located in Canada. As of December 31, 2009, the useful economic lives of these landfills include approximately 22.8 million cubic yards of remaining capacity. This estimate of the useful economic lives of these landfills includes permitted airspace and unpermitted airspace that our management believes to be probable of being permitted based on our analysis of various factors. In addition to the capacity included in the useful economic lives of these landfills, there are approximately 36.8 million cubic yards of additional unpermitted airspace capacity included in the footprints of these landfills that may ultimately be permitted. There can be no assurance that this unpermitted additional capacity will be permitted. In addition to the hazardous waste landfills, we operate two non-hazardous industrial landfills with 2.1 million cubic yards of remaining permitted capacity. These two facilities are located in the United States and have been issued operating permits under the authority of Subtitle D of RCRA. Prior to issuance of a permit, we must demonstrate to the permitting agency that our non-hazardous industrial landfills have, and must subsequently employ, operational programs protective of the integrity of the landfill, human health and the surrounding environment. Our non-hazardous landfill facilities are permitted to accept commercial industrial waste, including wastes from foundries, demolition and construction, machine shops, automobile manufacturing, printing, metal fabrications and recycling.
Many of our landfills perform physical treatment of waste prior to final disposal. Physical treatment methods include separation and stabilization. These methods are used to reduce the volume or toxicity of waste material. Separation utilizes techniques such as sedimentation, filtration, flocculation and centrifugation to remove solid materials from liquids. Stabilization refers to a category of waste treatment processes designed to reduce contaminant mobility or solubility and convert waste to a more chemically stable form. Stabilization technology includes many classes of immobilization systems and applications. Stabilization is a frequent treatment method for metal bearing wastes received at several of our facilities, which treat the waste to meet specific federal land disposal restrictions. After treatment, the waste is tested to confirm that treatment standards have been met.
Wastewater Treatment. We operate seven wastewater treatment facilities that offer a range of wastewater treatment technologies. These wastewater treatment operations involve processing hazardous and non-hazardous wastes through the use of physical and chemical treatment methods. The solid waste materials produced by these wastewater processing operations are then disposed of at Company-owned facilities or select third party facilities, while the treated effluent is discharged to the local sewer system under permit.
Our wastewater treatment facilities treat a broad range of industrial liquid and semi-liquid wastes containing heavy metals, organics and suspended solids, including:
- •
- Acids and caustics;
- •
- Ammonias, sulfides and cyanides;
- •
- Heavy metals, ink wastes and plating solutions;
- •
- Landfill leachate and scrubber waters; and
- •
- Oily wastes and water soluble coolants.
8
Explosives Management. We dispose of munitions and other explosives at our facility in Colfax, Louisiana. The Colfax facility is capable of treating a wide range of materials from fireworks and contaminated debris to rocket motors. Materials are managed in one of 20 permitted thermal treatment burn units. Residue is collected from the treatment process and shipped off-site for disposal at an approved facility. Metal by-products are shipped off-site for recycling.
Field Services
These services provide customers with highly skilled experts who utilize specialty equipment and resources to perform services at any chosen location. Our field service crews and equipment are dispatched on a planned or emergency basis, and perform services such as confined space entry for tank cleaning, site decontamination, large remediation projects, demolition, spill cleanup, railcar cleaning, product recovery and transfer, scarifying and media blasting and vacuum services. Additional services include used oil and oil products recycling, as well as PCB management and disposal. Other services include filtration and water treatment services.
Industrial Services
These services include a wide range of industrial maintenance services provided at refineries, chemical plants, pulp and paper mills, manufacturing, and power generation facilities, as well as production support services in the field for oil and gas companies. Many of our industrial services are provided within the oil sands region in Alberta, Canada. Our crews handle a variety of specialized industrial services including plant outage and turnaround services, decoking and pigging, catalyst handling, chemical cleaning, high and ultra-high pressure water cleaning, and large tank and surface impoundment cleaning. Our lodging and rentals services primarily consist of premier industrial lodges and drill camp accommodations for companies operating in the Alberta oil sands region. We also offer for rent or sale a variety of oilfield equipment including access rentals, well-site units, and production equipment. Other services include industrial health and safety services.
Exploration Services
We provide a variety of services to support exploration programs for oil and gas companies. Some of the core services we offer include geospatial data imaging, line clearing, heli-portable and track drilling, seismic surveying, and land development. Our directional boring services support oil and gas companies and municipalities by installing pipeline, fiber optic, cable, gas, and water and sewer lines.
Other Services
Apollo Onsite Services. Our Apollo Onsite Services Program is an on-site solution that allows customers to outsource all or portions of their environmental management program. Select technicians work on a customer's site in tandem with the customer to deliver proper waste transportation and disposal, lab chemical packing, and field services and industrial services where appropriate. Whether a customer requires a single field technician or a multi-person team of diversified experience, we design a program to satisfy the customer's specific need. Additionally, the Apollo Onsite Services Program leverages our transportation and disposal assets by providing incremental volumes to process at our facilities.
9
Information Management Services. Our Online Services allow customers free access to their waste information online, 24-hours per day, seven days per week. Customers can manage their waste profiles; run reports such as waste tracking reports and data for regulatory reporting; and have the ability to view, print or download signed manifests.
Competition
The hazardous waste management industry in which we compete is highly competitive. The sources of competition vary by locality and by type of service rendered, with competition coming from national and regional waste services companies and hundreds of privately-owned firms. Philip Services Corp. (PSC), Veolia Environmental Services, and Waste Management, Inc. (WM) are the principal national firms with which we compete. Each of these competitors is able to provide one or more of the environmental services offered by us.
In the United States, the original generators of hazardous waste remain liable under federal and state environmental laws for improper disposal of such wastes. Even if waste generators employ companies that have proper permits and licenses, knowledgeable customers are therefore interested in the reputation and financial strength of the companies they use for management of their hazardous wastes. We believe that our technical proficiency and reputation are important considerations to our customers in selecting and continuing to utilize our services.
We believe that the depth of our recycling, treatment and disposal capabilities and our ability to collect and transport waste products efficiently, quality of service, safety, and pricing are the most significant factors in the market for treatment and disposal services.
For our technical and field services, competitors include several major national and regional environmental services firms, as well as numerous smaller local firms. We believe the availability of skilled technical professional personnel, quality of performance, diversity of services and price are the key competitive factors in this service industry.
The energy and industrial services industry in which we compete is also highly competitive. The sources of competition vary by locality and by type of service rendered, with competition coming from national and regional service providers, and hundreds of privately-owned firms that offer energy or industrial services. CEDA International Corporation and Newalta in Canada, and Philip Services Corp. (PSC) and Veolia Environmental Services in the United States, are the principal national firms with which we compete. Each of these competitors is able to provide one or more of the energy or industrial services offered by us. We believe the availability of specialized equipment, skilled technical professional personnel, quality of performance, diversity of services and price are the key competitive factors in this service industry.
The principal methods of competition for all of our services are price, quality, reliability of service rendered and technical proficiency. We believe that we offer a more comprehensive range of environmental, energy and industrial services than our competitors in major portions of our service territory, and that our ability to provide comprehensive services supported by unique information technologies capable of managing the customers' overall environmental programs constitutes a significant advantage.
10
Employees
As of December 31, 2009, we employed approximately 6,399 active full-time employees, of which 647 employees (10%) are represented by labor unions. We believe that our relationship with our employees is satisfactory.
| |
Number of Employees |
||||
|---|---|---|---|---|---|
Unions in the United States: |
|||||
International Brotherhood of Teamsters |
183 | ||||
United Steelworkers' Union |
206 | ||||
Unions in Canada: |
|||||
Communication, Energy and Paper Workers' Union |
97 | ||||
International Brotherhood of Teamsters |
69 | ||||
International Union of Operating Engineers |
40 | ||||
International Brotherhood of Boilermakers, Iron Ship Builders, Blacksmiths, Forgers And Helpers |
52 | ||||
Non-union employees |
5,752 | ||||
|
6,399 | ||||
As part of our commitment to employee safety and quality customer service, we have an extensive compliance program and a trained environmental, health and safety staff. We adhere to a risk management program designed to reduce potential liabilities to us and to our customers.
Intellectual Property
We have invested significantly in the development of proprietary technology and also to establish and maintain an extensive knowledge of leading technologies and incorporate these technologies into the services we offer and provide to our customers. We hold a total of 15 U.S. and 12 foreign patents (which will expire between 2010 and 2024), and 16 U.S. and three foreign trademarks. We also license software and other intellectual property from various third parties. We enter into confidentiality agreements with certain of our employees, consultants and corporate partners, and control access to software documentation and other proprietary information. We believe that we hold adequate rights to all intellectual property used in our business and that we do not infringe upon any intellectual property rights held by other parties.
Management of Risks
We adhere to a program of risk management policies and practices designed to reduce potential liability, as well as to manage customers' ongoing environmental exposures. This program includes installation of risk management systems at our facilities, such as fire suppression, employee training, environmental, auditing and policy decisions restricting the types of wastes handled. We evaluate all revenue opportunities and decline those that we believe involve unacceptable risks.
We dispose of waste at our incineration, wastewater treatment and landfill facilities, or at facilities owned and operated by other firms that we have audited and approved. Typically, we apply established technologies to the treatment, storage and recovery of hazardous wastes. We believe our operations are conducted in a safe and prudent manner and in substantial compliance with applicable laws and regulations.
11
Insurance and Financial Assurance
Our insurance programs cover the potential risks associated with our multifaceted operations from two primary exposures: direct physical damage and third party liability. We maintain a casualty insurance program providing coverage for vehicles, employer's liability and commercial general liability in the aggregate amount of $55.0 million, $52.0 million and $52.0 million, respectively, per year, subject to a retention of $0.5 million per occurrence. We also have workers' compensation insurance whose limits are established by state statutes. Since the early 1980s, casualty insurance policies have typically excluded liability for pollution, which is covered under a separate pollution liability program; however, our auto liability policy does provide the first $5.0 million of transportation pollution insurance.
We have pollution liability insurance policies covering potential risk in three areas: as a contractor performing services at customer sites, as a transporter of waste and for waste processing at our facilities. The contractor's pollution liability insurance has limits of $15.0 million per occurrence and $25.0 million in the aggregate, covering offsite remedial activities and associated liabilities. A $0.25 million deductible applies to this policy.
For in-transit pollution liability, the pollution liability policy provides coverage for up to $45.0 million per occurrence and $55.0 million aggregate excess above the primary $5.0 million auto liability policy. The combined policies provide us with coverage for up to $50.0 million per occurrence and $60.0 million aggregate for sudden and accidental occurrences during transportation of waste from the time waste is picked up from a customer until its delivery to the final disposal site. A $0.5 million deductible applies to this coverage.
Federal and state regulations require liability insurance coverage for all facilities that treat, store or dispose of hazardous waste. RCRA, the Toxic Substances Control Act, and comparable state hazardous waste regulations typically require hazardous waste handling facilities to maintain pollution liability insurance in the amount of $1.0 million per occurrence and $2.0 million in the aggregate for sudden occurrences, and $3.0 million per occurrence and $6.0 million in the aggregate for non-sudden occurrences. Steadfast Insurance Company (a unit of Zurich Insurance N.A.) provides insurance for our treatment, storage and disposal activities that meet the regulatory requirements. In addition, this policy provides excess limits above the regulatory requirements up to $30.0 million.
Under our insurance programs, coverage is obtained for catastrophic exposures as well as those risks required to be insured by law or contract. It is our policy to retain a significant portion of certain expected losses related primarily to employee benefit, workers' compensation, commercial general and vehicle liability. Provisions for losses expected under these programs are recorded based upon our estimates of the actuarial promulgation of the aggregate liability for claims. We believe that policy cancellation terms are similar to those of other companies in other industries.
Operators of hazardous waste handling facilities are also required by federal, state and provincial regulations to provide financial assurance for closure and post-closure care of those facilities should the facilities cease operation. Closure would include the cost of removing the waste stored at a facility which ceased operating and sending the material to another facility for disposal and the cost of performing certain procedures for decontamination of the facilities. The total amount of the closure and post-closure financial assurance which we have been required by regulators to provide is approximately $319.7 million for U.S. facilities and $22.7 million for Canadian facilities. We have placed the required financial assurance for closure through a qualified insurance company, Steadfast Insurance Company.
Environmental Regulation
While our business has benefited substantially from increased governmental regulation of hazardous waste transportation, storage and disposal, the environmental services industry itself has
12
become the subject of extensive and evolving regulation by federal, state, provincial and local authorities. We are required to obtain federal, state, provincial and local permits or approvals for each of our hazardous waste facilities. Such permits are difficult to obtain and, in many instances, extensive studies, tests, and public hearings are required before the approvals can be issued. We have acquired all operating permits and approvals now required for the current operation of our business, and have applied for, or are in the process of applying for, all permits and approvals needed in connection with continued operation and planned expansion or modifications of our operations.
We make a continuing effort to anticipate regulatory, political and legal developments that might affect operations, but are not always able to do so. We cannot predict the extent to which any environmental legislation or regulation that may be enacted or enforced in the future may affect our operations.
United States Hazardous Waste Regulation
Federal Regulations. The most significant federal environmental laws affecting us are the Resource Conservation and Recovery Act ("RCRA"), the Comprehensive Environmental Response, Compensation and Liability Act ("CERCLA"), also known as the "Superfund Act," the Clean Air Act, the Clean Water Act, and the Toxic Substances Control Act ("TSCA").
RCRA. RCRA is the principal federal statute governing hazardous waste generation, treatment, transportation, storage and disposal. Pursuant to RCRA, the U.S. Environmental Protection Agency (the "EPA") has established a comprehensive "cradle-to-grave" system for the management of a wide range of materials identified as hazardous or solid waste. States that have adopted hazardous waste management programs with standards at least as stringent as those promulgated by the EPA have been delegated authority by the EPA to administer their facility permitting programs in lieu of the EPA's program.
Every facility that treats, stores or disposes of hazardous waste must obtain a RCRA permit from the EPA or an authorized state agency, unless a specific exemption exists, and must comply with certain operating requirements. Under RCRA, hazardous waste management facilities in existence on November 19, 1980 were required to submit a preliminary permit application to the EPA, the so-called Part A Application. By virtue of this filing, a facility obtained interim status, allowing it to operate until licensing proceedings are instituted pursuant to more comprehensive and exacting regulations (the Part B permitting process). Interim Status facilities may continue to operate pursuant to the Part A Application until their Part B permitting process is concluded.
RCRA requires that Part B permits contain provisions for required on-site study and cleanup activities, known as "corrective action," including detailed compliance schedules and provisions for assurance of financial responsibility. See Note 8, "Closure and Post-Closure Liabilities," and Note 9, "Remedial Liabilities," to our consolidated financial statements included in Item 8, "Financial Statements and Supplementary Data," for a discussion of our environmental liabilities. See "Insurance and Financial Assurance" above for a discussion of our financial assurance requirements.
The Superfund Act. The Superfund Act is the primary federal statute regulating the cleanup of inactive hazardous substance sites and imposing liability for cleanup on the responsible parties. It also provides for immediate response and removal actions coordinated by the EPA to releases of hazardous substances into the environment, and authorizes the government to respond to the release or threatened release of hazardous substances or to order responsible persons to perform any necessary cleanup. The statute provides for strict, and in certain cases, joint and several liability for these responses and other related costs, and for liability for the cost of damages to natural resources, to the parties involved in the generation, transportation and disposal of such hazardous substances. Under the statute, we may be deemed liable as a generator or transporter of a hazardous substance which is released into the environment, or as the owner or operator of a facility from which there is a release of
13
a hazardous substance into the environment. See Note 18, "Commitments and Contingencies," to our consolidated financial statements included in Item 8, "Financial Statements and Supplementary Data," for a description of the principal such proceedings in which we are involved.
The Clean Air Act. The Clean Air Act was passed by Congress to control the emissions of pollutants into the air and requires permits to be obtained for certain sources of toxic air pollutants such as vinyl chloride, or criteria pollutants, such as carbon monoxide. In 1990, Congress amended the Clean Air Act to require further reductions of air pollutants with specific targets for non-attainment areas in order to meet certain ambient air quality standards. These amendments also require the EPA to promulgate regulations, which (i) control emissions of 189 hazardous air pollutants; (ii) create uniform operating permits for major industrial facilities similar to RCRA operating permits; (iii) mandate the phase-out of ozone depleting chemicals; and (iv) provide for enhanced enforcement.
In 2009 the EPA enacted regulations under its Clean Air Act authority requiring the mandatory reporting from all sources that emit 25,000 tons per year of greenhouse gasses. The regulations are administrative in nature and do not place any restrictions on our operations. We have evaluated each of our operations and determined that compliance with these new regulations will not have a material impact on our operations.
The Clean Water Act. This legislation prohibits discharges into the waters of the United States without governmental authorization and regulates the discharge of pollutants into surface waters and sewers from a variety of sources, including disposal sites and treatment facilities. The EPA has promulgated "pretreatment" regulations under the Clean Water Act, which establish pretreatment standards for introduction of pollutants into publicly owned treatment works. In the course of the treatment process, our wastewater treatment facilities generate wastewater, which we discharge to publicly owned treatment works pursuant to permits issued by the appropriate governmental authority. We are required to obtain discharge permits and conduct sampling and monitoring programs. We believe each of our operating facilities complies in all material respects with the applicable requirements.
In December 2000, the EPA promulgated new effluent limitations, pretreatment standards and source performance standards for centralized wastewater treatment facilities. Centralized wastewater treatment facilities receive and treat a wide variety of hazardous and non-hazardous wastewaters from offsite companies and discharge the treated water directly to waterways or to municipal sewer systems. These rules set stringent limits for the discharge of metals, organic compounds and oil. All of our wastewater treatment facilities were affected by these rules and were in substantial compliance with the discharge standards by December 2004.
TSCA. We also operate a network of collection, treatment and field services (remediation) activities throughout North America that are regulated under provisions of TSCA. TSCA established a national program for the management of substances classified as PCBs, which include waste PCBs as well as RCRA wastes contaminated with PCBs. The rules set minimum design and operating requirements for storage, treatment and disposal of PCB wastes. Since their initial publication, the rules have been modified to enhance the management standards for TSCA-regulated operations including the decommissioning of PCB transformers and articles; detoxification of transformer oils; incineration of PCB liquids and solids; landfill disposal of PCB solids; and remediation of PCB contamination at customer sites.
Other Federal Laws. In addition to regulations specifically directed at the transportation, storage, and disposal facilities, there are a number of regulations that may "pass-through" to the facilities based on the acceptance of regulated waste from affected client facilities. Each facility that accepts affected waste must comply with the regulations for that waste, facility or industry. Examples of this type of regulation are National Emission Standards for Benzene Waste Operations and National Emissions
14
Standards for Pharmaceuticals Production. Each of our facilities addresses these regulations on a case-by-case basis determined by its ability to comply with the pass-through regulations.
In our transportation operations, we are regulated by the U.S. Department of Transportation, the Federal Railroad Administration, the Federal Aviation Administration and the U.S. Coast Guard, as well as by the regulatory agencies of each state in which we operate or through which our vehicles pass.
Health and safety standards under the Occupational Safety and Health Act ("OSHA") are applicable to all of our operations in all four of our segments.
State and Local Regulations. Pursuant to the EPA's authorization of their RCRA equivalent programs, a number of U.S. states have regulatory programs governing the operations and permitting of hazardous waste facilities. Accordingly, the hazardous waste treatment, storage and disposal activities of a number of our facilities are regulated by the relevant state agencies in addition to federal EPA regulation.
Some states classify as hazardous some wastes that are not regulated under RCRA. For example, Massachusetts considers used oil as "hazardous wastes" while RCRA does not. Accordingly, we must comply with state requirements for handling state regulated wastes, and, when necessary, obtain state licenses for treating, storing, and disposing of such wastes at our facilities.
We believe that each of our facilities is in substantial compliance with the applicable requirements of federal and state laws, the regulations thereunder, and the licenses which we have obtained pursuant thereto. Once issued, such licenses have maximum fixed terms of a given number of years, which differ from state to state, ranging from three to ten years. The issuing state agency may review or modify a license at any time during its term. We anticipate that once a license is issued with respect to a facility, the license will be renewed at the end of its term if the facility's operations are in compliance with applicable requirements. However, there can be no assurance that regulations governing future licensing will remain static, or that we will be able to comply with such requirements.
Our wastewater treatment facilities are also subject to state and local regulation, most significantly sewer discharge regulations adopted by the municipalities which receive treated wastewater from the treatment processes. Our continued ability to operate our liquid waste treatment process at each such facility is dependent upon our ability to continue these sewer discharges.
Our facilities are regulated pursuant to state statutes, including those addressing clean water and clean air. Local sewer discharge and flammable storage requirements are applicable to certain of our facilities. Our facilities are also subject to local siting, zoning and land use restrictions. Although our facilities occasionally have been cited for regulatory violations, we believe we are in substantial compliance with all federal, state and local laws regulating our business.
Canadian Hazardous Waste Regulation
In Canada, the provinces retain control over environmental issues within their boundaries and thus have the primary responsibility for regulating management of hazardous wastes. The federal government regulates issues of national scope or where activities cross provincial boundaries.
Provincial Regulations. Most of Canada's industrial development and the major part of its population are located in four provinces: Ontario, Quebec, Alberta and British Columbia. These provinces have the most detailed environmental regulations. We operate major waste management facilities in each of these provinces, as well as waste transfer facilities in Nova Scotia and Manitoba.
The main provincial acts dealing with hazardous waste management are:
- •
- Ontario—Environmental Protection Act;
- •
- Quebec—Environmental Quality Act;
15
- •
- Alberta—Environmental Protection and Enhancement Act; and
- •
- British Columbia—Waste Management Act.
These pieces of legislation were developed by the provinces totally independently and, among other things, generally control the generation, characterization, transport, treatment and disposal of hazardous wastes. Regulations developed by the provinces under the relevant legislation are also developed independently, but are often quite similar in effect and sometimes in application. For example, there is some uniformity in manifest design and utilization.
Provincial legislation also provides for the establishment of waste management facilities. In this case, the facilities are also controlled by provincial statutes and regulations governing emissions to air, groundwater and surface water and prescribing design criteria and operational guidelines.
On August 12, 2005, the Ontario Ministry of the Environment adopted new regulations which prohibit land disposal of untreated hazardous waste and require the waste to meet specific treatment standards prior to land disposal. Land disposal includes onsite and offsite land filling, land farming and any other form of land disposal. These requirements are similar to the RCRA Land Disposal Restrictions, or "LDR," enacted in the United States and thus bring the Province of Ontario in closer conformity with the United States regulatory scheme. The new Ontario LDR commenced in 2007 through a phased-in schedule based on specific inorganic waste streams, and are now fully implemented with the regulation of organic waste streams that became effective at the end of 2009.
We carefully analyzed the new regulations to determine their impact on our operations in Ontario and made a series of operational improvements at our Lambton landfill facility aimed at receiving all waste regulated under the new LDR and applying treatment technologies to compliantly dispose of the waste at the landfill. These operational improvements included the construction of a new totally enclosed LDR waste treatment and stabilization building which was completed in September 2007 under a Certificate of Approval from the Ontario Ministry of the Environment. These modifications allow us to compliantly accept, treat and dispose of inorganic streams subject to the new LDR. The Ministry also approved a series of proprietary organic waste treatment methods that allow the Lambton facility to accept, for example, spent aluminum pot liner waste for pre-treatment, followed by LDR-compliant disposal within the landfill. Additionally, the Ministry has approved various disposal methodologies associated with the management of debris contaminated with organic chemical constituents subject to LDR regulation. We continue to evaluate other potential customer waste streams subject to the new LDR standards and modify on-site waste treatment processes to accommodate these streams at the Lambton landfill.
Waste transporters require a permit to operate under provincial waste management regulations and are subject to the requirements of the Federal Transportation of Dangerous Goods legislation. They are required to report the quantities and disposition of materials shipped.
Within the provincial regulations, definitions of hazardous wastes are quite similar. Wastes can be defined as hazardous based on origin or characteristic and the descriptions or parameters involved are very similar to those in effect in the United States. A major difference between the United States regulatory regime and those in Canada relates to ownership and liability. Under Canadian provincial regulations, ownership changes when waste is transferred to a properly permitted third party carrier and subsequently to an approved treatment and disposal facility. This means that the generator is no longer liable for improper handling, treatment or disposal, responsibility having been transferred to the carrier or the facility. Exceptions may occur if the carrier is working under contract to the generator or if the waste is different from that which was originally contracted among the parties.
16
Canadian Federal Regulations. The Canadian federal government has authority for those matters which are national in scope and in impact and for Canada's relations with other nations. The main federal laws governing hazardous waste management are:
- •
- Canadian Environmental Protection Act (1999) ("CEPA 99"), and
- •
- Transportation of Dangerous Goods Act.
Environment Canada is the federal agency with responsibility for environmental matters and the main legislative instrument is the Canadian Environmental Protection Act. This act charges Environment Canada and Health Canada with protection of human health and the environment and seeks to control the production, importation and use of substances in Canada and to control their impact on the environment.
The Export and Import of Hazardous Wastes Regulations under CEPA 99 control the export and import of hazardous wastes and hazardous recyclable materials. By reference, these regulations incorporate the Transportation of Dangerous Goods Act and Regulations, which address identification, packaging, marking and documentation of hazardous materials during transport. CEPA 99 requires that anyone proposing to export or import hazardous wastes or hazardous recyclable materials or to transport them through Canada notify the Minister of the Environment and obtain a permit to do so. Section 9 of CEPA 99 allows the federal government to enter into administrative agreements with the provinces and territories for the development and improvement of environmental standards. These agreements represent cooperation towards a common goal rather than a delegation of authority under CEPA 99. To facilitate the development of provincial and territorial agreements, the federal, provincial and territorial governments participate in the Canadian Council of Ministers of the Environment ("CCME"). The CCME comprises the 14 environment ministers from the federal, provincial and territorial governments, who normally meet twice a year to discuss national environmental priorities and to determine work to be carried out under the auspices of the CCME.
In 2004, Environment Canada implemented mandatory greenhouse gas reporting under CEPA 99. Under CEPA 99, mandatory reporting was required if a facility emitted more than 100,000 Canadian tonnes of carbon dioxide equivalent per year. As of July 11, 2009, the reporting threshold under CEPA 99 was reduced to 50,000 Canadian tonnes of carbon dioxide equivalent. The reduction in reporting limits will subject certain of the Company's Canadian facilities to the new reporting requirements, but the Company does not believe the new requirements will have a material impact on operations.
Canadian Local and Municipal Regulations. Local and municipal regulations seldom reference direct control of hazardous waste management activities. Municipal regulations and by-laws, however, control such issues as land use designation, access to municipal services and use of emergency services, all of which can have a significant impact on facility operation.
Compliance with Environmental Regulations
We incur costs and make capital investments in order to comply with the previously discussed environmental regulations. These regulations require that we remediate contaminated sites, operate our facilities in accordance with enacted regulations, obtain required financial assurance for closure and post-closure care of our facilities should such facilities cease operations, and make capital investments in order to keep our facilities in compliance with environmental regulations.
As discussed in Note 8, "Closure and Post-Closure Liabilities," and Note 9, "Remedial Liabilities," to our consolidated financial statements included in Item 8, "Financial Statements and Supplementary Data," we have accrued environmental liabilities as of December 31, 2009, of $181.3 million, substantially all of which we assumed in connection with our acquisitions of the assets of the Chemical Services Division (the "CSD assets") of Safety-Kleen Corp. in 2002, Teris LLC in 2006, and one of the
17
two solvent recycling facilities we purchased from Safety-Kleen Systems, Inc. in 2008. Such amount does not include approximately $3.0 million of additional environmental liabilities which relate to the Pembina Area Landfill which Eveready owned and operated but which we have agreed to divest. For the years ended December 31, 2009 and 2008, we spent $8.6 million and $14.3 million, respectively, to address environmental liabilities, almost all of the spending related to the environmental liabilities assumed as part of the acquisition of the CSD assets and Teris. The decrease in the year-over-year spending was primarily due to the settlement during 2008 of legal and administrative proceedings relating to our Plaquemine, Louisiana property and the Helen Kramer Superfund site.
As discussed more fully above under the heading "Insurance and Financial Assurance," we are required to provide financial assurance with respect to certain statutorily required closure, post-closure and corrective action obligations at our facilities. We have placed the required financial assurance through a qualified insurance company, Steadfast Insurance Company (a unit of Zurich N.A.).
As described in Note 18, "Commitments and Contingencies," to our consolidated financial statements included in Item 8, "Financial Statements and Supplementary Data," we are involved in legal proceedings arising under environmental laws and regulations. Alleged failure to comply with laws and regulations may lead to the imposition of fines or the denial, revocation or delay of the renewal of permits and licenses by governmental entities. In addition, such governmental entities, as well as surrounding landowners, may claim that we are liable for environmental damages. Citizens groups have become increasingly active in challenging the grant or renewal of permits and licenses for hazardous waste facilities, and responding to such challenges has further increased the costs associated with establishing new facilities or expanding current facilities. A significant judgment against us, the loss of a significant permit or license or the imposition of a significant fine could have a material adverse effect on our business and future prospects.
An investment in our securities involves certain risks, including those described below. You should consider carefully these risk factors together with all of the information included in this report before investing in our securities. The information below includes updated discussions with respect to changes which have occurred in our risk factors as a result of our acquisition on July 31, 2009 of Eveready Inc., or "Eveready," and the related significant expansion of our energy and industrial services business, our entry on July 31, 2009 into an amended $120.0 million revolving credit facility, or the "new revolving credit facility," and our issuance on August 14, 2009 of $300.0 million principal amount of 75/8% senior secured notes, or the "notes."
Risks Affecting Both Our Environmental Services and Energy and Industrial Services Businesses
Our businesses are subject to operational and insurance risks.
Provision of both environmental services and energy and industrial services to our customers is subject to such risks as equipment defects, malfunctions and failures, and natural disasters. These risks expose us to potential liability for personal injury, loss of life, business interruption, property damage or destruction, pollution and other environmental damages. While we seek to minimize our exposure to such risks through comprehensive training programs, vehicle and equipment maintenance programs and insurance, such programs and insurance may not be adequate to cover all of our potential liabilities and such insurance may not in the future be available at commercially reasonable rates. If we were to incur substantial liabilities in excess of policy limits, or if we were to incur such liabilities at a time when we were not able to obtain adequate liability insurance on commercially reasonable terms, our business, results of operations and financial condition could be adversely affected to a material extent.
18
Our businesses are subject to significant competition.
We compete with a large number of companies, which range from large public companies to small operators, that provide most of the same or similar services to those we provide. The current downturn in economic conditions, particularly with respect to manufacturing and oil and gas production, has caused increased competition for market share, which could result in lower prices and reduced gross margins from the services we provide and negatively affect our ability to grow or sustain our current revenue and profit levels in the future.
The provision of our services involves significant safety risks.
Our employees often work under potentially hazardous conditions, and we must maintain a solid safety record in order to remain a preferred supplier to our major customers. In order to protect our employees and meet such customer demands, we have instituted an active safety program supported by continual practice and training. However, should our safety record deteriorate, we could be subject to potential liabilities and a reduction of revenues from our major customers.
Our businesses are subject to statutory and regulatory requirements, which may increase in the future.
Our businesses are subject to numerous statutory and regulatory requirements, and our ability to continue to hold licenses and permits required for our businesses is subject to maintaining satisfactory compliance with such requirements. These requirements may increase in the future as a result of statutory and regulatory changes. Although we are very committed to compliance and safety, we may not, either now or in the future, be in full compliance at all times with such statutory and regulatory requirements. Consequently, we could be required to incur significant costs to maintain or improve our compliance with such requirements.
Seasonality makes it harder for us to manage our businesses and for investors to evaluate our performance.
Our business operations are affected by seasonal fluctuations due to weather and budgetary cycles influencing the timing of customers' spending for our services. Typically during the first quarter of each calendar year, there is less demand for environmental remediation due to weather-related reasons, particularly in the northern and midwestern United States and Canada, and an increased possibility of unplanned weather-related plant shutdowns. Conversely, because a large portion of our energy and industrial services business is carried out in Western Canada and involves moving heavy equipment, our ability to provide such services is dependent on weather conditions. Thawing in the spring renders many secondary roads incapable of supporting heavy equipment, and extremely cold weather in the winter season or wet weather during any season can limit our ability to provide timely services. As a result, the operating performance of our energy and industrial services business also tends to be seasonal (with higher revenues during the first quarter of each year and reduced revenues during the second quarter) and may be negatively impacted by adverse weather conditions during any quarter. This seasonality makes it harder for us to manage our businesses and for investors to evaluate our performance.
Future conditions might require us to make substantial write-downs in our assets, which would adversely affect our balance sheet and results of operations.
Periodically, we review long-lived assets for impairment whenever events or changes in circumstances indicate that the carrying value of an asset may not be recoverable. At the end of each of 2009, 2008 and 2007, we determined that no asset write-downs were required; however, if conditions in either the environmental services or energy and industrial services businesses were to deteriorate significantly, we could determine that certain of our assets were impaired and we would then be required to write-off all or a portion of our costs for such assets. Any such significant write-offs would adversely affect our balance sheet and results of operations.
19
Risks Particularly Affecting Our Environmental Services Business
We assumed significant environmental liabilities as part of past acquisitions, and our financial condition and results of operations would be adversely affected if we were required to pay such liabilities more rapidly or in greater amounts than now estimated.
We have accrued environmental liabilities valued as of December 31, 2009, at $181.3 million, substantially all of which we assumed in connection with our acquisitions of substantially all of the assets of the Chemical Services Division, or "CSD," of Safety-Kleen Corp. in 2002, Teris LLC in 2006, and one of two solvent recycling facilities we purchased from Safety-Kleen Systems, Inc. in 2008. This amount does not include approximately $3.0 million of additional environmental liabilities related to the Pembina Area Landfill which Eveready owned and operated that we have agreed to divest. We calculate our environmental liabilities on a present value basis in accordance with generally accepted accounting principles (which takes into consideration both the amount of such liabilities and the timing when it is projected that we will be required to pay such liabilities). We anticipate our environmental liabilities will be payable over many years and that cash flows generated from our operations will generally be sufficient to fund the payment of such liabilities when required. However, events not now anticipated (such as future changes in environmental laws and regulations or their enforcement) could require that such payments be made earlier or in greater amounts than now estimated, which could adversely affect our financial condition and results of operations.
If we are unable to obtain at reasonable cost the insurance, surety bonds and financial assurances which are required for our operations, our business and results of operations would be adversely affected.
We purchase insurance, occasionally post bid and performance bonds, and are required to provide substantial amounts of financial assurance to governmental agencies for closure and post-closure care of our licensed hazardous waste treatment facilities should those facilities cease operation. As of December 31, 2009, our total estimated closure and post-closure costs requiring financial assurance by regulators (excluding Eveready's estimated costs as described below) were $319.7 million for our U.S. facilities and $22.7 million for our Canadian facilities. We have placed all of the required financial assurance through a qualified insurance company, Steadfast Insurance Company (a unit of Zurich Insurance N.A.), or "Steadfast." The U.S. facilities are insured with an insurance policy written by Steadfast which expires in 2013. The Canadian facilities utilize surety bonds provided through Zurich Insurance Company (Canada), which expire at various dates throughout 2010.
As of July 31, 2009, Eveready had outstanding letters of credit of $1.9 million that were issued to comply with certain environmental regulations relating to Eveready's closure and post-closure costs. We replaced two of the three letters of credit for $1.2 million with surety bonds and the remaining outstanding letter of credit as of December 31, 2009 will be replaced with a letter of credit under our current credit facility in the first quarter of 2010.
Our ability to continue conducting our operations would be adversely affected if we became unable to obtain sufficient insurance, surety bonds or other financial assurances at reasonable cost to meet our business and regulatory requirements in the future. The availability of insurance could be affected by factors outside of our control as well as the insurers' or sureties' assessment of our risk. If we should become unable to obtain such letters of credit under our financial arrangements, we might be unable to obtain sufficient insurance or other financial assurances.
The environmental services industry in which we participate is subject to significant economic and business risks.
Our future operating results of our environmental services business may be affected by such factors as our ability to utilize our facilities and workforce profitably in the face of intense price competition; maintain or increase market share in an industry which has experienced significant downsizing and
20
consolidation; realize benefits from cost reduction programs; generate incremental volumes of waste to be handled through our facilities from existing and acquired sales offices and service centers; obtain sufficient volumes of waste at prices which produce revenue sufficient to offset the operating costs of the facilities; minimize downtime and disruptions of operations; and develop our field services business. In particular, economic downturns or recessionary conditions in North America, and increased outsourcing by North American manufacturers to plants located in countries with lower wage costs and less stringent environmental regulations, have adversely affected and may in the future adversely affect the demand for our services. The hazardous and industrial waste management business is also cyclical to the extent that it is dependent upon a stream of waste from cyclical industries such as the chemical and petrochemical, primary metals, paper, furniture and aerospace industries. If those cyclical industries slow significantly, the business that we receive from those industries is likely to slow.
A significant portion of our environmental services business depends upon the demand for major remedial projects and regulatory developments over which we have no control.
Our operations are significantly affected by the commencement and completion of major remedial projects; cleanup of major spills or other events; seasonal fluctuations due to weather and budgetary cycles influencing the timing of customers' spending for remedial activities; the timing of regulatory decisions relating to hazardous waste management projects; changes in regulations governing the management of hazardous waste; secular changes in the waste processing industry towards waste minimization and the propensity for delays in the remedial market; and changes in the myriad of governmental regulations governing our diverse operations. We do not control such factors and, as a result, our revenue and income can vary significantly from quarter to quarter, and past financial performance for certain quarters may not be a reliable indicator of future performance for comparable quarters in subsequent years.
The extensive environmental regulations to which we are subject may increase our costs and potential liabilities.
Our operations and those of others in the environmental services industry involve the handling of dangerous and hazardous materials, and are subject to extensive federal, state, provincial and local environmental requirements in both the United States and Canada, including those relating to emissions to air, discharged wastewater, storage, treatment, transport and disposal of regulated materials and cleanups of soil and groundwater contamination. While increasing environmental regulation often presents new business opportunities for us, it often results in increased operating and compliance costs. Efforts to conduct our operations in compliance with all applicable laws and regulations, including environmental rules and regulations, require programs to promote compliance, such as training employees and customers, purchasing health and safety equipment, and in some cases hiring outside consultants and lawyers. Even with these programs, we and other companies in the environmental services industry are routinely faced with governmental enforcement proceedings, which can result in fines or other sanctions and require expenditures for remedial work on waste management facilities and contaminated sites. Certain of these laws impose strict and, under certain circumstances, joint and several liability on current and former owners and operators of facilities that release regulated materials, and that generate those materials and arrange for their disposal or treatment at contaminated sites. Such liabilities can relate to cleanup of releases of regulated materials and related natural resource damages.
From time to time, we have paid fines or penalties in governmental environmental enforcement proceedings, usually involving our waste treatment, storage and disposal facilities. Although none of these fines or penalties that we have paid in the past has had a material adverse effect upon us, we might in the future be required to make substantial expenditures as a result of governmental proceedings, which would have a negative impact on our earnings. Furthermore, regulators have the
21
power to suspend or revoke permits or licenses needed for operation of our plants, equipment, and vehicles based on, among other factors, our compliance record, and customers may decide not to use a particular disposal facility or do business with us because of concerns about our compliance record. Suspension or revocation of permits or licenses would impact our operations and could have a material adverse impact on financial results. Although we have never had any of our facilities' operating permits revoked, suspended or non-renewed involuntarily, it is possible that such an event could occur in the future.
Some environmental laws and regulations impose liability and responsibility on present and former owners, operators or users of facilities and sites for contamination at such facilities and sites without regard to causation or knowledge of contamination. In the past, practices have resulted in releases of regulated materials at and from certain of our facilities, or the disposal of regulated materials at third party sites, which may require investigation and remediation, and potentially result in claims of personal injury, property damage and damages to natural resources. In addition, we occasionally evaluate various alternatives with respect to our facilities, including possible dispositions or closures. Investigations undertaken in connection with these activities may lead to discoveries of contamination that must be remediated, and closures of facilities might trigger compliance requirements that are not applicable to operating facilities. We are currently conducting remedial activities at certain of our sites and paying a portion of the remediation costs at certain sites owned by third parties. While, based on available information, we do not believe these remedial activities will result in a material adverse effect upon our operations or financial condition, these activities or the discovery of previously unknown conditions could result in material costs.
Environmental and land use laws also impact our ability to expand. In addition, we are required to obtain governmental permits to operate our facilities, including all of our landfills. Even if we were to comply with applicable environmental law, there is no guarantee that we would be able to obtain the requisite permits from the applicable governmental authorities, and, even if we could, that any permit (and any existing permits we currently hold) will be extended or modified as needed to fit out business needs.
We may make further acquisitions from time to time in the future, and we have tried and will continue to try to evaluate and limit environmental risks and liabilities presented by businesses or facilities to be acquired prior to the acquisition. It is possible that some liabilities, including ones that may exist only because of the past operations of an acquired business or facility, may prove to be more difficult or costly to address than we anticipate. It is also possible that government officials responsible for enforcing environmental laws may believe an issue is more serious than we expect, or that we will fail to identify or fully appreciate an existing liability before we become legally responsible to address it. Some of the legal sanctions to which we could become subject could cause the suspension or revocation of a needed permit, or prevent us from or delay us in obtaining or renewing permits to operate or expand our facilities or harm our reputation.
In addition to the costs of complying with environmental laws and regulations, we incur costs defending against environmental litigation brought by governmental agencies and private parties. We are now, and may in the future be, a defendant in lawsuits brought by parties alleging environmental damage, personal injury, and/or property damage, which may result in our payment of significant amount of liabilities.
Future changes in environmental regulations may require us to make significant capital expenditures.
Changes in environmental regulations can require us to make significant capital expenditures for our facilities. For example, in 2002, the United States Environmental Protection Agency, or "EPA," promulgated Interim Standards of the Hazardous Waste Combustor Maximum Achievable Control Technology, or "MACT," under the Federal Clean Air Act Amendments. These standards established
22
new emissions limits and operational controls on all new and existing incinerators, cement kilns and light-weight aggregate kilns that burn hazardous waste-derived fuels. We have spent approximately $28.9 million since September 7, 2002 in order to bring our Deer Park, Texas and Aragonite, Utah incineration facilities, which we then acquired as part of the CSD assets, and our Kimball, Nebraska facility into compliance with the MACT regulations. Prior to our acquisition in August 2006 of our additional incineration facility in El Dorado, Arkansas, as part of our purchase of all the membership interests in Teris LLC, Teris had spent in excess of $30 million in order to bring that facility into compliance with the MACT standards. Future environmental regulations could cause us to make significant additional capital expenditures and adversely affect our results of operations and cash flow.
In late June 2009 the U.S. House of Representatives passed HR 2454, The American Clean Energy and Security Act of 2009 (also known as the Waxman/Markey Bill), which is now pending in the U.S. Senate. The bill as passed by the House does not impose any onerous provisions which would adversely affect our facilities, and includes some provisions which might be beneficial to our business of incinerating toxic materials. However, no assurances can be given that the final version of the bill, if enacted by the U.S. Congress and subsequently signed into law by the President, would not include provisions which could cause us to incur additional expenditures.
If our assumptions relating to expansion of our landfills should prove inaccurate, our results of operations and cash flow could be adversely affected.
When we include the expansion airspace in our calculations of available airspace, we adjust our landfill liabilities to the present value of projected costs for cell closure and landfill closure and post-closure. It is possible that any of our estimates or assumptions could ultimately turn out to be significantly different from actual results. In some cases we may be unsuccessful in obtaining an expansion permit or we may determine that an expansion permit that we previously thought was probable has become unlikely. To the extent that such estimates, or the assumptions used to make those estimates, prove to be significantly different than actual results, or our belief that we will receive an expansion permit changes adversely in a significant manner, the landfill assets, including the assets incurred in the pursuit of the expansion, may be subject to impairment testing and lower prospective profitability may result due to increased interest accretion and depreciation or asset impairments related to the removal of previously included expansion airspace. In addition, if our assumptions concerning the expansion airspace should prove inaccurate, certain of our cash expenditures for closure of landfills could be accelerated and adversely affect our results of operations and cash flow.
Risks Particularly Affecting Our Energy and Industrial Services Business
A large portion of our energy and industrial services business is dependent on the oil and gas industry in Western Canada, and declines in oil and gas production in that region adversely affect our business.
Our energy and industrial services business generates well over 50% of its total revenues from customers in the oil and gas industry operating in Western Canada, although a majority of the services which we provide to such customers relate to industrial maintenance and production which are less volatile than oil and gas exploration. We also provide significant services to customers in the oil and gas industry operating in the United States or internationally and to customers in other industries such as forestry, mining and manufacturing. However, a major portion of the total revenues of our energy and industrial services business remains dependent on customers in the oil and gas industry operating in Western Canada.
Accordingly, declines in the general level of oil and gas production in Western Canada could potentially have in the future significant adverse effects on our total revenues and profitability. Such declines have recently been, and could in the future be, triggered by declines in the commodity prices
23
for oil and gas. Such future declines could also be triggered by technological and regulatory changes and other changes in industry and worldwide economic and political conditions.
A significant part of our energy and industrial services business relates to the Alberta oil sands.
Many of our major customers in the oil and gas industry operating in Western Canada conduct a significant portion of their operations in the Alberta oil sands. The Alberta oil sands contain large oil deposits, but extraction may involve significantly greater cost and environmental concerns than conventional oil drilling. While we believe our major involvement in the oil sands region will provide significant future growth opportunities, such involvement also increases the risk that our business will be adversely affected if future economic activity in the Alberta oil sands were to decline considerably. Major factors that could cause such a decline might include a prolonged decline in the commodity price of oil and gas, potential future changes in environmental restrictions and regulations, and technological and regulatory changes relating to production of oil from the oil sands. Due to the current downturn in worldwide economic conditions and a substantial decline in the commodity price of oil and gas, certain of our customers have delayed a number of large projects in the planning and early development phases within the oil sands region. In addition, customers are revisiting their operating budgets and challenging their suppliers to reduce costs and achieve better efficiencies in their work programs.
Our energy and industrial services business is subject to workforce availability.
Our ability to provide high quality services to our customers is dependent upon our ability to attract and retain well-trained, experienced employees. The oil and gas services industry in Western Canada experienced in the past several years high demand for, and a corresponding shortage of, quality employees. Although the current downturn in the oil and gas industry has increased the pool of quality employees available to meet our customer commitments, any improvement of conditions in the oil and gas industry would likely increase competition for experienced employees.
If we are unable to successfully complete the integration of Eveready's business and operations into our business and operations and realize synergies in the expected time frame, our future results would be adversely affected.
We substantially increased our energy and industrial services business through our acquisition of Eveready on July 31, 2009. Our integration of Eveready's business and operations into our business and operations has required and will continue to require implementation of appropriate operations, management and financial reporting systems and controls. The integration of Eveready has required and will continue to require the focused attention of our management teams, including a significant commitment of their time and resources. The success of the acquisition will depend, in part, on the combined company's ability to realize the anticipated benefits from combining the respective businesses and operations of Clean Harbors and Eveready through cost reductions in overhead, greater efficiencies, increased utilization of support facilities and the adoption of mutual best practices. To realize these anticipated benefits, however, the businesses and operations of Clean Harbors and Eveready must continue to be successfully combined.
If the combined company is not able to achieve these objectives, the anticipated benefits to us of the acquisition may not be realized fully or at all or may take longer to realize than expected. It is possible that the integration process could result in the loss of key employees, as well as the disruption of our ongoing businesses, failure to implement the business plan for the combined businesses, unanticipated issues in integrating service offerings, logistics, information, communications and other systems, or other unanticipated issues, expenses and liabilities, any or all of which could adversely affect our ability to maintain relationships with customers and employees and to achieve the anticipated benefits of the acquisition.
24
Our acquisition of Eveready may expose us to unknown liabilities.
Because we acquired all of Eveready's outstanding common shares, our investment in Eveready is subject to all of Eveready's liabilities other than Eveready's debt which we paid either at the time of the acquisition or shortly thereafter upon our issuance of the notes. If there are unknown Eveready obligations, including contingent liabilities, our business could be materially and adversely affected. We may learn additional information about Eveready's business that adversely affects us, such as unknown liabilities or issues relating to internal controls over financial reporting or that could affect our ability to comply with the Sarbanes-Oxley Act or other applicable laws. As a result, our acquisition of Eveready might not be successful.
Risks Relating to Our Level of Debt and the Notes
Our substantial levels of outstanding debt and letters of credit could adversely affect our financial condition and ability to fulfill our obligations under the notes.
As of December 31, 2009, after giving effect to our (i) acquisition of Eveready on July 31, 2009, (ii) sale of the notes on August 14, 2009, (iii) repayment between July 24 and August 14, 2009 of substantially all of our and Eveready's then outstanding debt (other than certain capital leases) using a portion of our available cash and the net proceeds from the sale of the notes, and (iv) payment of related fees and expenses, we had outstanding $292.4 million of debt and $88.7 million of letters of credit. Our substantial levels of outstanding debt and letters of credit may:
- •
- adversely impact our ability to obtain additional financing in the future for working capital, capital expenditures,
acquisitions or other general corporate purposes or to repurchase the notes from holders upon any change of control;
- •
- require us to dedicate a substantial portion of our cash flow to the payment of interest on our debt and fees on our
letters of credit, which reduces the availability of our cash flow to fund working capital, capital expenditures, acquisitions and other general corporate purposes;
- •
- subject us to the risk of increased sensitivity to interest rate increases based upon variable interest rates, including
our borrowings (if any) under our new revolving credit facility;
- •
- increase the possibility of an event of default under the financial and operating covenants contained in our debt
instruments; and
- •
- limit our ability to adjust to rapidly changing market conditions, reduce our ability to withstand competitive pressures and make us more vulnerable to a downturn in general economic conditions of our business than our competitors with less debt.
If we are unable to generate sufficient cash flow from operations in the future to service our debt and letter of credit fee obligations, we may be required to refinance all or a portion of our existing debt and letter of credit facilities, or to obtain new or additional such facilities. However, we may not be able to obtain any such new or additional facilities on favorable terms or at all.
Despite our substantial levels of outstanding debt and letters of credit, we could incur substantially more debt and letter of credit obligations in the future.
Although the agreements governing our new revolving credit facility and the indenture governing the notes contain restrictions on the incurrence of additional indebtedness (including, for this purpose, reimbursement obligations under outstanding letters of credit), these restrictions are subject to a number of qualifications and exceptions and the additional amount of indebtedness which we might incur in the future in compliance with these restrictions could be substantial. In particular, we had available as of December 31, 2009 under our new revolving credit facility up to an additional approximately $31.3 million for purposes of future borrowings and letters of credit. In addition, the
25
indenture governing the notes would also allow us to borrow significant amounts of money from other sources. These restrictions would also not prevent us from incurring obligations (such as operating leases) that do not constitute "indebtedness" as defined in the relevant agreements. To the extent we incur in the future additional debt and letter of credit obligations, the related risks will increase.
Servicing our debt, including the notes, any revolving loans and capital leases, and paying our letter of credit fee obligations, will require a significant amount of cash, and our ability to generate cash depends on many factors beyond our control.
Our ability to make scheduled payments of principal or interest with respect to our debt, including the notes, any revolving loans and our capital leases, and to pay fee obligations with respect to our letters of credit, will depend on our ability to generate cash and on our future financial results. Our ability to generate cash depends on, among other factors, the demand for our services, which is subject to market conditions in the environmental, energy and industrial services industries, the occurrence of events requiring major remedial projects, changes in government environmental regulation, general economic conditions, and financial, competitive, regulatory and other factors affecting our operations, many of which are beyond our control. Our operations may not generate sufficient cash flow, and future borrowings may not be available under our new revolving credit facility or otherwise, in an amount sufficient to enable us to pay our debt and the fee obligations respecting our letters of credit, or to fund our other liquidity needs.
The covenants in our financing agreements will restrict our ability to operate our business and might lead to a default under our debt agreements.
The agreements governing our new revolving credit facility and the indenture relating to the notes limit, among other things, our ability and the ability of our restricted subsidiaries to:
- •
- incur or guarantee additional indebtedness (including, for this purpose, reimbursement obligations under letters of
credit) or issue preferred stock;
- •
- pay dividends or make other distributions to our stockholders;
- •
- purchase or redeem capital stock or subordinated indebtedness;
- •
- make investments;
- •
- create liens;
- •
- incur restrictions on the ability of our restricted subsidiaries to pay dividends or make other payments to us;
- •
- sell assets, including capital stock of our subsidiaries;
- •
- consolidate or merge with or into other companies or transfer all or substantially all of our assets; and
- •
- engage in transactions with affiliates.
As a result of these covenants, we may not be able to respond to changes in business and economic conditions and to obtain additional financing, if needed, and we may be prevented from engaging in transactions that might otherwise be beneficial to us. Our new revolving credit facility requires, and our future credit facilities may require, us to maintain specified financial ratios and satisfy certain financial condition tests. Our ability to meet these financial ratios and tests can be affected by events beyond our control, and we may not be able to meet those tests. The breach of any of these covenants could result in a default under our revolving credit facility or future credit facilities. Upon the occurrence of an event of default, the lenders could elect to declare all amounts outstanding under such credit facilities, including accrued interest or other obligations, to be immediately due and
26
payable. If amounts outstanding under such credit facilities were to be accelerated, our assets might not be sufficient to repay in full that indebtedness and our other indebtedness, including the notes.
The instruments governing certain of our debt, including the indenture governing the notes and our new revolving credit facility, also contain cross-default provisions. Under these provisions, a default under one instrument governing our debt may constitute a default under our other debt instruments that contain cross-default provisions, which could result in the related debt and the debt issued under such other instruments becoming immediately due and payable. In such event, we would need to raise funds from alternative sources, which funds might not be available to us on favorable terms, on a timely basis or at all. Alternatively, such a default could require us to sell assets and otherwise curtail operations to pay our creditors. The proceeds of such a sale of assets, or curtailment of operations, might not enable us to pay all of our liabilities.
Risks Relating to Certain Anti-Takeover Provisions
Sections 8.06 and 7.02 of the Massachusetts Business Corporation Act provide that Massachusetts corporations which are publicly-held must have a staggered board of directors and that written demand by holders of at least 40% of the outstanding shares of each relevant voting group of stockholders is required for stockholders to call a special meeting unless such corporations take certain actions to affirmatively "opt-out" of such requirements. In accordance with these provisions, our By-Laws provide for a staggered Board of Directors which consists of three classes of directors of which one class is elected each year for a three-year term, and require that written application by holders of at least 25% (which is less than the 40% which would otherwise be applicable without such a specific provision in our By-Laws) of our outstanding shares of common stock is required for stockholders to call a special meeting. In addition, our By-Laws prohibit the removal by the stockholders of a director except for cause. These provisions could inhibit a takeover of our company by restricting stockholders action to replace the existing directors or approve other actions which a party seeking to acquire us might propose. A takeover transaction would frequently afford stockholders an opportunity to sell their shares at a premium over then market prices.
ITEM 1B. UNRESOLVED STAFF COMMENTS
Not applicable.
Our principal executive office is in Norwell, Massachusetts where approximately 104,000 square feet is leased under arrangements expiring in 2022. There are also regional administrative offices in South Carolina and Alberta, Canada. We own or lease property in 36 U.S. states, seven Canadian provinces, Puerto Rico, Bulgaria, China, Mexico, Singapore, Sweden, Thailand and the United Kingdom.
Our principal property, plant and equipment consist of land, landfill assets and buildings (primarily incinerators, wastewater treatment plants and TSDFs), vehicles and equipment (including environmental remediation equipment). We have 52 active permitted hazardous waste or nonhazardous waste management properties, and 145 additional service centers and satellite or support locations, which occasionally move to other locations as operations and space requirements change. The incinerators, landfills, and TSDFs are our most significant properties and they are included in our Technical Services segment.
Our properties are sufficient and suitable to our needs. The following tables set forth certain information as of December 31, 2009 regarding our properties. Substantially all of our owned operating properties are mortgaged as collateral for our loans.
27
Hazardous Waste Management Properties
Included in our 52 active hazardous waste management properties are six incineration locations, nine commercial landfills, seven wastewater treatment plants, 20 TSDFs, two solvent recycling facilities and eight facilities which specialize in PCB management, oil and used oil products recycling. Some of our properties offer multiple capabilities. As described below under "Inactive Facilities," and "Asset Held for Sale," we also own 11 closed or inactive facilities and one facility acquired as part of our acquisition of Eveready which we have agreed to divest.
Incinerators. We own six operating incineration facilities containing a total of nine incinerators as follows:
| |
# of Incinerators |
Practical Capacity (Tons) |
Utilization Rate Year Ended December 31, 2009 |
|||||||
|---|---|---|---|---|---|---|---|---|---|---|
Arkansas |
2 | 95,072 | 94.4 | % | ||||||
Nebraska |
1 | 58,808 | 71.9 | % | ||||||
Utah |
1 | 66,815 | 73.0 | % | ||||||
Texas |
3 | 165,500 | 90.0 | % | ||||||
Ontario, Canada |
1 | 93,695 | 91.8 | % | ||||||
Quebec, Canada |
1 | 71,650 | 82.4 | % | ||||||
|
9 | 551,540 | 86.1 | % | ||||||
Our incinerators offer a wide range of technological capabilities to customers through this network. Incineration in the United States is provided by a fluidized bed thermal oxidation unit and three solids and liquids-capable incineration facilities. In Canada, we operate two hazardous waste liquid injection incinerators.
Landfills. In the United States and Canada, we operate nine commercial landfills as described in the following table, which excludes the Pembina Area Landfill (described below under "Asset Held for Sale") which Eveready owned and operated but which we have agreed to divest:
| |
# of Facilities |
Remaining Highly Probable Airspace (cubic yards, in thousands) |
Remaining Lives (Years) |
|||||||
|---|---|---|---|---|---|---|---|---|---|---|
California |
2 | 11,606 | 39 and 64 | |||||||
Colorado |
1 | 845 | 34 | |||||||
North Dakota |
1 | 1,045 | 42 | |||||||
Oklahoma |
1 | 873 | 8 | |||||||
Texas |
1 | 1,085 | 22 | |||||||
Utah |
1 | 1,597 | 17 | |||||||
Alberta, Canada |
1 | 1,281 | 20 | |||||||
Ontario, Canada |
1 | 6,567 | 46 | |||||||
|
9 | 24,899 | ||||||||
Seven of our commercial landfills are designed and permitted for the disposal of hazardous wastes and two landfills are operated for nonhazardous industrial waste disposal and, to a lesser extent, municipal solid waste. In addition to our commercial landfills, we also own and operate two non-commercial landfills that only accept waste from our on-site incinerators. We own all of the landfills with the exception of the landfill in Oklahoma that is leased.
28
Wastewater Treatment Plants. We operate seven facilities that offer a range of wastewater treatment technologies and customer services, as follows:
| |
# of Facilities |
Owned | Leased | |||||||
|---|---|---|---|---|---|---|---|---|---|---|
Connecticut |
1 | 1 | — | |||||||
Louisiana |
2 | 1 | 1 | |||||||
Ohio |
1 | 1 | — | |||||||
Tennessee |
1 | 1 | — | |||||||
Alberta, Canada |
1 | — | 1 | |||||||
Ontario, Canada |
1 | 1 | — | |||||||
|
7 | 5 | 2 | |||||||
Wastewater treatment consists primarily of three types of services: hazardous wastewater treatment, sludge de-watering or drying, and non-hazardous wastewater treatment.
Transportation, Storage and Disposal Facilities. We operate 20 TSDFs in the United States and Canada as follows:
| |
# of Facilities |
Owned | Leased | |||||||
|---|---|---|---|---|---|---|---|---|---|---|
Arizona |
1 | 1 | — | |||||||
California |
2 | 2 | — | |||||||
Florida |
1 | — | 1 | |||||||
Illinois |
1 | — | 1 | |||||||
Kansas |
1 | 1 | — | |||||||
Louisiana |
1 | 1 | — | |||||||
Maryland |
1 | 1 | — | |||||||
Massachusetts |
1 | 1 | — | |||||||
North Carolina |
1 | 1 | — | |||||||
Ohio |
1 | 1 | — | |||||||
Texas |
1 | 1 | — | |||||||
British Columbia, Canada |
1 | 1 | — | |||||||
Manitoba, Canada |
1 | 1 | — | |||||||
Nova Scotia, Canada |
1 | 1 | — | |||||||
Ontario, Canada |
3 | 2 | 1 | |||||||
Quebec, Canada |
2 | 2 | — | |||||||
|
20 | 17 | 3 | |||||||
Our TSDFs facilitate the movement of materials among our network of service centers and treatment and disposal facilities. Transportation may be accomplished by truck, rail, barge or a combination of modes, with our own assets or in conjunction with third-party transporters. Specially designed containment systems, vehicles and other equipment permitted for hazardous and industrial waste transport, together with drivers trained in transportation skills and waste handling procedures, provide for the movement of customer waste streams.
29
PCB Management Facilities and Oil Storage or Recycling Capabilities. We operate eight facilities specializing in PCB management or providing oil recycling capabilities, as follows:
| |
# of Facilities |
Owned | Leased | |||||||
|---|---|---|---|---|---|---|---|---|---|---|
California |
1 | 1 | — | |||||||
Georgia |
1 | 1 | — | |||||||
Kansas |
1 | 1 | — | |||||||
Maine |
1 | 1 | — | |||||||
Massachusetts |
1 | — | 1 | |||||||
Ohio |
2 | 1 | 1 | |||||||
Pennsylvania |
1 | 1 | — | |||||||
|
8 | 6 | 2 | |||||||
These facilities are the most significant properties relating to our Field Services segment.
Solvent Recycling Operations. We own two facilities specializing in solvent recovery management in Illinois and Ohio, and also have one solvent recycling operation adjacent to our incineration facility in El Dorado, Arkansas.
Other Facilities and Properties
Service Centers and Satellite Locations. We operate 145 additional service centers and satellite or support locations of which 19 are owned and 126 are leased.
Inactive Facilities. In addition to the active facilities and properties described above, we own a total of 11 facilities which are now closed or inactive, most of which were acquired in 2002 as part of the CSD assets due to our assumption of the remediation liabilities associated with such properties or our closure of such sites. The principal inactive facilities are a closed incinerator and landfill in Baton Rouge, Louisiana, closed incinerators in Roebuck, South Carolina, Coffeyville, Kansas and Bridgeport, New Jersey, and closed wastewater treatment facilities in Cleveland, Ohio and Plaquemine, Louisiana. Prior to the sale of the CSD assets, Safety-Kleen gave notice to the applicable regulatory agencies of Safety-Kleen's intent to close and stopped accepting wastes at Cleveland in 1990, Baton Rouge in 1997, Roebuck in 1998, Coffeyville in 2000, and Bridgeport in 2001. We gave notice to the regulators and stopped accepting wastes at Plaquemine in 2006.
Asset Held for Sale. In connection with our acquisition of Eveready, we agreed with the Canadian Commissioner of Competition to divest Eveready's Pembina Area Landfill, located near Drayton Valley, Alberta, due to its proximity to our existing landfill in the region. The Pembina Area Landfill consists of a landfill facility and an administrative office.
See Note 18, "Commitments and Contingencies," to our consolidated financial statements included in Item 8, "Financial Statements and Supplementary Data," for a description of legal proceedings.
30
ITEM 5. MARKET FOR REGISTRANT'S COMMON EQUITY, RELATED STOCKHOLDER MATTERS AND ISSUER PURCHASES OF EQUITY SECURITIES
Common Stock
Effective December 15, 2008, our common stock began trading on the New York Stock Exchange under the symbol CLH. Prior to that time, our stock was traded on The NASDAQ Global Select Market under the symbol CLHB. The following table sets forth the high and low sales prices of our common stock for the indicated periods as reported by the New York Stock Exchange and The NASDAQ Global Select Market.
2009
|
High | Low | |||||
|---|---|---|---|---|---|---|---|
First Quarter |
$ | 65.18 | $ | 40.90 | |||
Second Quarter |
57.95 | 45.71 | |||||
Third Quarter |
61.63 | 48.87 | |||||
Fourth Quarter |
61.28 | 52.80 | |||||
2008
|
High | Low | |||||
|---|---|---|---|---|---|---|---|
First Quarter |
$ | 67.58 | $ | 49.67 | |||
Second Quarter |
77.79 | 61.76 | |||||
Third Quarter |
82.99 | 63.62 | |||||
Fourth Quarter |
67.45 | 44.11 | |||||
On February 25, 2010, the closing price of our common stock on the New York Stock Exchange was $56.02 and there were 443 stockholders of record of our common stock, excluding stockholders whose shares were held in nominee, or "street," name. We estimate that approximately 15,000 additional stockholders beneficially held the shares in street name on that date.
We have never declared nor paid any cash dividends on our common stock, and we do not intend to pay any dividends on our common stock in the foreseeable future. We intend to retain our future earnings, if any, for use in the operation and expansion of our business and payment of our outstanding debt. In addition, our current credit agreement prohibits, and our indenture restricts, us from paying cash dividends on our common stock. See "Liquidity and Capital Resources" under Item 7, "Management's Discussion and Analysis of Financial Condition and Results of Operations."
31
Performance Graph
The following graph compares the five-year return from investing $100 in each of our common stock, the NASDAQ Market Index, the NYSE Market Index, and an index of environmental services companies (custom peer group) compiled by CoreData. Our common stock commenced trading on the New York Stock Exchange on December 15, 2008, and therefore both the NASDAQ Market Index and the NYSE Market Index are used as comparable indices. The environmental services group used by CoreData includes all companies whose listed line-of-business is SIC Code 4953 (refuse systems), and assumes reinvestment of dividends on the ex-dividend date. An index compares relative performance since a particular starting date. In this instance, the starting date was December 31, 2004, when our common stock closed at $15.09 per share.
COMPARISON OF 5-YEAR CUMULATIVE TOTAL RETURN
AMONG CLEAN HARBORS, INC.,
NASDAQ MARKET INDEX, NYSE MARKET INDEX, AND CUSTOM PEER GROUP
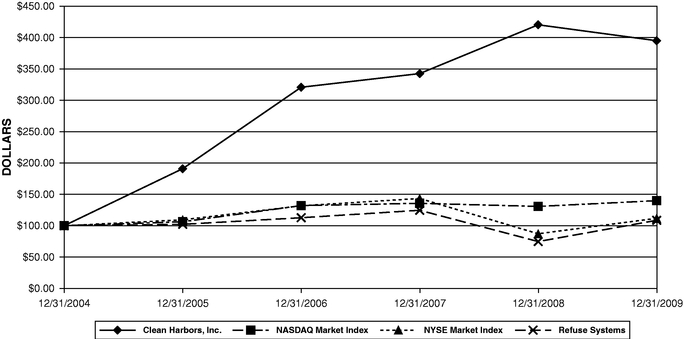
ASSUMES
$100 INVESTED ON JAN. 01, 2005
ASSUMES DIVIDEND REINVESTED
FISCAL YEAR ENDING DEC. 31, 2009
Securities Authorized For Issuance Under Equity Compensation Plans
See Item 12, "Security Ownership of Certain Beneficial Owners and Management and Related Stockholder Matters," for a description of the securities which are authorized for issuance under our equity compensation plans.
Issuer Purchases of Equity Securities
During the fiscal quarter ended December 31, 2009, we did not repurchase any of our outstanding common stock or any other securities registered under the Securities Exchange Act of 1934, as amended.
32
ITEM 6. SELECTED FINANCIAL DATA
The following summary of consolidated financial information has been derived from the audited consolidated financial statements included in Item 8, "Financial Statements and Supplementary Data," of this report and in the annual reports we previously filed with the SEC. This information should be reviewed in conjunction with Item 7, "Management's Discussion and Analysis of Financial Condition and Results of Operations," and the financial statements and the notes thereto included in Item 8, "Financial Statements and Supplementary Data" of this report.
| |
For the Year Ended December 31, | |||||||||||||||
|---|---|---|---|---|---|---|---|---|---|---|---|---|---|---|---|---|
| |
2009 | 2008 | 2007 | 2006 | 2005 | |||||||||||
| |
(in thousands except per share amounts) |
|||||||||||||||
Income Statement Data: |
||||||||||||||||
Revenues |
$ | 1,074,220 | $ | 1,030,713 | $ | 946,917 | $ | 829,809 | $ | 711,170 | ||||||
Cost of revenues (exclusive of items shown separately below) |
753,483 | 707,820 | 664,440 | 584,835 | 512,582 | |||||||||||
Selling, general and administrative expenses |
163,157 | 159,674 | 149,180 | 125,039 | 108,312 | |||||||||||
Accretion of environmental liabilities |
10,617 | 10,776 | 10,447 | 10,220 | 10,384 | |||||||||||
Depreciation and amortization |
64,898 | 44,471 | 37,590 | 35,339 | 28,633 | |||||||||||
Income from operations |
82,065 | 107,972 | 85,260 | 74,376 | 51,259 | |||||||||||
Other (expense) income |
259 | (119 | ) | 135 | (447 | ) | 611 | |||||||||
Loss on early extinguishment of debt |
(4,853 | ) | (5,473 | ) | — | (8,529 | ) | — | ||||||||
Interest expense, net |
(15,999 | ) | (8,403 | ) | (13,157 | ) | (12,447 | ) | (22,754 | ) | ||||||
Income from continuing operations before provision for income taxes and equity interest in joint venture |
61,472 | 93,977 | 72,238 | 52,953 | 29,116 | |||||||||||
Provision for income taxes(1) |
26,225 | 36,491 | 28,040 | 6,339 | 3,495 | |||||||||||
Equity interest in joint venture |
— | — | — | (61 | ) | — | ||||||||||
Income from continuing operations |
35,247 | 57,486 | 44,198 | 46,675 | 25,621 | |||||||||||
Income from discontinued operations, net of tax |
1,439 | — | — | — | — | |||||||||||
Net income |
36,686 | 57,486 | 44,198 | 46,675 | 25,621 | |||||||||||
Dividends on Series B preferred stock |
— | — | 206 | 276 | 279 | |||||||||||
Net income attributable to common stockholders |
$ | 36,686 | $ | 57,486 | $ | 43,992 | $ | 46,399 | $ | 25,342 | ||||||
Basic earnings attributable to common stockholders(2) |
$ | 1.48 | $ | 2.56 | $ | 2.22 | $ | 2.38 | $ | 1.62 | ||||||
Diluted earnings attributable to common stockholders(2) |
$ | 1.47 | $ | 2.51 | $ | 2.14 | $ | 2.26 | $ | 1.45 | ||||||
Cash Flow Data: |
||||||||||||||||
Net cash from operating activities |
$ | 93,270 | $ | 109,590 | $ | 79,995 | $ | 61,382 | $ | 29,667 | ||||||
Net cash from investing activities |
(118,391 | ) | (84,515 | ) | (42,791 | ) | (98,885 | ) | (3,509 | ) | ||||||
Net cash from financing activities |
3,584 | 116,795 | 2,724 | (20,330 | ) | 75,023 | ||||||||||
Other Financial Data: |
||||||||||||||||
Adjusted EBITDA(3) |
$ | 157,580 | $ | 163,219 | $ | 133,297 | $ | 119,935 | $ | 90,276 | ||||||
33
| |
At December 31, | |||||||||||||||
|---|---|---|---|---|---|---|---|---|---|---|---|---|---|---|---|---|
| |
2009 | 2008 | 2007 | 2006 | 2005 | |||||||||||
| |
(in thousands) |
|||||||||||||||
Balance Sheet Data: |
||||||||||||||||
Working capital |
$ | 386,930 | $ | 307,679 | $ | 169,585 | $ | 124,465 | $ | 100,354 | ||||||
Goodwill |
56,085 | 24,578 | 21,572 | 19,032 | 19,032 | |||||||||||
Total assets |
1,401,068 | 898,336 | 769,888 | 670,808 | 614,364 | |||||||||||
Long-term obligations (including current portion)(4) |
301,271 | 53,630 | 123,483 | 124,561 | 154,291 | |||||||||||
Stockholders' equity(2) |
613,825 | 429,045 | 202,897 | 173,186 | 115,658 | |||||||||||
- (1)
- For
fiscal year 2006, the provision includes a reversal of $14.1 million of the valuation allowance.
- (2)
- We
issued: (i) 0.4 million shares of common stock in February 2005 upon cashless exercise of previously outstanding warrants;
(ii) 1.6 million shares of common stock in October 2005 upon exercise of previously outstanding warrants for an aggregate of $12.5 million; (iii) 2.3 million shares
of common stock in December 2005 upon the closing of a public offering for aggregate net proceeds (after deducting the underwriters' discount and offering expenses payable by us) of
$60.2 million; (iv) 0.4 million shares of common stock in December 2007 upon exercise of previously outstanding warrants for an aggregate of $1.2 million and conversion of
previously outstanding shares of Series B preferred stock; (v) 2.875 million shares of common stock in April 2008 upon the closing of a public offering for aggregate net proceeds
(after deducting the underwriters' discount and offering expenses payable by us) of $173.5 million; and (vi) 2.4 million shares of common stock in July 2009 to the former holders
of Eveready common shares as partial consideration for our acquisition of Eveready.
- (3)
- For
all periods presented, "Adjusted EBITDA" consists of net income plus accretion of environmental liabilities, depreciation and amortization, net interest
expense, and provision for income taxes. We also exclude loss on early extinguishment of debt, equity interest in joint venture, other (income) expense, and income from discontinued operations, net of
tax as these amounts are not considered part of usual business operations. See below for a reconciliation of Adjusted EBITDA to both net income and net cash provided by operating activities for the
specified periods. Our management considers Adjusted EBITDA to be a measurement of performance which provides useful information to both management and investors. Adjusted EBITDA should not be
considered an alternative to net income or other measurements under generally accepted accounting principles ("GAAP"). Because Adjusted EBITDA is not calculated identically by all companies, our
measurements of Adjusted EBITDA may not be comparable to similarly titled measures reported by other companies.
We use Adjusted EBITDA to enhance our understanding of our core operating performance, which represents our views concerning our performance in the ordinary, ongoing and customary course of our operations. We historically have found it helpful, and believe that investors have found it helpful, to consider an operating measure that excludes expenses such as debt extinguishment and related costs relating to transactions not reflective of our core operations.
The information about our core operating performance provided by this financial measure is used by our management for a variety of purposes. We regularly communicate Adjusted EBITDA results to our board of directors and discuss with the board our interpretation of such results. We also compare our Adjusted EBITDA performance against internal targets as a key factor in determining cash bonus compensation for executives and other employees, largely because we believe that this measure is indicative of the how the fundamental business is performing and is being managed.
We also provide information relating to our Adjusted EBITDA so that analysts, investors and other interested persons have the same data that we use to assess our core operating performance. We believe that Adjusted EBITDA should be viewed only as a supplement to the GAAP financial information. We also believe, however, that providing this information in addition to, and together with, GAAP financial information permits the foregoing persons to obtain a better understanding of our core operating performance and to evaluate the efficacy of the methodology and information used by management to evaluate and measure such performance on a standalone and a comparative basis.
34
The following is a reconciliation of net income to Adjusted EBITDA for the following periods (in thousands):
| |
Year Ended December 31, | |||||||||||||||
|---|---|---|---|---|---|---|---|---|---|---|---|---|---|---|---|---|
| |
2009 | 2008 | 2007 | 2006 | 2005 | |||||||||||
Net income |
$ | 36,686 | $ | 57,486 | $ | 44,198 | $ | 46,675 | $ | 25,621 | ||||||
Accretion of environmental liabilities |
10,617 | 10,776 | 10,447 | 10,220 | 10,384 | |||||||||||
Depreciation and amortization |
64,898 | 44,471 | 37,590 | 35,339 | 28,633 | |||||||||||
Loss on early extinguishment of debt |
4,853 | 5,473 | — | 8,529 | — | |||||||||||
Interest expense, net |
15,999 | 8,403 | 13,157 | 12,447 | 22,754 | |||||||||||
Equity interest in joint venture |
— | — | — | (61 | ) | — | ||||||||||
Provision for income taxes |
26,225 | 36,491 | 28,040 | 6,339 | 3,495 | |||||||||||
Other (income) expense |
(259 | ) | 119 | (135 | ) | 447 | (611 | ) | ||||||||
Income from discontinued operations, net of tax |
(1,439 | ) | — | — | — | — | ||||||||||
Adjusted EBITDA |
$ | 157,580 | $ | 163,219 | $ | 133,297 | $ | 119,935 | $ | 90,276 | ||||||
The following reconciles Adjusted EBITDA to net cash provided by operating activities for the following years ended December 31 (in thousands):
| |
Year Ended December 31, | ||||||||||||||||
|---|---|---|---|---|---|---|---|---|---|---|---|---|---|---|---|---|---|
| |
2009 | 2008 | 2007 | 2006 | 2005 | ||||||||||||
Adjusted EBITDA |
$ | 157,580 | $ | 163,219 | $ | 133,297 | $ | 119,935 | $ | 90,276 | |||||||
Interest expense, net |
(15,999 | ) | (8,403 | ) | (13,157 | ) | (12,447 | ) | (22,754 | ) | |||||||
Provision for income taxes |
(26,225 | ) | (36,491 | ) | (28,040 | ) | (6,339 | ) | (3,495 | ) | |||||||
Income from discontinued operations, net of tax |
1,439 | — | — | — | — | ||||||||||||
Allowance for doubtful accounts |
1,006 | 267 | (418 | ) | 88 | (105 | ) | ||||||||||
Amortization of deferred financing costs and debt discount |
1,997 | 1,915 | 1,940 | 1,616 | 1,669 | ||||||||||||
Change in environmental liability estimates |
(4,657 | ) | (2,047 | ) | 597 | (9,582 | ) | (11,265 | ) | ||||||||
Deferred income taxes |
4,830 | 3,197 | (7,492 | ) | (6,385 | ) | (1,242 | ) | |||||||||
Stock-based compensation |
968 | 3,565 | 4,799 | 3,387 | 56 | ||||||||||||
Excess tax benefit of stock-based compensation |
(481 | ) | (3,504 | ) | (6,386 | ) | (5,239 | ) | — | ||||||||
Income tax benefits related to stock option exercises |
474 | 3,534 | 6,427 | 5,399 | 408 | ||||||||||||
Impairment of assets held for sale |
— | — | — | — | 281 | ||||||||||||
Gain on sale of fixed assets |
— | — | — | — | (26 | ) | |||||||||||
Prepayment penalty on early extinguishment of debt |
(3,002 | ) | (3,552 | ) | — | (6,146 | ) | — | |||||||||
Environmental expenditures |
(8,617 | ) | (14,268 | ) | (6,511 | ) | (7,605 | ) | (7,243 | ) | |||||||
Changes in assets and liabilities, net of acquisition |
|||||||||||||||||
Accounts receivable |
(11,429 | ) | 17,221 | (19,142 | ) | (5,000 | ) | (25,983 | ) | ||||||||
Other current assets |
1,093 | 5,529 | (2,693 | ) | (11,092 | ) | (686 | ) | |||||||||
Accounts payable |
5,050 | (17,763 | ) | (4,603 | ) | (4,674 | ) | (804 | ) | ||||||||
Other current liabilities |
(10,757 | ) | (2,829 | ) | 21,377 | 5,466 | 10,580 | ||||||||||
Net cash provided by operating activities |
$ | 93,270 | $ | 109,590 | $ | 79,995 | $ | 61,382 | $ | 29,667 | |||||||
- (4)
- Long-term obligations (including current portion) include borrowings under our current and former revolving credit facilities and capital lease obligations.
35
ITEM 7. MANAGEMENT'S DISCUSSION AND ANALYSIS OF FINANCIAL CONDITION AND RESULTS OF OPERATIONS
Forward-Looking Statements
In addition to historical information, this Management's Discussion and Analysis contains forward-looking statements, which are generally identifiable by use of the words "believes," "expects," "intends," "anticipates," "plans to," "estimates," "projects," or similar expressions. These forward-looking statements are subject to certain risks and uncertainties that could cause actual results to differ materially from those reflected in these forward-looking statements. Factors that might cause such a difference include, but are not limited to, those discussed in the section of this report entitled Item 1A, "Risk Factors." Readers are cautioned not to place undue reliance on these forward-looking statements, which reflect management's opinions only as of the date hereof. We undertake no obligation to revise or publicly release the results of any revision to these forward-looking statements. Readers should also carefully review the risk factors described in other documents which we file from time to time with the SEC, including the quarterly reports on Form 10-Q to be filed by us during 2010.
Overview
We are a leading provider of environmental, energy and industrial services throughout North America. We serve over 50,000 customers, including a majority of Fortune 500 companies, thousands of smaller private entities and numerous federal, state, provincial and local governmental agencies. We have more than 175 locations, including over 50 waste management facilities, throughout North America in 36 U.S. states, seven Canadian provinces, Mexico and Puerto Rico. We also operate international locations in Bulgaria, China, Singapore, Sweden, Thailand and the United Kingdom.
In connection with the closing of our acquisition of Eveready on July 31, 2009, we re-aligned and expanded our reportable segments. This new structure reflects the way management makes operating decisions and manages the growth and profitability of our business. The amounts presented for all prior periods in the discussion and analysis have been recast to reflect the impact of such changes. Under the new structure, we report the business in four operating segments, including:
- •
- Technical Services—provide a broad range of hazardous material management services including the packaging,
collection, transportation, treatment and disposal of hazardous and non-hazardous waste at Company-owned incineration, landfill, wastewater, and other treatment facilities.
- •
- Field Services—provide a wide variety of environmental cleanup services on customer sites or other locations
on a scheduled or emergency response basis including tank cleaning, decontamination, remediation, and spill cleanup.
- •
- Industrial Services—provide industrial and specialty services, such as high-pressure and chemical
cleaning, catalyst handling, decoking, material processing and industrial lodging services to refineries, chemical plants, pulp and paper mills, and other industrial facilities.
- •
- Exploration Services—provide exploration and directional boring services to the energy sector serving oil and gas exploration, production, and power generation.
During the third quarter of 2009, we completed the Eveready acquisition and integrated Eveready's operations with our existing systems and processes. Eveready is a Canadian-based company that provides industrial maintenance and production, lodging and exploration services to the oil and gas, chemical, pulp and paper, manufacturing and power generation industries. We expect the acquisition to extend our capabilities in both the environmental and industrial services marketplace, providing cross-selling opportunities for the combined organization and significantly broadening our presence throughout Canada.
36
The purchase price of the acquisition totaled $410 million and included the issuance of 2.4 million shares of our common stock, assumption of $237 million of Eveready debt, and a cash payment of $56 million to the former Eveready shareholders. The acquisition was announced in April 2009, and as a condition to the approval of the acquisition by the Canadian Commissioner of Competition we agreed to divest Eveready's Pembina Area Landfill, located near Drayton Valley, Alberta, due to its proximity to our existing landfill in the region.
In connection with our acquisition of Eveready, we were required to obtain waivers from the lenders under our and Eveready's respective then existing credit agreements to allow for the completion of the acquisition and the repayment of Eveready's then outstanding 7% convertible subordinated debentures, and also concurrently with or following the acquisition to secure financing sufficient to pay off or restructure substantially all of the then remaining Eveready indebtedness. We obtained the necessary waivers prior to the closing of the acquisition and subsequently met the financing requirement on August 14, 2009 by issuing $300.0 million principal amount of 75/8% senior secured notes for net proceeds of $292.1 million. We used most of the net proceeds of the offering to repay and terminate substantially all of the then outstanding Eveready debt (other than certain capital leases) assumed in connection with the acquisition and to pay related fees and expenses.
Critical Accounting Policies and Estimates
The preparation of our financial statements requires us to make estimates and judgments that affect the reported amounts of our assets, liabilities, revenues and expenses, and related disclosures of contingent liabilities. The following are the areas that we believe require the greatest amount of judgments or estimates in the preparation of the financial statements: revenue allowance, deferred revenue, allowance for doubtful accounts, accounting for landfills, non-landfill closure and post-closure liabilities, remedial liabilities, testing goodwill for impairment, permits and other intangible assets, insurance expense, legal matters, and provision for income taxes. Our management reviews critical accounting estimates with the Audit Committee of our Board of Directors on an ongoing basis and as needed prior to the release of our annual financial statements. Also see Note 2, "Significant Accounting Policies," in Part II, Item 8. "Financial Statements and Supplementary Data," of this Form 10-K annual report, which discusses the significant assumptions used in applying our accounting policies.
Revenue Allowance. Due to the nature of our business and the complex invoices that result from the services we provide, customers may withhold payments and attempt to renegotiate amounts invoiced. In addition, for some of the services we provide, our invoices are based on quotes that can either generate credits or debits when the actual revenue amount is known. Based on our industry knowledge and historical trends, we record a revenue allowance accordingly. This practice causes the volume of activity flowing through the revenue allowance during the year to be higher than the balance at the end of the year. Increases in overall sales volumes and the expansion of our customer base in recent years have also increased the volume of additions and deductions to the allowance during the year, as well as increased the amount of the allowance at the end of the year.
Our revenue allowance is intended to cover the net amount of revenue adjustments that may need to be credited to customers' accounts in future periods. We determine the appropriate total revenue allowance by evaluating the following factors on a customer-by-customer basis as well as on a consolidated level: historical collection trends, age of outstanding receivables, existing economic conditions and other information as deemed applicable. Revenue allowance estimates can differ materially from the actual adjustments, but historically our revenue allowance has been sufficient to cover the net amount of the reserve adjustments issued in subsequent reporting periods.
Deferred Revenue. As is the customary practice in the environmental services industry, we submit a bill for services shortly after waste is collected from a customer location and prior to completion of
37
the waste disposal process. We recognize revenue for waste disposal services only when the waste is placed into a landfill, incinerated, treated in a wastewater treatment facility, or shipped to a third party for disposal. Deferred revenue, representing amounts invoiced to customers for waste not yet processed, stated on our balance sheet as of December 31, 2009 was $21.2 million.
Allowance for Doubtful Accounts. We establish an allowance for doubtful accounts to cover accounts receivable that may not be collectible. In establishing the allowance for doubtful accounts, we analyze the collectability of accounts that are large or past due. In addition, we consider historical bad debts and current economic trends in evaluating the allowance for doubtful accounts. Accounts receivable written off in subsequent periods can differ materially from the allowance for doubtful accounts provided, but historically our provision has been adequate.
Accounting for Landfills. We amortize landfill improvements and certain landfill-related permits over their estimated useful lives. The units-of-consumption method is used to amortize land, landfill cell construction, asset retirement costs and remaining landfill cells and sites. We also utilize the units-of-consumption method to record closure and post-closure obligations for landfill cells and sites. Under the units-of-consumption method, we include future estimated construction and asset retirement costs, as well as costs incurred to date, in the amortization base of the landfill assets. Additionally, where appropriate, as discussed below, we include probable expansion airspace that has yet to be permitted in the calculation of the total remaining useful life of the landfill.
Landfill Assets—Landfill assets include the costs of landfill site acquisition, permits and cell construction incurred to date. These amounts are amortized under the units-of-consumption method such that the asset is completely amortized when the landfill ceases accepting waste.
Landfill Capacity—Landfill capacity, which is the basis for the amortization of landfill assets and for the accrual of final closure and post-closure obligations, represents total permitted airspace plus unpermitted airspace that management believes is probable of ultimately being permitted based on established criteria. Management applies the following criteria for evaluating the probability of obtaining a permit for future expansion airspace at existing sites, which provides management a basis to evaluate the likelihood of success of unpermitted expansions:
- •
- Personnel are actively working to obtain the permit or permit modifications (land use, state and federal) necessary for
expansion of an existing landfill, and progress is being made on the project.
- •
- Management expects to submit the application within the next year and to receive all necessary approvals to accept waste
within the next five years.
- •
- At the time the expansion is included in management's estimate of the landfill's useful economic life, it is probable that
the required approvals will be received within the normal application and processing time periods for approvals in the jurisdiction in which the landfill is located.
- •
- The Company or other owner of the landfill has a legal right to use or obtain the right to use the land associated with
the expansion plan.
- •
- There are no significant known political, technical, legal or business restrictions or other issues that could impair the
success of such expansion.
- •
- A financial feasibility analysis has been completed and the results demonstrate that the expansion will have a positive
financial and operational impact such that management is committed to pursuing the expansion.
- •
- Additional airspace and related additional costs, including permitting, final closure and post-closure costs, have been estimated based on the conceptual design of the proposed expansion.
38
Exceptions to the criteria set forth above are approved through a landfill-specific approval process that includes approval from our Chief Financial Officer and review by the Audit Committee of our Board of Directors. As of December 31, 2009, there were three unpermitted expansions at two locations included in management's landfill calculation, which represented 29.4% of our remaining airspace at that date. As of December 31, 2009, none of these unpermitted expansions were considered exceptions to management's established criteria described above. If actual expansion airspace is significantly different from management's estimate of expansion airspace, the amortization rates used for the units-of-consumption method would change, therefore impacting our profitability. If we determine that there is less actual expansion airspace at a landfill, this would increase amortization expense recorded and decrease profitability, while if we determine a landfill has more actual expansion airspace, amortization expense would decrease and profitability would increase.
Landfill Final Closure and Post-Closure Liabilities—The balance of landfill final closure and post-closure liabilities at December 31, 2009 and 2008 was $28.1 million and $25.3 million, respectively. We have material financial commitments for the costs associated with requirements of the EPA and the comparable regulatory agency in Canada for landfill final closure and post-closure activities. In the United States, the landfill final closure and post-closure requirements are established under the standards of the EPA, and are implemented and applied on a state-by-state basis. We develop estimates for the cost of these activities based on our evaluation of site-specific facts and circumstances, such as the existence of structures and other landfill improvements that would need to be dismantled, the amount of groundwater monitoring and leachate management expected to be performed, and the length of the post-closure period as determined by the applicable regulatory agency. Included in our cost estimates are our interpretation of current regulatory requirements and proposed regulatory changes. Such estimates may change in the future due to various circumstances including, but not limited to, permit modifications, changes in legislation or regulations, technological changes and results of environmental studies. We perform zero-based reviews of these estimated liabilities at least every five years or sooner if the occurrence of a significant event is likely to change the timing or amount of the currently estimated expenditures. We consider a significant event to be a new regulation or an amendment to an existing regulation, a new permit or modification to an existing permit, or a change in the market price of a significant cost item. Our cost estimates are calculated using internal sources as well as input from third party experts. These costs are measured at estimated fair value using present value techniques, and therefore changes in the estimated timing of closure and post-closure activities would affect the liability, the value of the related asset, and our results of operations.
Final closure costs are the costs incurred after the site ceases to accept waste, but before the landfill is certified as closed by the applicable state or provincial regulatory agency. These costs generally include the costs required to cap the final cell of the landfill (if not included in cell closure), to dismantle certain structures for landfills and other landfill improvements and regulation-mandated groundwater monitoring, and for leachate management. Post-closure costs involve the maintenance and monitoring of a landfill site that has been certified closed by the applicable regulatory agency. These costs generally include groundwater monitoring and leachate management. Regulatory post-closure periods are generally 30 years after landfill closure. Final closure and post-closure obligations are accrued on a units-of-consumption basis, such that the present value of the final closure and post-closure obligations are fully accrued at the date the landfill discontinues accepting waste.
Non-Landfill Closure and Post-Closure Liabilities. The balance of our non-landfill closure and post-closure liabilities at December 31, 2009 and 2008 was $7.7 million and $7.4 million, respectively. We base estimates for non-landfill closure and post-closure liabilities on our interpretations of existing permit and regulatory requirements for closure and post-closure maintenance and monitoring. Our cost estimates are calculated using internal sources as well as input from third party experts. We use probability scenarios to estimate when future operations will cease and inflate the current cost of closing the non-landfill facility on a probability weighted basis using the appropriate inflation rate and
39
then discounting the future value to arrive at an estimated present value of closure and post-closure costs. The estimates for non-landfill closure and post-closure liabilities are inherently uncertain due to the possibility that permit and regulatory requirements will change in the future, impacting the estimation of total costs and the timing of the expenditures. We review non-landfill closure and post-closure liabilities for changes to key assumptions that would impact the amount of the recorded liabilities. Changes that would prompt us to revise a liability estimate include changes in legal requirements that impact our expected closure plan, in the market price of a significant cost item, in the probability scenarios as to when future operations at a location might cease, or in the expected timing of the cost expenditures. Changes in estimates for non-landfill closure and post-closure events immediately impact the required liability and the value of the corresponding asset. If a change is made to a fully-consumed asset, the adjustment is charged immediately to expense. When a change in estimate relates to an asset that has not been fully consumed, the adjustment to the asset is recognized in income prospectively as a component of amortization. Historically, material changes to non-landfill closure and post-closure estimates have been infrequent.
Remedial Liabilities. The balance of our remedial liabilities at December 31, 2009 and 2008 was $145.5 million and $145.9 million, respectively. See Note 9, "Remedial Liabilities," to our consolidated financial statements for the three years ended December 31, 2009, for the changes to the remedial liabilities during the years ended December 31, 2009 and 2008. Remedial liabilities are obligations to investigate, alleviate or eliminate the effects of a release (or threat of a release) of hazardous substances into the environment and may also include corrective action under RCRA. Our remediation obligations can be further characterized as Legal, Superfund, Long-term Maintenance and One-Time Projects. Legal liabilities are typically comprised of litigation matters that involve potential liability for certain aspects of environmental cleanup and can include third party claims for property damage or bodily injury allegedly arising from or caused by exposure to hazardous substances originating from our activities or operations, or in certain cases, from the actions or inactions of other persons or companies. Superfund liabilities are typically claims alleging that we are a potentially responsible party ("PRP") and/or are potentially liable for environmental response, removal, remediation and cleanup costs at/or from either a facility we own or a site owned by a third party. As described in Note 18, "Commitments and Contingencies," to our consolidated financial statements for the three years ended December 31, 2009, Superfund liabilities also include certain liabilities payable to governmental entities for which we are potentially liable to reimburse the sellers in connection with our 2002 acquisition of substantially all of the assets of the Chemical Services Division of Safety-Kleen Corp. Long-term Maintenance liabilities include the costs of groundwater monitoring, treatment system operations, permit fees and facility maintenance for inactive operations. One-Time Projects liabilities include the costs necessary to comply with regulatory requirements for the removal or treatment of contaminated materials.
Amounts recorded related to the costs required to remediate a location are determined by internal engineers and operational personnel and incorporate input from external third parties. The estimates consider such factors as the nature and extent of environmental contamination (if any); the terms of applicable permits and agreements with regulatory authorities as to cleanup procedures and whether modifications to such permits and agreements will likely need to be negotiated; the cost of performing anticipated cleanup activities based upon current technology; and in the case of Superfund and other sites where other parties will also be responsible for a portion of the clean up costs, the likely allocation of such costs and the ability of such other parties to pay their share. Each quarter, our management discusses if any events have occurred or milestones have been met that would warrant the creation of a new remedial liability or the revision of an existing remedial liability. Such events or milestones include identification and verification as a PRP, receipt of a unilateral administrative order under Superfund or requirement for RCRA interim corrective measures, completion of the feasibility study under Superfund or the corrective measures study under RCRA, new or modifications to existing permits, changes in property use, or a change in the market price of a significant cost item. Remedial liabilities are inherently difficult to estimate and there is a risk that the actual quantities of
40
contaminants could differ from the results of the site investigation, which could materially impact the amount of our liability. It is also possible that chosen methods of remedial solutions will not be successful and funds will be required for alternative solutions.
Remedial liabilities are discounted only when the timing of the payments is estimable and the amounts are determinable. With the exception of remedial liabilities assumed as part of an acquisition that are measured at fair value, our experience has been that the timing of payments for remedial liabilities is usually not estimable and therefore the amounts of remedial liabilities are generally not discounted.
Goodwill. Goodwill is assessed for impairment at least annually and as triggering events occur. Such triggering events include, but are not limited to:
- •
- A significant adverse change in legal factors or in the business climate,
- •
- An adverse action or assessment by a regulator,
- •
- Cash or operating losses at the reporting unit, or
- •
- Market capitalization that is below book value.
Our management assesses impairment by comparing the fair value of each reporting unit to the carrying value of the net assets assigned to each reporting unit, including goodwill. In the event the fair value of a reporting unit exceeds its carrying amount, goodwill of the reporting unit is considered not impaired. If the carrying amount of a reporting unit exceeds its fair value, the second step of the goodwill test would be performed to measure the amount of impairment loss.
The fair value of the reporting units is determined based on a discounted cash flow analysis and compared to guideline companies and comparable transactions for reasonableness. Significant judgments are inherent in these analyses and include assumptions about the amount and timing of expected future cash flows, growth rates, and the determination of appropriate discount rates. We believe that the assumptions used in our impairment analysis are reasonable, but variations in any of the assumptions may result in different calculations of fair values that could result in a material impairment charge. The impairment analysis performed during the year ended December 31, 2009, utilized 2010 annual budgeted amounts. The discount rate assumptions were based on an assessment of our weighted average cost of capital. As part of the analysis, we compared the aggregate implied fair value of our five reporting units to our market capitalization at December 31, 2009 and assessed for reasonableness.
We did not record an impairment charge as a result of our goodwill impairment test in 2009. The fair value significantly exceeds the carry value of our Field Services and Technical Services reporting units. Because we assigned net assets at fair value as of July 31, 2009 to the Industrial Services and Exploration Services reporting units, the fair value closely approximates the carrying value of these recently created reporting units. There can be no assurance that goodwill will not be impaired at any time in the future.
Permits and Other Intangible Assets. Our long-lived assets, including permits, are carried on our financial statements based on their cost less accumulated depreciation or amortization. We review the carrying value of our long-lived assets for impairment whenever events or changes in circumstances indicate that the carrying value of an asset may not be recoverable. In order to assess whether a potential impairment exists, the assets' carrying values are compared with their undiscounted expected future cash flows. Estimating future cash flows requires significant judgment about factors such as general economic conditions and projected growth rates, and our estimates often vary from the cash flows eventually realized. Impairments are measured by comparing the fair value of the asset to its carrying value. Fair value is generally determined by considering (i) internally developed discounted projected cash flow analysis of the asset; (ii) actual third-party valuations; and/or (iii) information
41
available regarding the current market environment for similar assets. If the fair value of an asset is determined to be less than the carrying amount of the asset, an impairment in the amount of the difference is recorded in the period that the events or changes in circumstances that indicated the carrying value of the assets may not be recoverable occurred.
Insurance Expense. It is our policy to retain a significant portion of certain expected losses related primarily to workers' compensation, health insurance, comprehensive general and vehicle liability. The insurance accruals are based on claims filed and estimates of claims not reported and are developed by management with assistance from our third-party actuary and third-party claims administrator. The insurance accruals are driven by historical claims data and industry information. Significant changes in the frequency or amount of claims as compared to our historical information could materially affect our self-insurance liabilities. Actual expenditures required in future periods can differ materially from accruals established based on estimates.
Legal Matters. As described in Note 18, "Commitments and Contingencies," to the financial statements included in Item 8, "Financial Statements and Supplemental Data," we are subject to legal proceedings which relate to our past acquisitions or which have arisen in the ordinary course of business. Accruals are established for legal matters when, in our opinion, it is probable that a liability exists and the liability can be reasonably estimated. As of December 31, 2009, we had reserves of $28.8 million (substantially all of which we had established as part of the purchase price for the CSD assets and are included in the $181.3 million accrued environmental liabilities as of December 31, 2009 for closure, post closure and remediation, as described above) relating to our potential liabilities in connection with such legal proceedings which were then pending or anticipated. We also estimate that it is "reasonably possible," as that term is defined ("more than remote but less than likely"), that the amount of such total liabilities could be as much as $4.7 million more. Actual expenses incurred in future periods could differ materially from accruals established.
Provision for Income Taxes. We account for income taxes in accordance with Accounting Standards Codification ("ASC") 740, Income taxes. We have established a valuation allowance when, based on an evaluation of objective verifiable evidence, we believe it is more likely than not that some portion or all of deferred tax assets will not be realized.
A liability for uncertain tax positions is recorded to the extent a tax position taken or expected to be taken in a tax return does not meet certain recognition or measurement criteria. We record interest and penalties on these uncertain tax positions as applicable. We record interest and penalties related to income tax matters as a component of income tax expense.
42
Results of Operations
The following table sets forth for the periods indicated certain operating data associated with our results of operations. This table and subsequent discussions should be read in conjunction with Item 6, "Selected Financial Data," and Item 8, "Financial Statements and Supplementary Data," of this report.
| |
Percentage of Total Revenues Year Ended December 31, |
|||||||||||||||
|---|---|---|---|---|---|---|---|---|---|---|---|---|---|---|---|---|
| |
2009 | 2008 | 2007 | 2006 | 2005 | |||||||||||
Revenues |
100.0 | % | 100.0 | % | 100.0 | % | 100.0 | % | 100.0 | % | ||||||
Cost of revenues (exclusive of items shown separately below) |
70.2 | 68.7 | 70.1 | 70.4 | 72.1 | |||||||||||
Selling, general and administrative expenses |
15.2 | 15.5 | 15.8 | 15.1 | 15.2 | |||||||||||
Accretion of environmental liabilities |
1.0 | 1.0 | 1.1 | 1.2 | 1.5 | |||||||||||
Depreciation and amortization |
6.0 | 4.3 | 4.0 | 4.3 | 4.0 | |||||||||||
Income from operations |
7.6 | 10.5 | 9.0 | 9.0 | 7.2 | |||||||||||
Other income (expense) |
— | — | — | (0.1 | ) | 0.1 | ||||||||||
Loss on early extinguishment of debt |
(0.4 | ) | (0.5 | ) | — | (1.0 | ) | — | ||||||||
Interest (expense) net |
(1.5 | ) | (0.8 | ) | (1.4 | ) | (1.5 | ) | (3.2 | ) | ||||||
Income from continuing operations before provision for income taxes |
5.7 | 9.2 | 7.6 | 6.4 | 4.1 | |||||||||||
Provision for income taxes |
2.4 | 3.6 | 2.9 | 0.8 | 0.5 | |||||||||||
Income from continuing operations |
3.3 | 5.6 | 4.7 | 5.6 | 3.6 | |||||||||||
Income from discontinued operations, net of tax |
0.1 | — | — | — | — | |||||||||||
Net income |
3.4 | % | 5.6 | % | 4.7 | % | 5.6 | % | 3.6 | % | ||||||
Segment data
Performance of our segments is evaluated on several factors of which the primary financial measure is Adjusted EBITDA. The following tables set forth certain operating data associated with our results of operations and compare Adjusted EBITDA contribution by operating segment for the years ended December 31, 2009 and 2008 and the years ended December 31, 2008 and 2007. See footnote 3 under Item 6, "Selected Financial Data," for a description of the calculation of Adjusted EBITDA and a reconciliation of Adjusted EBITDA to net income and net cash provided by operating activities. We consider the Adjusted EBITDA contribution from each operating segment to include revenue attributable to that segment less operating expenses, which include cost of revenues and selling, general and administrative expenses. Revenue attributable to each segment is generally external or direct revenue from third party customers. Direct revenue is the revenue allocated to the segment performing the provided service. Certain income or expenses of a non-recurring or unusual nature are not included in the operating segment's Adjusted EBITDA contribution. In connection with the Eveready acquisition on July 31, 2009, amounts presented for prior periods have been recast to reflect the changes made to our segment presentation as a result of the changes we then made in how we manage our business. This table and subsequent discussions should be read in conjunction with Item 8, "Financial Statements and Supplementary Data," of this report and in particular Note 19, "Segment Reporting," to such financial statements.
43
Year ended December 31, 2009 versus Year ended December 31, 2008
| |
Summary of Operations (in thousands) | ||||||||||||||
|---|---|---|---|---|---|---|---|---|---|---|---|---|---|---|---|
| |
December 31, | ||||||||||||||
| |
2009 | 2008 | $ Change |
% Change |
|||||||||||
Direct Revenues: |
|||||||||||||||
Technical Services |
$ | 672,969 | $ | 734,940 | $ | (61,971 | ) | (8.4 | )% | ||||||
Field Services |
202,745 | 258,431 | (55,686 | ) | (21.5 | ) | |||||||||
Industrial Services |
181,826 | 39,509 | 142,317 | 360.2 | |||||||||||
Exploration Services |
18,392 | — | 18,392 | — | |||||||||||
Corporate Items |
(1,712 | ) | (2,167 | ) | 455 | (21.0 | ) | ||||||||
Total |
1,074,220 | 1,030,713 | 43,507 | 4.2 | |||||||||||
Cost of Revenues (exclusive of certain items shown separately)(1): |
|||||||||||||||
Technical Services |
430,743 | 483,789 | (53,046 | ) | (11.0 | ) | |||||||||
Field Services |
155,834 | 193,662 | (37,828 | ) | (19.5 | ) | |||||||||
Industrial Services |
145,838 | 27,971 | 117,867 | 421.4 | |||||||||||
Exploration Services |
16,147 | — | 16,147 | — | |||||||||||
Corporate Items |
4,921 | 2,398 | 2,523 | 105.3 | |||||||||||
Total |
753,483 | 707,820 | 45,663 | 6.5 | |||||||||||
Selling, General & Administrative Expenses: |
|||||||||||||||
Technical Services |
64,543 | 64,675 | (132 | ) | (0.2 | ) | |||||||||
Field Services |
22,473 | 27,653 | (5,180 | ) | (18.7 | ) | |||||||||
Industrial Services |
15,358 | 2,550 | 12,808 | 502.2 | |||||||||||
Exploration Services |
1,622 | — | 1,622 | — | |||||||||||
Corporate Items |
59,161 | 64,796 | (5,635 | ) | (8.7 | ) | |||||||||
Total |
163,157 | 159,674 | 3,483 | 2.2 | |||||||||||
Adjusted EBITDA(2): |
|||||||||||||||
Technical Services |
177,683 | 186,476 | (8,793 | ) | (4.7 | ) | |||||||||
Field Services |
24,438 | 37,116 | (12,678 | ) | (34.1 | ) | |||||||||
Industrial Services |
20,630 | 8,988 | 11,642 | 129.5 | |||||||||||
Exploration Services |
623 | — | 623 | — | |||||||||||
Corporate Items |
(65,794 | ) | (69,361 | ) | 3,567 | (5.1 | ) | ||||||||
Total |
$ | 157,580 | $ | 163,219 | $ | (5,639 | ) | (3.5 | )% | ||||||
- (1)
- Items
shown separately on the statements of income consist of (i) accretion of environmental liabilities and (ii) depreciation and
amortization.
- (2)
- See footnote 3 under Item 6, "Selected Financial Data," for a discussion of Adjusted EBITDA.
Revenues
Technical Services revenues decreased 8.4%, or $62.0 million, for the year ended December 31, 2009 from the comparable period in 2008 primarily due to reductions in volumes being processed through our facilities network ($45.8 million) and the weakening Canadian dollar ($7.7 million). These decreases were partially offset by revenues generated by the two solvent recycling facilities acquired in March 2008, changes in product mix and pricing ($5.3 million) and increases in incinerator and landfill
44
volumes ($12.7 million). The remainder of the total decrease was attributable to reductions in base business and reduced fuel recovery fees.
Field Services revenues decreased 21.5%, or $55.7 million, for the year ended December 31, 2009 from the comparable period in 2008 due primarily to a decline in base business, a reduction in the volume of long-term project business ($10.3 million), declines in oil pricing ($9.8 million), a reduction in event related revenues ($9.7 million), a decrease in large remedial project business ($7.7 million) and the weakening of the Canadian dollar ($0.9 million).
The increases in Industrial Services and Exploration Services revenues for the year ended December 31, 2009 were primarily due to our acquisition of Eveready on July 31, 2009.
There are many factors which have impacted, and continue to impact, our revenues. These factors include, but are not limited to: the current economic slowdown, the effects of unseasonable weather conditions, the general conditions of the oil and gas industries particularly in the Alberta oil sands and other parts of Western Canada, the reduced level of emergency response projects, competitive industry pricing, and the effects of lower fuel prices on our fuel recovery fee.
Cost of Revenues
Technical Services costs of revenues decreased 11.0%, or $53.0 million, for the year ended December 31, 2009 from the comparable period in 2008 primarily due to reductions in outside disposal and transportation costs ($11.0 million), salary and labor expenses ($10.6 million), fuel costs ($9.5 million), costs of materials, supplies, and equipment rentals ($5.7 million), utility costs ($4.6 million), subcontractor and temporary fees ($4.2 million), and the weakening of the Canadian dollar ($4.2 million).
Field Services costs of revenues decreased 19.5%, or $37.8 million, for the year ended December 31, 2009 from the comparable period in 2008 primarily due to decreases in outside transportation and disposal costs ($9.8 million), subcontractor and temporary fees ($6.3 million), labor and related expenses ($5.1 million), fuel charges ($4.4 million), material and supply costs ($2.7 million), materials for reclaim or resale ($4.2 million), travel expenses ($2.2 million), and the weakening of the Canadian dollar ($0.7 million). The decrease in outside transportation and disposal costs was partially attributable to Company-wide initiatives to maximize the utilization of Company owned resources.
The increases in Industrial Services and Exploration Services cost of revenues for the year ended December 31, 2009 were primarily due to our acquisition of Eveready on July 31, 2009.
Corporate Items costs of revenues increased $2.5 million for the year ended December 31, 2009 from the comparable period in 2008 primarily due to increases in health insurance related costs.
We believe that our ability to manage operating costs is important in our ability to remain price competitive. We continue to upgrade the quality and efficiency of our waste treatment services through the development of new technology and continued modifications and upgrades at our facilities, and implementation of strategic sourcing initiatives. We plan to continue to focus on achieving cost savings relating to purchased goods and services through a strategic sourcing initiative. No assurance can be given that our efforts to reduce future operating expenses will be successful.
Selling, General and Administrative Expenses
Technical Services selling, general and administrative expenses decreased 0.2% or $0.1 million for the year ended December 31, 2009 from the comparable period in 2008 primarily due to reductions in salaries, commissions and bonuses ($2.5 million), partially offset by year-over-year unfavorable changes in environmental liability estimates ($2.4 million) resulting from a benefit recorded in 2008 of $2.3 million compared to an expense recorded in 2009 of $0.1 million.
45
Field Services selling, general and administrative expenses decreased 18.7%, or $5.2 million, for the year ended December 31, 2009 from the comparable period in 2008 primarily due to reductions in commissions and bonuses.
The increases in Industrial Services and Exploration Services selling, general and administrative expenses for the year ended December 31, 2009 were primarily due to our acquisition of Eveready on July 31, 2009.
Corporate Items selling, general and administrative expenses decreased $5.6 million, primarily due to a reduction in stock-based compensation and bonuses ($7.3 million), legal fees ($3.9 million), salaries ($2.6 million) which included a year-over-year reduction of $1.8 million for severance costs, and year-over-year favorable changes in environmental liability estimates ($4.3 million). These decreases were partially offset by increases in year-over-year acquisition related costs ($6.6 million), health insurance related costs ($1.8 million) and the impact on our balance sheet of the weakening Canadian dollar ($4.1 million).
Depreciation and Amortization
| |
Year Ended December 31, (in thousands) |
||||||
|---|---|---|---|---|---|---|---|
| |
2009 | 2008 | |||||
Depreciation of fixed assets |
$ | 50,428 | $ | 33,438 | |||
Landfill and other amortization |
14,470 | 11,033 | |||||
Total depreciation and amortization |
$ | 64,898 | $ | 44,471 | |||
Depreciation and amortization increased 45.9%, or $20.4 million for the year ended December 31, 2009 compared to the same period in 2008. Depreciation of fixed assets increased primarily due to our acquisition of Eveready on July 31, 2009 and other increased capital expenditures in recent periods. Landfill and other amortization increased 31.2%, primarily due to the increase in other intangibles resulting from the acquisition of Eveready as well as increases in landfill volumes and landfill cell amortization rates.
Interest Expense, Net
| |
Year Ended December 31, (in thousands) |
||||||
|---|---|---|---|---|---|---|---|
| |
2009 | 2008 | |||||
Interest expense |
$ | 16,824 | $ | 13,497 | |||
Interest income |
(825 | ) | (5,094 | ) | |||
Interest expense, net |
$ | 15,999 | $ | 8,403 | |||
Interest expense, net increased 90.4%, or $7.6 million for the year ended December 31, 2009 compared to the same period in 2008. The increase in interest expense was primarily due to the issuance of $300.0 million in senior secured notes in August 2009 and the refinancing of our revolving credit facility. The reduction of interest income in the same period was primarily due to a reduction in the interest rates being earned on our cash and cash equivalents balances.
46
Year ended December 31, 2008 versus Year ended December 31, 2007
| |
Summary of Operations (in thousands) | ||||||||||||||
|---|---|---|---|---|---|---|---|---|---|---|---|---|---|---|---|
| |
December 31, | ||||||||||||||
| |
2008 | 2007 | $ Change |
% Change |
|||||||||||
Direct Revenues: |
|||||||||||||||
Technical Services |
$ | 734,940 | $ | 694,361 | $ | 40,579 | 5.8 | % | |||||||
Field Services |
258,431 | 215,931 | 42,500 | 19.7 | |||||||||||
Industrial Services |
39,509 | 37,736 | 1,773 | 4.7 | |||||||||||
Exploration Services |
— | — | — | — | |||||||||||
Corporate Items |
(2,167 | ) | (1,111 | ) | (1,056 | ) | 95.0 | ||||||||
Total |
1,030,713 | 946,917 | 83,796 | 8.8 | |||||||||||
Cost of Revenues (exclusive of certain items shown separately)(1): |
|||||||||||||||
Technical Services |
483,789 | 468,469 | 15,320 | 3.3 | |||||||||||
Field Services |
193,662 | 161,504 | 32,158 | 19.9 | |||||||||||
Industrial Services |
27,971 | 28,707 | (736 | ) | (2.6 | ) | |||||||||
Exploration Services |
— | — | — | — | |||||||||||
Corporate Items |
2,398 | 5,760 | (3,362 | ) | (58.4 | ) | |||||||||
Total |
707,820 | 664,440 | 43,380 | 6.5 | |||||||||||
Selling, General & Administrative Expenses: |
|||||||||||||||
Technical Services |
64,675 | 62,487 | 2,188 | 3.5 | |||||||||||
Field Services |
27,653 | 19,597 | 8,056 | 41.1 | |||||||||||
Industrial Services |
2,550 | 3,439 | (889 | ) | (25.9 | ) | |||||||||
Exploration Services |
— | — | — | — | |||||||||||
Corporate Items |
64,796 | 63,657 | 1,139 | 1.8 | |||||||||||
Total |
159,674 | 149,180 | 10,494 | 7.0 | |||||||||||
Adjusted EBITDA(2): |
|||||||||||||||
Technical Services |
186,476 | 163,405 | 23,071 | 14.1 | |||||||||||
Field Services |
37,116 | 34,830 | 2,286 | 6.6 | |||||||||||
Industrial Services |
8,988 | 5,590 | 3,398 | 60.8 | |||||||||||
Exploration Services |
— | — | — | — | |||||||||||
Corporate Items |
(69,361 | ) | (70,528 | ) | 1,167 | (1.7 | ) | ||||||||
Total |
$ | 163,219 | $ | 133,297 | $ | 29,922 | 22.4 | % | |||||||
- (1)
- Items
shown separately on the statements of income consist of (i) accretion of environmental liabilities and (ii) depreciation and
amortization.
- (2)
- See footnote 3 under Item 6, "Selected Financial Data," for a discussion of Adjusted EBITDA.
Revenues
Technical Services revenues increased 5.8%, or $40.6 million, in the year ended December 31, 2008 from the comparable period in 2007 due to increases in pricing ($38.9 million), new business, increases in fuel recovery fees, stronger performance in the transportation and disposal business lines, and the strengthening of the Canadian dollar ($0.9 million), partially offset by a nationwide reduction in landfill volumes ($15.8 million). The revenue growth from new business was generated primarily from the 2008
47
acquisitions of two solvent recycling facilities ($9.8 million), and the 2007 Romic acquisition which contributed to the overall growth in some of our Western locations ($7.1 million).
Field Services revenues increased 19.7%, or $42.5 million, in the year ended December 31, 2008 from the comparable period in 2007 due to several significant emergency response projects ($8.8 million), an increase in large remedial project business ($8.1 million), an increase in the volume of long-term project business ($6.7 million), growth in base business ($16.2 million), pricing increases, and new business. The new business reflected primarily increases in services for existing customers and the effect of the Universal Environmental acquisition.
Industrial Services revenues increased 4.7%, or $1.8 million, in the year ended December 31, 2008 from the comparable period in 2007, primarily due to increased project work.
Corporate Items revenues decreased 95.0%, or $1.1 million, in the year ended December 31, 2008 from the comparable period in 2007 resulting primarily from ceasing to charge Technical Services and Field Services for internal regulatory training in 2008 ($0.5 million) and increased use of internal resources to remediate environmental liabilities ($0.5 million). These increases were largely offset by compensating decreases in external costs (see the Cost of Revenues section below).
Cost of Revenues
Technical Services costs of revenues increased 3.3%, or $15.3 million, in the year ended December 31, 2008 from the comparable period in 2007 due primarily to higher vehicle and fuel related costs ($10.4 million), labor expenses ($6.6 million), utilities ($3.8 million), materials for reclaim or resale ($1.7 million) and the strengthening of the Canadian dollar ($0.5 million). These increases were partially offset by a decrease in outside transportation costs ($10.0 million).
Field Services costs of revenues increased 19.9%, or $32.2 million, in the year ended December 31, 2008 from the comparable period in 2007 primarily due to increases in labor ($8.7 million), vehicle and fuel ($6.0 million), outside transportation and disposal ($3.9 million), subcontractor ($3.9 million), materials and supplies ($2.1 million) and travel costs ($1.8 million). The increase in subcontractor costs was related to the increase in the size of emergency response projects. The increase in labor costs was attributable to business growth and the Universal Environmental acquisition.
Industrial Services cost of revenues decreased 2.6%, or $0.7 million, in the year ended December 31, 2008 from the comparable period in 2007 primarily due to reductions in outside transportation and disposal costs ($1.1 million) and equipment rentals ($1.0 million), offset partially by increased labor expenses ($1.6 million).
Corporate Items costs of revenues decreased 58.4%, or $3.4 million, in the year ended December 31, 2008 from the comparable period in 2007 due primarily to a reduction in insurance premiums and an increased allocation of centrally contracted insurance costs from the Corporate Items segment to Technical Services and Field Services ($1.8 million), lower costs associated with our inactive facilities ($0.8 million), increased internalization resulting in more internal costs being charged against environmental expenditures ($0.5 million), and other reduced costs ($0.3 million).
Selling, General and Administrative Expenses
Technical Services selling, general and administrative expenses increased 3.5% or $2.2 million, in the year ended December 31, 2008 from the comparable period in 2007 primarily due to increases in salary and commissions, offset by a favorable change in environmental liability estimates ($1.7 million).
Field Services selling, general and administrative expenses increased 41.1%, or $8.1 million, in the year ended December 31, 2008 from the comparable period in 2007 primarily due to increases in salary costs and incentive compensation. The increase in labor costs was due to our expansion in the West and Mid-West regions.
48
Industrial Services selling, general and administrative expenses decreased 25.9%, or $0.9 million, in the year ended December 31, 2008 from the comparable period in 2007 primarily due to reductions in commissions and bonuses.
Corporate Items selling, general and administrative expenses increased 1.8%, or $1.1 million, in the year ended December 31, 2008 from the comparable period in 2007 primarily due to increases in salaries, benefits and other compensation ($4.4 million), severance costs ($1.9 million), professional fees ($1.8 million), and other costs ($0.7 million). These increases were offset primarily by the weakening of the Canadian dollar and its impact on the remeasurement of the balance sheet ($6.6 million) which resulted from recording a benefit of $3.8 million in 2008 and an expense of $2.8 million in 2007, and year-over-year favorable changes in environmental liability estimates ($1.1 million). The increase in professional fees was primarily attributable to increased legal fees and the termination of negotiations relating to a proposed acquisition. Increases in salaries and bonuses were due to expansion and improved performance.
Depreciation and Amortization
| |
Year Ended December 31, (in thousands) |
||||||
|---|---|---|---|---|---|---|---|
| |
2008 | 2007 | |||||
Depreciation of fixed assets |
$ | 33,438 | $ | 27,200 | |||
Landfill and other amortization |
11,033 | 10,390 | |||||
Total depreciation and amortization |
$ | 44,471 | $ | 37,590 | |||
Depreciation and amortization increased 18.3%, or $6.9 million for the year ended December 31, 2008 compared to the same period in 2007. Depreciation of fixed assets increased due to increased capital expenditures in recent periods and acquisitions. Landfill and other amortization increased due primarily to an increase in other intangible assets related to acquisitions.
Interest Expense, Net
| |
Year Ended December 31, (in thousands) |
||||||
|---|---|---|---|---|---|---|---|
| |
2008 | 2007 | |||||
Interest expense |
$ | 13,497 | $ | 17,180 | |||
Interest income |
(5,094 | ) | (4,023 | ) | |||
Interest expense, net |
$ | 8,403 | $ | 13,157 | |||
Interest expense, net decreased 36.1%, or $4.8 million for the year ended December 31, 2008 compared to the same period in 2007. Interest expense decreased due to (i) early termination of capital leases, (ii) a reduction in interest rates, and (iii) the July 2008 and November 2008 redemption or purchase of $50.0 million and $18.5 million, respectively, principal amounts of outstanding senior secured notes. Interest income increased due to the interest earned on the proceeds from the issuance of common stock in April 2008.
Loss on Early Extinguishment of Debt
During the third quarter of 2009, we recorded a $4.9 million loss on the early extinguishment of debt for the repayment of the Company's $30.0 million term loan which was due in 2010, the Company's $23.7 million outstanding senior secured notes, and the Eveready credit facility assumed in connection with the acquisition. The loss included $0.7 and $2.2 million in prepayment penalties on the senior secured notes and Eveready credit facility, respectively, other fees of $0.2 million and non-cash expenses of $1.7 million and $0.1 million for unamortized financing costs and discount, respectively.
49
On July 28, 2008, pursuant to a redemption notice delivered on June 25, 2008, we redeemed $50.0 million principal amount of outstanding senior secured notes, recognizing a $4.3 million loss on early extinguishment of debt for the year ended December 31, 2008. This loss consisted of a $2.8 million prepayment penalty and a write-off of the $1.1 million unamortized portion of financing costs and $0.4 million of unamortized discount on the redeemed notes.
In November 2008, pursuant to an excess cash flow offer made on October 8, 2008, we purchased $18.5 million principal amount of outstanding senior secured notes for a purchase price of $19.2 million, plus accrued interest. This purchase resulted in a $1.2 million loss on early extinguishment of debt, which included a $0.7 million premium payment and a write-off of unamortized financing costs and unamortized discount of $0.4 million and $0.1 million, respectively.
Income from Discontinued Operations
In connection with our acquisition of Eveready, we agreed with the Canadian Commissioner of Competition to divest Eveready's Pembina Area Landfill, located near Drayton Valley, Alberta, due to its proximity to our existing landfill in the region. The Pembina Area Landfill meets the held for sale criteria and therefore the fair value of its assets and liabilities less estimated costs to sell have been recorded as held for sale in our consolidated balance sheet and the net income is presented as income from discontinued operations on our consolidated statements of income at December 31, 2009. For the year ended December 31, 2009, the Pembina Area Landfill recorded $3.1 million of revenues which are included in the calculation of income from discontinued operations.
Income Taxes
Our effective tax rate for fiscal years 2009, 2008, and 2007 was 42%, 39% and 39%, respectively. Our tax rate is affected by recurring items, such as tax rates in Canada and the relative amount of income we earn in Canada, which will change due to the acquisition of Eveready. In addition, the interest and penalties accrual for uncertain tax positions has a material impact on our rate. The rate is also affected by discrete items that may occur in any given year, but are not consistent from year to year. In addition to state income taxes, the following items had the most significant impact on the change in our U.S. federal income tax rate:
2009
- •
- A $4.2 million (6.6%) reduction resulting from rate differences between Canada and the U.S.
- •
- A $3.5 million (5.5%) increase resulting from the annual calculation of accrued interest and penalties for
uncertain tax positions.
- •
- A $1.9 million (3.0%) increase resulting from non-deductible transaction costs relating to the 2009 acquisitions.
2008
- •
- A $4.8 million (5.1%) increase resulting from the annual calculation of accrued interest and penalties for
uncertain tax positions.
- •
- A $4.5 million (4.8%) reduction resulting from rate differences between Canada and the U.S.
- •
- A $1.1 million (1.2%) reduction resulting from the release of interest and penalties of a Canadian tax reserve for
which the statute expired.
- •
- A $1.0 million (1.1%) reduction resulting from a change in state deferred taxes.
50
2007
- •
- A $5.5 million (7.6%) increase resulting from annual calculation of interest and penalties for uncertain tax
positions.
- •
- A $4.4 million (6.2%) reduction resulting from rate differences between Canada and the U.S.
- •
- A $1.9 million (2.7%) decrease resulting from an adjustment to prior year tax attributes.
- •
- A $0.8 million (1.0%) increase resulting from net Canadian withholding expense on interest payments.
Income tax expense (including taxes on income from discontinued operations) for the year ended December 31, 2009 decreased $9.7 million to $26.8 million from $36.5 million for the comparable period in 2008, while income tax expense for the year ended December 31, 2008 increased $8.5 million to $36.5 million from $28.0 million for the comparable period in 2007. The change in income tax expense between years resulted primarily from changes in earnings.
A valuation allowance is required to be established when, based on an evaluation of available evidence, it is more likely than not that some portion or all of the deferred tax assets will not be realized. Accordingly, as of December 31, 2009, we had a remaining valuation allowance of approximately $11.2 million. The allowance consists of $9.2 million of foreign tax credits, $0.9 million of state net operating loss carryforwards and $1.1 million of foreign net operating loss carryforwards. As of December 31, 2008, we had a remaining valuation allowance of approximately $10.8 million. The allowance consisted of $8.9 million of foreign tax credits and $1.9 million of state net operating loss carryforwards.
Management's policy is to recognize interest and penalties related to income tax matters as a component of income tax expense. The liability for unrecognized tax benefits as of December 31, 2009 and 2008 included accrued interest and penalties of $28.0 million and $22.2 million, respectively. Tax expense for the years ended December 31, 2009, 2008 and 2007 included interest and penalties, net of federal benefit, of $3.5 million, $4.3 million and $5.5 million, respectively.
In December 2007, the FASB issued ASC 805, Business Combinations ("ASC 805"), which was effective for financial statements issued for fiscal years beginning after December 15, 2008. Under the provisions of ASC 805, the future reversal of acquisition-related tax reserves of approximately $10.9 million as of December 31, 2009 will be recorded in earnings, rather than as an adjustment to goodwill or acquisition related other intangible assets. If recognized, this will affect the annual effective income tax rate.
Liquidity and Capital Resources
Highlights:
- •
- In February 2009, we acquired EnviroSORT Inc. for a purchase price of $9.6 million, including the assumption
of $2.5 million of debt, which we paid off on the acquisition date.
- •
- On July 24, 2009, we repaid our then outstanding $30.0 million term note.
- •
- On July 31, 2009, we discharged our then outstanding $23.0 million of senior secured notes (plus a
prepayment premium of $0.7 million and accrued interest of $0.3 million as of the scheduled redemption date of August 31, 2009). We also paid the $56 million cash portion
of the purchase price for our acquisition of Eveready and repaid Eveready's $47.1 million of then outstanding convertible notes.
- •
- On August 14, 2009, we issued $300 million aggregate principal amount of 75/8% senior secured notes due 2016 (the "notes") and used approximately $175.0 million of the net proceeds to
51
repay all amounts outstanding under Eveready's then existing credit facility and certain capital leases and to pay related fees, expenses and other costs. The Eveready credit facility was terminated in connection with the repayment of all amounts outstanding thereunder.
We intend to use our remaining existing cash and cash equivalents, marketable securities and cash flow from operations to provide for our working capital needs and to fund capital expenditures. We anticipate that our cash flow provided by operating activities will provide the necessary funds on both a short- and long-term basis to meet operating cash requirements.
We had accrued environmental liabilities as of December 31, 2009 of approximately $181.3 million, substantially all of which we assumed in connection with our acquisition of the CSD assets in September 2002, Teris LLC in 2006, and one of the two solvent recycling facilities we purchased from Safety-Kleen Systems, Inc. in 2008. This amount excludes an additional $3.0 million of environmental liabilities related to the Pembina Area Landfill which we have agreed to divest, and which are recorded as liabilities held for sale. We anticipate our environmental liabilities will be payable over many years and that cash flow from operations will generally be sufficient to fund the payment of such liabilities when required. However, events not anticipated (such as future changes in environmental laws and regulations) could require that such payments be made earlier or in greater amounts than currently anticipated, which could adversely affect our results of operations, cash flow and financial condition.
We assess our liquidity in terms of our ability to generate cash to fund our operating, investing, and financing activities. Our primary ongoing cash requirements will be to fund operations, capital expenditures, interest payments and investments in line with our business strategy. We believe our future operating cash flows will be sufficient to meet our future operating and investing cash needs. Furthermore, the existing cash balances and the availability of additional borrowings under our revolving credit facility provide additional potential sources of liquidity should they be required.
Cash Flows for 2009
Cash from operating activities for the year ended December 31, 2009 was $93.3 million, a decrease of 14.9%, or $16.3 million, compared with cash from operating activities for the year ended December 31, 2008. The decrease was primarily the result of a reduction in income from operations.
Cash used for investing activities for the year ended December 31, 2009 was $118.4 million, an increase of 40.1%, or $33.9 million, compared with cash used for investing activities for the year ended December 31, 2008. The increase resulted primarily from higher year-over-year costs associated with acquisitions.
Cash from financing activities for the year ended December 31, 2009 was $3.6 million, compared to cash used for financing activities of $116.8 million for the year ended December 31, 2008. The change was primarily the result of net proceeds of $173.5 million from the issuance of 2.875 million shares of common stock in April 2008 and the net proceeds of $292.1 million from the August 2009 issuance of senior secured notes offset by the payment on debt acquired related to the 2009 acquisitions of EnviroSORT and Eveready.
Cash Flows for 2008
Cash from operating activities for the year ended December 31, 2008 was $109.6 million, an increase of 37.0%, or $29.6 million, compared with cash from operating activities for the year ended December 31, 2007. The increase was primarily the result of price increases, new business generated from acquisitions and stronger performance within the transportation and disposal business lines in the Technical Services segment.
Cash used for investing activities for the year ended December 31, 2008 was $84.5 million, an increase of 97.5%, or $41.7 million, compared with cash used for investing activities for the year ended
52
December 31, 2007. The increase was primarily the result of acquisition costs and an increase in capital expenditures, partially offset by the sale of marketable securities.
Cash from financing activities for the year ended December 31, 2008 was $116.8 million, an increase of $114.1 million, compared to cash used for financing activities for the year ended December 31, 2007. The increase was primarily the result of proceeds from the issuance of common stock, partially offset by the redemption and purchase of $50 million and $18.5 million principal amounts of outstanding senior secured notes.
Financing Arrangements
The following summarizes our principal financing activities during the year ended December 31, 2009:
- •
- July 24, 2009: we repaid our then outstanding $30.0 million term loan due in 2010;
- •
- July 31, 2009: we discharged our $23.0 million of then outstanding senior secured notes by calling such
notes for redemption on August 31, 2009 and depositing with the trustee the redemption price of $23.7 million and accrued interest of $0.3 million through the redemption date;
- •
- July 31, 2009: we amended our previous $70.0 million revolving credit facility and $50.0 million
synthetic letter of credit facility with a new $120 million revolving credit facility (described below);
- •
- July 31, 2009: we assumed all of Eveready's then outstanding debt;
- •
- July 31, 2009: we repaid $47.1 million of Eveready's then outstanding convertible subordinated debentures
which was at 101% principal plus accrued interest of $0.3 million; and
- •
- August 14, 2009: we issued $300 million principal amount of 75/8% senior secured notes due 2016 for net proceeds of $292.1 million. We used approximately $175.0 million of the net proceeds to repay all amounts outstanding under Eveready's then existing credit facility and certain capital leases and to pay certain related fees, expenses and other costs. The Eveready credit facility was terminated in connection with the repayment of all amounts outstanding thereunder.
The financing arrangements, debt covenants and principal terms of the $300 million principal amount of senior secured notes and the $120 million revolving credit facility are discussed further in Note 10, "Financing Arrangements," to our financial statements included in Item 8 of this report. As of December 31, 2009, we were in compliance with the covenants of all our debt agreements.
Liquidity Impacts of Uncertain Tax Positions
As discussed in Note 13, "Income Taxes," to our financial statements included in Item 8 of this report, we have recorded $76.2 million of unrecognized tax benefits, including $21.9 million of potential interest and $6.1 million of potential penalties. These liabilities are classified as "unrecognized tax benefits and other long-term liabilities" in our consolidated balance sheets. We are not able to reasonably estimate when we would make any cash payments to settle these liabilities. However, we believe no material cash payments will be required in the next 12 months.
53
Contractual Obligations
The following table has been included to assist the reader in analyzing our debt and similar obligations as of December 31, 2009 and our ability to meet such obligations (in thousands):
| |
|
Payments Due by Period | ||||||||||||||
|---|---|---|---|---|---|---|---|---|---|---|---|---|---|---|---|---|
Contractual Obligations
|
Total | Less than 1 year |
1-3 years | 4-5 years | After 5 years | |||||||||||
Closure, post-closure and remedial liabilities |
$ | 431,196 | $ | 18,766 | $ | 38,316 | $ | 29,114 | $ | 345,000 | ||||||
Pension funding |
3,597 | 264 | 565 | 653 | 2,115 | |||||||||||
Long-term debt |
292,433 | — | — | — | 292,433 | |||||||||||
Interest on long-term obligations |
135,227 | 22,332 | 44,884 | 45,221 | 22,790 | |||||||||||
Capital leases |
10,261 | 2,524 | 4,136 | 3,429 | 172 | |||||||||||
Operating leases |
125,281 | 33,801 | 44,286 | 20,723 | 26,471 | |||||||||||
Total contractual obligations |
$ | 997,995 | $ | 77,687 | $ | 132,187 | $ | 99,140 | $ | 688,981 | ||||||
As we are not able to reasonably estimate when we would make any cash payments to settle uncertain tax position liabilities of $48.2 million, such amounts have not been included in the table above. In addition, we have recorded a liability for interest of $21.9 million and potential penalties of $6.1 million relating to such uncertain tax positions which amounts have also not been included in the table above.
The undiscounted value of closure, post closure and remedial liabilities of $431.2 million is equivalent to the present value of $181.3 million based on discounting of $169.4 million and the remainder of $80.5 million to be accrued for closure and post-closure liabilities over the remaining site lives.
The following table has been included to assist the reader in understanding other contractual obligations we had as of December 31, 2009 and our ability to meet these obligations (in thousands):
| |
|
Payments Due by Period | ||||||||||||||
|---|---|---|---|---|---|---|---|---|---|---|---|---|---|---|---|---|
Other Commercial Commitments
|
Total | Less than 1 year |
1-3 years | 4-5 years | After 5 years | |||||||||||
Standby letters of credit |
$ | 88,653 | $ | 88,653 | $ | — | $ | — | $ | — | ||||||
We obtained substantially all of the standby letters of credit described in the above table as security for financial assurance obligations which we have been required to provide to regulatory bodies for our hazardous waste facilities and which would be called only in the event that we fail to satisfy closure, post-closure and other obligations under the permits issued by those regulatory bodies for such licensed facilities. See Note 10, "Financing Arrangements," to our financial statements included in Item 8 of this report for further discussion of our financing arrangements.
Off-Balance Sheet Arrangements
Except for our obligations under operating leases and letters of credit described above under "Contractual Obligations" and performance obligations incurred in the ordinary course of business, we are not now party to any off-balance sheet arrangements involving guarantee, contingency or similar obligations to entities whose financial statements are not consolidated with our results and that have or are reasonably likely to have a current or future effect on our financial condition, changes in financial condition, revenues or expenses, results of operations, liquidity, capital expenditures or capital resources that would be material to investors in our securities.
54
Capital Expenditures
We now anticipate that 2010 capital spending will be between $60.0 million and $65.0 million, of which approximately $3.0 million will relate to complying with environmental regulations. However, changes in environmental regulations could require us to make significant capital expenditures for our facilities and adversely affect our results of operations and cash flow.
Auction Rate Securities
As of December 31, 2009, our long-term investments included $6.5 million of available for sale auction rate securities. With the liquidity issues experienced in global credit and capital markets, these auction rate securities have experienced multiple failed auctions and as a result are currently not liquid. The auction rate securities are secured by student loans substantially insured by the Federal Family Education Loan Program, maintain the highest credit rating of AAA, and continue to pay interest according to their stated terms with interest rates resetting generally every 28 days.
We believe we have sufficient liquidity to fund operations and do not plan to sell our auction rate securities in the foreseeable future. In the unlikely event that we need to access the funds that are in an illiquid state, we may not be able to do so without a possible loss of principal until a future auction for these investments is successful, another secondary market evolves for these securities, they are redeemed by the issuer, or they mature. If we were unable to sell these securities in the market or they were not redeemed, we could be required to hold them to maturity. These securities are currently reflected at their fair value utilizing a discounted cash flow analysis or significant other observable inputs. As of December 31, 2009, we have recorded an unrealized pre-tax loss of $0.5 million, which we assess as temporary. We will continue to monitor and evaluate these investments on an ongoing basis for other than temporary impairment and record a charge to earnings if and when appropriate.
Stockholder Matters
As described in Note 3, "Business Combinations," to our financial statements included in Item 8 of this report, we acquired Eveready on July 31, 2009 and, as a portion of the consideration, we issued to the former Eveready shareholders $118.4 million in our common stock consisting of 2.4 million shares valued at $49.50 per Clean Harbors share (the closing price on the New York Stock Exchange on the day prior to the acquisition).
On March 18, 2009, July 31, 2009 and September 18, 2009, the Compensation Committee of our Board of Directors granted a total of 68,251 performance share awards that are subject to achieving predetermined revenue and EBITDA margin goals by December 31, 2010 and also include continued service conditions. If we do not achieve the performance goals by the end of 2010, the shares will be forfeited in their entirety. As of December 31, 2009, management continued to believe that it was not then probable that the performance targets would be achieved and therefore recorded no related compensation expense for the year ended December 31, 2009.
On May 15, 2008 and September 23, 2008, the compensation committee of the Board of Directors granted a total of 92,936 performance share awards that were subject to achieving predetermined revenue and EBITDA margin targets by December 31, 2009 and also included continued service conditions. As of December 31, 2009, the performance targets related to the 2008 performance stock awards were not met and therefore the performance stock awards granted in 2008 were forfeited. Any previously recognized compensation cost was reversed in the second quarter when management concluded that it was not then probable that the performance targets would be achieved.
In July 2008, warrants for an aggregate of 150,000 shares were exercised for $1.2 million in cash. In October 2008, warrants for an aggregate of 198,690 shares were exercised for $1.6 million in cash. No warrants remained outstanding at December 31, 2008.
55
On April 29, 2008, we issued 2.875 million shares of common stock, including 375,000 shares of common stock issued upon exercise of an underwriters' option, at a public offering price of $63.75 per share. After the underwriter discount and offering expenses, we received net proceeds of $173.5 million.
On March 15, 2008, 13,100 performance share awards that were granted in 2007 vested, leaving 34,474 of such performance share awards outstanding at December 31, 2008. For the year ended December 31, 2008, we believed that it was probable that the performance targets for the remaining 2007 awards would be achieved.
ITEM 7A. QUANTITATIVE AND QUALITATIVE DISCLOSURES ABOUT MARKET
In the normal course of business, we are exposed to market risks, including changes in interest rates, certain commodity prices, and certain foreign currency rates, primarily the Canadian dollar. Our philosophy in managing interest rate risk is to borrow at fixed rates for longer time horizons to finance non-current assets and to borrow (to the extent, if any, required) at variable rates for working capital and other short-term needs. We therefore have not entered into derivative or hedging transactions, nor have we entered into transactions to finance off-balance sheet debt. The following table provides information regarding our fixed rate borrowings at December 31, 2009 (in thousands):
Scheduled Maturity Dates
|
2010 | 2011 | 2012 | 2013 | 2014 | Thereafter | Total | |||||||||||||||
|---|---|---|---|---|---|---|---|---|---|---|---|---|---|---|---|---|---|---|---|---|---|---|
Senior secured notes |
$ | — | $ | — | $ | — | $ | — | $ | — | $ | 292,433 | $ | 292,433 | ||||||||
Capital lease obligations |
1,923 | 1,797 | 1,729 | 1,811 | 1,408 | 170 | 8,838 | |||||||||||||||
|
$ | 1,923 | $ | 1,797 | $ | 1,729 | $ | 1,811 | $ | 1,408 | $ | 292,603 | $ | 301,271 | ||||||||
Weighted average interest rate on fixed rate borrowings |
7.6 | % | 7.6 | % | 7.6 | % | 7.6 | % | 7.6 | % | 7.6 | % | ||||||||||
In addition to the fixed rate borrowings described in the above table, we had at December 31, 2009 variable rate instruments that included a revolving credit facility with maximum borrowings of up to $120 million (with a $110.0 million sub-limit for letters of credit).
We view our investment in our foreign subsidiaries as long-term; thus, we have not entered into any hedging transactions between any two foreign currencies or between any of the foreign currencies and the U.S. dollar. During 2009, the Canadian subsidiaries transacted approximately 11.3% of their business in U.S. dollars and at any period end have cash on deposit in U.S. dollars and outstanding U.S. dollar accounts receivable related to these transactions. These cash and receivable accounts are vulnerable to foreign currency translation gains or losses. Exchange rate movements also affect the translation of Canadian generated profits and losses into U.S. dollars. In March 2009, we significantly reduced the U.S. cash balance held by our Canadian subsidiaries and as a result, significantly reduced our foreign exchange exposure. Had the Canadian dollar been 10.0% stronger against the U.S. dollar, we would have reported decreased net income of $0.2 million and decreased net income of $0.8 million for the years ended December 31, 2009 and 2008, respectively. Had the Canadian dollar been 10.0% weaker against the U.S. dollar, we would have reported increased net income of $0.2 million and increased net income of $0.8 million for the years ended December 31, 2009 and 2008, respectively.
At December 31, 2009, $6.5 million of our noncurrent investments were auction rate securities. While we are uncertain as to when the liquidity issues relating to these investments will improve, we believe these issues will not materially impact our ability to fund our working capital needs, capital expenditures, or other business requirements.
We are subject to minimal market risk arising from purchases of commodities since no significant amount of commodities are used in the treatment of hazardous waste or providing energy and industrial services.
56
ITEM 8. FINANCIAL STATEMENTS AND SUPPLEMENTARY DATA
REPORT OF INDEPENDENT REGISTERED PUBLIC ACCOUNTING FIRM
To
the Board of Directors and Stockholders of
Clean Harbors, Inc.
Norwell, Massachusetts
We have audited the accompanying consolidated balance sheets of Clean Harbors, Inc. and subsidiaries (the "Company") as of December 31, 2009 and 2008, and the related consolidated statements of income, stockholders' equity, and cash flows for each of the three years in the period ended December 31, 2009. Our audits also included the financial statement schedule listed in the Index at Item 15. These financial statements and financial statement schedule are the responsibility of the Company's management. Our responsibility is to express an opinion on these financial statements and financial statement schedule based on our audits.
We conducted our audits in accordance with the standards of the Public Company Accounting Oversight Board (United States). Those standards require that we plan and perform the audit to obtain reasonable assurance about whether the financial statements are free of material misstatement. An audit includes examining, on a test basis, evidence supporting the amounts and disclosures in the financial statements. An audit also includes assessing the accounting principles used and significant estimates made by management, as well as evaluating the overall financial statement presentation. We believe that our audits provide a reasonable basis for our opinion.
In our opinion, such consolidated financial statements present fairly, in all material respects, the financial position of Clean Harbors, Inc. and subsidiaries as of December 31, 2009 and 2008, and the results of their operations and their cash flows for each of the three years in the period ended December 31, 2009, in conformity with accounting principles generally accepted in the United States of America.
As discussed in Note 2 to the consolidated financial statements, the Company changed its method of accounting for tax contingencies on January 1, 2007.
We have also audited, in accordance with the standards of the Public Company Accounting Oversight Board (United States), the Company's internal control over financial reporting as of December 31, 2009, based on the criteria established in Internal Control—Integrated Framework issued by the Committee of Sponsoring Organizations of the Treadway Commission and our report dated March 1, 2010 expressed an unqualified opinion on the Company's internal control over financial reporting.
/s/ DELOITTE & TOUCHE LLP
Boston,
Massachusetts
March 1, 2010
57
CLEAN HARBORS, INC. AND SUBSIDIARIES
CONSOLIDATED BALANCE SHEETS
ASSETS
(dollars in thousands)
| |
As of December 31, | ||||||||
|---|---|---|---|---|---|---|---|---|---|
| |
2009 | 2008 | |||||||
Current assets: |
|||||||||
Cash and cash equivalents |
$ | 233,546 | $ | 249,524 | |||||
Marketable securities |
2,072 | 175 | |||||||
Accounts receivable, net of allowances aggregating $8,255 and $6,723, respectively |
274,918 | 174,990 | |||||||
Unbilled accounts receivable |
12,331 | 5,545 | |||||||
Deferred costs |
5,192 | 5,877 | |||||||
Prepaid expenses and other current assets |
18,348 | 13,472 | |||||||
Supplies inventories |
41,417 | 26,905 | |||||||
Deferred tax assets |
18,865 | 12,564 | |||||||
Assets held for sale |
13,561 | — | |||||||
Total current assets |
620,250 | 489,052 | |||||||
Property, plant and equipment: |
|||||||||
Land |
29,294 | 26,399 | |||||||
Asset retirement costs (non-landfill) |
1,853 | 1,761 | |||||||
Landfill assets |
48,646 | 35,062 | |||||||
Buildings and improvements |
141,685 | 127,466 | |||||||
Camp equipment |
52,753 | — | |||||||
Vehicles |
120,587 | 33,502 | |||||||
Equipment |
492,831 | 310,459 | |||||||
Furniture and fixtures |
1,695 | 1,663 | |||||||
Construction in progress |
14,413 | 13,206 | |||||||
|
903,757 | 549,518 | |||||||
Less—accumulated depreciation and amortization |
313,813 | 254,057 | |||||||
Total property, plant and equipment |
589,944 | 295,461 | |||||||
Other assets: |
|||||||||
Long-term investments |
6,503 | 6,237 | |||||||
Deferred financing costs |
10,156 | 3,044 | |||||||
Goodwill |
56,085 | 24,578 | |||||||
Permits and other intangibles, net of accumulated amortization of $48,981 and $40,303, respectively |
114,188 | 71,754 | |||||||
Deferred tax assets |
— | 5,454 | |||||||
Other |
3,942 | 2,756 | |||||||
Total other assets |
190,874 | 113,823 | |||||||
Total assets |
$ | 1,401,068 | $ | 898,336 | |||||
The accompanying notes are an integral part of these consolidated financial statements.
58
CLEAN HARBORS, INC. AND SUBSIDIARIES
CONSOLIDATED BALANCE SHEETS (Continued)
LIABILITIES AND STOCKHOLDERS' EQUITY
(dollars in thousands)
| |
As of December 31, | ||||||||
|---|---|---|---|---|---|---|---|---|---|
| |
2009 | 2008 | |||||||
Current liabilities: |
|||||||||
Current portion of capital lease obligations |
$ | 1,923 | $ | 400 | |||||
Accounts payable |
97,923 | 71,618 | |||||||
Deferred revenue |
21,156 | 24,190 | |||||||
Accrued expenses |
90,707 | 67,901 | |||||||
Current portion of closure, post-closure and remedial liabilities |
18,412 | 17,264 | |||||||
Liabilities held for sale |
3,199 | — | |||||||
Total current liabilities |
233,320 | 181,373 | |||||||
Other liabilities: |
|||||||||
Closure and post-closure liabilities, less current portion of $7,305 and $6,383, respectively |
28,505 | 26,254 | |||||||
Remedial liabilities, less current portion of $11,107 and $10,881, respectively |
134,379 | 135,007 | |||||||
Long-term obligations |
292,433 | 52,870 | |||||||
Capital lease obligations, less current portion |
6,915 | 360 | |||||||
Unrecognized tax benefits and other long-term liabilities |
91,691 | 73,427 | |||||||
Total other liabilities |
553,923 | 287,918 | |||||||
Commitments and contingent liabilities |
|||||||||
Stockholders' equity: |
|||||||||
Common stock, $.01 par value: |
|||||||||
Authorized 40,000,000 shares; issued and outstanding 26,230,803 and 23,733,257 shares, respectively |
262 | 237 | |||||||
Treasury stock |
(2,068 | ) | (1,653 | ) | |||||
Shares held under employee participation plan |
(1,150 | ) | — | ||||||
Additional paid-in capital |
476,067 | 353,950 | |||||||
Accumulated other comprehensive income (loss) |
26,829 | (688 | ) | ||||||
Accumulated earnings |
113,885 | 77,199 | |||||||
Total stockholders' equity |
613,825 | 429,045 | |||||||
Total liabilities and stockholders' equity |
$ | 1,401,068 | $ | 898,336 | |||||
The accompanying notes are an integral part of these consolidated financial statements.
59
CLEAN HARBORS, INC. AND SUBSIDIARIES
CONSOLIDATED STATEMENTS OF INCOME
(in thousands except per share amounts)
| |
For the years ended December 31, | ||||||||||
|---|---|---|---|---|---|---|---|---|---|---|---|
| |
2009 | 2008 | 2007 | ||||||||
Revenues |
$ | 1,074,220 | $ | 1,030,713 | $ | 946,917 | |||||
Cost of revenues (exclusive of items shown separately below) |
753,483 | 707,820 | 664,440 | ||||||||
Selling, general and administrative expenses |
163,157 | 159,674 | 149,180 | ||||||||
Accretion of environmental liabilities |
10,617 | 10,776 | 10,447 | ||||||||
Depreciation and amortization |
64,898 | 44,471 | 37,590 | ||||||||
Income from operations |
82,065 | 107,972 | 85,260 | ||||||||
Other income (expense) |
259 | (119 | ) | 135 | |||||||
Loss on early extinguishment of debt |
(4,853 | ) | (5,473 | ) | — | ||||||
Interest expense, net of interest income of $825, $5,094, and $4,023, respectively |
(15,999 | ) | (8,403 | ) | (13,157 | ) | |||||
Income from continuing operations before provision for income taxes |
61,472 | 93,977 | 72,238 | ||||||||
Provision for income taxes |
26,225 | 36,491 | 28,040 | ||||||||
Income from continuing operations |
35,247 | 57,486 | 44,198 | ||||||||
Income from discontinued operations, net of tax |
1,439 | — | — | ||||||||
Net income |
36,686 | 57,486 | 44,198 | ||||||||
Dividends on Series B preferred stock |
— | — | 206 | ||||||||
Net income attributable to common stockholders |
$ | 36,686 | $ | 57,486 | $ | 43,992 | |||||
Earnings per share: |
|||||||||||
Basic income attributable to common stockholders |
$ | 1.48 | $ | 2.56 | $ | 2.22 | |||||
Diluted income attributable to common stockholders |
$ | 1.47 | $ | 2.51 | $ | 2.14 | |||||
Weighted average common shares outstanding |
24,817 | 22,465 | 19,827 | ||||||||
Weighted average common shares outstanding plus potentially dilutive common shares |
24,933 | 22,866 | 20,630 | ||||||||
The accompanying notes are an integral part of these consolidated financial statements.
60
CLEAN HARBORS, INC. AND SUBSIDIARIES
CONSOLIDATED STATEMENTS OF CASH FLOWS
(in thousands)
| |
For the years ended December 31, | |||||||||||||
|---|---|---|---|---|---|---|---|---|---|---|---|---|---|---|
| |
2009 | 2008 | 2007 | |||||||||||
Cash flows from operating activities: |
||||||||||||||
Net income |
$ | 36,686 | $ | 57,486 | $ | 44,198 | ||||||||
Adjustments to reconcile net income to net cash from operating activities: |
||||||||||||||
Depreciation and amortization |
64,898 | 44,471 | 37,590 | |||||||||||
Allowance for doubtful accounts |
1,006 | 267 | (418 | ) | ||||||||||
Amortization of deferred financing costs and debt discount |
1,997 | 1,915 | 1,940 | |||||||||||
Accretion of environmental liabilities |
10,617 | 10,776 | 10,447 | |||||||||||
Changes in environmental liability estimates |
(4,657 | ) | (2,047 | ) | 597 | |||||||||
Deferred income taxes |
4,830 | 3,197 | (7,492 | ) | ||||||||||
Other (income) expense |
(259 | ) | 119 | (135 | ) | |||||||||
Stock-based compensation |
968 | 3,565 | 4,799 | |||||||||||
Excess tax benefit of stock-based compensation |
(481 | ) | (3,504 | ) | (6,386 | ) | ||||||||
Income tax benefit related to stock option exercises |
474 | 3,534 | 6,427 | |||||||||||
Write-off of deferred financing costs and debt discount |
1,851 | 1,921 | — | |||||||||||
Environmental expenditures |
(8,617 | ) | (14,268 | ) | (6,511 | ) | ||||||||
Changes in assets and liabilities: |
||||||||||||||
Accounts receivable |
(11,429 | ) | 17,221 | (19,142 | ) | |||||||||
Other current assets |
1,093 | 5,529 | (2,693 | ) | ||||||||||
Accounts payable |
5,050 | (17,763 | ) | (4,603 | ) | |||||||||
Other current liabilities |
(10,757 | ) | (2,829 | ) | 21,377 | |||||||||
Net cash from operating activities |
93,270 | 109,590 | 79,995 | |||||||||||
Cash flows from investing activities: |
||||||||||||||
Additions to property, plant and equipment |
(62,244 | ) | (57,462 | ) | (36,528 | ) | ||||||||
Acquisitions, net of cash acquired |
(54,476 | ) | (27,628 | ) | (7,410 | ) | ||||||||
Costs to obtain or renew permits |
(2,228 | ) | (2,129 | ) | (1,302 | ) | ||||||||
Purchase of available-for-sale securities |
— | (2,529 | ) | (2,310 | ) | |||||||||
Sales of marketable securities |
105 | 4,350 | 3,200 | |||||||||||
Proceeds from sales of fixed assets and assets held for sale |
452 | 537 | 615 | |||||||||||
Proceeds from insurance |
— | 346 | 944 | |||||||||||
Net cash from investing activities |
$ | (118,391 | ) | $ | (84,515 | ) | $ | (42,791 | ) | |||||
The accompanying notes are an integral part of these consolidated financial statements.
61
CLEAN HARBORS, INC. AND SUBSIDIARIES
CONSOLIDATED STATEMENTS OF CASH FLOWS (Continued)
(in thousands)
| |
For the years ended December 31, | |||||||||||
|---|---|---|---|---|---|---|---|---|---|---|---|---|
| |
2009 | 2008 | 2007 | |||||||||
Cash flows from financing activities: |
||||||||||||
Change in uncashed checks |
$ | 4,034 | $ | 2,513 | $ | (5,916 | ) | |||||
Proceeds from exercise of stock options |
430 | 2,082 | 1,647 | |||||||||
Proceeds from exercise of warrants |
— | 2,789 | 1,200 | |||||||||
Remittance of shares, net |
(415 | ) | (483 | ) | — | |||||||
Excess tax benefit of stock-based compensation |
481 | 3,504 | 6,386 | |||||||||
Dividend payments on preferred stock |
— | — | (206 | ) | ||||||||
Deferred financing costs paid |
(10,473 | ) | — | (32 | ) | |||||||
Proceeds from employee stock purchase plan |
2,315 | 1,820 | 1,169 | |||||||||
Payments on capital leases |
(1,118 | ) | (485 | ) | (1,455 | ) | ||||||
Proceeds from issuance of common stock, net |
— | 173,541 | — | |||||||||
Payment on acquired debt |
(230,745 | ) | — | — | ||||||||
Principal payments on debt and acquired capital leases |
(53,032 | ) | (68,486 | ) | — | |||||||
Issuance of senior secured notes, net |
292,107 | — | — | |||||||||
Other |
— | — | (69 | ) | ||||||||
Net cash from financing activities |
3,584 | 116,795 | 2,724 | |||||||||
Effect of exchange rate change on cash |
5,559 | (11,884 | ) | 6,060 | ||||||||
(Decrease) increase in cash and cash equivalents |
(15,978 | ) | 129,986 | 45,988 | ||||||||
Cash and cash equivalents, beginning of year |
249,524 | 119,538 | 73,550 | |||||||||
Cash and cash equivalents, end of year |
$ | 233,546 | $ | 249,524 | $ | 119,538 | ||||||
Supplemental information: |
||||||||||||
Cash payments for interest and income taxes: |
||||||||||||
Interest paid |
$ | 7,833 | $ | 13,661 | $ | 14,648 | ||||||
Income taxes paid |
14,608 | 36,520 | 13,941 | |||||||||
Non-cash investing and financing activities: |
||||||||||||
Property, plant and equipment accrued |
908 | 6,150 | 4,792 | |||||||||
Issuance of Clean Harbors common stock for Eveready common shares |
118,427 | — | — | |||||||||
The accompanying notes are an integral part of these consolidated financial statements.
62
CLEAN HARBORS, INC. AND SUBSIDIARIES
CONSOLIDATED STATEMENTS OF STOCKHOLDERS' EQUITY
(in thousands)
| |
Series B Preferred Stock |
|
|
|
|
|
|
|
|
|||||||||||||||||||||||
|---|---|---|---|---|---|---|---|---|---|---|---|---|---|---|---|---|---|---|---|---|---|---|---|---|---|---|---|---|---|---|---|---|
| |
Common Stock | |
|
|
|
|
|
|||||||||||||||||||||||||
| |
|
|
|
Accumulated Other Comprehensive Income |
|
|
||||||||||||||||||||||||||
| |
Number of Shares |
$0.01 Par Value |
Number of Shares |
$0.01 Par Value |
Treasury Stock |
Additional Paid-in Capital |
Comprehensive Income |
Accumulated Earnings |
Total Stockholders' Equity |
|||||||||||||||||||||||
Balance at December 31, 2006 |
69 | $ | 1 | 19,685 | $ | 197 | $ | — | $ | 151,691 | $ | 8,939 | $ | 12,358 | $ | 173,186 | ||||||||||||||||
Net income |
— | — | — | — | — | — | $ | 44,198 | — | 44,198 | 44,198 | |||||||||||||||||||||
Foreign currency translation |
— | — | — | — | — | — | 8,786 | 8,786 | — | 8,786 | ||||||||||||||||||||||
Minimum pension liability adjustment (net of deferred taxes of $127) |
— | — | — | — | — | — | (227 | ) | (227 | ) | — | (227 | ) | |||||||||||||||||||
Comprehensive income |
— | — | — | — | — | — | $ | 52,757 | — | — | — | |||||||||||||||||||||
Uncertain tax positions cumulative effect adjustment |
— | — | — | — | — | — | — | (36,843 | ) | (36,843 | ) | |||||||||||||||||||||
Other |
— | — | — | — | — | (69 | ) | — | — | (69 | ) | |||||||||||||||||||||
Series B preferred stock dividends |
— | — | — | — | — | (206 | ) | — | — | (206 | ) | |||||||||||||||||||||
Conversion of Series B preferred |
(69 | ) | (1 | ) | 210 | 2 | — | (1 | ) | — | — | — | ||||||||||||||||||||
Exercise of warrants |
— | — | 150 | 2 | — | 1,198 | — | — | 1,200 | |||||||||||||||||||||||
Stock-based compensation |
— | — | 56 | — | — | 4,799 | — | — | 4,799 | |||||||||||||||||||||||
Issuance of restricted shares, net of shares remitted |
— | — | 23 | — | (1,170 | ) | — | — | — | (1,170 | ) | |||||||||||||||||||||
Exercise of stock options |
— | — | 173 | 2 | — | 1,645 | — | — | 1,647 | |||||||||||||||||||||||
Tax benefit on exercise of stock options |
— | — | — | — | — | 6,427 | — | — | 6,427 | |||||||||||||||||||||||
Employee stock purchase plan |
— | — | 31 | — | — | 1,169 | — | — | 1,169 | |||||||||||||||||||||||
Balance at December 31, 2007 |
— | — | 20,328 | $ | 203 | $ | (1,170 | ) | $ | 166,653 | $ | 17,498 | $ | 19,713 | $ | 202,897 | ||||||||||||||||
The accompanying notes are an integral part of these consolidated financial statements.
63
CLEAN HARBORS, INC. AND SUBSIDIARIES
CONSOLIDATED STATEMENTS OF STOCKHOLDERS' EQUITY (Continued)
(in thousands)
| |
Common Stock | |
Shares Held Under Employee Participation Plan |
|
|
|
|
|
|||||||||||||||||||||
|---|---|---|---|---|---|---|---|---|---|---|---|---|---|---|---|---|---|---|---|---|---|---|---|---|---|---|---|---|---|
| |
|
|
|
Accumulated Other Comprehensive Income (Loss) |
|
|
|||||||||||||||||||||||
| |
Number of Shares |
$0.01 Par Value |
Treasury Stock |
Additional Paid-in Capital |
Comprehensive Income |
Accumulated Earnings |
Total Stockholders' Equity |
||||||||||||||||||||||
Balance at December 31, 2007 |
20,328 | $ | 203 | $ | (1,170 | ) | $ | — | $ | 166,653 | $ | 17,498 | $ | 19,713 | $ | 202,897 | |||||||||||||
Net income |
— | — | — | — | — | $ | 57,486 | — | 57,486 | 57,486 | |||||||||||||||||||
Foreign currency translation |
— | — | — | — | — | (16,950 | ) | (16,950 | ) | — | (16,950 | ) | |||||||||||||||||
Change in fair value of available for sale securities (net of deferred taxes of $332) |
— | — | — | — | — | (716 | ) | (716 | ) | — | (716 | ) | |||||||||||||||||
Unfunded pension liability (net of deferred taxes of $328) |
— | — | — | — | — | (520 | ) | (520 | ) | — | (520 | ) | |||||||||||||||||
Comprehensive income |
— | — | — | — | — | $ | 39,300 | — | — | — | |||||||||||||||||||
Exercise of warrants |
349 | 3 | — | — | 2,786 | — | — | 2,789 | |||||||||||||||||||||
Stock-based compensation |
(4 | ) | — | — | — | 3,565 | — | — | 3,565 | ||||||||||||||||||||
Remittance of shares |
(31 | ) | — | (483 | ) | — | — | — | — | (483 | ) | ||||||||||||||||||
Exercise of stock options |
178 | 2 | — | — | 2,080 | — | — | 2,082 | |||||||||||||||||||||
Issuance of common stock, net of issuance costs of $556 |
2,875 | 29 | — | — | 173,512 | — | — | 173,541 | |||||||||||||||||||||
Tax benefit on exercise of stock options |
— | — | — | — | 3,534 | — | — | 3,534 | |||||||||||||||||||||
Employee stock purchase plan |
38 | — | — | — | 1,820 | — | — | 1,820 | |||||||||||||||||||||
Balance at December 31, 2008 |
23,733 | $ | 237 | $ | (1,653 | ) | $ | — | $ | 353,950 | $ | (688 | ) | $ | 77,199 | $ | 429,045 | ||||||||||||
Net income |
— | — | — | — | — | $ | 36,686 | — | 36,686 | 36,686 | |||||||||||||||||||
Foreign currency translation |
— | — | — | — | — | 25,259 | 25,259 | — | 25,259 | ||||||||||||||||||||
Unrealized gain on long-term investments (net of deferred taxes of $441) |
— | — | — | — | — | 1,726 | 1,726 | — | 1,726 | ||||||||||||||||||||
Unfunded pension liability (net of deferred taxes of $254) |
— | — | — | — | — | 532 | 532 | — | 532 | ||||||||||||||||||||
Comprehensive income |
— | — | — | — | — | $ | 64,203 | — | — | — | |||||||||||||||||||
Stock-based compensation |
33 | — | — | — | 525 | — | — | 525 | |||||||||||||||||||||
Issuance of restricted shares, net of shares remitted |
(8 | ) | — | (415 | ) | — | — | — | — | (415 | ) | ||||||||||||||||||
Shares held under employee participation plan |
— | — | — | (1,150 | ) | — | — | — | (1,150 | ) | |||||||||||||||||||
Exercise of stock options |
29 | 1 | — | — | 429 | — | — | 430 | |||||||||||||||||||||
Issuance of common stock, net of issuance costs |
2,392 | 24 | — | — | 118,374 | — | — | 118,398 | |||||||||||||||||||||
Net tax benefit on exercise of stock options |
— | — | — | — | 474 | — | — | 474 | |||||||||||||||||||||
Employee stock purchase plan |
52 | — | — | — | 2,315 | — | — | 2,315 | |||||||||||||||||||||
Balance at December 31, 2009 |
26,231 | $ | 262 | $ | (2,068 | ) | $ | (1,150 | ) | $ | 476,067 | $ | 26,829 | $ | 113,885 | $ | 613,825 | ||||||||||||
The accompanying notes are an integral part of these consolidated financial statements.
64
CLEAN HARBORS, INC. AND SUBSIDIARIES
NOTES TO CONSOLIDATED FINANCIAL STATEMENTS
(1) OPERATIONS
Clean Harbors, Inc., through its subsidiaries (collectively, the "Company"), is a leading provider of environmental, energy and industrial services throughout North America and is the largest operator of non-nuclear hazardous waste treatment facilities in North America based on a 2008 industry report. The Company has a network of more than 175 service locations, including 52 active hazardous waste management properties. These properties include six incineration facilities, nine commercial landfills, seven wastewater treatment facilities, 20 transportation, storage and disposal facilities ("TSDFs"), two solvent recycling facilities and eight locations specializing in polychlorinated biphenyls ("PCB") management and oil storage and recycling. Some of the Company's properties offer multiple capabilities. In addition, the Company has 145 service centers, satellite and support locations and corporate and regional offices. These properties are located in 36 U.S. states, seven Canadian provinces, Mexico and Puerto Rico. The Company also operates international locations in Bulgaria, China, Singapore, Sweden, Thailand and the United Kingdom.
In preparing the accompanying audited consolidated financial statements, the Company has reviewed, as determined necessary by the Company's management, events that have occurred after December 31, 2009, until the issuance of the financial statements.
(2) SIGNIFICANT ACCOUNTING POLICIES
The accompanying consolidated financial statements of the Company reflect the application of certain significant accounting policies as described below:
Principles of Consolidation
The accompanying consolidated statements include the accounts of Clean Harbors, Inc. and its majority-owned subsidiaries. All material intercompany accounts and transactions have been eliminated in consolidation.
Revenue Recognition
The Company recognizes revenue when persuasive evidence of an arrangement exists, delivery has occurred or services have been rendered, the price is fixed or determinable, and collection is reasonably assured. Revenue is recognized net of estimated allowances. Due to the nature of the business and the complex invoices that result from the services provided, customers may withhold payments and attempt to renegotiate amounts invoiced. Accordingly, management establishes a revenue allowance to cover the estimated amounts of revenue that may need to be credited to customers' accounts in future periods. The Company records a provision for revenue allowances based on specific review of particular customers, historical trends and other relevant information.
The Company provides a wide range of environmental, energy and industrial services through four segments: Technical Services, Field Services, Industrial Services and Exploration Services. Within Clean Harbors Environmental Services, the Company offers Technical Services and Field Services. Technical Services provide a broad range of hazardous material management and disposal services including the collection, packaging, recycling, treatment and disposal of hazardous and non-hazardous waste. Field Services provide a wide variety of environmental cleanup services on customer sites or other locations on a scheduled or emergency response basis. Within Clean Harbors Energy and Industrial Services, the Company offers Industrial Services and Exploration Services. Industrial Services provide industrial and specialty services, such as high-pressure and chemical cleaning, catalyst handling, decoking, material
65
CLEAN HARBORS, INC. AND SUBSIDIARIES
NOTES TO CONSOLIDATED FINANCIAL STATEMENTS (Continued)
(2) SIGNIFICANT ACCOUNTING POLICIES (Continued)
processing and industrial lodging services to refineries, chemical plants, pulp and paper mills, and other industrial facilities. Exploration Services provide exploration and directional boring services to the energy sector serving oil and gas exploration, production, and power generation. Revenues for all services with the exception of services for the treatment and disposal of hazardous waste are recorded as services are rendered. Revenues for disposing of hazardous waste are recognized upon completion of wastewater treatment, landfill disposal or incineration of the waste at a Company-owned site or when the waste is shipped to a third party for processing and disposal. Revenues from waste that is not yet completely processed and the related costs are deferred until services are completed. Revenue is recognized on contracts with retainage when services have been rendered and collectability is reasonably assured.
Credit Concentration
Concentration of credit risks in accounts receivable is limited due to the large number of customers comprising the Company's customer base throughout North America and internationally. The Company maintains strict policies over credit extension that include credit evaluations, credit limits and collection monitoring procedures on a customer-by-customer basis. However, the Company generally does not require collateral before services are performed. The Company establishes an allowance for uncollectible accounts each month based on specific review of particular balances and customers, the credit risk applicable to particular customers, historical collection trends, age of outstanding receivables, existing economic conditions and other information as deemed applicable. Past-due receivable balances are written-off when the Company's internal collection efforts have been deemed unsuccessful in collecting the outstanding balance due. No individual customer accounts for more than 10% of revenues.
Income Taxes
The Company accounts for income taxes in accordance with Accounting Standards Codification ("ASC") 740, Income Taxes ("ASC 740"). There are two major components of income tax expense, current and deferred. Current income tax expense approximates cash to be paid or refunded for taxes for the applicable period. Deferred tax assets and liabilities are determined based upon the difference between the financial statement and tax basis of assets and liabilities as measured by the enacted tax rates, which will be in effect when these differences reverse. Deferred tax expense or benefit is the result of changes between deferred tax assets and liabilities.
The Company changed its methodology of accounting for income tax contingencies on January 1, 2007 and recorded a $36.8 million cumulative adjustment. The Company recognizes interest and penalties related to unrecognized tax benefits within the income tax expense line in the consolidated statements of income. Accrued interest and penalties are included within unrecognized tax benefits and other long-term liabilities line in the consolidated balance sheet.
A valuation allowance is established when, based on an evaluation of objective verifiable evidence, it is more likely than not that some portion or all of deferred tax assets will not be realized.
66
CLEAN HARBORS, INC. AND SUBSIDIARIES
NOTES TO CONSOLIDATED FINANCIAL STATEMENTS (Continued)
(2) SIGNIFICANT ACCOUNTING POLICIES (Continued)
Earnings per Share ("EPS")
Basic EPS is calculated by dividing income available to common stockholders by the weighted average number of common shares outstanding during the period. Diluted EPS gives effect to all potentially dilutive common shares that were outstanding during the period.
Reclassifications
In connection with the July 2009 acquisition of Eveready Inc. ("Eveready"), the Company re-aligned and expanded its reportable operating segments. Under the new structure, the Company's operations are managed in four segments: Technical Services, Field Services, Industrial Services and Exploration Services. The Company has recast the December 31, 2008 and 2007 segment information to conform to the current year presentation. See Note 19, "Segment Reporting."
The Company has combined the uncashed checks balance of $7.7 million on the 2008 consolidated balance sheet with accounts payable to conform to the current year presentation.
Cash, Cash Equivalents and Uncashed Checks
The Company classifies all highly liquid instruments purchased with maturities of less than three months to be cash equivalents.
The Company's cash management program with its revolving credit lender allows for the maintenance of a zero balance in the U.S. bank disbursement accounts that are used to issue vendor and payroll checks. The program can result in checks outstanding in excess of bank balances in the disbursement accounts. When checks are presented to the bank for payment, cash deposits in amounts sufficient to fund the checks are made, at the Company's discretion, either from funds provided by other accounts or under the terms of the Company's revolving credit facility. Therefore, until checks are presented for payment, there is no right of offset by the bank and the Company continues to have control over cash relating to both released as well as unreleased checks. Checks that have been written to vendors or employees but have not yet been presented for payment at the Company's bank are classified as uncashed checks and added back to cash balances.
Marketable Securities
The Company has classified its marketable securities as available-for-sale and, accordingly, carries such securities at fair value. Unrealized gains and losses are reported, net of tax, as a component of stockholders' equity.
Allowances for Doubtful Accounts
On a regular basis, the Company evaluates its accounts receivable and establishes the allowance for doubtful accounts based on an evaluation of historical collection trends, customer concentration, customer credit ratings, current economic trends and changes in customer payment patterns.
Unbilled Receivables
The Company recognizes unbilled accounts receivable for service and disposal transactions rendered but not invoiced to the customer by the end of the period.
67
CLEAN HARBORS, INC. AND SUBSIDIARIES
NOTES TO CONSOLIDATED FINANCIAL STATEMENTS (Continued)
(2) SIGNIFICANT ACCOUNTING POLICIES (Continued)
Supplies Inventories
Supplies inventories consist primarily of supplies and repair parts expected to be used in the operating cycle, which are stated at the lower of cost or market. The Company periodically reviews its inventories for obsolete or unsaleable items and adjusts its carrying value to reflect estimated realizable values.
Property, Plant and Equipment (excluding landfill assets)
Property, plant and equipment are stated at cost and include amounts capitalized under capital lease obligations. Expenditures for major renewals and improvements which extend the life of the asset are capitalized. Items of an ordinary repair or maintenance nature are charged directly to operating expense as incurred. During the construction and development period of an asset, the costs incurred, including applicable interest costs, are classified as construction-in-progress. Interest in the amount of $0.2 million, $0.2 million and $1.2 million was capitalized to fixed assets during the years ended December 31, 2009, 2008 and 2007, respectively. Depreciation and amortization expense was $50.4 million, $33.4 million and $27.2 million for the years ended December 31, 2009, 2008 and 2007, respectively.
The Company depreciates and amortizes the cost of these assets, using the straight-line method as follows:
Asset Classification
|
Estimated Useful Life | ||
|---|---|---|---|
Buildings and building improvements |
|||
Buildings |
30–40 years | ||
Land, leasehold and building improvements |
5–40 years | ||
Camp equipment |
12–15 years | ||
Vehicles |
3–12 years | ||
Equipment |
|||
Capitalized software and computer equipment |
3 years | ||
Containers and railcars |
15–20 years | ||
All other equipment |
8–10 years | ||
Furniture and fixtures |
5–8 years | ||
Land, leasehold and building improvements have a weighted average life of 6.8 years.
The Company recognizes an impairment in the carrying value of long-lived assets when the expected future undiscounted cash flows derived from the assets are less than their carrying value. For the years ended December 31, 2009, 2008 and 2007, the Company recorded no impairment charge related to long-lived assets.
Goodwill and Intangible Assets
Goodwill, permits and other intangible assets are stated at cost. Goodwill is not amortized. Permits relating to landfills are amortized on a units-of-consumption basis. All other permits are amortized over periods ranging from 5 to 30 years on a straight-line basis. Permits consist of the value of permits acquired in a business combination and direct costs related to obtaining such permits such as legal fees, site surveys, engineering costs and other expenses. In addition, the Company capitalizes legal costs
68
CLEAN HARBORS, INC. AND SUBSIDIARIES
NOTES TO CONSOLIDATED FINANCIAL STATEMENTS (Continued)
(2) SIGNIFICANT ACCOUNTING POLICIES (Continued)
incurred in connection with the defense of the Company's right to accept certain waste under a validly issued permit. Amortization expense was $7.7 million, $5.5 million and $5.0 million for the years ended December 31, 2009, 2008 and 2007, respectively.
The Company assesses goodwill for impairment at least on an annual basis as of December 31st by comparing the fair value of each reporting unit to its carrying value, including goodwill. Permits and other intangible assets are assessed whenever events or changes in circumstances indicate that the carrying value of an asset may not be recoverable. There were no impairment charges during the years ended December 31, 2009, 2008 and 2007.
Leases
The Company leases rolling stock, rail cars, equipment, real estate and office equipment under operating leases. Certain real estate leases contain rent holidays and rent escalation clauses. Most of the Company's real estate lease agreements include renewal periods at the Company's option. For its operating leases, the Company recognizes rent holiday periods and scheduled rent increases on a straight-line basis over the lease term beginning with the date the Company takes possession of the leased assets.
Deferred Financing Costs
Deferred financing costs are amortized over the life of the related debt instrument using the effective interest method. Amortization expense is included in interest expense in the statements of income.
Fair Value of Financial Instruments
The Company's financial instruments consist of cash and cash equivalents, marketable securities, receivables, trade payables, auction rate securities and long-term debt. The estimated fair value of cash and cash equivalents, receivables, and trade payables approximate their carrying value due to the short maturity of these instruments. The fair value of the Company's outstanding long-term debt is based on quoted market price and was $294.9 million at December 31, 2009. The fair value of marketable securities is recorded based on quoted market price and the fair value of auction rate securities are recorded based on discounted cash flows.
Landfill Accounting
The Company amortizes landfill improvements, and certain landfill-related permits over their estimated useful lives. The units-of-consumption method is used to amortize land, landfill cell construction, asset retirement costs and remaining landfill cells and sites. The Company also utilizes the units-of-consumption method to record closure and post-closure obligations for landfill cells and sites. Under the units-of-consumption method, the Company includes future estimated construction and asset retirement costs, as well as costs incurred to date, in the amortization base of the landfill assets. Additionally, where appropriate, as described below, the Company includes probable expansion airspace that has yet to be permitted in the calculation of the total remaining useful life of the landfill.
Landfill assets—Landfill assets include the costs of landfill site acquisition, permits and cell construction incurred to date. These amounts are recorded at cost, which includes capitalized interest
69
CLEAN HARBORS, INC. AND SUBSIDIARIES
NOTES TO CONSOLIDATED FINANCIAL STATEMENTS (Continued)
(2) SIGNIFICANT ACCOUNTING POLICIES (Continued)
as applicable. Landfill assets, net of amortization, are combined with management's estimate of the costs required to complete construction of the landfill to determine the amount to be amortized over the remaining estimated useful economic life of a site. Amortization of landfill assets is recorded on a units-of-consumption basis, such that the landfill assets should be completely amortized at the date the landfill ceases accepting waste. Amortization totaled $6.8 million, $5.6 million and $5.4 million for the years ended December 31, 2009, 2008 and 2007, respectively. Changes in estimated costs to complete construction are applied prospectively to the amortization rate.
Landfill capacity—Landfill capacity, which is the basis for the amortization of landfill assets and for the accrual of final closure and post-closure obligations, represents total permitted airspace plus unpermitted airspace that management believes is probable of ultimately being permitted based on established criteria. The Company applies the following criteria for evaluating the probability of obtaining a permit for future expansion airspace at existing sites, which provides management a basis to evaluate the likelihood of success of unpermitted expansions:
- •
- Personnel are actively working to obtain the permit or permit modifications (land use, state, provincial and federal)
necessary for expansion of an existing landfill, and progress is being made on the project.
- •
- Management expects to submit the application within the next year and to receive all necessary approvals to accept waste
within the next five years.
- •
- At the time the expansion is included in the Company's estimate of the landfill's useful economic life, it is probable
that the required approvals will be received within the normal application and processing time periods for approvals in the jurisdiction in which the landfill is located.
- •
- The Company or other owner of the landfill has a legal right to use or obtain the right to use the land associated with
the expansion plan.
- •
- There are no significant known political, technical, legal or business restrictions or issues that could impair the
success of such expansion.
- •
- A financial feasibility analysis has been completed and the results demonstrate that the expansion will have a positive
financial and operational impact such that management is committed to pursuing the expansion.
- •
- Additional airspace and related additional costs, including permitting, final closure and post-closure costs, have been estimated based on the conceptual design of the proposed expansion.
Exceptions to the criteria set forth above may be approved through a landfill-specific approval process that includes approval from the Company's Chief Financial Officer and review by the Audit Committee of the Company's Board of Directors. As of December 31, 2009, there were three unpermitted expansions at two locations included in the Company's landfill accounting model, which represented 29.4% of the Company's remaining airspace at that date. As of December 31, 2009 and 2008, none of the expansions were considered exceptions to the Company's established criteria.
70
CLEAN HARBORS, INC. AND SUBSIDIARIES
NOTES TO CONSOLIDATED FINANCIAL STATEMENTS (Continued)
(2) SIGNIFICANT ACCOUNTING POLICIES (Continued)
As of December 31, 2009, the Company had 11 active landfill sites (including the Company's two non-commercial landfills), which have estimated remaining lives (based on anticipated waste volumes and remaining highly probable airspace) as follows:
| |
|
|
Remaining Highly Probable Airspace (cubic yards) (in thousands) |
||||||||||||
|---|---|---|---|---|---|---|---|---|---|---|---|---|---|---|---|
| |
|
Remaining Lives (Years) |
|||||||||||||
Facility Name
|
Location | Permitted | Unpermitted | Total | |||||||||||
Altair |
Texas | 22 | 1,085 | — | 1,085 | ||||||||||
Buttonwillow |
California | 39 | 8,874 | — | 8,874 | ||||||||||
Deer Park |
Texas | 14 | 490 | — | 490 | ||||||||||
Deer Trail |
Colorado | 34 | 845 | — | 845 | ||||||||||
Grassy Mountain |
Utah | 17 | 231 | 1,366 | 1,597 | ||||||||||
Kimball |
Nebraska | 18 | 376 | — | 376 | ||||||||||
Lambton |
Ontario | 46 | 355 | 6,212 | 6,567 | ||||||||||
Lone Mountain |
Oklahoma | 8 | 873 | — | 873 | ||||||||||
Ryley |
Alberta | 20 | 1,281 | — | 1,281 | ||||||||||
Sawyer |
North Dakota | 42 | 1,045 | — | 1,045 | ||||||||||
Westmorland |
California | 64 | 2,732 | — | 2,732 | ||||||||||
|
18,187 | 7,578 | 25,765 | ||||||||||||
The Company had 1.5 million cubic yards of permitted, but not highly probable, airspace as of December 31, 2009. Permitted, but not highly probable, airspace is permitted airspace the Company currently does not expect to utilize; therefore, this airspace has not been included in the above table.
The following table presents the remaining highly probable airspace from January 1, 2007 through December 31, 2009 (in thousands of cubic yards):
| |
2009 | 2008 | 2007 | |||||||
|---|---|---|---|---|---|---|---|---|---|---|
Remaining capacity at January 1, |
28,308 | 28,511 | 28,040 | |||||||
(Reduction) addition of highly probable airspace |
(1,635 | ) | 623 | 1,328 | ||||||
Consumed |
(908 | ) | (826 | ) | (857 | ) | ||||
Remaining capacity at December 31, |
25,765 | 28,308 | 28,511 | |||||||
71
CLEAN HARBORS, INC. AND SUBSIDIARIES
NOTES TO CONSOLIDATED FINANCIAL STATEMENTS (Continued)
(2) SIGNIFICANT ACCOUNTING POLICIES (Continued)
Amortization of cell construction costs and accrual of cell closure obligations—Landfills are typically comprised of a number of cells, which are constructed within a defined acreage (or footprint). The cells are typically discrete units, which require both separate construction and separate capping and closure procedures. Cell construction costs are the costs required to excavate and construct the landfill cell. These costs are typically amortized on a units-of-consumption basis, such that they are completely amortized when the specific cell ceases accepting waste. In some instances, the Company has landfills that are engineered and constructed as "progressive trenches." In progressive trench landfills, a number of contiguous cells form a progressive trench. In those instances, the Company amortizes cell construction costs over the airspace within the entire trench, such that the cell construction costs will be fully amortized at the end of the trench useful life.
The design and construction of a landfill does not create a landfill asset retirement obligation. Rather, the asset retirement obligation for cell closure (the cost associated with capping each cell) is incurred in relatively small increments as waste is placed in the landfill. Therefore, the cost required to construct the cell cap is capitalized as an asset retirement cost and a liability of an equal amount is established, based on the discounted cash flow associated with each capping event, as airspace is consumed. Spending for cell capping is reflected as environmental expenditures within operating activities in the statement of cash flows.
Landfill final closure and post-closure liabilities—The balance of landfill final closure and post-closure liabilities at December 31, 2009 and 2008 was $28.1 million and $25.3 million, respectively. The Company has material financial commitments for the costs associated with requirements of the Environmental Protection Agency ("EPA") and the comparable regulatory agency in Canada for landfill final closure and post-closure activities. In the United States, the landfill final closure and post-closure requirements are established under the standards of the EPA, and are implemented and applied on a state-by-state basis. The Company develops estimates for the cost of these activities based on an evaluation of site-specific facts and circumstances, including the Company's interpretation of current regulatory requirements and proposed regulatory changes. Such estimates may change in the future due to various circumstances including, but not limited to, permit modifications, changes in legislation or regulations, technological changes and results of environmental studies.
Final closure costs are the costs incurred after the site ceases to accept waste, but before the landfill is certified as closed by the applicable state regulatory agency. These costs generally include the costs required to cap the final cell of the landfill (if not included in cell closure), the costs required to dismantle certain structures for landfills and other landfill improvements, and regulation-mandated groundwater monitoring, and leachate management. Post-closure costs involve the maintenance and monitoring of a landfill site that has been certified closed by the applicable regulatory agency. These costs generally include groundwater monitoring and leachate management. Regulatory post-closure periods are generally 30 years after landfill closure. Final closure and post-closure obligations are accrued on a units-of-consumption basis, such that the present value of the final closure and post-closure obligations are fully accrued at the date the landfill discontinues accepting waste.
Cell closure, final closure and post closure costs (also referred to as "asset retirement obligations") are calculated by estimating the total obligation in current dollars, adjusted for inflation (1.02% during 2009 and 2.44% during 2008) and discounted at the Company's credit-adjusted risk-free interest rate (10.57% for the period January through July 2009, 9.37% for the period August through December 31, 2009, and 10.12% for the year ended December 31, 2008). In 2009, the credit-adjusted risk-free interest
72
CLEAN HARBORS, INC. AND SUBSIDIARIES
NOTES TO CONSOLIDATED FINANCIAL STATEMENTS (Continued)
(2) SIGNIFICANT ACCOUNTING POLICIES (Continued)
rate was recalculated mid-year due to the August 2009 offering of $300.0 million of senior secured notes and the discharge of the outstanding balance of the prior senior secured notes on which the initial 2009 rate had been based.
Non-Landfill Closure and Post-Closure Liabilities
Non-landfill closure costs include costs required to dismantle and decontaminate certain structures and other costs incurred during the closure process. Post-closure costs, if required, include associated maintenance and monitoring costs as required by the closure permit. Post-closure periods are performance-based and are not generally specified in terms of years in the closure permit, but may generally range from 10 to 30 years or more.
The Company records its non-landfill closure and post-closure liability by: (i) estimating the current cost of closing a non-landfill facility and the post closure care of that facility, if required, based upon the closure plan that the Company is required to follow under its operating permit, or in the event the facility operates with a permit that does not contain a closure plan, based upon legally enforceable closure commitments made by the Company to various governmental agencies; (ii) using probability scenarios as to when in the future operations may cease; (iii) inflating the current cost of closing the non-landfill facility on a probability weighted basis using the inflation rate to the time of closing under each probability scenario; and (iv) discounting the future value of each closing scenario back to the present using the credit-adjusted risk-free interest rate. Non-landfill closure and post-closure obligations arise when the Company commences operations.
The balance of non-landfill closure and post-closure liabilities at December 31, 2009 and 2008 was $7.7 million and $7.4 million, respectively. Management bases estimates for non-landfill closure and post-closure liabilities on its interpretation of existing permit and regulatory requirements for closure and post-closure maintenance and monitoring. The Company's cost estimates are calculated using internal sources as well as input from third party experts. Management uses probability scenarios to estimate when future operations will cease and inflates the current cost of closing the non-landfill facility on a probability weighted basis using the appropriate inflation rate and then discounting the future value to arrive at an estimated present value of closure and post-closure costs. The estimates for non-landfill closure and post-closure liabilities are inherently uncertain due to the possibility that permit and regulatory requirements will change in the future, impacting the estimation of total costs and the timing of the expenditures. Management reviews non-landfill closure and post-closure liabilities for changes to key assumptions that would impact the amount of the recorded liabilities. Changes that would prompt management to revise a liability estimate include changes in legal requirements that impact the Company's expected closure plan, in the market price of a significant cost item, in the probability scenarios as to when future operations at a location might cease, or in the expected timing of the cost expenditures. Changes in estimates for non-landfill closure and post-closure events immediately impact the required liability and the value of the corresponding asset. If a change is made to a fully-consumed asset, the adjustment is charged immediately to expense. When a change in estimate relates to an asset that has not been fully consumed, the adjustment to the asset is recognized in income prospectively as a component of amortization. Historically, material changes to non-landfill closure and post-closure estimates have been infrequent.
73
CLEAN HARBORS, INC. AND SUBSIDIARIES
NOTES TO CONSOLIDATED FINANCIAL STATEMENTS (Continued)
(2) SIGNIFICANT ACCOUNTING POLICIES (Continued)
Remedial Liabilities
Remedial liabilities, including Superfund liabilities, include the costs of removal or containment of contaminated material, the treatment of potentially contaminated groundwater and maintenance and monitoring costs necessary to comply with regulatory requirements. Most of the Company's remedial liabilities relate to the active and inactive hazardous waste treatment and disposal facilities which the Company acquired in the last seven years and 35 Superfund sites owned by third parties for which the Company agreed to indemnify certain remedial liabilities owed or potentially owed to governmental entities by the sellers of certain assets (the "CSD assets") which the Company acquired in 2002. The Company performed extensive due diligence to estimate accurately the aggregate liability for remedial liabilities to which the Company became potentially liable as a result of the acquisitions. The Company's estimate of remedial liabilities involved an analysis of such factors as: (i) the nature and extent of environmental contamination (if any); (ii) the terms of applicable permits and agreements with regulatory authorities as to cleanup procedures and whether modifications to such permits and agreements will likely need to be negotiated; (iii) the cost of performing anticipated cleanup activities based upon current technology; and (iv) in the case of Superfund and other sites where other parties will also be responsible for a portion of the cleanup costs, the likely allocation of such costs and the ability of such other parties to pay their share. Remedial liabilities and on-going operations are reviewed quarterly and adjustments are made as necessary.
The Company periodically evaluates potential remedial liabilities at sites that it owns or operates or to which the Company or the sellers of the CSD assets (or the respective predecessors of the Company or such sellers) transported or disposed of waste, including 60 Superfund sites as of December 31, 2009. The Company periodically reviews and evaluates sites requiring remediation, including Superfund sites, giving consideration to the nature (i.e., owner, operator, arranger, transporter or generator) and the extent (i.e., amount and nature of waste hauled to the location, number of years of site operations or other relevant factors) of the Company's (or such sellers') alleged connection with the site, the extent (if any) to which the Company believes it may have an obligation to indemnify cleanup costs in connection with the site, the regulatory context surrounding the site, the accuracy and strength of evidence connecting the Company (or such sellers) to the location, the number, connection and financial ability of other named and unnamed potentially responsible parties ("PRPs") and the nature and estimated cost of the likely remedy. Where the Company concludes that it is probable that a liability has been incurred and an amount can be estimated, a provision is made, based upon management's judgment and prior experience, of such estimated liability.
Remedial liabilities are inherently difficult to estimate. Estimating remedial liabilities requires that the existing environmental contamination be understood. There are risks that the actual quantities of contaminants differ from the results of the site investigation, and that contaminants exist that have not been identified by the site investigation. In addition, the amount of remedial liabilities recorded is dependent on the remedial method selected. There is a risk that funds will be expended on a remedial solution that is not successful, which could result in the additional incremental costs of an alternative solution. Such estimates, which are subject to change, are subsequently revised if and when additional or new information becomes available.
Remedial liabilities are discounted only when the timing of the payments is estimable and the amounts are determinable. Management's experience has been that the timing of payments for remedial liabilities is not usually estimable, and therefore the amounts of remedial liabilities are not
74
CLEAN HARBORS, INC. AND SUBSIDIARIES
NOTES TO CONSOLIDATED FINANCIAL STATEMENTS (Continued)
(2) SIGNIFICANT ACCOUNTING POLICIES (Continued)
generally discounted. In the case of remedial liabilities assumed in connection with acquisitions, acquired liabilities are recorded under purchase accounting at fair value, which requires taking into consideration inflation and discount factors. Accordingly, as of the respective acquisition dates, the Company recorded the remedial liabilities assumed as part of acquisitions at their fair value, which were calculated by inflating costs in current dollars using an estimate of future inflation rates as of the respective acquisition dates until the expected time of payment, and then discounting the amount of the payments to their present value using a risk-free discount rate as of the acquisition dates. Discounts were and will be applied to the environmental liabilities as follows:
- •
- Remedial liabilities assumed relating to acquisitions are and will continue to be inflated using the inflation rates at
the time of each acquisition (ranging from 2.17% to 2.44%) until the expected time of payment, then discounted at the risk-free interest rate at the time of such acquisition (ranging from
4.17% to 4.9%).
- •
- Remedial liabilities incurred subsequent to the acquisitions and remedial liabilities of the Company that existed prior to the acquisitions have been and will continue to be recorded at the estimated current value of the liabilities, which is usually neither increased for inflation nor reduced for discounting.
Claims for Recovery
The Company records claims for recovery from third parties relating to remedial liabilities only when realization of the claim is probable. The gross remedial liability is recorded separately from the claim for recovery on the balance sheet. At December 31, 2009 and 2008, the Company had recorded no such claims.
Accumulated Other Comprehensive Income
The components of accumulated other comprehensive income (loss) were as follows (in thousands):
| |
December 31, | |||||||||
|---|---|---|---|---|---|---|---|---|---|---|
| |
2009 | 2008 | 2007 | |||||||
Cumulative translation adjustment of foreign currency statements |
$ | 26,430 | $ | 1,171 | $ | 18,121 | ||||
Unrealized gain (loss) on long-term investments (net of deferred taxes of ($109) and $332, respectively) |
1,010 | (716 | ) | — | ||||||
Unfunded pension liability (net of deferred taxes of $201, $455 and $127, respectively) |
(611 | ) | (1,143 | ) | (623 | ) | ||||
|
$ | 26,829 | $ | (688 | ) | $ | 17,498 | |||
Foreign Currency
The Company has operations in Canada and Mexico, and also operates international locations in Bulgaria, China, Singapore, Sweden, Thailand and the United Kingdom. The functional currencies of Canada, Mexico, Singapore, Sweden, Thailand and the United Kingdom are their respective local currencies. The functional currencies of Bulgaria and China are the Euro and the U.S. dollar,
75
CLEAN HARBORS, INC. AND SUBSIDIARIES
NOTES TO CONSOLIDATED FINANCIAL STATEMENTS (Continued)
(2) SIGNIFICANT ACCOUNTING POLICIES (Continued)
respectively. Assets and liabilities are translated to U.S. dollars at the exchange rate in effect at the balance sheet date and revenue and expenses at the average exchange rate for the period. Gains and losses from the translation of the consolidated financial statements of certain foreign subsidiaries into U.S. dollars are included in stockholders' equity as a component of other comprehensive income. Gains and losses resulting from foreign currency transactions are recognized in the consolidated statements of income. Recorded balances that are denominated in a currency other than the functional currency are remeasured to the functional currency using the exchange rate at the balance sheet date and gains or losses are recorded in the statements of income.
Related Parties
The Company identifies related parties as entities in which the Company has an investment accounted for using the equity method or which are controlled or influenced by the Company's executive officers or directors. In connection with the July 2009 acquisition of Eveready, the Company records related party transactions consisting primarily of occupancy fees, equipment rentals and purchases and consulting fees.
Letters of Credit
The Company utilizes letters of credit to provide financial assurance to regulatory authorities that certain funds will be available for closure of Company facilities. In addition, the Company utilizes letters of credit to provide collateral for casualty insurance programs, to provide collateral for a vehicle lease line and to provide collateral for a transportation permit. As of December 31, 2009 and 2008, the Company had outstanding letters of credit in an aggregate amount of $88.7 million and $87.6 million, respectively under the revolving credit facility. In addition, the Company had one outstanding letter of credit for $0.8 million in Canada which will be transitioned to the revolving credit facility in the first quarter of 2010.
Use of Estimates
The preparation of consolidated financial statements in conformity with accounting principles generally accepted in the United States of America requires management to make estimates and assumptions, which are evaluated on an ongoing basis, that affect the amounts reported in the Company's consolidated financial statements and accompanying notes. Management bases its estimates on historical experience and on various other assumptions it believes to be reasonable at the time under the circumstances, the results of which form the basis for making judgments about the carrying values of assets and liabilities and reported amounts of revenues and expenses. Actual results could differ from those estimates and judgments.
Stock-Based Compensation
The Company recognizes stock-based compensation expense in the financial statements based on the fair value of the awards. Stock-based compensation cost is measured at the grant date based on the fair value of the award and is recognized as expense over the requisite service period, which generally represents the vesting period, and includes an estimate of awards that will be forfeited. The fair value of stock options is calculated using the Black-Scholes option-pricing model. Compensation expense is based on the number of options expected to vest. Forfeitures estimated when recognizing compensation
76
CLEAN HARBORS, INC. AND SUBSIDIARIES
NOTES TO CONSOLIDATED FINANCIAL STATEMENTS (Continued)
(2) SIGNIFICANT ACCOUNTING POLICIES (Continued)
expense are adjusted when actual forfeitures differ from the estimate. The fair value of the Company's grants of restricted stock are based on the quoted market price for the Company's common stock on the respective dates of grant.
Any reduction in taxes payable resulting from tax deductions that exceed the recognized tax benefit associated with compensation expense (excess tax benefits) is classified as financing cash flows.
Business Combinations
In December 2007, the FASB issued ASC 805, Business Combinations ("ASC 805"). ASC 805 changes how business acquisitions are accounted for and impacts financial statements both on the acquisition date and in subsequent periods. ASC 805 is effective for financial statements issued for fiscal years beginning after December 15, 2008. The Company adopted ASC 805 on January 1, 2009 and during the year ended December 31, 2009, expensed $5.0 million of acquisition costs that, prior to the adoption of ASC 805, would have been included as part of the respective purchase prices. In addition, under the provisions of ASC 805, future reversal of the Company's current acquisition-related tax reserves of approximately $10.9 million (excluding interest and penalties) will be recorded in earnings, rather than as an adjustment to goodwill or acquisition related other intangible assets and will affect the Company's annual effective income tax rate. Due to the expiring statutes in Canada, the Company expects that acquisition-related tax reserves will decrease by $7.9 million within the next twelve months, which will be recorded in earnings and therefore impact the effective income tax rate.
Recent Accounting Pronouncements
In June 2009, the Financial Accounting Standards Board ("FASB") approved its ASC as the single source of authoritative United States accounting and reporting standards applicable for all non-governmental entities, with the exception of the Securities and Exchange Commission ("SEC") and its staff. The ASC, which changes the referencing of financial standards, is effective for interim or annual financial periods ending after September 15, 2009. Accordingly, the Company has updated all references made to U.S. generally accepted accounting principles ("U.S. GAAP") with the corresponding new ASC numbering system prescribed by the FASB. As the ASC is not intended to change or alter existing U.S. GAAP, its adoption did not have any impact on the Company's financial position, results of operations or cash flow.
In February 2008, the FASB issued authoritative guidance which delayed the effective date of ASC 820, Fair Value Measurements ("ASC 820") for non-financial assets and non-financial liabilities that are recognized or disclosed in the financial statements on a nonrecurring basis to fiscal years beginning after November 15, 2008. The Company adopted such guidance on January 1, 2009 and it did not have a material impact on the Company's financial position, results of operations or cash flow.
In December 2008, the FASB issued authoritative guidance which requires additional disclosures for employers' pension and other post-retirement benefit plan assets. This guidance requires employers to disclose information about fair value measurements of plan assets similar to the disclosures required under ASC 820, the investment policies and strategies for the major categories of plan assets, and significant concentrations of risk within plan assets. This guidance is effective for the Company as of December 31, 2009. As the guidance provides only disclosure requirements, the adoption of this standard had no material impact on the Company's financial position, results of operations or cash flow. See Note 17, "Employee Benefit Plans," for detailed disclosure.
77
CLEAN HARBORS, INC. AND SUBSIDIARIES
NOTES TO CONSOLIDATED FINANCIAL STATEMENTS (Continued)
(2) SIGNIFICANT ACCOUNTING POLICIES (Continued)
On February 1, 2009, the Company adopted the FASB's authoritative guidance which changed the accounting and reporting for minority interests to have such interests be recharacterized as noncontrolling interests and classified as a component of equity within the Company's consolidated balance sheets. The Company did not have any significant noncontrolling interests outstanding in any of its subsidiaries prior to the acquisition of Eveready on July 31, 2009, and therefore the adoption did not affect previously reported financial information. As of September 30, 2009, the noncontrolling interests in one of the Company's subsidiaries acquired as part of the Eveready acquisition were redeemable securities under ASC 480 and were recorded as temporary equity at their maximum redemption amount within the Company's consolidated balance sheet. The redemption agreement for a portion of noncontrolling interest was exercised in December 2009 and the Company reclassified the maximum redemption amount from temporary equity to accrued expenses at December 31, 2009. For the year ended December 31, 2009, the net income attributable to those noncontrolling interests was immaterial and was included in the Company's net income.
In April 2009, the FASB issued authoritative guidance that changes the method for determining whether an other-than-temporary impairment exists for debt securities and the amount of an impairment charge to be recorded in earnings. To determine whether an other-than-temporary impairment exits, an entity will assess the likelihood of selling the security prior to recovering its cost basis, rather than assessing whether it has the intent and ability to hold a security to recovery. The Company adopted such guidance in the period ended March 31, 2009, and has determined that the cumulative $0.5 million impairment related to the fair value of its auction rate securities continues to be temporary.
(3) BUSINESS COMBINATIONS
Eveready
On July 31, 2009, the Company acquired 100% of the outstanding common shares of Eveready Inc. ("Eveready"), an Alberta corporation headquartered in Edmonton, Alberta. Eveready provides industrial maintenance and production, lodging, and exploration services to the oil and gas, chemical, pulp and paper, manufacturing and power generation industries. The Company anticipates that this acquisition will enhance the Company's presence in the industrial services market, broaden the range of services the Company can offer customers of both companies, and advance the Company's position in the Canadian marketplace.
78
CLEAN HARBORS, INC. AND SUBSIDIARIES
NOTES TO CONSOLIDATED FINANCIAL STATEMENTS (Continued)
(3) BUSINESS COMBINATIONS (Continued)
The following table summarizes the consideration paid for Eveready at the acquisition date (in thousands).
2.4 million shares of Clean Harbors common stock issued for Eveready common shares(1) |
$ | 118,427 | ||
Cash paid for Eveready common shares |
56,191 | |||
Shares held in the Eveready employee participation plan(2) |
(1,946 | ) | ||
Cash paid for Eveready deferred shares assumed(3) |
100 | |||
Eveready credit facility assumed |
168,561 | |||
Capital lease obligations assumed |
21,214 | |||
Eveready debentures assumed(3) |
47,144 | |||
Fair value of consideration transferred |
$ | 409,691 | ||
- (1)
- The
value of Clean Harbors common stock used ($49.50) was the closing price of Clean Harbors common stock on the New York Stock Exchange on July 30,
2009.
- (2)
- The
Eveready employee participation plan included 247,727 Eveready common shares that were held in the Eveready employee participation plan trust. Upon
completion of the acquisition, the Eveready common shares held by that trust were exchanged for the same purchase amount of cash and ratio of shares of Clean Harbors common stock as the other
outstanding Eveready common shares and will vest as they are earned in future periods in accordance with the plan's terms and conditions. The Eveready employee participation plan consideration is
reflected in the shares of Clean Harbors common stock and cash paid for Eveready common shares, and the amount still to be earned by the plan participants has been shown as a reduction of the total
purchase price. The amount presented for the shares held in the employee participation plan trust is net of the value of shares vested as of July 31, 2009.
- (3)
- The outstanding Eveready deferred shares and Eveready debentures were paid off on July 31, 2009. The redemption price of the outstanding Eveready debentures was equal to 101% of the principal amount plus accrued interest.
In connection with the acquisition, the Company was required to obtain waivers from the lenders under the Company's and Eveready's respective then existing credit agreements to allow for the completion of the acquisition and the repayment of Eveready's then existing 7% convertible subordinated debentures, and also concurrently with or following the acquisition to secure financing sufficient to pay off or restructure substantially all of the then remaining Eveready indebtedness. The Company obtained the necessary waivers prior to the close of the acquisition and subsequently met the financing requirement on August 14, 2009, by issuing $300.0 million principal amount of 75/8% senior secured notes for net proceeds of $292.1 million. See Note 10, "Financing Arrangements."
Acquisition related costs of $4.7 million were included in selling, general and administrative expenses in the Company's consolidated statements of income for the year ended December 31, 2009.
The following table summarizes the recognized amounts of identifiable assets acquired and liabilities assumed at July 31, 2009 (in thousands). The fair value of accounts receivable, accounts payable, accrued expenses and income taxes are provisional pending finalization of the Company's
79
CLEAN HARBORS, INC. AND SUBSIDIARIES
NOTES TO CONSOLIDATED FINANCIAL STATEMENTS (Continued)
(3) BUSINESS COMBINATIONS (Continued)
valuation. Measurement period adjustments reflect new information obtained about facts and circumstances that existed as of the acquisition date. The Company believes that such information provides a reasonable basis for estimating the fair values of assets acquired and liabilities assumed but the Company is waiting for additional information necessary to finalize fair value. The Company expects to finalize the valuation and complete the purchase price allocation as soon as practicable but no later than one year from the acquisition date. Final determination of the fair value may result in further adjustments to the values presented below.
| |
July 31, 2009 (As initially reported) |
Measurement Period Adjustments |
July 31, 2009 (As adjusted) |
|||||||
|---|---|---|---|---|---|---|---|---|---|---|
Current assets(i)(ii) |
$ | 121,787 | $ | (3,753 | ) | $ | 118,034 | |||
Property, plant and equipment |
271,752 | — | 271,752 | |||||||
Identifiable intangible assets(iii) |
43,800 | (600 | ) | 43,200 | ||||||
Other assets |
1,481 | (22 | ) | 1,459 | ||||||
Current liabilities(ii) |
(38,437 | ) | (1,694 | ) | (40,131 | ) | ||||
Asset retirement obligations |
(70 | ) | — | (70 | ) | |||||
Other liabilities |
(5,894 | ) | (301 | ) | (6,195 | ) | ||||
Noncontrolling interests(iv) |
(5,484 | ) | — | (5,484 | ) | |||||
Total identifiable net assets |
$ | 388,935 | $ | (6,370 | ) | $ | 382,565 | |||
Goodwill(v) |
20,919 | 6,207 | 27,126 | |||||||
|
$ | 409,854 | $ | (163 | ) | $ | 409,691 | |||
- (i)
- The
preliminary fair value of the financial assets acquired includes customer receivables with a preliminary fair value of $77.7 million. The gross
amount due is $88.3 million.
- (ii)
- Includes
assets and liabilities held for sale of $12.1 million and $3.0 million, respectively.
- (iii)
- The
intangible assets are being amortized over a weighted average useful life of 8.2 years.
- (iv)
- The
fair value of the noncontrolling interests approximate the maximum redemption prices on the date of the acquisition.
- (v)
- Goodwill, which is attributable to assembled workforce and expected operating and cross-selling synergies, is not expected to be deductible for tax purposes. Goodwill of $13.4 million, $10.3 million and $3.4 million has been recorded in the Industrial Services, Exploration Services and Field Services segments, respectively; however, the amount are subject to change pending the finalization of the Company's valuation.
In connection with the acquisition, the Company agreed with the Canadian Commissioner of Competition to divest Eveready's Pembina Area Landfill, located near Drayton Valley, Alberta, due to its proximity to the Company's existing landfill in the region. The Pembina Area Landfill meets the held for sale criteria, and therefore the fair value of its assets and liabilities have been recorded as held for sale in the Company's consolidated balance sheet as of December 31, 2009 and the results of its operations have been presented as discontinued operations on the consolidated statements of income for the year ended December 31, 2009.
80
CLEAN HARBORS, INC. AND SUBSIDIARIES
NOTES TO CONSOLIDATED FINANCIAL STATEMENTS (Continued)
(3) BUSINESS COMBINATIONS (Continued)
The Company has determined that the presentation of Eveready net income is impracticable for the year ended December 31, 2009 due to the integration of Eveready operations into the Company upon acquisition. Revenues attributable to Eveready for the year ended December 31, 2009 were $177.7 million.
The following unaudited pro forma combined summary data presents information as if Eveready had been acquired at the beginning of the periods presented with financing obtained as described above and assumes that there were no other changes in the Company's operations. The pro forma information does not necessarily reflect the actual results that would have occurred had the Company and Eveready been combined during the periods presented, nor is it necessarily indicative of the future results of operations of the combined companies (in thousands).
| |
Year ended December 31, |
||||||
|---|---|---|---|---|---|---|---|
| |
2009 | 2008 | |||||
Pro forma combined revenues |
$ | 1,349,269 | $ | 1,644,348 | |||
Pro forma combined net income |
$ | 29,025 | $ | (6,326 | ) | ||
Earnings per share |
$ | 1.16 | $ | (0.25 | ) | ||
EnviroSORT
On February 27, 2009, the Company acquired 100% of the outstanding stock of privately-held EnviroSORT Inc., an Alberta corporation ("EnviroSORT"), for a purchase price of $9.6 million. The purchase price included the assumption of $2.5 million of EnviroSORT debt and $0.9 million of post-closing adjustments. The Company paid down the balance of the $2.5 million assumed debt on the acquisition date. The acquisition of EnviroSORT complemented and expanded the Company's operations in Western Canada. The purchase price was subject to post-closing adjustments which were based upon the amount by which EnviroSORT's net working capital, as of the closing date, was greater or less than $0.5 million. As of December 2009, the Company finalized the working capital adjustment resulting in a payment to the seller of $0.8 million. As of December 31, 2009, the Company recorded intangible assets of $0.6 million and goodwill of $2.5 million. The intangible assets are being amortized over a weighted average useful life of 4.9 years. Goodwill has been allocated to the Technical Services segment and is not expected to be deductible for tax purposes. Acquisition-related costs of $0.3 million were included in selling, general, and administrative expenses for the year ended December 31, 2009.
Safety-Kleen Systems and Universal Environmental
During the three months ended March 31, 2009, the Company finalized the purchase accounting for the March 2008 acquisitions of two solvent recycling facilities from Safety-Kleen Systems, Inc. and of Universal Environmental, Inc. There were no material adjustments to the purchase price of the solvent recycling facilities after December 31, 2008. Additional acquisition costs of $0.1 million were recorded against the purchase price of Universal Environmental, Inc., resulting in a final purchase price of $15.1 million. These additional acquisition costs resulted in an increase of $0.1 million to goodwill. The working capital adjustment was also finalized and resulted in an increase of less than $0.1 million owed to the seller.
81
CLEAN HARBORS, INC. AND SUBSIDIARIES
NOTES TO CONSOLIDATED FINANCIAL STATEMENTS (Continued)
(4) FAIR VALUE MEASUREMENTS
The Company's financial instruments consist of cash and cash equivalents, marketable securities, receivables, trade payables, auction rate securities and long-term debt. The estimated fair value of cash and cash equivalents, receivables, and trade payables approximate their carrying value due to the short maturity of these instruments. As of December 31, 2009, the Company held certain marketable securities and auction rate securities that are required to be measured at fair value on a recurring basis. The fair value of marketable securities is recorded based on quoted market prices. The auction rate securities are classified as available for sale and the fair value of these securities as of December 31, 2009 was estimated utilizing a discounted cash flow analysis. The discounted cash flow analysis considered, among other items, the collateralization underlying the security investments, the creditworthiness of the counterparty, the timing of expected future cash flows, and the expectation of the next time the security is expected to have a successful auction. The auction rate securities were also compared, when possible, to other observable market data with similar characteristics to the securities held by the Company.
As of December 31, 2009, all of the Company's auction rate securities continue to have AAA underlying ratings. The underlying assets of the Company's auction rate securities are student loans, which are substantially insured by the Federal Family Education Loan Program. The Company attributes the $0.5 million decline in the fair value of the securities from the original cost basis to external liquidity issues rather than credit issues. The Company assessed the decline in value to be temporary because the Company does not intend to sell the securities and it is more likely than not that it will not have to sell the securities before their maturity.
During the year ended December 31, 2009, the Company recorded an unrealized pre-tax gain of $0.3 million on its auction rate securities which is included in accumulated other comprehensive income. In addition, as of December 31, 2009, the Company continued to earn interest on all of its auction rate securities.
The Company's assets measured at fair value on a recurring basis subject to the disclosure requirements at December 31, 2009 and 2008 were as follows (in thousands):
| |
Quoted Prices in Active Markets for Identical Assets (Level 1) |
Significant Other Observable Inputs (Level 2) |
Significant Unobservable Inputs (Level 3) |
Balance at December 31, 2009 |
|||||||||
|---|---|---|---|---|---|---|---|---|---|---|---|---|---|
Auction rate securities |
$ | — | $ | — | $ | 6,503 | $ | 6,503 | |||||
Marketable securities |
$ | 2,072 | $ | — | $ | — | $ | 2,072 | |||||
| |
Quoted Prices in Active Markets for Identical Assets (Level 1) |
Significant Other Observable Inputs (Level 2) |
Significant Unobservable Inputs (Level 3) |
Balance at December 31, 2008 |
|||||||||
|---|---|---|---|---|---|---|---|---|---|---|---|---|---|
Auction rate securities |
$ | — | $ | — | $ | 6,237 | $ | 6,237 | |||||
Marketable securities |
$ | 175 | $ | — | $ | — | $ | 175 | |||||
82
CLEAN HARBORS, INC. AND SUBSIDIARIES
NOTES TO CONSOLIDATED FINANCIAL STATEMENTS (Continued)
(4) FAIR VALUE MEASUREMENTS (Continued)
The following table presents the changes in the Company's long-term investments measured at fair value on a recurring basis using significant unobservable inputs (Level 3) during the year ended December 31, 2009 (in thousands):
| |
2009 | |||
|---|---|---|---|---|
Balance at January 1, 2009 |
$ | 6,237 | ||
Total unrealized gains included in other comprehensive income |
266 | |||
Balance at December 31, 2009 |
$ | 6,503 | ||
(5) SUPPLIES INVENTORY
The Company's supplies inventory balance increased from $26.9 million at December 31, 2008 to $41.4 million at December 31, 2009, primarily due to the acquisition of Eveready. Eveready's supplies inventory is similar to the supplies inventory historically carried by the Company, which is primarily materials, parts, and supplies consumed in rendering services to customers.
(6) GOODWILL AND OTHER INTANGIBLE ASSETS
The changes to goodwill for the year ended December 31, 2009 were as follows (in thousands):
| |
2009 | |||
|---|---|---|---|---|
Balance at January 1, 2009 |
$ | 24,578 | ||
Acquired from acquisitions |
30,200 | |||
Foreign currency translation |
1,307 | |||
Balance at December 31, 2009 |
$ | 56,085 | ||
The increase in goodwill during the year ended December 31, 2009 was primarily attributed to the acquisitions of Eveready and EnviroSORT and final purchase price adjustments related to Universal Environmental, Inc. The goodwill related to Eveready includes estimates that are subject to change based upon final fair value determinations.
Below is a summary of amortizable other intangible assets (in thousands):
| |
December 31, 2009 | December 31, 2008 | |||||||||||||||||||||||
|---|---|---|---|---|---|---|---|---|---|---|---|---|---|---|---|---|---|---|---|---|---|---|---|---|---|
| |
Cost | Accumulated Amortization |
Net | Weighted Average Amortization Period (in years) |
Cost | Accumulated Amortization |
Net | Weighted Average Amortization Period (in years) |
|||||||||||||||||
Permits |
$ | 100,236 | $ | 38,246 | $ | 61,990 | 13.8 | $ | 94,446 | $ | 33,458 | $ | 60,988 | 17.2 | |||||||||||
Customer lists |
52,327 | 4,220 | 48,107 | 8.9 | 10,768 | 1,324 | 9,444 | 8.4 | |||||||||||||||||
Other intangible assets |
10,606 | 6,515 | 4,091 | 4.3 | 6,843 | 5,521 | 1,322 | 2.2 | |||||||||||||||||
|
$ | 163,169 | $ | 48,981 | $ | 114,188 | 15.7 | $ | 112,057 | $ | 40,303 | $ | 71,754 | 13.6 | |||||||||||
The increase in the customer lists and other intangible assets was due to the acquisition of Eveready.
83
CLEAN HARBORS, INC. AND SUBSIDIARIES
NOTES TO CONSOLIDATED FINANCIAL STATEMENTS (Continued)
(6) GOODWILL AND OTHER INTANGIBLE ASSETS (Continued)
Below is the expected amortization for the net carrying amount of finite-lived intangible assets at December 31, 2009 (in thousands):
Years Ending December 31,
|
Expected Amortization |
|||
|---|---|---|---|---|
2010 |
$ | 9,434 | ||
2011 |
8,815 | |||
2012 |
8,658 | |||
2013 |
8,511 | |||
2014 |
8,169 | |||
Thereafter |
70,601 | |||
|
$ | 114,188 | ||
(7) ACCRUED EXPENSES
Accrued expenses consisted of the following (in thousands):
| |
December 31, 2009 |
December 31, 2008 |
|||||
|---|---|---|---|---|---|---|---|
Insurance |
$ | 20,319 | $ | 15,361 | |||
Interest |
8,860 | 1,280 | |||||
Accrued disposal costs |
2,108 | 2,305 | |||||
Accrued compensation and benefits |
20,023 | 22,952 | |||||
Real estate, sales and other taxes |
7,201 | 4,702 | |||||
Other items |
32,196 | 21,301 | |||||
|
$ | 90,707 | $ | 67,901 | |||
At the time of the Company's acquisition of Eveready on July 31, 2009, there was an aggregate 7.89% noncontrolling interest in an Eveready subsidiary held by the former owners of Bullseye Directional Drilling ("Bullseye") and Rodrigue Directional Drilling ("Rodrigue") group of companies, which were acquired by Eveready in 2006. Under the agreements with the former owners, Eveready then held a call option to acquire, and the former owners then held a put option to sell, the noncontrolling interests at certain prices to be determined in accordance with the agreements. In September 2009, the agreements were amended to provide that the options would be exercisable for fixed prices to be paid in cash on September 1, 2010 in the case of Bullseye and on December 1, 2010 in the case of Rodrigue. The agreements for the noncontrolling interests of Bullseye and Rodrigue were exercised in September 2009 and December 2009, respectively, and the Company classified the maximum redemption amount as accrued expenses at December 31, 2009. For the year ended December 31, 2009, the net income attributable to those noncontrolling interests was immaterial and was included in the Company's net income.
84
CLEAN HARBORS, INC. AND SUBSIDIARIES
NOTES TO CONSOLIDATED FINANCIAL STATEMENTS (Continued)
(8) CLOSURE AND POST-CLOSURE LIABILITIES
The changes to closure and post-closure liabilities (also referred to as "asset retirement obligations"), from January 1, 2008 through December 31, 2009 were as follows (in thousands):
| |
Landfill Retirement Liability |
Non-Landfill Retirement Liability |
Total | |||||||
|---|---|---|---|---|---|---|---|---|---|---|
Balance at January 1, 2008 |
$ | 22,896 | $ | 6,833 | $ | 29,729 | ||||
Liabilities assumed in acquisitions |
— | 418 | 418 | |||||||
New asset retirement obligations |
1,180 | — | 1,180 | |||||||
Accretion |
3,028 | 872 | 3,900 | |||||||
Changes in estimates recorded to statement of income |
(586 | ) | 452 | (134 | ) | |||||
Other changes in estimates recorded to balance sheet |
213 | — | 213 | |||||||
Settlement of obligations |
(1,050 | ) | (1,138 | ) | (2,188 | ) | ||||
Currency translation and other |
(412 | ) | (69 | ) | (481 | ) | ||||
Balance at December 31, 2008 |
25,269 | 7,368 | 32,637 | |||||||
Liabilities assumed in acquisitions |
— | 70 | 70 | |||||||
New asset retirement obligations |
1,395 | — | 1,395 | |||||||
Accretion |
2,952 | 943 | 3,895 | |||||||
Changes in estimates recorded to statement of income |
(946 | ) | (100 | ) | (1,046 | ) | ||||
Other changes in estimates recorded to balance sheet |
1,143 | — | 1,143 | |||||||
Settlement of obligations |
(2,040 | ) | (597 | ) | (2,637 | ) | ||||
Currency translation and other |
297 | 56 | 353 | |||||||
Balance at December 31, 2009 |
$ | 28,070 | $ | 7,740 | $ | 35,810 | ||||
The 2009 benefit resulting from changes in estimate was primarily due to completing the closure of a landfill cell at lower than anticipated cost as well as delays in timing of certain final cell closure and remedial projects spending. All of the landfill facilities included in the above were active as of December 31, 2009.
New asset retirement obligations incurred in the period January through July 2009 were discounted at the credit-adjusted risk-free rate of 10.57% and inflated at a rate of 1.02%. With the August 2009 offering of $300.0 million of senior secured notes and the discharge of the outstanding balance of the previous senior secured notes on which the initial 2009 rate had been based, the credit-adjusted risk-free rate was recalculated. Beginning in August 2009, new asset retirement obligations have been discounted at the rate of 9.37%.
On October 9, 2009 the Company submitted the terms of reference for an environmental assessment ("EA") to the Environment Ministry of Ontario as the next step in a proposal to develop additional capacity at the Lambton landfill pursuant to the Ontario Environmental Assessment Act. Landfill amortization and accrual rates at Lambton have historically been based on an assumption of 7.8 million cubic yards of unpermitted yet highly probable airspace. The terms of reference included a request to reduce the highly probable airspace to 6.2 million cubic yards. As a result, the highly probable airspace at Lambton was reduced and the amortization and accrual rates were adjusted. Because of the long life of the landfill and the effect of discounting, the rate change is insignificant on the units-of-consumption basis. Additionally, the 1.6 million cubic yards of airspace that is not included in this EA will still be available for inclusion in a future expansion request.
85
CLEAN HARBORS, INC. AND SUBSIDIARIES
NOTES TO CONSOLIDATED FINANCIAL STATEMENTS (Continued)
(8) CLOSURE AND POST-CLOSURE LIABILITIES (Continued)
Anticipated payments (based on current estimated costs and anticipated timing of necessary regulatory approvals to commence work on closure and post-closure activities) for each of the next five years and thereafter are as follows (in thousands):
Year ending December 31,
|
|
|||
|---|---|---|---|---|
2010 |
$ | 7,659 | ||
2011 |
6,389 | |||
2012 |
6,265 | |||
2013 |
2,953 | |||
2014 |
7,098 | |||
Thereafter |
213,291 | |||
Undiscounted closure and post-closure liabilities |
243,655 | |||
Less: Reserves to be provided (including discount of $127.4 million) over remaining site lives |
(207,845 | ) | ||
Present value of closure and post-closure liabilities |
$ | 35,810 | ||
(9) REMEDIAL LIABILITIES
The changes to remedial liabilities from January 1, 2008 through December 31, 2009 were as follows (in thousands):
| |
Remedial Liabilities for Landfill Sites |
Remedial Liabilities for Inactive Sites |
Remedial Liabilities (Including Superfund) for Non-Landfill Operations |
Total | |||||||||
|---|---|---|---|---|---|---|---|---|---|---|---|---|---|
Balance at January 1, 2008 |
$ | 5,682 | $ | 88,619 | $ | 60,458 | $ | 154,759 | |||||
Liabilities assumed in acquisitions |
— | — | 3,204 | 3,204 | |||||||||
Accretion |
261 | 4,202 | 2,413 | 6,876 | |||||||||
Changes in estimates recorded to statement of income |
(189 | ) | 93 | (1,817 | ) | (1,913 | ) | ||||||
Settlement of obligations |
(98 | ) | (3,955 | ) | (8,027 | ) | (12,080 | ) | |||||
Currency translation and other |
(544 | ) | 1,332 | (5,746 | ) | (4,958 | ) | ||||||
Balance at December 31, 2008 |
5,112 | 90,291 | 50,485 | 145,888 | |||||||||
Accretion |
253 | 4,192 | 2,276 | 6,721 | |||||||||
Changes in estimates recorded to statement of income |
(323 | ) | (4,466 | ) | 1,178 | (3,611 | ) | ||||||
Settlement of obligations |
(97 | ) | (3,330 | ) | (2,553 | ) | (5,980 | ) | |||||
Currency translation and other |
392 | 74 | 2,002 | 2,468 | |||||||||
Balance at December 31, 2009 |
$ | 5,337 | $ | 86,761 | $ | 53,388 | $ | 145,486 | |||||
The benefit resulting from changes in estimate for landfill sites and inactive sites was due primarily to (i) the successful introduction of new technology for remedial activities and (ii) the net discounting effect of delays in timing for completion of certain remedial projects and updated site information. The
86
CLEAN HARBORS, INC. AND SUBSIDIARIES
NOTES TO CONSOLIDATED FINANCIAL STATEMENTS (Continued)
(9) REMEDIAL LIABILITIES (Continued)
changes in estimate resulting in an increase to the non-landfill liabilities were primarily due to (i) new regulatory compliance obligations, (ii) the net of timing changes and implementation of technology upgrades, and (iii) the discounting effect of delays in certain remedial projects and updated site information.
Anticipated payments at December 31, 2009 (based on current estimated costs and anticipated timing of necessary regulatory approvals to commence work on remedial activities) for each of the next five years and thereafter are as follows (in thousands):
Year ending December 31,
|
|
|||
|---|---|---|---|---|
2010 |
$ | 11,107 | ||
2011 |
12,137 | |||
2012 |
13,526 | |||
2013 |
9,932 | |||
2014 |
9,131 | |||
Thereafter |
131,708 | |||
Undiscounted remedial liabilities |
187,541 | |||
Less: Discount |
(42,055 | ) | ||
Total remedial liabilities |
$ | 145,486 | ||
In light of currently available facts and legal interpretations, existing technology, and presently enacted laws and regulations, the Company estimates that its aggregate liabilities as of December 31, 2009 for future remediation relating to all of its owned or leased facilities and the Superfund sites for which the Company has current or potential future liability is approximately $145.5 million. The Company also estimates that it is reasonably possible that the amount of such total liabilities could be as much as $21.8 million more. Future changes in either available technology or applicable laws or regulations could affect such estimates of remedial liabilities. Since the Company's satisfaction of the liabilities will occur over many years, the Company cannot now reasonably predict the nature or extent of future changes in either available technology or applicable laws or regulations and the impact that those changes, if any, might have on the current estimates of remedial liabilities.
The following tables show, respectively, (i) the amounts of such estimated liabilities associated with the types of facilities and sites involved and (ii) the amounts of such estimated liabilities associated with each facility or site which represents at least 5% of the total and with all other facilities and sites as a group.
87
CLEAN HARBORS, INC. AND SUBSIDIARIES
NOTES TO CONSOLIDATED FINANCIAL STATEMENTS (Continued)
(9) REMEDIAL LIABILITIES (Continued)
Estimates Based on Type of Facility or Site (in thousands):
Type of Facility or Site
|
Remedial Liability |
% of Total | Reasonably Possible Additional Losses |
|||||||
|---|---|---|---|---|---|---|---|---|---|---|
Facilities now used in active conduct of the Company's business (20 facilities) |
$ | 50,290 | 34.6 | % | $ | 10,295 | ||||
Inactive facilities not now used in active conduct of the Company's business but most of which were acquired because the assumption of remedial liabilities for such facilities was part of the purchase price for the CSD assets (16 facilities) |
86,761 | 59.6 | 10,636 | |||||||
Superfund sites owned by third parties on which wastes generated or shipped by the sellers of the CSD assets (or their predecessors) of such sites are present (14 sites) |
8,435 | 5.8 | 862 | |||||||
Total |
$ | 145,486 | 100.0 | % | $ | 21,793 | ||||
Estimates Based on Amount of Potential Liability (in thousands):
Location
|
Type of Facility or Site | Remedial Liability |
% of Total | Reasonably Possible Additional Losses(1)(2) |
||||||||
|---|---|---|---|---|---|---|---|---|---|---|---|---|
| Baton Rouge, LA | Closed incinerator and landfill | $ | 37,498 | 25.8 | % | $ | 5,279 | |||||
| Bridgeport, NJ | Closed incinerator | 28,064 | 19.3 | 3,412 | ||||||||
| Mercier, Quebec | Open incinerator and legal proceedings | 13,187 | 9.0 | 1,355 | ||||||||
| El Dorado, AR | Open incinerator | 7,609 | 5.2 | 684 | ||||||||
| San Jose, CA | Open treatment, storage, or disposal facilities | 9,000 | 6.2 | 945 | ||||||||
| Various | All other incinerators, landfills, wastewater treatment facilities and service centers (31 facilities) | 41,693 | 28.7 | 9,256 | ||||||||
| Various | All other Superfund sites (each representing less than 5% of total liabilities) owned by third parties on which wastes generated or shipped by either the Company or the sellers of the CSD assets (or their predecessors) are present (14 sites) | 8,435 | 5.8 | 862 | ||||||||
| Total | $ | 145,486 | 100.0 | % | $ | 21,793 | ||||||
- (1)
- Reasonably
possible additional losses include estimates of remediation liability related to the legal and administrative proceedings discussed in
Note 18, "Commitments and Contingencies," as well as other such estimated remedial liabilities.
- (2)
- Amounts represent the high end of the range of management's best estimate of the reasonably possible additional losses.
88
CLEAN HARBORS, INC. AND SUBSIDIARIES
NOTES TO CONSOLIDATED FINANCIAL STATEMENTS (Continued)
(9) REMEDIAL LIABILITIES (Continued)
Revisions to remediation reserve requirements may result in upward or downward adjustments to income from operations in any given period. The Company believes that its extensive experience in the environmental services business, as well as its involvement with a large number of sites, provides a reasonable basis for estimating its aggregate liability. It is possible, however, that technological, regulatory or enforcement developments, the results of environmental studies, or other factors could necessitate the recording of additional liabilities or the revision of currently recorded liabilities that could be material. The impact of such future events cannot be estimated at the current time.
(10) FINANCING ARRANGEMENTS
The following table is a summary of the Company's financing arrangements (in thousands):
| |
December 31, 2009 | December 31, 2008 | |||||
|---|---|---|---|---|---|---|---|
Senior secured notes, at 11.25%, due July 15, 2012 |
$ | — | $ | 23,032 | |||
Revolving facility, due December 1, 2010 |
— | — | |||||
Synthetic letter of credit facility, due December 1, 2010 |
— | — | |||||
Term loan, at 2.97% on December 31, 2008, due December 1, 2010 |
— | 30,000 | |||||
Senior secured notes, at 7.625%, due August 15, 2016 |
300,000 | — | |||||
Revolving credit facility, due July 31, 2013 |
— | — | |||||
Less unamortized issue discount |
(7,567 | ) | (162 | ) | |||
Long-term obligations |
$ | 292,433 | $ | 52,870 | |||
The following summarizes the principal financing activities of the Company during the year ended December 31, 2009:
- •
- July 24, 2009: the Company repaid its then outstanding $30.0 million term loan due in 2010;
- •
- July 31, 2009: the Company discharged its $23.0 million of then outstanding senior secured notes due 2012
(the "former notes") by calling such notes for redemption on August 31, 2009 and depositing with the trustee the redemption price of $23.7 million and accrued interest of
$0.3 million through the redemption date;
- •
- July 31, 2009: the Company amended its previous $70.0 million revolving credit facility and
$50.0 million synthetic letter of credit facility with a new $120 million revolving credit facility (described below);
- •
- July 31, 2009: the Company assumed all of Eveready's then outstanding debt including capital leases;
- •
- July 31, 2009: the Company repaid $47.1 million of Eveready's then outstanding convertible subordinated
debentures at 101% principal plus accrued interest of $0.3 million; and
- •
- August 14, 2009: the Company issued $300 million principal amount of 75/8% senior secured notes due 2016 for net proceeds of $292.1 million. The Company used approximately $175.0 million of the net proceeds to repay all amounts outstanding under Eveready's existing credit facility and certain capital leases, and to pay certain related fees, expenses and other costs. The Eveready credit facility was terminated in connection with the repayment of all amounts outstanding thereunder.
89
CLEAN HARBORS, INC. AND SUBSIDIARIES
NOTES TO CONSOLIDATED FINANCIAL STATEMENTS (Continued)
(10) FINANCING ARRANGEMENTS (Continued)
In connection with the above mentioned transactions, the Company recorded an aggregate $4.9 million loss on early extinguishment of debt, which included $0.7 and $2.2 million in prepayment penalties on the senior secured notes and Eveready credit facility, respectively, other fees of $0.2 million, and non-cash expenses of $1.7 million and $0.1 million for unamortized financing costs and discount, respectively.
The principal terms of the senior secured notes and the revolving credit facility are as follows:
Senior Secured Notes. Interest is payable semi-annually on February 15 and August 15 of each year beginning on February 15, 2010. The senior secured notes were issued pursuant to an indenture dated as of August 14, 2009 (the "indenture"), among the Company, as issuer, substantially all of the Company's domestic subsidiaries, as guarantors, and U.S. Bank National Association, as trustee and senior secured notes collateral agent.
The Company may redeem some or all of the senior secured notes at any time on or after August 15, 2012 at the following redemption prices (expressed as percentages of the principal amount) if redeemed during the twelve-month period commencing on August 15 of the year set forth below, plus, in each case, accrued and unpaid interest, if any, to the date of redemption:
Year
|
Percentage | |||
|---|---|---|---|---|
2012 |
103.813 | % | ||
2013 |
101.906 | % | ||
2014 and thereafter |
100.000 | % | ||
At any time and from time to time prior to August 15, 2012, but not more than once in any twelve-month period, the Company may also redeem up to 10% of the original aggregate principal amount of the senior secured notes at a redemption price of 103% of the principal amount, plus any accrued and unpaid interest. Prior to August 15, 2012, the Company may also redeem up to 35% of the aggregate principal amount of the senior secured notes at a redemption price of 107.625% of the principal amount, plus any accrued and unpaid interest, using proceeds from certain equity offerings, and may also redeem some or all of the senior secured notes at a redemption price of 100% of the principal amount plus a make-whole premium and any accrued and unpaid interest. Holders may require the Company to repurchase the senior secured notes at a purchase price equal to 101% of the principal amount, plus any accrued and unpaid interest, upon a change of control of the Company.
The senior secured notes are guaranteed by substantially all the Company's current and future domestic restricted subsidiaries. The senior secured notes are the Company's and the guarantors' senior secured obligations ranking equally, subject to the lien priorities summarized below, with all of the Company's and the guarantors' existing and future senior obligations (including obligations under the Company's credit agreement) and senior to any future indebtedness that is expressly subordinated to the senior secured notes and the guarantees. The senior secured notes and the guarantees are secured by a first lien on substantially all of the assets of the Company and its domestic restricted subsidiaries (the "Notes Collateral"), except for accounts receivable, related general intangibles and instruments and proceeds related thereto (the "Revolver Collateral") and certain other excluded collateral as provided in the indenture and subject to certain exceptions and permitted liens. The senior secured notes and the guarantees are also secured by a second lien on the Revolver Collateral that, along with a second lien on the Notes Collateral, secure the Company's obligations under its revolving credit
90
CLEAN HARBORS, INC. AND SUBSIDIARIES
NOTES TO CONSOLIDATED FINANCIAL STATEMENTS (Continued)
(10) FINANCING ARRANGEMENTS (Continued)
facility. The senior secured notes are not guaranteed by, or secured by the assets of, the Company's foreign subsidiaries, including Eveready.
If the Company or its domestic subsidiaries sell assets under specified circumstances, the Company must offer to repurchase the senior secured notes from certain of the net proceeds of such sale at a purchase price equal to 100% of the principal amount, plus any accrued and unpaid interest, to the applicable repurchase date.
In connection with the issuance of the senior secured notes, the Company and the guarantors entered into a registration rights agreement dated August 14, 2009, with the initial purchasers of the senior secured notes. Under the terms of the registration rights agreement, the Company and the guarantors were required to file with the SEC an exchange offer registration statement and use commercially reasonable efforts to cause the exchange offer to be consummated within 180 days following the issuance of the senior secured notes, thereby enabling holders to exchange the senior secured notes for registered senior secured notes with terms substantially identical to the terms of the original senior secured notes. In accordance with the registration rights agreement, the Company completed that registered exchange offer on December 11, 2009.
Revolving Credit Facility. Under the new revolving credit facility, the Company has the right to borrow and obtain letters of credit for a combined maximum of up to $120.0 million, with a sub-limit of $110.0 million for letters of credit. Availability under the new facility is subject to a borrowing base comprised of 85% of the Company's and its U.S. subsidiaries' eligible accounts receivable and 97% of eligible cash pledged under the new facility. The new facility has a term of four years. Bank of America, N.A. ("BofA") is the administrative agent and collateral agent for the lenders and the issuing bank for letters of credit.
Borrowings under the revolving credit facility bear interest at a rate of, at the Company's option, either (i) LIBOR plus an applicable margin ranging from 3.25% to 3.75% per annum based on the then level of the Company's fixed charge coverage ratio or (ii) BofA's base rate plus an applicable margin ranging from 2.25% to 2.75% per annum based on such fixed charge coverage ratio. In addition, there is an unused line fee, calculated on the then unused portion of the lenders' $120.0 million maximum commitment, ranging from 0.50% to 0.75% per annum of the unused commitment. For outstanding letters of credit, the Company will pay to the lenders a fee equal to the then applicable LIBOR margin described above, and to BofA a standard fronting fee and customary fees and charges in connection with all amendments, extensions, draws and other actions with respect to letters of credit. At December 31, 2009, the revolving credit facility had no outstanding loans, $31.3 million available to borrow and $88.7 million of letters of credit outstanding.
The Company's obligations under the new revolving letter of credit facility (including revolving loans and reimbursement obligations for outstanding letters of credit) are guaranteed by substantially all of its U.S. subsidiaries and secured by a first lien on the Revolver Collateral and a second lien on the Notes Collateral as described above.
The credit agreement for the revolving credit facility requires the Company to maintain liquidity of not less than $50.0 million, and a consolidated fixed charge coverage ratio of not less than 1.00:1. The consolidated fixed charge coverage ratio is defined as the ratio of (a) (i) consolidated EBITDA (as defined in the credit agreement), less the sum of (ii) aggregate amount of federal, state, local and foreign income taxes paid or payable in cash, (iii) the aggregate amount of all capital expenditures
91
CLEAN HARBORS, INC. AND SUBSIDIARIES
NOTES TO CONSOLIDATED FINANCIAL STATEMENTS (Continued)
(10) FINANCING ARRANGEMENTS (Continued)
(other than those financed by certain indebtedness permitted under the credit agreement), (iv) the aggregate amount of all restricted payments, and (v) environmental expenditures, to (b) the sum of (i) consolidated interest charges to the extent paid or payable in cash, and (ii) the aggregate principal amount of all regularly scheduled principal payments paid or payable with respect to indebtedness, in each case of or by the Company and its subsidiaries for the most recently completed measurement period.
(11) HELD FOR SALE
In connection with the Company's acquisition of Eveready, the Company agreed with the Canadian Commissioner of Competition to divest Eveready's Pembina Area Landfill, located near Drayton Valley, Alberta, due to its proximity to the Company's existing landfill in the region. The Pembina Area Landfill meets the held for sale criteria and therefore the fair values of its assets and liabilities less estimated costs to sell have been recorded as held for sale in the Company's consolidated balance sheet in the Technical Services segment and the net income presented as income from discontinued operations on the consolidated statement of income at December 31, 2009. During the period from July 31 to December 31, 2009, the Pembina Area Landfill recorded $3.1 million of revenues and $2.0 million of pre-tax income which are included in the calculation of income from discontinued operations. At December 31, 2009, the components of assets and liabilities held for sale in the consolidated balance sheet were as follows (in thousands):
| |
December 31, 2009 | |||
|---|---|---|---|---|
Current assets |
$ | 1,994 | ||
Property, plant and equipment |
10,494 | |||
Permits and other intangibles |
1,073 | |||
Assets held for sale |
$ | 13,561 | ||
Current liabilities |
$ |
801 |
||
Closure and post-closure liabilities |
2,398 | |||
Liabilities held for sale |
$ | 3,199 | ||
(12) RELATED PARTY TRANSACTIONS
During the year ended December 31, 2009, the Company recorded no revenue from related party transactions, but incurred $0.7 million in cost of revenues and selling, general and administrative expenses and acquired $0.2 million of capitalized service equipment as a result of these transactions. As at December 31, 2009, outstanding amounts collectible from or owing to related parties included in accounts receivable and accounts payable and accrued liabilities were immaterial.
92
CLEAN HARBORS, INC. AND SUBSIDIARIES
NOTES TO CONSOLIDATED FINANCIAL STATEMENTS (Continued)
(13) INCOME TAXES
The domestic and foreign components of income before provision for income taxes were as follows (in thousands):
| |
For the Year Ended December 31, | |||||||||
|---|---|---|---|---|---|---|---|---|---|---|
| |
2009 | 2008 | 2007 | |||||||
Domestic |
$ | 57,763 | $ | 77,420 | $ | 71,449 | ||||
Foreign |
5,742 | 16,557 | 789 | |||||||
Total |
$ | 63,505 | $ | 93,977 | $ | 72,238 | ||||
The provision for income taxes consisted of the following:
| |
For the Year Ended December 31, | ||||||||||
|---|---|---|---|---|---|---|---|---|---|---|---|
| |
2009 | 2008 | 2007 | ||||||||
Current: |
|||||||||||
Federal |
$ | 12,059 | $ | 21,235 | $ | 22,926 | |||||
State |
3,163 | 7,432 | 7,913 | ||||||||
Foreign |
6,868 | 3,556 | 4,497 | ||||||||
|
22,090 | 32,223 | 35,336 | ||||||||
Deferred |
|||||||||||
Federal |
4,965 | 3,178 | (5,002 | ) | |||||||
State |
968 | (1,231 | ) | (1,001 | ) | ||||||
Foreign |
(1,204 | ) | 2,321 | (1,293 | ) | ||||||
|
4,729 | 4,268 | (7,296 | ) | |||||||
Net provision for income taxes |
$ | 26,819 | $ | 36,491 | $ | 28,040 | |||||
The effective income tax rate varied from the amount computed using the statutory federal income tax rate as follows:
| |
For the Year Ended December 31, | |||||||||
|---|---|---|---|---|---|---|---|---|---|---|
| |
2009 | 2008 | 2007 | |||||||
Tax expense at statutory rate |
$ | 22,227 | $ | 32,892 | $ | 25,259 | ||||
State income taxes, net of federal benefit |
2,067 | 3,760 | 3,323 | |||||||
Foreign rate differential |
(4,213 | ) | (4,533 | ) | (4,440 | ) | ||||
Change in federal valuation allowance |
— | — | (765 | ) | ||||||
Non-deductible transaction costs |
1,921 | |||||||||
Other |
1,335 | 277 | (499 | ) | ||||||
Uncertain tax position interest and penalties, net of benefit |
3,482 | 4,095 | 5,487 | |||||||
Tax credits, net |
— | — | (325 | ) | ||||||
Net provision for income taxes |
$ | 26,819 | $ | 36,491 | $ | 28,040 | ||||
93
CLEAN HARBORS, INC. AND SUBSIDIARIES
NOTES TO CONSOLIDATED FINANCIAL STATEMENTS (Continued)
(13) INCOME TAXES (Continued)
The components of the total net deferred tax assets and liabilities at December 31, 2009 and 2008 were as follows (in thousands):
| |
2009 | 2008 | ||||||
|---|---|---|---|---|---|---|---|---|
Deferred tax assets: |
||||||||
Workers compensation accrual |
$ | 3,903 | $ | 3,543 | ||||
Provision for doubtful accounts |
4,536 | 2,570 | ||||||
Closure, post-closure and remedial liabilities |
39,660 | 39,769 | ||||||
Accrued expenses |
11,226 | 9,098 | ||||||
Accrued compensation |
1,630 | 1,678 | ||||||
Net operating loss carryforwards(1) |
2,750 | 2,161 | ||||||
Tax credit carryforwards(2) |
14,120 | 13,656 | ||||||
Uncertain tax positions accrued interest and federal benefit |
9,524 | 8,132 | ||||||
Other |
3,952 | 1,380 | ||||||
Total deferred tax asset |
91,301 | 81,987 | ||||||
Deferred tax liabilities: |
||||||||
Property, plant and equipment |
(53,174 | ) | (39,162 | ) | ||||
Permits and customer databases |
(19,263 | ) | (13,996 | ) | ||||
Total deferred tax liability |
(72,437 | ) | (53,158 | ) | ||||
Total net deferred tax asset before valuation allowance |
18,864 | 28,829 | ||||||
Less valuation allowance |
(11,242 | ) | (10,811 | ) | ||||
Net deferred tax asset |
$ | 7,622 | $ | 18,018 | ||||
- (1)
- As
of December 31, 2009, the net operating loss carryforwards included (i) state net operating loss carryovers of $1.0 million which
begin to expire in 2019, (ii) Canadian net operating losses of $1.7 million which begin to expire in 2025 and (iii) other foreign net operating losses of $0.1 million which begin
to expire in 2013.
- (2)
- As of December 31, 2009, foreign tax credit carryforwards of $14.1 million expire between 2012 and 2019.
During 2009, the Company decreased taxes payable for adjustments related to realized and recognized tax benefits of $1.1 million related to exercises of non-qualified stock options of which $0.5 million resulted in an increase to paid-in capital.
The Company does not accrue U.S. tax for foreign earnings that it considers to be permanently reinvested outside the United States. Consequently, the Company has not provided any U.S. tax on the unremitted earnings of its foreign subsidiaries. As of December 31, 2009 and 2008, the amount of earnings for which no repatriation tax has been provided was $46.8 million and $29.5 million, respectively. It is not practicable to estimate the amount of additional tax that might be payable on those earnings if distributed.
As of December 31, 2009, the Company has a remaining valuation allowance of approximately $11.2 million related to foreign tax credits, certain state net operating loss carryforwards and foreign net operating loss carryforwards. The Company believes that it is not more likely than not that such amounts will be utilized.
94
CLEAN HARBORS, INC. AND SUBSIDIARIES
NOTES TO CONSOLIDATED FINANCIAL STATEMENTS (Continued)
(13) INCOME TAXES (Continued)
Included in the balance of tax contingencies for uncertain tax positions at December 31, 2009 and 2008 was $66.3 million and $49.1 million, respectively, of unrecognized tax benefits (including interest and penalties) that, if recognized, would affect the annual effective income tax rate.
The Company's policy is to recognize interest and penalties related to income tax matters as a component of income tax expense. The liability for unrecognized tax benefits at December 31, 2009 included accrued interest and penalties of $21.9 million and $6.1 million, respectively. Tax expense for the year ended December 31, 2009 included interest and penalties of $4.7 million.
The changes to unrecognized tax benefits from January 1, 2008 through December 31, 2009, were as follows (in thousands):
| |
2009 | 2008 | 2007 | Description | |||||||
|---|---|---|---|---|---|---|---|---|---|---|---|
Unrecognized tax benefits as of January 1 |
$ | 46,480 | $ | 50,071 | $ | 48,076 | Additional Canadian federal liability for 2009 and additional state liabilities for 2008 and 2007 |
||||
Gross increases in tax positions in prior periods |
124 | 423 | 77 | Additional state liability | |||||||
Gross increases during the current period |
— | 355 | 61 | ||||||||
Settlements |
— | — | (260 | ) | |||||||
Lapse of statute of limitations |
— | (1,748 | ) | — | |||||||
Foreign currency translation |
1,574 | (2,621 | ) | 2,117 | Functional currency is Canadian dollars—booked to currency translation adjustment |
||||||
Unrecognized tax benefits as of December 31 |
$ | 48,178 | $ | 46,480 | $ | 50,071 | |||||
As of December 31, 2009, the Company had recorded $76.2 million of liabilities for unrecognized tax benefits of which $28.0 million related to interest and penalties.
The Company files U.S. federal income tax returns as well as income tax returns in various states and foreign jurisdictions. The Company may be subject to examination by the Internal Revenue Service (the "IRS") for calendar years 2003 through 2008. Additionally, any net operating losses that were generated in prior years and utilized in these years may also be subject to examination by the IRS. The Company may also be subject to examinations by state and local revenue authorities for calendar years 2002 through 2008. The Company is currently not under examination by the IRS. The Company has ongoing state and local jurisdictional audits, which the Company believes will not result in material liabilities. One foreign jurisdiction conducted an audit in 2008 for calendar years 2003 through 2006, which was concluded with no material assessment.
Due to expiring statutes in Canada, the Company anticipates that total unrecognized tax benefits, other than adjustments for additional accruals for interest and penalties and foreign currency translation, will decrease by approximately $12.9 million within the next twelve months. The $12.9 million includes interest and penalties of $5.1 million and is related to a business combination in Canada and will be recorded in earnings and therefore will impact the effective income tax rate.
95
CLEAN HARBORS, INC. AND SUBSIDIARIES
NOTES TO CONSOLIDATED FINANCIAL STATEMENTS (Continued)
(13) INCOME TAXES (Continued)
Due to expiring state and local statutes in the United States, the Company anticipates that total unrecognized tax benefits, other than adjustments for additional accruals for interest and penalties, will decrease by approximately $1.3 million within the next twelve months. The $1.3 million includes interest and penalties of $0.4 million and is related to various state and local jurisdictional tax laws and will be recorded in earnings and therefore will impact the effective income tax rate.
(14) EARNINGS PER SHARE
The following is a reconciliation of basic and diluted earnings per share computations (in thousands except for per share amounts):
| |
Years Ended December 31, | ||||||||||
|---|---|---|---|---|---|---|---|---|---|---|---|
| |
2009 | 2008 | 2007 | ||||||||
Numerator for basic and diluted earnings per share: |
|||||||||||
Income from continuing operations attributable to common stockholders |
$ | 35,247 | $ | 57,486 | $ | 43,992 | |||||
Income from discontinued operations, net of tax |
1,439 | — | — | ||||||||
Net income attributable to common stockholders |
$ | 36,686 | $ | 57,486 | $ | 43,992 | |||||
Denominator: |
|||||||||||
Basic shares outstanding |
24,817 | 22,465 | 19,827 | ||||||||
Dilutive effect of equity-based compensation awards and warrants |
116 | 401 | 803 | ||||||||
Dilutive shares outstanding |
24,933 | 22,866 | 20,630 | ||||||||
Basic earnings per share |
|||||||||||
Income from continuing operations attributable to common stockholders |
$ | 1.42 | $ | 2.56 | $ | 2.22 | |||||
Income from discontinued operations, net of tax |
0.06 | — | — | ||||||||
Net income attributable to common stockholders |
$ | 1.48 | $ | 2.56 | $ | 2.22 | |||||
Diluted earnings per share |
|||||||||||
Income from continuing operations attributable to common stockholders |
$ | 1.41 | $ | 2.51 | $ | 2.14 | |||||
Income from discontinued operations, net of tax |
0.06 | — | — | ||||||||
Net income attributable to common stockholders |
$ | 1.47 | $ | 2.51 | $ | 2.14 | |||||
For each of the years ended December 31, 2009, 2008 and 2007, the dilutive effect of all then outstanding warrants, options, restricted stock and Series B preferred stock is included in the above calculations. For the year ended December 31, 2009 the above calculation excluded the dilutive effects of 66 thousand outstanding performance stock awards for which the performance criteria were not attained at that time, 18 thousand stock options that were not then in-the-money, and 23 thousand unvested shares then held in the employee participation plan trust as described in Note 16, "Stock-Based Compensation and Employee Participation Plan." For each of the years ended December 31, 2008 and 2007, the dilutive effects of 85 thousand and 48 thousand outstanding performance stock
96
CLEAN HARBORS, INC. AND SUBSIDIARIES
NOTES TO CONSOLIDATED FINANCIAL STATEMENTS (Continued)
(14) EARNINGS PER SHARE (Continued)
awards, respectively, were excluded from the above calculation as the performance criteria were not attained at that time.
(15) STOCKHOLDERS' EQUITY
(a) Warrants
On June 30, 2004, the Company issued warrants to purchase 2.8 million shares of the Company's common stock. The warrants provided for an exercise price of $8.00 per common share and an expiration date of September 10, 2009. Warrants activity from January 1, 2007 through December 31, 2008 was as follows:
| |
2008 | 2007 | |||||
|---|---|---|---|---|---|---|---|
Outstanding at January 1, |
348,690 | 498,690 | |||||
Exercised |
(348,690 | ) | (150,000 | ) | |||
Outstanding at December 31, |
— | 348,690 | |||||
(b) Series B Preferred Stock
On February 16, 1993, the Company issued 112,000 shares of Series B convertible preferred stock for the acquisition of its Spring Grove facility. The liquidation value of each share of Series B preferred stock was the liquidation preference of $50.00 plus unpaid dividends. On December 28, 2007, the Company issued an aggregate of 209,200 shares of the Company's common stock upon the conversion (at the holders' elections) of the remaining previously outstanding 68,810 shares of Series B preferred stock.
Prior to the conversion, each share of Series B preferred stock entitled its holder to receive a cumulative annual cash dividend of $4.00 per share, or at the election of the Company, a common stock dividend of equivalent value. Dividends were payable on the 15th day of January, April, July and October, at the rate of $1.00 per share, per quarter. During the year ended December 31, 2007, all dividends on the Series B preferred stock were paid in cash.
(c) Common Stock
As described in Note 3, "Business Combinations," the Company acquired Eveready on July 31, 2009 and, as a portion of the consideration, the Company issued to the former Eveready shareholders $118.4 million of the Company's common stock consisting of 2.4 million shares valued at $49.50 per Clean Harbors share (the closing price on the New York Stock Exchange on the day prior to the acquisition).
On April 29, 2008, the Company issued 2.875 million shares of common stock, including 375,000 shares of common stock issued upon exercise of an underwriters' option, at a public offering price of $63.75 per share. After deducting the underwriter discount and offering expenses, the Company received net proceeds of $173.5 million from the issuance.
97
CLEAN HARBORS, INC. AND SUBSIDIARIES
NOTES TO CONSOLIDATED FINANCIAL STATEMENTS (Continued)
(16) STOCK-BASED COMPENSATION AND EMPLOYEE PARTICIPATION PLAN
In 1992 the Company adopted an equity incentive plan (the "1992 Plan"), which provides for a variety of incentive awards, including stock options, and in 2000, the Company adopted a stock incentive plan (the "2000 Plan"), which provides for awards in the form of incentive stock options, non-qualified stock options, restricted stock awards, performance stock awards and common stock awards. The 2000 Plan allows up to 2.0 million shares to be awarded. As of December 31, 2009 and 2008 the Company had the following types of stock-based compensation awards outstanding under these plans: stock options, restricted stock awards and performance stock awards. The stock options generally become exercisable up to five years from the date of grant, subject to certain employment requirements, and terminate ten years from the date of grant. The restricted stock awards vest over five years subject to continued employment. The performance stock awards vest depending on the satisfaction of certain performance criteria as described below.
As of December 31, 2009 the Company had reserved 410,902 shares of common stock available for grant under the 2000 Plan, exclusive of shares previously issued (either upon exercise of stock options or pursuant to restricted stock, performance stock or common stock awards) or reserved for options previously granted under the 2000 Plan. The 1992 Plan expired on March 15, 2002, but there were outstanding on December 31, 2009 options for an aggregate of 22,550 shares, which shall remain in effect until such options are either exercised or expire in accordance with their terms.
Total stock-based compensation cost charged to income from operations for the years ended December 31, 2009, 2008 and 2007 was $1.0 million, $3.6 million and $4.8 million, respectively. The total income tax benefit recognized in the consolidated statements of income from stock-based compensation was $0.4 million, $1.3 million and $1.8 million for the years ended December 31, 2009, 2008 and 2007, respectively.
Stock Option Awards
The Company uses the Black-Scholes option pricing model to value the compensation expense associated with its stock option awards based on the assumptions in the following table. In addition, the Company estimates forfeitures when recognizing compensation expense, and adjusts its estimate of forfeitures over the requisite service period based on the extent to which actual forfeitures differ, or are expected to differ, from such estimates. Changes in estimated forfeitures are recognized through a cumulative catch-up adjustment in the period of change and also impact the amount of compensation expense to be recognized in future periods. The expected forfeiture rates used to calculated compensation expense were 5% for non-executive employees and 3% for executives and directors.
The Company ceased issuing stock options awards in May 2008. The following weighted-average assumptions were used in calculating the grant date fair value of stock options awards issued during the years ended December 31, 2008 and 2007:
| |
2008 | 2007 | ||
|---|---|---|---|---|
Expected volatility |
40.81% | 80.02%-81.36% | ||
Risk-free interest rate |
2.31%-3.10% | 4.58%-4.98% | ||
Expected life (years) |
3.3 | 2.9 | ||
Dividend yield |
none | none |
98
CLEAN HARBORS, INC. AND SUBSIDIARIES
NOTES TO CONSOLIDATED FINANCIAL STATEMENTS (Continued)
(16) STOCK-BASED COMPENSATION AND EMPLOYEE PARTICIPATION PLAN (Continued)
Expected volatility is based on the historical volatility of the Company's common stock over the period commensurate with the expected life of the stock option shares. The risk-free rate for the stock options is the average yield rate of the 3- and 5-year term on the U.S. Treasury Constant Maturities at the inception of each quarterly stock option period. The expected life of the stock options shares is 3.3 years based on using the simplified method as described in Staff Accounting Bulletin No. 110. Due to the Company changing the nature of the awards granted beginning in 2006 from stock options to restricted stock awards and performance stock awards, the historical data does not provide a reasonable basis upon which to estimate expected term and therefore the Company continues to calculate the expected life by using the simplified method. The dividend yield of zero is based on the fact that the Company has never paid cash dividends and has no present intention to pay cash dividends.
The following table summarizes activity under the Plans relating to stock options:
Stock Options
|
Number of Shares |
Weighted Average Exercise Price |
Weighted Average Remaining Contractual Term (in years) |
Aggregate Intrinsic Value as of 12/31/09 (in thousands) |
||||||||||
|---|---|---|---|---|---|---|---|---|---|---|---|---|---|---|
Outstanding at January 1, 2009 |
219,943 | $ | 20.45 | |||||||||||
Forfeited |
(3,500 | ) | 2.50 | |||||||||||
Exercised |
(29,169 | ) | 14.73 | |||||||||||
Outstanding at December 31, 2009 |
187,274 | $ | 21.68 | 3.21 | $ | 7,221 | ||||||||
Vested and expected to vest |
187,111 | $ | 21.65 | 3.20 | $ | 7,219 | ||||||||
Exercisable at December 31, 2009 |
178,274 | $ | 20.23 | 3.00 | $ | 7,100 | ||||||||
The weighted-average grant date fair values of option grants for the years ended December 31, 2008 and 2007 were $20.78, and $26.13, respectively. As of December 31, 2009, there was $0.1 million of total unrecognized compensation cost arising from non-vested compensation related to stock option awards under the Company's stock incentive plans. This cost is expected to be recognized over a weighted-average period of four months. The total intrinsic value of options exercised during 2009, 2008 and 2007 was $1.2 million, $9.6 million, and $6.8 million, respectively.
Restricted Stock Awards
The following information relates to restricted stock awards that have been granted to employees and directors under the Company's stock incentive plans. The restricted stock awards are not transferable until vested and the restrictions lapse upon the achievement of continued employment or service as a director over a five-year time period.
The fair value of each restricted stock grant is based on the closing price of the Company's stock on the date of grant and is amortized to expense over its vesting period. The expected forfeiture rates used to calculated compensation expense were 5% for non-executive employees and 3% for executives and directors.
99
CLEAN HARBORS, INC. AND SUBSIDIARIES
NOTES TO CONSOLIDATED FINANCIAL STATEMENTS (Continued)
(16) STOCK-BASED COMPENSATION AND EMPLOYEE PARTICIPATION PLAN (Continued)
The following table summarizes information about restricted stock awards for the year ended December 31, 2009:
Restricted Stock
|
Number of Shares |
Weighted Average Grant-Date Fair Value |
|||||
|---|---|---|---|---|---|---|---|
Unvested at January 1, 2009 |
19,251 | $ | 34.61 | ||||
Granted |
46,100 | 54.71 | |||||
Vested |
(12,023 | ) | 37.86 | ||||
Forfeited |
(1,171 | ) | 46.97 | ||||
Unvested at December 31, 2009 |
52,157 | $ | 51.35 | ||||
As of December 31, 2009, there was $2.1 million of total unrecognized compensation cost arising from restricted stock awards under the Company's stock incentive plans. This cost is expected to be recognized over a weighted-average period of 4.5 years. The total fair value of restricted stock vested during 2009, 2008 and 2007 was $0.7 million, $0.6 million and $0.4 million, respectively.
Performance Stock Awards
The following information relates to performance stock awards that have been granted to employees under the Company's stock incentive plans. Generally, performance stock awards are subject to performance criteria such as predetermined revenue and EBITDA margin for a specified period of time. The vesting of the performance stock awards is based on achieving such targets and also includes continued service conditions.
The fair value of each performance stock award is based on the closing price of the Company's stock on the date of grant and is amortized to expense over the service period if achievement of performance measures is then considered probable. The expected forfeiture rates used to calculated compensation expense were 5% for employees and 3% for executives and directors.
In regards to the performance stock awards granted in 2008, management previously believed that the performance targets would be achieved and therefore recorded compensation expense during fiscal 2008 and during the first quarter of 2009. As of June 30, 2009, based on the year-to-date results of operations, management determined that it was then not probable that the performance targets would be achieved, and therefore the cumulative expense recorded through March 31, 2009 of $1.7 million was reversed through sales, general and administrative expenses. As of December 31, 2009, the performance targets related to the 2008 performance stock awards were not met and therefore the performance stock awards granted in 2008 were forfeited. In regards to the performance stock awards granted in 2009, as of December 31, 2009, management continued to believe that it was not then probable that the performance targets would be achieved and therefore recorded no compensation expense for the year ended December 31, 2009.
100
CLEAN HARBORS, INC. AND SUBSIDIARIES
NOTES TO CONSOLIDATED FINANCIAL STATEMENTS (Continued)
(16) STOCK-BASED COMPENSATION AND EMPLOYEE PARTICIPATION PLAN (Continued)
The following table summarizes information about performance stock awards for the year ended December 31, 2009:
Performance Stock
|
Number of Shares |
Weighted Average Grant-Date Fair Value |
|||||
|---|---|---|---|---|---|---|---|
Unvested at January 1, 2009 |
119,216 | $ | 62.08 | ||||
Granted |
68,251 | 45.76 | |||||
Vested |
(18,321 | ) | 51.90 | ||||
Forfeited |
(88,339 | ) | 65.48 | ||||
Unvested at December 31, 2009 |
80,807 | $ | 46.88 | ||||
As of December 31, 2009, there was $0.2 million of total unrecognized compensation cost arising from non-vested compensation related to performance stock awards probable of vesting under the Company's stock incentive plans that will be recognized over the next two years. The total fair value of performance awards vested during 2009, 2008 and 2007 was $1.1 million, $0.8 million and $1.7 million, respectively.
Employee Stock Purchase Plan
In May of 1995, the Company's stockholders approved an Employee Stock Purchase Plan (the "ESPP"), which is a qualified employee stock purchase plan under Section 423 of the Internal Revenue Code of 1986, as amended, through which employees of the Company are given the opportunity to purchase shares of common stock. Under the ESPP, a total of one million shares of common stock were originally reserved for offering to employees, in quarterly offerings of 50,000 shares each plus any shares not issued in any previous quarter, commencing on July 1, 1995 and on the first day of each quarter thereafter. In 2005, the Company's stockholders approved an increase of 500,000 in the maximum number of shares which can be issued under the ESPP. As of December 31, 2009, the Company had reserved 429,177 shares of common stock available for purchase under the ESPP. Employees who elect to participate in an offering may utilize up to 10% of their payroll for the purchase of common stock at 85% of the closing price of the stock on the first day of such quarterly offering or, if lower, 85% of the closing price on the last day of the offering. Due to the discount of 15% offered to employees for purchase of shares under the ESPP, the Company considers such plan as compensatory. The weighted average per share fair values of the purchase rights granted under the ESPP during the years ended December 31, 2009 and 2008 was $9.82 and $11.69, respectively.
Common Stock Awards
In the years ended December 31, 2009 and 2008, the Company issued 2,400 shares and 2,900 shares of common stock at a weighted average grant-date fair value of $52.66 and $66.10, respectively, under the Company's 2000 Plan which vested immediately.
Employee Participation Plan
Prior to the Company's acquisition of Eveready on July 31, 2009, Eveready's predecessor had established an employee participation plan (the "Plan") under which employees were offered an opportunity to purchase at the then market price up to a specified number of the predecessor's units
101
CLEAN HARBORS, INC. AND SUBSIDIARIES
NOTES TO CONSOLIDATED FINANCIAL STATEMENTS (Continued)
(16) STOCK-BASED COMPENSATION AND EMPLOYEE PARTICIPATION PLAN (Continued)
("Purchased Units") from the predecessor's treasury. For each employee who elected to participate (a "Participant"), Eveready's predecessor matched the Purchased Units with an equal number of units ("Matching Units") purchased on the open market and deposited the Matching Units into a trust (the "Trust"), with 20% of the Matching Units vesting each December 31 from 2007 through 2011 provided the Participant remained employed by Eveready's predecessor at the vesting date. Participants had the option to finance the Purchased Units with a loan from Bank of Montreal (a "BMO loan"), which carries an annual interest rate of LIBOR plus 0.5% for a term of 10 years with payment commencing in year six, secured by both the Purchased and the Matching Units. Upon the conversion of Eveready's predecessor into Eveready effective December 31, 2008, the Purchased Units held by Participants and Matching Units held by the Trust were converted (on the same ratio as other outstanding units) into Eveready common shares.
When the Company acquired Eveready on July 31, 2009, the Eveready common shares held both by Participants and by the Trust were converted into cash and shares of the Company's common stock on the same terms as other outstanding Eveready common shares. The Matching Units converted into 23 thousand shares of the Company's common stock and will continue to be held in the Trust and vest according to the original vesting schedule. The Company has agreed with its employees who were Participants in the Plan to pay a cash bonus (a "Shortfall Bonus") to each such employee who remains employed by the Company on December 31, 2011 (or whose employment was involuntarily terminated by the Company in connection with the acquisition) to the extent (if any) that on December 31, 2011 there is a shortfall between (i) the amount which such employee originally paid for Purchased Units and (ii) the aggregate of (x) the market value on December 31, 2011 (but not less than $48.00 per Company share) of the Company's shares derived from the Purchased Units and Matching Units held by such employee and (y) the cash portion of the acquisition consideration received for such employee's Eveready shares as described above. To the extent that any such employee has an outstanding BMO loan balance on December 31, 2011, the amount of any such Shortfall Bonus (net of withholding taxes) shall first be applied against such outstanding loan balance, with the remainder (if any) of such net bonus paid to the employee. Based on the market value of $59.61 per share of the Company's common stock on December 31, 2009, the maximum amount of such Shortfall Bonus was $3.0 million on December 31, 2009.
The Company classifies the Plan as an equity award and compensation expense of $0.3 million was recognized for the year ended December 31, 2009. The potential Shortfall Bonus is classified as a liability award and measured based on the award's fair value at each reporting date until the date of settlement. The fair value of the Shortfall Bonus is determined to be the difference between (i) the Participants' original investment in the Plan and (ii) the aggregate of the market value (but not less than $48.00 per Company share) of the Company's shares derived from both Purchased Units and Matching Units and the cash portion of the acquisition consideration received, adjusted for the portion of requisite service that has been rendered as of the measurement date. Compensation cost for the period is based on the change or a portion of the change, depending on the percentage of the requisite service that has been rendered at the reporting date, in the fair value of the potential Shortfall Bonus. Compensation cost relating to the potential Shortfall Bonus for the year ended December 31, 2009 was $0.3 million.
On December 31, 2009, 9,075 shares vested and during 2009, 14,400 shares were forfeited and continued to be held by the trust. As of December 31, 2009, there was $0.8 million of total
102
CLEAN HARBORS, INC. AND SUBSIDIARIES
NOTES TO CONSOLIDATED FINANCIAL STATEMENTS (Continued)
(16) STOCK-BASED COMPENSATION AND EMPLOYEE PARTICIPATION PLAN (Continued)
unrecognized compensation cost arising from the remaining unvested shares in the Plan. This cost is expected to be recognized over a weighted average period of 1.5 years.
(17) EMPLOYEE BENEFIT PLANS
The Company has responsibility for a defined benefit plan that covers 25 active non-supervisory Canadian employees. The Company accounts for the defined benefit plan in accordance with ASC 962, Defined Contribution Pension Plans ("ASC 962"), which required separate recognition of the over funded or under funded status of the pension plan as an asset or liability. The funded status is measured as the difference between the fair value of plan assets and the projected benefit obligations to current and retired employees.
The following table presents the net periodic pension cost for the years ended December 31, (in thousands):
| |
2009 | 2008 | 2007 | |||||||
|---|---|---|---|---|---|---|---|---|---|---|
Service cost |
$ | 115 | $ | 199 | $ | 176 | ||||
Interest cost |
416 | 374 | 359 | |||||||
Expected return on fair value of assets |
(368 | ) | (459 | ) | (441 | ) | ||||
Actuarial loss |
78 | 11 | — | |||||||
Net periodic pension cost |
$ | 241 | $ | 125 | $ | 94 | ||||
Weighted average assumptions used to determine pension benefit obligations at year end and net pension cost for the following years were as follows:
| |
2009 | 2008 | 2007 | |||||||
|---|---|---|---|---|---|---|---|---|---|---|
Discount rate |
5.75 | % | 6.30 | % | 5.18 | % | ||||
Expected return on fair value of assets |
6.75 | % | 6.75 | % | 7.00 | % | ||||
Rate of compensation increase |
3.25 | % | 2.75 | % | 3.21 | % | ||||
The long-term rate-of-return-on-assets assumption was determined using a building-block method, which integrates historical inflation, real risk-free rates and risk premiums for the different asset categories forming the plan fund. A weighted average of the above result and the historical return of the plan's fund is then calculated. The current asset mix is assumed to remain constant and a 0.7% adjustment for investment and custodial fees was taken into account. Unless the result so obtained is significantly different from the previous year assumption, the long-term rate-of-return-on-assets assumption remains unchanged.
The accumulated benefit obligation was $6.8 million and $6.1 million at December 31, 2009 and 2008, respectively.
103
CLEAN HARBORS, INC. AND SUBSIDIARIES
NOTES TO CONSOLIDATED FINANCIAL STATEMENTS (Continued)
(17) EMPLOYEE BENEFIT PLANS (Continued)
The following table sets forth the changes in benefit obligations, plan assets and the net pension liability accrued on the Company's consolidated balance sheets at December 31, (in thousands):
| |
2009 | 2008 | |||||
|---|---|---|---|---|---|---|---|
Change in benefit obligations: |
|||||||
Benefit obligation at the beginning of year |
$ | 6,324 | $ | 7,783 | |||
Service cost |
115 | 199 | |||||
Interest cost |
416 | 374 | |||||
Employee contributions |
29 | 44 | |||||
Actuarial loss |
(238 | ) | (314 | ) | |||
Benefits paid |
(557 | ) | (256 | ) | |||
Currency translation |
1,049 | (1,506 | ) | ||||
Benefit obligation at end of year |
$ | 7,138 | $ | 6,324 | |||
| |
2009 | 2008 | |||||
|---|---|---|---|---|---|---|---|
Change in plan assets: |
|||||||
Fair value of plan assets at beginning of year |
$ | 5,122 | $ | 6,883 | |||
Actual return on plan assets |
776 | (843 | ) | ||||
Employer contributions |
392 | 555 | |||||
Employee contributions |
29 | 44 | |||||
Benefits paid |
(556 | ) | (256 | ) | |||
Currency translation |
920 | (1,261 | ) | ||||
Fair value of plan assets at end of year |
$ | 6,683 | $ | 5,122 | |||
| |
2009 | 2008 | |||||
|---|---|---|---|---|---|---|---|
Unfunded pension liability (included in other long-term liabilities) |
$ | (456 | ) | $ | (1,202 | ) | |
The Company's pension assets measured at fair value by asset class at December 31, 2009 and 2008 were as follows (in thousands):
| |
Quoted Prices in Active Markets for Identical Assets (Level 1) |
Significant Observable Inputs (Level 2) |
Significant Unobservable Inputs (Level 3) |
Balance at December 31, 2009 |
|||||||||
|---|---|---|---|---|---|---|---|---|---|---|---|---|---|
Canadian equities |
$ | 2,072 | $ | — | $ | — | $ | 2,072 | |||||
Canadian corporate and other bonds |
— | 1,871 | — | 1,871 | |||||||||
United States equities |
1,002 | — | — | 1,002 | |||||||||
International equities |
869 | — | — | 869 | |||||||||
Canadian government bonds |
535 | — | — | 535 | |||||||||
Cash and cash equivalents |
334 | — | — | 334 | |||||||||
Total |
$ | 4,812 | $ | 1,871 | $ | — | $ | 6,683 | |||||
104
CLEAN HARBORS, INC. AND SUBSIDIARIES
NOTES TO CONSOLIDATED FINANCIAL STATEMENTS (Continued)
(17) EMPLOYEE BENEFIT PLANS (Continued)
| |
Quoted Prices in Active Markets for Identical Assets (Level 1) |
Significant Observable Inputs (Level 2) |
Significant Unobservable Inputs (Level 3) |
Balance at December 31, 2008 |
|||||||||
|---|---|---|---|---|---|---|---|---|---|---|---|---|---|
Canadian equities |
$ | 1,537 | $ | — | $ | — | $ | 1,537 | |||||
Canadian corporate and other bonds |
— | 1,537 | — | 1,537 | |||||||||
United States equities |
614 | — | — | 614 | |||||||||
Non-North American equities |
666 | — | — | 666 | |||||||||
Canadian government bonds |
461 | — | — | 461 | |||||||||
Cash and cash equivalents |
307 | — | — | 307 | |||||||||
Total |
$ | 3,585 | $ | 1,537 | $ | — | $ | 5,122 | |||||
Components of net periodic benefit cost and other amounts recognized in other comprehensive income were as follows at December 31, (in thousands):
| |
2009 | 2008 | 2007 | |||||||
|---|---|---|---|---|---|---|---|---|---|---|
Net (gain) loss |
$ | (701 | ) | $ | 858 | $ | 354 | |||
Amortization of net loss |
(85 | ) | (10 | ) | — | |||||
Total recognized in other comprehensive income |
$ | (786 | ) | $ | 848 | $ | 354 | |||
Amounts recognized in accumulated other comprehensive income during the years ended December 31, 2009, 2008 and 2007 were $1.1 million, $1.6 million and $0.9 million, respectively.
The estimated net loss that will be amortized from accumulated other comprehensive income into net periodic benefit cost over the next fiscal year is $31 thousand.
The Company's investment policy targets a 20% to 70% allocation to equity securities, a 30% to 50% allocation to debt securities, and a 0% to 20% allocation to cash. The asset mix is frequently reviewed by the fund manager by examining the domestic and international macroeconomic factors and relative valuation levels of equity versus fixed income markets as well as internal forecasts of interest rate trends. The objective is to add value through longer-term asset mix positioning rather than short-term trading. The portfolio's volatility is kept to a minimum by implementing only incremental asset mix changes. It is believed that this investment policy fits the long-term nature of pension obligations.
The Company's weighted average asset allocations at December 31, 2009 and 2008 were as follows:
| |
2009 | 2008 | |||||
|---|---|---|---|---|---|---|---|
Canadian equities |
31 | % | 30 | % | |||
Canadian corporate bonds |
28 | % | 30 | % | |||
United States equities |
15 | % | 12 | % | |||
International equities |
13 | % | 13 | % | |||
Canadian government bonds |
8 | % | 9 | % | |||
Cash and cash equivalents |
5 | % | 6 | % | |||
Total |
100 | % | 100 | % | |||
105
CLEAN HARBORS, INC. AND SUBSIDIARIES
NOTES TO CONSOLIDATED FINANCIAL STATEMENTS (Continued)
(17) EMPLOYEE BENEFIT PLANS (Continued)
The Company expects to contribute $387 thousand to this pension plan in 2010.
Benefit payments including those amounts to be paid out of corporate assets and reflecting future expected service as appropriate, are expected to be paid as follows (in thousands):
Year
|
Expected benefit payments |
|||
|---|---|---|---|---|
2010 |
$ | 259 | ||
2011 |
259 | |||
2012 |
296 | |||
2013 |
296 | |||
2014 |
348 | |||
2015-2019 |
2,096 | |||
The Company has a profit-sharing plan under Section 401(k) of the Internal Revenue Code covering substantially all U.S. employees. The plan allows employees to make contributions up to a specified percentage of their compensation. The Company makes discretionary partial matching contributions established annually by the Board of Directors. The Company expensed $1.0 million, expensed $1.0 million, and recognized income of $0.8 million for the years ended December 31, 2009, 2008, and 2007, respectively.
(18) COMMITMENTS AND CONTINGENCIES
Legal and Administrative Proceedings
The Company's waste management services are regulated by federal, state, provincial and local laws enacted to regulate discharge of materials into the environment, remediation of contaminated soil and groundwater or otherwise protect the environment. This ongoing regulation results in the Company frequently becoming a party to legal or administrative proceedings involving all levels of governmental authorities and other interested parties. The issues involved in such proceedings generally relate to applications for permits and licenses by the Company and conformity with legal requirements, alleged violations of existing permits and licenses, or alleged responsibility arising under federal or state Superfund laws to remediate contamination at properties owned either by the Company or by other parties ("third party sites") to which either the Company or prior owners of certain of the Company's facilities shipped wastes.
At December 31, 2009, the Company had recorded $28.8 million of reserves in the Company's financial statements for actual or potential liabilities related to the legal and administrative proceedings in which the Company was then involved, the principal of which are described below, and the Company believes that it is reasonably possible that the amount of such potential liabilities could be as much as $4.7 million more. The Company periodically adjusts the aggregate amount of such reserves when such actual or potential liabilities are paid or otherwise discharged, new claims arise, or additional relevant information about existing or potential claims becomes available. Primarily all of such reasonably possible additional liability amounts resulting from the legal or administrative proceedings discussed below relate to remedial liabilities and they are therefore included in the reasonably possible additional liability amounts in the tables under the column heading "Remedial Liabilities (Including Superfund Liabilities) for Non-Landfill Operations" in Note 9, "Remedial Liabilities."
106
CLEAN HARBORS, INC. AND SUBSIDIARIES
NOTES TO CONSOLIDATED FINANCIAL STATEMENTS (Continued)
(18) COMMITMENTS AND CONTINGENCIES (Continued)
As of December 31, 2009, the principal legal and administrative proceedings in which the Company was involved, or which had been terminated during 2009, were as follows:
Ville Mercier. In September 2002, the Company acquired the stock of a subsidiary (the "Mercier Subsidiary") which owns a hazardous waste incinerator in Ville Mercier, Quebec (the "Mercier Facility"). The property adjacent to the Mercier Facility, which is also owned by the Mercier Subsidiary, is now contaminated as a result of actions dating back to 1968, when the Government of Quebec issued to a company unrelated to the Mercier Subsidiary two permits to dump organic liquids into lagoons on the property. By 1972, groundwater contamination had been identified, and the Quebec government provided an alternate water supply to the municipality of Ville Mercier.
In 1999, Ville Mercier and three neighboring municipalities filed separate legal proceedings against the Mercier Subsidiary and the Government of Quebec. The lawsuits assert that the defendants are jointly and severally responsible for the contamination of groundwater in the region, which they claim caused each municipality to incur additional costs to supply drinking water for their citizens since the 1970's and early 1980's. The four municipalities claim a total of $1.6 million (CDN) as damages for additional costs to obtain drinking water supplies and seek an injunctive order to obligate the defendants to remediate the groundwater in the region. The Quebec Government also sued the Mercier Subsidiary to recover approximately $17.4 million (CDN) of alleged past costs for constructing and operating a treatment system and providing alternative drinking water supplies.
On September 26, 2007, the Quebec Minister of Sustainable Development, Environment and Parks issued a Notice pursuant to Section 115.1 of the Environment Quality Act, superseding Notices issued in 1992, which are the subject of the pending litigation. The more recent Notice notifies the Mercier Subsidiary that, if the Mercier Subsidiary does not take certain remedial measures at the site, the Minister intends to undertake those measures at the site and claim direct and indirect costs related to such measures. The Mercier Subsidiary continues to assert that it has no responsibility for the groundwater contamination in the region and will contest any action by the Ministry to impose costs for remedial measures on the Mercier Subsidiary. The Company also continues to pursue settlement options. At December 31, 2009 and 2008, the Company had accrued $12.8 million and $10.6 million, respectively, for remedial liabilities relating to the Ville Mercier legal proceedings. The increase resulted primarily from a foreign exchange rate adjustment due to the strengthening of the Canadian dollar and interest accretion.
CH El Dorado. In August 2006, the Company purchased all of the outstanding membership interests in Teris LLC ("Teris") and changed the name of Teris to Clean Harbors El Dorado, LLC ("CH El Dorado"). At the time of the acquisition, Teris was, and CH El Dorado now is, involved in certain legal proceedings arising from a fire on January 2, 2005, at the incineration facility owned and operated by Teris in El Dorado, Arkansas.
CH El Dorado is defending vigorously the claims asserted against Teris in those proceedings, and the Company believes that the resolution of those proceedings will not have a material adverse effect on the Company's financial position, results of operations or cash flows. In addition to CH El Dorado's defenses to the lawsuits, the Company will be entitled to rely upon an indemnification from the seller of the membership interests in Teris which is contained in the purchase agreement for those interests. Under that agreement, the seller agreed to indemnify (without any deductible amount) the Company against any damages which the Company might suffer as a result of the lawsuits to the extent that such
107
CLEAN HARBORS, INC. AND SUBSIDIARIES
NOTES TO CONSOLIDATED FINANCIAL STATEMENTS (Continued)
(18) COMMITMENTS AND CONTINGENCIES (Continued)
damages are not fully covered by insurance or the reserves which Teris had established on its books prior to the acquisition. The seller's parent also guaranteed the indemnification obligation of the seller to the Company.
Deer Trail, Colorado Facility. Since April 5, 2006, the Company has been involved in various legal proceedings which have arisen as a result of the issuance by the Colorado Department of Public Health and Environment ("CDPHE") of a radioactive materials license ("RAD License") to a Company subsidiary, Clean Harbors Deer Trail, LLC ("CHDT") to accept certain low level radioactive materials known as "NORM/TENORM" wastes for disposal. Adams County, the county where the CHDT facility is located, filed two suits against the CDPHE in Colorado effectively seeking to invalidate the license. The two suits filed in 2006 were both dismissed and those dismissals were upheld by the Colorado Court of Appeals. Adams County appealed those rulings to the Colorado Supreme Court which ruled on October 13, 2009 on the procedural issue that the County did have standing to challenge the license in district court and remanded the case back to that court for further proceedings. Adams County filed a third suit directly against CHDT in 2007 again attempting to invalidate the license. That suit was dismissed on November 14, 2008, and Adams County has now appealed that dismissal to the Colorado Court of Appeals. The Company continues to believe that the grounds asserted by the County are factually and legally baseless and has contested the appeal vigorously. The Company has not recorded any liability for this matter on the basis that such liability is currently neither probable nor estimable.
Superfund Proceedings
As of December 31, 2009, the Company has been notified that either the Company or the prior owners of certain of the Company's facilities for which the Company may have certain indemnification obligations have been identified as potentially responsible parties ("PRPs") or potential PRPs in connection with 60 sites which are subject to or are proposed to become subject to proceedings under federal or state Superfund laws. Of the 60 sites, two involve facilities that are now owned by the Company and 58 involve third party sites to which either the Company or the prior owners shipped wastes. In connection with each site, the Company has estimated the extent, if any, to which it may be subject, either directly or as a result of any such indemnification provisions, for cleanup and remediation costs, related legal and consulting costs associated with PRP investigations, settlements, and related legal and administrative proceedings. The amount of such actual and potential liability is inherently difficult to estimate because of, among other relevant factors, uncertainties as to the legal liability (if any) of the Company or the prior owners of certain of the Company's facilities to contribute a portion of the cleanup costs, the assumptions that must be made in calculating the estimated cost and timing of remediation, the identification of other PRPs and their respective capability and obligation to contribute to remediation efforts, and the existence and legal standing of indemnification agreements (if any) with prior owners, which may either benefit the Company or subject the Company to potential indemnification obligations.
The Company's potential liability for cleanup costs at the two facilities now owned by the Company and at 35 (the "Listed Third Party Sites") of the 58 third party sites arose out of the Company's 2002 acquisition of substantially all of the assets (the "CSD assets") of the Chemical Services Division of Safety-Kleen Corp. As part of the purchase price for the CSD assets, the Company became liable as the owner of these two facilities and also agreed to indemnify the prior owners of the CSD assets against their share of certain cleanup costs for the Listed Third Party Sites payable to
108
CLEAN HARBORS, INC. AND SUBSIDIARIES
NOTES TO CONSOLIDATED FINANCIAL STATEMENTS (Continued)
(18) COMMITMENTS AND CONTINGENCIES (Continued)
governmental entities under federal or state Superfund laws. Of the 35 Listed Third Party Sites, 18 are currently requiring expenditures on remediation, ten are now settled, six are not currently requiring expenditures on remediation, and at one site the Company is contesting the prior owner's liability with the PRP group. The status of the two facilities owned by the Company (the Wichita Property and the BR Facility) and two of the Listed Third Party Sites (the Breslube-Penn and Casmalia sites) are further described below. Also further described below are one third party site (the Marine Shale site) at which the Company has been named a PRP as a result of its acquisition of the CSD assets but disputes that it has any cleanup or related liabilities, certain of the other third party sites which are not related to the Company's acquisition of the CSD assets, and certain notifications which the Company has received about other third party sites.
Wichita Property. The Company acquired in 2002 as part of the CSD assets a service center located in Wichita, Kansas (the "Wichita Property"). The Wichita Property is one of several properties located within the boundaries of a 1,400 acre state-designated Superfund site in an old industrial section of Wichita known as the North Industrial Corridor Site. Along with numerous other PRPs, the former owner executed a consent decree relating to such site with the EPA, and the Company is continuing its ongoing remediation program for the Wichita Property in accordance with that consent decree. The Company also acquired rights under an indemnification agreement between the former owner and an earlier owner of the Wichita Property, which the Company anticipates but cannot guarantee will be available to reimburse certain such cleanup costs.
BR Facility. The Company acquired in 2002 as part of the CSD assets a former hazardous waste incinerator and landfill in Baton Rouge (the "BR Facility"), for which operations had been previously discontinued by the prior owner. In September 2007, the EPA issued a special notice letter to the Company related to the Devil's Swamp Lake Site ("Devil's Swamp") in East Baton Rouge Parish, Louisiana. Devil's Swamp includes a lake located downstream of an outfall ditch where wastewater and stormwater have been discharged, and Devil's Swamp is proposed to be included on the National Priorities List due to the presence of Contaminants of Concern ("COC") cited by the EPA. These COCs include substances of the kind found in wastewater and stormwater discharged from the BR Facility in past operations. The EPA originally requested COC generators to submit a good faith offer to conduct a remedial investigation feasibility study directed towards the eventual remediation of the site. The Company is currently performing corrective actions at the BR Facility under an order issued by the Louisiana Department of Environmental Quality (the "LDEQ"). The Company cannot presently estimate the potential additional liability for the Devil's Swamp cleanup until a final remedy is selected by the EPA.
Breslube-Penn Site. At one of the 35 Listed Third Party Sites, the Breslube-Penn site, the EPA brought suit in 1997 in the U.S. District Court for the Western District of Pennsylvania against a large number of PRPs for recovery of the EPA's response costs in connection with that site. The named defendants are alleged to be jointly and severally liable for the remediation of the site and all response costs associated with the site. One of the prior owners, GSX Chemical Services of Ohio ("GSX"), was a named defendant in the original complaint. In 2006, the EPA filed an amended complaint naming the Company as defendant, alleging that the Company was the successor in interest to the liability of GSX.
Casmalia Site. At one of the 35 Listed Third Party Sites, the Casmalia Resources Hazardous Waste Management Facility (the "Casmalia site") in Santa Barbara County, California, the Company
109
CLEAN HARBORS, INC. AND SUBSIDIARIES
NOTES TO CONSOLIDATED FINANCIAL STATEMENTS (Continued)
(18) COMMITMENTS AND CONTINGENCIES (Continued)
received from the EPA a request for information in May 2007. In that request, the EPA is seeking information about the extent to which, if at all, the prior owner transported or arranged for disposal of waste at the Casmalia site. The Company has not recorded any liability for this 2007 notice on the basis that such transporter or arranger liability is currently neither probable nor estimable.
Marine Shale Site. Prior to 1996, Marine Shale Processors, Inc. ("Marine Shale") operated a kiln in Amelia, Louisiana which incinerated waste producing a vitrified aggregate as a by-product. Marine Shale contended that its operation recycled waste into a useful product, i.e., vitrified aggregate, and therefore was exempt from regulation under the RCRA and permitting requirements as a hazardous waste incinerator under applicable federal and state environmental laws. The EPA contended that Marine Shale was a "sham-recycler" subject to the regulation and permitting requirements as a hazardous waste incinerator under RCRA, that its vitrified aggregate by-product was a hazardous waste, and that Marine Shale's continued operation without required permits was illegal. Litigation between the EPA and Marine Shale began in 1990 and continued until July 1996, when the U.S. Fifth Circuit Court of Appeals ordered Marine Shale to shut down its operations.
On May 11, 2007, the EPA and the LDEQ issued a special notice to the Company and other PRPs, seeking a good faith offer to address site remediation at the former Marine Shale facility. Certain of the former owners of the CSD assets were major customers of Marine Shale, but the Marine Shale site was not included as a Listed Third Party Site in connection with the Company's acquisition of the CSD assets and the Company was never a customer of Marine Shale. Although the Company believes that it is not liable (either directly or under any indemnification obligation) for cleanup costs at the Marine Shale site, the Company elected to join with other parties which had been notified that are potentially PRPs in connection with Marine Shale site to form a group (the "Site Group") to retain common counsel and participate in further negotiations with the EPA and the LDEQ regarding a remedial investigation feasibility study directed towards the eventual remediation of the Marine Shale site.
The Site Group made a good faith settlement offer to the EPA on November 29, 2007, and negotiations among the EPA, the LDEQ and the Site Group with respect to the Marine Shale site are ongoing. As of December 31, 2009 and December 31, 2008, the amount of the Company's remaining reserves relating to the Marine Shale site was $3.7 million and $3.8 million, respectively.
Certain Other Third Party Sites. At 14 of the 58 third party sites, the Company has an indemnification agreement with ChemWaste, a former subsidiary of Waste Management, Inc. and the prior owner. The agreement indemnifies the Company with respect to any liability at the 14 sites for waste disposed prior to the Company's acquisition of the sites. Accordingly, Waste Management is paying all costs of defending those subsidiaries in those 14 cases, including legal fees and settlement costs. However, there can be no guarantee that the Company's ultimate liabilities for these sites will not exceed the amount recorded or that indemnities applicable to any of these sites will be available to pay all or a portion of related costs. The Company does not have an indemnity agreement with respect to any of the other remaining 58 third party sites not discussed above, however the Company believes that its additional potential liability, if any, to contribute to the cleanup of such remaining sites will not, in the aggregate, exceed $100,000.
Other Notifications. Between September 2004 and May 2006, the Company also received notices from certain of the prior owners of the CSD assets seeking indemnification from the Company at five
110
CLEAN HARBORS, INC. AND SUBSIDIARIES
NOTES TO CONSOLIDATED FINANCIAL STATEMENTS (Continued)
(18) COMMITMENTS AND CONTINGENCIES (Continued)
third party sites which are not included in the third party sites described above that have been designated as Superfund sites or potential Superfund sites and for which those prior owners have been identified as PRPs or potential PRPs. The Company has responded to such letters asserting that the Company has no obligation to indemnify those prior owners for any cleanup and related costs (if any) which they may incur in connection with these five sites. The Company intends to assist those prior owners by providing information that is now in the Company's possession with respect to those five sites and, if appropriate to participate in negotiations with the government agencies and PRP groups involved. The Company has also investigated the sites to determine the existence of potential liabilities independent from the liability of those former owners, and concluded that at this time the Company is not liable for any portion of the potential cleanup of the five sites and therefore has not established a reserve.
Federal, State and Provincial Enforcement Actions
From time to time, the Company pays fines or penalties in regulatory proceedings relating primarily to waste treatment, storage or disposal facilities. As of December 31, 2009, there were four proceedings for which the Company reasonably believes that the sanctions could equal or exceed $100,000. The Company does not believe that the fines or other penalties in these or any of the other regulatory proceedings will, individually or in the aggregate, have a material adverse effect on its financial condition or results of operations. One of such other regulatory proceedings is further described below.
Thorold Fire. On February 19, 2007, an explosion and fire occurred at the Company's Thorold facility in Ontario during non-business hours destroying a storage warehouse and damaging several nearby buildings on site. No employee casualties or injuries were reported. On October 23, 2007 the Ontario Ministry of the Environment announced that it had concluded its investigation into the fire and that there were no grounds to initiate action against the Company. This action by the Ontario Ministry of the Environment followed a prior pronouncement by the provincial Ministry of Health that there were no long-term health impacts from the fire. Despite the earlier pronouncements, on February 12, 2009 the Ontario Ministry of the Environment initiated proceedings against one of the Company's Canadian subsidiaries in the Ontario Court of Justice alleging three violations of the Environmental Protection Act. On February 19, 2010, the parties came to a full and final resolution of all outstanding matters arising from the Thorold Fire. The matter was resolved for an immaterial amount.
Guarantees
Each Participant in the Eveready Employee Participation Plan (the "Plan") described in Note 16, "Stock-Based Compensation and Employee Participation Plan," had the option to finance the acquisition of Purchased Units either through the employee's own funds or a BMO loan to the Participant secured by both the Purchased and Matching Units. Because of the decline in the market value of the predecessor's units and of Eveready shares subsequent to the purchase by the Participants of the Purchased Units, Eveready subsequently provided to BMO a guarantee of the BMO loans in the maximum amount at December 31, 2009 of Cdn $5.4 million (plus interest and collection costs). At December 31, 2009, the aggregate amount of such guarantee, after giving effect to the market value on that date of the Company's shares derived from the Purchased and Matching Units which secure the BMO loans, was Cdn $1.0 million. At December 31, 2009, the Company had accrued Cdn $0.6 million
111
CLEAN HARBORS, INC. AND SUBSIDIARIES
NOTES TO CONSOLIDATED FINANCIAL STATEMENTS (Continued)
(18) COMMITMENTS AND CONTINGENCIES (Continued)
related to such guarantee. As described in Note 16, "Stock-Based Compensation and Employee Participation Plan," the Company has agreed with certain of its employees who were Participants in the Plan to pay on December 31, 2011 to those employees a Shortfall Bonus under certain circumstances and the maximum amount of the potential Shortfall Bonus as of December 31, 2009 was $3.0 million. To the extent, if any, that the Company becomes obligated to pay on December 31, 2011 a Shortfall Bonus to any employees who then have outstanding balances in their respective BMO loans, the amount of such Shortfall Bonus (net of withholding taxes) shall first be applied against such outstanding BMO loan balances, thereby decreasing the amount, if any, which the Company might be obligated to pay directly to BMO under the guarantee which Eveready provided to BMO on the BMO loans.
The Company has provided a guarantee to a certain financial institution for financing obtained by a contractor to purchase specific service and automotive equipment in supplying services to the Company. As of December 31, 2009, the total balance of all outstanding third party payments guaranteed by the Company was Cdn $0.9 million. The financing is collateralized by the specific equipment purchased and is due to mature between 2010 and 2011. The Company would be required to settle the guarantee if the contractor were to default on the obligation and the collateral held by the financial institution was not sufficient to repay the balance due.
Leases
The Company leases facilities, service centers and personal property under certain operating leases. Some of these lease agreements contain an escalation clause for increased taxes and operating expenses and are renewable at the option of the Company. The Company also leases certain equipment under capital lease obligations, which consists primarily of rolling stock and laboratory equipment. Lease terms range from 1 to 20 years. The following is a summary of future minimum payments under capital and operating leases that have initial or remaining noncancelable lease terms in excess of one year at December 31, 2009 (in thousands):
Year
|
Total Capital Leases |
Total Operating Leases |
|||||
|---|---|---|---|---|---|---|---|
2010 |
$ | 2,524 | $ | 33,801 | |||
2011 |
2,135 | 24,812 | |||||
2012 |
2,001 | 19,474 | |||||
2013 |
1,968 | 14,721 | |||||
2014 |
1,461 | 6,002 | |||||
Thereafter |
172 | 26,471 | |||||
Total minimum lease payments |
10,261 | $ | 125,281 | ||||
Less: imputed interest at interest rates ranging from 5.00% to 22.00% |
1,423 | ||||||
Present value of future minimum lease payments |
8,838 | ||||||
Less: current portion of capital lease obligations |
1,923 | ||||||
Long-term capital lease obligations |
$ | 6,915 | |||||
During the years 2009, 2008 and 2007, rent expense including short-term rentals, was approximately $53.6 million, $46.7 million, and $47.0 million, respectively.
112
CLEAN HARBORS, INC. AND SUBSIDIARIES
NOTES TO CONSOLIDATED FINANCIAL STATEMENTS (Continued)
(18) COMMITMENTS AND CONTINGENCIES (Continued)
Other Contingencies
The Company is subject to various regulatory requirements, including the procurement of requisite licenses and permits at its facilities. These licenses and permits, without which the Company's operations would be adversely affected, are subject to periodic renewal. The Company anticipates that, once a license or permit is issued with respect to a facility, the license or permit will be renewed at the end of its term if the facility's operations are in compliance with the applicable regulatory requirements.
On August 12, 2005, the Ontario Ministry of the Environment adopted new regulations which prohibit land disposal of untreated hazardous waste and require the waste to meet specific treatment standards prior to land disposal. Land disposal includes onsite and offsite land filling, land farming and any other form of land disposal. These requirements are similar to the RCRA Land Disposal Restrictions, or "LDR," enacted in the United States and thus bring the Province of Ontario in closer conformity with the United States regulatory scheme. The new Ontario LDR commenced in 2007 through a phased-in schedule based on specific inorganic waste streams, and are now fully implemented with the regulation of organic waste streams that became effective at the end of 2009.
Under the Company's insurance programs, coverage is obtained for catastrophic exposures, as well as those risks required to be insured by law or contract. The Company's policy is to retain a significant portion of certain expected losses related primarily to workers' compensation, health insurance, comprehensive general, environmental impairment and vehicle liability. Provisions for losses expected under these programs are recorded based upon the Company's estimates of the aggregate liability for claims. The deductible per participant per year for the health insurance policy is $0.275 million. The deductible per occurrence for the workers' compensation, general liability and vehicle liability is $0.5 million. The retention per claim for the environmental impairment policy is $1.0 million. At December 31, 2009 and 2008, the Company had accrued $9.9 million and $9.1 million, respectively, for its self-insurance liabilities (exclusive of health insurance) using a risk-free discount rate of 1.59%. Actual expenditures in future periods can differ materially from accruals based on estimates.
Anticipated payments at December 31, 2009 for each of the next five years and thereafter are as follows (in thousands):
Years ending December 31,
|
|
|||
|---|---|---|---|---|
2010 |
$ | 4,500 | ||
2011 |
2,435 | |||
2012 |
1,705 | |||
2013 |
961 | |||
2014 |
587 | |||
Thereafter |
957 | |||
Undiscounted self-insurance liabilities |
11,145 | |||
Less: Discount |
1,251 | |||
Total self-insurance liabilities (included in other accrued expenses) |
$ | 9,894 | ||
113
CLEAN HARBORS, INC. AND SUBSIDIARIES
NOTES TO CONSOLIDATED FINANCIAL STATEMENTS (Continued)