Attached files
Table of Contents
UNITED STATES
SECURITIES AND EXCHANGE COMMISSION
Washington, D.C. 20549
FORM 10-K
(Mark One)
| [X] | ANNUAL REPORT PURSUANT TO SECTION 13 OR 15(d) OF THE SECURITIES EXCHANGE ACT OF 1934 |
For the fiscal year ended December 31, 2009
or
| [ ] | TRANSITION REPORT PURSUANT TO SECTION 13 OR 15(d) OF THE SECURITIES EXCHANGE ACT OF 1934 |
For the transition period from to
Commission file number: 1-15259
ARGO GROUP INTERNATIONAL HOLDINGS, LTD.
(Exact name of Registrant as specified in its charter)
| Bermuda | 98-0214719 | |
| (State or other jurisdiction of incorporation or organization) |
(I.R.S. Employer Identification Number) | |
| 110 Pitts Bay Road Pembroke HM08 Bermuda |
P.O. Box HM 1282 Hamilton HM FX Bermuda | |
| (Address of principal executive offices) | (Mailing address) | |
(441) 296-5858
(Registrant’s telephone number, including area code)
Securities registered pursuant to Section 12(b) of the Act:
| Title of Security | Name of Each Exchange on Which Registered | |
| Common Stock, par value of $1.00 per share | NASDAQ Global Select Market |
Securities registered pursuant to Section 12(g) of the Act:
None
Indicate by check mark if the registrant is a well-known seasoned issuer, as defined in Rule 405 of the Securities Act. Yes [X] No [ ]
Indicate by check mark if the registrant is not required to file reports pursuant to Section 13 or Section 15(d) of the Act. Yes [ ] No [X]
Indicate by check mark whether the registrant (1) has filed all reports required to be filed by Section 13 or 15(d) of the Securities Exchange Act of 1934 during the preceding 12 months (or for such shorter period that the registrant was required to file such reports), and (2) has been subject to such filing requirements for the past 90 days. Yes [X] No [ ]
Indicate by check mark whether the registrant has submitted electronically and posted on its corporate Website, if any, every Interactive Data File required to be submitted and posted pursuant to Rule 405 of Regulation S-T (§232.405 of this chapter) during the preceding 12 months (or for such shorter period that the registrant was required to submit and post such files). Yes [ ] No [ ]
Indicate by check mark if disclosure of delinquent filers pursuant to Item 405 of Regulation S-K (§229.405 of this chapter) is not contained herein, and will not be contained, to the best of the registrant’s knowledge, in definitive proxy or information statements incorporated by reference in Part III of this Form 10-K or any amendment to this Form 10-K. [X]
Indicate by check mark whether the registrant is a large accelerated filer, an accelerated filer, a non-accelerated filer, or a smaller reporting company. See the definitions of “large accelerated filer,” “accelerated filer” and “smaller reporting company” in Rule 12b-2 of the Exchange Act.
| Large accelerated filer [X] | Accelerated filer [ ] | Non-accelerated filer [ ] | Smaller reporting company [ ] |
Indicate by check mark whether the registrant is a shell company (as defined in Rule 12b-2 of the Act). Yes [ ] No [X]
As of June 30, 2009, the aggregate market value of the common stock held by non-affiliates was approximately $859.8 million.
As of February 25, 2010, the Registrant had 31,004,649 shares of common stock outstanding.
DOCUMENTS INCORPORATED BY REFERENCE
Part III: Excerpts from Argo Group International Holdings, Ltd.’s Proxy Statement for the Annual Meeting of Shareholders to be held on May 4, 2010
Table of Contents
ARGO GROUP INTERNATIONAL HOLDINGS, LTD.
Annual Report on Form 10-K
For the Year Ended December 31, 2009
TABLE OF CONTENTS
| Page | ||||||
| PART I | ||||||
| Item | 1. | 3 | ||||
| Item | 1A. | 17 | ||||
| Item | 1B. | 34 | ||||
| Item | 2. | 34 | ||||
| Item | 3. | 35 | ||||
| Item | 4. | 36 | ||||
| PART II | ||||||
| Item | 5. | 36 | ||||
| Item | 6. | 38 | ||||
| Item | 7. | Management’s Discussion and Analysis of Financial Condition and |
39 | |||
| Item | 7A. | 71 | ||||
| Item | 8. | 73 | ||||
| Item | 9. | Changes in and Disagreements with Accountants on Accounting and |
74 | |||
| Item | 9A. | 74 | ||||
| Item | 9B. | 75 | ||||
| PART III | ||||||
| Item | 10. | 75 | ||||
| Item | 11. | 75 | ||||
| Item | 12. | Security Ownership of Certain Beneficial Owners and Management and Related |
76 | |||
| Item | 13. | Certain Relationships and Related Transactions and Director Independence |
76 | |||
| Item | 14. | 76 | ||||
| PART IV | ||||||
| Item | 15. | 77 | ||||
Table of Contents
Forward Looking Statements
Certain statements in this document are “forward-looking statements” as that term is defined in the Private Securities Litigation Reform Act of 1995 and are made pursuant to the safe harbor provisions of that act. Some of the forward-looking statements can be identified by the use of forward-looking words such as “believes”, “expects”, “potential”, “continued”, “may”, “will”, “should”, “seeks”, “approximately”, “predicts”, “intends”, “plans”, “estimates”, “anticipates” or the negative version of those words or other comparable words. The forward-looking statements are based on the current expectations of Argo Group International Holdings, Ltd. (“Argo Group” or the “Company”) and its beliefs concerning future developments and their potential effects on the Company. There can be no assurance that actual developments will be those anticipated by the Company. Actual results may differ materially as a result of significant risks and uncertainties including but not limited to:
| • | changes in the pricing environment including those due to the cyclical nature of the insurance and reinsurance industry; |
| • | increased competition; |
| • | the adequacy of the Company’s projected loss reserves including; |
| ¡ | development of claims that varies from that which was expected when loss reserves were established; |
| ¡ | adverse legal rulings which may impact the liability under insurance and reinsurance contracts beyond that which was anticipated when the reserves were established; |
| ¡ | development of new theories related to coverage which may increase liabilities under insurance and reinsurance contracts beyond that which were anticipated when the loss reserves were established; |
| ¡ | reinsurance coverage being other than what was anticipated when the loss reserves were established; |
| • | adverse changes to regulatory and tax conditions and legislation; |
| • | natural and/or man-made disasters, including terrorist acts; |
| • | the inability to secure reinsurance; |
| • | the inability to collect reinsurance recoverables; |
| • | a downgrade in the Company’s financial strength ratings; |
| • | changes in interest rates; |
| • | changes in the financial markets that impact investment income and the fair market values of the Company’s investments; |
| • | changes in asset valuations; |
| • | inability to successfully execute the Company’s mergers and acquisitions growth strategy; and |
| • | other risks detailed in this Form 10-K and that may be detailed in other filings with the Securities and Exchange Commission. |
These risks and uncertainties are discussed in greater detail in Item 1A “Risk Factors.” The Company undertakes no obligation to publicly update any forward-looking statements.
| ~~~~~~~~~~~~~~~~~~~~~~~~~~~~~~~~~~~~~~~~~~~~~~~~~~~~~~~~~~~~~~~~~~~~~~~~~~~~~~~~~~~~~~~~~~~~~~~~~~~ |
Business Overview
Argo Group International Holdings, Ltd. (“Argo Group” or the “Company”) is an international underwriter of specialty insurance and reinsurance products in the property and casualty market. Argo Group is the result of a merger in 2007 between Argonaut Group, Inc. and PXRE Group Ltd. (“PXRE”) (the “Merger”). The Company targets niches in which it can develop a leadership position and which the Company believes will generate superior underwriting profits. Its growth has been achieved both organically through an operational strategy focused on underwriting discipline and as a result of strategic acquisition activity.
3
Table of Contents
Following is a summary organization chart for the Company:
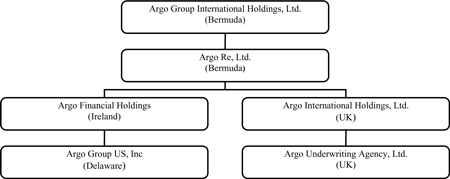
Business Segments and Products
For the year ended December 31, 2009, Argo Group’s operations included four ongoing business segments: Excess and Surplus Lines, Commercial Specialty, Reinsurance and International Specialty. Additionally, the Company has a Run-off Lines segment for products it no longer underwrites. For discussion of the operating results of each business segment, please refer to Item 7 “Management’s Discussion and Analysis of Financial Condition and Results of Operations” on pages 39 - 70 and Note 14, “Segment Information” in the Notes to the Consolidated Financial Statements.
Excess and Surplus Lines. Excess and surplus lines carriers focus on risks that the standard (admitted) market is unwilling or unable to underwrite due to the unique risk characteristics of the insureds or the lack of insurers willing to offer such coverage because of the perils involved, the nature of the business, or the insured’s loss experience. Excess and surplus lines carriers are able to underwrite these risks with more flexible policy terms at unregulated premium rates on a non-admitted basis.
Three operations are included in Argo Group’s Excess and Surplus Lines business segment: Colony Group (“Colony”), Argo Pro and Argonaut Specialty. These three operations focus on underwriting surplus lines coverage but any of the three may underwrite certain classes of business on an admitted basis for insureds with risk profiles that meet the Company’s underwriting standards.
Colony focuses on a broad class of risks that the standard market chooses not to underwrite. Its operations are divided into three focused divisions: liability, property and automobile. Colony provides coverage to commercial enterprises including restaurants, contractors, day care centers, apartment complexes, condominium associations, manufacturers and distributors. A portion of its business, primarily transportation (commercial automobile) coverage, is written on an admitted basis.
Argo Pro is comprised of four divisions: Allied Medical (“AM”), Errors & Omissions (“EO”), Environmental (“ENV”) and Insight. AM targets medical facilities within the social services, miscellaneous healthcare, and long term care segments. EO targets insurance agents, lawyers, miscellaneous EO, employment practices and real estate related EO accounts. ENV offers package policies for environmental consultants and contractors, storage tanks, dry cleaners pollution liability as well as other environmental related liability exposures. Insight offers coverages for architects and engineers, accountants and insurance agents. All Argo Pro divisions focus on small to medium size risks.
Argonaut Specialty underwrites risks, primarily on an excess and surplus lines basis, which are slightly larger in size and complexity than those traditionally targeted by Colony. It underwrites primary casualty, and excess/umbrella coverages for hard to place risks and/or distressed businesses that fall outside of the standard insurance market’s risk appetite. Primary casualty risks comprised 55% of Argonaut Specialty’s premium volume in 2009. The excess/umbrella casualty division accounted for 45% of Argonaut Specialty’s premium volume during 2009.
Commercial Specialty. This segment provides property casualty and surety coverages designed to meet the specialized insurance needs of businesses within certain well defined markets. It targets business classes and industries with distinct risk profiles that can benefit from specially designed insurance programs, tailored loss control and expert claims handling. This segment serves its targeted niche markets with a narrowly focused underwriting profile and a unique understanding of the businesses it serves. Five operations are included in the Company’s Commercial Specialty segment: Argo Select, Rockwood Casualty Insurance Company (“Rockwood”), Trident Insurance Services (“Trident”), Programs and Product Development and Argo Surety.
4
Table of Contents
The core operations of Argo Select consist of Grocery, Restaurants, and Specialty Retail (including dry cleaners, commercial launderers, convenience stores, and retail furniture stores). In addition, Argo Select partners with First Insurance Company of Hawaii (“FICOH”) to provide stand-alone hurricane coverage for personal lines policies on the Hawaiian Islands. Approximately 44% of Argo Select’s 2009 gross written premium was from the Grocery segment, followed by 18% from Restaurants, 15% in Specialty Retail, 8% from Religious Organizations (churches and other houses of worship), 8% from Hospitality, and 7% from FICOH. Argo Select provides property, liability, workers compensation, auto, and umbrella coverage throughout the United States. In November 2009, Argo Select announced that it was discontinuing programs for Hospitality and Religious Organizations.
Rockwood is recognized as a leading specialty underwriter of workers compensation for the mining industry. It also underwrites business coverage for small commercial businesses including office, retail operations, light manufacturing, services, and restaurants. Rockwood’s strategy includes a strong commitment to its insureds, a highly experienced staff, and a dedication to the individual underwriting of risks. Approximately 54% of its premiums are written in Pennsylvania where it is the largest workers compensation insurer of independent coal mines. Rockwood underwrites policies on both a large deductible basis and on a guaranteed cost basis for smaller commercial accounts. In addition, Rockwood provides supporting general liability, pollution liability, umbrella liability, property, commercial automobile and surety coverage, for certain of its mining accounts. These supporting lines of business represented less than 16% of Rockwood’s gross written premiums in 2009.
Trident functions as both an underwriter and a managing general agency and is a nationally recognized program manager providing insurance products for small to intermediate sized accounts in targeted sectors. Trident manages programs serving public entities, public schools, special districts, private education (K-12), home heating dealers, propane dealers, student transportation, septic contractors, waste haulers and lawyers. Trident offers a full range of solutions including program management, administration, professional claims and loss control services on a fee basis for pools as well as fully insured solutions for individual accounts in the sectors it serves. Its product lines include general liability, automobile liability, automobile physical damage, property, inland marine, crime, public official’s liability, educator’s legal liability, employment practices, law enforcement liability, environmental liability, lawyers professional liability, student accident, police and firefighters accident, workers compensation, inmate medical and tax interruption.
The Commercial Specialty Program and Product Development unit works with Program Administrators to develop specialized commercial programs in target segments of the industry. They seek to partner with Program Administrators which provide an expertise in particular field, have a proven record of managing profitable programs, have an established distribution network and are equipped to handle responsibilities such as marketing, underwriting, rating and policy issuance subject to Argo oversight.
Argo Surety is an underwriting unit offering surety products to a diverse range of U.S. businesses operating in numerous industries. The focus of Argo Surety is to deliver high-quality surety credit solutions to businesses that must satisfy various eligibility conditions in order to conduct commerce, such as licensure requirements promulgated by government statute or regulation, counterparty conditions found in private or public construction projects or satisfactory performance of contracted services. Surety products are commonly grouped into two broad categories referred to as Contract Bonds and Commercial Bonds. Argo Surety targets the construction (general, trade and service contractors), energy (coal, oil & gas and waste), manufacturing, and transportation industries.
Reinsurance. The Reinsurance segment underwrites international and U.S. reinsurance business. The segment’s primary business platform is Argo Re, Ltd., a Bermuda Class 4 insurance company (“Argo Re”).
Argo Re focuses on underwriting property catastrophe excess of loss reinsurance for a relatively small number of cedants whose accounts are known by Argo Re underwriters. Argo Re will also underwrite property per risk and pro rata reinsurance on a select basis. The business written by Argo Re covers underlying exposures which are located throughout the world including the United States.
5
Table of Contents
Property catastrophe reinsurance generally covers claims arising from large catastrophes around the world such as hurricanes, windstorms, hailstorms, earthquakes, volcanic eruptions, fires, industrial explosions, freezes, riots, floods and other man-made or natural disasters. In underwriting the property catastrophe portfolio, exposures are diversified geographically and by peril in order to manage the risks assumed and maximize return.
During 2009, Argo Re launched a “Casualty and Professional” division to underwrite primary excess casualty insurance business to global clients and Errors and Omissions and Directors and Officers insurance business to large corporations.
International Specialty. The International Specialty segment is focused on underwriting worldwide property and non U.S. liability insurance on behalf of underwriting syndicates, under the Lloyd’s of London (“Lloyd’s”) global franchise. The segment’s business platform, Argo International (formerly known as Heritage Underwriting Agency plc), based in London, is comprised of three principal components:
| • | Argo Managing Agency, which manages syndicates for the providers of capital; |
| • | Syndicate 1200, which underwrites the insurance risk on a year of account basis; and |
| • | Argo Underwriting Agency, which participates with other capital providers on syndicates. |
Argo International obtains its underwriting capital from a variety of sources and seeks to maintain a balance between capital managed on behalf of third parties and investment of its own capital. The sources of the underwriting capital for the International Specialty segment include the Company’s interest through Argo International and Argo Re, third party capital participants referred to as Trade Capital and third party capital attributable to individual members referred to as Names and Other Capital. Trade Capital reinsurers participate on a quota share basis, assuming 100% of their contractual participation in the syndicate results with such results settled on a year of account basis. The flexibility in the sources of capital allows Argo International to manage its underwriting exposure over the insurance cycle with a view to maximizing profitability.
The table below represents the Company’s participation in the syndicates it manages by year of account:
| Year of account | 2010 | 2009 | 2008 | 2007 | ||||||
| Participations on syndicate | 1200 | 1200 | 1200 | 1200 | 3245 | |||||
| Argo Group interest |
61% | 61% | 54% | 48% | 28% | |||||
| Third party - Trade Capital |
24% | 23% | 24% | 33% | 34% | |||||
| Third party - Names and Other Capital |
15% | 16% | 22% | 19% | 38% | |||||
In order to diversify risk and make more efficient use of capital, Syndicate 3245, which was writing a portion of the Argo International business, was merged into Syndicate 1200 beginning with the 2008 year of account, following which the combined underwriting activities have been carried out by two divisions within Syndicate 1200.
Argo International earns its income from return on the underwriting capital that is provided from its own resources, investment income on its capital resources and from commission earned from the management of third party capital. This commission is largely linked to profits earned on such capital.
Argo International’s worldwide property division concentrates mainly on underwriting short-tail risks with an emphasis on commercial property which are also exposed to catastrophes and other man-made or natural disasters. In underwriting the property portfolio, exposures are diversified geographically and by peril in order to manage the risks assumed and maximize return. The division maintains a flexible approach to underwriting and attempts to identify and respond to opportunities in territories and classes of business as they arise.
Argo International’s liability division underwrites non-U.S. professional indemnity, international general liability and directors & officers insurance. In addition, approximately 3% of the syndicate premium income is written on a range of U.S. general liability risks.
Within these sectors the underwriters leverage opportunities across geographies and risk layers. Business is evaluated against risk and return requirements. Operating through Lloyd’s global franchise, Argo International is able to select the markets it operates in by their position in the insurance cycle and thus seek the most profitable business. Lloyd’s business is often bound across multiple syndicates. Argo International is the lead underwriter on a high proportion of the business it underwrites.
6
Table of Contents
Marketing and Distribution
Argo Group provides products and services to well defined niche markets. Argo Group leverages the Company’s capital strength and brand by cross-marketing the products provided by the various operating companies. Argo Group offers its distribution partners tailored, innovative solutions for managing risk using the full range of products and services available within the Company.
Excess and Surplus Lines. Colony distributes its products through a network of appointed wholesale excess and surplus lines agents and brokers. Approximately 69% of Colony’s premium volume during 2009 was produced through Colony wholesale agents that are appointed to underwrite, quote and issue policies subject to stringent underwriting parameters provided by Colony. The remaining 31% of Colony’s premium volume in 2009 was produced by Colony wholesale agents and brokers who submit that brokerage business to Colony underwriters for quoting and issuance by Colony personnel. Argo Pro uses wholesale brokers in Allied Medical, Errors & Omissions and Environmental as well as retail agents for Insight’s products. Argonaut Specialty uses a select network of appointed excess and surplus lines brokers to distribute its products.
Commercial Specialty. Commercial Specialty’s distribution is multi-faceted, utilizing retail agents, direct to the insured, program managers and wholesale agents. Rockwood distributes its product lines through a network of independent retail and wholesale agents. Argo Select products and services are distributed through selected independent agents, brokers, wholesalers and program managers with demonstrated expertise in one or more of its targeted niche markets and through its in-house managing general agent and on a direct basis in a limited number of states. Trident provides its insurance products and related services to the public entity sector through licensed retail agents and brokers in eligible states. Trident has a limited number of statewide program managers and exclusive distribution agency partners in select states. Argo Surety distributes its products through selected surety specialty agents and brokers across the United States.
Reinsurance. Argo Re has obtained substantially all of its reinsurance business through brokers and intermediaries who represent clients in negotiations for the purchase of reinsurance. None of the intermediaries through which Argo Re obtains this business are authorized to arrange any business in the Company’s name without its approval. Argo Re pays commissions to these intermediaries or brokers that vary in size based on the amount of premiums and type of business assumed by Argo Re.
International Specialty. Argo International obtains underwriting business from two main sources: Lloyd’s open market where brokers approach the underwriters directly with individual insurance risk opportunities, and delegated authority to other underwriting agencies (where Argo International delegates the underwriting decision on individual risks to agencies which it has granted limited underwriting authority. In general, risks written on the open market business are larger than risks written on our behalf by agencies to which delegated authority has been given in both terms of exposure and premium volume.
Competition
The Company’s principal direct insurance competitors cannot be easily summarized. The Company’s principal lines of business are written by numerous other insurance companies. Competition for any one account may come from very large international firms or smaller regional companies in the domiciles in which the Company operates.
To remain competitive, the Company’s strategy includes, among other measures, (1) focusing on rate adequacy and underwriting discipline, (2) leveraging its distribution network, (3) controlling expenses, (4) maintaining financial strength and issuer credit ratings, (5) providing quality services to agents and policyholders and (6) acquiring suitable property and casualty books of business.
Excess and Surplus Lines. Competition within the excess and surplus lines marketplace comes from a wide range of carriers. In addition to mature companies that operate nationwide, there is competition from carriers formed in recent years. The Excess and Surplus Lines segment may also compete with national and regional carriers from the standard market willing to underwrite selected accounts on an admitted basis.
7
Table of Contents
Commercial Specialty. Due to the diverse nature of the products offered by the Commercial Specialty segment, competition comes from various sources. The majority of the competition comes from regional companies or regional subsidiaries of national carriers in the domiciles in which they operate. National carriers tend to compete for larger accounts along all product lines. Competition for the Company’s public entity products is primarily from small to medium size commercial insurers as well as from state and regional risk pools.
Reinsurance. Argo Re competes with numerous reinsurance and insurance companies. These competitors, many of whom have higher credit ratings and substantially greater financial, marketing and management resources than Argo Re, include independent reinsurance companies, subsidiaries or affiliates of established worldwide insurance companies, reinsurance departments of certain commercial insurance companies and underwriting syndicates.
International Specialty. The principal lines of business are written by numerous other insurance companies and syndicates at Lloyd’s. Competition for any one account may come from other Lloyd’s syndicates, international firms or smaller regional companies. To remain competitive, Argo International’s strategy includes, among other measures, leveraging the Lloyd’s brand.
Ratings
The Company’s insurance and reinsurance subsidiaries have a Financial Strength Rating from A.M. Best Company (“A.M. Best”). A.M. Best’s ratings are used by insurance buyers, agents, brokers and other insurance companies as an indicator of financial strength and security and are not intended to reflect the quality of the rated company for investment purposes. A.M. Best assigns Financial Strength Ratings ranging from “A++ (Superior)” to “S (Rating Suspended).” The Company’s insurance and reinsurance companies have a Financial Strength Rating of “A (Excellent)” with a stable outlook from A.M. Best.
Standard & Poor’s Rating Services (“S&P”) assigns Financial Strength Ratings ranging from “AAA (Extremely Strong)” to “R (Regulatory Action)” with plus or minus designations for categories from AA to CCC to designate the relative standing within the category. The Company’s U.S. insurance subsidiaries have been rated “A- (Strong)” with a stable outlook by S&P. In addition, Argo Group US, Inc. has an Issuer Credit Rating of “BBB- (Good)” with a stable outlook from S&P.
As part of the Lloyd’s, Argo International shares Lloyd’s rating rather than being rated independently. As all Lloyd’s policies are ultimately backed by the Lloyd’s Central Fund, a single market rating is applied. Lloyd’s, as a market, is rated “A (Excellent)” by A.M. Best and “A+” by S&P.
Regulation
General
The business of insurance and reinsurance is regulated in most countries, although the degree and type of regulation varies significantly from one jurisdiction to another. The principal jurisdictions of Argo Group’s insurance and reinsurance operations are Bermuda, the United States and the United Kingdom. Argo Group is also regulated by other countries where it does business.
Bermuda
As a holding company, Argo Group is not subject to Bermuda insurance regulations. However, the Insurance Act of 1978 and related regulations, as amended (together, the “Insurance Act”), regulate the insurance business of Argo Re, the Company’s operating subsidiary in Bermuda, and provide that no person may carry on the insurance business in or from within Bermuda unless registered as an insurer by the Bermuda Monetary Authority (the “BMA”). Under the Insurance Act, no distinction is made between insurance and reinsurance business.
Classification of Insurers
The Insurance Act distinguishes between special purpose insurers, insurers carrying on long-term business and insurers carrying on general business. There are six classifications of insurers carrying on general business, with Class 4 insurers subject to the strictest regulation. Argo Re, which is incorporated to carry on general insurance and reinsurance business, is registered as a Class 4 insurer in Bermuda and is regulated as such under the Insurance Act.
8
Table of Contents
Principal Representative
An insurer is required to maintain a principal office in Bermuda and to appoint and maintain a principal representative in Bermuda.
Argo Re
Effective December 31, 2007, Argo Group amalgamated its two Bermuda reinsurers, Peleus Re and PXRE Reinsurance Ltd. (“PXRE Bermuda”), with Peleus Re as the continuing company. Peleus Re, prior to the amalgamation, was a Class 3 general business insurer, and PXRE Bermuda was a Class 4 general business insurer. As a result of the amalgamation, Peleus Re was granted a Class 4 license under the Insurance Act. Effective April 7, 2008, the name of Peleus Re was changed to Argo Re.
The Insurance Act imposes on Bermuda insurance companies, including Argo Re, solvency and liquidity standards and auditing and reporting requirements, and grants to the BMA powers to supervise, investigate and intervene in the affairs of insurance companies. Specifically, the Insurance Act provides that the value of the general business assets of a Class 4 insurer must exceed the amount of its general business liabilities by an amount greater than the prescribed minimum solvency margin. Argo Re, as a Class 4 insurer, is required to maintain a minimum solvency margin equal to the greatest of: (a) $100.0 million, (b) 50% of net premiums written (with a deduction for ceded reinsurance from gross premiums written not exceeding 25% of gross premiums written) or (c) 15% of loss reserves. In addition, Argo Re is prohibited from declaring or paying any dividends during any financial year it is in breach of its minimum solvency margin or minimum liquidity ratio or if the declaration or payment of such dividends would cause it to fail to meet such margin or ratio. If it fails to meet its minimum solvency margin or minimum liquidity ratio on the last day of any financial year, the insurer will be prohibited, without the approval of the BMA, from declaring or paying any dividends during the next financial year. If Argo Re’s total statutory capital and surplus falls to $75.0 million or less, it will have to comply with additional reporting requirements as mandated by the BMA.
The Insurance Act was amended in 2008 to introduce, among other things, the Bermuda Solvency Capital Requirement model (the “BSCR”) which is a standard mathematical model designed to give the BMA more advanced methods for determining an insurer’s capital adequacy. Insurers may also apply in-house models that deal with their own particular risks and where such models satisfy the standards established by the BMA, such insurers may apply to the BMA to use such models in lieu of the BSCR. The amount calculated in accordance with the BSCR or a company’s approved in-house model is referred to as its enhanced capital requirement (“ECR”). Argo Re calculates its ECR in accordance with the BSCR.
In addition to the BMA’s powers under the Insurance Act to issue directions, where the BMA concludes that the risk profile of an insurer deviates significantly from (a) the assumptions underlying the enhanced capital requirement applicable to it or (b) from the insurer’s own assessment of its risk management policies and practices in calculating its own enhanced capital requirement, the BMA may, subject to compliance with the relevant provisions of the Act, make such adjustments to an insurer’s enhanced capital requirement and available statutory capital and surplus as it considers appropriate.
Underlying the BSCR is the belief that all insurers should operate with a view to maintaining their capital at a prudent level in excess of the minimum solvency margin prescribed under the Insurance Act. Currently all Class 4 insurers, including Argo Re, are expected to maintain their capital at a target level that is set at 120% of the ECR. At December 31, 2009, Argo Re exceeded the target level.
The Insurance Act provides a minimum liquidity ratio for general business. An insurer engaged in general business is required to maintain the value of its relevant assets at not less than 75% of the amount of its relevant liabilities. Relevant assets include cash and time deposits, quoted investments, unquoted bonds and debentures, first liens on real estate, investment income due and accrued, accounts and premiums receivable and reinsurance balances receivable. There are certain categories of assets that, unless specifically permitted by the BMA, do not automatically qualify as relevant assets; these include unquoted equity securities, investments in and advances to affiliates, real estate and collateral loans. The relevant liabilities are total general business insurance reserves and total other liabilities less deferred income tax and sundry liabilities (by interpretation, those not specifically defined).
At December 31, 2009, Argo Re’s solvency and liquidity margins and statutory capital and surplus were in excess of the minimum levels required by the Insurance Act.
9
Table of Contents
As a registered Class 4 insurer, Argo Re is required to submit an opinion of its approved loss reserve specialist with its statutory financial return in respect of its loss and loss expense reserves. The appointment of a loss reserve specialist, who will normally be a qualified casualty actuary, must be approved by the BMA. Argo Re has appointed a loss reserve specialist who has been approved by the BMA to serve in such capacity.
Any person who, directly or indirectly, becomes a holder of at least 10 percent, 20 percent, 33 percent or 50 percent of Argo Group’s common shares must notify the BMA in writing within 45 days of becoming such a holder or 30 days from the date they have knowledge of having such a holding, whichever is later. The BMA may, by written notice, object to such a person if it appears to it that the person is not fit and proper to be such a holder. The BMA may require the holder to reduce its holding of Argo Group’s common shares and direct, among other things, that voting rights attaching to the common shares shall not be exercisable.
Dividends
The payment of dividends by Argo Re is limited under the Insurance Act. Argo Re is prohibited from declaring or paying any dividends during any financial year it is in breach of its minimum solvency margin or minimum liquidity ratio or if the declaration or payment of such dividends would cause it to fail to meet such margin or ratio. As of December 31, 2009, Argo Re’s solvency and liquidity margins and statutory capital and surplus were in excess of the minimum levels required by the Insurance Act. As of December 31, 2009, the unaudited statutory capital and surplus of Argo Re was estimated to be $1,269.2 million and the amount required to be maintained was estimated to be $239.9 million. As of December 31, 2009, Argo Re’s total investments in subsidiaries and amounts due from its parent company, Argo Group, in its statutory balance sheet were approximately $766.4 million.
United States
State Insurance Regulation
The Company’s US insurance subsidiaries are subject to the supervision and regulation of the states in which they are domiciled. The Company currently has eleven insurance companies domiciled in five states (the “U.S. Subsidiaries”). Argo Group, as the indirect parent of the U.S. Subsidiaries, is subject to the insurance holding company laws of Illinois, Louisiana, Ohio, Pennsylvania and Virginia. These laws generally require each of the U.S. Subsidiaries to register with its respective domestic state insurance department and to furnish annually financial and other information about the operations of the companies within the holding company group. Generally, all material transactions among companies in the holding company group to which any of the U.S. Subsidiaries is a party, including sales, loans, reinsurance agreements and service agreements, must be fair and, if material or of a specified category, require prior notice and approval or non-disapproval by the insurance department where the subsidiary is domiciled. Transfers of assets among such affiliated companies, certain dividend payments from insurance subsidiaries and certain material transactions between companies within the group may be subject to prior notice to, or prior approval by, state regulatory authorities. Such supervision and regulation is designed to protect the Company’s policyholders rather than the Company’s shareholders. Matters relating to authorized lines of business, underwriting standards, financial condition standards, licensing of insurers, investment standards, premium levels, policy provisions, the filing of annual and other financial reports prepared on the basis of Statutory Accounting Principles, the filing and form of actuarial reports, dividends, and a variety of other financial and non-financial matters are also areas that are regulated and supervised by the state in which the Company’s insurance subsidiaries are domiciled.
Guarantee Associations
The Company’s U.S. insurance subsidiaries are participants in the statutorily created insolvency guarantee associations in all states where they are admitted licensed carriers. These associations were formed for the purpose of paying claims of insolvent companies. The Company is assessed its pro rata share of such claims based upon its premium writings, subject to a maximum annual assessment per line of insurance. Such costs can generally be recovered through surcharges on future premiums. Non-admitted business is neither supported by or subject to guaranty assessments.
Dividends
Effective December 31, 2007, Argonaut Group, Inc. and PXRE Corporation, two intermediate holding companies of Argo Group, merged. PXRE Corporation was the surviving entity and was renamed Argonaut Group, Inc. Effective April 7, 2008, Argonaut Group, Inc. was renamed Argo Group US, Inc. (“Argo Group US”). As a result of the merger, all of the Company’s U.S. Subsidiaries became subsidiaries of Argo Group US.
10
Table of Contents
As an insurance holding company, the Company is largely dependent on dividends and other permitted payments from its insurance subsidiaries to pay cash dividends to its shareholders, for debt service and for its operating capital. The ability of the Company’s insurance subsidiaries to pay dividends to the Company is subject to certain restrictions imposed by the jurisdictions of domicile that regulate the Company’s immediate insurance subsidiaries and each jurisdiction has calculations for the amount of dividends that an insurance company can pay without the approval of the insurance regulator. Argo Group US is able to receive dividends from its direct subsidiaries: Argonaut Insurance Company, Colony and Rockwood. For the year ended December 31, 2009, Colony paid an extraordinary dividend to Argo Group US in the amount of $90.0 million. The dividend was paid after receiving approval from the Virginia Bureau of Insurance. Additionally, Rockwood paid an extraordinary dividend to Argo Group US in the amount of $15.0 million. The dividend was paid after receiving approval from the Pennsylvania Department of Insurance. During 2010, Argonaut Insurance Company may be permitted to pay dividends of up to $56.8 million in cash without approval from the Illinois Department of Insurance, based on the state of domicile’s ordinary dividend calculation. Colony may be permitted to pay dividends of up to $36.8 million in cash without approval from the Virginia Bureau of Insurance, based on the state of domicile’s ordinary dividend calculation. Rockwood may be permitted to pay dividends of up to $15.6 million in cash without approval from the Pennsylvania Department of Insurance, based on the state of domicile’s ordinary dividend calculation. Business and regulatory considerations may impact the amount of dividends actually paid, and prior approval of dividend payments may be required.
State laws require prior notice or regulatory agency approval of direct or indirect changes in control of an insurer, reinsurer, or its holding company, and of certain significant inter-corporate transfers of assets within the holding company structure. An investor who acquires or attempts to acquire shares representing or convertible into more than 10% of the voting power of the securities of the Company would become subject to at least some of such regulations, would require approval by the five regulators of the Company’s U.S. Subsidiaries prior to acquiring such shares and would be required to file certain notices and reports with the five regulators prior to such acquisition.
The Terrorism Risk Insurance Program Reauthorization Act
The Terrorism Risk Insurance Program Reauthorization Act of 2007 was signed into law by the U.S. President on December 26, 2007. This law renews the prior federal terrorism risk insurance program through December 31, 2014. The program includes protections for acts of domestic terrorism. The insurer deductible is fixed at 20% of an insurer’s direct earned premium, and the federal share of compensation is fixed at 85% of insured losses that exceed insurer deductibles. The U.S. Treasury Department is required to promulgate regulations to determine the pro-rata share of insured losses if they exceed the $100 billion cap. In addition, clear and conspicuous notice to policyholders of the $100 billion cap is required. Under the program reauthorization, the trigger at which federal compensation becomes available remains fixed at $100 million per year through 2014.
United Kingdom
FSA Regulations.
Argo International’s operations are regulated by the U.K. Financial Services Authority (“FSA”) and franchised by Lloyd’s of London. The FSA has substantial powers of intervention in relation to the Lloyd’s managing agents (such as Argo International) which it regulates, including the power to remove their authorization to manage Lloyd’s syndicates. In addition, each year the FSA requires Lloyd’s to satisfy an annual solvency test that measures whether Lloyd’s has sufficient assets in the aggregate to meet all outstanding liabilities of its members, both current and run-off. If Lloyd’s fails this test, the FSA may require Lloyd’s to cease trading and/or its members to cease or reduce underwriting.
Lloyd’s Regulations and Requirements.
Argo International’s operations are franchised by Lloyd’s. The Council of Lloyd’s has wide discretionary powers to regulate members’ underwriting at Lloyd’s. The Lloyd’s Franchise Board is responsible for setting risk management and profitability targets for the Lloyd’s market and operates a business planning and monitoring process for all syndicates, including reviewing and approving the syndicates annual business plan. The Lloyd’s Franchise Board requires annual approval of Argo International’s business plan, including maximum underwriting capacity, and may require changes to any business plan presented to it or that additional capital to be provided to support underwriting. Lloyd’s also imposes various charges and assessments on its member’s. The Group has provided capital to Lloyd’s to support Argo (No 604) Ltd’s (the Group’s main corporate member) underwriting business at Lloyd’s. Dividends from a Lloyd’s managing agent and a Lloyd’s corporate member can be declared and paid provided it has sufficient profits available.
11
Table of Contents
The Group predominately participates in the Lloyd’s market through Argo (No 604) Ltd, a Lloyd’s corporate member. By entering into a membership agreement with Lloyds’s, Argo (No 604) Ltd undertakes to comply with all Lloyd’s bye-laws and regulations as well as the provisions of the Lloyd’s Acts and FSMA that are applicable to it. The underwriting capacity of a member of Lloyd’s must be supported by providing a deposit (referred to as “Funds at Lloyd’s) in the form of cash, securities or letters of credit in an amount determined under the Individual Capital Adequacy regime of the FSA. The amount of such deposit is calculated for each member through the completion of an annual capital adequacy exercise. These requirements allow Lloyd’s to demonstrate that each member has sufficient assets to meet its underwriting liabilities plus a required solvency margin.
If a member of Lloyd’s is unable to pay its debts to policyholders, such debts may be payable by the Lloyd’s Central Fund, which in many respects acts as an equivalent to a state guaranty fund in the United States. If Lloyd’s determines that the Central Fund needs to be increased, it has the power to assess premium levies on current Lloyd’s members. The Council of Lloyd’s has discretion to call or assess up to 3% of a member’s underwriting capacity in any one year as a Central Fund contribution.
Reinsurance
As is common practice within the insurance industry, the Company’s insurance and reinsurance subsidiaries transfer a portion of the risks insured under their policies by entering into a reinsurance treaty with another insurance company. Purchasing reinsurance protects primary carriers against the frequency and/or severity of losses incurred on the policies they issue, such as in the case of unusually serious occurrences in which a number of claims on one policy aggregate to produce an extraordinary loss on one policy or where a catastrophe generates a large number of serious claims on multiple policies at the same time. Reinsurance does not discharge the issuing primary carrier from its obligation to pay a policyholder for losses insured under its policy. Rather, the reinsured portion of each loss covered under a reinsurance treaty is ceded to the assuming reinsurer for reimbursement to the primary carrier. Because this creates a receivable owed by the reinsurer to the primary carrier, there is credit exposure with respect to losses ceded to the extent that any reinsurer is unable or unwilling to meet the obligations assumed under its reinsurance treaty. The ability to collect on reinsurance is subject to the solvency of the reinsurers, interpretation of contract language and other factors. The Company is selective in regard to its reinsurers, seeking out those with strong financial strength ratings from A.M. Best or S&P. However, the financial condition of a reinsurer may change over time based on market conditions. The Company performs credit reviews on its reinsurers, focusing on, among other things, financial condition, stability, trends and commitment to the reinsurance business. In certain instances, the Company also requires deposit of assets in trust, letters of credit or other acceptable collateral to support balances due from certain reinsurers whose financial strength ratings fall below a certain level or who transact business on a non-admitted basis in the case of the US subsidiaries in the state where the Company’s insurance subsidiary is domiciled.
At December 31, 2009, the Company’s reinsurance recoverable balance totaled $1,379.4 million, net of an allowance for doubtful accounts of $9.9 million. The following table reflects the credit ratings for the reinsurers comprising the $1,379.4 million reinsurance recoverable balance at December 31, 2009:
| ($’s in millions) Ratings per AM Best |
Reinsurance Recoverables |
% of Total | |||
| Reinsurers rated A+ or better |
$ | 566.4 | 41.1% | ||
| Reinsurers rated A |
580.8 | 42.1% | |||
| Reinsurers rated A- |
150.7 | 10.9% | |||
| Reinsurers rated below A- or not rated |
81.5 | 5.9% | |||
| $ | 1,379.4 | 100.0% | |||
The top ten reinsurers, all rated A- or higher, accounted for $936.6 million, or approximately 68% of the reinsurance recoverable balance as of December 31, 2009. Management has concluded that all net balances are considered recoverable as of December 31, 2009.
Additional information relating to the Company’s reinsurance activities is included under Item 7 “Management’s Discussion and Analysis of Financial Condition and Results of Operations” on pages 39 - 70 and Note 4, “Reinsurance” in the Notes to the Consolidated Financial Statements.
12
Table of Contents
Reserves for Losses and Loss Adjustment Expenses
The Company records reserves for specific claims incurred and reported and reserves for claims incurred but not reported. The estimates of losses for reported claims are established judgmentally on an individual case basis. Such estimates are based on the Company’s particular experience with the type of risk involved and its knowledge of the circumstances surrounding each individual claim. Reserves for reported claims consider the Company’s estimate of the ultimate cost to settle the claims, including investigation and defense of the claim, and may be adjusted for differences between costs originally estimated and costs re-estimated or incurred.
Reserves for incurred but not reported claims are based on the estimated ultimate cost of settling claims, including the effects of inflation and other social and economic factors, using past experience adjusted for current trends and any other factors that would modify past experience. The Company uses a variety of statistical and actuarial techniques to analyze current claims costs, frequency and severity data, and prevailing economic, social and legal factors. Reserves established in prior years are adjusted as loss experience develops and new information becomes available. Adjustments to previously estimated reserves are reflected in results in the year in which they are made.
The estimate of reinsurance recoverables related to reported and unreported losses and loss adjustment expenses represent the portion of the gross liabilities that are anticipated to be recovered from reinsurers. Amounts recoverable from reinsurers are recognized as assets at the same time as, and in a manner consistent with, the gross losses associated with the reinsurance treaty.
The Company is subject to claims arising out of catastrophes that may have a significant effect on its business, results of operations, and/or financial condition. Catastrophes can be caused by various events, including hurricanes, windstorms, earthquakes, hailstorms, explosions, power outages, severe winter weather, fires and by man-made events, such as terrorist attacks. The incidence and severity of catastrophes are inherently unpredictable. The extent of losses from a catastrophe is a function of both the total amount of insured exposure in the area affected by the event and the severity of the event.
Terrorism peril is deemed by the Company to include the damage resulting from various terrorist attacks through either conventional weapons or weapons of mass destruction such as nuclear or radioactive explosive devices as well as chemical and biological contaminants. The Company continues to review its underwriting data in assessing aggregate exposure to this peril. The Company underwrites against the risk of terrorism with a philosophy of avoidance wherever possible. For both property and casualty exposures, this is accomplished through the use of portfolio tracking tools that identify high risk areas, as well as areas of potential concentration. The Company estimates the probable maximum loss from each risk as well as for the portfolio in total and factors this analysis into the underwriting and reinsurance buying process. The probable maximum loss is a model generated and subject to assumptions that may not be reflective of losses incurred for a terrorist act. The Company also seeks to mitigate this exposure through the use of reinsurance.
Additionally, the Company has identified certain high risk locations and hazardous operations where there is a potential for an explosion or a rapid spread of fire due to a terrorist act. Through modeling, the Company continues to refine its estimates of the probable maximum loss from such an event and factors this analysis into the underwriting evaluation process and also seeks to mitigate this exposure through various policy terms and conditions (where allowed by statute) and through the use of reinsurance, to the extent possible. The Company’s current reinsurance arrangements either exclude terrorism coverage or significantly limit the level of coverage that is provided.
Terrorism exclusions are not permitted in the United States for workers compensation policies under the new federal act or under the laws of any state or jurisdiction in which the Company operates. When underwriting existing and new workers compensation business, the Company considers the added potential risk of loss due to terrorist activity, including foreign and domestic, and this may lead us to decline to underwrite or to renew certain business. However, even in lines where terrorism exclusions are permitted, because the Company’s clients may object to a terrorism exclusion in connection with business that the Company may still desire to underwrite without an exclusion, some or many of its insurance policies may not include a terrorism exclusion. Given the retention limits imposed under the US federal act and that some or many of the Company’s policies may not include exclusion for terrorism, future foreign or domestic terrorist attacks may result in losses that have a material adverse effect on the Company’s business, results of operations and/or financial condition.
The Company has discontinued underwriting certain lines of business; however, the Company is still obligated to pay losses incurred on these lines. Certain lines currently in run-off are characterized by long elapsed periods between the occurrence of a claim and any ultimate payment to resolve the claim. Included in Run-off Lines are claims related to asbestos and environmental liabilities arising out of other liability policies primarily written in the 1960s, 1970s and into the mid-1980s, with a limited number of claims occurring on policies written into the early 1990s. Also included in Run-off Lines is other business previously written and classified by PXRE as property catastrophe and Lloyd’s of London. Business formerly written in the Company’s Risk Management segment is also classified in the Run-off Lines segment. Additional discussion on Run-off Lines can be found under Item 7 “Management’s Discussion and Analysis of Financial Condition and Results of Operations” on pages 39 - 70 and Note 15, “Run-off Lines” in the Notes to the Consolidated Financial Statements.
13
Table of Contents
The tables below present a development of loss and loss adjustment expense reserve liabilities and payments for the years 1999 through 2009. The information presented in Table I is net of the effects of reinsurance. The information presented in Table II includes only amounts related to direct and assumed insurance. The amounts in the tables for the years ended December 31, 1999 to 2000 do not include Colony’s and Rockwood’s unpaid losses and loss adjustment expenses since these entities were acquired in 2001. Amounts for the former PXRE companies are not included for the years prior to 2007, the year of acquisition. Additionally, amounts for Argo International are not included for the years prior to 2008, the year of acquisition.
Table I
Analysis of Losses and Loss Adjustment Expense (“LAE”) Development
(Net of Reinsurance)
| (in millions) | 1999 | 2000 | 2001 | 2002 | 2003 | 2004 | 2005 | 2006 | 2007 | 2008 | 2009 | |||||||||||
| Reserves for Losses and LAE (1) |
$ 706.5 | $ 757.6 | $ 929.6 | $ 838.2 | $ 965.5 | $ 1,060.8 | $ 1,394.8 | $ 1,530.5 | $ 1,863.3 | $ 2,115.6 | $ 2,213.2 | |||||||||||
| Cumulative Amount Paid as of (2) |
||||||||||||||||||||||
| 1 year later |
160.9 | 154.0 | 200.1 | 188.7 | 230.5 | 183.1 | 235.6 | 286.6 | 410.9 | 567.8 | ||||||||||||
| 2 years later |
282.8 | 255.1 | 327.5 | 348.8 | 354.1 | 341.9 | 435.2 | 517.8 | 721.5 | |||||||||||||
| 3 years later |
366.3 | 326.7 | 449.8 | 431.9 | 471.6 | 492.9 | 600.3 | 712.7 | ||||||||||||||
| 4 years later |
426.4 | 394.2 | 509.5 | 514.0 | 588.5 | 614.0 | 734.0 | |||||||||||||||
| 5 years later |
487.0 | 428.4 | 573.1 | 609.3 | 683.0 | 717.1 | ||||||||||||||||
| 6 years later |
517.3 | 471.9 | 656.3 | 688.0 | 765.5 | |||||||||||||||||
| 7 years later |
557.5 | 538.9 | 726.8 | 763.4 | ||||||||||||||||||
| 8 years later |
622.0 | 597.7 | 796.5 | |||||||||||||||||||
| 9 years later |
678.6 | 658.6 | ||||||||||||||||||||
| 10 years later |
738.2 | |||||||||||||||||||||
| Reserves Re-estimated as of (3) |
||||||||||||||||||||||
| 1 year later |
833.9 | 773.2 | 991.5 | 879.0 | 964.6 | 1,216.0 | 1,349.9 | 1,499.4 | 1,798.6 | 2,109.3 | ||||||||||||
| 2 years later |
835.6 | 820.3 | 1,034.0 | 889.9 | 1,158.2 | 1,196.3 | 1,331.4 | 1,472.5 | 1,757.9 | |||||||||||||
| 3 years later |
889.4 | 851.1 | 1,053.5 | 1,090.7 | 1,161.3 | 1,200.2 | 1,306.5 | 1,446.1 | ||||||||||||||
| 4 years later |
919.6 | 875.7 | 1,084.9 | 1,099.7 | 1,187.3 | 1,196.0 | 1,316.3 | |||||||||||||||
| 5 years later |
937.2 | 905.9 | 1,100.9 | 1,138.0 | 1,189.0 | 1,219.5 | ||||||||||||||||
| 6 years later |
968.4 | 921.8 | 1,141.9 | 1,142.6 | 1,208.3 | |||||||||||||||||
| 7 years later |
986.7 | 961.8 | 1,147.7 | 1,166.1 | ||||||||||||||||||
| 8 years later |
1,027.3 | 964.7 | 1,174.3 | |||||||||||||||||||
| 9 years later |
1,030.2 | 987.2 | ||||||||||||||||||||
| 10 years later |
1,049.4 | |||||||||||||||||||||
| Cumulative (Deficiency) Redundancy (4) (5) |
(342.9) | (229.6) | (244.7) | (327.9) | (242.8) | (158.7) | 78.5 | 84.4 | 105.4 | 6.3 | ||||||||||||
| Prior Yr. Cumulative (Deficiency) Redundancy (5) |
(323.7) | (207.1) | (218.1) | (304.4) | (223.5) | (135.2) | 88.3 | 58.0 | 64.7 | - | ||||||||||||
| Change in Cumulative |
||||||||||||||||||||||
| (Deficiency) Redundancy |
$ (19.2) | $ (22.5) | $ (26.6) | $ (23.5) | $ (19.3) | $ (23.5) | $ (9.8) | $ 26.4 | $ 40.7 | $ 6.3 | ||||||||||||
| (1) | Original estimated reserves for losses and LAE, net of reinsurance, as of the balance sheet date for each of the years indicated. |
| (2) | Cumulative amounts paid, net of reinsurance payments as of the end of successive years related to those reserves. |
| (3) | Re-estimated reserves are calculated by adding cumulative amounts paid subsequent to year-end to the re-estimated unpaid losses and LAE for each year. |
| (4) | Cumulative (deficiency) redundancy, compares the adjusted reserves (3) to the reserves as originally established (1) and shows that the reserves as originally recorded were either inadequate or excessive to cover the estimated cost of claims as of the respective year end. |
14
Table of Contents
| (5) | The Cumulative (Deficiency) Redundancy for each of the current year and prior year lines includes $176.2 million of (Deficiency) related to the commutation of the Adverse Development Contract (“ADC”) for each of the 2002 through 2004 years. There is no net effect to the change in Cumulative (Deficiency) Redundancy. |
Table II
Analysis of Losses and Loss Adjustment Expense (“LAE”) Development
(Gross Reserves)
| (in millions) | 1999 | 2000 | 2001 | 2002 | 2003 | 2004 | 2005 | 2006 | 2007 | 2008 | 2009 | ||||||||||||||||||||||
| Reserves for Losses and LAE (1) |
$ | 897.4 | $ | 930.7 | $ | 1,147.8 | $ | 1,281.6 | $ | 1,480.8 | $ | 1,607.5 | $ | 1,875.4 | $ | 2,029.2 | $ | 2,425.5 | $ | 2,996.6 | $ | 3,203.3 | |||||||||||
| Cumulative Amount Paid as of (2) |
|||||||||||||||||||||||||||||||||
| 1 year later |
218.9 | 190.0 | 246.0 | 236.7 | 316.2 | 275.2 | 335.6 | 358.9 | 499.5 | 789.5 | |||||||||||||||||||||||
| 2 years later |
375.2 | 316.1 | 411.5 | 464.6 | 501.0 | 470.4 | 578.5 | 650.4 | 894.6 | ||||||||||||||||||||||||
| 3 years later |
481.6 | 404.8 | 594.1 | 596.1 | 638.8 | 645.5 | 784.1 | 903.7 | |||||||||||||||||||||||||
| 4 years later |
557.1 | 515.2 | 688.8 | 691.3 | 771.7 | 791.9 | 957.1 | ||||||||||||||||||||||||||
| 5 years later |
659.4 | 577.7 | 762.8 | 798.5 | 882.2 | 924.0 | |||||||||||||||||||||||||||
| 6 years later |
716.8 | 628.1 | 854.7 | 890.0 | 990.4 | ||||||||||||||||||||||||||||
| 7 years later |
762.7 | 700.0 | 934.6 | 988.8 | |||||||||||||||||||||||||||||
| 8 years later |
831.9 | 764.4 | 1,025.9 | ||||||||||||||||||||||||||||||
| 9 years later |
893.8 | 844.8 | |||||||||||||||||||||||||||||||
| 10 years later |
971.3 | ||||||||||||||||||||||||||||||||
| Reserves Re-estimated as of (3) |
|||||||||||||||||||||||||||||||||
| 1 year later |
1,048.3 | 966.2 | 1,265.3 | 1,370.1 | 1,489.5 | 1,604.1 | 1,792.0 | 1,960.1 | 2,369.6 | 3,044.0 | |||||||||||||||||||||||
| 2 years later |
1,063.3 | 1,061.3 | 1,346.3 | 1,394.1 | 1,519.2 | 1,547.1 | 1,741.6 | 1,939.8 | 2,333.4 | ||||||||||||||||||||||||
| 3 years later |
1,167.6 | 1,094.0 | 1,381.4 | 1,425.7 | 1,486.5 | 1,540.8 | 1,727.4 | 1,932.3 | |||||||||||||||||||||||||
| 4 years later |
1,197.7 | 1,146.5 | 1,405.4 | 1,410.5 | 1,513.7 | 1,542.9 | 1,764.7 | ||||||||||||||||||||||||||
| 5 years later |
1,242.8 | 1,167.7 | 1,406.0 | 1,455.6 | 1,515.5 | 1,608.2 | |||||||||||||||||||||||||||
| 6 years later |
1,265.5 | 1,171.0 | 1,457.6 | 1,459.4 | 1,587.1 | ||||||||||||||||||||||||||||
| 7 years later |
1,270.9 | 1,218.3 | 1,461.4 | 1,533.1 | |||||||||||||||||||||||||||||
| 8 years later |
1,317.9 | 1,217.9 | 1,533.9 | ||||||||||||||||||||||||||||||
| 9 years later |
1,318.4 | 1,279.1 | |||||||||||||||||||||||||||||||
| 10 years later |
1,372.1 | ||||||||||||||||||||||||||||||||
| Cumulative (Deficiency) Redundancy (4) |
(474.7) | (348.4) | (386.1) | (251.5) | (106.3) | (0.7) | 110.7 | 96.9 | 92.1 | (47.4) | |||||||||||||||||||||||
| Prior Yr. Cumulative (Deficiency) Redundancy |
(421.0) | (287.2) | (313.6) | (177.8) | (34.7) | 64.6 | 148.0 | 89.4 | 55.9 | - | |||||||||||||||||||||||
| Change in Cumulative |
|||||||||||||||||||||||||||||||||
| (Deficiency) Redundancy |
$ | (53.7) | $ | (61.2) | $ | (72.5) | $ | (73.7) | $ | (71.6) | $ | (65.3) | $ | (37.3) | $ | 7.5 | $ | 36.2 | $ | (47.4) | |||||||||||||
| (1) | Original estimated reserves for losses and LAE, prior to the effects of reinsurance, as of the balance sheet date for each of the years indicated. |
| (2) | Cumulative amounts paid, prior to the effects of reinsurance as of the end of successive years related to those reserves. |
| (3) | Re-estimated reserves are calculated by adding cumulative amounts paid subsequent to year-end to the re-estimated unpaid losses and LAE for each year. |
| (4) | Represents changes of the original estimate of the year indicated (1) and the reserves re-estimated (3) as of the current year-end. |
Excluded from the preceding tables are loss reserves of $135.7 million, which are classified as “Liabilities held for sale” as of December 31, 2007.
On September 15, 2005, the Company commuted the ADC which originally became effective in 2002. Reserves previously ceded under the contract of $176.2 million are added back to the Reserves Re-estimated section of the Analysis of Losses and Loss Adjustment Expense Development Net of Reinsurance table for the 2002 through 2004 years and is included in the 2005 Reserves for Losses and LAE line. As a result, the Cumulative (Deficiency) Redundancy line and the Prior Year Cumulative (Deficiency) Redundancy line include a $176.2 million deficiency related to the commutation for each of the 2002 through 2004 years. Retention of loss reserves previously ceded under the ADC did not result in additional loss expense to the Company.
15
Table of Contents
Caution should be exercised in evaluating the information shown in the above tables. It should be noted that each amount includes the effects of all changes in amounts for prior periods. In addition, the tables present calendar year data, not accident or policy year development data, that some readers may be more accustomed to analyzing. The social, economic and legal conditions and other trends which have had an impact on the changes in the estimated liability in the past are not necessarily indicative of the future. Accordingly, readers are cautioned against extrapolating any conclusions about future results from the information presented in these tables.
Additional information relating to our loss reserve development is included under Item 7 “Management’s Discussion and Analysis of Financial Condition and Results of Operations” on Pages 39 – 70 and Note 6, “Reserves for Losses and Loss Adjustment Expenses” in the Notes to Consolidated Financial Statements.
Investments
Insurance company investments must comply with applicable regulatory and domicile constraints which generally prescribe the type, quality and concentrations of investments. These regulations permit, and the Company holds, a diversified portfolio of investments in high quality corporate bonds, U.S. Treasury notes, securities issued and/or guaranteed by government or government agencies, structured securities, including asset and mortgage backed, state and municipal bonds and preferred and common stocks. The majority of the Company’s invested assets are held by its insurance and reinsurance companies and on behalf of the syndicate. These securities are classified as available for sale and are recorded at fair value. Management of the available for sale portfolio is done with consideration of changes in market conditions, changes in tax circumstances, and to maintain an appropriate matching of asset and liability duration, among other factors.
The Company’s investment policy is approved by the Board of Directors and its Investment Committee, who regularly monitor overall investment results and compliance with investment objectives and guidelines. The investment policy specifies minimum levels of overall credit quality as well as maximum levels of issuer and sector concentration in order to achieve an appropriate level of diversification. The policy also provides guidelines on overall duration for the fixed income portfolio and for the equity portfolio, maximum levels of issuer concentrations based on the market capitalization of the issuer. At December 31, 2009, the fixed income securities had an average credit quality of AA+, duration of 3.0 years, and approximately 99.5% were rated as investment grade.
The Company’s investment strategy is to preserve principal and maximize net investment income while generating competitive after-tax total rates of return subject to appropriate levels of risk. The Company manages the duration of the fixed income portfolio relative to the aggregate duration of its insurance and reinsurance liabilities. Although the Company generally intends to hold fixed income securities to maturity, it may re-evaluate its position based upon market conditions and the underlying fundamentals of securities.
The Company primarily utilizes four professional fixed income managers to manage the fixed income portfolios. The majority of the equity portfolio is managed through an external investment manager, Fayez Sarofim & Co (see “Related Party Transactions” on page 55.) Certain short-term investments and other strategic investments are managed internally.
Additional information relating to the Company’s investment portfolio is included under Item 7 “Management’s Discussion and Analysis of Financial Condition and Results of Operations” on pages 39 - 70 and Note 3, “Investments” in the Notes to Consolidated Financial Statements.
Employees
As of December 31, 2009, the Company had 1,331 employees. The Company provides a comprehensive benefits program for substantially all of its employees, including a 401(k) savings plan, health, life and disability benefits and a tuition reimbursement program. Management believes that the Company’s relationship with its employees is good.
A number of the Company’s Bermuda based employees, including the Chief Executive Officer of the Company, are employed pursuant to work permits granted by Bermuda authorities. These permits expire at various times over the next few years. The Bermuda government has a policy that limits the duration of work permits to six years, subject to certain exemptions for key employees.
16
Table of Contents
Available Information
The Company’s executive offices are located at 110 Pitts Bay Road, Pembroke HM08, Bermuda. The Company’s mailing address is P.O. Box HM 1282, Hamilton HM FX, Bermuda. Its telephone number is (441) 296-5858. The Company’s website address is www.argolimited.com. The Company files annual, quarterly and current reports, proxy statements and other information and documents with the SEC, which are made available to read and copy at the SEC’s Public Reference Room at 100 F Street, N.E., Washington, D.C. 20549. You may obtain information on the operation of the Public Reference Room by contacting the SEC at 1-800-SEC-0330. Reports filed with the SEC are also made available at www.sec.gov. The Company makes available free of charge on its website its annual report on Form 10-K, quarterly reports on Form 10-Q, current reports on Form 8-K and amendments to those reports filed with or furnished to the SEC pursuant to Section 13 or 15(d) of the Securities Exchange Act of 1934 as soon as reasonably practical after it electronically files them with or furnishes them to the SEC.
| Item 1A. | Risk Factors |
An investment in the Company’s common shares involves various risks, including those mentioned below and those that are discussed from time to time in our other periodic filings with the SEC. Investors should carefully consider these risks, along with the other information filed in this report, before making an investment decision regarding our common shares. There may be additional risks which the Company is currently unaware of or which we currently consider immaterial. All of these risks could have a material adverse effect on our financial condition, results of operations and/or value of our common shares.
Risks Related to the Business of Insurance and Reinsurance
The insurance and reinsurance business is historically cyclical, and Argo Group may experience periods with excess underwriting capacity and unfavorable premium rates; conversely, Argo Group may have a shortage of underwriting capacity when premium rates are strong both of which could adversely impact Argo Group’s results.
Historically, insurers and reinsurers have experienced significant fluctuations in operating results due to competition, frequency and severity of catastrophic events, levels of capacity, adverse trends in litigation, regulatory constraints, general economic conditions and other factors. The supply of insurance and reinsurance is related to prevailing prices, the level of insured losses and the level of industry capital that, in turn, may fluctuate in response to changes in rates of return on investments being earned in the insurance and reinsurance industry. As a result, the insurance and reinsurance business historically has been a cyclical industry characterized by periods of intense price competition due to excessive underwriting capacity as well as periods when shortages of capacity increased premium levels. Demand for reinsurance depends on numerous factors, including the frequency and severity of catastrophic events, levels of capacity, general economic conditions and underwriting results of primary insurers. The supply of reinsurance is related to prevailing prices, recent loss experience and capital levels. All of these factors fluctuate and may contribute to price declines generally in the reinsurance industry.
Argo Group cannot predict whether market conditions will improve, remain constant or continue to deteriorate. Negative market conditions may impair our ability to underwrite insurance and reinsurance at rates that Argo Group considers appropriate relative to the risk assumed. If Argo Group cannot underwrite insurance or reinsurance at appropriate rates, its ability to transact business would be materially and adversely affected. Any of these factors could lead to an adverse effect on Argo Group’s business, results of operations and/or financial condition.
We operate in a highly competitive environment and no assurance can be given that we will be able to compete effectively in this environment.
We compete with numerous companies that provide property-based lines of insurance and reinsurance. Although we employ an experienced management team, have a strong capital position, and have a financial strength rating of “A” rating from A.M. Best, no assurance can be given that we will be able to compete successfully in the insurance and/or reinsurance market. Increased competition in these markets could result in a change in the supply and/or demand for insurance or reinsurance, our ability to price our products at attractive rates and retain existing business, or write new business on favorable terms. If this increased competition so limits our ability to transact business, our operating results could be adversely affected.
17
Table of Contents
Argo Group’s insurance and reinsurance subsidiaries have exposure to unpredictable and unexpected industry practices, catastrophes, and terrorist acts that can materially and adversely affect its business, results of operations and/or financial condition.
Emerging Claims. Changes in industry practices and legal, judicial, social and other environmental conditions may have an unexpected adverse impact on claims and coverage issues. These issues may adversely affect Argo Group’s business such as extending coverage beyond its underwriting intent or increasing the number or size of expected claims. In some instances, these changes may not become apparent until some time after insurance or reinsurance contracts that are affected were issued. As a result, the full extent of liability under Argo Group’s insurance or reinsurance contracts may not be known for many years after contracts are issued, and the Company’s financial position and results of operations may be materially and adversely affected in such future periods. The effects of these and other unforeseen emerging claims and coverage issues are inherently difficult to predict.
Catastrophic Losses. Argo Group is subject to claims arising out of catastrophes that may have a significant effect on its business, results of operations, and/or financial condition. Catastrophes can be caused by various events, including tornadoes, hurricanes, windstorms, earthquakes, hailstorms, explosions, power outages, severe winter weather, fires and intentional man-made events, such as terrorist attacks. The incidence and severity of catastrophes are inherently unpredictable. The extent of losses from a catastrophe is a function of both the total amount of insured exposure in the area affected by the event and the severity of the event. Insurance companies are not permitted to reserve for catastrophes until such event takes place. Therefore, although Argo Group will actively manage its exposure to catastrophes through its underwriting process and the purchase of reinsurance protection, an especially severe catastrophe or series of catastrophes could exceed its reinsurance protection and may have a material adverse impact on Argo Group’s business, results of operations and/or financial condition. Also, it is possible that a series of catastrophic events could occur with unusual frequency in a given period which, although individually not severe enough to reach the attachment point of reinsurance protection, in the aggregate could have a material adverse impact on the Company.
Further, as a reinsurer of property catastrophe-type coverage in the worldwide marketplace, Argo Re’s operating results in any given period will depend to some extent on the number and magnitude of such natural and man-made catastrophes. While Argo Re may, depending on market conditions, purchase catastrophe retrocessional coverage for its own protection, the occurrence of one or more major catastrophes in any given period could nevertheless have a material adverse impact on Argo Re’s operating results and/or financial condition. This could, in turn, result in a material adverse impact on Argo Group’s business, results of operations and/or financial condition.
Terrorism. Argo Group may also have exposure to losses resulting from acts of terrorism. Even if reinsurers are able to exclude coverage for terrorist acts or price that coverage at rates that Argo Group considers unattractive, direct insurers, like Argo Group’s primary insurance company subsidiaries, might not be able to likewise exclude terrorist acts because of regulatory constraints. If this does occur, Argo Group, in its capacity as a primary insurer, would have a significant gap in its reinsurance protection and would be exposed to potential losses as a result of any terrorist acts. These events are inherently unpredictable. It is difficult to predict occurrence of such events with statistical certainty or to estimate the amount of loss per occurrence they will generate. If there is a future terrorist attack, the possibility remains that losses resulting from such event could prove to be material to our financial condition and results of operations. Terrorist acts may also cause multiple claims, and there is no assurance that our attempts to limit our liability through contractual policy provisions will be effective.
The Terrorism Risk Insurance Program Reauthorization Act of 2007 was signed into law by the U.S. President on December 26, 2007. This law renews the prior federal terrorism risk insurance program through December 31, 2014. The program includes protections for acts of domestic terrorism. The insurer deductible is fixed at 20% of an insurer’s direct earned premium, and the federal share of compensation is fixed at 85% of insured losses that exceed insurer deductibles. The U.S. Treasury Department is required to promulgate regulations to determine the pro-rata share of insured losses if they exceed the $100 billion cap. In addition, clear and conspicuous notice to policyholders of the $100 billion cap is required. Under the program reauthorization, the trigger at which federal compensation becomes available remains fixed at $100 million per year through 2014.
Global climate change may have an adverse effect on our financial results.
Although uncertainty remains as to the nature and effect of greenhouse gas emissions, we could suffer losses if global climate change results in an increase in the frequency and severity of natural disasters. As with traditional natural disasters, claims arising from these incidents could increase our exposure to losses and have a material adverse impact on Argo Group’s business, results of operations, and/or financial condition.
18
Table of Contents
Because our business is dependent upon insurance and reinsurance agents and brokers, we are exposed to certain risks that could cause our results to be aversely affected.
Argo Group markets and distributes some of our insurance products through a select group of wholesale agents who have limited quoting and binding authority and who, in turn, sell our insurance products to insureds through retail insurance brokers. These agencies can bind certain risks that meet our pre-established guidelines without our initial approval. If these agents failed to comply with our underwriting guidelines and the terms of their appointment, we could be bound on a particular risk or number of risks that were not anticipated when we developed the insurance products. Such actions could adversely affect our results of operations. Additionally, in any given period we may derive a significant portion of our business from a limited number of agents and brokers and the loss of any of these relationships could have a significant impact on our ability to market our products and services.
In accordance with industry practice, we may pay amounts owed on claims under our insurance and reinsurance contracts to brokers who in turn remit these amounts to our insureds or reinsureds. Although the law is unsettled and depends upon the facts and circumstances of each particular case, in some jurisdictions, if an agent or broker fails to remit funds delivered for the payment of claims, we may remain liable to our insured or reinsured ceding insurer for the deficiency. Likewise, in certain jurisdictions, when the insured or reinsured pays the remitting funds to our agent or broker in full, our premiums are considered to have been paid in full, notwithstanding that we may or may not have actually received the premiums from the agent or broker. Consequently, we assume a degree of credit risk associated with certain agents and brokers with whom we transact business.
Argo Group may incur income statement charges (or benefits) if the reserves for losses and loss adjustment expenses are insufficient (or redundant). Such income statement charges (or benefits) could be material, individually or in the aggregate, to the Company’s financial condition and operating results in future periods and could result in rating agency actions and/or the need to raise capital.
General Loss Reserves. Argo Group maintains reserves for losses and loss adjustment expenses to cover estimated ultimate unpaid liabilities with respect to reported and unreported claims incurred as of the end of each balance sheet date. Reserves do not represent an exact calculation of liability, but instead represent management’s best estimates, which take into account various statistical and actuarial projection techniques as well as other influencing factors. These reserve estimates represent management’s expectations of what the ultimate settlement and administration of claims will cost based on an assessment of facts and circumstances then known, review of historical settlement patterns, estimates of trends in claims severity and frequency, changing legal theories of liability and other factors. Variables in the reserve estimation process can be affected by both internal and external events, such as changes in claims handling procedures, economic inflation, legal trends and legislative changes. Many of these items are not directly quantifiable, particularly on a prospective basis. Additionally, there may be significant reporting lags between the occurrence of an insured event and the time it is actually reported to the insurer, which can be of particular concern in two of our markets, reinsurance and excess. Reserve estimates are continually refined in a regular ongoing process as historical loss experience develops and additional claims are reported and settled, and as a consequence, management’s estimates may change from time to time. Because establishment of the reserves for losses and loss adjustment expenses is an inherently uncertain process involving estimates, currently established reserves may be insufficient (or redundant) or estimates of ultimate losses and loss adjustment expenses may increase (or decrease).
Asbestos and Environmental Liability Loss Reserves. The Company has received asbestos and environmental liability claims arising out of other liability coverage primarily written in the 1960s, 1970s and into the mid-1980s. Argo Group has a specialized claims unit that investigates and adjusts asbestos and environmental claims. Beginning in 1986, nearly all standard liability policies contained an express exclusion for asbestos and environmental related claims. All policies currently being issued by Argo Group’s insurance subsidiaries contain this exclusion. In addition to the previously described general uncertainties encountered in estimating reserves, there are significant additional uncertainties in estimating the amount of Argo Group’s potential losses from asbestos and environmental claims. Reserves for asbestos and environmental claims cannot be estimated with traditional loss reserving techniques that rely on historical accident year development factors due to the uncertainties surrounding these types of claims. Among the uncertainties impacting the estimation of such losses are:
| • | potentially long waiting periods between exposure and emergence of any bodily injury or property damage; |
19
Table of Contents
| • | difficulty in identifying sources of environmental or asbestos contamination; |
| • | difficulty in properly allocating responsibility and/or liability for environmental or asbestos damage; |
| • | changes in underlying laws and judicial interpretation of those laws; |
| • | potential for an environmental or asbestos claim to involve many insurance providers over many policy periods; |
| • | long reporting delays from insureds to insurance companies; |
| • | historical data concerning asbestos and environmental losses, which is more limited than historical information on other types of claims; |
| • | questions concerning interpretation and application of insurance coverage; and |
| • | uncertainty regarding the number and identity of insureds with potential asbestos or environmental exposure. |
Argo Group’s management believes that these factors continue to render traditional actuarial methods less effective at estimating reserves for asbestos and environmental losses than reserves on other types of losses. Argo Group establishes reserves to the extent that, in the judgment of its management, the facts and prevailing law reflect an exposure for Argo Group not dissimilar to those results the industry has experienced with regard to asbestos and environmental related claims. The Company has annually reviewed its loss and loss adjustment expense reserves for its run-off lines of business, including its asbestos and environmental claims. The review entails a detailed analysis of its direct and assumed exposure. Argo Group will continue to monitor industry trends and its own experience in order to determine the adequacy of its environmental and asbestos reserves.
Black Lung Disease Loss Reserves. Through Argo Group’s subsidiary Rockwood, Argo Group has exposure to claims for black lung disease. Those diagnosed with black lung disease are eligible to receive workers compensation benefits from various US federal and state programs. These programs are continually being reviewed by the governing bodies and may be revised without notice in such a way as to increase the level of Argo Group’s exposure. Argo Group’s subsidiary, Colony, also currently underwrites environmental and pollution coverages (on a limited number of policies) for underground storage tanks.
Because of all of the above, estimates of ultimate losses and loss adjustment expenses may increase in the future. Income statement charges that would result from such increases, if any, cannot now be reasonably estimated. Such charges could be material, individually or in the aggregate, to Argo Group’s future operating results and financial condition and could result in rating agency actions and/or the need to raise capital. The Company can provide no assurances such capital will be available. Adjustments to reserves are reflected in the results of the periods in which the estimates are changed.
Additional information relating to the Company’s reserves for losses and loss adjustment expense is included under Item 7 “Management’s Discussion and Analysis of Financial Condition and Results of Operations” on pages 39 - 70 and Note 6 “Reserves for Losses and Loss Adjustment Expenses” in the Notes to Consolidated Financial Statements.
Argo Re’s inability to provide the necessary collateral could affect Argo Re’s ability to offer reinsurance in certain markets.
Argo Re is not licensed or admitted as an insurer in any jurisdiction other than Bermuda. Because many jurisdictions do not permit insurance companies to take credit for reinsurance obtained from unlicensed or non-admitted insurers in statutory financial statements unless appropriate security is in place, Argo Re anticipates that its reinsurance clients will typically require it to post a letter of credit or other collateral. If Argo Re is unable to arrange for security on commercially reasonable terms, Argo Re could be limited in its ability to underwrite business for certain of its clients.
Argo Group faces a risk of non-availability of reinsurance, which could materially and adversely affect its business, results of operations and/or financial condition.
As is common practice within the insurance industry, Argo Group transfers a portion of the risks insured under its policies to other companies through the purchase of reinsurance. This reinsurance is maintained to protect the insurance and reinsurance subsidiaries against the severity of losses on individual claims, unusually serious occurrences in which a number of claims produce an aggregate extraordinary loss and catastrophic events. Although reinsurance does not discharge Argo Group’s subsidiaries from their primary obligation to pay for losses insured under the policies they issue, reinsurance does make the assuming reinsurer liable to the insurance and reinsurance subsidiaries for the reinsured portion of the risk. A credit exposure exists with respect to ceded losses to the extent that any reinsurer is unable or unwilling to meet the obligations assumed under the reinsurance contracts. The collectability of reinsurance is subject to the solvency of the reinsurers, interpretation and application of contract language and other factors. Argo Group is selective in regard to its reinsurers, placing reinsurance with those reinsurers with strong financial strength ratings from A.M. Best, S&P, or a combination thereof, although the financial condition of a reinsurer may change based on market conditions. Argo Group performs credit reviews on its reinsurers, focusing on, among other things, financial condition, stability, trends and commitment to the reinsurance business. Argo Group also requires assets in trust, letters of credit or other acceptable collateral to support balances due from reinsurers not authorized to transact business in the applicable jurisdictions. It has not always been standard business practice to require security for balances due; therefore, certain balances are not collateralized. A reinsurer’s insolvency or inability to make payments under the terms of a reinsurance contract could have a material adverse effect on Argo Group’s business, results of operations and/or financial condition.
20
Table of Contents
There can be no assurance that the Company and its subsidiaries will not experience a ratings downgrade, which may result in an adverse effect on Argo Group’s business, financial condition and operating results.
Ratings with respect to claims paying ability and financial strength are important factors in establishing the competitive position of insurance companies and will also impact the cost and availability of capital to an insurance company. Ratings by A.M. Best and S&P represent an important consideration in maintaining customer confidence in Argo Group and in its ability to market insurance products. Rating organizations regularly analyze the financial performance and condition of insurers.
All of Argo Group’s insurance and reinsurance subsidiaries have a Financial Strength Rating of “A (Excellent)” (3rd highest rating out of 16 rating classifications) with a stable outlook from A.M Best. S&P has assigned a Financial Strength Rating of “A- (Strong)” to Argo Group’s U.S. insurance subsidiaries. Argo Group US has an Issuer Credit Rating of “BBB- (Good)” with a stable outlook from S&P.
Argo Group’s ratings are subject to periodic review by those entities and the continuation of those ratings cannot be assured. A significant downgrade in these ratings could affect Argo Group’s competitive position in the insurance industry, make it more difficult for Argo Group to market its products and result in a material loss of business as policyholders move to other companies with higher claims-paying and financial strength ratings.
Risks Related to Regulatory Constraints
Regulatory constraints may restrict Argo Group’s ability to operate its business.
General Regulatory Constraints
Restrictions on Ownership. Argo Group’s ownership of U.S. subsidiaries can, under applicable state insurance company laws and regulations, delay or impede a change of control of Argo Group. Under applicable insurance regulations, any proposed purchase of 10% or more of the voting securities of Argo Group would require the prior approval of the relevant insurance regulatory authorities.
Except as provided below, shareholders have one vote for each common share held by them and are entitled to vote at all meetings of shareholders. However, for so long as the shares of a shareholder are treated as “controlled shares” (as determined under section 958 of the Code) of any U.S. Person (that owns shares directly or indirectly through non-U.S. entities) and such controlled shares constitute 9.5% or more of the votes conferred by Argo Group’s issued shares, the voting rights with respect to the controlled shares of such U.S. Person, which we refer to as a 9.5% U.S. Shareholder, will be limited, in the aggregate, to a voting power of less than 9.5% under a formula specified in Argo Group’s bye-laws. The formula is applied repeatedly until the voting power of all 9.5% U.S. Shareholders has been reduced to less than 9.5%. In addition, the board of Argo Group may limit a shareholder’s voting rights where it deems it appropriate to do so to (i) avoid the existence of any 9.5% U.S. Shareholder; and (ii) avoid certain material adverse tax, legal or regulatory consequences to Argo Group, any subsidiary of Argo Group or any direct or indirect shareholder or its affiliates. “Controlled shares” include, among other things, all shares of Argo Group that such U.S. Person is deemed to own directly, indirectly or constructively (within the meaning of section 958 of the Code).
21
Table of Contents
Under these provisions, certain shareholders may have their voting rights limited, while other shareholders may have voting rights in excess of one vote per share. Moreover, these provisions could have the effect of reducing the votes of certain shareholders who would not otherwise be subject to the 9.5% limitation by virtue of their direct share ownership.
Regulation of Subsidiaries
General. Argo Group’s insurance and reinsurance subsidiaries and insurance-related services subsidiaries may not be able to obtain or maintain necessary licenses, permits, authorizations or may be able to do so only at significant cost. In addition, Argo Group may not be able to comply with, or obtain appropriate exemptions from, the wide variety of laws and regulations applicable to insurance or reinsurance companies or insurance-related services companies or holding companies. Failure to comply with or to obtain appropriate authorizations and/or exemptions under any applicable laws could result in restrictions on Argo Group’s ability to do business or certain activities that are regulated in one or more of the jurisdictions and could subject Argo Group to fines and other sanctions, which could have a material adverse effect on Argo Group’s business.
Argo Group’s U.S. Subsidiaries. Argo Group’s U.S. insurance subsidiaries are subject to extensive regulation which may reduce our profitability or inhibit our growth. If we fail to comply with these regulations, we may be subject to penalties, including fines and suspensions, which may adversely affect our financial condition and results of operations. Finally, changes in the level of regulation of the insurance industry or changes in laws or regulations themselves or interpretations by regulatory authorities could adversely affect our ability to operate our business.
The U.S. insurance industry is highly regulated and supervised. Our insurance subsidiaries are subject to the supervision and regulation of each of the states in which they are domiciled and the states in which they do business. Such supervision and regulation is designed to protect our policyholders rather than our shareholders. These regulations are generally administered by a department of insurance in each state and relate to various aspects of our business. State insurance departments also conduct periodic examinations of the affairs of insurance and reinsurance companies and require the filing of annual and other reports relating to financial condition, holding company issues and other matters. These regulatory requirements may adversely affect or inhibit our ability to achieve some or all of our business objectives.
In addition, regulatory authorities have relatively broad discretion to deny, suspend or revoke licenses for various reasons, including the violation of regulations. If we do not have the requisite licenses and approvals or do not comply with applicable regulatory requirements, insurance regulatory authorities could preclude or temporarily suspend us from carrying on some or all of our activities or otherwise penalize us. This could adversely affect our ability to operate our business.
From time to time, various regulatory and legislative changes have been proposed in the U.S. insurance industry, some of which could have an effect on reinsurers and insurers. Among the proposals that have in the past been or are at present being considered are the possible introduction of federal regulation in addition to, or in lieu of, the current system of state regulation of insurers, an initiative to create a federally guaranteed disaster reinsurance pool pre-funded by insurers and proposals in various state legislatures (some of which have been enacted) to conform portions of their insurance laws and regulations to various model acts adopted by the National Association of Insurance Commissioners. Also currently being considered is a bill to improve and streamline the regulation of non-admitted insurance and reinsurance. The Company is unable to predict what effect, if any, the foregoing developments may have on its operations and financial condition in the future.
Argo Group’s Bermuda Subsidiary. Argo Re is registered as a Class 4 Bermuda insurance company and is subject to regulation and supervision in Bermuda. Changes in Bermuda insurance statutes, regulations and the policies of the BMA could result in restrictions on Argo Re’s ability to pursue its business plans, issue reinsurance policies, distribute funds and execute its investment strategy.
U.K. Financial Services Authority (“FSA”) Regulations. Argo International (formerly known as Heritage Underwriting Agency plc) operations are regulated by the FSA and franchised by Lloyd’s. The FSA has substantial powers of intervention in relation to the Lloyd’s managing agents (such as Argo International) which it regulates, including the power to remove their authorization to manage Lloyd’s syndicates. In addition, each year the FSA requires Lloyd’s to satisfy an annual solvency test that measures whether Lloyd’s has sufficient assets in the aggregate to meet all outstanding liabilities of its members, both current and run-off. If Lloyd’s fails this test, the FSA may require Lloyd’s to cease trading and/or its members to cease or reduce underwriting. Future regulatory changes or rulings by the FSA could interfere with Argo International’s business strategy or financial assumptions, possibly resulting in an adverse effect on Argo International’s financial condition and operating results.
22
Table of Contents
Lloyd’s of London Regulations and Requirements. Argo International’s operations are franchised by Lloyd’s. The Lloyd’s Franchise Board requires annual approval of Argo International’s business plan, including maximum underwriting capacity, and may require changes to any business plan presented to it or additional capital to be provided to support underwriting. Lloyd’s also imposes various charges and assessments on its member companies. If Lloyd’s required material changes in Argo International’s business plans, or if charges and assessments payable by Argo International to Lloyd’s were to increase significantly, these events could have an adverse effect on the operations and financial results of Argo International. In addition, no assurances can be given as to how much business Lloyd’s will permit Argo International to underwrite in 2010 and subsequent years nor as to the viability and cost of the capital structure we may use as a substitute for the external capital and reinsurance used by Argo International in 2009 and prior underwriting years.
The financial security of the Lloyd’s market is regularly assessed by three independent rating agencies (A.M. Best, Standard & Poor’s, Fitch Ratings). A satisfactory credit rating issued by an accredited rating agency is necessary for Lloyd’s syndicates to be able to trade in certain classes of business at current levels. Argo International would be adversely affected if Lloyd’s current ratings were downgraded.
Other Applicable Laws. Lloyd’s worldwide insurance and reinsurance business is subject to various regulations, laws, treaties and other applicable policies of the European Union, as well as each nation, state and locality in which it operates. Material changes in governmental requirements and laws could have an adverse affect on Lloyd’s and its member companies, including Argo International.
Argo Group is a holding company and if its subsidiaries do not make dividend payments to Argo Group, Argo Group may not be able to pay dividends or other obligations.
Argo Group is a holding company with no significant operations or significant assets other than the share capital of its subsidiaries. Argo Group relies primarily on cash dividends from its subsidiaries to pay its operating expenses and obligations. Argo Group expects future distributions from these subsidiaries to be its principal source of funds to pay expenses and dividends. The payment of dividends by Argo Group’s insurance and reinsurance subsidiaries is limited under Bermuda law, Irish law and under the Illinois, Virginia, Pennsylvania, Ohio and Louisiana insurance laws, which are the states of domicile for Argonaut Insurance Company, Colony Insurance Company and Rockwood Casualty Insurance Company, Argo Group US’s directly owned insurance subsidiaries. These states regulate the maximum amount of annual dividends or other distributions available to shareholders without prior approval of the state regulatory authorities.
Bermuda insurance laws require Argo Re to maintain certain measures of solvency and liquidity, and further limit the amount by which we can reduce surplus without prior regulatory approval.
Risks Related to Our Business Operations
Argo Group may be unable to attract and retain qualified employees and key executives.
We depend on our ability to attract and retain experienced underwriting talent and other skilled employees and key executives who are knowledgeable about our business. If the quality of our underwriting team and other personnel decreases, we may be unable to maintain our current competitive position in the specialized markets in which we operate and be unable to expand our operations into new markets, which could adversely affect our results.
Argo Group is domiciled in Bermuda. Under Bermuda law, non-Bermudians, with some limited exceptions, may not engage in any occupation in Bermuda without an appropriate governmental work permit. The Bermuda government will issue a work permit for a specific period of time, which may be extended upon showing that, after proper public advertisements, no Bermudian (or spouse of a Bermudian or holder of a permanent resident certificate) is available who meets the minimum standards for the advertised position. The Bermuda government has a policy that limits the duration of these work permits to six years, subject to certain exemptions for key employees. A substantial number of Argo Group’s Bermuda based employees are employed pursuant to these work permits granted by Bermuda authorities. If the Bermuda government refuses to extend the work permits of key Argo Group employees, our operations could be disrupted and our financial performance could be adversely affected.
23
Table of Contents
Litigation and legal proceedings against Argo Group could have an adverse effect on Argo Group’s financial condition.
Between May 3, 2006 and June 16, 2006, several class action lawsuits were filed against PXRE Group Ltd. (now Argo Group) and certain former officers of PXRE on behalf of a putative class of plaintiffs consisting of investors who purchased PXRE securities traded on the NYSE under the ticker symbol “PXT” between September 11, 2005 and February 22, 2006. These lawsuits were consolidated into one proceeding before the United States District Court for the Southern District of New York and were the subject of an Amended Class Action Complaint filed on June 15, 2007 (the “Amended Complaint”). The Amended Complaint alleges that during the purported class period PXRE fraudulently understated the full impact of hurricanes Katrina, Rita and Wilma on PXRE’s business and that certain PXRE executives made a series of materially false and misleading statements or omissions about PXRE’s business, prospects and operations in violation of Sections 10(b) and 20(a) of the Securities Exchange Act of 1934, as amended (the “1934 Act”), and Rule 10b-5 promulgated under the 1934 Act. On March 4, 2009, the Amended Complaint was dismissed with prejudice by the District Court. On December 21, 2009 the District Court’s decision was affirmed on appeal to the United States Court of Appeals for the Second Circuit, and the class plaintiff’s petition for rehearing was denied by the Court of Appeals on January 11, 2010.
On December 4, 2008, a lawsuit was filed against PXRE., Argo Group and certain of PXRE’s former officers in United States District Court for the Southern District of New York alleging causes of action based on facts and circumstances on behalf of a group of institutional shareholders that purchased Series D Perpetual Non-voting Preferred Shares of PXRE pursuant to the Private Placement Memorandum dated on or about September 28, 2005, (the “Private Placement”). The lawsuit alleges that the Private Placement was a public offering and that the Private Placement Memorandum contained false and misleading statements or omissions concerning PXRE’s business, prospects and operations actionable under Section 12(a) (2) of the Securities Act of 1933. In addition, the lawsuit alleges claims under New York state law for negligent misrepresentation and common law fraud based upon, among other things, statements contained in the Private Placement Memorandum and alleged false and misleading statements by PXRE’s named former officers. On April 6, 2009, the institutional investors filed an amended complaint. The Company filed a motion to dismiss the amended complaint on May 6, 2009. On January 26, 2010 the District Court granted the Company’s motion, dismissing the plaintiffs’ federal law causes of action without prejudice, and holding that the amended complaint failed to allege facts that would show that the Private Placement could be construed to be a public offering or that the Private Placement should be integrated with PXRE’s public share offering. The Court’s order provided the plaintiffs with a deadline of February 22, 2010 to file amended pleadings setting forth the nature of the entities to which the Private Placement was offered. Based on the dismissal of the federal law claims, the Court’s order also dismissed without prejudice all state law claims asserted by the plaintiffs for lack of subject matter jurisdiction, without prejudice to the plaintiffs’ right to file a separate action in state court asserting such claims. On February 22, 2010 the plaintiffs filed a Second Amended Complaint in the District Court case seeking to overcome the deficiencies outlined in the order of dismissal. The Company does not believe that the Second Amended Complaint is sufficient to comply with the relevant legal standard, and plans to file a Motion to Dismiss accordingly.
Although the Company has received no notice of any other potential lawsuits or other proceedings relating to the alleged facts and circumstances described above, it is possible that the Company could be the subject of additional litigation or regulatory inquiries regarding such matters in the future.
At this stage, the Company is unable to determine with any reasonable certainty the specific claims, litigants, or alleged damages that ultimately may be associated with the pending securities litigation, Private Placement lawsuit or any other future proceedings regarding the alleged facts and circumstances described above, nor can the Company currently predict the timing of any rulings, trials or other significant events relating to such proceedings. Given these limitations and the inherent difficulty of projecting the outcome of litigated disputes, the Company is unable to reasonably estimate the possible loss, range of loss or legal costs that are likely to arise out of the pending securities litigation or any future proceedings relating to the above matters at this time. The Company has insurance protection that may cover a portion of any potential loss or legal costs, but a settlement above the coverage limits could impact the Company’s financial position.
Based on all information available to the Company at this time, management of the Company believes that PXRE’s reserving practices, financial disclosures, public filings and securities offerings in the aftermath of the 2005 hurricanes complied fully with all applicable regulatory and legal requirements. However, if unfavorable outcomes in the class action litigation or Private Placement lawsuit were to occur and result in the payment of substantial damages or fines or criminal penalties, these outcomes could have a material adverse effect on the Company’s business, cash flows, results of operations, financial position and prospects.
24
Table of Contents
The subsidiaries of the Company are parties to other legal actions incidental to their business. Based on the advice of counsel, management of the Company believes that the resolution of these matters will not materially affect the Company’s financial condition or results of operations.
Argo Group’s merger and acquisition strategy may not succeed.
Argo Group’s strategy for growth may include merger and acquisition transactions. This strategy presents risks that could have a material adverse effect on Argo Group’s business and financial performance, including: (i) the diversion of management’s attention, (ii) the ability of Argo Group to execute a transaction effectively, including the integration of operations and the retention of employees, and (iii) the contingent and latent risks associated with the past operations of and other unanticipated problems arising from a transaction partner. Argo Group cannot predict whether it will be able to identify and complete a future transaction on terms favorable to it. Argo Group cannot know if it will realize the anticipated benefits of a completed transaction or if there will be substantial unanticipated costs associated with the transaction.
Specifically, we acquired Argo International in May 2008 and there can be no assurance that we will fully realize the expected benefits of this acquisition. The Company has recorded goodwill and intangible assets related to the acquisition of Argo International based on assumptions of anticipated benefits. These assets may become impaired if anticipated benefits are not achieved, resulting in a corresponding impact on our results of operations and financial condition.
In addition to the Argo International acquisition, a future transaction within the Argo Group merger and acquisition strategy may result in tax consequences at either or both the shareholder and Argo Group level, potentially dilutive issuances of our equity securities, the incurrence of additional debt and the recognition of potential impairment of goodwill and other intangible assets. Each of these factors could adversely affect Argo Group’s financial position and results of operations.
Argo Group’s internal controls may fail and have an adverse effect on our business.
We utilize a number of strategies to mitigate our risk exposure including:
| • | engaging in vigorous underwriting within certain defined risk parameters and subject to various levels of oversight by experienced underwriting professionals; |
| • | carefully evaluating terms and conditions of our policies; |
| • | focusing on our risk aggregations by geographic zones, industry type, credit exposure and other bases; and |
| • | ceding insurance risk to reinsurance companies. |
However, there are inherent limitations in all of these strategies. No assurance can be given that an unanticipated event or series of such events will not result in loss levels that could have a material adverse effect on Argo Group’s financial condition or results of operations.
We continually enhance our operating procedures and internal controls to effectively support our business and our regulatory and financial reporting requirements. As a result of the inherent limitations in all control systems, no system of controls can provide absolute assurance that all control objectives have been or will be met, and that instances of fraud, if any, within the company have been detected. A control system, no matter how well conceived and operated, can provide only reasonable, not absolute, assurance that the objectives of the control system are met. These inherent limitations include the realities that judgments in decision-making can be faulty, and that breakdowns can occur because of simple error or mistake. Additionally, controls can be circumvented by the individual acts of some persons or by collusion of two or more persons. The design of any system of controls is based in part upon certain assumptions about the likelihood of future events, and there can be no assurance that any design will succeed in achieving its stated goals under all potential future conditions; over time, controls may become inadequate because of changes in conditions, or the degree of compliance with policies or procedures may deteriorate. Further, the design of a control system must reflect the fact that there are resource constraints, and the benefits of controls must be considered relative to their costs. As a result of the inherent limitations in a cost-effective control system, misstatement due to error or fraud may occur and not be detected. Accordingly, our disclosure controls and procedures are designed to provide reasonable, not absolute, assurance that the disclosure controls and procedures are met; our management does not expect that our disclosure controls or our internal controls will prevent all errors or fraud.
Further, Argo Group’s business is highly dependent upon the successful and uninterrupted functioning of our computer and data processing systems. We rely on these systems to perform accounting, policy administration, actuarial and other modeling functions necessary for writing business, as well as to process and make claims and other payments. We have a highly trained staff that is committed to the development and maintenance of these systems. The failure of these systems could interrupt our operations. This could result in a material adverse effect on our business results.
25
Table of Contents
In addition, a security breach of our computer systems could damage our reputation or result in liability. We retain confidential information regarding our business dealings in our computer systems. We may be required to spend significant capital and other resources to protect against security breaches or to alleviate problems caused by such breaches. It is critical that these facilities and infrastructure remain secure. Despite the implementation of security measures, this infrastructure may be vulnerable to physical break-ins, computer viruses, programming errors, attacks by third parties or similar disruptive problems. In addition, we could be subject to liability if hackers were able to penetrate our network security or otherwise misappropriate confidential information.
An impairment in the carrying value of goodwill and intangible assets could negatively impact our consolidated results of operations and shareholders’ equity.
Goodwill and intangible assets are originally recorded at fair value. Goodwill is not amortized while certain intangible assets are amortized over estimated useful lives or have indefinite useful lives. Goodwill and intangible assets are reviewed for impairment at least annually or more frequently if indicators are present. Management, in evaluating the recoverability of such assets, relies on estimates and assumptions related to margin, growth rates, discount rates and other data. There are inherent uncertainties related to these factors and management’s judgment in applying these factors. Goodwill and intangible asset impairment charges can result from declines in operating results, divestitures or sustained market capitalization declines and other factors. Impairment charges could materially affect our financial results in the period in which they are recognized. As of December 31, 2009, goodwill and intangible assets represented approximately 15.4% of shareholders’ equity.
Risks Related to Our Corporate Structure
Some aspects of Argo Group’s corporate structure and applicable insurance regulations may discourage or impede sale of the company, tender offers, or other mechanisms of control.
Restrictions on Stock Transfers. Argo Group’s bye-laws generally permit transfers of Argo Group common shares unless the board of directors determines a transfer may result in a non-de minims adverse tax, legal or regulatory consequence to Argo Group, any Argo Group subsidiary or any direct or indirect shareholder of Argo Group or its affiliates. Argo Group may refuse to register on its share transfer records any transfer that does not comply with these share transfer restrictions. A transferee will be permitted to promptly dispose of any Argo Group shares purchased that violate the restrictions and as to the transfer of which registration is refused.
Restrictions on Voting Rights. In the event that Argo Group becomes aware of a U.S. Person (that owns Argo Group shares directly or indirectly through non-U.S. entities) owning more than the permitted 9.5% level of voting power of the outstanding shares of Argo Group after a transfer of shares has been registered, Argo Group’s bye-laws provide that, subject to certain exceptions and waiver procedures, the voting rights with respect to the shares of Argo Group owned by any such shareholder will be limited to the permitted level of voting power, subject only to the further limitation that no other shareholder allocated any such voting rights may exceed the permitted level of voting power as a result of such limitation.
Argo Group also has the authority under its bye-laws to request information from any shareholder for the purpose of determining whether a shareholder’s voting rights are to be reallocated under the bye-laws. If a shareholder fails to respond to such a request for information or submits incomplete or inaccurate information in response to such a request, Argo Group may, in its sole discretion, eliminate such shareholder’s voting rights.
Election of Board of Directors. Argo Group’s bye-laws provide for a classified board of directors. The directors of the class elected at each annual general meeting hold office for a term of three years, with the term of each class expiring at successive annual general meetings of shareholders. Under Argo Group’s bye-laws, the vote of two-thirds of the outstanding shares entitled to vote and the approval of a majority of the board are required to amend bye-laws regarding appointment and removal of directors, indemnification of directors and officers, directors’ interests and the procedures for amending bye-laws.
Restrictions on Third Party Takeovers. The provisions described above may have the effect of making more difficult or discouraging unsolicited takeover bids from third parties. To the extent that these effects occur, shareholders could be deprived of opportunities to realize takeover premiums for their shares and the market price of their shares could be depressed. In addition, these provisions could also result in the entrenchment of incumbent management.
26
Table of Contents
Argo Group is a Bermuda company and it may be difficult for you to enforce judgments against it and/or its directors and executive officers.
Argo Group is organized under the laws of Bermuda and its business is based in Bermuda. The Companies Act 1981 of Bermuda, which applies to Argo Group, differs in certain material respects from laws generally applicable to U.S. corporations and their shareholders. These differences include the manner in which directors must disclose transactions in which they have an interest, the rights of shareholders to bring class action and derivative lawsuits, the company’s right to enter into business transactions with shareholders without prior approval from shareholders, committee organization and the scope of indemnification available to directors and officers.
In addition, certain of Argo Group’s directors and officers reside outside the United States, and all or a substantial portion of Argo Group’s assets and the assets of such persons are located in jurisdictions outside the United States. As such, it may be difficult for investors to effect service of process within the United States on our directors and officers who reside outside the United States or to enforce against us or our directors and officers judgments of U.S. courts predicated upon civil liability provisions of the U.S. federal securities laws.
Argo Group has been advised that there is doubt as to whether:
| • | a holder of Argo Group’s common shares would be able to enforce, in the courts of Bermuda, judgments of United States courts against persons who reside in Bermuda based upon the civil liability provisions of the United States federal securities laws; |
| • | a holder of Argo Group’s common shares would be able to enforce, in the courts of Bermuda, judgments of United States courts based upon the civil liability provisions of the United States federal securities laws; and |
| • | a holder of Argo Group’s common shares would be able to bring an original action in the Bermuda courts to enforce liabilities against Argo Group or Argo Group’s directors or officers, as well as Argo Group’s independent accountants, who reside outside the United States based solely upon United States federal securities laws. |
Further, Argo Group has been advised that there is no treaty in effect between the United States and Bermuda providing for the enforcement of judgments of United States courts, and there are grounds upon which Bermuda courts may not enforce judgments of United States courts. Because judgments of United States courts are not automatically enforceable in Bermuda, it may be difficult for Argo Group’s shareholders to recover against Argo Group based on such judgments.
Risks Related to Economic Uncertainties
We may be adversely affected by changes in economic conditions, including inflation and changes in interest rates.
The effects of inflation could cause the cost of claims to rise in the future. Our reserve for losses and loss adjustment expenses includes assumptions about future payments for settlement of claims and claims handling expenses, such as medical treatments and litigation costs. To the extent inflation causes these costs to increase above reserves established for these claims, we will be required to increase our loss reserves with a corresponding reduction in our net income in the period in which the deficiency is identified.
Additionally, our operating results are affected, in part, by the performance of our investment portfolio. As discussed in greater detail below, our investment portfolio may be adversely affected by inflation or changes in interest rates.
Interest rates are highly sensitive to many factors, including the fiscal and monetary policies of the U.S. and other major economies, inflation, economic and political conditions and other factors beyond our control. Although we attempt to take measures to manage the risks of investing in changing interest rate environments, we may not be able to mitigate interest rate sensitivity effectively. Despite our mitigation efforts, an increase in interest rates could have a material adverse effect on our book value.
A prolonged recession or a prolonged period of recovery characterized by a highly competitive environment for pricing terms and conditions, including as a result of significant turmoil in the U.S. and international financial markets, could adversely affect our business, liquidity and financial conditions, and our share price.
U.S. and international financial market disruptions such as the ones experienced in the recent global financial crisis, along with the possibility of a prolonged recession, may potentially affect various aspects of our business, including the demand for and claims made under our products, our counterparty credit risk and the ability of our customers, counterparties and others to establish or maintain their relationships with us, our ability to access and efficiently use internal and external capital resources and our investment performance. Volatility in the U.S. and other securities markets may also adversely affect our share price. Depending on future market conditions, we could incur substantial additional realized and unrealized losses in future periods, which would have an adverse impact on our results of operations, financial condition, debt and financial strength ratings, insurance subsidiaries’ capital and ability to access capital markets.
27
Table of Contents
Argo Group’s investment portfolio is subject to significant market and credit risks which could result in an adverse impact on Argo Group’s financial position or results.
Argo Group holds a diversified portfolio of investments. These investments are managed in accordance with our investment policy by professional investment management firms, under the direction of our investment committee and the Chief Investment Officer. Although our investment policies stress diversification of risks, conservation of principal, and liquidity, our investments are subject to general economic conditions and market risks as well as risks inherent to particular securities.
During an economic downturn, our investment portfolio could be subject to higher risk. The value of our investment portfolio is subject to the risk that certain investments may default or become impaired due to deterioration in the financial condition of one or more issuers of the securities held in our portfolio, or due to deterioration in the financial condition of an insurer that guarantees an issuer’s payments of such investments. Such defaults and impairments could reduce our net investment income and result in realized investment losses.
Our investment portfolio is also subject to increased valuation uncertainties when investment markets are illiquid. The valuation of investments is more subjective when markets are illiquid, thereby increasing the risk that the estimated fair value (i.e., the carrying amount) of the portion of the investment portfolio that is carried at fair value as reflected in our financial statements is not reflective of prices at which actual transactions would occur.
Additionally, Argo Group’s portfolio of investments in fixed income and short-term securities may be adversely affected by changes in inflation and/or interest rates which, in turn, may adversely affect operating results. The fair market value and investment income of these assets fluctuate with general economic and market conditions. Generally, the fair market value of fixed income securities decreases as interest rates increase. Some fixed income securities have call or prepayment options, which represent possible reinvestment risk in declining rate environments. Other fixed income securities such as mortgage-backed and asset-backed securities carry prepayment risk.
The Company’s investment portfolio includes $21.9 million, less than 1% of our portfolio, of mortgage-backed securities collateralized by sub prime residential loans. These securities were issued over several years from 2001 through 2006. The Company’s exposure to unrealized losses on securities with sub prime exposure has been predominantly related to changes in the security values. The Company and its investment managers closely monitor the performance of sub prime assets, using statistics provided by data vendors as well as information provided directly by trustee remittance reports. These data reference points include, but are not limited to delinquencies, foreclosures, accumulated loss, and credit support, which are used to determine the potential for losses or marginal risk. The Company has never purchased collateralized debt obligations or mortgage derivatives.
Since the beginning of the recent global financial crisis, delinquencies and losses with respect to residential mortgage loans generally have increased and may continue to increase, particularly in the sub prime sector. In addition, in recent months residential property values in many states have declined or remained stable, after extended periods during which those values appreciated. A continued decline or an extended flattening in those values may result in additional increases in delinquencies and losses on residential mortgage loans generally, especially with respect to second homes and investment properties, and with respect to any residential mortgage loans where the aggregate loan amounts (including any subordinate loans) are close to or greater than the related property values. These developments may have a significant adverse effect on the prices of loans and securities, including those in our investment portfolio. The situation continues to have wide ranging consequences, including downward pressure on economic growth and the potential for increased insurance and reinsurance exposures, which could have a material and adverse impact on our results of operations, financial condition, business and operations.
Argo Group also invests in marketable equity securities. These securities are carried on the balance sheet at fair market value and are subject to potential losses and declines in market value. Argo Group’s invested assets also include hedge funds, equity limited partnerships, and other privately held securities. These investments were designed to provide diversification of risk and enhance the return on the overall portfolio. However, such investments entail substantial risks.
28
Table of Contents
Risks for all types of securities are managed through application of the investment policy, which establishes investment parameters that include – but are not limited to – maximum percentages of investment in certain types of securities, minimum levels of credit quality, and Option-Adjusted Duration guidelines. No issuer (excluding United States Government and United States Governmental agencies) of fixed income or equity securities represents more than 4.1% of shareholders’ equity at December 31, 2009.
Although Argo Group seeks to preserve its capital, there can be no assurance that Argo Group’s investment objectives will be achieved, and results may vary substantially over time. In addition, although Argo Group seeks to employ investment strategies that are not correlated with its insurance and reinsurance exposures, losses in Argo Group’s investment portfolio may occur at the same time as underwriting losses and, therefore, exacerbate such losses’ adverse effect on Argo Group.
Argo Group may be adversely affected by foreign currency fluctuations.
Although Argo Group foreign subsidiaries’ functional currency is the U.S. Dollar, certain premium receivables and loss reserves include business denominated in currencies other than U.S. Dollars. With the acquisition of Argo International, foreign currency exposure has increased. Argo Group is exposed to the possibility of significant claims in currencies other than U.S. Dollars. We may, from time to time, experience losses resulting from fluctuations in these non-U.S. currencies, which could materially and adversely affect our operating results.
Risks Related to Taxation
Risks Associated with Taxation of the Company
U.S. Tax Risks
Argo Group and Argo Group’s non-U.S. subsidiaries may be subject to U.S. tax, which may have a material adverse effect on Argo Group’s financial condition and operating results.
Argo Group and Argo Group’s non-U.S. subsidiaries have operated and intend to continue to operate in a manner that should not cause them to be treated as engaged in a trade or business in the United States (and, in the case of those non-U.S. companies qualifying for treaty protection, in a manner that should not cause any of such non-U.S. subsidiaries to be doing business through a permanent establishment in the United States) and, thus, Argo Group believes that it and its non-U.S. subsidiaries should not be subject to U.S. federal income taxes or branch profits tax (other than withholding taxes on certain U.S. source investment income and excise taxes on insurance or reinsurance premiums). However, because there is uncertainty as to the activities that constitute being engaged in a trade or business within the United States, and what constitutes a permanent establishment under the applicable tax treaties, there can be no assurances that the United States Internal Revenue Service (“IRS”) will not contend successfully that one of the non-U.S. subsidiaries is engaged in a trade or business, or carrying on business through a permanent establishment, in the United States.
The reinsurance agreements between Argo Group and Argo Group’s U.S. subsidiaries may be subject to recharacterization or other adjustment for U.S. federal income tax purposes, which may have a material adverse effect on Argo Group’s financial condition and operating results.
Under Section 845 of the Code, the IRS may allocate income, deductions, assets, reserves, credits and any other items related to a reinsurance agreement among certain related parties to the reinsurance agreement, recharacterize such items, or make any other adjustment, in order to reflect the proper source, character or amount of the items for each party. No regulations have been issued under Section 845 of the Code. Accordingly, the application of such provisions is uncertain and Argo Group cannot predict what impact, if any, such provisions may have on it and its subsidiaries.
Changes in U.S. federal income tax law could be retroactive and may subject Argo Group or its non-U.S. subsidiaries to U.S. federal income taxation.
Legislation has been introduced in the U.S. Congress intended to eliminate certain perceived tax advantages of companies (including insurance companies) that have legal domiciles outside the United States but have certain U.S. connections. There are currently pending legislative proposals which, if enacted, could have a material adverse effect on Argo Group or its shareholders. For example, legislation has been introduced in Congress to limit the deductibility of reinsurance premiums paid by U. S. companies to foreign affiliates that, if enacted, could adversely impact our results. It is possible that broader-based or new legislative proposals could emerge in the future that could have an adverse effect on Argo Group or its shareholders.
29
Table of Contents
The tax laws and interpretations thereof are subject to change, possibly on a retroactive basis. Argo Group is not able to predict if, when or in what form such changes will be provided and whether such guidance will be applied on a retroactive basis.
The Merger between PXRE and Argonaut may have adverse U.S. federal income tax consequences on Argo Group under certain circumstances.
Section 7874 of the Code was added in 2004 by the American Jobs Creation Act of 2004 to address inversion transactions, which refer in relevant part to transactions where a U.S. corporation becomes a subsidiary of a foreign corporation. This provision provides that in certain instances a foreign corporation may be treated as a domestic corporation for U.S. federal income tax purposes.
Because the former holders of Argonaut Group common stock did not own 80% or more of the stock (by vote or value) of Argo Group immediately after the Merger, Argo Group believes that neither Argo Group nor any of its non-U.S. affiliates should be treated as a domestic corporation subject to U.S. taxation under Section 7874 of the Code. Moreover, although the former holders of Argonaut Group common stock held more than 60% of the stock (by vote and value) of Argo Group immediately after the inversion transaction, Argo Group believes that it should not recognize current gain under Section 7874 of the Code or otherwise as a result of the Merger of Argonaut Group and PXRE. It is possible that, as a result of certain transfers or licenses of stock or other property, as the case may be, during the applicable period (including the transfer of any income received or accrued during the applicable period by reason of a license of any property by Argonaut Group), Argonaut Group could recognize inversion gain during the applicable period. However, Argo Group does not anticipate such transfers taking place and thus do not expect to recognize any inversion gain during the applicable period.
Bermuda Tax Risks
Argo Group and Argo Group’s Bermuda subsidiaries may become subject to Bermuda taxes after 2016.
Bermuda currently imposes no income tax on corporations. Argo Group has obtained an assurance from the Bermuda Minister of Finance, under The Exempted Undertakings Tax Protection Act 1966 of Bermuda, that if any legislation is enacted in Bermuda that would impose tax computed on profits or income, or computed on any capital asset, gain or appreciation, or any tax in the nature of estate duty or inheritance tax, then the imposition of any such tax will not be applicable to Argo Group or Argo Group’s Bermuda subsidiaries, until March 28, 2016. Argo Group cannot assure you that Argo Group or its Bermuda subsidiaries will not be subject to any Bermuda tax after that date.
The Organization for Economic Cooperation and Development and other multinational organizations are considering measures that might increase our taxes and reduce Argo Group’s net income.
The Organization for Economic Cooperation and Development, which is commonly referred to as the OECD, has published reports and launched a global dialogue among member and non-member countries on measures to limit harmful tax competition. These measures are largely directed at counteracting the effects of tax havens and preferential tax regimes in countries around the world. In the OECD’s report dated April 18, 2002 and updated as of May 2009, Bermuda was not listed as an uncooperative tax haven jurisdiction because it had previously committed to eliminate harmful tax practices and to embrace international tax standards for transparency, exchange of information and the elimination of any aspects of the regimes for financial and other services that attract business with not substantial domestic activity. We are not able to predict what changes will arise from the commitment or whether such changes will subject us to additional taxes.
U.K. Tax Risks
Our non-U.K. companies may be subject to U.K. tax.
We intend to operate in such a manner so that none of our companies other than Argo International, which manages Syndicate 1200 at Lloyd’s, Argo Management Services, Ltd,, Argo Management Holdings, Ltd., Argo Managing Agency, Ltd. and Argo Direct, Ltd. should be resident in the U.K. for tax purposes or have a permanent establishment in the U.K. Accordingly, we expect that none of our companies other than Argo International should be subject to U.K. taxation. However, since applicable law and regulations do not conclusively define the activities that constitute conducting business in the U.K. through a permanent establishment, the U.K. Inland Revenue might contend successfully that one or more of our other companies is conducting business in the U.K. through a permanent establishment in the U.K.
30
Table of Contents
Any arrangements between U.K.-resident entities of Argo Group and other members of Argo Group are subject to the U.K. transfer pricing regime. Consequently, if any agreement between a U.K.-resident entity of Argo Group and any other Argo Group entity (whether that entity is resident in or outside the U.K.) is found not to be on arm’s length terms and as a result a U.K. tax advantage is being obtained, an adjustment will be required to compute U.K. taxable profits as if such an agreement were on arm’s length terms. Any transfer pricing adjustment could adversely impact the tax charge incurred by the relevant U.K.-resident entities of Argo Group.
Irish Tax Risks
Dividends paid by Argo Group’s U.S. subsidiaries to Argo Ireland may not be eligible for benefits under the U.S.-Ireland income tax treaty.
Under U.S. federal income tax law, dividends paid by a U.S. corporation to a non-U.S. shareholder are generally subject to a 30% withholding tax, unless reduced by treaty. The income tax treaty between the Republic of Ireland and the United States (“the Irish Treaty”) reduces the rate of withholding tax on certain dividends to 5%. Were the IRS to contend successfully that Argo Ireland is not eligible for benefits under the Irish Treaty, any dividends paid by Argo Group’s U.S. subsidiaries to Argo Ireland would be subject to the 30% withholding tax. Such a result could have a material adverse effect on Argo Group’s financial condition and operating results.
Risks Associated with Our Shareholders
If you are a U.S. non-corporate shareholder, dividends you receive from Argo Group will not be eligible for reduced rates of tax upon enactment of certain legislative proposals or after 2010 if legislation is not enacted extending the “qualified dividend” income provisions.
Dividends are generally considered to be ordinary income subject, in the case of individuals, to rates of tax up to 35%. However, dividends paid by a qualified foreign corporation, such as Argo Group, to U.S. non-corporate holders of its common shares, are eligible for reduced rates of taxation (based on the long-term capital gain rates) up to a maximum of 15%. The application of these reduced rates is, however, set to expire in 2011. Argo Group, therefore, cannot assure you that any dividends paid by Argo Group after 2010 would continue to qualify for reduced rates of tax.
Moreover, legislation has been introduced in the U.S. Congress that would, if enacted, deny the applicability of reduced rates to dividends paid by any corporation organized under the laws of a foreign country that does not have a comprehensive income tax system, such as Bermuda. It is possible that this legislative proposal could become law before 2011 or that it could apply retroactively. Therefore, depending on whether, when and in what form this legislative proposal is enacted, Argo Group cannot assure you that any dividends paid by Argo Group in the future would qualify for reduced rates of tax.
If Argo Group is classified as a passive foreign investment company, which we refer to as a PFIC, your taxes would increase.
In order to avoid significant potential adverse U.S. federal income tax consequences for any U.S. person who owns our common shares, we must not constitute a passive foreign investment company in any year in which such U.S. person is a shareholder. Those consequences could include increasing the tax liability of the investor, accelerating the imposition of the tax and causing a loss of the basis step-up on the death of the investor. In general, a non-U.S. corporation is a passive foreign investment company for a taxable year if 75% or more of its income constitutes passive income or 50% or more of its assets produce passive income. Passive income generally includes interest, dividends and other investment income. However, passive income does not include income derived in the active conduct of an insurance business by a company that is predominantly engaged in an insurance business. This exception is intended to ensure that income derived by a bona fide insurance company is not treated as passive income, except to the extent such income is attributable to financial reserves in excess of the reasonable needs of the insurance business. Argo Group believes that it should not be, and currently does not expect to become, a PFIC for U.S. federal income tax purposes; however, Argo Group cannot assure you that it will not be deemed a PFIC by the IRS based, in part, on Argo Group’s recent limited operations. There are currently no regulations regarding the application of the PFIC provisions to an insurance company. New regulations or pronouncements interpreting or clarifying these rules may be forthcoming. Argo Group cannot predict what impact, if any, such guidance would have on persons subject to U.S. federal income tax that directly or indirectly own Argo Group’s shares.
31
Table of Contents
If you acquire 10% or more of Argo Group’s shares and Argo Group or one or more of its non-U.S. subsidiaries is classified as a controlled foreign corporation (“CFC”) your taxes could increase.
Each U.S. person who, directly, indirectly, or through attribution rules, owns 10% or more of our common shares should consider the possible application of the controlled foreign corporation rules.
Each U.S. 10% shareholder of a controlled foreign corporation on the last day of the controlled foreign corporation’s taxable year generally must include in its gross income for U.S. federal income tax purposes its pro-rata share of the controlled foreign corporation’s subpart F income, even if the subpart F income has not been distributed. In general, a non-U.S. insurance company is treated as a controlled foreign corporation only if such U.S. 10% shareholders collectively own more than 25% of the total combined voting power or total value of the company’s capital stock for an uninterrupted period of 30 days or more during any year. We believe that, because of the anticipated dispersion of share ownership among holders and because of the restrictions in our bye-laws on transfer, issuance or repurchase of our common shares, shareholders will not be subject to treatment as U.S. 10% shareholders of a controlled foreign corporation. In addition, because under our bye-laws no single shareholder is permitted to exercise 9.5% or more of the total combined voting power, unless such provision is waived by the unanimous consent of the board of directors, we believe that our shareholders should not be viewed as U.S. 10% shareholders of a controlled foreign corporation for purposes of the controlled foreign corporation rules. We cannot assure shareholders, however, that these rules will not apply to our shareholders.
Argo Group cannot assure you that Argo Group or its non-U.S. subsidiaries will not be classified as CFCs. Argo Group believes that because of the anticipated dispersion of its common share ownership, provisions in Argo Group’s organizational documents that limit voting power and other factors, no United States person who (i) owns Argo Group’s shares directly or indirectly through one or more non-U.S. entities and (ii) has not received a waiver from Argo Group’s board of directors of provisions in Argo Group’s organizational documents that limit voting power, should be treated as owning (directly, indirectly through non-U.S. entities or constructively) 10% or more of the total voting power of all classes of the shares of Argo Group or any of its non-U.S. subsidiaries.
Due to the attribution provisions of the Code regarding determination of beneficial ownership, there is a risk that the IRS could assert that Argo Group or one or more of its non-U.S. subsidiaries are CFCs and that U.S. holders of Argo Group’s shares who own 10% or more of the value of Argo Group’s shares should be treated as owning 10% or more of the total voting power of Argo Group, and/or its non-U.S. subsidiaries, notwithstanding the reduction of voting power discussed above.
If one or more of Argo Group’s non-U.S. subsidiaries is determined to have related person insurance income (“RPII”), you may be subject to U.S. taxation on your pro rata share of such income.
If the RPII of any of Argo Group’s non-U.S. insurance subsidiaries were to equal or exceed 20% of such company’s gross insurance income in any taxable year and direct or indirect insureds (and persons related to such insureds) own, directly or indirectly through entities, 20% or more of Argo Group’s voting power or value, then a U.S. person who owns Argo Group’s shares (directly or indirectly through non-U.S. entities) on the last day of the taxable year would be required to include in its income for U.S. federal income tax purposes such person’s pro rata share of such non-U.S. insurance subsidiary’s RPII for the entire taxable year, determined as if such RPII were distributed proportionately only to U.S. persons at that date regardless of whether such income is distributed. In addition, any RPII that is includible in the income of a U.S. tax-exempt organization may be treated as unrelated business taxable income. The amount of RPII earned by the non-U.S. insurance subsidiaries (generally, premium and related investment income from the direct or indirect insurance or reinsurance of any direct or indirect U.S. holder of common shares or any person related to such holder) will depend on a number of factors, including the identity of persons directly or indirectly insured or reinsured by the non-U.S. insurance subsidiaries. Argo Group believes that the gross RPII of each non-U.S. insurance subsidiary did not in prior years of operation and is not expected in the foreseeable future to equal or exceed 20% of such subsidiary’s gross insurance income. Additionally, Argo Group does not expect the direct or indirect insureds of its non-U.S. insurance subsidiaries (and persons related to such insureds) to directly or indirectly own 20% or more of either the voting power or value of its shares. No assurance can be given that this will be the case because some of the factors that determine the existence or extent of RPII may be beyond Argo Group’s knowledge and/or control.
32
Table of Contents
The RPII rules provide that if a U.S. person disposes of shares in a non-U.S. insurance corporation in which U.S. persons own 25% or more of the shares (even if the amount of RPII is less than 20% of the corporation’s gross insurance income and the ownership of its shares by direct or indirect insureds and related persons is less than the 20% threshold), any gain from the disposition will generally be treated as ordinary income to the extent of the U.S. person’s share of the corporation’s undistributed earnings and profits that were accumulated during the period that the U.S. person owned the shares (whether or not such earnings and profits are attributable to RPII). In addition, such U.S. person will be required to comply with certain reporting requirements, regardless of the amount of shares owned by the U.S. person. These RPII rules should not apply to dispositions of Argo Group’s shares because Argo Group will not itself be directly engaged in the insurance business. The RPII provisions, however, have never been interpreted by the courts or the U.S. Treasury Department in final regulations, and regulations interpreting the RPII provisions of the Code exist only in proposed form. It is not certain whether these regulations will be adopted in their proposed form or what changes or clarifications might ultimately be made thereto or whether any such changes, as well as any interpretation or application of RPII by the IRS, the courts or otherwise, might have retroactive effect. The U.S. Treasury Department has authority to impose, among other things, additional reporting requirements with respect to RPII. Accordingly, the meaning of the RPII provisions and the application of those provisions to Argo Group and its non-U.S. subsidiaries are uncertain.
U.S. tax-exempt organizations that own Argo Group’s shares may recognize unrelated business taxable income.
A U.S. tax-exempt organization may recognize unrelated business taxable income if a portion of Argo Group’s insurance income is allocated to the organization. In general, insurance income will be allocated to a U.S. tax-exempt organization if either Argo Group is a CFC and the tax-exempt shareholder is a 10% U.S. Shareholder or there is RPII and certain exceptions do not apply. Although Argo Group does not believe that any U.S. persons should be allocated such insurance income, Argo Group cannot be certain that this will be the case. U.S. tax-exempt investors should consult their tax advisors as to the U.S. tax consequences of any allocation of Argo Group’s insurance income.
The payment of the special cash dividend to Argonaut Group shareholders made in July 2007 could result in adverse U.S. federal income tax consequences to shareholders and to Argo Group under certain circumstances.
Argo Group intends to take the position that the amount paid as the special cash dividend is treated as a distribution with respect to the Argonaut Group common stock, and not as consideration in the Merger. Although Argo Group believes its position with respect to the special cash dividend is correct, the IRS may take a contrary position, and to the extent the IRS were to prevail, the amount paid as the special cash dividend would be treated as additional cash received in connection with the Merger and not as a distribution for U.S. federal income tax purposes. If the special cash dividend were to be treated as Merger consideration, it is possible that the special cash dividend would be deemed to be paid from Argonaut Group to Argo Group, in which case a U.S. 30% withholding tax would be imposed on such payment.
Risks Related to Capital Structure
Argo Group’s insurance subsidiaries are subject to risk-based capital requirements under their respective regulatory domiciles.
The risk-based capital system is designed to measure whether the amount of available capital is adequate to support the inherent specific risks of each insurer. Risk-based capital is calculated annually. Authorities use the risk-based capital formula to identify insurance companies that may be undercapitalized and thus may require further regulatory attention. The formula prescribes a series of risk measurements to determine a minimum capital amount for an insurance company, based on the profile of the individual company. The ratio of a company’s actual policyholder surplus to its minimum capital requirements will determine whether any state regulatory action is required.
Argo Group US. Argo Group U.S. is subject to the risk-based capital system outlined in the Risk-Based Capital for Insurers Model Act. This Act provides four levels of regulatory activity if the risk-based capital ratio yielded by the calculation falls below specified minimums. At each of four successively lower risk-based capital ratios specified by statute, increasing regulatory remedies become available, some of which are mandatory. The four levels are: (i) Company Action Level Event, (ii) Regulatory Action Level Event, (iii) Authorized Control Level Event, and (iv) Mandatory Control Level Event. As of December 31, 2009, all U.S. subsidiaries had risk-based capital ratios that exceed specified minimums. If we fall below the minimum acceptable risk-based capital level, we would be subject to additional regulation.
33
Table of Contents
Argo International. Argo International is subject to the risk-based capital requirements under the Financial Services and Markets Act.
Argo Re. Argo Re is subject to the Bermuda Solvency Capital Requirement (“BSCR”), a risk-based capital system mandated by the Bermuda Insurance (Prudential Standards)(Class 4 Solvency Requirement) Order 2008.
As a result of these and other requirements, we may require additional capital in the future that may not be available to us on commercially favorable terms. Our future capital requirements depend on many factors, including our ability to underwrite new business and to establish premium rates and reserves at levels sufficient to cover losses. To the extent that the funds generated by insurance premiums received and sale proceeds and income from our investment portfolio are insufficient to fund future operating requirements and cover losses and loss expenses, we may need to raise additional funds through financings or curtail our growth and reduce our assets. The current financial market crisis has created unprecedented uncertainty in the equity and credit markets and has affected our ability, and the ability of others within our industry, to raise additional capital in the public or private markets. Any future financing, if available at all, may be on terms that are not favorable to us. In the case of equity financing, dilution to our shareholders could result, and the securities issued may have rights, preferences and privileges that are senior or otherwise superior to those of our common shares.
Argo Group may incur significant additional indebtedness.
Argo Group may seek to incur additional indebtedness either through the issuance of public or private debt or through bank or other financing. The funds raised by the incurrence of such additional indebtedness may be used to repay existing indebtedness of the parties, including amounts borrowed under Argo Group US’s credit facility, Argo Group’s outstanding subordinated debt and Argo Group’s floating rate loan stock, or for general corporate purposes of Argo Group, including additions to working capital, capital expenditures, investments in subsidiaries or acquisitions.
This additional indebtedness, particularly if not used to repay existing indebtedness, could limit Argo Group’s financial and operating flexibility, including as a result of the need to dedicate a greater portion of its cash flows from operations to interest and principal payments. It may also be more difficult for Argo Group to obtain additional financing on favorable terms, if at all, limiting Argo Group’s ability to capitalize on significant business opportunities and making Argo Group more vulnerable to economic downturns.
Item 1B. Unresolved Staff Comments
None.
Argo Group leases office space in Bermuda, where its principal executive offices are located. Argo Group US leases office space in San Antonio, Texas, for its United States headquarters, its Commercial Specialty subsidiary company, and for certain support functions associated with Argonaut Insurance Company. Argo Group also leases space in the following locations:
| • | New York City, New York (Argo Group U.S and Argonaut Specialty) |
| • | Edison, New Jersey (Argo Group US) |
| • | Brussels, Belgium (Argo Solutions) |
| • | Chicago, Illinois (Argo Group US and Commercial Specialty) |
| • | Richmond, Virginia (Colony and Argonaut Specialty) |
| • | Rockwood, Pennsylvania (Rockwood) |
| • | Portland, Oregon (Grocers Insurance) |
| • | Redwood City, California (Argonaut Insurance Company) |
| • | Houston, Texas (Argo Surety) |
| • | Boston and Greenfield, Massachusetts (Trident Insurance Service of New England) |
| • | London, England (Argo International) |
In addition, the Company has entered into other leases in conjunction with its operations at various geographic locations throughout the world. The properties are leased on terms and for durations that are reflective of commercial standards in the communities where these properties are located. Argo Group believes the facilities it occupies are adequate for the purposes in which they are currently used and are well maintained.
34
Table of Contents
Between May 3, 2006 and June 16, 2006, several class action lawsuits were filed against PXRE Group Ltd. (now Argo Group) and certain former officers of PXRE on behalf of a putative class of plaintiffs consisting of investors who purchased PXRE securities traded on the NYSE under the ticker symbol “PXT” between September 11, 2005 and February 22, 2006. These lawsuits were consolidated into one proceeding before the United States District Court for the Southern District of New York and were the subject of an Amended Class Action Complaint filed on June 15, 2007 (the “Amended Complaint”). The Amended Complaint alleges that during the purported class period PXRE fraudulently understated the full impact of hurricanes Katrina, Rita and Wilma on PXRE’s business and that certain PXRE executives made a series of materially false and misleading statements or omissions about PXRE’s business, prospects and operations in violation of Sections 10(b) and 20(a) of the Securities Exchange Act of 1934, as amended (the “1934 Act”), and Rule 10b-5 promulgated under the 1934 Act. On March 4, 2009, the Amended Complaint was dismissed with prejudice by the District Court. On December 21, 2009 the District Court’s decision was affirmed on appeal to the United States Court of Appeals for the Second Circuit, and the class plaintiff’s petition for rehearing was denied by the Court of Appeals on January 11, 2010.
On December 4, 2008, a lawsuit was filed against PXRE., Argo Group and certain of PXRE’s former officers in United States District Court for the Southern District of New York alleging causes of action based on facts and circumstances on behalf of a group of institutional shareholders that purchased Series D Perpetual Non-voting Preferred Shares of PXRE pursuant to the Private Placement Memorandum dated on or about September 28, 2005, (the “Private Placement”). The lawsuit alleges that the Private Placement was a public offering and that the Private Placement Memorandum contained false and misleading statements or omissions concerning PXRE’s business, prospects and operations actionable under Section 12(a) (2) of the Securities Act of 1933. In addition, the lawsuit alleges claims under New York state law for negligent misrepresentation and common law fraud based upon, among other things, statements contained in the Private Placement Memorandum and alleged false and misleading statements by PXRE’s named former officers. On April 6, 2009, the institutional investors filed an amended complaint. The Company filed a motion to dismiss the amended complaint on May 6, 2009. On January 26, 2010 the District Court granted the Company’s motion, dismissing the plaintiffs’ federal law causes of action without prejudice, and holding that the amended complaint failed to allege facts that would show that the Private Placement could be construed to be a public offering or that the Private Placement should be integrated with PXRE’s public share offering. The Court’s order provided the plaintiffs with a deadline of February 22, 2010 to file amended pleadings setting forth the nature of the entities to which the Private Placement was offered. Based on the dismissal of the federal law claims, the Court’s order also dismissed without prejudice all state law claims asserted by the plaintiffs for lack of subject matter jurisdiction, without prejudice to the plaintiffs’ right to file a separate action in state court asserting such claims. On February 22, 2010 the plaintiffs filed a Second Amended Complaint in the District Court case seeking to overcome the deficiencies outlined in the order of dismissal. The Company does not believe that the Second Amended Complaint is sufficient to comply with the relevant legal standard, and plans to file a Motion to Dismiss accordingly.
Although the Company has received no notice of any other potential lawsuits or other proceedings relating to the alleged facts and circumstances described above, it is possible that the Company could be the subject of additional litigation or regulatory inquiries regarding such matters in the future.
At this stage, the Company is unable to determine with any reasonable certainty the specific claims, litigants, or alleged damages that ultimately may be associated with the pending securities litigation, Private Placement lawsuit or any other future proceedings regarding the alleged facts and circumstances described above, nor can the Company currently predict the timing of any rulings, trials or other significant events relating to such proceedings. Given these limitations and the inherent difficulty of projecting the outcome of litigated disputes, the Company is unable to reasonably estimate the possible loss, range of loss or legal costs that are likely to arise out of the pending securities litigation or any future proceedings relating to the above matters at this time. The Company has insurance protection that may cover a portion of any potential loss or legal costs, but a settlement above the coverage limits could impact the Company’s financial position.
Based on all information available to the Company at this time, management of the Company believes that PXRE’s reserving practices, financial disclosures, public filings and securities offerings in the aftermath of the 2005 hurricanes complied fully with all applicable regulatory and legal requirements. However, if unfavorable outcomes in the class action litigation or Private Placement lawsuit were to occur and result in the payment of substantial damages or fines or criminal penalties, these outcomes could have a material adverse effect on the Company’s business, cash flows, results of operations, financial position and prospects.
35
Table of Contents
The subsidiaries of the Company are parties to other legal actions incidental to their business. Based on the advice of counsel, management of the Company believes that the resolution of these matters will not materially affect the Company’s financial condition or results of operations.
Item 5. Market for Registrant’s Common Equity, Related Shareholder Matters and Issuer Purchases of Equity Securities
Market Information
The Company’s common stock trades on the NASDAQ Global Select Market under the symbol “AGII.” The following table sets forth the range of high and low sales prices for the Company’s common stock for fiscal years 2009 and 2008:
| 2009 | 2008 | ||||||||||||||
| High | Low | High | Low | ||||||||||||
| First Quarter |
$ | 35.51 | $ | 25.33 | $ | 42.06 | $ | 33.08 | |||||||
| Second Quarter |
36.66 | 27.41 | 39.68 | 33.26 | |||||||||||
| Third Quarter |
36.33 | 30.78 | 43.15 | 32.10 | |||||||||||
| Fourth Quarter |
36.33 | 28.24 | 39.14 | 24.35 | |||||||||||
On February 24, 2010, the closing price of the Company’s common stock was $28.49.
Holders of Common Stock
The number of holders of record of the Company’s common stock as of February 25, 2010 was 1,746.
Dividends
The dividend policy of the Company is determined by the Board of Directors and depends, among other factors, upon the Company’s earnings, operations, financial condition, capital requirements and general business outlook at the time the policy is considered. For the years ended December 31, 2009 and 2008, Argo Group did not pay any dividends to common shareholders. On February 19, 2010, the Company announced that the Board of Directors has reinstated a quarterly cash dividend in the amount of $0.12 on each share of common stock outstanding to be disbursed on March 15, 2010, to shareholders of record on March 1, 2010. The declaration and payment of future dividends to the Company’s shareholders will be at the discretion of the Company’s Board of Directors and will depend upon the factors noted above.
Sale of Unregistered Securities
During the year ended December 31, 2009, the Company did not sell or issue any unregistered securities.
Use of Proceeds from Sale of Registered Securities
During the year ended December 31, 2009, the Company did not sell or issue any registered securities.
Issuer Purchases of Equity Securities
On November 13, 2007, the Board of Directors authorized the repurchase of up to $150 million of Argo Group’s common stock. The Company did not repurchase any shares during 2009, and as of December 31, 2009 had purchased 145,999 shares at an average price of $35.23 (total of $5.1 million repurchased). Shares of stock repurchased will be held as treasury shares in accordance with the provisions of the Bermuda Companies Act 1981.
36
Table of Contents
The following table provides information with respect to shares of the Company’s common stock that were repurchased or surrendered during the three months ended December 31, 2009:
| Period | Total Number of Shares |
Average Price Paid per Share (b) |
Total Number of |
Approximate Dollar That May Yet Be | ||||||||||
|
October 1 through October 31, 2009 |
- |
$ - |
- |
$ 144,856,935 | ||||||||||
| November 1 through November 30, 2009 |
696 | $ 33.32 | - | 144,856,935 | ||||||||||
| December 1 through December 31, 2009 |
- | $ - | - | 144,856,935 | ||||||||||
| Total |
696 | $ 33.32 | - | $ 144,856,935 | ||||||||||
Employees are allowed to surrender shares to settle the tax liability incurred upon the vesting of shares under the various employees equity compensation plans. For the year ended December 31, 2009, the Company received 18,935 shares of its common stock, with an average price paid per share of $30.28, that were surrendered by employees in payment for the minimum required withholding taxes due to the vesting of restricted stock units. In the above table, these shares are included in columns (a) and (b), but excluded from columns (c) and (d). These shares do not reduce the number of shares that may yet be purchased under the repurchase plan.
Performance Graph
The following graph compares the yearly percentage change in the cumulative total shareholder return for the Company since the Merger and for the common stock prior to that with the cumulative total return of investments in the NASDAQ Composite Index and the SNL Property & Casualty Insurance Index. The graph assumes the investment of $100 on December 31, 2004 in Common Stock of PXRE Group Ltd., the NASDAQ Composite Index and the SNL Property & Casualty Insurance Index. The stock price performance shown on the following graph is not intended to predict or be indicative of future price performance. The results of this analysis are significantly influenced by the results of the legal predecessor to the Company prior to the Merger, under the direction of previous management.
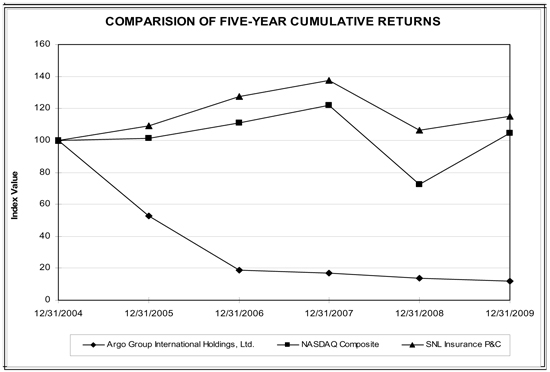
37
Table of Contents
| Period Ending | ||||||||||||
| Index | 12/31/04 | 12/31/05 | 12/31/06 | 12/31/07 | 12/31/08 | 12/31/09 | ||||||
| Argo Group International Holdings, Ltd. |
100.00 | 52.52 | 18.68 | 17.08 | 13.75 | 11.81 | ||||||
| NASDAQ Composite |
100.00 | 101.37 | 111.03 | 121.92 | 72.49 | 104.31 | ||||||
| SNL Insurance P&C |
100.00 | 109.31 | 127.42 | 137.59 | 106.50 | 115.13 | ||||||
| (1) | As noted above, the chart reflects the performance of a $100 investment in PXRE Group Ltd. stock on December 31, 2004. A $100 investment in Argonaut Group, Inc. stock on December 31, 2004 would have been worth $97.23 on December 31, 2009. |
Item 6. Selected Financial Data
The following selected financial data is derived from the Company’s consolidated financial statements. The information set forth below should be read in conjunction with “Management’s Discussion and Analysis of Financial Condition and Results of Operations,” included under Item 7 on pages 39 - 70 and the consolidated financial statements and notes thereto, included in Item 8 “Financial Statements and Supplementary Data” beginning on page F-1.
| For the Years Ended December 31, | |||||||||||||||
| (in millions except per share amounts) | 2009 | 2008 (a) | 2007 (b) | 2006 | 2005 | ||||||||||
| Statement of Operations Data |
|||||||||||||||
| Gross written premiums |
$ | 1,988.9 | $ | 1,601.5 | $ | 1,180.9 | $ | 1,155.6 | $ | 1,055.7 | |||||
| Earned premiums |
1,414.9 | 1,127.1 | 859.8 | 813.0 | 699.0 | ||||||||||
| Net investment income |
145.5 | 150.2 | 134.3 | 104.5 | 83.9 | ||||||||||
| Total revenue |
1,544.8 | 1,249.4 | 1,000.0 | 938.7 | 786.2 | ||||||||||
| Net income |
117.5 | 62.9 | 143.8 | 106.0 | 80.5 | ||||||||||
| Net income per diluted common share (c) |
3.81 | 2.05 | 5.58 | 4.82 | 3.91 | ||||||||||
| Cash dividends declared per common share |
- | - | 1.65 | - | - | ||||||||||
| Balance Sheet Data |
|||||||||||||||
| Invested assets |
$ | 4,334.3 | $ | 3,995.4 | $ | 3,582.8 | $ | 2,534.0 | $ | 2,184.6 | |||||
| Total assets |
6,896.8 | 6,381.5 | 5,123.5 | 3,721.5 | 3,404.6 | ||||||||||
| Borrowing under revolving credit facility |
- | 50.0 | 58.0 | - | - | ||||||||||
| Other indebtedness |
69.2 | 67.3 | - | - | - | ||||||||||
| Junior subordinated debentures |
311.4 | 311.4 | 311.4 | 144.3 | 144.3 | ||||||||||
| Shareholders’ equity |
1,614.9 | 1,352.9 | 1,384.5 | 847.7 | 716.1 | ||||||||||
| Other Select data |
|||||||||||||||
| Cash provided by operating activities |
$ | 301.8 | $ | 124.6 | $ | 166.2 | $ | 299.0 | $ | 333.2 | |||||
| Book value per share |
52.37 | 44.18 | 45.15 | 25.34 | 21.73 | ||||||||||
| Combined ratio |
96.9% | 100.5% | 99.4% | 93.9% | 98.7% | ||||||||||
| (a) | On May 14, 2008, the Company effectively acquired all the outstanding stock of Argo International. Operating results from Argo International are included in the consolidated statement of income from May 31, 2008. |
| (b) | The results of operations reflect those of Argonaut Group for the year ended December 31, 2007 and those of PXRE from the point of acquisition, August 7, 2007 to December 31, 2007. |
| (c) | Net income per common share is adjusted for the effects of the 6.484 exchange ratio and for the 1-for-10 reverse stock split which was effective August 7, 2007. |
38
Table of Contents
Item 7. Management’s Discussion and Analysis of Financial Condition and Results of Operations
The following discussion should be read in conjunction with the consolidated financial statements and related notes beginning on page F-1. This discussion contains forward-looking statements that involve risks and uncertainties. The Company’s actual results could differ materially from those anticipated in the forward looking statements as a result of various factors described in this report.
Consolidated Results of Operations
For the year ended December 31, 2009, Argo Group reported net income of $117.5 million, or $3.81 per fully diluted share. For the year ended December 31, 2008, Argo Group reported net income of $62.9 million, or $2.05 per fully diluted share. In May 2008, the Company completed the acquisition of Argo International. Included in the Company’s consolidated results of operations for the year ended December 31, 2008, is seven months of activity specifically attributable to Argo International. Net income for the year ended December 31, 2007 was $143.8 million, or $5.58 per fully diluted share, including an extraordinary gain resulting from the Merger of PXRE and Argonaut Group of $66.3 million, or $2.57 per fully diluted share. The following is a comparison of selected data from the Company’s operations:
| Years ended December 31, | |||||||||
| (in millions) | 2009 | 2008 | 2007 | ||||||
| Gross written premiums |
$ | 1,988.9 | $ | 1,601.5 | $ | 1,180.9 | |||
| Earned premiums |
$ | 1,414.9 | $ | 1,127.1 | $ | 859.8 | |||
| Net investment income |
145.5 | 150.2 | 134.3 | ||||||
| Fee income, net |
1.1 | 7.2 | - | ||||||
| Realized investment and other (losses) gains, net |
(16.7) | (35.1) | 5.9 | ||||||
| Total revenue |
$ | 1,544.8 | $ | 1,249.4 | $ | 1,000.0 | |||
| Income before income taxes and extraordinary item |
$ | 142.4 | $ | 86.4 | $ | 119.8 | |||
| Provision for income taxes |
24.9 | 23.5 | 42.3 | ||||||
| Income before extraordinary item |
117.5 | 62.9 | 77.5 | ||||||
| Extraordinary item |
- | - | 66.3 | ||||||
| Net income |
$ | 117.5 | $ | 62.9 | $ | 143.8 | |||
| Loss ratio |
60.3% | 64.3% | 61.3% | ||||||
| Expense ratio |
36.6% | 36.2% | 38.1% | ||||||
| Combined ratio |
96.9% | 100.5% | 99.4% | ||||||
The increase in consolidated gross written premiums and earned premiums for the year ended December 31, 2009 as compared to the same periods in 2008 and 2007 was primarily attributable to the operations of Argo Re and Argo International. Earned premiums from Argo International were $424.1 million for the year ended December 31, 2009 compared to $183.4 million from the date of acquisition through December 31, 2008. Earned premiums from Argo Re were $75.4 million for the year ended December 31, 2009 compared to $52.4 million and $1.0 million for the years ended December 31, 2008 and 2007, respectively. Argo Re began operations during the third quarter of 2007. Most of the Company’s product lines have experienced increased competition and/or reduced rates during 2009, with the exception of Argo Re where property catastrophe pricing increased relative to 2008. Earned premiums for the year ended December 31, 2008 were reduced by $3.5 million for net reinstatement premiums related to property catastrophe reinsurance contracts as a result of hurricane activity in 2008.
Consolidated net investment income decreased for the year ended December 31, 2009 as compared to the same period in 2008 due to lower investment yields which were partially offset by higher total invested assets resulting from positive operating cash flows. Consolidated net investment income increased for the year ended December 31, 2008 as compared to the same period in 2007 due to higher invested asset balances due to positive cash flows from operations coupled with invested assets acquired in the acquisition of Argo International. Total invested assets at December 31, 2009 were $4,099.0 million, net of $235.3 million of invested assets attributable to Argo International’s Trade Capital providers. Total invested assets at December 31, 2008 were $3,779.6 million, net of $215.8 million of invested assets attributable to the Trade Capital providers. Total invested assets as of December 31, 2007 were $3,582.8 million.
39
Table of Contents
Consolidated gross realized gains were $47.4 million for the year ended December 31, 2009, as compared to $22.1 million and $12.4 million in 2008 and 2007, respectively. Consolidated gross realized losses were $64.1 million, $57.2 million and $6.5 million for the years ended December 31, 2009, 2008 and 2007, respectively. Included in consolidated gross realized losses for the years ended December 31, 2009, 2008 and 2007 were write downs of approximately $45.0 million, $51.3 million and $2.3 million, respectively, from the recognition of other-than-temporary impairments on certain investment securities.
Consolidated losses and loss adjustment expenses were $853.1 million for the year ended December 31, 2009, compared to $724.9 million and $526.9 million for the same periods in 2008 and 2007, respectively. Included in consolidated losses and loss adjustment expenses for the year ended December 31, 2009 was $6.3 million in favorable loss reserve development on prior accident years. The Excess and Surplus Lines segment had favorable loss development of $15.4 million primarily within the property, casualty and professional liability lines of business. The Commercial Specialty segment had favorable loss development across multiple lines. The Reinsurance segment had favorable loss development of $9.1 million, including $3.6 million of favorable development attributable to Hurricane Ike. The International Specialty segment had unfavorable loss development of $23.5 million, which was offset by additional premiums of $24.1 million primarily within the property lines of business. The Run-off Lines segment had $1.6 million of net favorable development primarily driven by $10.8 million favorable development on legacy PXRE claims, partially offset by $9.1 million of unfavorable reserve development in the U.S run-off lines, including $6.1 million in unfavorable reserve development in asbestos and environmental lines.
Included in consolidated losses and losses adjustment expenses for the year ended December 31, 2008 was $72.3 million in losses resulting from hurricane activity in the United States during the third quarter of 2008. Losses and loss adjustment expenses for 2008 also include $22.5 million in property losses resulting primarily from severe weather during the second quarter of 2008 and $18.9 million of losses in certain casualty lines of business resulting from higher than expected severity in the fourth quarter of 2008. Prior accident year net favorable loss reserve development recognized during 2008 was $61.2 million of which $31.8 million related to property lines of business. This favorable development included $14.3 million from the 2006 and 2007 accident years within the U.S. operations, $12.5 million from the PXRE non-catastrophe lines and $5.0 million from 2005 PXRE catastrophe reserves. Net favorable development across casualty lines of business totaled $29.4 million and resulted from $27.5 million of favorable development in general and other liability lines of business primarily related to accident years 2005 and prior, $13.8 million of net favorable development within workers compensation and commercial multi peril lines primarily related to accident years 2006 and prior, adverse development of $6.8 million in commercial auto liability lines for 2006 and 2007 accident years and net adverse development of $5.2 million for asbestos and environmental reserves.
Consolidated losses and loss adjustment expenses for the year ended December 31, 2007 included $30.3 million of net favorable development. The favorable development was primarily concentrated in the Excess and Surplus Lines segment due to lower claim counts and severity for the 2004 through 2006 accident years and lower frequency and severity within the Commercial Specialty segment for the 2002 through 2006 accident years. Partially offsetting this favorable development was $22.2 million of reserve strengthening in the Run-off Lines segment, primarily due to the Company strengthening the reserves for the asbestos and environmental exposures by $26.0 million in the third quarter of 2007. Additionally, the Company recorded approximately $32.2 million in additional losses and loss adjustment expenses for the 2007 accident year due to higher than expected losses, primarily in the Excess and Surplus Lines and the Commercial Specialty segments.
40
Table of Contents
The following table summarizes the above referenced reserve development as respects to prior year loss reserves by line of business for the year ended December 31, 2009:
| (in millions) | 2008 Net Reserves |
Net Reserve Development (Favorable)/ Unfavorable |
Percent of 2008 Net Reserves | |||||
| General liability |
$ | 909.9 | $ | (9.2) | -1.0% | |||
| Workers compensation |
465.4 | (3.2) | -0.7% | |||||
| Commercial multi-peril |
190.2 | 0.9 | 0.5% | |||||
| Commercial auto liability |
145.7 | 7.5 | 5.1% | |||||
| Reinsurance - nonproportional assumed property |
127.6 | (18.8) | -14.7% | |||||
| Special property |
19.0 | (0.2) | -1.1% | |||||
| Auto physical damage |
10.0 | (5.6) | -56.0% | |||||
| Argo International |
239.5 | 23.5 | 9.8% | |||||
| All other lines |
8.3 | (1.2) | -14.5% | |||||
| Total |
$ | 2,115.6 | $ | (6.3) | -0.3% | |||
The net favorable loss and loss adjustment expense development for the twelve months ended December 31, 2009 was approximately 0.3% of total reserves outstanding as of December 31, 2008. The reinsurance – nonproportional assumed property favorable net loss reserve development was driven by $10.8 million of favorable development in the PXRE Legacy reserves (including $3.2 million for the 2005 hurricanes) and $8.0 million of favorable development in Argo Re (including $3.1 million related to hurricane Ike in 2008). The general liability line of business had $9.2 million of favorable prior accident year development primarily driven by favorable Excess and Surplus Lines development, partially offset by the unfavorable reserve development for certain asbestos and environmental claims in the Run-Off Lines segment. The favorable development in the workers compensation and auto physical damage lines of business resulted from better than expected loss frequency and severity. The Argo International net loss reserves developed unfavorably by $23.5 million as described above. The unfavorable reserve development for commercial auto liability was primarily attributable to increased frequency and severity.
In determining appropriate reserve levels for the year ended December 31, 2009, the Company maintained the same general processes and disciplines that were used to set reserves at prior reporting dates. No significant changes in methodologies were made to estimate the reserves since the last reporting date; however at each reporting date the Company reassesses the actuarial estimate of the reserve for loss and loss adjustment expenses and records its best estimate. Consistent with prior reserve valuations, as claims data becomes more mature for prior accident years, actuarial estimates were refined to weigh certain actuarial methods more heavily in order to respond to any emerging trends in the paid and reported loss data. These modifications to the analysis varied depending on whether the line of business was short-tailed or long-tailed and also varied by accident year. While prior accident years’ net reserves for losses and loss adjustment expenses for some lines of business have developed favorably in recent years, this does not infer that more recent accident years’ reserves also will develop favorably; pricing, reinsurance costs, the legal environment, general economic conditions and many other factors impact management’s ultimate loss estimates.
When determining reserve levels, the Company recognizes that there are several factors that present challenges and uncertainties to the estimation of loss reserves. Examples of these uncertainties include growth over the last several years in both the Excess and Surplus Lines and Commercial Specialty segments, and changes to the reinsurance structure. The Company’s net retained losses vary by product and they have generally increased over time. To properly recognize these uncertainties, actuarial reviews have given significant consideration to the paid and incurred Bornhuetter-Ferguson methodologies. Compared with other actuarial methodologies, the paid and incurred Bornhuetter-Ferguson methods assign smaller weight to actual reported loss experience, with the greatest weight assigned to an expected or planned loss ratio. The expected or planned loss ratio has typically been determined using various assumptions pertaining to prospective loss frequency and loss severity. In setting reserves at December 31, 2009, the Company continued to consider the paid and incurred Bornhuetter-Ferguson methods for recent years.
The Company’s loss reserve estimates gradually blend in the results from development and frequency/severity methodologies over time. For general liability estimates, more credibility is assigned to the Company’s own loss experience approximately 60 to 72 months after the beginning of an accident year. For property business, the Company’s loss reserve estimates also blend in the results from development and frequency/severity methodologies over time. In contrast to general liability estimates, full credibility is assigned to the Company’s loss experience approximately 24 to 36 months after the beginning of an accident year, where loss reporting and claims closing patterns settle more quickly. The Company’s loss experience receives partial weighting in the estimates 12 to 24 months after the beginning of the accident year.
41
Table of Contents
For the Run-off Lines segment, in determining appropriate reserve levels, the Company maintained the same general processes and disciplines that were used to set reserves at prior reporting dates. No changes in key assumptions were made to estimate the reserves since the last reporting date; however the maturation of claims for twelve additional months since the date of last report provided the actuaries with a basis to assign greater credibility to emerged loss development patterns.
Consolidated loss reserves were $3,203.2 million (including $227.9 million of reserves attributable to Argo International’s Trade Capital providers), $2,996.6 million (including $183.3 million of reserves attributable to the Trade Capital providers) and $2,425.5 million (which excludes $135.7 million of loss reserves which are classified as “Liabilities held for sale”) as of December 31, 2009, 2008 and 2007, respectively. Management has recorded its best estimate of loss reserves as of December 31, 2009 based on current known facts and circumstances. Due to the significant uncertainties inherent in the estimation of loss reserves, there can be no assurance that future loss development, favorable or unfavorable, will not occur.
Consolidated underwriting, acquisition and insurance expenses were $517.9 million, $407.1 million and $328.1 million for the years ended December 31, 2009, 2008 and 2007, respectively. Expense ratios for the years ended December 31, 2009 and 2008 were comparable at 36.6% and 36.2%, respectively. Included in consolidated underwriting, acquisition and insurance expenses for the year ended December 31, 2008 was $63.0 million resulting from Argo International. Included in consolidated underwriting, acquisition and insurance expenses for the year ended December 31, 2007 was $10.2 million of additional compensation expense resulting from the acceleration of the vesting of certain share-based payment arrangements prior to the Merger. Additionally, included in consolidated underwriting, acquisition and insurance expenses was $18.8 million resulting from the operations of PXRE for the period from the closing date of the Merger through December 31, 2007.
Consolidated interest expense and other were $25.5 million, $31.0 million and $24.4 million for the years ended December 31, 2009, 2008 and 2007, respectively. Consolidated interest expense decreased to $25.7 million for the year ended December 31, 2009 compared to $29.9 million and $20.9 million for the same periods in 2008 and 2007, respectively. The decrease in interest expense for the year ended December 31, 2009 as compared to 2008 was due to reduced interest rates and the repayment of outstanding balances on the Company’s revolving line of credit during the year. The increase in interest expense for the year ended December 31, 2008 as compared to 2007 was due to the inclusion of a full year of interest on the junior subordinated debentures acquired in the Merger with PXRE, coupled with $1.1 million in interest expense related to Argo International indebtedness assumed in May 2008. Also included in consolidated interest expense and other for the year ended December 31, 2008 was $0.6 million resulting from the net change in fair value on derivative reinsurance contracts, compared to $3.5 million for 2007.
In June 2009, the Company deemed the value assigned to the trade name of Heritage impaired after an evaluation of the value of the name in the Lloyd’s market and the subsequent renaming of Heritage to Argo International. The expense recognized as a result of this impairment was $5.9 million, which represented the unamortized balance as of the impairment date.
Consolidated provisions for income taxes were $24.9 million, $23.5 million and $42.3 million for the years ended December 31, 2009, 2008 and 2007, respectively. Included in the consolidated provision for income taxes for the year ended December 31, 2009 was a $5.6 million tax refund received from the state of California due to a favorable tax settlement. Offsetting this tax refund was $7.7 million in tax expense from Argo Financial Holding (Ireland) Ltd to the Internal Revenue Service for withholding on dividends received from Argo Group US. The consolidated income tax provision represents the income tax expense associated with the Company’s operations based on the tax laws of the jurisdictions in which they operate. Therefore, the consolidated provision for income taxes represents taxes on net income for the Company’s United States and United Kingdom operations. Additionally, the Company’s tax rate for 2009 and 2008 were impacted by fluctuations in foreign exchange rates within the International Specialty segment.
Segment Results
The Company is primarily engaged in writing property and casualty insurance and reinsurance. The Company has four ongoing reporting segments: Excess and Surplus Lines, Commercial Specialty, Reinsurance and International Specialty. Additionally, the Company has a Run-off Lines segment for products that it no longer underwrites.
In evaluating the operating performance of its segments, the Company focuses on core underwriting and investing results before consideration of realized gains or losses from the sales of investments. Management excludes realized investment gains and losses from segment results, as decisions regarding the sales of investments are made at the corporate level. Although this measure of profit (loss) does not replace net income (loss) computed in accordance with generally accepted accounting principles in the United States (“GAAP”) as a measure of profitability, management utilizes this measure of profit (loss) to focus its reporting segments on generating operating income.
42
Table of Contents
Since the Company generally manages and monitors the investment portfolio on an aggregate basis, the overall performance of the investment portfolio, and related net investment income, is discussed above on a combined basis under consolidated net investment income rather than within or by segment.
Excess and Surplus Lines.
The following table summarizes the results of operations for the Excess and Surplus Lines segment:
| Years ended December 31, | |||||||||
| (in millions) | 2009 | 2008 | 2007 | ||||||
| Gross written premiums |
$ | 642.3 | $ | 684.3 | $ | 726.5 | |||
| Earned premiums |
537.0 | 531.9 | 542.6 | ||||||
| Losses and loss adjustment expenses |
355.0 | 320.2 | 311.8 | ||||||
| Underwriting, acquisition and insurance expenses |
180.1 | 175.8 | 172.6 | ||||||
| Underwriting income |
1.9 | 35.9 | 58.2 | ||||||
| Net investment income |
62.8 | 62.4 | 54.5 | ||||||
| Income before income taxes |
$ | 64.7 | $ | 98.3 | $ | 112.7 | |||
| Loss ratio |
66.1% | 60.2% | 57.5% | ||||||
| Expense ratio |
33.5% | 33.1% | 31.8% | ||||||
| Combined ratio |
99.6% | 93.3% | 89.3% | ||||||
The decline in gross written premiums was primarily due to market conditions. The excess and surplus lines market place continues to experience increased competition, from both other excess and surplus lines carriers as well as the standard markets, which has led to lower rates and business shifting to the standard markets. Pricing in the Excess and Surplus Lines segment has declined moderately for the year ended December 31, 2009 as compared to the same periods in 2008 and 2007. Additionally, the Excess and Surplus Lines segment has experienced a shift in both product and policyholder mix, resulting in reduced premium writings.
The increase in earned premiums for the year ended December 31, 2009 as compared to the same period in 2008 was primarily attributable to the termination of a ceded quota share reinsurance contract in April 2008. Premiums ceded under this contract reduced earned premiums $51.3 million for the year ended December 31, 2008. The decline in earned premium for the year ended December 31, 2008 as compared to the same period in 2007 was primarily attributable to a decline in gross written premiums in 2008. Additionally, earned premiums for the year ended December 31, 2008 were reduced by $4.0 million of reinstatement premiums related to property catastrophe reinsurance contracts resulting from Hurricanes Gustav and Ike. Partially offsetting earned premiums for the year ended December 31, 2007 was a $4.1 million increase in ceded premiums under a property reinsurance contract due to a shortfall in the minimum subject premium under this contract.
Losses and loss adjustment expenses for the year ended December 31, 2009 resulted in a loss ratio of 66.1%, compared to 60.2% and 57.5% for the same periods ended 2008 and 2007, respectively. Included in losses and loss adjustment expenses for the year ended December 31, 2009 was $19.4 million in higher than anticipated losses attributable to the 2009 accident year primarily within the professional, casualty and property lines. Partially offsetting the increased expense for accident year 2009 was $15.4 million in favorable loss reserve development on prior accident years within the casualty, professional liability and property lines.
Included in losses and loss adjustment expenses for the year ended December 31, 2008 was $12.7 million in losses resulting from the 2008 hurricane activity. Additionally, $16.7 million of increased losses for the 2008 accident year were recorded for other storm losses and fire losses. Included in losses and loss adjustment expense for the year ended December 31, 2008 was $39.6 million in favorable loss reserve development on prior accident years primarily driven by property lines for the 2006 and 2007 accident years and general liability lines written on both claims-made and occurrence forms related to accident years 2005 and 2006.
43
Table of Contents
Losses and loss adjustment expenses for the year ended December 31, 2007 included $38.5 million in favorable development on prior accident years. This favorable development consisted primarily of $24.3 million favorable development in the general liability and automobile lines, $5.3 million in the property lines and $6.0 million across all other lines. Favorable development was primarily the result of lower claim counts and lower severities for the 2004 through 2006 accident years. Partially offsetting the favorable development related to prior year loss reserves was $21.1 million in losses related to the 2007 accident year. Of the $21.1 million, $4.8 million was related to higher than expected property losses and the remainder was associated with casualty business resulting from increased severity, rate changes and an increased net retention due to changes in reinsurance coverages.
Loss reserves for the Excess and Surplus Lines segment were $1,359.6 million, $1,257.7 million and $1,084.7 million at December 31, 2009, 2008 and 2007, respectively.
The expense ratio increased to 33.5% for the year ended December 31, 2009 compared to 33.1% for the same period in 2008. The increase in the expense ratio in 2009 as compared to 2008 was attributable to a reduction in the deferral of acquisition expenses due to declining premium volumes and to increased expenses in the first quarter of 2009 associated with a 2008 acquisition. The increase in the expense ratio for the year ended December 31, 2008 as compared to the same period ended 2007 was primarily attributable to rate declines and reinstatement premiums.
Commercial Specialty.
The following table summarizes the results of operations for the Commercial Specialty segment:
| Years ended December 31, | |||||||||
| (in millions) | 2009 | 2008 | 2007 | ||||||
| Gross written premiums |
$ | 475.7 | $ | 510.9 | $ | 420.7 | |||
| Earned premiums |
364.0 | 357.6 | 302.2 | ||||||
| Losses and loss adjustment expenses |
239.9 | 243.1 | 182.2 | ||||||
| Underwriting, acquisition and insurance expenses |
108.0 | 101.8 | 85.9 | ||||||
| Underwriting income |
16.1 | 12.7 | 34.1 | ||||||
| Net investment income |
29.3 | 29.7 | 27.2 | ||||||
| Fee income, net |
0.4 | 0.6 | - | ||||||
| Income before income taxes |
$ | 45.8 | $ | 43.0 | $ | 61.3 | |||
| Loss ratio |
65.9% | 68.0% | 60.3% | ||||||
| Expense ratio |
29.7% | 28.5% | 28.4% | ||||||
| Combined ratio |
95.6% | 96.5% | 88.7% | ||||||
The overall $6.4 million increase in earned premiums for the year ended December 31, 2009 as compared to the same period in 2008 was primarily attributable to growth in the public entity product lines due to an acquisition that expanded business into the New England region in 2008. Earned premiums for the public entity products increased $13.2 million, from $113.7 million for the year ended December 31, 2008 to $126.9 million for the same period in 2009. Additionally, earned premiums in the surety lines increased $5.3 million from $0.2 million for the year ended December 31, 2008 to $5.5 million for the same period in 2009. These increases in earned premiums were partially offset by a decrease in earned premiums for the Company’s coal mining business due to the effects of a planned shift to large deductible policies which began in 2008. Coal mining business earned premiums decreased $8.1 million, from $74.5 million for the year ended December 31, 2008 to $66.4 million for the same period in 2009. Additionally, earned premiums in Argo Select decreased $5.6 million from $146.9 million for the year ended December 31, 2008 to $141.3 million for the same period in 2009 primarily due to discontinued programs. The increase in earned premiums for the year ended December 31, 2008 as compared to the same period of 2007 was primarily attributable to growth within the public entity and a specialty program which incepted in the fourth quarter of 2007. The Commercial Specialty segment has experienced pricing pressure for the year ended December 31, 2009 compared to the same periods in 2008 and 2007.
Losses and loss adjustment expenses for the year ended December 31, 2009 resulted in a loss ratio of 65.9%, compared to 68.0% and 60.3% for the same periods ended 2008 and 2007, respectively. The decrease in the loss ratio in 2009 compared to 2008 was primarily attributable to the absence of hurricane activity, $2.0 million lower storm related activity and $9.5 million decrease in non-catastrophe property and casualty lines losses. Additionally, the Commercial Specialty segment recognized $3.7 million of favorable development on prior accident years loss reserves in 2009. This favorable development was comprised primarily of $6.2 million of favorable development in workers compensation, $3.5 million of favorable development in short tail lines, $2.5 million of adverse development in other liability, and $3.5 million of adverse development in commercial auto liability.
44
Table of Contents
The increase in the loss ratio in 2008 versus 2007 was primarily attributable to increased losses for the 2008 accident year. The increased losses for the year ended December 31, 2008 included $2.8 million in losses resulting from hurricane activity and $12.5 million in other property losses, primarily attributable to other storm activity and $12.3 million in casualty losses, workers compensation and commercial automobile lines. Additionally in 2008, the Commercial Specialty segment recognized $8.2 million of net favorable development primarily comprised of $5.0 million of favorable development in an assumed Directors and Officers program, $4.0 million of favorable development in workers compensation lines, $1.5 million of favorable development in property lines, $3.8 million of favorable development in other liability lines and $6.1 million of adverse development in commercial automobile products.
Included in losses and loss adjustment expenses for the year ended December 31, 2007 was $14.8 million in net favorable development on prior accident years. The favorable development consisted of $7.6 million in workers compensation reserves primarily for accident years 2004 through 2006 due to lower loss frequency and lower losses on the large deductible policies in addition to $4.1 million for workers compensation occupational disease for accident years 1998 and prior. Favorable development for general liabilities and automobile lines totaled $7.2 million for accident years 2002 through 2005 and $0.4 million for property lines due to lower than expected frequency and severity. Included in losses and loss adjustment expenses for the 2007 accident year was $2.5 million attributable to storm losses which occurred in December 2007 in the Northwest and Midwest. Workers compensation reserves for the 2007 accident year included $4.4 million of additional reserves due to increased frequency of claims, including a $0.5 million mining accident. Loss reserves for the 2007 accident year within the public entity products were increased by $2.5 million for the property lines and $1.7 million for the commercial automobile and other lines.
Loss reserves for the Commercial Specialty segment were $605.4 million, $574.8 million and $481.7 million as of December 31, 2009, 2008 and 2007, respectively.
The expense ratio for the year ended December 31, 2009 and 2008 was at 29.7% and 28.5%, respectively. The increase in the expense ratio was primarily attributable to reduced ceding commissions received on the state fund program due to lower premium volumes, along with a business shift to large deductible products from guaranteed cost products in the coal mining business. The expense ratio for the year ended December 31, 2008 and 2007 were comparable at 28.5% and 28.4%, respectively.
Reinsurance.
The following table summarizes the results of operations for the Reinsurance segment:
| Years ended December 31, | |||||||||
| (in millions) | 2009 | 2008 | 2007 | ||||||
| Gross written premiums |
$ | 162.9 | $ | 126.4 | $ | 34.3 | |||
| Earned premiums |
87.7 | 69.9 | 18.1 | ||||||
| Losses and loss adjustment expenses |
15.4 | 33.0 | 9.8 | ||||||
| Underwriting, acquisition and insurance expenses |
30.5 | 21.5 | 5.8 | ||||||
| Underwriting income |
41.8 | 15.4 | 2.5 | ||||||
| Net investment income |
8.5 | 8.2 | 5.6 | ||||||
| Income before income taxes |
$ | 50.3 | $ | 23.6 | $ | 8.1 | |||
| Loss ratio |
17.5% | 47.1% | 54.4% | ||||||
| Expense ratio |
34.8% | 30.8% | 31.7% | ||||||
| Combined ratio |
52.3% | 77.9% | 86.1% | ||||||
45
Table of Contents
Earned premiums for the year ended December 31, 2009 increased as compared to the same period in 2008 as a result of an improved property catastrophe rate environment, a greater use of outward reinsurance and third party quota shares, and the introduction of a primary excess casualty and professional lines unit. Earned premiums for property catastrophe lines increased to $71.3 million for the year ended December 31, 2009 compared to $52.4 million for the same period in 2008. The casualty and professional lines unit contributed earned premiums of $4.1 million for the year ended December 31, 2009. Earned premiums for other assumed programs were $12.3 million and $17.5 million, respectively, for the years ended December 31, 2009 and 2008. The increase in earned premiums for the year ended December 31, 2008 as compared to 2007 was primarily attributable to the effect of initiating operations for Argo Re in 2008. Earned premiums for the assumed programs were comparable for the years ended December 31, 2008 and 2007, respectively, as the Company’s assumed programs remained relatively unchanged.
Losses and loss adjustment expenses for the year ended December 31, 2009 resulted in a loss ratio of 17.5%, compared to 47.1% and 54.4% for the same periods ended 2008 and 2007, respectively. Losses and loss adjustment expenses for the year ended December 31, 2009 reflect no major loss events for the 2009 accident year. Losses and loss adjustment expenses for the year ended December 31, 2009 included $3.6 million in favorable loss reserve development for the 2008 accident year due to Hurricane Ike losses developing more favorably than original estimates, coupled with $4.4 million of favorable reported loss activity on the non-catastrophe losses. Included in losses and loss adjustment expense for the year ended December 31, 2008 were $16.1 million in losses resulting from the hurricanes Gustav and Ike, including $9.6 million attributable to Argo Re’s property catastrophe programs. The Reinsurance segment had favorable loss development in 2008 of $2.7 million driven by favorable property loss reserve development on two reinsurance contracts. Absent the hurricane activity, the loss ratio for the year ended December 31, 2008 as compared to 2007 declined due to the inclusion of a full year of Argo Re results, which underwrites to a lower ultimate loss ratio than the assumed business.
Loss reserves for the Reinsurance segment were $76.0 million, $59.8 million and $17.3 million at December 31, 2009, 2008 and 2007, respectively.
The increase in the expense ratio for the year ended December 31, 2009 as compared to 2008 was primarily attributable to increased staffing and related costs associated with starting the new casualty and professional lines units. Expenses associated with these units, as is typical for a start up operation, are disproportionately higher than the rate at which premiums are earned. The decrease in the expense ratio for the year ended December 31, 2008 as compared to 2007 was the result of the overall increase in earned premiums.
46
Table of Contents
International Specialty.
The International Specialty segment was formed in May 2008 with the purchase of Heritage, renamed Argo International. As a result, financial results for the two periods presented below are not directly comparable with the table including the last seven months from the acquisition date for the period ended December 31, 2008, and the full year for the year ended December 31, 2009. The following table summarizes the results of operations for the International Specialty segment:
| Years ended December 31, | ||||||
| (in millions) | 2009 | 2008 | ||||
| Gross written premiums |
$ | 706.0 | $ | 282.9 | ||
| Earned premiums |
424.1 | 183.4 | ||||
| Losses and loss adjustment expenses |
244.4 | 142.8 | ||||
| Underwriting, acquisition and insurance expenses |
161.9 | 63.0 | ||||
| Underwriting income (loss) |
17.8 | (22.4) | ||||
| Net investment income |
11.5 | 10.6 | ||||
| Fee income, net |
0.7 | 6.6 | ||||
| Impairment of intangible asset |
5.9 | - | ||||
| Income (loss) before income taxes |
$ | 24.1 | $ | (5.2) | ||
| Loss ratio |
57.6% | 77.9% | ||||
| Expense ratio |
38.2% | 34.4% | ||||
| Combined ratio |
95.8% | 112.3% | ||||
Subsequent to the acquisition and in preparation for the 2009 year of account, Argo Underwriting Agency increased its participation to 61% from 54% for the prior year of account for Syndicate 1200 results, and is maintaining that participation for the 2010 year of account. For the 2008 year of account, Argo Underwriting Agency increased its participation in Syndicate 1200 to 54% compared to 48% for the 2007 year of account. Argo Managing Agency manages syndicate 1200 and also managed Syndicate 3245 for the 2007 and prior years of account. Argo Underwriting Agency participated in 28% of Syndicate 3245 for the 2007 year of account and increased its participation to 54% upon Syndicate 3245 merging into Syndicate 1200 for the 2008 year of account. For Syndicate 1200 results not retained by the Company, Argo Managing Agency receives fee income for underwriting services provided to third party capital providers. Lloyd’s stamp capacity for Syndicate 1200 for the 2008 and 2009 years of account was £325 million. For the 2010 year of account, Lloyd’s stamp capacity has been increased to £350 million.
Earned premiums represent the portion of gross written premiums retained by Argo Underwriting Agency with 2009 representing a full year compared to the final seven months from acquisition for 2008. Earned premiums for 2009 were increased by approximately $43.3 million in respect of property binder premiums from prior exposures reported to the Company during 2009.
Losses and loss adjustment expenses are reported net of losses ceded to the trade reinsurers. The loss ratio for the year ended December 31, 2009 was 57.6% and was lower than the prior year loss ratio of 77.9% primarily due to lower catastrophe losses in 2009. Included in losses and loss adjustment expenses for the year ended December 31, 2008 was $40.7 million in losses resulting from hurricanes Gustav and Ike. Unfavorable loss reserve development on prior accident years during 2009 was $23.5 million which was offset by additional premiums of $24.1 million, both of which were primarily related to the property binder business. Included in 2008 losses and loss adjustment expenses was $3.5 million of unfavorable loss development related to property facultative claims from the 2006 year of account.
Loss reserves at December 31, 2009 were $609.6 million, including $227.9 million of reserves attributable to the trade capital providers, compared to loss reserves at December 31, 2008 of $449.7 million, including $183.3 million of reserves attributable to the trade capital providers.
The increase in the expense ratio for the year ended December 31, 2009 as compared to the period ended December 31, 2008 was primarily the result of a different mix of business. The change in business mix resulted in higher commission program business and less open market property business in particular the binder premium relating to prior exposures. Additionally, included in expenses for 2009 were post-acquisition costs associated with integrating the International Specialty segment into the business.
47
Table of Contents
Fee income, net represents fees and profit commission derived from the Company’s management of third party capital for the underwriting syndicates at Lloyd’s, net of associated expenses. Fee income, net of $0.7 million for the year ended December 31, 2009 was less than the $6.6 million fee income for the last seven months of 2008 due to reduction in profit estimates particularly 2008 year of account. In addition, the Company’s trade name was changed from Heritage to Argo during 2009. As a result, the remaining unamortized intangible of $5.9 million associated with the Heritage trade name was written off.
Run-off Lines
The following table summarizes the results of operations for the Run-off Lines segment:
| Years ended December 31, | |||||||||
| (in millions) | 2009 | 2008 | 2007 | ||||||
| Earned premiums |
$ | 2.1 | $ | (15.7) | $ | (3.1) | |||
| Losses and loss adjustment expenses |
(1.6) | (14.2) | 23.1 | ||||||
| Underwriting, acquisition and insurance expenses |
19.9 | 21.3 | 23.8 | ||||||
| Underwriting loss |
(16.2) | (22.8) | (50.0) | ||||||
| Net investment income |
22.6 | 32.4 | 43.1 | ||||||
| Other expense |
- | 0.6 | - | ||||||
| Income (loss) before income taxes |
$ | 6.4 | $ | 9.0 | $ | (6.9) | |||
Earned premiums for the year ended December 31, 2009 were primarily attributable to adjustments resulting from final audits, reinstatement premiums and other adjustments on policies previously written. Earned premiums for the year ended December 31, 2008 were reduced by $15.0 million in ceded premiums due to the expiration of a reinsurance contract in 2008, in addition to decreased reinstatement premiums on reinsurance programs previously written. Earned premiums for the year ended December 31, 2007 were primarily attributable to adjustments resulting from final audits and other adjustments on policies previously written.
Losses and loss adjustment expenses for the year ended December 31, 2009 included $1.6 million in net favorable loss reserve development on prior accident years. The favorable development included $7.6 million of favorable loss reserve development for PXRE non-catastrophe lines and $3.2 million of favorable development related to PXRE’s 2005 hurricane losses. Partially offsetting the favorable development was $6.1 million in unfavorable reserve development resulting from the settlement of one large asbestos claim in the first quarter of 2009 and $3.0 million unfavorable reserve development related to workers compensation reserve discount.
Losses and loss adjustment expense for the year ended December 31, 2008 included $14.2 million in net favorable loss reserve development on prior accident years. Included in losses and loss adjustment expenses for the year ended December 31, 2008 was $12.5 million favorable loss reserve development on prior accident years for PXRE non-catastrophe property lines and $5.0 million favorable loss development related to PXRE’s 2005 hurricane losses and $1.7 million of favorable loss reserve development in risk management lines. Partially offsetting this favorable development was $5.0 million of unfavorable loss reserve development on prior accident years, primarily driven by strengthening the reserves for the Company’s asbestos and environmental exposure.
Losses and loss adjustment expenses for the year ended December 31, 2007 included $23.1 million in net unfavorable development on prior accident years. The unfavorable development included $26.0 million for the Company’s asbestos and environmental exposure. Workers compensation claims resulted in $7.0 million in unfavorable development, primarily due the settlement of one claim for $5.5 million, coupled with $2.0 million due to the unwinding of the reserve discount. Loss reserves for involuntary pools and unallocated loss adjustment expenses increased $0.8 million for prior accident years. Favorable development of $8.7 million was recognized on the general liability and automobile lines, primarily related to the 2000 through 2004 accident years. Favorable development on the general liability lines includes reserve take downs due to the Company closing its last open construction defect claim and the corresponding reversal of the construction defect bulk reserve.
48
Table of Contents
Underwriting expenses for the year ended December 31, 2009 decreased as compared to 2008 and 2007 due to reduced administrative expenses. Bad debt expense on uncollectible reinsurance recoverable balances of $4.8 million and $5.8 million were included for the years ended December 31, 2009 and 2008, respectively.
The Company, through its subsidiary Argonaut Insurance Company, is exposed to asbestos liability at the primary level through claims filed against its direct insureds, as well as through its position as a reinsurer of other primary carriers. Argonaut Insurance Company has direct liability arising primarily from policies issued from the 1960s to the early 1980s which pre-dated policy contract wording that excluded asbestos exposure. The majority of the direct policies were issued on behalf of small contractors or construction companies. The Company believes that the frequency and severity of asbestos claims for such insureds is typically less than that experienced for large, industrial manufacturing and distribution concerns.
Argonaut Insurance Company also assumed risk as a reinsurer, primarily for the period from 1970 to 1975, a portion of which was assumed from the London market. Argonaut Insurance Company also reinsured risks on policies written by domestic carriers. Such reinsurance typically provided coverage for limits attaching at a relatively high level which are payable only after other layers of reinsurance are exhausted. Some of the claims now being filed on policies reinsured by Argonaut Insurance Company are on behalf of claimants who may have been exposed at some time to asbestos incorporated into buildings they occupied, but have no apparent medical problems resulting from such exposure. Additionally, lawsuits are being brought against businesses that were not directly involved in the manufacture or installation of materials containing asbestos. The Company believes that a significant portion of claims generated out of this population of claimants may result in incurred losses generally lower than the asbestos claims filed over the past decade and could be below the attachment level of Argonaut Insurance Company.
The following table represents a reconciliation of total gross and net reserves for the Run-off Lines for each of the years in the three-year period ended December 31, 2009. Amounts in the net column are reduced by reinsurance recoverables.
| (in millions) | 2009 | 2008 | 2007 | |||||||||||||||
| Gross | Net | Gross | Net | Gross | Net | |||||||||||||
| Asbestos and environmental: |
||||||||||||||||||
| Loss reserves, beginning of the year |
$ | 143.3 | $ | 125.4 | $ | 157.2 | $ | 141.4 | $ | 166.8 | $ | 156.8 | ||||||
| Incurred losses |
30.4 | 6.5 | 8.9 | 5.0 | 29.8 | 21.8 | ||||||||||||
| Losses paid |
51.0 | 38.9 | 22.8 | 21.0 | 39.4 | 37.2 | ||||||||||||
| Loss reserves - asbestos and environmental, end of the year |
122.7 | 93.0 | 143.3 | 125.4 | 157.2 | 141.4 | ||||||||||||
| Risk management reserves |
367.3 | 268.1 | 397.7 | 290.3 | 461.2 | 337.7 | ||||||||||||
| PXRE run-off reserves |
50.0 | 49.9 | 97.6 | 97.5 | 198.5 | 198.2 | ||||||||||||
| Other run-off lines |
12.6 | 12.3 | 16.0 | 15.6 | 24.9 | 19.7 | ||||||||||||
| Total loss reserves - Run-off Lines |
$ | 552.6 | $ | 423.3 | $ | 654.6 | $ | 528.8 | $ | 841.8 | $ | 697.0 | ||||||
49
Table of Contents
The following table represents the components of gross loss reserves for the Run-off Lines for each of the years in the three-year period ended December 31, 2009:
| (in millions) | 2009 | 2008 | 2007 | ||||||
| Asbestos: |
|||||||||
| Direct |
|||||||||
| Case reserves |
$ | 23.5 | $ | 9.6 | $ | 11.5 | |||
| ULAE |
2.9 | 3.2 | 3.3 | ||||||
| IBNR |
9.6 | 16.7 | 19.1 | ||||||
| Total direct written reserves |
36.0 | 29.5 | 33.9 | ||||||
| Assumed domestic |
|||||||||
| Case reserves |
28.4 | 35.7 | 34.2 | ||||||
| ULAE |
4.3 | 4.5 | 5.4 | ||||||
| IBNR |
22.1 | 34.3 | 39.1 | ||||||
| Total assumed domestic reserves |
54.8 | 74.5 | 78.7 | ||||||
| Assumed London |
|||||||||
| Case reserves |
9.8 | 10.4 | 10.8 | ||||||
| ULAE |
1.2 | 1.4 | 1.5 | ||||||
| IBNR |
6.7 | 8.9 | 11.7 | ||||||
| Total assumed London reserves |
17.7 | 20.7 | 24.0 | ||||||
| Total asbestos reserves |
108.5 | 124.7 | 136.6 | ||||||
| Environmental: |
|||||||||
| Case reserves |
6.0 | 6.6 | 7.4 | ||||||
| ULAE |
0.8 | 1.0 | 1.3 | ||||||
| IBNR |
7.4 | 11.0 | 11.9 | ||||||
| Total environmental reserves |
14.2 | 18.6 | 20.6 | ||||||
| Risk management reserves |
367.3 | 397.7 | 461.2 | ||||||
| PXRE run-off reserves |
50.0 | 97.6 | 198.5 | ||||||
| Other run-off lines |
12.6 | 16.0 | 24.9 | ||||||
| Total loss reserves - Run-off Lines |
$ | 552.6 | $ | 654.6 | $ | 841.8 | |||
The Company performs an extensive actuarial analysis of the asbestos and environmental reserves on at least an annual basis. The process is typically completed in the third quarter of the calendar year and reviewed/updated during the fourth quarter. The Company continually monitors the status of the claims, and may make adjustments outside of the annual review period. The review entails a detailed analysis of the Company’s direct and assumed exposure. The Company utilizes a consulting actuary to assist in determining the indicated liability and then reviews the study results. Management considers that estimate in determining their best estimate of the asbestos and environmental loss and loss adjustment expense reserves.
Management uses various actuarial methods to determine its best estimate of losses for the asbestos and environmental exposure within the Run-off Lines segment, which resulted in a range of potential ultimate liability, net of reinsurance, of $68.2 million to $140.8 million. In determining its best estimate, management primarily relied on a method that projects future reported claims and severities, with some weight given to other methods. This method relies most heavily on the Company’s historical claims and severity information, whereas other methods rely more heavily on industry information. The method produces an estimate of losses which have been incurred but not yet reported based on projections of future claims and the average severity for those future claims. The severities were calculated based on the Company’s specific data and in management’s opinion best reflect the Company’s liabilities based upon the insurance policies issued.
50
Table of Contents
The following table represents a reconciliation of the number of asbestos and environmental claims outstanding for each of the years in the three-year period ended December 31, 2009:
| 2009 | 2008 | 2007 | ||||
| Open claims, beginning of the year |
4,409 | 5,217 | 6,250 | |||
| Claims closed during the year |
1,633 | 1,335 | 1,756 | |||
| Claims opened during the year |
655 | 527 | 723 | |||
| Open claims, end of the year |
3,431 | 4,409 | 5,217 | |||
The number of claims opened during the three years ended December 31, 2009 were as follows:
| 2009 | 2008 | 2007 | ||||
| Direct |
157 | 37 | 22 | |||
| Assumed domestic |
343 | 378 | 531 | |||
| Assumed London |
155 | 112 | 170 | |||
| Total opened claims |
655 | 527 | 723 | |||
Settlement of litigation in the second quarter of 2009 pertaining to a single asbestos case accounted for 138 of the 157 direct claims that were established in 2009. New claims in the reinsurance assumed categories are primarily the result of the Company typically providing coverage for higher limits which are payable only after other layers of reinsurance are exhausted. Additionally, there tend to be long delays in the ceding companies reporting claims to the reinsurers.
The following table represents gross payments on asbestos and environmental claims for each of the years in the three-year period ended December 31, 2009:
| (in millions) | 2009 | 2008 | 2007 | ||||||
| Gross payments on closed claims |
$ | 16.5 | $ | 3.3 | $ | - | |||
| Gross payments on open claims |
34.5 | 19.5 | 39.4 | ||||||
| Total gross payments |
$ | 51.0 | $ | 22.8 | $ | 39.4 | |||
Settlement of the litigation referenced above accounted for $19.5 million of the $34.5 million in direct claim payments made in 2009.
Because of the types of coverages within the Run-off Lines of business still being serviced by Argonaut Insurance Company, a significant amount of subjectivity and uncertainty exists in establishing the reserves for losses and loss adjustment expenses. Factors that increase these uncertainties are: (1) lack of historical data, (2) inapplicability of standard actuarial projection techniques, (3) uncertainties regarding ultimate claim costs, (4) coverage interpretations, and (5) the judicial, statutory and regulatory environments under which these claims may ultimately be resolved. Significant uncertainty remains as to the ultimate liability to the Company due to the potentially long waiting period between exposure and emergence of any bodily injury or property damage and the resulting potential for involvement of multiple policy periods for individual claims. Due to these uncertainties, the current trends may not be indicative of future results. Although management has determined and recorded its best estimate of the reserves for losses and loss adjustment expenses for Run-off Lines, current judicial and legislative decisions continue to broaden liability, expand policy scopes and increase the severity of claims payments. As a result of these and other recent developments, the uncertainties inherent in estimating ultimate loss reserves are heightened, further complicating the already complex process of determining loss reserves. The industry as a whole is involved in extensive litigation over these coverages and liability issues, and must contend with the continuing uncertainty in its effort to quantify these exposures.
51
Table of Contents
Liquidity and Capital Resources
The primary sources of cash flow for the Company and its subsidiaries are premiums, reinsurance recoverables, proceeds from sales and redemptions of investments and investment income. The primary cash outflows are claim payments, loss adjustment expenses, reinsurance costs and operating expenses. The nature of insurance is that cash collected for premiums written is invested, interest and dividends are earned thereon, and loss and settlement expenses are paid out over a period of years. This period of time varies by line of business and by the circumstances surrounding each claim. A substantial portion of the Company’s loss and loss expenses are paid out over more than one year. Additional cash outflow occurs through payments of underwriting and acquisition costs such as commissions, taxes, payroll and general overhead expenses. Management believes that cash receipts from premiums, proceeds from investment sales and redemptions and investment income are sufficient to cover cash outflows in the foreseeable future. Should the need for additional cash arise, the Company believes it has access to additional sources of liquidity.
Cash provided by operating activities can fluctuate due to timing difference in the collection of premiums and reinsurance recoverables and the payment of losses and expenses. For the year ended December 31, 2009, net cash provided by operating activities was $301.8 million, compared to $118.5 million and $166.2 million for the years ended December 31, 2008 and 2007, respectively. The increase in cash flows from operations in 2009 as compared to 2008 was primarily attributable to the inclusion of a full year of Argo International activity and increased cash flow from the U.S. and Bermuda operations. The decrease in cash flows from operations in 2008 as compared to 2007 was primarily attributable to Argo International’s positive net cash flow offset by increased claim payments for Argo Group US and Argo Re in 2008 as compared to these two entities’ claim payments in 2007.
Net cash used by investing activities totaled $240.8 million, $115.4 million and $189.3 million for the years ended December 31, 2009, 2008 and 2007, respectively. In 2009, cash was primarily used to acquire fixed maturity securities. The decrease in the amount of net cash used in 2008 as compared to 2007 was primarily due to the cash payments associated with the Company’s 2008 acquisitions (Argo International, Massamont, and Insight) being less than the net proceeds from investment activity year over year and the cash proceeds received in 2008 from the sale of PXRE Reinsurance Company. In 2007, cash was primarily used to acquire fixed maturity and equity securities, offset by cash received from sales, calls and maturities of fixed maturity securities and sales of equity securities. The Company received net cash of $10.4 million upon the closing of the Merger of PXRE and Argonaut Group in August 2007. As of December 31, 2009, 2008 and 2007, $439.3 million, $513.6 million and $648.8 million, respectively, of the investment portfolio were invested in short-term investments. The increase in 2008 and 2007 reflects the duration of liabilities from Argo Re.
For the year ended December 31, 2009 and 2008, net cash used by financing activities totaled $48.1 million and $11.6 million, respectively. For the years ended December 31, 2007, cash provided by financing activities totaled $15.5 million. The decrease in financing activities in 2009 is primarily resulting from the net cash payment on the revolving credit facility. The decrease in financing activities in 2008 is resulting from less activity from the Company’s stock incentive plans in 2008 due to the respective strike price of the awards being in excess of market price, net cash payment on the revolving credit facility and the repurchase by the Company of 145,999 shares of its common stock offset by no dividend payments made in 2008. The increase in cash provided by financing activities in 2007 as compared to 2006 was primarily the result of cash received from stock option exercises.
The Company and its other holding company subsidiaries are largely dependent on dividends and other permitted payments from its insurance and reinsurance subsidiaries to pay cash dividends to its shareholders, for debt service and for its operating expenses. The ability of the Company’s insurance and reinsurance subsidiaries to pay dividends to the Company is subject to certain restrictions imposed by the jurisdictions of domicile that regulate the Company’s immediate insurance and reinsurance subsidiaries and each jurisdiction has calculations for the amount of dividends that an insurance and reinsurance company can pay without the approval of the insurance regulator.
In addition, the Company’s ability to receive dividends from its downstream subsidiaries is subject to the ability of each parent corporation within the corporate ownership structure to receive dividends from its respective subsidiary(ies), based upon the subsidiary’s domiciliary regulations. Argo Re is the primary direct subsidiary of Argo Group and is subject to Bermuda insurance laws. Argo Ireland is indirectly owned by Argo Re and is a mid-level holding company subject to Irish laws, and its primary subsidiary is Argo Group US. Argo Group US is a mid-level holding company subject to Delaware laws. Argo Group US is the parent of all of the Company’s U.S. insurance subsidiaries.
52
Table of Contents
The payment of dividends by Argo Re is limited under Bermuda insurance laws, which require Argo Re to maintain certain measures of solvency and liquidity. As of December 31, 2009, Argo Re’s solvency and liquidity margins and statutory capital and surplus were in excess of the minimum levels required by the Insurance Act. As of December 31, 2009, the unaudited statutory capital and surplus of Argo Re was estimated to be $1,269.2 million and the amount required to be maintained was estimated to be $239.9 million, thereby allowing Argo Re the potential to pay dividends or capital distributions within the parameters of the solvency and liquidity margins. The Company believes that the dividend and capital distribution capacity of Argo Re will provide the Company with sufficient liquidity to meet its operating and debt service commitments, as well as other obligations that may arise from time to time.
As a mid-level holding company, Argo Ireland is largely dependent on dividends or other permitted payments from Argo Group US to fund its operating expenses and to fund dividends or share capital reductions to Argo Re. Argo Group US is a mid-level holding company owned by Argo Ireland and is largely dependent on dividends and other permitted payments from its insurance subsidiaries to fund its operating expenses, fund debt service, or to fund dividends to Argo Ireland. Each holding company is subject to their respective domiciliary regulations and tax laws. The Company believes that Argo Ireland and Argo Group US each have sufficient dividend and capital distribution capacity to meet the operating and capital needs of their parents.
During 2010, Argonaut Insurance Company may be permitted to pay dividends of up to $56.8 million in cash without approval from the Illinois Department of Insurance, based on the state of domicile’s ordinary dividend calculation. Colony may be permitted to pay dividends of up to $36.8 million in cash without approval from the Virginia Bureau of Insurance, based on the state of domicile’s ordinary dividend calculation. Rockwood may be permitted to pay dividends of up to $15.6 million in cash without approval from the Pennsylvania Department of Insurance, based on the state of domicile’s ordinary dividend calculation. Business and regulatory considerations may impact the amount of dividends actually paid, and prior approval of dividend payments may be required.
The Company believes it has access to various sources of liquidity including cash, investments, and borrowings under its revolving credit facility as well as access to the debt and equity capital markets. On February 27, 2009 the Company entered into a $100 million, 364 day revolving credit facility with JPMorgan Chase Bank, N.A., as administrative agent, and other lenders thereto (the “Credit Agreement”). The Credit Agreement was amended to extend the maturity to April 30, 2010. The proceeds of borrowings can be used for general corporate purposes, including working capital and permitted acquisitions. At December 31, 2009, the Company had no borrowings outstanding under this agreement.
The Company has two additional LOC facilities totaling $400 million that allow it to provide LOCs to its ceding companies if such LOC is required under the terms of the contract, and to Lloyd’s to be filed on behalf of Argo (No. 604) Limited. All of the facilities require the Company to provide collateral in the form of fixed maturity securities or cash to the issuing bank as security for the outstanding LOCs. The Company also has two LOC facilities that have been terminated but still have outstanding LOCs. The Company no longer has the ability to issue new LOCs from these facilities but the existing LOCs shall be maintained by the issuing banks. The Company must transfer eligible assets to collateral banks prior to each respective bank issuing an LOC. Since eligible assets include fixed income investments, such securities need not be sold in order to qualify as eligible collateral. At December 31, 2009, the Company has pledged assets with a fair value of $128.9 million to support outstanding letters of credit.
LOCs have been filed with Lloyd’s under a third party property deed on behalf of the Trade Capital providers. LOCs have been filed as part of the terms of whole account quota share reinsurance contracts entered into by the Trade Capital reinsurers. In the event such LOCs are funded, the outstanding balance would be the responsibility of the Trade Capital providers.
53
Table of Contents
Through a series of trusts, that are wholly-owned subsidiaries (non-consolidated), the Company issued debt. The debentures are variable and fixed rate, with the variable rate being reset periodically and subject to certain interest rate ceilings. Interest payments are payable quarterly or semiannually. The debentures are all unsecured and are subordinated to other indebtedness. All are redeemable five years after issuance subject to certain terms and conditions at a price equal to 100% of the principal plus accrued and unpaid interest, except as noted in the footnotes to the following table. These obligations are summarized as follows:
| (in millions) | |||||||||||||
| Issue Date |
Trust Preferred Pools |
Maturity |
Redeemable | Rate Structure |
Interest Rate at |
Amount | |||||||
| Argo Group |
|||||||||||||
|
05/15/2003 |
PXRE Capital Statutory Trust II | 05/15/2033 | 05/15/2008 | 3M Libor + 4.10% | 4.37% | $ 18.0 | |||||||
|
05/23/2003 |
PXRE Capital Trust III |
05/23/2033 | 05/23/2008 | (1) | 9.75% | 9.75% | 15.5 | ||||||
|
10/29/2003 |
PXRE Capital Trust V | 10/29/2033 | 10/29/2008 | 3M Libor + 3.85% | 4.13% | 20.6 | |||||||
|
11/ 06/2003 |
PXRE Capital Trust VI | 09/30/2033 | 09/30/2008 | 3M Libor + 3.90% | 4.15% | 10.3 | |||||||
| Argo Group US |
|||||||||||||
| 01/29/1997 |
PXRE Capital Trust I | 02/01/2027 | 02/01/2007 | (2) | 8.85% | 8.85% | 103.1 | ||||||
|
04/25/2003 |
Argonaut Group Statutory Trust I | 05/15/2033 | 05/15/2008 | 3M Libor + 4.10% | 4.37% | 15.5 | |||||||
|
12/16/2003 |
Argonaut Group Statutory Trust III | 01/08/2034 | 01/08/2009 | 3M Libor + 4.10% | 4.38% | 12.3 | |||||||
|
04/29/2004 |
Argonaut Group Statutory Trust IV | 04/29/2034 | 04/29/2009 | 3M Libor + 3.85% | 4.12% | 13.4 | |||||||
|
05/26/2004 |
Argonaut Group Statutory Trust V | 05/24/2034 | 05/24/2009 | 3M Libor + 3.85% | 4.11% | 12.3 | |||||||
|
05/12/2004 |
Argonaut Group Statutory Trust VI | 05/12/2034 | 06/01/2009 | 3M Libor + 3.80% | 4.05% | 13.4 | |||||||
|
09/17/2004 |
Argonaut Group Statutory Trust VII | 12/15/2034 | 09/17/2009 | 3M Libor + 3.60% | 3.85% | 15.5 | |||||||
|
09/22/2004 |
Argonaut Group Statutory Trust VIII | 09/22/2034 | 09/22/2009 | 3M Libor + 3.55% | 3.80% | 15.5 | |||||||
|
10/22/2004 |
Argonaut Group Statutory Trust IX | 12/15/2034 | 12/15/2009 | 3M Libor + 3.60% | 3.85% | 15.5 | |||||||
|
09/14/2005 |
Argonaut Group Statutory Trust X |
09/15/2035 |
09/15/2010 |
(3) |
7.75% until 09/10, then 3M Libor + 3.40% |
7.75% |
30.9 | ||||||
| PXRE Capital Trust I Unamortized discount | (0.4) | ||||||||||||
| Total Outstanding | $ 311.4 | ||||||||||||
| (1) | Redeemable at a price equal to 104.875 to 100% of the principal, plus accrued and unpaid interest |
| (2) | Redeemable at a call prices of 104.18% at February 2007 declining to 100.418% at February 2016, and 100% thereafter |
| (3) | Redeemable prior to September 2010, at the greater of a) 107.5% of principal plus accrued and unpaid interest or b) the sum of the discounted present value of the principal, the discounted present value of the interest payable during the fixed rate period remaining life and the accrued and unpaid interest. Redeemable after September 2010 at a price equal to 100% of the principal plus accrued and unpaid interest |
The Company assumed debt through the acquisition of Argo International. At December 31, 2009, the outstanding balance on this debt was $69.2 million. The total debt is comprised of two U.S. denominated notes (issued in 2005 and 2006) and three Euro denominated notes (issued 2005, 2006 and 2007). The debt is unsecured, and each note has an option to repay in full on any interest payment date following the fifth anniversary of issue. No principal payments were made on these notes during 2009 or during the seven months ended December 31, 2008. These notes mature beginning in 2034.
Throughout 2009, the Company had no preferred shares outstanding.
The Company did not pay cash dividends in 2009 to its common shareholders. On February 19, 2010, the Company announced that the Board of Directors has reinstated a quarterly cash dividend in the amount of $0.12 on each share of common stock outstanding to be disbursed on March 15, 2010, to shareholders of record on March 1, 2010. The declaration and payment of dividends is at the discretion of the Board and will depend on the Company’s financial results, cash requirements, future prospects and other factors deemed relevant by the Board.
On November 13, 2007, the Board of Directors authorized the repurchase of up to $150.0 million of the Company’s common shares. The Company did not repurchase any shares during 2009, and as of December 31, 2009 had purchased 145,999 shares at an average price of $35.23 (total of $5.1 million repurchased). The Company may continue to acquire stock based on available liquidity and market conditions.
54
Table of Contents
The Company invests excess cash in a variety of investment securities. As of December 31, 2009, the Company’s investment portfolio consisted of 81.5% fixed maturities, 6.2% equity securities, 2.2% other investments and 10.1% short-term investments (based on fair value) compared to 78.9% fixed maturities, 6.8% equity securities, 1.4% other investments and 12.9% short-term investments for the same period in 2008. The Company classifies the majority of its investment portfolio as available-for-sale; resulting in these investments being reported at fair market value, with unrealized gains and losses, net of tax, being reported as a component of shareholders’ equity. Of the Company’s total investments of $4,334.3 million, only $2.2 million is classified as trading. All trading investments are reported at fair market value, with unrealized gains and losses, net of tax, being reported as a component of net income. No issuer (excluding United States Government and United States Governmental agencies) of fixed income or equity securities represents more than 4.1% of shareholders’ equity at December 31, 2009.
The Company’s insurance subsidiaries require liquidity and adequate capital to meet ongoing obligations to policyholders and claimants, and to fund operating expenses. During the three years ended December 31, 2009, the Company’s liquidity generated from operations and investment income were sufficient to meet obligations. Adequate levels of liquidity and surplus are maintained to manage the risks inherent with any differences between the duration of its liabilities and invested assets. The Company believes it maintains sufficient liquidity to pay claims and expenses, as well as satisfy its commitments in the event of unforeseen events such as reinsurer insolvencies, inadequate premium rates, or reserve deficiencies.
The Company maintains a comprehensive reinsurance program at levels management considers adequate to diversify risk and safeguard its financial position. The costs of the Company’s program, to the extent not passed on to customers through increased rates may have a negative impact on liquidity.
Credit Risk
Credit risk is a major factor of the overall enterprise risk within the Company, and the Company has established policies and procedures to evaluate its exposure to credit risk, particularly with respect to its investment holdings and its receivable balances from insureds and reinsurers. The Company is also exposed to credit risk on losses recoverable from reinsurers and premiums receivable from insureds. Downturns in one sector or market can adversely impact other sectors and may result in higher credit exposure. The Company does not currently use credit default swaps to mitigate its credit exposure from either investments or counterparties.
The Company invests in the debt securities markets, which exposes it to credit risk. As a consequence of extending credit and/or carrying investment positions, the Company has exposure to credit risk arising from the uncertainty associated with a financial instrument obligor’s ability to make timely principal and/or interest payments. The Company attempts to mitigate this risk by limiting credit concentrations, diversification, and frequently monitoring the credit quality of issuers and counterparties.
The Company controls its credit exposure related to financial instruments by limiting exposure to any one counterparty and mandating minimum credit ratings. The Company utilizes specific criteria to judge the credit quality of its investments and counterparties, and also reviews ratings published by various credit rating services, if available.
Additional information relating to the Company’s investment strategy and credit risk is included under Item 7A “Quantitative and Qualitative Disclosures about Market Risk” on pages 71 – 73.
Related Party Transactions
Fayez Sarofim & Co. Certain insurance subsidiaries of the Company and Fayez Sarofim & Co. (“Investment Manager”) are parties to investment agreements (the “Investment Management Agreements”), whereby the Investment Manager has agreed to make investment decisions with respect to and otherwise manages certain funds deposited by the Company’s insurance subsidiaries for those purposes. The Investment Manager is owned 100% by the Sarofim Group, Inc. the majority of which is owned by Fayez Sarofim, a former director of the Company. As of December 31, 2009, Fayez Sarofim & Co. managed $244.8 million fair market value of the Company’s insurance subsidiary’s investments. The Company paid Fayez Sarofim & Co. approximately $0.5 million for services provided for the year ended December 31, 2009. The Investment Management Agreements are terminable by either party at any time on 30 days advance written notice. Fayez Sarofim ceased to serve on our board of directors in May 2009.
Off-Balance Sheet Arrangements
The Company has committed to invest up to a total of $25.0 million in a series of capital partnerships. As of December 31, 2009, the Company has a remaining obligation to the partnerships to invest up to an additional $7.1 million, which can be called at any time. The Company has not recorded this commitment in its consolidated financials statements. The investment will be recorded at such time as the capital partnership requires the additional investment. Additionally, the Company has not recorded the liabilities for its operating leases in its consolidated financial statements.
55
Table of Contents
The Company has no material obligations under a guarantee contract. The Company has no material retained or contingent interests in assets transferred to an unconsolidated entity. The Company has no unrecorded obligations, arising out of a variable interest in an unconsolidated entity held by, and material to, the Company, where such entity provides financing, liquidity, market risk or credit risk support to, or engages in leasing, hedging or research and development services with the Company.
Contractual Obligations
The Company’s estimated contractual obligations and commitments as of December 31, 2009 were as follows:
| Payments Due by Period | |||||||||||||||
| (in millions) | Total | Less than 1 year |
1 - 3 years | 3 - 5 years | Thereafter | ||||||||||
| Long-term debt: |
|||||||||||||||
| Junior subordinated debentures (1) |
$ | 729.9 | $ | 19.8 | $ | 39.7 | $ | 39.6 | $ | 630.8 | |||||
| Floating rate loan stock (2) |
156.5 | 3.3 | 6.6 | 6.6 | 140.0 | ||||||||||
| Capital lease obligations |
3.9 | 0.7 | 3.2 | - | - | ||||||||||
| Operating leases |
40.5 | 10.4 | 14.5 | 6.1 | 9.5 | ||||||||||
| Purchase obligations (3) |
11.5 | 6.8 | 4.0 | 0.7 | - | ||||||||||
| Additional purchase price consideration (4) |
2.9 | 2.9 | - | - | - | ||||||||||
| Other long-term liabilities: |
|||||||||||||||
| Claim payments (5) |
3,203.2 | 775.7 | 948.4 | 462.1 | 1,017.0 | ||||||||||
| Partnership commitments (6) |
7.1 | - | - | - | 7.1 | ||||||||||
| Total contractual obligations |
$ | 4,155.5 | $ | 819.6 | $ | 1,016.4 | $ | 515.1 | $ | 1,804.4 | |||||
| (1) | Interest only due on Junior Subordinated Debentures through 2027 which represents first date when principal payments become contractually due. Interest calculated based on the rate in effect at December 31, 2009. Principal due beginning February 2027 for Argo Group US and beginning May 2033 for Argo Group. |
| (2) | Interest due on “Floating rate loan stock” through 2034 which represents first date when principal payments become contractually due. Interest calculated based on the rate in effect at December 31, 2009. |
| (3) | Purchase obligations consist primarily of software servicing and licensing fees. |
| (4) | Associated with the Company’s acquisition of Insight Insurance Services, Inc. Interest and final payments to previous owners payable by the Company on September 8, 2010 and is calculated based on the rate in effect at December 31, 2009. |
| (5) | Claim payments do not have a contractual maturity; exact timing of claim payments cannot be predicted with certainty. The above table estimates timing of claim payments based on historical payment patterns and excludes the benefits of reinsurance recoveries. |
| (6) | Argo Group has invested in multiple capital partnership agreements and can be called to fulfill the obligations at any time. The remaining commitment outstanding is $7.1 million. |
Recent Accounting Pronouncements
The discussion of the adoption and pending adoption of recently issued accounting policies is included in Note 1, “Business and Significant Accounting Policies” in the Notes to the Consolidated Financial Statements, included in Item 8 “Financial Statements and Supplementary Data” beginning on page F-1.
Critical Accounting Estimates
Reserves for Losses and Loss Adjustment Expenses. The Company establishes reserves for the estimated total unpaid costs of losses including loss adjustment expenses (“LAE”), for losses that occurred in 2009 and prior. Unless otherwise specified below, the term “loss reserves” shall encompass reserves for both losses and LAE. Loss reserves reflect management’s best estimate of the total cost of (i) claims that have been incurred, but not yet paid, and (ii) claims that have been “incurred but not yet reported” (“IBNR”). Loss reserves established by the Company are not an exact calculation of the Company’s liability. Rather, loss reserves represent management’s best estimate of its liability based on application of actuarial techniques and other projection methodology and taking into consideration other facts and circumstances known at the balance sheet date. The process of establishing loss reserves is complex and necessarily imprecise, as it involves using judgment that is impacted by many variables such as past loss experience, current claim trends and the prevailing social, economic and legal environments. The impact of both internal and external variables on ultimate loss and LAE costs is difficult to estimate. The Company underwrites several different product lines across many different geographic regions with exposure impacted by both the risk characteristics of the physical locations such as wind perils, as well as risks associated with varying social, judicial and legislative characteristics of the states in which the Company does business. In determining loss reserves, the Company gives careful consideration to all available data and actuarial analyses and this process involves significant judgment.
56
Table of Contents
The relevant factors and methodologies used to estimate loss reserves vary significantly by product line due to differences in loss exposure and claim complexity. Much of the Company’s business is written on an occurrence basis, meaning that there may be a significant time lag between the event which gives rise to a claim and the date on which the claim is reported to the Company, which can also result in additional time being required to resolve the claim. During these time lags, which can span over several years for complex claims, new facts and information specific to the claim become known to the Company, and general econometric and societal trends continue to change, requiring the Company to refine its loss reserve estimates on a regular basis. The Company applies a strict regimen to assure that review of these facts and trends occurs on a timely basis so that this information can be factored into its estimate of future liabilities. However, due to the number and potential magnitude of these variables, actual paid losses in future periods may differ materially from the Company’s estimates as reflected in current reserves. These differences can be favorable or unfavorable. More precise estimation of loss reserves is also hindered by the effects of growth in a line of business and uncertainty as to how new business performs over time. In addition to reserving for known claim events, the Company also establishes loss reserves for IBNR. Loss reserves for IBNR are set using the Company’s actuarial estimates for events that have occurred as of the balance sheet date but have yet to be reported to the Company. Estimation of IBNR loss reserves are subject to significant uncertainty.
The Company evaluates and sets its loss reserves by line of business. Following is a summary of gross and net loss reserves recorded by the Company by line of business as of December 31, 2009 and 2008:
| 2009 | 2008 | |||||||||||
| (in millions)
|
Gross | Net | Gross | Net | ||||||||
| General liability |
$ | 1,354.8 | $ | 957.3 | $ | 1,235.1 | $ | 909.9 | ||||
| Workers compensation |
660.3 | 447.0 | 682.5 | 465.4 | ||||||||
| Commercial multi-peril |
217.5 | 185.6 | 239.2 | 190.2 | ||||||||
| Commercial auto liability |
186.7 | 161.9 | 175.4 | 145.7 | ||||||||
| Reinsurance - nonproportional assumed property |
95.6 | 89.3 | 127.7 | 127.6 | ||||||||
| Special property |
28.8 | 17.5 | 37.7 | 19.0 | ||||||||
| Auto physical damage |
12.2 | 8.3 | 16.3 | 10.0 | ||||||||
| Argo International |
609.6 | 336.7 | 449.8 | 239.5 | ||||||||
| All other lines |
37.7 | 9.6 | 32.9 | 8.3 | ||||||||
| Total reserves |
$ | 3,203.2 | $ | 2,213.2 | $ | 2,996.6 | $ | 2,115.6 | ||||
Loss Reserve Estimation Methods
The process for estimating the Company’s loss reserves begins with the collection and analysis of claim data. The data collected for actuarial analyses includes reported claims sorted by the year the loss occurred, paid losses, also sorted by year of loss occurrence, and case reserve estimates. The data sets are sorted into homogeneous groupings, exhibiting similar loss and exposure characteristics. The Company primarily uses internal data in the analysis but also considers industry data in developing factors and estimates. The Company analyzes loss reserves on a quarterly and annual basis.
The Company utilizes a variety of actuarial techniques and methods to determine loss reserves for all lines of business. Each such method has its own set of assumptions and outputs, and each has strengths and weaknesses in different areas. No single estimation method is superior to another method in all situations. Because the Company underwrites business in multiple product lines in various locations, the methods and assumptions used to project loss reserves will vary by line of business. The Company utilizes what it believes to be the best and most appropriate set of actuarial methods and assumptions for each product line grouping. The estimation methods utilized reflect those methods that the Company believes will produce the most accurate and reliable indication of ultimate claim liabilities at the balance sheet date for the claim liabilities being evaluated. While the loss projection methods may vary by product line, the general approach for calculating IBNR remains the same: ultimate losses and LAE are forecasted first, and that amount is reduced by the amount of cumulative paid claims and by case reserves.
57
Table of Contents
When the Company initially establishes IBNR reserves at the beginning of an accident year for each line of business, it uses the expected loss ratio method. This method is initially based upon the Company’s annual analyses of historical loss ratios but may be adjusted based on pricing input from the underwriters, anticipated loss ratio trend, changes in reinsurance structure, and any other factors that may impact loss ratio expectations. At the end of each quarter, the Company will review the loss ratio selections, but will generally not deviate from the loss ratio method until the end of the accident year, at which time the Company will begin to assign weight to the paid and incurred Bornhuetter-Ferguson (“BF”) methods depending on the line of business being evaluated. The BF methods compute IBNR through a blend of the expected loss ratio method and traditional loss development methods. The output of the BF methods computes IBNR for an accident year as the product of expected losses (earned premium multiplied by an expected loss ratio) plus an expected percentage of unreported losses. The expected percentage of unreported losses is derived from age-to-ultimate loss development factors that result from the Company’s analyses of loss development triangles. Finally, once losses mature to the point at which the loss experience is more credible, the Company assigns most weight to the paid and incurred loss development methods.
For short tailed lines of business such as property, loss experience is generally credible 18 to 36 months after the beginning of the accident year. The expected loss ratio method is initially selected and applied to earned premium at the beginning of an accident year. As property losses occur and are reported, and when claims adjusters have sufficient time and information to make specific claims estimates, the BF methods are utilized to supplement the expected loss ratio method. Property losses are generally reported within a short time from the date of loss, and in most instances property claims are settled and paid within a relatively short period of time. Therefore, approximately six months after the accident year has expired, paid and incurred development methods are given greater weight in the Company’s analyses. In the event there are large claims incurred, the Company will analyze large loss information separately to ensure that the loss reserving methods appropriately recognize the magnitude of these losses in the evaluation of ultimate losses.
For the general liability and automobile liability long tail lines, the starting point for determining ultimate losses is initially the expected loss ratio method, just as it is for short tailed lines. The time lag for reporting claims is greater in liability lines of business. Facts and information are frequently not complete at the time case reserves are established, and because protracted litigation is sometimes involved creating additional uncertainty in final settlement amounts, case reserves alone are an insufficient measure of the ultimate loss costs. Due to the variability in the timing of receipt and completeness of case reserve data, the Company generally waits approximately 60 to 72 months after the beginning of an accident year to assign greater credibility to the paid and incurred development methods. Until that time, the Company relies primarily on the BF methods.
Workers compensation is a long tailed line of business and also requires approximately 60 to 72 months after the beginning of an accident year until the data is deemed fully credible for paid and incurred reserve evaluation methods. Until that time, an expected loss ratio method is utilized for the initial 12 to 18 months of an accident year, followed by paid and incurred BF loss development methodologies. Frequency and severity statistics are also tracked for workers compensation and used to supplement the other actuarial techniques. Loss development for workers compensation spans many years. However, a significant portion of the outstanding reserves correspond to scheduled annuity payments and are not subject to extreme volatility. The portion of reserves that is not scheduled or annuitized is subject to potentially large variations in ultimate loss cost due to the uncertainty of medical cost inflation. Sources of medical cost inflation include increased utilization, new and more expensive medical testing procedures, and increased utilization and cost of prescription drugs.
The Company has a Run-off Lines segment which includes other liability loss reserves for asbestos, environmental, and other latent exposures. These latent exposures are typically characterized by extended periods of time between the date the Company first became exposed to a loss, the date on which a claim was reported, and the date on which the claim is resolved. For the Company’s Run-off Lines segment long tail loss reserves, there is significant uncertainty involved in estimating reserves for asbestos, environmental, and other latent injury claims. The Company utilizes several methods to estimate reserves for these claims including an approach that projects future calendar period reported claims and severities, a report year method which estimates loss reserves based on the pattern and magnitude of reported claims, and a ground-up analysis which relies on studies of individual policy terms and conditions. The Company also considers survival ratios which compare the Company’s level of loss reserves and loss payments to that of the industry for similar exposures. The combination of the methods produces a range of outcomes from which management evaluates and selects its best estimate given the available facts at the balance sheet date. The Company applies greatest weight to the method that projects future calendar period reported claims and severities because the Company believes it best captures the unique claim reporting and claim severity characteristics of the underlying exposures and loss development potential. The Company analyzes its Run-off Lines loss reserves on a quarterly and annual basis.
58
Table of Contents
Each business segment is analyzed individually, with development characteristics for each short tail and long tail line of business identified and applied accordingly. In comparing loss reserve methods and assumptions utilized at December 31, 2009 as compared with methods and assumptions utilized at December 31, 2008, management has not changed or adjusted methodologies or assumptions in any significant manner.
In conducting its actuarial analyses, the Company generally assumes that past patterns demonstrated in the data will repeat themselves, and that the data provides a basis for estimating future loss reserves. In the event that the Company becomes aware of a material change that may render past experience inappropriate for the purpose of estimating current loss reserves, the Company will attempt to quantify the effect of the change and utilize informed management judgment to adjust loss reserve forecasts appropriately. There were no significant assumptions made at December 31, 2009 in estimating loss reserves that were premised on future emergence that were inconsistent with historical patterns or experience.
Uncertainties in Loss Reserve Estimation
The major causes of uncertainty will vary for each product line reviewed. For short tailed property lines of business, the Company is exposed to catastrophe losses, both natural and manmade. Due to the nature of certain catastrophic loss events, such as hurricanes, earthquakes, or terrorist attacks, the Company’s normal claims resolution processes may be impaired due to factors such as difficulty in accessing impacted areas and other physical, legal, and regulatory impediments. These factors can make establishment of accurate loss reserve estimates difficult and render such estimates subject to greater uncertainty. Additionally, if the catastrophe occurs near the end of a financial reporting period, there are additional uncertainties in loss reserve estimates due to the lack of sufficient time to conduct a thorough analysis. Long tailed casualty lines of business also present challenges in establishing appropriate loss reserves, particularly in the event of changes in the legal environment over time which may broaden the Company’s liability or scope of policy coverage and increase the magnitude of claim payments. The possibility of future adverse changes in the legal environment heightens the uncertainty inherent in estimating the ultimate claim costs on the basis of past claims costs, further complicating the already complex loss reserving process.
In all lines, final claim payments may differ from the established loss reserve, particularly when resolution of a claim takes several years. Due to the uncertainties discussed above, the ultimate losses may vary materially from current loss reserves and could have a material adverse effect on the Company’s future financial condition, results of operations and cash flows. Any adjustments to loss reserves are reflected in the results for the year during which the adjustments are made.
In addition to the previously described general uncertainties encountered in estimating loss reserves, there are significant additional uncertainties in estimating the amount of the Company’s potential losses from asbestos and environmental claims. Loss reserves for asbestos and environmental claims cannot be estimated with traditional loss reserving techniques that rely on historical accident year development factors due to the uncertainties surrounding these types of claims. Among the uncertainties impacting the estimation of such losses are:
| • | potentially long waiting periods between exposure and emergence of any bodily injury or property damage; |
| • | difficulty in identifying sources of environmental or asbestos contamination; |
| • | difficulty in properly allocating responsibility and/or liability for environmental or asbestos damage; |
| • | changes in underlying laws and judicial interpretation of those laws; |
| • | potential for an environmental or asbestos claim to involve many insurance providers over many policy periods; |
| • | long reporting delays from insureds to insurance companies; |
| • | historical data concerning asbestos and environmental losses, which is more limited than historical information on other types of claims; |
| • | questions concerning interpretation and application of insurance coverage; and |
| • | uncertainty regarding the number and identity of insureds with potential asbestos or environmental exposure. |
Case reserves and expense reserves for costs of related litigation have been established where sufficient information has been developed. Additionally, IBNR has been established to cover additional exposure on known and unknown claims.
59
Table of Contents
The Company underwrites environmental and pollution coverages on a limited number of policies and underground storage tanks. The Company establishes loss reserves to the extent that, in the judgment of management, the facts and prevailing law reflect an exposure for the Company.
Through its subsidiary, Rockwood, the Company has exposure to claims for black lung disease. Those diagnosed with black lung disease are eligible to receive workers compensation benefits from various US federal and state programs. These programs are continually being reviewed by the governing bodies and may be revised without notice in such a way as to increase the level of the Company’s exposure. Management has recorded its best estimate of approximately $12.7 million of loss reserves related to these exposures based on the trends and facts currently known.
Risk Factors by Line of Business in Loss Reserve Estimation
The following section details reserving considerations and loss and LAE risk factors for the product lines representing most of the Company’s loss reserves. Each risk factor presented will have a different impact on required loss reserves. Also, risk factors can have offsetting or compounding effects on required loss reserves. For example, introduction and approval of a more expensive medical procedure may result in higher estimates for medical inflation costs. But in the workers compensation context, the availability of that same medical procedure may enable workers to return to work more quickly, thereby lowering estimates for indemnity costs for that line of business. As a result, it usually is not possible to identify and measure the impact that a change in one discrete risk factor may have or construct a meaningful sensitivity expectation around it. The Company does not make explicit estimates of the impact on loss reserve estimates for the assumptions related to the risk factors described below.
Loss adjustment expenses used in connection with the Company’s loss reserves are comprised of both allocated and unallocated expenses. Allocated loss adjustment expenses relate to specific claim files. The Company typically combines allocated loss adjustment expenses with losses for purposes of projecting ultimate liabilities, since most estimation methods contemplate inclusion of both. For some types of claims, such as asbestos and environmental claims, allocated loss adjustment expenses consisting primarily of legal costs may be significant, sometimes exceeding the liability to indemnify claimants for losses. Unallocated loss adjustment expenses are those which are not associated with the handling of any specific claim, and relate to the general administration and handling of claims in the ordinary course of business. Unallocated loss adjustment expenses are calculated as a percentage of unpaid losses for each line of business and are typically less volatile than estimates for losses or allocated loss adjustment expenses.
GENERAL LIABILITY
General liability is considered a long tail line, as it takes a relatively long period of time to finalize and resolve all claims from a given accident year. The speed at which claims are received and then resolved is a function of the specific coverage provided, the jurisdiction in which the claim is located, and specific policy provisions. There are numerous components underlying the general liability product line. Some of these have relatively moderate payout patterns with most of the claims for a given accident year closed within five to seven years, while others are characterized by extreme time lags for both reporting and payment of claims. In addition, this line includes asbestos and environmental claims, which are reviewed separately because of the unique character of these exposures. Allocated loss adjustment expenses in this line consist primarily of legal costs, and may exceed the total amount of the indemnity loss on some claims.
Major factors contributing to uncertainty in loss reserve estimates for general liability include reporting lags (i.e., the length of time between the event triggering coverage and the actual reporting of the claim), the number of parties involved in the underlying tort action, events triggering coverage that are spread over multiple time periods, the inability to know in advance what actual indemnity costs associated with an individual claim will be, the potential for disputes over whether claims were reasonably foreseeable and intended to be covered at the time the contracts were written, and the potential for mass tort claims and class actions. Generally, claims with a longer reporting lag time are characterized by greater inherent risk of uncertainty.
Examples of loss and LAE risk factors associated with general liability claims that can change over time and result in adjustments to loss reserves include, but are not limited to, the following:
Claims risk factors
| • | Changes in claim handling procedures |
| • | Changes in policy provisions or court interpretation of such provisions |
| • | New theories of liability |
60
Table of Contents
| • | Trends in jury awards |
| • | Changes in the propensity to sue, in general and with specificity to particular issues |
| • | Changes in statutes of limitations |
| • | Changes in the underlying court system |
| • | Distortions from losses resulting from large single accounts or single issues |
| • | Changes in tort law |
| • | Shifts in law suit mix between US federal and state courts |
| • | Changes in claim office structure (causing distortions in the data) |
| • | Changes in settlement patterns |
Book of Business risk factors
| • | Changes in policy provisions (e.g., deductibles, policy limits, endorsements) |
| • | Changes in underwriting standards |
| • | Product mix (e.g., size of account, industries insured, jurisdiction mix) |
| • | Growth due to acquisitions |
| • | Development characteristics of general liability lines |
The Company uses several loss reserving methods to capture development characteristics within this line of business. Paid and incurred loss development, paid and incurred Bornhuetter-Ferguson methods, and a loss frequency/severity method are utilized in deriving estimated loss reserves. In addition to these approaches, which are used across most general liability categories of business, the Company considers additional analytic measures in deriving its loss reserve estimates that consider the Claims and Book of Business risk factors noted above.
Many of the Company’s general liability claims require extended time periods to resolve due to delays in reporting, complex coverage issues, and difficulties in assessing claim values and ultimate loss payouts. Some lines require specialized claim handling, such as industrial casualty, general casualty and professional liability exposures and require additional time to resolve. Actuarial methods used to forecast ultimate liabilities in these and other general liability lines are adjusted to take into consideration the uncertainties related to handling claims expected to remain open for an extended period of time.
For asbestos and environmental claims, the Company supplements its traditional loss forecasting methods with additional approaches that attempt to capture the risk characteristics of these insureds and the claimants involved.
WORKERS COMPENSATION
Workers compensation is generally considered a long-tail coverage, as it takes a relatively long period of time to finalize claims from a given accident year. Certain payments, such as initial medical treatment or temporary wage replacement for the injured worker, are generally disbursed quickly. Other payments are made over the course of several years, such as awards for permanent partial injuries. Some payments continue to take place throughout the injured worker’s life, such as permanent disability benefits and on-going medical care. Although long tail in nature, claims generally are not subject to long reporting lags, settlements are generally not complex, and most of the liability exposure is characterized by high frequency and moderate severity. The largest reserve risks are generally associated with low frequency, high severity claims that require lifetime coverage for medical expense arising from a worker’s injury.
Examples of loss and LAE risk factors that can change over time and cause workers compensation loss reserves to fluctuate include, but are not limited to, the following:
Indemnity claims risk factors
| • | Time required to recover from the injury |
| • | Degree of available transitional jobs |
| • | Degree of legal involvement |
| • | Changes in the interpretations and processes of the workers compensation commissions’ oversight of claims |
| • | Future wage inflation for US states that index benefits |
| • | Changes in the administrative policies of second injury funds |
61
Table of Contents
Medical claims risk factors
| • | Changes in the cost of medical treatments (including prescription drugs) and underlying fee schedules |
| • | Frequency of visits to health providers |
| • | Number of medical procedures given during visits to health providers |
| • | Types of health providers used |
| • | Type of medical treatments received |
| • | Use of preferred provider networks and other medical cost containment practices |
| • | Availability of new medical processes and equipment |
| • | Changes in the use of pharmaceutical drugs |
| • | Degree of patient responsiveness to treatment |
Book of Business risk factors
| • | Injury type mix |
| • | Changes in underwriting standards |
| • | Changing product mix based on insured demand |
| • | Management of exited products risk |
| • | Development characteristics of workers compensation lines |
The Company uses several loss reserving methods to capture development characteristics within this line of business. Paid and incurred loss development, paid and incurred Bornhuetter-Ferguson methods, and a loss frequency/severity method are utilized in deriving estimated loss reserves. In addition to these approaches, which are used across most workers compensation categories of business, the Company considers additional analytic measures based upon the Claims and Book of Business workers compensation risk factors noted above in deriving its loss reserve estimate.
REINSURANCE – NONPROPORTIONAL ASSUMED PROPERTY
As a property catastrophe reinsurer, incurred losses are inherently more volatile than those of primary insurers and reinsurers of risks that have an established historical pattern of losses. The most significant uncertainty in reserves involves estimates of catastrophe losses. In reserving for catastrophe losses, these estimates are influenced by underwriting information provided by clients, clients’ market shares, industry catastrophe models, industry loss estimates and internal analyses of this information. This reserving approach can cause significant development from initial loss estimates in the immediate wake of a catastrophe event due to the limited information available to the Company as a reinsurer regarding the actual underlying losses. This process can cause the ultimate estimates to differ significantly from initial projections.
The loss estimation process begins with the identification of events with characteristics similar to the recent catastrophe (geographic location, wind speed, damageability etc.), which then results in a list of the expected losses by contract from the Company’s proprietary risk management system. Third party modeling software is embedded in the Company’s proprietary risk management system.
Concurrently, underwriting teams employ a market share approach as well as perform a thorough contract by contract analysis to identify potential changes to the expected loss estimates including IBNR by contract. The results of this initial process are updated when additional information is available. This information comes in the form of publicly available announcements, informal contact with brokers and/or clients, submission data and formal claim notices. As catastrophic events mature and reporting loss methods become more credible (usually six to twelve months after the event) actuarial methods implementing historical patterns can be assigned more credibility. In evaluating the loss estimates for catastrophic events, the Company utilizes internal databases to establish projected reporting patterns and payment patterns. This database includes data dating back to the 1980’s consisting of well over one hundred catastrophic events, of which over twenty are hurricanes. Industry patterns from the Reinsurance Association of America (“RAA”), an insurance industry organization, are also employed. Using this information, the Company has developed loss development factors for significant catastrophes. Internal significant catastrophe loss development factors are analyzed as appropriate and at least once per year to reflect updated industry benchmarks and changes in the Company’s specific loss history.
PXRE legacy reserves consist primarily of liabilities associated with property catastrophe reinsurance claims attributed to the 2005 Hurricanes, Katrina, Rita and Wilma (“KRW”). Specifically for Hurricane Katrina, the Company’s estimates are subject to a level of uncertainty arising out of extremely complex and unique causation and coverage issues, including the appropriate attribution of losses to wind or flood damage as opposed to other perils such as fire, business interruption or civil commotion. The underlying personal lines policies generally contain exclusions for flood damage; however, water damage caused by wind may be covered. Causation and coverage issues may not be resolved for a considerable period of time and may be influenced by evolving legal and regulatory developments.
62
Table of Contents
Actuarial analyses implementing historical paid and incurred loss development patterns based on both Company specific and industry data, support the adequacy of carried loss reserves for these events.
INTERNATIONAL SPECIALTY – ARGO INTERNATIONAL
International Specialty loss reserves are analyzed quarterly by internal staff. Additionally, the Company employs an independent actuarial firm to conduct a more detailed review of loss reserves annually. Management’s best estimate of loss reserves is determined after review of internal and external work products.
The Company uses several approaches and actuarial techniques to project gross and net loss reserves. For property lines of business, the Company reviews its loss reserves considering the underlying claims. The Company utilizes paid and incurred loss development as its primary methods for determining ultimate losses. Additionally, the Company considers expected loss ratios, pricing trends and any other variations in the business underwritten, including changes in underlying terms and conditions. Catastrophic claim liabilities and other large losses are inherently more volatile than attritional losses; therefore the Company needs to utilize other loss forecasting methodologies. For known catastrophic claims, the Company initially relies on third party modeling software to determine its exposure to catastrophic events. As catastrophic events mature, specific claim information received by the Company is used to refine its initial loss estimate. After approximately four to six months from the date of the catastrophic event, the Company’s reported losses relative to the event are assigned significant credibility. However, it may be several years before ultimate loss amounts are fully known as disputes over policy coverage or the relevant law governing a claim cause uncertainty in the estimation of outcomes. The observed large loss patterns are subsequently adjusted by changes in underlying exposures and risk characteristics.
For the long tailed lines underwritten by International Specialty, such as professional indemnity and general liability, it may be several years before claims are fully advised and settled. The large time lag involved for reporting and settling claims introduces a large amount of uncertainty into the loss estimation process. Loss experience is not deemed fully credible for several years. Until the time that an underwriting year of account is closed, the Company utilizes an expected loss ratio method to determine ultimate losses, supplemented by paid and incurred BF loss development methods, to the extent that the reported loss data matures and is considered credible.
For both short tailed and long tailed lines of business, the two most critical assumptions for determining loss reserves are that the past is a reasonable predictor of future claims development, and that rating and other models used, including pricing models for recent business, are fair indicators of the ultimate claims that will be incurred. If the underlying risk characteristics of the business written is materially different than business underwritten by the Company in prior years, or if changes in loss reserving or other claims settlement practices is not accurately captured by the actuarial forecasting methods, loss reserve estimates may be subject to error.
The Company performs its loss reserve analysis on a syndicate basis, which represents 100% of the business underwritten by the syndicate. The Company utilizes trade reinsurance to cede a proportion of its premium income and incurred losses to trade reinsurers. The percentage of the cession differs for each underwriting year of account. The reinsurers’ share of provisions for claims is based on calculated amounts of outstanding claims and projections for IBNR, net of estimated irrecoverable amounts. The syndicate will evaluate the reinsurance program in place for the class of business, the claims experience for the year, and the security rating of the reinsurance companies involved. This evaluation, along with other factors and considerations, is used to determine trade reinsurer participation in future years.
COMMERCIAL MULTIPLE PERIL
Commercial multiple peril lines insure a combination of property and liability exposures, and therefore include both short and long tail coverages. Property coverage claims are generally resolved in a short period of time, while liability coverage claims generally require more time to resolve. These lines include package polices issued to a limited number of well defined industry sectors, including grocery stores, restaurants, dry cleaners and religious institutions. The risk of fluctuation in loss reserves for this line is predominately associated with liability coverage, with risk factors similar to other general liability lines described above.
63
Table of Contents
Because commercial multiple peril lines involve both short tail and long tail coverages, the Company gives weight to different methodologies in deriving estimated loss reserves based on the coverage being evaluated. In general, paid and incurred loss development methods are used to forecast property losses. For liability losses, due to the Claims and Book of Business risk factors described in the General Liability section above, the Company uses several loss reserving methods to capture the development characteristics associated with these lines of business. Paid and incurred loss development, paid and incurred Bornhuetter-Ferguson methods, and a loss frequency/severity method are utilized in deriving estimated loss reserves. In addition to these approaches, which are used across most commercial multiple peril categories of business, the Company also considers additional analytic measures in deriving its loss reserve estimate for certain product lines with differing characteristics.
COMMERCIAL AUTOMOBILE LIABILITY
The commercial automobile liability product line is a long tail coverage, mainly due to exposures arising out of bodily injury claims. Losses in this line associated with bodily injury claims generally are more difficult to accurately estimate and take longer to resolve. Claim reporting lags also can be lengthy. Examples of loss and LAE risk factors that can change over time and result in adjustments to commercial automobile liability loss reserves include, but are not limited to, the following:
Claims risk factors
| • | Trends in jury awards |
| • | Changes in the underlying court system |
| • | Changes in case law |
| • | Litigation trends |
| • | Frequency of claims with payment capped by policy limits |
| • | Change in average severity of accidents, or proportion of severe accidents |
| • | Subrogation opportunities |
| • | Changes in claim handling procedures |
| • | Frequency of visits to health providers |
| • | Number of medical procedures given during visits to health providers |
| • | Types of health providers used |
| • | Types of medical treatments received |
| • | Changes in cost of medical treatments |
| • | Degree of patient responsiveness to treatment |
Book of Business risk factors
| • | Changes in policy provisions (e.g., deductibles, policy limits, endorsements, etc.) |
| • | Changes in mix of insured vehicles |
| • | Changes in underwriting standards |
The Company uses several loss reserving methods to capture the development characteristics of this line of business. Paid and incurred loss development, paid and incurred Bornhuetter-Ferguson methods, and a loss frequency/severity method are utilized in deriving estimated loss reserves. In addition to these approaches, which are used across most commercial automobile liability categories of business, the Company considers additional analytic measures based upon the Claims and Book of Business risk factors noted above in deriving its loss reserve estimate.
A significant portion of the Company’s commercial automobile liability is related to automobiles that are stationary for significant periods of time, such as automobile sales lots. In addition, the Company insures commercial automobiles that travel within a very short radius of the primary insured location, such as shuttle buses. Based on the Company’s targeted markets and their specific loss characteristics, the Company seeks to utilize methods and analytics that reflect the particular exposure to loss for these markets.
Impact of changes in key assumptions on reserve volatility
The Company estimates reserves using a variety of methods, assumptions and data elements. The reserve estimation process includes explicit assumptions about a number of factors in the internal and external environment. Across most lines of business, the most important assumptions are future loss development factors applied to paid or reported losses to date. The trend in loss costs is also a key assumption, particularly in the most recent accident years, where loss development factors are less credible.
64
Table of Contents
The following discussion includes disclosure of possible variations from current estimates of loss reserves due to a change in certain key assumptions. Each of the impacts described below is estimated individually, without consideration for any correlation among other key assumptions or among lines of business. Therefore, it would be inappropriate to take each of the amounts described below and add them together in an attempt to estimate volatility for the Company’s reserves in total. The estimated variations in reserves due to changes in key assumptions discussed below are a reasonable estimate of possible variations that may occur in the future, likely over a period of several calendar years. It is important to note that the variations discussed herein are not meant to be a worst or best case scenario, and therefore, it is possible that future variations may be more than amounts discussed below.
Recorded gross reserves for general liability were $1,354.8 million, with approximately 9% of that amount related to run-off asbestos and environmental exposures. For general liability losses relating to ongoing operations, reported loss development patterns are a key assumption for this line of business. Historically, assumptions on reported loss development patterns have been impacted by, among other things, emergence of new types of claims (e.g. construction defect claims) or a shift in the mixture between smaller, more routine claims and larger, more complex claims. The Company has reviewed the historical variation in reported loss development patterns for general liability losses deriving from continuing operations. If the reported loss development patterns change by 10%, a change that the Company has experienced in the past and which management considers possible, the estimated net reserve could change by $65.0 million, in either direction.
Similar to general liability, commercial multiple peril reserves are affected by reported loss development pattern assumptions. Recorded gross reserves for commercial multiple peril business were $217.5 million as of December 31, 2009. If the development patterns underlying the Company’s net reserves for this line of business changes by 10 points, the estimated net reserve could change by $15.0 million, in either direction.
Recorded gross reserves for PXRE’s legacy property reserves are $49.9 million, with $34.9 million attributed to the 2005 Hurricanes, Katrina, Rita and Wilma (“KRW”). Based on both Company- specific and industry benchmark patterns, these events are approximately 99% reported and 97% paid. Given the maturity of these events, the potential variability in its reserves is small. However, coverage issues surrounding flood in conjunction with wind damage increase the uncertainty around Hurricane Katrina’s loss. For PXRE Legacy business, a range of reserves was calculated as +/- 5% about its net carried reserves.
Recorded gross reserves for workers compensation were $660.3 million. The two most important assumptions for workers compensation reserves are loss development factors and loss cost trends, particularly medical cost inflation. Loss development patterns are dependent on medical cost inflation. Approximately half of the workers compensation net reserves are related to future medical costs. A review of National Council on Compensation Insurance data suggests that the annual growth in industry medical claim costs has varied from -2% to +13% since 1991. Across the entire reserve base, a 1 point change in calendar year medical inflation could change the estimated net reserve by $30.0 million, in either direction.
Recorded gross reserves for auto liability were $186.7 million across all lines, almost entirely Commercial Lines. A key assumption for Commercial Lines auto liability is the annual loss cost trend, particularly the severity trend component of loss costs. A review of Insurance Services Office data suggests that annual growth in industry severity since 1999 has varied from +1% to +6%. A 3 point change in assumed annual severity is within the range of historical experience for the industry and for the Company, and which management considers possible. A 3 point change in assumed annual severity could change the estimated net reserve by $25.0 million, in either direction.
Recorded gross reserves for Argo International were $609.6 million. The Argo International reserves consist primarily of general liability and property reserves. Estimation of Argo International’s general liability reserves are subject to loss emergence, and to types of claims along with mix shifts between smaller, more routine claims and larger, more complex claims. Argo International’s property reserves are analyzed by the characteristics of the underlying exposures. Property loss reserves are characterized by relatively short periods between occurrence, reporting, determination of coverage, and ultimate claims settlement. These property loss reserves tend to be the most predictable. Catastrophic loss reserves tend to exhibit more volatility due to the nature of the underlying loss event which may cause delays and complexity in estimating ultimate loss exposure.
With respect to asbestos and environmental general liability losses, the Company wrote several different categories of insurance contracts that may cover asbestos and environmental claims. First, the Company wrote primary policies providing the first layer of coverage in an insured’s liability program. Second, the Company wrote excess policies providing higher layers of coverage for losses that exhaust the limits of underlying coverage. Third, the Company acted as a reinsurer assuming a portion of those risks assumed from other insurers writing primary, excess and reinsurance coverages. Fourth, subsidiaries of the Company participated in the London Market, writing both direct insurance and assumed reinsurance business. With regard to both environmental and particularly asbestos claims, significant uncertainty limits the ability of insurers and reinsurers to estimate the ultimate reserves necessary for unpaid losses and related expenses. Traditional actuarial reserving techniques cannot reasonably estimate the ultimate cost of these claims, particularly during periods where theories of law are in flux. The degree of variability of reserve estimates for these exposures is significantly greater than for other more traditional exposures. In particular, the Company believes there is a high degree of uncertainty inherent in the estimation of asbestos loss reserves.
65
Table of Contents
In the case of the reserves for asbestos exposures, factors contributing to the high degree of uncertainty include inadequate loss development patterns, plaintiffs’ expanding theories of liability, the risks inherent in major litigation, and inconsistent emerging legal doctrines. Furthermore, over time, insurers, including the Company, have experienced significant changes in the rate at which asbestos claims are brought, the claims experience of particular insureds, and the value of claims, making predictions of future exposure from past experience uncertain. For example, in the past, insurers in general, including the Company, have experienced an increase in the number of asbestos-related claims due to, among other things, plaintiffs’ increased focus on new and previously peripheral defendants and an increase in the number of insureds seeking bankruptcy protection as a result of asbestos-related liabilities. Plaintiffs and insureds have sought to use bankruptcy proceedings, including “pre-packaged” bankruptcies, to accelerate and increase loss payments by insurers. In addition, some policyholders have asserted new classes of claims for coverages to which an aggregate limit of liability may not apply. Further uncertainties include insolvencies of other insurance and reinsurance carriers and unanticipated developments pertaining to the Company’s ability to recover reinsurance for asbestos and environmental claims. Management believes these issues are not likely to be resolved in the near future. In the case of the reserves for environmental exposures, factors contributing to the high degree of uncertainty include expanding theories of liability and damages, the risks inherent in major litigation, inconsistent decisions concerning the existence and scope of coverage for environmental claims, and uncertainty as to the monetary amount being sought by the claimant from the insured.
The reporting pattern for assumed reinsurance claims, including those related to asbestos and environmental claims is much longer than for direct claims. In many instances, it takes months or years to determine that the policyholder’s own obligations have been met and how the reinsurance in question may apply to such claims. The delay in reporting reinsurance claims and exposures adds to the uncertainty of estimating the related reserves.
A number of factors affect the variability of estimates for asbestos and environmental reserves including assumptions with respect to the frequency of claims, the average severity of those claims settled with payment, the dismissal rate of claims with no payment and the expense to indemnity ratio. The uncertainty with respect to the underlying reserve assumptions for asbestos and environmental adds a greater degree of variability to these reserve estimates than reserve estimates for more traditional exposures. While this variability is reflected in part in the size of the range of reserves developed by the Company, that range may still not be indicative of the potential variance between the ultimate outcome and the recorded reserves. The process of estimating asbestos and environmental reserves, which are detailed in Note 16, “Run-off Lines”, of Notes to Consolidated Financial Statements, remain subject to a wide variety of uncertainties. Due to these uncertainties, further developments could cause the Company to change its estimates and ranges of its asbestos and environmental reserves, and the effect of these changes could be material to the Company’s consolidated operating results, financial condition and liquidity.
Loss Reserve Estimation Variability
After reviewing the output from various loss reserving methodologies, the Company selects management’s best estimate of reserves. Management believes that the aggregate loss reserves at December 31, 2009 were adequate to cover claims for losses that have occurred, including both known claims and claims yet to be reported. As of December 31, 2009, the Company recorded gross loss reserves of $3,203.2 million, and loss reserves net of reinsurance of $2,213.2 million. Although the Company’s financial reports reflect management’s best estimate of reserves, it is unlikely that the final amount paid will exactly equal management’s best estimate. In order to provide an indication of the variability in loss reserve estimates, the Company develops reserve ranges by evaluating the variability implied by the results of the various methods and the impact of changing the assumptions and factors used in the loss reserving process.
The Company estimates its range of reserves, net of reinsurance, at $1,936.2 million to $2,494.7 million. In determining this range, loss reserve analyses were performed for each of its major operating segments, comprising both ongoing operations and runoff businesses. High and low estimates developed for each major business segment are summed together to derive the range.
66
Table of Contents
This approach may result in a different range than might be derived from other approaches, since the Company does not attempt to estimate covariance effects which may occur because its lines of business and the events driving ultimate losses may not be correlated. Nor does the Company’s estimated range recognize sources of unknown or unanticipated correlated events such as potential sources of liability not anticipated at the time coverage was afforded, such as asbestos. These factors in combination with other events which may not be contemplated by management in developing its range may cause reserves to develop either more or less favorably than indicated by assumptions that management considers reasonable. This means that the range of reserve values does not represent the range of all possible favorable or unfavorable reserve outcomes, and actual ultimate paid losses may fall outside this range. No one risk factor has been isolated for the purpose of performing a sensitivity or variability analysis on that particular risk factor. Rather, management estimates a range based upon the estimation methods involved.
In establishing its best estimate for reserves, management considers facts currently known and the present judicial and legislative environment. However, given the expansion of coverage and liability by the courts and the legislatures in the recent past and the possibility of similar interpretations in the future, particularly with regard to asbestos and environmental claims, additional loss reserves may develop in future periods. These potential increases cannot be reasonably estimated at the present time. Any increases could have an adverse impact on future operating results, liquidity, risk-based capital ratios and the ratings assigned to the insurance subsidiaries by the nationally recognized insurance rating agencies.
Reinsurance Premiums and Recoverables. Premiums on reinsurance business assumed are recorded as earned evenly over the contract period based upon estimated subject premiums. Assumed premium is comprised of both minimum and deposit premium and an estimate of premium. Minimum and deposit premium is billed and collected in accordance with the provisions of the contracts and is usually billed quarterly or semi-annually. A premium estimate is also recorded if the estimate of the ultimate premium is greater than the minimum and deposit premium. The final or ultimate premium for most contracts is the product of the provisional rate and the ceding company’s subject net earned premium income (“SNEPI”). Because this portion of the premium is reasonably estimable, the Company records and recognizes it as revenue over the period of the contract in the same manner as the minimum and deposit premium. The key assumption related to the premium estimate is the estimate of the amount of the ceding company’s SNEPI, which is a significant element of the Company’s overall underwriting process. Because of the inherent uncertainty in this process, there is the risk that premiums and related receivable balances may turn out to be higher or lower than reported.
The premiums on reinsurance business ceded are recorded as incurred evenly over the contract period. Certain ceded reinsurance contracts contain provisions requiring us to pay additional premiums or reinstatement premiums in the event that losses of a significant magnitude are ceded under such contracts. Under GAAP, the Company is not permitted to establish reserves for these potential additional premiums until a loss occurs that would trigger the obligation to pay such additional or reinstatement premiums. As a result, the net amount recoverable from the Company’s reinsurers in the event of a loss may be reduced by the payment of additional premiums and reinstatement premiums. Frequently, the impact of such premiums will be offset by additional premiums and reinstatement premiums payable to the Company by its clients on its assumed reinsurance business. No assurance can be given; however, that assumed reinstatement and additional premiums will offset ceded reinstatement and additional premiums.
Assumed reinstatement premiums that reinstate coverage are written and earned at the time the associated loss event occurs. Under the contract terms of certain of the Company’s excess of loss contracts, reinstatement premiums are mandatorily due Argo Group following a ceding company’s loss, based on pre-defined contract terms. Terms principally include a pro-rata amount of the original contract premium relative to the proportion of the contractual limit exhausted by the associated loss, without respect to time remaining in the term of the original limit, that is, the amount due is 100% as to time and pro-rata as to amount. Less frequently, terms can vary to incorporate a percentage of the original premium that is more or less than the original premium or can be pro-rata as to time remaining in the term of the original limit.
Assumed reinstatement premiums are accrued based upon contract terms applied to the amount estimated to settle ultimate incurred losses. The primary factor that could affect the estimate of assumed reinstatement premiums is management’s best estimate of ultimate incurred losses. While premiums stated relative to limit (“rates on line”) have an effect on the estimate of assumed reinstatement premiums, those associated with case reserves are based on actual contract rate on line terms, and those estimates associated with IBNR are based on weighted average rate on line terms of the book of business for a given underwriting year by line of business. Therefore the primary factor that could change the estimate of assumed reinstatement premium is management’s best estimate of ultimate incurred losses and the mix of treaties along with their respective rate on lines that ultimately incur losses. Assumed reinstatement premiums receivable are settled on a net basis when loss payments are made to cedents. Accordingly, there is an insignificant amount of credit risk associated with this asset as of any given period end date.
67
Table of Contents
Reinsurance recoverables recorded with respect to insurance losses ceded to reinsurers under reinsurance contracts are also subject to estimation. Ceding ratios are determined using actuarial assumptions, and therefore, are subject to the same uncertainties as reserves for losses and loss adjustment expenses. Additionally, estimates of reinsurance recoverables may prove uncollectible if the reinsurer is unable or unwilling to perform under the contract. The ceding of insurance does not legally discharge the ceding company from its primary liability for the full amount of the policies, and the ceding company is required to pay the loss and bear collection risk if the reinsurer fails to meet its obligation under the reinsurance agreement. The Company evaluates the balances due from reinsurance companies for collectability, and when indicated, in management’s opinion, issues of collectability exist, establish an allowance for doubtful accounts.
Valuation of Investments. The Company’s investments in fixed maturities, preferred stocks and common stocks are classified as available for sale and are reported at fair value under GAAP. Changes in the fair value of investments classified as available for sale are not recognized to income during the period, but rather are recognized as a separate component of shareholders’ equity until realized. Fair values of these investments are estimated using quoted market prices where available. For securities not actively traded, fair values are estimated using values obtained from the Company’s independent investment managers. To estimate the fair value of these investments, the investment managers employ various models that take into consideration such factors, among others, as the credit rating of the issuer, duration of the security, yields on comparably rated publicly traded securities and risk-free yield curves. As of December 31, 2009, investments held by the Company for which there is not a quoted market price is less than 1% of the investment portfolio. The actual value at which such securities could actually be sold or settled with a willing buyer or seller may differ from such estimated fair values depending on a number of factors including, but not limited to, current and future economic conditions, the quantity sold or settled, the presence of an active market and the availability of a willing buyer or seller.
The Company regularly monitors the difference between the estimated fair values of its investments and their cost or book values to identify underperforming investments and whether declines in value are temporary in nature, or “other than temporary.” If a decline in the value of a particular investment is believed to be temporary, the decline is recorded as an unrealized loss, net of tax, in other comprehensive operations as a separate component of shareholders’ equity. If the decline is believed to be “other than temporary,” the carrying value of the investment is written down and recorded as a realized loss in the Consolidated Statements of Operations. Each quarter, all investments in an unrealized loss position are formally reviewed. In general, the process for identifying other-than-temporary declines in fair value involves the consideration of several factors, including but not limited to, whether the issuer has been downgraded to below investment-grade, the length of time in which there has been a significant decline in value, the liquidity, business prospects, and overall financial condition of the issuer, the nature and performance of the collateral or other credit support backing the security, the significance of the decline in value, particularly those trading at 80% or less of original cost, and whether the Company has the intent to sell the debt security or may be required to sell the debt security before its anticipated recovery. For equity securities, the length of time in which there has been a significant decline in value, the significance of the decline in value and whether the Company has the intent to sell the security before its anticipated recovery are the primary factors in determining if an unrealized loss on a security is other-than-temporary. If it is concluded that a decline is “other than temporary,” a realized investment loss for the impairment is recognized. For the year ended December 31, 2009, the Company recorded $45.0 million of realized losses due to the recognition of an other than temporary impairment.
For additional discussion of the risks related to the Company’s investment portfolio, please refer to Item 7A “Quantitative and Qualitative Disclosures about Market Risk” on pages 71 - 73.
Deferred Tax Assets and Liabilities. Deferred tax assets and liabilities are determined based on the differences between the financial reporting and tax bases of the Company’s United States and United Kingdom subsidiaries’ assets and liabilities. Deferred tax liabilities are recognized for temporary differences that will result in taxable amounts in future years. Deferred tax assets are recognized for deductible temporary differences and tax operating loss and tax credit carryforwards. The deferred tax assets and liabilities are measured by applying the enacted tax rates and laws in effect for the years in which such differences are expected to reverse. The components of the Company’s deferred tax asset are temporary differences primarily attributable to loss reserve discounting and unearned premium reserves. The Company’s deferred tax liabilities resulted primarily from unrealized gains in the investment portfolio, deferred acquisition costs, and from underwriting profits arising from business conducted at Lloyd’s which do not become subject to corporation tax in the United Kingdom until the year in which such profits are distributed.
Realization of deferred tax assets is dependent upon the Company’s generation of sufficient taxable income in the future to recover tax benefits that cannot be recovered from taxes paid in the carryback period, which is generally two years for net operating losses and three years for capital losses. At December 31, 2009, the Company had a total net deferred tax asset of $56.1 million prior to any valuation allowance. Management has concluded that a valuation allowance is required for a portion of the tax effected net capital loss carryforward of $33.6 million generated from the sale of PXRE Reinsurance Company, and a full valuation allowance is required for the tax effected net operating loss carryforward of $18.7 million from PXRE Corporation. Of the PXRE loss carryforwards, $17.2 million will expire if not utilized by December 31, 2025 and $1.5 million will expire if not utilized by December 31, 2027. The valuation allowances have been established as Internal Revenue Code Section 382 limits the utilization of net operating loss and net capital loss carryforwards following an ownership change. Accordingly, a valuation allowance of $49.5 million is required. The loss carryforwards available to utilize per year are $2.8 million as required by Internal Revenue Code Section 382. The net deferred tax asset after the valuation allowance is $6.6 million at December 31, 2009. Management regularly evaluates the recoverability of the deferred tax asset and makes any necessary adjustments to it based upon any changes in management’s expectations of future taxable income.
68
Table of Contents
Indefinite Lived Intangible Assets, including Goodwill. The Company performs annual impairment tests of its indefinite lived intangible assets, including goodwill (“goodwill”), or more frequently when impairment indicators exist. The Company has elected to perform its goodwill impairment test on the first day of the fourth quarter of each year, or October 1 of each year. The goodwill impairment test is determined using a two-step process. The first step is to identify if a potential impairment exists by comparing the fair value of a reporting unit with its carrying amount, including goodwill (Step 1). If the fair value of a reporting unit exceeds its carrying value amount, goodwill of the reporting unit is not considered to have a potential impairment and the second step is not necessary. However, if the carrying amount of the reporting unit exceeds its fair value, the second step (Step 2) is performed to determine if goodwill is impaired and to measure the amount of impairment loss to recognize, if any. Step 2 compares the implied fair value of goodwill with the carrying amount of goodwill. If the implied value of goodwill is less than the carrying amount of goodwill, then a charge is recorded to reduce goodwill to the implied goodwill. The implied goodwill is calculated based on a hypothetical purchase price allocation, similar to the requirements in the accounting guidance for business combinations, whereby the implied fair value of the reporting unit is allocated to the fair value of the assets and liabilities of the reporting unit.
At December 31, 2009, the Company had goodwill of $152.2 million assigned to the following reporting units: Excess and Surplus lines - $76.4 million, Commercial Specialty - $47.1 million and International Specialty - $28.7 million. Additionally, at December 31, 2009, the Company had intangible assets totaling $96.5 million, including an indefinite lived intangible asset of $60.5 million within the International Specialty reporting unit. Due to the nature of the International Specialty business, for purposes of the annual impairment evaluation, management is unable to segregate the fair value between the indefinite lived intangible asset and goodwill.
For purposes of evaluating goodwill for impairment, management determined that its reporting units are the same as its operating segments because all components of each segment are similar and none of the components were determined to be separate reporting units. Additionally, each operating segment has discrete financial information available that is regularly reviewed by the chief operating decision maker to make decisions about resources to be allocated and to assess performance. The Company allocated its assets, including goodwill, and liabilities of its reporting units consistent with its segment reporting and prior periods. The Company has not made any material changes in the accounting methodology used to evaluate goodwill.
The Company estimated the fair value of reporting units using an average of three valuation methods: a comparable company analysis, a precedent transaction analysis and a discounted cash flow analysis. All three methods require management to make various judgments and assumptions. Specifically, the October 1 analysis included the assumption that the competitive pricing present in the marketplace for the E&S and Commercial Specialty reporting units will revert to more favorable pricing beginning in 2010 and further in 2011. Additionally, the discounted cash flow analysis included projections of earned premiums, loss ratios, expense growth, and discount rates for each reporting unit. Assumptions about such future cash flows are based on our budgets, business plans, economic projections, anticipated future cash flows and market data. Finally, the comparable company analysis and precedent transaction analysis required judgment in selecting comparable companies and comparable transactions for use in the calculations. In all instances, future changes in these judgments and assumptions could cause impairment of goodwill.
On October 1, 2009, the resulting fair values of the reporting units were in excess of the carrying value, including goodwill, of the reporting units. Accordingly, management did not perform Step 2. However, a 3% decline in the fair value of the Excess and Surplus Lines reporting unit, or a 19% decline in the fair value of the Commercial Specialty reporting unit, or a 3% decline in the fair value of the International Specialty reporting unit would have resulted in the carrying values of these reporting units to be in excess of their respective carrying values, resulting in the need to perform the second step which could have resulted in a material impairment to the Company’s goodwill. Any continued decline in the fair value of these reporting units could result in the carrying value of the reporting unit being in excess of fair value, triggering the second step of the impairment testing model. The second step could result in an impairment of goodwill.
69
Table of Contents
As noted above, the Company has elected to make the first day of the fourth quarter the annual impairment assessment date for goodwill and indefinite-lived intangible assets. An impairment analysis subsequent to this date has not been performed as management believes that no additional indicators of impairment have arisen, such as significant additional pricing competition, unexpected significant declines in operating results, the divestiture of a significant component of the business or a further significant decline in market capitalization.
The market capitalization of the stock of the Company has been below book value during 2009. Management considered the market capitalization decline below book value as a data point in performing its annual impairment test. Management considers the decline in the Company market capitalization to be primarily attributable to global financial market conditions, including the credit crisis, as well as current trends within the insurance industry. The valuation analysis discussed above supports management’s view that goodwill and indefinite lived intangible assets are not impaired at October 31, 2009.
While management believes the estimates and assumptions are reasonable in determining the fair value of reporting units, it is possible a material change could occur. If the Company’s actual results are not consistent with its estimates and assumptions used to calculate fair value, the Company may be required to perform Step 2 in future periods and impairment of goodwill and/or indefinite lived assets could result. The Company cannot predict future events that might impact the fair value of reporting units and goodwill impairment. Such events include, but are not limited to, increased competition in insurance markets and global economic changes.
The Company evaluated its definite lived intangibles for indicators of impairment. If indicators of impairment had been identified, the Company would have been required to test with definite lived intangible assets for impairment. As of October 1, 2009, the testing date, no indicators of impairment were identified. Therefore, the Company was not required to test for impairment. As with the indefinite lived intangible assets, the Company will continue to monitor for indicators of impairment and test as required.
70
Table of Contents
Item 7A. Quantitative and Qualitative Disclosures about Market Risk
The Company’s market risk generally represents the risk of gain or loss that may result from the potential change in the fair value of its investment portfolio as a result of fluctuations in prices, interest rates, credit spreads, and/or market liquidity. Interest expense fluctuates with changes in interest rates as well. In addition, the Company is subject to currency exchange rate risk from its International Specialty and Reinsurance segments.
Fixed Income Portfolio
The Company continually monitors the credit quality of its fixed income portfolio. The Company’s Investment Committee has established guidelines regarding minimum credit quality. These guidelines govern the minimum acceptable credit rating at purchase, as well as the minimum acceptable average credit rating for the portfolio as a whole. As shown on the accompanying table, the Company’s fixed income portfolio is diversified among different types of investments and has a weighted average rating of AA+. At December 31, 2009, 95.0% ($3.4 billion at fair value) of the Company’s portfolio was rated A or better, with 61.8% ($2.2 billion at fair value) of the portfolio rated AAA.
| (in millions) | Fair Value AAA |
Fair Value AA |
Fair Value A |
Fair Value Other |
Total | ||||||||||
| U.S. Treasury securities |
$ | 172.7 | $ | - | $ | - | $ | - | $ | 172.7 | |||||
| U.S. Government agencies |
400.6 | - | 3.0 | - | 403.6 | ||||||||||
| Obligations of states and political subdivisions |
94.6 | 502.5 | 116.5 | 11.1 | 724.7 | ||||||||||
| Corporate securities |
14.3 | 72.1 | 332.0 | 108.9 | 527.3 | ||||||||||
| Structured securities: |
|||||||||||||||
| CMO/MBS-agency |
900.5 | - | - | - | 900.5 | ||||||||||
| CMO/MBS-non agency |
15.6 | 5.7 | 1.5 | 23.8 | 46.6 | ||||||||||
| CMBS |
158.7 | - | 6.0 | 2.3 | 167.0 | ||||||||||
| ABS-residential |
6.8 | 3.6 | 2.0 | 5.7 | 18.1 | ||||||||||
| ABS-non residential |
173.4 | 2.5 | 1.3 | 7.5 | 184.7 | ||||||||||
| Foreign |
246.3 | 70.0 | 52.8 | 17.8 | 386.9 | ||||||||||
| Total Fixed Maturities |
$ | 2,183.5 | $ | 656.4 | $ | 515.1 | $ | 177.1 | $ | 3,532.1 | |||||
Monoline Guarantors: Some securities in the Company’s investment portfolio have credit enhancement in the form of a third-party guarantee from one of the monoline insurers, resulting in exposure to the financial strength of these entities. At December 31, 2009, the total fair value of these securities was $394.1 million, or 9.1% of the consolidated investment portfolio. In most instances, the underlying issuer has its own rating, independent of the additional credit enhancement provided by the monoline insurer. The tables below show the rating of these securities “with” and “without” the credit enhancement provided by the monoline insurer. The rating “with” the guarantee is the higher of the monoline insurer or underlying issuer rating. The rating “without” the credit enhancement represents the rating of the underlying issuer, or the rating of the security based solely on the underlying collateral.
| Insurer | With Guarantee | ||||||||||||||
| (in millions) | AAA | AA | A | Other | Total | ||||||||||
| AMBAC |
$ | 1.8 | $ | 45.7 | $ | 23.0 | $ | 11.2 | $ | 81.7 | |||||
| FGIC |
2.3 | 19.3 | 4.9 | 1.8 | 28.3 | ||||||||||
| XLCA |
- | - | 4.4 | 1.2 | 5.6 | ||||||||||
| Assured Guaranty |
132.9 | - | - | - | 132.9 | ||||||||||
| National Public Finance |
- | 100.1 | 45.5 | - | 145.6 | ||||||||||
| Total With Guarantee |
$ | 137.0 | $ | 165.1 | $ | 77.8 | $ | 14.2 | $ | 394.1 | |||||
71
Table of Contents
| (in millions) | Without Guarantee | ||
| AAA |
$ | 4.1 | |
| AA |
251.4 | ||
| A |
116.5 | ||
| Less than A |
11.1 | ||
| Not Rated |
11.0 | ||
| Total Without Guarantee |
$ | 394.1 | |
The Company continues to monitor developments on the credit quality of these guarantees and underlying issuers, and our professional investment managers continue to evaluate credit risk on a basis that includes the underlying issuer as well as the guarantor. The average credit quality of monoline holdings without the guarantees is AA-. The Company has no direct investment in any of the monoline insurers at December 31, 2009.
CMBS/ABS Exposure:
CMBS: The Company’s investment portfolio includes $166.7 million par value of CMBS holdings at December 31, 2009. The amortized cost of these CMBS securities was $166.6 million and the fair value was $167.0 million, representing 3.9% of the Company’s consolidated investment portfolio. Of these CMBS securities, 94.0% ($158.7 million at fair value) were rated AAA and the remaining $8.3 million were rated AA or lower (all above investment grade). These CMBS securities are generally of the “conduit” variety (as compared with single property type/single property transactions), providing diversity by number of properties (typically over 100), property type, and geography. The CMBS portfolio has a significant number of seasoned deals; 2005 vintages and earlier represent 91.6% of the total. In addition, the CMBS holdings are senior and super senior credit enhanced securities, and 15.4% of these securities have been defeased with U.S. Treasury securities.
ABS: The Company’s investment portfolio includes $180.7 million par value of non-residential ABS holdings at December 31, 2009. The amortized cost of these ABS securities was $182.7 million and the fair value was $184.7 million, representing 4.3% of the Company’s consolidated investment portfolio. These ABS holdings are collateralized by a variety of asset types including: auto loans, prime consumer credit cards, commercial equipment leases, railcar leases, timberland leases, and others.
Equity Portfolio
The Company holds a diversified investment portfolio of common stocks in various industries and market segments, ranging from small market capitalization stocks to large capitalization S&P 500 companies. Marketable equity securities are carried on the consolidated balance sheets at fair value, and are subject to the risk of potential loss in fair value resulting from adverse changes in prices. At December 31, 2009, the fair value of the equity securities portfolio was $265.9 million.
The Company has evaluated its equity portfolio to determine what level, if any, the current market conditions may have on its other-than-temporary write downs for the first quarter of 2010. Assuming December 31, 2009 market prices, the Company does not anticipate any write downs on its equity portfolio in the first quarter of 2010.
Total Portfolio
As of December 31, 2009, the Company had gross unrealized losses of $10.0 million that were in an unrealized loss position for less than one year and $16.8 million of gross unrealized losses that were in an unrealized loss position for one year or greater. The fixed income portfolio accounted for 97.6% of the unrealized losses greater than one year, which were due to macroeconomic issues affecting market liquidity, and increases in credit spreads. The Company has concluded that the above declines in the fair values of its investments in fixed income and equity securities as of December 31, 2009 are temporary.
For the year ended December 31, 2009, the Company recorded other-than-temporary impairments of $45.0 million, including $17.8 million related to foreign currency losses on short-term investments held at Lloyd’s that the Company has sold or intends to sell. For the year ended December 31, 2008, the Company recorded other-than-temporary impairments of $51.3 million.
No issuer (excluding United States Government and United States Governmental agencies) of fixed income or equity securities represents more than 4.1% of shareholders’ equity at December 31, 2009.
72
Table of Contents
Volatility
The Company’s portfolio of investments in fixed income and short-term securities may be adversely affected by changes in interest rates. In addition, some fixed income securities have call or prepayment options. This subjects the Company to reinvestment risk as issuers may call their securities and proceeds are reinvested at lower interest rates resulting in lower investment income. Exposure to interest rate risk is managed by adhering to specific guidelines in connection with the investment portfolio. The Company primarily invests in investment grade bonds or in securities which are guaranteed by the United States federal government. Less than 1% of the fixed income portfolio is invested in bonds rated lower than BBB minus at December 31, 2009. Duration is a common gauge of the price sensitivity of a fixed income portfolio to a change in interest rates. Based upon a pricing model, the Company determines the estimated change in fair value of the fixed maturity securities, assuming immediate parallel shifts in the treasury yield curve while keeping spreads between individual securities and treasuries static. The following interest rate sensitivity analysis measures the potential change in fair value for the fixed maturity and short-term investments resulting from changes in market rates ranging from -200 basis points to +300 basis points as of December 31, 2009:
FIXED INCOME AND SHORT-TERM INVESTMENTS
Portfolio Characteristics
| -200 | -100 | Base Case | 100 | 200 | 300 | |||||||||||||||||||
| Market Yield |
0.7 | % | 1.7 | % | 2.7 | % | 3.7 | % | 4.7 | % | 5.7 | % | ||||||||||||
| Average Life (years) |
3.8 | 4.0 | 4.4 | 5.1 | 5.3 | 5.4 | ||||||||||||||||||
| Option Adjusted Duration (years) |
2.4 | 2.7 | 3.0 | 3.3 | 3.5 | 3.5 | ||||||||||||||||||
| Market Value (in millions) |
$ 4,199.6 | $ | 4,090.3 | $ | 3,971.4 | $ | 3,844.0 | $ | 3,714.4 | $ | 3,587.1 | |||||||||||||
| Gain (Loss) (in millions) |
$ 312.2 | $ | 202.9 | $ | 84.0 | $ | (43.4 | ) | $ | (173.0 | ) | $ | (300.3 | ) | ||||||||||
Foreign Currency Risk
The Company has exposure to foreign currency risk in both its insurance contracts and its invested assets. Certain of the Company’s insurance contracts provide that ultimate losses may be payable in foreign currencies depending on the country of original loss. Foreign currency exchange rate risk exists to the extent that there is an increase in the exchange rate of the foreign currency in which losses are ultimately owed. Therefore, the Company attempts to manage its foreign currency risk by seeking to match its liabilities under insurance and reinsurance polices that are payable in foreign currencies with cash and investments that are denominated in such currencies. Due to the extended time frame for settling the claims plus the fluctuation in currency exchange rates, the potential exists for the Company to realize gains and or losses related to the exchange rates. In addition, the Company may experience foreign currency gains or losses related to exchange rate fluctuations in operating expenses as certain operating costs are payable in currencies other than the U.S. Dollar. For year ended December 2009, the Company recorded realized gains $0.2 million on foreign currency translation.
The Company holds investments that are denominated in foreign currencies. For these foreign denominated investments, the change in exchange rates between the local currency and the Company’s functional currency at each balance sheet date represents an unrealized appreciation or depreciation in value of these securities, and is included as a component of accumulated other comprehensive income.
Indebtedness
At December 31, 2009, the Company has $380.6 million of par value indebtedness outstanding of which $231.5 million or 60.8% is subject to variable interest rates and $149.1 million has fixed interest rates. Thus, interest expense on this variable rate debt is directly correlated to market interest rates, primarily changes in the three-month U.S. dollar-denominated LIBOR rate. Based on the December 31, 2009 outstanding floating par value of $231.5 million, a 100 basis point change in market interest rates would change annual interest expense by $2.3 million per annum.
Item 8. Financial Statements and Supplementary Data
The report of the independent auditors, the consolidated financial statements of Argo Group International Holdings, Ltd. and the supplementary financial statements called for by this Item 8 are included in this report beginning on page F-1 and are incorporated herein by reference.
73
Table of Contents
Item 9. Changes in and Disagreements with Accountants on Accounting and Financial Disclosure
None.
Item 9A. Controls and Procedures
The Company, under the supervision and with the participation of its management, including the Chief Executive Officer and the Chief Financial Officer, evaluated the effectiveness of the design and operation of the Company’s “disclosure controls and procedures” (as defined in Rule 13a-15(e) under the Securities Exchange Act) as of the end of the period covered by this report. In designing and evaluating these disclosure controls and procedures, the Company and its management recognize that any controls and procedures, no matter how well designed and operated, can provide only reasonable assurance of achieving the desired control objectives, and management necessarily was required to apply its judgment in evaluating and implementing possible controls and procedures. Based upon that evaluation, the Chief Executive Officer and Chief Financial Officer concluded that the disclosure controls and procedures were effective at the reasonable assurance level to ensure that information required to be disclosed by the Company in the reports filed or submitted under the Exchange Act are recorded, processed, summarized and reported within the time periods specified in the Securities and Exchange Commission’s rules and forms.
There were no changes in the internal control over financial reporting made during the quarter ended December 31, 2009 that materially affected, or are reasonably likely to materially affect, the Company’s internal control over financial reporting. The Company reviews its disclosure controls and procedures, which may include internal controls over financial reporting, on an ongoing basis. From time to time, management makes changes to enhance the effectiveness of these controls and ensure that they continue to meet the needs of the Company’s business activities over time.
Management’s Report on Internal Control Over Financial Reporting
The management of the Company is responsible for establishing and maintaining adequate internal control over financial reporting. The Company’s internal control over financial reporting is a process designed under the supervision of the Chief Executive Officer and Chief Financial Officer to provide reasonable assurance regarding the reliability of financial reporting and the preparation of the Company’s financial statements for external purposes in accordance with generally accepted accounting principles.
As of December 31, 2009, management assessed the effectiveness of the Company’s internal control over financial reporting based on the criteria for effective internal control over financial reporting established in “Internal Control — Integrated Framework,” issued by the Committee of Sponsoring Organizations (“COSO”) of the Treadway Commission. As a result of the assessment, management determined that the Company maintained effective internal control over financial reporting as of December 31, 2009, based on those criteria.
Ernst & Young LLP, the independent registered public accounting firm that audited the consolidated financial statements of the Company included in this Annual Report on Form 10-K, has issued an attestation report on the Company’s internal control over financial reporting as of December 31, 2009. The report, which expresses unqualified opinions on the effectiveness of the Company’s internal control over financial reporting as of December 31, 2009, is included in this Item under the heading “Attestation Report of Independent Registered Public Accounting Firm.”
Attestation Report of Independent Registered Public Accounting Firm
Report of Ernst & Young LLP
Report of Independent Registered Public Accounting Firm
The Board of Directors and Shareholders of Argo Group International Holdings, Ltd.:
We have audited Argo Group International Holdings, Ltd.’s (the Company’s) internal control over financial reporting as of December 31, 2009, based on criteria established in Internal Control—Integrated Framework issued by the Committee of Sponsoring Organizations of the Treadway Commission (the COSO criteria). The Company’s management is responsible for maintaining effective internal control over financial reporting and for its assessment of the effectiveness of internal control over financial reporting included in the accompanying Management’s Report on Internal Control over Financial Reporting. Our responsibility is to express an opinion on the Company’s internal control over financial reporting based on our audit.
74
Table of Contents
We conducted our audit in accordance with the standards of the Public Company Accounting Oversight Board (United States). Those standards require that we plan and perform the audit to obtain reasonable assurance about whether effective internal control over financial reporting was maintained in all material respects. Our audit included obtaining an understanding of internal control over financial reporting, assessing the risk that a material weakness exists, testing and evaluating the design and operating effectiveness of internal control based on the assessed risk, and performing such other procedures as we considered necessary in the circumstances. We believe that our audit provides a reasonable basis for our opinion.
A company’s internal control over financial reporting is a process designed to provide reasonable assurance regarding the reliability of financial reporting and the preparation of financial statements for external purposes in accordance with generally accepted accounting principles. A company’s internal control over financial reporting includes those policies and procedures that (1) pertain to the maintenance of records that, in reasonable detail, accurately and fairly reflect the transactions and dispositions of the assets of the company; (2) provide reasonable assurance that transactions are recorded as necessary to permit preparation of financial statements in accordance with generally accepted accounting principles, and that receipts and expenditures of the company are being made only in accordance with authorizations of management and directors of the company; and (3) provide reasonable assurance regarding prevention or timely detection of unauthorized acquisition, use or disposition of the company’s assets that could have a material effect on the financial statements.
Because of its inherent limitations, internal control over financial reporting may not prevent or detect misstatements. Also, projections of any evaluation of effectiveness to future periods are subject to the risk that controls may become inadequate because of changes in conditions, or that the degree of compliance with the policies or procedures may deteriorate.
In our opinion, the Company maintained, in all material respects, effective internal control over financial reporting as of December 31, 2009, based on the COSO criteria.
We also have audited, in accordance with the standards of the Public Company Accounting Oversight Board (United States), the consolidated balance sheets of Argo Group International Holdings, Ltd. as of December 31, 2009 and 2008, and the related consolidated statements of income, comprehensive income (loss), shareholders’ equity, and cash flows for each of the three years in the period ended December 31, 2009 of Argo Group International Holdings, Ltd. and our report dated February 26, 2010 expressed an unqualified opinion thereon.
/s/ ERNST & YOUNG LLP
San Antonio, Texas
February 26, 2010
None.
Item 10. Directors, Executive Officers and Corporate Governance
Incorporated herein by reference is the information appearing under the captions “Election of Directors,” “Named Executive Officers,” “Audit Committee,” “Audit Committee Financial Experts,” “Code of Business Ethics and Conduct”, and “Section 16(a) Beneficial Ownership Reporting Compliance” in the Company’s Proxy Statement to be filed with the Securities and Exchange Commission relating to the Company’s Annual Meeting of Shareholders to be held on May 4, 2010.
Item 11. Executive Compensation
Incorporated herein by reference is the information appearing under the captions “Compensation of Executive Officers,” “Non-Employee Director Compensation” and “Human Resources Committee Interlocks and Insider Participation” in the Company’s Proxy Statement to be filed with the Securities and Exchange Commission relating to the Company’s Annual Meeting of Shareholders to be held on May 4, 2010.
75
Table of Contents
Item 12. Security Ownership of Certain Beneficial Owners and Management and Related Shareholder Matters
Equity Based Compensation Plans
In November 2007, the Company’s shareholders approved the Argo Group International Holdings, Ltd. 2007 Long-Term Incentive Plan (the “LTIP”). The LTIP replaces the Argonaut Group, Inc. Amended and Restated Stock Incentive Plan and the PXRE Group Ltd. Incentive Bonus Compensation Plan, both which were approved by their respective shareholders. Both plans were terminated as of the date of the merger, and all outstanding awards were converted into equivalent shares equity awards of Argo Group. The Argonaut Group, Inc. Non-Employee Directors Plan, the PXRE Group Ltd. Director Stock Plan and the PXRE Group Ltd. Director Equity and Deferred Compensation Plan, which were previously approved by shareholders, were terminated as of the merger date, and all outstanding awards converted into equivalent shares of Argo Group. All unissued shares available in the reserve were canceled as of the merger date.
The following table sets forth information as of December 31, 2009 concerning the Company’s equity compensation plans:
| Plan Category |
Number of Securities To Be Issued Upon Exercise of Outstanding Options, Warrants and Rights |
Weighted- Average Per Share Exercise Price of Outstanding Options, Warrants and Rights |
Number of Securities Remaining Available For Future Issuance Under Equity Compensation Plans (Excluding Securities Reflected in the First Column) | |||
| Equity compensation plans approved by shareholders: |
||||||
| Argo Group International Holdings, Ltd. |
||||||
| Long-Term Incentive Plan |
1,406,920 | $ 32.02 | 2,954,311 | |||
| Argonaut Group, Inc. historical plans |
716,990 | $ 35.32 | - | |||
| PXRE Group Ltd. historical plans |
18,728 | $192.12 | - | |||
| Equity compensation plans not approved by shareholders |
- | - | - | |||
| Total |
2,142,638 | $ 35.03 | 2,954,311 | |||
Incorporated herein by reference is the information appearing under the caption “Security Ownership of Principal Stockholders and Management” in the Company’s Proxy Statement to be filed with the Securities and Exchange Commission relating to the Company’s Annual Meeting of Shareholders to be held on May 4, 2010.
Item 13. Certain Relationships and Related Transactions and Director Independence
Incorporated herein by reference is the information appearing under the captions “Human Resources Committee Interlocks and Insider Participation,” “Related Persons Transactions” and “Director Independence” in the Company’s Proxy Statement to be filed with the Securities and Exchange Commission relating to the Company’s Annual Meeting of Shareholders to be held on May 4, 2010.
Item 14. Principal Accounting Fees and Services
Incorporated herein by reference is the information appearing under the caption “Relationship with Independent Auditors” in the Company’s Proxy Statement to be filed with the Securities and Exchange Commission relating to the Company’s Annual Meeting of Shareholders to be held on May 4, 2010.
76
Table of Contents
Item 15. Exhibits, Financial Statement Schedules
| (a) | 1. Financial Statements |
Selected Financial Data
Report of Independent Registered Public Accounting Firm
Consolidated Balance Sheets - December 31, 2009 and 2008
Consolidated Statements of Income
For the Years Ended December 31, 2009, 2008 and 2007
Consolidated Statements of Comprehensive Income (Loss)
For the Years Ended December 31, 2009, 2008 and 2007
Consolidated Statements of Shareholders’ Equity
For the Years Ended December 31, 2009, 2008 and 2007
Consolidated Statements of Cash Flows
For the Years Ended December 31, 2009, 2008 and 2007
Notes to Consolidated Financial Statements
| (a) | 2. Financial Statement Schedules |
Schedule II - Condensed Financial Information of Registrant
December 31, 2009 and 2008
Schedule III - Supplementary Insurance Information
For the Years Ended December 31, 2009, 2008 and 2007
Schedule V - Valuation and Qualifying Accounts for the Years Ended December 31, 2009, 2008 and 2007
Schedule VI - Supplementary Information for Property-Casualty Insurance Companies
For the Years Ended December 31, 2009, 2008 and 2007
All other schedules and notes specified under Regulation S-X are omitted because they are either not applicable, not required or the information called for therein appears in response to the items of Form 10-K or in the Consolidated Financial Statements and the related Notes to Consolidated Financial Statements of Argo Group International Holdings, Ltd. and its subsidiaries listed on the above index.
| a) | 3. Exhibits |
The following exhibits are numbered in accordance with Item 601 of Regulation S-K and, except as noted, are filed herewith.
| Exhibit |
Description | |
| 2.1 | Agreement and Plan of Merger, dated as of March 14, 2007 and amended and restated as of June 8, 2007, by and among Argo Group International Holdings, Ltd. (formerly named PXRE Group Ltd.) (“Argo Group”), PXMS Inc. and Argonaut Group, Inc. (incorporated by reference to Exhibit 2.1 to the Current Report of Argo Group on Form 8-K filed on August 8, 2007). | |
77
Table of Contents
| 2.2 | Recommend Cash Offer, dated as of April 17, 2008, by Argo Acquisition, Limited (a wholly owned subsidiary of Argo Group) for Heritage Underwriting Agency plc (incorporated by reference to Exhibit 99.1 to the Current Report of Argo Group on Form 8-K filed on April 18, 2008). | |
| 3.1 | Amended and Restated Memorandum of Association of Argo Group (incorporated by reference to Exhibit 3.1 to the Current Report of Argo Group on Form 8-K filed on August 8, 2007). | |
| 3.2 | Bye-Laws of Argo Group (incorporated by reference to Exhibit 3.2 to the Current Report of Argo Group on Form 8-K filed on August 8, 2007). | |
| 4.1 | Form of Certificate of Common Shares of Argo Group (incorporated by reference to Exhibit 4.1 to the Current Report of Argo Group on Form 8-K filed on August 8, 2007). | |
| 4.2 | Junior Subordinated Debentures1 | |
| 10.1 | Deed Poll Guarantee of Argo Group in respect of PXRE Reinsurance Ltd., dated as of September 1, 2002 (incorporated by reference to Exhibit 10.3a to Argo Group’s Quarterly Report on Form 10-Q for the quarter ended September 30, 2002). | |
| 10.2 | Argo Group International Holdings, Ltd. 2007 Employee Share Purchase Plan (incorporated by reference to Exhibit 99.1 to Argo Group’s Registration Statement on Form S-8 filed with the Securities and Exchange Commission on December 10, 2007). | |
| 10.3 | Argo Group International Holdings, Ltd. 2007 Annual Incentive Compensation Plan (incorporated by reference to Appendix II to Argo Group’s Proxy Statement for the 2007 Annual General Meeting of Shareholders). | |
| 10.4 | Argo Group International Holdings, Ltd. 2007 Long-Term Incentive Plan (incorporated by reference to Exhibit 99.2 to Argo Group’s Registration Statement on Form S-8 filed with the Securities and Exchange Commission on December 10, 2007). | |
| 10.5 | Argonaut Group, Inc. Amended and Restated Stock Incentive Plan (incorporated by reference to Exhibit 99.1 to Argo Group’s Registration Statement on Form S-8 filed with the Securities and Exchange Commission on November 29, 2007). | |
| 10.6 | Argonaut Group, Inc. Retirement Plan (incorporated by reference to Exhibit 10.2 to Argonaut Group, Inc.’s Form 10 Registration Statement dated September 3, 1986, filed with the Securities and Exchange Commission on September 4, 1986). | |
| 10.7 | 401(k) Retirement Savings Plan (incorporated by reference to the Exhibit 10.4 to Argonaut Group, Inc.’s Form 10-K filed with the Securities and Exchange Commission on February 28, 1989). | |
| 10.8 | Argonaut Group, Inc. Amended and Restated Non-Employee Director Stock Option Plan (incorporated by reference to Exhibit 99.2 to Argo Group’s Registration Statement on Form S-8 filed with the Securities and Exchange Commission on November 29, 2007). | |
| 10.9 | $100,000,000 Credit Agreement dated as of February 27, 2009 among Argo Group International Holdings, Ltd., Argo Group US, Inc., Argo Acquisition Ltd. and Heritage Underwriting Agency, Ltd., The Lenders Party thereto, JPMorgan Chase Bank, N.A., as administrative agent, and Wachovia Bank, N.A., as Syndication Agent (incorporated by reference to Exhibit 10.24 to Argo Group’s Annual Report on Form 10-K filed on March 2, 2009.) | |
| 1 The | Company, through its subsidiaries, has several series of outstanding junior subordinated debentures as described in the footnotes to the Company’s consolidated financial statements filed with its Annual Report on Form 10-K. The Company will provide the SEC with copies of the instruments governing such junior subordinated debentures upon the SEC’s request in accordance with Regulation S-K Item 601(b)(4)(iii)(A). |
78
Table of Contents
| 10.10 | Employment Agreement dated August 17, 2007 between Argo Group International Holdings, Ltd. and Mark E. Watson, III (incorporated by reference to Exhibit 10.1 to Argo Group’s Current Report on Form 8-K filed with the Securities and Exchange Commission on August 17, 2007). | |
| 10.11 | Letter Agreement dated August 17, 2007 between Argo Group International Holdings, Ltd. and Barbara Bufkin (incorporated by reference to Exhibit 10.1 to Argo Group’s Current Report on Form 8-K filed with the Securities and Exchange Commission on August 23, 2007). | |
| 10.12 | Argo Group International Holdings, Ltd. Deferred Compensation Plan for Non-Employee Directors, effective February 12, 2008 (incorporated by reference to Exhibit 10.1 to Argo Group’s Current Report on Form 8-K filed with the Securities and Exchange Commission on February 15, 2008). | |
| 10.13 | First Amendment, effective November 2, 2009, to Argo Group International Holdings, Ltd. Deferred Compensation Plan for Non-Employee Directors. | |
| 10.14 | Lockup Agreement with Mark E. Watson III, dated June 13, 2007 (incorporated by reference to Exhibit 10.1 to Argonaut Group, Inc.’s Current Report on Form 8-K filed with the Securities and Exchange Commission on June 19, 2007). | |
| 10.15 | Lockup Agreement with Barbara C. Bufkin, dated June 13, 2007 (incorporated by reference to Exhibit 10.2 to Argonaut Group, Inc.’s Current Report on Form 8-K filed with the Securities and Exchange Commission on June 19, 2007). | |
| 10.16 | Lockup Agreement with Byron L. Leflore, Jr., dated June 13, 2007 (incorporated by reference to Exhibit 10.4 to Argonaut Group, Inc.’s Current Report on Form 8-K filed with the Securities and Exchange Commission on June 19, 2007). | |
| 10.17 | Executive Employment Agreement, effective May 13, 2008, between Argo Group and Jay Bullock (incorporated by reference to Exhibit 10.1 to Argo Group’s Current Report on Form 8-K filed with the Securities and Exchange Commission on May 16, 2008). | |
| 10.18 | Employment Contract dated June 1, 2009, between Argo International (formerly known as Heritage Group Services Limited) and Julian Enoizi. | |
| 12 | Statements of computation of ratios of earnings to fixed charges and earnings to combined fixed charges and preferred share dividends. | |
| 21 | Subsidiaries of Registrant, as amended. | |
| 23 | Consent of Independent Registered Public Accounting Firm. | |
| 31.1 | Rule 13(a) - 14(a)/15(d) – 14(a) Certification of Chief Executive Officer. | |
| 31.2 | Rule 13(a) - 14(a)/15(d) – 14(a) Certification of Chief Financial Officer. | |
| 32.1 | Certification of Chief Executive Officer Pursuant to 18 U.S.C. Section 1350, as Adopted Pursuant to Section 906 of the Sarbanes-Oxley Act of 2002. | |
| 32.2 | Certification of Chief Financial Officer Pursuant to 18 U.S.C. Section 1350, as Adopted Pursuant to Section 906 of the Sarbanes-Oxley Act of 2002. | |
79
Table of Contents
SIGNATURES
Pursuant to the requirements of Section 13 or 15(d) of the Securities Exchange Act of 1934, the registrant has duly caused this report to be signed on its behalf by the undersigned, thereunto duly authorized.
| ARGO GROUP INTERNATIONAL HOLDINGS, LTD. | ||||
| By | /s/ Mark E. Watson III | |||
| Mark E. Watson III | ||||
| President and Chief Executive Officer | ||||
| Date: February 26, 2010 | ||||
Pursuant to the requirements of the Securities Exchange Act of 1934, this report has been signed below by the following persons on behalf of the registrant and in the capacities and on the dates indicated.
| Signature | Title | Date | ||
| /s/ Mark E. Watson III Mark E. Watson III |
President, Chief Executive |
February 26, 2010 | ||
| /s/ Jay S. Bullock Jay S. Bullock |
Executive Vice President and |
February 26, 2010 | ||
| /s/ Gary V. Woods Gary V. Woods |
Director | February 26, 2010 | ||
| /s/ F. Sedgwick Browne F. Sedgwick Browne |
Director | February 26, 2010 | ||
| /s/ H. Berry Cash H. Berry Cash |
Director | February 26, 2010 | ||
| /s/ Hector DeLeon Hector DeLeon |
Director | February 26, 2010 | ||
| /s/ Mural R. Josephson Mural R. Josephson |
Director | February 26, 2010 | ||
| /s/ Frank W. Maresh Frank W. Maresh |
Director | February 26, 2010 | ||
| /s/ John R. Power, Jr. John R. Power, Jr. |
Director | February 26, 2010 | ||
80
Table of Contents
INDEX TO CONSOLIDATED FINANCIAL STATEMENTS
| F-2 | ||
| Consolidated Financial Statements: |
||
| F-3 | ||
| F-4 | ||
| F-5 | ||
| F-6 | ||
| F-7 | ||
| F-8 | ||
| Supplementary Financial Statement Schedules: |
||
| F-50 | ||
| F-52 | ||
| F-53 | ||
| Schedule VI - Supplementary Information for Property-Casualty Insurance Companies |
F-54 |
F-1
Table of Contents
Report of Independent Registered Public Accounting Firm
The Board of Directors and Shareholders of Argo Group International Holdings, Ltd.:
We have audited the accompanying consolidated balance sheets of Argo Group International Holdings, Ltd. (the Company) as of December 31, 2009 and 2008, and the related consolidated statements of income, comprehensive income (loss), shareholders’ equity, and cash flows for each of the three years in the period ended December 31, 2009. Our audits also included the financial statement schedules listed in the Index at Item 15(a). These consolidated financial statements and schedules are the responsibility of the Company’s management. Our responsibility is to express an opinion on these financial statements based on our audits.
We conducted our audits in accordance with the standards of the Public Company Accounting Oversight Board (United States). Those standards require that we plan and perform the audit to obtain reasonable assurance about whether the financial statements are free of material misstatement. An audit includes examining, on a test basis, evidence supporting the amounts and disclosures in the financial statements. An audit also includes assessing the accounting principles used and significant estimates made by management, as well as evaluating the overall financial statement presentation. We believe that our audits provide a reasonable basis for our opinion.
In our opinion, the financial statements referred to above present fairly, in all material respects, the consolidated financial position of Argo Group International Holdings, Ltd. and subsidiaries at December 31, 2009 and 2008, and the consolidated results of their operations and their cash flows for each of the three years in the period ended December 31, 2009, in conformity with U.S. generally accepted accounting principles. Also in our opinion, the related financial statement schedules, when considered in relation to the basic financial statements taken as a whole, present fairly in all material respects the information set forth therein.
As discussed in Note 1 to the financial statements in 2009 the Company changed its method of accounting for other than temporary impairments with the adoption of the guidance originally issued in FASB Staff Position FAS 115-2 and FAS 124-2, Recognition and Presentation of Other-Than-Temporary Impairments (codified in FASB ASC Topic 320, Investments-Debt and Equity Securities), and in 2007 the Company changed its method of accounting for income taxes with the adoption of the guidance originally issued in FASB Interpretation 46(R), Consolidation of Variable Interest Entities (codified primarily in FASB ASC Topic 810, Consolidation).
We also have audited, in accordance with the standards of the Public Company Accounting Oversight Board (United States), Argo Group International Holdings, Ltd.’s internal control over financial reporting as of December 31, 2009, based on criteria established in Internal Control—Integrated Framework issued by the Committee of Sponsoring Organizations of the Treadway Commission and our report dated February 26, 2010 expressed an unqualified opinion thereon.
| /s/ Ernst & Young LLP |
| San Antonio, Texas |
| February 26, 2010 |
F-2
Table of Contents
ARGO GROUP INTERNATIONAL HOLDINGS, LTD.
CONSOLIDATED BALANCE SHEETS
(in millions, except number of shares and per share amounts)
| December 31, | ||||||
| 2009 | 2008 | |||||
| Assets |
||||||
| Investments: |
||||||
| Fixed maturities, at fair value: |
||||||
| Available-for-sale (cost: 2009 - $3,445.8; 2008 - $3,145.3) |
$ | 3,529.9 | $ | 3,150.4 | ||
| Trading (cost: 2009 - $2.2; 2008 - $2.1) |
2.2 | 2.1 | ||||
| Equity securities, at fair value (cost: 2009 - $181.6; 2008 - $251.8) |
265.9 | 272.3 | ||||
| Other investments (cost: 2009 - $97.4; 2008 - $56.8) |
97.0 | 57.0 | ||||
| Short-term investments, at fair value (cost: 2009 - $439.4; 2008 - $542.0) |
439.3 | 513.6 | ||||
| Total investments |
4,334.3 | 3,995.4 | ||||
| Cash |
18.1 | 5.2 | ||||
| Accrued investment income |
30.8 | 34.2 | ||||
| Premiums receivable |
380.7 | 339.4 | ||||
| Reinsurance recoverables |
1,379.4 | 1,193.8 | ||||
| Goodwill |
152.2 | 151.4 | ||||
| Intangible assets, net of accumulated amortization |
96.5 | 106.2 | ||||
| Current income taxes receivable, net |
7.9 | - | ||||
| Deferred tax asset, net |
6.6 | 50.0 | ||||
| Deferred acquisition costs, net |
185.7 | 178.2 | ||||
| Ceded unearned premiums |
197.7 | 208.8 | ||||
| Other assets |
106.9 | 118.9 | ||||
| Total assets |
$ | 6,896.8 | $ | 6,381.5 | ||
| Liabilities and Shareholders’ Equity |
||||||
| Reserves for losses and loss adjustment expenses |
$ | 3,203.2 | $ | 2,996.6 | ||
| Unearned premiums |
803.6 | 807.6 | ||||
| Accrued underwriting expenses |
100.8 | 107.3 | ||||
| Ceded reinsurance payable, net |
707.9 | 603.4 | ||||
| Funds held |
38.0 | 45.4 | ||||
| Borrowing under revolving credit facility |
- | 50.0 | ||||
| Other indebtedness |
69.2 | 67.3 | ||||
| Junior subordinated debentures |
311.4 | 311.4 | ||||
| Current income taxes payable, net |
- | 2.1 | ||||
| Other liabilities |
47.8 | 37.5 | ||||
| Total liabilities |
5,281.9 | 5,028.6 | ||||
| Shareholders’ equity: |
||||||
| Common shares - $1.00 par, 500,000,000 shares authorized; 30,982,839 and 30,768,878 shares issued and outstanding at December 31, 2009 and 2008, respectively |
31.0 | 30.8 | ||||
| Additional paid-in capital |
702.4 | 694.2 | ||||
| Treasury shares (145,999 shares at December 31, 2009 and December 31, 2008) |
(5.1) | (5.1) | ||||
| Retained earnings |
779.2 | 655.2 | ||||
| Accumulated other comprehensive gain (loss), net of taxes |
107.4 | (22.2) | ||||
| Total shareholders’ equity |
1,614.9 | 1,352.9 | ||||
| Total liabilities and shareholders’ equity |
$ | 6,896.8 | $ | 6,381.5 | ||
See accompanying notes.
F-3
Table of Contents
ARGO GROUP INTERNATIONAL HOLDINGS, LTD.
CONSOLIDATED STATEMENTS OF INCOME
(in millions, except number of shares and per share amounts)
| For the Years Ended December 31, | |||||||||
| 2009 | 2008 | 2007 | |||||||
| Premiums and other revenue: |
|||||||||
| Earned premiums |
$ | 1,414.9 | $ | 1,127.1 | $ | 859.8 | |||
| Net investment income |
145.5 | 150.2 | 134.3 | ||||||
| Fee income, net |
1.1 | 7.2 | - | ||||||
| Realized investment and other (losses) gains, net |
(16.7) | (35.1) | 5.9 | ||||||
| Total revenue |
1,544.8 | 1,249.4 | 1,000.0 | ||||||
| Expenses: |
|||||||||
| Losses and loss adjustment expenses |
853.1 | 724.9 | 526.9 | ||||||
| Underwriting, acquisition and insurance expenses |
517.9 | 407.1 | 328.1 | ||||||
| Interest expense and other |
25.5 | 31.0 | 25.2 | ||||||
| Impairment of intangible asset |
5.9 | - | - | ||||||
| Total expenses |
1,402.4 | 1,163.0 | 880.2 | ||||||
| Income before income taxes and extraordinary item |
142.4 | 86.4 | 119.8 | ||||||
| Provision for income taxes |
24.9 | 23.5 | 42.3 | ||||||
| Income before extraordinary item |
117.5 | 62.9 | 77.5 | ||||||
| Extraordinary item |
- | - | 66.3 | ||||||
| Net income |
$ | 117.5 | $ | 62.9 | $ | 143.8 | |||
| Net income per common share - basic: |
|||||||||
| Income before extraordinary item |
$ | 3.82 | $ | 2.05 | $ | 3.05 | |||
| Extraordinary item |
- | - | 2.61 | ||||||
| Net income |
$ | 3.82 | $ | 2.05 | $ | 5.66 | |||
| Net income per common share - diluted: |
|||||||||
| Income before extraordinary item |
$ | 3.81 | $ | 2.05 | $ | 3.01 | |||
| Extraordinary item |
- | - | 2.57 | ||||||
| Net income |
$ | 3.81 | $ | 2.05 | $ | 5.58 | |||
| Dividend declared per common share: |
$ | - | $ | - | $ | 1.65 | |||
| Weighted average common shares: |
|||||||||
| Basic |
30,731,226 | 30,622,025 | 25,367,004 | ||||||
| Diluted |
30,842,894 | 30,765,420 | 25,773,631 | ||||||
| For the Years Ended December 31, | |||||||||
| 2009 | 2008 | 2007 | |||||||
| Realized investment and other gains before other-than-temporary impairment losses |
$ | 28.3 | $ | 16.2 | $ | 8.2 | |||
| Other-than-temporary impairment losses recognized in earnings |
|||||||||
| Other-than-temporary impairment losses on fixed maturities |
(6.9) | (21.3) | (1.5) | ||||||
| Other-than-temporary impairment losses on equity securities |
(20.3) | (30.0) | (0.8) | ||||||
| Other-than temporary impairment losses on Funds at Lloyd's foreign currency exchange |
(17.8) | - | - | ||||||
| Non-credit portion of loss recognized in other comprehensive income |
- | - | - | ||||||
| Impairment losses recognized in earnings |
(45.0) | (51.3) | (2.3) | ||||||
| Realized investment and other (losses) gains, net |
$ | (16.7) | $ | (35.1) | $ | 5.9 | |||
See accompanying notes.
F-4
Table of Contents
ARGO GROUP INTERNATIONAL HOLDINGS, LTD.
CONSOLIDATED STATEMENTS OF COMPREHENSIVE INCOME (LOSS)
(in millions)
| For the Years Ended December 31, | |||||||||
| 2009 | 2008 | 2007 | |||||||
| Net income |
$ | 117.5 | $ | 62.9 | $ | 143.8 | |||
| Other comprehensive income (loss): |
|||||||||
| Defined benefit pension plans: |
|||||||||
| Net gain (loss) arising during the period |
0.4 | (2.9) | 0.8 | ||||||
| Unrealized gains (losses) on securities (1): |
|||||||||
| Gains (losses) arising during the period |
162.5 | (162.2) | 56.4 | ||||||
| Reclassification adjustment for losses (gains)included in net income |
18.1 | 38.1 | (4.4) | ||||||
| Other comprehensive income (loss) before tax |
181.0 | (127.0) | 52.8 | ||||||
| Income tax provision (benefit) related to other comprehensive income (loss) |
44.9 | (29.2) | 16.0 | ||||||
| Other comprehensive income (loss), net of tax |
136.1 | (97.8) | 36.8 | ||||||
| Comprehensive income (loss) |
$ | 253.6 | $ | (34.9) | $ | 180.6 | |||
| (1) | Included in unrealized gains on securities at December 31, 2007, is $1.6 million of unrealized gains attributable to investments held by PXRE Reinsurance Company which was a component of “Assets held for sale” in the 2007 Consolidated Balance Sheet. These investments are non-taxable. |
See accompanying notes.
F-5
Table of Contents
ARGO GROUP INTERNATIONAL HOLDINGS, LTD.
CONSOLIDATED STATEMENTS OF SHAREHOLDERS' EQUITY
(in millions, except number of shares and per share amounts)
| Preferred Shares |
Common Shares |
Additional Paid-In Capital |
Treasury Shares |
Retained Earnings |
Accumulated Other Comprehensive Income (Loss) |
Shareholders’ Equity | |||||||||||||||
| Balance, January 1, 2007 |
$ | 0.6 | $ | 21.0 | $ | 281.6 | $ | - | $ | 505.7 | $ | 38.8 | $ | 847.7 | |||||||
| Net income |
- | - | - | - | 143.8 | - | 143.8 | ||||||||||||||
| Minimum pension liability, net of taxes |
- | - | - | - | - | 0.5 | 0.5 | ||||||||||||||
| Change in net unrealized appreciation on securities, net of taxes |
- | - | - | - | - | 36.3 | 36.3 | ||||||||||||||
| Series A preferred stock conversion |
(0.6) | 0.6 | - | - | - | - | - | ||||||||||||||
| Activity under stock incentive plans |
- | 0.9 | 33.4 | - | - | - | 34.3 | ||||||||||||||
| Retirement of common shares (tax payments on non-vested stock) |
- | - | (4.8) | - | - | - | (4.8) | ||||||||||||||
| Deferred tax - share-based payments |
- | - | 3.0 | - | - | - | 3.0 | ||||||||||||||
| Employee stock purchase plan |
- | - | 0.7 | - | - | - | 0.7 | ||||||||||||||
| Equity acquired in merger, net of acquisition expenses |
- | 8.2 | 372.0 | - | - | - | 380.2 | ||||||||||||||
| Cash dividend declared - preferred shares ($0.21/share) |
- | - | - | - | (0.1) | - | (0.1) | ||||||||||||||
| Cash dividend declared - common shares ($1.65/share) |
- | - | - | - | (57.1) | - | (57.1) | ||||||||||||||
| Balance, December 31, 2007 |
- | 30.7 | 685.9 | - | 592.3 | 75.6 | 1,384.5 | ||||||||||||||
| Net income |
- | - | - | - | 62.9 | - | 62.9 | ||||||||||||||
| Minimum pension liability, net of taxes |
- | - | - | - | - | (1.9) | (1.9) | ||||||||||||||
| Change in net unrealized depreciation on securities, net of taxes |
- | - | - | - | - | (95.9) | (95.9) | ||||||||||||||
| Repurchase of common shares (145,999 at a weighted average price of $35.23) |
- | - | - | (5.1) | - | - | (5.1) | ||||||||||||||
| Activity under stock incentive plans |
- | 0.1 | 8.1 | - | - | - | 8.2 | ||||||||||||||
| Retirement of common shares (tax payments on non-vested stock) |
- | - | (0.6) | - | - | - | (0.6) | ||||||||||||||
| Deferred tax - share-based payments |
- | - | (0.2) | - | - | - | (0.2) | ||||||||||||||
| Employee stock purchase plan |
- | - | 1.0 | - | - | - | 1.0 | ||||||||||||||
| Balance, December 31, 2008 |
- | 30.8 | 694.2 | (5.1) | 655.2 | (22.2) | 1,352.9 | ||||||||||||||
| Net income |
- | - | - | - | 117.5 | - | 117.5 | ||||||||||||||
| Minimum pension liability, net of taxes |
- | - | - | - | - | 0.3 | 0.3 | ||||||||||||||
| Change in net unrealized appreciation on securities, net of taxes |
- | - | - | - | - | 135.8 | 135.8 | ||||||||||||||
| Adoption of accounting standard relating to other than temporary impairments, net of tax |
- | - | - | - | 6.5 | (6.5) | - | ||||||||||||||
| Activity under stock incentive plans |
- | 0.2 | 8.2 | - | - | - | 8.4 | ||||||||||||||
| Retirement of common shares (tax payments on non-vested stock) |
- | - | (0.5) | - | - | - | (0.5) | ||||||||||||||
| Deferred tax - share-based payments |
- | - | (0.4) | - | - | - | (0.4) | ||||||||||||||
| Employee stock purchase plan |
- | - | 0.9 | - | - | - | 0.9 | ||||||||||||||
| Balance, December 31, 2009 |
$ | - | $ | 31.0 | $ | 702.4 | $ | (5.1) | $ | 779.2 | $ | 107.4 | $ | 1,614.9 | |||||||
See accompanying notes.
F-6
Table of Contents
ARGO GROUP INTERNATIONAL HOLDINGS, LTD.
CONSOLIDATED STATEMENTS OF CASH FLOWS
(in millions)
| For the Years Ended December 31, | |||||||||
| 2009 | 2008 | 2007 | |||||||
| Cash flows from operating activities: |
|||||||||
| Net income |
$ | 117.5 | $ | 62.9 | $ | 143.8 | |||
| Adjustments to reconcile net income to net cash provided by operating activities: |
|||||||||
| Amortization and depreciation |
22.4 | 17.0 | 8.4 | ||||||
| Share-based payments expense |
7.9 | 6.9 | 19.3 | ||||||
| Excess tax expense (benefit) from share-based payments arrangements |
0.3 | 0.2 | (3.3) | ||||||
| Deferred income tax (benefit) provision, net |
(1.9) | (13.1) | 3.6 | ||||||
| Realized investment losses (gains) |
16.7 | 38.2 | (5.9) | ||||||
| Impairment of intangible asset |
5.9 | - | - | ||||||
| Extraordinary gain due to merger |
- | - | (66.3) | ||||||
| Change in: |
|||||||||
| Accrued investment income |
3.4 | (6.1) | (2.9) | ||||||
| Receivables |
(226.9) | (139.4) | (62.7) | ||||||
| Deferred acquisition costs |
(7.5) | (4.6) | 0.2 | ||||||
| Ceded unearned premiums |
11.1 | 37.1 | 3.1 | ||||||
| Reserves for losses and loss adjustment expenses |
206.6 | 124.3 | 130.3 | ||||||
| Unearned premiums |
(4.0) | (49.2) | (10.3) | ||||||
| Ceded reinsurance payable and funds held |
100.2 | 108.2 | (12.0) | ||||||
| Income taxes payable |
(10.7) | (5.1) | 7.2 | ||||||
| Accrued underwriting expenses |
(8.8) | (9.9) | (2.4) | ||||||
| Sales and maturities of trading investments |
- | 17.6 | 5.2 | ||||||
| Purchases of trading investments |
- | (11.8) | - | ||||||
| Other assets and liabilities, net |
69.6 | (54.7) | 10.9 | ||||||
| Cash provided by operating activities |
301.8 | 118.5 | 166.2 | ||||||
| Cash flows from investing activities: |
|||||||||
| Sales of fixed maturity investments |
1,257.3 | 463.2 | 427.8 | ||||||
| Maturities and mandatory calls of fixed maturity investments |
439.0 | 325.0 | 257.9 | ||||||
| Sales of equity securities |
81.9 | 45.6 | 31.8 | ||||||
| Sales of other investments |
0.6 | 5.4 | 7.0 | ||||||
| Purchases of fixed maturity investments |
(2,027.2) | (996.6) | (949.7) | ||||||
| Purchases of equity securities |
(24.0) | (55.3) | (57.3) | ||||||
| Purchases of other investments |
(6.0) | (13.6) | (4.1) | ||||||
| Change in overseas deposits |
(34.1) | 0.2 | - | ||||||
| Change in short-term investments |
85.7 | 364.7 | 93.3 | ||||||
| Purchases of fixed assets |
(23.0) | (10.4) | (6.7) | ||||||
| Acquisitions, net of cash acquired |
- | (294.2) | 10.4 | ||||||
| Sale of investment in subsidiary - continuing operations |
- | 57.7 | - | ||||||
| Other, net |
9.0 | (7.1) | 0.3 | ||||||
| Cash used by investing activities |
(240.8) | (115.4) | (189.3) | ||||||
| Cash flows from financing activities: |
|||||||||
| Activity under revolving credit facility, net |
(50.9) | (8.0) | 58.0 | ||||||
| Activity under stock incentive plans |
3.1 | 1.7 | 11.4 | ||||||
| Repurchase of Company’s common shares |
- | (5.1) | - | ||||||
| Excess tax (expense) benefit from share-based payment arrangements |
(0.3) | (0.2) | 3.3 | ||||||
| Payment of cash dividend to common shareholders |
- | - | (57.1) | ||||||
| Payment of cash dividend to preferred shareholders |
- | - | (0.1) | ||||||
| Cash (used) provided by financing activities |
(48.1) | (11.6) | 15.5 | ||||||
| Change in cash |
12.9 | (8.5) | (7.6) | ||||||
| Cash, beginning of period |
5.2 | 13.7 | 21.3 | ||||||
| Cash, end of period |
$ | 18.1 | $ | 5.2 | $ | 13.7 | |||
See accompanying notes.
F-7
Table of Contents
ARGO GROUP INTERNATIONAL HOLDINGS, LTD.
NOTES TO CONSOLIDATED FINANCIAL STATEMENTS
| 1. | Business and Significant Accounting Policies |
Business. Argo Group International Holdings, Ltd. (“Argo Group” or the “Company”) is an international underwriter of specialty insurance and reinsurance products in the property and casualty market. Argo Group is the result of a merger on March 14, 2007 (closing date of merger August 7, 2007) between Argonaut Group, Inc. and PXRE Group Ltd. (“PXRE”) (the “Merger”) pursuant to which Argonaut Group became a wholly-owned subsidiary of Argo Group. Immediately following the Merger, Argonaut Group’s pre-merger shareholders held approximately 73% of PXRE’s shares, with PXRE’s pre-merger shareholders retaining approximately 27% of PXRE’s shares. An extraordinary gain representing remaining negative goodwill of $66.3 million was recorded in the Consolidated Statement of Income for the year ended December 31, 2007. Notwithstanding the fact that PXRE was the legal acquirer under the Merger and remained the registrant for Securities and Exchange Commission (“SEC”) reporting purposes, the Merger was accounted for as a reverse acquisition with Argonaut Group as the accounting acquirer. Argo Group accounted for the Merger as a purchase business combination, using Argonaut Group’s historical financial information and accounting policies and applying fair value estimates to the acquired assets, liabilities and commitments of PXRE as of August 7, 2007. As a result of the reverse acquisition treatment, the consolidated financial statements presented herein for periods ended prior to the closing of the Merger (and any other financial information presented herein with respect to such pre-merger dates, unless otherwise specified) are the consolidated financial statements and other financial information of Argonaut Group. The results of operations, comprehensive income, and cash flows reflect those of Argonaut Group for the twelve months ended December 31, 2007 and those of PXRE from the point of acquisition, August 7, 2007 to December 31, 2007.
In connection with and immediately following the completion of the Merger, on August 7, 2007 the Company’s common shares were split 1-for-10 in a reverse stock split. All references in the accompanying consolidated financial statements to share and per share amounts have been retroactively restated to reflect the 1-for-10 reverse stock split.
Effective December 31, 2007, Argonaut Group and PXRE Corporation, two intermediate holding companies merged, resulting in PXRE Corporation becoming the surviving entity. In 2008, PXRE Corporation changed its name to Argo Group US, Inc. (“Argo Group US”). References in the notes to Argonaut Group pertain to the period prior to this merger. Argo Group US is a subsidiary of Argo Financial Holding (Ireland), which is owned by Argo Reinsurance Ltd. (“Argo Re”), a Bermuda based company. Argo Re is directly owned by Argo Group.
On May 14, 2008, Argo Group, through its wholly-owned subsidiary, Argo International Holdings, Ltd., acquired Heritage Underwriting Agency plc (“Heritage”), which was subsequently renamed Argo Underwriting Agency Limited (“Argo International”). Argo International, a specialist insurer based in London, is focused on underwriting worldwide property and non-U.S. liability risks. For accounting purposes, the acquisition date is May 31, 2008. Included in the Company’s consolidated results of operations, comprehensive loss, and cash flows for the year ended December 31, 2008, is seven months of activity specifically attributable to Argo International. The functional currency of Argo International is the U.S. Dollar. See Note 2, “Acquisition” for additional discussion.
Argo Group conducts its ongoing business through four segments. Excess and Surplus Lines products are written by Colony Insurance Group, located in Richmond, Virginia; Argo Pro, located in Richmond, Virginia; and Argonaut Specialty Insurance Services, headquartered in New York, New York. Commercial Specialty products are written by Argo Select, a combination of Argonaut Great Central out of Peoria, Illinois and Grocers Insurance Agency, Inc. out of Portland, Oregon; Argo Surety headquartered in Houston, Texas; Argonaut Insurance Company, headquartered in Chicago, Illinois; Rockwood Casualty Insurance Company, headquartered in Rockwood, Pennsylvania; and Trident Insurance Services, headquartered in San Antonio, Texas. Reinsurance products are provided by Argo Re based in Bermuda. International Specialty products are written by Argo International based in London. The Company’s Run-off Lines segment includes liabilities associated with other liability policies that were issued in the 1960s, 1970s and into the 1980s, as well as risk management policies written prior to the sale of renewal rights and other business previously written and classified by PXRE as property catastrophe and Lloyd’s of London (“Lloyd’s”).
F-8
Table of Contents
Basis of Presentation and Use of Estimates. The consolidated financial statements of the Company and its subsidiaries have been prepared in accordance with accounting principles generally accepted in the United States (“GAAP”). The preparation of consolidated financial statements in conformity with GAAP requires management to make estimates and assumptions that affect the reported amounts of assets and liabilities and disclosure of contingent assets and liabilities at the date of the financial statements and the reported amounts of revenues and expenses during the reporting period. The major estimates reflected in the Company’s consolidated financial statements include, but are not limited to, the reserves for losses and loss adjustment expenses, reinsurance recoverables, including the reinsurance recoverables allowance for doubtful accounts, estimates of written and earned premiums, the fair value of investments and the Company’s deferred tax asset valuation allowance. Actual results could differ from those estimates.
Specifically, estimates for reserves for losses and loss adjustment expenses are based upon past claim experience modified for current trends as well as prevailing economic, legal and social conditions. Although management believes that amounts included in the accompanying consolidated financial statements are adequate, such estimates may be more or less than the amounts ultimately paid when the claims are settled. The estimates are continually reviewed and any changes are reflected in current operating results. Further, the nature of loss exposures involves significant variability due to the long-tailed payments on claims related to asbestos and environmental coverage and workers compensation coverage. As such, losses and loss adjustment expenses could vary significantly from the recorded amounts.
The consolidated financial statements include the accounts and operations of the Company and its subsidiaries. All material intercompany accounts and transactions have been eliminated. Certain items in prior years’ financial statements have been reclassified to conform to the current presentation. Amounts related to Trade Capital providers, who are third party capital participants that provide underwriting capital to the International Specialty segment, are included in the balance sheet. Trade Capital reinsurers participate on a quota share basis, assuming 100% of their contractual participation in the underwriting syndicate results and with such results settled on a year of account basis. The underwriting syndicates underwrite under the Lloyd’s global franchise.
In 2009, the Financial Accounting Standards Board (“FASB”) issued revised accounting standards regarding consolidation of variable interest entities. The Company reevaluated its investment in its fourteen statutory trusts (collectively, the “Trusts”) and its two charitable foundations (collectively, the “Foundations”). The Company determined that the Trusts and the Foundations continue to be variable interest entities due to the fact that the Trusts and the Foundations do not have sufficient equity to finance their activities without additional subordinate financial support from other parties. The Company is not entitled to receive a majority of the residual returns of the Trusts and the Foundations. Additionally, the Company is not responsible to absorb the majority of the expected losses of the Trusts or the Foundations; therefore, the Company is not the primary beneficiary and, accordingly, the Trusts and the Foundations are not included in the Company’s consolidated financial statements.
Cash. Cash consists of cash deposited in banks, generally in concentration and operating accounts. Interest-bearing cash accounts are classified as short-term investments.
Investments. Investments in fixed maturities at December 31, 2009 and 2008 include bonds, structured securities and long-term certificates of deposits. Equity securities include common and nonredeemable preferred stocks. Short-term investments consist of funds in excess of the Company's near-term operating and claims paying needs and funds on deposit with Lloyd’s as security to support the Corporate member’s capital and are invested in certificates of deposit, commercial paper, money market funds, United Kingdom short-term government gilts, U.S. Treasury bills, sovereign debt and interest-bearing cash accounts. Short-term investments, maturing in less than one year, are classified as investments in the consolidated financial statements as they relate principally to the Company’s investment activities.
The amortized cost of fixed maturity securities is adjusted for amortization of premiums and accretion of discounts. This amortization or accretion is included in net investment income.
For the structured securities portion of the fixed maturity securities portfolio, the Company recognizes income using a constant effective yield based on anticipated prepayments and the estimated economic life of the securities. Premium or discount on high investment grade securities (rated AA or higher) is amortized into income using the retrospective method. Premium or discount on lower investment grade securities (rated less than AA) is amortized into income using the prospective method.
F-9
Table of Contents
Investments are considered available-for-sale or trading and are carried at fair value. The Company measures the fair value of the investments based upon quoted market prices from an independent pricing service and its third-party investment managers, using both observable and non-observable market information. The cost of securities sold is based on the specific identification method. Unrealized gains and losses associated with the available-for-sale portfolio, as a result of temporary changes in fair value during the period such investments are held, are reflected net of income taxes and reported in other comprehensive income as a separate component of shareholders’ equity. Unrealized losses, associated with the available-for-sale portfolio, which are deemed other than temporary are charged to income in the period the other-than-temporary impairment is determined. Unrealized gains and losses associated with the trading portfolio are recognized in income. The Company evaluates its investment portfolio for impairments of individual securities that are deemed to be other-than-temporary. In general, the process for identifying other-than-temporary declines in fair value involves the consideration of several factors, including, but not limited to, whether the issuer has been downgraded to below investment-grade, the length of time in which there has been a significant decline in value, the liquidity, business prospects, and overall financial condition of the issuer, the nature and performance of the collateral or other credit support backing the security, the significance of the decline in value, and whether the Company has the intent to sell the security or may be required to sell the security prior to its anticipated recovery. For those securities where the Company's cost or amortized cost is more than fair market value, the Company reviews such securities internally and with its investment advisors.
All investment balances include amounts relating to third party trade reinsurers. The results operations and other comprehensive income only include amounts relating to Argo International. All third party amounts are subject to 100% of their contractual participation in the syndicate results and are included in reinsurance recoverables.
Receivables. Premiums receivable, representing amounts due from insureds, are presented net of an allowance for doubtful accounts of $4.9 million and $6.6 million at December 31, 2009 and 2008, respectively. Premiums receivable include amounts relating to the Trade Capital reinsurers’ quota share, which is 100% of their contractual participation in the syndicate results.
Reinsurance recoverables represent amounts of paid losses and loss adjustment expenses, case reserves and incurred but not reported amounts ceded to reinsurers under reinsurance treaties. Reinsurance recoverables also reflect amounts that are due to or from Trade Capital reinsurers for which Argo International produces and cedes underwriting activity through a 100% quota share arrangement. These amounts are presented in the Consolidated Balance Sheets net of an allowance for doubtful accounts of $10.2 million and $9.8 million at December 31, 2009 and 2008, respectively (see Note 4, “Reinsurance” for related disclosures).
Premiums receivable and reinsurance recoverables are charged off after a determination has been made that a specific balance will not be collected based upon the collection efforts of Company personnel. Premiums receivable written off in 2009, 2008 and 2007, net of recoveries were $1.1 million, $0.8 million, and $0.7 million, respectively. Reinsurance recoverables written off in 2009, 2008, and 2007, net of recoveries were $4.3 million, $5.8 million, and $0, respectively. An estimate of amounts that are likely to be charged off is established as an allowance for doubtful accounts as of the balance sheet date. The estimate is primarily comprised of specific insured and reinsurance balances that are considered probable to be charged off after all collection efforts have ceased.
Goodwill and Intangible Assets. Goodwill and intangible assets are allocated to the segment in which the results of operations for the acquired company are reported (see Note 14, “Segment Information” for further discussion). Intangible assets with a finite life are amortized over the estimated useful life of the asset. Goodwill and intangible assets with an indefinite useful life are not amortized. Goodwill and intangible assets are tested for impairment on an annual basis or more frequently if events or changes in circumstances indicate that the carrying amount may not be recoverable. For goodwill, the impairment test is determined using a two-step process. The first step is to identify if a potential impairment exists by comparing the fair value of a reporting unit with its carrying amount, including goodwill. If the fair value of a reporting unit exceeds its carrying value amount, goodwill of the reporting unit is not considered to have a potential impairment and the second step is not necessary. However, if the carrying amount of the reporting unit exceeds its fair value, the second step is performed to determine if goodwill is impaired and to measure the amount of impairment loss to recognize, if any. The second step compares the implied fair value of goodwill with the carrying amount of goodwill. If the implied value of goodwill is less than the carrying amount of goodwill, it is written down to its fair value with a corresponding expense reflected in the Consolidated Statements of Income. The implied goodwill is calculated based on a hypothetical purchase price allocation, similar to the requirements in the accounting guidance for business combinations, whereby the implied fair value of the reporting unit is allocated to the fair value of the assets and liabilities of the reporting unit.
The Company performs its goodwill impairment test on the first day of the fourth quarter of each year, or October 1 of each year. In performing the first step of the impairment test, the Company estimated the fair value of reporting units using an average of three valuation methods: a comparable company analysis, a precedent transaction analysis and a discounted cash flow analysis. All three methods require management to make various judgments and assumptions. Specifically, the October 1 analysis included the assumption that the competitive pricing present in the marketplace for the Excess and Surplus Lines and Commercial Specialty reporting units will revert to more favorable pricing beginning in 2010 and further in 2011. Additionally, the discounted cash flow analysis included projections of earned premiums, loss ratios, expense growth, and discount rates for each reporting unit. Assumptions about such future cash flows are based on our budgets, business plans, economic projections, anticipated future cash flows and market data. Finally, the comparable company analysis and precedent transaction analysis required judgment in selecting comparable companies and comparable transactions for use in the calculations. In all instances, future changes in these judgments and assumptions could cause impairment of goodwill.
F-10
Table of Contents
For the years ended December 31, 2009, 2008 and 2007, all of the Company reporting units passed the first step of the goodwill impairment analysis. However, based on carrying values of the reporting units as of December 31, 2009, a 3% decline in the fair value of the Excess and Surplus Lines reporting unit, or a 19% decline in the fair value of the Commercial Specialty reporting unit, or a 3% decline in the fair value of the International Specialty reporting unit would have resulted in the carrying values of these reporting units to be in excess of their respective fair values, resulting in the need to perform the second step, which could have resulted in a material impairment to the Company’s goodwill. Any continued decline in the fair value of these reporting units could result in the carrying value of the reporting unit being in excess of fair value, triggering the second step of the impairment testing model. The second step could result in an impairment of goodwill.
As noted above, the Company has elected to make the first day of the fourth quarter the annual impairment assessment date for goodwill and indefinite-lived intangible assets. An impairment analysis subsequent to this date has not been performed as management believes that no additional indicators of impairment have arisen, such as significant additional pricing competition, unexpected significant declines in operating results, the divestiture of a significant component of the business or a further significant decline in the Company’s market capitalization.
In June 2009, the Company deemed the value assigned to the trade name of Heritage impaired after an evaluation of the value of the name in the Lloyd’s market and the subsequent renaming of Heritage to Argo International. The value of the trade name and accumulated amortization at the time of the impairment was $6.4 million and $0.5 million, respectively.
The following tables present the Company’s intangible assets and accumulated amortization at December 31, 2009 and 2008:
| December 31, 2009 | ||||||
| (in millions) | Gross Carrying Amount |
Accumulated Amortization | ||||
| Stamp capacity |
$ | 60.5 | n/a | |||
| Distribution network |
39.9 | 6.2 | ||||
| Trade name |
0.8 | 0.1 | ||||
| Other |
2.3 | 0.7 | ||||
| $ | 103.5 | $ | 7.0 | |||
| December 31, 2008 | ||||||
| (in millions) | Gross Carrying Amount |
Accumulated Amortization | ||||
| Stamp capacity |
$ | 60.5 | n/a | |||
| Distribution network |
39.9 | 3.1 | ||||
| Trade name |
7.2 | 0.5 | ||||
| Other |
2.3 | 0.1 | ||||
| $ | 109.9 | $ | 3.7 | |||
During the twelve months ended December 31, 2009 and 2008, amortization expense was $3.8 million and $3.7 million, respectively, and is included in “Underwriting, acquisition and insurance expenses” in the Consolidated Statements of Income.
The estimated amortization expense for the years ended December 31, 2010, 2011, 2012, 2013 and 2014 are $4.4 million, $4.3 million, $4.3 million, $4.3 million and $3.9 million, respectively.
F-11
Table of Contents
Earned Premiums. Premium revenue is recognized ratably over the policy period, with an adjustment, where appropriate, to reflect the risk profile of certain classes of business particularly those exposed to seasonal weather related events. Premiums that have yet to be earned are reported as “Unearned premiums” in the Consolidated Balance Sheets.
Unearned premium balances include amounts relating to Trade Capital reinsurers while the earned premium recognized in the income statement only includes amounts relating to Argo International. The Trade Capital reinsurer quota share amount, which is 100% of their contractual participation in the syndicate results, is included in ceded reinsurance payable.
Assumed reinstatement premiums that reinstate coverage are written and earned at the time the associated loss event occurs. The original premium is earned over the remaining exposure period of the contract. Reinstatement premiums are estimated based upon contract terms for reported losses and estimated for incurred but not reported losses.
Retrospectively Rated Policies. The Company has written a number of workers compensation and other liability policies that are retrospectively rated. Under this type of policy, the policyholder may be entitled, subsequent to policy expiration, to a refund or may owe additional premiums based on the amount of losses incurred under the policy. The retrospective premium adjustments are limited to a minimum or maximum premium adjustment, which is calculated as a percentage of the standard amount of premium charged during the life of the policy. Accrued retrospectively rated premiums have been determined based on estimated ultimate loss experience of the individual policyholder accounts. The estimated liability for return of premiums under retrospectively rated workers compensation policies is included in unearned premiums and was $2.1 million and $3.2 million at December 31, 2009 and 2008, respectively. The estimated amount included in premiums receivable for additional premiums due under retrospectively rated policies was $1.6 million and $3.0 million at December 31, 2009 and 2008, respectively.
Deferred Acquisition Costs. Policy acquisition costs, which include commissions, premium taxes, fees and certain other costs of underwriting policies, are deferred, when such policies are profitable, and amortized over the same period in which the related premiums are earned. Anticipated investment income is considered in determining whether the deferred acquisition costs are recoverable and whether a premium deficiency exists. The Company continually reviews the methods of making such estimates and establishing the deferred costs, and any adjustments are made in the accounting period in which the adjustment arose.
The 2009 and 2008 net amortization (deferral) of policy acquisition costs will not equal the change in the Consolidated Balance Sheets as a result of 1) deferred acquisition costs acquired in the acquisition of Argo International, 2) amounts relating to Trade Capital reinsurers quota share, which is 100% of their contractual participation in the syndicate results, and 3) an allocation of administrative expenses and the associated currency exchange. The 2007 net amortization (deferral) of policy acquisition costs will not equal the change in the Consolidated Balance Sheet as a result of deferred acquisition costs acquired in the Merger.
Reserves for Losses and Loss Adjustment Expenses. Liabilities for unpaid losses and loss adjustment expenses include the accumulation of individual case estimates for claims reported as well as estimates of incurred but not reported claims and estimates of claim settlement expenses. Reinsurance recoverables on unpaid claims and claim expenses represent estimates of the portion of such liabilities that will be recoverable from reinsurers. Amounts recoverable from reinsurers are recognized as assets at the same time and in a manner consistent with the unpaid claims liabilities associated with the reinsurance policy (for additional information, see heading “Reinsurance” below).
Property and Equipment. Property and equipment used in operations, including certain costs incurred to develop or obtain computer software for internal use, are capitalized and carried at cost less accumulated depreciation and are reported in “Other assets” in the Consolidated Balance Sheets. Depreciation is calculated using a straight-line method over the estimated useful lives of the assets, generally three to forty years. The accumulated depreciation for property and equipment was $33.1 million and $28.0 million at December 31, 2009 and 2008, respectively. The net book value of the Company’s property and equipment at December 31, 2009 and 2008 was $39.0 million and $23.7 million, respectively. The depreciation expense at December 31, 2009, 2008, and 2007 was $7.6 million, $6.3 million, and $4.1 million, respectively.
Foreign Currency Translation. The U.S. Dollar is the functional currency of the Company’s foreign operations. Monetary assets and liabilities in foreign operations that are denominated in foreign currencies are revalued at the exchange rates in effect at the balance sheet date, with resulting gains and losses because of foreign exchange movements reflected in income, and revenues and expenses denominated in foreign currencies are translated at the prevailing exchange rate on the transaction date with the resulting foreign exchange gains and losses included in net income for the period. In the case of the Company’s foreign currency denominated investments, the change in exchange rates between the local currency and the Company’s functional currency at each balance sheet date represents an unrealized appreciation or depreciation in value of these securities, and is included as a component of accumulated other comprehensive income.
F-12
Table of Contents
Included in “Interest expense and other” for the years ended December 31, 2009, 2008 and 2007 is a gain of $0.2 million and losses of $0.5 million and $0.7 million, respectively, attributable to foreign currency translation.
Share-Based Payments. With the closing of the Merger, all share-based compensation plans of the companies were frozen, resulting in no new grants being issued from these plans after the closing date of the Merger. All share-based payment awards outstanding as of the effective date of the Merger were converted into equivalent awards of Argo Group. Plans in effect prior to the Merger included the Argonaut Group, Inc. Amended and Restated Stock Incentive Plan, the Argonaut Group, Inc. Non-Employee Director Stock Option Plan, the PXRE Group Ltd. Incentive Bonus Compensation Plans and the PXRE Group Ltd. Director Stock Plan. Pursuant to the Merger Agreement, non-vested stock awards and options to acquire shares of Argonaut Group common stock were converted into options to acquire a number of Company common shares equal to the exchange ratio under the Merger of 6.484 shares of PXRE for each share of Argonaut Group (0.6484 shares of PXRE after adjustment for the effect of the 1-for-10 reverse stock split). Additionally, in accordance with the Merger Agreement, all share-based payment awards issued under the PXRE plans were adjusted for the 1-for-10 reverse stock split.
Compensation expense for share based payments is recognized based on the grant-date fair value. Compensation expense for awards that are settled in equity are recognized on a straight line pro rata basis over the vesting period. Compensation expense for awards that are settled in cash are recognized on the accelerated recognition method over the award’s vesting period. (See Note 13, “Share-Based Payments” for related disclosures.)
Income Taxes. Deferred tax assets and liabilities are recognized for the estimated future tax consequences attributable to differences between the financial statement carrying amounts of existing assets and liabilities and their respective tax bases. Deferred tax assets and liabilities are measured using enacted tax rates in effect for the year in which those temporary differences are expected to be recovered or settled. The effect on deferred tax assets and liabilities of a change in tax rates is recognized in net income in the period in which the change is enacted.
Effective January 1, 2007, the FASB issued an accounting standard that prescribes the accounting for the financial statement recognition, measurement and disclosure of uncertain tax positions recognized in an enterprise’s financial statements. The accounting standard requires that tax positions not meeting the "more likely than not" recognition threshold be recognized or continue to be recognized on the effective date. The Company had no material unrecognized tax benefits upon adoption of this accounting standard and has no material unrecognized tax benefits as of December 31, 2009. Tax years ended December 31, 2006 through December 31, 2009 are open for examination by the Internal Revenue Service (“IRS”).
Reinsurance. In the normal course of business, the Company’s insurance and reinsurance subsidiaries reinsure certain risks above certain retention levels with other insurance enterprises. Reinsurance recoverables include claims paid by the Company and estimates of unpaid losses and loss adjustment expenses that are subject to reimbursement under reinsurance and retrocessional contracts. The method for determining reinsurance recoverables for unpaid losses and loss adjustment expenses involves reviewing actuarial estimates of gross unpaid losses and loss adjustment expenses to determine the Company's ability to cede unpaid losses and loss adjustment expenses under its existing reinsurance contracts. This method is continually reviewed and updated and any resulting adjustments are reflected in earnings in the period identified. Reinsurance premiums, commissions and expense reimbursements are accounted for on a basis consistent with those used in accounting for the original policies issued and the term of the reinsurance contracts. Amounts recoverable from reinsurers for losses and loss adjustment expenses for which the Company's insurance and reinsurance subsidiaries have not been relieved of their legal obligations to the policyholder are reported as assets.
Derivative Instruments. In 2007, the Company entered into certain retrocession pro rata contracts for the periods from July 1, 2007 to December 31, 2007 and from January 1, 2008 to December 31, 2008 that had been determined to be derivatives. The Company had recorded these contracts at fair value with the changes in fair value reported in “Interest expense and other” in the Consolidated Statements of Income. The coverage expired on December 31, 2008. At December 31, 2008 and 2009, the Company did not hold any derivative instruments.
F-13
Table of Contents
Supplemental Cash Flow Information.
Income taxes paid. The Company paid income taxes of $40.5 million in 2009, $36.5 million in 2008 and $31.2 million in 2007.
Income taxes recovered. The Company recovered $5.8 million of income taxes in 2009. In June 2009, the Company received a $10.1 million refund attributable to a favorable decision rendered by the California State Board of Equalization related to franchise tax payments paid by Argo Group US for tax years 1994 through 1999. Of this refund, $5.6 million was a recovery of taxes and $4.5 million was earned interest. The earned interest has been reflected in “Net investment income” in the Consolidated Statement of Income for the twelve months ended December 31, 2009. The Company recovered income taxes of $0.2 million in both 2008 and 2007.
Interest paid. The Company paid interest on the junior subordinated debentures of $21.3 million, $24.9 million, and $19.8 million during 2009, 2008, and 2007, respectively. The Company paid interest on its other indebtedness of $4.6 million, $6.6 million, and $1.5 million during 2009, 2008, and 2007, respectively.
Recently Issued Accounting Pronouncements.
In June 2009, the FASB issued an accounting standard that established the Accounting Standards Codification (the “Codification”) to become the single source of authoritative GAAP to be applied by nongovernmental entities, with the exception of guidance issued by the SEC and its staff. All guidance contained in the Codification carries an equal level of authority. The Codification is not intended to change GAAP, but rather is expected to simplify accounting research by reorganizing current GAAP into approximately 90 accounting topics. The Company adopted this accounting standard in preparing the consolidated financial statements for the period ended September 30, 2009. The adoption of this accounting standard had no impact on the Company’s financial position or results of operations.
In December 2008, the FASB issued an accounting standard on the disclosure of postretirement benefit plan assets. The accounting standard requires an employer to provide certain disclosures about plan assets of its defined benefit pension or other postretirement plans. The objective of the accounting standard is to provide users of the financial statements with an understanding of how investment allocation decisions are made, including factors that are pertinent to an understanding of investment policies and strategies; the major categories of plan assets as of each annual reporting date for which a statement of financial position is presented; the inputs and valuation techniques used to measure the fair value of plan assets; the effect of fair value measurements using significant unobservable inputs (Level 3 as defined in the Fair Value Measurements guidance) on changes in plan assets for the period; and significant concentrations of risk within plan assets. The accounting standard is effective on a prospective basis for fiscal years ending after December 15, 2009. Earlier application was permitted; however the Company has chosen not to early adopt. The adoption of the accounting standard had no impact on the Company’s financial position or results of operations and financial condition. See Note 12, “Pension Benefits” for the related disclosures.
In April 2009, the FASB issued an accounting standard that provided guidance on estimating fair value when the volume and level of activity for an asset or liability have significantly decreased and in identifying transactions that are not orderly. This accounting standard emphasizes that even if there has been a significant decrease in the volume and level of activity for the asset or liability and regardless of the valuation technique(s) used, the objective of a fair value measurement remains the same. Fair value is the price that would be received to sell an asset or paid to transfer a liability in an orderly transaction (that is, not a forced liquidation or distressed sale) between market participants at the measurement date under current market conditions. The accounting standard also includes guidance on identifying circumstances that indicate a transaction is not orderly. Revisions resulting from a change in valuation technique or its application are accounted for as a change in accounting estimate. In the period of adoption, a reporting entity shall disclose a change, if any, in valuation technique and related inputs resulting from the application of the accounting standard, and quantify the total effect of the change in valuation technique and related inputs, if practicable, by major category. The Company adopted this accounting standard on April 1, 2009. The provisions in this accounting standard were applied prospectively and did not result in significant changes to the Company’s valuation techniques.
F-14
Table of Contents
In April 2009, the FASB issued an accounting standard that amended other-than-temporary impairment guidance in GAAP for debt securities. The accounting standard was effective for interim and annual reporting periods ending after June 15, 2009. The accounting standard amended the other-than-temporary impairment guidance in GAAP for fixed maturity securities to make the guidance more operational. The accounting standard also improved the presentation and disclosure of other-than-temporary impairments on fixed maturity and equity securities in the financial statements. The accounting standard did not amend existing recognition and measurement guidance related to other-than-temporary impairments of equity securities. This accounting standard was applicable to existing and new investments held by an entity as of the beginning of the interim period in which it was adopted. For fixed maturity securities held at the beginning of the interim period of adoption for which an other-than-temporary impairment was previously recognized, if an entity did not intend to sell and it is not more likely than not the entity will be required to sell the security before recovery of its amortized cost basis, the entity recognized the cumulative effect of initial adoption as an adjustment to the opening balance of retained earnings with a corresponding adjustment to accumulated other comprehensive income. The cumulative-effect adjustment includes the related tax effects. The discount rate used to calculate the present value of the cash flows expected to be collected is the rate in effect before recognizing any other-than-temporary impairments and not a rate that has been adjusted to reflect those impairments. The amortized cost basis of a security with previously recognized other-than-temporary impairment will be adjusted by the amount of the cumulative-effect adjustment before taxes. The difference between the new amortized cost basis and the cash flows expected to be collected will be accreted in accordance with existing guidance as interest income. The accounting standard does not require disclosures for earlier periods presented for comparative purposes at initial adoption. See Note 3, “Investments” for the related disclosure.
In May 2009, the FASB issued an accounting standard that established general standards of accounting for and disclosures of events that occur after the balance sheet date but before financial statements are issued or are available to be issued. The accounting standard was effective for interim or annual financial periods ended after June 15, 2009. By definition, the date financial statements are available to be issued is when financial statements are complete in a form and format that comply with GAAP and all approvals necessary for issuance have been obtained. An entity that has a current expectation of widely distributing its financial statements to its shareholders and other financial statement users is to evaluate subsequent events through the date that the financial statements are issued. The accounting standard establishes the following: the period after the balance sheet during which management should evaluate events or transactions that may occur for potential recognition or disclosure in the financial statements; the circumstances under which an entity will recognize events or transactions occurring after the balance sheet date in its financial statements; and the required disclosures about events or transactions that occurred after the balance sheet date. The accounting standard required the disclosure of the date through which an entity had evaluated subsequent events and whether that date represented the date the financial statements were issued or were available to be issued. In February 2010, the FASB issued an additional update on this topic which amended the disclosure requirements previously stated. The date through which an entity evaluated subsequent events is no longer required to be disclosed. This change went into effect upon issuance of the final update in February 2010.
In June 2009 and as updated in the Codification in December 2009, the FASB issued an accounting standard to replace the quantitative-based risks and rewards calculation for determining which enterprise has a controlling financial interest in a variable interest entity with an approach focused on identifying which enterprise has the power to direct the activities of a variable interest entity that most significantly impact the entity’s economic performance and (1) the obligation to absorb losses of the entity or (2) the right to receive benefits from the entity. The accounting standard also requires ongoing reassessments of whether an enterprise is the primary beneficiary of a variable interest entity, modifying existing guidance that required reconsideration only when specific events occurred. The accounting standard amends certain existing guidance for determining whether an entity is a variable interest entity. Application of the accounting standard requires an additional reconsideration event when determining whether an entity is a variable interest entity when any changes in facts and circumstances occur such that the holders of the equity investment at risk, as a group, lose the power from voting rights or similar rights of those investments to direct the activities of the entity that most significantly impact the entity’s economic performance. Finally, the accounting standard requires additional disclosures to provide more transparent information about involvement in a variable interest entity. The accounting standard became effective as of the beginning of the entity’s first annual reporting period that began after November 15, 2009, for interim periods within that first annual reporting period, and for interim and annual reporting periods thereafter. Early application was prohibited. The adoption of this accounting standard did not have a material effect on the Company’s financial position or results of operations and financial condition.
In August 2009, an accounting standard was issued by the FASB that amended standards on the topic of the fair value measurement of liabilities. The amendments provide clarification that in circumstances in which a quoted price in an active market for the identical liability is not available, a reporting entity is required to measure fair value using one or more of the following techniques: 1) a valuation technique that uses the quoted price of the identical or similar liability when that liability is traded as an asset or 2) another valuation technique that is consistent with principles established by the FASB (such as a present value technique or a technique that is based on the amount at the measurement date that the reporting entity would pay to transfer the identical liability or would receive to enter into the identical liability). The amendments also clarify that when estimating the fair value of a liability, a reporting entity is not required to include a separate input or adjustment to other inputs relating to the existence of a restriction that prevents the transfer of the liability. The amendments also clarify that both a quoted price in an active market for the identical liability at the measurement date and the quoted price for the identical liability when traded as an asset in an active market when no adjustments to the quoted price of the asset are required are Level 1 fair value measurements. The guidance is effective for the first reporting period (including interim periods) beginning after the issuance date of August 2009. The adoption of this accounting standard did not have a material effect on the Company’s financial position or results of operations and financial condition.
F-15
Table of Contents
In September 2009, an accounting standard was issued by the FASB that amended standards for the fair value measurement of investments in certain entities that calculate net asset value per share (or its equivalent). As of the reporting entity’s measurement date, the amendments permit, as a practical expedient, a reporting entity to measure the fair value of an investment on the basis of the net asset value per share of the investment if the net asset value of the investment is calculated in a manner consistent with the measurement principles of GAAP for investment companies, including measurement of all or substantially all of the underlying investments of the investee in accordance with GAAP fair value measurement standards. The amendments also require disclosures by major category of investment about the attributes of investments within the scope of this update, such as the nature of any restrictions on the investor’s ability to redeem its investments at the measurement date, any unfunded commitments and the investment strategies of the investees. The guidance was effective for interim and annual periods ending after December 15, 2009. The adoption of this accounting standard did not have a material effect on the Company’s financial position or results of operations and financial condition.
In January 2010, the FASB issued an accounting update that requires new fair value measurement disclosures and clarifies current fair value measurement disclosure requirements. Companies will now be required to disclose separate significant transfers in and out of Level 1 and Level 2 categories and provide an explanation for the transfer(s). Companies are also required to separately disclose purchases, sales, issuances and settlements in the Level 3 reconciliation table rather than aggregating this activity in one line as currently allowed. The update clarifies that fair value measurement disclosures should be for each class of assets and liabilities. The update also clarifies that disclosures about inputs and valuation techniques are required for recurring and nonrecurring fair value measurements that are categorized as Level 2 or Level 3. Except for the separate disclosure requirements related to the Level 3 reconciliation table, the disclosures required by this accounting update are effective for interim and annual reporting periods beginning after December 15, 2009. The Level 3 reconciliation table disclosure requirements are effective for fiscal years beginning after December 15, 2010 and for interim periods within those fiscal years. Although allowed, the Company has elected to not early adopt this update for its December 31, 2009 reporting period.
| 2. | Acquisition |
Acquisition of Argo Underwriting Agency Limited, formerly known as Heritage Underwriting Agency plc
On April 2, 2008, Argo Group announced an offer to acquire Heritage. On May 14, 2008, all conditions of the acquisition were satisfied or waived. Heritage was renamed Argo International during the second quarter of 2009. The acquisition was accounted for using the purchase method of accounting, which required the total purchase price to be allocated to the assets acquired and liabilities assumed based on their fair values as of May 31, 2008. The functional currency of Argo International is the U.S. Dollar. The purchase price totaled approximately $277.4 million, including transaction costs of approximately $7.3 million.
Pro Forma Financial Information
The financial information in the table below summarizes the combined results of operations of PXRE, Argo International and Argo Group US, on an unaudited pro forma basis, as though the companies had been combined as of the beginning of each of the periods presented. These results have been prepared by adjusting the historical results of Argo Group US to include the historical results of PXRE and Argo International and the impact of purchase price allocations.
F-16
Table of Contents
The following unaudited pro forma information is not necessarily indicative of what would have occurred had the acquisition and related transactions been made on the dates indicated or of future results of the Company:
| For the Years Ended December 31, | ||||||
| (in millions, except per share data) | 2008 | 2007 | ||||
| (unaudited) | (unaudited) | |||||
| Revenue |
$ | 1,389.4 | $ | 1,326.7 | ||
| Net income |
70.2 | 85.1 | ||||
| Net income per common share (1) |
||||||
| Basic |
$ | 2.29 | $ | 2.82 | ||
| Diluted |
$ | 2.28 | $ | 2.78 | ||
| (1) | All per share information has been restated to reflect the 1-for-10 reverse stock split effected on August 7, 2007. |
| 3. | Investments |
The amortized cost, gross unrealized gains, gross unrealized losses and fair value of investments as of December 31 were as follows:
| (in millions) | Amortized | Gross Unrealized |
Gross Unrealized |
Fair | ||||||||
| 2009 | Cost | Gains | Losses | Value | ||||||||
| Fixed maturities |
||||||||||||
| U.S. Treasury securities |
$ | 171.7 | $ | 1.9 | $ | 0.9 | $ | 172.7 | ||||
| U.S. Government agencies (1) |
395.3 | 9.1 | 0.8 | 403.6 | ||||||||
| Obligations of states and political subdivisions |
692.6 | 33.0 | 0.9 | 724.7 | ||||||||
| Corporate securities |
513.8 | 16.5 | 3.0 | 527.3 | ||||||||
| Structured securities: |
||||||||||||
| CMO/MBS-agency |
874.1 | 28.1 | 1.7 | 900.5 | ||||||||
| CMO/MBS-non agency |
52.4 | 0.5 | 6.3 | 46.6 | ||||||||
| CMBS |
166.6 | 2.4 | 2.0 | 167.0 | ||||||||
| ABS-residential |
23.1 | - | 5.0 | 18.1 | ||||||||
| ABS-non residential |
182.7 | 2.7 | 0.7 | 184.7 | ||||||||
| Foreign |
375.7 | 15.6 | 4.4 | 386.9 | ||||||||
| Total fixed maturities |
3,448.0 | 109.8 | 25.7 | 3,532.1 | ||||||||
| Equity securities |
181.6 | 84.9 | 0.6 | 265.9 | ||||||||
| Other investments |
97.4 | - | 0.4 | 97.0 | ||||||||
| Short-term investments |
439.4 | - | 0.1 | 439.3 | ||||||||
| Total investments |
$ | 4,166.4 | $ | 194.7 | $ | 26.8 | $ | 4,334.3 | ||||
| (1) | Includes corporate bonds backed by the Federal Deposit Insurance Corporation of $158.6 million amortized cost, $159.6 million fair value. |
F-17
Table of Contents
| 2008 | Amortized Cost |
Unrealized Gains |
Unrealized Losses |
Fair Value | ||||||||
| Fixed maturities |
||||||||||||
| U.S. Treasury securities |
$ | 233.7 | $ | 9.0 | $ | - | $ | 242.7 | ||||
| U.S. Government agencies (1) |
265.2 | 13.6 | - | 278.8 | ||||||||
| Obligations of states and political subdivisions |
780.7 | 19.5 | 4.0 | 796.2 | ||||||||
| Corporate securities |
565.6 | 3.6 | 22.9 | 546.3 | ||||||||
| Structured securities: |
||||||||||||
| CMO/MBS-agency |
800.8 | 34.6 | 0.1 | 835.3 | ||||||||
| CMO/MBS-non agency |
73.2 | - | 12.8 | 60.4 | ||||||||
| CMBS |
188.0 | - | 24.9 | 163.1 | ||||||||
| ABS-residential |
22.8 | 0.5 | 1.0 | 22.3 | ||||||||
| ABS-non residential |
85.5 | - | 6.2 | 79.3 | ||||||||
| Foreign |
131.9 | 3.2 | 7.0 | 128.1 | ||||||||
| Total fixed maturities |
3,147.4 | 84.0 | 78.9 | 3,152.5 | ||||||||
| Equity securities |
251.8 | 50.5 | 30.0 | 272.3 | ||||||||
| Other investments |
56.8 | 0.2 | - | 57.0 | ||||||||
| Short-term investments |
542.0 | - | 28.4 | 513.6 | ||||||||
| Total investments |
$ | 3,998.0 | $ | 134.7 | $ | 137.3 | $ | 3,995.4 | ||||
| (1) | Includes corporate bonds backed by the Federal Deposit Insurance Corporation of $31.2 million amortized cost, $32.0 million fair value. |
Included in total investments at December 31, 2009 and 2008 is $235.3 million and $215.8 million, respectively, of assets managed on behalf of the Trade Capital providers.
The amortized cost and fair values of fixed maturity investments as of December 31, 2009, by contractual maturity, were as follows:
| (in millions) | Amortized Cost |
Fair Value | ||||
| Due in one year or less |
$ | 224.6 | $ | 227.6 | ||
| Due after one year through five years |
1,191.7 | 1,229.8 | ||||
| Due after five years through ten years |
421.9 | 440.8 | ||||
| Thereafter |
310.9 | 317.0 | ||||
| Structured securities |
1,298.9 | 1,316.9 | ||||
| Total |
$ | 3,448.0 | $ | 3,532.1 | ||
The expected maturities may differ from the contractual maturities because debtors may have the right to call or prepay obligations.
F-18
Table of Contents
An aging of unrealized losses on the Company’s investments in fixed maturities, equity securities and other investments at December 31, 2009 and 2008 is presented below:
| 2009 | Less Than One Year | One Year or Greater | Total | |||||||||||||||
| (in millions) | Fair Value |
Unrealized Loss |
Fair Value |
Unrealized Loss |
Fair Value |
Unrealized Loss | ||||||||||||
| Fixed maturities |
||||||||||||||||||
| U.S. Treasury securities |
$ | 72.0 | $ | 0.8 | $ | 8.4 | $ | 0.1 | $ | 80.4 | $ | 0.9 | ||||||
| U.S. Government agencies |
98.0 | 0.8 | - | - | 98.0 | 0.8 | ||||||||||||
| Obligations of states and political subdivisions |
45.7 | 0.5 | 3.5 | 0.4 | 49.2 | 0.9 | ||||||||||||
| Corporate securities |
93.4 | 0.9 | 14.8 | 2.1 | 108.2 | 3.0 | ||||||||||||
| Structured securities: |
||||||||||||||||||
| CMO/MBS-agency |
143.3 | 1.6 | 1.2 | 0.1 | 144.5 | 1.7 | ||||||||||||
| CMO/MBS-non agency |
1.0 | - | 42.6 | 6.3 | 43.6 | 6.3 | ||||||||||||
| CMBS |
16.8 | 0.1 | 23.9 | 1.9 | 40.7 | 2.0 | ||||||||||||
| ABS-residential |
10.2 | 3.1 | 7.7 | 1.9 | 17.9 | 5.0 | ||||||||||||
| ABS-non residential |
22.4 | 0.1 | 10.5 | 0.6 | 32.9 | 0.7 | ||||||||||||
| Foreign |
149.2 | 1.4 | 49.3 | 3.0 | 198.5 | 4.4 | ||||||||||||
| Total fixed maturities |
652.0 | 9.3 | 161.9 | 16.4 | 813.9 | 25.7 | ||||||||||||
| Equity securities |
9.1 | 0.6 | 1.1 | - | 10.2 | 0.6 | ||||||||||||
| Other investments |
- | - | 13.0 | 0.4 | 13.0 | 0.4 | ||||||||||||
| Short-term investments |
8.0 | 0.1 | - | - | 8.0 | 0.1 | ||||||||||||
| Total |
$ | 669.1 | $ | 10.0 | $ | 176.0 | $ | 16.8 | $ | 845.1 | $ | 26.8 | ||||||
| 2008 | Less Than One Year | One Year or Greater | Total | |||||||||||||||
| (in millions) | Fair Value |
Unrealized Loss |
Fair Value |
Unrealized Loss |
Fair Value |
Unrealized Loss | ||||||||||||
| Fixed maturities |
||||||||||||||||||
| U.S. Treasury securities |
$ | 20.9 | $ | - | $ | - | $ | - | $ | 20.9 | $ | - | ||||||
| U.S. Government agencies |
1.4 | - | - | - | 1.4 | - | ||||||||||||
| Obligations of states and politicalsubdivisions |
136.8 | 3.6 | 9.4 | 0.4 | 146.2 | 4.0 | ||||||||||||
| Corporate securities |
223.0 | 10.1 | 161.7 | 12.8 | 384.7 | 22.9 | ||||||||||||
| Structured securities: |
||||||||||||||||||
| CMO/MBS-agency |
8.5 | - | 16.4 | 0.1 | 24.9 | 0.1 | ||||||||||||
| CMO/MBS-non agency |
31.8 | 4.1 | 28.2 | 8.7 | 60.0 | 12.8 | ||||||||||||
| CMBS |
122.5 | 17.6 | 42.3 | 7.3 | 164.8 | 24.9 | ||||||||||||
| ABS-residential |
0.2 | - | 9.0 | 1.0 | 9.2 | 1.0 | ||||||||||||
| ABS-non residential |
72.5 | 3.9 | 5.3 | 2.3 | 77.8 | 6.2 | ||||||||||||
| Foreign |
4.0 | 6.8 | 4.0 | 0.2 | 8.0 | 7.0 | ||||||||||||
| Total fixed maturities |
621.6 | 46.1 | 276.3 | 32.8 | 897.9 | 78.9 | ||||||||||||
| Equity securities |
97.2 | 28.4 | 2.2 | 1.6 | 99.4 | 30.0 | ||||||||||||
| Short-term investments |
119.3 | 28.4 | - | - | 119.3 | 28.4 | ||||||||||||
| Total |
$ | 838.1 | $ | 102.9 | $ | 278.5 | $ | 34.4 | $ | 1,116.6 | $ | 137.3 | ||||||
The Company holds a total of 3,859 securities, of which 433 were in an unrealized loss position for less than one year and 133 were in an unrealized loss position for a period one year or greater as of December 31, 2009.
F-19
Table of Contents
Investment income and expenses for the years ended December 31 were as follows:
| (in millions) | 2009 | 2008 | 2007 | ||||||
| Investment income: |
|||||||||
| Interest and dividends on fixed maturities |
$ | 133.6 | $ | 132.7 | $ | 114.2 | |||
| Dividends on equity securities |
7.9 | 8.0 | 7.6 | ||||||
| Interest on short-term and other investments |
5.7 | 16.7 | 18.5 | ||||||
| Other |
7.7 | 2.3 | 1.1 | ||||||
| 154.9 | 159.7 | 141.4 | |||||||
| Investment expenses |
(9.4) | (9.5) | (7.1) | ||||||
| Net investment income |
$ | 145.5 | $ | 150.2 | $ | 134.3 | |||
Proceeds from sales of fixed maturity investments were $1,257.3 million, $463.2 million and $427.8 million in 2009, 2008, and 2007, respectively. Proceeds from sales of equity securities were $81.9 million, $39.9 million and $31.8 million in 2009, 2008, and 2007, respectively. Proceeds from sales of other investments were $0.6 million, $5.4 million and $7.0 million in 2009, 2008, and 2007, respectively.
The following table presents the Company’s gross realized investment and other (losses) gains for the years ended December 31:
| (in millions) | 2009 | 2008 | 2007 | ||||||
| Realized gains |
|||||||||
| Fixed maturities |
$ | 35.6 | $ | 4.6 | $ | 1.1 | |||
| Equity securities |
9.1 | 14.2 | 9.0 | ||||||
| Short-term and other investments |
2.7 | 0.2 | 2.3 | ||||||
| Gain on sale of affiliates |
- | 3.1 | - | ||||||
| Gross realized gains |
47.4 | 22.1 | 12.4 | ||||||
| Realized losses |
|||||||||
| Fixed maturities |
(17.2) | (5.3) | (2.9) | ||||||
| Equity securities |
(0.9) | (0.3) | (0.2) | ||||||
| Short-term and other investments |
(1.0) | (0.3) | (1.1) | ||||||
| Other-than-temporary impairment losses on fixed maturities |
(6.9) | (21.3) | (1.5) | ||||||
| Other-than-temporary impairment losses on equity securities |
(20.3) | (30.0) | (0.8) | ||||||
| Other-than-temporary impairment losses on Funds at Lloyd’s foreign currency exchange |
(17.8) | - | - | ||||||
| Gross realized losses |
(64.1) | (57.2) | (6.5) | ||||||
| Net realized investment and other (losses) gains |
$ | (16.7) | $ | (35.1) | $ | 5.9 | |||
During the year ended December 31, 2009, the Company recognized $17.8 million of other-than-temporary impairment on short-term investments held at Lloyds’ that the Company has since sold or intended to sell at December 31, 2009. These losses are related entirely to foreign currency losses.
At December 31, 2009, the amortized cost and fair value of investments on deposit with various U.S. insurance and other regulatory agencies were $243.1 million and $254.0 million, respectively.
Investments with an amortized cost of $128.0 million and fair value of $131.5 million were pledged as collateral in support of irrevocable letters of credit at December 31, 2009. These assets support irrevocable letters of credit issued under the terms of certain reinsurance agreements in respect of reported loss and loss expense reserves in the amount of $53.7 million and the Company’s Corporate member’s capital as security to support the underwriting business at Lloyd’s in the amount of $49.9 million. The Company also has securities of $32.5 million amortized cost and $33.5 million fair value principally pledged as collateral related to a security trust agreement.
F-20
Table of Contents
Securities pledged to Lloyd’s as the Company’s Corporate member’s capital at December 31, 2009 comprise:
| (in millions) | 2009 | ||
| Letters of credit |
$ | 49.9 | |
| Fixed maturities, at fair value |
113.8 | ||
| Short-term investments, at fair value |
66.6 | ||
| Total securities pledged to Lloyd’s |
$ | 230.3 | |
The Company evaluates its investments for impairment. In accordance with Company policy, the determination that a security has incurred an other-than-temporary decline in fair value and the associated amount of any loss recognition requires the judgment of the Company’s management and a continual review of its investments. The Company reviews its investments in an unrealized loss position at each balance sheet date to determine whether a decline in fair value below the amortized cost basis is other-than-temporary. In general, the process for identifying other-than-temporary declines in fair value involves the consideration of several factors, including but not limited to, whether the issuer has been downgraded to below investment-grade, the length of time in which there has been a significant decline in value, the liquidity, business prospects, and overall financial condition of the issuer, the nature and performance of the collateral or other credit support backing the security, the significance of the decline in value, and whether the Company has the intent to sell the debt security or may be required to sell the debt security before its anticipated recovery. For equity securities, the length of time in which there has been a significant decline in value, the significance of the decline in value and whether the Company has the intent to sell the security before its anticipated recovery are the primary factors in determining if an unrealized loss on a security is other-than-temporary. If consideration of the factors above result in a conclusion that the decline in fair value is other-than-temporary, the cost basis of the security is written down to fair value and the write down is recorded as a realized loss. For securities in an unrealized loss position at December 31, 2009, management has evaluated the aforementioned factors. Based on an evaluation of these factors, the Company has concluded that the unrealized losses on the Company’s investments in equity and fixed income securities, as shown above, at December 31, 2009, are temporary.
For investments in equity securities, none of the unrealized losses have been in an unrealized loss position of 20% or more for more than one year. The Company recognized $20.3 million of other-than-temporary losses during the year ended December 31, 2009 on its equity securities portfolio primarily due to the effects of the decline in equities market over the past two years.
Unrealized losses greater than twelve months on fixed maturities were the result of a number of factors, including increasing credit spreads and higher market yields relative to the date the securities were purchased, macroeconomic issues affecting market liquidity, and for structured securities by the performance of the underlying collateral as well. The Company does not consider those investments to be other-than-temporarily impaired at December 31, 2009.
The Company recognized $6.9 million of other-than-temporary losses on its fixed maturities portfolio at December 31, 2009.
The Company recognized $17.8 million of other-than-temporary losses on short-term investments held at Lloyd’s that the Company has sold or intended to sell at December 31, 2009. These losses are related entirely to foreign currency losses.
In accordance with an accounting standard issued by the FASB in the second quarter of 2009, the Company evaluated debt securities held at the beginning of the interim period of adoption (April 1, 2009) for which an other-than-temporary impairment was previously recognized in earnings. For securities that the Company did not intend to sell, the Company projected the cash flows expected to be received from each security and compared the present value of those cash flows with the amortized cost basis to determine if an impairment was required. Assumptions used in projecting these cash flows included prepayment assumptions, expected default rates and loss severities, and the current condition of any guarantors. Based on this analysis, the Company has determined the other-than-temporary impairment charge associated with those debt securities which is non-credit related to be $9.7 million on a pre-tax basis. On April 1, 2009, the Company has reclassified $9.7 million pre-tax, $6.5 million after taxes, of previously recognized other-than-temporary impairment charges from retained earnings to other comprehensive income as the cumulative effect-adjustment of the adoption of the accounting standard.
Fair Value Measurements
Fair value is the price that would be received to sell an asset or paid to transfer a liability in an orderly transaction between market participants at the measurement date. Fair value measurement assumes that the transaction to sell the asset or transfer the liability occurs in the principal market for the asset or liability, or in the absence of a principal market, the most advantageous market. Market participants are buyers and sellers in the principal (or most advantageous) market that are independent, knowledgeable, able to transact for the asset or liability and willing to transfer for the asset or liability.
F-21
Table of Contents
Valuation techniques consistent with the market approach, income approach and/or cost approach are used to measure fair value. The inputs of these valuation techniques are categorized into three levels.
| ¡ | Level 1 inputs are quoted prices (unadjusted) in active markets for identical assets or liabilities that can be accessed at the reporting date. Actively traded, as defined by the Company, is a security that has traded in the past seven days. The Company receives one quote per instrument for Level 1 inputs. |
| ¡ | Level 2 inputs are inputs other than quoted prices included within Level 1 that are observable for the asset or liability, either directly or indirectly. The Company receives one quote per instrument for Level 2 inputs. |
| ¡ | Level 3 inputs are unobservable inputs. Unobservable inputs reflect the Company’s own assumptions about the assumptions market participants would use in pricing the asset or liability based on the best information available in the circumstances. |
The Company receives fair value prices from an independent pricing service and its third-party investment managers. These prices are determined using observable market information such as dealer quotes, market spreads, cash flows, yield curves, live trading levels, trade execution data, market consensus prepayment speeds, credit information and the security’s terms and conditions, among other things. The Company has reviewed the processes used by the third party providers for pricing the securities, and has determined that these processes result in fair values consistent with GAAP requirements. In addition, the Company reviews these prices for reasonableness, and has not adjusted any prices received from the third-party providers as of December 31, 2009. A description of the Company’s valuation techniques used to measure its assets at fair value is as follows:
Available-for-Sale Fixed Maturity Investments: U.S. Treasury Notes included in available-for-sale fixed maturity investments are reported at fair value utilizing Level 1 inputs. For these securities, the Company obtains fair value measurements from an independent pricing service using quoted prices (unadjusted) in active markets at the reporting date. Effectively all other available-for-sale fixed maturity investments are reported at fair value utilizing Level 2 inputs. For these securities, the Company obtains fair value measurements from either an independent pricing service using quoted prices or from its investment managers. These Level 2 inputs are valued by either the pricing service or the investment managers utilizing observable data that may include dealer quotes, market spreads, cash flows, yield curves, live trading levels, trade execution data, market consensus prepayment speeds, credit information and the security’s terms and conditions, among other things. The remaining securities are reported at fair value utilizing Level 3 inputs. These securities are priced by the investment managers utilizing unobservable inputs.
Trading Fixed Maturity Investments: Trading fixed maturity investments are reported at fair value utilizing Level 2 inputs in the same manner as described above for available-for-sale fixed maturity investments.
Equity Securities: Equity securities are principally reported at fair value utilizing Level 1 inputs. For these securities, the Company obtains fair value measurements from an independent pricing service using quoted prices (unadjusted) in active markets at the reporting date. All other equity securities are reported at fair value utilizing Level 3 inputs. For these securities, the Company obtains fair value measurements from the National Association of Insurance Commissioners’ Securities Valuation Office (NAIC SVO) at the reporting date or has priced the security utilizing unobservable inputs.
Other Investments: Overseas deposits are assets held in trust in jurisdictions where there is a legal and regulatory requirement to maintain funds locally in order to protect policyholders. Lloyd’s is the appointed investment manager for the funds. These assets are invested in short term government securities, agency securities and corporate bonds and are valued utilizing Level 2 inputs based upon values obtained from Lloyd’s.
Short-term Investments: Short-term investments are principally reported at fair value utilizing Level 1 inputs Values for the investments categorized as Level 1 are obtained from various financial institutions as of the reporting period date. Included in short-term investments are Funds at Lloyd’s which represents a portion of the Company’s Corporate member’s capital as security to support the underwriting business at Lloyd’s. Lloyd’s invests the funds in fixed cash deposit accounts, certificates of deposits, sovereign debt, United Kingdom short government gilts and U.S. Treasury bills.
F-22
Table of Contents
Based on an analysis of the inputs, the Company’s financial assets measured at fair value on a recurring basis at December 31, 2009 and 2008 have been categorized as follows:
| (in millions) | December 31, 2009 | Fair Value Measurements at Reporting Date Using | ||||||||||
| Level 1 | Level 2 | Level 3 | ||||||||||
| Investments |
||||||||||||
| Fixed maturities (Available-for-sale): |
||||||||||||
| U.S. Treasury securities |
$ | 172.7 | $ | 172.7 | $ | - | $ | - | ||||
| U.S. Government agencies |
403.6 | - | 403.6 | - | ||||||||
| Obligations of states and political subdivisions |
724.7 | - | 724.7 | - | ||||||||
| Corporate securities |
527.3 | - | 526.6 | 0.7 | ||||||||
| Structured securities |
1,316.9 | - | 1,316.9 | - | ||||||||
| Foreign |
384.7 | - | 384.7 | - | ||||||||
| Fixed maturities (Trading): |
||||||||||||
| Foreign |
2.2 | - | 2.2 | - | ||||||||
| Equity securities |
265.9 | 251.9 | - | 14.0 | ||||||||
| Other investments |
66.3 | - | 66.3 | - | ||||||||
| Short-term investments |
439.3 | 439.3 | - | - | ||||||||
| $ | 4,303.6 | $ | 863.9 | $ | 3,425.0 | $ | 14.7 | |||||
| (in millions) | December 31, 2008 | Fair Value Measurements at Reporting Date Using | ||||||||||
| Level 1 | Level 2 | Level 3 | ||||||||||
| Investments |
||||||||||||
| Fixed maturities (Available-for-sale): |
||||||||||||
| U.S. Treasury securities |
$ | 242.7 | $ | 242.7 | $ | - | $ | - | ||||
| U.S. Government agencies |
278.8 | - | 278.8 | - | ||||||||
| Obligations of states and political subdivisions |
796.2 | - | 796.2 | - | ||||||||
| Corporate securities |
546.3 | - | 544.9 | 1.4 | ||||||||
| Structured securities |
1,160.4 | - | 1,160.4 | - | ||||||||
| Foreign |
126.0 | - | 126.0 | - | ||||||||
| Fixed maturities (Trading): |
- | |||||||||||
| Foreign |
2.1 | - | 2.1 | - | ||||||||
| Equity securities |
272.3 | 266.1 | - | 6.2 | ||||||||
| Other investments |
32.3 | - | 32.3 | - | ||||||||
| Short-term investments |
513.6 | 513.5 | 0.1 | - | ||||||||
| $ | 3,970.7 | $ | 1,022.3 | $ | 2,940.8 | $ | 7.6 | |||||
The fair value measurements in the table above do not agree to “Total investments” on the Consolidated Balance Sheets as they exclude certain other investments that are accounted for under the equity-method of accounting and are not included in this disclosure.
F-23
Table of Contents
A reconciliation of the beginning and ending balances for the investments categorized as Level 3 at December 31, 2009 and 2008 are as follows:
| Fair Value Measurements Using Unobservable Inputs (Level 3) | |||||||||
| (in millions) | Corporate Securities |
Equity Securities |
Total | ||||||
| Beginning balance, January 1, 2009 |
$ | 1.4 | $ | 6.2 | $ | 7.6 | |||
| Total gains or losses (realized/unrealized): |
|||||||||
| Included in net income |
(0.5) | - | (0.5) | ||||||
| Included in other comprehensive income |
0.3 | 7.8 | 8.1 | ||||||
| Purchases, issuances and settlements |
(0.5) | - | (0.5) | ||||||
| Transfers in and/or out of Level 3 |
- | - | - | ||||||
| Ending balance, December 31, 2009 |
$ | 0.7 | $ | 14.0 | $ | 14.7 | |||
| Amount of total gains or losses for the period included in net income attributable to the change in unrealized gains or losses relating to assets still held at December 31, 2009 |
$ | - | $ | - | $ | - | |||
| Fair Value Measurements Using Unobservable Inputs (Level 3) | |||||||||
| (in millions) | Corporate Securities |
Equity Securities |
Total | ||||||
| Beginning balance, January 1, 2008 |
$ | 1.1 | $ | 6.0 | $ | 7.1 | |||
| Total gains or losses (realized/unrealized): |
|||||||||
| Included in net income |
(0.1) | - | (0.1) | ||||||
| Included in other comprehensive income |
(0.1) | 0.2 | 0.1 | ||||||
| Purchases, issuances and settlements |
- | - | - | ||||||
| Transfers in and/or out of Level 3 |
0.5 | - | 0.5 | ||||||
| Ending balance, December 31, 2008 |
$ | 1.4 | $ | 6.2 | $ | 7.6 | |||
| Amount of total gains or losses for the period included in net income attributable to the change in unrealized gains or losses relating to assets still held at December 31, 2008 |
$ | - | $ | - | $ | - | |||
At December 31, 2009, the Company did not have any financial assets or financial liabilities measured on a nonrecurring basis.
| 4. | Reinsurance |
The Company reinsures certain risks with other insurance companies. Such arrangements serve to limit the Company’s maximum loss on catastrophes and large or unusually hazardous risks. The Company is liable for reinsurance ceded in the event its reinsurers do not meet their obligations. Thus, a credit exposure exists with respect to reinsurance ceded to the extent that any reinsurer is unable or unwilling to meet the obligations assumed under the reinsurance contracts. The Company’s allowance for uncollectible reinsurance balances receivable on paid losses and incurred claims were $10.2 million and $9.8 million as of December 31, 2009 and 2008, respectively. Under certain reinsurance agreements, collateral and letters of credit are held to secure performance of reinsurers in meeting their obligations. The amount of such collateral and letters of credit were $330.9 million and $309.3 million at December 31, 2009 and 2008, respectively.
F-24
Table of Contents
The long-term nature of the reinsurance contracts creates a credit risk to the Company over time arising from potentially uncollectible reinsurance. To mitigate that counter-party risk, the Company evaluates its reinsurers to assess their financial condition. The factors that underlie these reviews include a financial risk assessment as well as an internal assessment of the capitalization and the operational risk of the reinsurer. As a result of these reviews, the Company may make changes to the approved markets that are utilized in both its treaty and facultative reinsurance programs.
Estimated losses recoverable from reinsurers and the ceded portion of unearned premiums are reported as assets in the Consolidated Balance Sheets. Included in reinsurance recoverables are paid loss recoverables of $389.4 million and $312.8 million as of December 31, 2009 and 2008, respectively. Premiums earned and losses and loss adjustment expenses are reported net of reinsurance in the Consolidated Statements of Income.
Losses and loss adjustment expenses of $853.1 million, $724.9 million and $526.9 million for the years ended December 31, 2009, 2008 and 2007, respectively, are net of amounts ceded to reinsurers of $629.3 million, $544.0 million and $230.5 million, respectively.
The Company is required to accept certain assigned risks and other legally mandated reinsurance obligations. In previous years, the Company actively assumed various forms of casualty reinsurance for which it continues to maintain reserves for losses and loss adjustment expenses (see Note 15, “Run-off Lines”). For such assumed reinsurance transactions, the Company engages in various monitoring steps that are common with assumed reinsurance such as ongoing claims reviews. The Company currently assumes property related reinsurance primarily through its subsidiary, Argo Re (see Note 14, “Segment Information”).
Premiums for the years ended December 31, were as follows:
| (in millions) | 2009 | 2008 | 2007 | ||||||
| Direct written premiums |
$ | 1,840.0 | $ | 1,471.5 | $ | 1,130.0 | |||
| Reinsurance ceded to other companies |
(567.5) | (450.5) | (326.7) | ||||||
| Reinsurance assumed from other companies |
148.9 | 130.0 | 50.9 | ||||||
| Net written premiums |
$ | 1,421.4 | $ | 1,151.0 | $ | 854.2 | |||
| Direct earned premiums |
$ | 1,775.9 | $ | 1,519.9 | $ | 1,135.8 | |||
| Reinsurance ceded to other companies |
(577.4) | (506.4) | (332.7) | ||||||
| Reinsurance assumed from other companies |
216.4 | 113.6 | 56.7 | ||||||
| Net earned premiums |
$ | 1,414.9 | $ | 1,127.1 | $ | 859.8 | |||
| Percentage of reinsurance assumed to netearned premiums |
15.3% | 10.1% | 6.6% | ||||||
| 5. | Income Taxes |
The Company is incorporated under the laws of Bermuda and, under current Bermuda law, is not obligated to pay any taxes in Bermuda based upon income or capital gains. The Company has received an undertaking from the Supervisor of Insurance in Bermuda pursuant to the provisions of the Exempted Undertakings Tax Protection Act, 1966, which exempts the Company from any Bermuda taxes computed on profits, income or any capital asset, gain or appreciation, or any tax in the nature of estate duty or inheritance tax, at least until the year 2016.
The Company does not consider itself to be engaged in a trade or business in the United States or the United Kingdom and, accordingly, does not expect to be subject to direct United States or United Kingdom income taxation.
The Company has subsidiaries based in the United Kingdom that are subject to the tax laws of that country. Under current law, these subsidiaries are taxed at the applicable corporate tax rates. Six of the United Kingdom subsidiaries are deemed to be engaged in business in the United States and are therefore subject to United States corporate tax in respect of a proportion of their United States underwriting business only. Relief is available against the United Kingdom tax liabilities in respect of overseas taxes paid that arise from the underwriting business. Corporate income tax losses incurred in the United Kingdom can be carried forward, for application against future income, indefinitely. The United Kingdom subsidiaries of the Company file separate United Kingdom income tax returns.
F-25
Table of Contents
The Company has subsidiaries based in the United States that are subject to the tax laws of that country. Under current law, these subsidiaries are taxed at the applicable corporate tax rates. The United States subsidiaries of the Company file a consolidated United States federal income tax return.
The Company also has operations in Belgium and Ireland, which also are subject to income taxes imposed by the jurisdiction in which they operate.
The Company’s income tax provision includes the following components for the years ended December 31:
| (in millions) | 2009 | 2008 | 2007 | ||||||
| Current tax provision |
$ | 26.8 | $ | 36.6 | $ | 38.7 | |||
| Deferred tax provision (benefit) related to: |
|||||||||
| Future tax deductions |
(0.9) | (41.3) | 3.6 | ||||||
| Valuation allowance change |
(1.0) | 28.2 | - | ||||||
| Income tax provision |
$ | 24.9 | $ | 23.5 | $ | 42.3 | |||
The Company’s expected income tax provision computed on pre-tax income at the weighted average tax rate has been calculated as the sum of the pre-tax income in each jurisdiction multiplied by that jurisdiction’s applicable statutory tax rate.
A reconciliation of the difference between the provision for income taxes and the tax provision at the weighted average tax rate is as follows:
| (in millions) | 2009 | 2008 | 2007 | ||||||
| Income tax provision at expected rate |
$ | 38.6 | $ | 28.2 | $ | 44.4 | |||
| Tax effect of: |
|||||||||
| Tax-exempt interest |
(7.3) | (7.1) | (3.8) | ||||||
| Dividends received deduction |
(1.4) | (1.5) | (1.4) | ||||||
| Valuation allowance change |
(1.0) | (3.9) | - | ||||||
| Other permanent adjustments, net |
0.7 | 0.3 | 2.3 | ||||||
| Reduction of tax liability accounts |
- | (2.6) | - | ||||||
| Reduction of tax reserve |
- | (0.7) | - | ||||||
| United States state tax expense |
(3.5) | 0.2 | 0.8 | ||||||
| Foreign tax credits |
(0.7) | - | - | ||||||
| Other foreign adjustments |
0.1 | - | - | ||||||
| Foreign exchange adjustments |
(0.6) | 10.6 | - | ||||||
| Income tax provision |
$ | 24.9 | $ | 23.5 | $ | 42.3 | |||
The consolidated provision for income taxes for the year ended December 31, 2009 was affected by a $3.5 million reduction for state tax expense primarily related to a refund of $5.6 million from the California State Board of Equalization, a $0.7 million reduction for the adjustments on prior year foreign tax expense, and a $0.6 million reduction for the foreign exchange adjustment on the translation from Sterling to the U.S. Dollar within Argo International.
Deferred taxes arise from temporary differences in the recognition of revenues and expenses for tax and financial reporting purposes. Net deferred tax assets as of December 31, 2009, 2008 and 2007 resulted from the tax-effected temporary differences shown in the following table. Due primarily to changes in unrealized gains on available-for-sale investment securities, the net deferred tax asset balance decreased by $43.4 million, increased by $19.7 million and decreased by $20.1 million as of December 31, 2009, 2008 and 2007, respectively.
F-26
Table of Contents
| (in millions) | 2009 | 2008 | 2007 | ||||||
| Deferred tax asset: |
|||||||||
| Unrealized losses on fixed maturities and other investment securities |
$ | 0.8 | $ | 1.8 | $ | - | |||
| Losses and loss adjustment expense reserve discounting |
42.3 | 50.6 | 55.9 | ||||||
| Unearned premiums |
28.9 | 29.9 | 27.5 | ||||||
| Capital loss carryforward |
33.6 | 32.1 | - | ||||||
| Allowance for bad debt |
3.3 | 3.9 | 6.0 | ||||||
| Net operating loss carryforward |
18.7 | 17.9 | 18.9 | ||||||
| Impairment of investment values |
17.6 | 17.1 | - | ||||||
| United Kingdom interest |
1.9 | 3.3 | - | ||||||
| Other |
18.2 | 16.6 | 15.4 | ||||||
| Deferred tax asset, gross |
165.3 | 173.2 | 123.7 | ||||||
| Deferred tax liability: |
|||||||||
| Unrealized gains on equity securities |
(29.9) | (10.0) | (35.7) | ||||||
| Unrealized gains on fixed maturities and other investment securities |
(22.0) | (0.2) | (2.8) | ||||||
| Deferred acquisition costs |
(34.7) | (34.4) | (32.1) | ||||||
| United Kingdom underwriting profits |
(8.8) | (19.6) | - | ||||||
| United Kingdom amortization of intangible assets |
(6.8) | (8.4) | - | ||||||
| United States state tax |
(0.7) | (0.7) | - | ||||||
| Other |
(6.3) | (2.9) | (4.0) | ||||||
| Deferred tax liability, gross |
(109.2) | (76.2) | (74.6) | ||||||
| Deferred tax asset, net before valuation allowance |
56.1 | 97.0 | 49.1 | ||||||
| Valuation allowance |
(49.5) | (47.0) | (18.8) | ||||||
| Deferred tax asset, net |
$ | 6.6 | $ | 50.0 | $ | 30.3 | |||
| Net deferred tax asset (liability) - United Kingdom |
$ | (13.7) | $ | (24.5) | $ | - | |||
| Net deferred tax asset (liability) - United States |
20.3 | 74.5 | 30.3 | ||||||
| Deferred tax asset, net |
$ | 6.6 | $ | 50.0 | $ | 30.3 | |||
The Company’s net deferred tax assets are supported by taxes paid in previous periods, the reversal of the taxable temporary differences and the recognition of future income. Management regularly evaluates the recoverability of the deferred tax asset and makes any necessary adjustments to it based upon any changes in management’s expectations of future taxable income. Realization of deferred tax assets is dependent upon the Company’s generation of sufficient taxable income in the future to recover tax benefits that cannot be recovered from taxes paid in the carryback period, which is generally two years for net operating losses and three years for capital losses. At December 31, 2009, the Company had a total net deferred tax asset of $56.1 million prior to any valuation allowance. Management has concluded that a valuation allowance is required for a portion of the tax effected net capital loss carryforward of $33.6 million generated from the sale of PXRE Reinsurance Company, and a full valuation allowance is required for the tax effected net operating loss carryforward of $18.7 million from PXRE Corporation. Of the PXRE loss carryforwards, $17.2 million will expire if not utilized by December 31, 2025 and $1.5 million will expire if not utilized by December 31, 2027. The valuation allowances have been established as Internal Revenue Code Section 382 limits the utilization of net operating loss and net capital loss carryforwards following an ownership change. Accordingly, a valuation allowance of $49.5 million is required. The loss carryforwards available to utilize per year are $2.8 million as required by Internal Revenue Code Section 382. During the year ended December 31, 2009, there was an increase to the valuation allowance for the capital loss carryforward of $2.5 million and to the net operating loss carryforward of $1.0 million and a reduction of the valuation allowance of $1.0 million.
The Company had no material unrecognized tax benefits upon adoption of the accounting guidance for accounting for uncertainty in income taxes and has no material unrecognized tax benefits as of December 31, 2009. Tax years ended December 31, 2006 through December 31, 2009 are open for examination by the IRS.
F-27
Table of Contents
| 6. | Reserves for Losses and Loss Adjustment Expenses |
The following table provides a reconciliation of reserves for losses and loss adjustment expenses (“LAE”) for the years ended December 31, 2009, 2008 and 2007, respectively.
| (in millions) | 2009 | 2008 | 2007 | ||||||
| Net beginning of the year |
$ | 2,115.6 | $ | 1,863.3 | $ | 1,530.5 | |||
| Add: |
|||||||||
| Net reserves held for sale (1) |
- | 104.3 | - | ||||||
| Net reserves from acquired companies |
- | 210.2 | 368.4 | ||||||
| Losses and LAE incurred during current calendar year, net of reinsurance: |
|||||||||
| Current accident year |
859.4 | 786.1 | 557.2 | ||||||
| Prior accident years |
(6.3) | (61.2) | (30.3) | ||||||
| Losses and LAE incurred during calendar year, net of reinsurance |
853.1 | 724.9 | 526.9 | ||||||
| Deduct: |
|||||||||
| Losses and LAE payments made during current calendar year, net of reinsurance: |
|||||||||
| Current accident year |
218.9 | 200.7 | 105.2 | ||||||
| Prior accident years |
566.8 | 466.3 | 354.6 | ||||||
| Losses and LAE payments made during current calendar year, net of reinsurance: |
785.7 | 667.0 | 459.8 | ||||||
| Additional participation interest |
18.2 | - | - | ||||||
| Foreign exchange adjustments |
12.0 | (20.6) | 1.3 | ||||||
| Retroactive reinsurance ceded |
- | - | 0.3 | ||||||
| Net reserves - end of period |
2,213.2 | 2,215.1 | 1,967.6 | ||||||
| Deduct: |
|||||||||
| Net reserves sold on disposition of subsidiary (2) |
- | 99.5 | 104.3 | ||||||
| Net reserves - end of period, excluding disposition of subsidiary |
2,213.2 | 2,115.6 | 1,863.3 | ||||||
| Add: |
|||||||||
| Reinsurance recoverable on unpaid losses and LAE, end of period |
990.0 | 881.0 | 562.2 | ||||||
| Gross reserves - end of period |
$ | 3,203.2 | $ | 2,996.6 | $ | 2,425.5 | |||
| (1) | Amount represents the fair value of reserves held for sale at the beginning of the year attributable to PXRE Reinsurance Company. |
| (2) | Amount was classified as held for sale at December 31, 2007. |
Reserves for losses and loss adjustment expenses represent the estimated indemnity cost and related adjustment expenses necessary to investigate and settle claims. Such estimates are based upon individual case estimates for reported claims, estimates from ceding companies for reinsurance assumed, and actuarial estimates for losses that have been incurred but not yet reported to the insurer. Any change in probable ultimate liabilities is reflected in current operating results.
Net favorable loss development recognized in 2009 for prior accident years was a $6.3 million reduction to losses and LAE. The Excess and Surplus Lines segment had favorable loss development of $15.4 million primarily driven by favorable development of $8.0 million related to casualty and professional liability lines of business, $3.3 million related to property lines of business, and $4.0 million related to unallocated loss adjustment reserves. The Commercial Specialty segment had net favorable loss development of $3.7 million which includes: 1) $6.2 million of favorable development in the workers compensation lines, 2) $3.5 million of favorable development in short tail lines, 3) $2.5 million of unfavorable development in other liability and 4) $3.5 million of unfavorable development in commercial auto liability. The Reinsurance segment had favorable loss development of $9.1 million, which includes: 1) $3.6 million of favorable development attributable to Hurricane Ike, 2) $4.4 million favorable development attributable to non-catastrophe losses and 3) $1.1 million favorable development related to other assumed programs. The International Specialty segment had unfavorable loss development of $23.5 million, which was offset by additional premiums of $24.1 million related to the following: 1) $19.6 million unfavorable development related to property lines of business, offset by additional premium of $18.3 million, and 2) $3.9 million unfavorable development related to liability lines of business, offset by additional premium of $5.8 million. The Run-off Lines segment had $1.6 million of net favorable development primarily driven by: 1) $6.1 million of unfavorable development in asbestos and environmental lines, 2) $7.6 million favorable development on legacy PXRE claims primarily related to non-catastrophe property lines, 3) $3.2 million of favorable development related to PXRE’s 2005 hurricane losses and 4) $3.0 million of unfavorable development in workers compensation lines due to the unwinding of the reserve discount.
F-28
Table of Contents
Net favorable loss development recognized in 2008 for prior accident years was a $61.2 million reduction to losses and LAE. The Excess and Surplus Lines segment had favorable loss development of $39.6 million driven by favorable development of $15.2 million for property lines, $17.4 million for general liability lines, and $7.0 million favorable development spread across commercial multi peril, automobile and unallocated loss adjustment expense reserves. The Commercial Specialty segment had favorable loss development of $8.2 million, which includes: 1) $8.8 million of favorable loss reserve development in the liability lines which includes $5.0 million of favorable directors and officers development, 2) $4.0 million of favorable loss reserve development in the workers compensation lines, 3) $1.5 million of favorable loss reserve development in the property lines for the 2007 accident year and 4) $6.1 million of unfavorable loss reserve development in automobile lines. The Reinsurance segment had favorable loss development of $2.7 million driven by favorable property loss reserve development on two reinsurance contracts. The International Specialty segment had unfavorable loss development of $3.5 million related to property facultative claims from the 2006 year. The Run-off Lines segment had favorable loss reserve development of $14.2 million primarily driven by: 1) $17.5 million of favorable loss reserve development mainly for PXRE property losses, 2) $1.7 million of favorable loss reserve development in risk management lines and 3) $5.0 million net unfavorable loss reserve development primarily related to asbestos and environmental liability reserves.
Net favorable loss development recognized in 2007 for prior accident years was a $30.3 million reduction to losses and LAE. The Excess and Surplus Lines segment had favorable development of $38.5 million which was caused by: 1) $24.3 million decrease to other liability and automobile reserves, 2) $5.3 million decrease to property reserves, 3) $2.9 million decrease to unallocated loss adjustment reserves and 4) $6.0 million reduction to reserves across other lines of business. The Commercial Specialty segment had favorable development of $14.8 million caused by: 1) $7.2 million decrease to other liability and auto reserves, 2) $11.7 million decrease to workers compensation reserves, 3) $0.4 million decrease to property reserves and 4) unfavorable development of $4.5 million from the unwinding of workers compensation discount. The Run-off Lines segment had unfavorable development of $23.0 million mainly driven by: 1) $28.8 million increase to other liability reserves primarily driven by increased asbestos and environmental reserves, 2) $7.0 million increase to workers compensation reserves, and $10.4 million decrease to liability and automobile reserves from the Company’s risk management business, 3) $3.2 million favorable development in medical malpractice reserves and 4) $0.8 million of unfavorable development attributable to the write down of a ceded risk cover underwritten by PXRE.
In the opinion of management, the Company's reserves represent the best estimate of its ultimate liabilities, based on currently known facts, current law, current technology, and assumptions considered reasonable where facts are not known. Due to the significant uncertainties and related management judgments, there can be no assurance that future loss development, favorable or unfavorable, will not occur.
Pension-type reserves (tabular reserves) are indemnity reserves that are calculated using discounts determined with reference to actuarial tables, which incorporate interest and contingencies such as mortality, remarriage, inflation, or recovery from disability applied to a reasonably determinable payment stream. The Company discounted certain workers compensation pension-type reserves using a maximum interest rate of 3.5% in 2009, 2008 and 2007. The amount of unamortized discount was $23.5 million, $25.3 million and $40.0 million at December 31, 2009, 2008 and 2007, respectively.
F-29
Table of Contents
| 7. | Junior Subordinated Debentures |
Through a series of trusts, that are wholly-owned subsidiaries (non-consolidated), the Company issued debt. The debentures are variable and fixed rate, with the variable rate being reset quarterly and subject to certain interest rate ceilings. Interest payments are payable quarterly or semiannually. The debentures are all unsecured and are subordinated to other indebtedness. All are redeemable five years after issuance subject to certain terms and conditions at a price equal to 100% of the principal plus accrued and unpaid interest, except as noted in the footnotes to the following table. These obligations are summarized in the following table:
| (in millions) | Interest | |||||||||||||
| Issue Date |
Trust Preferred Pools |
Maturity |
Redeemable | Rate Structure |
Rate at December 31, 2009 |
Amount | ||||||||
| Argo Group |
||||||||||||||
| 05/15/2003 |
PXRE Capital Statutory Trust II | 05/15/2033 | 05/15/2008 | 3M Libor + 4.10% | 4.37% | $ | 18.0 | |||||||
| 05/23/2003 |
PXRE Capital Trust III |
05/23/2033 | 05/23/2008 | (1) | 9.75% | 9.75% | 15.5 | |||||||
| 10/29/2003 |
PXRE Capital Trust V |
10/29/2033 | 10/29/2008 | 3M Libor + 3.85% | 4.13% | 20.6 | ||||||||
| 11/06/2003 |
PXRE Capital Trust VI |
09/30/2033 | 09/30/2008 | 3M Libor + 3.90% | 4.15% | 10.3 | ||||||||
| Argo Group US |
||||||||||||||
| 01/29/1997 |
PXRE Capital Trust I |
02/01/2027 | 02/01/2007 | (2) | 8.85% | 8.85% | 103.1 | |||||||
| 04/25/2003 |
Argonaut Group Statutory Trust I |
05/15/2033 | 05/15/2008 | 3M Libor + 4.10% | 4.37% | 15.5 | ||||||||
| 12/16/2003 |
Argonaut Group Statutory Trust III |
01/08/2034 | 01/08/2009 | 3M Libor + 4.10% | 4.38% | 12.3 | ||||||||
| 04/29/2004 |
Argonaut Group Statutory Trust IV |
04/29/2034 | 04/29/2009 | 3M Libor + 3.85% | 4.12% | 13.4 | ||||||||
| 05/26/2004 |
Argonaut Group Statutory Trust V |
05/24/2034 | 05/24/2009 | 3M Libor + 3.85% | 4.11% | 12.3 | ||||||||
| 05/12/2004 |
Argonaut Group Statutory Trust VI |
05/12/2034 | 06/01/2009 | 3M Libor + 3.80% | 4.05% | 13.4 | ||||||||
| 09/17/2004 |
Argonaut Group Statutory Trust VII |
12/15/2034 | 09/17/2009 | 3M Libor + 3.60% | 3.85% | 15.5 | ||||||||
| 09/22/2004 |
Argonaut Group Statutory Trust VIII |
09/22/2034 | 09/22/2009 | 3M Libor + 3.55% | 3.80% | 15.5 | ||||||||
| 10/22/2004 |
Argonaut Group Statutory Trust IX |
12/15/2034 | 12/15/2009 | 3M Libor + 3.60% | 3.85% | 15.5 | ||||||||
| 09/14/2005 |
Argonaut Group Statutory Trust X |
09/15/2035 | 09/15/2010 | (3) | 7.75% until 09/10, then 3M Libor + 3.40% |
7.75% | 30.9 | |||||||
| PXRE Capital Trust I Unamortized discount |
(0.4) | |||||||||||||
| Total Outstanding | $ | 311.4 | ||||||||||||
| (1) | Redeemable at a price equal to 104.875 to 100% of the principal, plus accrued and unpaid interest |
| (2) | Redeemable at a call prices of 104.18% at February 2007 declining to 100.418% at February 2016, and 100% thereafter |
| (3) | Redeemable prior to September 2010, at the greater of a) 107.5% of principal plus accrued and unpaid interest or b) the sum of the discounted present value of the principal, the discounted present value of the interest payable during the fixed rate period remaining life and the accrued and unpaid interest. Redeemable after September 2010 at a price equal to 100% of the principal plus accrued and unpaid interest |
F-30
Table of Contents
| 8. | Other Indebtedness |
Floating Rate Loan Stock
This debt was assumed through the acquisition of Argo International. These notes are unsecured, and each has an option to repay in full on any interest payment date following the fifth anniversary of issue. Interest on the U.S. Dollar and Euro notes is due semiannually and quarterly, respectively. A summary of the notes outstanding at December 31, 2009 is presented below:
| Start Year |
Maturity Year |
Currency | Interest Rate |
Interest Rate at December 31, 2009 |
Loan Amount | ||||||
| (in millions) | |||||||||||
| 2004 |
2034 | U.S. Dollar | 6 month LIBOR + 4.2% |
5.17% | $ | 6.5 | |||||
| 2005 |
2035 | Euro | 3 month LIBOR + 4.0% |
4.72% | 17.6 | ||||||
| 2006 |
2036 | U.S. Dollar | 6 month LIBOR + 4.0% |
4.97% | 10.0 | ||||||
| 2006 |
2036 | Euro | 3 month LIBOR + 4.0% |
4.72% | 15.3 | ||||||
| 2007 |
2037 | Euro | 3 month LIBOR + 3.9% |
4.67% | 19.8 | ||||||
| $ | 69.2 | ||||||||||
At December 31, 2008 the floating rate loan stock was $67.3 million. No principal payments have been made by the Company since the acquisition of Argo International. The $52.7 million floating rate loan stock denominated in Euros fluctuates due to foreign currency translation. The foreign currency translation adjustment is recorded in the Consolidated Statements of Income.
Borrowing Under Revolving Credit Facility
On February 27, 2009 the Company entered into a $100 million, 364 day revolving credit facility, amended to mature April 30, 2010, with JPMorgan Chase Bank, N.A., as administrative agent, and other lenders thereto (the “Credit Agreement”). The proceeds of borrowings can be used for general corporate purposes, including working capital and permitted acquisitions. At December 31, 2009, the Company had no borrowings outstanding under the Credit Agreement. The Credit Agreement replaced a $75 million credit agreement dated March 6, 2006. At December 31, 2008 the Company had $50.0 million of borrowing under this agreement.
The Credit Agreement contains certain affirmative and negative covenants. The Company was in compliance with all covenants of the Credit Agreement as of December 31, 2009. Included in the Credit Agreement is a provision that allows up to $10.0 million of the revolver to be used for letters of credit (“LOC”), subject to availability under the line. At December 31, 2009, the Company had drawn $0.1 million in LOCs against the credit facility.
| 9. | Shareholders’ Equity |
The Company is authorized to issue 30 million shares of $1.00 par value preferred shares. As of December 31, 2009, no preferred shares were issued and outstanding.
On November 13, 2007, the Board of Directors authorized the repurchase of up to $150.0 million of the Company’s common shares. As of December 31, 2009, the Company had purchased 145,999 shares at an average price of $35.23 (total of $5.1 million repurchased). Shares of stock repurchased will be held as treasury shares in accordance with the provisions of the Bermuda Companies Act 1981.
F-31
Table of Contents
At December 31, 2009, the Company had the following authorized, unissued common shares reserved for future issuance:
| Reserve Name |
Shares Reserved | |
| 2007 Long-Term Incentive Plan |
4,380,906 | |
| 2007 Employee Share Purchase Plan |
634,840 | |
| Argonaut Group historical stock compensation plans |
716,990 | |
| PXRE historical stock compensation plans |
18,728 | |
| Total |
5,751,464 | |
Shares reserved under the Argonaut Group and PXRE historical plans represent all grants issued and outstanding as of December 31, 2009. (See Note 13, “Share-Based Payments” for further discussion.)
| 10. | Net Income Per Common Share |
The following table presents the calculation of net income per common share on a basic and diluted basis for the years ended December 31, 2009, 2008 and 2007 (2007 balances have been adjusted to reflect the effects of the 6.484 exchange ratio and the 1-for-10 reverse stock split resulting from the Merger):
| (in millions, except number of shares and per share amounts) | 2009 | 2008 | 2007 | ||||||
| Computation of net income per common share - basic: |
|||||||||
| Income before extraordinary item |
$ | 117.5 | $ | 62.9 | $ | 77.5 | |||
| Less preferred dividends |
- | - | (0.1) | ||||||
| Income available to common shareholders |
117.5 | 62.9 | 77.4 | ||||||
| Extraordinary item (1) |
- | - | 66.3 | ||||||
| Net income available to common shareholders |
$ | 117.5 | $ | 62.9 | $ | 143.7 | |||
| Weighted average common shares outstanding-basic |
30,731,226 | 30,622,025 | 25,367,004 | ||||||
| Net income per common share - basic |
|||||||||
| Income before extraordinary item |
$ | 3.82 | $ | 2.05 | $ | 3.05 | |||
| Extraordinary item |
- | - | 2.61 | ||||||
| Net income |
$ | 3.82 | $ | 2.05 | $ | 5.66 | |||
| Computation of net income per common share - diluted: |
|||||||||
| Income before extraordinary item |
$ | 117.5 | $ | 62.9 | $ | 77.5 | |||
| Extraordinary item |
- | - | 66.3 | ||||||
| Net income |
$ | 117.5 | $ | 62.9 | $ | 143.8 | |||
| Weighted average common shares outstanding-basic |
30,731,226 | 30,622,025 | 25,367,004 | ||||||
| Weighted average preferred shares outstanding |
- | - | 105,520 | ||||||
| Stock options and non-vested shares |
111,668 | 143,395 | 301,107 | ||||||
| Weighted average common shares outstanding-diluted |
30,842,894 | 30,765,420 | 25,773,631 | ||||||
| Net income per common share—diluted |
|||||||||
| Income before extraordinary item |
$ | 3.81 | $ | 2.05 | $ | 3.01 | |||
| Extraordinary item |
- | - | 2.57 | ||||||
| Net income |
$ | 3.81 | $ | 2.05 | $ | 5.58 | |||
(1) An extraordinary gain was recorded in the Consolidated Statement of Income representing the negative goodwill remaining upon completion of the Merger.
Excluded from the weighted average common shares outstanding calculation are 145,999 shares which are currently held as treasury shares. In 2009, options to purchase 1,006,257 shares of common stock were excluded from the computation of diluted net income per common share as these instruments were anti-dilutive. These instruments expire at varying times from 2010 through 2016. In 2008, options to purchase 1,264,496 shares of common stock were excluded from the computation of diluted net income per common share as these instruments were anti-dilutive. These instruments expire at varying times from 2009 through 2016. In 2007, options to purchase 705,335 shares of common stock were excluded from the computation of diluted net income per common share as these instruments were anti-dilutive. These instruments expire at varying times from 2008 through 2016.
F-32
Table of Contents
| 11. | Underwriting, Acquisition and Insurance Expenses |
Underwriting, acquisition and insurance expenses for the years ended December 31 2009, 2008 and 2007 were as follows:
| (in millions) | 2009 | 2008 | 2007 | ||||||
| Commissions |
$ | 298.6 | $ | 216.6 | $ | 135.6 | |||
| General expenses |
199.1 | 183.1 | 169.7 | ||||||
| Premium taxes, boards and bureaus |
29.9 | 25.8 | 22.6 | ||||||
| 527.6 | 425.5 | 327.9 | |||||||
| Net (deferral) amortization of policy acquisition costs |
(9.7) | (18.4) | 0.2 | ||||||
| Total underwriting, acquisition and insurance expenses |
$ | 517.9 | $ | 407.1 | $ | 328.1 | |||
As a result of lost arbitrations, reinsurance recoverable balances of $4.8 million in 2009 and $5.8 million in 2008 were written off. These amounts are included in general expenses. The 2007 general expenses include costs related to the acceleration of vesting on non-vested stock awards and stock options grants.
The 2008 underwriting, acquisition and insurance expenses include $62.9 million from seven months (commencing June 1, 2008), of activity from Argo International. The 2007 underwriting, acquisition and insurance expenses include $18.8 million arising from five months of PXRE activity.
The 2009, 2008 and 2007 net (deferral) amortization of policy acquisition costs will not equal the change in the Consolidated Balance Sheet. See Note 1, “Business and Significant Accounting Policies” for further discussion.
| 12. | Pension Benefits |
Argo Group US sponsors a qualified defined benefit plan and non-qualified unfunded supplemental defined benefit plans, all of which were curtailed effective February 2004. The following tables set forth the change in plan assets and the change in projected benefit obligation, as of December 31 with respect to these plans. The assets and liabilities of the plans were measured as of December 31 of the respective years presented.
| (in millions) | 2009 | 2008 | ||||
| Change in plan assets |
||||||
| Fair value of plan assets at beginning of year |
$ | 20.5 | $ | 24.6 | ||
| Actual return on plan assets |
3.1 | (2.1) | ||||
| Employer contributions |
0.2 | 0.2 | ||||
| Benefits paid |
(2.1) | (2.2) | ||||
| Fair value of plan assets at end of year |
$ | 21.7 | $ | 20.5 | ||
| (in millions) | 2009 | 2008 | ||||
| Change in projected benefit obligation |
||||||
| Projected benefit obligation at beginning of year |
$ | 22.4 | $ | 23.8 | ||
| Interest cost |
1.3 | 1.3 | ||||
| Actuarial loss (gain) |
1.8 | (0.5) | ||||
| Benefits paid |
(2.1) | (2.2) | ||||
| Projected benefit obligation at end of year |
$ | 23.4 | $ | 22.4 | ||
As of December 31, 2009 and 2008, the amount of pension assets related to the qualified overfunded plan that exceeded the liability was $0.4 million and $0.1 million, respectively, and other postretirement liabilities related to the non-qualified underfunded plans were $2.1 million and $2.0 million, respectively. These amounts were included in “Other assets” and “Other liabilities,” respectively, in the Consolidated Balance Sheets.
F-33
Table of Contents
Assumptions used to determine benefit obligations at December 31 were as follows:
| 2009 | 2008 | |||
| Weighted average discount rate |
5.25% | 6.00% | ||
| Expected rate of increase in future compensation levels |
n/a | n/a |
Assumptions used to determine net periodic benefit cost for the years ended December 31:
| 2009 | 2008 | 2007 | ||||
| Weighted average discount rate |
6.00% | 5.75% | 5.74% | |||
| Expected return on plan assets |
6.00% | 5.75% | 5.74% | |||
| Expected rate of increase in future compensation levels |
n/a | n/a | n/a |
The expected return on plan assets has been ascertained using the Aa corporate bond rate, rounded to the nearest 25 basis points, which management believes will conservatively approximate future earnings on current and expected investments.
Components of net periodic benefit cost for the years ended December 31 were as follows:
| (in millions) | 2009 | 2008 | 2007 | ||||||
| Interest cost |
$ | 1.3 | $ | 1.3 | $ | 1.3 | |||
| Expected return on plan assets |
(1.2) | (1.4) | (1.4) | ||||||
| Settlement charge |
- | - | 0.6 | ||||||
| Amortization of actuarial loss |
0.2 | 0.1 | 0.1 | ||||||
| Net periodic benefit cost |
$ | 0.3 | $ | - | $ | 0.6 | |||
The Company estimates that $0.2 million of unrecognized actuarial loss will be amortized from accumulated other comprehensive income into net periodic benefit cost during 2010.
The projected benefit obligation for the non-qualified unfunded supplemental defined benefit plans, with accumulated benefit obligations in excess of plan assets, was $2.1 million and $2.0 million as of December 31, 2009 and 2008, respectively. The fair value of plan assets for these plans was zero for these same periods. The accumulated benefit obligation for all defined benefit plans is equal to the projected benefit obligation for each of the years presented.
The Company’s investment policy for the qualified plan requires the investments be prudently selected and properly diversified so as to minimize the risk of large losses in accordance with applicable laws including the Employee Retirement Income Security Act of 1974. The overall investment strategy is to achieve a balance of long-term growth of capital and current income, taking into account the need for liquidity to pay benefits as they come due. Periodic shifts in the asset allocation may be made based on the assessment of current and prospective market conditions. These tactical shifts are to remain consistent with established maximum and minimum ranges established in the investment guidelines.
The investment policy for the qualified plan contains asset allocation guidelines with minimum, maximum and target thresholds which remain effective until such time as the investment policy is revised. At December 31, 2009, the target thresholds were 65% fixed income investments, 30% equity investments, and 5% cash and short-term investments. The target asset allocation percentages were selected based on risk diversification needs, expected distribution patterns, asset manager recommendations, and benefits committee approval. The actual asset allocation as of December 31, 2009 was 53% fixed income investments, 31% equity investments, of which 26% and 5% were allocated between U.S. and foreign equities, respectively, and 16% cash and short-term investments. These allocations were in compliance with the investment policy.
F-34
Table of Contents
Following is a description of the valuation techniques used to measure the plan’s assets at fair value.
Mutual funds: Fair value is determined using observable, market-based inputs.
Common collective trusts: Fair value is determined by Northern Trust at the net asset value recalculated daily.
The methods described above may produce a fair value calculation that may not be indicative of net realizable value or reflective of future fair values. Furthermore, while it is believed the valuation methods are appropriate and consistent with other market participants, the use of different methodologies or assumptions to determine the fair value of certain financial instruments could result in a different fair value measurement at the reporting date.
The fair values of the plan assets at December 31, 2009 by asset category are as follows:
Fair Value Measurements at December 31, 2009
| Asset Category | Total |
Quoted Prices in Active Markets for Identical Assets (Level 1) |
Significant Other Observable Inputs (Level 2) |
Significant Unobservable Inputs (Level 3) | ||||||||
| Equity Securities |
||||||||||||
| Mutual Funds |
||||||||||||
| Large cap U.S. equity (1) |
$ | 3.8 | $ | 3.8 | $ | - | $ | - | ||||
| Small-mid cap U.S. equity (1) |
0.7 | 0.7 | - | - | ||||||||
| International equity (1) |
1.1 | 1.1 | - | - | ||||||||
| Real estate (2) |
0.4 | 0.4 | - | - | ||||||||
| Convertible bond (3) |
0.7 | 0.7 | - | - | ||||||||
| U.S. bonds (4) |
11.5 | 11.5 | - | - | ||||||||
| Cash & short-term investments |
||||||||||||
| Common Collective Trusts |
||||||||||||
| Short-term investment fund (5) |
3.4 | - | 3.4 | - | ||||||||
| Northern Trust Collective Trust - STEP (6) |
0.1 | - | 0.1 | - | ||||||||
| Total |
$ | 21.7 | $ | 18.2 | $ | 3.5 | $ | - | ||||
| (1) | Assets invested in SEC registered mutual funds that have their objectives focused on U.S. or non-U.S. equity markets. The funds in this category emphasize investing in stocks of companies, which generally would be characterized in the large-capitalization sector, the mid or small capitalization sector and, for the international equity fund, across multiple capitalization sectors and multiple geographic locals. |
| (2) | Assets invested in one SEC registered mutual fund that has its investment objective focused on investing in U.S. and non-U.S. residential and commercial real estate. |
| (3) | Assets invested in one SEC registered mutual fund that has its investment objective focused on investing in the convertible bond market. The fund in this category has characteristics, which are both equity and fixed income related due to risks normally found with convertible securities. |
| (4) | Assets invested in one SEC registered mutual fund that has its investment objective focused on investing in the U.S. fixed income markets. The fund in this category emphasizes investing in the diversified U.S. bond markets with an emphasis on investment grade rated sectors. The sectors representing the largest allocation within the fund were U.S. government bonds, corporate bonds, U.S. agency mortgage-backed security debt (“MBS”) and other non-agency residential MBS, commercial MBS bonds, asset-backed security bonds and municipal bonds. |
| (5) | Assets invested in one collective trust composed of high-grade money market money instruments with short maturities. |
| (6) | Assets invested in one private placement security issued by Northern Trust Investments, N.A. The security represents a pro rata share of a private collective fund invested in fixed income assets. The fund name is the Short-Term Extendable Portfolio (“STEP”) and does not trade in the open markets. Northern Trust Investments, N.A. is solely the market maker and valuation source for the security. |
F-35
Table of Contents
Based on the current funding status of the pension plan, the effects of the curtailment, and expected changes in pension plan asset values and pension obligations, the Company does not believe any significant funding of the pension plan will be required during the year ending December 31, 2010.
The Company anticipates formally terminating the plans in the future; however, no definitive date has been determined. Absent the termination of the plans, the Company expects to make the following benefit payments:
| (in millions) | Pension Benefits | ||
| 2010 |
$ | 1.7 | |
| 2011 |
2.2 | ||
| 2012 |
1.7 | ||
| 2013 |
2.0 | ||
| 2014 |
1.8 | ||
| Years 2015 to 2019 |
8.8 | ||
Substantially all employees of the Company are eligible to participate in employee savings plans. Under these plans, if the employee elects to participate, a percentage of the employee’s pay may be contributed to various savings alternatives. The plans also call for Company contributions under several formulae. Charges to income related to the Company’s contributions were $6.4 million in 2009, $5.6 million in 2008 and $4.7 million in 2007. During the twelve months and seven months ended December 31, 2009 and 2008, Argo International paid $2.1 million and $1.4 million, respectively, under its employee savings plan of which $1.2 million and $0.8 million, respectively, was retained by Argo International (a component of the 2009 and 2008 expense). Argo International receives reimbursement for the portion of the employee savings plan that is allocated to the syndicates that Argo International manages but does not own which amounted to $0.9 million in 2009 and $0.6 million in 2008.
13. Share-Based Payments
In November 2007, the shareholders of Argo Group approved the 2007 Long-Term Incentive Plan (the “2007 Plan”), which provides for an aggregate of 4.5 million shares of the Company’s common stock which may be issued to executives, non-employee directors and other key employees. The share awards may be in the form of share options, share appreciation rights (“SARs”), restricted shares, restricted share units, performance units, performance shares or other share-based incentive awards. Shares issued under this plan may be shares that are authorized and unissued or shares that were reacquired by the Company, including shares purchased on the open market. Share options and SARs will count as one share for the purposes of the limits under the 2007 Plan; restricted shares, restricted share units, performance units, performance shares or other share-based incentive awards will count as 2.75 shares for purpose of the limits under the 2007 Plan.
Share options may be in the form of incentive share options, non-qualified share options and restorative options. Share options are required to have an exercise price that is not less than the market value on the date of grant. The Company is prohibited from repricing the options. The term of the share options cannot exceed seven years from the grant date. The plan provides for restorative options not to be issued prior to January 1, 2010.
With the closing of the Merger between PXRE and Argonaut Group in August 2007, all share-based compensation plans of the companies were frozen, resulting in no new grants being issued under these plans after the closing date of the Merger. All share-based payment awards outstanding as of the effective date of the Merger were converted into equivalent awards of Argo Group. Plans in effect prior to the Merger included the Argonaut Group, Inc. Amended and Restated Stock Incentive Plan, the Argonaut Group, Inc. Non-Employee Director Stock Option Plan, the PXRE Group Ltd. Incentive Bonus Compensation Plan, the PXRE Group Ltd. Director Equity and Deferred Compensation Plan and the PXRE Group Ltd. Director Stock Plan. Additionally, PXRE has awards outstanding resulting from the following plans that were no longer active: the Restated Employees Annual Incentive Plan (terminated in 2003), the 1992 Officer Incentive Plan and the 2002 Officer Plans. Pursuant to the Merger Agreement, non-vested stock awards and options to acquire shares of Argonaut Group common stock were converted into options to acquire a number of Company common shares equal to the exchange ratio under the Merger of 6.4840 shares of PXRE for each share of Argonaut Group (0.6484 shares of PXRE after adjustment for the effect of the 1-for-10 reverse stock split). Additionally, in accordance with the Merger Agreement, all share-based payment awards issued under the PXRE plans were adjusted for the 1-for-10 reverse stock split. Expenses under the former PXRE plan have been included in the results of operations from the closing date of the Merger through December 31, 2008.
F-36
Table of Contents
The fair value method of accounting is used for equity-based compensation plans. Under the fair value method, compensation cost is measured based on the fair value of the award at the measurement date and recognized over the requisite service period. The Company uses the Black-Scholes model to estimate the fair values on the measurement date for share options and SARs. The Black-Scholes model uses several assumptions to value a stock option. The volatility assumption is based on the historical change in the Company’s stock price over the previous five years preceding the measurement date. The risk-free rate of return assumption is based on the five-year U.S. Treasury constant maturity rate on the measurement date. The expected option life is based upon the average holding period over the history of the incentive plan. The dividend yield assumption is zero, as the Company has not made regular dividend payments on its common shares since November 2005. The following table summarizes the assumptions used by the Company for the years ended December 31, 2009, 2008 and 2007:
| 2009 | 2008 | 2007 | ||||
| Risk-free rate of return |
0.40% to 2.82% | 2.45% to 3.67% | 3.57% to 5.07% | |||
| Expected dividend yields |
0.00% | 0.00% | 0.00% | |||
| Expected option life (years) |
1.00 to 4.81 | 4.81 to 7.00 | 4.45 to 4.81 | |||
| Expected volatility |
29.9% to 50.8% | 24.9% to 35.0% | 40.6% to 43.4% |
The Company estimates forfeitures based on historical forfeitures patterns, thereby recognizing expense only for those awards that are expected to vest. The estimate of forfeitures is adjusted as actual forfeitures differ from the Company’s estimate, resulting in recognition of compensation expense only for those awards that actually vest.
The compensation expense recognized under the share-based payment plans were $7.3 million ($5.8 million, net of tax), $7.2 million ($5.3 million, net of tax) and $19.2 million ($12.5 million net of tax) for the years ended December 31, 2009, 2008 and 2007, respectively. Included in the compensation expense for the year ended December 31, 2007 was $10.2 million ($6.6 million net of tax) of expense resulting from the acceleration of the vesting of certain stock options and non-vested stock awards prior to the Merger. The compensation expense is included in “Underwriting, acquisition and insurance expenses” in the accompanying Consolidated Statements of Income.
The Company presents all tax benefits resulting from the exercise of stock options and vesting of non-vested shares as cash flows from financing activities. Excess tax benefits are realized tax benefits from tax deductions for exercised options and vested shares in excess of the deferred tax asset attributable to stock compensation costs for such options. For the years ended December 31, 2009 and 2008 the Company recorded $ 0.3 million and $0.2 million, respectively, of financing cash outflow and, conversely, $0.3 million and $0.2 million of operating cash inflow in the Consolidated Statement of Cash Flows, compared to $3.3 million of financing cash inflow and $3.3 million of operating cash outflow for the same period in 2007. The income tax benefit resulting from stock options exercises totaled $0.4 million for the year ended December 31, 2009 compared to an income tax provision of $0.2 million and a benefit of $3.1 million for the years ended December 31, 2008 and 2007, respectively.
Argo Group’s 2007 Long-Term Incentive Plan
A summary of option activity under the 2007 Plan as of December 31, 2009, and changes during the year is as follows:
| 2009 | |||||||||
| Shares |
Weighted- |
Weighted-Average |
Aggregate Intrinsic Value | ||||||
| Outstanding at beginning of the year |
561,788 | $36.18 | |||||||
| Granted |
10,000 | $26.43 | |||||||
| Exercised |
(1,292) | $35.23 | |||||||
| Expired or forfeited |
(77,461) | $35.78 | |||||||
| Outstanding at end of the year |
493,035 | $36.44 | 5.2 | $ | 27,100 | ||||
| Options vested or expected to vest as of year end |
284,824 | $36.19 | 5.2 | $ | 27,100 | ||||
| Exercisable at end of year |
174,475 | $36.57 | 5.0 | $ | 27,100 | ||||
F-37
Table of Contents
Options outstanding under this plan vest over a 12 to 60 month period, subject to continued employment. Cash received for the exercise of options under this plan was not material for the year ended December 31, 2009. Unamortized expense for these options was $3.2 million as of December 31, 2009. The weighted-average period over which this unrecognized expense is expected to be recognized is 2.2 years.
The aggregate intrinsic value is calculated as the difference between the exercise price of the underlying awards and the quoted price of the Company’s common stock for those options where the exercise price was below the quoted price at December 31, 2009.
The weighted-average grant date fair value of options granted during the years ended December 31, 2009 and 2008 were $5.35 and $11.87, respectively.
A summary of restricted share units’ activity under the 2007 Plan as of December 31, 2009, and changes during the year is as follows:
| 2009 | ||||
| Shares | Weighted-Average Grant Date Fair Value | |||
| Outstanding at beginning of the year |
146,358 | $37.95 | ||
| Granted |
23,142 | $31.38 | ||
| Vested and issued |
(38,602) | $36.37 | ||
| Expired or forfeited |
(36,443) | $38.11 | ||
| Outstanding at end of the year |
94,455 | $36.54 | ||
As of December 31, 2009, there was $2.7 million of total unrecognized compensation cost related to restricted share units compensation arrangements granted by the Company. The weighted-average period over which this unrecognized expense is expected to be recognized is 2.6 years. The total fair value of shares vested during the year ended December 31, 2008 was $1.4 million.
At December 31, 2009, the Company had issued and outstanding 249,552 stock-settled SARs, with a weighted average exercise price of $28.03 per share. The stock-settled SARs vest over a one to five year period. Upon exercise of the stock-settled SARs, the employee is entitled to receive shares of the Company’s common stock equal to the appreciation of the stock as compared to the exercise price. Expense of $0.2 million was recognized for the stock-settled SARs for the year ended December 31, 2009. As of December 31, 2009, there was $2.0 million of total unrecognized compensation cost related to stock-settled SARs granted by the Company. The weighted-average period over which this unrecognized expense is expected to be recognized is 3.0 years. Aggregate intrinsic value of the stock-settled SARs at December 31, 2009 was $0.3 million.
As of December 31, 2009, the Company had 300,203 cash-settled SARs issued and outstanding, with a weighted average exercise price of $27.99 per share. The cash-settled SARs vest over a one to four year period. Upon exercise of the cash-settled SARs, the employee is entitled to receive cash payment for the appreciation in the value of the Company’s common stock over the exercise price. The Company is accounting for the cash-settled SARs as liability awards. Expense recognized for the cash-settled SARs totaled $2.0 million for the year ended December 31, 2009. As of December 31, 2009, there was $1.4 million of total unrecognized compensation cost related to cash-settled SARs granted by the Company. The weighted-average period over which this unrecognized expense is expected to be recognized is 2.4 years. Aggregate intrinsic value of the cash-settled SARs at December 31, 2009 was $0.4 million.
Included in the total shares outstanding at December 31, 2009 are 288,203 cash-settled SARs and 186,552 stock-settled SARs whose vesting is contingent on the employee meeting defined performance conditions. Employees have a specified time period in which to meet the performance condition (typically one year) and forfeit the grant (on a pro rata basis) if the performance conditions are not met in the specified time frame. The Company evaluates the likelihood of the employee completing the performance condition and includes this estimate in the determination of the forfeiture factor for the grants.
F-38
Table of Contents
Employee Stock Purchase Plans
The Company maintains an employee stock purchase plan for eligible employees. Under this plan, shares of the Company’s common stock may be purchased over an offering period of three months at 85% of the lower of the fair value on the first day of the offering period or on the designated purchase date at the end of the offering period. Expense recognized under this plan was $0.2 million for each of the years ended December 31, 2009 and 2008. Expense recognized under this plan was not material for the year ended December 31, 2007.
Argo Group International Holdings Ltd. Deferred Compensation Plan for Non-Employee Directors
In February 2008, the Board of Directors approved the Argo Group International Holdings Ltd. Deferred Compensation Plan for Non-Employee Directors (“Directors Plan”), a non-funded and non-qualified deferred compensation plan. Under the Directors Plan, non-employee directors can elect each year to defer payment of 50% or 100% of their cash compensation payable during the next calendar year. During the time that the cash compensation amounts are deferred, such amounts are credited with interest earned at a rate two percent above the prime rate, to be re-set each May 1. In addition, the Directors Plan calls for the Company to grant a match equal to 75% of the cash compensation amounts deferred in the form of “Stock Units,” which provide directors with the economic equivalent of stock ownership and are credited as a bookkeeping entry to each director’s “Stock Unit Account.” Each Stock Unit is valued at the closing price of the Company’s common stock on the national exchange on which it is listed as of the date credited for all purposes under the Directors Plan and fluctuates daily thereafter on that same basis. The Directors Plan provides for a Stock Unit Account to be established for each non-employee director upon the effective date of the Directors Plan and with credit for an initial bookkeeping entry for 1,650 Stock Units. The Directors Plan was modified in November 2009, and cash compensation of $1.0 million was paid out for service rendered for the year ended December 31, 2009. Under the Directors Plan, the Company recorded compensation expense of $1.0 million and $1.5 million for the years ended December 31, 2009 and 2008, respectively.
Argonaut Group’s Amended and Restated Stock Incentive Plan
Argonaut Group’s Amended and Restated Stock Incentive Plan, as approved by the shareholders (the “Amended Plan”), provided for an aggregate of up to 6,250,000 shares of the Company’s common stock that may be issued to certain executives and other key employees. The stock awards were issued in the form of non-qualified stock options and non-vested stock. The stock awards issued under the Amended Plan may be time-vested or have performance measures which must be met in order for the awards to vest, and generally vest over a two-to-five year period. Grants under the Amended Plan have a legal life of seven to eleven years.
A summary of option activity under the Amended Plan as of December 31, 2009, and changes during the year is as follows:
| 2009 | |||||||||
| Shares |
Weighted- |
Weighted-Average |
Aggregate Intrinsic Value | ||||||
| Outstanding at beginning of the year |
886,749 | $34.56 | |||||||
| Granted |
- | $0.00 | |||||||
| Exercised |
(99,509) | $24.96 | |||||||
| Expired or forfeited |
(120,531) | $40.50 | |||||||
| Outstanding at end of the year |
666,709 | $34.92 | 2.9 | $ | 1,014,513 | ||||
| Options vested or expected to vest as of year end |
660,816 | $34.83 | 2.9 | $ | 1,014,513 | ||||
| Exercisable at end of year |
610,902 | $34.01 | 2.7 | $ | 1,014,513 | ||||
The aggregate intrinsic value is calculated as the difference between the exercise price of the underlying awards and the quoted price of the Company’s common stock for those options where the exercise price was below the quoted price at December 31, 2009. Total intrinsic value of options exercised during the years ended December 31, 2009, 2008 and 2007 were $0.9 million, $0.4 million and $11.0 million, respectively.
F-39
Table of Contents
For the year ended December 31, 2009, the Company received cash payments of $2.5 million (net of any related tax payments) related to the settlement of stock options exercised under the Amended Plan.
Under the Amended Plan, up to 1,250,000 shares (of the total shares authorized under the plan) may be issued as non-vested stock to officers and certain key employees. The shares vest in equal annual installments over a period of two to five years, subject to continued employment. The stock is not issued until the vesting requirements are met; therefore, participants in the plan are not entitled to any voting or dividend rights until the stock has been issued. A summary of the non-vested shares activity under the Amended Plan as of December 31, 2009, and changes during the year is as follows:
| 2009 | ||||
| Shares | Weighted-Average Grant Date Fair Value | |||
| Outstanding at beginning of the year |
89,864 | $48.90 | ||
| Granted |
- | $0.00 | ||
| Vested and issued |
(43,125) | $49.99 | ||
| Expired or forfeited |
(12,668) | $47.55 | ||
| Outstanding at end of the year |
34,071 | $48.02 | ||
As of December 31, 2009, there was $0.8 million of total unrecognized compensation cost related to non-vested stock compensation arrangements granted by the Company. The weighted-average period over which this unrecognized expense is expected to be recognized is 1.0 years. The total fair value of shares vested during the year ended December 31, 2009 was $2.1 million.
14. Segment Information
The Company is primarily engaged in writing property and casualty insurance and reinsurance. The Company has four ongoing reporting segments: Excess and Surplus Lines, Commercial Specialty, Reinsurance and International Specialty. Additionally, the Company has a Run-off Lines segment for products that it no longer writes.
The Company considers many factors, including the nature of each segment’s insurance and reinsurance products, production sources, distribution strategies and the regulatory environment, in determining how to aggregate reporting segments.
In evaluating the operating performance of its segments, the Company focuses on core underwriting and investing results before the consideration of realized gains or losses from the sales of investments. Realized investment and other (losses) gains are reported as a component of the Corporate and Other segment, as decisions regarding the acquisition and disposal of securities reside with the executive management of the Company and are not under the control of the individual business segments. Identifiable assets by segment are those assets used in the operation of each segment.
F-40
Table of Contents
Revenue and income (loss) before income taxes and extraordinary item for each segment for the years ended December 31 were as follows:
| (in millions) | 2009 | 2008 | 2007 | |||||||||
| Revenue: |
||||||||||||
| Earned premiums |
||||||||||||
| Excess and Surplus Lines |
$ | 537.0 | $ | 531.9 | $ | 542.6 | ||||||
| Commercial Specialty |
364.0 | 357.6 | 302.2 | |||||||||
| Reinsurance |
87.7 | 69.9 | 18.1 | |||||||||
| International Specialty |
424.1 | 183.4 | - | |||||||||
| Run-off Lines |
2.1 | (15.7 | ) | (3.1 | ) | |||||||
| Total earned premiums |
1,414.9 | 1,127.1 | 859.8 | |||||||||
| Net investment income |
||||||||||||
| Excess and Surplus Lines |
62.8 | 62.4 | 54.5 | |||||||||
| Commercial Specialty |
29.3 | 29.7 | 27.2 | |||||||||
| Reinsurance |
8.5 | 8.2 | 5.6 | |||||||||
| International Specialty |
11.5 | 10.6 | - | |||||||||
| Run-off Lines |
22.6 | 32.4 | 43.1 | |||||||||
| Corporate and Other |
10.8 | 6.9 | 3.9 | |||||||||
| Total net investment income |
145.5 | 150.2 | 134.3 | |||||||||
| Fee income, net |
1.1 | 7.2 | - | |||||||||
| Realized investment and other (losses) gains, net |
(16.7 | ) | (35.1 | ) | 5.9 | |||||||
| Total revenue |
$ | 1,544.8 | $ | 1,249.4 | $ | 1,000.0 | ||||||
| (in millions) | 2009 | 2008 | 2007 | |||||||||
| Income (loss) before income taxes and extraordinary item |
||||||||||||
| Excess and Surplus Lines |
$ | 64.7 | $ | 98.3 | $ | 112.7 | ||||||
| Commercial Specialty |
45.8 | 43.0 | 61.3 | |||||||||
| Reinsurance |
50.3 | 23.6 | 8.1 | |||||||||
| International Specialty |
24.1 | (5.2 | ) | - | ||||||||
| Run-off Lines |
6.4 | 9.0 | (6.9 | ) | ||||||||
| Total segment income before taxes and extraordinary item |
191.3 | 168.7 | 175.2 | |||||||||
| Corporate and Other |
(6.5 | ) | (17.3 | ) | (40.4 | ) | ||||||
| Interest expense |
(25.7 | ) | (29.9 | ) | (20.9 | ) | ||||||
| Realized investment and other (losses) gains, net |
(16.7 | ) | (35.1 | ) | 5.9 | |||||||
| Total income before income taxes and extraordinary item |
$ | 142.4 | $ | 86.4 | $ | 119.8 | ||||||
Included in Corporate and Other for the year ended December 31, 2007 was $19.8 million in expenses related to the entities acquired in the Merger and $10.2 million in compensation expense due to the acceleration of the vesting of certain share-based payment awards.
The following table represents identifiable assets as of December 31, 2009 and 2008:
| (in millions) | 2009 | 2008 | ||||
| Excess and Surplus Lines |
$ | 2,340.7 | $ | 2,286.4 | ||
| Commercial Specialty |
1,245.4 | 1,197.9 | ||||
| Reinsurance |
470.6 | 299.8 | ||||
| International Specialty |
1,858.2 | 1,614.7 | ||||
| Run-off Lines |
746.7 | 970.4 | ||||
| Corporate and Other |
235.2 | 12.3 | ||||
| Total |
$ | 6,896.8 | $ | 6,381.5 | ||
Included in the International Specialty segment at December 31, 2009 and 2008 are $884.2 million and $792.5 million, respectively, in assets associated with Trade Capital providers.
F-41
Table of Contents
The following table represents goodwill and intangible assets, net of accumulated amortization as of December 31, 2009 and 2008:
| Goodwill | Intangible Assets, Net of Accumulated Amortization | |||||||||||
| (in millions) | 2009 | 2008 | 2009 | 2008 | ||||||||
| Excess and Surplus Lines |
$ | 76.4 | $ | 76.4 | $ | 6.0 | $ | 6.8 | ||||
| Commercial Specialty |
47.1 | 46.4 | 6.9 | 7.7 | ||||||||
| International Specialty |
28.7 | 28.6 | 83.6 | 91.7 | ||||||||
| Total |
$ | 152.2 | $ | 151.4 | $ | 96.5 | $ | 106.2 | ||||
15. Run-off Lines
The Company has discontinued active underwriting of certain lines of business, including those lines that were previously recorded in Argonaut Group’s Risk Management segment and business previously written and classified by PXRE as property catastrophe and Lloyd’s. All current activity within these lines is related to the management of claims and other administrative functions. Also included in Run-off Lines are other liability reserves, which include exposure to claims for asbestos and environmental liabilities and medical malpractice policies, written in past years. The other liability reserves are often characterized by long elapsed periods between the occurrence of a claim and ultimate payment to resolve the claim. The Company utilizes a specialized staff dedicated to administer and settle these claims.
The following table presents the Company’s gross reserves for Run-off Lines as of December 31:
| (in millions) | 2009 | 2008 | ||||
| Asbestos and Environmental: |
||||||
| Reinsurance assumed |
$ | 83.1 | $ | 108.5 | ||
| Other |
39.6 | 34.8 | ||||
| Total Asbestos and Environmental |
122.7 | 143.3 | ||||
| Risk management |
367.3 | 397.7 | ||||
| PXRE run-off lines |
50.0 | 97.6 | ||||
| Other run-off lines |
12.6 | 16.0 | ||||
| Total Run-off Lines |
$ | 552.6 | $ | 654.6 | ||
F-42
Table of Contents
The Company has received asbestos and environmental liability claims arising from other liability coverage primarily written in the 1960s, 1970s and into the mid-1980s. Asbestos and environmental claims originate from policies directly written by the Company and from reinsurance assumed during this period, including a portion assumed from the London market. The following table represents the total gross reserves for the Company's asbestos exposure as of December 31:
| (in millions) | 2009 | 2008 | 2007 | ||||||
| Direct written |
|||||||||
| Case reserves |
$ | 23.5 | $ | 9.6 | $ | 11.5 | |||
| ULAE |
2.9 | 3.2 | 3.3 | ||||||
| IBNR |
9.6 | 16.7 | 19.1 | ||||||
| Total direct written reserves |
36.0 | 29.5 | 33.9 | ||||||
| Assumed domestic |
|||||||||
| Case reserves |
28.4 | 35.7 | 34.2 | ||||||
| ULAE |
4.3 | 4.5 | 5.4 | ||||||
| IBNR |
22.1 | 34.3 | 39.1 | ||||||
| Total assumed domestic reserves |
54.8 | 74.5 | 78.7 | ||||||
| Assumed London |
|||||||||
| Case reserves |
9.8 | 10.4 | 10.8 | ||||||
| ULAE |
1.2 | 1.4 | 1.5 | ||||||
| IBNR |
6.7 | 8.9 | 11.7 | ||||||
| Total assumed London reserves |
17.7 | 20.7 | 24.0 | ||||||
| Total asbestos reserves |
$ | 108.5 | $ | 124.7 | $ | 136.6 | |||
The following table presents the Company’s net underwriting results for Run-off Lines for the three years ended December 31:
| (in millions) | 2009 | 2008 | 2007 | |||||||||
| Asbestos and Environmental: |
||||||||||||
| Reinsurance assumed |
$ | (0.4 | ) | $ | (6.8 | ) | $ | (18.3 | ) | |||
| Other |
(6.1 | ) | 1.8 | (3.4 | ) | |||||||
| Total Asbestos and Environmental |
(6.5 | ) | (5.0 | ) | (21.7 | ) | ||||||
| Risk management |
(15.6 | ) | (12.2 | ) | (15.7 | ) | ||||||
| PXRE run-off lines |
6.0 | (5.6 | ) | (7.9 | ) | |||||||
| Other run-off lines |
- | - | (3.9 | ) | ||||||||
| Total Run-off Lines |
$ | (16.1 | ) | $ | (22.8 | ) | $ | (49.2 | ) | |||
Reserves for asbestos and environmental claims cannot be estimated with traditional loss reserving techniques that rely on historical accident year loss development factors. The uncertainty in the asbestos and environmental reserves estimates arises from several factors including lack of historical data, inapplicability of standard actuarial projection techniques, uncertainty with regards to claim costs, coverage interpretations, and the judicial, statutory and regulatory provisions under which the claims may be ultimately resolved. It is impossible to predict how the courts will interpret coverage issues and these resolutions may have a material impact on the ultimate resolution of the asbestos and environmental liabilities. The Company uses a variety of estimation methods to calculate reserves as a whole; however, reserves for asbestos and environmental claims were determined primarily based on the report year method with some weight applied to other methods. The report year method relies most heavily on the Company's historical claims and severity information. Other methods rely more heavily on industry information. Although management has recorded its best estimate of loss reserves utilizing internal and consulting actuaries, due to the uncertainties of estimation of liabilities that may arise as discussed herein, further deterioration of claims could occur in the future. The Company periodically engages an outside consulting actuary to perform an analysis on the Company's exposure. The consulting actuary provides its best estimate of ultimate losses and management evaluates that estimate in assessing the adequacy of the asbestos and environmental loss and loss adjustment expense reserves.
The Company completed an analysis in 2009 of loss and loss adjustment expense reserves related to its other liability lines which include asbestos and environmental claims during the third quarter of 2009. As a result of this analysis, the Run-off Lines segment recognized favorable loss reserve development on prior accident years of $1.6 million, which was primarily driven by $6.1 million unfavorable loss reserve development related to asbestos and environmental liability reserves, $3.0 million of unfavorable development in workers compensation lines due to the unwinding of the reserve discount, $7.6 million favorable development on legacy PXRE claims primarily related to non-catastrophe property lines and $3.2 million of favorable development related to PXRE’s 2005 hurricane losses.
F-43
Table of Contents
The Company completed an analysis in 2008 of loss and loss adjustment expense reserves related to its other liability lines which include asbestos and environmental claims during the third quarter of 2008. As a result of this analysis, the Run-off Lines segment recognized favorable loss reserve development on prior accident years of $14.2 million which included a $5.0 million net unfavorable loss reserve development on prior years related to asbestos and environmental liability reserves. In addition, the segment recognized $1.7 million of favorable loss reserve development in risk management lines, $12.5 million favorable loss reserve development for PXRE non-catastrophe property lines and $5.0 million favorable loss development related to PXRE’s 2005 hurricane losses.
The Company completed an analysis in 2007 of loss and loss adjustment expense reserves related to its other liability lines which include asbestos and environmental claims during the third quarter of 2007. As a result of this analysis, the Run-off Lines segment recognized unfavorable development on prior accident years of $23.0 million driven by a $28.8 million increase to other liability reserves, primarily asbestos and environmental, and $3.2 million favorable development in medical malpractice reserves. The Company’s run-off risk management business also experienced $10.4 million in favorable development in liability and automobile reserves as well as $7.0 million unfavorable development in workers compensation reserves. In addition, the segment had $0.8 million of unfavorable development primarily attributable to a write down of a ceded risk cover underwritten by PXRE.
16. Commitments and Contingencies
Between May 3, 2006 and June 16, 2006, several class action lawsuits were filed against PXRE Group Ltd. (now Argo Group) and certain former officers of PXRE on behalf of a putative class of plaintiffs consisting of investors who purchased PXRE securities traded on the NYSE under the ticker symbol “PXT” between September 11, 2005 and February 22, 2006. These lawsuits were consolidated into one proceeding before the United States District Court for the Southern District of New York and were the subject of an Amended Class Action Complaint filed on June 15, 2007 (the “Amended Complaint”). The Amended Complaint alleges that during the purported class period PXRE fraudulently understated the full impact of hurricanes Katrina, Rita and Wilma on PXRE’s business and that certain PXRE executives made a series of materially false and misleading statements or omissions about PXRE’s business, prospects and operations in violation of Sections 10(b) and 20(a) of the Securities Exchange Act of 1934, as amended (the “1934 Act”), and Rule 10b-5 promulgated under the 1934 Act. On March 4, 2009, the Amended Complaint was dismissed with prejudice by the District Court. On December 21, 2009 the District Court’s decision was affirmed on appeal to the United States Court of Appeals for the Second Circuit, and the class plaintiff’s petition for rehearing was denied by the Court of Appeals on January 11, 2010.
On December 4, 2008, a lawsuit was filed against PXRE., Argo Group and certain of PXRE’s former officers in United States District Court for the Southern District of New York alleging causes of action based on facts and circumstances on behalf of a group of institutional shareholders that purchased Series D Perpetual Non-voting Preferred Shares of PXRE pursuant to the Private Placement Memorandum dated on or about September 28, 2005, (the “Private Placement”). The lawsuit alleges that the Private Placement was a public offering and that the Private Placement Memorandum contained false and misleading statements or omissions concerning PXRE’s business, prospects and operations actionable under Section 12(a)(2) of the Securities Act of 1933. In addition, the lawsuit alleges claims under New York state law for negligent misrepresentation and common law fraud based upon, among other things, statements contained in the Private Placement Memorandum and alleged false and misleading statements by PXRE’s named former officers. On April 6, 2009, the institutional investors filed an amended complaint. The Company filed a motion to dismiss the amended complaint on May 6, 2009. On January 26, 2010 the District Court granted the Company’s motion, dismissing the plaintiffs’ federal law causes of action without prejudice, and holding that the amended complaint failed to allege facts that would show that the Private Placement could be construed to be a public offering or that the Private Placement should be integrated with PXRE’s public share offering. The Court’s order provided the plaintiffs with a deadline of February 22, 2010 to file amended pleadings setting forth the nature of the entities to which the Private Placement was offered. Based on the dismissal of the federal law claims, the Court’s order also dismissed without prejudice all state law claims asserted by the plaintiffs for lack of subject matter jurisdiction, without prejudice to the plaintiffs’ right to file a separate action in state court asserting such claims. On February 22, 2010 the plaintiffs filed a Second Amended Complaint in the District Court case seeking to overcome the deficiencies outlined in the order of dismissal. The Company does not believe that the Second Amended Complaint is sufficient to comply with the relevant legal standard, and plans to file a Motion to Dismiss accordingly.
F-44
Table of Contents
Although the Company has received no notice of any other potential lawsuits or other proceedings relating to the alleged facts and circumstances described above, it is possible that the Company could be the subject of additional litigation or regulatory inquiries regarding such matters in the future.
At this stage, the Company is unable to determine with any reasonable certainty the specific claims, litigants, or alleged damages that ultimately may be associated with the pending securities litigation, Private Placement lawsuit or any other future proceedings regarding the alleged facts and circumstances described above, nor can the Company currently predict the timing of any rulings, trials or other significant events relating to such proceedings. Given these limitations and the inherent difficulty of projecting the outcome of litigated disputes, the Company is unable to reasonably estimate the possible loss, range of loss or legal costs that are likely to arise out of the pending securities litigation or any future proceedings relating to the above matters at this time. The Company has insurance protection that may cover a portion of any potential loss or legal costs, but a settlement above the coverage limits could impact the Company’s financial position.
Based on all information available to the Company at this time, management of the Company believes that PXRE’s reserving practices, financial disclosures, public filings and securities offerings in the aftermath of the 2005 hurricanes complied fully with all applicable regulatory and legal requirements. However, if unfavorable outcomes in the class action litigation or Private Placement lawsuit were to occur and result in the payment of substantial damages or fines or criminal penalties, these outcomes could have a material adverse effect on the Company’s business, cash flows, results of operations, financial position and prospects.
The subsidiaries of the Company are parties to other legal actions incidental to their business. Based on the advice of counsel, management of the Company believes that the resolution of these matters will not materially affect the Company’s financial condition or results of operations.
17. Leases
The Company has entered into a fifteen-year capital lease agreement for the home office of one of its U.S. subsidiaries. Under the terms of this lease, the Company has the option to purchase the property at any time during the lease for a scheduled price equal to all of the remaining fixed payments discounted at 8.5%, including a required payment of $2.5 million at the end of the lease term. If the Company fails to exercise such option, the lessor may require the Company to purchase the property for $2.5 million at the conclusion of the lease. For financial reporting purposes, the lease asset has been recorded in other assets, net of depreciation and in other liabilities at its present value using a discount rate of 8.5%. At December 31, 2009, the future minimum rental payments required under this lease are as follows:
| (in millions) | Amount Due | ||
| 2010 |
$ | 0.7 | |
| 2011 |
0.7 | ||
| 2012 |
2.5 | ||
| Total |
$ | 3.9 | |
The Company leases additional office space and equipment under lease agreements that expire at various intervals and are subject to renewal options at market rates prevailing at the time of renewal. At December 31, 2009, the future minimum payments under non-cancelable operating leases are as follows:
| (in millions) | Amount Due | ||
| 2010 |
$ | 10.1 | |
| 2011 |
8.7 | ||
| 2012 |
5.4 | ||
| 2013 |
3.5 | ||
| 2014 |
2.2 | ||
| Thereafter |
8.3 | ||
| Total |
$ | 38.2 | |
F-45
Table of Contents
18. Statutory Accounting Principles
As an insurance holding company, the Company is largely dependent on dividends and other permitted payments from its insurance and reinsurance subsidiaries to pay cash dividends to its shareholders, for debt service and for its operating expenses. The ability of the Company’s insurance and reinsurance subsidiaries to pay dividends to the Company is subject to certain restrictions imposed by the jurisdictions of domicile that regulate the Company’s insurance and reinsurance subsidiaries and each jurisdiction has calculations for the amount of dividends that an insurance and reinsurance company can pay without the approval of the insurance regulator.
The Company’s insurance and reinsurance subsidiaries file financial statements prepared in accordance with statutory accounting principles prescribed or permitted by insurance regulatory authorities of the state in which they are domiciled. The differences between statutory-based financial statements and financial statements prepared in accordance with GAAP vary between jurisdictions. The principal differences are that for statutory-based financial statements, deferred policy acquisition costs are not recognized, a portion of the deferred federal income tax assets is recorded, bonds are generally carried at amortized cost, certain assets are non-admitted and charged directly to surplus, a liability for a provision for reinsurance is recorded and charged directly to surplus, and outstanding losses and unearned premium are presented net of reinsurance.
The payment of dividends by Argo Re is limited under the Insurance Act 1978, amendments thereto and Related Regulations of Bermuda (collectively, the “Insurance Act”). Argo Re is prohibited from declaring or paying any dividends during any financial year it is in breach of its minimum solvency margin or minimum liquidity ratio or if the declaration or payment of such dividends would cause it to fail to meet such margin or ratio. As of December 31, 2009, Argo Re’s solvency and liquidity margins and statutory capital and surplus were in excess of the minimum levels required by the Insurance Act. As of December 31, 2009, the unaudited statutory capital and surplus of Argo Re was estimated to be $1,269.2 million and the amount required to be maintained was estimated to be $239.9 million. The unaudited statutory net income was estimated to be $194.7 million. As of December 31, 2009, Argo Re’s total investments in subsidiaries and amounts due from its parent company, Argo Group, in its statutory balance sheet were approximately $766.4 million.
As an intermediate insurance and reinsurance holding company, Argo Group US is largely dependent on dividends and other permitted payments from its insurance and reinsurance subsidiaries to service its debt, to fund operating expenses and to pay dividends to Argo Financial Holding (Ireland) Limited. The statutory policyholders' surplus and net income for the years ended December 31, 2009, 2008, and 2007, of Argo Group US’s principal insurance and reinsurance subsidiaries, Argonaut Insurance Company, Colony Insurance Company, Rockwood Casualty Insurance Company and PXRE Reinsurance Company included in those companies' respective filings with regulatory authorities are as follows:
| (in millions) | 2009 | 2008 | 2007(1) | ||||||
| (unaudited) | (unaudited) | (audited) | |||||||
| Net income |
$ | 123.9 | $ | 56.8 | $ | 109.4 | |||
| Surplus |
$ | 705.2 | $ | 761.7 | $ | 947.0 | |||
| (1) | Results of PXRE Reinsurance Company are included for December 31, 2007 only. |
Various state insurance laws restrict the amount that may be transferred to Argo Group US from its subsidiaries in the form of dividends without prior approval of regulatory authorities. In addition, that portion of the insurance subsidiaries' net equity that results from the difference between statutory insurance principles and GAAP would not be available for dividends.
In June of 2009, Colony Insurance Company and Rockwood Casualty Insurance Company each paid its sole shareholder Argo Group US, an extraordinary dividend of $90.0 million and $15.0 million respectively.
On December 31, 2008, Argonaut Insurance Company made an extraordinary dividend of its holdings in Rockwood Casualty Insurance Company, an affiliate, and its subsidiaries, to its sole shareholder, Argo Group US, valued at approximately $100.5 million. Argonaut Insurance Company also dividended certain fixed assets held by its subsidiary, Argonaut Group Inc. Properties, to Argo Group US, valued at approximately $21.6 million; however, such fixed assets had been non-admitted on a statutory basis by Argonaut Insurance Company. Upon closing of the sale of PXRE Reinsurance Company on March 31, 2008, Argo Group US was paid a dividend from PXRE Reinsurance Company in the amount of $75.0 million.
F-46
Table of Contents
On December 28, 2007, Argonaut Insurance Company paid its sole shareholder, Argo Group US, an ordinary dividend of $46.0 million, and also on December 28, 2007, after receiving approval from the Virginia Bureau of Insurance, Colony Insurance Company paid its sole shareholder, Argo Group US, an extraordinary dividend of $28.5 million.
Argonaut Insurance Company is a direct subsidiary of Argo Group US and is regulated by the Illinois Division of Insurance. During 2010, based on the state of domicile’s ordinary dividend calculation, Argonaut Insurance Company may be permitted to pay dividends of up to $56.8 million without approval from the Illinois Division of Insurance. Colony Insurance Company, a direct subsidiary of Argo Group US, is regulated by the Virginia Bureau of Insurance. Colony Insurance Company may be permitted to pay dividends of up to $36.8 million in cash without approval from the Virginia Department of Insurance. Rockwood Casualty Insurance Company, a direct subsidiary of Argo Group US, is regulated by the Pennsylvania Department of Insurance. Rockwood Casualty Insurance Company may be permitted to pay dividends of up to $15.6 million in cash without approval from the Pennsylvania Department of Insurance. Each department of insurance may require prior approval for the payment of all dividends, based on business and regulatory conditions of the insurance companies.
19. Disclosures about Fair Value of Financial Instruments
Cash. The carrying amount approximates fair value.
Investment securities and short-term investments. See Note 3, “Investments” for additional information.
Premiums receivable and reinsurance recoverables on paid losses. The carrying value of current receivables approximates fair value. At December 31, 2009 and 2008, the carrying values of premiums receivable over 90 days were $20.5 million and $11.0 million, respectively. Included in “Reinsurance recoverables” in the Consolidated Balance Sheets at December 31, 2009 and 2008, are amounts that are due from third party trade reinsurers associated with the operations of Argo International. Upon settlement, the receivable is offset against the liability also reflected in the accompanying Consolidated Balance Sheets. At December 31, 2009 and 2008, the payable was in excess of the receivable. Of the Company’s paid losses on reinsurance recoverable balances, excluding amounts attributable to Argo International’s third party trade reinsurers, at December 31, 2009 and 2008, the carrying values over 90 days were $16.9 million and $23.5 million, respectively. The Company’s methodology for establishing its allowances for doubtful accounts includes specifically identifying all potential uncollectible balances regardless of aging. Any of the over 90 day balances, where collectibility was deemed questionable, have been included in the allowances. At December 31, 2009 and 2008, the allowance for doubtful accounts for premiums receivable was $4.9 million and $6.6 million, respectively, and the allowance for doubtful accounts for reinsurance recoverables on paid losses was $5.8 million and $5.5 million, respectively. As of December 31, 2009 and 2008, premiums receivable over 90 days were secured by collateral in the amount of $0 and $0.6 million, respectively, and reinsurance recoverables on paid losses over 90 days were secured by collateral in the amount of $0.8 million and $1.0 million, respectively. The carrying value of aged receivables, net of allowances for doubtful accounts and collateral security, also approximates fair value due to the short duration of the expected turnover period.
Revolving credit facility. The Company’s outstanding balance under its revolving credit facility at December 31, 2009 and 2008 was $0 and $50.0 million, respectively (see Note 8, “Other Indebtedness”). The carrying amount of the borrowing approximates fair value. The interest rate on the revolving credit facility is reset every 30, 60, 90, or 180 days when there is a balance outstanding, depending on the term of the borrowing. Accrued interest generally becomes due and payable at each reset date.
Long-term debt. At December 31, 2009 and 2008, the fair value of the Company’s Junior Subordinated Debentures was estimated using quoted prices from external sources based on current market conditions.
Floating rate loan stock. At December 31, 2009 and 2008, the fair value of Argo International’s floating rate loan stock was estimated using quoted prices from external sources based on current market conditions.
F-47
Table of Contents
A summary of the Company’s financial instruments whose carrying value did not equal fair value at December 31, 2009 and 2008 is shown below:
| December 31, 2009 | December 31, 2008 | |||||||||||
| (in millions) | Carrying Amount |
Fair Value |
Carrying Amount |
Fair Value | ||||||||
| Junior subordinated debentures |
$ | 311.4 | $ | 190.9 | $ | 311.4 | $ | 217.9 | ||||
| Floating rate loan stock |
69.2 | 32.8 | 67.3 | 47.7 | ||||||||
| $ | 380.6 | $ | 223.7 | $ | 378.7 | $ | 265.6 | |||||
| 20. | Insurance Assessments |
The Company participates in statutorily created insolvency guarantee and weather-related loss protection associations in all states where it is authorized to transact business. These associations were formed for the purpose of paying the claims of insolvent companies. The Company is assessed its pro-rata share of such claims based upon its premium writings, subject to a maximum annual assessment per line of insurance. Certain of these assessments can be recovered through premium tax offsets or policy surcharges. The Company does not believe that assessments on current insolvencies will have a material impact on its financial condition or results of operations. The Company has accrued assessments of $11.2 million and $11.1 million at December 31, 2009 and 2008, respectively.
| 21. | Quarterly Financial Data — Unaudited |
The following tables represent unaudited quarterly financial data for the years ended December 31, 2009 and 2008. In the opinion of management, all adjustments necessary to present fairly the results of operations for such periods have been made. Total revenue, net income (loss) before income taxes and net income (loss) include realized gains or losses on the sale of investments. The Company cannot anticipate when or if similar gains or losses may occur in the future. Since financial results rely heavily on estimates, caution should be used in drawing specific conclusions from quarterly consolidated results. The quarterly financial data for the year ended December 31, 2008 includes the results of Argo International beginning on June 1, 2008.
| Three Months Ended | ||||||||||||
| (in millions, except per share amounts) | March 31 | June 30 | Sept. 30 | Dec. 31 | ||||||||
| 2009 |
||||||||||||
| Total revenue |
$ | 370.7 | $ | 402.6 | $ | 380.5 | $ | 391.0 | ||||
| Net income before income taxes |
31.4 | 22.5 | 37.4 | 51.1 | ||||||||
| Net income |
27.0 | 21.9 | 27.6 | 41.0 | ||||||||
| Net income per common share |
||||||||||||
| Basic* |
$ | 0.88 | $ | 0.71 | $ | 0.89 | $ | 1.33 | ||||
| Diluted* |
$ | 0.88 | $ | 0.71 | $ | 0.89 | $ | 1.33 | ||||
| Comprehensive income |
29.0 | 73.0 | 111.4 | 40.2 | ||||||||
F-48
Table of Contents
| Three Months Ended | ||||||||||||||
| (in millions, except per share amounts) | March 31 | June 30 | Sept. 30 | Dec. 31 | ||||||||||
| 2008 |
||||||||||||||
| Total revenue |
$ | 258.1 | $ | 297.2 | $ | 347.7 | $ | 346.4 | ||||||
| Net income (loss) before income taxes |
41.3 | 29.6 | (6.4 | ) | 21.9 | |||||||||
| Net income (loss) |
36.9 | 23.0 | (8.8 | ) | 11.8 | |||||||||
| Net income (loss) per common share |
||||||||||||||
| Basic* |
$ | 1.20 | $ | 0.75 | $ | (0.29 | ) | $ | 0.39 | |||||
| Diluted* |
1.20 | 0.75 | (0.29 | ) | 0.38 | |||||||||
| Comprehensive income (loss) |
37.0 | (18.2 | ) | (54.5 | ) | 0.8 | ||||||||
*Basic and diluted net income (loss) per common share are computed independently for each quarter and full year based on the respective average number of common shares outstanding; therefore, the sum of the quarterly net income (loss) per common share data may not equal the net income (loss) per common share for the year.
“Total revenue” for each quarter presented in the tables will not agree to “Total revenue” in the Company’s quarterly reports on Form 10-Q previously filed. At December 31, 2009, the Company elected to present fee income net of the related expenses. The expenses related to the generation of fee income were previously included in the “Interest expense and other” line item in the Consolidated Statements of Income.
F-49
Table of Contents
ARGO GROUP INTERNATIONAL HOLDINGS, LTD.
SCHEDULE II
CONDENSED FINANCIAL INFORMATION OF REGISTRANT
(in millions)
| BALANCE SHEETS | December 31, | |||||||||||
| 2009 | 2008 | |||||||||||
| Assets |
||||||||||||
| Short-term investments |
$ | 2.0 | $ | 1.8 | ||||||||
| Cash |
- | 0.4 | ||||||||||
| Investment in subsidiaries |
1,706.7 | 1,429.4 | ||||||||||
| Other assets |
4.8 | 3.8 | ||||||||||
| Total assets | $ | 1,713.5 | $ | 1,435.4 | ||||||||
| Liabilities and Shareholders’ Equity |
||||||||||||
| Junior subordinated debentures |
$ | 64.4 | $ | 64.4 | ||||||||
| Due to subsidiaries |
27.8 | 12.9 | ||||||||||
| Accrued underwriting expense |
6.0 | 4.6 | ||||||||||
| Other liabilities |
0.4 | 0.6 | ||||||||||
| Total liabilities | 98.6 | 82.5 | ||||||||||
| Shareholders’ equity |
1,614.9 | 1,352.9 | ||||||||||
| Total liabilities and shareholders’ equity | $ | 1,713.5 | $ | 1,435.4 | ||||||||
| STATEMENTS OF INCOME | For the Years Ended December 31, | |||||||||||
| 2009 | 2008 | 2007 (1) | ||||||||||
| Net investment income (loss) |
$ | (1.7 | ) | $ | (0.9 | ) | $ | 0.3 | ||||
| Expenses: |
||||||||||||
| Interest Expense |
3.9 | 5.2 | 2.2 | |||||||||
| Other expenses |
15.2 | 19.9 | 10.6 | |||||||||
| Total operating expenses |
19.1 | 25.1 | 12.8 | |||||||||
| Net loss before equity in earnings of subsidiaries (2) |
(20.8 | ) | (26.0 | ) | (12.5 | ) | ||||||
| Equity in undistributed earnings of subsidiaries |
138.3 | 88.9 | 90.0 | |||||||||
| Income before extraordinary item |
117.5 | 62.9 | 77.5 | |||||||||
| Extraordinary item |
- | - | 66.3 | |||||||||
| Net income |
$ | 117.5 | $ | 62.9 | $ | 143.8 | ||||||
| (1) | Net income for 2007 consists of net loss before equity in earnings of subsidiaries for Argo Group International Holdings, Ltd. for the period from the Merger date of August 7, 2007 through December 31, 2007, and equity in undistributed earnings of Argonaut Group subsidiaries for the twelve month period plus equity in undistributed earnings in PXRE subsidiaries for the period from the Merger date of August 7, 2007 through December 31, 2007. |
| (2) | Argo Group International Holdings, Ltd. is not subject to U.S. taxation. |
F-50
Table of Contents
ARGO GROUP INTERNATIONAL HOLDINGS, LTD.
SCHEDULE II
CONDENSED FINANCIAL INFORMATION OF REGISTRANT
(in millions)
| STATEMENTS OF CASH FLOWS | For the Years Ended December 31, | |||||||||||
| 2009 | 2008 | 2007 (1) | ||||||||||
| Cash flows from operating activities: |
||||||||||||
| Net income |
$ | 117.5 | $ | 62.9 | $ | 143.8 | ||||||
| Adjustments to reconcile net income to net cash used by operating activities: |
||||||||||||
| Amortization and depreciation |
0.5 | 0.4 | - | |||||||||
| Share-based payments expense |
3.0 | 1.3 | 0.1 | |||||||||
| Extraordinary gain due to merger |
- | - | (66.3 | ) | ||||||||
| Undistributed earnings in subsidiaries |
(138.3 | ) | (88.9 | ) | (90.0 | ) | ||||||
| Change in: |
||||||||||||
| Prepaid assets |
(0.2 | ) | 0.4 | (1.4 | ) | |||||||
| Accrued underwriting expense |
- | 0.8 | (4.4 | ) | ||||||||
| Due to subsidiaries |
14.9 | (1.5 | ) | 2.1 | ||||||||
| Other, net |
0.1 | (0.3 | ) | 0.1 | ||||||||
| Cash used by operating activities |
(2.5 | ) | (24.9 | ) | (16.0 | ) | ||||||
| Cash flows from investing activities: |
||||||||||||
| Change in short-term investments |
(0.2 | ) | 23.4 | (25.2 | ) | |||||||
| Purchases of fixed assets |
(0.8 | ) | (0.1 | ) | - | |||||||
| Net distribution from subsidiaries |
- | - | 40.0 | |||||||||
| Cash (used) provided by investing activities |
(1.0 | ) | 23.3 | 14.8 | ||||||||
| Cash flows from financing activities: |
||||||||||||
| Activity under stock incentive plans |
3.1 | 1.8 | 1.1 | |||||||||
| Cash provided by financing activities |
3.1 | 1.8 | 1.1 | |||||||||
| Change in cash |
(0.4 | ) | 0.2 | (0.1 | ) | |||||||
| Cash, beginning of period |
0.4 | 0.2 | 0.3 | |||||||||
| Cash, end of period |
$ | - | $ | 0.4 | $ | 0.2 | ||||||
(1) Cash flows for 2007 represents cash flows for Argo Group International Holdings, Ltd. for the period from the Merger date of August 7, 2007 through December 31, 2007.
F-51
Table of Contents
ARGO GROUP INTERNATIONAL HOLDINGS, LTD.
SCHEDULE III
SUPPLEMENTARY INSURANCE INFORMATION
For the Years Ended December 31, 2009, 2008, and 2007
(in millions)
| Segment | DAC (a) |
Future (b) |
UPR (c) |
Premium (d) |
Net Invest. (e) (l) |
Loss & LAE (f) |
Amortization (g) (2) |
Other Insur. Exp (h) (3) |
Premiums (i) | ||||||||||||||||||
| Year Ended December 31, 2009 |
|||||||||||||||||||||||||||
| Excess and Surplus Lines |
$ | 65.7 | $ | 1,359.6 | $ | 293.1 | $ | 537.0 | $ | 62.8 | $ | 355.0 | $ | (1.2) | $ | 181.3 | $ | 529.8 | |||||||||
| Commercial Specialty |
33.5 | 605.4 | 190.6 | 364.0 | 29.3 | 239.9 | 0.3 | 107.7 | 358.8 | ||||||||||||||||||
| Reinsurance |
2.1 | 76.0 | 54.7 | 87.7 | 8.5 | 15.4 | 1.0 | 29.5 | 98.9 | ||||||||||||||||||
| International Specialty |
84.4 | 609.6 | 263.0 | 424.1 | 11.5 | 244.4 | (9.8) | 171.7 | 432.0 | ||||||||||||||||||
| Run-off Lines |
- | 552.6 | 2.2 | 2.1 | 22.6 | (1.6) | - | 19.9 | 1.9 | ||||||||||||||||||
| Corporate and Other |
- | - | - | - | 10.8 | - | - | 17.5 | - | ||||||||||||||||||
| $ | 185.7 | $ | 3,203.2 | $ | 803.6 | $ | 1,414.9 | $ | 145.5 | $ | 853.1 | $ | (9.7) | $ | 527.6 | $ | 1,421.4 | ||||||||||
| Year Ended December 31, 2008 |
|||||||||||||||||||||||||||
| Excess and Surplus Lines |
$ | 64.5 | $ | 1,257.7 | $ | 304.0 | $ | 531.9 | $ | 62.4 | $ | 320.2 | $ | (3.4) | $ | 179.2 | $ | 550.3 | |||||||||
| Commercial Specialty |
33.8 | 574.8 | 196.6 | 357.6 | 29.7 | 243.1 | (4.1) | 105.9 | 379.8 | ||||||||||||||||||
| Reinsurance |
3.1 | 59.8 | 32.8 | 69.9 | 8.2 | 33.0 | (1.9) | 23.4 | 82.6 | ||||||||||||||||||
| International Specialty |
76.8 | 449.7 | 270.0 | 183.4 | 10.6 | 142.8 | (9.0) | 72.0 | 155.2 | ||||||||||||||||||
| Run-off Lines |
- | 654.6 | 4.2 | (15.7) | 32.4 | (14.2) | - | 21.3 | (16.9) | ||||||||||||||||||
| Corporate and Other |
- | - | - | - | 6.9 | - | - | 23.7 | - | ||||||||||||||||||
| $ | 178.2 | $ | 2,996.6 | $ | 807.6 | $ | 1,127.1 | $ | 150.2 | $ | 724.9 | $ | (18.4) | $ | 425.5 | $ | 1,151.0 | ||||||||||
| Year Ended December 31, 2007 |
|||||||||||||||||||||||||||
| Excess and Surplus Lines |
$ | 61.1 | $ | 1,084.7 | $ | 318.7 | $ | 542.6 | $ | 54.5 | $ | 311.8 | $ | (0.1) | $ | 172.7 | $ | 533.5 | |||||||||
| Commercial Specialty |
29.7 | 481.7 | 169.5 | 302.2 | 27.2 | 182.2 | 0.7 | 85.2 | 303.1 | ||||||||||||||||||
| Reinsurance |
1.2 | 17.3 | 14.1 | 18.1 | 5.6 | 9.8 | (0.4) | 6.2 | 19.0 | ||||||||||||||||||
| Run-off Lines |
- | 841.8 | 4.5 | (3.1) | 43.1 | 23.1 | - | 23.0 | (1.4) | ||||||||||||||||||
| Corporate and Other |
- | - | - | - | 3.9 | - | - | 40.8 | - | ||||||||||||||||||
| $ | 92.0 | $ | 2,425.5 | $ | 506.8 | $ | 859.8 | $ | 134.3 | $ | 526.9 | $ | 0.2 | $ | 327.9 | $ | 854.2 | ||||||||||
F-52
Table of Contents
ARGO GROUP INTERNATIONAL HOLDINGS, LTD.
SCHEDULE V
VALUATION AND QUALIFYING ACCOUNTS
(in millions)
| Balance at Beginning of Period |
Charged to Cost and Expense |
Capital Loss Carryforward |
Net Operating Loss Carryforward |
Charged to Other Accounts |
Deductions | Balance at End of Period | ||||||||||||||||
| Year ended December 31, 2009 |
||||||||||||||||||||||
| Deducted from assets: |
||||||||||||||||||||||
| Valuation allowance for deferred tax asset |
$ | 47.0 | $ | (1.0) | $ | 2.5 | $ | 1.0 | $ | - | $ | - | $ | 49.5 | ||||||||
| Year ended December 31, 2008 |
||||||||||||||||||||||
| Deducted from assets: |
||||||||||||||||||||||
| Valuation allowance for deferred tax asset |
$ | 18.8 | $ | - | $ | 32.1 | $ | - | $ | - | $ | 3.9 | $ | 47.0 | ||||||||
| Year ended December 31, 2007 |
||||||||||||||||||||||
| Deducted from assets: |
||||||||||||||||||||||
| Valuation allowance for deferred tax asset |
$ | - | $ | 49.3 | $ | - | $ | - | $ | - | $ | 30.5 | (1) | $ | 18.8 | |||||||
| (1) | The deduction is attributable to PXRE Reinsurance Company deferred tax balances that are excluded subject to the accounting guidance for the impairment or disposal of long-lived assets. |
F-53
Table of Contents
ARGO GROUP INTERNATIONAL HOLDINGS, LTD.
SCHEDULE VI
SUPPLEMENTARY INFORMATION FOR PROPERTY-CASUALTY INSURANCE COMPANIES
(in millions)
| For the Years Ended December 31, | |||||||||
| 2009 | 2008 | 2007 | |||||||
| Deferred acquisition costs |
$ | 185.7 | $ | 178.2 | $ | 92.0 | |||
| Reserves for losses and loss adjustment expenses (1) |
$ | 3,203.2 | $ | 2,996.6 | $ | 2,425.5 | |||
| Unamortized discount in reserves for losses |
$ | 23.5 | $ | 25.3 | $ | 40.0 | |||
| Unearned premiums |
$ | 803.6 | $ | 807.6 | $ | 506.8 | |||
| Premiums earned |
$ | 1,414.9 | $ | 1,127.1 | $ | 859.8 | |||
| Net investment income |
$ | 145.5 | $ | 150.2 | $ | 134.3 | |||
| Losses and loss adjustment expenses incurred: |
|||||||||
| Current year |
$ | 859.4 | $ | 786.1 | $ | 557.2 | |||
| Prior years |
$ | (6.3) | $ | (61.2) | $ | (30.3) | |||
| Amortization (deferral) of policy acquisition costs (2) |
$ | (9.7) | $ | (18.4) | $ | 0.2 | |||
| Paid losses and loss adjustment expenses, net of reinsurance |
$ | 785.7 | $ | 667.0 | $ | 459.8 | |||
| Gross premiums written |
$ | 1,988.9 | $ | 1,601.5 | $ | 1,180.9 | |||
| (1) | Excludes PXRE Reinsurance Company’s reserves for losses and loss adjustment expenses of $135.7 million, which is a component of “Liabilities held for sale” in the Consolidated Balance Sheet at December 31, 2007. |
| (2) | Deferred acquisition costs (“DAC”) were acquired in the Merger and in the acquisition of Argo International. See Note 1, “Business and Significant Accounting Policies” for further discussion regarding Argo International’s DAC balance. The amortization (deferral) of DAC will not equal the change in the balance sheet. |
F-54