Attached files
| file | filename |
|---|---|
| EX-31.1 - EXHIBIT 31.1 - CONVERSANT, INC. | a2196829zex-31_1.htm |
| EX-32.1 - EXHIBIT 32.1 - CONVERSANT, INC. | a2196829zex-32_1.htm |
| EX-31.2 - EXHIBIT 31.2 - CONVERSANT, INC. | a2196829zex-31_2.htm |
| EX-23.1 - EXHIBIT 23.1 - CONVERSANT, INC. | a2196829zex-23_1.htm |
| EX-21.1 - EXHIBIT 21.1 - CONVERSANT, INC. | a2196829zex-21_1.htm |
UNITED STATES
SECURITIES AND EXCHANGE COMMISSION
Washington, D.C. 20549
FORM 10-K
| (Mark One) | ||
ý |
ANNUAL REPORT PURSUANT TO SECTION 13 OR 15(d) OF THE SECURITIES EXCHANGE ACT OF 1934 |
|
For the Year Ended December 31, 2009 |
||
or |
||
o |
TRANSITION REPORT PURSUANT TO SECTION 13 OR 15(d) OF THE SECURITIES EXCHANGE ACT OF 1934 |
|
For the transition period from to |
||
Commission file number 000-30135
VALUECLICK, INC.
(Exact name of registrant as specified in its charter)
| Delaware (State or Other Jurisdiction of Incorporation or Organization) |
77-0495335 (I.R.S. Employer Identification No.) |
|
30699 RUSSELL RANCH ROAD, SUITE 250 WESTLAKE VILLAGE, CALIFORNIA 91362 (Address of principal executive offices, including zip code) |
||
Registrant's Telephone Number, Including Area Code: (818) 575-4500 |
||
Securities registered pursuant to Section 12(b) of the Act: |
||
| |
Title of each class | Name of each exchange on which registered | |
|||
|---|---|---|---|---|---|---|
| Common Stock, $0.001 par value | NASDAQ Global Select Market |
Securities registered pursuant to Section 12(g) of the Act:
Series A Junior Participating Preferred Stock Purchase Rights
Indicate by check mark if the registrant is a well-known seasoned issuer, as defined in Rule 405 of the Securities Act. Yes ý No o
Indicate by check mark if the registrant is not required to file reports pursuant to Section 13 or 15(d) of the Act. Yes o No ý
Indicate by check mark whether the registrant: (1) has filed all reports required to be filed by Section 13 or 15(d) of the Securities Exchange Act of 1934 during the preceding 12 months (or for such shorter period that the registrant was required to file such reports), and (2) has been subject to such filing requirements for the past 90 days. Yes ý No o
Indicate by check mark if disclosure of delinquent filers pursuant to Item 405 of Regulation S-K is not contained herein, and will not be contained, to the best of registrant's knowledge, in definitive proxy or information statements incorporated by reference in Part III of this Form 10-K or any amendment to this Form 10-K. o
Indicate by check mark whether the registrant has submitted electronically and posted on its corporate Web site, if any, every Interactive Data File required to be submitted and posted pursuant to Rule 405 of Regulation S-T (§232.405 of this chapter) during the preceding 12 months (or for such shorter period that the registrant was required to submit and post such files): Yes o No o
Indicate by check mark whether the registrant is a large accelerated filer, an accelerated filer, a non-accelerated filer, or a smaller reporting company. See definitions of "large accelerated filer," "accelerated filer" and "smaller reporting company" in Rule 12b-2 of the Exchange Act. (Check one):
| Large accelerated filer ý | Accelerated filer o | Non-accelerated filer o (Do not check if a smaller reporting company) |
Smaller reporting company o |
Indicate by check mark whether the registrant is a shell company (as defined in Rule 12b-2 of the Exchange Act). Yes o No ý
As of June 30, 2009, which was the last business day of the registrant's most recently completed second fiscal quarter, the approximate aggregate market value of voting stock held by non-affiliates of the registrant was $901,062,796 (based upon the closing price for shares of the registrant's Common Stock as reported by the NASDAQ Global Select Market as of that date). As of February 19, 2010, there were 83,529,396 shares of the registrant's Common Stock outstanding.
DOCUMENTS INCORPORATED BY REFERENCE
Portions of the definitive Proxy Statement for the 2010 Annual Meeting of the Stockholders (the "Proxy Statement"), to be filed within 120 days of the end of the fiscal year ended December 31, 2009, are incorporated by reference in Part III hereof.
VALUECLICK, INC.
ANNUAL REPORT ON FORM 10-K
TABLE OF CONTENTS
This annual report on Form 10-K ("Report"), including information incorporated herein by reference, contains "forward-looking statements" within the meaning of Section 27A of the Securities Act of 1933 and Section 21E of the Securities Exchange Act of 1934. These statements relate to expectations concerning matters that are not historical facts. Words such as "projects," "believes," "anticipates," "will," "estimate," "plans," "expects," "intends," and similar words and expressions are intended to identify forward-looking statements. Although we believe that such forward-looking statements are reasonable, we cannot assure you that such expectations will prove to be correct. Important language regarding factors which could cause actual results to differ materially from such expectations are disclosed in this Report, including without limitation under the caption "Risk Factors" beginning on page 8 of this Report and in the other documents we file, from time to time, with the Securities and Exchange Commission, including our annual reports on Form 10-K, quarterly reports on Form 10-Q and current reports on Form 8-K. All forward-looking statements attributable to ValueClick, Inc. are expressly qualified in their entirety by such language. We undertake no obligation to release publicly any revisions to any forward-looking statements to reflect events or circumstances after the date hereof or to reflect the occurrence of unanticipated events.
OVERVIEW
ValueClick is one of the world's largest and most comprehensive online marketing services companies. We sell targeted and measurable online advertising campaigns and programs for advertisers and advertising agency customers, generating qualified customer leads, online sales and increased brand recognition on their behalf with large numbers of online consumers.
Our customers are primarily direct marketers, brand advertisers and the advertising agencies that service these groups. The proposition we offer our customers includes: one of the industry's broadest online marketing services portfolios—including performance-based campaigns and programs where marketers only pay for advertising when it generates a customer lead or product sale; our ability to target campaigns to reach the online consumers our customers are most interested in; and the scale at which we can deliver results for online advertising campaigns. Additionally, our networks of online publishers provide advertisers with a cost-effective and complementary source of online consumers relative to online portals and other large website publishers. Through this approach we have become an industry leader in generating qualified customer leads and online sales for advertisers.
We generate the audiences for our advertisers' campaigns primarily through networks of third-party websites, other online publisher partners and search engines. We aggregate our publisher partners' online advertising inventory into networks, optimize these networks for specific marketing goals, and deliver the campaigns across the appropriate networks' advertising inventory. We are one of the industry's largest online network providers, with: industry expertise and proprietary technology platforms for online advertising inventory aggregation; campaign targeting and optimization, delivery, measurement, and reporting; and, payment settlement and delivery services.
Our publisher partners enjoy efficient and effective monetization of their online advertising inventory through representation by our direct sales teams in major U.S. and European media markets, participation in large-scale advertiser and advertising agency campaigns they may not have access to on their own, enhanced monetization through our proprietary campaign optimization and targeting technology, and settlement services to facilitate payments to publishers for the online inventory utilized by the advertisers. As we do not primarily compete directly with our publisher partners for online consumers, we act as a trusted partner in helping online publishers monetize their online audience and advertising inventory.
We believe that the effectiveness of our online marketing services is dependent on the quality of our networks and our publisher partner relationships. As such, we have established stringent quality standards that include publisher rejection from our networks due to inappropriate content, illegal activity and fraudulent clicking activity, among other criteria. We enforce these quality standards using a combination of manual and automated auditing processes that continually monitor and review both website content and adherence to advertiser campaign specifications.
We derive our revenue from four business segments. These business segments are presented on a worldwide basis and include Media, Affiliate Marketing, Owned & Operated Websites, and Technology, which are described in more detail below. For information regarding the operating performance and total assets of these segments, see Item 7 "Management's Discussion and Analysis of Financial Condition and Results of Operations," and Note 17 to the December 31, 2009 consolidated financial statements included herein.
MEDIA SEGMENT
ValueClick's Media segment provides a comprehensive suite of online marketing services and tailored programs that help marketers create and increase awareness for their products and brands,
1
attract visitors and generate leads and sales through the Internet. We have aggregated thousands of online publishers to provide marketers with access to one of the largest and most reputable display advertising networks in the industry. We partner with third-party website publishers and apply our proprietary technology platform and industry expertise to deliver our customers' display ad campaigns to the appropriate pages of our publisher partners' websites.
With a single buy, marketers can reach targeted online users on a large scale, using a variety of online display ad units across our entire network of publishers, any of 21 standard channels of online content within the network, customized content channels, or a select number of websites where we are authorized to sell inventory on a single-site basis. Audiences can be further targeted based on the demographic and psychographic composition of sites within the network and technical information such as geographic location, browser type, connection speed, ISP or top-level domain (.com, .edu, etc.). In addition, our behavioral targeting capabilities allow marketers to retarget users who have recently visited their sites or to display highly relevant ads based on anonymous profiles we develop based on consumers' recent online behavior such as web browsing and interaction with ads across our network.
With 10,000 active online publisher sites in the U.S. and 16,000 worldwide, our display advertising network reached 171 million unique visitors, or 83% of the U.S. internet audience in December 2009 according to published industry data.
We deliver a variety of display ad units to the Web pages of our online display advertising network publisher partners and track them to evaluate success against the goals of the advertising programs. With traditional banner ads, interstitials, text links, and other online ad units, our technology maximizes the impact of marketing campaigns by identifying the most effective placement for each type of campaign. We also execute a wide variety of rich media applications, including in-stream and in-banner video ads, providing even greater visual and auditory impact for a marketer's online display advertising campaigns.
We began as a performance-based marketing network and we continue to offer multiple pricing models designed around maximizing our customers' return on investment. Our display advertising placements are offered on several pricing models including: cost-per-thousand-impression ("CPM"), whereby our customers pay based on the number of times the target audience is exposed to the advertisement; cost-per-click ("CPC"), whereby payment is triggered only when an interested individual clicks on our customer's advertisement; and cost-per-action ("CPA"); whereby payment is triggered only when a specific, pre-defined action is performed by an online consumer.
The benefits that our customers enjoy in display and other Web advertising include, but are not limited to: flexible pricing models; the ability to target and reach significant numbers of online consumers in a way that complements media buys on portals and other large websites; and the ability to improve online advertising performance while the campaigns are still running by optimizing at site, placement and creative levels, based on both response to ads and the resulting conversions.
Publishers in our display advertising network enjoy efficient and effective monetization of their online advertising inventory, including: representation by our direct sales teams in major U.S. and European media markets; participation in large-scale advertiser and advertising agency campaigns they may not be able to access on their own; enhanced monetization through our campaign optimization technology; and, settlement services to facilitate payments to publishers for the inventory utilized by the advertisers. Through our proprietary publisher interface, publishers can control their participation in campaigns as well as their minimum acceptable level of revenue on an effective-CPM basis.
Lead Generation Marketing & E-commerce
Our Media segment previously included our lead generation marketing and e-commerce businesses. We divested our lead generation marketing business in February 2010 and our e-commerce
2
business in October 2008. These divestitures are discussed more fully in Note 5 to our consolidated financial statements contained in this annual report.
AFFILIATE MARKETING SEGMENT
Our Affiliate Marketing segment services, outlined below, are offered through our wholly-owned subsidiary Commission Junction. Through the combination of: a large-scale pay-for-performance model built on our proprietary technology platforms; marketing expertise; and a large, quality advertising network, our Affiliate Marketing business enables advertisers to develop their own fully-commissioned online sales force comprised of third-party affiliate publishers. We believe we are the largest provider of affiliate marketing services.
In affiliate marketing, a publisher joins an advertiser's affiliate marketing program and agrees to distribute the advertiser's offers in exchange for commissions on leads or sales generated. The publisher places the advertiser's display ads or text links on their website, in email campaigns, or in search listings, and receives a commission from the advertiser only when a visitor takes an agreed-upon action, such as filling out a form or making a purchase on the advertiser's website.
Our Affiliate Marketing services are offered on a hosted basis to enable marketers to execute their own affiliate marketing programs without the expense of building and maintaining their own in-house technical infrastructure and resources.
CJ Marketplace
To facilitate our advertiser customers' recruitment of affiliate publishers, we manage CJ Marketplace, an advertising network dedicated to our affiliate marketing business. Advertisers upload their offers onto CJ Marketplace, making them available for placement by affiliates. Affiliates apply to join the advertiser's program, and upon acceptance, select and place the advertiser's offers on their websites, in email campaigns, or in search listings. These links are served and tracked by Commission Junction. When a visitor clicks on one of the affiliate's links and then makes an online purchase or completes an agreed-upon action on the advertiser's website, that transaction is tracked and recorded by Commission Junction.
CJ Marketplace provides an open environment whereby affiliates can quickly view payment and conversion statistics to assess the effectiveness of every advertiser relationship and advertisement, and advertisers can quickly gauge the quality and potential of every affiliate relationship in the marketplace, allowing them to maximize the performance and scale of their online advertising campaigns.
Affiliate Marketing revenues are principally driven by variable compensation that is based on either a percentage of commissions paid to affiliates or on a percentage of transaction revenue generated from the programs managed with our affiliate marketing platforms.
In addition to the transaction-related revenue streams, we also receive monthly service fees from our advertiser customers who elect to utilize our Program Management service offerings. With these services, we assume full responsibility for all aspects of managing the advertiser's program including planning, affiliate recruitment, program review and management, and program administration.
Search Marketing
Search marketing allows advertisers to find prospective customers who are actively engaged in researching and buying products and services online. Our CJ Search product provides a fully-managed, comprehensive search engine marketing (SEM) solution by combining proprietary technology and expert services to optimize keyword campaigns across major search and shopping engines, and is specifically designed to complement our advertisers' affiliate marketing efforts. We use our technology and processes to create, manage and optimize pay-per-click, paid inclusion and organic search
3
campaigns for our advertiser customers. SEM revenues are driven primarily by a percentage of the revenue we generate for our advertiser customers.
OWNED & OPERATED WEBSITES SEGMENT
Our Owned & Operated Websites segment services are offered through a number of transaction-focused branded websites including Pricerunner, Smarter.com and Couponmountain.com. In 2009, we also launched a limited number of content websites in key online verticals such as healthcare, finance, travel, home and garden, education and business services.
The Pricerunner comparison shopping destination websites operate in the United Kingdom, Sweden, Germany, France, Denmark, and Austria. The Smarter.com and Couponmountain.com websites operate primarily in the United States and, to a lesser extent, Japan and China. The Pricerunner and Smarter.com websites enable consumers to research and compare products from among thousands of online and/or offline merchants using our proprietary technologies. We gather product and merchant data and organize it into comprehensive catalogs on our destination websites, along with relevant consumer and professional reviews. The Couponmountain.com website allows consumers to locate coupons and deals related to products and services that may be of interest to them, and our content websites offer consumers information and reference material across a variety of topics. Our services in these areas are free for consumers, and we generate revenue in one of three ways: on a CPC basis for traffic delivered to the customers' websites from listings on our websites; on a CPA basis when a consumer completes a purchase or other specific event; and on a CPM basis for display advertising shown on our websites.
In addition to our destination websites, Search123, which operates primarily in Europe, is ValueClick's self-service paid search offering that generates its traffic primarily through syndication relationships with other search engines, Web portals and content websites. Search syndication revenues are driven primarily on a CPC basis.
TECHNOLOGY SEGMENT
Our Technology segment provides advertisers, advertising agencies, and other companies with the tools they need to effectively manage their online marketing programs. Our technology products and services are offered through our wholly-owned subsidiary Mediaplex, Inc. Mediaplex is an application services provider ("ASP") offering technology infrastructure tools and consultative services that enable marketers to implement and manage their own online display advertising, SEM and email campaigns. Our Mediaplex products are based on our proprietary MOJO® technology platform, which has the ability, among other attributes, to automatically configure advertisements in response to real-time information from an advertiser's enterprise data system and to provide ongoing campaign optimization and analytics. Mediaplex's products are priced primarily on a CPM or email-delivered basis.
Our Technology segment also included our Mediaplex Systems subsidiary prior to October 2008. We divested the operations of this subsidiary in October 2008. Please refer to Note 5 to our consolidated financial statements contained in this annual report on Form 10-K for further information about this divestiture.
INTERNATIONAL OPERATIONS
We currently conduct international operations through wholly-owned subsidiaries throughout Europe as well as China and Japan.
In August 1999, we commenced operations in the European market with ValueClick Europe Ltd., a wholly-owned subsidiary of ValueClick, Inc., based in the United Kingdom. Since then we have expanded in Europe by opening wholly-owned subsidiaries in Paris, France; Munich, Germany; Madrid, Spain; and Dublin, Ireland. In August 2004, we acquired Pricerunner AB, a leading provider of online
4
comparison shopping services in Europe, based in Sweden. In July 2007, we acquired MeziMedia, which has operations in the United States, China and Japan. Employees in our international subsidiaries totaled 400 as of December 31, 2009. For additional information regarding our international operations, see Note 17 to our consolidated financial statements contained in this annual report on Form 10-K.
TECHNOLOGY PLATFORMS
Our proprietary applications are constructed from established, readily available technologies. Some of the basic components that our products are built on come from leading software and hardware providers such as Oracle, Sybase, Sun, Dell, EMC, NetApp, and Cisco while some components are constructed from leading Open Source initiatives such as Apache Web Server, MySQL, Java, Perl, PHP, and Linux. By striking the proper balance between using commercially available software and Open Source software, our technology expenditures are directed toward enhancing and maintaining our technology platforms while minimizing our technology costs.
We build high-performance, availability and reliability into our product offerings. We safeguard against the potential for service interruptions by engineering fail-safe controls into our critical software components. ValueClick delivers its solutions from a variety of geographic locations within the United States, Europe and China. ValueClick applications are monitored 24 hours a day, 365 days a year by specialized monitoring systems that aggregate alarms to a human-staffed network operations center.
SALES, MARKETING AND CUSTOMER SERVICE
We market our products and services primarily through direct marketing, print advertising and online advertising throughout the year. We also market them through the ValueClick properties' websites, trade show participation and other media events. In addition, we actively pursue public relations programs to promote our brands, products and services to potential network publishers and advertiser customers, as well as to industry analysts.
Customers
We sell our products and services to a variety of advertisers, advertising agencies and traffic distribution partners. Our Media and Affiliate Marketing segment revenues are generated from thousands of customers, and there are no significant customer concentrations in these segments. Our Owned & Operated Websites and Technology segment each have a significant customer that comprises a large portion of each segment's respective revenues. A loss of, or reduction of revenue from, these significant customers could have a significant negative impact on the revenue of these segments.
Competition
We face intense competition in the Internet advertising market. We expect that this competition will continue to intensify in the future as a result of industry consolidation, the continuing maturation of the industry and low barriers to entry. We compete with a diverse and large pool of advertising, media and Internet companies.
Our ability to compete depends upon several factors, including the following:
- •
- our continued ability to aggregate large networks of quality publishers efficiently;
- •
- the timing and market acceptance of new solutions and enhancements to existing solutions developed by us;
- •
- our customer service and support efforts;
- •
- our sales and marketing efforts;
- •
- the ease of use, performance, price, and reliability of solutions provided by us; and
5
- •
- our ability to remain price competitive while maintaining our operating margins.
Additional competitive factors include, but are not limited to, our: reputation, knowledge of the advertising market, financial controls, geographical coverage, relationships with customers, technological capability, and quality and breadth of products and services. For additional information regarding our competitors, see "If we fail to compete effectively against other Internet advertising companies, we could lose customers or advertising inventory and our revenue and results of operations could decline" in the Item 1A Risk Factors discussion in this annual report on Form 10-K.
Seasonality and Cyclicality
We believe that our business is subject to seasonal fluctuations with the calendar fourth quarter generally being our strongest. Expenditures by advertisers and advertising agencies vary in cycles and tend to reflect the overall economic conditions, as well as budgeting and buying patterns.
INTELLECTUAL PROPERTY RIGHTS
We currently rely on a combination of copyright, trademark and trade secret laws and restrictions on disclosure to protect our intellectual property rights. Our success depends on the protection of the proprietary aspects of our technology as well as our ability to operate without infringing on the proprietary rights of others. We also enter into proprietary information and confidentiality agreements with our employees, consultants and commercial partners and control access to, and distribution of, our software documentation and other proprietary information. We have registered the trademark "ValueClick" in the United States and the European Union. We currently have nine pending U.S. patent applications. In addition, we have been granted ten U.S. patents. We do not know if our current patent applications or any future patent application will result in a patent being issued within the scope of the claims we seek, if at all, or whether any patents we may have or may receive will be challenged or invalidated. Although patents are only one component of the protection of intellectual property rights, if our patent applications are denied, it may result in increased competition and the development of products substantially similar to our own. In addition, it is difficult to monitor unauthorized use of technology, particularly in foreign countries where the laws may not protect our proprietary rights as fully as in the United States, and our competitors may independently develop technology similar to our own. We will continue to assess appropriate occasions for seeking patent and other intellectual property protections for those aspects of our technology that we believe constitute innovations providing significant competitive advantages.
CORPORATE HISTORY AND RECENT ACQUISITIONS
We commenced operations as ValueClick, LLC, a California limited liability company, on May 1, 1998. Prior to the formation of ValueClick, LLC, the ValueClick Internet advertising business began in July 1997 as a line of business within Web-Ignite Corporation, a company wholly owned by the founding member of ValueClick, LLC. The reorganization and formation of ValueClick, LLC was affected by the transfer of the Internet advertising business of Web-Ignite to ValueClick, LLC. On December 31, 1998, ValueClick, LLC reorganized as ValueClick, Inc., a Delaware corporation. On March 30, 2000, we completed our initial public offering of common stock. Our common stock is publicly traded and is reported on the NASDAQ Global Select Market under the symbol "VCLK." We have acquired 14 companies since our inception, the most recent of which was MeziMedia in July 2007.
PRIVACY
We may collect personally identifiable information on a permitted basis. We store this personally identifiable data securely and do not use the data without the permission of the Web user. In addition, we use anonymous and non-personally identifiable information, in accordance with our privacy policies, for purposes that include, without limitation, tailoring advertisements and website content to a Web
6
user's interests. We use "cookies," along with other technologies, as set forth in our privacy policies, for purposes that include, without limitation, improving the experience Web users have when they see Web advertisements, advertising campaign reporting, and website reporting.
Please refer to the section entitled "Government Enforcement Actions, Changes in Government Regulation and Industry Standards, Including, But Not Limited To Spyware, Privacy and Email Matters, Could Decrease Demand For Our Products and Services and Increase Our Costs of Doing Business" in Item 1A "Risk Factors" of this annual report on Form 10-K for further details about our compliance with privacy regulations.
EMPLOYEES
As of December 31, 2009, we had 686 employees in the U.S. and 400 employees in our international locations. None of these employees are covered by collective bargaining agreements. Management believes that our relations with our employees are good.
EXECUTIVE OFFICERS
See Part III, Item 10 "Directors and Executive Officers of the Registrant" of this annual report on Form 10-K for information about executive officers of the registrant.
WEBSITE ACCESS TO OUR PERIODIC SEC REPORTS
Our primary Internet address is www.valueclick.com. We make our Securities and Exchange Commission ("SEC") periodic reports (Forms 10-Q and Forms 10-K) and current reports (Forms 8-K), and amendments to these reports, available free of charge through our website as soon as reasonably practicable after they are filed electronically with the SEC. We may from time to time provide important disclosures to investors by posting them in the investor relations section of our website, as allowed by SEC rules.
Materials we file with the SEC may be read and copied at the SEC's Public Reference Room at 100 F Street, N.E., Washington, D.C. 20549. Information on the operation of the Public Reference Room may be obtained by calling the SEC at 1-800-SEC-0330. The SEC also maintains an Internet website at www.sec.gov that contains reports, proxy and information statements, and other information regarding our Company that we file electronically with the SEC.
CODE OF ETHICS AND BUSINESS CONDUCT
We have adopted a Code of Ethics and Business Conduct (the "Code") for our principal executive, financial and accounting, and other officers, and our directors, employees, agents, and consultants. The Code is publicly available on our website at www.valueclick.com under the heading "About Us." Among other things, the Code addresses such issues as conflicts of interest, corporate opportunities, confidentiality, fair dealing, protection and proper use of Company assets, compliance with applicable laws (including insider trading laws), and reporting of illegal or unethical behavior.
Within the Code, ValueClick has established an accounting ethics complaint procedure for all of its employees. The complaint procedure is for employees who may have concerns regarding accounting, internal accounting controls and auditing matters. We treat all complaints confidentially and with the utmost professionalism. If an employee desires, he or she may submit any concerns or complaints on an anonymous basis, and his or her concerns or complaints will be addressed in the same manner as any other complaints. We do not, and will not, condone any retaliation of any kind against an employee who comes forward with an ethical concern or complaint.
7
You should carefully consider the following risks before you decide to buy shares of our common stock. The risks and uncertainties described below are not the only ones facing us. Additional risks and uncertainties, including those risks set forth in "Management's Discussion and Analysis of Financial Condition and Results of Operations" below, may also adversely impact and impair our business. If any of the following risks actually occur, our business, results of operations or financial condition would likely suffer. In such case, the trading price of our common stock could decline, and you may lose all or part of the money you paid to buy our stock.
This annual report on Form 10-K contains forward-looking statements based on the current expectations, assumptions, estimates, and projections about us and our industry. These forward-looking statements involve risks and uncertainties. Our actual results could differ materially from those discussed in these forward-looking statements as a result of certain factors, as more fully described in this section and elsewhere in this annual report on Form 10-K. We undertake no obligation to release publicly any revisions to any forward-looking statements to reflect events or circumstances after the date hereof or to reflect the occurrence of unanticipated events.
DETERIORATING MACROECONOMIC CONDITIONS IN THE UNITED STATES HAVE NEGATIVELY IMPACTED OUR BUSINESS AND FURTHER WEAKENING OF MACROECONOMIC CONDITIONS MAY HAVE ADDITIONAL NEGATIVE IMPACTS ON OUR BUSINESS.
In 2008, we began experiencing weakness across most of our business segments in connection with deteriorating macroeconomic conditions in the United States and Europe. Our consolidated full year 2009 revenue and cash generated from operations decreased as compared to the prior year amounts. We are not able to predict whether general macroeconomic conditions, or conditions in the online advertising industry specifically, will worsen or improve, or the timing of such developments. If macroeconomic conditions worsen, we are not able to predict the impact such worsening conditions will have on the online marketing industry in general, and our results of operations specifically. Further, when macroeconomic conditions do improve, there can be no assurances that we will be able to regain the levels of revenue, profitability and positive cash flow that we achieved prior to the macroeconomic downturn.
OUR PROFITABILITY MAY NOT REMAIN AT CURRENT LEVELS
We face risks that could prevent us from achieving our current profitability levels in future periods. These risks include, but are not limited to, our ability to:
- •
- adapt our products, services and cost structure to changing macroeconomic conditions;
- •
- maintain and increase our inventory of advertising space on publisher websites and with email list owners and newsletter
publishers;
- •
- maintain and increase the number of advertisers that use our products and services;
- •
- continue to expand the number of products and services we offer and the capacity of our systems;
- •
- adapt to changes in Web advertisers' promotional needs and policies, and the technologies used to generate Web
advertisements;
- •
- respond to challenges presented by the large and increasing number of competitors in the industry;
- •
- respond to challenges presented by the continuing consolidation within our industry;
8
- •
- adapt to changes in legislation, taxation or regulation regarding Internet usage, advertising and e-commerce;
- •
- adapt to changes in technology related to online advertising filtering software; and
- •
- adapt to changes in the competitive landscape.
If we are unsuccessful in addressing these or other risks and uncertainties, our business, results of operations and financial condition could be materially and adversely affected.
IF ADVERTISING ON THE INTERNET LOSES ITS APPEAL, OUR REVENUE COULD DECLINE.
Our business models may not continue to be effective in the future for a number of reasons, including the following: click and conversion rates have always been low and may decline as the number of advertisements and ad formats on the Web increases; Web users can install "filter" software programs which allow them to prevent advertisements from appearing on their computer screens or in their email boxes; Internet advertisements are, by their nature, limited in content relative to other media; companies may be reluctant or slow to adopt online advertising that replaces, limits or competes with their existing direct marketing efforts; companies may prefer other forms of Internet advertising we do not offer, including certain forms of search engine placements; companies may not utilize online advertising due to concerns of "click-fraud", particularly related to search engine placements; and regulatory actions may negatively impact certain business practices that we currently rely on to generate a portion of our revenue and profitability. If the number of companies who purchase online advertising from us does not grow, we may experience difficulty in attracting publishers, and our revenue could decline.
OUR REVENUE COULD DECLINE IF WE FAIL TO EFFECTIVELY MANAGE OUR EXISTING ADVERTISING SPACE AND OUR GROWTH COULD BE IMPEDED IF WE FAIL TO ACQUIRE NEW ADVERTISING SPACE.
Our success depends in part on our ability to effectively manage our existing advertising space. The Web publishers and email list owners that list their unsold advertising space with us are not bound by long-term contracts that ensure us a consistent supply of advertising space, which we refer to as inventory. In addition, Web publishers or email list owners can change the amount of inventory they make available to us at any time. If a Web publisher or email list owner decides not to make advertising space from its websites, newsletters or email lists available to us, we may not be able to replace this advertising space with advertising space from other Web publishers or email list owners that have comparable traffic patterns and user demographics quickly enough to fulfill our advertisers' requests. This would result in lost revenue.
We expect that our advertiser customers' requirements will become more sophisticated as the Web continues to mature as an advertising medium. If we fail to manage our existing advertising space effectively to meet our advertiser customers' changing requirements, our revenue could decline. Our growth depends, in part, on our ability to expand our advertising inventory within our networks and to have access to new sources of advertising inventory such as ad exchange. To attract new customers, we must maintain a consistent supply of attractive advertising space. Our success relies in part on expanding our advertising inventory by selectively adding new Web publishers and email list owners to our networks that offer attractive demographics, innovative and quality content and growing Web user traffic and email volume. Our ability to attract new Web publishers and email list owners to our networks and to retain Web publishers and email list owners currently in our networks will depend on various factors, some of which are beyond our control. These factors include, but are not limited to: our ability to introduce new and innovative products and services, our ability to efficiently manage our existing advertising inventory, our pricing policies, and the cost-efficiency to Web publishers and email list owners of outsourcing their advertising sales. In addition, the number of competing intermediaries
9
that purchase advertising inventory from Web publishers and email list owners continues to increase. We cannot assure you that the size of our advertising inventory will increase or remain constant in the future.
OUR OWNED & OPERATED WEBSITES SEGMENT REVENUE IS SUBJECT TO CUSTOMER CONCENTRATION RISKS. THE LOSS OF ONE OR MORE OF THE MAJOR CUSTOMERS IN OUR OWNED & OPERATED WEBSITES SEGMENT COULD SIGNIFICANTLY AND NEGATIVELY IMPACT THE REVENUE AND PROFITABILITY LEVELS OF THIS SEGMENT.
Our Owned & Operated Websites business generates revenue through a combination of: sponsored search listings placed on our destination websites, merchant relationships, affiliate marketing networks and display advertising on our destination websites. A large portion of the revenue in our Owned & Operated Websites segment is generated via sponsored search listings from major search engines. Factors that could cause these relationships to cease or become significantly reduced in scale include, but are not limited to: the non-renewal of our distribution agreement with one or more of the major search engines; the determination by one or more of the major search engines that consumer traffic received from us does not meet their quality standards (in other words, the traffic is not converting at appropriate rates); and changes in the competitive environment, such as industry consolidation. If our relationships with one or more of the major search engines were to cease or become significantly reduced in scale, our revenue and profitability levels could be significantly and negatively impacted. In the fourth quarter of 2009, our largest customer in our Owned & Operated Websites segment made changes that negatively impacted the amount of traffic that we could monetize with them. This change had a significant negative impact on the revenue levels of this segment beginning in the fourth quarter of 2009. As a result of this change, we expect our revenue from the Owned & Operated Websites segment in 2010 to be lower than it was in 2009.
CHANGES IN HOW WE GENERATE ONLINE CONSUMER TRAFFIC FOR OUR DESTINATION WEBSITES COULD NEGATIVELY IMPACT OUR ABILITY TO MAINTAIN OR GROW THE REVENUE AND PROFITABILITY LEVELS OF OUR OWNED & OPERATED WEBSITES SEGMENT.
We generate online consumer traffic for our destination websites using various methods, including: organic traffic, offline marketing campaigns, distribution agreements, search engine marketing (SEM) and search engine optimization (SEO). The current revenue and profitability levels of our Owned & Operated Websites segment are dependent upon our continued ability to use a combination of these methods to generate online consumer traffic to our websites in a cost-efficient manner. Our SEM and SEO techniques have been developed to work with the existing search algorithms utilized by the major search engines. The major search engines frequently modify their search algorithms. Future changes in these search algorithms could change the mix of the methods we use to generate online consumer traffic for our destination websites and could negatively impact our ability to generate such traffic in a cost-efficient manner, which could result in a significant reduction to the revenue and profitability of our Owned & Operated Websites segment. There can be no assurances that we will be able to maintain the current mix of online consumer traffic sources for our destination websites or that we will be able to modify our SEM and SEO techniques to address any future search algorithm changes made by the major search engines.
WE MAY FACE INTELLECTUAL PROPERTY ACTIONS THAT ARE COSTLY OR COULD HINDER OR PREVENT OUR ABILITY TO DELIVER OUR PRODUCTS AND SERVICES.
We may be subject to legal actions alleging intellectual property infringement (including patent infringement), unfair competition or similar claims against us. Companies may apply for or be awarded patents or have other intellectual property rights covering aspects of our technologies or businesses. We
10
are currently involved in two patent disputes with subsidiaries of AOL, Inc. On July, 15, 2008, we filed a complaint against Tacoda, Inc., a Company which was subsequently acquired by AOL, Inc., in the United States District Court for the for the Central District of California for patent infringement of U.S. patent numbers 5,848,396 and 5,991,735. In March of 2009, Netscape, Inc. a subsidiary of AOL, Inc., filed a complaint in the United States District Court for the Eastern District of Virginia against ValueClick, Inc., Mediaplex, Inc., Commission Junction, Inc., MeziMedia, Inc. Web Clients, Inc., and Fastclick, Inc. for alleged patent infringement of U.S. patent number 5,774,670. If Netscape is successful in its patent lawsuit against us, it could result in a large monetary reward against us. If Netscape obtains an injunction from the Court against us, it could require us to change our business practices, could potentially hinder or prevent our ability to deliver our products and services and could divert management's attention.
IF THE TECHNOLOGY THAT WE CURRENTLY USE TO TARGET THE DELIVERY OF ONLINE ADVERTISEMENTS AND TO PREVENT FRAUD ON OUR NETWORKS IS RESTRICTED OR BECOMES SUBJECT TO REGULATION, OUR EXPENSES COULD INCREASE AND WE COULD LOSE CUSTOMERS OR ADVERTISING INVENTORY.
Websites typically place small files of non-personalized (or "anonymous") information, commonly known as cookies, on an Internet user's hard drive. Cookies generally collect information about users on a non-personalized basis to enable websites to provide users with a more customized experience. Cookie information is passed to the website through an Internet user's browser software. We currently use cookies to track an Internet user's movement through our advertiser customer's websites and to monitor and prevent fraudulent activity on our networks. Most currently available Internet browsers allow Internet users to modify their browser settings to prevent cookies from being stored on their hard drive, and some users currently do so. Internet users can also delete cookies from their hard drives at any time. Some Internet commentators and privacy advocates have suggested limiting or eliminating the use of cookies, and legislation has been introduced in some jurisdictions to regulate the use of cookie technology. The effectiveness of our technology could be limited by any reduction or limitation in the use of cookies. If the use or effectiveness of cookies were limited, we expect that we would need to switch to other technologies to gather demographic and behavioral information. While such technologies currently exist, they may be less effective than cookies. We also expect that we would need to develop or acquire other technology to monitor and prevent fraudulent activity on our networks. Replacement of cookies could require reengineering time and resources, might not be completed in time to avoid losing customers or advertising inventory, and might not be commercially feasible. Our use of cookie technology or any other technologies designed to collect Internet usage information may subject us to litigation or investigations in the future. Any litigation or government action against us could be costly and time consuming, could require us to change our business practices and could divert management's attention.
IF WE FAIL TO COMPETE EFFECTIVELY AGAINST OTHER INTERNET ADVERTISING COMPANIES, WE COULD LOSE CUSTOMERS OR ADVERTISING INVENTORY AND OUR REVENUE AND RESULTS OF OPERATIONS COULD DECLINE.
The Internet advertising markets are characterized by rapidly changing technologies, evolving industry standards, frequent new product and service introductions, and changing customer demands. The introduction of new products and services embodying new technologies and the emergence of new industry standards and practices could render our existing products and services obsolete and unmarketable or require unanticipated technology or other investments. Our failure to adapt successfully to these changes could harm our business, results of operations and financial condition.
The market for Internet advertising and related products and services is highly competitive. We expect this competition to continue to increase, in part because there are no significant barriers to
11
entry to our industry. Increased competition may result in price reductions for advertising space, reduced margins and loss of market share. Our principal competitors include other companies that provide advertisers with Internet advertising solutions and companies that offer pay-per-click search services. We compete in the performance-based marketing segment with CPL and CPA performance-based companies, such as Platform-A (owned by AOL), Google Affiliate Network, Trade Doubler, and Linkshare (owned by Rakuten), and we compete with other large Internet display advertising networks. In addition, we compete in the online comparison shopping market with focused comparison shopping websites such as Shopping.com (owned by eBay), Kelkoo, NexTag, Shopzilla (owned by EW Scripps), and Pricegrabber (owned by Experian), and with search engines and portals such as Yahoo!, Google and MSN, and with online retailers such as Amazon.com and eBay. Large websites with brand recognition, such as Yahoo!, Google, AOL and MSN, have direct sales personnel and substantial proprietary online advertising inventory that may provide competitive advantages compared to our networks, and they have a significant impact on pricing for online advertising overall. These companies have longer operating histories, greater name recognition and have greater financial, technical, sales, and marketing resources than we have. Further, Google, Yahoo! and Microsoft have made acquisitions to put them in direct competition with a number of our offerings.
Competition for advertising placements among current and future suppliers of Internet navigational and informational services, high-traffic websites and Internet service providers ("ISPs"), as well as competition with other media for advertising placements, could result in significant price competition, declining margins and reductions in advertising revenue. In addition, as we continue our efforts to expand the scope of our Web services, we may compete with a greater number of Web publishers and other media companies across an increasing range of different Web services, including in vertical markets where competitors may have advantages in expertise, brand recognition and other areas. If existing or future competitors develop or offer products or services that provide significant performance, price, creative or other advantages over those offered by us, our business, results of operations and financial condition could be negatively affected. We also compete with traditional advertising media, such as direct mail, television, radio, cable, and print, for a share of advertisers' total advertising budgets. Many current and potential competitors enjoy competitive advantages over us, such as longer operating histories, greater name recognition, larger customer bases, greater access to advertising space on high-traffic websites, and significantly greater financial, technical, sales, and marketing resources. As a result, we may not be able to compete successfully. If we fail to compete successfully, we could lose customers or advertising inventory and our revenue and results of operations could decline.
WE DEPEND ON KEY PERSONNEL, THE LOSS OF WHOM COULD HARM OUR BUSINESS.
Our success depends in part on the retention of personnel critical to our combined business operations due to, for example, unique technical skills, management expertise or key business relationships. We may be unable to retain existing management, finance, engineering, sales, customer support, and operations personnel that are critical to the success of the Company, which may result in disruption of operations, loss of key business relationships, information, expertise or know-how, unanticipated additional recruitment and training costs, and diminished anticipated benefits of acquisitions, including loss of revenue and profitability.
Our future success is substantially dependent on the continued service of our key senior management. Our employment agreements with our key personnel are short-term and on an at-will basis. We do not have key-person insurance on any of our employees. The loss of the services of any member of our senior management team, or of any other key employees, could divert management's time and attention, increase our expenses and adversely affect our ability to conduct our business efficiently. Our future success also depends on our continuing ability to attract, retain and motivate highly skilled employees. We may be unable to retain our key employees or attract, retain and motivate
12
other highly qualified employees in the future. We have experienced difficulty from time to time in attracting or retaining the personnel necessary to support the growth of our business, and may experience similar difficulties in the future.
DELAWARE LAW AND OUR STOCKHOLDER RIGHTS PLAN CONTAIN ANTI-TAKEOVER PROVISIONS THAT COULD DETER TAKEOVER ATTEMPTS THAT COULD BE BENEFICIAL TO OUR STOCKHOLDERS.
Provisions of Delaware law could make it more difficult for a third-party to acquire us, even if doing so would be beneficial to our stockholders. Section 203 of the Delaware General Corporation Law may make the acquisition of our company and the removal of incumbent officers and directors more difficult by prohibiting stockholders holding 15% or more of our outstanding voting stock from acquiring us, without our board of directors' consent, for at least three years from the date they first hold 15% or more of the voting stock. In addition, our Stockholder Rights Plan has significant anti-takeover effects by causing substantial dilution to a person or group that attempts to acquire us on terms not approved by our board of directors.
SYSTEM FAILURES COULD SIGNIFICANTLY DISRUPT OUR OPERATIONS, WHICH COULD CAUSE US TO LOSE CUSTOMERS OR ADVERTISING INVENTORY.
Our success depends on the continuing and uninterrupted performance of our systems. Sustained or repeated system failures that interrupt our ability to provide services to customers, including failures affecting our ability to deliver advertisements quickly and accurately and to process visitors' responses to advertisements, would reduce significantly the attractiveness of our solutions to advertisers and Web publishers. Our business, results of operations and financial condition could also be materially and adversely affected by any systems damage or failure that impacts data integrity or interrupts or delays our operations. Our computer systems are vulnerable to damage from a variety of sources, including telecommunications failures, power outages, malicious or accidental human acts, and natural disasters. We lease data center space in various locations in northern and southern California; Stockholm, Sweden; and Shanghai, China. Therefore, any of the above factors affecting any of these areas could substantially harm our business. Moreover, despite network security measures, our servers are potentially vulnerable to physical or electronic break-ins, computer viruses and similar disruptive problems in part because we cannot control the maintenance and operation of our third-party data centers. Despite the precautions taken, unanticipated problems affecting our systems could cause interruptions in the delivery of our solutions in the future and our ability to provide a record of past transactions. Our data centers and systems incorporate varying degrees of redundancy. All data centers and systems may not automatically switch over to their redundant counterpart. Our insurance policies may not adequately compensate us for any losses that may occur due to any failures in our systems.
IT MAY BE DIFFICULT TO PREDICT OUR FINANCIAL PERFORMANCE BECAUSE OUR QUARTERLY OPERATING RESULTS MAY FLUCTUATE.
Our revenue and operating results may vary significantly from quarter to quarter due to a variety of factors, many of which are beyond our control. You should not rely on period-to-period comparisons of our results of operations as an indication of our future performance. Our results of operations have fallen below the expectations of market analysts and our own forecasts in the past and may also do so in some future periods. If this happens, the market price of our common stock may fall significantly. The factors that may affect our quarterly operating results include, but are not limited to, the following:
- •
- macroeconomic conditions in the United States and Europe;
- •
- fluctuations in demand for our advertising solutions or changes in customer contracts;
- •
- fluctuations in click, lead, action, impression, and conversion rates;
13
- •
- fluctuations in the amount of available advertising space, or views, on our networks;
- •
- the timing and amount of sales and marketing expenses incurred to attract new advertisers;
- •
- fluctuations in sales of different types of advertising; for example, the amount of advertising sold at higher rates
rather than lower rates;
- •
- fluctuations in the cost of online advertising;
- •
- seasonal patterns in Internet advertisers' spending;
- •
- fluctuations in our stock price which may impact the amount of stock-based compensation we are required to record;
- •
- changes in our pricing and publisher compensation policies, the pricing and publisher compensation policies of our
competitors, the pricing and publisher compensation policies of our advertiser customers, or the pricing policies for advertising on the Internet generally;
- •
- changes in the regulatory environment, including regulation of advertising on the Internet, that may negatively impact our
marketing practices;
- •
- possible impairments of the recorded amounts of goodwill, intangible assets, or other long-lived assets;
- •
- the timing and amount of expenses associated with litigation, regulatory investigations or restructuring activities,
including settlement costs and regulatory penalties assessed related to government enforcement actions;
- •
- the adoption of new accounting pronouncements, or new interpretations of existing accounting pronouncements, that impact
the manner in which we account for, measure or disclose our results of operations, financial position or other financial measures;
- •
- the loss of, or a significant reduction in business from, large customers resulting from, among other factors, the
exercise of a cancellation clause within a contract, the non-renewal of a contract or an advertising insertion order, or shifting business to a competitor when the lack of an exclusivity
clause exists;
- •
- fluctuations in levels of professional services fees or the incurrence of non-recurring costs;
- •
- deterioration in the credit quality of our accounts receivable and an increase in the related provision;
- •
- impairments on our marketable securities due to, among other factors, issuer-specific difficulties or dislocations in the
credit markets in the United States;
- •
- changes in tax laws or our interpretation of tax laws, changes in our effective income tax rate or the settlement of
certain tax positions with tax authorities as a result of a tax audit; and
- •
- costs related to acquisitions of technologies or businesses.
Expenditures by advertisers also tend to be cyclical, reflecting overall economic conditions as well as budgeting and buying patterns. Any decline in the economic prospects of advertisers or the economy generally may alter advertisers' current or prospective spending priorities, or may increase the time it takes us to close sales with advertisers, and could materially and adversely affect our business, results of operations and financial condition.
14
OUR EXPANDING INTERNATIONAL OPERATIONS SUBJECT US TO ADDITIONAL RISKS AND UNCERTAINTIES AND WE MAY NOT BE SUCCESSFUL WITH OUR STRATEGY TO CONTINUE TO EXPAND SUCH OPERATIONS.
We initiated operations, through wholly-owned subsidiaries or divisions, in the United Kingdom in 1999, France and Germany in 2000, Sweden in 2004, Japan and China in 2007, and Spain and Ireland in 2008. Our international expansion and the integration of international operations present unique challenges and risks to our company, and require management attention. Compliance with complex foreign and U.S. laws and regulations that apply to our international operations increases our cost of doing business in international jurisdictions and could interfere with our ability to offer our products and services to one or more countries or expose us or our employees to fines and penalties. These laws and regulations include, but are not limited to, content requirements, tax laws, data privacy and filtering requirements, U.S. laws such as the Foreign Corrupt Practices Act, and local laws prohibiting corrupt payments to governmental officials. Violations of these laws and regulations could result in monetary damages, criminal sanctions against us, our officers, or our employees, and prohibitions on the conduct of our business. Our continued international expansion also subjects us to additional foreign currency exchange rate risks and will require additional management attention and resources. We cannot assure you that we will be successful in our international expansion. Our international operations and expansion subject us to other inherent risks, including, but not limited to:
- •
- the impact of recessions in economies outside of the United States;
- •
- changes in and differences between regulatory requirements between countries;
- •
- U.S. and foreign export restrictions, including export controls relating to encryption technologies;
- •
- reduced protection for and enforcement of intellectual property rights in some countries;
- •
- potentially adverse tax consequences;
- •
- difficulties and costs of staffing and managing foreign operations;
- •
- political and economic instability;
- •
- tariffs and other trade barriers; and
- •
- seasonal reductions in business activity.
Our failure to address these risks adequately could materially and adversely affect our business, revenue, results of operations and financial condition.
WE MAY NOT BE ABLE TO PROTECT OUR INTELLECTUAL PROPERTY FROM UNAUTHORIZED USE, WHICH COULD DIMINISH THE VALUE OF OUR PRODUCTS AND SERVICES, WEAKEN OUR COMPETITIVE POSITION AND REDUCE OUR REVENUE.
Our success depends in large part on our proprietary technologies, including tracking management software, our affiliate marketing technologies, our display advertising technologies, our lead generation technologies, our technology, including SEM technology that runs our owned and operated websites, and our MOJO platform. In addition, we believe that our trademarks are key to identifying and differentiating our products and services from those of our competitors. We may be required to spend significant resources to monitor and police our intellectual property rights. If we fail to successfully enforce our intellectual property rights, the value of our products and services could be diminished and our competitive position may suffer.
15
We rely on a combination of copyright, trademark and trade secret laws, confidentiality procedures and licensing arrangements to establish and protect our proprietary rights. Third-party software providers could copy or otherwise obtain and use our technologies without authorization or develop similar technologies independently, which may infringe upon our proprietary rights. We may not be able to detect infringement and may lose competitive position in the market before we do so. In addition, competitors may design around our technologies or develop competing technologies. Intellectual property protection may also be unavailable or limited in some foreign countries.
We generally enter into confidentiality or license agreements with our employees, consultants, vendors, customers, and corporate partners, and generally control access to and distribution of our technologies, documentation and other proprietary information. Despite these efforts, unauthorized parties may attempt to disclose, obtain or use our products and services or technologies. Our precautions may not prevent misappropriation of our products, services or technologies, particularly in foreign countries where laws or law enforcement practices may not protect our proprietary rights as fully as in the United States.
GOVERNMENT ENFORCEMENT ACTIONS, CHANGES IN GOVERNMENT REGULATION AND INDUSTRY STANDARDS, INCLUDING, BUT NOT LIMITED TO SPYWARE, PRIVACY AND EMAIL MATTERS, COULD DECREASE DEMAND FOR OUR PRODUCTS AND SERVICES AND INCREASE OUR COSTS OF DOING BUSINESS.
Laws and regulations that apply to Internet communications, commerce and advertising are becoming more prevalent. These regulations could affect the costs of communicating on the Web and could adversely affect the demand for our advertising solutions or otherwise harm our business, results of operations and financial condition. The United States Congress has enacted Internet legislation regarding children's privacy, copyrights, sending of commercial email (e.g., the Federal CAN-SPAM Act of 2003), and taxation. The United States Congress has passed legislation regarding spyware (i.e., H.R. 964, the "Spy Act of 2007") and the New York Attorney General's office has also pursued enforcement actions against companies in this industry. The Federal Trade Commission ("FTC") conducted an investigation in 2007 into certain ValueClick websites which promise consumers a free gift of substantial value, and the manner in which they drive traffic to such websites, in particular through email. In the first quarter of 2008, we agreed to a stipulated injunction with the FTC resolving this matter. The injunction made clear that it constituted no finding of any impermissible conduct by us in the past under preexisting FTC regulations then in effect. But the injunction also imposed new FTC guidelines for promotional lead generation activities, consistent with the approach that the agency applied to our competitors. In addition, the FTC issued a report and a revised set of "Self-Regulatory Principles for Online Behavioral Advertising" which promotes principles designed to encourage meaningful self-regulation with regard to online behavioral advertising within the industry, however its message strongly encourages that industry participants come up with more meaningful and rigorous self-regulation or invite legislation by states, Congress or a more regulatory approach by the FTC. Such legislation or increased regulatory approach, including legislation by Congress or guidelines by the FTC that may require consumers to "opt-in" before any data is collected about their web viewing behavior, may adversely affect our ability to grow our company and our behavioral targeting platform. Other laws and regulations have been adopted and may be adopted in the future, and may address issues such as user privacy, spyware, "do not email" lists, pricing, intellectual property ownership and infringement, copyright, trademark, trade secret, export of encryption technology, click-fraud, acceptable content, search terms, lead generation, behavioral targeting, taxation, and quality of products and services. This legislation could hinder growth in the use of the Web generally and adversely affect our business. Moreover, it could decrease the acceptance of the Web as a communications, commercial and advertising medium. We do not use any form of spam or spyware and has policies to prohibit abusive Internet behavior, including prohibiting the use of spam and spyware by our Web publisher partners.
16
Due to the global nature of the Web, it is possible that, although our transmissions originate in California, Sweden and China, the governments of other states or foreign countries might attempt to regulate our transmissions or levy sales or other taxes relating to our activities. In addition, the growth and development of the market for Internet commerce may prompt calls for more stringent consumer protection laws, both in the United States and abroad, that may impose additional burdens on companies conducting business over the Internet. The laws governing the Internet remain largely unsettled, even in areas where there has been some legislative action. It may take years to determine how existing laws, including those governing intellectual property, privacy, libel and taxation, apply to the Internet and Internet advertising. Our business, results of operations and financial condition could be materially and adversely affected by the adoption or modification of industry standards, laws or regulations relating to the Internet, or the application of existing laws to the Internet or Internet-based advertising.
WE COULD BE SUBJECT TO LEGAL CLAIMS, GOVERNMENT ENFORCEMENT ACTIONS AND DAMAGE TO OUR REPUTATION AND HELD LIABLE FOR OUR OR OUR CUSTOMERS' FAILURE TO COMPLY WITH FEDERAL, STATE AND FOREIGN LAWS, REGULATIONS OR POLICIES GOVERNING CONSUMER PRIVACY, WHICH COULD MATERIALLY HARM OUR BUSINESS.
Recent growing public concern regarding privacy and the collection, distribution and use of information about Internet users has led to increased federal, state and foreign scrutiny and legislative and regulatory activity concerning data collection and use practices. The United States Congress currently has pending legislation regarding privacy and data security measures (e.g., S. 495, the "Personal Data Privacy and Security Act of 2007"). Any failure by us to comply with applicable federal, state and foreign laws and the requirements of regulatory authorities may result in, among other things, indemnification liability to our customers and the advertising agencies we work with, administrative enforcement actions and fines, class action lawsuits, cease and desist orders, and civil and criminal liability. Recently, class action lawsuits have been filed alleging violations of privacy laws by ISPs. The European Union's directive addressing data privacy limits our ability to collect and use information regarding Internet users. These restrictions may limit our ability to target advertising in most European countries. Our failure to comply with these or other federal, state or foreign laws could result in liability and materially harm our business.
In addition to government activity, privacy advocacy groups and the technology and direct marketing industries are considering various new, additional or different self-regulatory standards. This focus, and any legislation, regulations or standards promulgated, may impact us adversely. Governments, trade associations and industry self-regulatory groups may enact more burdensome laws, regulations and guidelines, including consumer privacy laws, affecting our customers and us. Since many of the proposed laws or regulations are just being developed, and a consensus on privacy and data usage has not been reached, we cannot yet determine the impact these proposed laws or regulations may have on our business. However, if the gathering of profiling information were to be curtailed, Internet advertising would be less effective, which would reduce demand for Internet advertising and harm our business.
Third parties may bring class action lawsuits against us relating to online privacy and data collection. We disclose our information collection and dissemination policies, and we may be subject to claims if we act or are perceived to act inconsistently with these published policies. Any claims or inquiries could be costly and divert management's attention, and the outcome of such claims could harm our reputation and our business.
Our customers are also subject to various federal and state laws concerning the collection and use of information regarding individuals. These laws include the Children's Online Privacy Protection Act, the Federal Drivers Privacy Protection Act of 1994, the privacy provisions of the Gramm-Leach-Bliley
17
Act, the Federal CAN-SPAM Act of 2003, as well as other laws that govern the collection and use of consumer credit information. We cannot assure you that our customers are currently in compliance, or will remain in compliance, with these laws and their own privacy policies. We may be held liable if our customers use our technologies in a manner that is not in compliance with these laws or their own stated privacy policies.
OUR STOCK PRICE IS LIKELY TO BE VOLATILE AND COULD DROP UNEXPECTEDLY.
Our common stock has been publicly traded since March 30, 2000. The market price of our common stock has been subject to significant fluctuations since the date of our initial public offering.
The stock market has from time to time experienced significant price and volume fluctuations that have affected the market prices of securities, particularly securities of technology companies. As a result, the market price of our common stock may materially decline, regardless of our operating performance. In the past, following periods of volatility in the market price of a particular company's securities, securities class action litigation has often been brought against that company. We were involved in this type of litigation, which arose shortly after our stock price dropped significantly during the third quarter of 2007. Litigation of this type is often expensive and diverts management's attention and resources.
SEVERAL STATES HAVE IMPLEMENTED OR PROPOSED REGULATIONS THAT IMPOSE SALES TAX ON CERTAIN ECOMMERCE TRANSACTIONS INVOLVING THE USE OF AFFILIATE MARKETING PROGRAMS.
In 2008, the state of New York implemented regulations that require advertisers to collect and remit sales taxes on sales made to residents of New York if the affiliate/publisher that facilitated that sale is a New York-based entity. In addition, several other states, including California, have proposed similar regulations, although most of the regulations proposed by these other states have not passed. While the New York sales tax requirement has not had a material impact on our Affiliate Marketing segment results of operations, we are unable to determine the impact on our Affiliate Marketing business if other states adopt similar requirements.
WE MAY BE REQUIRED TO RECORD A SIGNIFICANT CHARGE TO EARNINGS IF OUR GOODWILL OR AMORTIZABLE INTANGIBLE ASSETS BECOME IMPAIRED.
As disclosed in this Annual Report on Form 10-K, we recorded an impairment charge as of December 31, 2008 related to our goodwill and amortizable intangible assets totaling $269.5 million. As of December 31, 2009, we have $157.1 million and $38.7 million of goodwill and amortizable intangible assets, respectively, remaining.
We perform our annual impairment analysis of goodwill as of December 31 of each year, or sooner if we determine there are indicators of impairment, in accordance with accounting principles generally accepted in the United States of America ("GAAP"). Under GAAP, the impairment analysis of goodwill must be based on estimated fair values. The determination of fair values requires assumptions and estimates of many critical factors, including, but not limited to: expected operating results; macroeconomic conditions; our stock price; earnings multiples implied in acquisitions in the online marketing industry; industry analyst expectations; and the discount rates used in the discounted cash flow analysis. We are required to perform our next goodwill impairment analysis at December 31, 2010. If macroeconomic conditions deteriorate further in 2010 or our stock price experiences further declines, we may be required to record additional impairment charges in the future.
We are also required under GAAP to review our amortizable intangible assets for impairment whenever events and circumstances indicate that the carrying value of such assets may not be
18
recoverable. We may be required to record a significant charge to earnings in a period in which any impairment of our goodwill or amortizable intangible assets is determined.
WE MAY INCUR LIABILITIES TO TAX AUTHORITIES IN EXCESS OF AMOUNTS THAT HAVE BEEN ACCRUED WHICH MAY ADVERSELY IMPACT OUR RESULTS OF OPERATIONS AND FINANCIAL CONDITION.
As more fully described in Note 9 to our consolidated financial statements, we have recorded significant income tax liabilities. The preparation of our consolidated financial statements requires estimates of the amount of income tax that will become payable in each of the jurisdictions in which we operate. We may be challenged by the taxing authorities in these jurisdictions and, in the event that we are not able to successfully defend our position, we may incur significant additional income tax liabilities and related interest and penalties which may have an adverse impact on our results of operations and financial condition.
IF WE FAIL TO MAINTAIN AN EFFECTIVE SYSTEM OF INTERNAL CONTROLS, WE MAY NOT BE ABLE TO ACCURATELY REPORT OUR FINANCIAL RESULTS OR PREVENT FRAUD AND OUR BUSINESS MAY BE HARMED AND OUR STOCK PRICE MAY BE ADVERSELY IMPACTED.
Effective internal controls are necessary for us to provide reliable financial reports and to effectively prevent fraud. Any inability to provide reliable financial reports or to prevent fraud could harm our business. The Sarbanes-Oxley Act of 2002 requires management to evaluate and assess the effectiveness of our internal control over financial reporting. We determined that our internal control over financial reporting was effective as of December 31, 2009. In order to continue to comply with the requirements of the Sarbanes-Oxley Act, we are required to continuously evaluate and, where appropriate, enhance our policies, procedures and internal controls. If we fail to maintain the adequacy of our internal controls, we could be subject to litigation or regulatory scrutiny and investors could lose confidence in the accuracy and completeness of our financial reports. We cannot assure you that in the future we will be able to fully comply with the requirements of the Sarbanes-Oxley Act or that management will conclude that our internal control over financial reporting is effective. If we fail to fully comply with the requirements of the Sarbanes-Oxley Act, our business may be harmed and our stock price may decline.
DECREASED EFFECTIVENESS OF EQUITY COMPENSATION COULD ADVERSELY AFFECT OUR ABILITY TO ATTRACT AND RETAIN EMPLOYEES AND HARM OUR BUSINESS.
We have historically used equity compensation as a key component of our employee compensation program in order to align employees' interests with the interests of our stockholders, encourage employee retention, and provide competitive compensation packages. Volatility or lack of positive performance in our stock price may adversely affect our ability to retain key employees, many of whom have been granted equity awards, or to attract additional highly-qualified personnel. As of December 31, 2009, many of our outstanding employee stock options have exercise prices in excess of the stock price on that date. To the extent this continues to occur, our ability to retain employees may be adversely affected. Moreover, applicable NASDAQ listing standards relating to obtaining stockholder approval of equity compensation plans could make it more difficult or expensive for us to grant stock options or other stock-based awards to employees in the future. As a result, we may incur increased compensation costs, change our equity compensation strategy or find it difficult to attract, retain and motivate employees, any of which could materially, adversely affect our business.
ITEM 1B. UNRESOLVED STAFF COMMENTS
None.
19
As of December 31, 2009, we leased facilities at the following locations (including square-feet and primary function/segment(s) using the facility):
- •
- Westlake Village, California (36,000 square-feet; corporate headquarters and Media)
- •
- Santa Barbara, California (43,200 square-feet; Affiliate Marketing)
- •
- Harrisburg, Pennsylvania (27,500 square-feet; Media)
- •
- London, England (9,100 square-feet; European headquarters)
- •
- Westborough, Massachusetts (16,000 square-feet; Affiliate Marketing)
- •
- New York, New York (13,900 square-feet; Media, Affiliate Marketing and Technology)
- •
- Los Angeles, California (8,800 square-feet; Media)
- •
- San Francisco, California (15,900 square-feet; Media, Affiliate Marketing and Technology)
- •
- Shanghai, China (23,300 square-feet; Owned & Operated Websites)
We own land and a building, approximating 61,900 square-feet and 23,800 square-feet, respectively, in Simi Valley, California. We also lease small office space and facilities in: Monrovia, California; Chicago, Illinois; Paris, France; Munich, Germany; Dublin, Ireland; Madrid, Spain; Stockholm, Sweden; Hong Kong, China and, Tokyo, Japan. In addition, we use third-party co-location facilities that house our Web servers in: Sunnyvale, California; San Jose, California; Los Angeles, California; El Segundo, California; Irvine, California; Santa Clara, California; Stockholm, Sweden; and Shanghai, China. As a result of the divestiture of our lead generation business, operated through our Web Clients subsidiary, the lease on our Harrisburg, Pennsylvania facility was assumed by the buyer in February 2010. For additional information regarding our obligations under leases, see Note 16 to our consolidated financial statements included in this annual report on Form 10-K.
Internet Cookie Patent Litigation
In March of 2009, Netscape, Inc., a subsidiary of AOL, Inc., filed a complaint in the United States District Court for the Eastern District of Virginia against ValueClick, Inc., Mediaplex, Inc., Commission Junction, Inc., MeziMedia, Inc., Web Clients, Inc., and Fastclick, Inc. for alleged patent infringement of U.S. patent number 5,774,670, colloquially known as the "Internet Cookies Patent." On July 23, 2009, we filed a cross complaint against Netscape for, among other things, fraud.
The complaint seeks an unspecified amount of damages in addition to injunctive relief. Should the plaintiff be successful in this litigation, we could be liable for a royalty relating to the alleged use of the technology, the amount of which is not specified but which could be material to our financial position, operating results, and cash flows in the period in which the litigation is resolved (and possibly for future periods for future alleged use of the technology). The effectiveness of our operations could be limited by any reduction or limitation in our ability to utilize any alleged related technology. If we lose at trial and are forced to utilize replacement technology, such replacement technology could require reengineering time and resources, might not be completed in time to avoid losing customers or advertising inventory, and might not be commercially feasible.
On January 29, 2010, the court issued a ruling in this matter with respect to the parties' motions for summary judgment. On our motion for summary judgment, the court granted our motion concerning 35 U.S.C. Sec. 102(b) with respect to Claim 1 on the patent, and ruled Claim 1 to be invalid. The validity of the remaining claims of the Internet Cookies Patent will be litigated at trial. The
20
court also granted our motion with respect to willfulness, which eliminates plaintiff's claim for a finding of willful infringement and treble damages. On the plaintiff's motion for summary judgment, the court granted their motion with respect to equitable estoppel, public use, inventorship and preemption of our state law counterclaims, including our claim for fraud. The court's decision eliminates those defenses and counter-claims by us. We believe we have valid remaining defenses and intend to defend ourselves vigorously at trial in this matter.
The plaintiff has filed a motion for reconsideration of the court's summary judgment ruling concerning Claim 1 of the Internet Cookies Patent and a hearing date for that motion has been set for March 19, 2010. A trial date for the remaining claims has been set in this matter for May 11, 2010. At this time, and based on all available evidence, we are unable to estimate the range of potential loss, if any, associated with this matter. Accordingly, the accompanying consolidated financial statements do not reflect an accrual of any amount for possible loss in this matter. Given the pending trial date in May 2010, it is reasonably possible that there will be developments in this matter in the near future. Such developments, if any, will be considered by us in evaluating the need for an accrual in subsequent reporting periods.
Other Litigation
On April 8, 2008, Hypertouch, Inc. filed an action against us in the Superior Court of California, County of Los Angeles. The complaint asserts causes of action for violation of California Business & Professions Code §§ 17529.5 and 17200, et seq., arising from the plaintiff's alleged receipt of a large number of email messages allegedly transmitted by us "and/or (our) agents" and seeks statutory damages for each such email. We filed our answer to the complaint on May 28, 2008. On May 4, 2009, the court granted our motion for summary judgment which ended the case in this court. Hypertouch has appealed the Court's ruling. The appeal is pending.
On July 15, 2008, we filed a complaint against Tacoda, Inc. in the United States District Court for the Central District of California for patent infringement of U.S. patent numbers 5,848,396 and 5,991,735. We are seeking an unspecified amount of damages in addition to injunctive relief. This case has been put on hold by the Court until May 25, 2010, pending a review by the Patent and Trademark Office of U.S. patent numbers 5,848,396 and 5,991,735.
From time to time, we may become subject to legal proceedings, claims and litigation arising in the ordinary course of business. In addition, we may receive letters alleging infringement of patent or other intellectual property rights. We are not currently a party to any material legal proceedings, except as discussed above, nor are we aware of any pending or threatened litigation that would have a material adverse effect on our business, operating results, cash flows or financial condition should such litigation be resolved unfavorably.
ITEM 4. SUBMISSION OF MATTERS TO A VOTE OF SECURITY HOLDERS
No matters were submitted to a vote of security holders during the quarter ended December 31, 2009.
21
ITEM 5. MARKET FOR THE REGISTRANT'S COMMON EQUITY, RELATED STOCKHOLDER MATTERS AND ISSUER PURCHASES OF EQUITY SECURITIES
Market Information
Our common stock has traded on the NASDAQ Global Select Market (including its predecessor markets) under the symbol "VCLK" since our initial public offering on March 30, 2000. The following table sets forth, for the periods indicated, the high and low sales prices per share of our common stock as reported on the NASDAQ Global Select Market. On February 19, 2010, the last sale price of our common stock reported by the NASDAQ Global Select Market was $9.45 per share.
| |
Price Range of Common Stock | ||||||
|---|---|---|---|---|---|---|---|
| |
High | Low | |||||
Fiscal Year Ended December 31, 2009 |
|||||||
Fourth Quarter |
$ | 13.94 | $ | 9.08 | |||
Third Quarter |
$ | 13.54 | $ | 9.38 | |||
Second Quarter |
$ | 12.39 | $ | 8.31 | |||
First Quarter |
$ | 8.75 | $ | 5.47 | |||
| |
Price Range of Common Stock | ||||||
|---|---|---|---|---|---|---|---|
| |
High | Low | |||||
Fiscal Year Ended December 31, 2008 |
|||||||
Fourth Quarter |
$ | 10.18 | $ | 4.66 | |||
Third Quarter |
$ | 15.47 | $ | 9.44 | |||
Second Quarter |
$ | 21.00 | $ | 14.90 | |||
First Quarter |
$ | 23.75 | $ | 16.11 | |||
Stockholders
As of December 31, 2009, there were 553 stockholders of record who held shares of our common stock.
Dividend Policy
We have not declared or paid any cash dividends on our capital stock since our inception and we do not anticipate paying cash dividends in the foreseeable future.
22
Stockholder Return Performance Graph
Set forth below is a graph comparing the cumulative total stockholder return of $100 invested in our common stock on December 31, 2004 through December 31, 2009 relative to the cumulative total return of $100 invested in the NASDAQ Composite Index and the RDG Internet Composite Index calculated similarly for the same period.
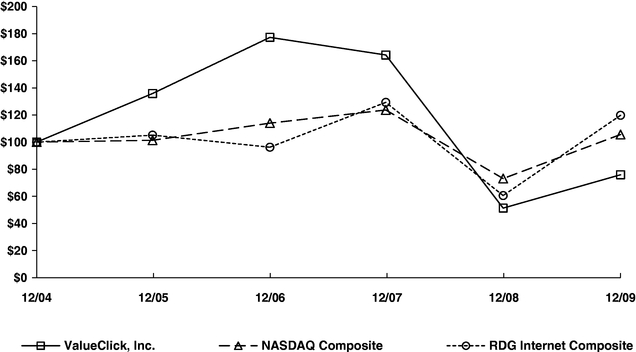
Issuer Purchases of Equity Securities
The table below summarizes our common stock repurchases during the three months ended December 31, 2009 (dollar amounts, except per share data, are in millions).
Period
|
Total Number of Shares Purchased(1) |
Average Price Paid per Share(2) |
Total Number of Shares Purchased as Part of Publicly Announced Plans or Programs |
Approximate Dollar Value of Shares that May Yet Be Purchased Under the Plans or Programs |
|||||||||
|---|---|---|---|---|---|---|---|---|---|---|---|---|---|
October 1, 2009 through October 31, 2009 |
250,000 | $ | 9.87 | 250,000 | $ | 102.5 | |||||||
November 1, 2009 through November 30, 2009 |
1,835,416 | 9.76 | 1,835,416 | 84.6 | |||||||||
December 1, 2009 through December 31, 2009 |
1,514,015 | 9.75 | 1,514,015 | 69.9 | |||||||||
Total |
3,599,431 | $ | 9.76 | 3,599,431 | $ | 69.9 | |||||||
- (1)
- In September 2001, our board of directors authorized a stock repurchase program (the "Program") to allow for the repurchase of shares of our common stock at prevailing market prices in the open market or through unsolicited negotiated transactions. Since the inception of the Program and through December 31, 2008, our board of directors had authorized a total of $479.1 million for repurchases under the Program, and we had repurchased a total of 47.1 million shares of our common stock for $374.2 million, leaving approximately $105 million available under the Program as of December 31, 2008. During the year ended December 31, 2009, we repurchased 3.6 million
23
shares of our common stock for $35.1 million, leaving $69.9 million available under the Program as of December 31, 2009. Repurchases have been funded from available working capital and all shares have been retired subsequent to their repurchase. There is no guarantee as to the exact number of shares that will be repurchased by us, and we may discontinue repurchases at any time that management or our board of directors determines additional repurchases are not warranted. The amounts authorized by our board of directors exclude broker commissions.
- (2)
- Includes commissions paid.
ITEM 6. SELECTED FINANCIAL DATA
The selected consolidated financial data set forth below with respect to our consolidated statements of operations for the years ended December 31, 2009, 2008 and 2007 and with respect to our consolidated balance sheets as of December 31, 2009 and 2008 have been derived from the audited consolidated financial statements of ValueClick which are included elsewhere herein. The consolidated statement of operations data for the years ended December 31, 2006 and 2005 and the consolidated balance sheet data as of December 31, 2007, 2006 and 2005 have been derived from our audited consolidated financial statements not included herein, and as adjusted for reclassification of previously reported operating results arising from discontinued operations. The selected consolidated financial data set forth below is qualified in its entirety by, and should be read in conjunction with both Item 7 "Management's Discussion and Analysis of Financial Condition and Results of Operations" of this annual report on Form 10-K, and the consolidated financial statements and the notes to those consolidated financial statements included in Item 8 "Financial Statements and Supplementary Data" of this annual report on Form 10-K.
24
CONSOLIDATED STATEMENT OF OPERATIONS DATA
| |
For the Year Ended December 31, | |||||||||||||||||
|---|---|---|---|---|---|---|---|---|---|---|---|---|---|---|---|---|---|---|
| |
2009 | 2008 | 2007 | 2006 | 2005 | |||||||||||||
| |
(in thousands, except per share data) |
|||||||||||||||||
Consolidated Statement of Operations Data(1): |
||||||||||||||||||
Revenue |
$ | 422,723 | $ | 455,441 | $ | 375,515 | $ | 256,760 | $ | 187,378 | ||||||||
Cost of revenue |
116,509 | 139,470 | 118,127 | 85,442 | 50,948 | |||||||||||||
Gross profit |
306,214 | 315,971 | 257,388 | 171,318 | 136,430 | |||||||||||||
Operating expenses: |
||||||||||||||||||
Sales and marketing(2) |
118,457 | 136,466 | 95,939 | 62,395 | 36,004 | |||||||||||||
General and administrative(2) |
60,373 | 88,745 | 60,711 | 47,032 | 33,924 | |||||||||||||
Technology(2) |
25,050 | 31,160 | 27,715 | 25,403 | 18,218 | |||||||||||||
Amortization of intangible assets |
19,803 | 21,733 | 16,480 | 10,953 | 6,121 | |||||||||||||
Impairment of goodwill and intangible assets |
— | 269,500 | — | — | — | |||||||||||||
Restructuring benefit, net |
— | — | — | — | (73 | ) | ||||||||||||
Total operating expenses |
223,683 | 547,604 | 200,845 | 145,783 | 94,194 | |||||||||||||
Income (loss) from operations |
82,531 | (231,633 | ) | 56,543 | 25,535 | 42,236 | ||||||||||||
Interest and other income, net |
302 | 2,451 | 12,025 | 7,903 | 5,072 | |||||||||||||
Income (loss) before income taxes and minority interest |
82,833 | (229,182 | ) | 68,568 | 33,438 | 47,308 | ||||||||||||
Income tax expense (benefit) |
21,264 | (33,814 | ) | 28,406 | 14,353 | 19,604 | ||||||||||||
Income (loss) from continuing operations |
61,569 | (195,368 | ) | 40,162 | 19,085 | 27,704 | ||||||||||||
Discontinued operations: |
||||||||||||||||||
Income (loss) from discontinued operations, net of tax |
7,047 | (23,728 | ) | 30,450 | 43,489 | 12,940 | ||||||||||||
Gain on disposition, net of tax |
— | 4,984 | — | — | — | |||||||||||||
Net income (loss) from discontinued operations |
7,047 | (18,744 | ) | 30,450 | 43,489 | 12,940 | ||||||||||||
Net income (loss) |
$ | 68,616 | $ | (214,112 | ) | $ | 70,612 | $ | 62,574 | $ | 40,644 | |||||||
Basic net income (loss) per common share |
||||||||||||||||||
Continuing operations |
$ | 0.71 | $ | (2.12 | ) | $ | 0.40 | $ | 0.19 | $ | 0.32 | |||||||
Discontinued operations |
$ | 0.08 | $ | (0.20 | ) | $ | 0.31 | $ | 0.44 | $ | 0.15 | |||||||
Net income (loss) |
$ | 0.79 | $ | (2.32 | ) | $ | 0.71 | $ | 0.63 | $ | 0.46 | |||||||
Diluted net income (loss) per common share |
||||||||||||||||||
Continuing operations |
$ | 0.71 | $ | (2.12 | ) | $ | 0.40 | $ | 0.19 | $ | 0.30 | |||||||
Discontinued operations |
$ | 0.08 | $ | (0.20 | ) | $ | 0.30 | $ | 0.43 | $ | 0.14 | |||||||
Net income (loss) |
$ | 0.79 | $ | (2.32 | ) | $ | 0.70 | $ | 0.62 | $ | 0.45 | |||||||
Weighted-average shares used to calculate basic net income (loss) per common share |
86,716 |
92,325 |
99,224 |
99,600 |
87,722 |
|||||||||||||
Weighted-average shares used to calculate diluted net income (loss) per common share |
87,210 | 92,325 | 100,518 | 101,721 | 90,857 | |||||||||||||
- (1)
- The amounts included in the Consolidated Statement of Operations Data for the years presented reflect the following acquisitions from their effective dates:
25
Acquisitions
|
Date | |
|---|---|---|
MeziMedia |
July 2007 | |
Shopping.net |
December 2006 | |
Fastclick, Inc. |
September 2005 |
The results of operations of the following dispositions and disposal groups are reflected in discontinued operations for all periods:
Dispositions
|
Disposition Date | |
|---|---|---|
Mediaplex Systems |
October 2008 | |
E-Babylon, Inc |
October 2008 | |
Web Marketing Holdings, LLC ("Web Clients") |
February 2010 |
- (2)
- Includes stock-based compensation for the following periods (in thousands):
| |
For the Year Ended December 31, | |||||||||||||||
|---|---|---|---|---|---|---|---|---|---|---|---|---|---|---|---|---|
| |
2009 | 2008 | 2007 | 2006 | 2005 | |||||||||||
Sales and marketing |
$ | 1,907 | $ | 15,621 | $ | 4,645 | $ | 4,215 | $ | 817 | ||||||
General and administrative |
6,034 | 30,620 | 9,526 | 4,878 | 382 | |||||||||||
Technology |
928 | 1,925 | 1,218 | 1,826 | 823 | |||||||||||
|
$ | 8,869 | $ | 48,166 | $ | 15,389 | $ | 10,919 | $ | 2,022 | ||||||
Consolidated Balance Sheet Data:
| |
As of December 31, | |||||||||||||||
|---|---|---|---|---|---|---|---|---|---|---|---|---|---|---|---|---|
| |
2009 | 2008 | 2007 | 2006 | 2005 | |||||||||||
| |
(in thousands) |
|||||||||||||||
Cash, cash equivalents and marketable securities |
$ | 180,523 | $ | 150,412 | $ | 287,517 | $ | 281,594 | $ | 240,783 | ||||||
Working capital |
$ | 160,531 | $ | 77,183 | $ | 179,649 | $ | 315,576 | $ | 259,797 | ||||||
Total assets |
$ | 566,562 | $ | 603,279 | $ | 1,011,022 | $ | 793,266 | $ | 720,861 | ||||||
Total non-current liabilities |
$ | 61,669 | $ | 73,195 | $ | 81,890 | $ | 62,143 | $ | 35,372 | ||||||
Total stockholders' equity |
$ | 406,489 | $ | 353,479 | $ | 709,933 | $ | 643,709 | $ | 618,543 | ||||||
26
Quarterly Results
The following table sets forth certain selected financial information for our eight most recent fiscal quarters. In the opinion of our management, this unaudited financial information has been prepared on the same basis as the audited financial statements, and includes all adjustments, consisting only of normal recurring adjustments, necessary to fairly state this information when read in conjunction with our consolidated financial statements and the related notes contained elsewhere herein. These operating results are not necessarily indicative of results of any future period.
| |
For the Three-Month Period Ended | ||||||||||||||||||||||||||
|---|---|---|---|---|---|---|---|---|---|---|---|---|---|---|---|---|---|---|---|---|---|---|---|---|---|---|---|
| |
Dec. 31, 2009 |
Sept. 30, 2009 |
Jun. 30, 2009 |
Mar. 31, 2009 |
Dec. 31, 2008 |
Sept. 30, 2008 |
Jun. 30, 2008 |
Mar. 31, 2008 |
|||||||||||||||||||
| |
(in thousands, except per share data) |
||||||||||||||||||||||||||
Revenue |
$ | 110,394 | $ | 105,166 | $ | 104,090 | $ | 103,073 | $ | 110,059 | $ | 104,848 | $ | 115,284 | $ | 125,250 | |||||||||||
Cost of revenue |
31,173 | 26,146 | 28,232 | 30,958 | 35,611 | 33,471 | 34,764 | 35,624 | |||||||||||||||||||
Gross profit |
79,221 | 79,020 | 75,858 | 72,115 | 74,448 | 71,377 | 80,520 | 89,626 | |||||||||||||||||||
Operating expenses: |
|||||||||||||||||||||||||||
Sales and marketing(1) |
27,228 | 31,093 | 30,927 | 29,209 | 27,155 | 38,836 | 32,963 | 37,512 | |||||||||||||||||||
General and administrative(1) |
14,434 | 16,700 | 14,810 | 14,429 | 18,057 | 36,796 | 15,661 | 18,231 | |||||||||||||||||||
Technology(1) |
6,179 | 6,143 | 6,244 | 6,484 | 7,205 | 8,104 | 8,019 | 7,832 | |||||||||||||||||||
Amortization of intangible assets |
4,999 | 4,991 | 4,924 | 4,889 | 4,992 | 5,538 | 5,613 | 5,590 | |||||||||||||||||||
Impairment of goodwill and intangible assets |
— | — | — | — | 269,500 | — | — | — | |||||||||||||||||||
Total operating expenses |
52,840 | 58,927 | 56,905 | 55,011 | 326,909 | 89,274 | 62,256 | 69,165 | |||||||||||||||||||
Income (loss) from operations |
26,381 | 20,093 | 18,953 | 17,104 | (252,461 | ) | (17,897 | ) | 18,264 | 20,461 | |||||||||||||||||
Interest and other income (expense), net |
(176 | ) | (513 | ) | 1,133 | (142 | ) | (1,728 | ) | (269 | ) | 1,408 | 3,040 | ||||||||||||||
Income (loss) before income taxes |
26,205 | 19,580 | 20,086 | 16,962 | (254,189 | ) | (18,166 | ) | 19,672 | 23,501 | |||||||||||||||||
Income tax expense (benefit) |
8,834 | (3,677 | ) | 8,129 | 7,978 | (35,635 | ) | (16,522 | ) | 8,440 | 9,903 | ||||||||||||||||
Income (loss) from continuing operations |
17,371 | 23,257 | 11,957 | 8,984 | (218,554 | ) | (1,644 | ) | 11,232 | 13,598 | |||||||||||||||||
Discontinued operations: |
|||||||||||||||||||||||||||
Income (loss) from discontinued operations, net of tax(1) |
(1,874 | ) | 1,773 | 2,915 | 4,233 | (38,197 | ) | 3,643 | 5,257 | 5,569 | |||||||||||||||||
Gain on disposition, net of tax |
— | — | — | — | 4,984 | — | — | — | |||||||||||||||||||
Net income (loss) from discontinued operations |
(1,874 | ) | 1,773 | 2,915 | 4,233 | (33,213 | ) | 3,643 | 5,257 | 5,569 | |||||||||||||||||
Net income (loss) |
$ | 15,497 | $ | 25,030 | $ | 14,872 | $ | 13,217 | $ | (251,767 | ) | $ | 1,999 | $ | 16,489 | $ | 19,167 | ||||||||||
Basic net income (loss) per common share |
|||||||||||||||||||||||||||
Continuing operations |
$ | 0.20 | $ | 0.27 | $ | 0.14 | $ | 0.10 | $ | (2.52 | ) | $ | (0.02 | ) | $ | 0.12 | $ | 0.14 | |||||||||
Discontinued operations |
$ | (0.02 | ) | $ | 0.02 | $ | 0.03 | $ | 0.05 | $ | (0.38 | ) | $ | 0.04 | $ | 0.06 | $ | 0.06 | |||||||||
Net income (loss) |
$ | 0.18 | $ | 0.29 | $ | 0.17 | $ | 0.15 | $ | (2.90 | ) | $ | 0.02 | $ | 0.17 | $ | 0.20 | ||||||||||
Diluted net income (loss) per common share |
|||||||||||||||||||||||||||
Continuing operations |
$ | 0.20 | $ | 0.26 | $ | 0.14 | $ | 0.10 | $ | (2.52 | ) | $ | (0.02 | ) | $ | 0.12 | $ | 0.14 | |||||||||
Discontinued operations |
$ | (0.02 | ) | $ | 0.02 | $ | 0.03 | $ | 0.05 | $ | (0.38 | ) | $ | 0.04 | $ | 0.05 | $ | 0.06 | |||||||||
Net income (loss) |
$ | 0.18 | $ | 0.29 | $ | 0.17 | $ | 0.15 | $ | (2.90 | ) | $ | 0.02 | $ | 0.17 | $ | 0.19 | ||||||||||
- (1)
- Includes stock-based compensation for the following periods (in thousands):
| |
For the Three-Month Period Ended | ||||||||||||||||||||||||
|---|---|---|---|---|---|---|---|---|---|---|---|---|---|---|---|---|---|---|---|---|---|---|---|---|---|
| |
Dec. 31, 2009 |
Sept. 30, 2009 |
Jun. 30, 2009 |
Mar. 31, 2009 |
Dec. 31, 2008 |
Sept. 30, 2008 |
Jun. 30, 2008 |
Mar. 31, 2008 |
|||||||||||||||||
Sales and marketing |
$ | 355 | $ | 394 | $ | 575 | $ | 583 | $ | 581 | $ | 11,936 | $ | 1,575 | $ | 1,529 | |||||||||
General and administrative |
1,361 | 1,555 | 1,542 | 1,576 | 1,531 | 23,011 | 2,911 | 3,167 | |||||||||||||||||
Technology |
197 | 228 | 242 | 261 | 291 | 978 | 331 | 325 | |||||||||||||||||
|
$ | 1,913 | $ | 2,177 | $ | 2,359 | $ | 2,420 | $ | 2,403 | $ | 35,925 | $ | 4,817 | $ | 5,021 | |||||||||
27
ITEM 7. MANAGEMENT'S DISCUSSION AND ANALYSIS OF FINANCIAL CONDITION AND RESULTS OF OPERATIONS
The following discussion of our financial condition and results of operations should be read in conjunction with our consolidated financial statements and the related notes thereto included elsewhere in this annual report on Form 10-K beginning on page F-1.
The following discussion contains forward-looking statements based on the current expectations, assumptions, estimates, and projections about us and our industry. These forward-looking statements involve risks and uncertainties. Our actual results could differ materially from those discussed in these forward- looking statements as a result of certain factors, as more fully described in Item 1A "Risk Factors" and elsewhere in this annual report on Form 10-K. We undertake no obligation to release publicly any revisions to any forward-looking statements to reflect events or circumstances after the date hereof or to reflect the occurrence of unanticipated events.
Overview
We offer a suite of products and services that enable marketers to advertise and sell their products through all major online marketing channels, including display advertising, search marketing, comparison shopping, and affiliate marketing. We also offer technology infrastructure tools and services that enable marketers to implement and manage their own online display advertising and email campaigns, and that assist online publishers with management of their website inventory. The broad range of products and services that we provide enables our customers to address all aspects of their online marketing process, from strategic planning through execution, including results measurement and campaign refinements.
In October 2008, we completed the dispositions of our Mediaplex Systems subsidiary and our e-commerce operations. In February 2010, we completed the disposition of our Web Clients subsidiary. This business is treated as a disposal group and classified in our consolidated financial statements as held-for-sale as of December 31, 2009. The results of operations of these disposed businesses and disposal group have been classified as discontinued operations in our consolidated financial statements. All current year and prior year financial information discussed herein pertains to the remaining continuing operations.
On July 30, 2007, we completed the acquisition of MeziMedia. We have included the results of operations of MeziMedia in our consolidated results of operations beginning on the date of acquisition. Note 4 to our consolidated financial statements included in this annual report on Form 10-K provides unaudited pro forma revenue, net income and basic and diluted net income per common share for the year ended December 31, 2007 as if the acquisition of MeziMedia occurred as of January 1, 2007.
We derive our revenue from four business segments. These business segments are presented on a worldwide basis and include: Media, Affiliate Marketing, Owned & Operated Websites, and Technology. Each of these four business segments is described in Item 1 "Business" of this annual report on Form 10-K.
Our operations and financial performance depend on general economic conditions. The economies in which we primarily operate have experienced, and could continue to experience, an economic downturn due to various factors including: the crisis in credit markets, slower economic activity, decreased consumer confidence, high consumer debt levels and unemployment rates, and other adverse business conditions. Such fluctuations in these economies could cause, among others, deterioration and continued decline in business and consumer spending, reductions in our customer's advertising budgets, and a decrease in demand for the types of online marketing services we provide or the products our customers offer. These factors have negatively impacted our revenue levels and could continue to negatively impact our business in the future.
28
The following table provides revenue, gross profit, operating expenses, and income from operations information for each of our four business segments. Segment income from operations, as shown below, excludes the effects of: stock-based compensation; amortization of intangible assets; impairment of goodwill and intangible assets, and corporate expenses, as these items are excluded from the segment performance measures utilized by our chief operating decision maker in evaluating the performance of the segments. Corporate expenses consist of those costs not directly attributable to a business segment, and include: salaries and benefits for our executive, finance, legal, corporate governance, human resources, and facilities organizations; fees for professional service providers including audit, tax, Sarbanes-Oxley compliance, and certain legal matters; insurance; and other corporate expenses. A reconciliation of segment income from operations to consolidated income from operations and a reconciliation of segment revenue to consolidated revenue are also provided in the following table.
| |
For the Year Ended December 31, | |||||||||
|---|---|---|---|---|---|---|---|---|---|---|
| |
2009 | 2008 | 2007 | |||||||
| |
(in thousands) |
|||||||||
Media Segment |
||||||||||
Revenue |
$ | 135,086 | $ | 130,891 | $ | 125,319 | ||||
Cost of revenue |
71,320 | 71,638 | 70,066 | |||||||
Gross profit |
63,766 | 59,253 | 55,253 | |||||||
Operating expenses |
30,505 | 34,038 | 32,798 | |||||||
Segment income from operations |
$ | 33,261 | $ | 25,215 | $ | 22,455 | ||||
Affiliate Marketing Segment |
||||||||||
Revenue |
$ | 111,903 | $ | 121,972 | $ | 115,977 | ||||
Cost of revenue |
15,617 | 19,374 | 12,978 | |||||||
Gross profit |
96,286 | 102,598 | 102,999 | |||||||
Operating expenses |
38,165 | 43,143 | 39,798 | |||||||
Segment income from operations |
$ | 58,121 | $ | 59,455 | $ | 63,201 | ||||
Owned & Operated Websites Segment |
||||||||||
Revenue |
$ | 149,599 | $ | 177,145 | $ | 112,706 | ||||
Cost of revenue |
27,002 | 46,950 | 33,695 | |||||||
Gross profit |
122,597 | 130,195 | 79,011 | |||||||
Operating expenses |
87,563 | 89,263 | 56,504 | |||||||
Segment income from operations |
$ | 35,034 | $ | 40,932 | $ | 22,507 | ||||
Technology Segment |
||||||||||
Revenue |
$ | 27,686 | $ | 28,670 | $ | 23,741 | ||||
Cost of revenue |
3,709 | 4,147 | 3,880 | |||||||
Gross profit |
23,977 | 24,523 | 19,861 | |||||||
Operating expenses |
11,202 | 10,923 | 9,324 | |||||||
Segment income from operations |
$ | 12,775 | $ | 13,600 | $ | 10,537 | ||||
Reconciliation of segment income from operations to consolidated income from operations: |
||||||||||
Total segment income from operations |
$ | 139,191 | $ | 139,202 | $ | 118,700 | ||||
Corporate expenses |
(27,988 | ) | (31,436 | ) | (30,288 | ) | ||||
Stock-based compensation |
(8,869 | ) | (48,166 | ) | (15,389 | ) | ||||
Amortization of intangible assets |
(19,803 | ) | (21,733 | ) | (16,480 | ) | ||||
Impairment of goodwill and intangible assets |
— | (269,500 | ) | — | ||||||
Consolidated income (loss) from operations |
$ | 82,531 | $ | (231,633 | ) | $ | 56,543 | |||
Reconciliation of segment revenue to consolidated revenue: |
||||||||||
Media |
$ | 135,086 | $ | 130,891 | $ | 125,319 | ||||
Affiliate Marketing |
111,903 | 121,972 | 115,977 | |||||||
Owned & Operated Websites |
149,599 | 177,145 | 112,706 | |||||||
Technology |
27,686 | 28,670 | 23,741 | |||||||
Inter-segment eliminations |
(1,551 | ) | (3,237 | ) | (2,228 | ) | ||||
Consolidated revenue |
$ | 422,723 | $ | 455,441 | $ | 375,515 | ||||
29
RESULTS OF OPERATIONS—Fiscal Years Ended December 31, 2009 and 2008
Revenue. Consolidated revenue for the year ended December 31, 2009 was $422.7 million, representing a 7.2% decrease from the prior year total of $455.4 million.
Media segment revenue increased 3.2% to $135.1 million for the year ended December 31, 2009 compared to $130.9 million for 2008. This growth was due to strength in our U.S. display advertising business, offset by weakness in our European display advertising business.
Affiliate Marketing segment revenue decreased to $111.9 million for the year ended December 31, 2009 compared to $122.0 million in 2008. This decrease of $10.1 million, or 8.3%, was due to a decrease, both in the U.S. and Europe, in e-commerce transaction activity conducted through our network and, to a lesser extent, lower prices for our services.
Owned & Operated Websites segment revenue decreased to $149.6 million for the year ended December 31, 2009 compared to $177.1 million in 2008. The decrease of $27.5 million, or 15.5%, was primarily attributable to a decrease in consumer traffic to our destination websites, lower conversion rates experienced by advertisers, and a change made by the largest customer is this segment at the end of the third quarter of 2009 that significantly reduced our volume with that customer. The Owned & Operated Websites segment has a significant customer that comprises a large portion of this segment's revenues. A loss of, or reduction of revenue from, this customer could have a significant negative impact on the revenue of this segment.
Technology segment revenue was $27.7 million for the year ended December 31, 2009 compared to $28.7 million in 2008, a decrease of $1.0 million, or 3.4%. The decrease in revenue was primarily related to lower volumes of ad serving during the year ended December 31, 2009 compared to the prior year. The Technology segment has a significant customer that comprises a large portion of this segment's revenues. A loss of, or reduction of revenue from, this customer could have a significant negative impact on the revenue of this segment.
Cost of Revenue and Gross Profit. Cost of revenue for the Media and Owned & Operated Websites segments consists primarily of amounts that we pay to website publishers that are directly related to a revenue-generating event. We pay these publishers on a CPC, CPA, CPL, or CPM basis. Cost of revenue for all segments also includes labor costs, depreciation on revenue-producing technologies and Internet access costs. Consolidated cost of revenue was $116.5 million for the year ended December 31, 2009 compared to $139.5 million in 2008, a decrease of $23.0 million, or 16.5%. The consolidated gross margin increased to 72.4% for the year ended December 31, 2009 compared to 69.4% for the year ended December 31, 2008 due to the segment-level movements in gross margin as described below.
Cost of revenue for the Media segment remained relatively consistent at $71.3 million for the year ended December 31, 2009 compared to $71.6 million in 2008. Our Media segment gross margin increased to 47.2% for the year ended December 31, 2009 compared to 45.3% for the same period in 2008. The increase in Media segment gross margin resulted primarily from our ability to utilize our technology platform to use advertising inventory more effectively than in the year ago period. In addition, our U.S. display advertising business has launched a number of vertical ad networks, which allows us to achieve a higher effective CPM than our broad-based ad network due to the branding nature of the campaigns running in the vertical networks.
Cost of revenue for the Affiliate Marketing segment was $15.6 million for the year ended December 31, 2009 compared to $19.4 million in 2008. Our Affiliate Marketing segment gross margin increased to 86.0% for the year ended December 31, 2009 from 84.1% for the same period in 2008 due to a decline in the mix of certain lower margin revenue streams in the current year as compared to the prior year.
Cost of revenue for the Owned & Operated Websites segment was $27.0 million for the year ended December 31, 2009 compared to $47.0 million in 2008. The decrease in cost of revenue was due
30
to the lower revenue described above. Our Owned & Operated Websites segment gross margin increased to 82.0% for 2009 from 73.5% in 2008 due primarily to a mix shift in this segment's traffic acquisition strategies, which reduced the mix of consumer traffic coming from distribution partners with a revenue-share relationship.
Technology segment cost of revenue was $3.7 million for the year ended December 31, 2009 compared to $4.1 million in 2008. Our Technology segment gross margin remained relatively consistent at 86.6% in 2009 compared to 85.5% in 2008. As the gross margin for the Technology segment is highly dependent upon revenue due to the existing operating leverage, any increases or decreases in segment revenue may have a significant impact on segment gross margin.
Operating Expenses:
Sales and Marketing. Sales and marketing expenses consist primarily of compensation and employee benefits of sales and marketing, network development and related support teams, certain online and offline advertising costs, travel, trade shows, and marketing materials. Online advertising costs included in sales and marketing expenses are primarily comprised of amounts that we pay to search engines for driving consumer traffic to our owned and operated websites. Sales and marketing expenses for the year ended December 31, 2009 were $118.5 million compared to $136.5 million in 2008, a decrease of $18.0 million, or 13.2%. Sales and marketing expenses decreased primarily due to lower stock-based compensation and other labor costs. Please refer to the Stock-Based Compensation section below for a discussion of the lower stock-based compensation expense in 2009. Our sales and marketing expenses as a percentage of revenue decreased to 28.0% for the year ended December 31, 2009 compared to 30.0% in 2008 due to the lower stock-based compensation.
General and Administrative. General and administrative expenses consist primarily of facilities costs, executive and administrative compensation and employee benefits, depreciation, professional services fees, insurance costs, and other general overhead costs. General and administrative expenses decreased to $60.4 million for the year ended December 31, 2009 compared to $88.7 million in 2008, a decrease of $28.4 million, or 32.0%. General and administrative expenses decreased due to a decrease of $24.6 million in stock-based compensation and an overall focus on reducing operating expenses in the face of a difficult economic environment. Please refer to the Stock-Based Compensation section below for a discussion of the lower stock-based compensation expense in 2009. As a result, our general and administrative expenses as a percentage of revenue decreased to 14.3% for the year ended December 31, 2009 compared to 19.5% in 2008.
Technology. Technology expenses include costs associated with the maintenance of our technology platforms, including compensation and employee benefits for our engineering and network operations departments, as well as costs for contracted services and supplies. Technology expenses for the year ended December 31, 2009 were $25.1 million compared to $31.2 million in 2008, a decrease of $6.1 million, or 19.6%. The decrease in technology expenses was due primarily due to lower labor costs and stock-based compensation. Please refer to the Stock-Based Compensation section below for a discussion of the lower stock-based compensation expense in 2009. Our technology expenses as a percentage of revenue decreased to 5.9% for the year ended December 31, 2009 compared to 6.8% in 2008.
Segment Income from Operations. Media segment income from operations for the year ended December 31, 2009 increased 31.9%, or $8.0 million, to $33.3 million, from $25.2 million in the prior year, and represented 24.6% and 19.3% of Media segment revenue in these respective periods. Media segment operating margin increased due to the higher revenue and gross margin described above, and lower operating expenses.
Affiliate Marketing segment income from operations for the year ended December 31, 2009 decreased 2.2%, or $1.3 million, to $58.1 million, from $59.5 million in the prior year, and represented 51.9% and 48.7% of Affiliate Marketing segment revenue in these respective periods. The higher operating margin was due to the higher gross margin as described above and lower operating expenses.
31
Owned & Operated Websites segment income from operations for the year ended December 31, 2009 decreased to $35.0 million, from $40.9 million in the prior year, and remained relatively consistent at 23.4% and 23.1% of Owned & Operated Websites segment revenue in these respective periods.
Technology segment income from operations for the year ended December 31, 2009 decreased to $12.8 million, from $13.6 million in the prior year, and represented 46.1% and 47.4% of Technology segment revenue in these respective periods. The decrease in Technology segment income from operations and operating margin was primarily attributable to the operating leverage associated with the lower revenue as described above.
Stock-Based Compensation. Stock-based compensation for the year ended December 31, 2009 amounted to $8.9 million compared to $48.2 million in 2008. The decrease of $39.3 million was primarily due to the impact of a one-time stock-based compensation charge in 2008, which represented the acceleration of expense associated with unvested stock options that were repurchased by the Company through a tender offer process and the resulting reduction in expense thereafter.
We currently anticipate total stock-based compensation of approximately $10 million for the year ending December 31, 2010. Such amounts may change as a result of higher or lower than anticipated equity award grants to new and existing employees, differences between actual and estimated forfeitures of stock options and restricted stock, fluctuations in the market value of our common stock, modifications to our existing stock option programs, additions of new stock-based compensation programs, or other factors.
Amortization of Intangible Assets. Amortization of intangible assets for the year ended December 31, 2009 was $19.8 million compared to $21.7 million in 2008. This expense represents the amortization of intangible assets acquired through business combinations. The decrease compared to the prior year was related to certain intangible assets that became fully amortized. We currently anticipate total amortization of intangible assets of approximately $19 million for the year ending December 31, 2010.
Impairment of Goodwill and Intangible Assets. In 2008, we recorded an impairment charge on our goodwill and intangible assets of $269.5 million related to our Media and Owned & Operated Websites reporting units. No such charge was recorded in continuing operations in 2009.
Interest and Other Income, net. Interest and other income, net, consists principally of interest earned on our cash and cash equivalents and marketable securities and foreign currency exchange gains or losses. Interest and other income, net was $302,000 for 2009 compared to $2.5 million for the same period in 2008. The decrease of $2.1 million was primarily attributable to a reduction in interest income, due to lower average cash and cash equivalents and marketable securities balances in 2009 and the achievement of lower investment yields as compared to the prior year, offset by a reduction in foreign exchange currency losses.
Income Tax Expense. For the year ended December 31, 2009, we recorded an income tax expense of $21.3 million compared to an income tax benefit of $33.8 million in 2008. The increase in the effective income tax rate for the year ended December 31, 2009 to 25.7% from (14.8)% for the year ended December 31, 2008 was primarily due to income from continuing operations before income taxes in 2009 of $82.8 million, the tax impact of which was partially offset by the recognition of $14.5 million in tax benefits related to the reversal of contingency reserves due to the expiration of certain statutes of limitations, compared to a tax benefit associated with the loss from continuing operations before income taxes of $229.2 million in 2008. We currently expect our effective tax rate to be approximately 42.0% in the year ending December 31, 2010.
32
RESULTS OF OPERATIONS—Fiscal Years Ended December 31, 2008 and 2007
Revenue. Consolidated revenue for the year ended December 31, 2008 was $455.4 million, representing a 21.3% increase over the prior year total of $375.5 million.
Media segment revenue increased 4.4% to $130.9 million for the year ended December 31, 2008 compared to $125.3 million for 2007 due to growth in our European display advertising business, offset by a decline in our U.S. display advertising business.
Affiliate Marketing segment revenue increased to $122.0 million for the year ended December 31, 2008 compared to $116.0 million in 2007. This increase of $6.0 million, or 5.2%, was due to an increase, both in the U.S. and Europe, in the number of customers and an increase in transaction volumes associated with both our new and existing customers, offset by the loss of a major customer in the first half of 2008.
Owned & Operated Websites segment revenue increased to $177.1 million for the year ended December 31, 2008 compared to $112.7 million in 2007. The increase of $64.4 million, or 57.2%, was primarily attributable to the acquisition of MeziMedia in July 2007 as well as growth in our existing European comparison shopping operations.
Technology segment revenue was $28.7 million for the year ended December 31, 2008 compared to $23.7 million in 2007, an increase of $4.9 million, or 20.8%. The increase in revenue was primarily related to higher volumes of ad serving, both domestically and in Europe, during the year ended December 31, 2008 compared to the same period of the prior year.
Cost of Revenue and Gross Profit. Consolidated cost of revenue was $139.5 million for the year ended December 31, 2008 compared to $118.1 million in 2007, an increase of $21.3 million, or 18.1%. The consolidated gross margin increased from 68.5% for the year ended December 31, 2007 to 69.4% for the year ended December 31, 2008. This increase in consolidated gross margin is primarily a result of the higher gross margin in our Owned & Operated Websites segment and the relative size of that segment following the acquisition of MeziMedia as described below.
Cost of revenue for the Media segment increased $1.6 million, or 2.2%, to $71.6 million for the year ended December 31, 2008 compared to $70.1 million in 2007. Our Media segment gross margin remained relatively consistent at 45.3% for the year ended December 31, 2008 compared to 44.1% for the same period in 2007.
Cost of revenue for the Affiliate Marketing segment was $19.4 million for the year ended December 31, 2008 compared to $13.0 million in 2007. Our Affiliate Marketing segment gross margin decreased to 84.1% for the year ended December 31, 2008 from 88.8% for the same period in 2007 due to the mix of lower margin services revenue in the current year as compared to the prior year.
Cost of revenue for the Owned & Operated Websites segment was $47.0 million for the year ended December 31, 2008 compared to $33.7 million in 2007. The increase in cost of revenue was primarily due to the acquisition of MeziMedia, acquired in July 2007. Our Owned & Operated Websites segment gross margin increased to 73.5% for 2008 from 70.1% in 2007 due primarily to the full year impact in 2008 of the acquisition of MeziMedia.
Technology segment cost of revenue was $4.1 million for the year ended December 31, 2008 compared to $3.9 million in 2007. Our Technology segment gross margin increased to 85.5% in 2008 from 83.7% in 2007 due to the operating leverage associated with higher revenue.
Operating Expenses:
Sales and Marketing. Sales and marketing expenses for the year ended December 31, 2008 were $136.5 million compared to $95.9 million in 2007, an increase of $40.5 million, or 42.2%. Sales and
33
marketing expenses increased primarily due the inclusion of a full year of online advertising costs for MeziMedia, acquired in July 2007, and higher stock-based compensation. Please refer to the Stock-Based Compensation section below for a discussion of the higher stock-based compensation expense in 2008. Our sales and marketing expenses as a percentage of revenue increased to 30.0% for the year ended December 31, 2008 compared to 25.5% in 2007 due to the inclusion of a full year of MeziMedia, which has higher sales and marketing costs as a percentage of revenue as compared to our other businesses, and the increase in stock-based compensation.
General and Administrative. General and administrative expenses increased to $88.7 million for the year ended December 31, 2008 compared to $60.7 million in 2007, an increase of $28.0 million, or 46.2%. General and administrative expenses increased primarily due to an increase of $21.1 million in stock-based compensation. Please refer to the Stock-Based Compensation section below for a discussion of the higher stock-based compensation expense in 2008. As a result, our general and administrative expenses as a percentage of revenue increased to 19.5% for the year ended December 31, 2008 compared to 16.2% in 2007.
Technology. Technology expenses for the year ended December 31, 2008 were $31.2 million compared to $27.7 million in 2007, an increase of $3.4 million, or 12.4%. The increase in technology expenses was due primarily to the inclusion of a full year of MeziMedia's technology expenses. Our technology expenses as a percentage of revenue decreased to 6.8% for the year ended December 31, 2008 compared to 7.4% in 2007 primarily due to the operating leverage associated with the higher revenue.
Segment Income from Operations. Media segment income from operations for the year ended December 31, 2008 increased 12.3%, or $2.8 million, to $25.2 million, from $22.5 million in the prior year. Media segment operating margin remained relatively consistent at 19.3% and 17.9% of Media segment revenue in these respective periods.
Affiliate Marketing segment income from operations for the year ended December 31, 2008 decreased 5.9%, or $3.7 million, to $59.5 million, from $63.2 million in the prior year, and represented 48.7% and 54.5% of Affiliate Marketing segment revenue in these respective periods. The lower operating margin was due primarily to the lower gross margin as described above and higher operating costs associated with our international expansion.
Owned & Operated Websites segment income from operations for the year ended December 31, 2008 increased to $40.9 million, from $22.5 million in the prior year, and represented 23.1% and 20.0% of segment revenue in these respective periods. The increase in Owned & Operated Websites segment income from operations and operating margin was largely attributable to the full year impact of MeziMedia, which was acquired in July 2007.
Technology segment income from operations for the year ended December 31, 2008 increased to $13.6 million, from $10.5 million in the prior year, and represented 47.4% and 44.4% of Technology segment revenue in these respective periods. The increase in Technology segment income from operations and the higher operating margin was attributable to the operating leverage associated with the higher revenue as described above.
Stock-Based Compensation. Stock-based compensation for the year ended December 31, 2008 amounted to $48.2 million compared to $15.4 million in 2007. The increase of $32.8 million was primarily due to the impact of a one-time stock-based compensation charge, which represents the acceleration of expense associated with unvested stock options repurchased by the Company through a tender offer process completed during 2008.
Amortization of Intangible Assets. Amortization of intangible assets for the year ended December 31, 2008 was $21.7 million compared to $16.5 million in 2007. This expense represents the
34
amortization of intangible assets acquired through business combinations. The increase compared to the prior year was due to the intangible assets purchased in the MeziMedia acquisition in July 2007.
Impairment of Goodwill and Intangible Assets. During 2008 we recorded an impairment charge on our goodwill and intangible assets of $269.5 million related to our Media and Owned & Operated Websites reporting units. We believe this impairment charge is primarily a result of the significant decline in our stock price during 2008 and the weak macroeconomic environment. Refer to Critical Accounting Policies below for further details about this impairment charge.
Interest and Other Income, net. Interest and other income, net, consists principally of interest earned on our cash and cash equivalents and marketable securities and foreign currency exchange gains or losses. Interest and other income, net was $2.5 million for 2008 compared to $12.0 million for the same period in 2007. The decrease of $9.6 million was primarily attributable to a reduction in interest income as a result of lower average cash and cash equivalents and marketable securities balances in 2008, as well as the achievement of lower investment yields as compared to the prior year. In addition, the significant strengthening of the U.S. dollar in the second half of 2008 resulted in a foreign currency exchange loss in the amount of $3.6 million due primarily to the requirement to mark-to-market certain intercompany loan balances with certain of our European subsidiaries.
Income Tax Expense. For the year ended December 31, 2008, we recorded an income tax benefit of $33.8 million compared to income tax expense of $28.4 million in 2007. The decrease in the effective income tax rate for the year ended December 31, 2008 to (14.8)% from 41.4% for the year ended December 31, 2007 was primarily a result of our $229.2 million loss from continuing operations before income taxes associated with the goodwill impairment, and the recognition of $10.0 million in tax benefits related to the reversal of contingency reserves due to the expiration of certain statutes of limitations.
Liquidity and Capital Resources
In recent years, we have financed our operations and our cash acquisitions primarily through working capital generated from operations. At December 31, 2009, our combined cash and cash equivalents and marketable securities balances totaled $180.5 million ($22.0 million of which is classified as non-current as more fully described under "Marketable Securities" below).
Net cash provided by operating activities totaled $123.7 million for the year ended December 31, 2009 compared to $130.9 million in 2008 and $142.5 million in 2007. The decrease in net cash provided by operating activities of $7.2 million from 2008 to 2009 was primarily due to a decrease in net income before non-cash depreciation and amortization, stock-based compensation and goodwill impairment in our discontinued lead generation business offset by lower income tax payments. The decrease in net cash provided by operating activities of $11.6 million from 2007 to 2008 was primarily due to higher income tax payments in 2008 as compared to 2007.
Net cash used in investing activities for the year ended December 31, 2009 of $59.0 million was the result of earnout payments related to the acquisition of MeziMedia of $62.7 million and purchases of property and equipment of $4.6 million, offset by proceeds from the maturity and sale of marketable securities of $8.3 million. Net cash provided by investing activities for the year ended December 31, 2008 of $67.4 million was the result of net sales and maturities of marketable securities of $168.3 million and cash proceeds from the disposition of businesses of $11.7 million, offset by earnout payments related to the acquisition of MeziMedia of $105.4 million and the use of $7.2 million for equipment purchases. Net cash used in investing activities for the year ended December 31, 2007 of $110.5 million was the result of net cash used of $102.1 million, net, related to the acquisition of MeziMedia and $9.3 million used for equipment purchases, offset by proceeds from the net sales and maturities of marketable securities of $0.9 million.
35
Net cash used in financing activities for the year ended December 31, 2009 of $32.1 million was primarily attributable to the use of $35.1 million to repurchase common stock under our stock repurchase program, offset by proceeds from exercises of stock options of $2.9 million. Net cash used in financing activities for the year ended December 31, 2008 of $148.8 million was primarily attributable to the use of $151.3 million to repurchase our common stock under our stock repurchase program. Net cash used in financing activities for the year ended December 31, 2007 of $26.3 million was primarily attributable to $44.0 million used to repurchase our common stock under our stock repurchase program, offset by proceeds of $13.2 million received from the exercises of stock options and $4.5 million of excess tax benefits from stock option exercises.
Marketable Securities
Marketable securities as of December 31, 2009 consisted of auction rate securities ("ARS") collateralized by student loan portfolios that are government supported or privately insured. As of December 31, 2009, our marketable securities portfolio included ARS with a par value of $27.6 million and an estimated fair value of $22.0 million. ARS are designed to provide liquidity via a dutch auction process that resets the applicable interest rate at predetermined calendar intervals (usually every seven to thirty-five days) and historically have allowed existing investors to either rollover their holdings, whereby they would continue to own their respective interest in the ARS, or gain immediate liquidity by selling such ARS at par. Beginning in February 2008, the auctions for our ARS began failing due to insufficient demand for these securities. As a result of these failed auctions, we have been unable to liquidate these securities and the interest rates on these ARS reset to contractually stipulated "fail rates" that are variable based on short-term municipal bond or other market indices. In the event we need to sell these ARS, we will not be able to do so until a future auction on these investments is successful, the issuer redeems the outstanding securities, the securities mature, or we sell the securities in the secondary market.
As a result of the remaining uncertainty in the market for ARS, we have classified these investments as "non-current" in the accompanying consolidated balance sheet as of December 31, 2009. Additionally, we have reduced the fair value for these investments from their par value of $27.6 million to an estimated fair value of $22.0 million. Because we do not currently intend to sell any of our ARS at a significant loss, nor do we believe we will be required to sell any of these securities before recovering their cost basis, we consider this reduction in value to be temporary, and have recorded it as an unrealized loss in accumulated other comprehensive income. During 2009, we liquidated $6.3 million of our ARS and received net proceeds of $6.2 million. As a result, we reversed $2.6 million of previously recorded unrealized loss associated with these redeemed securities and recorded a realized loss of $147,000.
As discussed in Note 3 to our consolidated financial statements, we adopted new accounting guidance for fair value estimates as of January 1, 2008. We have determined that we utilize unobservable (Level 3) inputs in establishing the estimated fair value of the ARS of $22.0 million at December 31, 2009. In periods prior to February 2008, due to successful auctions, quoted market prices were readily available for these ARS, which would qualify as Level 1 inputs under GAAP. However, due to the events discussed above which resulted in the lack of an active market for ARS, and due to the lack of other observable market data with similar characteristics to our ARS holdings, we have estimated the fair values of these ARS utilizing a discounted cash flow analysis as of December 31, 2009. These analyses consider, among other factors, the collateralization underlying the security, the creditworthiness of the counterparty, the timing of expected future cash flows, and expectations of when the ARS are expected to have successful auctions. Due to these events, we reclassified all of our ARS fair value measurements as Level 3 in the first quarter of 2008.
36
Line of Credit
In November 2008, we entered into a $100 million line of credit with a bank group. The line of credit has a term of three years and the availability under the line of credit is subject to our meeting certain financial and non-financial covenants, as more fully described in Note 15 to our consolidated financial statements. The line of credit provides us with additional financial flexibility for pursuing acquisitions, repurchasing our common stock, and for general corporate purposes. We did not borrow against the line of credit during 2009, and thus no amount was outstanding against the line of credit at December 31, 2009.
Stock Repurchase Program
In September 2001, our board of directors authorized a stock repurchase program (the "Program") to allow for the repurchase of shares of our common stock at prevailing market prices in the open market or through unsolicited negotiated transactions. Since the inception of the Program and through December 31, 2008, our board of directors had authorized a total of $479.1 million for repurchases under the Program, and we had repurchased a total of 47.1 million shares of our common stock for $374.2 million, leaving approximately $105 million available under the Program as of December 31, 2008. During the year ended December 31, 2009, we repurchased 3.6 million shares of our common stock for $35.1 million, leaving $69.9 million available under the Program as of December 31, 2009.
In the period from January 1, 2010 through February 25, 2010, we repurchased an additional 1.9 million shares of our common stock for $17.7 million, leaving $52.2 million available under the program as of February 25, 2010.
Repurchases have been funded from available working capital, and all shares have been retired subsequent to their repurchase. There is no guarantee as to the exact number of shares that will be repurchased by us, and we may discontinue repurchases at any time that management or our board of directors determines additional repurchases are not warranted. The amounts authorized by our board of directors exclude broker commissions.
Commitments and Contingencies
Contractual obligations at December 31, 2009 are as follows (in thousands):
| |
Payments due by period | |||||||||||||||||||
|---|---|---|---|---|---|---|---|---|---|---|---|---|---|---|---|---|---|---|---|---|
| |
Total | Less than 1 year |
1 to less than 3 years |
3 to less than 5 years |
More than 5 years |
Other | ||||||||||||||
Operating leases(1) |
$ | 20,205 | $ | 5,600 | $ | 7,564 | $ | 4,348 | $ | 2,693 | $ | — | ||||||||
Purchase obligations(2) |
2,286 | 1,924 | 362 | — | — | — | ||||||||||||||
Liability for unrecognized tax benefits(3) |
52,032 | — | — | — | — | 52,032 | ||||||||||||||
Total contractual obligations |
$ | 74,523 | $ | 7,524 | $ | 7,926 | $ | 4,348 | $ | 2,693 | $ | 52,032 | ||||||||
- (1)
- The
operating lease obligations shown in the table have not been reduced by minimum non-cancelable sublease rentals aggregating $557,000. We
remain secondarily liable under these leases in the event that any sublessee defaults under the sublease terms. We do not currently believe that material payments will be required as a result of the
secondary liability provisions of the primary lease agreements.
- (2)
- Purchase obligations include agreements to purchase goods or services that are enforceable, legally binding and specify all significant terms. Purchase obligations exclude agreements that are cancelable without penalty.
37
- (3)
- Please refer to Note 9 to the consolidated financial statements for a description of the liability for unrecognized tax benefits. As more fully described in Note 9, because the ultimate resolution of this unrecognized tax benefit depends on many factors and assumptions, we are not able to estimate the timing of any payments that may result from this liability.
Other commercial commitments as of December 31, 2009 are as follows (in thousands):
| |
Other Commercial Commitments | ||||||||||||||||
|---|---|---|---|---|---|---|---|---|---|---|---|---|---|---|---|---|---|
| |
Total | Less than 1 year |
1 to less than 3 years |
3 to less than 5 years |
More than 5 years |
||||||||||||
Standby letters of credit |
$ | 521 | $ | 521 | $ | — | $ | — | $ | — | |||||||
The standby letters of credit are maintained pursuant to certain of our lease agreements and remain in effect at declining levels through the terms of the related leases.
In the ordinary course of business, we may provide indemnifications of varying scope and terms to customers, vendors, lessors, business partners, and other parties with respect to certain matters, including, but not limited to, losses arising out of our breach of such agreements, services to be provided by us, or from intellectual property infringement claims made by third-parties. In addition, we have entered into indemnification agreements with our directors and certain of our officers and employees that will require us, among other things, to indemnify them against certain liabilities that may arise by reason of their status or service as directors, officers or employees. We have also agreed to indemnify certain former officers, directors and employees of acquired companies in connection with the acquisition of such companies. We maintain director and officer insurance, which may cover certain liabilities arising from our obligation to indemnify our directors and certain of our officers, employees and former officers, directors and employees of acquired companies, in certain circumstances.
It is not possible to determine the maximum potential amount of exposure under these indemnification agreements due to the limited history of prior indemnification claims and the unique facts and circumstances involved in each particular agreement. Such indemnification agreements may not be subject to maximum loss clauses.
Capital Resources
We believe that the combination of: our existing cash and cash equivalents; our liquid marketable securities; our $100 million line of credit; and our expected future cash flows from operations, will provide us with sufficient liquidity to fund our operations and capital requirements for at least the next twelve months. However, it is possible that we may need or elect to raise additional funds to fund our activities beyond the next year or to consummate acquisitions of other businesses, products or technologies. We could raise such funds by selling more stock to the public or to selected investors, or by borrowing, whether under the existing line of credit or a new facility. In addition, even though we may not need additional funds, we may still elect to sell additional equity securities for other reasons. We cannot assure you that we will be able to obtain additional funds on commercially favorable terms, or at all. If we raise additional funds by issuing additional equity or convertible debt securities, the ownership percentages of existing stockholders may be reduced. In addition, the equity or debt securities that we issue may have rights, preferences or privileges senior to those of the holders of our common stock.
Although we believe we have sufficient capital to fund our activities for at least the next twelve months, our future capital requirements may vary materially from those now planned. The amount of capital that we will need in the future will depend on many factors, including:
- •
- the macroeconomic environment;
38
- •
- the market acceptance of our products and services;
- •
- the levels of promotion and advertising that will be required to launch our new products and services and achieve and
maintain a competitive position in the marketplace;
- •
- our business, product, capital expenditures and technology plans, and product and technology roadmaps;
- •
- capital improvements to new and existing facilities;
- •
- technological advances;
- •
- our competitors' responses to our products and services;
- •
- our pursuit of strategic transactions, including mergers and acquisitions;
- •
- the extent of dislocations in the credit markets in the United States and the related impact on the liquidity of our
marketable securities;
- •
- our stock repurchase program; and
- •
- our relationships with our advertiser customers and publisher partners.
Off-Balance Sheet Arrangements
None.
Critical Accounting Policies and Estimates
Management's discussion and analysis of financial condition and results of operations is based upon our consolidated financial statements, which have been prepared in accordance with GAAP. The preparation of these consolidated financial statements requires us to make estimates and assumptions that affect the reported amounts of assets, liabilities, revenue, and expenses, and related disclosure of contingent assets and liabilities. On an ongoing basis, we evaluate our estimates and assumptions, including, but not limited to, those related to revenue recognition, allowance for doubtful accounts and sales credits, investments, income taxes, goodwill and other intangible assets, and contingencies and litigation. We base our estimates on historical experience and on various other assumptions that are believed to be reasonable under the circumstances, the results of which form the basis for making judgments about the carrying values of assets and liabilities that are not readily apparent from other sources. Actual results may differ from these estimates and assumptions.
We apply the following critical accounting policies in the preparation of our consolidated financial statements:
- •
- Revenue Recognition. We recognize revenue in accordance with GAAP. Accordingly, we recognize revenue when the following criteria have been met: persuasive evidence of an arrangement exists, no significant Company obligations remain, collection of the related receivable is reasonably assured, and the fees are fixed or determinable. To date, our agreements have not required a guaranteed minimum number of click-throughs or actions.
Our Media and Owned & Operated Websites segment revenue is recognized in the period that the advertising impressions, click-throughs or actions occur, when lead-based information is delivered or, for our search syndication services, in the period that a visitor to a website in our search syndication network completes a qualified search transaction, provided that no significant Company obligations remain, collection of the resulting receivable is reasonably assured, and the fees are fixed or determinable. We act as a principal in Media and Owned & Operated Websites segment transactions in that we are the primary obligor to the advertiser customer. In accordance with GAAP, revenue is recognized in our Media and Owned & Operated Websites
39
segments on a gross basis, and publisher expenses that are directly related to a revenue-generating event are recorded as a component of cost of revenue.
Revenue for our Affiliate Marketing segment is generated primarily from: commission fees earned from transactions, including product sales made by our advertiser customers, occurring on our affiliate marketing networks; fixed monthly fees from program management services; commission fees earned for our search engine marketing ("SEM") services; and, to a lesser extent, implementation fees. Commission fee revenue from transactions on our affiliate marketing networks and from our SEM services are recognized on a net basis as we act as an agent in these transactions and the payments to publishers are the contractual obligation of the advertiser customers. Commission fee revenue is recognized in the period that our advertiser customer generates a sale or other agreed-upon action on our affiliate marketing network or as a result of our SEM services, provided that no significant Company obligations remain, collection of the resulting receivable is reasonably assured, and the fees are fixed or determinable. Program management services fees revenue is recognized over the contractual service period, provided no significant Company obligations remain, collection of the resulting receivable is reasonably assured, and the fees are fixed or determinable. Implementation fee revenue is recognized over the estimated customer lives, provided no significant Company obligations remain, collection of the resulting receivable is reasonably assured, and the fees are fixed or determinable.
Revenue for our Technology segment is generated primarily from fixed monthly fees or monthly transaction volume-based fees earned by us for making our technologies available to our customers on an application services provider ("ASP") basis. Such revenue is recognized monthly provided no significant Company obligations remain, collection of the resulting receivable is reasonably assured, and the fees are fixed or determinable. We also generate a nominal amount of other services fee revenue in our Technology segment. Such other services fee revenue is recognized when the services are performed provided no significant Company obligations remain, collection of the resulting receivable is reasonably assured, and the fees are fixed or determinable.
Our customers do not have the right to take possession of our software at any time during or after the term of the relevant customer agreement. Accordingly, our revenue recognition is outside the scope of prescribed accounting guidance relevant to software revenue recognition.
Deferred revenue consists primarily of the unrecognized portion of implementation fee revenue for our Affiliate Marketing segment. Prepayments and amounts on deposit from customers are classified as an advertiser deposit liability.
We estimate a provision for sales returns which is recorded as a reduction to revenue. The provision for sales returns reflects an estimate of commission based fee reversals related to product returns from consumers of our Affiliate Marketing customers. In determining the estimate for sales returns, we rely upon historical data, contract information and other factors. The estimated provision for sales returns can vary from actual results. More or less product may be returned from consumers of our Affiliate Marketing customers as compared to what was estimated. These factors and unanticipated changes in the economic and industry environment could make the provision for sales returns estimates differ from actual returns.
We recorded a provision for sales returns of $6.0 million and $7.6 million as a reduction to our revenue during the years ended December 31, 2009 and 2008, respectively. The decrease in the provision for sales returns is primarily a result of lower affiliate marketing revenue. If our assumptions with regard to the returns ratios were to change such that our estimated returns ratios were to increase by a factor of 10%, the result would be an increase in the December 31,
40
- •
- Allowance for Doubtful Accounts and Sales Credits. We estimate our allowance for doubtful accounts using two methods. First, we evaluate specific accounts where information indicates our customers may have an inability to meet financial obligations, such as due to bankruptcy, and receivable amounts outstanding for an extended period beyond contractual terms. In these cases, we use assumptions and judgment, based on the best available facts and circumstances, to record a specific allowance for those customers against amounts due to reduce the receivable to the amount expected to be collected. These specific allowances are re-evaluated and adjusted as additional information is received. Second, an allowance is established for all customers based on a range of loss percentages applied to receivables aging categories based upon our historical collections and write-off experience. The amounts calculated from each of these methods are analyzed to determine the total amount of the allowance for doubtful accounts. We also estimate an allowance for sales credits based upon our historical sales credits experience. Historically, actual bad debt write-offs and sales credits have not significantly differed from our estimates. However, factors including higher than expected default rates or sales credits may result in future write-offs that are greater than our estimates.
- •
- Marketable Securities. Marketable securities are classified as available-for-sale and accordingly are recorded at fair value, based on quoted market rates, with unrealized gains and losses reflected as a separate component of stockholders' equity titled accumulated other comprehensive income (loss), net of tax, until realized or until a determination is made that an other-than-temporary decline in market value has occurred. Factors considered by management in assessing whether an other-than-temporary impairment has occurred include: the nature of the investment; whether the decline in fair value is attributable to specific adverse conditions affecting the investment; the financial condition of the investee; the severity and the duration of the impairment; and whether we intend to sell the investment or will be required to sell the investment before recovery of its amortized cost basis. When it is determined that an other-than-temporary impairment has occurred, the investment is written down to its market value at the end of the period in which it is determined that an other-than-temporary decline has occurred. The cost of marketable securities sold is based upon the specific identification method.
2009 allowance for sales returns of $119,000 and a corresponding decrease to revenue for the year then ended.
As of December 31, 2009, we recorded an allowance for doubtful accounts and sales credits of $4.2 million, which represents an allowance percentage of 5.8% of our gross accounts receivable balance of $72.7 million. If our assumptions and estimates regarding the ultimate collectability of our outstanding accounts receivable balances and/or our sales credits changed to warrant a 100 basis point increase in the ending allowance percentage, the result would be an increase in the December 31, 2009 allowance for doubtful accounts and sales credits of approximately $727,000 and a corresponding decrease in our operating income for the year then ended.
- •
- Stock-Based Compensation. GAAP requires us to estimate the fair value of stock options on the date of grant using an option-pricing model. We calculated the estimated fair value of our stock
See further discussion of our marketable securities portfolio and auction rate securities holdings in the "Liquidity and Capital Resources" section of Item 7 of this Form 10-K under the header "Marketable Securities".
41
options granted during 2008 on the date of grant using the Black-Scholes option-pricing model and the following weighted-average assumptions:
Risk-free interest rates |
2.4 | % | ||
Expected lives (in years) |
3.6 | |||
Dividend yield |
0 | % | ||
Expected volatility |
55 | % |
- •
- Income Taxes. We use the asset and liability method of accounting for income taxes in accordance with GAAP. Under this method, income tax expense or benefit is recognized for the amount of: (i) taxes payable or refundable for the current year; and, (ii) deferred tax consequences of temporary differences resulting from matters that have been recognized in an entity's financial statements or tax returns. FASB guidance requires that management make judgments, assumptions and estimates to determine our income tax expense and also our deferred tax assets and liabilities and any valuation allowance to be recorded against a deferred tax asset. Our judgments, assumptions and estimates relative to the income tax expense take into account enacted tax laws, our interpretation of tax laws and possible outcomes of audits if and when conducted by tax authorities. Changes in tax laws or our interpretation of tax laws and the resolution of tax audits, if and when conducted by tax authorities, could significantly impact the amount of income tax expense in our consolidated financial statements.
There were no stock options granted in 2009. Our computation of expected volatility for the year ended December 31, 2008 was based on a combination of historical volatility and market-based implied volatility from traded options on our common stock. We believe that including market-based implied volatility in the calculation of expected volatility results in a more accurate measure of the volatility expected in future periods. We estimated the expected life of each stock option granted in 2008 using the short-cut method permissible under GAAP, which utilizes the weighted-average expected life of each tranche of the granted stock option, which was determined based on the sum of each tranche's vesting period plus one-half of the period from the vesting date of each tranche to its expiration. The risk-free interest rate is based on the implied yield available on U.S. Treasury securities with an equivalent remaining term. Based upon the assumptions listed above, the weighted-average estimated grant date fair value of stock options issued for the year ended December 31, 2008 was $8.89. The value of the portion of stock options that are ultimately expected to vest is recognized as an expense over the requisite service periods using the straight-line attribution method. If our expectations regarding the number of stock options that ultimately vest are incorrect, we may experience unexpected volatility in the stock-based compensation ultimately recorded in any given period.
The fair value of stock options, as determined by the Black-Scholes option-pricing model, can vary significantly depending on the assumptions used. However, given the limited number of stock options granted in 2008 (150,000), we do not believe that changes in the underlying assumptions used would result in a material change to the aggregate valuation of the stock options.
During 2008, we granted 2,028,500 shares of restricted stock. The stock based compensation associated with restricted stock is a function of the number of awards multiplied by the fair value of our common stock on the grant date, amortized on a straight-line basis over the relevant vesting period. During 2009 we did not grant any stock options or shares of restricted stock.
As of December 31, 2009, we have gross deferred tax assets of $76.5 million, relating to net operating loss carryforwards, goodwill impairment and certain other temporary differences. As of December 31, 2009, based upon both positive and negative evidence available, we have
42
- •
- Goodwill and Other Intangible Assets. As of December 31, 2009, we had goodwill and other intangible assets with net balances of $157.1 million and $38.7 million, respectively. Goodwill is tested for impairment at the reporting unit level on an annual basis as of December 31 or between annual tests whenever facts and circumstances indicate that goodwill might be impaired. As of December 31, 2009, our reporting units consisted of the Media, Affiliate Marketing, Owned & Operated Websites, and Technology operating segments. However, our Technology reporting unit has no goodwill. Application of the goodwill impairment test requires certain estimates and assumptions, including the identification of reporting units, assigning assets and liabilities to reporting units, and determining the fair value of each reporting unit. We have determined the fair value of each reporting unit using a discounted cash flow approach, giving consideration to the market valuation approach.
determined it is more likely than not that certain deferred tax assets primarily relating to net operating loss carryforwards in foreign jurisdictions and unrealized loss on marketable securities may not be realizable. Accordingly, we have recorded a valuation allowance of $3.7 million against these deferred tax assets as of December 31, 2009. Should we determine in the future that we will be able to realize these deferred tax assets, or not be able to realize all or part of our remaining net deferred tax assets recorded as of December 31, 2009, an adjustment to the net deferred tax assets would impact net income in the period such determination was made.
In addition to our deferred tax assets, management is required to make judgments and assumptions related to our uncertain tax positions. As further described in Note 9 to the consolidated financial statements, as of December 31, 2009 we have recorded a liability for uncertain tax positions of $52.0 million. The ultimate resolutions of these uncertain tax positions may take several years. Such resolutions could result in additional tax payments by us to the applicable tax jurisdiction(s). If the ultimate resolutions of any of our uncertain tax positions results in either (a) an additional tax payment that is lower than our liability recorded for such uncertain tax position or (b) no additional tax payment, then we would record a reduction to our liability for uncertain tax positions and a corresponding decrease to our income tax expense in the period such resolution is achieved. Accordingly, a resolution of one or more of our uncertain tax positions in any given period could have a material impact to our reported net income for such period. However, because the ultimate resolution of our uncertain tax positions depends on many factors and assumptions, we are not able to estimate the range of potential changes in our liability for uncertain tax positions or the timing of such changes.
As a result of our 2009 annual goodwill impairment test, no goodwill impairment was recorded related to our continuing operations as the estimated fair value of each reporting unit exceeded the carrying value. Based on our 2009 impairment testing for our continuing operations, there would have to be significant unfavorable changes to our estimates and assumptions for an impairment to exist.
However, we recorded a goodwill impairment charge of $3.2 million in 2009 related to our discontinued operations. We do not believe that significant changes to our estimates and assumptions would result in a significant change to the goodwill impairment charge for our discontinued operations.
In addition to the accounting for goodwill as described above, we amortize other intangible assets over their estimated economic useful lives. We record an impairment charge on these assets when we determine that their carrying value may not be recoverable. In determining if impairment exists, we estimate the undiscounted cash flows to be generated from the use and ultimate disposition of these assets. If impairment is indicated based on a comparison of the assets' carrying values and the undiscounted cash flows, the impairment loss is measured as the amount by which the carrying amount of the intangible assets exceeds the fair market value of
43
- •
- Contingencies and Litigation. We evaluate contingent liabilities including threatened or pending litigation in accordance with GAAP and record accruals when the outcome of these matters is deemed probable and the liability is reasonably estimable. We make these assessments based on the specific facts and circumstances of each matter.
the intangible assets. Our estimates of future cash flows attributable to our other intangible assets require significant judgments and assumptions, including anticipated industry and economic conditions. Different assumptions and judgments could materially affect the calculation of the fair value of any individual other intangible assets which could lead to impairment. No impairment was identified in 2009 related to our continuing operations. However, we recorded an impairment charge of $2.3 million as of December 31, 2009 related to other intangible assets within discontinued operations.
Recently Issued Accounting Pronouncements
On January 1, 2009, we adopted new accounting guidance issued by the Financial Accounting Standards Board ("FASB") for business combinations. The new accounting guidance establishes principles and requirements for how an acquirer in a business combination recognizes and measures in its financial statements the identifiable assets acquired, liabilities assumed, and any noncontrolling interests in the acquiree, as well as the goodwill acquired. Significant changes from previous guidance resulting from this new guidance include the expansion of the definitions of a "business" and a "business combination." For all business combinations (whether partial, full or step acquisitions), the acquirer will record 100% of all assets and liabilities of the acquired business, including goodwill, generally at their fair values; contingent consideration will be recognized at its fair value on the acquisition date and; for certain arrangements, changes in fair value will be recognized in earnings until settlement; and acquisition-related transaction and restructuring costs will be expensed rather than treated as part of the cost of the acquisition. The new accounting guidance also establishes disclosure requirements to enable users to evaluate the nature and financial effects of the business combination. The adoption of this accounting guidance did not have a material impact on our consolidated financial statements.
In April 2009, the FASB revised the authoritative guidance that defines disclosure requirements for the fair value of financial instruments, to require disclosures about fair value of financial instruments of publicly traded companies for interim reporting periods as well as in annual financial statements. The guidance is effective for interim and annual periods ending after June 15, 2009. The adoption of the guidance did not impact our consolidated financial statements. See Note 3 to our consolidated financial statements for further information.
In April 2009, the FASB issued updated authoritative guidance on other-than-temporary impairments. The objective of an other-than-temporary impairment analysis under existing GAAP is to determine whether the holder of an investment in a debt or equity security for which changes in fair value are not regularly recognized in earnings (such as securities classified as held-to-maturity or available-for-sale) should recognize a loss in earnings when the investment is impaired. An investment is impaired if the fair value of the investment is less than its amortized cost basis. This updated guidance amends the other-than-temporary impairment guidance in GAAP for debt securities to make it more operational and to improve the presentation and disclosure of other-than-temporary impairments on debt and equity securities in the financial statements. It does not amend existing recognition and measurement guidance related to other-than-temporary impairments of equity securities. This guidance is effective for interim and annual periods ending after June 15, 2009. In response to the revised guidance, in April 2009, the SEC published a bulletin in which the SEC maintains the staff's previous views related to equity securities. It also amends the SEC's previous bulletin to exclude debt securities from its scope. The adoption of the guidance did not impact our consolidated financial statements.
44
In April 2009, the FASB issued additional authoritative guidance on fair value measurements for estimating fair value when the volume and level of activity for the asset or liability have significantly decreased and on identifying circumstances that indicate a transaction is not orderly. It emphasizes that even if there has been a significant decrease in the volume and level of activity for the asset or liability, and regardless of the valuation technique(s) used, the objective of a fair value measurement remains the same. Fair value is the price that would be received to sell an asset or paid to transfer a liability in an orderly transaction (that is, not a forced liquidation or distressed sale) between market participants at the measurement date under current market conditions. This guidance is effective for interim and annual periods ending after June 15, 2009. Its adoption did not impact our consolidated financial statements.
In April 2009, the FASB revised the authoritative guidance on business combinations. The guidance amends the previously existing provisions for the initial recognition and measurement, subsequent measurement and accounting, and disclosures for assets and liabilities arising from contingencies in business combinations. The revised guidance eliminates the distinction between contractual and non-contractual contingencies, including the initial recognition and measurement criteria and instead carries forward most of the provisions from previous guidance for acquired contingencies. It is effective for contingent assets and contingent liabilities acquired in business combinations for which the acquisition date is on or after the beginning of the first annual reporting period beginning on or after December 15, 2008. The nature and magnitude of the specific effects that this guidance will have on our consolidated financial statements will depend upon the nature, term and size of acquired contingencies resulting from future acquisitions.
In May 2009, the FASB issued authoritative guidance on management's assessment of subsequent events. The guidance is effective prospectively for interim and annual periods ending after June 15, 2009. The guidance requires entities to disclose the date through which subsequent events have been evaluated and whether the date corresponds with the release of the entities' financial statements. The implementation of this standard did not have a material impact on our consolidated financial position and results of operations. See Note 1 to our consolidated financial statements for further information.
In June 2009, the FASB issued the FASB Accounting Standards Codification ("Codification"). The Codification will become the single source for all authoritative GAAP recognized by the FASB to be applied for financial statements issued for periods ending after September 15, 2009. The Codification does not change GAAP and will not have an effect on our financial position, results of operations or liquidity. We have adjusted historical GAAP references herein to reflect accounting guidance references as prescribed by the Codification.
Inflation
Inflation was not a material factor in either revenue or operating expenses during the fiscal years ended December 31, 2009, 2008 and 2007.
45
ITEM 7A. QUANTITATIVE AND QUALITATIVE DISCLOSURES ABOUT MARKET RISK
INTEREST RATE RISK
The primary objective of our investment activities is to preserve capital while at the same time maximizing yields without significantly increasing risk. We are exposed to the impact of interest rate changes and changes in the market values of our investments in marketable securities. Our interest income is sensitive to changes in the general level of U.S. interest rates. Our exposure to market rate risk for changes in interest rates relates primarily to our marketable securities portfolio. We have not used derivative financial instruments in our marketable securities portfolio. We invest a portion of our excess cash in debt instruments of high-quality issuers and, as a matter of policy, limit the amount of credit exposure to any one issuer. We protect and preserve our invested funds by limiting default, market and reinvestment risk. Investments in both fixed-rate and floating-rate interest-earning instruments carry a degree of interest rate risk. Fixed-rate securities may have their fair market value adversely impacted due to a rise in interest rates, while floating-rate securities may produce less income than expected if interest rates fall. Due in part to these factors, our future investment income may fall short of expectations due to changes in interest rates, or we may suffer losses in principal if forced to sell securities which have declined in market value due to changes in interest rates.
Marketable securities as of December 31, 2009 consisted of highly rated auction rate securities ("ARS") collateralized by student loan portfolios that are government supported or privately insured. ARS are designed to provide liquidity via a dutch auction process that resets the applicable interest rate at predetermined calendar intervals (usually every seven to thirty-five days) and historically has allowed existing investors to either rollover their holdings, whereby they would continue to own their respective interest in the ARS, or gain immediate liquidity by selling the ARS at par. See further discussion of our marketable securities portfolio and ARS holdings in the "Liquidity and Capital Resources" section of Item 7 of this Form 10-K under the header "Marketable Securities".
Management's internal investment policy requires a weighted-average time to maturity of the overall investment portfolio to be no greater than 365 days and allows for ARS to be weighted based on the auction reset date. Due to the current illiquidity in the ARS market, we have temporarily excluded our ARS from the determination of compliance with the maturity limitations of our internal investment policy. We classify all of our investments as available-for-sale. Available-for-sale securities are carried at fair value, with unrealized gains and losses, net of tax, reported in a separate component of stockholders' equity. As of December 31, 2009, the net unrealized loss in our investments in marketable securities totaled $5.5 million due to a temporary decline in fair value of our ARS, reflecting the current lack of liquidity for these instruments.
During the year ended December 31, 2009, our investments in marketable securities yielded an annual effective interest rate of 1.0%. If interest rates were to decrease by one half, or 50 basis points, the result would be an annual decrease in our interest income related to our cash and cash equivalents and marketable securities of approximately $156,000.
FOREIGN CURRENCY RISK
We transact business in various foreign countries and are thus subject to exposure from adverse movements in foreign currency exchange rates. This exposure is primarily related to revenue and operating expenses of our foreign subsidiaries, which denominate their transactions primarily in British Pounds, Euros, Swedish Kronor, Japanese Yen, and Chinese Yuan Renminbi. The effect of foreign currency exchange rate fluctuations for the year ended December 31, 2009 was not material to our consolidated results of operations. In 2009 we began hedging certain of our exposures to currency exchange rate fluctuations related to intercompany balances. There were not material gains or losses in 2009 associated with our requirement to mark-to-market certain of our intercompany loan balances or with our hedging activities.
46
In the future, if there were an adverse change of 10% in overall foreign currency exchange rates over an entire year, the result of translations would be a reduction of revenue of approximately $8.8 million, a reduction of income before income taxes of approximately $783,000 and a reduction of net assets, excluding intercompany balances, of approximately $7.6 million. As of December 31, 2009, we had $45.1 million in cash and cash equivalents and $13.5 million in total current liabilities denominated in foreign currencies, including British Pounds, Euros, Swedish Kronor, Japanese Yen, and Chinese Yuan Renminbi.
Our international business is subject to risks typical of an international business, including, but not limited to, differing economic conditions, changes in political climate, differing tax structures, other regulations and restrictions, and foreign currency exchange rate volatility. Accordingly, our future results could be materially and adversely affected by changes in these or other factors.
ITEM 8. FINANCIAL STATEMENTS AND SUPPLEMENTARY DATA
The Company's financial statements, schedules and supplementary data, as listed under Item 15, appear in a separate section of this annual report on Form 10-K beginning on page F-1.
ITEM 9. CHANGES IN AND DISAGREEMENTS WITH ACCOUNTANTS ON ACCOUNTING AND FINANCIAL DISCLOSURE
None.
ITEM 9A. CONTROLS AND PROCEDURES
Disclosure Controls and Procedures
The Company maintains disclosure controls and procedures that are designed to ensure that the information required to be disclosed in the Company's reports under the Securities Exchange Act of 1934, as amended (the "Exchange Act"), is recorded, processed, summarized, and reported within the time periods specified in the SEC's rules and forms, and that such information is accumulated and communicated to management, including the Company's Chief Executive Officer ("CEO") and Chief Financial Officer ("CFO"), as appropriate, to allow timely decisions regarding required disclosure. In designing and evaluating the disclosure controls and procedures, management recognized that any controls and procedures, no matter how well designed and operated, can provide only reasonable assurance of achieving the desired control objectives.
In connection with the preparation of this annual report on Form 10-K as of December 31, 2009, an evaluation was performed under the supervision and with the participation of the Company's management, including the CEO and CFO, of the effectiveness of the design and operation of the Company's disclosure controls and procedures (as defined in Rule 13a-15(e) under the Exchange Act). Based on this evaluation, the Company's CEO and CFO have concluded that the Company's disclosure controls and procedures are effective as of December 31, 2009 to provide reasonable assurance that the information required to be disclosed by it in reports or submitted under the Exchange Act is recorded, processed, summarized, and reported within the time periods specified in the rules and forms of the SEC and that such information is accumulated and communicated to management, including the Company's CEO and CFO, as appropriate, to allow timely decisions regarding required disclosure.
Management's Report on Internal Control over Financial Reporting
The Company's management is responsible for establishing and maintaining adequate internal control over financial reporting as defined in Rules 13a-15(f) and 15d-15(f) under the Exchange Act. The Company's internal control over financial reporting is designed to provide reasonable assurance regarding the reliability of financial reporting and the preparation of consolidated financial statements
47
for external purposes in accordance with generally accepted accounting principles. The Company's internal control over financial reporting includes those policies and procedures that:
- (i)
- pertain
to the maintenance of records that, in reasonable detail, accurately and fairly reflect the transactions and dispositions of its assets,
- (ii)
- provide
reasonable assurance that transactions are recorded as necessary to permit preparation of consolidated financial statements in accordance with
generally accepted accounting principles, and that receipts and expenditures are being made only in accordance with authorizations of the Company's management and directors, and
- (iii)
- provide reasonable assurance regarding prevention or timely detection of any unauthorized acquisition, use or disposition of the Company's assets that could have a material effect on the consolidated financial statements.
Because of its inherent limitations, internal control over financial reporting may not prevent or detect financial statement misstatements. Also, projections of any evaluation of internal control effectiveness to future periods are subject to the risk that controls may become inadequate because of changes in conditions, or that the degree of compliance with the policies or procedures may deteriorate.
The Company's management has assessed the effectiveness of the Company's internal control over financial reporting as of December 31, 2009. In making this assessment, management used the criteria set forth by the Committee of Sponsoring Organizations of the Treadway Commission ("COSO") in Internal Control—Integrated Framework. Based on this evaluation, the Company's management has concluded that the Company's internal control over financial reporting was effective as of December 31, 2009.
The effectiveness of the Company's internal control over financial reporting as of December 31, 2009 has been audited by PricewaterhouseCoopers LLP, an independent registered public accounting firm, as stated in their report which appears in this annual report on Form 10-K.
Changes in Internal Control over Financial Reporting
Additionally, the Company's Chief Executive Officer and Chief Financial Officer have determined that there have been no changes to the Company's internal control over financial reporting during the three-month period ended December 31, 2009 that have materially affected, or are reasonably likely to materially affect, the Company's internal control over financial reporting.
None.
ITEM 10. DIRECTORS AND EXECUTIVE OFFICERS OF THE REGISTRANT
The information required by this Item is incorporated by reference from our definitive Proxy Statement for the 2010 Annual Meeting of Stockholders to be held on or about May 6, 2010.
ITEM 11. EXECUTIVE COMPENSATION
The information required by this Item is incorporated by reference from our definitive Proxy Statement for the 2010 Annual Meeting of Stockholders to be held on or about May 6, 2010.
48
ITEM 12. SECURITY OWNERSHIP OF CERTAIN BENEFICIAL OWNERS AND MANAGEMENT AND RELATED STOCKHOLDER MATTERS
Equity Compensation Plan Information
The following table provides aggregated information with respect to our compensation plans under which equity securities of ValueClick are authorized for issuance as of December 31, 2009:
Plan category
|
Number of securities to be issued upon exercise of outstanding options, warrants and rights |
Weighted-average exercise price of outstanding options, warrants and rights(1) |
Number of securities remaining available for future issuance under equity compensation plans(3) |
|||||||
|---|---|---|---|---|---|---|---|---|---|---|
Equity compensation plans approved by security holders |
3,956,325 | $ | 13.45 | 6,946,089 | ||||||
Equity compensation plans not approved by security holders(2) |
168,401 | $ | 43.70 | — | ||||||
Total |
4,124,726 | $ | 14.66 | 6,946,089 | ||||||
- (1)
- For
additional information with respect to the outstanding option pricing categories as of December 31, 2009, refer to Note 11 to the
consolidated financial statements included in Item 8 "Financial Statements and Supplementary Data."
- (2)
- The
equity compensation plans not approved by security holders represent stock option plans assumed in business combinations.
- (3)
- Of these shares, 956,365 were available under the Employee Stock Purchase Plan and 5,989,724 were available for award grant purposes under the 2002 Stock Incentive Plan. During the current purchase period, which ends on February 26, 2010, an estimated 119,000 shares of the Company's common stock may become issuable under the Employee Stock Purchase Plan. The 2002 Stock Incentive Plan provides for an automatic increase on January 1 of each year equal to 1% of the total outstanding shares of ValueClick common stock as of the last day of the previous year. An additional 838,776 shares were made available under the 2002 Stock Incentive Plan effective January 1, 2010, which are not included in the 6,946,089 shares shown herein.
The remaining information required by this Item is incorporated by reference from our definitive Proxy Statement for the 2010 Annual Meeting of Stockholders to be held on or about May 6, 2010.
ITEM 13. CERTAIN RELATIONSHIPS AND RELATED TRANSACTIONS, AND DIRECTOR INDEPENDENCE
The information required by this Item is incorporated by reference from our definitive Proxy Statement for the 2010 Annual Meeting of Stockholders to be held on or about May 6, 2010.
ITEM 14. PRINCIPAL ACCOUNTANT FEES AND SERVICES
The information required by this Item is incorporated by reference from our definitive Proxy Statement for the 2010 Annual Meeting of Stockholders to be held on or about May 6, 2010.
49
ITEM 15. EXHIBITS AND FINANCIAL STATEMENT SCHEDULE
- (a)
- Documents
filed as part of this annual report on Form 10-K:
- 1.
- Financial Statements. The following consolidated financial statements of ValueClick, Inc. are included in a separate section of this annual report on Form 10-K commencing on the pages referenced below:
| |
|
|
|
Page | |
|||||
|---|---|---|---|---|---|---|---|---|---|---|
|
ValueClick, Inc. Consolidated Financial Statements | |||||||||
|
Report of PricewaterhouseCoopers LLP, Independent Registered Public Accounting Firm |
F-2 | ||||||||
|
Consolidated Balance Sheets at December 31, 2009 and 2008 |
F-3 | ||||||||
|
Consolidated Statements of Operations for the years ended December 31, 2009, 2008 and 2007 |
F-4 | ||||||||
|
Consolidated Statements of Stockholders' Equity for the years ended December 31, 2009, 2008 and 2007 |
F-5 | ||||||||
|
Consolidated Statements of Cash Flows for the years ended December 31, 2009, 2008 and 2007 |
F-6 | ||||||||
|
Notes to Consolidated Financial Statements |
F-7 | ||||||||
|
2. |
Financial Statement Schedule. The following financial statement schedule of ValueClick, Inc. is included in a separate section of this annual report on Form 10-K commencing on the pages referenced below. All other schedules have been omitted because they are not applicable, not required, or the information is included in the consolidated financial statements or notes thereto. |
||||||||
|
Schedule II—Valuation and Qualifying Accounts |
F-41 |
||||||||
- 3.
- Exhibits. The following exhibits are filed as part of, or are incorporated by reference in, this annual report on Form 10-K:
50
Exhibit Number
|
Description of Document | |
|---|---|---|
| 2.1(1) | Amended and Restated Agreement and Plan of Merger, dated as of July 24, 2007 and effective as of July 13, 2007, by and among ValueClick, MM Acquisition Corp. and MeziMedia | |
| 2.2(2) | Agreement and Plan of Merger, dated as of June 13, 2005, by and among ValueClick and E-Babylon, Inc. | |
| 2.3(3) | Agreement and Plan of Merger, dated as of June 10, 2005, by and among ValueClick, Spider Acquisition Corporation and Web Marketing Holdings, Inc. | |
| 2.4(4) | Agreement and Plan of Merger and Reorganization, dated as of August 10, 2005, among ValueClick, Fastclick, Inc. and FC Acquisition Sub, Inc. | |
| 2.5(5) | Agreement and Plan of Merger, dated as of August 6, 2004, by and among ValueClick and Pricerunner AB | |
| 2.6(6) | Stock Purchase Agreement, dated January 29, 2004, by and among ValueClick and Livedoor Co., Ltd (formerly Edge Co., Ltd), a Japanese Corporation | |
| 2.7(7) | Agreement and Plan of Merger, dated as of December 7, 2003, by and among ValueClick, HS Acquisition Corporation and HiSpeed Media, Inc. | |
| 2.8(8) | Agreement and Plan of Merger, dated as of October 9, 2003, by and among ValueClick, NCJ Acquisition Corporation and Commission Junction, Inc. | |
| 2.9(9) | Agreement and Plan of Merger, dated as of May 30, 2003, by and among ValueClick, Search123.com Acquisition Corporation and Search123 | |
| 3.1(10) | Second Amended and Restated Certificate of Incorporation of ValueClick | |
| 3.2(11) | Amended and Restated Bylaws of ValueClick | |
| 4.1 | See Exhibits 3.1 and 3.2 for provisions of the Certificate of Incorporation and Bylaws for ValueClick, Inc. defining the rights of holders of common stock of ValueClick, Inc. | |
| 4.2(12) | Specimen stock certificate for the ValueClick common stock | |
| 4.3(13) | Rights Agreement, dated as of June 4, 2002, between ValueClick, Inc. and Mellon Investor Services LLC, a New Jersey limited liability company, which includes the form of Certificate of Designation for the Series A junior participating preferred stock as Exhibit A, the form of Rights Certificate as Exhibit B and the Summary of Rights to Purchase Series A Preferred Stock as Exhibit C | |
| 10.1(14) | Form of Indemnification Agreement by and between ValueClick and directors and executive officers | |
| 10.2(12) | Deed of Assignment, dated January 1, 1999 by and between Web-Ignite Corporation and ValueClick | |
| 10.3(12) | Trademark Assignment, dated as of May 1, 1998 from Web-Ignite Corporation to ValueClick | |
| 10.4(12) | Exchange Agreement, dated December 31, 1998, by and between ValueClick and ValueClick, LLC | |
| 10.5(12) | Bill of Sale and Assignment and Assumption of Liabilities, dated December 31, 1998 | |
| 10.6(12) | License and Option Agreement, dated January 1, 1999, by and between ValueClick, LLC and ValueClick Japan, Inc. in effect from January 1, 1999 to December 17, 1999 | |
| 10.7(12) | Share Purchase Agreement, dated December 31, 1999, by and between ValueClick and James R. Zarley | |
| 10.8(12) | License Agreement, dated August 17, 1999, between ValueClick and ValueClick Europe, Limited |
51
Exhibit Number
|
Description of Document | |
|---|---|---|
| 10.9(15)† | 1999 Stock Option Plan, as amended, and form of option agreement | |
| 10.10(16)† | 2002 Stock Incentive Plan and form of option agreement | |
| 10.11(17)† | 2007 Employee Stock Purchase Plan and form of subscription agreement | |
| 10.12(23)† | Key Employee Agreement between ValueClick and James R. Zarley dated February 7, 2008 | |
| 10.13(18)† | Key Employee Agreement between ValueClick and Samuel J. Paisley dated January 1, 2002 | |
| 10.14(24)† | Key Employee Agreement between ValueClick and Peter Wolfert dated February 7, 2008 | |
| 10.15(25)† | Key Employee Agreement between ValueClick and Tom A. Vadnais dated February 7, 2008 | |
| 10.16(26)† | Key Employee Agreement between ValueClick and John P. Pitstick dated February 7, 2008 | |
| 10.17(27)† | Key Employee Agreement between ValueClick and Scott P. Barlow dated February 7, 2008 | |
| 10.18(12) | Intercompany License Agreement dated December 19, 1999, between ValueClick and ValueClick Japan, Inc. | |
| 10. 19(28)† | Key Employee Agreement between ValueClick and David Yovanno dated February 7, 2008 | |
| 10.20(20) | Credit Agreement dated as of November 14, 2008 by and among ValueClick, Inc., Wells Fargo Bank, National Association (as Administrative Agent, Swing Line Lender and L/C Issuer), and certain other financial institutions from time to time party thereto | |
| 10.21(21) | Security Agreement dated as of November 14, 2008 by and among ValueClick, Inc., Hi-Speed Media, Inc., Web Marketing Holdings, LLC, Web Clients, LLC, I-Deal Direct Interactive, LLC, Mezi Media, Inc., Search123.com Inc., Mediaplex, Inc., BeFree, Inc., Commission Junction, Inc. and Wells Fargo Bank, National Association | |
| 10.22(22) | Guaranty Agreement dated as of November 14, 2008 by Hi-Speed Media, Inc., Web Marketing Holdings, LLC, Web Clients, LLC, I-Deal Direct Interactive, LLC, Mezi Media, Inc., Search123.com Inc., Mediaplex, Inc., Be Free, Inc., and Commission Junction, Inc. in favor of Wells Fargo Bank, National Association | |
| 10.23(29) | Amendment to Credit Agreement dated as of November 14, 2008 by and among ValueClick, Inc., Wells Fargo Bank, National Association (as Administrative Agent, Swing Line Lender and L/C Issuer), and certain other financial institutions from time to time party thereto | |
| 21.1 | Subsidiaries of ValueClick | |
| 23.1 | Consent of PricewaterhouseCoopers LLP | |
| 31.1 | Certification of CEO Pursuant to Securities Exchange Act Rules 13a-14(a) and 15d-14(a), as adopted Pursuant to Section 302 of the Sarbanes-Oxley Act of 2002 | |
| 31.2 | Certification of CFO Pursuant to Securities Exchange Act Rules 13a-14(a) and 15d-14(a), as adopted Pursuant to Section 302 of the Sarbanes-Oxley Act of 2002 | |
| 32.1 | Certification of CEO and CFO Pursuant to 18 U.S.C. Section 1350, as adopted Pursuant to Section 906 of the Sarbanes-Oxley Act of 2002 |
- †
- Indicates a management contract or compensatory arrangement.
52
- (1)
- Incorporated
by reference to Exhibit 2.1 to the current report on Form 8-K filed by ValueClick on August 2, 2007.
- (2)
- Incorporated
by reference to Exhibit 2.1 to the annual report on Form 10-K filed by ValueClick on March 31, 2006.
- (3)
- Incorporated
by reference to Exhibit 2.1 to the current report on Form 8-K filed by ValueClick on June 29, 2005.
- (4)
- Incorporated
by reference to Exhibit 2.1 to the current report on Form 8-K filed by ValueClick on August 12, 2005.
- (5)
- Incorporated
by reference to Exhibit 2.1 to the annual report on Form 10-K filed by ValueClick on March 31, 2005.
- (6)
- Incorporated
by reference to Exhibit 2.2 to the annual report on Form 10-K filed by ValueClick on March 31, 2005.
- (7)
- Incorporated
by reference to Exhibit 2.6 to the annual report on Form 10-K filed by ValueClick on March 31, 2006.
- (8)
- Incorporated
by reference to Exhibit 2.1 to the current report on Form 8-K/A filed by ValueClick on February 23, 2004.
- (9)
- Incorporated
by reference to Exhibit 2.1 to the current report on Form 8-K filed by ValueClick on June 11, 2003.
- (10)
- Incorporated
by reference to Exhibit 3.1 to the annual report on Form 10-K filed by ValueClick on March 31, 2006.
- (11)
- Incorporated
by reference to Exhibit 3.2 to the annual report on Form 10-K filed by ValueClick on March 31, 2006.
- (12)
- Incorporated
by reference from Registration Statement on Form S-1 (File No. 333-88765), as amended, originally filed
with the Securities and Exchange Commission on October 12, 1999.
- (13)
- Incorporated
by reference to Exhibit 4 to the current report on Form 8-K filed by ValueClick on June 14, 2002.
- (14)
- Incorporated
by reference to Exhibit 10.1 to the annual report on Form 10-K filed by ValueClick on March 31, 2006.
- (15)
- Incorporated
by reference from Registration Statement on Form S-8 (File No. 333-61278) originally filed with the
Securities and Exchange Commission on April 19, 2001.
- (16)
- Incorporated
by reference from Registration Statement on Form S-8 (File No. 333-89396) originally filed with the
Securities and Exchange Commission on May 30, 2002.
- (17)
- Incorporated
by reference from Registration Statement on Form S-8 (File No. 333-145853) originally filed with the
Securities and Exchange Commission on August 31, 2007.
- (18)
- Incorporated
by reference to Exhibit 10.15 to the annual report on Form 10-K filed by ValueClick on March 28, 2003.
- (19)
- Not
used.
- (20)
- Incorporated
by reference to Exhibit 10.1 to the current report on Form 8-K filed by ValueClick on November 18, 2008.
- (21)
- Incorporated by reference to Exhibit 10.2 to the current report on Form 8-K filed by ValueClick on November 18, 2008.
53
- (22)
- Incorporated
by reference to Exhibit 10.3 to the current report on Form 8-K filed by ValueClick on November 18, 2008.
- (23)
- Incorporated
by reference to Exhibit 10.12 to the annual report on Form 10-K filed by ValueClick on February 29, 2008.
- (24)
- Incorporated
by reference to Exhibit 10.14 to the annual report on Form 10-K filed by ValueClick on February 29, 2008.
- (25)
- Incorporated
by reference to Exhibit 10.15 to the annual report on Form 10-K filed by ValueClick on February 29, 2008.
- (26)
- Incorporated
by reference to Exhibit 10.16 to the annual report on Form 10-K filed by ValueClick on February 29, 2008.
- (27)
- Incorporated
by reference to Exhibit 10.17 to the annual report on Form 10-K filed by ValueClick on February 29, 2008.
- (28)
- Incorporated
by reference to Exhibit 10.19 to the annual report on Form 10-K filed by ValueClick on February 29, 2008.
- (29)
- Incorporated by reference to Exhibit 99.2 to the current report on Form 8-K filed by ValueClick on February 1, 2010.
54
INDEX TO CONSOLIDATED FINANCIAL STATEMENTS
F-1
REPORT OF INDEPENDENT REGISTERED PUBLIC ACCOUNTING FIRM
To
the Board of Directors and Stockholders of
ValueClick, Inc.
In our opinion, the consolidated financial statements listed in the index appearing under Item 15(a)(1) present fairly, in all material respects, the financial position of ValueClick, Inc. and its subsidiaries at December 31, 2009 and 2008, and the results of their operations and their cash flows for each of the three years in the period ended December 31, 2009 in conformity with accounting principles generally accepted in the United States of America. In addition, in our opinion, the financial statement schedule listed in the index appearing under Item 15(a)(2) presents fairly, in all material respects, the information set forth therein when read in conjunction with the related consolidated financial statements. Also in our opinion, the Company maintained, in all material respects, effective internal control over financial reporting as of December 31, 2009, based on criteria established in Internal Control—Integrated Framework issued by the Committee of Sponsoring Organizations of the Treadway Commission (COSO). The Company's management is responsible for these financial statements and financial statement schedule, for maintaining effective internal control over financial reporting and for its assessment of the effectiveness of internal control over financial reporting, included in Management's Report on Internal Control over Financial Reporting appearing under Item 9A. Our responsibility is to express opinions on these financial statements, on the financial statement schedule, and on the Company's internal control over financial reporting based on our integrated audits. We conducted our audits in accordance with the standards of the Public Company Accounting Oversight Board (United States). Those standards require that we plan and perform the audits to obtain reasonable assurance about whether the financial statements are free of material misstatement and whether effective internal control over financial reporting was maintained in all material respects. Our audits of the financial statements included examining, on a test basis, evidence supporting the amounts and disclosures in the financial statements, assessing the accounting principles used and significant estimates made by management, and evaluating the overall financial statement presentation. Our audit of internal control over financial reporting included obtaining an understanding of internal control over financial reporting, assessing the risk that a material weakness exists, and testing and evaluating the design and operating effectiveness of internal control based on the assessed risk. Our audits also included performing such other procedures as we considered necessary in the circumstances. We believe that our audits provide a reasonable basis for our opinions.
A company's internal control over financial reporting is a process designed to provide reasonable assurance regarding the reliability of financial reporting and the preparation of financial statements for external purposes in accordance with generally accepted accounting principles. A company's internal control over financial reporting includes those policies and procedures that (i) pertain to the maintenance of records that, in reasonable detail, accurately and fairly reflect the transactions and dispositions of the assets of the company; (ii) provide reasonable assurance that transactions are recorded as necessary to permit preparation of financial statements in accordance with generally accepted accounting principles, and that receipts and expenditures of the company are being made only in accordance with authorizations of management and directors of the company; and (iii) provide reasonable assurance regarding prevention or timely detection of unauthorized acquisition, use, or disposition of the company's assets that could have a material effect on the financial statements.
Because of its inherent limitations, internal control over financial reporting may not prevent or detect misstatements. Also, projections of any evaluation of effectiveness to future periods are subject to the risk that controls may become inadequate because of changes in conditions, or that the degree of compliance with the policies or procedures may deteriorate.
/s/ PricewaterhouseCoopers LLP
Los
Angeles, California
February 26, 2010
F-2
VALUECLICK, INC.
CONSOLIDATED BALANCE SHEETS
| |
As of December 31, | |||||||||
|---|---|---|---|---|---|---|---|---|---|---|
| |
2009 | 2008 | ||||||||
| |
(in thousands, except share data) |
|||||||||
Assets |
||||||||||
Current assets: |
||||||||||
Cash and cash equivalents |
$ | 158,497 | $ | 122,487 | ||||||
Marketable securities |
— | 2,175 | ||||||||
Accounts receivable, net of allowances of $4,225 and $5,886 as of December 31, 2009 and 2008, respectively |
68,484 | 108,611 | ||||||||
Prepaid expenses and other current assets |
5,246 | 5,155 | ||||||||
Income taxes receivable |
7,629 | 4,313 | ||||||||
Deferred tax assets |
7,981 | 11,047 | ||||||||
Current assets held for sale |
11,098 | — | ||||||||
Total current assets |
258,935 | 253,788 | ||||||||
Assets held for sale, less current portion |
25,777 | — | ||||||||
Marketable securities, less current portion |
22,026 | 25,750 | ||||||||
Property and equipment, net |
11,272 | 15,514 | ||||||||
Goodwill |
157,123 | 172,583 | ||||||||
Intangible assets acquired in business combinations, net |
38,718 | 80,042 | ||||||||
Deferred tax assets, less current portion |
51,357 | 53,661 | ||||||||
Other assets |
1,354 | 1,941 | ||||||||
Total assets |
$ | 566,562 | $ | 603,279 | ||||||
Liabilities and Stockholders' Equity |
||||||||||
Current liabilities: |
||||||||||
Accounts payable and accrued expenses |
$ | 91,703 | $ | 173,407 | ||||||
Income taxes payable |
1,136 | 1,722 | ||||||||
Deferred tax liabilities |
9 | 15 | ||||||||
Deferred revenue |
1,150 | 1,461 | ||||||||
Liabilities related to assets held for sale |
4,406 | — | ||||||||
Total current liabilities |
98,404 | 176,605 | ||||||||
Income taxes payable, less current portion |
60,154 | 71,021 | ||||||||
Deferred tax liabilities, less current portion |
1,515 | 2,174 | ||||||||
Total liabilities |
160,073 | 249,800 | ||||||||
Commitments and contingencies (Note 16) |
||||||||||
Stockholders' equity: |
||||||||||
Convertible preferred stock, $0.001 par value; 20,000,000 shares authorized; no shares issued or outstanding at December 31, 2009 and 2008 |
— | — | ||||||||
Common stock, $0.001 par value; 500,000,000 shares authorized; 83,877,696 and 86,743,612 shares issued and outstanding at December 31, 2009 and 2008, respectively |
84 | 87 | ||||||||
Additional paid-in capital |
583,682 | 607,143 | ||||||||
Accumulated other comprehensive loss |
(9,857 | ) | (17,715 | ) | ||||||
Accumulated deficit |
(167,420 | ) | (236,036 | ) | ||||||
Total stockholders' equity |
406,489 | 353,479 | ||||||||
Total liabilities and stockholders' equity |
$ | 566,562 | $ | 603,279 | ||||||
The accompanying notes are an integral part of these consolidated financial statements.
F-3
VALUECLICK, INC.
CONSOLIDATED STATEMENTS OF OPERATIONS
| |
For the Year Ended December 31, | |||||||||||
|---|---|---|---|---|---|---|---|---|---|---|---|---|
| |
2009 | 2008 | 2007 | |||||||||
| |
(in thousands, except per share data) |
|||||||||||
Revenue |
$ | 422,723 | $ | 455,441 | $ | 375,515 | ||||||
Cost of revenue |
116,509 | 139,470 | 118,127 | |||||||||
Gross profit |
306,214 | 315,971 | 257,388 | |||||||||
Operating expenses: |
||||||||||||
Sales and marketing (includes stock-based compensation of $1,907, $15,621 and $4,645 for 2009, 2008 and 2007, respectively) |
118,457 | 136,466 | 95,939 | |||||||||
General and administrative (includes stock-based compensation of $6,034, $30,620 and $9,526 for 2009, 2008 and 2007, respectively) |
60,373 | 88,745 | 60,711 | |||||||||
Technology (includes stock-based compensation of $928, $1,925 and $1,218 for 2009, 2008 and 2007, respectively) |
25,050 | 31,160 | 27,715 | |||||||||
Amortization of intangible assets acquired in business combinations |
19,803 | 21,733 | 16,480 | |||||||||
Impairment of goodwill and intangible assets |
— | 269,500 | — | |||||||||
Total operating expenses |
223,683 | 547,604 | 200,845 | |||||||||
Income (loss) from operations |
82,531 | (231,633 | ) | 56,543 | ||||||||
Interest and other income, net |
302 | 2,451 | 12,025 | |||||||||
Income (loss) before income taxes |
82,833 | (229,182 | ) | 68,568 | ||||||||
Income tax expense (benefit) |
21,264 | (33,814 | ) | 28,406 | ||||||||
Income (loss) from continuing operations |
61,569 | (195,368 | ) | 40,162 | ||||||||
Discontinued operations (Note 5): |
||||||||||||
Income (loss) from discontinued operations, net of tax |
7,047 | (23,728 | ) | 30,450 | ||||||||
Gain on sale, net of tax |
— | 4,984 | — | |||||||||
Net income (loss) from discontinued operations |
7,047 | (18,744 | ) | 30,450 | ||||||||
Net income (loss) |
$ | 68,616 | $ | (214,112 | ) | $ | 70,612 | |||||
Basic net income (loss) per common share |
||||||||||||
Continuing operations |
$ | 0.71 | $ | (2.12 | ) | $ | 0.40 | |||||
Discontinued operations |
0.08 | (0.20 | ) | 0.31 | ||||||||
|
$ | 0.79 | $ | (2.32 | ) | $ | 0.71 | |||||
Diluted net income (loss) per common share |
||||||||||||
Continuing operations |
$ | 0.71 | $ | (2.12 | ) | $ | 0.40 | |||||
Discontinued operations |
0.08 | (0.20 | ) | 0.30 | ||||||||
|
$ | 0.79 | $ | (2.32 | ) | $ | 0.70 | |||||
Weighted-average shares used to calculate net income (loss) per common share: |
||||||||||||
Basic |
86,716 | 92,325 | 99,224 | |||||||||
Diluted |
87,210 | 92,325 | 100,518 | |||||||||
The accompanying notes are an integral part of these consolidated financial statements.
F-4
VALUECLICK, INC.
CONSOLIDATED STATEMENTS OF STOCKHOLDERS' EQUITY
| |
Preferred Stock | Common Stock | |
Accumulated Other Comprehensive Income (Loss) |
Retained Earnings (Accumulated Deficit) |
|
|||||||||||||||||||||
|---|---|---|---|---|---|---|---|---|---|---|---|---|---|---|---|---|---|---|---|---|---|---|---|---|---|---|---|
| |
Additional Paid-In Capital |
Total Stockholders' Equity |
|||||||||||||||||||||||||
| |
Shares | Amount | Shares | Amount | |||||||||||||||||||||||
| |
(in thousands, except share data) |
||||||||||||||||||||||||||
Balance at December 31, 2006 |
— | — | 99,413,324 | $ | 99 | $ | 632,884 | $ | 5,232 | $ | 5,494 | $ | 643,709 | ||||||||||||||
Non-cash, stock-based compensation |
— | — | — | — | 18,332 | — | — | 18,332 | |||||||||||||||||||
Shares issued in connection with employee stock programs |
— | — | 1,102,184 | 1 | 13,209 | — | — | 13,210 | |||||||||||||||||||
Repurchase and retirement of common stock |
— | — | (2,303,559 | ) | (2 | ) | (15,055 | ) | — | (28,980 | ) | (44,037 | ) | ||||||||||||||
Tax benefit from stock option exercises |
— | — | — | — | 4,060 | — | — | 4,060 | |||||||||||||||||||
Comprehensive income: |
|||||||||||||||||||||||||||
Net income |
— | — | — | — | — | — | 70,612 | 70,612 | |||||||||||||||||||
Change in market value of marketable securities, net of tax |
— | — | — | — | — | 685 | — | 685 | |||||||||||||||||||
Foreign currency translation |
— | — | — | — | — | 3,362 | — | 3,362 | |||||||||||||||||||
Total comprehensive income |
74,659 | ||||||||||||||||||||||||||
Balance at December 31, 2007 |
— | — | 98,211,949 | $ | 98 | $ | 653,430 | $ | 9,279 | $ | 47,126 | $ | 709,933 | ||||||||||||||
Non-cash, stock-based compensation |
— | — | — | — | 53,376 | — | — | 53,376 | |||||||||||||||||||
Shares issued in connection with employee stock programs |
— | — | 714,954 | 1 | 6,849 | — | — | 6,850 | |||||||||||||||||||
Repurchase and retirement of common stock |
— | — | (12,183,291 | ) | (12 | ) | (82,196 | ) | — | (69,050 | ) | (151,258 | ) | ||||||||||||||
Tax benefit shortfall from employee stock transactions |
— | — | — | — | (44 | ) | — | — | (44 | ) | |||||||||||||||||
Repurchase of employee stock options |
— | — | — | — | (5,029 | ) | — | — | (5,029 | ) | |||||||||||||||||
Tax effect related to the repurchase of employee stock options |
— | — | — | — | (19,243 | ) | — | — | (19,243 | ) | |||||||||||||||||
Comprehensive loss: |
|||||||||||||||||||||||||||
Net loss |
— | — | — | — | — | — | (214,112 | ) | (214,112 | ) | |||||||||||||||||
Change in market value of marketable securities, net of tax |
— | — | — | — | — | (8,344 | ) | — | (8,344 | ) | |||||||||||||||||
Foreign currency translation |
— | — | — | — | — | (18,650 | ) | — | (18,650 | ) | |||||||||||||||||
Total comprehensive loss |
(241,106 | ) | |||||||||||||||||||||||||
Balance at December 31, 2008 |
— | — | 86,743,612 | $ | 87 | $ | 607,143 | $ | (17,715 | ) | $ | (236,036 | ) | $ | 353,479 | ||||||||||||
Non-cash, stock-based compensation |
— | — | — | — | 9,241 | — | — | 9,241 | |||||||||||||||||||
Shares issued in connection with employee stock programs |
— | — | 733,515 | — | 2,914 | — | — | 2,914 | |||||||||||||||||||
Repurchase and retirement of common stock |
— | — | (3,599,431 | ) | (3 | ) | (35,145 | ) | — | — | (35,148 | ) | |||||||||||||||
Tax benefit shortfall from employee stock transactions |
— | — | — | — | (471 | ) | — | — | (471 | ) | |||||||||||||||||
Comprehensive income: |
|||||||||||||||||||||||||||
Net income |
— | — | — | — | — | — | 68,616 | 68,616 | |||||||||||||||||||
Change in market value of marketable securities, net of tax |
— | — | — | — | — | 2,577 | — | 2,577 | |||||||||||||||||||
Foreign currency translation |
— | — | — | — | — | 5,281 | — | 5,281 | |||||||||||||||||||
Total comprehensive income |
76,474 | ||||||||||||||||||||||||||
Balance at December 31, 2009 |
83,877,696 | $ | 84 | $ | 583,682 | $ | (9,857 | ) | $ | (167,420 | ) | $ | 406,489 | ||||||||||||||
The accompanying notes are an integral part of these consolidated financial statements.
F-5
VALUECLICK, INC.
CONSOLIDATED STATEMENTS OF CASH FLOWS
| |
For the Year Ended December 31, | ||||||||||||
|---|---|---|---|---|---|---|---|---|---|---|---|---|---|
| |
2009 | 2008 | 2007 | ||||||||||
| |
(in thousands) |
||||||||||||
Cash flows from operating activities: |
|||||||||||||
Net income (loss) |
$ | 68,616 | $ | (214,112 | ) | $ | 70,612 | ||||||
Adjustments to reconcile net income to net cash provided by operating activities: |
|||||||||||||
Depreciation and amortization expense |
33,576 | 39,264 | 35,706 | ||||||||||
Provision for doubtful accounts and sales credits |
4,865 | 7,212 | 7,762 | ||||||||||
Non-cash, stock-based compensation |
9,241 | 53,376 | 18,332 | ||||||||||
Impairment of goodwill and intangible assets |
5,500 | 322,000 | — | ||||||||||
Gain on sale of businesses, net of tax |
— | (4,984 | ) | — | |||||||||
Benefit from deferred income taxes |
4,501 | (55,520 | ) | (15,954 | ) | ||||||||
Net tax windfall (shortfall) from stock-based awards |
(452 | ) | 442 | 4,289 | |||||||||
Excess tax benefit from stock-based awards |
(175 | ) | (599 | ) | (4,508 | ) | |||||||
Changes in operating assets and liabilities, net of effects of acquisitions: |
|||||||||||||
Accounts receivable |
25,253 | 5,174 | (16,504 | ) | |||||||||
Prepaid expenses and other assets |
438 | (843 | ) | 327 | |||||||||
Accounts payable and accrued expenses |
(15,826 | ) | 2,703 | 12,789 | |||||||||
Income taxes receivable/payable |
(11,746 | ) | (20,021 | ) | 29,249 | ||||||||
Deferred revenue |
(55 | ) | (240 | ) | 532 | ||||||||
Other non-current liabilities |
— | (2,951 | ) | (107 | ) | ||||||||
Net cash provided by operating activities |
123,736 | 130,901 | 142,525 | ||||||||||
Cash flows from investing activities: |
|||||||||||||
Proceeds from the maturities and sales of marketable securities |
8,333 | 207,971 | 324,675 | ||||||||||
Purchases of marketable securities |
— | (39,660 | ) | (323,745 | ) | ||||||||
Acquisition of businesses, net of cash acquired |
(62,696 | ) | (105,419 | ) | (102,126 | ) | |||||||
Proceeds from disposition of businesses, net of cash disposed and taxes paid |
— | 11,746 | — | ||||||||||
Purchases of property and equipment |
(4,625 | ) | (7,227 | ) | (9,344 | ) | |||||||
Net cash provided by (used in) investing activities |
(58,988 | ) | 67,411 | (110,540 | ) | ||||||||
Cash flows from financing activities: |
|||||||||||||
Repurchases and retirement of common stock |
(35,148 | ) | (151,258 | ) | (44,037 | ) | |||||||
Repurchase of employee stock options |
— | (5,029 | ) | — | |||||||||
Proceeds from shares issued under employee stock programs |
2,914 | 6,850 | 13,210 | ||||||||||
Excess tax benefit from stock-based awards |
175 | 599 | 4,508 | ||||||||||
Net cash used in financing activities |
(32,059 | ) | (148,838 | ) | (26,319 | ) | |||||||
Effect of foreign currency translations |
3,321 | (9,754 | ) | 332 | |||||||||
Net increase in cash and cash equivalents |
36,010 | 39,720 | 5,998 | ||||||||||
Cash and cash equivalents, beginning of period |
122,487 | 82,767 | 76,769 | ||||||||||
Cash and cash equivalents, end of period |
$ | 158,497 | $ | 122,487 | $ | 82,767 | |||||||
Supplemental disclosures of cash flow information: |
|||||||||||||
Cash paid for interest |
$ | — | $ | — | $ | — | |||||||
Cash paid for income taxes, net |
$ | 33,002 | $ | 50,346 | $ | 37,491 | |||||||
The accompanying notes are an integral part of these consolidated financial statements.
F-6
VALUECLICK, INC.
NOTES TO CONSOLIDATED FINANCIAL STATEMENTS
1. Organization and Summary of Significant Accounting Policies
Organization and Basis of Presentation
ValueClick, Inc. and its subsidiaries ("ValueClick" or "the Company") offer a suite of products and services that enable marketers to advertise and sell their products through major online marketing channels—display advertising, search marketing, comparison shopping, and affiliate marketing. The Company also offers technology infrastructure tools and services that enable marketers to implement and manage their own online display advertising and email campaigns. The broad range of products and services that the Company provides enables its customers to address all aspects of their online marketing process, from strategic planning through execution, including results measurement and campaign refinements. The Company derives its revenue from four business segments. These business segments are presented on a worldwide basis and include: Media, Affiliate Marketing, Owned & Operated Websites, and Technology.
MEDIA—ValueClick's Media segment provides a comprehensive suite of online marketing services and tailored programs that help marketers create and increase awareness for their products and brands, attract visitors and generate leads and sales through the Internet. The Company has aggregated thousands of online publishers to provide marketers with access to one of the largest display advertising networks. The Company's Media services are sold on a variety of pricing models, including cost-per-lead ("CPL"), cost-per-action ("CPA"), cost-per-thousand-impression ("CPM"), and cost-per-click ("CPC").
The Company has classified its lead generation marketing business, which was sold on February 1, 2010, as held for sale at December 31, 2009. In October 2008, the Company divested its interest in its e-commerce websites and has reported the results of operations of the lead generation marketing and e-commerce businesses as discontinued operations for all periods presented.
AFFILIATE MARKETING—ValueClick's Affiliate Marketing segment, through the combination of: a large-scale pay-for-performance model built on the Company's proprietary technology platforms; marketing expertise; and a large, quality advertising network, enables the Company's customers to develop their own fully-commissioned online sales force comprised of third-party affiliate publishers. Affiliate Marketing segment revenues are driven primarily by variable compensation that is generally based on either a percentage of commissions paid to affiliates or on a percentage of transaction revenue generated from the programs managed with the Company's affiliate marketing platforms.
OWNED & OPERATED WEBSITES—ValueClick's Owned & Operated Websites segment services are offered through a number of transaction-focused branded websites including Pricerunner, Smarter.com and Couponmountain.com. In 2009, ValueClick also launched a limited number of content websites in key online verticals such as healthcare, finance, travel, home and garden, education and business services.
The Pricerunner comparison shopping destination websites operate in the United Kingdom, Sweden, Germany, France, Denmark, and Austria. The Smarter.com and Couponmountain.com websites operate primarily in the United States and, to a lesser extent, Japan and China. The Pricerunner and Smarter.com websites enable consumers to research and compare products from among thousands of online and/or offline merchants using its proprietary technologies. The Company gathers product and merchant data and organizes it into comprehensive catalogs on its destination websites, along with relevant consumer and professional reviews. The Couponmountain.com website allows consumers to locate coupons and deals related to products and services that may be of interest to them, and the Company's content websites offer consumers information and reference material
F-7
across a variety of topics. The Company's services in these areas are free for consumers, and revenue is generated in one of three ways: on a CPC basis for traffic delivered to the customers' websites from listings on the Company's websites; on a CPA basis when a consumer completes a purchase or other specific event; and on a CPM basis for display advertising shown on the Company's websites.
In addition to the Company's destination websites, Search123, which operates primarily in Europe, is ValueClick's self-service paid search offering that generates its traffic primarily through syndication relationships with other search engines, Web portals and content websites. Search syndication revenues are driven primarily on a CPC basis.
TECHNOLOGY—ValueClick's Technology segment operates through its wholly-owned subsidiary Mediaplex. Mediaplex is an application services provider ("ASP") offering technology products and services that enable marketers to implement and manage their online advertising across multiple channels including display, email, paid search, natural search, on-site, offline and affiliate. Mediaplex's MOJO® product suite is supported by a single proprietary technology platform, which has the ability to manage all aspects of online advertising from campaign implementation to real-time behavioral targeting to enterprise-level cross channel analysis. Revenues are primarily driven by software access and usage fees which are priced on a CPM or email-delivered basis.
In October 2008, the Company sold its Mediaplex Systems business, which had previously been included in the Company's Technology segment. As a result, the Company has classified Mediaplex Systems as discontinued operations for all periods presented.
Principles of Consolidation
The consolidated financial statements include the accounts of the Company and its wholly-owned subsidiaries. All material intercompany transactions and balances have been eliminated in consolidation.
The consolidated financial statements include the accounts of the Company and its subsidiaries from the acquisition date of majority voting control and through the date of disposition, if any.
Basis of Presentation and Use of Estimates
Accounting principles generally accepted in the United States ("GAAP") require management of the Company to make estimates and assumptions in the preparation of these consolidated financial statements that affect the reported amounts of assets and liabilities and the disclosure of contingent assets and liabilities at the date of the financial statements and the reported amounts of revenue and expenses during the reporting period. Actual results could differ from these estimates and assumptions.
The most significant areas that require management judgment and which are susceptible to possible change in the near term include the Company's revenue recognition, allowance for doubtful accounts and sales credits, investments, stock-based compensation, income taxes, goodwill and other intangible assets, and contingencies and litigation. The accounting policies for these areas are discussed elsewhere in these consolidated financial statements.
The Company has evaluated subsequent events through February 25, 2010. Other than the disposition of the lead generation business that is discussed in Note 5 and the common stock repurchases that are discussed in Note 10, no material subsequent events have occurred since December 31, 2009 that required recognition or disclosure in these financial statements.
Cash and Cash Equivalents
The Company considers all short-term highly liquid investments with a remaining maturity at the date of purchase of three months or less to be cash equivalents. At December 31, 2009 and 2008, cash equivalents consisted primarily of money market accounts.
F-8
Marketable Securities
Marketable securities are classified as available-for-sale and accordingly are recorded at fair value with unrealized gains and losses reflected as a separate component of stockholders' equity titled accumulated other comprehensive income (loss), net of tax, until realized or until a determination is made that an other-than-temporary decline in market value has occurred. Factors considered by management in assessing whether an other-than-temporary impairment has occurred include: the nature of the investment; whether the decline in fair value is attributable to specific adverse conditions affecting the investment; the financial condition of the investee; the severity and the duration of the impairment; and whether the Company intends to sell the investment or will be required to sell the investment before recovery of its amortized cost basis. When it is determined that an other-than-temporary impairment has occurred, the investment is written down to its fair value at the end of the period in which it is determined that an other-than-temporary decline has occurred, and the Company recognizes a corresponding loss for the amount of the unrealized loss not previously recognized. The cost of marketable securities sold is based upon the specific identification method. Fair value of the Company's marketable securities is determined based upon quoted market rates when available. Refer to Notes 2 and 3 for additional details on the Company's determination of fair value of its auction rate securities. Additionally, see Note 2 for further details on the Company's marketable securities portfolio and events that occurred in 2008 that impacted the classification of auction rate securities in the Company's consolidated balance sheets.
Accounts Receivable and Allowance for Doubtful Accounts and Sales Credits
Trade receivables are stated at gross invoice amount less an allowance for doubtful accounts and sales credits.
The Company estimates its allowance for doubtful accounts using two methods. First, the Company evaluates specific accounts where information indicates the Company's customers may have an inability to meet financial obligations, such as due to bankruptcy, and receivable amounts outstanding for an extended period beyond contractual terms. In these cases, the Company uses assumptions and judgment, based on the best available facts and circumstances, to record a specific allowance for those customers against amounts due to reduce the receivable to the amount expected to be collected. These specific allowances are re-evaluated and adjusted as additional information is received. Second, an allowance is established for all customers based on a range of loss percentages applied to receivables aging categories based upon the Company's historical collection and write-off experience. The amounts calculated from each of these methods are analyzed to determine the total amount of the allowance for doubtful accounts. The Company also estimates an allowance for sales credits based upon its historical sales credits experience.
Property and Equipment
Property and equipment are stated at historical cost less accumulated depreciation and amortization. Depreciation and amortization expense are computed using the straight-line method over the estimated useful lives of the assets, generally, three years for computer equipment and purchased software, three to five years for furniture and equipment, the shorter of five years or the term of the lease for leasehold improvements, three years for vehicles, and 30 years for buildings.
Business Combinations
The Company's historical acquisitions were accounted for utilizing the purchase method of accounting. Under the purchase method of accounting, the total consideration paid is allocated to the underlying assets and liabilities, based on their respective estimated fair values. The excess of the purchase price over the estimated fair values of the net tangible and identifiable intangible assets
F-9
acquired is recorded as goodwill. Determining the fair value of certain acquired assets and liabilities, identifiable intangible assets in particular, is subjective in nature and often involves the use of significant estimates and assumptions including, but not limited to: estimates of revenue growth rates; determination of appropriate discount rates; estimates of advertiser and publisher turnover rates; and estimates of terminal values. These assumptions are generally made based on available historical information. Definite-lived identifiable intangible assets are amortized on a straight-line basis, as this basis approximates the expected cash flows from the Company's existing definite-lived identifiable intangible assets.
As described more fully below under "Recently Issued Accounting Standards," on January 1, 2009, the Company adopted new accounting guidance issued by the Financial Accounting Standards Board ("FASB") for business combinations. The new guidance includes changes from previous guidance that may have a significant impact on the accounting results of future business combinations. The Company did not enter into any business combinations in 2009 that would have been accounted for under the new guidance.
Goodwill
The Company tests goodwill for impairment in accordance with GAAP. Accordingly, the Company tests for impairment of goodwill annually as of December 31 at the reporting unit level or whenever events or circumstances indicate that goodwill might be impaired. The Company has determined its reporting units based on FASB guidance. As of December 31, 2009, the Company's reporting units consisted of the Media, Affiliate Marketing, Owned & Operated Websites, and Technology operating segments. The impairment test is a two-step process, whereby in the first step, the Company compares the estimated fair value of the reporting unit with the reporting unit's carrying amount, including goodwill. The Company generally determines the estimated fair value of each reporting unit using a discounted cash flow approach, giving consideration to the market valuation approach. If the carrying amount of a reporting unit exceeds the reporting unit's fair value, the Company performs the second step of the goodwill impairment test to determine the amount of impairment, if any. Due to the weakening economy and the significant decline of the Company's stock price, the Company determined that there was an impairment of goodwill for the year ended December 31, 2008. See Note 6 for a discussion of the impairment charge taken. For the years ended December 31, 2009 and 2007, there was no impairment of goodwill for the Company's continuing operations. For the year ended December 31, 2009, the Company recorded a goodwill impairment charge related to its discontinued operations of $3.2 million.
Long-lived Assets
Management evaluates the recoverability of the Company's identifiable intangible assets and other long-lived assets in accordance with GAAP, which generally requires the assessment of these assets for recoverability when events or circumstances indicate a potential impairment exists. Events and circumstances considered by the Company in determining whether the carrying value of identifiable intangible assets and other long-lived assets may not be recoverable include, but are not limited to: significant changes in performance relative to expected operating results; significant changes in the use of the assets; significant negative industry or economic trends; a significant decline in the Company's stock price for a sustained period of time; and changes in the Company's business strategy. In determining if impairment exists, the Company estimates the undiscounted cash flows to be generated from the use and ultimate disposition of these assets. If impairment is indicated based on a comparison of the assets' carrying values and the undiscounted cash flows, the impairment loss is measured as the amount by which the carrying amount of the assets exceeds the fair value of the assets. During the year ended December 31, 2008, as a result of the weakening economy and revenue results for certain businesses that were lower than initial expectations, the Company tested its long-lived assets for
F-10
impairment, and recorded an impairment loss related to certain identifiable intangible assets. See Note 6 for a discussion of the impairment charge taken. The Company determined that there was no impairment of long-lived assets for the years ended December 31, 2009 and 2007 for the Company's continuing operations. For the year ended December 31, 2009, the Company recorded an impairment charge on long-lived assets related to its discontinued operations of $2.3 million.
Revenue Recognition
The Company recognizes revenue when the following criteria have been met: persuasive evidence of an arrangement exists, no significant Company obligations remain, collection of the related receivable is reasonably assured, and the fees are fixed or determinable.
The Company's Media and Owned & Operated Websites segments revenue is recognized in the period that the advertising impressions, click-throughs or actions occur, when lead-based information is delivered, provided that no significant Company obligations remain, collection of the resulting receivable is reasonably assured, and the fees are fixed or determinable. The Company acts as a principal in Media and Owned & Operated Websites segment transactions in that the Company is the primary obligor to the advertiser customers. Revenue is recognized in the Company's Media and Owned & Operated Websites segments on a gross basis and publisher expenses that are directly related to a revenue-generating event are recorded as a component of cost of revenue.
Revenue for the Company's Affiliate Marketing segment is generated primarily from: commission fees earned from transactions, including product sales made by the Company's advertiser customers, occurring on the Company's affiliate marketing networks; fixed monthly fees from program management services; commission fees earned for the Company's search engine marketing ("SEM") services; and, to a lesser extent, implementation fees. Commission fee revenue from transactions on the Company's affiliate marketing networks and from the Company's SEM services are recognized on a net basis as the Company acts as an agent in these transactions and the payments to publishers are the contractual obligation of the advertiser customers. Commission fee revenue is recognized in the period that the Company's advertiser customer generates a sale or other agreed-upon action on the Company's affiliate marketing networks or as a result of the Company's SEM services, provided that no significant Company obligations remain, collection of the resulting receivable is reasonably assured, and the fees are fixed or determinable. Program management services fees revenue is recognized over the contractual service period, provided no significant Company obligations remain, collection of the resulting receivable is reasonably assured, and the fees are fixed or determinable. Implementation fee revenue is recognized over the estimated customer lives, provided no significant Company obligations remain, collection of the resulting receivable is reasonably assured, and the fees are fixed or determinable.
Revenue for the Company's Technology segment is generated primarily from fixed monthly fees or monthly transaction volume-based fees earned by the Company for making its technologies available to the Company's customers on an ASP basis. Such revenue is recognized monthly, provided no significant Company obligations remain, collection of the resulting receivable is reasonably assured, and the fees are fixed or determinable. The Company also generates a nominal amount of other services fee revenue in its Technology segment. Such other services fee revenue is recognized when the services are performed provided no significant Company obligations remain, collection of the resulting receivable is reasonably assured, and the fees are fixed or determinable.
The Company's customers do not have the right to take possession of the Company's software at any time during or after the term of the relevant customer agreement. Accordingly, the Company's revenue recognition is outside the scope of prescribed accounting guidance relevant to software revenue recognition.
F-11
Deferred revenue consists primarily of the unrecognized portion of implementation fee revenue for the Company's Affiliate Marketing segment. Prepayments and amounts on deposit from customers are classified as an advertiser deposit liability.
The Company estimates a provision for sales returns which is recorded as a reduction to revenue. The provision for sales returns reflects an estimate of commission based fee reversals related to product returns from consumers of the Company's Affiliate Marketing customers. In determining the estimate for sales returns, the Company relies upon historical data, contract information and other factors. The estimated provision for sales returns can vary from actual results. More or less product may be returned from consumers of the Company's Affiliate Marketing as compared to what was estimated. These factors and unanticipated changes in the economic and industry environment could make the provision for sales returns estimates differ from actual returns.
Cost of Revenue
Cost of revenue consists of payments to website publishers that are directly related to a revenue-generating event, labor costs, and depreciation on revenue-producing technologies and Internet access costs. The Company becomes obligated to make payments related to website publishers in the period the advertising impressions, click-throughs, actions or lead-based information are delivered or occur. Such expenses are classified as cost of revenue in the corresponding period in which the revenue is recognized in the accompanying consolidated statement of operations.
Sales and Marketing
Sales and marketing expenses consist primarily of compensation and employee benefits of sales and marketing, network development and related support teams, certain online and offline advertising costs, travel, trade shows, and marketing materials. Online advertising costs included in sales and marketing expenses are primarily comprised of amounts that the Company pays to search engines for driving consumer traffic to the Company's owned and operated websites.
Advertising costs are expensed as incurred and totaled $65.2 million, $64.0 million and $35.0 million for the years ended December 31, 2009, 2008 and 2007, respectively.
General and Administrative
General and administrative expenses include facilities costs, executive and administrative compensation and employee benefits, depreciation, professional services fees, insurance costs, and other general overhead costs.
Technology
Technology expenses include costs associated with the maintenance of the Company's technology platforms, including compensation and employee benefits associated with the Company's engineering and network operations departments, as well as costs for contracted services and supplies. The Company capitalizes certain costs incurred in the application development stage when developing or obtaining computer software for internal use. No internal software development costs were capitalized in the years ended December 31, 2009, 2008 and 2007.
Stock-based Compensation
The Company records stock-based compensation in accordance with GAAP, which requires companies to estimate the fair value of stock-based awards to employees and directors on the date of grant using an option-pricing model. The value of the portion of an award that is ultimately expected
F-12
to vest is recognized as an expense over the requisite service period using the straight-line attribution method.
Accounting guidance prohibits recognition of a deferred tax asset for an excess tax benefit that has not been realized. The Company will recognize a benefit from stock-based compensation in stockholders' equity if an incremental tax benefit is realized by following the ordering provisions of the U.S. tax law. In addition, the Company has elected to account for the indirect effects of stock-based awards on other tax attributes, such as the research tax credit, through the consolidated statements of operations.
Refer to Note 11 for information on the accounting impact of the stock-based compensation guidance and the assumptions used to calculate the fair value of share-based employee compensation.
Foreign Currency Translation
The Company's foreign subsidiaries record their assets, liabilities and results of operations in their respective local currencies, which are their functional currencies. The Company translates its subsidiaries' financial statements into U.S. dollars each reporting period for purposes of consolidation.
Assets and liabilities of the Company's foreign subsidiaries are translated at the period-end currency exchange rates while revenue, expenses, gains, and losses are translated at the average currency exchange rates in effect for the period. Except for certain intercompany balances that have been designated as short-term in nature, the effects of these translation adjustments are reported in a separate component of stockholders' equity titled accumulated other comprehensive income. The effects of the translation adjustments for those intercompany balances that have been designated as short-term in nature were not significant in the year ended December 31, 2007 and were included in general and administrative expenses. In the first quarter of 2008 and thereafter, the Company began recording the effects of the translation adjustments for these intercompany balances in interest and other income, net. These amounts were immaterial in 2009 and totaled $3.6 million for the year ended December 31, 2008.
Transaction gains and losses related to transactions with third parties denominated in other than the functional currency were not significant for the years ended December 31, 2009, 2008 and 2007.
Concentration of Credit Risk and Significant Customers
Financial instruments that potentially subject the Company to concentration of credit risk consist of cash and cash equivalents, marketable securities and accounts receivable. Cash and cash equivalents are deposited in the local currency with a limited number of financial institutions in the United States and Europe. The balances in the United States held at any one financial institution are generally in excess of Federal Deposit Insurance Corporation ("FDIC") insurance limits and certain balances in Europe may not be insured. Marketable securities are held in local currency with major financial institutions and, with the exception of the Company's investments in certain municipal obligations, are generally not insured.
Credit is extended to customers based on an evaluation of their financial condition and other factors. The Company generally does not require collateral or other security to support accounts receivable. The Company performs ongoing credit evaluations of its customers and maintains an allowance for doubtful accounts and sales credits. At December 31, 2009 and 2008, no customers accounted for more than 10% of the accounts receivable balance. For the year ended December 31, 2009, one customer accounted for approximately 17.0% of total revenue and another customer accounted for approximately 10.6% of total revenue. For the year ended December 31, 2008, one customer accounted for approximately 16.8% of total revenue and another customer accounted for
F-13
approximately 11.1% of total revenue. For the year ended December 31, 2007, no customers accounted for more than 10% of total revenue.
Fair Value of Financial Instruments
The Company's financial instruments, including cash and cash equivalents, net accounts receivable, accounts payable and accrued expenses, are carried at historical cost. At December 31, 2009 and 2008, the carrying amounts of these instruments approximated their fair values because of the short-term nature of these instruments. The Company's marketable securities are carried at fair value as discussed in Note 2.
Income Taxes
The Company uses the asset and liability method of accounting for income taxes in accordance with GAAP. Under this method, income tax expense is recognized for the amount of: (i) taxes payable or refundable for the current year; and, (ii) deferred tax consequences of temporary differences resulting from matters that have been recognized in an entity's financial statements or tax returns. Deferred tax assets and liabilities are measured using enacted tax rates expected to apply to taxable income in the years in which those temporary differences are expected to be recovered or settled. The effect on deferred tax assets and liabilities of a change in tax rates is recognized in the results of operations in the period that includes the enactment date. A valuation allowance is provided to reduce the deferred tax assets reported if, based on the weight of the available positive and negative evidence, it is more likely than not some portion or all of the deferred tax assets will not be realized. A liability (including interest if applicable) is established in the consolidated financial statements to the extent a current benefit has been recognized on a tax return for matters that are considered contingent upon the outcome of an uncertain tax position. Interest and penalties, if any, are included as components of income tax expense and income taxes payable.
The Company follows FASB guidance when accounting for tax contingencies. The guidance prescribes a comprehensive model for how companies should recognize, measure, present, and disclose in their financial statements uncertain tax positions taken or expected to be taken on a tax return. Under GAAP, tax benefits are initially recognized in the consolidated financial statements when it is more likely than not the position will be sustained upon examination by the tax authorities. Such tax positions must initially and subsequently be measured as the largest amount of tax benefit that is greater than 50 percent likely of being realized upon ultimate settlement with the tax authority assuming full knowledge of the position and relevant facts. See Note 9 for additional information.
Basic and Diluted Net Income per Common Share
Basic net income per common share is computed by dividing net income by the weighted-average number of shares of common stock outstanding for the period. Diluted net income per common share is computed using the weighted-average number of common shares outstanding for the period, and, if dilutive, potential common shares outstanding during the period. Potential common shares consist of the incremental common shares issuable upon the exercise of stock options and release of restricted stock awards, and shares issuable under the Company's Employee Stock Purchase Plan, determined using the treasury stock method. The Company determines potential windfall tax benefits and shortfalls on stock options on an "as if" basis for purposes of calculating assumed stock option proceeds under the treasury stock method when determining the denominator for diluted net income per common share.
F-14
Comprehensive Income
GAAP establishes standards for reporting comprehensive income and its components in financial statements. Comprehensive income, as defined, includes all changes in equity (net assets) during a period from non-owner sources. The elements of comprehensive income, other than net income, relate to foreign currency translation adjustments and unrealized gains/losses on marketable securities for the years ended December 31, 2009, 2008 and 2007. As of December 31, 2009 and 2008, the accumulated balance of the foreign currency translation adjustment was a $4.3 million loss and a $9.6 million loss, respectively. As of December 31, 2009, the unrealized loss on marketable securities was $5.5 million, net of tax and valuation allowance. The Company has recorded a full valuation allowance against the related deferred tax asset associated with the unrealized losses on marketable securities due to the uncertainty as to whether such losses and related deferred tax asset will be realized. As of December 31, 2008, unrealized gain on marketable securities was $8.1 million, net of tax and valuation allowance and as of December 31, 2007, unrealized loss on marketable securities was $242,000, net of income tax liability of $170,000.
Business Segments
The Company uses the "management approach" to identify its operating segments. The management approach designates the internal organization used by management for making operating decisions and assessing performance as the basis for identifying the Company's operating segments.
Recently Issued Accounting Standards
On January 1, 2009, the FASB issued new accounting guidance for business combinations. The new accounting guidance establishes principles and requirements for how an acquirer in a business combination recognizes and measures in its financial statements the identifiable assets acquired, liabilities assumed, and any noncontrolling interests in the acquiree, as well as the goodwill acquired. Significant changes from previous guidance resulting from this new guidance include the expansion of the definitions of a "business" and a "business combination." For all business combinations (whether partial, full or step acquisitions), the acquirer will record 100% of all assets and liabilities of the acquired business, including goodwill, generally at their fair values; contingent consideration will be recognized at its fair value on the acquisition date and; for certain arrangements, changes in fair value will be recognized in earnings until settlement; and acquisition-related transaction and restructuring costs will be expensed rather than treated as part of the cost of the acquisition. The new accounting guidance also establishes disclosure requirements to enable users to evaluate the nature and financial effects of the business combination. The adoption of this accounting guidance did not have a material impact on the Company's consolidated financial statements.
In April 2009, the FASB revised the authoritative guidance that defines disclosure requirements for the fair value of financial instruments, to require disclosures about fair value of financial instruments of publicly traded companies for interim reporting periods as well as in annual financial statements. The guidance is effective for interim and annual periods ending after June 15, 2009. The adoption of the guidance did not impact the Company's consolidated financial statements. See Note 3 for further information.
In April 2009, the FASB issued updated authoritative guidance on other-than-temporary impairments. The objective of an other-than-temporary impairment analysis under existing GAAP is to determine whether the holder of an investment in a debt or equity security for which changes in fair value are not regularly recognized in earnings (such as securities classified as held-to-maturity or available-for-sale) should recognize a loss in earnings when the investment is impaired. An investment is impaired if the fair value of the investment is less than its amortized cost basis. This updated guidance amends the other-than-temporary impairment guidance in GAAP for debt securities to make
F-15
it more operational and to improve the presentation and disclosure of other-than-temporary impairments on debt and equity securities in the financial statements. It does not amend existing recognition and measurement guidance related to other-than-temporary impairments of equity securities. This guidance is effective for interim and annual periods ending after June 15, 2009. In response to the revised guidance, in April 2009, the SEC published a bulletin in which the SEC maintains the staff's previous views related to equity securities. It also amends the SEC's previous bulletin to exclude debt securities from its scope. The adoption of the guidance did not impact the Company's consolidated financial statements.
In April 2009, the FASB issued additional authoritative guidance on fair value measurements for estimating fair value when the volume and level of activity for the asset or liability have significantly decreased and on identifying circumstances that indicate a transaction is not orderly. It emphasizes that even if there has been a significant decrease in the volume and level of activity for the asset or liability, and regardless of the valuation technique(s) used, the objective of a fair value measurement remains the same. Fair value is the price that would be received to sell an asset or paid to transfer a liability in an orderly transaction (that is, not a forced liquidation or distressed sale) between market participants at the measurement date under current market conditions. This guidance is effective for interim and annual periods ending after June 15, 2009. Its adoption did not impact the Company's consolidated financial statements.
In April 2009, the FASB revised the authoritative guidance on business combinations. The guidance amends the previously existing provisions for the initial recognition and measurement, subsequent measurement and accounting, and disclosures for assets and liabilities arising from contingencies in business combinations. The revised guidance eliminates the distinction between contractual and non-contractual contingencies, including the initial recognition and measurement criteria and instead carries forward most of the provisions from previous guidance for acquired contingencies. It is effective for contingent assets and contingent liabilities acquired in business combinations for which the acquisition date is on or after the beginning of the first annual reporting period beginning on or after December 15, 2008. The nature and magnitude of the specific effects that this guidance will have on the Company's consolidated financial statements will depend upon the nature, term and size of acquired contingencies resulting from future acquisitions.
In May 2009, the FASB issued authoritative guidance on management's assessment of subsequent events. The guidance is effective prospectively for interim and annual periods ending after June 15, 2009. The guidance requires entities to disclose the date through which subsequent events have been evaluated and whether the date corresponds with the release of the entities' financial statements. The implementation of this standard did not have a material impact on the Company's consolidated financial position and results of operations.
In June 2009, the FASB issued the FASB Accounting Standards Codification ("Codification"). The Codification will become the single source for all authoritative GAAP recognized by the FASB to be applied for financial statements issued for periods ending after September 15, 2009. The Codification does not change GAAP and will not have an effect on the Company's financial position, results of operations or liquidity. The Company has adjusted historical GAAP references herein to reflect accounting guidance references as prescribed by the Codification.
2. Marketable Securities
Marketable securities consisted of municipal student loan-backed auction rate securities as of December 31, 2009 (in thousands):
| |
Cost | Unrealized Gains |
Unrealized Losses |
Estimated Fair Value |
|||||||||
|---|---|---|---|---|---|---|---|---|---|---|---|---|---|
Municipal obligations |
$ | 27,550 | $ | — | $ | (5,524 | ) | $ | 22,026 | ||||
F-16
Marketable securities consisted of the following as of December 31, 2008 (in thousands):
| |
Cost | Unrealized Gains |
Unrealized Losses |
Estimated Fair Value |
||||||||||
|---|---|---|---|---|---|---|---|---|---|---|---|---|---|---|
Municipal obligations |
$ | 33,850 | $ | — | $ | (8,100 | ) | $ | 25,750 | |||||
Corporate obligations |
2,176 | — | (1 | ) | 2,175 | |||||||||
Total marketable securities |
$ | 36,026 | $ | — | $ | (8,101 | ) | $ | 27,925 | |||||
The following table summarizes the amortized cost and estimated fair value of marketable securities classified by the remaining maturity of the security as of December 31, 2009 (in thousands):
| |
Cost | Estimated Fair Value |
||||||
|---|---|---|---|---|---|---|---|---|
Due within ten years |
$ | — | $ | — | ||||
Due after ten years |
27,550 | 22,026 | ||||||
Total |
$ | 27,550 | $ | 22,026 | ||||
Realized losses from sales and maturities of marketable securities are included in interest and other income, net, in the consolidated statements of operations and were immaterial for the years ended December 31, 2009, 2008 and 2007. The Company recognizes realized gains and losses upon sale or maturity of marketable securities using the specific identification method.
The following table summarizes, for all investments in an unrealized loss position, the fair value and gross unrealized losses of investments aggregated by type of investment instrument and length of time that individual securities have been in a continuous unrealized loss position as of December 31, 2009 (in thousands):
| |
Less Than 12 Months | 12 Months or Greater | Total | ||||||||||||||||
|---|---|---|---|---|---|---|---|---|---|---|---|---|---|---|---|---|---|---|---|
| |
Fair Value |
Unrealized Losses |
Fair Value |
Unrealized Losses |
Fair Value |
Unrealized Losses |
|||||||||||||
Municipal obligations |
$ | — | $ | — | $ | 22,026 | $ | 5,524 | $ | 22,026 | $ | 5,524 | |||||||
The following table summarizes, for all investments in an unrealized loss position, the fair value and gross unrealized losses of investments aggregated by type of investment instrument and length of time that individual securities have been in a continuous unrealized loss position as of December 31, 2008 (in thousands):
| |
Less Than 12 Months | 12 Months or Greater | Total | |||||||||||||||||
|---|---|---|---|---|---|---|---|---|---|---|---|---|---|---|---|---|---|---|---|---|
| |
Fair Value |
Unrealized Losses |
Fair Value |
Unrealized Losses |
Fair Value |
Unrealized Losses |
||||||||||||||
Municipal obligations |
$ | 25,750 | $ | (8,100 | ) | $ | — | $ | — | $ | 25,750 | $ | (8,100 | ) | ||||||
Corporate obligations |
2,175 | (1 | ) | — | — | 2,175 | (1 | ) | ||||||||||||
Total |
$ | 27,925 | $ | (8,101 | ) | $ | — | $ | — | $ | 27,925 | $ | (8,101 | ) | ||||||
Auction Rate Securities ("ARS")
Included in the Company's municipal obligations are auction rate securities totaling $22.0 million and $25.8 million as of December 31, 2009 and 2008, respectively. ARS are securities that are structured with short-term reset dates of generally less than 90 days but with maturities generally greater than 10 years. At the end of the reset period, investors can generally sell or continue to hold the securities at par value. The assets underlying these investments are student loan portfolios that are
F-17
insured or government backed. The auction events, which have historically provided liquidity for these securities, began failing during the first quarter of 2008, and there have been no successful auction events for the Company's ARS since that time. The principal amounts associated with the ARS will not be accessible until a successful auction occurs, a buyer is found outside of the auction process, the issuer calls the security, or the security matures according to contractual terms.
Due to the auction failures, these ARS do not have a readily determinable market value. As a result, fair values were estimated utilizing discounted cash flow analyses as of December 31, 2009. These analyses consider, among other factors, the collateralization underlying the security investments, the creditworthiness of the counterparty, the timing of expected future cash flows, and the expectation of the next time the ARS are expected to have a successful auction (liquidity). These ARS were also compared when possible, to other observable market data with similar characteristics to the ARS held by the Company.
As a result of the remaining uncertainty in the market for ARS, the Company has classified these investments as "non-current" assets in the accompanying consolidated balance sheet as of December 31, 2009. Additionally, the fair value of these investments has been reduced from their par value of $27.6 million to an estimated fair value of $22.0 million. Because the Company does not intend to sell any of these securities, it is not more likely than not that the Company will be required to sell any of these securities before recovering its cost basis, and it expects to recover each security's entire amortized cost basis, the decline in fair value is considered temporary, and has been recorded as an unrealized loss in accumulated other comprehensive income. If the Company were to determine that a decline in fair value is other-than-temporary, a charge would be recorded to earnings in the period such determination was made.
3. Fair Value Measurements
Effective January 1, 2008, the Company adopted the new authoritative guidance for financial assets and liabilities recorded at fair value. The guidance defines fair value, establishes a framework for measuring fair value in accordance with GAAP, and expands disclosures about fair value measurements. Although the adoption of the new guidance did not materially impact its financial condition, results of operations, or cash flows, the Company is now required to provide additional disclosures as part of its consolidated financial statements.
The accounting guidance establishes a three-tier fair value of hierarchy, which prioritizes the inputs used in measuring fair value. These tiers include: Level 1, defined as fair value measured based on observable inputs such as quoted prices in active markets for identical assets; Level 2, defined as fair value measured based on observable inputs such as quoted prices in active markets for similar assets, and inputs other than quoted prices in active markets that are either directly or indirectly observable and for identifiable assets in less active markets; and Level 3, defined as fair value measured based on unobservable inputs in which little or no market data exists, therefore requiring an entity to develop its own assumptions. The fair value hierarchy also requires an entity to maximize the use of observable inputs and minimize the use of unobservable inputs when measuring fair value.
F-18
The Company's assets measured at fair value on a recurring basis subject to the disclosure requirements at December 31, 2009, were as follows (in thousands):
| |
|
Fair Value Measurements at Reporting Date Using | |||||||||||
|---|---|---|---|---|---|---|---|---|---|---|---|---|---|
| |
December 31, 2009 |
Quoted Prices in Active Markets for Identical Assets (Level 1) |
Significant Other Observable Inputs (Level 2) |
Significant Unobservable Inputs (Level 3) |
|||||||||
Description: |
|||||||||||||
Auction rate securities measured at fair value |
$ | 22,026 | $ | — | $ | — | $ | 22,026 | |||||
As discussed in Note 2, the Company changed its valuation methodology for ARS to a discounted cash flow analysis during the first quarter of 2008 as quoted prices in an active market were not available due to the auction failures. Accordingly, these ARS changed from Level 1 to Level 3 within the GAAP hierarchy since the Company's initial adoption of the new accounting guidance at January 1, 2008.
The following table presents the Company's assets measured at fair value on a recurring basis using significant unobservable inputs (Level 3) at December 31, 2009 (in thousands):
| |
Fair Value Measurements Using Significant Unobservable Inputs (Level 3) |
||||
|---|---|---|---|---|---|
| |
Auction Rate Securities |
||||
Balance at December 31, 2007 |
$ | — | |||
Transfers to Level 3 |
33,850 | ||||
Total unrealized losses included in other comprehensive income |
(8,100 | ) | |||
Balance at December 31, 2008 |
$ | 25,750 | |||
Less: Sales and redemptions |
(6,300 | ) | |||
Reversals of unrealized losses on securities sold or redeemed |
2,576 | ||||
Balance at December 31, 2009 |
$ | 22,026 | |||
4. Recent Business Combinations
MeziMedia. On July 30, 2007, the Company completed the acquisition of MeziMedia, a leading operator of U.S. comparison shopping and coupon websites. Under the terms of the agreement, the Company acquired all outstanding equity interests in MeziMedia for initial cash consideration of $96.3 million, net of cash acquired of $18.9 million, plus approximately $700,000 in transaction costs, resulting in a total initial cash consideration of $97.0 million.
F-19
The final allocation of the initial purchase price (excluding contingent consideration) to the assets acquired and liabilities assumed and the useful lives, in years, assigned to intangible assets is as follows (in thousands):
Cash acquired |
$ | 18,944 | |||||||
Other tangible assets acquired |
9,540 | ||||||||
Useful life |
|||||||||
|---|---|---|---|---|---|---|---|---|---|
Amortizable intangible assets: |
|||||||||
Customer relationships |
3 | 2,100 | |||||||
Trademarks, trade names and domain names |
5 | 10,400 | |||||||
Developed technologies |
4 | 26,700 | |||||||
Covenants not to compete |
4 | 7,500 | |||||||
Total identifiable intangible assets |
46,700 | ||||||||
Goodwill |
58,025 | ||||||||
Total assets acquired |
133,209 | ||||||||
Liabilities assumed |
(17,230 | ) | |||||||
Total |
$ | 115,979 | |||||||
The intangible assets were valued using a combination of valuation methods, including future discounted cash flows expected to be generated from the assets, comparison of market prices for other similar assets, and the cost of replacing the assets. The Company is amortizing each intangible asset on a straight-line basis over the asset's useful life as this method approximates the pattern in which the economic benefits of the assets are consumed. All of the goodwill resulting from this acquisition is tax deductible.
In addition to the initial cash consideration, the shareholders of MeziMedia earned $62.6 million and $106.1 million in contingent cash consideration for achieving certain revenue and earnings performance targets for the years ended December 31, 2008 and 2007, respectively. No additional cash consideration was earned during the year ended December 31, 2009, and no further contingent consideration exists related to this acquisition as of December 31, 2009. The cash consideration earned related to MeziMedia's 2008 and 2007 performance has been accounted for as additional purchase price and was recorded as additional goodwill during the years ended December 31, 2008 and 2007, respectively. The $62.6 million earned for 2008 performance was accrued as a liability in the accompanying consolidated balance sheet as of December 31, 2008 and was paid in the first quarter of 2009. The $106.1 million earned for 2007 performance was paid in February 2008, less an indemnity holdback amount which was paid in January 2009.
MeziMedia provided the Company with additional opportunities to monetize online traffic and expanded its online presence in the United States, China and Japan. This factor contributed to a purchase price in excess of the fair value of MeziMedia's net tangible and intangible assets acquired, and, as a result, the Company recorded goodwill in connection with this transaction. The results of MeziMedia's operations are included in the Company's consolidated financial statements beginning on the date of acquisition.
The historical operating results of acquired entities prior to the respective acquisition dates have not been included in the Company's historical operating results. Pro forma data (unaudited) for the
F-20
year ended December 31, 2007 as if the MeziMedia acquisition was completed on January 1, 2007 is as follows (in thousands, except per share data):
| |
2007 | |||
|---|---|---|---|---|
| |
(pro forma) |
|||
Revenue |
$ | 420,324 | ||
Net income (loss) |
$ | 43,606 | ||
Basic net income per common share |
$ | 0.44 | ||
Diluted net income per common share |
$ | 0.43 | ||
These unaudited, pro forma results of operations are not necessarily indicative of future operating results.
5. Discontinued Operations
In October 2008, the Company sold two non-core businesses, Mediaplex Systems and the ink-jet e-commerce business. Mediaplex Systems was included in the Company's Technology operating segment, while the e-commerce business was included in the Media operating segment. The divestitures generated total gross consideration in 2008 of $15.9 million and a pretax gain of $10.1 million ($5.0 million, net of income taxes).
On February 1, 2010, the Company completed the disposition of its lead generation marketing business, operated through its subsidiary Web Marketing Holdings LLC ("Web Clients"). The proceeds from the sale were approximately $32.8 million, consisting of the estimated discounted fair value of a $45 million (face amount) five year note receivable bearing interest at the rate of five percent, with monthly payments amortized over a ten year period and a balloon payment at the end of the fifth year. The note is collateralized by substantially all of the assets of the buyer, consisting of Web Clients and other unrelated businesses. The assets and liabilities of Web Clients are classified as held for sale as of December 31, 2009, and the historical results of Web Clients are treated as discontinued operations herein. The Company determined that Web Clients met the definition of an asset held for sale in October 2009.
The following amounts related to Web Clients, Mediaplex Systems and the ink-jet e-commerce business were derived from historical financial information and have been segregated from continuing operations and reported as discontinued operations (in thousands):
| |
Year Ended December 31, | |||||||||
|---|---|---|---|---|---|---|---|---|---|---|
| |
2009 | 2008 | 2007 | |||||||
Revenues |
$ | 103,004 | $ | 188,134 | $ | 270,101 | ||||
Income (loss) before income taxes from discontinued operations |
11,055 | (17,302 | ) | 53,677 | ||||||
Income tax expense |
4,008 | 6,426 | 23,227 | |||||||
Income (loss) from discontinued operations, net of tax, before gain on sale |
7,047 | (23,728 | ) | 30,450 | ||||||
Gain on sale, net of tax of $5,154 |
— | 4,984 | — | |||||||
Net income from discontinued operations |
$ | 7,047 | $ | (18,744 | ) | $ | 30,450 | |||
F-21
The components of assets and liabilities held for sale at December 31, 2009 are as follows:
| |
December 31, 2009 |
||||
|---|---|---|---|---|---|
Current assets held for sale: |
|||||
Receivables, net |
$ | 10,814 | |||
Other current assets |
284 | ||||
|
$ | 11,098 | |||
Assets held for sale, less current portion: |
|||||
Property and equipment, net |
$ | 664 | |||
Goodwill |
14,512 | ||||
Intangible assets acquired in business combinations |
10,541 | ||||
Other assets |
60 | ||||
|
$ | 25,777 | |||
Liabilities related to assets held for sale: |
|||||
Accounts payable and accrued expenses |
$ | 4,224 | |||
Other current liabilities |
182 | ||||
|
$ | 4,406 | |||
6. Goodwill and Intangible Assets
In accordance with GAAP, the Company does not amortize goodwill, but rather tests goodwill for impairment annually as of December 31 at the reporting unit level. The Company's testing approach utilizes a discounted cash flow analysis corroborated by comparative market multiples to determine the fair value of its reporting units for comparison to their corresponding book values. If the book value exceeds the estimated fair value of a reporting unit, a potential impairment is indicated and accounting guidance prescribes the approach for measuring the impairment amount, if any. In performing the annual goodwill impairment test as of December 31, 2009 for the Company's held and used reporting units, no impairment was identified. Furthermore, the estimated fair values of each of our reporting units exceeded their carrying values by at least 31% as of December 31, 2009. In addition, the Company evaluates recoverability of its identifiable intangible assets and other long-lived assets when events or circumstances indicate a potential impairment exists. During 2009, no events or circumstances indicated the existence of a potential impairment in the Company's held and used intangible assets. Accordingly, an impairment test was not performed for the Company's held and used intangible assets.
In accordance with GAAP, the Company performed its impairment testing for its assets held for sale in the following order: 1) goodwill, and 2) the remainder of the disposal group. The book value of the disposal group exceeded the estimated fair value of the disposal group, and consequently the Company determined that the goodwill of the disposal group was impaired by $3.2 million. Additionally, after recording this goodwill impairment, the Company recorded intangible asset impairment of $2.3 million in order to reduce the remaining book value of the disposal group to the estimated fair value of the disposal group less estimated costs to sell. As a result, the Company recorded a total impairment charge of $5.5 million related to the assets held for sale. This charge is reported in discontinued operations and was primarily driven by the diminishing financial performance of the disposal group during 2009. The tax benefit related to the impairment charge was $1.4 million.
After conducting its impairment test as of December 31, 2008, the Company determined that goodwill in its Media and Owned & Operated Websites reporting units was impaired by $112 million and $210 million, respectively. The total goodwill impairment charge of $322 million is included in the consolidated results of operations for the year ended December 31, 2008. The goodwill impairment
F-22
charge was primarily driven by the significant decline in the Company's stock price during 2008 and the weak economic environment, which resulted in lower projected cash flows for these reporting units as compared to projections used in goodwill impairment tests completed in prior periods. The tax benefit related to the impairment charge was $51.2 million. No goodwill impairment was recorded as a result of the Company's annual impairment test for the years ended December 31, 2007.
The Company determined its reporting units based on GAAP. As of December 31, 2009, the Company's reporting units consisted of the Media, Affiliate Marketing, Owned & Operated Websites, and Technology operating segments. As required by GAAP, the Company assigned goodwill to its reporting units. The Technology segment has no goodwill associated with it. Below is assigned goodwill by reporting unit (in thousands):
| |
Media | Affiliate Marketing |
Owned & Operated Websites |
Total | ||||||||||
|---|---|---|---|---|---|---|---|---|---|---|---|---|---|---|
Balance at December 31, 2007 |
$ | 232,000 | $ | 30,733 | $ | 176,799 | $ | 439,532 | ||||||
Accumulated impairment losses |
— | — | — | — | ||||||||||
|
232,000 | 30,733 | 176,799 | 439,532 | ||||||||||
Foreign currency translation adjustments |
(379 | ) | (893 | ) | (3,530 | ) | (4,802 | ) | ||||||
Earn-out consideration |
— | — | 59,474 | 59,474 | ||||||||||
Impairment write-down(1) |
(112,000 | ) | — | (210,000 | ) | (322,000 | ) | |||||||
Other |
(166 | ) | — | 545 | 379 | |||||||||
Balance at December 31, 2008 |
231,455 | 29,840 | 233,288 | 494,583 | ||||||||||
Accumulated impairment losses |
(112,000 | ) | — | (210,000 | ) | (322,000 | ) | |||||||
|
119,455 | 29,840 | 23,288 | 172,583 | ||||||||||
Foreign currency translation adjustments |
144 | 337 | 677 | 1,158 | ||||||||||
Tax adjustments |
(20 | ) | — | (2,820 | ) | (2,840 | ) | |||||||
Allocation to disposal group(2) |
(13,778 | ) | — | — | (13,778 | ) | ||||||||
Balance at December 31, 2009 |
217,802 | 30,177 | 231,144 | 479,123 | ||||||||||
Accumulated impairment losses |
(112,000 | ) | — | (210,000 | ) | (322,000 | ) | |||||||
|
$ | 105,802 | $ | 30,177 | $ | 21,144 | $ | 157,123 | ||||||
- (1)
- The
impairment write-down in 2008 for the Media segment of $112 million was allocated to discontinued operations ($59.5 million)
and continuing operations ($52.5 million) based upon an estimated relative fair value calculation.
- (2)
- Allocation to disposal group was based upon an estimated relative fair value calculation.
As of December 31, 2009, goodwill with a book value of $31.6 million, of which $21.1 million related to the Owned & Operated Websites reporting unit and $10.5 million related to the Media reporting unit, is tax deductible. As of December 31, 2008, $34.0 million of goodwill was tax deductible.
F-23
The Company's acquired intangible assets as of December 31, 2009 are being amortized on a straight-line basis over the following weighted-average useful lives (in years):
| |
Weighted- Average Useful Life |
|||
|---|---|---|---|---|
Customer, affiliate and advertiser relationships |
7 | |||
Trademarks, trade names and domain names |
7 | |||
Developed technologies and websites |
4 | |||
Covenants not to compete |
4 | |||
The gross carrying amounts and accumulated amortization of the Company's acquired intangible assets were as follows at December 31, 2008 and 2007 (in thousands):
| |
Gross Balance |
Accumulated Amortization |
Net Carrying Amount |
||||||||
|---|---|---|---|---|---|---|---|---|---|---|---|
December 31, 2009: |
|||||||||||
Customer, affiliate and advertiser relationships |
$ | 46,793 | $ | (32,246 | ) | $ | 14,547 | ||||
Trademarks, trade names and domain names |
23,211 | (12,532 | ) | 10,679 | |||||||
Developed technologies and websites |
26,700 | (16,167 | ) | 10,533 | |||||||
Covenants not to compete |
7,525 | (4,566 | ) | 2,959 | |||||||
Total intangible assets |
$ | 104,229 | $ | (65,511 | ) | 38,718 | |||||
December 31, 2008: |
|||||||||||
Customer, affiliate and advertiser relationships |
$ | 81,596 | $ | (44,793 | ) | $ | 36,803 | ||||
Trademarks, trade names and domain names |
32,929 | (11,739 | ) | 21,190 | |||||||
Developed technologies and websites |
30,992 | (13,784 | ) | 17,208 | |||||||
Covenants not to compete |
15,819 | (10,978 | ) | 4,841 | |||||||
Total intangible assets |
$ | 161,336 | $ | (81,294 | ) | $ | 80,042 | ||||
Gross Intangible Assets decreased $57.1 million from $161.3 million at December 31, 2008 to $104.2 million at December 31, 2009. In 2009, the Company wrote off fully amortized intangible assets totaling $17.5 million and reclassified $41.3 million to the disposal group classified as assets held for sale. This decrease in the gross balance of the intangible assets at December 31, 2009 was offset by foreign currency translation adjustments totaling approximately $1.7 million. In 2008, $2.0 million was removed from the intangible asset balances due to the disposition of the e-commerce business. Additionally, the Company recorded an impairment charge of $248,000 in 2008 related to developed technologies and websites. Amortization expense related to intangible assets was $19.8 million, $21.7 million and $16.5 million for the years ended December 31, 2009, 2008 and 2007, respectively. Estimated intangible asset amortization expense for the next five years ending December 31 and thereafter is as follows (in thousands):
2010 |
$ | 19,367 | ||
2011 |
$ | 12,196 | ||
2012 |
$ | 4,666 | ||
2013 |
$ | 378 | ||
2014 |
$ | 378 | ||
Thereafter |
$ | 1,733 |
F-24
7. Property and Equipment
Property and equipment consisted of the following (in thousands):
| |
As of December 31, | ||||||
|---|---|---|---|---|---|---|---|
| |
2009 | 2008 | |||||
Land |
$ | 1,470 | $ | 1,470 | |||
Building |
1,330 | 1,330 | |||||
Computer equipment and purchased software |
32,984 | 46,276 | |||||
Furniture and equipment |
4,066 | 4,412 | |||||
Vehicles |
35 | 56 | |||||
Leasehold improvements |
2,979 | 3,299 | |||||
|
42,864 | 56,843 | |||||
Less: accumulated depreciation and amortization |
(31,592 | ) | (41,329 | ) | |||
|
$ | 11,272 | $ | 15,514 | |||
Total depreciation expense, including the amortization of leasehold improvements, for the years ended December 31, 2009, 2008 and 2007 was $7.6 million, $8.5 million and $8.1 million, respectively.
8. Accounts Payable and Accrued Expenses
Accounts payable and accrued expenses consisted of the following (in thousands):
| |
As of December 31, | ||||||
|---|---|---|---|---|---|---|---|
| |
2009 | 2008 | |||||
Accounts payable, including amounts due to publishers |
$ | 53,954 | $ | 59,941 | |||
Advertiser deposits |
17,232 | 16,026 | |||||
Accrued salaries and benefits |
7,357 | 5,992 | |||||
Accrued contingent consideration |
— | 62,563 | |||||
Other accrued expenses |
13,160 | 28,885 | |||||
|
$ | 91,703 | $ | 173,407 | |||
Accrued contingent consideration of $62.6 million for the year ended December 31, 2008 represents the contingent cash consideration earned by MeziMedia for achieving certain revenue and earnings performance targets for the year ended December 31, 2008 as per the terms of the merger agreement. These amounts were paid in February 2009. See Note 4.
9. Income Taxes
The components of income from continuing operations before income taxes are as follows (in thousands):
| |
Year Ended December 31, | |||||||||
|---|---|---|---|---|---|---|---|---|---|---|
| |
2009 | 2008 | 2007 | |||||||
United States |
$ | 75,584 | $ | (234,148 | ) | $ | 56,828 | |||
Foreign |
7,249 | 4,966 | 11,740 | |||||||
Income before income taxes |
$ | 82,833 | $ | (229,182 | ) | $ | 68,568 | |||
F-25
Income tax expense attributable to continuing operations is comprised of the following provision (benefit) components (in thousands):
| |
Year Ended December 31, | ||||||||||
|---|---|---|---|---|---|---|---|---|---|---|---|
| |
2009 | 2008 | 2007 | ||||||||
Current: |
|||||||||||
Federal |
$ | 9,256 | $ | 6,659 | $ | 29,552 | |||||
State |
6,861 | 4,137 | 7,126 | ||||||||
Foreign |
2,190 | 1,950 | 4,263 | ||||||||
|
18,307 | 12,746 | 40,941 | ||||||||
Deferred: |
|||||||||||
Federal |
1,910 | (36,649 | ) | (7,876 | ) | ||||||
State |
1,994 | (9,784 | ) | (2,729 | ) | ||||||
Foreign |
(947 | ) | (127 | ) | (1,930 | ) | |||||
|
2,957 | (46,560 | ) | (12,535 | ) | ||||||
Income tax expense |
$ | 21,264 | $ | (33,814 | ) | $ | 28,406 | ||||
Income tax expense attributable to discontinued operations is $4.0 million, $11.6 million, and $23.2 million for the years ended December 31, 2009, 2008 and 2007, respectively.
Income tax expense of $0.5 million attributable to stock option grants and restricted stock awards during 2009, and income tax expense primarily attributable to employee stock option tender offer of $19.2 million during 2008 were recorded as decreases to additional paid-in capital and did not, therefore, result in an expense in the consolidated statements of operations for the years ended December 31, 2009 and December 31, 2008, respectively. The income tax benefit of employee stock options exercised of $4.1 million during 2007 was recorded as increase to additional paid-in capital and did not, therefore, result in a benefit in the consolidated statement of operations for the year ended December 31, 2007. For the year ended December 31, 2007, the Company recorded a decrease to goodwill of $0.1 million related to tax benefits from exercises in 2007 of nonqualified employee stock options that were assumed and fully vested at the time of acquisition. No such decreases were recorded in the years ended December 31, 2009 and 2008.
F-26
The components of the deferred tax assets and deferred tax liabilities are as follows (in thousands):
| |
As of December 31, | ||||||||
|---|---|---|---|---|---|---|---|---|---|
| |
2009 | 2008 | |||||||
Deferred tax assets: |
|||||||||
Net operating loss carryforwards |
$ | 6,701 | $ | 7,904 | |||||
Depreciation and amortization |
49,660 | 52,492 | |||||||
Stock options |
5,079 | 3,929 | |||||||
State tax |
4,152 | 5,865 | |||||||
Unrealized loss on marketable securities |
2,395 | 3,515 | |||||||
Deferred book gain on asset sale |
— | 2,853 | |||||||
Other |
8,552 | 10,625 | |||||||
Gross deferred tax assets |
76,539 | 87,183 | |||||||
Valuation allowance |
(3,676 | ) | (4,574 | ) | |||||
Net deferred tax assets |
72,863 | 82,609 | |||||||
Deferred tax liabilities: |
|||||||||
Acquired intangible assets |
13,517 | 19,786 | |||||||
Other |
1,532 | 304 | |||||||
Total deferred tax liabilities |
15,049 | 20,090 | |||||||
Net deferred tax assets |
57,814 | 62,519 | |||||||
Current portion of net deferred tax assets |
7,972 | 11,032 | |||||||
Long-term portion of net deferred tax assets |
49,842 | 51,487 | |||||||
Net deferred tax assets |
$ | 57,814 | $ | 62,519 | |||||
In evaluating the need for a valuation allowance at December 31, 2009 and 2008, the Company evaluated both positive and negative evidence in accordance with GAAP. As of December 31, 2009, based upon both positive and negative evidence, the Company determined it is more likely than not that certain deferred tax assets may not be realizable. As of December 31, 2009 and 2008, the valuation allowance attributable to deferred tax assets was $3.7 million and $4.6 million, respectively, representing an overall decrease of $0.9 million. The decrease in valuation allowance relates primarily to a decrease in unrealized capital losses on marketable securities which the Company deems more likely than not will expire unutilized. As of December 31, 2009, the Company had net operating loss carryforwards for federal and state purposes of $14.4 million and $11.5 million, respectively. The federal and state net operating loss carryforwards begin to expire in 2019 and 2013, respectively.
F-27
A reconciliation of the beginning and ending amount of unrecognized tax benefits during 2009 and 2008 is as follows (in thousands):
| |
2009 | 2008 | 2007 | ||||||||
|---|---|---|---|---|---|---|---|---|---|---|---|
Unrecognized tax benefits balance at January 1 |
$ | 62,476 | $ | 68,597 | $ | 48,567 | |||||
Add: |
|||||||||||
Additions based on tax positions related to the current year |
1,888 | 2,349 | 19,887 | ||||||||
Additions for tax positions of prior years |
1,071 | 919 | 364 | ||||||||
Deduct: |
|||||||||||
Settlements with tax authorities |
— | (120 | ) | — | |||||||
Reductions as a result of lapse of applicable statute of limitations |
(12,815 | ) | (8,819 | ) | (221 | ) | |||||
Reductions for tax positions of prior years |
(588 | ) | (450 | ) | — | ||||||
Unrecognized tax benefits balance at December 31 |
$ | 52,032 | $ | 62,476 | $ | 68,597 | |||||
The total amount of unrecognized tax benefits of $52.0 million at December 31, 2009, if ultimately recognized, will reduce the Company's annual effective tax rate.
The Company's policy is to recognize interest and penalties expense, if any, related to uncertain tax positions as a component of income tax expense. For the years ended December 31, 2009, 2008, and 2007, the Company recognized $2.6 million, $4.3 million, and $3.5 million, respectively, in gross interest and penalties expense related to uncertain tax positions. During the years ended December 31, 2009 and 2008, gross interest expense was offset by a reversal of prior accrued interest of $2.8 million and $2.1 million, respectively, as a result of the expiration of certain statutes of limitations. As of December 31, 2009 and 2008, the Company had an accrued liability of $8.3 million and $8.5 million, respectively, for interest and penalties related to uncertain tax positions. These amounts are included in non-current income taxes payable.
The Company's uncertain tax positions are related to tax years that remain subject to examination by the relevant tax authorities. These include the 2006 through 2009 tax years for federal purposes, 1999 and 2004 through 2009 tax years for various state jurisdictions, and 2004 through 2009 tax years for various foreign jurisdictions. The Company is currently under examination by various state tax authorities for the 2004 through 2007 tax years and under federal examination for the 2007 tax year. Facts and circumstances could arise in the twelve-month period following December 31, 2009 that could cause the Company to reduce the liability for unrecognized tax benefits, including, but not limited to, settlement of income tax positions or expiration of the statutes of limitations. Since the ultimate resolution of uncertain tax positions depends on many factors and assumptions, the Company is not able to estimate the range of potential changes in the liability for unrecognized tax benefits or the timing of such changes.
F-28
The overall effective income tax rate for continuing operations differs from the statutory federal tax rate as follows:
| |
Year Ended December 31, | |||||||||
|---|---|---|---|---|---|---|---|---|---|---|
| |
2009 | 2008 | 2007 | |||||||
Tax provision (benefit) based on the federal statutory rate |
35.0 | % | (35.0 | )% | 35.0 | % | ||||
State income taxes, net of federal benefit |
6.9 | (1.5 | ) | 4.2 | ||||||
Stock-based compensation |
0.7 | 0.4 | 0.7 | |||||||
Research and experimentation credit |
(0.3 | ) | (0.2 | ) | (0.6 | ) | ||||
Goodwill impairment |
— | 24.8 | — | |||||||
Effects of foreign income |
(1.3 | ) | — | (0.7 | ) | |||||
Adjustment to valuation allowance, net of purchase accounting adjustments |
0.2 | — | (0.5 | ) | ||||||
Lapse of statute of limitations |
(17.5 | ) | (4.4 | ) | (0.3 | ) | ||||
Other, net |
2.0 | 1.1 | 3.6 | |||||||
Overall effective income tax rate |
25.7 | % | (14.8 | )% | 41.4 | % | ||||
The Company files a consolidated federal income tax return as well as state and foreign tax returns.
As of December 31, 2009, withholding and U.S. income taxes have not been provided on $21.9 million of unremitted earnings of certain non-U.S. subsidiaries because such earnings will be permanently reinvested in foreign operations. The determination of taxes associated with the $21.9 million of unremitted earnings is not practicable.
10. Capitalization
Share Repurchase Program
In September 2001, the Company's board of directors authorized a stock repurchase program (the "Program") to allow for the repurchase of shares of the Company's common stock at prevailing market prices in the open market or through unsolicited negotiated transactions.
Since the inception of the Program and through December 31, 2008, the Company's board of directors had authorized a total of $479.1 million for repurchases under the Program and the Company had repurchased a total of 47.1 million shares of its common stock for approximately $374.2 million, leaving approximately $105 million available under the Program as of December 31, 2008. During the year ended December 31, 2009, the Company repurchased 3.6 million shares of its common stock for $35.1 million, leaving approximately $69.9 million available under the Program as of December 31, 2009.
In the period from January 1, 2010 through February 25, 2010, the Company repurchased an additional 1.9 million shares of its common stock for $17.7 million, leaving $52.2 million available under the program as of February 25, 2010.
Repurchases have been funded from available working capital and all shares have been retired subsequent to their repurchase. There is no guarantee as to the exact number of shares that will be repurchased by the Company, and the Company may discontinue repurchases at any time that management or the Company's board of directors determines additional repurchases are not warranted. The amounts authorized by the Company's board of directors exclude broker commissions.
F-29
Stockholder Rights Plan
On June 4, 2002, the board of directors of ValueClick, Inc. declared a dividend of one preferred share purchase right for each outstanding share of the Company's common stock. The dividend was payable on June 14, 2002 to the stockholders of record at the close of business on that date. Each right entitles the registered holder to purchase from the Company one unit consisting of one-thousandth of a share of Series A junior participating preferred stock of the Company at a price of $25.00 per unit. The description and terms of the rights are set forth in a Rights Agreement, dated as of June 4, 2002, by and between the Company and Mellon Investor Services LLC, a New Jersey Limited Liability Company, as Rights Agent.
Until the earlier to occur of (i) the close of business on the tenth day after a public announcement that a person or group of affiliated or associated persons has acquired beneficial ownership of 15% or more of the Company's outstanding common stock or (ii) ten business days (or such later date as may be determined by action of the Company's board of directors prior to such time as any person becomes an acquiring person) following the commencement of, or announcement of an intention to make, a tender offer or exchange offer, the consummation of which would result in the bidder's beneficial ownership of 15% or more of the Company's outstanding common stock (the earlier of such dates being called the distribution date), the rights will be evidenced by the Company's common stock certificates.
The rights are not exercisable until the distribution date. The rights will expire at the close of business on June 4, 2012 unless the final expiration date is extended or the rights are earlier redeemed or exchanged by the Company.
The Series A junior participating preferred stock purchasable upon exercise of the rights will not be redeemable. Each share of Series A junior participating preferred stock will be entitled to a dividend of 1,000 times the dividend declared per share of common stock. In the event of liquidation, the holders of the shares of Series A junior participating preferred stock will be entitled to a payment of 1,000 times the payment made per share of common stock. Each share of Series A junior participating preferred stock will have 1,000 votes, voting together with the common stock. Finally, in the event of any merger, consolidation or other transaction in which shares of common stock are exchanged, each share of Series A junior participating preferred stock will be entitled to receive 1,000 times the amount received per share of common stock. These rights are protected by customary anti-dilution provisions.
The terms of the rights may be amended by the board of directors of the Company without the consent of the holders of the rights except that from and after such time that there is an acquiring person no amendment may adversely affect the interests of the holders of the rights.
Until a right is exercised, the holder of a right will have no rights by virtue of ownership as a stockholder of the Company, including, without limitation, the right to vote or to receive dividends.
11. Stock-Based Compensation
1999 Stock Option Plan and 2002 Stock Incentive Plan
On May 13, 1999, the Board of Directors adopted and the stockholders approved the 1999 Stock Option Plan (the "1999 Stock Plan"). A total of 5,000,000 shares of common stock were reserved for issuance under the 1999 Stock Plan.
On May 23, 2002, the Board of Directors adopted and the stockholders approved the 2002 Stock Incentive Plan and reserved an additional 10,000,000 shares of common stock for issuance under this plan. The 2002 Stock Incentive Plan replaced the 1999 Stock Plan and all available shares under the 1999 Stock Plan were transferred to the 2002 Stock Incentive Plan (collectively the "2002 Stock Plan"),
F-30
resulting in 15,000,000 common shares reserved for issuance. In addition, the shares under the 2002 Stock Plan increase annually on January 1 of each year equal to 1% of the total outstanding shares of ValueClick common stock as of the last day of the previous year. As of December 31, 2009, there are 5,989,724 shares available for future grant.
The 2002 Stock Plan provides for the granting of non-statutory and incentive stock options and restricted stock awards to, among other parties, employees, officers and directors of the Company. Stock options granted to new employees or officers generally begin vesting on the new employee's or officer's first date of employment, and vest over a four-year period, with one-fourth vesting on the first anniversary date and the remainder vesting pro-rata monthly over the remaining three years, and expire five to ten years from the date of grant. Stock options granted to existing employees or officers typically vest on a monthly pro-rata basis over a four-year period and expire five to ten years from the date of grant. Stock options granted to directors generally vest over a two-year period and expire five to ten years from the date of grant. Restricted stock grants generally vest over a four-year period.
Pursuant to the Company's business combinations with Fastclick, Web Clients, HiSpeed Media, Commission Junction, Be Free, and Mediaplex, the Company assumed certain stock options and related plans. No stock options are available for future grants under these assumed stock plans.
The following table summarizes stock option activity under the Company's stock plans for the years ended December 31, 2009, 2008, and 2007:
| |
Shares | Weighted- Average Exercise Price |
Weighted- Average Remaining Contractual Term |
Aggregate Intrinsic Value |
||||||||||
|---|---|---|---|---|---|---|---|---|---|---|---|---|---|---|
| |
|
|
(in years) |
(in thousands) |
||||||||||
Options outstanding at December 31, 2006 |
5,464,288 | $ | 13.66 | |||||||||||
Granted |
6,300,000 | $ | 26.95 | |||||||||||
Exercised |
(1,102,184 | ) | $ | 12.00 | ||||||||||
Forfeited/expired |
(1,536,626 | ) | $ | 19.59 | ||||||||||
Options outstanding at December 31, 2007 |
9,125,478 | $ | 22.04 | |||||||||||
Granted |
150,000 | $ | 21.27 | |||||||||||
Exercised |
(420,394 | ) | $ | 9.48 | ||||||||||
Forfeited/expired |
(5,875,317 | ) | $ | 26.31 | ||||||||||
Options outstanding at December 31, 2008 |
2,979,767 | $ | 15.35 | |||||||||||
Granted |
— | — | ||||||||||||
Exercised |
(83,062 | ) | $ | 9.22 | ||||||||||
Forfeited/expired |
(279,790 | ) | $ | 16.73 | ||||||||||
Options outstanding at December 31, 2009 |
2,616,915 | $ | 15.40 | 3.85 | $ | 2,095 | ||||||||
Options vested at December 31, 2009 and expected to vest after December 31, 2009 |
2,615,626 | $ | 15.39 | 3.84 | $ | 2,095 | ||||||||
Options exercisable at December 31, 2009 |
2,521,535 | $ | 15.20 | 3.90 | $ | 2,095 | ||||||||
The total intrinsic value of stock options exercised during the years ended December 31, 2009, 2008 and 2007 was $193,000, $2.6 million and $16.9 million, respectively. There were no stock options granted in 2009. The weighted-average estimated grant date fair value of stock options granted for the years ended December 31, 2008 and 2007 was $8.89 and $10.74, respectively.
As of December 31, 2009 and 2008, there were $579,000 and $3.6 million, respectively, of total unrecognized stock-based compensation related to unvested stock options. The remaining vesting period for such unvested stock options ranges up to 4 years, with a weighted-average remaining vesting period of 1.3 years.
F-31
Tender Offer
In September 2008, the Company completed a tender offer process in which it agreed to purchase certain underwater stock options from eligible employees, officers and directors. Under the terms of the tender offer process, the Company acquired and cancelled 4.8 million outstanding stock options with exercise prices ranging from $25.66 to $29.73, which resulted in cash payments of $5.0 million. The completed tender offer triggered the acceleration of stock-based compensation resulting in an additional charge of $30.3 million in the three-month period ended September 30, 2008, which represents the product of the number of unvested stock options purchased times the original Black-Scholes value that was established for each option on the original grant date.
Restricted Stock
The Company began granting restricted stock awards in 2008. During 2008, the Company granted 2.0 million shares of restricted stock under the Company's 2002 Stock Incentive Plan to its executive officers, board of directors and certain of its employees. Under the terms of the restricted stock awards, the shares granted generally vest over a four year period. If the employment of any recipient of a restricted stock grant terminates for any reason, the Company shall automatically reacquire any unvested shares without cost to the Company.
The following table summarizes activity for restricted stock awards during the year ended December 31, 2009:
| |
Shares | Weighted-Average Grant Date Fair Value |
||||||
|---|---|---|---|---|---|---|---|---|
Outstanding at December 31, 2008 |
1,890,435 | $ | 10.69 | |||||
Granted |
— | $ | — | |||||
Vested |
(321,500 | ) | $ | 12.98 | ||||
Forfeited |
(61,125 | ) | $ | 10.34 | ||||
Outstanding at December 31, 2009 |
1,507,810 | $ | 10.22 | |||||
At December 31, 2009, the intrinsic value of outstanding restricted stock awards was $15.3 million. The fair value of restricted stock that vested during the year ended December 31, 2009 was $3.3 million. As of December 31, 2009, there was $12.8 million of total unrecognized stock-based compensation related to unvested restricted stock awards. The weighted-average remaining vesting period is 2.7 years for these awards.
Employee Stock Purchase Plan
The Company commenced its Employee Stock Purchase Plan ("the Purchase Plan") in September 2007, which allows employees to purchase shares of the Company's common stock through payroll deductions of up to 10 percent of their annual, eligible compensation subject to certain Internal Revenue Code and Purchase Plan limitations. The Purchase Plan provides for the issuance of a cumulative maximum of 1.5 million shares of common stock. The price of common stock purchased under the Purchase Plan is equal to 85 percent of the lower of the fair market value of the common stock on the commencement date of each twelve-month offering period or the specified purchase date. For the year ended December 31, 2009, 329,000 shares were purchased. For the year ended December 31, 2008, 215,000 shares were purchased. No shares were purchased for the year ended December 31, 2007. For the years ended December 31, 2009, 2008 and 2007, stock-based compensation recognized under the Purchase Plan was $972,000, $1.1 million and $394,000, respectively. As of December 31, 2009, there was $645,000 of unrecognized compensation cost related to the Purchase Plan which is expected to be recognized over a weighted average period of approximately five months.
F-32
Valuation and Expense Information of Stock-Based Compensation
For the years ended December 31, 2009, 2008 and 2007, the Company recognized stock-based compensation of $8.9 million, $48.2 million and $15.4 million, respectively, in continuing operations. The following table summarizes, by consolidated statement of operations line item the impact of stock-based compensation and the related income tax benefits recognized for the years ended December 31, 2009, 2008 and 2007, (in thousands):
| |
Year Ended December 31, 2009 |
Year Ended December 31, 2008 |
Year Ended December 31, 2007 |
||||||||
|---|---|---|---|---|---|---|---|---|---|---|---|
Sales and marketing |
$ | 1,907 | $ | 15,621 | $ | 4,645 | |||||
General and administrative |
6,034 | 30,620 | 9,526 | ||||||||
Technology |
928 | 1,925 | 1,218 | ||||||||
Stock-based compensation |
8,869 | 48,166 | 15,389 | ||||||||
Related income tax benefits |
(2,884 | ) | (18,123 | ) | (5,677 | ) | |||||
Stock-based compensation, net of tax benefits |
$ | 5,985 | $ | 30,043 | $ | 9,712 | |||||
Stock-based compensation of $400,000, $5.2 million and $3.1 million, net of tax, was recorded in discontinued operations for the years ended December 31, 2009, 2008 and 2007, respectively. The Company has not capitalized as an asset any stock-based compensation for the years ended December 31, 2009, 2008 and 2007.
GAAP requires cash flows resulting from excess tax benefits to be classified as a financing activity. Excess tax benefits are realized tax benefits from tax deductions for exercised stock options in excess of the deferred tax asset attributable to the recognized stock-based compensation for such stock options. Pursuant to GAAP, $175,000, $599,000 and $4.5 million of excess tax benefits for the years ended December 31, 2009, 2008 and 2007, respectively, have been classified as a financing activity in the consolidated statements of cash flows.
The Company calculated the estimated fair value of each stock-based award on the date of grant using the Black-Scholes option-pricing model and the following weighted-average assumptions:
| |
Stock Options | |||||||||
|---|---|---|---|---|---|---|---|---|---|---|
| |
Year Ended December 31, | |||||||||
| |
2009 | 2008 | 2007 | |||||||
Risk-free interest rates |
— | 2.4 | % | 4.5 | % | |||||
Expected lives (in years) |
— | 3.6 | 3.6 | |||||||
Dividend yield |
— | 0 | % | 0 | % | |||||
Expected volatility |
— | 55 | % | 48 | % | |||||
| |
Employee Stock Purchase Plan | |||||||||
|---|---|---|---|---|---|---|---|---|---|---|
| |
Year Ended December 31, | |||||||||
| |
2009 | 2008 | 2007 | |||||||
Risk-free interest rates |
0.3 | % | 2.0 | % | 4.5 | % | ||||
Expected lives (in years) |
0.7 | 0.7 | 0.7 | |||||||
Dividend yield |
0 | % | 0 | % | 0 | % | ||||
Expected volatility |
61 | % | 57 | % | 51 | % | ||||
F-33
No stock options were granted by the Company in 2009. The risk-free interest rate used in the Company's fair value estimates are based on the implied yield available on U.S. Treasury securities with an equivalent remaining term. The Company estimated the expected life of each stock option granted in 2008 and 2007 using the short-cut method permissible under GAAP, which utilizes the weighted-average expected life of each tranche of the granted stock option, which was determined based on the sum of each tranche's vesting period plus one-half of the period from the vesting date of each tranche to its expiration. The expected life of options granted under the Purchase Plan represents the weighted-average amount of time remaining in the twelve-month offering period. The Company's computation of expected volatility for the years ended December 31, 2009, 2008 and 2007 was based on a combination of historical and market-based implied volatility from traded options on the Company's common stock.
12. Net Income Per Common Share
The following table sets forth the computation of basic and diluted net income per common share for the periods indicated (in thousands, except per share data):
| |
Year Ended December 31, | |||||||||||
|---|---|---|---|---|---|---|---|---|---|---|---|---|
| |
2009 | 2008 | 2007 | |||||||||
Numerator: |
||||||||||||
Income (loss) from continuing operations |
$ | 61,569 | $ | (195,368 | ) | $ | 40,162 | |||||
Income (loss) from discontinued operations |
7,047 | (18,744 | ) | 30,450 | ||||||||
Net (loss) income |
68,616 | $ | (214,112 | ) | $ | 70,612 | ||||||
Denominator: |
||||||||||||
Denominator for basic calculation—weighted-average common shares |
86,716 | 92,325 | 99,224 | |||||||||
Weighted-average effect of dilutive securities |
494 | — | 1,294 | |||||||||
Denominator for diluted calculation |
87,210 | 92,325 | 100,518 | |||||||||
Net income per common share: |
||||||||||||
Basic income (loss) from continuing operations |
$ | 0.71 | $ | (2.12 | ) | $ | 0.40 | |||||
Basic income (loss) from discontinued operations |
0.08 | (0.20 | ) | 0.31 | ||||||||
Basic net income (loss) |
$ | 0.79 | $ | (2.32 | ) | $ | 0.71 | |||||
Diluted income (loss) from continuing operations |
$ | 0.71 | $ | (2.12 | ) | $ | 0.40 | |||||
Diluted income (loss) from discontinued operations |
0.08 | (0.20 | ) | 0.30 | ||||||||
Diluted net income (loss) |
$ | 0.79 | $ | (2.32 | ) | $ | 0.70 | |||||
The diluted net income per common share computations exclude common stock options which were anti-dilutive as a result of their exercise price being greater than the average market price of the Company's common stock for the years ended December 31, 2009 and 2007. There were no stock options included in the denominator for the diluted calculation for the year ended December 31, 2008 as the Company recognized a loss from continuing operations and, therefore, inclusion of stock options would be anti-dilutive to the Company's loss per share. The number of shares excluded from the diluted net income per common share computation was 2.8 million, 6.4 million and 4.2 million for the years ended December 31, 2009, 2008 and 2007, respectively.
13. Defined Contribution Plans
Prior to 2006, the Company had various savings plans (the "Savings Plans") that qualified as defined contribution plans under Section 401(k) of the Internal Revenue Code. In 2006, the Savings Plans were consolidated into one savings plan (the "Master Savings Plan"), which also qualifies as a
F-34
defined contribution plan under Section 401(k) of the Internal Revenue Code. Under the Master Savings Plan, participating employees may defer a percentage of their eligible pre-tax earnings up to the Internal Revenue Service's annual contribution limit. All full-time domestic employees of the Company are eligible to participate in the Master Savings Plan. The Master Savings Plan does not permit investment of participant contributions in the Company's common stock. Company matching contributions to the Master Savings Plan is discretionary. Company contributions to the Master Savings Plan amounted to $734,000, $764,000 and $555,000 for the years ended December 31, 2009, 2008 and 2007, respectively.
14. Related Party Transactions
For the years ended December 31, 2009, 2008 and 2007, the Company recorded advertising costs in discontinued operations totaling $656,000, $1.2 million and $313,000, which were paid to Acquisis LLC, of which a member of the Company's board of directors is the managing partner and greater than 5% owner. The Company had outstanding amounts due to this entity of $43,000 and $131,000 as of December 31, 2009 and 2008, respectively, which are reflected in liabilities related to assets held for sale at December 31, 2009, and accounts payable and accrued expenses at December 31, 2008.
15. Line of Credit
In November 2008, the Company obtained a line of credit with a bank group which allows for borrowings of up to $100 million through November 14, 2011 ("Line of Credit"). The Line of Credit was amended on February 1, 2010. Advances under the Line of Credit bear interest at either (i) the Base Rate, which is equal to the highest of (a) the Agent's prime rate, (b) the federal funds rate plus 1.50%, and (c) the one month reserve adjusted daily LIBOR rate plus 1.50%, or (ii) the London Interbank Offered Rate ("LIBOR"), in each case plus an applicable margin as in effect at each interest calculation date. The applicable margin in effect from time to time is based on the Company's total leverage ratio. The applicable margins range from 1.50% to 2.25% for LIBOR loans and from 0.50% to 1.25% for Base Rate loans.
Certain of the Company's domestic subsidiaries have guaranteed the obligations of the Company and all future domestic subsidiaries of the Company also are required to guarantee the obligations of the Company under the Line of Credit. The Company's obligations are secured by a lien on substantially all of its present and future assets pursuant to a separate Security Agreement (the "Security Agreement"). In addition, the obligations of each subsidiary Guarantor are secured by a lien on substantially all of such subsidiary's present and future assets. The subsidiary guarantees and the collateral under the Security Agreement are subject to release upon fulfillment of certain conditions specified in the Credit Agreement, Security Agreement and the Guaranty Agreement.
The Line of Credit is available to be used by the Company, among other things, to fund its working capital needs and for other general corporate purposes, including acquisitions and stock repurchases. The Company will pay a commitment fee on unused amounts that ranges, based on the Company's total leverage ratio, from 0.35% to 0.50% of the unused portion of the Line of Credit. The agreement also contains customary events of default such as failure to pay interest or principal when due, material inaccuracy of representations or warranties, bankruptcy events, change of control, a material adverse change in financial condition or operations, or a default of covenant. Upon the occurrence of an event of default, the principal and accrued interest under the Line of Credit then outstanding may be declared due and payable. At December 31, 2009, no amount was outstanding on the Line of Credit.
The Company has provided various representations and agreed to certain financial covenants including a total leverage ratio, minimum trailing-twelve month EBITDA of $100 million, and minimum
F-35
unrestricted, unencumbered liquid asset requirements. At December 31, 2009, the Company was in compliance with all of the financial covenants of the Line of Credit.
16. Commitments and Contingencies
Leases
Future minimum lease payments as of December 31, 2009 under noncancellable operating leases, and related sublease income, with initial lease terms in excess of one year, for the next five years and thereafter are as follows (in thousands):
Year Ending December 31:
|
Operating Lease Commitments |
Operating Sublease Income |
||||||
|---|---|---|---|---|---|---|---|---|
2010 |
$ | 5,600 | $ | (468 | ) | |||
2011 |
4,214 | (89 | ) | |||||
2012 |
3,350 | — | ||||||
2013 |
2,498 | — | ||||||
2014 |
1,850 | — | ||||||
Thereafter |
2,693 | — | ||||||
Total minimum lease payments |
$ | 20,205 | $ | (557 | ) | |||
Operating leases consist primarily of facility leases. Certain of the Company's operating leases include escalation clauses that periodically adjust rental expense to reflect changes in price indices. The Company records rent expense on a straight-line basis over the lease term.
Total rent expense under operating leases, net of sublease income, was $5.6 million, $6.2 million and $4.6 million for the years ended December 31, 2009, 2008 and 2007, respectively.
As of December 31, 2009, the Company had the following purchase obligations (in thousands):
| |
Payments due by period | |||||||||||||||
|---|---|---|---|---|---|---|---|---|---|---|---|---|---|---|---|---|
| |
Total | Less than 1 year |
1 to less than 3 years |
3 to less than 5 years |
More than 5 years |
|||||||||||
Purchase obligations |
$ | 2,286 | $ | 1,924 | $ | 362 | $ | — | $ | — | ||||||
Purchase obligations include agreements to purchase goods or services that are enforceable, legally binding and specify all significant terms. Purchase obligations exclude agreements that are cancelable without penalty.
Standby letters of credit are maintained pursuant to certain of the Company's lease agreements. The standby letters of credit remain in effect at declining levels through the terms of the related leases. Commitments under standby letters of credit as of December 31, 2009 are scheduled to expire as follows (in thousands):
| |
Total | Less than 1 year |
1 to less than 3 years |
3 to less than 5 years |
More than 5 years |
|||||||||||
|---|---|---|---|---|---|---|---|---|---|---|---|---|---|---|---|---|
Standby letters of credit |
$ | 521 | $ | 521 | $ | — | $ | — | $ | — | ||||||
Other Commitments
In the ordinary course of business, the Company may provide indemnifications of varying scope and terms to customers, vendors, lessors, business partners, and other parties with respect to certain matters, including, but not limited to, losses arising out of the Company's breach of such agreements,
F-36
services to be provided by the Company, or from intellectual property infringement claims made by third parties. In addition, the Company has entered into indemnification agreements with its directors and certain of its officers and employees that will require the Company, among other things, to indemnify them against certain liabilities that may arise by reason of their status or service as directors, officers or employees. The Company has also agreed to indemnify certain former officers, directors and employees of acquired companies in connection with the acquisition of such companies. The Company maintains director and officer insurance, which may cover certain liabilities arising from its obligation to indemnify its directors and certain of its officers and employees, and former officers, directors and employees of acquired companies, in certain circumstances.
It is not possible to determine the maximum potential amount of exposure under these indemnification agreements due to the limited history of prior indemnification claims and the unique facts and circumstances involved in each particular agreement. Such indemnification agreements may not be subject to maximum loss clauses.
Legal Action
Internet Cookie Patent Litigation
In March of 2009, Netscape, Inc., a subsidiary of AOL, Inc., filed a complaint in the United States District Court (the "Court") for the Eastern District of Virginia against ValueClick, Inc., Mediaplex, Inc., Commission Junction, Inc., MeziMedia, Inc., Web Clients, Inc., and Fastclick, Inc. for alleged patent infringement of U.S. patent number 5,774,670, colloquially known as the "Internet Cookies Patent." On July 23, 2009, the Company filed a cross complaint against Netscape for, among other things, fraud.
The complaint seeks an unspecified amount of damages in addition to injunctive relief. Should the plaintiff be successful in this litigation, the Company could be liable for a royalty relating to the alleged use of the technology, the amount of which is not specified but which could be material to its financial position, operating results, and cash flows in the period in which the litigation is resolved (and possibly for future periods for future alleged use of the technology). The effectiveness of the Company's operations could be limited by any reduction or limitation in its ability to utilize any alleged related technology. If the Company loses at trial and is forced to utilize replacement technology, such replacement technology could require reengineering time and resources, might not be completed in time to avoid losing customers or advertising inventory, and might not be commercially feasible.
On January 29, 2010, the Court issued a ruling in this matter with respect to the parties' motions for summary judgment. On the Company's motion for summary judgment, the court granted its motion concerning 35 U.S.C. Sec. 102(b) with respect to Claim 1 on the patent, and ruled Claim 1 to be invalid. The validity of the remaining claims of the Internet Cookies Patent will be litigated at trial. The court also granted the Company's motion with respect to willfulness, which eliminates the plaintiff's claim for a finding of willful infringement and treble damages. On the plaintiff's motion for summary judgment, the court granted their motion with respect to equitable estoppel, public use, inventorship and preemption of the Company's state law counterclaims, including its claim for fraud. The court's decision eliminates those defenses and counter-claims by the Company. The Company believes it has valid remaining defenses and intends to defend itself vigorously at trial in this matter.
The plaintiff has filed a motion for reconsideration of the court's summary judgment ruling concerning Claim 1 of the Internet Cookies Patent and a hearing date for that motion has been set for March 19, 2010. A trial date for the remaining claims has been set in this matter for May 11, 2010. At this time, and based on all available evidence, the Company is unable to estimate the range of potential loss, if any, associated with this matter. Accordingly, the accompanying consolidated financial statements do not reflect an accrual of any amount for possible loss in this matter. Given the pending trial date in May 2010, it is reasonably possible that there will be developments in this matter in the
F-37
near future. Such developments, if any, will be considered by the Company in evaluating the need for an accrual in subsequent reporting periods.
Other Litigation
On April 8, 2008, Hypertouch, Inc. filed an action against the Company in the Superior Court of California, County of Los Angeles. The complaint asserts causes of action for violation of California Business & Professions Code §§ 17529.5 and 17200, et seq., arising from the plaintiff's alleged receipt of a large number of email messages allegedly transmitted by the Company "and/or (its) agents" and seeks statutory damages for each such email. The Company filed its answer to the complaint on May 28, 2008. On May 4, 2009, the court granted the Company's motion for summary judgment which ended the case in this court. Hypertouch has appealed the Court's ruling. The appeal is pending.
On July 15, 2008, the Company filed a complaint against Tacoda, Inc. in the United States District Court for the Central District of California for patent infringement of U.S. patent numbers 5,848,396 and 5,991,735. The Company is seeking an unspecified amount of damages in addition to injunctive relief. This case has been put on hold by the court until May 25, 2010, pending a review by the Patent and Trademark Office of U.S. patent numbers 5,848,396 and 5,991,735.
In the ordinary course of business, the Company may provide indemnifications of varying scope and terms to customers, vendors, lessors, business partners, and other parties with respect to certain matters, including, but not limited to, losses arising out of the Company's breach of such agreements, services to be provided by the Company, or from intellectual property infringement claims made by third-parties. In addition, the Company has entered into indemnification agreements with its directors and certain of its officers and employees that will require the Company, among other things, to indemnify them against certain liabilities that may arise by reason of their status or service as directors, officers or employees. The Company has also agreed to indemnify certain former officers, directors and employees of acquired companies in connection with the acquisition of such companies. The Company maintains director and officer insurance, which may cover certain liabilities arising from its obligation to indemnify its directors and certain of its officers and employees, and former officers, directors and employees of acquired companies, in certain circumstances.
It is not possible to determine the maximum potential amount of exposure under these indemnification agreements due to the limited history of prior indemnification claims and the unique facts and circumstances involved in each particular agreement. Such indemnification agreements may not be subject to maximum loss clauses.
From time to time, the Company may become subject to legal proceedings, claims and litigation arising in the ordinary course of business. In addition, the Company may receive letters alleging infringement of patent or other intellectual property rights. The Company is not currently a party to any material legal proceedings, except as discussed above, nor is the Company aware of any pending or threatened litigation that would have a material adverse effect on the Company's business, operating results, cash flows or financial condition should such litigation be resolved unfavorably.
17. Segments and Geographic Information
The Company derives its revenue from four business segments. These business segments are presented on a worldwide basis and include: Media, Affiliate Marketing, Owned & Operated Websites, and Technology. The following table provides revenue, segment income from operations and total assets for each of the Company's four business segments. Segment income from operations, as shown below, excludes the effects of: stock-based compensation; amortization of intangible assets; impairment of goodwill and intangible assets; and corporate expenses as these items are excluded from the segment performance measures utilized by the Company's chief operating decision maker in evaluating the performance of the segments. Corporate expenses consist of those costs not directly attributable to a
F-38
business segment, and include: salaries and benefits for the Company's executive, finance, legal, corporate governance, human resources, and facilities organizations; fees for professional service providers including audit, tax, Sarbanes-Oxley compliance and certain legal fees; insurance; and, other corporate expenses.
| |
Revenue | Segment Income from Operations | Total Assets | ||||||||||||||||||||||
|---|---|---|---|---|---|---|---|---|---|---|---|---|---|---|---|---|---|---|---|---|---|---|---|---|---|
| |
2009 | 2008 | 2007 | 2009 | 2008 | 2007 | 2009 | 2008 | |||||||||||||||||
| |
(in thousands) |
||||||||||||||||||||||||
Media |
$ | 135,086 | $ | 130,891 | $ | 125,319 | $ | 33,261 | $ | 25,215 | $ | 22,455 | $ | 282,135 | $ | 98,731 | |||||||||
Affiliate Marketing |
111,903 | 121,972 | 115,977 | 58,121 | 59,455 | 63,201 | 50,980 | 322,247 | |||||||||||||||||
Owned & Operated Websites |
149,599 | 177,145 | 112,706 | 35,034 | 40,932 | 22,507 | 87,058 | 121,929 | |||||||||||||||||
Technology |
27,686 | 28,670 | 23,741 | 12,775 | 13,600 | 10,537 | 6,951 | 60,372 | |||||||||||||||||
Inter-segment revenue |
(1,551 | ) | (3,237 | ) | (2,228 | ) | — | — | — | — | — | ||||||||||||||
Corporate assets |
— | — | — | — | — | — | 139,438 | — | |||||||||||||||||
Total |
$ | 422,723 | $ | 455,441 | $ | 375,515 | $ | 139,191 | $ | 139,202 | $ | 118,700 | $ | 566,562 | $ | 603,279 | |||||||||
A reconciliation of segment income from operations to consolidated income from operations is as follows for each period (in thousands):
| |
Segment Income from Operations | |||||||||
|---|---|---|---|---|---|---|---|---|---|---|
| |
2009 | 2008 | 2007 | |||||||
Segment income from operations |
$ | 139,191 | $ | 139,202 | $ | 118,700 | ||||
Corporate expenses |
(27,988 | ) | (31,436 | ) | (30,288 | ) | ||||
Stock-based compensation |
(8,869 | ) | (48,166 | ) | (15,389 | ) | ||||
Amortization of intangible assets |
(19,803 | ) | (21,733 | ) | (16,480 | ) | ||||
Impairment of goodwill and intangible assets |
— | (269,500 | ) | — | ||||||
Consolidated income (loss) from operations |
$ | 82,531 | $ | (231,633 | ) | $ | 56,543 | |||
Depreciation and leasehold amortization expense included in the determination of segment income from operations as presented above for the Media, Affiliate Marketing, Owned & Operated Websites, and Technology segments is as follows for each period (in thousands):
| |
Depreciation and Leasehold Amortization Expense |
|||||||||
|---|---|---|---|---|---|---|---|---|---|---|
| |
2009 | 2008 | 2007 | |||||||
Media |
$ | 2,135 | $ | 2,351 | $ | 1,977 | ||||
Affiliate Marketing |
1,057 | 1,786 | 2,029 | |||||||
Owned & Operated Websites |
1,878 | 2,038 | 1,687 | |||||||
Technology |
1,017 | 935 | 1,466 | |||||||
Total |
$ | 6,087 | $ | 7,110 | $ | 7,159 | ||||
The Company's operations are domiciled in the United States with operations in Europe, China and Japan through wholly-owned subsidiaries. Revenue is attributed to individual countries based upon the country in which the customer relationship is maintained. The Company's operations in China primarily support the revenue generated in the United States, and therefore, the costs associated with these operations are attributed to the United States in the determination of geographic income from operations shown below. Geographic long-lived assets exclude deferred tax assets and other assets in the Company's consolidated balance sheets.
F-39
The Company's geographic information was as follows (in thousands):
| |
Year Ended December 31, 2009 | |
||||||||
|---|---|---|---|---|---|---|---|---|---|---|
| |
Long-lived Assets at December 31, 2009 |
|||||||||
| |
Revenue | Income from Operations |
||||||||
United States |
$ | 339,684 | $ | 76,516 | $ | 9,735 | ||||
International |
87,605 | 6,015 | 1,537 | |||||||
Inter-regional eliminations |
(4,566 | ) | — | — | ||||||
Total |
$ | 422,723 | $ | 82,531 | $ | 11,272 | ||||
| |
Year Ended December 31, 2008 |
|
||||||||
|---|---|---|---|---|---|---|---|---|---|---|
| |
Long-lived Assets at December 31, 2008 |
|||||||||
| |
Revenue | Income (loss) from Operations |
||||||||
United States |
$ | 351,134 | $ | (235,629 | ) | $ | 13,329 | |||
International |
111,380 | 3,996 | 2,185 | |||||||
Inter-regional eliminations |
(7,073 | ) | — | — | ||||||
Total |
$ | 455,441 | $ | (231,633 | ) | $ | 15,514 | |||
| |
Year Ended December 31, 2007 |
|
||||||||
|---|---|---|---|---|---|---|---|---|---|---|
| |
Long-lived Assets at December 31, 2007 |
|||||||||
| |
Revenue | Income from Operations |
||||||||
United States |
$ | 285,930 | $ | 47,937 | $ | 16,964 | ||||
International |
100,818 | 8,606 | 2,393 | |||||||
Inter-regional eliminations |
(11,233 | ) | — | — | ||||||
Total |
$ | 375,515 | $ | 56,543 | $ | 19,357 | ||||
F-40
VALUECLICK, INC.
VALUATION AND QUALIFYING ACCOUNTS
(in thousands)
| |
Balance at Beginning of Period |
Additions Charged To Expense/ Against Revenue |
Other Adjustments(2) |
Deductions | Balance at End of Period |
||||||||||||
|---|---|---|---|---|---|---|---|---|---|---|---|---|---|---|---|---|---|
Allowance for doubtful accounts and sales credits(1): |
|||||||||||||||||
Year ended December 31, 2009 |
$ | 5,886 | $ | 4,860 | $ | (196 | ) | $ | (6,325 | ) | $ | 4,225 | |||||
Year ended December 31, 2008 |
$ | 6,535 | $ | 7,212 | $ | 37 | $ | (7,898 | ) | $ | 5,886 | ||||||
Year ended December 31, 2007 |
$ | 4,124 | $ | 7,762 | $ | 31 | $ | (5,382 | ) | $ | 6,535 | ||||||
- (1)
- Items
relating to the allowance for doubtful accounts are charged to expense. Items relating to sales credits are charged against revenue.
- (2)
- Other adjustments represent increases from acquisitions and decreases from the reclassification of amounts related to assets held for sale.
F-41
Pursuant to the requirements of Section 13 or 15(d) of the Securities Exchange Act of 1934, the registrant has duly caused this annual report on Form 10-K to be signed on its behalf by the undersigned, thereunto duly authorized, in the City of Westlake Village, State of California, on the 26th day of February, 2010.
| VALUECLICK, INC. | ||||
By: |
/s/ TOM A. VADNAIS Tom A. Vadnais Chief Executive Officer |
|||
KNOW ALL MEN BY THESE PRESENTS, the undersigned hereby constitute and appoint each of Tom A. Vadnais and John Pitstick their true and lawful attorney-in-fact and agent, with full power of substitution and resubstitution, for them and in their name, place and stead, in any and all capacities, to sign any and all amendments to this annual report on Form 10-K, and to file the same, with exhibits thereto, and other documents in connection therewith, with the Securities and Exchange Commission, granting unto said attorney-in-fact and agent, full power and authority to do and perform each and every act and thing requisite or necessary to be done in connection therewith, as fully to all intents and purposes as they might or could do in person, hereby ratifying and confirming all that said attorney-in-fact and agent, or his respective substitute or substitutes, may lawfully do or cause to be done by virtue hereof.
Pursuant to the requirements of the Securities Exchange Act of 1934, this report has been signed below by the following persons on behalf of the registrant and in the capacities and on the dates indicated:
Signature
|
Title
|
Date
|
||
|---|---|---|---|---|
| /s/ TOM A. VADNAIS Tom A. Vadnais |
Director and Chief Executive Officer (Principal Executive Officer) |
February 26, 2010 | ||
/s/ JOHN PITSTICK John Pitstick |
Chief Financial Officer (Principal Financial and Accounting Officer) |
February 26, 2010 |
||
/s/ JAMES R. ZARLEY James R. Zarley |
Chairman of the Board of Directors |
February 26, 2010 |
||
/s/ DAVID S. BUZBY David S. Buzby |
Director |
February 26, 2010 |
||
/s/ MARTIN T. HART Martin T. Hart |
Director |
February 26, 2010 |
||
/s/ JEFFREY F. RAYPORT Jeffrey F. Rayport |
Director |
February 26, 2010 |
||
/s/ JAMES A. CROUTHAMEL James A. Crouthamel |
Director |
February 26, 2010 |
||
/s/ JAMES R. PETERS James R. Peters |
Director |
February 26, 2010 |