Attached files
Table of Contents
UNITED STATES
SECURITIES AND EXCHANGE COMMISSION
WASHINGTON, D.C. 20549
FORM 10-K
| x | Annual Report Pursuant to Section 13 or 15(d) of the Securities Exchange Act of 1934 |
For the fiscal year ended December 31, 2009
OR
| ¨ | Transition Report Pursuant to Section 13 or 15(d) of the Securities Exchange Act of 1934 |
For the transition period from to
| Commission File No. |
Exact name of each Registrant as specified in its charter, state of incorporation, address of principal executive offices, telephone number |
I.R.S. Employer Identification Number | ||
| 1-8180 | TECO ENERGY, INC. (a Florida corporation) TECO Plaza 702 N. Franklin Street Tampa, Florida 33602 (813) 228-1111 |
59-2052286 | ||
| 1-5007 | TAMPA ELECTRIC COMPANY (a Florida corporation) TECO Plaza 702 N. Franklin Street Tampa, Florida 33602 (813) 228-1111 |
59-0475140 | ||
Securities registered pursuant to Section 12(b) of the Act:
| Title of each class |
Name of each exchange on which registered | |
| TECO Energy, Inc. Common Stock, $1.00 par value |
New York Stock Exchange |
Securities registered pursuant to Section 12(g) of the Act: NONE
Indicate by check mark if TECO Energy, Inc. is a well-known seasoned issuer, as defined in Rule 405 of the Securities Act. YES x NO ¨
Indicate by check mark if Tampa Electric Company is a well-known seasoned issuer, as defined in Rule 405 of the Securities Act. YES ¨ NO x
Indicate by check mark if the registrants are not required to file reports pursuant to Section 13 or Section 15(d) of the Exchange Act. YES ¨ NO x
Indicate by check mark whether the registrants (1) have filed all reports required to be filed by Section 13 or 15(d) of the Securities Exchange Act of 1934 during the preceding 12 months (or for such shorter period that the registrant was required to file such reports), and (2) have been subject to such filing requirements for the past 90 days. YES x NO ¨
Indicate by check mark whether the registrants have submitted electronically and posted on their corporate Web site, if any, every Interactive Data File required to be submitted and posted pursuant to Rule 405 of Regulation S-T during the preceding 12 months (or for such shorter period that the registrants were required to submit and post such files). YES ¨ NO ¨
Indicate by check mark if disclosure of delinquent filers pursuant to Item 405 of Regulation S-K is not contained herein, and will not be contained, to the best of registrants’ knowledge, in definitive proxy or information statements incorporated by reference in Part III of this Form 10-K or any amendment to this Form 10-K. ¨
Indicate by check mark whether TECO Energy, Inc. is a large accelerated filer, an accelerated filer, a non-accelerated filer, or a smaller reporting company. See the definitions of “large accelerated filer,” “accelerated filer” and “smaller reporting company” in Rule 12b-2 of the Exchange Act.
Large Accelerated filer x Accelerated filer ¨ Non-Accelerated filer ¨ Smaller reporting company ¨
Indicate by check mark whether Tampa Electric Company is a large accelerated filer, an accelerated filer, a non-accelerated filer, or a smaller reporting company. See the definitions of “large accelerated filer,” “accelerated filer” and “smaller reporting company” in Rule 12b-2 of the Exchange Act.
Large Accelerated filer ¨ Accelerated filer ¨ Non-Accelerated filer x Smaller reporting company ¨
Indicate by check mark whether TECO Energy, Inc. is a shell company (as defined in Rule 12b-2 of the Act). YES ¨ NO x
Indicate by check mark whether Tampa Electric Company is a shell company (as defined in Rule 12b-2 of the Act). YES ¨ NO x
The aggregate market value of TECO Energy, Inc.’s common stock held by non-affiliates of the registrant as of Jun. 30, 2009 was $2,549,968,020 based on the closing sale price as reported on the New York Stock Exchange.
The aggregate market value of Tampa Electric Company’s common stock held by non-affiliates of the registrant as of Jun. 30, 2009 was zero.
The number of shares of TECO Energy, Inc.’s common stock outstanding as of Feb. 22, 2010 was 213,857,116. As of Feb. 22, 2010, there were 10 shares of Tampa Electric Company’s common stock issued and outstanding, all of which were held, beneficially and of record, by TECO Energy, Inc.
DOCUMENTS INCORPORATED BY REFERENCE
Portions of the Definitive Proxy Statement relating to the 2010 Annual Meeting of Shareholders of TECO Energy, Inc. are incorporated by reference into Part III.
Tampa Electric Company meets the conditions set forth in General Instruction (I) (1) (a) and (b) of Form 10-K and is therefore filing this form with the reduced disclosure format.
This combined Form 10-K represents separate filings by TECO Energy, Inc. and Tampa Electric Company. Information contained herein relating to an individual registrant is filed by that registrant on its own behalf. Tampa Electric Company makes no representations as to the information relating to TECO Energy, Inc.’s other operations.
Cover page of 183
Index to Exhibits begins on page 180
Table of Contents
PART I
| Item 1. | BUSINESS. |
TECO ENERGY
TECO Energy, Inc. (TECO Energy) was incorporated in Florida in 1981 as part of a restructuring in which it became the parent corporation of Tampa Electric Company. TECO Energy and its subsidiaries had approximately 4,073 employees as of Dec. 31, 2009.
TECO Energy’s Corporate Governance Guidelines, the charter of each committee of the Board of Directors, and the code of ethics applicable to all directors, officers and employees, the Standards of Integrity, are available on the Investors section of TECO Energy’s website, www.tecoenergy.com, or in print free of charge to any investor who requests the information. TECO Energy also makes its Securities and Exchange Commission (SEC) (www.sec.gov) filings available free of charge on the Investors section of TECO Energy’s website as soon as reasonably practicable after they are filed with or furnished to the SEC.
TECO Energy is a holding company for regulated utilities and other businesses. TECO Energy currently owns no operating assets but holds all of the common stock of Tampa Electric Company and through its subsidiary TECO Diversified, Inc., owns TECO Coal Corporation and through its subsidiary TECO Wholesale Generation, Inc., owns TECO Guatemala, Inc.
Unless otherwise indicated by the context, “TECO Energy” means the holding company, TECO Energy, Inc., and its subsidiaries, and references to individual subsidiaries of TECO Energy, Inc. refer to that company and its respective subsidiaries. TECO Energy’s business segments, and revenues for those segments for the years indicated, are identified below.
Tampa Electric Company, a Florida corporation and TECO Energy’s largest subsidiary, has two business segments. Its Tampa Electric division (Tampa Electric) provides retail electric service to almost 667,000 customers in West Central Florida with a net winter system generating capability of 4,719 megawatts (MW). Peoples Gas System (PGS), the gas division of Tampa Electric Company, is engaged in the purchase, distribution and sale of natural gas for residential, commercial, industrial and electric power generation customers in Florida. With more than 334,000 customers, PGS has operations in Florida’s major metropolitan areas. Annual natural gas throughput (the amount of gas delivered to its customers, including transportation-only service) in 2009 was 1.4 billion therms.
TECO Coal Corporation (TECO Coal), a Kentucky corporation, has 13 subsidiaries located in Eastern Kentucky, Tennessee and Virginia. These entities own mineral rights, own or operate surface and underground mines and own interests in coal processing and loading facilities.
TECO Guatemala, Inc. (TECO Guatemala), a Florida corporation, owns equity investments in unconsolidated subsidiaries that participate in two contracted power plants and an interest in Distribućion Eléctrica Centro Americana II, S.A. (DECA II), which has an ownership interest in Guatemala’s largest distribution utility, Empresa Eléctrica de Guatemala, S.A. (EEGSA) and other affiliated energy-related companies.
TECO Transport Corporation (TECO Transport), a Florida corporation, was sold on Dec. 4, 2007. During 2007, it owned no operating assets but owned all of the common stock of, or membership interests in, nine subsidiaries which provided waterborne transportation, storage and transfer services of coal and other dry-bulk commodities.
Revenues from Continuing Operations
| (millions) |
2009 | 2008 | 2007 | |||||||||
| Tampa Electric |
$ | 2,194.8 | $ | 2,091.2 | $ | 2,188.4 | ||||||
| PGS |
470.8 | 688.4 | 599.7 | |||||||||
| Total regulated businesses |
2,665.6 | 2,779.6 | 2,788.1 | |||||||||
| TECO Coal |
653.0 | 588.4 | 544.5 | |||||||||
| TECO Guatemala (1) |
8.3 | 8.4 | 8.0 | |||||||||
| TECO Transport |
— | — | 290.3 | |||||||||
| 3,326.9 | 3,376.4 | 3,630.9 | ||||||||||
| Other and eliminations |
(16.4 | ) | (1.1 | ) | (94.8 | ) | ||||||
| Total revenues from continuing operations |
$ | 3,310.5 | $ | 3,375.3 | $ | 3,536.1 | ||||||
| (1) | Revenues are exclusive of entities deconsolidated as a result of accounting standards and include only revenues for the consolidated Guatemalan entities. |
1
Table of Contents
For additional financial information regarding TECO Energy’s significant business segments including geographic areas, see Note 14 to the TECO Energy Consolidated Financial Statements. Also, see Note 19 for additional information regarding the deconsolidation of Guatemala subsidiaries.
Discontinued Operations/Asset Dispositions
TECO Energy’s results for 2007 include amounts related to asset dispositions as part of the company’s business strategy to focus on the electric and gas utilities, eliminate exposure to the merchant power sector and retire parent debt.
In the fourth quarter of 2007, TECO Energy completed its sale of TECO Transport to an unaffiliated investment group. As a result of its continuing involvement via a waterborne transportation contract with Tampa Electric, all results through the date of sale were accounted for in continuing operations. In the second quarter of 2007, a favorable conclusion was reached with taxing authorities regarding the 2005 disposition of Union and Gila merchant power plants. This resulted in after-tax net income of $14.3 million reflected in discontinued operations.
TAMPA ELECTRIC—Electric Operations
Tampa Electric Company was incorporated in Florida in 1899 and was reincorporated in 1949. Tampa Electric Company is a public utility operating within the state of Florida. Its Tampa Electric division is engaged in the generation, purchase, transmission, distribution and sale of electric energy. The retail territory served comprises an area of about 2,000 square miles in West Central Florida, including Hillsborough County and parts of Polk, Pasco and Pinellas Counties, with an estimated population of over one million. The principal communities served are Tampa, Winter Haven, Plant City and Dade City. In addition, Tampa Electric engages in wholesale sales to utilities and other resellers of electricity. It has three electric generating stations in or near Tampa, one electric generating station in southwestern Polk County, Florida and one electric generating station in long-term reserve standby located near Sebring, a city in Highlands County in South Central Florida.
Tampa Electric had 2,324 employees as of Dec. 31, 2009, of which 898 were represented by the International Brotherhood of Electrical Workers and 209 were represented by the Office and Professional Employees International Union.
In 2009, approximately 49% of Tampa Electric’s total operating revenue was derived from residential sales, 31% from commercial sales, 9% from industrial sales and 11% from other sales, including bulk power sales for resale. The sources of operating revenue and megawatt hour sales for the years indicated were as follows:
Operating Revenue
| (millions) |
2009 | 2008 | 2007 | |||||||
| Residential |
$ | 1,082.4 | $ | 981.7 | $ | 1,017.9 | ||||
| Commercial |
689.1 | 639.0 | 653.6 | |||||||
| Industrial—Phosphate |
81.2 | 66.1 | 73.0 | |||||||
| Industrial—Other |
111.0 | 111.2 | 118.2 | |||||||
| Other retail sales of electricity |
204.3 | 185.7 | 178.4 | |||||||
| Total retail |
2,168.0 | 1,983.7 | 2,041.1 | |||||||
| Sales for resale |
42.4 | 69.7 | 69.0 | |||||||
| Other |
(15.6 | ) | 37.8 | 78.3 | ||||||
| Total operating revenues |
$ | 2,194.8 | $ | 2,091.2 | $ | 2,188.4 | ||||
| Megawatt-hour Sales
|
||||||||||
| (millions) |
2009 | 2008 | 2007 | |||||||
| Residential |
8,667 | 8,546 | 8,871 | |||||||
| Commercial |
6,274 | 6,399 | 6,542 | |||||||
| Industrial |
1,995 | 2,205 | 2,366 | |||||||
| Other retail sales of electricity |
1,839 | 1,840 | 1,754 | |||||||
| Total retail |
18,775 | 18,990 | 19,533 | |||||||
| Sales for resale |
440 | 884 | 905 | |||||||
| Total energy sold |
19,215 | 19,874 | 20,438 | |||||||
No significant part of Tampa Electric’s business is dependent upon a single or limited number of customers where the loss of any one or more would have a significant adverse effect on Tampa Electric. Tampa Electric’s business is not highly seasonal, but winter peak loads are experienced due to electric space heating, fewer daylight hours and colder temperatures and summer peak loads are experienced due to the use of air conditioning and other cooling equipment.
2
Table of Contents
Regulation
The retail operations of Tampa Electric are regulated by the Florida Public Service Commission (FPSC), which has jurisdiction over retail rates, quality of service and reliability, issuances of securities, planning, siting and construction of facilities, accounting and depreciation practices and other matters.
In general, the FPSC’s pricing objective is to set rates at a level that allows the utility to collect total revenues (revenue requirements) equal to its cost of providing service, plus a reasonable return on invested capital.
The costs of owning, operating and maintaining the utility system, other than fuel, purchased power, conservation and certain environmental costs, are recovered through base rates. These costs include operation and maintenance expenses, depreciation and taxes, as well as a return on Tampa Electric’s investment in assets used and useful in providing electric service (rate base). The rate of return on rate base, which is intended to approximate Tampa Electric’s weighted cost of capital, primarily includes its costs for debt, deferred income taxes at a zero cost rate and an allowed return on common equity. Base rates are determined in FPSC rate setting hearings which occur at irregular intervals at the initiative of Tampa Electric, the FPSC or other parties.
Tampa Electric’s rates and allowed return on equity (ROE) range of 10.25% to 12.25%, with a midpoint of 11.25%, are in effect until such time as changes are occasioned by an agreement approved by the FPSC or other FPSC actions as a result of rate or other proceedings initiated by Tampa Electric, FPSC staff or other interested parties. These values were set by the FPSC in March 2009 as part of Tampa Electric’s base rate proceeding filed in August 2008.
Prior to August 2008, Tampa Electric had not sought a base rate increase since 1992. As a result of lower customer growth, lower energy sales growth, and ongoing high levels of capital investment, Tampa Electric’s 13-month average regulatory ROE was 8.7% at the end of 2008.
Recognizing the significant decline in ROE, Tampa Electric filed for a $228.2 million base rate increase in August 2008. The filing included a request for an ROE mid-point of 12%, 54.0% equity in the capital structure and rate base of $3.7 billion. The formal hearing before the FPSC was held in late January 2009 and in March 2009, the FPSC approved a total base rate increase of $137.8 million, $104.3 million effective May 2009 and an additional $33.5 million, subject to audit of actual final cost, actual in service dates, need and prudency, effective January 2010 associated with Tampa Electric’s completion of five combustion turbine (CT) generation units and new rail facilities by Dec. 31, 2009. Motions for reconsideration of the FPSC’s decision were filed by Tampa Electric (addressing an incorrect tax calculation) and the intervenors (addressing the appropriateness of the additional rate increase in January 2010). In July 2009, the FPSC approved Tampa Electric’s motion and denied the intervenors’ motion for reconsideration, which increased the approved base rate increase to $147.7 million. Due to the FPSC’s denial of the intervenors’ motion for reconsideration, they have notified the FPSC of their intent to file an appeal with the Florida Supreme Court.
In October 2009, Tampa Electric filed its petition supporting the cost and in service operation of the CTs and rail facilities, the continuing need for the CTs and requesting the proposed rates become effective January 2010 as authorized by the FPSC. The FPSC determined, based in part on its staff audit of the actual costs of the CTs, that the January base rate change should be reduced by $8.4 million to $25.7 million, subject to refund. An evidentiary hearing will be held during 2010 regarding the need for the CTs, the appropriate amount to be recovered and the resulting rates. The intervenor’s appeal to the Florida Supreme Court is independent of the FPSC hearing. The intervenors are expected to file their initial appellate brief with the Florida Supreme Court in February 2010. A decision date in that case is uncertain.
Fuel, purchased power, conservation and certain environmental costs are recovered through levelized monthly charges established pursuant to the FPSC’s cost recovery clauses. These charges, which are reset annually in an FPSC proceeding, are based on estimated costs of fuel, environmental compliance, conservation programs, purchased power and estimated customer usage for a specific recovery period, with a true-up adjustment to reflect the variance of actual costs from the projected costs. The FPSC may disallow recovery of any costs that it considers imprudently incurred.
In November 2008, the FPSC approved Tampa Electric’s originally requested 2009 fuel rates. The rates included the costs for natural gas and coal expected in 2009, and the recovery of fuel and purchased power expenses, which were not collected in 2008. In March 2009, Tampa Electric filed a mid-course correction with the FPSC to adjust its projected 2009 fuel and purchased power costs to reflect the decline in commodity fuel prices, primarily natural gas. The revised forecast reduced fuel and purchased power costs by $191 million for 2009, which when combined with $35 million over recovery in late 2008, resulted in $226 million lower projected fuel and purchased power cost (coincident with the base rate adjustments made as a result of the base rate proceeding). Residential energy rates also reflect a two-block base rate and fuel factor structure with a lower factor for the first 1,000 kilowatt-hours used each month. Tampa Electric’s residential customer rate per 1,000 kilowatt-hours decreased $1.94 from $114.67 in August of 2009 to $112.73 in 2010.
In November 2009, the FPSC approved cost recovery rates for fuel and purchased power, capacity, environmental and conservation costs for the period January through December 2010. The rates include the expected cost for natural gas and coal in 2010 as well as the solid fuel transportation costs associated with the company’s transportation agreements, the net over recovery of fuel, purchased power and capacity clause expenses, which were collected in 2009 following the March adjustment, and the operating cost for and a return on the capital invested in the fourth SCR project to enter service at the Big Bend Power Station as well as the operation and maintenance expense associated with the projects.
3
Table of Contents
The FPSC determined that it was appropriate for Tampa Electric to recover selective catalytic reduction (SCR) operating costs through the environmental cost recovery clause (ECRC) as well as earn a return on its SCR investment installed on the Big Bend coal fired units for NOx control in compliance with the environmental consent decree. The SCR for Big Bend Unit 4 was reported in service in May 2007, the SCR for Big Bend Unit 3 was reported in service in June 2008, the SCR for Big Bend Unit 2 was reported in service in May 2009 and cost recovery started in the respective in service years. The SCR for Big Bend Unit 1 is scheduled to enter service by May 1, 2010, and cost recovery for the capital investment and operating costs for that unit has been approved by the FPSC to start in 2010.
Tampa Electric is also subject to regulation by the Federal Energy Regulatory Commission (FERC) in various respects, including wholesale power sales, certain wholesale power purchases, transmission services, bulk electric system reliability standards, affiliate transactions and accounting and depreciation practices. Regarding reliability standards, a spot audit of Tampa Electric was conducted Nov. 9-13, 2009 by the Florida Reliability Coordinating Council (FRCC). FRCC is a Regional Entity operating under a Delegation Agreement approved by the North American Electric Reliability Corporation (NERC) and FERC. The FRCC audit assessed compliance with the NERC Critical Infrastructure Protection (CIP) or cyber standards. The FRCC Compliance Staff concluded that Tampa Electric was fully compliant with 12 of the 13 NERC CIP requirements subject to the spot audit with one relatively minor finding. See also the Regulation section of MD&A.
The Energy Policy Act of 2005 repealed the Public Utility Holding Company Act of 1935 (PUHCA), which established a regulatory regime overseen by the SEC, and replaced it with a new statute focused on increased access to holding-company books and records to assist the FERC and state utility regulators in protecting customers of regulated utilities. On Dec. 8, 2005, the FERC finalized rules to implement the congressional mandated repeal of the PUHCA of 1935 and enactment of the PUHCA of 2005. FERC issued its final rules effective Feb. 8, 2006. Pursuant to this Act, TECO Energy has a single-state waiver regarding FERC’s access to its holding-company books and records.
Federal, state and local environmental laws and regulations cover air quality, water quality, land use, power plant, substation and transmission line siting, noise and aesthetics, solid waste and other environmental matters (see Environmental Matters section below).
Transactions between Tampa Electric and its affiliates are subject to regulation by the FPSC and FERC, and any charges deemed to be imprudently incurred may be disallowed for recovery from Tampa Electric’s retail and wholesale customers, respectively.
Competition
Tampa Electric’s retail electric business is substantially free from direct competition with other electric utilities, municipalities and public agencies. At the present time, the principal form of competition at the retail level consists of self-generation available to larger users of electric energy. Such users may seek to expand their alternatives through various initiatives, including legislative and/or regulatory changes that would permit competition at the retail level. Tampa Electric intends to retain and expand its retail business by managing costs and providing high quality service to retail customers.
Presently there is competition in Florida’s wholesale power markets, largely as a result of the Energy Policy Act of 1992 and related federal initiatives. However, the state’s Power Plant Siting Act, which sets the state’s electric energy and environmental policy and governs the building of new generation involving steam capacity of 75 megawatts or more, requires that applicants demonstrate that a plant is needed prior to receiving construction and operating permits.
FPSC rules require Investor Owned Utilities (IOUs) to issue Request for Proposals (RFPs) prior to filing a petition for Determination of Need for construction of a power plant with a steam cycle greater than 75 megawatts. These rules provide a mechanism for expedited dispute resolution, allow bidders to submit new bids whenever the IOU revises its cost estimates for its self-build option, require IOUs to disclose the methodology and criteria to be used to evaluate the bids, and provide more stringent standards for the IOUs to recover cost overruns in the event the self-build option is deemed the most cost-effective.
Fuel
Approximately 55% of Tampa Electric’s generation of electricity for 2009 was coal-fired, with natural gas representing approximately 45% and oil representing less than 1%. Tampa Electric used its generating units to meet approximately 91% of the total system load requirements, with the remaining 9% coming from purchased power. Tampa Electric’s average delivered fuel cost per million British thermal unit (Btu) and average delivered cost per ton of coal burned, have been as follows:
| Average cost per million Btu |
2009 | 2008 | 2007 | 2006 | 2005 | ||||||||||
| Coal |
$ | 3.05 | $ | 2.91 | $ | 2.57 | $ | 2.49 | $ | 2.25 | |||||
| Oil |
$ | 16.01 | $ | 20.48 | $ | 13.87 | $ | 13.39 | $ | 10.16 | |||||
| Gas (Natural) |
$ | 8.00 | $ | 10.61 | $ | 9.52 | $ | 9.61 | $ | 9.37 | |||||
| Composite |
$ | 5.02 | $ | 5.56 | $ | 5.05 | $ | 4.75 | $ | 4.79 | |||||
| Average cost per ton of coal burned |
$ | 79.28 | $ | 69.14 | $ | 60.72 | $ | 58.75 | $ | 53.00 | |||||
4
Table of Contents
Tampa Electric’s generating stations burn fuels as follows: Bayside, with units 3 through 6 entering commercial operation in 2009, burns natural gas; Big Bend Station, which has sulfur dioxide scrubber capabilities, burns a combination of high-sulfur coal, a processed oil by-product known as petroleum coke and CT4 which entered commercial operation in August 2009 burns No. 2 fuel oil and natural gas; Polk Unit 1 burns a blend of low-sulfur coal and petroleum coke, which is gasified and subject to sulfur and particulate matter removal prior to combustion, natural gas and oil; and Phillips Station, which burned residual fuel oil and was placed on long-term standby in September 2009.
Coal. Tampa Electric burned approximately 4.2 million tons of coal and petroleum coke during 2009 and estimates that its combined coal and petroleum coke consumption will be about 4.7 million tons for 2010. During 2009, Tampa Electric purchased approximately 67% of its coal under long-term contracts with four suppliers, and approximately 33% of its coal and petroleum coke in the spot market. Tampa Electric attempts to maintain a portfolio of 60% long-term versus 40% spot contracts, but market conditions, actual deliveries and unit performance can change this portfolio on a year-by-year basis. Tampa Electric expects to obtain approximately 79% of its coal and petroleum coke requirements in 2010 under long-term contracts with four suppliers and the remaining 21% in the spot market.
Tampa Electric’s long-term contracts provide for revisions in the base price to reflect changes in several important cost factors and for suspension or reduction of deliveries if environmental regulations should prevent Tampa Electric from burning the coal supplied, provided that a good faith effort has been made to continue burning such coal.
In 2009, approximately 77% of Tampa Electric’s coal supply was deep-mined, approximately 14% was surface-mined and the remaining was petroleum coke. Federal surface-mining laws and regulations have not had any material adverse impact on Tampa Electric’s coal supply or results of its operations. Tampa Electric cannot predict, however, the effect of any future mining laws and regulations.
Natural Gas. As of Dec. 31, 2009, approximately 48% of Tampa Electric’s 850,000 MMBtu gas storage capacity was full. Tampa Electric has contracted for 60% of the expected gas needs for the April 2010 through September 2010 period, 50% for October 2010 and 20% for November 2010 through March 2011. In early March 2010 Tampa Electric expects to issue a RFP and contract for additional gas to meet its generation requirements for these time periods. Additional volume requirements in excess of projected gas needs are purchased on the short-term spot market.
Oil. Tampa Electric has agreements in place to purchase low sulfur No. 2 oil for its Big Bend and Polk power stations. All of these agreements have prices that are based on spot indices.
Franchises and Other Rights
Tampa Electric holds franchises and other rights that, together with its charter powers, govern the placement of Tampa Electric’s facilities on the public rights-of-way as it carries on its retail business in the localities it serves. The franchises specify the negotiated terms and conditions governing Tampa Electric’s use of public rights-of-way and other public property within the municipalities it serves during the term of the franchise agreement, and are irrevocable and not subject to amendment without the consent of Tampa Electric (except to the extent certain city ordinances relating to permitting and like matters are modified from time to time), although, in certain events, they are subject to forfeiture.
Florida municipalities are prohibited from granting any franchise for a term exceeding 30 years. Temple Terrace reserved the right to purchase Tampa Electric’s property used in the exercise of its franchise if the franchise is not renewed. In the absence of such right to purchase, based on judicial precedent, if the franchise agreement is not renewed Tampa Electric would be able to continue to use public rights-of-way within the municipality, subject to reasonable rules and regulations imposed by the municipalities.
Tampa Electric has franchise agreements with 13 incorporated municipalities within its retail service area. These agreements have various expiration dates through November 2039.
Franchise fees payable by Tampa Electric, which totaled $39.4 million in 2009, are calculated using a formula based primarily on electric revenues and are collected on customers’ bills.
Utility operations in Hillsborough, Pasco, Pinellas and Polk Counties outside of incorporated municipalities are conducted in each case under one or more permits to use state or county rights-of-way granted by the Florida Department of Transportation or the county commissioners of such counties. There is no law limiting the time for which such permits may be granted by counties. There are no fixed expiration dates for the Hillsborough County, Pinellas County and Polk County agreements. The agreement covering electric operations in Pasco County expires in 2023.
5
Table of Contents
Environmental Matters
Among our companies, Tampa Electric has a number of significant stationary sources with air emissions impacted by the Clean Air Act and material Clean Water Act implications. Tampa Electric has undertaken major steps to dramatically reduce its air emissions through a series of actions, including technology selection (e.g., Integrated Gasification Combined-Cycle (IGCC) and conversion of coal-fired units to natural-gas fired combined cycle); implementing a responsible fuel mix taking into account price and reliability effects on its customers; a substantial capital expenditure program to add Best Available Control Technology (BACT) emissions controls; implementation of additional controls to accomplish earlier reductions of certain emissions allowing for lower emission rates when BACT was ultimately installed; and enhanced controls and monitoring systems for certain pollutants. All of these improvements represent an investment in excess of $2 billion since 1994.
These actions have allowed Tampa Electric to maintain a diverse fuel supply, essential to power generation reliability and customer economic vitality; while at the same time, achieve significant air pollutant emission reductions, including carbon dioxide.
Consent Decree
Tampa Electric, through voluntary negotiations with the Environmental Protection Agency (EPA), the U.S. Department of Justice (DOJ) and the FDEP, signed a Consent Decree, which became effective Feb. 29, 2000, and a Consent Final Judgment, which became effective Dec. 6, 1999, as settlement of federal and state litigation. Pursuant to these agreements, allegations of violations of New Source Review requirements of the Clean Air Act were resolved, provision was made for environmental controls and pollution reductions, and Tampa Electric began implementing a comprehensive program to dramatically decrease emissions from its power plants.
The emission reduction requirements included specific detail with respect to the availability of flue gas desulfurization systems (scrubbers) to help reduce SO2, projects for NOx reduction on Big Bend Units 1 through 4, and the repowering of the coal-fired Gannon Power Station to natural gas, which was renamed the H. L. Culbreath Bayside Power Station (Bayside Power Station), in 2003 and 2004. Upon completion of the conversion, the station capacity was about 1,800 megawatts (nominal) of natural gas-fueled, combined-cycle electric generation. The repowering has reduced the facility’s NOx and SO 2 emissions by approximately 99% and particulate matter (PM) emissions by approximately 92% from 1998 levels.
In 2004, Tampa Electric made its NOx reduction technology selection and decided to install SCR systems for NO x control on the coal-fired Big Bend units. The first three units at Big Bend Power Station were reported in service in May 2007, June 2008 and May 2009, respectively. The remaining unit, Big Bend Unit 1, is expected to be in service in May 2010. Tampa Electric’s capital investment forecast includes amounts in 2010 for completion of the final NOx control project (see the Capital Expenditures section).
The FPSC has determined that it is appropriate for Tampa Electric to recover the operating costs of and earn a return on the investment in the SCRs to be installed on all four of the units at the Big Bend Power Station and pre-SCR projects on Big Bend Units 1–3 (which are early plant improvements to reduce NOx emissions prior to installing the SCRs) through the ECRC (see the Regulation section). Cost recovery for the SCRs began in each of the years that the units entered service, Big Bend Unit 4 in 2007, Big Bend Unit 3 in 2008 and Big Bend Unit 2 in 2009. In November 2009, the FPSC approved cost recovery for the capital investment on the Big Bend Unit 1 SCR to start in 2010.
In November 2007, Tampa Electric entered into an agreement with the EPA and DOJ for a Second Amendment to the Consent Decree. The Second Amendment: 1) establishes a 0.12 lb/MMBtu NOx limit on a 30-day rolling average for Big Bend Units 1 through 3, which is lower than the original Consent Decree that had a provision for a limit as high as 0.15 lb/MMBtu depending on certain conditions; 2) allows for the sale of NOx allowances gained as a result of surpassing the emission limit goals of the Consent Decree; and 3) calls for Tampa Electric to install a second PM Continuous Emissions Monitoring System and potentially replace the originally installed system if the new system is successful.
Emission Reductions
Projects committed to under the Consent Decree and Consent Final Judgment have resulted in significant reductions in emissions. Since 1998, Tampa Electric has reduced annual SO2, NOx and PM emissions from its facilities by 154,000 tons, 57,000 tons, and 4,000 tons, respectively.
Reductions in SO2 emissions were accomplished through the installation of scrubber systems on Big Bend Units 1 and 2 in 1999. Big Bend Unit 4 was originally constructed with a scrubber. The Big Bend Unit 4 scrubber system was modified in 1994 to allow it to scrub emissions from Big Bend Unit 3 as well. Currently the scrubbers at Big Bend Power Station remove more than 95% of the SO2 emissions from the flue gas streams.
6
Table of Contents
The repowering of the Gannon Station to the Bayside Power Station has resulted in a significant reduction in emissions of all pollutant types. We expect that Tampa Electric’s actions to install NOx emissions controls on all Big Bend units will result in the further reduction of emissions and that by the expected completion of the final unit in 2010, the SCR projects will result in a total phased reduction of NOx by 62,000 tons per year from 1998 levels.
In total, we expect that Tampa Electric’s emission reduction initiatives will result in the annual reduction of SO2, NOx and PM emissions by 88%, 90% and 71%, respectively, below 1998 levels by 2010. With these state-of-the-art improvements in place, Tampa Electric’s activities have helped to significantly enhance the quality of the air in the community. As a result of already completed emission reduction actions, Tampa Electric has achieved the emission reduction levels called for in Phase I of the Clean Air Interstate Rule (CAIR). In July 2008, the U.S. Court of Appeals for the District of Columbia Circuit vacated CAIR on emissions of SO2 and NOx. The federal appeals court reinstated CAIR in December 2008 as an interim solution. The EPA is continuing to work on a replacement rule that is expected to be proposed in 2010 and finalized in 2011. Until a new rule is proposed CAIR will remain intact.
A pollution control benefit from the environmental initiatives taken by Tampa Electric is the significant reduction of mercury emissions. At Bayside Power Station, mercury emissions have decreased by 99% from 1998 levels, essentially resulting in zero mercury emissions. Additional mercury reductions come from the installation of NOx controls at Big Bend Power Station, which are expected to lead to a reduction of mercury emissions of more than 75% from 1998 levels by 2010. The Clean Air Mercury Rule (CAMR) Phase I requirements were scheduled for implementation in 2010. CAMR was vacated by the U.S. Court of Appeals for the District of Columbia Circuit on Feb. 8, 2008. Prior to the court’s decision Tampa Electric expected that it would have been in compliance with CAMR Phase I without additional capital investment. The EPA is expected to propose new or modified rules to address mercury and other hazardous air pollutants by late 2011.
In 2007 the EPA modified the 24-hour coarse and fine PM ambient air standards. Based on the reduced emissions of PM, sulfates and nitrates resulting from projects associated with compliance with the Consent Decree, as well as local ambient air quality data, the Tampa Electric service area is expected to be in compliance with the proposed new PM standards without additional expenditures by Tampa Electric. (See the Environmental Compliance section of MD&A.)
On Sep. 16, 2009, the EPA announced it would reconsider its 2008 decision setting national standards for ground-level ozone. The EPA is reconsidering the standards to ensure they are grounded in science, protect public health with an adequate margin of safety, and are sufficient to protect the environment. Much of Tampa Electric’s service territory is not expected to meet the current ground-level ozone standards and will most likely be deemed non-attainment.
Superfund and Former Manufactured Gas Plant Sites
Tampa Electric Company, through its Tampa Electric and PGS divisions, is a potentially responsible party (PRP) for certain superfund sites and, through its PGS division, for certain former manufactured gas plant sites. While the joint and several liability associated with these sites presents the potential for significant response costs, as of Dec. 31, 2009, Tampa Electric Company has estimated its ultimate financial liability to be approximately $19.9 million (primarily related to PGS), and this amount has been reflected in the company’s financial statements. This amount is higher than prior estimates to reflect a 2009 study for the costs of remediation primarily related to one site. The environmental remediation costs associated with these sites, which are expected to be paid over many years, are not expected to have a significant impact on customer prices. The amounts represent only the estimated portion of the cleanup costs attributable to Tampa Electric Company. The estimates to perform the work are based on actual estimates obtained from contractors or Tampa Electric Company’s experience with similar work, adjusted for site specific conditions and agreements with the respective governmental agencies. The estimates are made in current dollars, are not discounted and do not assume any insurance recoveries.
Allocation of the responsibility for remediation costs among Tampa Electric Company and other PRPs is based on each party’s relative ownership interest in or usage of a site. Accordingly, Tampa Electric Company’s share of remediation costs varies with each site. In virtually all instances where other PRPs are involved, those PRPs are considered credit worthy.
Factors that could impact these estimates include the ability of other PRPs to pay their pro rata portion of the cleanup costs, additional testing and investigation which could expand the scope of the cleanup activities, additional liability that might arise from the cleanup activities themselves or changes in laws or regulations that could require additional remediation. Under current regulation, these additional costs would be eligible for recovery through customer rates.
Capital Expenditures
Tampa Electric’s 2009 capital expenditures included $53 million for the installation of SCR equipment at the coal-fired Big Bend Power Station, and $4 million for other environmental compliance projects.
PEOPLES GAS SYSTEM—Gas Operations
PGS operates as the Peoples Gas System division of Tampa Electric Company. PGS is engaged in the purchase, distribution and sale of natural gas for residential, commercial, industrial and electric power generation customers in the State of Florida.
7
Table of Contents
Gas is delivered to the PGS system through three interstate pipelines. PGS does not engage in the exploration for or production of natural gas. PGS operates a natural gas distribution system that serves more than 334,000 customers. The system includes approximately 11,000 miles of mains and 6,500 miles of service lines. (See PGS’ Franchises section below.)
In 2009, the total throughput for PGS was 1.4 billion therms. Of this total throughput, 9% was gas purchased and resold to retail customers by PGS, 72% was third-party supplied gas that was delivered for retail transportation-only customers, and 19% was gas sold off-system. Industrial and power generation customers consumed approximately 50% of PGS’ annual therm volume, commercial customers used approximately 26%, and the balance was consumed by residential customers.
While the residential market represents only a small percentage of total therm volume, residential operations comprised almost 31% of total revenues.
Natural gas has historically been used in many traditional industrial and commercial operations throughout Florida, including production of products such as steel, glass, ceramic tile and food products. Within the PGS operating territory, large cogeneration facilities utilize gas-fired technology in the production of electric power and steam.
Revenues and therms for PGS for the years ended Dec. 31, are as follows:
| (millions) |
2009 | Revenues 2008 |
2007 | 2009 | Therms 2008 |
2007 | |||||||||
| Residential |
$ | 143.4 | $ | 150.5 | $ | 140.2 | 73.5 | 74.4 | 70.1 | ||||||
| Commercial |
142.2 | 155.6 | 158.4 | 381.7 | 375.9 | 370.9 | |||||||||
| Industrial |
125.8 | 325.7 | 242.4 | 448.7 | 513.3 | 490.2 | |||||||||
| Power generation |
10.0 | 12.7 | 14.6 | 538.3 | 455.6 | 471.7 | |||||||||
| Other revenues |
40.6 | 36.5 | 37.4 | — | — | — | |||||||||
| Total |
$ | 462.0 | $ | 681.0 | $ | 593.0 | 1,442.2 | 1,419.2 | 1,402.9 | ||||||
PGS had 520 employees as of Dec. 31, 2009. A total of 79 employees in six of PGS’ 14 operating divisions are represented by various union organizations.
Regulation
The operations of PGS are regulated by the FPSC separately from the regulation of Tampa Electric. The FPSC has jurisdiction over rates, service, issuance of securities, safety, accounting and depreciation practices and other matters. In general, the FPSC sets rates at a level that allows a utility such as PGS to collect total revenues (revenue requirements) equal to its cost of providing service, plus a reasonable return on invested capital.
The basic costs of providing natural gas service, other than the costs of purchased gas and interstate pipeline capacity, are recovered through base rates. Base rates are designed to recover the costs of owning, operating and maintaining the utility system. The rate of return on rate base, which is intended to approximate PGS’ weighted cost of capital, primarily includes its cost for debt, deferred income taxes at a zero cost rate, and an allowed return on common equity. Base rates are determined in FPSC proceedings which occur at irregular intervals at the initiative of PGS, the FPSC or other parties. For a description of recent proceeding activity, see the Regulation—PGS Rates section of MD&A.
On May 5, 2009, the FPSC approved a base rate increase of $19.2 million that became effective on Jun. 18, 2009, and reflects a return on equity of 10.75%, which is the middle of a range between 9.75% and 11.75%. The allowed equity in capital structure is 54.7% from all investor sources of capital on an allowed rate base of $560.8 million.
PGS recovers the costs it pays for gas supply and interstate transportation for system supply through the purchased gas adjustment (PGA) clause. This charge is designed to recover the costs incurred by PGS for purchased gas, and for holding and using interstate pipeline capacity for the transportation of gas it delivers to its customers. These charges may be adjusted monthly based on a cap approved annually in an FPSC hearing. The cap is based on estimated costs of purchased gas and pipeline capacity, and estimated customer usage for a specific recovery period, with a true-up adjustment to reflect the variance of actual costs and usage from the projected charges for prior periods. In November 2009, the FPSC approved rates under PGS’ PGA for the period January 2010 through December 2010 for the recovery of the costs of natural gas purchased for its distribution customers.
In addition to its base rates and purchased gas adjustment clause charges, PGS customers (except interruptible customers) also pay a per-therm conservation charge for all gas. This charge is intended to permit PGS to recover its costs incurred in developing and implementing energy conservation programs, which are mandated by Florida law and approved and supervised by the FPSC. PGS is permitted to recover, on a dollar-for-dollar basis, prudently incurred expenditures made in connection with these programs if it demonstrates that the programs are cost effective for its ratepayers. The FPSC requires natural gas utilities to offer transportation-only service to all non-residential customers.
8
Table of Contents
In addition to economic regulation, PGS is subject to the FPSC’s safety jurisdiction, pursuant to which the FPSC regulates the construction, operation and maintenance of PGS’ distribution system. In general, the FPSC has implemented this by adopting the Minimum Federal Safety Standards and reporting requirements for pipeline facilities and transportation of gas prescribed by the U.S. Department of Transportation in Parts 191, 192 and 199, Title 49, Code of Federal Regulations.
PGS is also subject to federal, state and local environmental laws and regulations pertaining to air and water quality, land use, noise and aesthetics, solid waste and other environmental matters.
Competition
Although PGS is not in direct competition with any other regulated distributors of natural gas for customers within its service areas, there are other forms of competition. At the present time, the principal form of competition for residential and small commercial customers is from companies providing other sources of energy, including electricity, propane and fuel oil. PGS has taken actions to retain and expand its commodity and transportation business, including managing costs and providing high quality service to customers.
In Florida, gas service is unbundled for all non-residential customers. PGS has a “NaturalChoice” program, offering unbundled transportation service to all eligible customers and allowing non-residential customers to purchase commodity gas from a third party but continue to pay PGS for the transportation. As a result, PGS receives its base rate for distribution regardless of whether a customer decides to opt for transportation-only service or continue bundled service. PGS had approximately 15,250 transportation-only customers as of Dec. 31, 2009 out of approximately 31,400 eligible customers.
Competition is most prevalent in the large commercial and industrial markets. In recent years, these classes of customers have been targeted by companies seeking to sell gas directly by transporting gas through other facilities and thereby bypassing PGS facilities. In response to this competition, PGS has developed various programs, including the provision of transportation-only services at discounted rates.
Gas Supplies
PGS purchases gas from various suppliers depending on the needs of its customers. The gas is delivered to the PGS distribution system through three interstate pipelines on which PGS has reserved firm transportation capacity for delivery by PGS to its customers.
Gas is delivered by Florida Gas Transmission Company (FGT) through 59 interconnections (gate stations) serving PGS’ operating divisions. In addition, PGS’ Jacksonville Division receives gas delivered by the South Georgia Natural Gas Company pipeline through two gate stations located northwest of Jacksonville. Gulfstream Natural Gas Pipeline provides delivery through seven gate stations.
Companies with firm pipeline capacity receive priority in scheduling deliveries during times when the pipeline is operating at its maximum capacity. PGS presently holds sufficient firm capacity to permit it to meet the gas requirements of its system commodity customers, except during localized emergencies affecting the PGS distribution system and on abnormally cold days.
Firm transportation rights on an interstate pipeline represent a right to use the amount of the capacity reserved for transportation of gas on any given day. PGS pays reservation charges on the full amount of the reserved capacity whether or not it actually uses such capacity on any given day. When the capacity is actually used, PGS pays a volumetrically-based usage charge for the amount of the capacity actually used. The levels of the reservation and usage charges are regulated by FERC. PGS actively markets any excess capacity available on a day-to-day basis to partially offset costs recovered through the PGA clause.
PGS procures natural gas supplies using base-load and swing-supply contracts with various suppliers along with spot market purchases. Pricing generally takes the form of either a variable price based on published indices or a fixed price for the contract term.
Neither PGS nor any of the interconnected interstate pipelines have storage facilities in Florida. PGS occasionally faces situations when the demands of all of its customers for the delivery of gas cannot be met. In these instances, it is necessary that PGS interrupt or curtail deliveries to its interruptible customers. In general, the largest of PGS’ industrial customers are in the categories that are first curtailed in such situations. PGS’ tariff and transportation agreements with these customers give PGS the right to divert these customers’ gas to other higher priority users during the period of curtailment or interruption. PGS pays these customers for such gas at the price they paid their suppliers, or at a published index price, and in either case pays the customer for charges incurred for interstate pipeline transportation to the PGS system.
9
Table of Contents
Franchises
PGS holds franchise and other rights with approximately 100 municipalities throughout Florida. These franchises give PGS a right to occupy municipal rights-of-way within the franchise area. The franchises are irrevocable and are not subject to amendment without the consent of PGS, although in certain events, they are subject to forfeiture.
Municipalities are prohibited from granting any franchise for a term exceeding 30 years. Several franchises contain purchase options with respect to the purchase of PGS’ property located in the franchise area, if the franchise is not renewed; otherwise, based on judicial precedent, PGS is able to keep its facilities in place subject to reasonable rules and regulations imposed by the municipalities.
PGS’ franchise agreements with the incorporated municipalities within its service area have various expiration dates ranging from the present through 2038. PGS expects to negotiate 14 franchises in 2010, the majority of which will be renewals of existing agreements. Franchise fees payable by PGS, which totaled $9.5 million in 2009, are calculated using various formulas which are based principally on natural gas revenues. Franchise fees are collected from only those customers within each franchise area.
Utility operations in areas outside of incorporated municipalities are conducted in each case under one or more permits to use state or county rights-of-way granted by the Florida Department of Transportation or the county commissioners of such counties. There is no law limiting the time for which such permits may be granted by counties. There are no fixed expiration dates and these rights are, therefore, considered perpetual.
Environmental Matters
PGS’ operations are subject to federal, state and local statutes, rules and regulations relating to the discharge of materials into the environment and the protection of the environment generally that require monitoring, permitting and ongoing expenditures.
Tampa Electric Company is one of several potentially responsible parties for certain superfund sites and, through PGS, for former manufactured gas plant sites. See the previous discussion in the Environmental Matters section of Tampa Electric—Electric Operations.
Capital Expenditures
During the year ended Dec. 31, 2009, PGS did not incur any material capital expenditures to meet environmental requirements, nor are any anticipated for 2010 through 2014.
TECO COAL
Overview
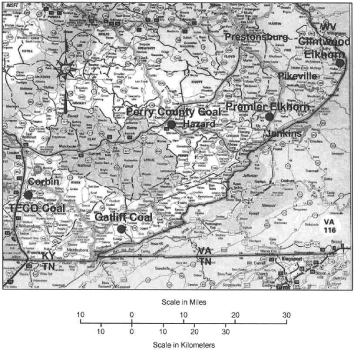
TECO Coal, with offices located in Corbin, Kentucky, through its subsidiaries operates surface and underground mines as well as coal processing facilities in eastern Kentucky, Tennessee and southwestern Virginia.
TECO Coal owns no operating assets but holds all of the common stock of Gatliff Coal Company, Rich Mountain Coal Company, Clintwood Elkhorn Mining Company, Pike Letcher Land Company, Premier Elkhorn Coal Company, Perry County Coal Corporation, Bear Branch Coal Company, and all of the membership interests in TECO Synfuel Administration, LLC and TECO Synfuel Operations, LLC. The TECO Coal subsidiaries own or control, by lease, mineral rights, and own or operate surface and underground mines and coal processing and loading facilities. TECO Coal produces, processes and sells bituminous, predominately low sulfur coal of steam, industrial and metallurgical grades. TECO Coal uses two distinct extraction techniques: continuous underground mining and dozer and front-end loader surface mining.
TECO Coal subsidiaries currently operate 27 underground mines, which employ the room and pillar mining method, and 13 surface mines. In 2009, TECO Coal subsidiaries sold 8.75 million tons of coal. None of this coal was sold to Tampa Electric. For the reporting period, the TECO Coal operating companies had a combined estimated 262.2 million tons of proven and probable recoverable reserves.
History
In 1967, Cal-Glo Coal Company was formed. It mined a product containing low sulfur, low ash fusion characteristic and high energy content. Realizing the potential for this product to meet its combustion, quality and environmental requirements, Tampa Electric Company purchased Cal-Glo Coal Company in 1974. In 1982, after several years of continued growth and success, TECO
10
Table of Contents
Coal Corporation was formed and Cal-Glo Coal Company was renamed Gatliff Coal Company. Rich Mountain Coal Company was established in 1987, when leases were signed for properties in Campbell County, Tennessee.
1988 saw a marketing change in which Gatliff Coal Company began selling ferro-silicon and silicon grade products. In addition, in that year properties were also acquired in Pike County, Kentucky and Clintwood Elkhorn Mining Company was formed. Premier Elkhorn Coal Company and Pike Letcher Land Company were formed in 1991, when additional property was acquired in Pike and Letcher Counties, Kentucky.
In 1997, Bear Branch Coal Company secured key leases for property located in Perry County and Knott County, Kentucky.
The newest mining company in the TECO Coal family is Perry County Coal Corporation, which was purchased in 2000 and is located in Perry, Knott and Leslie Counties, Kentucky.
TECO Synfuel Holdings, LLC and TECO Synfuel Administration, LLC were formed in 2003 to administer the production and sale of synfuel product at various TECO Coal subsidiaries. Synfuel operations were terminated at the end of 2007 when the tax credit associated with production of non-conventional fuels expired by statute.
In 2004, the acquisition of properties and the Millard Preparation Facilities (currently idle) from American Electric Power and Kentucky Coal, LLC was completed. The property and facility are located in Pike County, Kentucky.
Mining Operations
TECO Coal currently has three mining complexes, all operating in Kentucky with a portion of Clintwood Elkhorn Mining Company operating in Virginia as well. A mining complex is defined as all mines that supply a single wash plant, except in the case of Clintwood Elkhorn Mining Company, which provides production for two active wash plants. Clintwood Elkhorn’s Millard Plant is currently idle. These complexes blend, process and ship coal that is produced from one or more mines, with a single complex handling the coal production of as many as 15 individual underground or surface mines. TECO Coal uses two distinct extraction techniques: continuous underground mining; and dozer and front-end loader surface mining sometimes accompanied by highwall mining.
The complexes have been developed at strategic locations in close proximity to the TECO Coal preparation plants and rail shipping facilities. Coal is transported from TECO Coal’s mining complexes to customers by means of railroad cars, trucks, barges or vessels, with rail shipments representing approximately 93.2% of 2009 coal shipments. The map below shows the locations of the three mining complexes and TECO Coal’s offices in Corbin, Kentucky.
11
Table of Contents
Facilities
Coal mined by the operating companies of TECO Coal is processed and shipped from facilities located at each of the operating companies, with Clintwood Elkhorn Mining Company having three facilities. The Clintwood facilities are located at Biggs, Kentucky, Hurley, Virginia and the Millard facility, which is presently idle, located at Millard, Kentucky. The equipment at each facility is in good condition and regularly maintained by qualified personnel. Table 1 below is a summary of the TECO Coal processing facilities:
PROCESSING FACILITIES SUMMARY
Table 1
| COMPANY |
FACILITY |
LOCATION |
RAILROAD SERVICE |
UTILITY SERVICE | ||||
| Gatliff Coal |
Ada Tipple | Himyar, KY | CSXT Railroad | RECC | ||||
| Clintwood Elkhorn |
Clintwood #2 Plant | Biggs, KY | Norfolk Southern | American Electric Power | ||||
| Clintwood Elkhorn |
Clintwood #3 Plant | Hurley, VA | Norfolk Southern | American Electric Power | ||||
| Clintwood Elkhorn |
Millard Plant | Millard, KY | CSXT Railroad | American Electric Power | ||||
| Premier Elkhorn |
Burk Branch Plant | Myra, KY | CSXT Railroad | American Electric Power | ||||
| Perry County Coal |
Perry County Plant | Hazard, KY | CSXT Railroad | American Electric Power |
Significant Projects
Significant projects for 2009 included the following:
Perry County Coal
| • | Added a fourth active mining section to mine E4-2 underground mine. |
| • | Continued site development and began construction on the Second Creek Portals for mine E4-1 and mine E3-1 underground mines. |
Premier Elkhorn Coal
| • | Two company underground mines were closed due to depletion of reserves and market economics. |
| • | Started a new underground mine and began mining with highwall miner on a surface mine. |
Clintwood Elkhorn Mining
| • | Two surface mines were closed due to market economics and a highwall miner was moved to an active surface mine. |
| • | Started two new underground mines and expect to open three additional underground mines early in 2010. |
Mining Complexes
Table 2 below shows annual production for each mining complex for each of the last three years.
MINING COMPLEXES
Table 2
| Mine Type |
Mining Equipment |
Transportation | Tons Produced (in millions) |
Tons Sold (in millions) |
Year Established or Acquired | |||||||||||||
| Location |
2009 | 2008 | 2007 | 2009 | ||||||||||||||
| Gatliff Coal Company |
Bell County, KY/Knox County, KY/Campbell County, TN |
S | D/L | T | 0.16 | 0.31 | 0.26 | 0.14 | 1974 | |||||||||
| Clintwood Elkhorn Mining |
Pike County, KY/ Buchanan County, VA |
U, S | CM, D/L, HM, A |
R, R/V | 2.02 | 2.60 | 2.66 | 2.12 | 1988 | |||||||||
| Premier Elkhorn Coal |
Pike County, KY/ Letcher County, KY/ Floyd County, KY |
U, S | CM, D/L | R,T,R/ B,T/B |
3.22 | 3.19 | 3.15 | 3.40 | 1991 | |||||||||
| Perry County Coal |
Perry County, KY/ Leslie County, KY/ Knott County, KY |
U, S | CM, D/L, HM |
R,T,R/ B,T/B |
3.09 | 3.09 | 3.05 | 3.09 | 2000 | |||||||||
| TOTAL |
8.49 | 9.19 | 9.12 | 8.75 | ||||||||||||||
12
Table of Contents
S—Surface
U—Underground
CM—Continuous Miner
D/L—Dozers and Front-End Loaders
HM—Highwall Miner
A—Auger
R—Rail
R/B—Rail to Barge
R/V—Rail to Ocean Vessel
T—Truck
T/B—Truck to Barge
Gatliff Coal Company
Gatliff Coal Company discontinued surface mine operations in the late autumn of 2009. Poor market conditions and a depletion of the low sulfur content coal that was previously required on its sales contract led to this cessation of mining operations. Gatliff Coal Company produced 0.16 million tons of coal in 2009, leaving a reserve base of 3.4 million recoverable tons of predominantly low sulfur underground mineable coal which may later be recovered by Gatliff or by neighboring competing coal companies for coal royalty considerations. Rich Mountain Coal Company formerly operated as a contractor for Gatliff Coal Company’s Tennessee production, which is currently in non-producing reclamation status.
Clintwood Elkhorn Mining Company
Clintwood Elkhorn Mining Company has three facilities. One is located near Biggs, Kentucky in Pike County and is supplied by 14 underground mines and two surface mines. Principal products at the Biggs, Kentucky location include high volatile metallurgical coals and steam coal. The second Clintwood Elkhorn Mining Company facility is located near Hurley, Virginia and is supplied by two underground mines and two surface mines. The Hurley, Virginia operation facility also supplies high-volatile metallurgical coal as well as steam coal products. Products from both locations are shipped domestically to customers in North America via Norfolk Southern Corporation and vessels via the Great Lakes. International customers receive their products via ocean vessels from Lamberts Point, Virginia. The third facility, located at Millard, Kentucky in Pike County is currently idle. In total, Clintwood Elkhorn Mining Company produced 2.02 million tons of coal in 2009, leaving a reserve base of 50.0 million recoverable tons.
Premier Elkhorn Coal Company
Located near Myra, in Pike County, Kentucky, Premier Elkhorn Coal Company is supplied by production from eight underground mines and eight surface mines. Principal products include high-quality steam coal for utilities, specialty stoker products for ferro-silicon and industrial customers, PCI and metallurgical coal for the steel mills. Facilities include a unit train load-out with a 200 car siding capable of loading at 6,000 tons per hour as well as a single car siding. Products from this location are shipped via CSXT Railroad and trucking contractors to destinations in North America and internationally. All production is performed by Premier Elkhorn Coal Company even though Pike Letcher Land Company controls by fee and lease all of the recoverable reserves. Premier Elkhorn Coal Company produced 3.22 million tons of coal in 2009 leaving a reserve base of 72.8 million recoverable tons.
Perry County Coal Corporation
Located near Hazard, Kentucky in Perry County, Perry County Coal Corporation is supplied by three underground mines and one surface mine. Principal products include high quality steam coal for utilities, industrial stoker and PCI products. Facilities include an upgraded 1,350 ton per hour preparation plant and two unit train load-outs, each capable of loading at 5,000 tons per hour. Products from this location are shipped via CSXT Railroad and trucking contractors to destinations in both North America and internationally. In 2009, Perry County Coal completed a comparable trade of underground reserves with another mining company of 16.0 million tons. During 2010 this boundary of reserves will continue to be core drilled to confirm final reserve quantities and qualities and to finalize a comprehensive mining plan. Perry County Coal Corporation produced 3.09 million tons of coal in 2009. A baseline review of reserves for Perry County Coal Corporation proved an additional 4.2 million tons of reserves which were previously unreported leaving a reserve base of 136.0 million recoverable tons.
Sales and Marketing
The TECO Coal marketing and sales force includes sales managers, distribution/transportation managers and administrative personnel. Primary customers are utility, steel and industrial companies. TECO Coal subsidiaries sell coal under long-term agreements, which are generally classified as greater than 12 months, and on a spot basis, which is generally classified 12 months or less.
The terms of these coal sales contracts result from bidding and extensive negotiations with customers. Consequently, these contracts typically vary significantly in price, quantity, quality, length, and may contain terms and conditions that allow for periodic price reviews, price adjustment mechanisms, recovery of governmental impositions as well as provisions for force majeure, suspension, termination, treatment of environmental legislation and assignment.
13
Table of Contents
Distribution
TECO Coal subsidiaries transport coal from their mining complexes to customers by rail, barge, vessel and trucks. They employ transportation specialists who coordinate the development of acceptable shipping schedules with its customers, transportation providers and mining facilities.
Competition
Primary competitors of TECO Coal’s subsidiaries are other coal suppliers, many of which are located in Central Appalachia. Even though consolidation and bankruptcy have decreased the number of coal suppliers, the industry is still intensely competitive. To date, the TECO Coal subsidiaries have been able to compete for coal sales by mining high quality steam and specialty coals, including coals used for making coke and furnace injection, and by effectively managing production and processing costs.
Employees
As of Dec. 31, 2009, TECO Coal and its subsidiaries employed a total of 1,089 employees.
Regulations
Mine Safety and Health
The operations of underground mines, including all related surface facilities, are subject to the Federal Coal Mine Safety and Health Act of 1969, the 1977 Amendment and the new Miner Act of 2006. TECO Coal’s subsidiaries are also subject to various Kentucky, Tennessee and Virginia mining laws which require approval of roof control, ventilation, dust control and other facets of the coal mining business. Federal and state inspectors inspect the mines to ensure compliance with these laws. TECO Coal believes it is in substantial compliance with the standards of the various enforcement agencies. It is unaware of any mining laws or regulations that would materially affect the market price of coal sold by its subsidiaries, although mining accidents within the industry could lead to new legislation that could impose additional costs on TECO Coal.
Black Lung Legislation
Under the Black Lung Benefits Revenue Act of 1977 and the Black Lung Benefits Reform Act of 1977, as amended in 1981, each coal mine operator must make payment of federal black lung benefits to claimants who are current and former employees, certain survivors of a miner who dies from black lung disease, and to a trust fund for the payment of benefits and medical expenses to claimants who last worked in the coal industry prior to Jul. 1, 1973. Historically, a small percentage of the miners currently seeking federal black lung benefits are awarded these benefits by the federal government. The trust fund is funded by an excise tax on coal production of up to $1.10 per ton for deep-mined coal and up to $0.55 per ton for surface-mined coal, neither amount to exceed 4.4% of the gross sales price.
In 2000, the Department of Labor issued amendments to the regulations implementing the federal black lung laws that, among other things, established a presumption in favor of a claimant’s treating physician, limited a coal operator’s ability to introduce medical evidence, and redefined Coal Workers Pneumoconiosis to include chronic obstructive pulmonary disease. These changes in the regulations increased the percentage of claims approved and the overall cost of black lung to coal operators. TECO Coal, with the help of its consulting actuaries, continues to monitor claims very closely.
Workers’ Compensation
The TECO Coal subsidiaries are liable for workers’ compensation benefits for traumatic injury and occupational exposure claims under state workers’ compensation laws. Workers’ compensation laws are administered by state agencies with each state having its own set of rules and regulations regarding compensation that is owed to an employee that is injured in the course of employment.
Environmental Laws
Surface Mining Control and Reclamation Act
Coal mining operations are subject to the Surface Mining Control and Reclamation Act of 1977 which places a charge of $0.15 and $0.35 on every net ton of underground and surface coal mined, respectively, to create a reserve for reclaiming land and water adversely affected by past coal mining. Other provisions establish standards for the control of environmental effects and reclamation of surface coal mining and the surface effects of underground coal mining and requirements for federal and state inspections.
14
Table of Contents
Clean Air Act/Clean Water Act
While conducting their mining operations, TECO Coal’s subsidiaries are subject to various federal, state and local air and water pollution standards. In 2009, TECO Coal spent approximately $3.7 million on environmental protection and reclamation programs. TECO Coal expects to spend a similar amount in 2010 on these programs.
CERCLA (Superfund)
The Comprehensive Environmental Response, Compensation, and Liability Act (CERCLA) commonly known as Superfund affects coal mining and hard rock operations by creating liability for investigation and remediation in response to releases of hazardous substances into the environment and for damages to natural resources. Under Superfund, joint and several liabilities may be imposed on waste generators, site owners or operators and others regardless of fault.
Under EPA’s Toxic Release Inventory process, companies are required to report annually listed toxic materials that exceed defined quantities.
Glossary of Selected Mining Terms
Assigned reserves. Coal which has been committed by the coal company to operating mine shafts, mining equipment, and plant facilities, and all coal which has been leased by the company to others.
Bituminous coal. The most common type of coal with moisture content less than 20% by weight and heating value of 10,500 to 14,000 Btu per pound. It is dense and black and often has well-defined bands of bright and dull material.
Btu. (British Thermal Unit). A measure of the energy required to raise the temperature of one pound of water one degree Fahrenheit.
Central Appalachia. Coal producing states and regions of eastern Kentucky, eastern Tennessee, western Virginia and southern West Virginia.
Coal seam. Coal deposits occur in layers. Each layer is called a “seam.”
Coal washing. The process of removing impurities, such as ash and sulfur based compounds, from coal.
Compliance coal. Coal which, when burned, emits 1.2 pounds or less of sulfur dioxide per million Btu, which is equivalent to .72% sulfur per pound of 12,000 Btu coal. Compliance coal requires no mixing with other coals or use of sulfur dioxide reduction technologies by generators of electricity to comply with the requirements of the federal Clean Air Act.
Continuous miner. A machine used in underground mining to cut coal from the seam and load it onto conveyors or into shuttle cars in a continuous operation.
Continuous mining. One of two major underground mining methods now used in the United States. This process utilizes a continuous miner. The continuous miner removes or “cuts” the coal from the seam. The loosened coal then falls on a conveyor for removal to a shuttle car or larger conveyor belt system.
Deep mine. An underground coal mine.
Dozer and front-end loader mining. An open-cast method of mining that uses large dozers together with trucks and loaders to remove overburden, which is used to backfill pits after coal removal.
Ferro-silicon. An alloy of iron and silicon used in the production of carbon steel.
Force majeure. An event that may prevent the company from conducting its mining operations as a result of in whole or in part by: Acts of God, wars, riots, fires, explosions, breakdowns or accidents; strikes, lockouts or other labor difficulties; lack or shortages of labor, materials, utilities, energy sources, compliance with governmental rules, regulations or other governmental requirements; any other like causes.
High vol met coal. Coal that averages approximately 35% volatile matter. Volatile matter refers to a constituent that becomes gaseous when heated to certain temperatures.
Highwall miner. An auger-like apparatus that drives parallel rectangular entries to 1,000 feet into the coal seam.
15
Table of Contents
Industrial coal. Coal used by industrial steam boilers to produce electricity or process steam. It generally is lower in Btu heat content and higher in volatile matter than metallurgical coal.
Long-term contracts. Contracts with terms of one year or longer.
Low ash fusion. Coal that when burned typically produces ash that has a melting point below 2,450 degrees Fahrenheit.
Low sulfur coal. Coal which, when burned, emits 1.6 pounds or less of sulfur dioxide per million Btus.
Metallurgical coal. The various grades of coal suitable for carbonization to make coke for steel manufacture. Also known as “met” coal, it possesses four important qualities: volatility, which affects coke yield; the level of impurities, which affects coke quality; composition, which affects coke strength; and basic characteristics, which affect coke oven safety. Met coal has a particularly high Btu, but low ash content.
Overburden. Layers of earth and rock covering a coal seam. In surface mining operations, overburden is removed prior to coal extraction.
Overburden ratio. The amount of overburden commonly stated in cubic yards that must be removed to excavate one ton of coal.
Pillar. An area of coal left to support the overlying strata in a mine; sometimes left permanently to support surface structures.
Pneumoconiosis. A lung disease caused by long-continued inhalation of mineral or metallic dust.
Preparation plant. Usually located on a mine site, although one plant may serve several mines. A preparation plant is a facility for crushing, sizing and washing coal to prepare it for use by a particular customer. The washing process has the added benefit of removing some of the coal’s sulfur content.
Probable (Indicated) reserves. Reserves for which quantity and grade and/or quality are computed from information similar to that used for proven reserves, but the sites for inspection, sampling and measurement are farther apart; therefore, the degree of assurance, although lower than that for proven reserves, is high enough to assume continuity between points of observation.
Proven (Measured) reserves. Reserves for which (a) quantity is computed from dimensions revealed in outcrops, trenches, workings or drill holes; grade and/or quality are computed from the results of detailed sampling and (b) the sites for inspection, sampling and measurement are spaced so closely and the geologic character is so well defined that size, shape, depth and mineral content of reserves are well established.
Pulverized coal injection (PCI). A system whereby coal is pulverized and injected into blast furnaces in the production of steel and/or steel products.
Reclamation. The process of restoring land and the environment to their approximate original state following mining activities. The process commonly includes “recontouring” or reshaping the land to its approximate original appearance, restoring topsoil and planting native grass and ground covers. Reclamation operations are usually underway before the mining of a particular site is completed. Reclamation is closely regulated by both state and federal law.
Recoverable reserves. The amount of proven and probable reserves that can actually be recovered from the reserve base taking into account all mining and preparation losses involved in producing a saleable product using existing methods and under current law.
Reserves. That part of a mineral deposit which could be economically and legally extracted or produced at the time of the reserve determination.
Resource (Non-reserve coal deposit). A coal-bearing body that does not qualify as a commercially viable coal reserve. Resources may be classified as such by either limited property control, geologic limitations, insufficient exploration or other limitations. In the future, it is possible that portions of the resource could be re-classified as reserve if those limitations are removed or mitigated by: improving market conditions, additional property control, favorable results of exploration, advances in technology, etc.
Roof. The stratum of rock or other mineral above a coal seam; the overhead surface of a coal working place. Same as “top.”
Room and pillar mining. In the underground room and pillar method of mining, continuous mining machines cut three to nine entries into the coal bed and connect them by driving crosscuts, leaving a series of rectangular pillars, or columns of coal to help support the mine roof and control the flow of air. As mining advances, a grid-like pattern of entries and pillars is formed. Additional coal may be recovered from the pillars as this panel of coal is retreated.
16
Table of Contents
Spot market. Sales of coal under an agreement for shipments over a period of one year or less.
Steam coal. Coal used by power plants and industrial steam boilers to produce electricity or process steam. It generally is lower in Btu heat content and higher in volatile matter than metallurgical coal.
Sulfur. One of the elements present in varying quantities in coal that contributes to environmental degradation when coal is burned. Sulfur dioxide is produced as a gaseous by-product of coal combustion.
Sulfur content. Coal is commonly described by its sulfur content due to the importance of sulfur in environmental regulations. “Low sulfur” coal has a variety of definitions but is typically used to describe coal consisting of 1.0% or less sulfur. A majority of TECO Coal’s Central Appalachian reserves are of low sulfur grades.
Surface mine. A mine in which the coal lies near the surface and can be extracted by removing overburden.
Synthetic fuel (Synfuel). A solid fuel that is produced by mixing coal and/or coal waste with various additives, causing a chemical change to occur within the original product.
Tipple. A structure that facilitates the loading of coal into rail cars.
Tons. A “short” or net ton is equal to 2,000 pounds. A “long” or British ton is 2,240 pounds; a “metric” ton is approximately 2,205 pounds. The short ton is the unit of measure referred to in this Form 10-K.
Unassigned reserves. Coal which has not been committed, and which would require new mineshafts, mining equipment, or plant facilities before operations could begin in the property.
Underground mine. Also known as a “deep” mine. Usually located several hundred feet below the earth’s surface, an underground mine’s coal is removed mechanically and transferred by shuttle car or conveyor to the surface.
Unit train. A train of a specified number of cars carrying only coal. A typical unit train can carry at least 10,000 tons of coal in a single shipment.
Utility coal. Coal used by power plants to produce electricity or process steam. It generally is lower in Btu heat content and higher in volatile matter than metallurgical coal.
TECO GUATEMALA
TECO Guatemala, Inc., has subsidiaries that have interests in independent power projects in Guatemala and a minority ownership interest in an electrical distribution utility and affiliated entities. The TECO Guatemala subsidiaries had 124 employees as of Dec. 31, 2009.
TECO Guatemala indirectly owns 100% of Central Generadora Eléctrica San José, Limitada (CGESJ), the owner of an electric generating station located in Guatemala, which consists of a single-unit pulverized-coal baseload facility (the San José Power Station). This facility was the first coal-fueled plant in Central America and meets environmental standards set by Guatemala and the World Bank. In 1996, CGESJ signed a U.S. dollar-denominated power purchase agreement (PPA) with EEGSA, the largest private distribution company in Central America, to provide 120 megawatts of capacity and energy for 15 years beginning in 2000. In 2001, CGESJ signed an option with EEGSA to extend that PPA for five years at the end of its current term for approximately $2.5 million. Tecnología Marítima, S.A. (TEMSA), an indirect wholly-owned subsidiary, in addition to receiving the coal shipments for CGESJ, provides unloading services to third parties.
Tampa Centro Americana de Electricidad, Limitada (TCAE), an entity 96.06% owned by TPS Guatemala One, Inc., a subsidiary of TECO Guatemala, and the owner of an oil-fired electric generating facility (the Alborada Power Station), has a U.S. dollar-denominated PPA with EEGSA to provide 78 megawatts of capacity for a 15-year period ending in 2010. In 2001, TCAE signed an option with EEGSA to extend that PPA for five years at the end of its current term for approximately $2.9 million. EEGSA is responsible for providing the fuel for the plant, with a subsidiary of TECO Guatemala providing assistance in fuel administration.
In 1998, DECA II, a consortium whose members include a subsidiary of TECO Guatemala, Iberdrola Energia, S.A. of Spain (Iberdrola), an electric utility in Spain, and Electricidade de Portugal, an electric utility in Portugal, completed the purchase of an 80.9% ownership interest in EEGSA for $520 million. TECO Guatemala contributed $100 million in equity and owns a 30% interest in this consortium. At this time, the consortium maintains a controlling interest in EEGSA and other affiliate companies which provide, among other things, electricity transmission services and power sales to large electric customers and engineering services. EEGSA serves more than 900,000 customers in and around the metropolitan area of Guatemala City.
17
Table of Contents
For CGESJ, TCAE and DECA II, TECO Guatemala has obtained political risk insurance for currency inconvertibility, expropriation and political violence covering TECO Guatemala’s indirect equity investment and economic returns.
Our existing plants in Guatemala operate under environmental permits issued by the local environmental authorities. The plants were built in compliance with World Bank Guidelines of 1988 and 1994, at the time of construction of these facilities. TECO Guatemala complies with strict monitoring programs established by the local Ministry of Environment-MARN, which regulates local environmental laws and monitors compliance. TECO Guatemala has an environmental emission controls plan, monitoring programs as per the approved permits and lender requirements, pursuant to the referenced World Bank Guidelines.
TECO Guatemala operates its facilities under an approved environmental management plan, providing for efficient facility operation while promoting worker health and safety and reducing environmental impacts.
| Item 1A. | RISK FACTORS. |
General Business and Operational Risks
General economic conditions may adversely affect our businesses.
Our businesses are affected by general economic conditions. In particular, growth in Tampa Electric’s service area and in Florida is important to the realization of annual energy sales growth for Tampa Electric and PGS. A failure of market conditions to improve, or additional deterioration in the overall economic situation and the currently depressed Florida housing markets, could adversely affect Tampa Electric’s or PGS’ expected performance. Continuation or worsening of the current economic conditions could affect these companies’ ability to collect payments from customers.
TECO Coal and TECO Guatemala are also affected by general economic conditions in the industries and geographic areas they serve, both nationally and internationally.
Our electric and gas utilities are highly regulated, changes in regulations or the regulatory environment could reduce revenues or increase costs of competition.
Tampa Electric and PGS operate in highly regulated industries. Their retail operations, including the prices charged, are regulated by the FPSC, and Tampa Electric’s wholesale power sales and transmission services are subject to regulation by the FERC. Changes in regulatory requirements or adverse regulatory actions could have an adverse effect on Tampa Electric’s or PGS’ financial performance by, for example, reducing revenues, increasing competition or costs, threatening investment recovery or impacting rate structure.
Tampa Electric and PGS were awarded ROE ranges with mid-points of 11.25% and 10.75%, respectively in 2009 by the FPSC. In 2010, the FPSC awarded ROE ranges with mid-points of 10.5% and 10.0% to other investor owned utilities in Florida. Our financial results could be adversely affected if the FPSC were to lower the allowed ROE in the next base rate proceedings by either company.
Tampa Electric and PGS were awarded ROE ranges with mid-points of 11.25% and 10.75% in their respective 2009 base rate proceedings. Recent decisions by the FPSC in investor owned utility rate cases awarded ROEs below those levels, which could be, in part, an effort to minimize the impact of utility price changes on customers in the current weak Florida economy. While the FPSC has a history of constructive regulation, the recent actions taken with other companies may signal a change in the Florida regulatory climate. If ROEs were reduced or other elements of the regulatory framework were changed, our financial results could be adversely affected.
Changes in the environmental laws and regulations affecting our businesses could increase our costs or curtail our activities.
Our businesses are subject to regulation by various governmental authorities dealing with air, water and other environmental matters. Changes in compliance requirements or the interpretation by governmental authorities of existing requirements may impose additional costs on us or require us to curtail some of our businesses’ activities.
Potential new regulations on the disposal and/or storage of coal combustion by-products could add to Tampa Electric’s operating costs.
In 2009, in response to a coal ash pond failure at another utility, the EPA announced that it would propose new regulations regarding coal combustion by-product handling, storage and disposal. As of February 2010, the proposed new rules had not been published. If the new rules reduce or eliminate the beneficial use of coal combustion by-products, or eliminate the use of ponds for by-product storage, it could increase Tampa Electric’s operating costs through higher disposal costs.
18
Table of Contents
Federal or state regulation of GHG emissions, depending on how they are enacted, could increase our costs or the costs of our customers or curtail sales.
Among our companies, Tampa Electric has the most significant number of stationary sources with air emissions. While GHG emission regulations have been proposed, both at the federal and state level, none have been passed at this time and therefore costs to reduce GHGs are unknown. Presently there is no viable technology to remove CO2 post-combustion from conventional coal-fired units such as Tampa Electric’s Big Bend units.
Regulation in Florida allows utility companies to recover from customers prudently incurred costs for compliance with new environmental regulations. Tampa Electric would expect to recover from customers the costs of power plant modifications or other costs required to comply with new GHG emission regulation, but increased costs for electricity may cause customers to change usage patterns, which would impact Tampa Electric’s sales. If the regulation allowing cost recovery is changed and the cost of compliance is not recovered through the ECRC, Tampa Electric could seek to recover those costs through a base-rate proceeding, but we cannot predict whether the FPSC would grant such recovery.
Changes in environmental laws or regulations could affect TECO Coal’s customers and could reduce the demand for coal as a fuel source and cause sales to decline.
The operations of TECO Coal and its customers are subject to extensive environmental laws and regulations especially air emissions and air quality standards. In particular, the Clean Air Act and state and local laws and regulations limit emissions of sulfur dioxide, nitrogen oxides, particulate matter and other compounds from electric power plants, which are the single largest users of our coal.
A major by-product of the combustion of coal is carbon dioxide, which is considered a major source of greenhouse gases. Future regulation of greenhouse gases as proposed by various federal, state and international initiatives could cause coal-fired power plants or other industrial users of coal to install expensive or unproven control technologies, cause them to switch to less carbon intensive fuels or shut-down. Any reduction in demand for coal as a fuel source could have a material adverse impact on TECO Coal’s and our financial results.
The significant, phased reductions in GHG emissions called for by the executive orders signed by the governor of Florida in 2007 could add to Tampa Electric’s costs and adversely affect its operating results.
The Governor of Florida signed three Executive Orders in July 2007 aimed at reducing Florida’s emissions of GHG. The three orders include directives for reducing GHG emissions by electric utilities to 2000 levels by 2017; to 1990 levels by 2025; and by 80 percent of 1990 levels by 2050; and the creation of the Governor’s Action Team on Energy and Climate Change to develop a plan to achieve the targets contained in the Executive Orders, including any necessary legislative initiatives required. The Action Team submitted its Phase One report to the Governor on Nov. 1, 2007. The final report was completed by the October 2008 deadline and included recommendations incorporating GHG emission reduction targets and strategies into Florida’s energy future as well as energy efficiency and conservation targets.
Also in 2008, the state legislature passed broad energy and climate legislation that, among other items, affirmed the FDEP’s authority to establish a utility carbon reduction schedule and a carbon dioxide cap and trade system by rule, but added a requirement for legislative ratification of the rule no sooner than January 2010. The FDEP has initiated the rule development process, but until the final rules are developed, the impact on Tampa Electric and its customers cannot be determined. However, if the final rules result in increased costs to Tampa Electric, or further changes in customer usage patterns in response to higher rates, Tampa Electric’s operating results could be adversely affected.
A mandatory RPS could add to Tampa Electric’s costs and adversely affect its operating results.
In connection with the executive orders signed by the Governor of Florida in July 2007, the FPSC was tasked with evaluating a renewable portfolio target. The FPSC has made a recommendation to the Florida legislature that the RPS percentage be 7% by Jan. 1, 2013, 12% by Jan. 1, 2016, 18% by Jan. 1, 2019 and 20% by Jan. 1, 2021. The FPSC recommendation is subject to ratification by the Florida legislature. In addition, there is proposed legislation in the U.S. Congress to introduce a renewable energy portfolio standard at the federal level. It remains unclear, however, if or when action on such legislation would be completed. Tampa Electric could incur significant costs to comply with a renewable energy portfolio standard, as proposed. Tampa Electric’s operating results could be adversely affected if Tampa Electric were not permitted to recover these costs from customers, or if customers change usage patterns in response to increased rates.
Tampa Electric, the State of Florida and the nation as a whole are increasingly dependent on natural gas to generate electricity. There may not be adequate infrastructure to deliver adequate quantities of natural gas to meet the expected future demand and the expected higher demand for natural gas may lead to increasing costs for the commodity.
The deferral of Tampa Electric’s IGCC unit and the cancellation of numerous proposed coal-fired generating stations in Florida and across the United States in response to GHG emissions concerns is expected to lead to an increasing reliance on natural gas-fired generation to meet the growing demand for electricity. Currently there is an adequate supply and infrastructure to meet
19
Table of Contents
demand for natural gas in Florida and nationally. There is, however, uncertainty regarding whether the available supply of both domestic and imported natural gas and the existing infrastructure to transport the natural gas into and within Florida are adequate to meet the projected increased demand.
If supplies are inadequate or if significant new investment is required to install the pipelines necessary to transport the gas, the cost of natural gas could rise. Currently Tampa Electric and PGS are allowed to pass the cost for the commodity gas and transportation services through to the customer without profit. Changes in regulations could reduce earnings for Tampa Electric and PGS if they required Tampa Electric and PGS to bear a portion of the increased cost. In addition, increased costs to customers could result in lower sales.
Our businesses are sensitive to variations in weather, the effects of extreme weather and have seasonal variations.
Our businesses are sensitive to variations in weather and the effects of extreme weather, and have seasonal variations. Climate change could lead to weather conditions other than what we routinely experience today.
Most of our businesses are affected by variations in general weather conditions and unusually severe weather, which are risks we face today. Tampa Electric’s and PGS’ energy sales are particularly sensitive to variations in weather conditions. Those companies forecast energy sales on the basis of normal weather, which represents a long-term historical average. If climate change, or other factors, cause significant variations from normal weather it could have a material impact on energy sales. Extreme weather conditions, such as hurricanes, can be destructive, causing outages and property damage that require the company to incur additional expenses. If warmer temperatures lead to changes in extreme weather events (increased frequency, duration and severity), these expenses could be greater. The speculative nature of such changes, however, and the long period of time over which any potential changes might be expected to take place make estimating the physical risks difficult.
PGS, which has a typically short but significant winter peak period that is dependent on cold weather, is more weather-sensitive than Tampa Electric, which has both summer and winter peak periods. Mild winter weather in Florida can be expected to negatively impact results at PGS.
Variations in weather conditions also affect the demand and prices for the commodities sold by TECO Coal. Severe weather conditions could interrupt or slow coal production or rail transportation and increase operating costs.
The State of Florida is exposed to extreme weather, including hurricanes, which can cause damage to our facilities and affect our ability to serve customers.
As a company with electric service and natural gas operations in peninsular Florida, the company has substantial experience operating in areas prone to extreme weather events, such as hurricanes. The company has storm preparations and recovery plans in its operations that are routinely assessed and improved based upon experience during drills and events and planning with critical partners. Tampa Electric and PGS host meetings with state and local emergency management agencies to refine communications and restoration plans and consult with similarly situated utilities in preparing for restoration following extreme weather events.
In addition to the design of its facilities and its storm recovery plans, the company continuously monitors and assesses the physical risks associated with severe weather conditions and adjusts its planning to reflect the results of that assessment. While Tampa Electric and PGS have historically been granted regulatory approval to recover or defer the majority of significant storm costs incurred, storm cost recovery petitions may not always be granted or may not be granted in a timely manner. If costs associated with future severe weather events cannot be recovered in a timely manner, or in an amount sufficient to cover actual costs, the financial condition and results of operations of the affected company could be materially and adversely impacted.
Commodity price changes may affect the operating costs and competitive positions of our businesses.
Most of our businesses are sensitive to changes in coal, gas, oil and other commodity prices. Any changes could affect the prices these businesses charge, their operating costs and the competitive position of their products and services.
In the case of Tampa Electric, fuel costs used for generation are affected primarily by the cost of coal and natural gas. Tampa Electric is able to recover prudently incurred costs of fuel through retail customers’ bills, but increases in fuel costs affect electric prices and, therefore, the competitive position of electricity against other energy sources.
The ability to make sales and the margins earned on wholesale power sales are affected by the cost of fuel to Tampa Electric, particularly as it compares to the costs of other power producers.
In the case of PGS, costs for purchased gas and pipeline capacity are recovered through retail customers’ bills, but increases in gas costs affect total retail prices, and therefore, the competitive position of PGS relative to electricity, other forms of energy and other gas suppliers.
20
Table of Contents
In the case of TECO Coal, the selling price of coal may cause it to either decrease or increase production. If production is decreased, there may be costs associated with idling facilities or write-offs of reserves that are no longer economic.
In the case of TECO Guatemala, the dispatch price for some of the diesel generating resources in Guatemala, which use residual oil, have, at times been above or below, the average price of coal used by the San José Power Station due to prices for crude oil. Depending on the price of residual oil, generation from the San José Power Station for spot sales would rise or fall with oil prices, thus increasing or reducing non-fuel energy sales revenues and net income.
Changes in customer energy usage patterns and the impact of the housing market slowdown may affect sales at our utility companies.
Tampa Electric’s weather-normalized residential per customer usage declined again in 2009, following a decline in 2008. It is now apparent that some of the robust residential customer growth in the 2005 through mid-2007 period, which was measured by new meter installations, was actually vacant residences with minimal energy usage. The average number of residential customers with minimal usage, which can be affected by weather, was approximately 8% in 2009 and in 2008.
In general, energy usage per residential customer at both Tampa Electric and PGS has declined over the last three years. We believe that this was in response to weather patterns especially in the spring and fall, voluntary conservation in response to the economic conditions, increased appliance efficiency, and increased residential vacancies as a result of increasing foreclosures amid the economic slowdown.
The utilities’ forecasts are based on normal weather patterns and historical trends in customer energy use patterns. Tampa Electric’s and PGS’ ability to increase energy sales and earnings could be negatively impacted if energy prices increase in general and customers continue to use less energy in response to economic conditions.
The federal government has injected considerable liquidity into the financial system and supported the housing market through mortgage purchases and tax credits for qualified home buyers. These programs are scheduled to expire at various times in 2010. Our customer and energy sales growth could be negatively impacted by the withdrawal of this financial support.
Our forecast for results in 2010 assumes no customer growth and a slight decrease in energy sales growth, driven primarily by the weak economy. If the housing and new home construction markets contract further following the expiration of the various federal support programs our financial results could be negatively impacted.
We rely on some transmission and distribution assets that we do not own or control to deliver wholesale electricity, as well as natural gas. If transmission is disrupted, or if capacity is inadequate, our ability to sell and deliver electricity and natural gas may be hindered.
We depend on transmission and distribution facilities owned and operated by other utilities and energy companies to deliver the electricity and natural gas we sell to the wholesale and retail markets, as well as the natural gas we purchase for use in our electric generation facilities. If transmission is disrupted, or if capacity is inadequate, our ability to sell and deliver products and satisfy our contractual and service obligations may be hindered.
The FERC has issued regulations that require wholesale electric transmission services to be offered on an open-access, non-discriminatory basis. Although these regulations are designed to encourage competition in wholesale market transactions for electricity, there is the potential that fair and equal access to transmission systems will not be available or that sufficient transmission capacity will not be available to transmit electric power as we desire. We cannot predict the timing of industry changes as a result of these initiatives or the adequacy of transmission facilities. Likewise, unexpected interruption in upstream natural gas supply or transmission could affect our ability to generate power or deliver natural gas to local distribution customers.
We may be unable to take advantage of our existing tax credits and deferred tax benefits.
We have generated significant tax credits and deferred tax assets that are being carried over to future periods to reduce future cash payments for income tax. Our ability to utilize the carry-over credits and deferred tax assets is dependent upon sufficient generation of future taxable income, including foreign source income and capital gains. These tax credit carryforwards are subject to expiration periods of varying durations (see Note 4 to the TECO Energy Consolidated Financial Statements)
Our financial results could be reduced if certain proposed revisions to the U.S. tax code related to foreign earnings are implemented.
The administration has announced initiatives that could substantially reduce our ability to defer U.S. income taxes. These proposals include repealing the deferral of U.S. taxation of foreign earnings; eliminating utilization of, or substantially reducing our ability to claim, foreign tax credits; and eliminating certain tax deductions until foreign earnings are repatriated to the U.S.
21
Table of Contents
The current 2010-2011 federal budget, as proposed, includes the elimination of the percentage depletion tax deduction for coal mines and other hard mineral fossil fuels.
If the percentage depletion tax deduction is eliminated for TECO Coal, the effective tax rate for that company would rise from the expected 20% to 25% to the general corporate tax rate of 37%, which would have an adverse effect on TECO Coal’s financial results after 2010.
Impairment testing of certain long-lived assets and goodwill could result in impairment charges.
We test our long-lived assets and goodwill for impairment annually or more frequently if certain triggering events occur. Should the current carrying values of any of these assets not be recoverable, we would incur charges to write down the assets to fair market value. In the normal course of business, TECO Guatemala evaluated its $146.7 million investment in DECA II, including associated goodwill, at Dec. 31, 2009 and determined that the value was not impaired. However, the outcome of the ongoing efforts and a potential arbitration under a DR-CAFTA claim is uncertain, and could impact this determination in the future. See the TECO Guatemala section of Management’s Discussion & Analysis for additional discussion of the DR-CAFTA claim.
Problems with operations could cause us to incur substantial costs.
Each of our subsidiaries is subject to various operational risks, including accidents, or equipment failures and operations below expected levels of performance or efficiency. As operators of power generation facilities, our subsidiaries could incur problems such as the breakdown or failure of power generation equipment, transmission lines, pipelines or other equipment or processes that would result in performance below assumed levels of output or efficiency. Our outlook assumes normal operations and normal maintenance periods for our operating companies’ facilities.
Our computer systems and Tampa Electric’s infrastructure may be subject to cyber (primarily electronic or internet based) attack, which could disrupt operations, cause loss of important data or compromise customer, employee-related or other critical information or systems.
There have been an increasing number of cyber attacks on companies around the world, which have caused operational failures or compromised sensitive corporate or customer data. These attacks have occurred over the internet, through malware, viruses, or attachments to e-mails or through persons inside of the organization or with persons with access to systems inside of the organization.
We have security systems and infrastructure in place to prevent such attacks, and these systems are subject to internal, external and regulatory audits to ensure adequacy. Despite these efforts, we can not be assured that a cyber attack will not cause electric or gas system operational problems, disruptions of service to customers, or compromise important data or systems.
Failure to obtain the permits necessary to open new surface mines could reduce earnings from our coal company.
Our coal mining operations are dependent on permits from the U.S. Army Corp of Engineers (USACE) to open new surface mines necessary to maintain or increase production. For the past several years, new permits issued by the USACE under Section 404 of the Clean Water Act for new surface coal mining operations have been challenged in court resulting in a backlog of permit applications and very few permits being issued. Our coal company has six permits on the list of permits subject to enhanced review by the U.S. EPA under its memorandum of understanding with the USACE, which was issued in September 2009. To date, there has been no progress in granting these permits. Failure to obtain the necessary permits to open new surface mines, which are required to maintain and expand production, could reduce production, cause higher mining costs, or require purchasing coal at prices above our cost of production to fulfill contract requirements, which would reduce the earnings expected from our coal company.
Our international projects are subject to risks that could result in losses or increased costs.
Our projects in Guatemala involve numerous risks that are not present in domestic projects, including expropriation, political instability, currency exchange rate fluctuations, repatriation restrictions, and regulatory and legal uncertainties. TECO Guatemala attempts to manage these risks through a variety of risk mitigation measures, including specific contractual provisions, obtaining non-recourse financing and obtaining political risk insurance where appropriate.
Guatemala, similar to many countries, has been experiencing higher electricity prices. As a result, TECO Guatemala’s operations are exposed to increased risks as the country’s government and regulatory authorities seek ways to reduce the cost of energy to its consumers.
22
Table of Contents
The purchased power agreement between the Alborada Power Station in Guatemala and EEGSA is scheduled to expire in September 2010. If the contract is not renewed the financial results from TECO Guatemala would be reduced.
In 2001, EEGSA granted TECO Guatemala an option to extend the Alborada power sales contract, which is scheduled to expire in September 2010, for five years at the end of the contract period. The tariff to pass through cost associated with the contract was approved by the Guatemalan regulators at that time. The current Guatemalan regulators have objected to the extension citing modifications to regulations passed in 2007. TECO Guatemala is currently in talks with the Guatemalan government to extend this contract. If the contract is not renewed, the net income from the plant would be reduced or eliminated and an impairment charge could be taken.
If efforts to have the July 2008 value added distribution tariff (VAD) decision at EEGSA recalculated or revised are unsuccessful, earnings and cash flow from that company would be at risk as long as the current lower VAD remains in place.
In January 2009, our subsidiary, TECO Guatemala Holdings, LLC, delivered a Notice of Intent to the Guatemalan government indicating its intent to file an arbitration claim against the Republic of Guatemala under the Dominican-Republic-Central America-United States Free Trade Agreement (DR-CAFTA). The required 90-day waiting period has passed and TECO Guatemala now has the ability to file a claim under DR-CAFTA when it deems it is appropriate. In 2009 TECO Guatemala attempted to resolve the dispute amicably through consultation or negotiation and through the Guatemalan legal system, without success. If these efforts continue to be unsuccessful, EEGSA’s earnings contribution to TECO Guatemala, estimated to be a minimum of $10 million annually, could be at risk as long as the lower VAD remains in effect.
Potential competitive changes may adversely affect our regulated electric and gas businesses.
The U.S. electric power industry has been undergoing restructuring. Competition in wholesale power sales has been introduced on a national level. Some states have mandated or encouraged competition at the retail level and, in some situations, required divestiture of generating assets. While there is active wholesale competition in Florida, the retail electric business has remained substantially free from direct competition. Although not expected in the foreseeable future, changes in the competitive environment occasioned by legislation, regulation, market conditions or initiatives of other electric power providers, particularly with respect to retail competition, could adversely affect Tampa Electric’s business and its expected performance.
The gas distribution industry has been subject to competitive forces for several years. Gas services provided by PGS are now unbundled for all non-residential customers. Because PGS earns margins on distribution of gas but not on the commodity itself, unbundling has not negatively impacted PGS’ results. However, future structural changes that we cannot predict could adversely affect PGS.
We are a party from time to time to legal proceedings that may result in a material adverse effect on our financial condition.
From time to time, we are a party to, or otherwise involved in, lawsuits, claims, proceedings, investigations and other legal matters that could adversely affect our financial results.
Financing Risks
Financial market conditions could limit our access to capital and increase our costs of borrowing or have other adverse effects on our results.
The financial market conditions that were experienced in 2008 and early 2009 impacted access to both the short-and long-term capital markets and the cost of such capital. We have debt maturities, beginning in 2010, which will require refinancing. Future capital market conditions could limit our ability to raise the capital we need, and could increase our interest costs which could reduce earnings.
We enter into derivative transactions with counterparties, most of which are financial institutions, to hedge our exposure to commodity price changes. Although we believe we have appropriate credit policies in place to manage the non-performance risk associated with these transactions, the recent turmoil in the financial markets could lead to a sudden decline in credit quality among these counterparties. If such a decline occurs for a counterparty with which we have an in-the-money position, we could be unable to collect from such counterparty.
Despite the strong financial market recovery in 2009, declines in the financial markets or in interest rates used to determine benefit obligations could increase our pension expense or the required cash contributions to maintain required levels of funding for our plan.
The value of our pension fund assets were negatively impacted by unfavorable market conditions in 2008. At Jan. 1, 2009 our plan was more than 100% funded under calculation requirements of the Pension Protection Act (PPA). However, as a result of the
23
Table of Contents
continued low interest rate environment, our funded percentage is expected to be approximately 90% as of the Jan. 1, 2010 PPA measurement date. This will increase our required contributions to the plan beginning in 2010. Any future declines in the financial markets or a continued low-interest rate environment could increase the amount of contributions required to fund our plan in the future.
We estimate that pension expense in 2010 will be higher than in 2009, due in large part to the lower interest rate environment (lower discount rates used to measure our Plan’s benefit obligations). Any future declines in the financial markets or a continuation of the low interest rate environment could cause pension expense to increase in future years.
We have substantial indebtedness, which could adversely affect our financial condition and financial flexibility.
We have significant indebtedness, which has resulted in fixed charges we are obligated to pay. The level of our indebtedness and restrictive covenants contained in our debt obligations could limit our ability to obtain additional financing.
TECO Energy, TECO Finance and Tampa Electric Company must meet certain financial tests as defined in the applicable agreements to use their respective credit facilities. Also, TECO Energy, TECO Finance, Tampa Electric Company and other operating companies, have certain restrictive covenants in specific agreements and debt instruments. The restrictive covenants of our subsidiaries could limit their ability to make distributions to us, which would further limit our liquidity. See the Credit Facilities section and Significant Financial Covenants table in the Liquidity, Capital Resources sections of MD&A for descriptions of these tests and covenants.
As of Dec. 31, 2009, we were in compliance with required financial covenants, but we cannot be assured that we will be in compliance with these financial covenants in the future. Our failure to comply with any of these covenants or to meet our payment obligations could result in an event of default which, if not cured or waived, could result in the acceleration of other outstanding debt obligations. We may not have sufficient working capital or liquidity to satisfy our debt obligations in the event of an acceleration of all or a portion of our outstanding obligations.
We also incur obligations in connection with the operations of our subsidiaries and affiliates that do not appear on our balance sheet. These obligations take the form of guarantees, letters of credit and contractual commitments, as described under Off-Balance Sheet Debt and Liquidity, Capital Resources sections of the MD&A.
Our financial condition and results could be adversely affected if our capital expenditures are greater than forecast.
We are forecasting lower levels of capital expenditures, primarily at Tampa Electric, for compliance with our environmental consent decree, to support the current levels of slower customer growth, to comply with the design changes mandated by the FPSC to harden transmission and distribution facilities against hurricane damage, to maintain transmission and distribution system reliability, and to maintain coal-fired generating unit reliability and efficiency.
If we are unable to maintain capital expenditures at the forecasted levels, we may need to draw on credit facilities or access the capital markets on unfavorable terms. We cannot be sure that we will be able to obtain additional financing, in which case our financial position, earnings and credit ratings could be adversely affected.
Our financial condition and ability to access capital may be materially adversely affected by ratings downgrades, and we cannot be assured of any rating improvements in the future.
Our senior unsecured debt is rated as investment grade by Standard & Poor’s (S&P) at BBB- with a stable outlook, by Moody’s Investor’s Services (Moody’s) at Baa3 with a stable outlook, and by Fitch Ratings (Fitch) at BBB- with a stable outlook. The senior unsecured debt of Tampa Electric Company is rated by S&P at BBB with a stable outlook, by Moody’s at Baa1 with a stable outlook and by Fitch at BBB+ with a stable outlook. Any downgrades by the rating agencies may affect our ability to borrow, may change requirements for future collateral or margin postings, and may increase our financing costs, which may decrease our earnings. We also may experience greater interest expense than we may have otherwise if, in future periods, we replace maturing debt with new debt bearing higher interest rates due to any such downgrades. In addition, downgrades could adversely affect our relationships with customers and counterparties.
At current ratings, Tampa Electric and PGS are able to purchase electricity and gas without providing collateral. If the ratings of Tampa Electric Company decline to below investment grade, Tampa Electric and PGS could be required to post collateral to support their purchases of electricity and gas.
Because we are a holding company, we are dependent on cash flow from our subsidiaries, which may not be available in the amounts and at the times we need it.
We are a holding company and are dependent on cash flow from our subsidiaries to meet our cash requirements that are not satisfied from external funding sources. Some of our subsidiaries have indebtedness containing restrictive covenants which, if violated, would prevent them from making cash distributions to us. In particular, certain long-term debt at PGS prohibits payment
24
Table of Contents
of dividends to us if Tampa Electric Company’s consolidated shareholders’ equity is lower than $500 million. At Dec. 31, 2009, Tampa Electric Company’s consolidated shareholders’ equity was approximately $2.1 billion. Also, our wholly owned subsidiary, TECO Diversified, Inc., the holding company for TECO Coal, has a guarantee related to a coal supply agreement that could limit the payment of dividends by TECO Diversified to us (see the TECO Energy Significant Financial Covenants table in the Liquidity, Capital Resources sections of MD&A).
Various factors could affect our ability to sustain our dividend.
Our ability to pay a dividend, or sustain it at current levels, could be affected by such factors as the level of our earnings and therefore our dividend payout ratio, and pressures on our liquidity, including unplanned debt repayments, unexpected capital spending and shortfalls in operating cash flow. These are in addition to any restrictions on dividends from our subsidiaries to us discussed above.
We are vulnerable to interest rate changes and may not have access to capital at favorable rates, if at all.
A portion of our debt bears interest at variable rates. Increases in interest rates, therefore, may require a greater portion of our cash flow to be used to pay interest. In addition, changes in interest rates and capital markets generally affect our cost of borrowing and access to these markets.
| Item 1B. | UNRESOLVED STAFF COMMENTS. |
None.
| Item 2. | PROPERTIES. |
TECO Energy believes that the physical properties of its operating companies are adequate to carry on their businesses as currently conducted. The properties of Tampa Electric are subject to a first mortgage bond indenture under which no bonds are currently outstanding.
TAMPA ELECTRIC
Tampa Electric has four electric generating plants in service, with a December 2009 net generating capability of 4,719 MW. Tampa Electric assets include the Big Bend Power Station (1,602 MW capacity from four coal units and 61 MW from a combustion turbine (CT)), the Bayside Power Station (2,083 MW capacity from two natural gas combined cycle units and four CTs), the Polk Power Station (235 MW capacity from the IGCC unit and 732 MW capacity from four CTs) and a partnership interest with the City of Tampa on 6 MW net winter generating capability from the Howard Current Advanced Waste Water Treatment Plant.
The Big Bend coal units went into service from 1970 to 1985 and the CT was installed in 2009. The Polk IGCC unit began commercial operation in 1996. In 1991, Tampa Electric purchased the Phillips Power Station from the Sebring Utilities Commission (Sebring) and it was placed on long term reserve standby in 2009. Bayside Unit 1 was completed in April 2003, Unit 2 was in January 2004, Units 5 and 6 were completed in April of 2009 and Units 3 and 4 were completed in July 2009.
Tampa Electric owns 178 substations having an aggregate transformer capacity of 22,248 Mega Volts Amps (MVA). The transmission system consists of approximately 1,309 pole miles (including underground and double-circuit) of high voltage transmission lines, and the distribution system consists of 6,413 pole miles of overhead lines and 4,472 trench miles of underground lines. As of Dec. 31, 2009, there were 668,157 meters in service. All of this property is located in Florida.
All plants and important fixed assets are held in fee except that titles to some of the properties are subject to easements, leases, contracts, covenants and similar encumbrances and minor defects of a nature common to properties of the size and character of those of Tampa Electric.
Tampa Electric has easements or other property rights for rights-of-way adequate for the maintenance and operation of its electrical transmission and distribution lines that are not constructed upon public highways, roads and streets. It has the power of eminent domain under Florida law for the acquisition of any such rights-of-way for the operation of transmission and distribution lines. Transmission and distribution lines located in public ways are maintained under franchises or permits.
Tampa Electric Company has a long-term lease for the office building in downtown Tampa which serves as headquarters for TECO Energy, Tampa Electric, PGS and TECO Guatemala.
PEOPLES GAS SYSTEM
PGS’ distribution system extends throughout the areas it serves in Florida and consists of approximately 17,500 miles of pipe, including approximately 11,000 miles of mains and 6,500 miles of service lines. Mains and service lines are maintained under rights-of-way, franchises or permits.
25
Table of Contents
PGS’ operations are located in 14 operating divisions throughout Florida. While most of the operations and administrative facilities are owned, a small number are leased.
TECO COAL
Property Control
Operations of TECO Coal and its subsidiaries are conducted on both owned and leased properties totaling over 250,000 acres in Kentucky, Tennessee and Virginia. TECO Coal’s current practice is to obtain a title review from a licensed attorney prior to purchasing or leasing property. As is typical in the coal mining industry, TECO Coal generally has not obtained title insurance in connection with its acquisitions of coal reserves and/or related surface properties. In many cases, the seller or lessor will grant the purchasing or leasing entity a warranty of property title. When leasing coal reserves and/or related surface properties where mining has previously occurred, TECO Coal may opt not to perform a separate title confirmation due to the previous mining activities on such a property. In cases involving less significant properties and consistent with industry practices, title and boundaries to less significant properties are now verified during lease or purchase negotiations.
In situations where property is controlled by lease, the lease terms are generally sufficient to allow the reserves for the associated operation to be mined within the initial lease term. In fact, the terms of many of these leases extend until the exhaustion of the mineable and merchantable coal from the leased property. If, however, extensions of the original lease term become necessary, provisions have generally been made within the original lease to extend the lease term upon continued payment of minimum royalties.
Coal Reserves
As of Dec. 31, 2009, the TECO Coal operating companies had a combined estimated 262.2 million tons of proven and probable recoverable reserves. All of the reserves consist of High Vol A Bituminous Coal. Reserves are the portion of the proven and probable tonnage that meet TECO Coal’s economic criteria regarding mining height, preparation plant recovery, depth of overburden and stripping ratio. Generally, these reserves would be commercially mineable at year-end price and cost levels. Additionally, other controlled areas presently identified as resource now total 67.5 million tons of coal.
Reserves are defined by Security and Exchange Commission (SEC) Industry Guide 7 as that part of a mineral deposit which could be economically and legally extracted or produced at the time of the reserve determination. Proven and probable coal reserves are defined by SEC Industry Guide 7 as follows:
Proven (Measured) Reserves—Reserves for which (a) quantity is computed from dimensions revealed in outcrops, trenches, working or drill holes: grade and/or quality are computed from the results of detailed sampling; and (b) the sites for inspection, sampling and measurement are spaced so closely and the geologic character is so well defined that size, shape, depth and mineral content of reserves are well-established.
Probable (Indicated) Reserves—Reserves for which quantity and grade and/or quality are computed from information similar to that used for proven reserves, but for which the sites for inspection, sampling and measurement are farther apart or are otherwise less adequately spaced. The degree of assurance, although lower than that for proven reserves, is high enough to assume continuity between points of observation.
Drill hole spacing for confidence levels in reserve calculations is based on guidelines in U.S. Geological Survey Circular 891 (Coal Resource Classification System of the U.S. Geological Survey). In this method of classification, “proven” reserves are considered to be those lying within one-quarter mile (1,320 feet) of a valid point of measurement and “probable” reserves are those lying between one-quarter mile and three-quarters mile (3,960 feet) from such an observation point.
TECO Coal’s reserve estimates are prepared by its staff of geologists, whose experience ranges from 20 years to 35 years. TECO Coal also has two chief geologists with the responsibility to track changes in reserve estimates, supervise TECO Coal’s other geologists and coordinate third party reviews of our reserve estimates by qualified mining consultants. In 2009, a third-party reserve audit was performed by Marshall Miller & Associates on the portion of reserves acquired during 2009. The results of that audit are reflected in the numbers within this report.
26
Table of Contents
Table 3 below shows recoverable reserves by quantity and the method of property control as well as the Assigned and Unassigned reserves per mining complex:
RECOVERABLE RESERVES BY QUANTITY (1)
(Millions of tons)
Table 3
| Assigned (2) | Unassigned (2) | |||||||||||||||||||
| Mining Complex |
Location |
Total | Proven | Probable | Owned | Leased | 2010 | 2009 | 2010 | 2009 | ||||||||||
| Gatliff Coal Company |
Bell County, KY/ Knox County, KY/ Campbell County, TN | 3.4 | 3.0 | 0.4 | 1.2 | 2.2 | 0.5 | 0.7 | 2.9 | 2.7 | ||||||||||
| Clintwood Elkhorn Mining |
Pike County, KY/ Buchanan County, VA |
50.0 | 42.0 | 8.0 | 3.3 | 46.7 | 50.0 | 52.2 | — | — | ||||||||||
| Premier Elkhorn Coal |
Pike County, KY/Letcher County, KY/Floyd County, KY | 72.8 | 55.4 | 17.4 | 40.4 | 32.4 | 64.4 | 67.6 | 8.4 | 8.4 | ||||||||||
| Perry County Coal |
Perry County, KY/ Leslie County, KY/ Knott County, KY |
136.0 | 64.7 | 71.3 | 0.1 | 135.9 | 129.2 | 134.9 | 6.8 | — | ||||||||||
| Total |
262.2 | 165.1 | 97.1 | 45.0 | 217.2 | 244.1 | 255.4 | 18.1 | 11.1 | |||||||||||
Notes:
| (1) | Recoverable reserves represent the amount of proven and probable reserves that can actually be recovered from the reserve base taking into account all mining and preparation losses involved in producing a saleable product using existing methods under current law. Reserve information reflects a moisture of 6.5%. This moisture factor represents the average moisture present in TECO Coal’s delivered coal. |
| (2) | Assigned reserves means coal which has been committed by the coal company to operating mine shafts, mining equipment, and plant facilities, and all coal which has been leased by the company to others. Unassigned reserves represent coal which has not been committed, and which would require new mineshafts, mining equipment, or plant facilities before operations could begin in the property. |
Table 4 below shows the recoverable reserves by quality, including sulfur content and coal type, per mining complex:
RECOVERABLE RESERVES BY QUALITY (1)
(Millions of tons)
Table 4
| Sulfur Content | ||||||||||||
| Mining Complex |
Recoverable Reserves | < 1% (2) | >1% (2) | Compliance Tons (3) |
Average BTU/lb As received |
Coal Type (4) | ||||||
| Gatliff Coal Company |
3.4 | 3.2 | 0.2 | — | 13,500 | LSU | ||||||
| Clintwood Elkhorn Mining |
50.0 | 24.9 | 25.1 | 23.6 | 13,400 | HVM, LSU, PCI | ||||||
| Premier Elkhorn Coal |
72.8 | 42.6 | 30.2 | 24.4 | 13,350 | IS, LSU, PCI | ||||||
| Perry County Coal |
136.0 | 107.1 | 28.9 | 74.9 | 13,195 | LSU, PCI, V | ||||||
| Total |
262.2 | 122.9 | ||||||||||
Notes:
| (1) | Reserve information reflects a moisture factor of 6.5%. This moisture factor represents the average moisture present in TECO Coal’s delivered coal. |
| (2) | <1% or >1% refers to sulfur content as a percentage in coal by weight. |
| (3) | Compliance coal is any coal that emits less than 1.2 pounds of sulfur dioxide per million BTU when burned. Compliance coal meets sulfur emission standards imposed by Title IV of the Clean Air Act. |
| (4) | Reserve holdings include metallurgical coal reserves. Although these metallurgical coal reserves receive the highest selling price in the current market when marketed to steel-making customers, they can also be marketed as an ultra-high BTU, low sulfur utility coal for electricity generation. |
HVM—High Vol Met
LSU—Low Sulfur Utility
PCI—Pulverized Coal Injection
V—Various
IS—Industrial Stoker
Reserve Estimation Procedure
TECO Coal’s reserves are based on over 2,900 data points, including drill holes, prospect measurements and mine measurements. Our reserve estimates also include information obtained from our on-going exploration drilling and in-mine channel sampling programs. Reserve classification is determined by evaluation of engineering and geologic information along with economic analysis. These reserves are adjusted periodically to reflect fluctuations in the economics in the market and/or changes in engineering parameters and/or geologic conditions. Additionally, the information is constantly being updated to reflect new data for existing property as well as new acquisitions and depleted reserves.
27
Table of Contents
This data may include elevation, thickness, and, where samples are available, the quality of the coal from individual drill holes and channel samples. The information is assembled by qualified geologists and engineers located throughout TECO Coal. Information is entered into sophisticated computer modeling programs from which preliminary reserves estimations are generated. The information derived from the geological database is then combined with data on ownership or control of the mineral and surface interests to determine the extent of the reserves in a given area. Determinations of reserves are made after in-house geologists have reviewed the computer models and manipulated the grids to better reflect regional trends.
During TECO Coal’s reserve evaluation and mine planning, TECO Coal takes into account factors such as restrictions under railroads, roads, buildings, power lines, or other structures. Depending on these factors, coal recovery may be limited or, in some instances, entirely prohibited. Current engineering practices are used to determine potential subsidence zones. The footprint of the relevant structure, as well as a safety angle-of-draw, are considered when mining near or under such facilities. Also, as part of TECO Coal’s reserve and mineability evaluation, TECO Coal reviews legal, economic and other technical factors. Final review and recoverable reserve determination is completed after a thorough analysis by in-house engineers, geologists and finance associates.
TECO GUATEMALA
TPS San José International, Inc., a subsidiary of TECO Guatemala, has a 100% ownership in a project entity, CGESJ, which owns approximately 152 acres in Masagua, Guatemala on which the 120 MW coal-fired San José Power Station is located. TPS Guatemala One, Inc., a subsidiary of TECO Guatemala, has a 96.06% interest in TCAE, which owns approximately 11 acres in Escuintla, Guatemala on which the 78 MW oil-fired Alborada Power Station is located. TPS Operaciones, a subsidiary of TECO Guatemala which provides operations, maintenance and administrative support to CGESJ and TCAE, owns approximately 43 acres in Masagua, Guatemala.
| Item 3. | LEGAL PROCEEDINGS. |
From time to time, TECO Energy and its subsidiaries are involved in various legal, tax and regulatory proceedings before various courts, regulatory commissions and governmental agencies in the ordinary course of its business. Where appropriate, accruals are made in accordance with accounting standards for contingencies to provide for matters that are probable of resulting in an estimable, material loss. While the outcome of such proceedings is uncertain, management does not believe that their ultimate resolution will have a material adverse effect on the company’s results of operations or financial condition.
For a discussion of the resolution of previously disclosed legal proceedings and an update of previously disclosed environmental matters, see Notes 12 and 8, Commitments and Contingencies, of the TECO Energy, Inc. and Tampa Electric Company Consolidated Financial Statements, respectively.
28
Table of Contents
| Item 4. | SUBMISSION OF MATTERS TO A VOTE OF SECURITY HOLDERS. |
No matter was submitted during the fourth quarter of 2009 to a vote of TECO Energy’s security holders, through the solicitation of proxies or otherwise.
EXECUTIVE OFFICERS OF THE REGISTRANT
The names, ages, current positions and principal occupations during the last five years of the current executive officers of TECO Energy are described below.
| Name |
Age | Current Positions and Principal Occupations During Last Five Years | ||
| Sherrill W. Hudson |
67 | Chairman of the Board and Chief Executive Officer, TECO Energy, Inc. and Tampa Electric Company, July 2004 to date. | ||
| Charles A. Attal, III |
50 | Senior Vice President-General Counsel and Chief Legal Officer, TECO Energy, Inc., and General Counsel of Tampa Electric Company, February 2009 to date; Vice President-General Counsel and Chief Legal Officer, TECO Energy, Inc. and General Counsel of Tampa Electric Company, July 2007 to February 2009; and prior thereto, Vice President and Deputy General Counsel, TECO Energy, Inc. | ||
| Phil L. Barringer |
56 | Vice President-Human Resources of TECO Energy, Inc. and Tampa Electric Company, July 2009 to date; President, TECO Guatemala, July 2009 to date; and prior thereto, Vice President-Controller, Operations of TECO Energy, Inc. and Chief Accounting Officer of Tampa Electric Company. | ||
| Deirdre A. Brown |
49 | Vice President-Business Strategy and Compliance and Chief Ethics and Compliance Officer, TECO Energy, Inc., July 2009 to date; Vice President-Regulatory Affairs of Tampa Electric Company and Vice President-Customer Service, Tampa Electric Division of Tampa Electric Company, April 2006 to July 2009; Vice President-Regulatory Affairs, Tampa Electric Company, April 2005-April 2006; and prior thereto, Vice-President-Regulatory Affairs, TECO Energy, Inc. | ||
| Sandra W. Callahan |
57 | Vice President-Finance and Accounting and Chief Financial Officer (Chief Accounting Officer), TECO Energy, Inc. and Tampa Electric Company, October 2009 to date; Vice President-Finance and Accounting and Chief Financial Officer (Treasurer and Chief Accounting Officer), TECO Energy, Inc. and Tampa Electric Company, July 2009 to October 2009; Vice President-Treasury and Risk Management (Treasurer and Chief Accounting Officer), TECO Energy, Inc., January 2007 to July 2009; Vice President-Treasury and Risk Management (Treasurer), TECO Energy, Inc., July 2000 to January 2007; Vice President-Treasurer and Assistant Secretary, Tampa Electric Company, April 2005 to July 2009. | ||
| Clinton E. Childress |
61 | Senior Vice President-Corporate Services and Chief Human Resources Officer, TECO Energy, Inc., October 2004 to date and Chief Human Resources Officer and Procurement Officer, Tampa Electric Company, September 2003 to date. | ||
| Gordon L. Gillette |
50 | President, Tampa Electric Company, July 2009 to date; Executive Vice President and Chief Financial Officer, TECO Energy, Inc., July 2004 to July 2009; President, TECO Guatemala, October 2004 to July 2009. | ||
| John B. Ramil |
54 | President and Chief Operating Officer, TECO Energy, Inc., July 2004 to date. | ||
| J. J. Shackleford |
63 | President of TECO Coal Corporation, since prior to 2005. | ||
There is no family relationship between any of the persons named above or between executive officers and any director of the company. The term of office of each officer extends to the meeting of the Board of Directors following the next annual meeting of shareholders, scheduled to be held on May 5, 2010, and until such officer’s successor is elected and qualified.
29
Table of Contents
PART II
| Item 5. | MARKET FOR REGISTRANT’S COMMON EQUITY, RELATED STOCKHOLDER MATTERS AND ISSUER PURCHASES OF EQUITY SECURITIES |
The following table shows the high and low sale prices for shares of TECO Energy common stock, which is listed on the New York Stock Exchange, and dividends paid per share, per quarter.
| 1st Quarter | 2nd Quarter | 3rd Quarter | 4th Quarter | |||||||||
| 2009 |
||||||||||||
| High |
$ | 12.97 | $ | 12.41 | $ | 14.64 | $ | 16.71 | ||||
| Low |
$ | 8.41 | $ | 10.28 | $ | 11.16 | $ | 13.45 | ||||
| Close |
$ | 11.15 | $ | 11.93 | $ | 14.08 | $ | 16.22 | ||||
| Dividend |
$ | 0.20 | $ | 0.20 | $ | 0.20 | $ | 0.20 | ||||
| 2008 |
||||||||||||
| High |
$ | 17.75 | $ | 21.99 | $ | 21.80 | $ | 16.05 | ||||
| Low |
$ | 14.48 | $ | 15.97 | $ | 15.36 | $ | 10.50 | ||||
| Close |
$ | 15.95 | $ | 21.49 | $ | 15.73 | $ | 12.35 | ||||
| Dividend |
$ | 0.195 | $ | 0.20 | $ | 0.20 | $ | 0.20 | ||||
The approximate number of shareholders of record of common stock of TECO Energy as of Feb. 22, 2010 was 14,655.
Dividends on TECO Energy’s common stock are declared and paid at the discretion of its Board of Directors. The primary sources of funds to pay dividends to its common shareholders are dividends and other distributions from its operating companies. TECO Energy’s $200 million credit facility contains a covenant that could limit the payment of dividends exceeding a calculated amount (initially $50 million) in any quarter under certain circumstances. Certain long-term debt at PGS contains restrictions that limit the payment of dividends and distributions on the common stock of Tampa Electric Company.
In addition, TECO Diversified, Inc., a wholly-owned subsidiary of TECO Energy and the holding company for TECO Coal, has a guarantee related to a coal supply agreement that limits the payment of dividends to its common shareholder, TECO Energy, but does not limit loans or advances.
See Liquidity, Capital Resources–Covenants in Financing Agreements section of MD&A, and Notes 6, 7 and 12 to the TECO Energy Consolidated Financial Statements for additional information regarding significant financial covenants.
All of Tampa Electric Company’s common stock is owned by TECO Energy, Inc. and, therefore, there is no market for the stock. Tampa Electric Company pays dividends on its common stock substantially equal to its net income. Such dividends totaled $179.6 million in 2009, $159.9 million in 2008, and $166.1 million in 2007. See the Restrictions on Dividend Payments and Transfer of Assets section in Note 1 to the Tampa Electric Company Consolidated Financial Statements for a description of restrictions on dividends on its common stock.
Set forth below is a table showing shares of TECO Energy common stock deemed repurchased by the issuer.
| (a) Total Number of Shares (or Units) Purchased (1) |
(b) Average Price Paid per Share (or Unit) |
(c) Total Number of Shares (or Units) Purchased as Part of Publicly Announced Plans or Programs |
(d) Maximum Number (or Approximate Dollar Value) of Shares (or Units) that May Yet Be Purchased Under the Plans or Programs | ||||||
| Oct. 1, 2009—Oct. 31, 2009 |
9,890 | $ | 14.18 | — | — | ||||
| Nov. 1, 2009—Nov. 30, 2009 |
8,243 | $ | 14.56 | — | — | ||||
| Dec. 1, 2009—Dec. 31, 2009 |
9,043 | $ | 16.54 | — | — | ||||
| Total 4th Quarter 2009 |
27,176 | $ | 15.08 | — | — | ||||
| (1) | These shares were not repurchased through a publicly announced plan or program, but rather relate to compensation or retirement plans of the company. Specifically, these shares represent shares delivered in satisfaction of the exercise price and/or tax withholding obligations by holders of stock options who exercised options (granted under TECO Energy’s incentive compensation plans), shares delivered or withheld (under the terms of grants under TECO Energy’s incentive compensation plans) to offset tax withholding obligations associated with the vesting of restricted shares and shares purchased by the TECO Energy Group Retirement Savings Plan pursuant to directions from plan participants or dividend reinvestment. |
30
Table of Contents
Shareholder Return Performance Graph
The following graph shows the cumulative total shareholder return on our common stock on a yearly basis over the five-year period ended Dec. 31, 2009, and compares this return with that of the S&P 500 Index and the S&P Multi Utility Index. The Graph assumes that the value of the investment in our common stock and each index was $100 on Dec. 31, 2004 and that all dividends were reinvested.
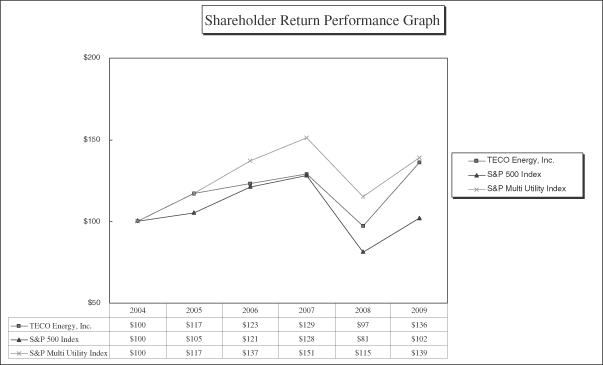
31
Table of Contents
| Item 6. | SELECTED FINANCIAL DATA OF TECO ENERGY, INC. |
| (millions, except per share amounts) Years ended Dec. 31, |
2009 | 2008 | 2007 | 2006 | 2005 | ||||||||||
| Revenues |
$ | 3,310.5 | $ | 3,375.3 | $ | 3,536.1 | $ | 3,448.1 | $ | 3,010.1 | |||||
| Net income from continuing operations |
$ | 213.9 | $ | 162.4 | $ | 316.7 | $ | 174.8 | $ | 123.9 | |||||
| Net income from discontinued operations (1) |
— | — | 14.3 | 1.9 | 63.5 | ||||||||||
| Net income attributable to TECO Energy |
$ | 213.9 | $ | 162.4 | $ | 413.2 | $ | 246.3 | $ | 274.5 | |||||
| Total assets |
$ | 7,219.5 | $ | 7,147.4 | $ | 6,765.2 | $ | 7,361.8 | $ | 7,170.1 | |||||
| Long-term debt |
$ | 3,309.5 | $ | 3,213.5 | $ | 3,158.4 | $ | 3,212.6 | $ | 3,709.2 | |||||
| Earnings per share (EPS)—basic; |
|||||||||||||||
| From continuing operations (1) |
$ | 1.00 | $ | 0.77 | $ | 1.90 | $ | 1.18 | $ | 1.02 | |||||
| From discontinued operations (1) |
— | — | 0.07 | 0.01 | 0.31 | ||||||||||
| EPS basic |
$ | 1.00 | $ | 0.77 | $ | 1.97 | $ | 1.19 | $ | 1.33 | |||||
| Earnings per share (EPS)—diluted; |
|||||||||||||||
| From continuing operations (1) |
$ | 1.00 | $ | 0.77 | $ | 1.89 | $ | 1.17 | $ | 1.00 | |||||
| From discontinued operations (1) |
— | — | 0.07 | 0.01 | 0.31 | ||||||||||
| EPS diluted |
$ | 1.00 | $ | 0.77 | $ | 1.96 | $ | 1.18 | $ | 1.31 | |||||
| Dividends declared per common share |
$ | 0.800 | $ | 0.795 | $ | 0.775 | $ | 0.760 | $ | 0.760 | |||||
| (1) | 2007 includes a $14.3 million gain on the 2005 sale of merchant power projects after reaching a favorable conclusion with taxing authorities. |
32
Table of Contents
| Item 7. | MANAGEMENT’S DISCUSSION AND ANALYSIS OF FINANCIAL CONDITIONS AND RESULTS OF OPERATIONS. |
This Management’s Discussion & Analysis contains forward-looking statements, which are subject to the inherent uncertainties in predicting future results and conditions. Actual results may differ materially from those forecasted. Such statements are based on our current expectations, and we do not undertake to update or revise such forward-looking statements, except as may be required by law. These forward-looking statements include references to our anticipated capital expenditures, liquidity and financing requirements, projected operating results, future environmental matters, and regulatory and other plans. Important factors that could cause actual results to differ materially from those projected in these forward-looking statements are discussed under “Risk Factors.”
TECO Energy, Inc. is a holding company, and all of its business is conducted through its subsidiaries. In this Management’s Discussion & Analysis, “we,” “our,” “ours” and “us” refer to TECO Energy, Inc. and its consolidated group of companies, unless the context otherwise requires.
OVERVIEW
We are an energy-related holding company with four businesses consisting of regulated electric and gas utility operations in Florida, Tampa Electric and Peoples Gas System (PGS), respectively; TECO Coal, which owns and operates coal production facilities in the Central Appalachian coal production region; and TECO Guatemala, which is engaged in electric power generation and distribution and energy-related businesses in Guatemala.
Our regulated utility companies, Tampa Electric and PGS, operate in the Florida market. Tampa Electric serves almost 667,000 retail customers in a 2,000 square mile service area in West Central Florida and has electric generating plants with a winter peak generating capacity of 4,719 megawatts. PGS, Florida’s largest gas distribution utility, serves more than 334,000 residential, commercial, industrial and electric power generating customers in all of the major metropolitan areas of the state, with a total natural gas throughput of more than 1.4 billion therms in 2009.
We also have two unregulated companies. TECO Coal, through its subsidiaries, operates surface and underground mines and related coal processing facilities in eastern Kentucky and southwestern Virginia, producing metallurgical-grade and high-quality steam coals. Sales in 2009 were 8.7 million tons. TECO Guatemala, through its subsidiaries, owns a coal-fired generating facility and has a 96% ownership interest in an oil-fired peaking power generating plant, both under long-term contracts with a regulated distribution utility in Guatemala. It also has a 24% ownership interest in Guatemala’s largest distribution utility, Empresa Eléctrica de Guatemala (EEGSA), and in affiliated companies (in combination called DECA II), which provide, among other things, electricity transmission services, wholesale power sales to unregulated electric customers and engineering services.
In December 2007, we sold TECO Transport, a dry-bulk shipping company that had been a part of our business mix for many years. We used the cash from this sale to further our most important cash priorities, investing in our Florida utilities and reducing parent company debt. The sale of TECO Transport allowed us to accelerate the retirement of parent debt, improve our balance sheet and credit ratings and reduce our business risk profile.
We have reduced parent and parent-guaranteed debt from a peak level of $2.7 billion in 2002 to $1.3 billion at the end of 2009. This debt was incurred in connection with a series of major investments in unregulated domestic power generation facilities outside Florida in anticipation of a movement toward competitive energy. The investments were ultimately unsuccessful and resulted in substantial losses when we exited this business segment in 2004 and 2005.
2009 PERFORMANCE
All amounts included in this Management’s Discussion & Analysis are after tax, unless otherwise noted.
In 2009, our net income and earnings per share attributable to TECO Energy were $213.9 million or $1.00 per share, compared to $162.4 million or $0.77 per share in 2008. Net income in 2009 included $15.8 million of restructuring charges, a $5.2 million write-off of project development costs at Tampa Electric, primarily related to the Polk Unit 6 IGCC plant, a $3.8 million loss on student loan securities held at TECO Energy, and an $8.7 million net gain on the sale of TECO Guatemala’s 16.5% interest in the Central American fiber optic telecommunications provider, Navega.
Our non-GAAP results in 2009, which exclude the charges and gains discussed above, were $1.08 on a per share basis, compared to $0.87 in 2008 (see the 2009 and 2008 Reconciliation of GAAP net income from continuing operations to non-GAAP results tables). Our results in 2009 reflect the benefits of higher base rates at Tampa Electric and PGS effective in 2009, and improved margins at TECO Coal as a result of higher selling prices. At TECO Guatemala, results reflect the impact of extended unplanned outages at the San José Power Station in the first half of 2009, the negative impact of lower Value Added
33
Table of Contents
Distribution (VAD) tariffs at EEGSA, the Guatemalan distribution utility, and lower net income from the unregulated affiliated companies due to the sale of Navega in the first quarter (see the TECO Guatemala section).
In 2008, our net income and earnings per share attributable to TECO Energy were $162.4 million or $0.77 per share, compared to $413.2 million or $1.97 per share in 2007. Net income in 2008 included a $21.6 million provision for taxes due to the repatriation of cash and investments from Guatemala, a $1.9 million charge associated with a regulatory settlement with the Florida Public Service Commission (FPSC) related to a dispute that arose in 2008 over the calculation of Tampa Electric’s waterborne transportation disallowance over its five-year life, and $2.6 million of favorable adjustments to income taxes and working capital related to the sale of TECO Transport.
Our non-GAAP results in 2008, which exclude the charges and gains discussed above, on a per share basis were $0.87 per share, compared to $1.07 in 2007, which excluded charges, gains and the benefits from the production of synthetic fuel (see the 2008 and 2007 Reconciliation of GAAP net income from continuing operations to non-GAAP results tables). Our results in 2008 reflected the impact on Tampa Electric of lower customer and energy sales growth, and the impact on TECO Coal of higher production costs. Performance in 2008 benefited from improved results at PGS and TECO Guatemala (excluding the taxes on the repatriation of cash and investments), and lower parent interest expense as a result of our debt retirement actions.
Net income attributable to TECO Energy in 2007 included the $149.4 million gain from the sale of TECO Transport, $16.3 million of costs related to the sale of TECO Transport, and $20.2 million of charges related to debt extinguishment/exchange transactions. TECO Transport and the production of synthetic fuel contributed $34.0 million and $52.6 million, respectively, or $0.41 per share collectively, to 2007 net income. In 2007, net income reflected a $14.3 million tax benefit recorded in discontinued operations related to the 2005 disposition of the Union and Gila River merchant power plants.
In 2009, we focused on concluding the base rate proceedings at both utilities and completion of peaking generation capacity additions and rail unloading facilities at Tampa Electric. In July 2009, we announced restructuring actions as part of our response to the lower customer and energy sales growth in the current economic downturn, industry changes, and the overall need to maintain a lean and efficient organization. We restructured the organization to establish a single management team over the electric and gas divisions of Tampa Electric Company, and integrated operating and support functions. These actions have reduced our expected 2010 operations and maintenance expenses to slightly above 2008 levels, and are expected to largely offset the effects of lower growth than expected at the time of the base rate filing.
We remain focused on supporting the growth of Tampa Electric and strengthening its capital structure through equity contributions from TECO Energy to Tampa Electric. Tampa Electric has ongoing capital requirements associated with reliably and efficiently serving its customer base. To accomplish our objectives of supporting Tampa Electric’s growth and reducing parent debt, in 2007 we completed the sale of TECO Transport for $405 million of gross proceeds. The sale allowed us to accelerate the retirement in 2007 of almost $300 million of parent debt and $111 million of parent-guaranteed debt. The accelerated debt retirement allowed us to deploy cash generated in 2008 to investment in Tampa Electric that otherwise would have been applied to debt reduction.
OUTLOOK
We remain focused on our long-term goal of investing in and growing our Florida utility businesses, while generating cash and earnings from our other energy-related businesses, TECO Coal and TECO Guatemala. Continued reduction of parent debt that remains from the unsuccessful merchant power investments made early in the last decade remains a priority as well.
Important factors in our 2010 results will be the individual operating company factors discussed below.
Tampa Electric and PGS are under a single management team with new organizational structures following the restructuring actions taken in the third quarter of 2009. These actions have reduced expected operations and maintenance expenses, excluding all FPSC approved recovery clauses, in 2010 to approximately 2008 levels to offset the approximately $40 million revenue shortfall that resulted from lower customer and energy sales growth than projected in their base rate cases. These actions are expected to enable the utilities to earn the authorized returns on equity set in their 2009 rate case decisions.
Tampa Electric and PGS will have the full year benefit of the new base rates approved by the FPSC in 2009, and, effective Jan. 1, 2010, $25.7 million of rates approved in 2009 related to the five combustion turbines and the rail unloading facilities placed in service in 2009. The 2010 portion of the base rate revenues effective Jan. 1, 2010 are subject to refund pending the outcome of a hearing to be held by the FPSC in 2010 (see the Regulatory section).
The forecast for Tampa Electric and PGS assumes normal weather for the full year. The outlook and timing for a Florida economic recovery remains uncertain due to high unemployment and a weak housing market. Some economists are forecasting a very slow recovery starting about the middle of 2010, while others are forecasting a flat economy for 2010. The forecast used by Tampa Electric and PGS assumes no recovery in customer growth in 2010 and a slight decline in energy sales due to lower
34
Table of Contents
customer usage in response to the continued weak economy. The Florida housing market is not expected to start to recover until after a general economic recovery begins. Until the economy and housing markets start to improve, it is difficult to forecast when customer and related energy sales growth will resume.
Excluding all FPSC approved recovery clauses, Tampa Electric’s non-fuel operation and maintenance expense is expected to decrease in 2010 compared to 2009 as a result of the restructuring actions taken in 2009. Depreciation expense is expected to increase from additions to facilities to serve customers; and interest expense is expected to increase due to higher long-term debt balances associated with the construction program. Environmental Cost Recovery Clause-related earnings are expected to increase due to the completion of the fourth, and final, nitrogen oxide (NOx) control project, which is expected to enter service in May. Allowance for Funds Used During Construction (AFUDC) is expected to decrease significantly in 2010 due to the 2009 completion of the peaking generation units and the 2010 completion of the NOx control projects. In November 2009, the FPSC approved Tampa Electric’s fuel cost recovery filing, which included full recovery of waterborne and rail transportation costs for the delivery of solid fuel.
In 2010, customer and therm sales growth at PGS will be impacted by the uncertain timing of economic and housing market recoveries. Excluding all FPSC-approved cost recovery clause-related expenses, operation and maintenance expense is expected to decrease in 2010. Depreciation expense is expected to increase due to normal additions to facilities to serve customers.
TECO Coal expects 2010 net income to increase over 2009 from higher contract selling prices. Total sales are expected to be in a range between 8.3 and 8.7 million tons in 2010, compared to 8.7 million tons in 2009. This lower level of expected production is in response to the current world-wide market conditions for steam and metallurgical coal. The full expected sales of all products are currently contracted at an average selling price of approximately $75 per ton. In 2010, the sales mix is expected to be closer to historical averages of one-third specialty coals (metallurgical, pulverized coal injection (PCI) and stoker) and two-thirds utility steam coal. The fully-loaded, all-in cost of production is expected to be in a range between $65 and $69 per ton driven by lower diesel fuel costs offset by higher safety requirements, productivity that reflects the industry-wide trend of increased inspections by state and federal agencies, and higher royalty costs and severance taxes due to the higher selling prices. Diesel fuel prices have been hedged for those contracts that do not have diesel price adjustments in the contract at average prices significantly below 2009 hedged levels.
TECO Guatemala expects improved operating and financial performance at the San José Power Station following the extended unplanned outages in 2009, and higher contract capacity payments, which are expected to increase as the 12-month rolling average capacity factor improves. Due to the unplanned outages in 2009, the 12-month rolling average contract availability for San José Power Station fell below the required level, which caused the capacity payments to be reduced. Spot energy sales are expected to increase due to higher residual (#6 oil) oil prices, which is the fuel used by other generators. The dispatch price for some of the diesel generating resources in Guatemala, which use residual fuel oil, is above the dispatch price for the San José Power Station, which includes the cost of coal plus a non-fuel variable cost component. TECO Guatemala is currently in talks with the Guatemalan regulatory authorities regarding the five-year extension of the power sales contract for the Alborada Power Station, which expires in September 2010. In August 2008, the Guatemalan regulatory body, CNEE, unilaterally reduced the distribution tariff (VAD) for EEGSA. TECO Guatemala Holdings, LLC has served a Notice of Intent under the Dominican-Republic-Central America-United States Free Trade Agreement (DR-CAFTA) indicating its intent to file an arbitration claim against the Republic of Guatemala for damages to its EEGSA partnership interest as a result of the VAD decision. There have been hearings in the Guatemalan courts on EEGSA’s actions, which have been resolved against EEGSA, and Iberdrola, EEGSA’s largest investor, is in an international arbitration process under the bilateral trade agreement between Spain and Guatemala, but the issue with the VAD remains unresolved with no firm schedule to resolve this matter (see the TECO Guatemala section). The 2010 outlook for TECO Guatemala assumes that the VAD issue remains unresolved.
These forecasts are based on our current assumptions described in each operating company discussion, which are subject to risks and uncertainties (see the Risk Factors section).
Our priorities for the use of cash remain investment in the utility companies and reduction of parent debt. We expect to make additional equity contributions to Tampa Electric and PGS in 2010 to support their capital spending programs.
Capital expenditures increased in 2009, primarily at Tampa Electric for equipment to control NOx emissions, peak load generating capacity expansion, installation of rail coal unloading facilities, compliance with the FPSC-mandated transmission and distribution system storm hardening requirements, distribution system reliability improvement, and heat rate and capacity factor improvements to our coal-fired units. We also invested in new mining equipment and continued development of mines at TECO Coal. We forecast capital expenditures of $305 million in 2010 at Tampa Electric and to remain at about that level for the next several years. This level of capital spending will allow Tampa Electric to meet generation plant maintenance and the expected resumption of customer growth. It will also allow for distribution system improvements to provide higher reliability and for expansion of its transmission system. We also plan to invest in modest distribution system expansion at PGS, and normal maintenance capital and regulatory compliance at TECO Coal in 2010 (see the Liquidity, Capital Resources section). Due to the slow down in the Florida economy in 2008 and 2009 and a lower near-term growth outlook, this forecast excludes any base load generating capacity additions, which were previously forecasted for the 2013 period. It also excludes any amounts for investments in renewable energy sources, which could be required under certain legislative proposals at the state and federal levels.
35
Table of Contents
RESULTS SUMMARY
Since July 2006, we have provided two measures to allow comparison of our results with and without synthetic fuel. They are non-GAAP results from continuing operations including benefits from the production of synthetic fuel (Non-GAAP Results With Synthetic Fuel), which exclude certain charges and gains, but include synthetic fuel benefits or costs, and non-GAAP results excluding synthetic fuel (Non-GAAP Results Excluding Synthetic Fuel), which exclude charges, gains and benefits associated with the production of synthetic fuel (see the Non-GAAP Information section). Although, with the expiration of the synthetic fuel tax credits at the end of 2007, we no longer produce synthetic fuel, we are continuing to provide both non-GAAP measures for historical comparison purposes.
The table below compares our GAAP net income to our non-GAAP measures. A reconciliation between GAAP net income and the two non-GAAP measures is contained in the Reconciliation of GAAP net income from continuing operations to non-GAAP results tables included for each year. A non-GAAP financial measure is a numerical measure that includes or excludes amounts, or is subject to adjustments that have the effect of including or excluding amounts, that are excluded or included from the most directly comparable GAAP measure (see the Non-GAAP Information section).
Results Comparisons
| (millions) |
2009 | 2008 | 2007 | ||||||
| Net income attributable to TECO Energy |
$ | 213.9 | $ | 162.4 | $ | 413.2 | |||
| Net income attributable to TECO Energy before discontinued operations |
$ | 213.9 | $ | 162.4 | $ | 398.9 | |||
| Non-GAAP results with synthetic fuel |
$ | 230.0 | $ | 183.3 | $ | 276.3 | |||
| Non-GAAP results excluding synthetic fuel |
$ | 230.0 | $ | 183.3 | $ | 223.7 | |||
In 2009, net income and earnings per share attributable to TECO Energy were $213.9 or $1.00 per share compared to $162.4 million or $0.77 per share in 2008. In 2007, net income and earnings per share attributable to TECO Energy were $413.2 million or $1.97 per share, which included the gain on the December 2007 sale of TECO Transport. Our non-GAAP results in 2009, which exclude charges and gains, were $230.0 million, or $1.08 on a per share basis, compared to our 2008 non-GAAP results of $183.3 million, or $0.87 on a per share basis. Non-GAAP results in 2007 were $223.7 million or $1.07 on a per-share basis (see the 2009 and 2008 Reconciliation of GAAP net income from continuing operations to non-GAAP results tables). TECO Transport and the production of synthetic fuel contributed $34.0 million and $52.6 million, respectively, or $0.41 per share collectively, to 2007 net income. Compared to 2008, our results in 2009 reflected higher earnings at both of the regulated utilities, Tampa Electric and PGS, and at TECO Coal and lower earnings from TECO Guatemala. In 2009, our net income and earnings per share were reduced by a net $16.1 million, or $0.08 per share, of charges and gains, primarily related to restructuring actions and the write-off of project development costs at Tampa Electric. In 2008 our net income and earnings per share were reduced by $21.6 million and $0.10 per share, respectively, for income taxes related to the repatriation of cash and investments from TECO Guatemala, of which $9.6 million was recognized by TECO Guatemala and $12.0 million by TECO Energy parent.
For 2007, as a result of the sale transaction, results at TECO Transport were included only through Dec. 3, 2007. Net income and earnings per share were $413.2 million or $1.97 per share in 2007, and included the $149.4 million gain and the $16.3 million of costs related to the sale of TECO Transport, and $20.2 million of charges related to the debt extinguishment/exchange transactions completed in December. Net income and earnings per share attributable to TECO Energy before discontinued operations were $316.7 million or $1.51 per share in 2007, and reflected a $14.3 million tax benefit recorded in discontinued operations in the second quarter as a result of reaching a favorable conclusion with taxing authorities related to the 2005 disposition of the Union and Gila River merchant power plants. TECO Transport was not classified as a discontinued operation due to its ongoing contractual relationship with Tampa Electric for solid fuel waterborne transportation services.
Results in 2007 included a $52.6 million, or $0.25 per share, benefit to earnings from synthetic fuel production (see the TECO Coal section).
36
Table of Contents
2009 Earnings Summary
| (millions) Except per-share amounts |
2009 | 2008 | 2007 | |||||||
| Consolidated revenues |
$ | 3,310.5 | $ | 3,375.3 | $ | 3,536.1 | ||||
| Earnings per share—basic |
||||||||||
| Earnings per share attributable to TECO Energy |
$ | 1.00 | $ | 0.77 | $ | 1.97 | ||||
| Discontinued operations |
— | — | 0.07 | |||||||
| Earnings per share attributable to TECO Energy before discontinued operations |
$ | 1.00 | $ | 0.77 | $ | 1.90 | ||||
| Earnings per share—diluted |
||||||||||
| Earnings per share attributable to TECO Energy |
$ | 1.00 | $ | 0.77 | $ | 1.96 | ||||
| Discontinued operations |
— | — | 0.07 | |||||||
| Earnings per share attributable to TECO Energy before discontinued operations |
$ | 1.00 | $ | 0.77 | $ | 1.89 | ||||
| Net income attributable to TECO Energy |
$ | 213.9 | $ | 162.4 | $ | 413.2 | ||||
| Net income from discontinued operations |
— | — | (14.3 | ) | ||||||
| Charges and (gains) from continuing operations (1) |
16.1 | 20.9 | (122.6 | ) | ||||||
| Non-GAAP results with synthetic fuel (2) |
230.0 | 183.3 | 276.3 | |||||||
| Synthetic fuel impact (1) |
— | — | (52.6 | ) | ||||||
| Non-GAAP results excluding synthetic fuel (2) |
$ | 230.0 | $ | 183.3 | $ | 223.7 | ||||
| Average common shares outstanding |
||||||||||
| Basic |
211.8 | 210.6 | 209.1 | |||||||
| Diluted |
213.1 | 211.4 | 209.9 | |||||||
| (1) | See the GAAP to non-GAAP reconciliation tables that follow. |
| (2) | A non-GAAP financial measure is a numerical measure that includes or excludes amounts, or is subject to adjustments that have the effect of including or excluding amounts, that are included or excluded from the most directly comparable GAAP measure (see the Non-GAAP Information section). |
The following tables show the specific adjustments made to GAAP net income for each segment to develop our non-GAAP results:
2009 Reconciliation of GAAP net income from continuing operations to non-GAAP results
| Net income impact (millions) |
Tampa Electric |
PGS | TECO Coal |
TECO Guatemala |
Parent/ Other |
Total | |||||||||||||||
| GAAP Net income attributable to TECO Energy |
$ | 160.2 | $ | 31.9 | $ | 37.2 | $ | 38.6 | $ | (54.0 | ) | $ | 213.9 | ||||||||
| Restructuring charges |
11.3 | 2.9 | — | — | 1.6 | 15.8 | |||||||||||||||
| Project development cost write-off |
5.2 | — | — | — | — | 5.2 | |||||||||||||||
| Gain on the sale of Navega |
— | — | — | (8.7 | ) | — | (8.7 | ) | |||||||||||||
| Charge related to student loan securities |
— | — | — | — | 3.8 | 3.8 | |||||||||||||||
| Total charges and (gains) |
16.5 | 2.9 | — | (8.7 | ) | 5.4 | 16.1 | ||||||||||||||
| Non-GAAP results |
$ | 176.7 | $ | 34.8 | $ | 37.2 | $ | 29.9 | $ | (48.6 | ) | $ | 230.0 | ||||||||
2008 Reconciliation of GAAP net income from continuing operations to non-GAAP results
| Net income impact (millions) |
Tampa Electric |
PGS | TECO Coal |
TECO Guatemala |
Parent/ Other |
Total | ||||||||||||||
| GAAP Net income attributable to TECO Energy |
$ | 135.6 | $ | 27.1 | $ | 18.0 | $ | 36.9 | $ | (55.2 | ) | $ | 162.4 | |||||||
| Waterborne transportation dispute settlement |
1.9 | — | — | — | — | 1.9 | ||||||||||||||
| Final adjustments associated with the sale of TECO Transport recorded at Parent |
— | — | — | — | (2.6 | ) | (2.6 | ) | ||||||||||||
| Taxes on repatriation of cash and investments from Guatemala |
— | — | — | 9.6 | 12.0 | 21.6 | ||||||||||||||
| Total charges and (gains) |
1.9 | — | — | 9.6 | 9.4 | 20.9 | ||||||||||||||
| Non-GAAP results |
$ | 137.5 | $ | 27.1 | $ | 18.0 | $ | 46.5 | $ | (45.8 | ) | $ | 183.3 | |||||||
37
Table of Contents
2007 Reconciliation of GAAP net income from continuing operations to non-GAAP results
| Net income impact (millions) |
Tampa Electric |
PGS | TECO Coal |
TECO Transport (1) |
TECO Guatemala |
Parent/ Other |
Total | ||||||||||||||||||
| GAAP Net income attributable to TECO Energy before discontinued operations |
$ | 150.3 | $ | 26.5 | $ | 90.9 | $ | 34.0 | $ | 44.7 | $ | 52.5 | $ | 398.9 | |||||||||||
| Gain on sale of TECO Transport |
— | — | — | — | — | (149.4 | ) | (149.4 | ) | ||||||||||||||||
| Asset held for sale—depreciation |
— | — | — | (9.7 | ) | — | — | (9.7 | ) | ||||||||||||||||
| Costs associated with the sale of TECO Transport recorded at Parent |
— | — | — | — | — | 16.3 | 16.3 | ||||||||||||||||||
| Debt extinguishment/exchange |
— | — | — | — | — | 20.2 | 20.2 | ||||||||||||||||||
| Total charges and (gains) |
— | — | — | (9.7 | ) | — | (112.9 | ) | (122.6 | ) | |||||||||||||||
| Non-GAAP results with synthetic fuel (1) |
150.3 | 26.5 | 90.9 | 24.3 | 44.7 | (60.4 | ) | 276.3 | |||||||||||||||||
| Synthetic fuel impact |
— | — | (52.6 | ) | — | — | — | (52.6 | ) | ||||||||||||||||
| Non-GAAP results excluding synthetic fuel * |
$ | 150.3 | $ | 26.5 | $ | 38.3 | $ | 24.3 | $ | 44.7 | $ | (60.4 | ) | $ | 223.7 | ||||||||||
| (1) | Results for TECO Transport include activity through Dec. 3, 2007. |
NON-GAAP INFORMATION
From time to time, in this Management’s Discussion & Analysis of Financial Condition and Results of Operations, we provide non-GAAP results, which present financial results after elimination of the effects of certain identified gains and charges. We believe that the presentation of this non-GAAP financial performance provides investors a measure that reflects the company’s operations under our business strategy. We also believe that it is helpful to present a non-GAAP measure of performance that clearly reflects the ongoing operations of our business and allows investors to better understand and evaluate the business as it is expected to operate in future periods. Management and the Board of Directors use this non-GAAP presentation as a yardstick for measuring our performance, making decisions that are dependent upon the profitability of our various operating units and in determining levels of incentive compensation.
The non-GAAP measure of financial performance we use is not a measure of performance under accounting principles generally accepted in the United States and should not be considered an alternative to net income or other GAAP figures as an indicator of our financial performance or liquidity. Our non-GAAP presentation of results may not be comparable to similarly titled measures used by other companies.
While none of the particular excluded items is expected to recur, there may be adjustments to previously estimated gains or losses related to the disposition of assets or additional debt extinguishment activities. We recognize that there may be items that could be excluded in the future. Even though charges may occur, we believe the non-GAAP measure is important in addition to GAAP net income for assessing our potential future performance, because excluded items are limited to those that we believe are not indicative of future performance.
OPERATING RESULTS
This Management’s Discussion & Analysis of Financial Condition and Results of Operations utilizes TECO Energy’s consolidated financial statements, which have been prepared in accordance with GAAP, and separate non-GAAP measures to analyze the financial condition of the company. Our reported operating results are affected by a number of critical accounting estimates such as those involved in our accounting for regulated activities, asset impairment testing and others (see the Critical Accounting Policies and Estimates section).
38
Table of Contents
The following table shows the segment revenues, net income and earnings per share contributions from continuing operations of our business segments on a GAAP basis (see Note 14 to the TECO Energy Consolidated Financial Statements).
| (millions) Except per share amounts |
2009 | 2008 | 2007 | ||||||||||
| Segment revenues (1) |
|||||||||||||
| Regulated companies |
Tampa Electric | $ | 2,194.8 | $ | 2,091.2 | $ | 2,188.4 | ||||||
| Peoples Gas | 470.8 | 688.4 | 599.7 | ||||||||||
| Total regulated |
$ | 2,665.6 | $ | 2,779.6 | $ | 2,788.1 | |||||||
| Unregulated companies |
TECO Coal | $ | 653.0 | $ | 588.4 | $ | 544.5 | ||||||
| TECO Guatemala (3) | 8.3 | 8.4 | 8.0 | ||||||||||
| TECO Transport (2) | — | — | 290.3 | ||||||||||
| Total unregulated |
$ | 661.3 | $ | 596.8 | $ | 842.8 | |||||||
| Net income (4) |
|||||||||||||
| Regulated companies |
Tampa Electric | $ | 160.2 | $ | 135.6 | $ | 150.3 | ||||||
| Peoples Gas | 31.9 | 27.1 | 26.5 | ||||||||||
| Total regulated |
192.1 | 162.7 | 176.8 | ||||||||||
| Unregulated companies |
TECO Coal | 37.2 | 18.0 | 90.9 | |||||||||
| TECO Guatemala | 38.6 | 36.9 | 44.7 | ||||||||||
| TECO Transport (2)(5) | — | — | 34.0 | ||||||||||
| Total unregulated |
75.8 | 54.9 | 169.6 | ||||||||||
| Parent/other |
(54.0 | ) | (55.2 | ) | 52.5 | ||||||||
| Net income attributable to TECO Energy before discontinued operations |
213.9 | 162.4 | 398.9 | ||||||||||
| Discontinued operations |
— | — | 14.3 | ||||||||||
| Net income attributable to TECO Energy |
$ | 213.9 | $ | 162.4 | $ | 413.2 | |||||||
| Earnings per share—basic (6) |
|||||||||||||
| Regulated companies |
Tampa Electric | $ | 0.76 | $ | 0.64 | $ | 0.72 | ||||||
| Peoples Gas | 0.15 | 0.13 | 0.13 | ||||||||||
| Total regulated |
0.91 | 0.77 | 0.85 | ||||||||||
| Unregulated companies |
TECO Coal | 0.17 | 0.08 | 0.44 | |||||||||
| TECO Guatemala | 0.18 | 0.18 | 0.21 | ||||||||||
| TECO Transport (2)(5) | — | — | 0.16 | ||||||||||
| Total unregulated |
0.35 | 0.26 | 0.81 | ||||||||||
| Parent/other |
(0.26 | ) | (0.26 | ) | 0.24 | ||||||||
| Earnings attributable to TECO Energy before discontinued operations |
1.00 | 0.77 | 1.90 | ||||||||||
| Discontinued operations |
— | — | 0.07 | ||||||||||
| EPS Total |
$ | 1.00 | $ | 0.77 | $ | 1.97 | |||||||
| Average shares outstanding—basic |
211.8 | 210.6 | 209.1 | ||||||||||
| (1) | Segment revenues include intercompany transactions that are eliminated in the preparation of TECO Energy’s consolidated financial statements. |
| (2) | 2007 results for TECO Transport reflect activities through Dec. 3, 2007. |
| (3) | Guatemalan entities CGESJ (San José) and TCAE (Alborada) were deconsolidated under accounting standards for variable interest entities. |
| (4) | Segment net income and earnings are reported on a basis that includes internally allocated financing costs to the non-utility companies. Internally allocated finance costs for 2009 were 7.25% for January through August and 7.15% for September through December. Internally allocated finance costs in 2008 and 2007 were at pretax rates of 7.25% and 7.5%, respectively, based on the average investment in each unregulated subsidiary. |
| (5) | Results at TECO Transport reflect the $9.7 million benefit in depreciation expense from not recording depreciation expense due to its classification as Assets Held for Sale effective Apr. 1, 2007 through Dec. 3, 2007. |
| (6) | The number of shares used in the earnings-per-share calculations is basic shares. |
TAMPA ELECTRIC
Electric Operations Results
Net income in 2009 was $160.2 million, compared to $135.6 million in 2008. Tampa Electric’s full-year non-GAAP results were $176.7 million, which excluded $11.3 million of restructuring charges and the $5.2 million write-off of project development costs primarily related to the Polk Unit 6 IGCC plant, compared to non-GAAP results of $137.5 million in 2008, which excluded the $1.9 million waterborne transportation settlement (see the 2009 and 2008 Reconciliation of GAAP net income from continuing operations to non-GAAP results table).
39
Table of Contents
Pretax base revenues increased approximately $72 million in 2009 from the higher base rates approved by the FPSC for Tampa Electric effective May 7, 2009. In the 2009 full-year period, there was no reduction in net income due to the waterborne transportation disallowance for the transportation of solid fuel, compared to an $8.9 million reduction in the 2008 period.
The higher 2009 base revenues were partially offset by lower retail energy sales and higher operations and maintenance, depreciation, property tax and interest expense. Results reflect 1.1% lower retail energy sales in 2009, primarily due to lower sales to commercial and industrial customers as a result of the weak Florida economy, and voluntary conservation by residential customers, which we believe was in response to the generally weaker economic conditions. Off-system sales declined due to lower state-wide demand. Total heating and cooling degree days were 4% above normal and 10% above 2008 levels. The average number of retail customers decreased 0.1% for the year.
In 2009, excluding all FPSC-approved cost recovery clause-related expenses, restructuring charges and the Polk 6 write-off, operations and maintenance expense increased $8.7 million, compared to 2008, primarily due to $2.1 million higher spending on generating unit maintenance and repairs, $1.7 million higher expenses to operate the distribution system, $3.0 million higher employee-related expenses, and $0.4 million higher bad debt expense. These increases were partially offset by savings in salaries and other benefits as a result of the restructuring actions taken in 2009. Depreciation and amortization expense increased $9.1 million reflecting additional facilities to serve customers. Interest expense increased due to higher long-term debt balances, and interest income decreased due to lower interest rates on lower under-recovered fuel balances. Net income also included $9.3 million of AFUDC-equity related to the construction of the peaking generation units, rail coal unloading facilities and the installation of NOx pollution control equipment, compared to $6.3 million in 2008.
In 2008, net income was $135.6 million, compared to $150.3 million in 2007. Tampa Electric’s 2008 non-GAAP results were $137.5 million, which excluded a $1.9 million charge related to the settlement with the FPSC related to a dispute that arose in 2008 over the calculation of Tampa Electric’s waterborne transportation disallowance over its five-year life (see the 2008 Reconciliation of GAAP net income from continuing operations to non-GAAP results table). These results were driven primarily by lower retail energy sales, higher depreciation, lower interest income and higher interest expense, partially offset by higher earnings on emissions control equipment recovered through the Environmental Cost Recovery Clause (ECRC) (see the Environmental Compliance section), and slightly lower operation and maintenance and property tax expense. These results reflect retail energy sales 2.8% lower than in 2007. The average number of retail customers increased 0.1% for the year, which was significantly lower than in prior years, as a result of the slowdown in the Florida economy and housing market. Total heating and cooling degree days were 5% below normal and 8% below 2007 levels.
In 2008, excluding all FPSC-approved cost recovery clause-related expenses, operation and maintenance expense decreased $0.8 million, compared to 2007, primarily due to $4.0 million higher spending on generating unit maintenance and repairs and $0.8 million higher bad-debt expense, more than offset by $4.2 million lower employee-related expenses and other smaller cost reductions totaling $0.6 million in aggregate. Property tax expense decreased $0.7 million reflecting adjustments to property valuations agreed to with taxing authorities. Depreciation and amortization expense increased $4.3 million reflecting additional facilities to serve customers. Interest expense increased $1.5 million due to higher interest rates, and interest income decreased $2.9 million due to lower under-recovered fuel balances. Net income also included $6.3 million of AFUDC-equity related to the construction of the peaking generation units and the installation of NOx pollution control equipment, compared to $4.5 million in 2007.
Base Rates
Because of lower customer growth, slower energy sales growth, and ongoing high levels of capital investment, Tampa Electric’s 13-month average regulatory ROE was 8.7% at the end of 2008, and 9.2% at the end of 2009. We made cash equity contributions totaling $292 million to Tampa Electric to strengthen its capital structure and to support its capital program in 2008.
Due to the significant decline in ROE, Tampa Electric filed for a $228 million base rate increase in August 2008. In March 2009, the FPSC awarded a $104 million higher revenue requirements effective in May 2009 that authorized an ROE mid-point of 11.25%, 54.0% equity in the capital structure, and 2009 13-month average rate base of $3.4 billion. A component of that decision was a $34 million 2010 base rate increase associated with the five peaking combustion turbines (CTs) and the solid-fuel rail unloading facilities at the Big Bend Power Station scheduled to enter service before the end of 2009.
In July, in response to a motion for reconsideration, the FPSC determined that adjustments to the capital structure used to calculate the new rates should have been calculated over all sources of capital rather than only investor sources. This change resulted in $9.3 million higher revenue requirements in 2009. At the same time the FPSC voted to reject the intervenors’ joint motion requesting reconsideration of the 2010 portion of base rates approved in 2009.
In September 2009, the intervenors filed a joint appeal to the Florida Supreme Court related to the FPSC’s decision to reject their motion for reconsideration of the 2010 portion of base rates approved in 2009. The FPSC and Tampa Electric will oppose this appeal. The intervenors filed appellate briefs on Feb. 24, 2010. There is no specific time frame for a resolution.
40
Table of Contents
In December 2009, the FPSC approved Tampa Electric’s petition requesting that the proposed rates to support the CTs and rail unloading facilities be put into effect Jan. 1, 2010. At that time, the FPSC determined that, based on its staff audit of the actual costs incurred, the 2010 portion of the base rates approved in 2009 should be reduced by $8.3 million to $25.7 million, subject to refund. A regulatory proceeding will be held during 2010 regarding the continuing need for the CTs, the appropriate amount to be recovered and the resulting rates. Pending final FPSC approval, the hearing is tentatively set for the first week of September.
Summary of Operating Results
| (millions) |
2009 | % Change | 2008 | % Change | 2007 | ||||||||||
| Revenues |
$ | 2,194.8 | 5.0 | $ | 2,091.2 | (4.4 | ) | $ | 2,188.4 | ||||||
| Other operating expenses |
244.7 | 17.8 | 207.7 | (0.3 | ) | 208.4 | |||||||||
| Maintenance |
123.4 | 6.2 | 116.2 | 6.3 | 109.3 | ||||||||||
| Depreciation |
200.4 | 8.0 | 185.6 | 3.9 | 178.6 | ||||||||||
| Taxes, other than income |
144.9 | 6.2 | 136.5 | (2.8 | ) | 140.4 | |||||||||
| Restructuring costs |
18.4 | — | — | — | — | ||||||||||
| Non-fuel operating expenses |
731.8 | 13.3 | 646.0 | 1.5 | 636.7 | ||||||||||
| Fuel |
923.3 | 12.7 | 819.4 | (13.6 | ) | 947.9 | |||||||||
| Purchased power |
177.6 | (41.8 | ) | 305.4 | 12.3 | 271.9 | |||||||||
| Total fuel expense |
1,100.9 | (2.1 | ) | 1,124.8 | (7.8 | ) | 1,219.8 | ||||||||
| Total operating expenses |
1,832.7 | 3.5 | 1,770.8 | (4.6 | ) | 1,856.5 | |||||||||
| Operating income |
362.1 | 13.0 | 320.4 | (3.5 | ) | 331.9 | |||||||||
| AFUDC equity |
9.3 | 47.6 | 6.3 | 40.0 | 4.5 | ||||||||||
| Net income |
$ | 160.2 | 18.1 | $ | 135.6 | (9.8 | ) | $ | 150.3 | ||||||
| Megawatt-Hour Sales (thousands) |
|||||||||||||||
| Residential |
8,667 | 1.4 | 8,546 | (3.7 | ) | 8,871 | |||||||||
| Commercial |
6,274 | (2.0 | ) | 6,399 | (2.2 | ) | 6,542 | ||||||||
| Industrial |
1,995 | (9.5 | ) | 2,205 | (6.8 | ) | 2,366 | ||||||||
| Other |
1,839 | — | 1,840 | 4.9 | 1,754 | ||||||||||
| Total retail |
18,775 | (1.1 | ) | 18,990 | (2.8 | ) | 19,533 | ||||||||
| Sales for resale |
440 | (50.2 | ) | 884 | (2.3 | ) | 905 | ||||||||
| Total energy sold |
19,215 | (3.3 | ) | 19,874 | (2.8 | ) | 20,438 | ||||||||
| Retail customers-thousands (average) |
666.7 | (0.1 | ) | 667.3 | 0.1 | 666.4 | |||||||||
Operating Revenues
In 2009 retail megawatt hour sales declined 1.1% primarily due to lower sales to commercial and industrial customers as a result of the weak Florida economy, and voluntary conservation by residential customers, which we believe was in response to the generally weaker economic conditions. Off-system sales declined due to lower state-wide demand. Total heating and cooling degree days were 4% above normal and 10% above 2008 levels. The average number of retail customers decreased 0.1% for the year. Pretax base revenues increased approximately $72 million in 2009 from the higher base rates approved by the FPSC, which were effective in May 2009.
In 2008, retail megawatt-hour sales declined 2.8%, which resulted in a $19.0 million reduction in base revenue, due to milder than normal weather and voluntary conservation by customers, which we believe to be in response to the generally weaker economic conditions. Total heating and cooling degree days were 5% below normal and 8% below 2007 levels.
For the past three years, weather-normalized energy consumption per residential customer declined due to the combined effects of voluntary conservation efforts, residential vacancies and changes in appliance efficiency. It is now apparent that some of the robust residential customer growth in the 2005 through mid-2007 period, which was measured by new meter installations, was actually vacant residences with minimal energy usage. The average number of residential customers with minimal usage was approximately 8% of total residential customers in both 2009 and 2008.
Electricity sales to the phosphate industry decreased 6.5% in 2009, following a 7.7% decrease in 2008. The decline in sales to phosphate customers was partially attributable to planned outages at their production facilities as the producers managed their product inventory levels during the economic downturn. Base revenues from phosphate sales represented less than 3% of base revenues in 2009 and less than 2% in 2008. Sales to commercial customers decreased 2.0% in 2009, reflecting the weaker local economy.
41
Table of Contents
Fuel-related rates decreased in both 2009 and 2008, after an increase in 2007 under the FPSC-approved fuel cost recovery clause. In March 2009, Tampa Electric filed to lower the fuel component of the customer’s bill due to an over recovery of fuel costs in 2008 and projected lower fuel costs in 2009. The March 2009 decrease was due to an over-recovery of fuel costs in the final quarter of 2008 from lower natural gas prices than previously forecast and a forecast for continued lower natural gas prices for the remainder of 2009 (see the Regulation section).
Energy sold to other utilities for resale decreased 50.2% in 2009 primarily due to lower energy demand state-wide and to lower natural gas prices through much of the summer, which made Tampa Electric’s base-load coal generation not the lowest cost form of energy for spot sales. Energy sold to other utilities for resale decreased 2.3% in 2008, due to lower coal unit availability in the first six months of the year.
Customer and Energy Sales Growth Forecast
The outlook and timing for a Florida economic recovery remains uncertain due to high unemployment and the weak housing market. Some economists are forecasting a very slow recovery starting about the middle of 2010, while others are forecasting a flat economy for 2010. The forecast used by Tampa Electric reflects no customer growth in 2010 and a slight decline in energy sales due to lower customer usage in response to the continued weak economy. The actual average number of customers declined 0.1% in 2009. There was an increase in the average number of customers in the fourth quarter of 2009, the first such increase in 18 months. Actual average 2008 customer growth was 0.1% reflecting customer growth early in the year that was partially offset by a decline in the number of customers in the last quarter. Until unemployment starts to decline and the economy and housing markets start to improve, it will be difficult to forecast when customer and related energy sales growth will resume (see the Risk Factors section).
Longer-term, assuming an economic recovery, and that growth from population increases and business expansion will resume, Tampa Electric expects average annual customer growth to return to a level of nearly 1.5% and weather-normalized average retail energy sales growth at about that same level in the 2011 or 2012 time frame. This energy sales growth projection is lower than previous projections, reflecting changes in usage patterns and changes in population trends. Tampa Electric forecasts that summer retail peak demand growth will be minimal over the next three years, but peak load growth will resume after 2013. These growth projections assume a resumption of local area economic growth, normal weather, a slow recovery in the housing market over time, and a continuation of the current energy market structure.
The economy in Tampa Electric’s service area contracted in 2009 and 2008 after modest growth in 2007. Initially, the contraction was centered in housing and related industries, but spread to the general economy later in 2007. The Tampa metropolitan area’s employment decreased 5.1% in 2009 following a 2.7% decrease in 2008. This level of job loss is greater than statewide losses in Florida. The local Tampa area unemployment rate increased to 12.4% at year-end 2009, compared with 8.3% at the end of 2008 and 4.7% in December 2007. The Tampa area year-end 2009 unemployment rate was higher than the 11.8% unemployment rate for the state of Florida and higher than the 10.0% for the nation, which is contrary to the trends experienced in previous economic slowdowns. The more severe downturn in the Tampa area and Florida was initially driven by the sharp downturn in construction activity following the boom in the 2005 and 2006 periods, which has since spread to other housing-related businesses and the economy in general.
As in many areas of the country, the housing market in Tampa Electric’s service area remained weak in 2009 with declining home prices for much of the year and a high number of foreclosures. This trend was a continuation of the weak housing markets of 2008 and 2007 initially driven by excess builder inventory, the curtailment of speculative investing and sub-prime mortgage issues, and more recently by high unemployment and the tight mortgage lending markets.
In the second half of 2009 there were some positive signals from the housing market in the form of increased sales of existing homes, increases in existing home resale prices in two of the last four months of 2009 as reported by the Case-Shiller Home Price Index, and a modest increase in the number of new single family building permits. Economists and real estate associations indicate that the housing market is expected to remain weak at least through the first half of 2010 with a recovery possibly starting late in 2010, depending on the timing of a general economic recovery and the absorption of excess inventory.
Operating Expenses
Total pretax operating expense increased 3.5% in 2009, driven by higher other operating expenses and maintenance expenses, which included the write-off of project development costs, the write-off of disallowed rate case expenses, and restructuring costs. Excluding all FPSC-approved cost recovery clause-related expenses, restructuring charges and the project development write-off, operations and maintenance expense increased $8.7 million, compared to 2008, primarily due to higher spending on generating unit maintenance and repairs, higher expenses to operate the distribution system, higher employee-related expenses, and slightly higher bad debt expense, partially offset by savings in salaries and other benefits as a result of the restructuring actions taken in the third quarter.
42
Table of Contents
Total pretax operating expense decreased 4.6% in 2008, driven by lower fuel expense and lower taxes other than income, including lower property taxes and sales-related taxes and lower franchise fees. In 2008, excluding all FPSC-approved cost recovery clause-related expenses, operation and maintenance expense decreased $0.8 million, compared to 2007, primarily due to $4.0 million higher spending on generating unit maintenance and repairs and $0.8 million higher bad debt expense more than offset by $4.2 million lower employee-related expenses, and $1.4 million of other smaller cost reductions. Property tax expense decreased $0.7 million, driven by adjustments to property valuations agreed to with taxing authorities.
Tampa Electric expects operation and maintenance expense, excluding fuel and purchased power, to decrease to approximately 2008 levels in 2010. Excluding all FPSC approved recovery clauses, the 2010 non-fuel operation and maintenance expense decrease is expected to be driven by the restructuring actions taken in 2009, and will better match expenditures to 2010 revenues, which reflect the current state of Florida’s economy.
In 2009, depreciation expense increased $9.1 million and taxes other than income were higher due to the peaking combustion turbines placed in service in 2009 and normal additions to facilities to serve customers. Depreciation expense increased $4.3 million in 2008, reflecting additional facilities to serve customers. Depreciation expense is projected to increase in 2010 due to routine plant additions to serve Tampa Electric’s customer base and maintain system reliability, a full year of depreciation on combustion turbines that were placed in service at various times in 2009, the addition of solid-fuel rail unloading facilities in late 2009 and a partial year of depreciation on the fourth and final NOx control project, which is expected to enter service in May 2010.
Fuel Prices and Fuel Cost Recovery
In November 2008, the FPSC approved Tampa Electric’s originally requested 2009 fuel rates. The rates included the costs for natural gas and coal expected in 2009, and the recovery of fuel and purchased power expenses, which were not collected in 2008. In March 2009, Tampa Electric filed a mid-course correction with the FPSC to adjust its projected 2009 fuel and purchased power costs to reflect the decline in commodity fuel prices, primarily natural gas. The revised forecast reduced fuel and purchased power costs by $191 million for 2009, which when combined with $35 million over recovery in late 2008, resulted in $226 million lower projected fuel and purchased power cost. (see the Regulation section).
In November 2009, the FPSC approved cost recovery rates for fuel and purchased power, capacity, environmental and conservation costs for the period January through December 2010. The rates include the expected cost for natural gas and coal in 2010, the net over recovery of fuel, purchased power and capacity clause expenses, which were collected in 2009 following the March adjustment, and the operating cost for and a return on the capital invested in the fourth SCR project to enter service at the Big Bend Power Station as well as the operation and maintenance expense associated with the projects (see the Regulation and Environmental Compliance sections).
Total fuel cost increased in 2009, due to higher cost for coal partially offset by lower costs for natural gas. Purchased power decreased in 2009 due to lower natural gas prices, which is the primary fuel used by other generators in Florida. Average delivered coal and natural gas prices moved in opposite directions in 2009. Natural gas prices decreased 24.6% in 2009 due to storage inventories above historic averages resulting from lower demand for natural gas from industrial users caused by the economic recession, and increased supply of low cost gas from domestic sources. Coal costs increased 4.8% in 2009 due to contracts signed in 2008 for deliveries in 2009 when coal prices were higher. Coal and natural gas prices were $3.05 per million BTU (/mmBTU) and $8.00/mmBTU, respectively, in 2009.
Total fuel prices decreased in 2008, but purchased power increased due to lower generation from natural gas fired facilities. Average delivered coal and natural gas prices increased 13.0% and 11.4%, respectively, to $2.91/mmBTU and $10.61/mmBTU, respectively, in 2008.
Natural gas futures as traded on the New York Mercantile Exchange (NYMEX) and various forecasts for natural gas prices indicate that natural gas prices will increase in 2010 from the unusually low 2009 levels. Coal prices, while less volatile, decreased in 2009 after sharp increases in 2008 and 2007. Coal prices experienced a significant decline in 2009 for spot or as needed purchases, due to lower demand for coal fired generation of electricity as a result of the economic conditions. Tampa Electric’s primary coal supplies are from the Illinois Basin, which experienced an upward movement in prices in 2008 but not of the same magnitude as prices in the Central Appalachian coal producing region. Tampa Electric’s coal prices are expected to remain stable in 2010 due to longer-term supply contracts signed in 2008.
Energy Supply
On a retail energy supply basis, Tampa Electric generation accounted for 98%, 94% and 93% of the total retail energy sales in 2009, 2008 and 2007, respectively, with the remainder of the energy supplied by purchased power. Purchased power expense decreased 41.8% due to the lower per-unit prices associated with the purchases as a result of lower natural gas prices and lower volumes purchased primarily due to lower demand and improved coal-fired unit availability during the high-load summer period. Purchased power expense is expected to decrease in 2010 due to a lower volume of purchases driven by only one planned outage for the final SCR installation compared to multiple SCR outages in 2009.
43
Table of Contents
Prior to 2003, nearly all of Tampa Electric’s generation was from coal. Starting in April 2003, the mix started to shift with increased use of natural gas at the Bayside Power Station, which was converted from the coal-fired Gannon Station. In 2009, at times it was more cost effective to generate electricity from natural gas than from coal due to the low natural gas prices. Nevertheless, coal is expected to continue to represent more than half of Tampa Electric’s fuel mix due to the baseload units at the Big Bend Power Station and the coal gasification unit, Polk Unit One. In 2010, the final Big Bend Power Station coal-fired unit will undergo an extensive outage to complete the construction of the NOx control equipment (see the Environmental Compliance section), which is expected to reduce the generation from coal from that unit. Anticipated higher natural gas prices in 2010 are expected to increase the use of coal for generation.
Hurricane Storm Hardening
Due to extensive storm damage to utility facilities during the 2004 and 2005 hurricane seasons and the resulting outages utility customers experienced throughout the state, in 2006 the FPSC initiated proceedings to explore methods of designing and building transmission and distribution systems that would minimize long-term outages and restoration costs related to severe weather.
The FPSC subsequently issued an order requiring all investor owned utilities (IOUs) to implement a 10-point storm preparedness plan designed to improve the statewide electric infrastructure to better withstand severe storms and expedite recovery from future storms. Tampa Electric implemented its plan in 2007 and estimates the average non-fuel operation and maintenance expense of this plan to be approximately $20 million annually for the foreseeable future.
The FPSC also modified its rule regarding the design standards for new and replacement transmission and distribution line construction, including certain critical circuits in a utility’s system. Future capital expenditures required under the storm hardening program are expected to average more than $20 million annually for the foreseeable future (see the Regulation section).
Capital Spending
For the past several years, Tampa Electric was in a period of increased capital spending for infrastructure to reliably serve its customer base and for peaking generating capacity additions. In addition to the capital spending to comply with the storm hardening plan described above, Tampa Electric expects to make additional capital investments in its transmission and distribution system to improve reliability and reduce customer outages, and for generating unit reliability.
Due to the dramatic slowdown in the Florida and national economies and the Florida housing market in 2008 and 2009, Tampa Electric has reassessed its forecast of long-term energy demand and sales growth. Tampa Electric had previously identified a need for new baseload capacity in early 2013; however, the current capital forecast reflects a deferral of construction of new baseload or peaking capacity beyond this forecast period. If growth resumes and demand increases above the current projections, Tampa Electric may require peaking capacity in the 2013 time frame. Tampa Electric may seek to purchase power rather than build additional capacity based on the economics of a decision to purchase rather than build new capacity (see the Capital Expenditures and Regulation sections).
Pending action by the Florida Legislature on a Florida renewable energy portfolio standard (RPS), the need for additional capital spending on renewable energy sources is likely but not yet defined (see the Environmental Compliance section). Depending on the final rules, which the legislature may enact in the 2010 legislative session, Tampa Electric may need to invest capital to develop additional sources of renewable power generation.
PEOPLES GAS (PGS)
Operating Results
PGS reported net income of $31.9 million in 2009, compared to $27.1 million in 2008. Non-GAAP results, which exclude $2.9 million of restructuring charges, were $34.8 million in 2009 (see the 2009 Reconciliation of GAAP net income from continuing operations to non-GAAP results table). There were no non-GAAP adjustments to the 2008 period. The higher 2009 results reflect a $4.0 million favorable adjustment to previously recorded deferred tax balances, and the new base rates effective in June, partially offset by higher non-fuel operations and maintenance expenses and depreciation. Results reflect a 0.2% lower average number of customers. Residential customer usage increased due to colder winter weather in the first quarter of 2009, compared to the very mild winter weather in 2008. Sales to commercial customers increased, due to several higher volume new customers and conversion of propane customers to natural gas. Lower sales volumes to industrial customers reflected economic conditions and reduced operations by industries sensitive to the housing market, such as cement plants. Gas transported for power generation customers increased over 2008 due to lower natural gas prices, which made it a more economical generating fuel choice. Excluding restructuring charges, non-fuel operations and maintenance expense increased in 2009 compared to 2008 when operations and maintenance expense was reduced by a $1.5 million benefit from the recognition of environmental remediation insurance recoveries and a $0.9 million benefit related to the completion of pipeline installations for power generation customers. PGS experienced higher pipeline integrity costs and higher depreciation expense in 2009 due to routine plant additions.
44
Table of Contents
In 2009, the total throughput for PGS was 1.4 billion therms. Industrial and power generation customers consumed approximately 50% of PGS’ annual therm volume, commercial customers used approximately 26%, approximately 19% was sold off-system, and the balance was consumed by residential customers.
PGS reported net income of $27.1 million in 2008, compared to $26.5 million in 2007. Results reflected higher volumes for weather-sensitive residential and small commercial customers due to colder than normal weather in the northern portion of Florida in the fourth quarter, which more than offset mild weather earlier in the year. Higher volumes transported for industrial customers and higher volumes for off-system sales offset lower volumes for power generation customers. Average customer growth of 0.2% was a result of the continued weak Florida housing market. Therm sales to industrial customers increased due to two new customers with significant usage but at lower transportation rates, which partially offset lower volumes for other customers due to the economic conditions. Sales to commercial and industrial customers were impacted by the weak Florida housing market and overall weak economy, which reduced sales to customers such as restaurants and wallboard, asphalt and concrete producers. Results also reflect a $1.5 million benefit from the recognition of environmental remediation insurance recoveries, and a $0.9 million benefit related to the completion of pipeline installations for a power generation customer.
In 2008, the total throughput for PGS was 1.4 billion therms. Industrial and power generation customers consumed approximately 45% of PGS’ annual therm volume, commercial customers used approximately 26%, approximately 23% was sold off-system, and the balance was consumed by residential customers.
Residential operations were about 30% of total revenues in 2009 due to lower natural gas prices. New residential construction that includes natural gas and conversions of existing residences to gas has slowed significantly due to the weak Florida housing market. Like most other natural gas distribution utilities, PGS is adjusting to lower per-customer usage due to improving appliance efficiency. As customers replace existing gas appliances with newer, more efficient models, per-customer usage tends to decline.
Natural gas has historically been used in many traditional industrial and commercial operations throughout Florida, including production of products such as steel, glass, ceramic tile and food products. Within the PGS operating territory, large cogeneration facilities utilize gas-fired technology in the production of electric power and steam.
The actual cost of gas and upstream transportation purchased and resold to end-use customers is recovered through a Purchased Gas Adjustment (PGA). Because this charge may be adjusted monthly based on a cap approved by the FPSC annually, PGS normally has a lower percentage of under- or over-recovered gas cost variances than Tampa Electric.
Excluding restructuring charges, 2009 non-fuel operations and maintenance expense increased $3.3 million compared to 2008 levels when operations and maintenance expense included a $1.5 million benefit from the recognition of environmental remediation insurance recoveries and a $0.9 million benefit related to the completion of pipeline installations for power generation customers. Absent the 2008 benefits, operations and maintenance expense was essentially unchanged in 2009.
In 2008, excluding costs recovered through the FPSC-approved conservation clause, operation and maintenance expenses decreased $1.2 million, driven primarily by a benefit to environmental remediation expenses discussed above and lower employee-related expenses. Depreciation expense increased $1.1 million due to additions to facilities to serve customers.
Because of lower customer growth, slower energy sales growth, higher levels of operations and maintenance spending, continued investment in the distribution system and higher costs associated with required safety requirements, such as transmission and distribution pipeline integrity management, PGS’ 13-month average regulatory ROE was below the bottom of its allowed range at the end of 2007 and was 8.7% at the end of 2008.
Due to the significant decline in ROE, PGS filed for a $26.5 million base rate increase in August 2008. In May 2009, the FPSC awarded a $19.2 million revenue requirements increase that authorized an ROE mid-point of 10.75%, 54.7% equity in the capital structure, and 2009 13-month average rate base of $561 million. The new rates were effective Jun. 18, 2009.
45
Table of Contents
Summary of Operating Results
| (millions) |
2009 | % Change | 2008 | % Change | 2007 | ||||||||||
| Revenues |
$ | 470.8 | (31.6 | ) | $ | 688.4 | 14.8 | $ | 599.7 | ||||||
| Cost of gas sold |
244.5 | (48.7 | ) | 476.6 | 22.2 | 389.9 | |||||||||
| Operating expenses |
163.3 | 8.6 | 150.3 | (0.4 | ) | 150.9 | |||||||||
| Operating income |
63.0 | 2.4 | 61.5 | 4.4 | 58.9 | ||||||||||
| Net income |
31.9 | 17.7 | 27.1 | 2.3 | 26.5 | ||||||||||
| Therms sold—by customer segment |
|||||||||||||||
| Residential |
73.5 | (1.2 | ) | 74.4 | 6.1 | 70.1 | |||||||||
| Commercial |
381.7 | 1.5 | 375.9 | 1.3 | 370.9 | ||||||||||
| Industrial |
448.7 | (12.6 | ) | 513.3 | 4.8 | 489.8 | |||||||||
| Power generation |
538.3 | 18.2 | 455.6 | (3.4 | ) | 471.7 | |||||||||
| Total |
1,442.2 | 1.6 | 1,419.2 | 1.2 | 1,402.5 | ||||||||||
| Therms sold—by sales type |
|||||||||||||||
| System supply |
398.0 | (13.1 | ) | 457.8 | 4.6 | 437.8 | |||||||||
| Transportation |
1,044.2 | 8.6 | 961.4 | (0.3 | ) | 964.7 | |||||||||
| Total |
1,442.2 | 1.6 | 1,419.2 | 1.2 | 1,402.5 | ||||||||||
| Customer (thousands)—average |
334.4 | (0.2 | ) | 335.1 | 0.2 | 334.3 | |||||||||
In Florida, natural gas service is unbundled for non-residential customers that elect this option, affording these customers the opportunity to purchase gas from any provider. The net result of unbundling is a shift from bundled transportation and commodity sales to transportation sales. Because the commodity portion of bundled sales is included in operating revenues at the cost of the gas on a pass-through basis, there is no net earnings impact to the company when a customer shifts to transportation-only sales. PGS markets its unbundled gas delivery services to customers through its “NaturalChoice” program. At year end 2009, approximately 15,200 out of 31,400 of PGS’ eligible non-residential customers had elected to take service under this program.
Since early 2008 at the start of the housing market collapse, customer growth and therm sales growth have been difficult to forecast, due to the state of the national and Florida economies and the uncertainty of the timing of a recovery in the Florida housing market. In 2009, PGS had a lower average number of customers than in 2008. In 2008, PGS had forecast customer growth of approximately 1.0%; however, actual customer growth was 0.2%, which is significantly lower than the average customer growth experienced for the previous five years. PGS provides service in areas of Florida that experienced some of the most rapid growth in 2005 and 2006, including the Miami, Ft. Myers and Naples areas. These areas continue to experience the most significant impacts of the housing market collapse.
In 2010, customer growth and therm sales growth at PGS will be impacted by the uncertain timing of economic and housing market recoveries. Excluding all FPSC-approved cost recovery clause-related expenses, operation and maintenance expense is expected to decrease in 2010 as a result of the 2009 restructuring. Depreciation expense is expected to increase from continued capital investments in facilities to reliably serve customers. Base rate relief was granted in 2009, which amounts to $19.2 million on an annualized basis effective in June 2009.
Since its acquisition by TECO Energy in 1997, PGS has expanded its gas distribution system into areas of Florida not previously served by natural gas, such as the lower southwest coast in the Ft. Myers and Naples areas and the northeast coast in the Jacksonville area. In 2010, PGS expects its capital spending to support modest system expansion in anticipation that the Florida housing market will recover over the next several years. Over time, PGS expects customer additions and related revenues to increase, assuming an economic and housing market recovery throughout the state of Florida, and other factors (see the Risk Factors section).
Gas Supplies
PGS purchases gas from various suppliers depending on the needs of its customers. The gas is delivered to the PGS distribution system through three interstate pipelines on which PGS has reserved firm transportation capacity for delivery by PGS to its customers.
Gas is delivered by the Florida Gas Transmission Company (FGT) through 59 interconnections (gate stations) serving PGS’ operating divisions. In addition, PGS’ Jacksonville Division receives gas delivered by the South Georgia Natural Gas Company pipeline through two gate stations located northwest of Jacksonville. PGS also receives gas delivered by Gulfstream Natural Gas Pipeline through seven gate stations.
46
Table of Contents
PGS procures natural gas supplies using baseload and swing-supply contracts with various suppliers along with spot market purchases. Pricing generally takes the form of either a variable price based on published indices, or a fixed price for the contract term.
TECO COAL
TECO Coal recorded net income of $37.2 million in 2009, more than double the $18.0 million in 2008, on sales of 8.7 million tons, compared to sales of 9.3 million tons in 2008. Lower volume and the sales mix in 2009 reflects coal market conditions, which included high inventory levels at utility steam coal customers and reduced demand for coal used in the production of steel. At almost $72 per ton, the 2009 full-year average net per-ton selling price was 20% above the 2008 average selling price. At almost $67 per ton, the 2009 all-in total per-ton cost of production was 14% higher than in 2008. In 2009, TECO Coal’s effective income tax rate was 17%.
TECO Coal recorded net income of $18.0 million in 2008, compared to $90.9 million in 2007 on sales of 9.3 million tons, compared to 9.2 million tons, which included 6.0 million tons of synthetic fuel, in 2007. TECO Coal’s 2007 Non-GAAP Results Excluding Synthetic Fuel, which excluded the $52.6 million benefit associated with the production of synthetic fuel, were $38.3 million (see the 2007 Reconciliation of GAAP net income from continuing operations to non-GAAP results table).
Results in 2008 reflected an average net selling price per ton across all products, which excluded transportation allowances, almost 7% higher than in 2007. Due to the signing of steam coal contracts for 2008 delivery during periods of lower prices in 2006 and 2007 and its 2008 metallurgical coal contracts early in the renewal cycle in late 2007, TECO Coal realized lower average prices per ton in 2008 than other coal producers realized from contracts signed during the period of very strong coal markets in 2008. The cash cost of production increased 14% in 2008 compared to 2007, driven by diesel oil prices that were 42% higher than 2007 prices, higher per-ton costs for steel products used in underground mining, higher costs for explosives used in surface mining operations, and higher costs associated with contract miners. The cost of production in 2008 also reflected the industry-wide issues of a shortage of qualified miners and lost productivity due to increased safety inspections, and difficult geology at several TECO Coal mines at various times during the year. Results also reflected a $2.6 million benefit from a contract settlement related to future coal sales, and a $0.6 million benefit from the true-up of the 2007 synthetic fuel tax credit rate, compared to a $1.6 million benefit in 2007 for the true-up of the 2006 rate.
Net income in 2007 reflected $52.6 million of benefits from the production of synthetic fuel. The tax credit program for the production of synthetic fuel expired Dec. 31, 2007.
TECO Coal Outlook
We expect TECO Coal’s net income to increase in 2010 over 2009 from higher contract selling prices. TECO Coal expects sales to be in range between 8.3 and 8.7 million tons. The total expected sales are contracted and priced at an average price of more than $75 per ton. More than one-third of sales are to steel producers and specialty stoker coal users with the remainder sold to utility steam coal customers. The all-in, fully-loaded production costs are expected to be in a range between $65 and $69 per ton, driven by lower diesel fuel costs offset by higher safety requirements, productivity that reflects the industry-wide trend of increased inspections by state and federal agencies, and higher royalty cost and severance taxes due to the higher selling prices. Diesel fuel prices have been hedged for those contracts that do not have diesel price adjustments in the contract at average prices below 2009 levels.
For the past several years, the issuance of permits by the U.S. Army Corp of Engineers (USACE) under Section 404 of the Clean Water Act required for surface mining activities in the Central and Northern Appalachian mining regions have been challenged in the courts. These challenges have been appealed by various mining companies affected on a number of occasions, but very few permits have been issued over the past several years. TECO Coal has six permits on the list of permits subject to enhanced review by the U.S. EPA under its memorandum of understanding with the USACE, which was issued in September 2009. Production from a mine affected by one of those permits that has been delayed is included in the 2010 sales projections. This mine is expected to contribute approximately 3% of 2010 sales. To date, there has been no progress in granting these permits. TECO Coal is currently producing from other mines to offset the lost production from the delayed permit.
Coal Markets
Following the rapid increase in coal prices that started late in 2007, in the third quarter of 2008, in response to the U.S. economic recession, the prices for many commodities, which had previously experienced very strong and very volatile prices in 2008, started to drop. The decline in commodity prices, including coal, accelerated in the fourth quarter of 2008 due to the spread of the U.S. economic recession to many other economies around the world. At that time, the U.S. steel industry, which is a large consumer of metallurgical coal, was reported to be operating at a less than 40% utilization rate. In the first half of 2009, coal producers around the world experienced generally depressed demand for their product, which resulted in lower shipments and lower prices. In the second half of 2009, government economic stimulus actions resulted in very strong demand for metallurgical coal in China and India. As the international economies started to emerge from the economic recession in late 2009, demand and
47
Table of Contents
prices for metallurgical coal increased, both in the U.S. and in international markets. In February 2010, Coal industry newsletters reported that spot prices for high quality metallurgical coal were approaching $200 per metric ton delivered to the customer.
Demand for coal used by utilities to generate electricity declined in 2009 due to the economic recession. Natural gas prices, as measured on a cent per million BTU basis, being below coal prices allowed utilities to substitute natural gas for coal in the generation of electricity. Further, demand for electricity, especially by industrial users across the country, decreased due to the recession. As a result, utility coal stockpiles were significantly above long-term averages, which caused some utilities to defer contracted tons into future years and to not purchase coal in the spot markets as they normally would. All of these factors caused prices for utility steam coal, as measured by reported spot market prices, to drop below $50 per ton for coal from Central Appalachia in 2009, which is less than 50% of the 2008 levels.
In 2010, cold weather early in the year, a recovery in electricity usage by industrial customers, higher natural gas prices, and the improving world economy may cause utilities to again seek new coal supplies, but probably not until the second half of 2010.
The significant factors that could influence TECO Coal’s results in 2010 are the cost of production and the ability of customers to accept their full contracted volumes. Longer-term factors that could influence results include inventories at steam coal users, weather, the ability to obtain environmental permits for mining operations, general economic conditions, the level of oil and natural gas prices, commodity price changes that impact the cost of production, and changes in environmental regulations (see the Environmental Compliance and Risk Factors sections).
TECO GUATEMALA
Our TECO Guatemala operations consist of two power plants operating in Guatemala under long-term contracts and an ownership interest in DECA II, which has an ownership interest in Guatemala’s largest distribution utility, Empresa Eléctrica de Guatemala (EEGSA) and affiliated energy-related companies which provide, among other things, electricity transmission services, wholesale power sales to unregulated electric customers, and engineering services. The San José and Alborada power stations in Guatemala both have long-term power sales contracts. TECO Guatemala’s effective 24% ownership interest in EEGSA is held jointly with partners Iberdrola Energia, S.A. of Spain (Iberdrola) and Electricidad of Portugal (EDP). Together, TECO Guatemala, Iberdrola and EDP own an 81% controlling interest in DECA II. TECO Guatemala has a 30% interest in DECA II.
The Alborada Power Station, which consists of oil-fired, simple-cycle combustion turbines, is a peak-load facility with high availability, but operates at a low capacity factor by design. Guatemala is heavily dependent on hydro-electric sources for baseload power generation. The Alborada Power Station is under contract to EEGSA but it is designated to be an operating reserve for the country of Guatemala by the country’s power dispatcher. The plant runs at peak times or in times of loss of a major generating unit or transmission circuit in the country.
In 2001, EEGSA and Alborada entered into an agreement (the Option) to extend the term of the Alborada power sales contract, which is scheduled to expire in September 2010, for five years at the end of the contract period. At the time of the execution of the Option (2001), the Guatemalan regulators expressly approved the pass through to the tariff of all costs associated with the extended term of the contract, however, even though Alborada is in compliance with all of the terms of the Option, the current Guatemalan regulator has objected to the extension citing modifications to regulations passed in 2007. Alborada is currently in talks with the Guatemalan government to extend this contract term.
In Guatemala, the VAD charges applicable in the tariffs charged by EEGSA are normally reset for new five-year terms. In the summer of 2008, the VAD was expected to be reset in a manner similar to the process utilized in 2003, in accordance with applicable Guatemalan law.
On Jul. 25, 2008, the National Electric Energy Commission (CNEE), the Guatemalan regulatory body, issued a communication unilaterally disbanding the panel of experts appointed under existing regulations to review and approve the new VAD. EEGSA expected that the panel’s action was going to result in increased rates. On Aug. 1, 2008, CNEE issued resolutions setting new tariff rates for EEGSA, which deviated significantly from the rates calculated consistent with the panel of experts’ guidance. The VAD revenues resulting from the new rates are approximately 30% – 40% below the prior level, essentially putting all of EEGSA’s earnings, in which our subsidiary, TECO Guatemala Holdings, LLC, (TGH) shares, which had previously averaged about $10 million annually, at risk during the time this tariff remains in effect.
As a result of these actions, in January 2009, our subsidiary, TGH delivered a Notice of Intent to the Guatemalan government indicating its intent to file an arbitration claim against the Republic of Guatemala under the DR-CAFTA. TGH continues to evaluate its options related to a DR-CAFTA filing (see the Risk Factors section). In the normal course of business, TECO Guatemala evaluated its $146.7 million investment in DECA II, including associated goodwill at Dec. 31, 2009 and determined that the value was not impaired. However, the outcome of the ongoing efforts and a potential arbitration under a DR-CAFTA claim is uncertain, and could impact this determination in the future (see Note 12 to the TECO Energy Consolidated Financial Statements).
48
Table of Contents
EEGSA, Iberdrola, EEGSA’s largest investor, and EEGSA’s other investors have actively pursued legal and other efforts in Guatemala to remedy CNEE’s actions which have been resolved against EEGSA. Through Dec. 31, 2009, these efforts had not resolved the dispute and TGH has until 2011 to initiate a claim under the DR-CAFTA . Iberdrola is in international arbitration under the bilateral trade treaty in place between the Republic of Guatemala and the Kingdom of Spain.
In 2009, TECO Guatemala’s net income was $38.6 million, compared to $36.9 million in 2008. TECO Guatemala’s full-year 2009 non-GAAP results, which exclude the $8.7 million gain on the sale of Navega were $29.9 million, compared to 2008 non-GAAP results of $46.5 million, which exclude $9.6 million of taxes related to the December cash repatriation. Results in 2009 reflect lower results at the San José Power Station due to unplanned outages for much of the first half of the year and lower capacity payments under the power sales contract as a result of lower availability due to the unplanned outages, partially offset by a $1.7 million net insurance recovery related to the unplanned outages. Results also reflect the reduction in the VAD tariff at EEGSA which reduced 2009 earnings at TECO Guatemala by approximately $5.0 million. The effect of the VAD more than offset the benefit of 28,000 additional customers, or 2.9% customer growth, higher energy sales, and cost control measures at EEGSA. The earnings from the DECA II unregulated EEGSA-affiliated companies, which provide, among other things, electricity transmission services, wholesale power sales to unregulated electric customers and engineering services, decreased due to the loss of the earnings from the telecommunications service provider, Navega, which was sold in the first quarter of 2009. The 2009 results for EEGSA and affiliated companies also include a $2.5 million benefit related to an adjustment to previously estimated year-end equity balances, compared to a similar $3.1 million benefit in 2008.
In 2008, TECO Guatemala’s net income was $36.9 million, compared to $44.7 million in 2007. In December 2008, TECO Guatemala repatriated $71.7 million of cash and investments to TECO Energy, resulting in additional taxes of $9.6 million. TECO Guatemala’s full-year 2008 non-GAAP results, which exclude $9.6 million of taxes related to the December 2008 repatriation of cash, were $46.5 million. The San José Power Station realized increased revenues in 2008 from significantly higher prices for spot energy sales. Revenues from contract energy sales increased due to a scheduled price escalation. Higher operating expenses and lower interest income on lower cash balances were essentially offset by lower interest on project debt. EEGSA had 3.9% customer growth in 2008, increasing its customer base by 37,000 to over 877,000 at year-end. The reduction in the VAD tariff at EEGSA starting in August 2008 reduced 2008 earnings at TECO Guatemala approximately $5.0 million. The 2008 results for EEGSA and affiliated companies also included a $3.1 million benefit related to an adjustment to previously estimated 2007 income and year-end equity balances, compared to a similar $1.9 million benefit in 2007.
TECO Guatemala Outlook
In 2010, we expect improved operating and financial performance at the San José Power Station following the extended unplanned outages in 2009, and higher contract capacity payments, which are expected to increase as the 12-month rolling average capacity factor improves. EEGSA, the Guatemalan distribution utility, continues to experience customer and energy sales growth, but the issue with the VAD remains unresolved. There have been hearings in the Guatemalan courts, and Iberdrola, EEGSA’s largest investor, is in an international arbitration process under the bilateral trade agreement between Spain and Guatemala.
In 2001, EEGSA and Alborada (a subsidiary of TECO Guatemala) entered into an agreement (the Option) to extend the term of the Alborada power sales contract, which is scheduled to expire in September 2010, for five years at the end of the contract period. At the time of the execution of the Option (2001), the Guatemalan regulators expressly approved the pass through to the tariff of all costs associated with the extended term of the contract; however, even though Alborada is in compliance with all of the terms of the Option, the current Guatemalan regulator has objected to the extension citing modifications to regulations passed in 2007. Alborada is currently in negotiations with the Guatemalan government to extend this contract term as originally intended. If the term of the contract is not extended in accordance with the Option, the net income from Alborada would be reduced or eliminated and an impairment charge could be taken.
PARENT/OTHER
In 2009, Parent/other cost was $54.0 million, compared to a cost of $55.2 million in 2008. Non-GAAP Parent/other cost was $48.6 million in 2009, compared to $45.8 million in 2008. Results in 2009 reflect a $2.6 million unfavorable valuation adjustment to foreign tax credits, a $1.5 million gain on the sale of a lease, the final asset held in a leveraged lease portfolio, and a $2.6 million benefit from a sale of property by TECO Properties. Results in 2009 also reflect negative tax return adjustments that normally occur, compared to 2008 when the tax return adjustments were favorable. Non-GAAP Parent/other cost in 2009 excluded $1.6 million of restructuring costs and a $3.8 million charge associated with the sale of student-loan securities held at TECO Energy parent (see the 2009 and 2008 Reconciliation of GAAP net income from continuing operations to non-GAAP results tables).
Parent/other cost was $55.2 million in 2008, compared to net income of $52.5 million in 2007. In 2008 the non-GAAP cost was $45.8 million, compared to the non-GAAP cost of $60.4 million in 2007. Non-GAAP costs in 2008 exclude $12.0 million of non-cash income taxes on the December 2008 repatriation of cash and investments from TECO Guatemala and a $2.6 million net benefit from adjustments to income taxes and previously estimated costs related to the sale of TECO Transport. Non-GAAP costs in 2007 exclude the $149.4 million net gain on the sale of TECO Transport, $16.3 million of charges related to the sale of TECO
49
Table of Contents
Transport, and the $20.2 million charge related to the debt extinguishment/exchanges completed in December (see the 2008 and 2007 Reconciliation of GAAP net income from continuing operations to non-GAAP results tables). In 2008, interest expense at TECO Energy Parent and TECO Finance, combined, declined $18.5 million reflecting debt retirement actions.
TECO TRANSPORT
We completed the sale of TECO Transport to an investment group for gross proceeds of $405 million in December 2007. The sale resulted in a net book gain of $149.4 million, before $16.3 million of transaction related costs recorded at TECO Energy parent. Proceeds from the sale of TECO Transport were used to pay down parent level debt on an accelerated basis.
Because of the Assets Held for Sale classification of TECO Transport, the recording of depreciation was discontinued as of Apr. 1, 2007. Net income through Dec. 3, 2007 was $34.0 million and Non-GAAP results were $24.3 million in 2007, including the $9.7 million of depreciation expense that was not recorded in GAAP net income (see the 2007 Reconciliation of GAAP net income from continuing operations to non-GAAP results tables).
OTHER ITEMS IMPACTING NET INCOME
Other income (expense)
In 2009, Other income (expense) of $79.3 million reflected $68.5 million, which included the $18.3 million pretax gain on the sale of Navega, from the Guatemalan operations, which are accounted for as equity investments, and a net $3.3 million charge related to the sale of various investments.
In 2008, Other income (expense) of $100.7 million reflected $72.5 million of pretax income from the Guatemalan operations, which are accounted for as equity investments; $7.2 million of pretax interest income on invested cash balances; and $6.7 million of pretax income from the sale of right-of-way easements and a contract settlement related to future coal sales at TECO Coal.
In 2007, Other income (expense) of $152.1 million reflected $84.5 million of mark-to-market gains on the oil price hedges on synthetic fuel production at TECO Coal; $68.6 million of pretax income from the Guatemalan operations, which are accounted for as equity investments; $19.4 million of pretax interest income on invested cash balances; and a $32.9 million pretax charge related to the debt extinguishment/exchange .
AFUDC equity at Tampa Electric, which is included in Other income (expense), was $9.3 million, $6.3 million and $4.5 million in 2009, 2008 and 2007, respectively. AFUDC is expected to decrease in 2010 due to the completion of the installation of combustion turbines to meet peak load capacity needs, the rail unloading facilities at Tampa Electric’s Big Bend Power Station and for the third NOx control also at Big Bend Power Station (see the Environmental Compliance and Liquidity, Capital Resources sections).
Interest Expense
In 2009, total interest expense was $227.0 million compared to $228.9 million in 2008 and $257.8 million in 2007. In 2009, interest expense was reduced by lower interest rates on floating rate debt and higher AFUDC debt at Tampa Electric, which is a credit to interest expense. In 2008, interest expense was reduced by the December 2007 retirement of $297 million of TECO Energy debt and the full-year benefit of other debt retirement in 2007, including the repayment of $300 million of 6.125% notes in May 2007 and the repayment of $111 million of 5% Dock and Wharf bonds in September 2007. Interest expense also reflects Tampa Electric Company’s issuance of $100 million of 6.10% notes in July 2009 (see the Financing Activity section).
Interest expense is expected to be higher in 2010 due to higher borrowing levels at Tampa Electric Company, less AFUDC-debt capitalized to construction, and the refinancing of $100 million of low interest rate, floating-rate debt maturing in 2010 (see the Liquidity, Capital Resources section).
Income Taxes
The provision for income taxes increased in 2009 primarily due to higher operating income, partially offset by lower foreign tax credit valuation allowances, lower taxes on cash repatriated from Guatemala, and increased depletion and AFUDC equity. The provision for income taxes decreased in 2008 due to lower operating income, the termination of the synthetic fuel operations tax credit program and its related investor income, and the gain recognized on the sale of TECO Transport in 2007. Income tax expense as a percentage of income from continuing operations before taxes was 31.6% in 2009, 36.8% in 2008, and 34.9% in 2007. For 2010, we expect the effective tax rate to be in the range of 30% to 35%.
The cash payments for income taxes, as required by the federal Alternative Minimum Tax rules (AMT), state income taxes and payments (refunds) related to prior years’ audits totaled $4.1 million, $6.0 million and ($10.5) million in 2009, 2008 and 2007, respectively. The 2007 refund was a result of a 2003 and 2004 foreign tax-credit carryback claim.
In recent years, due to the generation of deferred income tax assets related to the net operating loss (NOL) carryforward from disposition of the generating assets formerly held by TWG Merchant, our unregulated power generation subsidiary which is no longer in that business, cash tax payments for income taxes were limited to approximately 10% of the AMT rate. We expect future
50
Table of Contents
cash tax payments to be limited to a similar level reduced by AMT foreign tax credits and various state taxes. We currently expect to utilize these NOLs through 2013, at which time we expect to start using more than $190 million of AMT carry-forward to limit future cash tax payments for federal income taxes to the level of AMT. We currently project cash tax payments of approximately $0.5 million in 2010, and less than $3 million in 2011 and 2012. We expect 2013 cash payments to increase to $25 million as a result of having fully utilized the remainder of the NOL.
The tax credit for the production of synthetic fuel expired at the end of 2007. The credit was determined annually and was $0.4103 per million Btu for 2007 after phase-out ($1.2509 per million Btu with no phase-out).
The income tax effect of gains and losses from discontinued operations is shown as a component of results from discontinued operations.
DISCONTINUED OPERATIONS
In 2007, net income from discontinued operations reflected a $14.3 million tax benefit recorded in discontinued operations in the second quarter as a result of reaching a favorable conclusion with taxing authorities related to the 2005 disposition of the Union and Gila River merchant power plants. TECO Transport was not classified as a discontinued operation due to the ongoing contractual relationship with Tampa Electric for solid fuel waterborne transportation services.
LIQUIDITY AND CAPITAL RESOURCES
The table below sets forth the Dec. 31, 2009 consolidated liquidity and cash balances, the cash balances at the operating companies and TECO Energy parent, and amounts available under the TECO Energy/Finance and Tampa Electric Company credit facilities.
| Balances as of Dec. 31, 2009 | ||||||||||||
| (millions) |
Consolidated | Tampa Electric Company |
Unregulated Companies |
Parent | ||||||||
| Credit facilities |
$ | 675.0 | $ | 475.0 | $ | — | $ | 200.0 | ||||
| Drawn amounts/LCs |
62.6 | 55.7 | — | 6.9 | ||||||||
| Available credit facilities |
612.4 | 419.3 | — | 193.1 | ||||||||
| Cash and short-term investments |
46.8 | 5.5 | 19.4 | 21.9 | ||||||||
| Total liquidity |
$ | 659.2 | $ | 424.8 | $ | 19.4 | $ | 215.0 | ||||
Consolidated other cash and short-term investments included $19.4 million of cash at the unregulated operating companies for normal operations. In addition to consolidated cash, as of Dec. 31, 2009 unconsolidated affiliates owned by TECO Guatemala, CGESJ (San José) and TCAE (Alborada), had unrestricted cash balances of $24.1 million, which are not included in the table above.
In 2009, we met our cash flow needs primarily from a mix of internal sources supplemented with net borrowings of $57.1 million, of which $102.0 million represented notes issued by Tampa Electric Company (see the Financing Activity section). Cash from operations was $724.7 million. Other sources of cash included $31.6 million of proceeds from the sale of businesses, primarily the sale of our ownership interest in the Guatemalan telecommunications provider, Navega, $5.1 million from the sale of common stock, primarily through dividend reinvestment, and $16.1 million from the sale of student loan securities and other investments. We paid dividends of $170.8 million in 2009, and capital expenditures were $639.8 million.
In 2008, we met our cash needs primarily from a mix of internal sources and cash on hand at the beginning of the year, including cash held offshore which was repatriated in December 2008. We supplemented this with net borrowings of $102 million, of which $68 million represented borrowings under bank credit facilities. Cash from operations was $388 million in 2008. Other sources of cash included net proceeds of $79 million in January associated with the settlement of 2007 oil price hedges related to TECO Coal’s synthetic fuel program, and $22 million in common stock proceeds. We paid dividends in 2008 of $169 million, and our capital expenditures for the year were $590 million.
In 2007, cash from operations was $554 million. Other sources of cash in 2007 included $405 million from the sale of TECO Transport. We used cash to retire $357 million of TECO Energy parent debt at maturity, $111 million of TECO Energy parent-guaranteed TECO Transport Dock and Wharf bonds at maturity, and $297 million of TECO Energy parent debt prior to maturity, and the regulated companies reduced short-term borrowings $23 million and repaid $150 million of long-term debt at maturity.
Cash from Operations
In 2009, consolidated cash flow from operations was $724.7 million, which was positively impacted by $136.6 million associated with net recoveries of deferred costs, primarily fuel and purchased power, under FPSC-approved recovery clauses. Cash from operations reflects a $6.7 million contribution to the pension plan in 2009.
51
Table of Contents
We expect cash from operations in 2010 to be below the 2009 level. Although we expect higher net income in 2010, we expect the net recoveries under various regulatory clauses to reduce cash from operations. In November 2009, the FPSC approved recovery clause rates that provide for refunds to customers of estimated 2009 net over-recoveries of fuel and purchased power over the 12 months beginning Jan. 1, 2010 (see the Regulation section).
Cash from Investing Activities
Our investing activities in 2009 resulted in a net use of cash of $582.3 million, including capital expenditures totaling $639.8 million. We received $29.0 million in 2009 representing the proceeds from our ownership interest in the Guatemalan telecommunications provider, Navega. Investing activity in 2009 also included 16.1 million received primarily from the sale of student loan securities and other investments.
We expect capital spending for the next several years to be lower, primarily at Tampa Electric due to the 2009 completion of spending on combustion turbines to meet peak load needs and rail unloading facilities for the delivery of coal, and the completion of the fourth and final NOx control project in 2010. Spending to support customer growth at Tampa Electric and PGS is expected to be lower for several years due to the weak Florida economy and housing market. The economic recession and reduction in energy demand statewide has allowed the deferral of certain Central Florida transmission system upgrades (see the Tampa Electric and Capital Expenditures sections).
Cash from Financing Activities
Our financing activities in 2009 resulted in net use of cash of $108.6 million. Major items included $102.0 million of proceeds from Tampa Electric Company’s issuance of notes due in 2018, and the repayment of $38.0 million of short-term debt. We paid $170.8 million in common stock dividends, and we received $5.1 million from the sale of common stock from our dividend reinvestment program and exercises of stock options.
In 2010, Tampa Electric Company expects to utilize internally generated funds, equity contributions from TECO Energy, and short-term borrowings under its credit facilities to support its capital spending program and for normal working capital fluctuations. We have $100 million of floating rate notes maturing in 2010. See the Cash and Liquidity Outlook section below for a discussion of financing expectations in 2010 and beyond.
Cash and Liquidity Outlook
In general, we target to maintain consolidated liquidity (unrestricted cash on hand plus undrawn credit facilities) of at least $500 million. At Dec. 31, 2009 our consolidated liquidity was $659.2 million, consisting of $424.8 million at Tampa Electric Company, $215.0 million at TECO Energy parent and $19.4 million at the other consolidated operating companies. In addition, there was $24.1 million of unrestricted cash at the unconsolidated TECO Guatemala operating companies.
We expect our sources of cash in 2010 to include cash from operations at levels below 2009, due in large part to lower net recoveries under various regulatory clauses in 2010 as described above, partially offset by expected higher net income from the operating companies. We plan to use cash generated in 2010 to fund capital spending estimated at $445 million, and for dividends to shareholders. Because of the current favorable interest rate environment, we intend to refinance our $100 million of notes maturing in 2010.
Tampa Electric Company expects to utilize cash from operations and equity contributions from us to support its capital spending program, supplemented with minimal incremental utilization of its credit facilities. Our credit facilities contain certain financial covenants (see Covenants in Financing Agreements section). Although we expect the normal utilization of our credit facilities to be low, we estimate that we could fully utilize the total available capacity under our facilities in 2010 and remain within the covenant restrictions.
Beyond 2010, our long-term debt maturities for TECO Energy parent and TECO Finance total $364 million in 2011, $336 million in 2012, $200 million in 2015 and $300 million in 2017. Although we plan to retire a portion of these maturities with cash generated internally, because market conditions are currently favorable, on Feb. 22, 2010, we commenced a tender offer to ultimately refinance up to $300 million of the notes with new notes having longer maturities. Tampa Electric Company has two series of notes totaling $650 million maturing in 2012 and will need to issue replacement debt to fund those maturities. The existing bank credit facilities for both Tampa Electric Company and TECO Energy/TECO Finance expire in 2012.
Our expected cash flow could be affected by variables discussed in the individual operating company sections, such as customer growth and usage changes at our regulated businesses, and coal margins. In addition, actual fuel and other regulatory clause net recoveries will typically vary from those forecasted; however, the differences are generally recovered within the next calendar year. It is possible, however, that unforeseen cash requirements and/or shortfalls, or higher capital spending requirements could cause us to fall short of our liquidity target (see the Risk Factors section).
52
Table of Contents
The capital expenditures expected at Tampa Electric Company over the next several years will require additional equity contributions from TECO Energy in order to support the capital structure and financial integrity of the utilities. Tampa Electric Company expects to fund its capital needs with a combination of internally generated cash, and equity contributions from us. The 2007 sale of TECO Transport allowed us to use proceeds for the early implementation of parent debt retirement plans and positioned us to redeploy part of the cash planned for parent debt retirement in future years to Tampa Electric Company in the form of significant parent equity contributions in 2008. In addition, through 2012, we expect to realize significant cash benefits from the utilization of net operating loss carryforwards generated in 2004 and 2005 upon the disposition of merchant power assets to reduce federal and certain state income taxes and expect that our cash payment of income taxes in those years will be less than $3 million.
As a result of our significant debt retirements in 2007 and reduced business risk, we have improved our debt credit ratings and ratings outlooks (see Credit Ratings section). It is our intention to continue to improve our financial profile, with a goal of achieving additional ratings improvements. In the unlikely event Tampa Electric Company’s ratings were downgraded to below investment grade, counterparties to our derivative instruments could request immediate payment or full collateralization of net liability positions. If the credit risk related contingent features underlying these derivative instruments were triggered as of Dec. 31, 2009, we could have been required to post additional collateral or settle existing positions with counterparties totaling $37 million, including Tampa Electric Company positions of $36 million. In addition, credit provisions in long-term gas transportation agreements of Tampa Electric and PGS would give the transportation providers the right to demand collateral which we estimate to be approximately $52 million. None of our credit facilities or financing agreements has ratings downgrade covenants, which would require immediate repayment or collateralization; however in the event of a downgrade our interest expense could be higher.
Credit Facilities
At Dec. 31, 2009 and 2008, the following credit facilities and related borrowings existed:
| Dec. 31, 2009 | Dec. 31, 2008 | |||||||||||||||||||
| (millions) |
Credit Facilities |
Borrowings Outstanding (1) |
Letters of Credit Outstanding |
Credit Facilities |
Borrowings Outstanding (1) |
Letters of Credit Outstanding | ||||||||||||||
| Tampa Electric |
5-year facility | $ | 325.0 | $ | 55.0 | $ | 0.7 | $ | 325.0 | $ | — | $ | 1.4 | |||||||
| 1-year accounts receivable facility |
150.0 | — | — | 150.0 | 29.0 | — | ||||||||||||||
| TECO Finance |
5-year facility | 200.0 | — | 6.9 | 200.0 | 64.0 | 7.1 | |||||||||||||
| Total |
$ | 675.0 | $ | 55.0 | $ | 7.6 | $ | 675.0 | $ | 93.0 | $ | 8.5 | ||||||||
| (1) | Borrowings outstanding are reported as notes payable. |
Credit facilities, including the one-year accounts receivable facility which was renewed in February 2010, require commitment fees ranging from 7.0 to 60.0 basis points. The weighted average interest rates on outstanding notes payable under the credit facilities at Dec. 31, 2009 and 2008 were 0.66% and 2.65%, respectively.
At Dec. 31, 2009, TECO Finance had a $200 million bank credit facility in place guaranteed by TECO Energy with a maturity date in May 2012. Tampa Electric Company had a bank credit facility totaling $325 million, also maturing in May 2012. In addition, Tampa Electric Company had a $150 million accounts receivable securitized borrowing facility with a maturity date in March 2010. The TECO Finance and Tampa Electric Company bank credit facilities include sub-limits for letters of credit of $200 million and $50 million, respectively. At Dec. 31, 2009, the TECO Finance credit facility was undrawn and $6.9 million of letters of credit were outstanding. At Dec. 31, 2009, $55.0 million was drawn on the Tampa Electric Company credit facilities and $0.7 million of letters of credit were outstanding. These credit facilities have financial covenants as identified in Covenants in Financing Agreements section.
At current ratings, TECO Finance’s and Tampa Electric Company’s bank credit facilities require commitment fees of 12.5 basis points and 7.0 basis points, respectively, and drawn amounts are charged interest at LIBOR plus 55.0 – 60.0 basis points and 35.0 – 40.0 basis points, respectively. At Dec. 31, 2009, the LIBOR interest rate was 0.23%.
Tampa Electric Company and TEC Receivables Corp. (TRC), a wholly-owned subsidiary of Tampa Electric Company, have a $150 million accounts receivable collateralized borrowing facility. Under this facility, Tampa Electric Company sells and/or contributes to TRC all of its receivables for the sale of electricity or gas to its customers and related rights. The receivables are sold by Tampa Electric Company to TRC at a discount, which was initially 2%. The discount is subject to adjustment for future sales to reflect changes in prevailing interest rates and collection experience. TRC is consolidated in the financial statements of Tampa Electric Company and TECO Energy.
Under a Loan and Servicing Agreement, TRC may borrow up to $150 million to fund its acquisition of the receivables under the facility, and TRC secures such borrowings with a pledge of all of its assets, including the receivables. Tampa Electric Company acts as the servicer to service the collection of the receivables. TRC pays program and liquidity fees based on Tampa Electric
53
Table of Contents
Company’s credit ratings, which total 100 basis points under its renewed facility. Interest rates on the borrowings are based on prevailing asset-backed commercial paper rates, unless such rates are not available from conduit lenders, or under certain circumstances upon a change of accounting rules applicable to the lenders, in which case the rates will be at an interest rate equal to, at Tampa Electric Company’s option, either Citibank’s prime rate (or the federal funds rate plus 50 basis points, if higher) or a rate based on the London interbank deposit rate (if available) plus a margin. The facility includes the following financial covenants: (1) at each quarter-end, Tampa Electric Company’s debt-to-capital ratio, as defined in the agreement, must not exceed 65%; and (2) certain dilution and delinquency ratios with respect to the receivables (see the Covenants in Financing Agreements section). Tampa Electric Company renewed this facility Feb. 19, 2010 with a Feb. 18, 2011 maturity date.
Covenants in Financing Agreements
In order to utilize their respective bank credit facilities, TECO Energy/Finance and Tampa Electric Company must meet certain financial tests as defined in the applicable agreements (see the Credit Facilities section). In addition, TECO Energy, TECO Finance, Tampa Electric Company, and other operating companies have certain restrictive covenants in specific agreements and debt instruments. At Dec. 31, 2009, TECO Energy, TECO Finance, Tampa Electric Company, and the other operating companies were in compliance with all required financial covenants. The table that follows lists the significant financial covenants and the performance relative to them at Dec. 31, 2009. Reference is made to the specific agreements and instruments for more details.
TECO Energy Significant Financial Covenants
| (millions, unless otherwise indicated) | ||||||
| Instrument |
Financial Covenant (1) |
Requirement/Restriction |
Calculation at Dec. 31, 2009 | |||
| Tampa Electric Company |
||||||
| PGS senior notes | EBIT/interest (2) | Minimum of 2.0 times | 3.2 times | |||
| Restricted payments | Shareholder equity at least $500 | $2,104 | ||||
| Funded debt/capital | Cannot exceed 65% | 49.8% | ||||
| Sale of assets | Less than 20% of total assets | 0% | ||||
| Credit facility (3) | Debt/capital | Cannot exceed 65% | 49.4% | |||
| Accounts receivable credit facility (3) |
Debt/capital | Cannot exceed 65% | 49.4% | |||
| 6.25% senior notes | Debt/capital | Cannot exceed 60% | 49.4% | |||
| Limit on liens (4) | Cannot exceed $700 | $0 liens outstanding | ||||
| Insurance agreement relating to certain pollution bonds |
Limit on liens (4) | Cannot exceed $429 (7.5% of net assets) | $0 liens outstanding | |||
| TECO Energy/TECO Finance |
||||||
| Credit facility | EBITDA/interest (2) | Minimum of 2.6 times | 3.9 times | |||
| TECO Energy floating rate and 6.75% notes and TECO Finance 6.75% notes |
Restrictions on secured debt (6) | (5) | (5) | |||
| TECO Diversified |
||||||
| Coal supply agreement guarantee | Dividend restriction | Net worth not less than $298 | ||||
| (40% of tangible net assets) | $555 | |||||
| (1) | As defined in each applicable instrument. |
| (2) | EBIT generally represents earnings before interest and taxes. EBITDA generally represents EBIT before depreciation and amortization. However, in each circumstance, the term is subject to the definition prescribed under the relevant agreements. |
| (3) | See description of the Tampa Electric Company accounts receivable credit facilities (see Note 6 and Note 26 to the TECO Energy Consolidated Financial Statements). |
| (4) | If the limitation on liens is exceeded the company is required to provide ratable security to the holders of these notes. |
| (5) | The indentures for these notes contain restrictions which limit secured debt of TECO Energy if secured by Principal Property or Capital Stock or indebtedness of directly held subsidiaries (with exceptions as defined in the indentures) without equally and ratably securing these notes. |
| (6) | These limitations would not include first mortgage bonds of Tampa Electric if any were outstanding. |
Credit Ratings of Senior Unsecured Debt at Dec. 31, 2009
| Standard & Poor’s | Moody’s | Fitch | ||||
| Tampa Electric Company |
BBB | Baa1 | BBB+ | |||
| TECO Energy/TECO Finance |
BBB- | Baa3 | BBB- |
On May 6, 2009, Standard & Poor’s Rating Services changed its corporate credit rating on TECO Energy, TECO Finance and Tampa Electric Company to BBB from BBB- and changed its outlook to stable from positive. This upgrade resulted in credit ratings for the senior unsecured debt of TECO Energy and TECO Finance of BBB-. This upgrade returned TECO Energy’s senior unsecured credit rating to investment grade at these three credit rating agencies. As a result many, but not all, of the restrictive covenants in various financing arrangements are no longer applicable.
54
Table of Contents
On May 15, 2009 Moody’s Investors Service upgraded Tampa Electric Company’s senior unsecured debt to Baa1 from Baa2 and changed its outlook to stable from positive. At the same time Moody’s affirmed the ratings for TECO Energy and TECO Finance with stable outlooks at both.
On Jun. 1, 2009, Fitch Ratings affirmed the outstanding ratings of TECO Energy, TECO Finance and Tampa Electric Company, and the outlook remained stable.
All three rating agencies cited the March and May decisions by the FPSC in the base rate proceedings for Tampa Electric and PGS, respectively, as being supportive of credit quality.
Standard & Poor’s, Moody’s and Fitch describe credit ratings in the BBB or Baa category as representing adequate capacity for payment of financial obligations. The lowest investment grade credit ratings for Standard & Poor’s is BBB-, for Moody’s is Baa3 and for Fitch is BBB-; thus all three credit rating agencies assign TECO Energy, TECO Finance and Tampa Electric Company’s senior unsecured debt investment grade ratings.
A credit rating agency rating is not a recommendation to buy, sell or hold securities and may be subject to revision or withdrawal at any time by the assigning rating agency. Any future downgrades in credit ratings may affect our ability to borrow and may increase financing costs, which may decrease earnings (see the Risk Factors section).
Summary of Contractual Obligations
The following table lists the obligations of TECO Energy and its subsidiaries for cash payments to repay debt, lease payments and unconditional commitments related to capital expenditures. This table does not include contingent obligations, which are discussed in a subsequent table.
Contractual Cash Obligations at Dec. 31, 2009
| Payments Due by Period | ||||||||||||||||||
| (millions) |
Total | 2010 | 2011 | 2012 | 2013-2014 | After 2014 | ||||||||||||
| Long-term debt (1) |
||||||||||||||||||
| Recourse |
$ | 3,302.1 | $ | 106.5 | $ | 366.9 | $ | 989.8 | $ | 144.0 | $ | 1,694.9 | ||||||
| Non-recourse (2) |
7.6 | 1.4 | 1.5 | 1.5 | 3.2 | — | ||||||||||||
| Operating leases/rentals (3) |
50.8 | 10.3 | 8.0 | 4.7 | 4.9 | 22.9 | ||||||||||||
| Net purchase obligations/commitments (4) |
314.1 | 156.3 | 41.8 | 39.1 | 76.7 | 0.2 | ||||||||||||
| Interest payment obligations (5) |
1,782.0 | 209.9 | 193.8 | 160.0 | 221.9 | 996.4 | ||||||||||||
| Pension plans (6) |
251.6 | 41.5 | 89.6 | 46.3 | 74.2 | — | ||||||||||||
| Total contractual obligations |
$ | 5,708.2 | $ | 525.9 | $ | 701.6 | $ | 1,241.4 | $ | 524.9 | $ | 2,714.4 | ||||||
| (1) | Includes debt at TECO Energy, TECO Finance, Tampa Electric, PGS and the other operating companies (see Note 7 to the TECO Energy Consolidated Financial Statements for a list of long-term debt and the respective due dates). Does not include debt at the deconsolidated Guatemalan affiliates. |
| (2) | Reflects an intercompany loan at TECO Guatemala between its consolidated Cayman Island entity and an unconsolidated Guatemalan affiliate. |
| (3) | The table above excludes payment obligations under contractual agreements of Tampa Electric and PGS for fuel, fuel transportation and power purchases, which are recovered under regulatory clauses approved by the FPSC annually (see the Regulation section). One of these agreements, in accordance with accounting standards for arrangements that contain a lease has been determined to contain a lease (see Note 12 to the TECO Energy Consolidated Financial Statements). |
| (4) | Reflects those contractual obligations and commitments considered material to the respective operating companies, individually. At the end of 2009, these commitments include Tampa Electric’s outstanding commitments for materials and installation related to the NOx control equipment or other major projects, long-term capitalized maintenance agreements for its combustion turbines, and commitments related to the SeaCoast pipeline and associated lateral. |
| (5) | Includes variable rate notes at interest rates as of Dec. 31, 2009. |
| (6) | The total includes the estimated minimum required contributions to the qualified pension plan as of the measurement date and incremental amounts estimated to achieve certain funding levels. Future contributions are included but they are subject to annual valuation reviews, which may vary significantly due to changes in interest rates, discount rate assumptions, plan asset performance, which is affected by stock market performance and other factors (see Liquidity, Capital Resources section and Note 5 to the TECO Energy Consolidated Financial Statements). |
55
Table of Contents
Summary of Contingent Obligations
The following table summarizes the letters of credit and guarantees outstanding that are not included in the Summary of Contractual Obligations table above and not otherwise included in our Consolidated Financial Statements. These amounts represent guarantees by TECO Energy on behalf of consolidated subsidiaries. TECO Energy has no guarantees outstanding on behalf of unconsolidated or unrelated parties.
Contingent Obligations at Dec. 31, 2009
| (millions) |
Commitment Expiration | |||||||||||||||||||
| Total | 2010 | 2011 | 2012 | 2013 – 2014 | After 2014 (1) | |||||||||||||||
| Letters of credit |
$ | 7.6 | $ | — | $ | — | $ | — | $ | — | $ | 7.6 | ||||||||
| Guarantees |
Fuel purchase/energy management (2) |
129.7 | — | — | — | — | 129.7 | |||||||||||||
| Other |
1.4 | — | — | — | — | 1.4 | ||||||||||||||
| Total contingent obligations |
$ | 138.7 | $ | — | $ | — | $ | — | $ | — | $ | 138.7 | ||||||||
| (1) | These guarantees renew annually and are shown on the basis that they will continue to renew beyond 2014. |
| (2) | The amounts shown are the maximum theoretical amounts guaranteed under current agreements. |
Capital Expenditures
| Actual | Forecast | ||||||||||||||
| (millions) |
2009 | 2010 | 2011 | 2012 – 2014 | 2010 – 2014 Total | ||||||||||
| Tampa Electric |
|||||||||||||||
| Transmission |
$ | 36 | $ | 45 | $ | 40 | $ | 105 | $ | 190 | |||||
| Distribution |
103 | 85 | 85 | 285 | 455 | ||||||||||
| Generation |
205 | 125 | 140 | 415 | 680 | ||||||||||
| Committed generation expansion |
89 | — | — | — | — | ||||||||||
| Proposed generation expansion (1) |
— | — | — | — | — | ||||||||||
| Other |
30 | 25 | 35 | 90 | 150 | ||||||||||
| NOX control projects |
53 | 15 | — | — | 15 | ||||||||||
| Other environmental |
4 | 10 | 15 | 55 | 80 | ||||||||||
| Tampa Electric total |
520 | 305 | 315 | 950 | 1,570 | ||||||||||
| Net cash effect of accruals and retentions |
13 | — | — | — | — | ||||||||||
| Tampa Electric net |
533 | 305 | 315 | 950 | 1,570 | ||||||||||
| PGS |
51 | 50 | 50 | 150 | 250 | ||||||||||
| Unregulated companies (2) |
56 | 95 | 45 | 145 | 285 | ||||||||||
| Total |
$ | 640 | $ | 450 | $ | 410 | $ | 1,245 | $ | 2,105 | |||||
| (1) | See Tampa Electric Generating Capacity Additions discussion below. |
| (2) | Represents the capital expenditures of TECO Coal, Seacoast LLC and the consolidated operations of TECO Guatemala. |
TECO Energy’s 2009 capital expenditures of $639.8 million included $533 million at Tampa Electric, including $13.8 million of AFUDC-debt and equity and $13 million of amounts paid in 2009 but incurred in a prior period. Capital expenditures at PGS were $51 million in 2009. Tampa Electric’s capital expenditures in 2009 were primarily for equipment and facilities to meet limited customer growth, generating equipment maintenance, capital expenditures required for construction of additional generating capacity in the form of five peaking units, a rail coal unloading facility, environmental compliance, and NOx control projects (see the Environmental Compliance section). Capital expenditures for PGS were approximately $33 million for system expansion and approximately $18 million for maintenance of the existing system. TECO Coal’s capital expenditures included $24 million primarily for normal mining equipment replacement, and $23 million for new mine development.
TECO Energy estimates capital spending for ongoing operations to be $450 million for 2010 and approximately $1.6 billion during the 2011 – 2014 period.
For 2010, Tampa Electric expects to spend $305 million. For the transmission and distribution systems Tampa Electric expects to spend $130 million in 2010, including approximately $88 million for normal transmission and distribution system expansion and reliability, $22 million for transmission and distribution system storm hardening, and $20 million for expansion and improvements to Tampa Electric’s high-voltage transmission system. Capital expenditures for the existing generating facilities of $125 million include approximately $30 million for repair and refurbishments of combustion turbines under long-term agreements
56
Table of Contents
with equipment manufacturers; approximately $35 million in major improvements to the coal-fired Big Bend Unit 1 to take advantage of the extended outage to install NOx control equipment, $10 million for a reclaimed water pipeline to eliminate ground water usage at the Polk Power Station, and $50 million for other improvements and refurbishments to generating units. In addition, Tampa Electric expects to spend the final $15 million for the addition of SCR equipment at the Big Bend Power Station for NOx control, and $10 million for other environmental compliance programs in 2010. The Environmental Consent Decree compliance expenditures are eligible for recovery of depreciation and a return on investment through the ECRC (see the Environmental Compliance section).
In the 2011 – 2014 period, Tampa Electric expects to spend $45 million for the completion of the reclaimed water pipeline project at the Polk Power Station. Capital spending for environmental compliance is expected to average almost $20 million annually in the same period. In addition to the above amounts, Tampa Electric expects to spend approximately $285 million annually to support normal system growth and reliability in the 2011 – 2014 period. This level of ongoing capital expenditures reflects the costs for materials and contractors, long-term regulatory requirements for storm hardening, and an active program of transmission and distribution system upgrades which will occur over the forecast period. These programs and requirements include: approximately $35 million annually for repair and refurbishments of combustion turbines under long-term agreements with equipment manufacturers; average annual expenditures of more than $90 million to support generating unit availability and reliability; average annual expenditures of $25 million for general infrastructure to support customers; average annual expenditures of more than $20 million for transmission and distribution system storm hardening; approximately $25 million annually for transmission system reliability and capacity improvements; and an average of about $90 million annually for distribution system reliability and to meet the expected resumption of modest customer growth after 2010.
Capital expenditures for PGS are expected to be about $50 million in 2010 and $200 million during the 2011 – 2014 period. Included in these amounts is an average of approximately $25 million annually for projects associated with customer growth and system expansion. The remainder represents capital expenditures for ongoing renewal, replacement and system safety.
The unregulated companies expect to invest $95 million in 2010 and $190 million during the 2011 – 2014 period. Included in these amounts are expenditures for coal mine development to maintain production, compliance with new safety requirements under the MINER Act, and for normal coal mining equipment renewal and replacement at TECO Coal. Included in the 2010 forecast are $45 million of capital expenditures associated with the construction of the Seacoast LLC natural gas pipeline in northeast Florida, which is expected to be completed in late 2010.
Tampa Electric—Generating Capacity Additions
In 2009, Tampa Electric completed the construction of five peaking capacity combustion turbines at the Bayside and Big Bend power stations, with a total project cost of approximately $195 million, excluding AFUDC. These units were used to meet the summer peak demand requirements in 2009 and the new winter peak experienced in January 2010. One combustion turbine at each of the facilities is configured to meet the NERC black start requirements for system reliability.
Due to the dramatic slowdown in the Florida and national economies and the Florida housing market, Tampa Electric has deferred new baseload capacity until beyond the current forecast period. Tampa Electric may require peaking capacity in the 2013 period, after the expiration of the purchased power agreement with the Hardee Power Station in Central Florida. If demand growth resumes and additional generating capacity is required, Tampa Electric may construct this additional peaking capacity or seek to purchase power rather than build based on the economics (see the Tampa Electric and Regulation sections). If Tampa Electric builds this capacity, capital expenditures would start in 2012.
Pending action by the U.S. Congress or the Florida Legislature on a national or Florida renewable portfolio standard (RPS), the need for additional capital spending for renewable generating resources to meet the requirements of a RPS is likely but not yet defined (see the Environmental Compliance section). Depending on the final federal or state rules, which may be enacted in 2010, Tampa Electric may need to invest capital to develop additional sources of renewable power generation.
The forecast capital expenditures shown above are based on our current estimates and assumptions for normal maintenance capital at the operating companies; capital expenditures to support normal system reliability and growth at Tampa Electric and PGS; the programs for transmission and distribution system storm hardening and transmission system reliability requirements; and incremental investments above normal maintenance capital to expand the PGS system, the Seacoast LLC pipeline construction, and production capacity at TECO Coal. Actual capital expenditures could vary materially from these estimates due to changes in costs for materials or labor or changes in plans (see the Risk Factors section).
Financing Activity
Our year-end 2009 consolidated capital structure was 62% senior debt and 38% common equity. The debt-to-total-capital ratio has improved significantly over the past three years, primarily due to the repayment of $765 million of parent and parent guaranteed debt in 2007, as well as the increase in retained earnings due to the gain on the sale of TECO Transport in 2007. At Dec. 31, 2009, Tampa Electric Company’s year-end capital structure was 49% debt and 51% common equity.
57
Table of Contents
In 2009, we issued no new long-term debt at the TECO Energy parent level or at TECO Finance. We raised $5.1 million of equity primarily through our dividend reinvestment plan.
In July 2009, Tampa Electric Company completed an offering of $100 million aggregate principal amount of 6.10% Notes due May 15, 2018. These notes were sold at 102.988% of par. The offering resulted in net proceeds (after deducting underwriting discounts and commissions and estimated offering expenses) of approximately $102.0 million. Net proceeds were used to repay short-term debt and for general corporate purposes.
In May 2008, Tampa Electric Company issued $150 million aggregate principal amount of 6.10% Notes due May 15, 2018. The notes were sold at par. The offering resulted in net proceeds (after deducting underwriting discounts and commissions and estimated offering expenses) of approximately $148.7 million. Net proceeds were used for general corporate purposes. In connection with this debt offering, Tampa Electric Company settled interest rate swaps entered into in 2007 for $11.8 million. These amounts will be reclassified to interest expense over the 10-year term of the related debt, resulting in an effective interest rate of 6.89%.
In March 2008, in response to the turmoil in the auction rate securities market, the Hillsborough County Industrial Development Authority (HCIDA) remarketed $86.0 million Pollution Control Revenue Refunding Bonds (Tampa Electric Company Project), Series 2006, in a fixed-rate mode. The bonds, which previously had been in auction rate mode, bear interest at 5.00% per annum and are subject to mandatory tender for purchase on Mar. 15, 2012 from the proceeds of a remarketing of the bonds. Tampa Electric Company is responsible for payment of the interest and principal associated with the bonds. Regularly scheduled principal and interest, when due, are insured by Ambac Assurance.
Also in March 2008, Tampa Electric Company purchased in lieu of redemption $75.0 million Polk County Industrial Development Authority (PCIDA) Solid Waste Disposal Revenue Refunding Bonds (Tampa Electric Company Project), Series 2007 and $125.8 million HCIDA Pollution Control Revenue Refunding Bonds (Tampa Electric Company Project), Series 2007A, B and C (collectively, the “2007 Bonds”). Also on that date, the Insurance Agreement with Financial Guaranty Insurance Company (FGIC), pursuant to which FGIC issued a financial guaranty insurance policy for the 2007 HCIDA Bonds, was terminated. Tampa Electric Company also entered into a corresponding First Supplemental Loan and Trust Agreement regarding the removal of the bond insurance on the 2007 HCIDA Bonds. After these changes to the 2007 HCIDA Bonds, Tampa Electric Company remarketed the $54.2 million 2007 Series A and the $51.6 million 2007 Series B Bonds in long-term interest rate modes. The $54.2 million 2007 Series A bonds, which previously had been in auction rate mode, bear interest at 5.65% per annum until maturity on Mar. 15, 2018. The $51.6 million 2007 Series B bonds, which previously had been in auction rate mode, bear interest at 5.15% per annum and will be subject to mandatory tender on Sep. 1, 2013 from the proceeds of a remarketing of the bonds. Tampa Electric Company is responsible for payment of the interest and principal associated with the 2007 Bonds.
As a result of these transactions, $95.0 million of the bonds purchased in lieu of redemption were held by the trustee at the direction of Tampa Electric Company as of Dec. 31, 2009 (the “Held Bonds”) to provide an opportunity to evaluate refinancing alternatives. The Held Bonds effectively offset the outstanding debt balances and are presented net on the balance sheet.
Off-Balance Sheet Debt at Dec. 31, 2009
Unconsolidated affiliates had project debt balances as follows at Dec. 31, 2009. The San José Power Station financing is a non-recourse project loan, and the debt associated with DECA II is general corporate debt at DECA II; all of this debt is held at the project entity level. Although we are not directly obligated on the debt, our equity interest in those unconsolidated affiliates and its commitments with respect to those projects are at risk if interest and principal payments on these loans are not made timely. Our equity investment in TECO Guatemala was $361.1 million at Dec. 31, 2009.
| (millions) |
Long-term Debt | Ownership Interest | ||||
| TECO Guatemala |
||||||
| San José Power Station |
$ | 54.4 | 100 | % | ||
| DECA II |
$ | 174.3 | 30 | % | ||
The equity method of accounting is used to account for investments in partnership and corporate entities in which we, our subsidiary companies, do not have either a majority ownership or exercise control.
We deconsolidated the project entities for the San José and Alborada power stations in the first quarter of 2004 as a result of implementing the accounting guidance for variable interest entities. The San José Power Station is partially financed with non-recourse debt, which following the deconsolidation was considered to be off-balance sheet financing. As a result of new accounting standards regarding variable interest entities, effective Jan. 1, 2010 we are re-consolidating the San José and Alborada project entities, including the $54.4 million of debt shown in the table above (see the Critical Accounting Policies and Estimates section).
58
Table of Contents
CRITICAL ACCOUNTING POLICIES AND ESTIMATES
The preparation of consolidated financial statements requires management to make various estimates and assumptions that affect revenues, expenses, assets, liabilities, and the disclosure of contingencies. The policies and estimates identified below are, in the view of management, the more significant accounting policies and estimates used in the preparation of our consolidated financial statements. These estimates and assumptions are based on historical experience and on various other factors that are believed to be reasonable under the circumstances, the results of which form the basis for making judgments about the carrying values of assets and liabilities that are not readily apparent from other sources. Actual results may differ from these estimates and judgments under different assumptions or conditions. See Note 1 to the TECO Energy Consolidated Financial Statements for a description of our significant accounting policies and the estimates and assumptions used in the preparation of the consolidated financial statements.
Deferred Income Taxes
We use the liability method in the measurement of deferred income taxes. Under the liability method, we estimate our current tax exposure and assess the temporary differences resulting from differing treatment of items, such as depreciation for financial statement and tax purposes. These differences are reported as deferred taxes measured at current rates in the consolidated financial statements. Management reviews all reasonably available current and historical information, including forward-looking information, to determine if it is more likely than not that some or all of the deferred tax asset will not be realized. If we determine that it is likely that some or all of a deferred tax asset will not be realized, then a valuation allowance is recorded to report the balance at the amount expected to be realized.
At Dec. 31, 2009, we had net deferred income tax assets of $222.7 million, attributable primarily to property-related items, alternative minimum tax credit carryforwards, operating loss carryforwards, capital loss carryforwards, foreign tax credits and a valuation allowance. Based primarily on historical income levels and the steady growth expectations for future earnings of the company’s core utility operations, management has determined that the net deferred tax assets recorded at Dec. 31, 2009 will be realized in future periods.
We believe that the accounting estimate related to deferred income taxes, and any related valuation allowance, is a critical estimate for the following reasons: 1) realization of the deferred tax asset is dependent upon the generation of sufficient taxable income, both operating and capital, in future periods; 2) a change in the estimated valuation reserves could have a material impact on reported assets and results of operations; and 3) administrative actions of the IRS or the U.S. Treasury or changes in law or regulation could change our deferred tax levels, including the potential for elimination or reduction of our ability to utilize the deferred tax assets (see Note 4 to the TECO Energy Consolidated Financial Statements).
In June 2006, the Financial Accounting Standards Board (FASB) issued guidance that prescribes a recognition threshold and measurement attribute for financial statement recognition and measurement of a tax position taken or expected to be taken in a tax return, and also provides guidance on derecognition, classification, interest and penalties, accounting in interim periods, disclosure, and transition. See further discussion of Uncertainty in Income Taxes in Note 4 to the TECO Energy Consolidated Financial Statements.
Employee Postretirement Benefits
We sponsor a defined benefit pension plan (pension plan) that covers substantially all of our employees. In addition, we have unfunded non-qualified, non-contributory supplemental executive retirement benefit plans available to certain senior management. Several statistical and other factors, which attempt to anticipate future events, are used in calculating the expense and liability related to these plans. Key factors include assumptions about the expected rates of return on plan assets, salary increases and discount rates. These factors are determined by us within certain guidelines and with the help of external consultants. We consider market conditions, including changes in investment returns and interest rates, in making these assumptions.
We believe that the accounting related to employee postretirement benefits is a critical accounting estimate for the following reasons: 1) a change in the estimated benefit obligation could have a material impact on reported assets, accumulated other comprehensive income and results of operations; and 2) changes in assumptions could change our annual pension funding requirements, having significant impact on our annual cash requirements.
Pension plan assets (plan assets) are invested in a mix of equity and fixed income securities. The expected return on assets assumption was based on expectations of long-term inflation, real growth in the economy, fixed income spreads and equity premiums consistent with our portfolio, with provision for active management and expenses paid from the trust. The discount rate assumption is based on a cash flow matching technique developed by our outside actuaries and reflects current economic conditions. This technique matches the yields from high-quality (AA-rated, non-callable) corporate bonds to the company’s projected cash flows for the pension plan to develop a present value that is converted to a discount rate assumption, which is subject to change each year. The salary increase assumption was based on the same underlying expectation of long-term inflation together with assumptions regarding real growth in wages and company-specific merit and promotion increases. Holding all other
59
Table of Contents
assumptions constant, a 1% increase or decrease in the assumed rate of return on plan assets would have increased or decreased 2009 net income by approximately $2.8 million. Likewise, a 1.0% increase or decrease in the discount rate assumption would have resulted in an approximately $2.5 million increase or a $2.4 million decrease in 2009 net income, respectively. For 2010, a 1% increase in the discount rate assumption would result in an approximately $4.4 million decrease in the expected pension cost. A 1% decrease in the assumed rate of return on plan assets would result in an approximately $4.4 million increase in expected pension cost.
Unrecognized actuarial gains and losses are being recognized over a period of up to 15 years, which represents the expected remaining service life of the employee group. Unrecognized actuarial gains and losses arise from several factors including experience and assumption changes in the obligations and from the difference between expected return and actual returns on plan assets. These unrecognized gains and losses will be systematically recognized in future net periodic pension expense in accordance with applicable accounting guidance for pensions. Our policy is to fund the plan based on the required contribution determined by our actuaries within the guidelines set by the Employee Retirement Income Security Act of 1974 (ERISA), as amended.
In addition, we currently provide certain postretirement health care and life insurance benefits for substantially all employees retiring after age 50 who meet certain service requirements. The key assumptions used in determining the amount of obligation and expense recorded for postretirement benefits other than pension (OPEB), under the applicable accounting guidance, include the assumed discount rate and the assumed rate of increases in future health care costs. The discount rate used to determine the obligation for these benefits matched the discount rate used in determining our pension obligation in 2008; however, in 2009 we elected to determine the discount rate for the OPEB using that individual plan’s projected benefit cash flow rather than using the same discount rate that was determined for the pension plan. In estimating the health care cost trend rate, we consider our actual health care cost experience, future benefit structures, industry trends, and advice from our outside actuaries. We assume that the relative increase in health care cost will trend downward over the next several years, reflecting assumed increases in efficiency in the health care system and industry-wide cost containment initiatives. In December 2003, the Medicare Prescription Drug, Improvement and Modernization Act of 2003 (the Act) was enacted. The Act established a prescription drug benefit under Medicare, known as Medicare Part D, and a federal subsidy to sponsors of retiree health care benefit plans that provide a prescription benefit, which is at least actuarially equivalent to Medicare Part D. In May 2004, the FASB issued guidance that required: 1) that the effects of the federal subsidy be considered an actuarial gain and recognized in the same manner as other actuarial gains and losses and 2) certain disclosures for employers that sponsor postretirement health care plans that provide prescription drug benefits.
We adopted the guidance retroactive to the second quarter of 2004 for benefits provided that we believe to be actuarially equivalent to Medicare Part D. The expected subsidy reduced the accumulated postretirement benefit obligations (APBO) at Dec. 31, 2009 by $33.0 million and increased net income for 2009 by $1.3 million. In 2009, we filed for and received a Part D subsidy of $0.9 million.
The assumed health care cost trend rate for medical costs was 8.50% in 2009 and decreases to 5.00% in 2016 and thereafter. A 1% increase in the health care trend rates would have produced a 2.3% increase in the aggregate service and interest cost for 2009, which would have decreased net income $0.2 million, and a 3.6% increase in the accumulated postretirement benefit obligation as of Dec. 31, 2009, the measurement date.
A 1% decrease in the health care trend rates would have produced a 2.0% decrease in the aggregate service and interest cost for 2009, which would have increased net income $0.2 million, and a 2.9% decrease in the accumulated postretirement benefit obligation as of Dec. 31, 2009, the measurement date.
The actuarial assumptions we used in determining our pension and OPEB retirement benefits may differ materially from actual results due to changing market and economic conditions, higher or lower withdrawal rates, or longer or shorter life spans of participants. While we believe that the assumptions used are appropriate, differences in actual experience or changes in assumptions may materially affect our financial position or results of operations.
See the discussion of Employee Postretirement Benefits in Note 5 to the TECO Energy Consolidated Financial Statements.
Evaluation of Assets for Impairment
Long-Lived Assets
In accordance with accounting guidance for long-lived assets, we assess whether there has been an other-than-temporary impairment of our long-lived assets and certain intangibles held and used by us when such indicators exist. We annually review all long-lived assets in the last quarter of each year to ensure that any gradual change over the year and the seasonality of the markets are considered when determining which assets require an impairment analysis. We believe the accounting estimates related to asset impairments are critical estimates for the following reasons: 1) the estimates are highly susceptible to change, as management is required to make assumptions based on expectations of the results of operations for significant/indefinite future periods and/or the then current market conditions in such periods; 2) markets can experience significant uncertainties; 3) the estimates are based on the ongoing expectations of management regarding probable future uses and holding periods of assets; and 4) the impact of an impairment on reported assets and earnings could be material. Our assumptions relating to future results of operations or other
60
Table of Contents
recoverable amounts are based on a combination of historical experience, fundamental economic analysis, observable market activity and independent market studies. Our expectations regarding uses and holding periods of assets are based on internal long-term budgets and projections, which give consideration to external factors and market forces, as of the end of each reporting period. The assumptions made are consistent with generally accepted industry approaches and assumptions used for valuation and pricing activities.
At Dec. 31, 2009, there were no indications of impairment for any of the company’s long-lived assets.
Goodwill and Other Intangible Assets
Under the accounting guidance for goodwill and other intangible assets, goodwill is not subject to amortization. Rather, goodwill and intangible assets with an indefinite life are subject to an annual (or more frequently if events and circumstances indicate a possible impairment) assessment for impairment at the reporting unit level. Reporting units are generally determined as one level below the operating segment level; reporting units with similar characteristics are grouped for the purpose of determining the impairment, if any, of goodwill and other intangible assets.
At Dec. 31, 2009, the company had $59.4 million of goodwill on its balance sheet, which is reflected in the TECO Guatemala segment. This goodwill balance arose from the purchase of multiple entities as a result of the company’s investments in its San José and Alborada power plants ($52.4 million and $3.1 million, respectively), and its equity investment in DECA II ($3.9 million). Since these three investments are one level below the operating segment level, discrete cash flow information is available, and management regularly reviews their operating results separately. This is the reporting unit level at which potential impairment is tested. Additionally, since San José and Alborada were deconsolidated as a result of accounting guidance for variable interest entities, these were considered equity investments and any potential impairment is tested under accounting guidance for equity investments, along with TECO Guatemala’s investment at DECA II (see the discussion below and Notes 17 and 18 to the TECO Energy Consolidated Financial Statements).
As a result of the new accounting guidance for variable interest entities effective Jan. 1, 2010, the San José and Alborada project entities will be re-consolidated as of Jan. 1, 2010. While these entities remain consolidated, their associated goodwill will be subject to annual assessments for impairment.
Equity Investments
Equity investments, including their associated goodwill, and any potential impairment are tested under the accounting guidance for equity investments. Under this guidance, an impairment charge must be recorded if the investment has experienced a loss in value that is considered an “other than temporary” decline in value.
The evaluation and measurement of equity investment impairments involve the same uncertainties as described above for long-lived assets that we own directly. Similarly, the estimates that we make with respect to our equity investments are subject to variation, and the impact of such variations could be material. Additionally, if the entities in which we hold these investments recognize an impairment of a long-lived asset, we would record our proportionate share of that impairment loss and would evaluate our equity investment for an other than temporary decline in value (see Note 18 to the TECO Energy Consolidated Financial Statements).
Regulatory Accounting
Tampa Electric’s and PGS’ retail businesses and the prices charged to customers are regulated by the FPSC. Tampa Electric’s wholesale business is regulated by the Federal Energy Regulatory Commission (FERC). As a result, the regulated utilities qualify for the application of accounting guidance for certain types of regulation. This guidance recognizes that the actions of a regulator can provide reasonable assurance of the existence of an asset or liability. Regulatory assets and liabilities arise as a result of a difference between generally accepted accounting principles and the accounting principles imposed by the regulatory authorities. Regulatory assets generally represent incurred costs that have been deferred, as their future recovery in customer rates is probable. Regulatory liabilities generally represent obligations to make refunds to customers from previous collections for costs that are not likely to be incurred.
As a result of regulatory treatment and corresponding accounting treatment, we expect that the impact on utility costs and required investment associated with future changes in environmental regulations would create regulatory assets. Current regulation in Florida allows utility companies to recover from customers prudently incurred costs (including, for required capital investments, depreciation and a return on invested capital) for compliance with new environmental regulations through the ECRC (see the Environmental Compliance and Regulation sections).
We periodically assess the probability of recovery of the regulatory assets by considering factors such as regulatory environment changes, recent rate orders to other regulated entities in the same jurisdiction, the current political climate in the state, and the status of any pending or potential deregulation legislation. The assumptions and judgments used by regulatory authorities
61
Table of Contents
continue to have an impact on the recovery of costs, the rate earned on invested capital and the timing and amount of assets to be recovered by rates. We believe the application of regulatory accounting guidance is a critical accounting policy since a change in these assumptions may result in a material impact on reported assets and the results of operations (see the Regulation section and Notes 1 and 3 to the TECO Energy Consolidated Financial Statements).
RECENTLY ISSUED ACCOUNTING STANDARDS
Measuring Liabilities at Fair Value
In August 2009, the Financial Accounting Standards Board (FASB) issued an accounting standards update that clarifies how to measure the fair value of a liability when there is not a quoted price in an active market for a liability. This update provides clarification that in circumstances in which a quoted price in an active market for the identical liability is not available, a reporting entity is required to measure fair value using alternative techniques including, but not limited to: 1) the quoted price of the identical liability when traded as an asset or 2) quoted prices for similar liabilities or similar liabilities when traded as assets. It was effective for the first reporting period beginning after issuance. The new requirement did not have an impact on the company’s results of operations, statement of position or cash flows.
The FASB Accounting Standards Codification and the Hierarchy of Generally Accepted Accounting Principles
In June 2009, the FASB issued guidance that names the FASB Accounting Standards Codification (Codification) as the single source of authoritative U.S. GAAP for non-governmental entities recognized by the FASB. It became effective Jul. 1, 2009 and supersedes all U.S. GAAP accounting standards, aside from rules and interpretive releases issued by the Securities and Exchange Commission (SEC). The Codification is not intended to change GAAP; rather, it changes all referencing of U.S. GAAP including the notes to financial statements. Therefore, it did not have an impact on the company’s results of operations, statement of position or cash flows.
Variable Interest Entities
In June 2009, the FASB issued guidance that amended the analysis to determine the primary beneficiary of a variable interest entity (VIE). It requires an enterprise to determine whether the enterprise’s variable interest or interests give it a controlling financial interest in a VIE. This analysis identifies the primary beneficiary of a VIE as the enterprise that has both: 1) the power to direct the activities of a VIE that most significantly impact the entity’s economic performance, and 2) the obligation to absorb losses of the entity that could potentially be significant to the VIE or the right to receive benefits from the entity that could potentially be significant to the VIE.
This guidance is effective for fiscal years beginning after Nov. 15, 2009. TECO Energy adopted this guidance on Jan. 1, 2010. Upon adoption, it was determined that as a result of the new approach, the company would reconsolidate the San José and Alborada projects that were deconsolidated under the prior guidance. This new guidance will have an impact on the company’s 2010 statement of position and cash flows, but not an impact on the results of operations. See Note 19 to the TECO Energy Consolidated Financial Statements for further discussion.
Subsequent Events
In May 2009, the FASB issued guidance that requires companies to disclose the date through which they evaluated subsequent events and whether that date corresponds with the filing of their financial statements. It became effective for fiscal periods ending after Jun. 15, 2009. The adoption did not have an impact on the company’s results of operations, statement of position or cash flows.
Fair Value Measurements
In September 2006, the FASB issued guidance that defines fair value, establishes a framework for measuring fair value under GAAP, and expands required disclosures about fair value measurements. The guidance emphasizes that fair value is a market-based measurement, not an entity-specific measurement, and states that a fair value measurement should be determined based on the assumptions that market participants would use in pricing the asset or liability. The guidance applies under other accounting pronouncements that require or permit fair value measurements.
The effective date was for fiscal years beginning after Nov. 15, 2007. In November of 2007, the FASB informally granted a one year deferral for non-financial assets and liabilities. In February 2008, the FASB formally delayed the effective date of the fair value guidance to fiscal years beginning after Nov. 15, 2008 for non-financial assets and non-financial liabilities except for items that are required to be recognized or disclosed at fair value at least annually in the company’s financial statements. As a result, the company adopted the fair value guidance effective Jan. 1, 2008 for financial assets and liabilities and Jan. 1, 2009 for non-financial assets and liabilities. No adoption adjustment was necessary. Financial assets and liabilities of the company measured at fair value include derivatives and certain investments, for which fair values are primarily based on observable inputs. Non-financial assets and liabilities of the company measured at fair value include asset retirement obligations (AROs) when they are incurred and any long-lived assets or equity-method investments that are impaired in a currently reported period.
62
Table of Contents
In April 2009, the FASB issued guidance to address fair value valuation concerns in the current market environment. The guidance addresses applying the fair value model when the market for an asset is not active, other-than-temporary impairments (OTTI) of debt and equity securities and interim disclosures about the fair value of financial instruments.
When the market for an asset is not active, the newly issued guidance affirms that the objective of fair value is the price that would be received to sell the asset in an orderly transaction (that is, not a forced liquidation or distressed sale) between market participants at the measurement date in the inactive market. The determination of whether a transaction was not orderly should be based on the weight of the evidence. An entity is required to disclose a change in valuation technique and the related inputs resulting from the application of the new guidance and to quantify its effects. Retrospective application was not permitted. The new guidance became effective for interim and annual periods ending after Jun. 15, 2009. This did not have a material impact on the company’s results of operations, statement of position or cash flows.
The OTTI guidance is applicable to debt securities and requires that a company recognize the credit component of an OTTI in earnings and the remaining portion in other comprehensive income if management asserts it does not have the intent to sell the security and it is more likely than not it will not have to sell the security before recovery of its cost basis. It requires an entity to present, separately in the financial statement where the components of other comprehensive income are reported, the amounts recognized in accumulated other comprehensive income related to the noncredit portion of OTTI recognized for available-for-sale and held-to-maturity debt securities. Additionally, disclosure requirements were amended and are required for interim periods. The guidance became effective for interim and annual periods ending after Jun. 15, 2009 and did not have a material impact on the company’s results of operations, statement of position or cash flows.
Interim disclosures of fair value information, including methods and significant assumptions in measuring fair value, for financial instruments are required under the new guidance. The guidance became effective for interim and annual periods ending after Jun. 15, 2009 and had no impact on the company’s results of operations, statement of position or cash flows.
Employers’ Disclosures about Postretirement Benefit Plan Assets
In December 2008, the FASB issued guidance that requires enhanced disclosures about plan assets of defined benefit pension plans or other postretirement plans, including the concentrations of risk in those plans. The guidance was effective for fiscal years ending after Dec. 15, 2009 and is significant to the company’s financial statement disclosures through the provision of additional information (see Note 5 to the TECO Energy Consolidated Financial Statements) but has no impact on the company’s results of operations, statement of position or cash flows.
Determining Whether Instruments Granted in Share-Based Payment Transactions are Participating Securities
In June 2008, the FASB issued guidance requiring that the two-class method earnings per share calculation include unvested share-based payment awards that contain non-forfeitable rights to dividends or dividend equivalents, whether the dividend or dividend equivalents are paid or not paid. The guidance became effective for fiscal years beginning after Dec. 15, 2008 and had no material impact to the company’s results of operations, statement of position or cash flows.
Disclosures about Derivative Instruments and Hedging Activities
In March 2008, the FASB issued guidance to enhance the disclosure framework for derivatives and hedging. Enhanced disclosures about the purpose of an entity’s derivative instruments, how derivative instruments and hedged items are accounted for, and how the entity’s financial position, cash flows and performance are enhanced by the derivative instruments and hedged items were required for fiscal years and interim periods beginning after Nov. 15, 2008. The guidance was significant to the company’s financial statement disclosures but had no impact on its results of operations, statement of position or cash flows.
Additionally, in April 2008, the FASB revised previously issued implementation guidance to reflect the enhanced disclosures required by the new guidance. These revisions are significant to the company’s financial statement disclosures but have no impact on its results of operations, statement of position or cash flows.
INFLATION
The effects of general inflation on our results have not been significant for the past several years. The annual average rate of inflation, as measured by the Consumer Price Index (CPI-U), all items, all urban consumers as reported by the U.S. Department of Labor, was 2.7%, 3.8% and 2.8% in 2009, 2008 and 2007, respectively. The current economic situation and the early stages of the economic recovery continue to cause the outlook for 2010 to vary widely. Reports published in The Wall Street Journal in January 2010 state that The American Bankers Association expects core inflation, which excludes fuel and food, to be 1.2% in 2010. At its January 2010 meeting, the Federal Reserve Open Market Committee stated that “With substantial resource slack continuing to restrain cost pressures and with longer-term inflation expectations stable, inflation is likely to be subdued for some time.”
63
Table of Contents
With the rapid slowing of economies world wide in the second half of 2008 and the dramatic declines in commodity prices, especially petroleum based products, inflation dropped to almost zero in early 2009. Crude oil prices rose in the second quarter, but stabilized in a range between $70 and $80 per barrel in the second half of 2009. Tampa Electric and PGS are eligible to recover the cost of commodity fuel through the respective FPSC-approved fuel-adjustment clauses. In those cases where the higher costs can not be similarly recovered, higher costs could reduce the profit margins at the operating companies.
ENVIRONMENTAL COMPLIANCE
Environmental Matters
Among our companies, Tampa Electric has a number of significant stationary sources with air emissions impacted by the Clean Air Act, material Clean Water Act implications, and which may potentially be impacted by pending federal and state initiatives to adopt climate change legislation or regulate greenhouse gas emissions. Tampa Electric has undertaken major steps to dramatically reduce its air emissions through a series of voluntary actions, including technology selection (e.g., IGCC and conversion of coal-fired units to natural-gas fired combined cycle); implementing a responsible fuel mix taking into account price and reliability impacts to its customers; a substantial capital expenditure program to add Best Available Control Technology (BACT) emissions controls; implementation of additional controls to accomplish earlier reductions of certain emissions allowing for lower emission rates when BACT was ultimately installed; and enhanced controls and monitoring systems for certain pollutants. All of these improvements represent an investment in excess of $2 billion since 1994.
Through these actions, Tampa Electric has achieved significant reductions of all air pollutants, including CO2, while maintaining a reasonable fuel mix through the clean use of coal for the economic benefit of its customers.
Air Quality Control
Consent Decree
Tampa Electric, through voluntary negotiations with the U.S. Environmental Protection Agency (EPA), the U.S. Department of Justice (DOJ) and the Florida Department of Environmental Protection (FDEP), signed a Consent Decree, which became effective Feb. 29, 2000, and a Consent Final Judgment, which became effective Dec. 6, 1999, as settlement of federal and state litigation. Pursuant to these agreements, allegations of violations of New Source Review requirements of the Clean Air Act were resolved, a provision was made for environmental controls and pollution reductions, and Tampa Electric began implementing a comprehensive program to dramatically decrease emissions from its power plants.
The emission reduction requirements included specific detail with respect to the availability of flue gas desulfurization systems (scrubbers) to help reduce SO2, projects for NOx reduction on Big Bend Units 1 through 4, and the repowering of the coal-fired Gannon Power Station to natural gas, which was renamed as the H. L. Culbreath Bayside Power Station (Bayside Power Station), in 2003 and 2004. Upon completion of the conversion the station capacity was about 1,800 megawatts (nominal) of natural gas-fueled, combined-cycle electric generation. The repowering has reduced the facility’s NOx and SO2 emissions by approximately 99% and particulate matter (PM) emissions by approximately 92% from 1998 levels.
In 2004, Tampa Electric made its NOx reduction technology selection and decided to install SCR systems for NOx control on the coal-fired Big Bend units. The first three SCR units at Big Bend Power Station were reported in-service in May 2007, June 2008 and May 2009, respectively. The remaining SCR unit, Big Bend Unit 1, is expected to be in service in May 2010. The engineering and design is complete and construction of the remaining SCR system is currently in progress. Tampa Electric’s capital investment forecast includes amounts in 2010 for completion of the final NOx control project (see the Capital Expenditures section).
The FPSC has determined that it is appropriate for Tampa Electric to recover the operating costs of and earn a return on the investment in the SCRs to be installed on all four of the units at the Big Bend Power Station and pre-SCR projects on Big Bend Units 1–3 (which were early plant improvements to reduce NOx emissions prior to installing the SCRs) through the ECRC (see the Regulation section). Cost recovery for the SCRs began in each of the years that the units entered service, Big Bend Unit 4 in 2007, Big Bend Unit 3 in 2008 and Big Bend Unit 2 in 2009. In November 2009 the FPSC approved cost recovery for the capital investment on the Big Bend Unit 1 SCR to start in 2010.
In November 2007, Tampa Electric entered into an agreement with the EPA and DOJ for a Second Amendment to the Consent Decree. The Second Amendment: 1) establishes a 0.12 lb/MMBtu NOx limit on a 30-day rolling average for Big Bend Units 1 through 3, which is lower than the original Consent Decree that had a provision for a limit as high as 0.15 lb/MMBtu depending on certain conditions; 2) allows for the sale of NOx allowances gained as a result of surpassing the emission limit goals of the Consent Decree; and 3) calls for Tampa Electric to install a second PM Continuous Emissions Monitoring System and potentially replace the originally installed system if the new system is successful.
64
Table of Contents
Emission Reductions
Projects committed to under the Consent Decree and Consent Final Judgment have resulted in significant reductions in emissions. Since 1998, Tampa Electric has reduced annual SO2, NOx and PM from its facilities by 154,000 tons, 57,000 tons, and 4,000 tons, respectively.
Reductions in SO2 emissions were accomplished through the installation of scrubber systems on Big Bend Units 1 and 2 in 1999. Big Bend Unit 4 was originally constructed with a scrubber. The Big Bend Unit 4 scrubber system was modified in 1994 to allow it to scrub emissions from Big Bend Unit 3 as well. Currently the scrubbers at Big Bend Power Station remove more than 95% of the SO2 emissions from the flue gas streams.
The repowering of the Gannon Power Station to the Bayside Power Station has resulted in a significant reduction in emissions of all pollutant types. We expect that Tampa Electric’s actions to install NOx emissions controls on all Big Bend Power Station units will result in the further reduction of emissions and that by the expected completion in May 2010, the SCR projects will result in a total phased reduction of NOx by 62,000 tons per year from 1998 levels.
In total, we expect that Tampa Electric’s emission reduction initiatives will result in the annual reduction of SO2, NOx and PM emissions by 88%, 90% and 71%, respectively, below 1998 levels by 2010. With these state-of-the-art improvements in place, Tampa Electric’s activities have helped to significantly enhance the quality of the air in the community. As a result of its emission reduction actions, and completion of the SCR projects, Tampa Electric has achieved emission reduction levels called for in Phase I of the Clean Air Interstate Rule (CAIR). In July 2008, U.S. Court of Appeals for the District of Columbia Circuit vacated CAIR on emissions of SO2 and NOx. The federal appeals court reinstated CAIR in December 2008 as an interim solution. The EPA is continuing to work on a replacement rule that is expected to be proposed in 2010 and finalized in 2011. Until a new rule is proposed, CAIR will remain intact.
Due to pollution control benefits from the environmental improvements, reductions in mercury emissions have occurred from the repowering of Gannon Power Station to Bayside Power Station. At the Bayside Power Station, where mercury levels have decreased 99% below 1998 levels, there are virtually zero mercury emissions. Additional mercury reductions are also anticipated from the installation of NOx controls at Big Bend Power Station, which are expected to lead to a reduction of mercury emissions of more than 75% from 1998 levels by 2010. The Clean Air Mercury Rule (CAMR) Phase I requirements were scheduled for implementation in 2010. CAMR was vacated by the U.S. Court of Appeals for the District of Columbia Circuit on Feb. 8, 2008. Prior to the court’s decision Tampa Electric expected that it would have been in compliance with CAMR Phase I without additional capital investment. The EPA is expected to propose new or modified rules to address mercury and other hazardous air pollutants by late 2011.
On Sep. 16, 2009, the EPA announced it would reconsider its 2008 decision setting national standards for ground-level ozone. The EPA is reconsidering the standards to ensure they are grounded in science, protect public health with an adequate margin of safety, and are sufficient to protect the environment. Much of Tampa Electric’s service territory is not expected to meet the current ground-level ozone standards and will most likely be deemed to not meet national ambient air quality standards.
Carbon Reductions
Tampa Electric has historically supported voluntary efforts to reduce carbon emissions and has taken significant steps to reduce overall emissions at Tampa Electric’s facilities. Since 1998, Tampa Electric has reduced its system-wide emissions of CO2 by approximately 20%, bringing emissions to near 1990 levels. Tampa Electric expects emissions of CO2 to remain near 1990 levels until the addition of the next baseload unit, which is not expected until after 2014 (see the Tampa Electric and Capital Expenditures sections). Tampa Electric estimates that the repowering to natural gas and the shut-down of the Gannon Station coal-fired units resulted in an annual decrease in CO2 emissions of approximately 4.8 million tons below 1998 levels. During this same time frame, the numbers of retail customers and retail energy sales have risen by approximately 25%.
Tampa Electric’s voluntary activities to reduce carbon emissions also include membership in the U.S. Department of Energy’s Climate Challenge (now Power Partners) program since 1994, voluntary annual reporting of greenhouse gas (GHG) emissions through the Energy Information Agency (EIA) EIA-1605(b) Report beginning in 1995 and participation in the Chicago Climate Exchange (CCX), a voluntary but legally binding cap and trade program dedicated to reducing GHG emissions since 2003. Because of Tampa Electric’s membership in the CCX, its reported CO2 emissions are audited annually by the Financial Industry Regulatory Authority (formerly National Association of Securities Dealers), which has certified the results thus far. In January 2008, the CCX recognized Tampa Electric for achieving its Phase I GHG participation targets for CO2 reduction. While the commitment required in Phase I was a reduction of 4% below the average of the year 1998 – 2001, Tampa Electric surpassed this level with an actual reduction of approximately 20%. Recently the EPA issued its Final Rule on the mandatory reporting of GHGs, requiring facilities that emit 25,000 metric tons or more of CO2 per year to begin collecting GHG data under a new reporting system on Jan. 1, 2010, with the first annual report due Mar. 31, 2011. Tampa Electric expects to comply with the mandatory reporting requirement, in large part utilizing the same methods and procedures utilized for the voluntary activities.
65
Table of Contents
Climate Change
There are pending initiatives on the federal and state levels to adopt climate legislation that would require reductions in GHG emissions. At the federal level, there are several legislative proposals that would limit CO2 emissions. Most of these bills contain some type of cap-and-trade system with various allocation scenarios for regulated utilities, including credit for early action. While the timing of passage of any federal legislation into law remains uncertain, we will participate in the debate in an effort to ensure a comprehensive environmental approach to carbon emission reductions maintains a reliable energy supply at affordable prices. In order to meet the reduction contemplated, Tampa Electric could be required to make significant additional capital investments in technologies to reduce GHG that are not yet commercially viable.
On Dec. 15, 2009, the EPA published the final Endangerment Finding in the Federal Register. Although the finding is technically being made in the context of GHG emissions from new motor vehicles and does not in itself impose any requirements on industry or other entities, the finding will trigger GHG regulation of a variety of sources under the CAA. Related to utility sources, the EPA has proposed a “tailoring rule” rule addressing the GHG emission threshold triggers for permitting review of new and/or major modifications to existing stationary sources of GHG emissions.
At the state level, the Governor signed three Executive Orders in July 2007 aimed at reducing Florida’s emissions of GHG. The three orders include directives for reducing GHG emissions by electric utilities to 2000 levels by 2017; to 1990 levels by 2025; and by 80 percent of 1990 levels by 2050; and the creation of the Governor’s Action Team on Energy and Climate Change to develop a plan to achieve the targets contained in the Executive Orders including any necessary legislative initiatives required.
Also in 2008, the state legislature passed broad energy and climate legislation that, among other items, affirmed the FDEP’s authority to establish a utility carbon reduction schedule and a carbon dioxide cap and trade system by rule, but added a requirement for legislative ratification of the rule no sooner than January 2010. The FDEP has initiated the rule development process, but the process has slowed and is likely to be pushed out since the issue has become increasingly active at the federal level.
The company is examining various options relating to its carbon emissions. In the fall of 2007, Tampa Electric announced that it would not move forward with its previously announced coal-fired IGCC unit, because of the continued uncertainty related to carbon reduction regulations, particularly capture and sequestration issues. At this time, Tampa Electric expects to meet its needs for its next baseload generating capacity with natural gas fired combined-cycle technology, as well as energy efficiency programs and renewable resources (see the Tampa Electric section). While natural gas has lower carbon emissions than coal, fuel prices can make natural gas generating facilities less economic than coal-fired facilities. Fuel switching from coal to natural gas, absent additional sources of supply, would increase natural gas prices, further reducing the economic efficiency of natural gas generation facilities. Increased costs for electricity may cause customers to change usage patterns, which would impact Tampa Electric’s sales.
Tampa Electric currently emits approximately 16.6 million tons of CO2 per year. Assuming a projected long-term average annual load growth of 1.0% – 2.0%, Tampa Electric may emit approximately 19.8 million tons of CO2 (an increase of approximately 19%) by 2020 if natural gas-fired peaking and combined-cycle generation additions are used to meet growing customer needs.
Tampa Electric expects that the costs to comply with new environmental regulations would be eligible for recovery through the ECRC. If approved as prudent, the costs required to comply with CO2 emissions reductions would be reflected in customers’ bills. If the regulation allowing cost recovery is changed and the cost of compliance is not recovered through the ECRC, Tampa Electric could seek to recover those costs through a base-rate proceeding, but can not predict whether the FPSC would grant such recovery. Although Tampa Electric’s current coal-based generation has declined to less than 60% of its output in 2009 from 95% of its output in 2002, due primarily to the conversion of the coal-fired Gannon Power Station into the natural gas-fired Bayside Power Station, coal fired facilities remain a significant part of Tampa Electric’s generation fleet and additional coal units could be used in the future.
In the case of TECO Guatemala, the coal-fired San José Power Station in Guatemala is in compliance with current World Bank and Guatemalan Environmental Guidelines. While there are no known plans for legislation mandating GHG reductions in Guatemala, new rules or regulations could require additional capital investments or increase operating costs.
In the case of TECO Coal, it is unclear if the requirements for CO2 emissions reductions would directly impact it as a carbon-based fuel provider or the user. In either case, it could make the use of coal more expensive or less desirable, which could impact TECO Coal’s margins and profitability. Additional discussion related to climate change issues is included in the Risk Factors section.
Renewable Energy
Renewables are a component of Tampa Electric’s environmental portfolio. Tampa Electric’s renewable energy program offers to sell renewable energy as an option to customers and utilizes energy generated in the state from renewable sources (e.g. biomass and solar). To date, 30 million kWh of renewable energy have been produced to support participating customer requirements.
66
Table of Contents
Tampa Electric has installed almost 55,000 watts of solar panels to generate electricity from the sun at three schools and the Museum of Science and Industry in Tampa, and continues to evaluate opportunities for additional solar panel installations. In the area of biomass, which is organic plant material from yard clippings and other vegetation, Tampa Electric has tested bahia grass as a fuel to generate electricity at the Polk Power Station where it was ground and mixed with the pulverized coal slurry used in the plant’s gasifier.
Despite the emphasis on the use of renewable energy sources to reduce GHG in the Governor’s Executive Orders, the recently completed FPSC study conducted by Navigant Consulting indicates that only under the most favorable conditions of high customer incentives, a mature Renewable Energy Credit (REC) market and a high revenue rate cap would utilities hope to achieve the Governor’s renewable energy target. The Navigant study also found that solar photovoltaic power generation and biomass were the most viable sources of renewable energy and that Florida was a poor location for either significant land based wind generation or concentrating solar generation. While support for tax incentives for renewable energy development specific to regional disparities may facilitate the development of new sources, mandates for renewable portfolios at high percentages create concerns that RECs would have to be purchased to meet the mandate, rates for customers would grow rapidly and such mandates would not likely result in significant quantities of renewable energy sources to be developed in the state. A mandatory renewable energy portfolio standard could add to Tampa Electric’s costs and adversely affect its operating results.
In Florida, the executive orders tasked the FPSC with evaluating a renewable portfolio target of 20% by 2020. The 2008 Energy Bill directed the FPSC to draft a rule for a RPS to be presented to the Florida Legislature by Feb. 1, 2009, for ratification, but did not specify targets and timeframes. Under this direction, the FPSC’s recommendation to the legislature is that the RPS percentage and timing be 7% by Jan. 1, 2013, 12% by Jan. 1, 2016, 18% by Jan. 1, 2019 and 20% by Jan. 1, 2021. In addition, a 2% of retail revenue cost cap was proposed, and a new clause for the recovery of costs associated with meeting the RPS standard was also proposed. Ultimately the Legislature did not ratify the rule in the 2009 session, so the rule has not taken effect. The Legislature may take up the issue in the upcoming legislative session, which could include approval of the rule as adopted by the FPSC, rejection of the rule entirely, or amendment to one or more elements of the rule. While prospects in the Legislature are uncertain, nothing can become final until further action of the FPSC after the 2010 legislative session.
Although the U.S. Congress has considered, but to date has not passed, a federal RPS, there is likely to be an increased emphasis on the passage of a federal RPS. Tampa Electric could incur significant costs to comply with a high percentage renewable energy portfolio standard, as proposed, and its operating results could be adversely affected if the company were not permitted to recover these costs from customers, or if customers change usage patterns in response to increased rates.
Water Supply and Quality
The EPA’s final Clean Water Act Section 316(b) rule became effective Jul. 9, 2004. The rule established aquatic protection requirements for existing facilities that withdraw 50 million gallons or more of water per day from rivers, streams, lakes, reservoirs, estuaries, oceans, or other U.S. waters for cooling purposes. Tampa Electric uses water from Tampa Bay at its Bayside and Big Bend facilities as cooling water. Both plants use mesh screens to reduce the adverse impacts to aquatic organisms and Big Bend units 3 and 4 use proprietary fine-mesh screens, the best available technology, to further reduce impacts to aquatic organisms. Subsequent to promulgation of the rule, a number of states, environmental groups and others sought judicial review of the rule. On Jan. 25, 2007, the U.S. Court of Appeals for the Second Circuit overturned and remanded several provisions of the rule to the EPA for revisions. Among other things, the court rejected the EPA’s use of “cost-benefit” analysis and suggested some ways to incorporate cost considerations. The Supreme Court agreed to review the Second Circuit’s decision and heard arguments in December 2008. EPA decided to rewrite the rule, and expects to propose a new rule in 2010. The full impact of the new regulations will depend on subsequent legal proceedings, the results of studies and analyses performed as part of the rules’ implementation, and the actual requirements established by state regulatory agencies.
On Jan. 14, 2009, the EPA released a letter stating that it had made a determination that numeric nutrient water quality criteria is necessary in Florida to implement the Clean Water Act and established a deadline of Jan. 14, 2010 to propose criteria for lakes and streams, and Jan. 14, 2011 for estuaries. The EPA’s proposed criteria for lakes and streams was published in the form of a proposed rule in the Federal Register on Jan. 26, 2010. This proposed rule has the potential to affect Polk Power Station’s cooling reservoir discharge to surface waters, and may require the station to reduce the amount of nutrients in the cooling reservoir water before discharge. The proposed rule is subject to public comments and the language may be modified as a result of comments or reconsidered by the EPA. The provisions of the final rule will not be known until the final rule is published and becomes effective. The full effect of the EPA’s criteria for lakes and streams will depend on the outcome of the rulemaking and future legal proceedings.
The Big Bend, Bayside and Polk Power stations also use water on a daily basis to generate electricity with steam and to operate its scrubbers to reduce SO2 emissions. Water recycling and beneficial reuse programs are widely employed in the fresh water systems at all three power stations to reduce demand on higher-cost water sources such as municipal water systems.
Conservation
Energy conservation is becoming increasingly important in a period of volatile energy prices and in the GHG emissions reduction debate. In 2007, the Governor signed three Executive Orders aimed at reducing Florida’s emissions of GHG, which included a directive for the development of new policies to enhance energy efficiency and conservation statewide. The Climate Action Team described above completed a final report by the October 2008 deadline and included policy recommendations on
67
Table of Contents
energy efficiency and conservation targets which may either be used in the development of new legislation or in the augmentation of existing FPSC regulation.
Tampa Electric offers customers 27 comprehensive programs to conserve energy. These programs are designed to reduce peak energy demand which allows Tampa Electric to delay construction of future generation facilities. Since their inception, these conservation programs have reduced the summer peak demand by 232 megawatts, and the winter peak demand by 660 megawatts. PGS offers customers programs to switch to higher efficiency natural gas appliances from older electric power appliances. These programs and their costs are approved annually by the FPSC with the costs recovered through a clause on the customer’s bill.
In 2007, the FPSC approved the modification of nine existing programs and the addition of 13 new conservation programs. Following a two-year pilot program, the FPSC approved the Energy Planner program, which is a program aimed at residential customers that is expected to reduce summer peak demand by 22 megawatts, winter demand by 28 megawatts and annual energy consumption by almost 10,000 megawatt hours. In addition, PGS offers programs that enable customers to reduce their energy consumption, with the costs recovered through customers’ bills.
In December 2009, the FPSC established new demand-side-management (DSM) goals for 2010-2019 for all investor-owned electric utilities. For Tampa Electric, the summer and winter demand goals are 138 and 109 megawatts, respectively, and the annual energy goal is 360 gigawatt hours. These goals are very aggressive and represent as much as a 300 percent increase over the company’s previous goals. Tampa Electric is actively developing its overall DSM plan with its associated new and modified programs designed to meet the new goals. The DSM plan filing is due to the FPSC on Mar. 30, 2010 with an expected ruling for approval in June 2010. Implementation of the plan will immediately follow the ruling.
Superfund and Former Manufactured Gas Plant Sites
Tampa Electric Company, through its Tampa Electric and PGS divisions, is a potentially responsible party (PRP) for certain superfund sites and, through its PGS division, for certain former manufactured gas plant sites. While the joint and several liability associated with these sites presents the potential for significant response costs, as of Dec. 31, 2009, Tampa Electric Company has estimated its ultimate financial liability to be approximately $19.9 million (primarily related to PGS), and this amount has been reflected in the company’s financial statements. This amount is higher than prior estimates to reflect a 2009 study for the costs of remediation primarily related to one site. The environmental remediation costs associated with these sites, which are expected to be paid over many years, are not expected to have a significant impact on customer prices. The amounts represent only the estimated portion of the cleanup costs attributable to Tampa Electric Company. The estimates to perform the work are based on actual estimates obtained from contractors or Tampa Electric Company’s experience with similar work, adjusted for site specific conditions and agreements with the respective governmental agencies. The estimates are made in current dollars, are not discounted and do not assume any insurance recoveries.
Allocation of the responsibility for remediation costs among Tampa Electric Company and other PRPs is based on each party’s relative ownership interest in or usage of a site. Accordingly, Tampa Electric Company’s share of remediation costs varies with each site. In virtually all instances where other PRPs are involved, those PRPs are considered credit worthy.
Factors that could impact these estimates include the ability of other PRPs to pay their pro rata portion of the cleanup costs, additional testing and investigation which could expand the scope of the cleanup activities, additional liability that might arise from the cleanup activities themselves or changes in laws or regulations that could require additional remediation. Under current regulation, these additional costs would be eligible for recovery through customer rates.
Coal Combustion By-products Recycling
The combustion of coal at two of Tampa Electric’s power generating facilities, the Big Bend and Polk Power stations, produces ash and other by-products, collectively known as Coal Combustion Byproducts (CCB’s). The CCB’s produced at Big Bend includes fly ash, gypsum, boiler slag, bottom ash and economizer ash. The CCB’s produced at the Polk Power Station include gasifier slag and sulfuric acid. Overall, over 98% of all CCB’s produced at these facilities were marketed to customers for beneficial use in commercial and industrial products in 2009.
In response to the TVA Kingston coal ash pond failure that occurred in December 2008, the EPA announced that it would propose new regulations for the management and disposal of CCB’s. These rules, which are expected to be published in the Federal Register in the first quarter of 2010, may include a designation of CCB’s as a new category of hazardous wastes. In addition, these new rules may prohibit construction of new unlined by-product storage ponds and place additional management requirements on existing ash ponds such as those at Big Bend. However, we do not expect that this provision would adversely affect Tampa Electric, since all of its CCB storage areas are either lined or are in the process of being lined in accordance with current requirements.
REGULATION
The retail operations of Tampa Electric and PGS are regulated by the FPSC, which has jurisdiction over retail rates, quality of service and reliability, issuances of securities, planning, siting and construction of facilities, accounting and depreciation practices, and other matters.
68
Table of Contents
In general, the FPSC’s pricing objective is to set rates at a level that allows the utility to collect total revenues (revenue requirements) equal to its cost of providing service, plus a reasonable return on invested capital.
For both Tampa Electric and PGS, the costs of owning, operating and maintaining the utility system, other than fuel, purchased power, conservation and certain environmental costs, are recovered through base rates. These costs include operation and maintenance expenses, depreciation and taxes, as well as a return on investment in assets used and useful in providing electric and natural gas distribution services (rate base). The rate of return on rate base, which is intended to approximate the individual company’s weighted cost of capital, primarily includes its costs for debt, deferred income taxes at a zero cost rate and an allowed return on common equity. Base rates are determined in FPSC rate setting hearings which occur at irregular intervals at the initiative of Tampa Electric, PGS, the FPSC or other parties.
Tampa Electric is also subject to regulation by the FERC in various respects, including wholesale power sales, certain wholesale power purchases, transmission and ancillary services, and accounting practices.
Federal, state and local environmental laws and regulations cover air quality, water quality, land use, power plant, substation and transmission line siting, noise and aesthetics, security of electric system operating infrastructure, computer systems, customer and employee related data, solid waste and other environmental matters (see the Environmental Compliance section).
Tampa Electric-Base Rates
Tampa Electric’s rates and allowed return on equity (ROE) range of 10.25% to 12.25%, with a midpoint of 11.25%, are in effect until such time as changes are occasioned by an agreement approved by the FPSC or other FPSC actions as a result of rate or other proceedings initiated by Tampa Electric, FPSC staff or other interested parties.
Before August 2008, Tampa Electric had not sought a base rate increase since 1992. As a result of lower customer growth, lower energy sales growth, and average annual capital investments of more than $350 million annually over the past nine years, Tampa Electric’s 13-month average regulatory ROE was 8.7% at the end of 2008.
Recognizing the significant decline in ROE, Tampa Electric filed for a $228.2 million base rate increase in August 2008. In March 2009, the FPSC approved a $104.3 million increase in annual base rates, authorizing a new ROE range of 10.25% to 12.25% with a mid-point of 11.25% and an equity ratio of 54.0% for rates effective in May 2009. The Commission also authorized a $33.5 million change in base rates effective Jan. 1, 2010 to recover the cost of five peaking combustion turbines and solid-fuel rail unloading facilities at the Big Bend Station, subject to the conditions that the investments were in commercial operation by Dec. 31, 2009 and the five peaking combustion turbines are needed to serve customers. The FPSC later clarified that it would perform an audit to review the continuing need for the CTs and the costs incurred to place the CTs and rail unloading facilities in service.
In July, in response to a motion for reconsideration, the FPSC determined that adjustments to the capital structure used to calculate the new rates should have been calculated over all sources of capital rather than only investor sources. This change resulted in a $9.3 million increase in revenue requirements for a total 2009 increase of $113.6 million, and an additional $0.5 million in 2010. At the same time the FPSC voted to reject the intervenors’ joint motion requesting reconsideration of the 2010 portion of base rates approved in 2009.
In September, the intervenors filed a joint appeal to the Florida Supreme Court related to the FPSC’s decision to reject their motion for reconsideration of the 2010 portion of base rates approved in 2009. The FPSC and Tampa Electric will oppose this appeal. The intervenors filed appellate briefs on Feb. 24, 2010. There is no specific time frame for a resolution.
In December 2009, the FPSC approved Tampa Electric’s petition requesting that the proposed rates to support the CTs and rail unloading facilities be put into effect Jan. 1, 2010. At that time, the FPSC determined that, based on its staff audit of the actual costs incurred, the portion of base rates approved in 2009 should be reduced by $8.4 million to $25.7 million, subject to refund. A regulatory proceeding will be held during 2010 regarding the continuing need for the CTs, the appropriate amount to be recovered and the resulting rates. Subject to final FPSC approval, the hearing is tentatively set for the first week of September 2010.
Tampa Electric-Cost Recovery Clauses
Fuel, purchased power, conservation and certain environmental costs are recovered through levelized monthly charges established pursuant to the FPSC’s cost recovery clauses. These charges, which are reset annually in an FPSC proceeding, are based on estimated costs of fuel, environmental compliance, conservation programs and purchased power and estimated customer usage for a specific recovery period, with a true-up adjustment to reflect the variance of actual costs from the projected costs. The FPSC may disallow recovery of any costs that it considers imprudently incurred.
In November 2008, the FPSC approved Tampa Electric’s originally requested 2009 fuel rates. The rates included the costs for natural gas and coal expected in 2009, and the recovery of fuel and purchased power expenses, which were not collected in 2008. In March 2009, Tampa Electric filed a mid-course correction with the FPSC to adjust its projected 2009 fuel and purchased power
69
Table of Contents
costs to reflect the decline in commodity fuel prices, primarily natural gas. The revised forecast reduced fuel and purchased power costs by $191 million for 2009, which when combined with $35 million over recovery in late 2008, resulted in a $226 million lower projected fuel and purchased power cost. With the FPSC-approved lower projected fuel and power costs combined with the 2009 base rate increase described above, a 1,000 kWh monthly residential bill decreased 11% to $114.67.
In September 2009, Tampa Electric filed with the FPSC for approval of cost recovery rates for fuel and purchased power, capacity, environmental and conservation costs for the period January through December 2010. In November 2009, the FPSC approved Tampa Electric’s requested rates. The rates include the cost for natural gas, oil and coal expected in 2010, the net over-recovery of fuel, purchased power and capacity clause expenses, which were collected in 2009 following the March adjustment, and the operating cost for and a return on the capital invested in the fourth SCR project to enter service on Big Bend Unit 1 as well as the operation and maintenance expense associated with the project as required by the EPA Consent Decree and FDEP Consent Final Judgment (see the Environmental Compliance section). Rates in 2010 also reflect a two-block residential fuel factor structure with a lower factor for the first 1,000 kilowatt-hours used each month. Including the effects of the 2010 base rate change approved in December 2009, discussed above, Tampa Electric’s residential customer rate per 1,000 kilowatt-hours decreased $1.94 from $114.67 in 2009 to $112.73 in 2010.
The FPSC determined that it was appropriate for Tampa Electric to recover SCR operating costs through the ECRC as well as earn a return on its SCR investment installed on the Big Bend coal fired units for NOx control in compliance with the environmental consent decree. The SCR for Big Bend Unit 4 was reported in-service in May 2007, the SCR for Big Bend Unit 3 was reported in-service in June 2008, the SCR for Big Bend Unit 2 was reported in-service in May 2009 and cost recovery started in the respective in-service years. The SCR for Big Bend Unit 1 is scheduled to enter service by May 1, 2010.
Coal Transportation Contract
In 2003, following a request for proposal process, Tampa Electric executed a new five-year contract with TECO Transport, (at the time an affiliated company, now United Maritime, an unaffiliated company) effective Jan. 1, 2004, for waterborne coal transportation and storage services at market rates. Hearings regarding the prudence of the RFP process and final contract were held and a final order on the matter was issued in October 2004, which reduced the annual amount Tampa Electric could recover from its customers through the fuel adjustment clause for the water transportation services for coal and petroleum coke provided by TECO Transport. The annual disallowance was $8 million to $10 million, depending on the volumes and origination points of the coal shipments, which is reflected in our results. To settle a dispute with the FPSC that arose in 2008 over the calculation of the waterborne transportation disallowance over its five-year life, Tampa Electric recorded a $1.9 million charge in 2008 (see the Tampa Electric section).
Tampa Electric issued a RFP for solid fuel transportation services in October 2007. Tampa Electric structured the RFP to comply with the FPSC order issued in October 2004. New contracts for solid fuel deliveries were executed with United Maritime, AEP Memco and CSX Railroad prior to the expiration of the then existing contract with United Maritime on Dec. 31, 2008. The rail service contract provides Tampa Electric with bimodal capability for solid fuel transportation, which the FPSC had encouraged Tampa Electric to pursue, with the 2009 completion of construction of rail unloading facilities at Big Bend Power Station (see the Liquidity, Capital Resources section). In its November 2009 fuel hearings, the FPSC approved the full recovery of rates for 2010 that included the costs associated with the contracts described above.
Hardening of Transmission and Distribution Facilities
Due to extensive storm damage to utility facilities during the 2004 and 2005 hurricane seasons and the resulting outages utility customers experienced throughout the state, the FPSC initiated a proceeding to explore methods of designing, building and strengthening transmission and distribution systems that would minimize long-term outages and restoration costs.
The FPSC subsequently issued an order requiring all investor owned utilities (IOUs) to implement a 10-point storm preparedness plan designed to improve the statewide electric infrastructure to better withstand severe storms and expedite recovery from future storms. Tampa Electric has implemented its plan and estimates the average incremental non-fuel operation and maintenance expense of this plan to be approximately $20 million annually. The FPSC also modified its rule regarding the design standards for new and replacement transmission and distribution line construction, including certain critical circuits in a utility’s system. Future capital expenditures required under the storm hardening program are expected to average approximately $20 million annually for the foreseeable future.
Florida’s Energy Plan
The FDEP has produced an energy plan for the state that, among other initiatives, encourages fuel diversity for electric generation, streamlining of the power plant siting review process, conservation by state agencies and consumers, educational programs for residential and business customers regarding energy conservation, expansion of the use of hydrogen and additional grants to study alternative energy supplies (see the Environmental Compliance section).
70
Table of Contents
Utility Competition—Electric
Tampa Electric’s retail electric business is substantially free from direct competition with other electric utilities, municipalities and public agencies. At the present time, the principal form of competition at the retail level consists of self-generation available to larger users of electric energy. Such users may seek to expand their alternatives through various initiatives, including legislative and/or regulatory changes that would permit competition at the retail level. Tampa Electric intends to retain and expand its retail business by managing costs and providing high quality service to retail customers.
Presently there is competition in Florida’s wholesale power markets among Florida’s utilities and from other suppliers of electricity largely as a result of the Energy Policy Act of 1992 and related federal initiatives. However, the state’s Power Plant Siting Act, which sets the state’s electric energy and environmental policy and governs the building of new generation involving steam capacity of 75 megawatts or more, requires that applicants demonstrate that a plant is needed prior to receiving construction and operating permits.
FPSC rules require IOUs to issue RFPs prior to filing a petition for Determination of Need for construction of a power plant with a steam cycle greater than 75 megawatts. The rules provide a mechanism for expedited dispute resolution, allow bidders to submit new bids whenever the IOU revises its cost estimates for its self-build option, require IOUs to disclose the methodology and criteria to be used to evaluate the bids, and provide more stringent standards for the IOUs to recover cost overruns in the event the self-build option is deemed the most cost-effective.
PGS Rates
PGS’ previous base rates, which became effective in January 2003, were agreed to in a settlement with all parties involved. PGS’ 2003 authorized rates provided an allowed ROE range from 10.25% to 12.25% with an 11.25% midpoint. At the end of 2007, PGS’ 13-month average regulatory ROE was below the bottom of its allowed range as a result of higher operating costs, continued investment in the distribution system and higher costs associated with required safety requirements, such as transmission and distribution pipeline integrity management.
Recognizing the significant decline in ROE, PGS filed for a $26.5 million base rate increase in August 2008. In May 2009, the FPSC approved a $19.2 million increase in annual base rates, authorizing a new ROE range of 9.75% to 11.75% with a mid-point of 10.75% and an equity ratio of 54.7% for rates effective in June 2009.
PGS Cost Recovery Clauses
PGS recovers the costs it pays for gas supply and interstate transportation for system supply through the PGA clause. This charge is designed to recover the costs incurred by PGS for purchased gas, and for holding and using interstate pipeline capacity for the transportation of gas it delivers to its customers. These charges may be adjusted monthly based on a cap approved annually in an FPSC hearing. The cap is based on estimated costs of purchased gas and pipeline capacity, and estimated customer usage for a specific recovery period, with a true-up adjustment to reflect the variance of actual costs and usage from the projected charges for prior periods. In November 2009, the FPSC approved rates under PGS’ PGA for the period January 2010 through December 2010 for the recovery of the costs of natural gas purchased for its distribution customers.
In addition to its base rates and purchased gas adjustment clause charges, PGS customers (except interruptible customers) also pay a per-therm conservation charge for all gas. This charge is intended to permit PGS to recover its costs incurred in developing and implementing energy conservation programs, which are mandated by Florida law and approved and supervised by the FPSC. PGS is permitted to recover, on a dollar-for-dollar basis, prudently incurred expenditures made in connection with these programs if it demonstrates that the programs are cost effective for its ratepayers.
Utility Competition—Gas
Although PGS is not in direct competition with any other regulated distributors of natural gas for customers within its service areas, there are other forms of competition. At the present time, the principal form of competition for residential and small commercial customers is from companies providing other sources of energy, including electricity, propane and fuel oil. PGS has taken actions to retain and expand its natural gas distribution business, including managing costs and providing high quality service to customers.
In Florida, gas service is unbundled for all non-residential customers. PGS has a “NaturalChoice” program, offering unbundled transportation service to all eligible customers and allowing non-residential customers to purchase commodity gas from a third party but continue to pay PGS for the transportation. As a result, PGS receives its base rate for distribution regardless of whether a customer decides to opt for transportation-only service or continue bundled service. PGS had approximately 15,200 transportation customers as of Dec. 31, 2009 out of approximately 31,400 eligible customers.
Competition is most prevalent in the large commercial and industrial markets. In recent years, these classes of customers have been targeted by companies seeking to sell gas directly by transporting gas through other facilities and thereby bypassing PGS facilities. In response to this competition, PGS has developed various programs, including the provision of transportation services at discounted rates.
71
Table of Contents
| Item 7A. | QUANTITATIVE AND QUALITATIVE DISCLOSURES ABOUT MARKET RISK. |
Risk Management Infrastructure
We are subject to various types of market risk in the course of daily operations, as discussed below. We have adopted an enterprise-wide approach to the management and control of market and credit risk. Middle Office risk management functions, including credit risk management and risk control, are independent of each transacting entity (Front Office).
Our Risk Management Policy (Policy) governs all energy transacting activity at the TECO Energy group of companies. The Policy is approved by our Board of Directors and administered by a Risk Authorizing Committee (RAC) that is comprised of senior management. Within the bounds of the Policy, the RAC approves specific hedging strategies, new transaction types or products, limits, and transacting authorities. Transaction activity is reported daily and measured against limits. For all commodity risk management activities, derivative transaction volumes are limited to the anticipated volume for customer sales or supplier procurement activities.
The RAC administers the Policy with respect to interest rate risk exposures. Under the Policy, the RAC operates and oversees transaction activity. Interest rate derivative transaction activity is directly correlated to borrowing activities.
Risk Management Objectives
The Front Office is responsible for reducing and mitigating the market risk exposures which arise from the ownership of physical assets and contractual obligations, such as debt instruments and firm customer sales contracts. The primary objectives of the risk management organization, the Middle Office, are to quantify, measure, and monitor the market risk exposures arising from the activities of the Front Office and the ownership of physical assets. In addition, the Middle Office is responsible for enforcing the limits and procedures established under the approved risk management policies. Based on the policies approved by the company’s Board of Directors and the procedures established by the RAC, from time to time, members of the TECO Energy group of companies enter into futures, forwards, swaps and option contracts to limit the exposure to:
| • | Price fluctuations for physical purchases and sales of natural gas in the course of normal operations at Tampa Electric and PGS; |
| • | Interest rate fluctuations on debt at TECO Energy and its affiliates; and |
| • | Price fluctuations for physical purchases of fuel at TECO Coal. |
The TECO Energy companies use derivatives only to reduce normal operating and market risks, not for speculative purposes. Our primary objective in using derivative instruments for regulated operations is to reduce the impact of market price volatility on ratepayers. For unregulated operations, the companies use derivative instruments primarily to mitigate the price uncertainty related to commodity inputs, such as diesel fuel.
Derivatives and Hedge Accounting
Accounting standards for derivative instruments and hedging activities requires us and our affiliates to recognize derivatives as either assets or liabilities in the financial statements, to measure those instruments at fair value, and to reflect the changes in the fair value of those instruments as components of other comprehensive income or net income, depending on the designation of those instruments.
Designation of a hedging relationship requires management to make assumptions about the future probability of the timing and amount of the hedged transaction and the future effectiveness of the derivative instrument in offsetting the change in fair value or cash flows of the hedged item or transaction. The determination of fair value is dependent upon certain assumptions and judgments, as described more fully below (see Note 22 to the TECO Energy Consolidated Financial Statements).
Fair Value Measurements
Effective Jan. 1, 2008, the company adopted accounting standards for fair value measurement. These standards define fair value, establish a framework for measuring fair value under generally accepted accounting principles, and expand disclosures about financial assets and liabilities carried at fair value. The majority of the company’s financial assets and liabilities are in the form of natural gas, heating oil and interest rate derivatives classified as cash flow hedges and auction rate securities. This adoption did not have a material impact on our results of operations, liquidity or capital.
Most natural gas derivatives were entered into by the regulated utilities to manage the impact of natural gas prices on customers. As a result of applying the provisions of accounting standards for regulated activities, the changes in value of natural gas derivatives of Tampa Electric and PGS are recorded as regulatory assets or liabilities to reflect the impact of the risks of hedging activities in the fuel recovery clause. Because the amounts are deferred and ultimately collected through the fuel clause, the unrealized gains and losses associated with the valuation of these assets and liabilities do not impact our results of operations.
72
Table of Contents
Interest rate derivatives at the regulated utilities were entered into in 2007 as a cash flow hedge to reduce exposure to interest rate changes for debt that was issued in 2008. The $11.8 million settlement of these instruments at the time the debt was issued, May of 2008, was recorded in accumulated other comprehensive income and is being amortized to earnings over the life of the related debt which matures on May 15, 2018.
Heating oil hedges are used to mitigate the fluctuations in the price of diesel fuel which is a significant component in the cost of coal production at TECO Coal and its subsidiaries.
The valuation methods we used to determine fair value are described in Note 22 to the TECO Energy Consolidated Financial Statements.
Credit Risk
We have a rigorous process for the establishment of new trading counterparties. This process includes an evaluation of each counterparty’s financial statements, with particular attention paid to liquidity and capital resources; establishment of counterparty specific credit limits; optimization of credit terms; and execution of standardized enabling agreements. Our Credit Guidelines require transactions with counterparties below investment grade to be collateralized.
Contracts with different legal entities affiliated with the same counterparty are consolidated for credit purposes and managed as appropriate, considering the legal structure and any netting agreements in place. Credit exposures are calculated, compared to limits and reported to management on a daily basis. The Credit Guidelines are administered and monitored within the Middle Office, independent of the Front Office.
We have implemented procedures to monitor the creditworthiness of our counterparties and to consider nonperformance in valuing counterparty positions. Net liability positions are generally not adjusted as we use our derivative transactions as hedges and we have the ability and intent to perform under each of our contracts. In the instance of net asset positions, we consider general market conditions and the observable financial health and outlook of specific counterparties, forward looking data such as credit default swaps when available and historical default probabilities from credit rating agencies in evaluating the potential impact of nonperformance risk to derivative positions.
Certain of our derivative instruments contain provisions that require our debt, or in the case of derivative instruments where Tampa Electric Company is the counterparty, Tampa Electric Company’s debt, to maintain an investment grade credit rating from any or all of the major credit rating agencies. If our debt ratings, including Tampa Electric Company’s, were to fall below investment grade it could trigger these provisions, and the counterparties to the derivative instruments could request immediate payment or demand immediate and ongoing full overnight collateralization on derivative instruments in net liability positions. The aggregate fair value of all derivative instruments with credit-risk-related contingent features that are in a liability position on Dec. 31, 2009, was $36.7 million, including Tampa Electric Company positions of $35.9 million. If the credit-risk-related contingent features underlying these agreements were triggered as of Dec. 31, 2009, we could have been required to post collateral or settle existing positions with counterparties totaling $36.7 million. In the unlikely event that this situation would occur, we believe that we maintain adequate lines of credit to meet these obligations.
Interest Rate Risk
We are exposed to changes in interest rates, primarily as a result of our borrowing activities. We may enter into futures, swaps and option contracts, in accordance with the approved risk management policies and procedures, to moderate this exposure to interest rate changes and achieve a desired level of fixed and variable rate debt. As of Dec. 31, 2009 and 2008, a hypothetical 10% increase in the consolidated group’s weighted average interest rate on its variable rate debt during the subsequent year would not result in a material impact on pretax earnings. This is driven by the low amounts of variable rate debt at TECO Energy and at our subsidiaries.
These amounts were determined based on the variable rate obligations existing on the indicated dates at TECO Energy and its subsidiaries. A hypothetical 10% decrease in interest rates would increase the fair market value of our long-term debt by approximately 2.7% at Dec. 31, 2009 and 4.0% at Dec. 31, 2008 (see the Financing Activity section and Notes 6 and 7 to the TECO Energy Consolidated Financial Statements). The above sensitivities assume no changes to our financial structure and could be affected by changes in our credit ratings, changes in general economic conditions or other external factors (see the Risk Factors section).
Commodity Risk
We and our affiliates face varying degrees of exposure to commodity risks including coal, natural gas, fuel oil, and other energy commodity prices. Any changes in prices could affect the prices these businesses charge, their operating costs and the
73
Table of Contents
competitive position of their products and services. We assess and monitor risk using a variety of measurement tools. Management uses different risk measurement and monitoring tools based on the degree of exposure of each operating company to commodity risks.
Regulated Utilities
Historically, Tampa Electric’s fuel costs used for generation were affected primarily by the price of coal and, to a lesser degree, the cost of natural gas and fuel oil. With the repowering of the Bayside Power Station, the use of natural gas, with its more volatile pricing, has increased substantially. PGS has exposure related to the price of purchased gas and pipeline capacity.
Currently, Tampa Electric’s and PGS’ commodity price risk is largely mitigated by the fact that increases in the price of fuel and purchased power are recovered through cost recovery clauses, with no anticipated effect on earnings. However, increasing fuel cost recovery has the potential to affect total energy usage and the relative attractiveness of electricity and natural gas to consumers. To moderate the impacts of fuel price changes on customers, both Tampa Electric and PGS manage commodity price risk by entering into long-term fuel supply agreements, prudently operating plant facilities to optimize cost, and entering into derivative transactions designated as cash flow hedges of anticipated purchases of wholesale natural gas. At Dec. 31, 2009 and 2008, a change in commodity prices would not have had a material impact on earnings for Tampa Electric or PGS, but could have had an impact on the timing of the cash recovery of the cost of fuel (see the Tampa Electric and Regulation sections).
Unregulated Operating Companies
Our unregulated operating companies, TECO Coal and TECO Guatemala, are subject to significant commodity risk. The operating companies do not speculate using derivative instruments. However, all derivative instruments may not receive hedge accounting treatment due to the strict requirements and narrow applicability of the accounting rules to dynamic transactions.
TECO Coal is exposed to commodity price risk through coal sales as a part of its daily operations. Where possible and economical, TECO Coal enters into fixed price sales transactions to mitigate variability in coal prices. TECO Coal is also exposed to variability in operating costs as a result of periodic purchases of diesel oil in its operations. At Dec. 31, 2009, TECO Coal had derivative instruments in place to reduce the price variability for its anticipated 2010 diesel oil purchases for nearly all coal production volumes sold under contracts that did not include a fuel price component. Accordingly, a change in the average annual price for diesel oil is not expected to significantly change TECO Coal’s cost of production.
Like Tampa Electric and PGS, TECO Guatemala has commodity price risk that is largely mitigated by the fact that increases in the price of fuel are passed through to the power purchasing distribution utility. However, changes in the relative cost of coal-fired and oil-fired generation in Guatemala can have a substantial impact on the dispatch frequency of TECO Guatemala’s units and its ability to achieve incremental spot market sales.
Changes in Fair Value of Derivatives (millions)
| Net fair value of derivatives as of Dec. 31, 2008 |
$ | (151.4 | ) | |
| Additions and net changes in unrealized fair value of derivatives |
363.3 | |||
| Changes in valuation techniques and assumptions |
— | |||
| Realized net settlement of derivatives |
(248.5 | ) | ||
| Net fair value of derivatives as of Dec. 31, 2009 |
$ | (36.6 | ) | |
Roll-Forward of Derivative Net Assets (Liabilities) (millions)
| Total energy contract net assets (liabilities) as of Dec. 31, 2008 |
$ | (151.4 | ) | |
| Change in fair value of net derivative assets (liabilities): |
||||
| Recorded as regulatory assets and liabilities or other comprehensive income |
363.3 | |||
| Recorded in earnings |
— | |||
| Realized at settlement of derivatives |
(248.5 | ) | ||
| Net option premium payments |
— | |||
| Net purchase (sale) of existing contracts |
— | |||
| Total energy contract net assets (liabilities) as of Dec. 31, 2009 |
$ | (36.6 | ) | |
74
Table of Contents
Maturity and Source of Energy Derivative Contracts Net Assets (Liabilities) at Dec. 31, 2009
| (millions) |
Current | Non-current | Total Fair Value | |||||||||
| Source of fair value |
||||||||||||
| Actively quoted prices |
$ | — | $ | — | $ | — | ||||||
| Other external price sources (1) |
(33.2 | ) | (3.4 | ) | (36.6 | ) | ||||||
| Model prices (2) |
— | — | — | |||||||||
| Total |
$ | (33.2 | ) | $ | (3.4 | ) | $ | (36.6 | ) | |||
| (1) | Information from external sources includes information obtained from OTC brokers, industry price services or surveys and multiple-party on-line platforms. This information is reviewed by management for reasonableness by comparing it to prices quoted on NYMEX. |
| (2) | Model prices are used for determining the fair value of energy derivatives where price quotes are infrequent or the market is illiquid. Significant inputs to the models are derived from market observable data and actual historical experience. |
75
Table of Contents
| Item 8. | FINANCIAL STATEMENTS AND SUPPLEMENTARY DATA. |
All other financial statement schedules have been omitted since they are not required, are inapplicable or the required information is presented in the financial statements or notes thereto.
76
Table of Contents
Report of Independent Registered Certified Public Accounting Firm
To the Board of Directors and Shareholders of TECO Energy, Inc.:
In our opinion, the consolidated financial statements listed in the accompanying index present fairly, in all material respects, the financial position of TECO Energy, Inc. and its subsidiaries (the Company) at December 31, 2009 and 2008, and the results of their operations and their cash flows for each of the three years in the period ended December 31, 2009 in conformity with accounting principles generally accepted in the United States of America. In addition, in our opinion, the financial statement schedules listed in the accompanying index present fairly, in all material respects, the information set forth therein when read in conjunction with the related consolidated financial statements. Also in our opinion, the Company maintained, in all material respects, effective internal control over financial reporting as of December 31, 2009, based on criteria established in Internal Control - Integrated Framework issued by the Committee of Sponsoring Organizations of the Treadway Commission (COSO). The Company’s management is responsible for these financial statements and financial statement schedules, for maintaining effective internal control over financial reporting and for its assessment of the effectiveness of internal control over financial reporting, included in the accompanying Management’s Report on Internal Control Over Financial Reporting. Our responsibility is to express opinions on these financial statements, on the financial statement schedules, and on the Company’s internal control over financial reporting based on our integrated audits. We conducted our audits in accordance with the standards of the Public Company Accounting Oversight Board (United States). Those standards require that we plan and perform the audits to obtain reasonable assurance about whether the financial statements are free of material misstatement and whether effective internal control over financial reporting was maintained in all material respects. Our audits of the financial statements included examining, on a test basis, evidence supporting the amounts and disclosures in the financial statements, assessing the accounting principles used and significant estimates made by management, and evaluating the overall financial statement presentation. Our audit of internal control over financial reporting included obtaining an understanding of internal control over financial reporting, assessing the risk that a material weakness exists, and testing and evaluating the design and operating effectiveness of internal control based on the assessed risk. Our audits also included performing such other procedures as we considered necessary in the circumstances. We believe that our audits provide a reasonable basis for our opinions.
A company’s internal control over financial reporting is a process designed to provide reasonable assurance regarding the reliability of financial reporting and the preparation of financial statements for external purposes in accordance with generally accepted accounting principles. A company’s internal control over financial reporting includes those policies and procedures that (i) pertain to the maintenance of records that, in reasonable detail, accurately and fairly reflect the transactions and dispositions of the assets of the company; (ii) provide reasonable assurance that transactions are recorded as necessary to permit preparation of financial statements in accordance with generally accepted accounting principles, and that receipts and expenditures of the company are being made only in accordance with authorizations of management and directors of the company; and (iii) provide reasonable assurance regarding prevention or timely detection of unauthorized acquisition, use, or disposition of the company’s assets that could have a material effect on the financial statements.
Because of its inherent limitations, internal control over financial reporting may not prevent or detect misstatements. Also, projections of any evaluation of effectiveness to future periods are subject to the risk that controls may become inadequate because of changes in conditions, or that the degree of compliance with the policies or procedures may deteriorate.
| /s/ PricewaterhouseCoopers LLP |
| Tampa, Florida |
| February 25, 2010 |
77
Table of Contents
Consolidated Balance Sheets
Assets
| (millions) |
Dec. 31, 2009 |
Dec. 31, 2008 |
||||||
| Current assets |
||||||||
| Cash and cash equivalents |
$ | 46.0 | $ | 12.2 | ||||
| Short-term investments |
0.8 | 2.4 | ||||||
| Receivables, less allowance for uncollectibles of $3.0 and $3.5 at Dec. 31, 2009 and 2008, respectively |
277.4 | 285.9 | ||||||
| Inventories, at average cost |
||||||||
| Fuel |
124.3 | 90.2 | ||||||
| Materials and supplies |
65.7 | 72.8 | ||||||
| Current regulatory assets |
109.2 | 272.6 | ||||||
| Current derivative assets |
0.8 | — | ||||||
| Income tax receivables |
1.7 | 3.5 | ||||||
| Prepayments and other current assets |
25.7 | 25.8 | ||||||
| Total current assets |
651.6 | 765.4 | ||||||
| Property, plant and equipment |
||||||||
| Utility plant in service |
||||||||
| Electric |
6,079.5 | 5,528.3 | ||||||
| Gas |
1,017.2 | 964.4 | ||||||
| Construction work in progress |
304.5 | 463.5 | ||||||
| Other property |
377.2 | 354.8 | ||||||
| Property, plant and equipment |
7,778.4 | 7,311.0 | ||||||
| Accumulated depreciation |
(2,234.3 | ) | (2,089.7 | ) | ||||
| Total property, plant and equipment, net |
5,544.1 | 5,221.3 | ||||||
| Other assets |
||||||||
| Deferred income taxes |
222.7 | 333.8 | ||||||
| Other investments |
— | 21.3 | ||||||
| Long-term regulatory assets |
335.6 | 325.3 | ||||||
| Long-term derivative assets |
0.2 | 0.1 | ||||||
| Investment in unconsolidated affiliates |
279.3 | 284.0 | ||||||
| Goodwill |
59.4 | 59.4 | ||||||
| Deferred charges and other assets |
126.6 | 136.8 | ||||||
| Total other assets |
1,023.8 | 1,160.7 | ||||||
| Total assets |
$ | 7,219.5 | $ | 7,147.4 | ||||
The accompanying notes are an integral part of the consolidated financial statements.
78
Table of Contents
TECO ENERGY, INC.
Consolidated Balance Sheets—Continued
Liabilities and Capital
| (millions) |
Dec. 31, 2009 |
Dec. 31, 2008 |
||||||
| Current liabilities |
||||||||
| Long-term debt due within one year |
||||||||
| Recourse |
$ | 106.5 | $ | 5.5 | ||||
| Non-recourse |
1.4 | 1.4 | ||||||
| Notes payable |
55.0 | 93.0 | ||||||
| Accounts payable |
251.4 | 304.4 | ||||||
| Customer deposits |
151.2 | 144.6 | ||||||
| Current regulatory liabilities |
85.4 | 21.7 | ||||||
| Current derivative liabilities |
34.0 | 132.1 | ||||||
| Interest accrued |
45.3 | 45.1 | ||||||
| Taxes accrued |
20.5 | 21.2 | ||||||
| Other current liabilities |
20.6 | 15.3 | ||||||
| Total current liabilities |
771.3 | 784.3 | ||||||
| Other liabilities |
||||||||
| Investment tax credits |
10.8 | 11.2 | ||||||
| Long-term regulatory liabilities |
602.6 | 588.2 | ||||||
| Long-term derivative liabilities |
3.6 | 19.4 | ||||||
| Deferred credits and other liabilities |
544.2 | 530.0 | ||||||
| Long-term debt, less amount due within one year |
||||||||
| Recourse |
3,195.4 | 3,199.0 | ||||||
| Non-recourse |
6.2 | 7.6 | ||||||
| Total other liabilities |
4,362.8 | 4,355.4 | ||||||
| Commitments and contingencies (see Note 12) |
||||||||
| Capital |
||||||||
| Common equity (400.0 million shares authorized; par value $1; 213.9 million shares and 212.9 million shares outstanding at Dec. 31, 2009 and 2008, respectively) |
213.9 | 212.9 | ||||||
| Additional paid in capital |
1,530.8 | 1,518.2 | ||||||
| Retained earnings |
365.7 | 322.6 | ||||||
| Accumulated other comprehensive loss |
(25.0 | ) | (46.0 | ) | ||||
| Total capital |
2,085.4 | 2,007.7 | ||||||
| Total liabilities and capital |
$ | 7,219.5 | $ | 7,147.4 | ||||
The accompanying notes are an integral part of the consolidated financial statements.
79
Table of Contents
Consolidated Statements of Income
| (millions, except per share amounts) For the years ended Dec. 31, |
2009 | 2008 | 2007 | |||||||||||||||
| Revenues |
||||||||||||||||||
| Regulated electric and gas (includes franchise fees and gross receipts taxes of $115.7 in 2009, $109.2 in 2008 and $111.2 in 2007) |
$ | 2,649.1 | $ | 2,778.2 | $ | 2,786.3 | ||||||||||||
| Unregulated |
661.4 | 597.1 | 749.8 | |||||||||||||||
| Total revenues |
3,310.5 | 3,375.3 | 3,536.1 | |||||||||||||||
| Expenses |
||||||||||||||||||
| Regulated operations |
||||||||||||||||||
| Fuel |
909.9 | 819.4 | 854.7 | |||||||||||||||
| Purchased power |
177.6 | 305.4 | 271.9 | |||||||||||||||
| Cost of natural gas sold |
242.7 | 476.6 | 389.9 | |||||||||||||||
| Other |
318.7 | 277.7 | 280.4 | |||||||||||||||
| Operation other expense |
||||||||||||||||||
| Mining related costs |
458.7 | 440.6 | 435.4 | |||||||||||||||
| Waterborne transportation costs |
— | — | 206.4 | |||||||||||||||
| Other |
17.1 | 18.2 | 16.6 | |||||||||||||||
| Maintenance |
187.6 | 173.9 | 183.5 | |||||||||||||||
| Depreciation and amortization |
287.9 | 266.1 | 263.7 | |||||||||||||||
| Restructuring charges |
25.7 | — | — | |||||||||||||||
| Loss (gain) on sale, net of transaction related costs |
— | 0.9 | (221.3 | ) | ||||||||||||||
| Taxes, other than income |
224.4 | 211.5 | 218.3 | |||||||||||||||
| Total expenses |
2,850.3 | 2,990.3 | 2,899.5 | |||||||||||||||
| Income from operations |
460.2 | 385.0 | 636.6 | |||||||||||||||
| Other income (expense) |
||||||||||||||||||
| Allowance for other funds used during construction |
9.3 | 6.3 | 4.5 | |||||||||||||||
| Other income |
23.3 | 21.5 | 112.0 | |||||||||||||||
| Loss on debt exchange/extinguishment |
— | — | (32.9 | ) | ||||||||||||||
| Income from equity investments |
46.7 | 72.9 | 68.5 | |||||||||||||||
| Total other income |
79.3 | 100.7 | 152.1 | |||||||||||||||
| Interest charges |
||||||||||||||||||
| Interest expense |
231.5 | 231.3 | 259.5 | |||||||||||||||
| Allowance for borrowed funds used during construction |
(4.5 | ) | (2.4 | ) | (1.7 | ) | ||||||||||||
| Total interest charges |
227.0 | 228.9 | 257.8 | |||||||||||||||
| Income before provision for income taxes |
312.5 | 256.8 | 530.9 | |||||||||||||||
| Provision for income taxes |
98.6 | 94.4 | 214.2 | |||||||||||||||
| Income from continuing operations |
213.9 | 162.4 | 316.7 | |||||||||||||||
| Discontinued operations |
||||||||||||||||||
| Income tax (benefit) provision |
— | — | (14.3 | ) | ||||||||||||||
| Total discontinued operations |
— | — | 14.3 | |||||||||||||||
| Net income |
$ | 213.9 | $ | 162.4 | $ | 331.0 | ||||||||||||
| Plus: Net loss attributable to noncontrolling interest |
$ | — | $ | — | $ | 82.2 | ||||||||||||
| Net income attributable to TECO Energy |
$ | 213.9 | $ | 162.4 | $ | 413.2 | ||||||||||||
| Average common shares outstanding |
— |
Basic |
211.8 | 210.6 | 209.1 | |||||||||||||
| — |
Diluted |
213.1 | 211.4 | 209.9 | ||||||||||||||
| Earnings per share from continuing operations |
— |
Basic |
$ | 1.00 | $ | 0.77 | $ | 1.90 | ||||||||||
| — |
Diluted |
$ | 1.00 | $ | 0.77 | $ | 1.89 | |||||||||||
| Earnings per share from discontinued operations |
— |
Basic |
$ | — | $ | — | $ | 0.07 | ||||||||||
| — |
Diluted |
$ | — | $ | — | $ | 0.07 | |||||||||||
| Earnings per share |
— |
Basic |
$ | 1.00 | $ | 0.77 | $ | 1.97 | ||||||||||
| — |
Diluted |
$ | 1.00 | $ | 0.77 | $ | 1.96 | |||||||||||
| Dividends declared and paid per common share outstanding |
$ | 0.800 | $ | 0.795 | $ | 0.775 | ||||||||||||
The accompanying notes are an integral part of the consolidated financial statements.
80
Table of Contents
Consolidated Statements of Comprehensive Income
| (millions) For the years ended Dec. 31, |
2009 | 2008 | 2007 | ||||||||
| Net income |
$ | 213.9 | $ | 162.4 | $ | 413.2 | |||||
| Other comprehensive income (loss), net of tax |
|||||||||||
| Net unrealized gains (losses) on cash flow hedges |
17.8 | (18.9 | ) | (6.3 | ) | ||||||
| Amortization of unrecognized benefit costs |
1.3 | 2.6 | 2.4 | ||||||||
| Recognized benefit costs due to curtailment |
— | — | 8.7 | ||||||||
| Change in benefit obligation due to annual remeasurement |
0.2 | (10.8 | ) | 8.5 | |||||||
| Unrealized loss on available-for-sale securities |
1.7 | (1.7 | ) | — | |||||||
| Other comprehensive income (loss), net of tax |
21.0 | (28.8 | ) | 13.3 | |||||||
| Comprehensive income |
$ | 234.9 | $ | 133.6 | $ | 426.5 | |||||
The accompanying notes are an integral part of the consolidated financial statements.
81
Table of Contents
Consolidated Statements of Cash Flows
| (millions) For the years ended Dec. 31, |
2009 | 2008 | 2007 | |||||||||
| Cash flows from operating activities |
||||||||||||
| Net income |
$ | 213.9 | $ | 162.4 | $ | 331.0 | ||||||
| Adjustments to reconcile net income to net cash from operating activities: |
||||||||||||
| Depreciation and amortization |
287.9 | 266.1 | 263.7 | |||||||||
| Deferred income taxes |
98.5 | 95.4 | 184.8 | |||||||||
| Investment tax credits, net |
(0.4 | ) | (1.0 | ) | (2.5 | ) | ||||||
| Allowance for other funds used during construction |
(9.3 | ) | (6.3 | ) | (4.5 | ) | ||||||
| Non-cash stock compensation |
10.3 | 9.7 | 11.6 | |||||||||
| Gain on sales of business / assets, pretax |
(16.0 | ) | (1.7 | ) | (246.1 | ) | ||||||
| Equity in earnings of unconsolidated affiliates, net of cash distributions on earnings |
(4.3 | ) | (22.8 | ) | (18.0 | ) | ||||||
| Non-cash debt extinguishment / exchange |
— | — | 2.6 | |||||||||
| Derivatives marked-to-market |
— | — | (82.7 | ) | ||||||||
| Deferred recovery clause |
136.6 | (115.8 | ) | 123.7 | ||||||||
| Receivables, less allowance for uncollectibles |
8.5 | 10.0 | 8.7 | |||||||||
| Inventories |
(27.0 | ) | (9.0 | ) | (9.6 | ) | ||||||
| Prepayments and other deposits |
0.1 | (2.8 | ) | 3.2 | ||||||||
| Taxes accrued |
0.2 | (14.8 | ) | 26.6 | ||||||||
| Interest accrued |
0.1 | 12.4 | (17.8 | ) | ||||||||
| Accounts payable |
(38.7 | ) | (8.3 | ) | (29.6 | ) | ||||||
| Other |
64.3 | 14.3 | 8.9 | |||||||||
| Cash flows from operating activities |
724.7 | 387.8 | 554.0 | |||||||||
| Cash flows from investing activities |
||||||||||||
| Capital expenditures |
(639.8 | ) | (589.5 | ) | (494.4 | ) | ||||||
| Allowance for other funds used during construction |
9.3 | 6.3 | 4.5 | |||||||||
| Net proceeds from sales of business / assets |
31.6 | 0.6 | 405.2 | |||||||||
| Restricted cash |
0.5 | (0.1 | ) | 29.9 | ||||||||
| (Investments in) / Distributions from unconsolidated affiliates |
(0.2 | ) | 13.2 | 27.5 | ||||||||
| Other investments |
16.3 | 76.1 | (0.4 | ) | ||||||||
| Cash flows used in investing activities |
(582.3 | ) | (493.4 | ) | (27.7 | ) | ||||||
| Cash flows from financing activities |
||||||||||||
| Dividends |
(170.8 | ) | (168.6 | ) | (163.0 | ) | ||||||
| Proceeds from sale of common stock |
5.1 | 21.8 | 14.0 | |||||||||
| Proceeds from long-term debt |
102.0 | 327.8 | 444.1 | |||||||||
| Repayment of long-term debt |
(6.9 | ) | (293.8 | ) | (1,137.5 | ) | ||||||
| Contributions from noncontrolling interests |
— | — | 81.3 | |||||||||
| Debt exchange premiums |
— | — | (21.2 | ) | ||||||||
| Net (decrease) increase in short-term debt |
(38.0 | ) | 68.0 | (23.0 | ) | |||||||
| Cash flows used in financing activities |
(108.6 | ) | (44.8 | ) | (805.3 | ) | ||||||
| Net increase (decrease) in cash and cash equivalents |
33.8 | (150.4 | ) | (279.0 | ) | |||||||
| Cash and cash equivalents at beginning of the year |
12.2 | 162.6 | 441.6 | |||||||||
| Cash and cash equivalents at end of the year |
$ | 46.0 | $ | 12.2 | $ | 162.6 | ||||||
| Supplemental disclosure of cash flow information |
||||||||||||
| Cash paid during the year for: |
||||||||||||
| Interest (net of amounts capitalized) |
$ | 216.4 | $ | 203.0 | $ | 262.1 | ||||||
| Income taxes paid (refund) |
$ | 4.1 | $ | 6.0 | $ | (10.5 | ) | |||||
The accompanying notes are an integral part of the consolidated financial statements.
82
Table of Contents
Consolidated Statements of Capital
| (millions) |
Shares (1) | Common Stock |
Additional Paid-in Capital |
Retained Earnings |
Accumulated Other Comprehensive Income (Loss) |
Noncontrolling Interest |
Total Capital |
|||||||||||||||||
| Balance, Dec. 31, 2006 |
209.5 | $ | 209.5 | $ | 1,466.3 | $ | 83.7 | $ | (30.5 | ) | $ | (0.8 | ) | $ | 1,728.2 | |||||||||
| Net income |
413.2 | (82.2 | ) | 331.0 | ||||||||||||||||||||
| Other comprehensive income, after tax |
13.3 | 13.3 | ||||||||||||||||||||||
| Common stock issued |
1.4 | 1.4 | 10.9 | 12.3 | ||||||||||||||||||||
| Cash dividends declared |
(163.0 | ) | (163.0 | ) | ||||||||||||||||||||
| Stock compensation expense |
11.6 | 11.6 | ||||||||||||||||||||||
| Implementation of guidance for uncertain tax positions |
0.2 | 0.2 | ||||||||||||||||||||||
| Tax benefits—stock options |
0.4 | 0.4 | ||||||||||||||||||||||
| Decrease in noncontrolling interest |
83.0 | 83.0 | ||||||||||||||||||||||
| Balance, Dec. 31, 2007 |
210.9 | $ | 210.9 | $ | 1,489.2 | $ | 334.1 | $ | (17.2 | ) | $ | — | $ | 2,017.0 | ||||||||||
| Net income |
162.4 | 162.4 | ||||||||||||||||||||||
| Other comprehensive loss, after tax |
(28.8 | ) | (28.8 | ) | ||||||||||||||||||||
| Common stock issued |
2.0 | 2.0 | 19.3 | 21.3 | ||||||||||||||||||||
| Cash dividends declared |
(168.6 | ) | (168.6 | ) | ||||||||||||||||||||
| Stock compensation expense |
9.7 | 9.7 | ||||||||||||||||||||||
| Implementation of guidance for employer’s post-retirement benefits |
(5.3 | ) | (5.3 | ) | ||||||||||||||||||||
| Balance, Dec. 31, 2008 |
212.9 | $ | 212.9 | $ | 1,518.2 | $ | 322.6 | $ | (46.0 | ) | $ | — | $ | 2,007.7 | ||||||||||
| Net income |
213.9 | 213.9 | ||||||||||||||||||||||
| Other comprehensive income, after tax |
21.0 | 21.0 | ||||||||||||||||||||||
| Common stock issued |
1.0 | 1.0 | 2.2 | 3.2 | ||||||||||||||||||||
| Cash dividends declared |
(170.8 | ) | (170.8 | ) | ||||||||||||||||||||
| Stock compensation expense |
10.4 | 10.4 | ||||||||||||||||||||||
| Balance, Dec. 31, 2009 |
213.9 | $ | 213.9 | $ | 1,530.8 | $ | 365.7 | $ | (25.0 | ) | $ | — | $ | 2,085.4 | ||||||||||
| (1) | TECO Energy had a maximum of 400 million shares of $1 par value common stock authorized as of Dec. 31, 2009, 2008, 2007 and 2006. |
The accompanying notes are an integral part of the consolidated financial statements.
83
Table of Contents
NOTES TO CONSOLIDATED FINANCIAL STATEMENTS
| 1. | Significant Accounting Policies |
The significant accounting policies for both utility and diversified operations are as follows:
Principles of Consolidation
The consolidated financial statements include the accounts of TECO Energy, Inc. and its majority-owned subsidiaries (TECO Energy or the company). All significant inter-company balances and inter-company transactions have been eliminated in consolidation. Generally, the equity method of accounting is used to account for investments in partnerships or other arrangements in which TECO Energy or its subsidiary companies do not have majority ownership or exercise control.
For entities that are determined to meet the definition of a variable interest entity (VIE), the company obtains information, where possible, to determine if it is the primary beneficiary of the VIE. If the company is determined to be the primary beneficiary, then the VIE is consolidated and a minority interest is recognized for any other third-party interests. If the company is not the primary beneficiary, then the VIE is accounted for using the equity or cost method of accounting. In certain circumstances this can result in the company consolidating entities in which it has less than a 50% equity investment and deconsolidating entities in which it has a majority equity interest (see Note 19).
Use of Estimates
The use of estimates is inherent in the preparation of financial statements in accordance with generally accepted accounting principles (GAAP). Actual results could differ from these estimates.
Cash Equivalents
Cash equivalents are highly liquid, high-quality investments purchased with an original maturity of three months or less. The carrying amount of cash equivalents approximated fair market value because of the short maturity of these instruments.
Restricted Cash
Restricted cash included in “Deferred charges and other assets” included $7.0 million at Dec. 31, 2009 and $7.3 million at Dec. 31, 2008 of cash held in escrow related to the 2003 sale of Hardee Power Partners (HPP). The $7.0 million will be released from escrow in 2012, upon maturity of debt financing currently held by the purchaser of HPP. Restricted cash also included other unrelated amounts totaling approximately $0.2 million at Dec. 31, 2008.
Cost Capitalization
Debt issuance costs—The company capitalizes the external costs of obtaining debt financing and includes them in “Deferred charges and other assets” on TECO Energy’s Consolidated Balance Sheet and amortizes such costs over the life of the related debt on a straight-line basis that approximates the effective interest method. These amounts are reflected in “Interest expense” on TECO Energy’s Consolidated Statements of Income.
As discussed in Note 7, Long-term Debt, in December 2007, TECO Energy completed a debt exchange offer where $899.3 million principal amount of outstanding TECO Energy notes were exchanged for TECO Finance notes with substantially the same terms. Fees paid to the note holders in connection with these transactions of $21.2 million were capitalized and will be amortized over the lives of the related TECO Finance notes. The payment of these fees is reflected as “Debt exchange premiums” in the Financing section of the Consolidated Statement of Cash Flows for the year ended Dec. 31, 2007.
Planned Major Maintenance
TECO Energy accounts for planned maintenance projects by expensing the costs as incurred. Planned major maintenance projects that do not increase the overall life or value of the related assets are expensed. When the major maintenance materially increases the life or value of the underlying asset, the cost is capitalized. While normal maintenance outages covering various components of the plants generally occur on at least a yearly basis, major overhauls occur less frequently.
Tampa Electric and Peoples Gas System (PGS) expense major maintenance costs as incurred. For Tampa Electric and PGS, concurrent with a planned major maintenance outage, the cost of adding or replacing retirement units-of-property is capitalized in conformity with Florida Public Service Commission (FPSC) and Federal Energy Regulatory Commission (FERC) regulations.
84
Table of Contents
TECO ENERGY, INC.
NOTES TO CONSOLIDATED FINANCIAL STATEMENTS—(Continued)
The San José and Alborada plants in Guatemala have power purchase agreements (PPA) with EEGSA. A major maintenance revenue recovery component is explicit in the capacity payment portion of the PPA for each plant. Accordingly, a portion of each monthly fixed capacity payment is deferred to recognize the portion that reflects recovery of future planned major maintenance expenses. Actual maintenance costs are expensed when incurred with a like amount of deferred recovery revenue recognized at the same time.
Depreciation
TECO Energy subsidiaries compute depreciation primarily by the straight-line method at annual rates that amortize the original cost, less net salvage value, of depreciable property over its estimated service life. TECO Coal subsidiaries depreciate certain mining assets by the units of production method that assigns a rate per unit produced by dividing the original cost over the estimated amount of units.
Total depreciation expense for the years ended Dec. 31, 2009, 2008 and 2007 was $275.2 million, $257.3 million and $254.0 million, respectively. The provision for total regulated utility plant in service, expressed as a percentage of the original cost of depreciable property was 3.6% for 2009 and 2008 and 3.7% for 2007.
Allowance for Funds Used During Construction (AFUDC)
AFUDC is a non-cash credit to income with a corresponding charge to utility plant which represents the cost of borrowed funds and a reasonable return on other funds used for construction. The base on which AFUDC is calculated excludes construction work-in-progress which has been included in rate base and prior to May 2009, a $36 million threshold established in the company’s last rate case, but eliminated in the most recent proceeding. The rate used to calculate AFUDC is revised periodically to reflect significant changes in Tampa Electric’s cost of capital. The rate was 8.16% for May through December 2009 and 7.79% for January through April 2009 and all of 2008 and 2007. Total AFUDC for 2009, 2008 and 2007 was $13.8 million, $8.7 million and $6.2 million, respectively.
Inventory
TECO Energy subsidiaries value materials, supplies and fossil fuel inventory (coal, oil and natural gas) using a weighted-average cost method. These materials, supplies, and fuel inventories are carried at the lower of weighted-average cost or market, unless evidence indicates that the weighted-average cost (even if in excess of market) will be recovered with a normal profit upon sale in the ordinary course of business.
Investments in Unconsolidated Affiliates
Investments in unconsolidated affiliates are accounted for using the equity method of accounting. The percentage ownership interests for each investment at Dec. 31, 2009 and 2008 are presented in the following table:
TECO Energy’s Percent Ownership in Unconsolidated Affiliates (1)
| Dec. 31, |
2009 | 2008 | ||||
| TECO Guatemala |
||||||
| Distribućion Eléctrica CentroAmericana II, S.A.(DECA II) |
30 | % | 30 | % | ||
| Central Generadora Electrica San José, Limitada (San José or CGESJ) |
100 | % | 100 | % | ||
| Tampa Centro Americana de Electricidad, Limitada (Alborada or TCAE) |
96 | % | 96 | % | ||
| Other |
||||||
| UtiliPro Services, LLC |
33 | % | — | |||
| (1) | TECO Energy, Inc. received $42.2 million, $63.3 million and $63.2 million during the years ended Dec. 31, 2009, 2008 and 2007, respectively, as dividends from unconsolidated affiliates. |
On Jul. 27, 2009, TECO Consumer Ventures, Inc. (an indirect, wholly-owned subsidiary of TECO Energy), AGL UtiliPro Holdings, LLC and Michcon Fuel Services Company entered into a limited liability company agreement to capitalize UtiliPro Services, LLC (UtiliPro). UtiliPro was created to provide marketing, sale and support of home services contracts with respect to home furnace/HVAC systems, water heaters, refrigerators, ranges/ovens, washers and dryers and other major household appliances in the states of Georgia and Florida. Pursuant to this agreement, as of Dec. 31, 2009, TECO Consumer Ventures held 700 of the 2,100 UtiliPro units outstanding (1/3 ownership) based on capital contributions.
85
Table of Contents
TECO ENERGY, INC.
NOTES TO CONSOLIDATED FINANCIAL STATEMENTS—(Continued)
In accordance with the accounting guidance for equity method investments, the company assesses whether there has been an impairment of its equity investments and their associated goodwill when such impairment indicators exist. Indicators of impairment existed for the company’s investment in DECA II, triggering a requirement to ascertain the recoverability of the investment and its related goodwill using discounted cash flows. No impairment to the carrying value of the investment was needed at Dec. 31, 2009. See Note 18 for specific details regarding the result of the assessment.
Regulatory Assets and Liabilities
Tampa Electric and PGS are subject to accounting guidance for the effects of certain types of regulation (see Note 3 for additional details).
Deferred Income Taxes
TECO Energy uses the asset and liability method to determine deferred income taxes. Under the asset and liability method, the company estimates its current tax exposure and assesses the temporary differences resulting from differences in the treatment of items, such as depreciation, for financial statement and tax purposes. These differences are reported as deferred taxes, measured at current rates, in the consolidated financial statements. Management reviews all reasonably available current and historical information, including forward-looking information, to determine if it is more likely than not that some or all of the deferred tax asset will not be realized. If management determines that it is likely that some or all of a deferred tax asset will not be realized, then a valuation allowance is recorded to report the balance at the amount expected to be realized.
Investment Tax Credits
Investment tax credits have been recorded as deferred credits and are being amortized as reductions to income tax expense over the service lives of the related property.
Revenue Recognition
TECO Energy recognizes revenues consistent with the Securities and Exchange Commission’s (SEC) Staff Accounting Bulletin (SAB) 104, Revenue Recognition in Financial Statements. Except as discussed below, TECO Energy and its subsidiaries recognize revenues on a gross basis when earned for the physical delivery of products or services and the risks and rewards of ownership have transferred to the buyer. Revenues for any financial or hedge transactions that do not result in physical delivery are reported on a net basis.
The regulated utilities’ (Tampa Electric and PGS) retail businesses and the prices charged to customers are regulated by the FPSC. Tampa Electric’s wholesale business is regulated by the FERC. See Note 3 for a discussion of significant regulatory matters and the applicability of the accounting guidance for certain types of regulation to the company.
Revenues for TECO Coal shipments via rail are recognized when title and risk of loss transfer to the customer. For coal shipments via ocean vessel, revenue is recognized under international shipping standards as defined by Incoterms 2000 when title and risk of loss transfer to the customer.
Revenues for certain transportation services at TECO Transport, prior to its sale in December 2007, were recognized using the percentage of completion method, which included estimates of the distance traveled and/or the time elapsed, compared to the total estimated contract.
Revenues for energy marketing operations at TECO Gas Services are presented on a net basis in accordance with the accounting guidance for reporting revenue gross as a principal versus net as an agent and recognition and reporting of gains and losses on energy trading contracts to reflect the nature of the contractual relationships with customers and suppliers. As a result, costs netted against revenues for the years ended Dec. 31, 2009, 2008 and 2007 were $1.9 million, $17.3 million and $2.1 million, respectively.
Shipping and Handling
TECO Coal includes the costs to ship product to customers in “Operation other expense—Mining related costs” on the Consolidated Statements of Income for the periods ended Dec. 31, 2009, 2008 and 2007 of $24.3 million, $30.1 million and $25.9 million, respectively.
86
Table of Contents
TECO ENERGY, INC.
NOTES TO CONSOLIDATED FINANCIAL STATEMENTS—(Continued)
Derivatives and Hedging Activities
The company classifies cash inflows and outflows related to derivative and hedging instruments in the appropriate cash flow sections associated with the item being hedged. In the case of heating oil swaps that are used to mitigate the fluctuations in the price of diesel fuel, the cash inflows and outflows are included in the operations section. Settlements for crude oil options that protected the cash flows related to the sales of investor interests in the synthetic fuel production facilities are included in the investing section.
Other Income and Noncontrolling Interest
Prior to 2008, TECO Energy earned a significant portion of its income indirectly through the synthetic fuel operations at TECO Coal. TECO Coal had previously sold ownership interests in the synthetic fuel facilities to unrelated third-party investors equal to 98%. These investors paid for the purchase of the ownership interests as synthetic fuel was produced. The payments were based on the amount of production and sales of synthetic fuel and the related underlying value of the tax credit, which was subject to potential limitation based on the price of domestic crude oil. These payments are recorded in “Other income” in the Consolidated Statements of Income. The program that provided federal income tax credits for the production of synthetic fuel expired Dec. 31, 2007.
Additionally, the outside investors made payments towards the cost of producing synthetic fuel. These payments are reflected as a benefit under “Noncontrolling interest” in TECO Energy’s Consolidated Statements of Income and these benefits comprise the majority of that line item.
For the year ended Dec. 31, 2007, “Other income” reflected a phase-out of approximately 67%, or $140.2 million, of the benefit of the underlying value of any 2007 tax credits based on an estimate of the average annual price of domestic crude oil during 2007. The cash payments and the benefits recognized in “Other income” and “Noncontrolling interest” were adjusted in the first quarter of 2008 for the final adjustment of $0.9 million to the 2007 inflation factor applied to the tax credit available on the production of synthetic fuel in 2007.
To protect the cash proceeds derived from the sale of ownership interests, TECO Energy had in place crude oil options to hedge against the risk of high oil prices reducing the value of the tax credits related to the production of synthetic fuel. These instruments were marked-to-market with fair value gains and losses recognized in “Other income” on the Consolidated Statements of Income. For the year ended Dec. 31, 2007, the company recognized gains on marked-to-market derivatives of $82.7 million.
Revenues and Cost Recovery
Revenues include amounts resulting from cost recovery clauses which provide for monthly billing charges to reflect increases or decreases in fuel, purchased power, conservation and environmental costs for Tampa Electric and purchased gas, interstate pipeline capacity and conservation costs for PGS. These adjustment factors are based on costs incurred and projected for a specific recovery period. Any over- or under-recovery of costs plus an interest factor are taken into account in the process of setting adjustment factors for subsequent recovery periods. Over-recoveries of costs are recorded as regulatory liabilities, and under-recoveries of costs are recorded as regulatory assets.
Certain other costs incurred by the regulated utilities are allowed to be recovered from customers through prices approved in the regulatory process. These costs are recognized as the associated revenues are billed. The regulated utilities accrue base revenues for services rendered but unbilled to provide a closer matching of revenues and expenses (see Note 3). As of Dec. 31, 2009 and 2008, unbilled revenues of $51.6 million and $47.4 million, respectively, are included in the “Receivables” line item on TECO Energy’s Consolidated Balance Sheets.
Tampa Electric purchases power on a regular basis primarily to meet the needs of its retail customers. Tampa Electric purchased power from non-TECO Energy affiliates at a cost of $177.6 million, $305.4 million and $271.9 million, for the years ended Dec. 31, 2009, 2008 and 2007, respectively. The prudently incurred purchased power costs at Tampa Electric have historically been recovered through an FPSC-approved cost recovery clause.
Accounting for Excise Taxes, Franchise Fees and Gross Receipts
TECO Coal incurs most of TECO Energy’s total excise taxes, which are accrued as an expense and reconciled to the actual cash payment of excise taxes. As general expenses, they are not specifically recovered through revenues. Excise taxes paid by the regulated utilities are not material and are expensed when incurred.
87
Table of Contents
TECO ENERGY, INC.
NOTES TO CONSOLIDATED FINANCIAL STATEMENTS—(Continued)
The regulated utilities are allowed to recover certain costs incurred from customers through prices approved by the FPSC. The amounts included in customers’ bills for franchise fees and gross receipt taxes are included as revenues on the Consolidated Statements of Income. These amounts totaled $115.7 million, $109.2 million and $111.2 million for the years ended Dec. 31, 2009, 2008 and 2007, respectively. Franchise fees and gross receipt taxes payable by the regulated utilities are included as an expense on the Consolidated Statements of Income in “Taxes, other than income”. For the years ended Dec. 31, 2009, 2008 and 2007, these totaled $115.6 million, $109.0 million and $110.9 million, respectively.
Asset Impairments
TECO Energy and its subsidiaries apply the provisions of the accounting guidance for long-lived assets. The accounting guidance addresses accounting and reporting for the impairment or disposal of long-lived assets, including the disposal of a component of a business.
In accordance with the accounting guidance, the company assesses whether there has been an impairment of its long-lived assets and certain intangibles held and used by the company when such impairment indicators exist. Indicators of impairment did not exist for any long-lived asset.
Deferred Charges and Other Assets
Deferred charges and other assets consist primarily of mining development costs amortized on a per ton basis and offering costs associated with various debt offerings that are being amortized over the related obligation period as an increase in interest expense.
Deferred Credits and Other Liabilities
Other deferred credits primarily include the accrued postretirement and pension liabilities, and medical and general liability claims incurred but not reported. The company and its subsidiaries have a self-insurance program supplemented by excess insurance coverage for the cost of claims whose ultimate value exceeds the company’s retention amounts. The company estimates its liabilities for auto, general, marine protection and indemnity, and workers’ compensation using discount rates mandated by statute or otherwise deemed appropriate for the circumstances. Discount rates used in estimating these other self-insurance liabilities at both Dec. 31, 2009 and 2008 ranged from 4.00% to 4.75%.
Stock-based Compensation
TECO Energy accounts for its stock-based compensation in accordance with the accounting guidance for share-based payment. Under the provisions of this guidance, share-based compensation cost is measured at the grant date, based on the calculated fair value of the award, and is recognized as an expense over the employee’s or director’s requisite service period (generally the vesting period of the equity grant). See Note 9 for more information on share-based payments.
Restrictions on Dividend Payments and Transfer of Assets
Dividends on TECO Energy’s common stock are declared and paid at the discretion of its Board of Directors. The primary sources of funds to pay dividends on TECO Energy’s common stock are dividends and other distributions from its operating companies. TECO Energy’s credit facility contains a covenant that could limit the payment of dividends exceeding a calculated amount (initially $50 million) in any quarter under certain circumstances. Certain long-term debt at PGS contains restrictions that limit the payment of dividends and distributions on the common stock of Tampa Electric Company.
In addition, TECO Diversified, Inc., a wholly-owned subsidiary of TECO Energy and the holding company for TECO Coal, has a guarantee related to a coal supply agreement that limits the payment of dividends to its common shareholder, TECO Energy, but does not limit loans or advances. See Notes 6, 7 and 12 for additional information on significant financial covenants.
Foreign Operations
The functional currency of the company’s foreign investments is primarily the U.S. dollar. Transactions in the local currency are re-measured to the U.S. dollar for financial reporting purposes. The aggregate re-measurement gains or losses included in net income in 2009, 2008 and 2007 were not material. The foreign investments are generally protected from any significant currency gains or losses by the terms of the Guatemalan power sales agreements and other related contracts, in which payments are defined in U.S. dollars.
88
Table of Contents
TECO ENERGY, INC.
NOTES TO CONSOLIDATED FINANCIAL STATEMENTS—(Continued)
| 2. | New Accounting Pronouncements |
Measuring Liabilities at Fair Value
In August 2009, the Financial Accounting Standards Board (FASB) issued an accounting standards update that clarifies how to measure the fair value of a liability when there is not a quoted price in an active market for a liability. This update provides clarification that in circumstances in which a quoted price in an active market for the identical liability is not available, a reporting entity is required to measure fair value using alternative techniques including, but not limited to: 1) the quoted price of the identical liability when traded as an asset or 2) quoted prices for similar liabilities or similar liabilities when traded as assets. It was effective for the first reporting period beginning after issuance. The new requirement did not have an impact on the company’s results of operations, statement of position or cash flows.
The FASB Accounting Standards Codification and the Hierarchy of Generally Accepted Accounting Principles
In June 2009, the FASB issued guidance that names the FASB Accounting Standards Codification (Codification) as the single source of authoritative U.S. GAAP for non-governmental entities recognized by the FASB. It was effective in the third quarter and supersedes all U.S. GAAP accounting standards, aside from rules and interpretive releases issued by the SEC. The Codification is not intended to change GAAP; rather, it changes all referencing of U.S. GAAP including the notes to financial statements. Therefore, it did not have an impact on the company’s results of operations, statement of position or cash flows.
Variable Interest Entities
In June 2009, the FASB issued guidance that amended the analysis to determine the primary beneficiary of a VIE. It requires an enterprise to determine whether the enterprise’s variable interest or interests give it a controlling financial interest in a VIE. This analysis identifies the primary beneficiary of a VIE as the enterprise that has both 1) the power to direct the activities of a VIE that most significantly impact the entity’s economic performance, and 2) the obligation to absorb losses of the entity that could potentially be significant to the VIE or the right to receive benefits from the entity that could potentially be significant to the VIE.
This guidance is effective for fiscal years beginning after Nov. 15, 2009. TECO Energy adopted this guidance on Jan. 1, 2010. Upon adoption, it was determined that as a result of the new approach, the company would reconsolidate the San José and Alborada projects that were deconsolidated under the prior guidance. This new guidance will impact the company’s statement of position and cash flows, but not the results of operations. See Note 19 for further discussion.
Subsequent Events
In May 2009, the FASB issued guidance that requires companies to disclose the date through which they evaluated subsequent events and whether that date corresponds with the filing of their financial statements. It became effective for fiscal periods ending after Jun. 15, 2009, and the adoption did not have an impact on the company’s results of operations, statement of position or cash flows.
Fair Value Measurements
In September 2006, the FASB issued guidance that defines fair value, establishes a framework for measuring fair value under GAAP, and expands required disclosures about fair value measurements. The guidance emphasizes that fair value is a market-based measurement, not an entity-specific measurement, and states that a fair value measurement should be determined based on the assumptions that market participants would use in pricing the asset or liability. The guidance applies under other accounting pronouncements that require or permit fair value measurements.
The effective date was for fiscal years beginning after Nov. 15, 2007. In November of 2007, the FASB informally granted a one year deferral for non-financial assets and liabilities. In February 2008, the FASB formally delayed the effective date of the fair value guidance to fiscal years beginning after Nov. 15, 2008 for non-financial assets and non-financial liabilities except for items that are required to be recognized or disclosed at fair value at least annually in the company’s financial statements. As a result, the company adopted the fair value guidance effective Jan. 1, 2008 for financial assets and liabilities and Jan. 1, 2009 for non-financial assets and liabilities. No adoption adjustment was necessary. Financial assets and liabilities of the company measured at fair value include derivatives and certain investments, for which fair values are primarily based on observable inputs. Non-financial assets and liabilities of the company measured at fair value include asset retirement obligations (AROs) when they are incurred and any long-lived assets or equity-method investments that are impaired in a currently reported period.
In April 2009, the FASB issued additional guidance to address fair value valuation concerns in the current market environment. These concerns included applying the fair value model when the market for an asset is not active, when there are other-than-temporary impairments (OTTI) of debt and equity securities and when to include interim disclosures about the fair value of financial instruments.
89
Table of Contents
TECO ENERGY, INC.
NOTES TO CONSOLIDATED FINANCIAL STATEMENTS—(Continued)
When the market for an asset is not active, the newly issued guidance affirms that the objective of fair value is the price that would be received to sell the asset in an orderly transaction (that is, not a forced liquidation or distressed sale) between market participants at the measurement date in the inactive market. The determination of whether a transaction was not orderly should be based on the weight of the evidence. An entity is required to disclose a change in valuation technique and the related inputs resulting from the application of the new guidance and to quantify its impact. Retrospective application was not permitted. The new guidance became effective for interim and annual periods ending after Jun. 15, 2009. This did not materially affect the company’s results of operations, statement of position or cash flows.
The OTTI guidance is applicable to debt securities and requires that a company recognize the credit component of an OTTI in earnings and the remaining portion in other comprehensive income if management asserts it does not have the intent to sell the security and it is more likely than not it will not have to sell the security before recovery of its cost basis. It requires an entity to present, separately in the financial statement where the components of other comprehensive income are reported, the amounts recognized in accumulated other comprehensive income related to the noncredit portion of OTTI recognized for available-for-sale and held-to-maturity debt securities. Additionally, disclosure requirements were amended and are required for interim periods. The guidance became effective for interim and annual periods ending after Jun. 15, 2009 and did not materially affect the company’s results of operations, statement of position or cash flows.
Interim disclosures of fair value information, including methods and significant assumptions in measuring fair value, for financial instruments are required under the new guidance. The guidance became effective for interim and annual periods ending after Jun. 15, 2009 and had no impact on the company’s results of operations, statement of position or cash flows.
Employers’ Disclosures about Postretirement Benefit Plan Assets
In December 2008, the FASB issued guidance that requires enhanced disclosures about plan assets of defined benefit pension plans or other postretirement plans, including the concentrations of risk in those plans. The guidance was effective for fiscal years ending after Dec. 15, 2009 and is significant to the company’s financial statement disclosures but has no impact on the company’s results of operations, statement of position or cash flows.
In September 2009, the FASB issued an accounting standards update that allows reporting entities to use net asset value (NAV) as an estimate of fair value for certain investments. The guidance became effective for interim and annual periods ending after Dec. 15, 2009. The guidance had an impact on the company’s postretirement benefit plan footnote, as some of the company’s pension plan assets use NAV to estimate fair value.
Determining Whether Instruments Granted in Share-Based Payment Transactions are Participating Securities
In June 2008, the FASB issued guidance requiring that the two-class method earnings per share calculation include unvested share-based payment awards that contain non-forfeitable rights to dividends or dividend equivalents, whether the dividend or dividend equivalents are paid or not paid. The guidance became effective for fiscal years beginning after Dec. 15, 2008 and had no material impact to the company’s results of operations, statement of position or cash flows.
Disclosures about Derivative Instruments and Hedging Activities
In March 2008, the FASB issued guidance to enhance the disclosure framework for derivatives and hedging. Enhanced disclosures about the purpose of an entity’s derivative instruments, how derivative instruments and hedged items are accounted for, and how the entity’s financial position, cash flows and performance are enhanced by the derivative instruments and hedged items were required for fiscal years and interim periods beginning after Nov. 15, 2008. The guidance was significant to the company’s financial statement disclosures, but had no impact on its results of operations, statement of position or cash flows.
Additionally, in April 2008, the FASB revised previously issued implementation guidance to reflect the enhanced disclosures required by the new guidance. These revisions are significant to the company’s financial statement disclosures, but have no impact on its results of operations, statement of position or cash flows.
| 3. | Regulatory |
Tampa Electric’s and PGS’ retail businesses are regulated by the FPSC. Tampa Electric is subject to regulation by the FERC under the Public Utility Holding Company Act of 2005 (PUHCA 2005). However, pursuant to a waiver granted in accordance with the FERC’s regulations, TECO Energy is not subject to certain accounting, record-keeping and reporting requirements prescribed by the FERC’s regulations under PUHCA 2005. The operations of PGS are regulated by the FPSC separately from the regulation of Tampa Electric. The FPSC has jurisdiction over rates, service, issuance of securities, safety, accounting and depreciation
90
Table of Contents
TECO ENERGY, INC.
NOTES TO CONSOLIDATED FINANCIAL STATEMENTS—(Continued)
practices and other matters. In general, the FPSC sets rates at a level that allows a utility such as PGS to collect total revenues (revenue requirements) equal to its cost of providing service, plus a reasonable return on invested capital.
Base Rates—Tampa Electric
In order for Tampa Electric to continue meeting customers’ growing needs for reliable, efficient and affordable electric service, Tampa Electric filed with the FPSC for a base rate increase in August 2008. In March 2009, the FPSC approved an increase to base rates, effective on May 7, 2009, of $104.3 million that reflected a return on equity of 11.25%, which is the middle of a range between 10.25% and 12.25%. Additionally, the FPSC approved a 2010 portion of the base rate increase of $33.5 million, subject to need and prudency, effective Jan. 1, 2010 for capital additions placed in service in 2009, bringing the total approved base rate increase to $137.8 million.
In May 2009, Tampa Electric filed a Motion for Reconsideration (Motion) regarding the calculation of the annual revenue requirements approved by the FPSC. In July 2009, the FPSC approved Tampa Electric’s Motion resulting in an overall weighted cost of capital of 8.29%, compared to the 8.11% previously approved. This change increased the previously approved $104.3 million to $113.6 million and the $33.5 million 2010 portion to $34.1 million, bringing the total approved base rate increase to $147.7 million.
In connection with the base rate request, the FPSC rejected the intervenors’ arguments that the approved 2010 increase for recovery of costs associated with five combustion turbines and rail facilities violated the intervenors’ due process rights, Florida Statutes or FPSC rules. On Sep. 14, 2009, the intervenors filed an appeal to the Florida Supreme Court. Tampa Electric will oppose this appeal and it is not expected to affect the timing of the increase. On Feb. 24, 2010, the intervenors filed appellate briefs. There is no specific time frame for a resolution. If the intervenors were to eventually prevail, there would be revenues subject to refund.
On Oct. 12, 2009, Tampa Electric filed its petition supporting the continuing need for the combustion turbines, the commercial in service of the equipment and the costs incurred to place the combustion turbines and rail facilities in service and requesting the proposed rates to be put into effect in January 2010 as authorized by the Commission. On Dec. 1, 2009 the Commission determined, based in part on its staff audit of the actual costs of the CTs, the 2010 portion should be reduced $8.4 million to $25.7 million, subject to refund. An evidentiary hearing will be held during 2010 regarding the continuing need for the CTs, the appropriate amount to be recovered and the resulting rates. The increase in base rates became effective in January 2010 as ordered by the FPSC, subject to refund.
Base Rates—PGS
Recognizing the significant decline in ROE, PGS filed with the FPSC for a $3.7 million interim rate increase in August 2008. The FPSC approved an interim rate increase of $2.4 million effective Oct. 29, 2008. PGS also filed in August 2008 with the FPSC for a $26.5 million base rate increase. On May 5, 2009, the FPSC approved a base rate increase of $19.2 million that became effective on Jun. 18, 2009 and reflects a return on equity of 10.75%, which is the middle of a range between 9.75% and 11.75%. The allowed equity in capital structure is 54.7% from all investor sources of capital on an allowed rate base of $560.8 million.
Cost Recovery—Tampa Electric
Tampa Electric’s fuel, purchased power, conservation and certain environmental costs are recovered through levelized monthly charges established pursuant to the FPSC’s cost recovery clauses. These charges, which are reset annually in an FPSC proceeding, are based on estimated costs of fuel, environmental compliance, conservation programs and purchased power and estimated customer usage for a specific recovery period, with a true-up adjustment to reflect the variance of actual costs from the projected costs. The FPSC may disallow recovery of any costs that it considers imprudently incurred.
The FPSC determined in 2004 and 2005 that it was appropriate for Tampa Electric to recover SCR operating costs through the ECRC as well as earn a return on its SCR investment installed on Big Bend Units 1 through 4 for NOx control in compliance with the environmental consent decree. The SCRs for Big Bend Units 4, 3 and 2 entered service in 2007, 2008 and 2009, respectively, and cost recovery started in 2007, 2008 and 2009, respectively. The SCR for Big Bend Unit 1 is scheduled to enter service in May 2010, and cost recovery for the capital investment will commence in 2010.
Cost Recovery—PGS
PGS recovers the costs it pays for gas supply and interstate transportation for system supply through the purchased gas adjustment (PGA) clause. This charge is designed to recover the costs incurred by PGS for purchased gas, and for holding and using interstate pipeline capacity for the transportation of gas it delivers to its customers. These charges may be adjusted monthly
91
Table of Contents
TECO ENERGY, INC.
NOTES TO CONSOLIDATED FINANCIAL STATEMENTS—(Continued)
based on a cap approved annually by the FPSC. The cap is based on estimated costs of purchased gas and pipeline capacity, and estimated customer usage for a specific recovery period, with a true-up adjustment to reflect the variance of actual costs and usage from the projected charges for prior periods. In November 2009, the FPSC approved the PGS annual purchased gas adjustment cap factor for January 2010 through December 2010.
In addition to PGS’ base rates and purchased gas adjustment clause charges, PGS customers (except interruptible customers) also pay a per-therm conservation charge for all gas. This charge is intended to permit PGS to recover its costs incurred in developing and implementing energy conservation programs, which are mandated by Florida law and approved and supervised by the FPSC. PGS is permitted to recover, on a dollar-for-dollar basis, prudently incurred expenditures made in connection with these programs if it demonstrates that the programs are cost effective for its ratepayers. The FPSC requires natural gas utilities to offer transportation-only service to all non-residential customers. As a result, PGS receives its base rate for distribution regardless of whether a customer decides to opt for transportation-only service or continue bundled service. As of Dec. 31, 2009, PGS had approximately 15,250 transportation-only customers out of 31,400 eligible customers.
In addition to economic regulation, PGS is subject to the FPSC’s safety jurisdiction, pursuant to which the FPSC regulates the construction, operation and maintenance of PGS’ distribution system. In general, the FPSC has implemented this by adopting the Minimum Federal Safety Standards and reporting requirements for pipeline facilities and transportation of gas prescribed by the U.S. Department of Transportation in Parts 191, 192 and 199, Title 49, Code of Federal Regulations.
PGS is also subject to federal, state and local environmental laws and regulations pertaining to air and water quality, land use, noise and aesthetics, solid waste and other environmental matters.
Other Items
Storm Damage Cost Recovery
Tampa Electric accrues $8.0 million annually effective May 2009, an increase of $4.0 million from the prior year, to a FERC-authorized and FPSC-approved self-insured storm damage reserve. This reserve was created after Florida’s investor owned utilities (IOUs) were unable to obtain transmission and distribution insurance coverage due to destructive acts of nature. Tampa Electric’s storm reserve was $29.3 million and $22.7 million as of Dec. 31, 2009 and 2008, respectively.
Regulatory Assets and Liabilities
Tampa Electric and PGS maintain their accounts in accordance with recognized policies of the FPSC. In addition, Tampa Electric maintains its accounts in accordance with recognized policies prescribed or permitted by the FERC.
Tampa Electric and PGS apply the accounting standards for regulated operations. Areas of applicability include: deferral of revenues under approved regulatory agreements; revenue recognition resulting from cost recovery clauses that provide for monthly billing charges to reflect increases or decreases in fuel, purchased power, conservation and environmental costs; and the deferral of costs as regulatory assets to the period that the regulatory agency recognizes them when cost recovery is ordered over a period longer than a fiscal year.
92
Table of Contents
TECO ENERGY, INC.
NOTES TO CONSOLIDATED FINANCIAL STATEMENTS—(Continued)
Details of the regulatory assets and liabilities as of Dec. 31, 2009 and 2008 are presented in the following table:
Regulatory Assets and Liabilities
| (millions) |
Dec. 31, 2009 |
Dec. 31, 2008 | ||||
| Regulatory assets: |
||||||
| Regulatory tax asset (1) |
$ | 69.0 | $ | 65.1 | ||
| Other: |
||||||
| Cost recovery clauses |
89.4 | 266.8 | ||||
| Post-retirement benefit asset |
229.1 | 220.3 | ||||
| Deferred bond refinancing costs (2) |
18.0 | 21.7 | ||||
| Environmental remediation |
21.2 | 10.8 | ||||
| Competitive rate adjustment |
3.1 | 4.7 | ||||
| Other |
15.0 | 8.5 | ||||
| Total other regulatory assets |
375.8 | 532.8 | ||||
| Total regulatory assets |
444.8 | 597.9 | ||||
| Less: Current portion |
109.2 | 272.6 | ||||
| Long-term regulatory assets |
$ | 335.6 | $ | 325.3 | ||
| Regulatory liabilities: |
||||||
| Regulatory tax liability (1) |
$ | 19.6 | $ | 17.5 | ||
| Other: |
||||||
| Cost recovery clauses |
61.4 | 3.4 | ||||
| Environmental remediation |
19.9 | 10.6 | ||||
| Transmission and delivery storm reserve |
29.3 | 22.7 | ||||
| Deferred gain on property sales (3) |
2.8 | 4.1 | ||||
| Accumulated reserve-cost of removal |
554.3 | 551.2 | ||||
| Other |
0.7 | 0.4 | ||||
| Total other regulatory liabilities |
668.4 | 592.4 | ||||
| Total regulatory liabilities |
688.0 | 609.9 | ||||
| Less: Current portion |
85.4 | 21.7 | ||||
| Long-term regulatory liabilities |
$ | 602.6 | $ | 588.2 | ||
| (1) | Related to plant life and derivative positions. |
| (2) | Amortized over the term of the related debt instrument. |
| (3) | Amortized over a 5-year period with various ending dates. |
All regulatory assets are being recovered through the regulatory process. The following table further details our regulatory assets and the related recovery periods:
Regulatory assets
| (millions) Dec. 31, |
2009 | 2008 | ||||
| Clause recoverable (1) |
$ | 92.5 | $ | 271.5 | ||
| Components of rate base (2) |
238.1 | 227.7 | ||||
| Regulatory tax assets (3) |
69.0 | 65.1 | ||||
| Capital structure and other (3) |
45.2 | 33.6 | ||||
| Total |
$ | 444.8 | $ | 597.9 | ||
| (1) | To be recovered through cost recovery clauses approved by the FPSC on a dollar for dollar basis in the next year. |
| (2) | Primarily reflects allowed working capital, which is included in rate base and earns a rate of return as permitted by the FPSC. |
| (3) | “Regulatory tax assets” and “Capital structure and other” regulatory assets have a recoverable period longer than a fiscal year and are recognized over the period authorized by the regulatory agency. Also included are unamortized bond refinancing costs which are amortized over the life of the related debt instruments. See footnotes 1 and 2 in the prior table for additional information. |
93
Table of Contents
TECO ENERGY, INC.
NOTES TO CONSOLIDATED FINANCIAL STATEMENTS—(Continued)
| 4. | Income Tax Expense |
Income tax expense consists of the following components:
Income Tax Expense
| (millions) |
Federal | Foreign | State | Total | |||||||||||
| 2009 |
|||||||||||||||
| Continuing operations |
|||||||||||||||
| Current payable |
$ | — | $ | 0.6 | $ | (0.1 | ) | $ | 0.5 | ||||||
| Deferred |
86.0 | — | 12.5 | 98.5 | |||||||||||
| Amortization of investment tax credits |
(0.4 | ) | — | — | (0.4 | ) | |||||||||
| Total income tax expense |
$ | 85.6 | $ | 0.6 | $ | 12.4 | $ | 98.6 | |||||||
| 2008 |
|||||||||||||||
| Continuing operations |
|||||||||||||||
| Current payable |
$ | — | $ | 0.5 | $ | (0.6 | ) | $ | (0.1 | ) | |||||
| Deferred |
90.9 | 0.1 | 4.4 | 95.4 | |||||||||||
| Amortization of investment tax credits |
(0.9 | ) | — | — | (0.9 | ) | |||||||||
| Total income tax expense |
$ | 90.0 | $ | 0.6 | $ | 3.8 | $ | 94.4 | |||||||
| 2007 |
|||||||||||||||
| Continuing operations |
|||||||||||||||
| Current payable |
$ | 2.8 | $ | 0.7 | $ | 14.1 | $ | 17.6 | |||||||
| Deferred |
178.6 | — | 20.5 | 199.1 | |||||||||||
| Amortization of investment tax credits |
(2.5 | ) | — | — | (2.5 | ) | |||||||||
| Income tax expense from continuing operations |
$ | 178.9 | $ | 0.7 | $ | 34.6 | $ | 214.2 | |||||||
| Discontinued operations |
|||||||||||||||
| Deferred |
(14.3 | ) | — | — | (14.3 | ) | |||||||||
| Income tax benefit from discontinued operations |
(14.3 | ) | — | — | (14.3 | ) | |||||||||
| Total income tax expense |
$ | 164.6 | $ | 0.7 | $ | 34.6 | $ | 199.9 | |||||||
As discussed in Note 1, TECO Energy uses the liability method to determine deferred income taxes. Based primarily on the reversal of deferred income tax liabilities and future earnings of the company’s core utility operations, management has determined that the net deferred tax assets recorded at Dec. 31, 2009 will be realized in future periods.
The principal components of the company’s deferred tax assets and liabilities recognized in the balance sheet are as follows:
Deferred Income Tax Assets and Liabilities
| (millions) Dec. 31, |
2009 | 2008 | ||||||
| Deferred income tax assets (1) |
||||||||
| Alternative minimum tax credit carryforward |
$ | 197.2 | $ | 197.0 | ||||
| Losses and credit carryforwards |
553.2 | 578.9 | ||||||
| Other |
119.8 | 137.4 | ||||||
| Gross deferred income tax assets |
870.2 | 913.3 | ||||||
| Valuation allowance |
(14.6 | ) | (12.0 | ) | ||||
| Total deferred income tax assets |
855.6 | 901.3 | ||||||
| Deferred income tax liabilities (1) |
||||||||
| Property related |
(611.4 | ) | (514.5 | ) | ||||
| Deferred fuel |
(21.5 | ) | (53.0 | ) | ||||
| Total deferred income tax liabilities |
(632.9 | ) | (567.5 | ) | ||||
| Net deferred income tax assets |
$ | 222.7 | $ | 333.8 | ||||
| (1) | Certain property related assets and liabilities have been netted. |
94
Table of Contents
TECO ENERGY, INC.
NOTES TO CONSOLIDATED FINANCIAL STATEMENTS—(Continued)
At Dec. 31, 2009, the company had cumulative unused federal and state (Florida) net operating losses (NOLs) of $1,198.6 million and $487.3 million, respectively, expiring at various times between 2025 and 2029 and a $26.2 million unused capital loss, which expires in 2013. In addition, the company has unused general business credits of $3.6 million expiring between 2026 and 2028 and unused foreign tax credits of $49.5 million expiring between 2015 and 2019. The company also had available alternative minimum tax credit carryforwards for tax purposes of $197.2 million which may be used indefinitely to reduce federal income taxes.
The company establishes valuation allowances on its deferred tax assets, including losses and tax credits, when the amount of expected future taxable income is not likely to support the use of the deduction or credit. Our valuation allowance on foreign tax credits was $14.6 million at Dec. 31, 2009. During 2009, our valuation allowance increased $2.6 million due to an increase in the estimated amount of unrealizable foreign tax credits. The valuation allowance reduces our deferred tax assets to an amount that will more likely than not be realized. The amount of foreign tax credits considered realizable, however, could be reduced in the near term if estimates of future foreign source income during the carryforward period are reduced.
Effective Income Tax Rate
| (millions) For the years ended Dec. 31, |
2009 | 2008 | 2007 | |||||||||
| Income tax expense at the federal statutory rate of 35% |
$ | 109.4 | $ | 89.9 | $ | 185.8 | ||||||
| Increase (decrease) due to |
||||||||||||
| State income tax, net of federal income tax |
8.0 | 2.5 | 22.5 | |||||||||
| Tax effect of net income attributable to the noncontrolling interest |
— | — | 28.8 | |||||||||
| Foreign income taxed at different rates |
(18.0 | ) | (18.6 | ) | (17.5 | ) | ||||||
| Non-conventional fuels tax credit |
— | — | (1.4 | ) | ||||||||
| AFUDC equity |
(3.2 | ) | (2.2 | ) | (1.6 | ) | ||||||
| Tax on repatriation of foreign earnings |
12.5 | 14.8 | 5.4 | |||||||||
| Valuation allowance |
2.6 | 12.0 | 2.0 | |||||||||
| Depletion |
(7.3 | ) | (4.6 | ) | (7.8 | ) | ||||||
| Other |
(5.4 | ) | 0.6 | (2.0 | ) | |||||||
| Total income tax expense on consolidated statements of income |
$ | 98.6 | $ | 94.4 | $ | 214.2 | ||||||
For the three years presented, we experienced a number of events that have impacted the overall effective tax rate on continuing operations. These events included permanent reinvestment of foreign income as required by the accounting standards, repatriation of foreign earnings to the United States, the sale of a foreign subsidiary (see Note 16), valuation allowance on foreign tax credits, and depletion. The decrease in the company’s 2009 effective tax rate compared to 2008 was principally due to the decreased tax on repatriation of foreign earnings and valuation allowance on foreign tax credits and increased depletion and AFUDC equity benefit.
U.S. income taxes and foreign withholding taxes have not been provided on $57.0 million of undistributed earnings of certain foreign subsidiaries at Dec. 31, 2009 since these earnings are considered indefinitely reinvested. Applicable U.S. income and foreign withholding taxes are provided on these earnings in the periods in which they are no longer considered indefinitely reinvested. It is not practicable to determine the income tax liability that might be incurred if these earnings were to be distributed.
During 2008, the company repatriated $98.2 million of foreign earnings resulting in $14.7 million additional tax expense net of foreign tax credits. Of this amount $71.7 million represented a one-time repatriation from certain foreign subsidiaries whose remaining earnings at the end of the year are considered indefinitely reinvested.
The actual cash paid (refunded) for income taxes as required for the alternative minimum tax, state income taxes and prior year audits in 2009, 2008 and 2007 was $4.1 million, $6.0 million and ($10.5) million, respectively.
The company accounts for uncertain tax positions in accordance with FASB guidance. This guidance addresses the determination of whether tax benefits claimed or expected to be claimed on a tax return should be recorded in the financial statements. Under the guidance, the company may recognize the tax benefit from an uncertain tax position only if it is more likely than not that the tax position will be sustained on examination by the taxing authorities, based on the technical merits of the position. The tax benefits recognized in the financial statements from such a position should be measured based on the largest benefit that has a greater than fifty percent likelihood of being realized upon ultimate settlement. The guidance also provides guidance on derecognition, classification, interest and penalties on income taxes, accounting in interim periods and requires increased disclosures.
95
Table of Contents
TECO ENERGY, INC.
NOTES TO CONSOLIDATED FINANCIAL STATEMENTS—(Continued)
On Jan. 1, 2007, the company adopted the FASB guidance for uncertain tax positions. As a result of the implementation of this guidance, the company recognized a $0.1 million decrease in the deferred tax liability for uncertain tax benefits with a corresponding increase to the Jan. 1, 2007 balance of retained earnings.
The company has had on-going discussions with state tax authorities related to tax issues addressed prior to the adoption of this guidance. The principal remaining issues relate to how a state taxes the sale of various revenue components and how it treats the nature of the sale of various partnership interests. In 2009, the company received notice of hearing before the state’s Board of Tax Appeals scheduled for late in the first quarter of 2010. If these matters are positively settled, they would increase earnings in the period of settlement. If unfavorably resolved, they would have no impact on earnings, but they would result in a decrease in operating cash flows. The gross cash exposure on this issue as of Dec. 31, 2009 was $7.3 million. During 2009, a $0.9 million decrease for this issue affected the company’s effective tax rate.
A reconciliation of the beginning and ending amount of unrecognized tax benefits is as follows:
| (millions) |
2009 | 2008 | 2007 | |||||||
| Balance at Jan. 1 |
$ | 14.9 | $ | 14.9 | $ | 11.2 | ||||
| Increases due to tax positions related to prior years |
0.7 | — | 0.8 | |||||||
| Increases due to tax positions related to current year |
— | — | 2.9 | |||||||
| Decreases due to tax positions related to prior years |
(0.9 | ) | — | — | ||||||
| Decreases due to tax positions related to current year |
— | — | — | |||||||
| Decreases due to settlements with taxing authorities |
— | — | — | |||||||
| Decreases due to payments to taxing authorities |
(4.5 | ) | — | — | ||||||
| Decreases due to expiration of statute of limitations |
— | — | — | |||||||
| Balance at Dec. 31 |
$ | 10.2 | $ | 14.9 | $ | 14.9 | ||||
The company recognizes interest and penalties associated with uncertain tax positions in “Operation other expense – Other” in the Consolidated Statements of Income. In 2009, 2008 and 2007 the company recorded $0.9 million, $1.4 million and $0.9 million, respectively, of pre-tax charges for interest only. Additionally, the company has recorded $3.2 million of interest on the balance sheet as of Dec. 31, 2009. No amounts have been recorded for penalties.
The company’s U.S. subsidiaries join in the filing of a U.S. federal consolidated income tax return. The Internal Revenue Service (IRS) concluded its examination of the company’s 2008 consolidated federal income tax return during 2009. The IRS proposed an audit adjustment relating to the recovery of environmental costs, which the company formally appealed in January 2010. The company anticipates the appeal could take a few years to resolve and believes that it has provided an adequate reserve related to this matter. The U.S. federal statute of limitations remains open for the year 2006 and onward. Year 2009 is currently under examination by the IRS under the Compliance Assurance Program, a program in which the company is a participant. Foreign and U.S. state jurisdictions have statutes of limitations generally ranging from 3 to 5 years from the filing of an income tax return. The state impact of any federal changes remains subject to examination by various states for a period of up to one year after formal notification to the states. Years still open to examination by taxing authorities in major state and foreign jurisdictions include 2004 and forward.
| 5. | Employee Postretirement Benefits |
TECO Energy recognizes in its statement of financial position the over-funded or under-funded status of its postretirement benefit plans. This status is measured as the difference between the fair value of plan assets and the projected benefit obligation (PBO) in the case of its defined benefit plan, or the accumulated postretirement benefit obligation (APBO) in the case of its other postretirement benefit plan. Changes in the funded status are reflected, net of estimated tax benefits, in the benefit liabilities and accumulated other comprehensive loss in the case of the unregulated companies, or the benefit liabilities and regulatory assets in the case of Tampa Electric Company. The results of operations are not impacted.
Pension Benefits
TECO Energy has a non-contributory defined benefit retirement plan that covers substantially all employees. Benefits are based on employees’ age, years of service and final average earnings.
The Pension Protection Act of 2006 (PPA) became effective Jan. 1, 2008 and requires companies to, among other things, maintain certain defined minimum funding thresholds (or face plan benefit restrictions), pay higher premiums to the Pension Benefit Guaranty Corporation if they sponsor defined benefit plans, amend plan documents and provide additional plan disclosures in regulatory filings and to plan participants.
96
Table of Contents
TECO ENERGY, INC.
NOTES TO CONSOLIDATED FINANCIAL STATEMENTS—(Continued)
The Worker, Retiree and Employer Recovery Act of 2008 (WRERA) was signed into law on Dec. 23, 2008. WRERA grants plan sponsors relief from certain funding requirements and benefits restrictions, and also provides some technical corrections to the PPA. There are two primary provisions that impact funding results for TECO Energy. First, for plans funded less than 100%, required shortfall contributions will be based on a percentage of the funding target until 2011, rather than the funding target of 100%. These percentages are 94% and 96% in 2009 and 2010, respectively. Second, one of the technical corrections, referred to as asset smoothing, allows the use of asset averaging subject to certain limitations in the determination of funding requirements. The Jan. 1, 2010 estimate assumes adoption of the asset smoothing methodology under WRERA and includes an additional 2009 plan year contribution expected to be made in 2010.
The qualified pension plan’s actuarial value of assets, including credit balance, was 103.67% of the PPA funded target as of Jan. 1, 2009 and is estimated at 90% of the PPA funded target as of Jan. 1, 2010.
Amounts disclosed for pension benefits also include the unfunded obligations for the supplemental executive retirement plan (SERP). This is a non-qualified, non-contributory defined benefit retirement plan available to certain members of senior management.
Other Postretirement Benefits
TECO Energy and its subsidiaries currently provide certain postretirement health care and life insurance benefits for substantially all employees retiring after age 50 meeting certain service requirements. Postretirement benefit levels are substantially unrelated to salary. The company reserves the right to terminate or modify the plans in whole or in part at any time.
The Medicare Prescription Drug, Improvement and Modernization Act of 2003 (MMA) added prescription drug coverage to Medicare, with a 28% tax-free subsidy to encourage employers to retain their prescription drug programs for retirees, along with other key provisions. TECO Energy’s current retiree medical program for those eligible for Medicare (generally over age 65) includes coverage for prescription drugs. The company has determined that prescription drug benefits available to certain Medicare-eligible participants under its defined-dollar-benefit postretirement health care plan are at least “actuarially equivalent” to the standard drug benefits that are offered under Medicare Part D.
The FASB issued accounting guidance and disclosure requirements related to the MMA. The guidance requires (a) that the effects of the federal subsidy be considered an actuarial gain and recognized in the same manner as other actuarial gains and losses and (b) certain disclosures for employers that sponsor postretirement health care plans that provide prescription drug benefits.
The company received subsidy payments under Part D for the 2007 and 2008 plan years. Its 2009 Part D subsidy application with the Centers for Medicare and Medicaid Services (CMS) was approved in Dec. 2008, and the company expects to receive the payment later this year.
97
Table of Contents
TECO ENERGY, INC.
NOTES TO CONSOLIDATED FINANCIAL STATEMENTS—(Continued)
Obligations and Funded Status
| (millions) |
Pension Benefits | Other Benefits | ||||||||||||||
| 2009 | 2008 | 2009 | 2008 | |||||||||||||
| Change in benefit obligation |
||||||||||||||||
| Net benefit obligation at prior measurement date (1) |
$ | 555.4 | $ | 557.2 | $ | 188.9 | $ | 195.7 | ||||||||
| Effect of eliminating early measurement date |
n/a | 4.8 | n/a | 1.4 | ||||||||||||
| Service cost |
15.7 | 15.4 | 2.9 | 4.1 | ||||||||||||
| Interest cost |
33.7 | 31.9 | 11.2 | 12.0 | ||||||||||||
| Plan participants’ contributions |
— | — | 3.5 | 3.8 | ||||||||||||
| Actuarial loss (gain) |
29.6 | 3.3 | 16.6 | (5.7 | ) | |||||||||||
| Plan amendments |
0.4 | — | — | (9.4 | ) | |||||||||||
| Curtailment |
(0.8 | ) | — | — | — | |||||||||||
| Gross benefits paid |
(46.3 | ) | (54.5 | ) | (16.4 | ) | (13.8 | ) | ||||||||
| Settlements |
— | (2.7 | ) | — | — | |||||||||||
| Federal subsidy on benefits paid |
n/a | n/a | 0.9 | 0.8 | ||||||||||||
| Net benefit obligation at measurement date (1) |
$ | 587.7 | $ | 555.4 | $ | 207.6 | $ | 188.9 | ||||||||
| Change in plan assets |
||||||||||||||||
| Fair value of plan assets at prior measurement date (1) |
$ | 360.7 | $ | 492.7 | $ | — | $ | — | ||||||||
| Effect of eliminating early measurement date |
n/a | 28.4 | n/a | — | ||||||||||||
| Actual return on plan assets (2) |
66.3 | (119.1 | ) | — | — | |||||||||||
| Employer contributions |
8.2 | 15.9 | 12.9 | 10.0 | ||||||||||||
| Plan participants’ contributions |
— | — | 3.5 | 3.8 | ||||||||||||
| Settlements |
— | (2.7 | ) | — | — | |||||||||||
| Gross benefits paid |
(46.3 | ) | (54.5 | ) | (16.4 | ) | (13.8 | ) | ||||||||
| Fair value of plan assets at measurement date (1) |
$ | 388.9 | $ | 360.7 | $ | — | $ | — | ||||||||
| Funded status |
||||||||||||||||
| Fair value of plan assets (3) |
$ | 388.9 | $ | 360.7 | $ | — | $ | — | ||||||||
| Benefit obligation (PBO/APBO) |
587.7 | 555.4 | 207.6 | 188.9 | ||||||||||||
| Funded status at measurement date (1) |
(198.8 | ) | (194.7 | ) | (207.6 | ) | (188.9 | ) | ||||||||
| Unrecognized net actuarial loss |
228.7 | 237.2 | 18.3 | 1.0 | ||||||||||||
| Unrecognized prior service (benefit) cost |
(2.1 | ) | (2.7 | ) | 6.5 | 7.3 | ||||||||||
| Unrecognized net transition obligation |
— | — | 6.5 | 8.8 | ||||||||||||
| Accrued liability at end of year |
$ | 27.8 | $ | 39.8 | $ | (176.3 | ) | $ | (171.8 | ) | ||||||
| Amounts Recognized in Balance Sheet |
||||||||||||||||
| Regulatory assets |
$ | 181.7 | $ | 186.3 | $ | 47.4 | $ | 34.0 | ||||||||
| Accrued benefit costs and other current liabilities |
(7.2 | ) | (1.8 | ) | (13.4 | ) | (13.6 | ) | ||||||||
| Deferred credits and other liabilities |
(191.6 | ) | (193.0 | ) | (194.2 | ) | (175.3 | ) | ||||||||
| Accumulated other comprehensive loss (income) (pretax) |
44.9 | 48.3 | (16.1 | ) | (16.9 | ) | ||||||||||
| Net amount recognized at end of year |
$ | 27.8 | $ | 39.8 | $ | (176.3 | ) | $ | (171.8 | ) | ||||||
| (1) | The measurement dates were Dec. 31, 2009 and Dec. 31, 2008. |
| (2) | The actual return on plan assets differed from expectations due to general market conditions. |
| (3) | The Market Related Value (MRV) of plan assets is used as the basis for calculating the expected return on plan assets (EROA) component of periodic pension expense. MRV reflects the fair value of plan assets adjusted for experience gains and losses (i.e. the differences between actual investment returns and expected returns) spread over five years. |
Amounts recognized in accumulated other comprehensive income
| (millions) |
Pension Benefits | Other Benefits | ||||||||||||
| 2009 | 2008 | 2009 | 2008 | |||||||||||
| Net actuarial loss (gain) |
$ | 44.3 | $ | 47.8 | $ | (16.3 | ) | $ | (17.4 | ) | ||||
| Prior service cost (credit) |
0.6 | 0.5 | (1.2 | ) | (1.4 | ) | ||||||||
| Transition obligation (asset) |
— | — | 1.4 | 1.9 | ||||||||||
| Amount recognized |
$ | 44.9 | $ | 48.3 | $ | (16.1 | ) | $ | (16.9 | ) | ||||
98
Table of Contents
TECO ENERGY, INC.
NOTES TO CONSOLIDATED FINANCIAL STATEMENTS—(Continued)
The accumulated benefit obligation for all defined benefit pension plans was $530.1 million at Dec. 31, 2009 and $504.9 million at Dec. 31, 2008.
Assumptions used to determine benefit obligations at Dec. 31, 2009 and 2008:
| Pension Benefits | Other Benefits | |||||||||||
| 2009 | 2008 | 2009 | 2008 | |||||||||
| Discount rate |
5.75 | % | 6.05 | % | 5.60 | % | 6.05 | % | ||||
| Rate of compensation increase |
4.25 | % | 4.25 | % | 4.25 | % | 4.25 | % | ||||
| Healthcare cost trend rate |
||||||||||||
| Initial rate |
n/a | n/a | 8.00 | % | 8.50 | % | ||||||
| Ultimate rate |
n/a | n/a | 5.00 | % | 5.00 | % | ||||||
| Year rate reaches ultimate |
n/a | n/a | 2016 | 2015 | ||||||||
A one-percentage-point change in assumed health care cost trend rates would have the following effect on the benefit obligation:
| (millions) |
Increase | Decrease | |||||
| Effect on postretirement benefit obligation |
$ | 7.4 | $ | (6.1 | ) | ||
Net periodic benefit cost
| (millions) |
Pension Benefits | Other Benefits | |||||||||||||||||||
| 2009 (1) | 2008 (1) | 2007 (2) | 2009 (1) | 2008 (1) | 2007 (2) | ||||||||||||||||
| Service cost |
$ | 15.7 | $ | 15.4 | $ | 16.0 | $ | 2.9 | $ | 4.1 | $ | 5.3 | |||||||||
| Interest cost |
33.6 | 31.9 | 33.0 | 11.3 | 12.0 | 12.2 | |||||||||||||||
| Expected return on plan assets |
(37.8 | ) | (39.0 | ) | (36.3 | ) | — | — | — | ||||||||||||
| Amortization of: |
|||||||||||||||||||||
| Actuarial loss |
8.7 | 4.0 | 9.1 | — | — | — | |||||||||||||||
| Prior service (benefit) cost |
(0.4 | ) | (0.4 | ) | (0.5 | ) | 0.8 | 1.8 | 2.8 | ||||||||||||
| Transition obligation |
— | — | — | 2.3 | 2.3 | 2.5 | |||||||||||||||
| Curtailment loss (benefit) |
0.2 | — | (0.4 | ) | — | — | 6.4 | ||||||||||||||
| Settlement loss |
— | 0.9 | — | — | — | — | |||||||||||||||
| Net periodic benefit cost |
$ | 20.0 | $ | 12.8 | $ | 20.9 | $ | 17.3 | $ | 20.2 | $ | 29.2 | |||||||||
| (1) | Benefit Cost was measured for the twelve months ended Dec. 31, 2009 and 2008. The company elected a 15-month transition approach allowed by accounting standards for employer’s defined benefit pension and other post-retirement plans to move from an early measurement date of Sep. 30, 2007 to a year end measurement date of Dec. 31, 2008. In connection with this election, the company recorded after-tax charges to Retained Earnings of $2.2 million for Pensions and $3.1 million for Other Postretirement Benefits in the fourth quarter of 2008. |
| (2) | Benefit Cost was measured for the twelve months ended Sep. 30, 2007. |
In addition to the costs shown above, $0.6 million of special termination benefit costs were recognized in 2007 related to pension benefits.
The estimated net loss and prior service net cost for the defined benefit pension plans that will be amortized from accumulated other comprehensive income into net periodic benefit cost over the next fiscal year are $1.9 million and $0.1 million, respectively. The estimated prior service credit and transition obligation for the other postretirement benefit plans that will be amortized from accumulated other comprehensive income into net periodic benefit cost over the next fiscal year are $0.2 million and $0.5 million, respectively.
In addition, the estimated net loss and prior service benefit for the defined benefit pension plans that will be amortized from regulatory assets into net periodic benefit cost over the next fiscal year are $10.2 million and $0.5 million. The estimated prior service cost and transition obligation for the other postretirement benefit plan that will be amortized from regulatory asset into net periodic benefit cost over the next fiscal year will be $2.8 million.
99
Table of Contents
TECO ENERGY, INC.
NOTES TO CONSOLIDATED FINANCIAL STATEMENTS—(Continued)
Assumptions used to determine net periodic benefit cost for years ended Dec. 31,
| Pension Benefits | Other Benefits | |||||||||||||||||
| 2009 | 2008 | 2007 | 2009 | 2008 | 2007 | |||||||||||||
| Discount rate |
6.05 | % | 6.20 | % | 5.85 | % | 6.05 | % | 6.20 | % | 5.85 | % | ||||||
| Expected long-term return on plan assets |
8.25 | % | 8.25 | % | 8.25 | % | n/a | n/a | n/a | |||||||||
| Rate of compensation increase |
4.25 | % | 4.25 | % | 4.00 | % | 4.25 | % | 4.25 | % | 4.00 | % | ||||||
| Healthcare cost trend rate |
||||||||||||||||||
| Initial rate |
n/a | n/a | n/a | 8.50 | % | 9.25 | % | 9.50 | % | |||||||||
| Ultimate rate |
n/a | n/a | n/a | 5.00 | % | 5.25 | % | 5.25 | % | |||||||||
| Year rate reaches ultimate |
n/a | n/a | n/a | 2016 | 2016 | 2015 | ||||||||||||
The discount rate assumption was based on a cash flow matching technique developed by our outside actuaries and a review of current economic conditions. This technique matches the yields from high-quality (Aa-graded, non-callable) corporate bonds to the company’s projected cash flows for the benefit plans to develop a present value that is converted to a discount rate.
The expected return on assets assumption was based on historical returns, fixed income spreads and equity premiums consistent with our portfolio and asset allocation. A change in asset allocations could have a significant impact on the expected return on assets. Additionally, expectations of long-term inflation, real growth in the economy and a provision for active management and expenses paid were incorporated in the assumption. For the year ended Dec. 31, 2009, TECO Energy’s pension plan experienced actual asset returns of approximately 19.8%.
The compensation increase assumption was based on the same underlying expectation of long-term inflation together with assumptions regarding real growth in wages and company-specific merit and promotion increases.
A one-percentage-point change in assumed health care cost trend rates would have the following effect on expense:
| (millions) | 1% Increase |
1% Decrease |
|||||
| Effect on periodic cost |
$ | 0.3 | $ | (0.3 | ) | ||
Pension Plan Assets
Pension plan assets (plan assets) are invested in a mix of equity and fixed income securities. The company’s investment objective is to obtain above-average returns while minimizing volatility of expected returns over the long term. The company’s strategy is to hire proven managers and allocate assets to reflect a mix of investment styles, emphasize preservation of principal to minimize the impact of declining markets, and stay fully invested except for cash to meet benefit payment obligations and plan expenses. The company targets a higher allocation to equity securities than fixed income securities since the company believes that equity securities are expected to outperform fixed income securities.
| Asset Category |
Target Allocation |
Actual Allocation, End of Year | |||||||
| 2009 | 2008 | ||||||||
| Equity securities |
55-65 | % | 66 | % | 56 | % | |||
| Fixed income securities |
35-45 | % | 34 | % | 44 | % | |||
| Total |
100 | % | 100 | % | |||||
The company reviews the plan’s asset allocation periodically and re-balances the investment mix to maximize asset returns, optimize the matching of investment yields with the plan’s expected benefit obligations, and minimize pension cost.
The Plan’s investments are held by a trust fund administered by JP Morgan Chase Bank, N.A. (JP Morgan). JP Morgan measures fair value using the procedures set forth below for all investments. When available, JP Morgan uses quoted market prices on investments traded on an exchange to determine fair value and classifies such items as Level 1. In some cases where a market exchange price is available, but the investments are traded in a secondary market, JP Morgan makes use of acceptable practical expedients to calculate fair value, and the company classifies these items as Level 2.
If observable transactions and other market data are not available, fair value is based upon third party developed models that use, when available, current market-based or independently-sourced market parameters such as interest rates, currency rates or option volatilities. Items valued using third party generated models are classified according to the lowest level input or value driver that is most significant to the valuation. Thus, an item may be classified in Level 3 even though there may be significant inputs that are readily observable.
100
Table of Contents
TECO ENERGY, INC.
NOTES TO CONSOLIDATED FINANCIAL STATEMENTS—(Continued)
The following table sets forth by level within the fair value hierarchy the Plan’s investments as of Dec. 31, 2009. As required by the fair value accounting standards, the investments are classified in their entirety based on the lowest level of input that is significant to the fair value measurement. The Plan’s assessment of the significance of a particular input to the fair value measurement requires judgment, and may affect the valuation of fair value assets and liabilities and their placement within the fair value hierarchy levels. For cash equivalents, the cost approach was used in determining fair value. For bonds and U.S. government agencies, the income approach was used. For other investments, the market approach was used.
| (millions) |
At Fair Value as of Dec. 31, 2009 | |||||||||||||
| Level 1 | Level 2 | Level 3 | Total | |||||||||||
| Net cash |
$ | 37.2 | $ | — | $ | — | $ | 37.2 | ||||||
| Cash equivalents |
— | 10.6 | — | 10.6 | ||||||||||
| Equity securities |
||||||||||||||
| Common stocks |
94.1 | — | — | 94.1 | ||||||||||
| Preferred stocks |
— | 1.0 | — | 1.0 | ||||||||||
| American depository receipt (ADR) |
7.1 | 1.1 | — | 8.2 | ||||||||||
| Real estate investment trust (REIT) |
1.1 | — | — | 1.1 | ||||||||||
| Commingled fund |
— | 22.8 | — | 22.8 | ||||||||||
| Mutual fund |
127.2 | — | — | 127.2 | ||||||||||
| Total equity securities |
229.5 | 24.9 | — | 254.4 | ||||||||||
| Fixed income securities |
||||||||||||||
| Municipal bonds |
0.7 | 3.2 | — | 3.9 | ||||||||||
| Government bonds |
— | 27.5 | — | 27.5 | ||||||||||
| Corporate bonds |
— | 24.3 | — | 24.3 | ||||||||||
| Mortgage back securities (MBS) |
— | 25.7 | — | 25.7 | ||||||||||
| Asset backed securities (ABS) |
— | 0.7 | — | 0.7 | ||||||||||
| Collateralized mortgage obligation / Real estate mortgage investment conduit |
— | 3.9 | — | 3.9 | ||||||||||
| Mutual fund |
— | 0.9 | — | 0.9 | ||||||||||
| Total fixed income securities |
0.7 | 86.2 | — | 86.9 | ||||||||||
| Options |
— | (0.3 | ) | — | (0.3 | ) | ||||||||
| Miscellaneous |
— | 0.1 | — | 0.1 | ||||||||||
| Total |
$ | 267.4 | $ | 121.5 | $ | — | $ | 388.9 | ||||||
| • | Net cash represents cash, net accounts receivables and accounts payables. |
| • | Cash equivalents are valued using cost due to their short term nature. Additionally, cash equivalents are backed by 102% collateral. |
| • | The primary pricing inputs in determining the fair value of the Level 1 assets, excluding the mutual fund, are quoted prices in active markets. |
| • | The primary pricing inputs in determining the fair value of Level 2 preferred stock and ADR are prices of similar securities and benchmark quotes. |
| • | The commingled fund invests primarily in international equity securities, normally excluding securities issued in the U.S., with large- and mid-market capitalizations. The fund may invest in “value” or “growth” securities and is not limited to a particular investment style. The fund is valued using the net asset value (NAV), as determined by the fund’s trustee in accordance with U.S. GAAP, at year end. For redemption, written notice of the amount to be withdrawn must be given no later than 4:00 p.m. eastern standard time. |
| • | The primary pricing input in determining the Level 1 mutual fund is the mutual fund’s NAV. The Level 1 mutual fund is an open-ended mutual fund and the NAV is validated with purchases and sales at NAV, making this a Level 1 asset. |
| • | The primary pricing inputs in determining the fair value Level 2 municipal bonds are benchmark yields, historical spreads, sector curves, rating updates, and prepayment schedules. The primary pricing inputs in determining the fair value of government bonds are the U.S. treasury curve, CPI, and broker quotes, if available. The primary pricing inputs in determining the fair value of corporate bonds are the U.S. treasury curve, base spreads, YTM, and benchmark quotes. Asset backed securities (ABS) and collateralized mortgage obligations (CMO) are priced using TBA prices, treasury curves, swap curves, cash flow information, and bids and offers as inputs. Mortgage backed securities (MBS) are priced using TBA prices, treasury curves, average lives, spreads, and cash flow information. |
101
Table of Contents
TECO ENERGY, INC.
NOTES TO CONSOLIDATED FINANCIAL STATEMENTS—(Continued)
| • | The primary pricing input in determining the fair value of the Level 2 mutual fund is its NAV at year end. Shares may be purchased at the NAV without sales charges or other fees. Since this mutual fund is a private fund, it is a Level 2 asset. The fund invests primarily in emerging market fixed income securities. For redemption, written notice of the amount to be withdrawn must be given no later than 4:00 p.m. eastern standard time. Redemption proceeds will normally be received within three business days. |
| • | Level 2 options are valued using the bid-ask spread and the last price. |
There were no assets classified as level 3 assets in 2008 or 2009.
Other Postretirement Benefit Plan Assets
There are no assets associated with TECO Energy’s other postretirement benefits plan.
Contributions
TECO Energy’s policy is to fund the qualified pension plan at or above amounts determined by its actuaries to meet Employee Retirement Income Security Act (ERISA) guidelines for minimum annual contributions and minimize PBGC premiums paid by the plan. TECO Energy contributed $6.7 million to this plan in 2009 and $11.7 million in 2008, which met the minimum funding requirements for both 2009 and 2008. TECO Energy plans to make the required contribution estimate of $19.5 million in 2010 with potential additional contributions of $20 – $25 million to maintain certain funding thresholds. TECO Energy estimates annual contributions to range from $25 – $90 million per year in 2011 to 2014 based on current assumptions.
The SERP is funded annually to meet the benefit obligations. The company made contributions of $1.5 million and $4.2 million to this plan in 2009 and 2008, respectively. In 2010, the company expects to make a contribution of about $8.4 million to this plan, which includes $4.9 million for the settlement of benefit obligations related to the 2009 restructuring program (see Note 21).
The other postretirement benefits are funded annually to meet benefit obligations. The company contribution toward health care coverage for most employees who retired after the age of 55 between Jan. 1, 1990 and Jun. 30, 2001 is limited to a defined dollar benefit based on service. The company contribution toward pre-65 and post-65 health care coverage for most employees retiring on or after Jul. 1, 2001 is limited to a defined dollar benefit based on an age and service schedule. In 2010, the company expects to make a contribution of about $14.0 million. Postretirement benefit levels are substantially unrelated to salary.
Benefit Payments
The following benefit payments, which reflect expected future service, as appropriate, are expected to be paid:
| Expected Benefit Payments—TECO Energy (including projected service and net of employee contributions) |
Pension Benefits |
Other Postretirement Benefits | ||||||||
| Expected benefit payments (millions): |
Gross | Expected Federal Subsidy |
||||||||
| 2010 |
$ | 52.7 | $ | 15.2 | $ | (1.2 | ) | |||
| 2011 |
$ | 49.4 | $ | 16.4 | $ | (1.4 | ) | |||
| 2012 |
$ | 50.0 | $ | 17.3 | $ | (1.5 | ) | |||
| 2013 |
$ | 50.4 | $ | 17.9 | $ | (1.7 | ) | |||
| 2014 |
$ | 51.3 | $ | 18.0 | $ | (1.8 | ) | |||
| 2015-2019 |
$ | 273.6 | $ | 92.9 | $ | (11.0 | ) | |||
Defined Contribution Plan
The company has a defined contribution savings plan covering substantially all employees of TECO Energy and its subsidiaries (the Employers) that enables participants to save a portion of their compensation up to the limits allowed by IRS guidelines. The company and its subsidiaries match up to 6% of the participant’s payroll savings deductions. Effective July 2004, employer matching contributions were 30% of eligible participant contributions with additional incentive match of up to 70% of eligible participant contributions based on the achievement of certain operating company financial goals. In April 2007, the employer matching contributions were changed to 50% of eligible participant contributions, with an additional incentive match of up to 50%. For the years ended Dec. 31, 2009, 2008 and 2007, the company and its subsidiaries recognized expense totaling $8.1 million, $7.1 million and $8.6 million, respectively, related to the matching contributions made to this plan.
102
Table of Contents
TECO ENERGY, INC.
NOTES TO CONSOLIDATED FINANCIAL STATEMENTS—(Continued)
| 6. | Short-Term Debt |
At Dec. 31, 2009 and 2008, the following credit facilities and related borrowings existed:
Credit Facilities
| Dec. 31, 2009 | Dec. 31, 2008 | |||||||||||||||||
| (millions) |
Credit Facilities |
Borrowings Outstanding (1) |
Letters of Credit Outstanding |
Credit Facilities |
Borrowings Outstanding (1) |
Letters of Credit Outstanding | ||||||||||||
| Tampa Electric Company: |
||||||||||||||||||
| 5-year facility |
$ | 325.0 | $ | 55.0 | $ | 0.7 | $ | 325.0 | $ | — | $ | 1.4 | ||||||
| 1-year accounts receivable facility |
150.0 | — | — | 150.0 | 29.0 | — | ||||||||||||
| TECO Energy / TECO Finance: |
||||||||||||||||||
| 5-year facility |
200.0 | — | 6.9 | 200.0 | 64.0 | 7.1 | ||||||||||||
| Total |
$ | 675.0 | $ | 55.0 | $ | 7.6 | $ | 675.0 | $ | 93.0 | $ | 8.5 | ||||||
| (1) | Borrowings outstanding are reported as notes payable. |
At Dec. 31, 2009, these credit facilities require commitment fees ranging from 7.0 to 125.0 basis points (see Note 26). The weighted average interest rate on outstanding notes payable at Dec. 31, 2009 and 2008 was 0.66% and 2.65%, respectively.
Tampa Electric Company Accounts Receivable Facility
On Dec. 16, 2009, Tampa Electric Company and TEC Receivables Corp. (TRC), a wholly-owned subsidiary of Tampa Electric Company, amended their $150 million accounts receivable collateralized borrowing facility, entering into Amendment No. 7 to the Loan and Servicing Agreement with certain lenders named therein and Citicorp North America, Inc. as Program Agent. The amendment extends the maturity date to Mar. 17, 2010. Please refer to Note 26 for additional information.
| 7. | Long-Term Debt |
At Dec. 31, 2009, total long-term debt had a carrying amount of $3,309.7 million and an estimated fair market value of $3,500.3 million. At Dec. 31, 2008, total long-term debt had a carrying amount of $3,216.7 million and an estimated fair market value of $2,987.5 million.
A substantial part of the tangible assets of Tampa Electric are pledged as collateral to secure its first mortgage bonds. There are currently no bonds outstanding under Tampa Electric’s first mortgage bond indenture.
TECO Energy’s maturities and annual sinking fund requirements of long-term debt for 2010 through 2014 and thereafter are as follows:
Long-Term Debt Maturities
| Dec. 31, 2009 (millions) |
2010 | 2011 | 2012 | 2013 | 2014 | Thereafter | Total Long-Term Debt | ||||||||||||||
| TECO Energy |
$ | 102.8 | $ | 191.7 | $ | 100.2 | $ | — | $ | — | $ | 8.8 | $ | 403.5 | |||||||
| TECO Finance |
— | 171.8 | 236.2 | — | — | 491.2 | 899.2 | ||||||||||||||
| Tampa Electric |
— | — | 540.0 | 60.7 | 83.3 | 1,084.9 | 1,768.9 | ||||||||||||||
| Peoples Gas |
3.7 | 3.4 | 113.4 | — | — | 110.0 | 230.5 | ||||||||||||||
| TECO Guatemala |
1.4 | 1.5 | 1.5 | 1.6 | 1.6 | — | 7.6 | ||||||||||||||
| Total long-term debt maturities |
$ | 107.9 | $ | 368.4 | $ | 991.3 | $ | 62.3 | $ | 84.9 | $ | 1,694.9 | $ | 3,309.7 | |||||||
103
Table of Contents
TECO ENERGY, INC.
NOTES TO CONSOLIDATED FINANCIAL STATEMENTS—(Continued)
Debt Securities
Issuance of Tampa Electric Company 6.10% Notes due 2018
On Jul. 7, 2009, Tampa Electric Company completed an offering of $100 million aggregate principal amount of 6.10% Notes due 2018 (Notes). The Notes form a single series and are fungible with Tampa Electric Company’s 6.10% notes due 2018 issued on May 16, 2008 in the aggregate principal amount of $150 million. The Notes were sold at 102.988% of par. The offering resulted in net proceeds to Tampa Electric Company (after deducting underwriting discounts and commissions and estimated offering expenses) of approximately $102.0 million. Net proceeds were used to repay short-term debt and for general corporate purposes. Tampa Electric Company may redeem all or any part of the Notes at its option at any time and from time to time at a redemption price equal to the greater of (i) 100% of the principal amount of Notes to be redeemed or (ii) the sum of the present value of the remaining payments of principal and interest on the Notes to be redeemed, discounted at an applicable treasury rate (as defined in the Indenture), plus 35 basis points; in either case, the redemption price would include accrued and unpaid interest to the redemption date.
Issuance of Tampa Electric Company 6.10% Notes due 2018
On May 16, 2008, Tampa Electric Company issued $150 million aggregate principal amount of 6.10% Notes due May 15, 2018 (6.10% Notes). The 6.10% Notes were sold at par. The offering resulted in net proceeds to the Company (after deducting underwriting discounts and commissions and estimated offering expenses) of approximately $148.7 million. Net proceeds were used for general corporate purposes. Tampa Electric Company may redeem all or any part of the 6.10% Notes at its option at any time and from time to time at a redemption price equal to the greater of (i) 100% of the principal amount of the 6.10% Notes to be redeemed or (ii) the present value of the remaining payments of principal and interest on the 6.10% Notes to be redeemed, discounted at an applicable treasury rate (as defined in the applicable indenture) plus 35 basis points; in either case, the redemption price would include accrued and unpaid interest to the redemption date.
On May 15, 2008, in connection with this debt offering, Tampa Electric Company settled interest rate swaps entered into in 2007 for $11.8 million. The cash outflows related to this settlement are netted with the proceeds from the debt offering in the financing section of the Consolidated Statement of Cash Flows and are recorded in “Accumulated other comprehensive loss” on the Consolidated Balance Sheet. These amounts will be reclassified to interest expense over the 10-year term of the related debt, resulting in an effective interest rate of 6.89%.
Remarketing and Repurchase in Lieu of Redemption of Tampa Electric Company’s Tax-Exempt Auction Rate Bonds
On Mar. 19, 2008, the Hillsborough County Industrial Development Authority (HCIDA) remarketed $86.0 million Pollution Control Revenue Refunding Bonds (Tampa Electric Company Project), Series 2006, in a fixed-rate mode pursuant to the terms of the Loan and Trust Agreement governing those bonds. The bonds, which previously had been in auction rate mode, bear interest at 5.00% per annum and are subject to mandatory tender for purchase on Mar. 15, 2012 from the proceeds of a remarketing of the bonds. Tampa Electric Company is responsible for payment of the interest and principal associated with the bonds. Regularly scheduled principal and interest when due are insured by Ambac Assurance Corporation, as more fully described in Amendment No. 1 to the company’s Annual Report on Form 10-K for the year ended Dec. 31, 2007.
On Mar. 26, 2008, Tampa Electric Company purchased in lieu of redemption $75.0 million Polk County Industrial Development Authority (PCIDA) Solid Waste Disposal Revenue Refunding Bonds (Tampa Electric Company Project), Series 2007 and $125.8 million HCIDA Pollution Control Revenue Refunding Bonds (Tampa Electric Company Project), Series 2007A, B and C (collectively, the “2007 Bonds”). Also on that date, the Insurance Agreement dated as of Jul. 25, 2007 with Financial Guaranty Insurance Company, pursuant to which Financial Guaranty Insurance Company issued a financial guaranty insurance policy for the HCIDA Pollution Control Revenue Refunding Bonds (Tampa Electric Company Project), Series 2007A, B and C (the “2007 HCIDA Bonds”), was terminated. There was no financial statement impact related to the termination of this agreement. Tampa Electric Company also entered into a corresponding First Supplemental Loan and Trust Agreement regarding the removal of the bond insurance on the 2007 HCIDA Bonds. After these changes to the 2007 HCIDA Bonds, the company remarketed the $54.2 million 2007 Series A and the $51.6 million 2007 Series B Bonds in long-term interest rate modes. The $54.2 million 2007 Series A bonds, which previously had been in auction rate mode, bear interest at 5.65% per annum until maturity on Mar. 15, 2018. The $51.6 million 2007 Series B bonds, which previously had been in auction rate mode, bear interest at 5.15% per annum and will be subject to mandatory tender on Sep. 1, 2013 from the proceeds of a remarketing of the bonds. Tampa Electric Company is responsible for payment of the interest and principal associated with the 2007 Bonds.
As a result of these transactions, $95.0 million of the bonds purchased in lieu of redemption were held by the trustee at the direction of Tampa Electric Company as of Dec. 31, 2009 (the “Held Bonds”) to provide an opportunity to evaluate refinancing alternatives. The Held Bonds effectively offset the outstanding debt balances and are presented net on the balance sheet.
104
Table of Contents
TECO ENERGY, INC.
NOTES TO CONSOLIDATED FINANCIAL STATEMENTS—(Continued)
At Dec. 31, 2009 and 2008, TECO Energy had the following long-term debt outstanding:
| Long-Term Debt
(millions) Dec. 31, |
Due |
2009 | 2008 | |||||||
| TECO Energy |
Notes (1): | |||||||||
| Floating rate 2.3% (effective rate 2.5%) for 2009 and 5.2% for 2008 (2)(6) | 2010 | $ | 100.0 | $ | 100.0 | |||||
| 7.5% (effective rate of 7.8%) (2) | 2010 | 2.8 | 2.8 | |||||||
| 7.2% (effective rate of 7.4%) | 2011 | 191.7 | 191.7 | |||||||
| 7.0% (effective rate of 7.1%) | 2012 | 100.2 | 100.2 | |||||||
| 6.75% (effective rate of 6.9%) (2) | 2015 | 8.8 | 8.8 | |||||||
| 403.5 | 403.5 | |||||||||
| TECO Finance |
Notes (1)(3): 7.2% (effective rate of 7.4%) | 2011 | 171.8 | 171.8 | ||||||
| 7.0% (effective rate of 7.1%) | 2012 | 236.2 | 236.2 | |||||||
| 6.75% (effective rate of 6.9%) (2) | 2015 | 191.2 | 191.2 | |||||||
| 6.572% (effective rate of 7.3%) | 2017 | 300.0 | 300.0 | |||||||
| 899.2 | 899.2 | |||||||||
| Tampa Electric |
Installment contracts payable (4): | |||||||||
| 5.1% Refunding bonds (effective rate of 5.7%) | 2013 | 60.7 | 60.7 | |||||||
| 5.65% Refunding bonds (effective rate of 5.9%) (5) | 2018 | 54.2 | 54.2 | |||||||
| Variable rate bonds repurchased in 2008(7) | 2020 | — | — | |||||||
| 5.5% Refunding bonds (effective rate of 6.2%) | 2023 | 86.4 | 86.4 | |||||||
| 5.15% Refunding bonds (effective rate of 5.4%) (8) | 2025 | 51.6 | 51.6 | |||||||
| Variable rate bonds repurchased in 2008(7) | 2030 | — | — | |||||||
| 5.0% Refunding bonds (effective rate of 5.9%) (9) | 2034 | 86.0 | 86.0 | |||||||
| Notes (1): 6.875% (effective rate of 7.0%) | 2012 | 210.0 | 210.0 | |||||||
| 6.375% (effective rate of 7.4%) | 2012 | 330.0 | 330.0 | |||||||
| 6.25% (effective rate of 6.3%) (2) | 2014-2016 | 250.0 | 250.0 | |||||||
| 6.10% (effective rate of 6.4%) | 2018 | 200.0 | 100.0 | |||||||
| 6.55% (effective rate of 6.6%) | 2036 | 250.0 | 250.0 | |||||||
| 6.15% (effective rate of 6.2%) | 2037 | 190.0 | 190.0 | |||||||
| 1,768.9 | 1,668.9 | |||||||||
| Peoples Gas System |
Senior Notes (1)(2): 10.30% | 2009 | — | 1.8 | ||||||
| 9.93% | 2010 | 1.0 | 2.0 | |||||||
| 8.00% | 2010-2012 | 9.5 | 12.2 | |||||||
| Notes (1) 6.875% (effective rate of 7.0%) | 2012 | 40.0 | 40.0 | |||||||
| 6.375% (effective rate of 7.4%) | 2012 | 70.0 | 70.0 | |||||||
| 6.10% (effective rate of 7.0%) | 2018 | 50.0 | 50.0 | |||||||
| 6.15% (effective rate of 6.2%) | 2037 | 60.0 | 60.0 | |||||||
| 230.5 | 236.0 | |||||||||
| TECO Guatemala |
Note: 3.00% Fixed rate | 2010-2014 | 7.6 | 9.1 | ||||||
| Unamortized debt discount, net |
(0.2 | ) | (3.2 | ) | ||||
| 3,309.5 | 3,213.5 | |||||||
| Less amount due within one year |
107.9 | 6.9 | ||||||
| Total long-term debt |
$ | 3,201.6 | $ | 3,206.6 | ||||
| (1) | These securities are subject to redemption in whole or in part, at any time, at the option of the company. |
| (2) | These long-term debt agreements contain various restrictive financial covenants. |
| (3) | Guaranteed by TECO Energy. |
| (4) | Tax-exempt securities. |
| (5) | These bonds were converted in March 2008 from an auction rate mode to a fixed rate mode through maturity on May 15, 2018. |
| (6) | Composite year-end interest rate. |
| (7) | In March 2008 these bonds, which were in auction rate mode, were purchased in lieu of redemption by Tampa Electric Company. These held variable rate bonds have par amounts of $20 million and $75 million due in 2020 and 2030, respectively. |
| (8) | These bonds were converted in March 2008 from an auction rate mode to a fixed rate mode for the term ending Sep. 1, 2013. |
| (9) | These bonds were converted in March 2008 from an auction rate mode to a fixed rate mode for the term ending Mar. 15, 2012. |
105
Table of Contents
TECO ENERGY, INC.
NOTES TO CONSOLIDATED FINANCIAL STATEMENTS—(Continued)
| 8. | Preferred Stock |
Preferred stock of TECO Energy—$1 par
10 million shares authorized, none outstanding.
Preference stock (subordinated preferred stock) of Tampa Electric—no par
2.5 million shares authorized, none outstanding.
Preferred stock of Tampa Electric—no par
2.5 million shares authorized, none outstanding.
Preferred stock of Tampa Electric—$100 par
1.5 million shares authorized, none outstanding.
| 9. | Common Stock |
Stock-Based Compensation
TECO Energy has two share-based compensation plans, the Equity Plan and the Director Equity Plan (Plans), which are described below. The types of awards granted under these Plans include stock options, stock grants, time-vested restricted stock and performance-based restricted stock. Stock options have been granted with an exercise price greater than or equal to the fair market value of the common stock on the date of grant and have a 10-year contractual term. Stock options for the Director Equity Plan vest immediately and stock options for the Equity Plan have graded vesting over a three-year period, with the first 33% becoming exercisable one year after the date of grant. Stock options were last awarded in 2006. Stock grants and time-vested restricted stock are valued at the fair market value on the date of grant, with expense recognized over the vesting period, which is normally three years. Time-vested restricted stock granted to directors vests one-third each year. Performance-based restricted stock has been granted to officers and employees, with shares potentially vesting after three years. The total awards for performance-based restricted stock vest based on the total return of TECO Energy common stock compared to a peer group of utility stocks. The grants can vest between 0% and 150% of the original grant. Dividends are paid on all time-vested and performance-based restricted stock awards during the vesting period.
TECO Energy recognized total stock compensation expense for 2009, 2008 and 2007 of $10.4 million, $9.8 million and $11.6 million, respectively. Total stock compensation expense is reflected in “Operation other expense-Other” on the Consolidated Statements of Income. Cash received from option exercises under all share-based payment arrangements was $0.4 million, $18.2 million and $9.2 million for the periods ended Dec. 31, 2009, 2008 and 2007, respectively. The aggregate intrinsic value of stock options exercised was $0.1 million, $8.4 million and $3.6 million for the periods ended Dec. 31, 2009, 2008 and 2007, respectively. The total fair market value of awards vesting during 2009, 2008 and 2007 was $7.0 million, $2.6 million and $3.6 million, respectively, which includes stock grants, time-vested restricted stock and performance-based restricted stock. As of Dec. 31, 2009, there was $8.4 million of unrecognized compensation cost related to all non-vested awards that is expected to be recognized over a weighted average period of two years. In accordance with accounting standards for stock-based compensation, the cash flows resulting from excess tax deductions on share-based payments are classified as financing cash flows.
The fair market value of stock options is determined using the Black-Scholes valuation model, and the company uses the following methods to determine its underlying assumptions: expected volatilities are based on the historical volatilities; the expected term of options granted is based on the Staff Accounting Bulletin No. 107 (SAB 107) simplified method of averaging the vesting term and the original contractual term; the risk-free interest rate is based on the U.S. Treasury implied yield on zero-coupon issues (with a remaining term equal to the expected term of the option); and the expected dividend yield is based on the current annual dividend amount divided by the stock price on the date of grant.
The fair market value of performance-based restricted stock awards is determined using the Monte-Carlo valuation model, and the company uses the following methods to determine its underlying assumptions: expected volatilities are based on the historical volatilities; the expected term of the awards is based on the performance measurement period (which is generally three years); the risk-free interest rate is based on the U.S. Treasury implied yield on zero-coupon issues (with a remaining term equal to the expected term of the award); and the expected dividend yield is based on the current annual dividend amount divided by the stock price on the date of grant, with continuous compounding.
106
Table of Contents
TECO ENERGY, INC.
NOTES TO CONSOLIDATED FINANCIAL STATEMENTS—(Continued)
The value of time-vested restricted stock and stock grants are based on the fair market value of TECO Energy common stock at the time of grant.
| Assumptions |
2009 | 2008 | 2007 | ||||||
| Assumptions applicable to performance-based restricted stock |
|||||||||
| Risk-free interest rate |
1.36 | % | 2.46 | % | 4.53 | % | |||
| Expected lives (in years) |
3 | 3 | 3 | ||||||
| Expected stock volatility |
34.11 | % | 18.38 | % | 16.71 | % | |||
| Dividend yield |
7.54 | % | 4.80 | % | 4.25 | % |
Equity Plan
In April 2004, the company’s shareholders approved the 2004 Equity Incentive Plan (2004 Plan). The 2004 Plan superseded the 1996 Equity Incentive Plan (1996 Plan), and no additional grants will be made under the 1996 Plan. Under the 2004 Plan, the Compensation Committee of the Board of Directors authorized 10 million shares of TECO Energy common stock that may be awarded as stock grants, stock options and/or stock equivalents to officers, key employees and consultants of TECO Energy and its subsidiaries. The Compensation Committee has discretion to determine the terms and conditions of each award, which may be subject to conditions relating to continued employment, restrictions on transfer or performance criteria.
Under the 2004 Plan and the 1996 Plan (collectively referred to as the “Equity Plans”), 0.9 million, 0.7 million and 0.6 million shares of restricted stock were granted in 2009, 2008 and 2007, respectively, with weighted average fair values of $10.63, $16.85 and $18.14, respectively.
Director Equity Plan
In April 1997, the company’s shareholders approved the 1997 Director Equity Plan (1997 Plan), as an amendment and restatement of the 1991 Director Stock Option Plan (1991 Plan). The 1997 Plan superseded the 1991 Plan, and no additional grants will be made under the 1991 Plan. The purpose of the 1997 Plan is to attract and retain highly qualified non-employee directors of the company and to encourage them to own shares of TECO Energy common stock. The 1997 Plan, administered by the Board of Directors, authorized 250,000 shares of TECO Energy common stock to be awarded as stock grants, stock options and/or stock equivalents.
Under the 1997 Plan, 20,000, 22,500 and 25,000 shares of restricted stock were granted in 2009, 2008 and 2007, respectively, with weighted average fair values of $10.61, $16.66 and $18.35, respectively.
A summary of non-vested shares of restricted stock and stock options for 2009 under all of the Equity Plans are shown as follows:
Nonvested Restricted Stock and Stock Options
| Time Based Restricted Stock (1) |
Performance Based Restricted Stock (1) |
Nonvested Stock Options | ||||||||||||||||
| Number of Shares (thousands) |
Weighted Avg. Grant Date Fair Value (per share) |
Number of Shares (thousands) |
Weighted Avg. Grant Date Fair Value (per share) |
Number of Shares (thousands) |
Weighted Avg. Grant Date Fair Value (per share) | |||||||||||||
| Nonvested balance at Dec. 31, 2008 |
478 | $ | 17.39 | 1,021 | $ | 17.36 | 299 | $ | 3.26 | |||||||||
| Granted |
320 | 10.96 | 602 | 10.45 | — | — | ||||||||||||
| Vested |
(214 | ) | 15.78 | (359 | ) | 15.48 | (299 | ) | 3.26 | |||||||||
| Forfeited |
(2 | ) | 17.38 | (103 | ) | 17.00 | — | — | ||||||||||
| Nonvested balance at Dec. 31, 2009 |
582 | $ | 14.44 | 1,161 | $ | 14.39 | — | $ | — | |||||||||
| (1) | The weighted average remaining contractual term of restricted stock is 2 years. |
107
Table of Contents
TECO ENERGY, INC.
NOTES TO CONSOLIDATED FINANCIAL STATEMENTS—(Continued)
Stock option transactions during 2009 under all of the Equity Plans are summarized as follows:
Stock Options
| Number of Shares (thousands) |
Weighted Avg. Option Price (per share) |
Weighted Avg. Remaining Contractual Term (years) |
Aggregate Intrinsic Value (millions) | ||||||||
| Outstanding balance at Dec. 31, 2008 |
6,836 | $ | 21.60 | ||||||||
| Granted |
— | — | |||||||||
| Exercised |
(38 | ) | 11.87 | ||||||||
| Cancelled |
(796 | ) | 21.59 | ||||||||
| Outstanding balance at Dec. 31, 2009 (1) |
6,002 | $ | 21.66 | 3 | $ | 4.0 | |||||
| Exercisable at Dec. 31, 2009 (1) |
6,002 | $ | 21.66 | 3 | $ | 4.0 | |||||
| Available for future grant at Dec. 31, 2009 |
1,475 | ||||||||||
| (1) | Option prices range from $11.09 to $31.58. |
As of Dec. 31, 2009, the options outstanding and exercisable under the Equity Plans are summarized below:
| Range of Option Prices |
Stock Options Outstanding and Exercisable | ||||||
| Option Shares (thousands) |
Weighted Avg. Option Price |
Weighted Avg. Remaining Contractual Life | |||||
| $11.09 - $13.64 |
1,154 | $ | 12.80 | 4 Years | |||
| $16.21 - $19.05 |
1,577 | $ | 16.31 | 6 Years | |||
| $21.25 - $22.48 |
836 | $ | 21.25 | 1 Year | |||
| $23.55 - $25.97 |
20 | $ | 25.97 | 1 Year | |||
| $27.97 - $31.58 |
2,415 | $ | 29.50 | 2 Years | |||
| Total |
6,002 | $ | 21.66 | 3 Years | |||
Dividend Reinvestment Plan
In 1992, TECO Energy implemented a Dividend Reinvestment and Common Stock Purchase Plan. TECO Energy raised $3.8 million, $3.6 million and $3.9 million of common equity from this plan in 2009, 2008 and 2007, respectively.
Shareholder Rights Plan
The Shareholder Rights Plan expired according to its terms in May 2009.
Other
In February 2009, the Compensation Committee of TECO Energy’s Board of Directors awarded eight senior officers time-vested restricted common stock in-lieu of cash for 50% of their annual incentive award; the remaining balances of these 2008 incentive awards were paid in cash. The full cost of these incentives were reflected in the 2008 income statement under the caption “Operation other expense-Other.” In connection with these restricted stock awards, 72,342 shares were issued at a grant-date value of $12.15. These awards will vest one year from the date of grant.
108
Table of Contents
TECO ENERGY, INC.
NOTES TO CONSOLIDATED FINANCIAL STATEMENTS—(Continued)
| 10. | Other Comprehensive Income |
TECO Energy reported the following other comprehensive income (loss) (OCI) for the years ended Dec. 31, 2009, 2008 and 2007, related to changes in the fair value of cash flow hedges and amortization of unrecognized benefit costs associated with the company’s pension plans:
Other Comprehensive Income
| (millions) |
Gross | Tax | Net | |||||||||
| 2009 |
||||||||||||
| Unrealized gain on cash flow hedges |
$ | 4.0 | $ | (1.5 | ) | $ | 2.5 | |||||
| Plus: Loss reclassified to net income |
24.3 | (9.0 | ) | 15.3 | ||||||||
| Gain on cash flow hedges |
28.3 | (10.5 | ) | 17.8 | ||||||||
| Amortization of unrecognized benefit costs |
2.1 | (0.8 | ) | 1.3 | ||||||||
| Change in benefit obligation due to remeasurement |
0.4 | (0.2 | ) | 0.2 | ||||||||
| Reclassification to earnings loss on available-for-sale securities |
1.7 | — | 1.7 | |||||||||
| Total other comprehensive income |
$ | 32.5 | $ | (11.5 | ) | $ | 21.0 | |||||
| 2008 |
||||||||||||
| Unrealized loss on cash flow hedges |
$ | (25.2 | ) | $ | 9.4 | $ | (15.8 | ) | ||||
| Less: Gain reclassified to net income |
(4.9 | ) | 1.8 | (3.1 | ) | |||||||
| Loss on cash flow hedges |
(30.1 | ) | 11.2 | (18.9 | ) | |||||||
| Amortization of unrecognized benefit costs |
4.2 | (1.6 | ) | 2.6 | ||||||||
| Unrecognized loss on available-for-sale securities (1) |
(1.7 | ) | — | (1.7 | ) | |||||||
| Unrecognized benefits due to remeasurement |
(17.7 | ) | 6.9 | (10.8 | ) | |||||||
| Total other comprehensive loss |
$ | (45.3 | ) | $ | 16.5 | $ | (28.8 | ) | ||||
| 2007 |
||||||||||||
| Unrealized loss on cash flow hedges |
$ | (3.7 | ) | $ | 1.4 | $ | (2.3 | ) | ||||
| Less: Gain reclassified to net income |
(6.5 | ) | 2.5 | (4.0 | ) | |||||||
| Loss on cash flow hedges |
(10.2 | ) | 3.9 | (6.3 | ) | |||||||
| Amortization of unrecognized benefit costs |
4.3 | (1.9 | ) | 2.4 | ||||||||
| Recognized benefit costs due to curtailment |
14.2 | (5.5 | ) | 8.7 | ||||||||
| Unrecognized benefits due to remeasurement |
13.7 | (5.2 | ) | 8.5 | ||||||||
| Total other comprehensive income |
$ | 22.0 | $ | (8.7 | ) | $ | 13.3 | |||||
Accumulated Other Comprehensive Loss
| (millions) |
Dec. 31, 2009 |
Dec. 31, 2008 |
||||||
| Unrecognized pension losses and prior service costs (2) |
$ | (27.8 | ) | $ | (29.8 | ) | ||
| Unrecognized other benefit losses, prior service costs and transition obligations (3) |
10.1 | 10.6 | ||||||
| Net unrealized losses from cash flow hedges (4) |
(7.3 | ) | (25.1 | ) | ||||
| Net unrecognized loss on available-for-sale securities |
— | (1.7 | ) | |||||
| Total accumulated other comprehensive loss |
$ | (25.0 | ) | $ | (46.0 | ) | ||
| (1) | Amount relates to an off-shore investment not subject to U.S. Federal income tax. |
| (2) | Net of tax benefit of $17.1 million and $18.4 million as of Dec. 31, 2009 and Dec. 31, 2008, respectively. |
| (3) | Net of tax expense of $6.0 million and $6.3 million as of Dec. 31, 2009 and Dec. 31, 2008, respectively. |
| (4) | Net of tax benefit of $4.5 million and $15.0 million as of Dec. 31, 2009 and Dec. 31, 2008, respectively. |
| 11. | Earnings Per Share |
In accordance with accounting standards for the calculation of earnings per share (EPS), TECO Energy adopted the two-class method for computing EPS in the first quarter of 2009. These standards define share-based payment awards that participate in dividends prior to vesting as participating securities that should be included in the earnings allocation in computing EPS under the two-class method. The standards require retrospective application for all prior periods presented.
109
Table of Contents
TECO ENERGY, INC.
NOTES TO CONSOLIDATED FINANCIAL STATEMENTS—(Continued)
The two-class method of calculating EPS requires TECO Energy to calculate EPS for its common stock and its participating securities (time-vested restricted stock and performance-based restricted stock) based on dividends declared and the pro-rata share each has to undistributed earnings. The application of the two-class method did not have a material effect on TECO Energy’s EPS calculations.
Earnings Per Share
| (millions, except per share amounts) |
2009 | 2008 | 2007 | |||||||||
| Basic earnings per share |
||||||||||||
| Net income from continuing operations |
$ | 213.9 | $ | 162.4 | $ | 316.7 | ||||||
| Plus: Loss Attributable to noncontrolling interest |
— | — | 82.2 | |||||||||
| Less: Amount allocated to nonvested participating shareholders |
(1.8 | ) | (1.1 | ) | (2.3 | ) | ||||||
| Net income attributable to TECO Energy before discontinued operations available to common shareholders—basic |
$ | 212.1 | $ | 161.3 | $ | 396.6 | ||||||
| Net income from discontinued operations, net of tax |
$ | — | $ | — | $ | 14.3 | ||||||
| Amount allocated to nonvested participating shareholders |
— | — | (0.1 | ) | ||||||||
| Net income from discontinued operations available to common shareholders—basic |
$ | — | $ | — | $ | 14.2 | ||||||
| Net income attributable to TECO Energy |
$ | 213.9 | $ | 162.4 | $ | 413.2 | ||||||
| Amount allocated to nonvested participating shareholders |
(1.8 | ) | (1.1 | ) | (2.4 | ) | ||||||
| Net income attributable to TECO Energy available to common shareholders—basic |
$ | 212.1 | $ | 161.3 | $ | 410.8 | ||||||
| Average shares outstanding common |
211.8 | 210.6 | 209.1 | |||||||||
| Basic earnings per share attributable to TECO Energy before discontinued operations available to common shareholders |
$ | 1.00 | $ | 0.77 | $ | 1.90 | ||||||
| Basic earnings per share from discontinued operations available to common shareholders |
$ | — | $ | — | $ | 0.07 | ||||||
| Basic earnings per share attributable to TECO Energy available to common shareholders |
$ | 1.00 | $ | 0.77 | $ | 1.97 | ||||||
| Diluted earnings per share |
||||||||||||
| Net income from continuing operations |
$ | 213.9 | $ | 162.4 | $ | 316.7 | ||||||
| Plus: Loss Attributable to noncontrolling interest |
— | — | 82.2 | |||||||||
| Less: Amount allocated to nonvested participating shareholders |
(1.8 | ) | (1.1 | ) | (2.3 | ) | ||||||
| Net income attributable to TECO Energy before discontinued operations available to common shareholders—diluted |
$ | 212.1 | $ | 161.3 | $ | 396.6 | ||||||
| Net income from discontinued operations, net of tax |
$ | — | $ | — | $ | 14.3 | ||||||
| Amount allocated to nonvested participating shareholders |
— | — | (0.1 | ) | ||||||||
| Net income from discontinued operations available to common shareholders—diluted |
$ | — | $ | — | $ | 14.2 | ||||||
| Net income attributable to TECO Energy |
$ | 213.9 | $ | 162.4 | $ | 413.2 | ||||||
| Amount allocated to nonvested participating shareholders |
(1.8 | ) | (1.1 | ) | (2.4 | ) | ||||||
| Net income attributable to TECO Energy available to common shareholders—diluted |
$ | 212.1 | $ | 161.3 | $ | 410.8 | ||||||
| Average shares outstanding common |
211.8 | 210.6 | 209.1 | |||||||||
| Assumed conversion of stock options, unvested restricted stock and contingent performance |
1.3 | 0.8 | 0.8 | |||||||||
| Adjusted average shares outstanding common—diluted |
213.1 | 211.4 | 209.9 | |||||||||
| Diluted earnings per share attributable to TECO Energy before discontinued operations available to common shareholders |
$ | 1.00 | $ | 0.77 | $ | 1.89 | ||||||
| Diluted earnings per share from discontinued operations available to common shareholders |
$ | — | $ | — | $ | 0.07 | ||||||
| Diluted earnings per share attributable to TECO Energy available to common shareholders |
$ | 1.00 | $ | 0.77 | $ | 1.96 | ||||||
| Anti-dilutive shares |
6.0 | 4.3 | 5.8 | |||||||||
110
Table of Contents
TECO ENERGY, INC.
NOTES TO CONSOLIDATED FINANCIAL STATEMENTS—(Continued)
| 12. | Commitments and Contingencies |
Legal Contingencies
From time to time, TECO Energy and its subsidiaries are involved in various legal, tax and regulatory proceedings before various courts, regulatory commissions and governmental agencies in the ordinary course of its business. Where appropriate, accruals are made in accordance with accounting standards for contingencies to provide for matters that are probable of resulting in an estimable, material loss. While the outcome of such proceedings is uncertain, management does not believe that their ultimate resolution will have a material adverse effect on the company’s results of operations or financial condition.
Investment in Empresa Eléctrica de Guatemala
TECO Guatemala has a 24% ownership interest in EEGSA through a joint venture, DECA II, with Iberdrola Energia, S.A. (Iberdrola) and Electricidade de Portugal, S.A. The Value Added Distribution (VAD) charges applicable in the tariffs charged by EEGSA are reset every five years. The VAD was expected to be reset for a new five-year term in the third quarter of 2008 in a manner similar to the process utilized in 2003, in accordance with applicable Guatemalan law.
On Jul. 25, 2008, the National Commission of Electrical Energy (CNEE), the Guatemalan regulatory body responsible for establishing tariff rates, issued a communication unilaterally disbanding the panel of experts appointed under existing regulations to review and approve the new tariff rates. On Jul. 31, 2008, CNEE issued resolutions setting new tariff rates for EEGSA, which deviated from the rates calculated consistent with the panel of experts’ guidance. The new lower VAD set by CNEE is significantly below the prior period level. The results from Aug. 1, 2008 forward reflect the lower tariff rates.
In response to CNEE’s actions, EEGSA initiated various legal challenges which have been resolved against EEGSA. TECO Energy and EEGSA’s other investors are pursuing legal and other efforts on an international level to address damages caused by CNEE. EEGSA’s largest investor, Iberdrola, commenced an international arbitration process under the bilateral investment treaty in place between the Kingdom of Spain and the Republic of Guatemala. On Jan. 13, 2009, TECO Guatemala Holdings, LLC (TGH), a subsidiary of TECO Energy, delivered a Notice of Intent to the Guatemalan government indicating that it intends to file an arbitration claim against the Republic of Guatemala under the Dominican-Republic-Central America-United States Free Trade Agreement (DR-CAFTA). As of the date of this filing, there is no firm schedule to resolve this matter in any of the proceedings before the Guatemalan courts, in the case of EEGSA, or before international arbitral tribunals, in the case of Iberdrola and TGH.
TECO Guatemala evaluated its $146.7 million investment in DECA II, including associated goodwill of $3.9 million, at Dec. 31, 2009 and determined that the value was not impaired (see Note 18). In the event the activities described above are unsuccessful and no reasonable mitigation strategies are available such that lower revenues could be expected to continue indefinitely and make the returns we anticipated on this investment unachievable, we will need to reevaluate our strategy related to this investment and an impairment would be likely.
Superfund and Former Manufactured Gas Plant Sites
Tampa Electric Company, through its Tampa Electric and Peoples Gas divisions, is a potentially responsible party (PRP) for certain superfund sites and, through its Peoples Gas division, for certain former manufactured gas plant sites. While the joint and several liability associated with these sites presents the potential for significant response costs, as of Dec. 31, 2009, Tampa Electric Company has estimated its ultimate financial liability to be approximately $19.9 million, primarily at PGS, and this amount has been accrued in the company’s financial statements. This amount is higher than prior estimates to reflect a 2009 study for the costs of remediation primarily related to one site. The environmental remediation costs associated with these sites, which are expected to be paid over many years, are not expected to have a significant impact on customer prices.
The estimated amounts represent only the estimated portion of the cleanup costs attributable to Tampa Electric Company. The estimates to perform the work are based on Tampa Electric Company’s experience with similar work adjusted for site specific conditions and agreements with the respective governmental agencies. The estimates are made in current dollars, are not discounted and do not assume any insurance recoveries.
Allocation of the responsibility for remediation costs among Tampa Electric Company and other PRPs is based on each party’s relative ownership interest in or usage of a site. Accordingly, Tampa Electric Company’s share of remediation costs varies with each site. In virtually all instances where other PRPs are involved, those PRPs are considered creditworthy.
Factors that could impact these estimates include the ability of other PRPs to pay their pro-rata portion of the cleanup costs, additional testing and investigation which could expand the scope of the cleanup activities, additional liability that might arise from the cleanup activities themselves or changes in laws or regulations that could require additional remediation. These costs are recoverable through customer rates established in subsequent base rate proceedings.
111
Table of Contents
TECO ENERGY, INC.
NOTES TO CONSOLIDATED FINANCIAL STATEMENTS—(Continued)
Long-Term Commitments
TECO Energy has commitments under long-term leases, primarily for building space, capacity payments, office equipment and heavy equipment.
Total rental expense for these leases, included in “Operation other expense—Other” on the Consolidated Statements of Income for the years ended Dec. 31, 2009, 2008 and 2007, was $10.7 million, $9.9 million and $29.8 million, respectively. 2007 includes leases of marine equipment at TECO Transport, which was sold on Dec. 4, 2007.
The following is a schedule of future minimum lease payments at Dec. 31, 2009 for all leases with non-cancelable lease terms in excess of one year:
Future Minimum Lease Payments
| (millions) |
Capacity Payments (1) |
Operating Leases |
Total | ||||||
| Year ended Dec. 31: |
|||||||||
| 2010 |
$ | 8.6 | $ | 10.3 | $ | 18.9 | |||
| 2011 |
8.8 | 8.0 | 16.8 | ||||||
| 2012 |
9.0 | 4.7 | 13.7 | ||||||
| 2013 |
9.1 | 2.5 | 11.6 | ||||||
| 2014 |
9.3 | 2.4 | 11.7 | ||||||
| Thereafter |
39.2 | 22.9 | 62.1 | ||||||
| Total future minimum lease payments |
$ | 84.0 | $ | 50.8 | $ | 134.8 | |||
| (1) | This schedule includes the fixed capacity payments required under a capacity and tolling agreement of Tampa Electric which commenced Jan. 1, 2009. In accordance with accounting standards on arrangements that contains a lease, the company evaluated the agreement and concluded based on the criteria that the agreement met the lease definition. Prudently incurred capacity payments are recoverable under an FPSC-approved cost recovery clause (See Note 3). |
Guarantees and Letters of Credit
TECO Energy accounts for guarantees in accordance with the applicable accounting standards. Upon issuance or modification of a guarantee the company determines if the obligation is subject to either or both of the following:
| • | Initial recognition and initial measurement of a liability; and/or |
| • | Disclosure of specific details of the guarantee. |
Generally, guarantees of the performance of a third party or guarantees that are based on an underlying (where such a guarantee is not a derivative) are likely to be subject to the recognition and measurement, as well as the disclosure provisions. Such guarantees must initially be recorded at fair value, as determined in accordance with the interpretation.
Alternatively, guarantees between and on behalf of entities under common control or that are similar to product warranties are subject only to the disclosure provisions of the interpretation. The company must disclose information as to the term of the guarantee and the maximum potential amount of future gross payments (undiscounted) under the guarantee, even if the likelihood of a claim is remote.
112
Table of Contents
TECO ENERGY, INC.
NOTES TO CONSOLIDATED FINANCIAL STATEMENTS—(Continued)
A summary of the face amount or maximum theoretical obligation under TECO Energy’s letters of credit and guarantees as of Dec. 31, 2009 are as follows:
Letters of Credit and Guarantees-TECO Energy
| (millions) Letters of Credit and Guarantees for the Benefit of: |
2010 | 2011-2014 | After
(1) 2014 |
Total | Liabilities Recognized at Dec. 31, 2009 | ||||||||||
| Tampa Electric |
|||||||||||||||
| Letters of credit |
$ | — | $ | — | $ | 0.2 | $ | 0.2 | $ | — | |||||
| Guarantees: |
|||||||||||||||
| Fuel purchase/energy management (2) |
— | — | 20.0 | 20.0 | 4.5 | ||||||||||
| — | — | 20.2 | 20.2 | 4.5 | |||||||||||
| TECO Coal |
|||||||||||||||
| Letters of credit |
— | — | 6.7 | 6.7 | — | ||||||||||
| Guarantees: Fuel purchase related (2) |
— | — | 1.4 | 1.4 | 1.3 | ||||||||||
| — | — | 8.1 | 8.1 | 1.3 | |||||||||||
| Other subsidiaries |
|||||||||||||||
| Guarantees: |
|||||||||||||||
| Fuel purchase/energy management (1)(2) |
— | — | 109.7 | 109.7 | — | ||||||||||
| Total |
$ | — | $ | — | $ | 138.0 | $ | 138.0 | $ | 5.8 | |||||
Letters of Credit-Tampa Electric Company
| (millions) Letters of Credit for the Benefit of: |
2010 |
2011-2014 | After (1) 2014 |
Total | Liabilities Recognized at Dec. 31, 2009 | ||||||||||
| Tampa Electric |
|||||||||||||||
| Letters of credit |
$ | — | $ | — | $ | 0.7 | $ | 0.7 | $ | — | |||||
| Total |
$ | — | $ | — | $ | 0.7 | $ | 0.7 | $ | — | |||||
| (1) | These guarantees renew annually and are shown on the basis that they will continue to renew beyond 2014. |
| (2) | The amounts shown are the maximum theoretical amounts guaranteed under current agreements. Liabilities recognized represent the associated obligation of TECO Energy under these agreements at Dec. 31, 2009. The obligations under these letters of credit and guarantees include net accounts payable and net derivative liabilities. |
Financial Covenants
In order to utilize their respective bank facilities, TECO Energy, TECO Finance and Tampa Electric Company must meet certain financial tests as defined in the applicable agreements. In addition, TECO Energy, TECO Finance, Tampa Electric Company and other operating companies have certain restrictive covenants in specific agreements and debt instruments. At Dec. 31, 2009, TECO Energy, TECO Finance, Tampa Electric Company and the other operating companies were in compliance with all applicable financial covenants.
| 13. | Related Parties |
The company and its subsidiaries had certain transactions, in the ordinary course of business, with entities in which directors of the company had interests. The company paid legal fees of $1.6 million, $1.9 million and $1.3 million for the years ended Dec. 31, 2009, 2008 and 2007, respectively, to Ausley McMullen, P.A. of which Mr. Ausley (a director of TECO Energy) is an employee. Other transactions were not material for the years ended Dec. 31, 2009, 2008 and 2007. No material balances were payable as of Dec. 31, 2009 or 2008.
| 14. | Segment Information |
TECO Energy is an electric and gas utility holding company with significant diversified activities. Segments are determined based on how management evaluates, measures and makes decisions with respect to the operations of the entity. The management of TECO Energy reports segments based on each subsidiary’s contribution of revenues, net income and total assets, as required by the accounting guidance for disclosures about segments of an enterprise and related information. All significant intercompany transactions are eliminated in the consolidated financial statements of TECO Energy, but are included in determining reportable segments.
113
Table of Contents
TECO ENERGY, INC.
NOTES TO CONSOLIDATED FINANCIAL STATEMENTS—(Continued)
The information presented in the following table excludes all discontinued operations. See Note 20 for additional details of the components of discontinued operations.
| (millions) |
Tampa Electric |
PGS | TECO Coal |
TECO Transport (3) |
TECO Guatemala |
Other & Eliminations |
Total TECO Energy | ||||||||||||||||||
| 2009 |
|||||||||||||||||||||||||
| Revenues—outsiders |
$ | 2,193.5 | $ | 455.6 | $ | 653.0 | $ | — | $ | 8.3 | (5) | $ | 0.1 | $ | 3,310.5 | ||||||||||
| Revenues—affiliates |
1.3 | 15.2 | — | — | — | (16.5 | ) | — | |||||||||||||||||
| Total revenues |
2,194.8 | 470.8 | 653.0 | — | 8.3 | (16.4 | ) | 3,310.5 | |||||||||||||||||
| Earnings from unconsol. affiliates |
— | — | — | — | 47.3 | (0.6 | ) | 46.7 | |||||||||||||||||
| Depreciation and amortization |
200.4 | 44.2 | 42.2 | — | 0.8 | 0.3 | 287.9 | ||||||||||||||||||
| Restructuring charges |
18.4 | 4.7 | — | — | — | 2.6 | 25.7 | ||||||||||||||||||
| Total interest charges (1) |
116.2 | 18.7 | 7.3 | — | 12.9 | 71.9 | 227.0 | ||||||||||||||||||
| Internally allocated interest (1) |
— | — | 6.4 | — | 12.6 | (19.0 | ) | — | |||||||||||||||||
| Provision (benefit) for taxes |
98.4 | 13.3 | 7.8 | — | 10.8 | (31.7 | ) | 98.6 | |||||||||||||||||
| Net income attributable to company before discontinued operations (1) |
$ | 160.2 | $ | 31.9 | $ | 37.2 | $ | — | $ | 38.6 | $ | (54.0 | ) | $ | 213.9 | ||||||||||
| Goodwill, net |
$ | — | $ | — | $ | — | $ | — | $ | 59.4 | $ | — | $ | 59.4 | |||||||||||
| Investment in unconsolidated affiliates |
— | — | — | — | 279.2 | 0.1 | 279.3 | ||||||||||||||||||
| Total assets |
5,697.9 | 870.1 | 326.6 | (4) | — | 380.7 | (7) | (55.8 | ) | 7,219.5 | |||||||||||||||
| Capital expenditures |
$ | 533.0 | $ | 50.5 | $ | 47.4 | $ | — | $ | 0.2 | $ | 8.7 | $ | 639.8 | |||||||||||
| 2008 |
|||||||||||||||||||||||||
| Revenues—outsiders |
$ | 2,089.8 | $ | 688.4 | $ | 588.4 | $ | — | $ | 8.4 | (5) | $ | 0.3 | $ | 3,375.3 | ||||||||||
| Revenues—affiliates |
1.4 | — | — | — | — | (1.4 | ) | — | |||||||||||||||||
| Total revenues |
2,091.2 | 688.4 | 588.4 | — | 8.4 | (1.1 | ) | 3,375.3 | |||||||||||||||||
| Earnings from unconsol. affiliates |
— | — | — | — | 72.5 | 0.4 | 72.9 | ||||||||||||||||||
| Depreciation and amortization |
185.6 | 41.9 | 37.6 | — | 0.8 | 0.2 | 266.1 | ||||||||||||||||||
| Total interest charges (1) |
114.7 | 18.2 | 8.1 | — | 15.4 | 72.5 | 228.9 | ||||||||||||||||||
| Internally allocated interest (1) |
— | — | 6.7 | — | 15.1 | (21.8 | ) | — | |||||||||||||||||
| Provision (benefit) for taxes |
81.9 | 17.3 | 2.3 | — | 14.8 | (21.9 | ) (8) | 94.4 | |||||||||||||||||
| Net income attributable to company before discontinued operations (1) |
$ | 135.6 | $ | 27.1 | $ | 18.0 | $ | — | $ | 36.9 | (6) | $ | (55.2 | ) (2) | $ | 162.4 | |||||||||
| Goodwill, net |
$ | — | $ | — | $ | — | $ | — | $ | 59.4 | $ | — | $ | 59.4 | |||||||||||
| Investment in unconsolidated affiliates |
— | — | — | — | 284.0 | — | 284.0 | ||||||||||||||||||
| Other non-current investments |
— | — | — | — | — | 21.3 | 21.3 | ||||||||||||||||||
| Total assets |
5,538.8 | 878.0 | 309.1 | (4) | — | 383.1 | (7) | 38.4 | 7,147.4 | ||||||||||||||||
| Capital expenditures |
$ | 479.7 | $ | 69.0 | $ | 40.3 | $ | — | $ | 0.5 | $ | — | $ | 589.5 | |||||||||||
| 2007 |
|||||||||||||||||||||||||
| Revenues—outsiders |
$ | 2,186.6 | $ | 599.7 | $ | 544.5 | $ | 197.1 | $ | 8.0 | (5) | $ | 0.2 | $ | 3,536.1 | ||||||||||
| Revenues—affiliates |
1.8 | — | — | 93.2 | — | (95.0 | ) | — | |||||||||||||||||
| Total revenues |
2,188.4 | 599.7 | 544.5 | 290.3 | 8.0 | (94.8 | ) | 3,536.1 | |||||||||||||||||
| Earnings from unconsol. affiliates |
— | — | — | — | 68.5 | — | 68.5 | ||||||||||||||||||
| Depreciation and amortization |
178.6 | 40.1 | 38.4 | 5.6 | 0.5 | 0.5 | 263.7 | ||||||||||||||||||
| Total interest charges (1) |
112.2 | 17.1 | 12.5 | 4.8 | 15.2 | 96.0 | 257.8 | ||||||||||||||||||
| Internally allocated interest (1) |
— | — | 11.6 | 0.8 | 14.9 | (27.3 | ) | — | |||||||||||||||||
| Provision (benefit) for taxes |
85.2 | 16.4 | 46.3 | 13.5 | 7.8 | 45.0 | 214.2 | ||||||||||||||||||
| Net income attributable to company before discontinued operations (1) |
$ | 150.3 | $ | 26.5 | $ | 90.9 | $ | 34.0 | $ | 44.7 | $ | 52.5 | (2) | $ | 398.9 | ||||||||||
| Goodwill, net |
$ | — | $ | — | $ | — | $ | — | $ | 59.4 | $ | — | $ | 59.4 | |||||||||||
| Investment in unconsolidated affiliates |
— | — | — | — | 275.5 | — | 275.5 | ||||||||||||||||||
| Other non-current investments |
— | — | — | — | 15.0 | 8.0 | 23.0 | ||||||||||||||||||
| Total assets |
4,838.3 | 761.4 | 501.2 | (4) | — | 435.3 | (7) | 229.0 | 6,765.2 | ||||||||||||||||
| Capital expenditures |
$ | 373.8 | $ | 49.2 | $ | 43.8 | $ | 25.1 | $ | 2.3 | $ | 0.2 | $ | 494.4 | |||||||||||
114
Table of Contents
TECO ENERGY, INC.
NOTES TO CONSOLIDATED FINANCIAL STATEMENTS—(Continued)
| (1) | Segment net income is reported on a basis that includes internally allocated financing costs. Internally allocated costs were at pretax rates of 7.15% for September 2008 through December 2009, 7.25% for January through August 2008, and 7.5% for 2007. Rates were based on the average of each subsidiary’s equity and indebtedness to TECO Energy assuming a 50/50 debt/equity capital structure. Internally allocated interest charges are a component of total interest charges. |
| (2) | Results for 2008 include $0.6 million of after-tax transaction costs and a $3.2 million tax benefit related to the sale of TECO Transport. Results for 2007 include $16.4 million of these transaction costs, the $149.4 million after-tax gain on the sale of TECO Transport and $20.2 million of after-tax debt extinguishment costs. |
| (3) | 2007 results for TECO Transport are through Dec. 3, 2007. |
| (4) | The carrying value of mineral rights as of Dec. 31, 2009, 2008 and 2007 was $16.6 million, $18.1 million and $18.9 million, respectively. |
| (5) | Revenues for 2009, 2008 and 2007 are exclusive of entities deconsolidated as a result of the accounting guidance for variable interest entities and include only revenues for the consolidated Guatemalan entities. See Note 19 for further details. |
| (6) | Net income includes $9.6 million in taxes related to the cash and investments repatriated from Guatemala in December 2008. |
| (7) | Total assets represent primarily equity and advances invested in unconsolidated affiliates. As of Dec. 31, 2009, 2008 and 2007, the equity and advances balance due TECO Energy totaled $361.1 million, $356.8 million and $413.5 million, respectively. |
| (8) | Benefit includes a $12.0 million valuation allowance in consolidated income taxes related to the cash and investments repatriated from Guatemala in December 2008. |
Tampa Electric provides retail electric utility services to almost 667,000 customers in West Central Florida. PGS is engaged in the purchase and distribution of natural gas for more than 334,000 residential, commercial, industrial and electric power generation customers in the state of Florida.
TECO Coal, through its wholly-owned subsidiaries, owns mineral rights and owns or operates surface and underground mines and coal processing and loading facilities in Kentucky, Tennessee and Virginia. TECO Coal acquired and began operating two synthetic fuel facilities in 2000, whose production qualified for the non-conventional fuels tax credit through the expiration of the tax credit program on Dec. 31, 2007.
TECO Transport, through its wholly-owned subsidiaries, transported, stored and transferred coal and other dry bulk commodities for third parties and Tampa Electric. TECO Transport’s subsidiaries operated on the Mississippi, Ohio and Illinois rivers, in the Gulf of Mexico and worldwide. TECO Transport was sold on Dec. 4, 2007.
TECO Guatemala includes the equity investments in the San José and Alborada power plants, the equity investment in DECA II, and the TECO Guatemala parent company.
| 15. | Asset Retirement Obligations |
TECO Energy accounts for asset retirement obligations under the applicable accounting standards. An ARO for a long-lived asset is recognized at fair value at inception of the obligation if there is a legal obligation under an existing or enacted law or statute, a written or oral contract, or by legal construction under the doctrine of promissory estoppel. Retirement obligations are recognized only if the legal obligation exists in connection with or as a result of the permanent retirement, abandonment or sale of a long-lived asset.
When the liability is initially recorded, the carrying amount of the related long-lived asset is correspondingly increased. Over time, the liability is accreted to its estimated future value. The corresponding amount capitalized at inception is depreciated over the remaining useful life of the asset. The liability must be revalued each period based on current market prices.
TECO Energy has recognized AROs for reclamation and site restoration obligations principally associated with coal mining, storage and transfer facilities. The majority of obligations arise from environmental remediation and restoration activities for coal-related operations.
For the years ended Dec. 31, 2009, 2008 and 2007, TECO Energy recognized $1.4 million, $1.4 million and $1.4 million of accretion expense, respectively, associated with AROs in “Depreciation and amortization” on the Consolidated Statements of Income. For the year ended Dec. 31, 2008, increased cost of removal of materials used in the generation and transmission of electricity resulted in a $1.7 million estimated cash flow revision at Tampa Electric.
115
Table of Contents
TECO ENERGY, INC.
NOTES TO CONSOLIDATED FINANCIAL STATEMENTS—(Continued)
Reconciliation of beginning and ending carrying amount of asset retirement obligations:
| (millions) |
Dec. 31, | |||||||
| 2009 | 2008 | |||||||
| Beginning balance |
$ | 52.9 | $ | 47.8 | ||||
| Additional liabilities |
0.4 | 2.4 | ||||||
| Liabilities settled |
(1.0 | ) | (1.6 | ) | ||||
| Accretion expense |
1.4 | 1.4 | ||||||
| Revisions to estimated cash flows |
— | 1.7 | ||||||
| Other(1) |
1.5 | 1.2 | ||||||
| Ending balance |
$ | 55.2 | $ | 52.9 | ||||
| (1) | Accretion recorded as a deferred regulatory asset. |
As regulated utilities, Tampa Electric and PGS must file depreciation and dismantlement studies periodically and receive approval from the FPSC before implementing new depreciation rates. Included in approved depreciation rates is either an implicit net salvage factor or a cost of removal factor, expressed as a percentage. The net salvage factor is principally comprised of two components—a salvage factor and a cost of removal or dismantlement factor. The company uses current cost of removal or dismantlement factors as part of the estimation method to approximate the amount of cost of removal in accumulated depreciation.
For Tampa Electric and PGS, the original cost of utility plant retired or otherwise disposed of and the cost of removal or dismantlement, less salvage value is charged to accumulated depreciation and the accumulated cost of removal reserve reported as a regulatory liability, respectively.
| 16. | Mergers, Acquisitions and Dispositions |
Sale of Navega
On Mar. 13, 2009, TECO Guatemala sold its 16.5% interest in the Central American fiber optic telecommunications provider Navega. The sale resulted in a pre-tax gain of $18.3 million and total proceeds of $29.0 million.
Sale of TECO Transport
On Dec. 4, 2007, TECO Diversified, Inc., a wholly-owned subsidiary of the company, sold its entire interest in TECO Transport Corporation for cash to an unaffiliated investment group. The selling price was $405 million, subject to a working capital adjustment, and resulted in a pretax gain of $221.3 million, which is net of transaction-related costs. In accordance with accounting guidance, due to its significant continuing involvement with Tampa Electric related to the waterborne transportation of solid fuel, the results of TECO Transport were reflected in continuing operations for 2007.
On Feb. 19, 2008, TECO Energy, through TECO Diversified, Inc., paid $3.7 million to adjust the working capital estimated at Dec. 31, 2007 related to the sale of TECO Transport to an unaffiliated investment group.
| 17. | Goodwill and Other Intangible Assets |
Under the accounting guidance for goodwill, goodwill is not subject to amortization. Rather, goodwill and intangible assets with an indefinite life are subject to an annual assessment for impairment at the reporting unit level. Reporting units are generally determined as one level below the operating segment level; reporting units with similar characteristics are grouped for the purpose of determining the impairment, if any, of goodwill and other intangible assets. Intangible assets with a measurable useful life are required to be amortized.
At Dec. 31, 2009, the company had $59.4 million of goodwill on its balance sheet, which is reflected in the TECO Guatemala segment. The goodwill arose from the purchase of multiple entities as a result of the company’s investments in its San José and Alborada power plants ($52.4 million and $3.1 million, respectively), and its equity investment in DECA II ($3.9 million). Since these three investments are one level below the operating segment level, discrete cash flow information is available, and management regularly reviews their operating results separately, this is the reporting unit level at which potential impairment is tested. Additionally, since San José and Alborada are deconsolidated as a result of the accounting guidance for variable interest entities, these are considered equity investments and any potential impairment is tested under the accounting guidance for equity method investments, along with TECO Guatemala’s investment at DECA II. See Note 18.
116
Table of Contents
TECO ENERGY, INC.
NOTES TO CONSOLIDATED FINANCIAL STATEMENTS—(Continued)
| 18. | Asset Impairments |
The company accounts for long-lived asset impairments in accordance with the accounting guidance for long-lived assets, which requires that long-lived assets be tested for recoverability whenever events or changes in circumstances indicate that its carrying value may not be recoverable. An asset is considered not recoverable if its carrying value exceeds the sum of its undiscounted expected cash flows. If it is determined that the carrying value is not recoverable and its carrying value exceeds its fair value, an impairment charge is made and the value of the asset is reduced to its fair value. When the impaired asset is disposed of, if the consideration received is in excess of the reduced carrying value, a gain would then be recorded. In accordance with accounting guidance, the company assesses whether there has been an impairment of its long-lived assets and certain intangibles held and used by the company when such impairment indicators exist. No such indicators of impairment existed as of Dec. 31, 2009, 2008 or 2007.
The company accounts for equity investments and their associated goodwill in accordance with accounting guidance for equity method investments. The accounting guidance requires that equity investments be tested for impairment if there is an indication that the investment may have a loss in value that is other than temporary. An indication may include a fair value of an investment that is less than its carrying amount. The fair value for an equity investment is generally determined using discounted cash flows appropriate for the business model of the equity investment. The models incorporate assumptions relating to future results of operations that are based on a combination of historical experience, fundamental economic analysis, observable market activity and independent market studies. Management periodically reviews and adjusts the assumptions, as necessary, to reflect current market conditions and observable activity. If a sale is expected in the near term or a similar transaction can be readily observed in the marketplace, then this information is used by management to estimate the fair value of the equity investment. As stated in Note 17, the company has three equity investments reflected in its TECO Guatemala segment. During 2008, there was an indication that the company’s investment in DECA II may have had a loss in value that is other than temporary. As of Dec. 31, 2009, the circumstances around the company’s investment in DECA II were still unresolved. Therefore, the company performed an impairment analysis at year end to update the assumptions used in the 2008 impairment test.
While quoted prices in active markets provide the best evidence of fair value, these are not available since TECO Guatemala has not received any offers for the purchase of its investment in DECA II. Additionally, multiples of earnings or another performance measure to determine fair value is not available since there are no comparable entities in Guatemala that have recently been sold. While there have been similar sales in Central America, these sales are not comparable to TECO Guatemala’s investment due to the differing regulatory, economic and growth environments throughout Central America. Therefore, in conducting the impairment assessment for the company’s investment in DECA II, the company used discounted cash flows of the business model of each of DECA II’s significant group of assets.
The models incorporate assumptions relating to future results of operations that are based on a combination of historical experience, fundamental economic analysis, observable market activity, independent market studies and probabilities weighted for management’s estimate of the most likely outcomes. Cash flows through 2018 were based on detailed operating forecasts provided by EEGSA. A growth factor of 5% was applied to predict subsequent year cash flows through 2048, when EEGSA’s franchise to transmit and distribute electricity in Guatemala expires. The growth factor was determined based on past trends and management’s expectations for both growth and inflation. The cash flows were discounted to a present value using the risk free rate of return at Dec. 31, 2009, adjusted for an additional risk premium. The additional risk premium included a country risk premium, an equity risk premium, a small stock premium, and a company specific risk premium. The resulting discount rate was 11.6%. Additionally, management performed sensitivity analyses on the model valuation using discount rates up to 14.5%. The resulting calculations did not alter the conclusion of the tests.
The company determined the fair value of its investment in DECA II supports the investment and related goodwill carrying amounts at Dec. 31, 2009, resulting in no impairment charge. The company will continue to monitor its investment in DECA II as events and/or circumstances change or resolve (see Note 12 for more information).
| 19. | Variable Interest Entities |
TECO Energy accounts for VIEs in accordance with accounting standards for consolidations. As required by these standards, the company evaluates for consolidation all long-term agreements with VIEs in which contractual, ownership or other pecuniary interests in that entity change with changes in the fair value of the entity’s net assets. During the years presented, a party to an agreement that absorbs a majority of the entity’s expected losses, receives a majority of its expected residual returns, or both, is considered to be the primary beneficiary and is required to consolidate that entity. In addition to these quantitative factors, the company evaluates qualitative factors that would indicate that a transfer of risk from the entity to the company has occurred. The transfer of substantial risk from the entity to the company could result in a determination that the company is the primary beneficiary of the entity. While the company reviews each contract individually, for purposes of analyzing PPAs, the determining factors are generally the length of the agreement and which entity absorbs the fuel risk.
117
Table of Contents
TECO ENERGY, INC.
NOTES TO CONSOLIDATED FINANCIAL STATEMENTS—(Continued)
The company formed TCAE to own and construct the Alborada Power Station and the company formed CGESJ to own and construct the San José Power Station. Both power stations are located in Guatemala and both projects obtained long-term PPAs with EEGSA, a distribution utility in Guatemala. The terms of the two separate PPAs include EEGSA’s right to the full capacity of the plants for 15 years, U.S. dollar based capacity payments, certain terms for providing fuel, and certain other terms including the right to extend the Alborada and San José contracts. Under these accounting standards, management believed that EEGSA is the primary beneficiary of the variable interests in TCAE and CGESJ due to the terms of the PPAs. Accordingly, both entities were deconsolidated as of Jan. 1, 2004. The TCAE deconsolidation resulted in the initial removal of $25.0 million of debt and $15.1 million of net assets from TECO Energy’s Consolidated Balance Sheet. The CGESJ deconsolidation resulted in the initial removal of $65.5 million of debt and $106.6 million of net assets from TECO Energy’s Consolidated Balance Sheet. The results of operations for the two projects are classified as “Income from equity investments” on TECO Energy’s Consolidated Statements of Income since the date of deconsolidation. At Dec. 31, 2009, TECO Energy’s estimated maximum loss exposure in these entities is its equity investment of approximately $196.3 million.
Effective Jan. 1, 2010, the accounting standards for consolidation of VIEs were amended. The most significant amendment was in how to determine the primary beneficiary. Under the amended standard, the primary beneficiary is the enterprise that has both 1) the power to direct the activities of a VIE that most significantly impact the entity’s economic performance and 2) the obligation to absorb losses of the entity that could potentially be significant to the VIE or the right to receive benefits from the entity that could potentially be significant to the VIE. As a result of adopting this amendment, effective Jan. 1, 2010, the company reconsolidated both TCAE and CGESJ.
The following table summarizes combined financial information for the TCAE and CGESJ projects:
Summary Results
| (millions) |
2009 | 2008 | 2007 | ||||||
| Revenues |
$ | 97.2 | $ | 118.0 | $ | 115.3 | |||
| Operating expenses |
58.4 | 57.0 | 55.7 | ||||||
| Net income |
32.5 | 49.6 | 47.4 | ||||||
| Total assets |
219.3 | 235.8 | |||||||
| Debt |
54.4 | 67.9 | |||||||
Pike Letcher Synfuel, LLC was established as part of the Apr. 1, 2003, sale of TECO Coal’s synthetic fuel production facilities. While TECO Energy’s maximum loss exposure in this entity was its investment of approximately $8.2 million, the company could have lost potential earnings and incurred losses related to the production costs for synthetic fuel, in the event that such production created non-conventional fuel tax credits in excess of TECO Energy’s or the other buyers’ capacity to generate sufficient taxable income to use such credits or fuel tax credits were reduced or eliminated due to high oil prices. Management believed that the company was the primary beneficiary of this VIE and continued to consolidate the entity under the guidance through the expiration of synfuel production on Dec. 31, 2007.
Tampa Electric has entered into multiple PPAs with wholesale energy providers in Florida to ensure the ability to meet customer energy demand and to provide lower cost options in the meeting of this demand. These agreements are with similar entities and contain similar provisions. They range in size from 121 to 370 MW of available capacity. Some of these provisions provide for the transfer or sharing of a number of risks inherent in the generation of energy. Some of these risks include: operating and maintenance; regulatory; credit; commodity/fuel; and energy market risk. In most instances, the company has reviewed these risks and has determined that the owners of these entities have retained the majority of these risks over the expected life of the underlying generating assets and are the primary beneficiaries. As a result, the company is not required to consolidate any of these entities. The company purchased $105.5 million, $167.2 million, and $109.7 million under these PPAs for the years ended Dec. 31, 2009, 2008 and 2007, respectively.
In one instance the company’s agreement with the entity for 370 MW of capacity was entered into prior to Dec. 31, 2003, the effective date of these standards. Under the standards, the company is required to make an exhaustive effort to obtain sufficient information to determine if this entity is a VIE and which holder of the variable interests is the primary beneficiary. The owners of this entity are not willing to provide the information necessary to make these determinations, have no obligation to do so and the information is not available publicly. As a result, the company is unable to determine if this entity is a VIE and if so, which variable interest holder, if any, is the primary beneficiary. The company has no obligation to this entity beyond the purchase of capacity; therefore, the maximum exposure for the company is the obligation to pay for such capacity under terms of the PPA at rates that could be unfavorable to the wholesale market. The company purchased $31.7 million, $71.6 million, and $54.5 million under this PPA for the years ended Dec. 31, 2009, 2008 and 2007, respectively.
118
Table of Contents
TECO ENERGY, INC.
NOTES TO CONSOLIDATED FINANCIAL STATEMENTS—(Continued)
The company does not provide any material financial or other support to any of the VIEs it is involved with, nor is the company under any obligation to absorb losses associated with these VIEs. Other than the Guatemalan projects previously mentioned, in the normal course of business, our involvement with the remaining VIEs does not affect our Consolidated Balance Sheets, Statements of Income or Cash Flows.
| 20. | Discontinued Operations and Assets Held for Sale |
Union and Gila River Project Companies
Net income from discontinued operations in 2007 was $14.3 million, after-tax, reflecting a favorable conclusion reached in the second quarter with taxing authorities for the 2005 disposition of the Union and Gila River merchant power plants.
| 21. | Restructuring Charges |
On Jul. 30, 2009, TECO Energy, Inc. announced organizational changes and a new senior executive team structure as part of its response to industry changes, economic uncertainties and its commitment to maintain a lean and efficient organization. As a second step in response to these factors, on Aug. 31, 2009, the company decided on a total reduction in force of 229 jobs. The reduction in force was substantially completed by Dec. 31, 2009. In connection with this reduction in force, the company expects to incur total costs of $26.5 million related to severance and other benefits. For the year ended Dec. 31, 2009, $25.7 million of these costs were recognized on the Consolidated Condensed Statements of Income under “Restructuring Charges”. The corporation’s wholly-owned subsidiary, Tampa Electric Company incurred approximately $23.1 million of such costs in the year ended Dec. 31, 2009. The total cash payments related to these actions are expected to be approximately $28.4 million, including $4.9 million for the settlement of pension obligations (see Note 5), paid during 2009 and early 2010.
Restructuring Charges to be Incurred
| (millions) |
Termination of Benefits |
Other Costs | Total | |||||||||
| Total costs expected to be incurred |
$ | 26.5 | $ | 0.6 | $ | 27.1 | ||||||
| Current period costs incurred |
(25.1 | ) | (0.6 | ) | (25.7 | ) | ||||||
| Adjustments |
— | — | — | |||||||||
| Total costs remaining |
$ | 1.4 | $ | — | $ | 1.4 | ||||||
Accrued Liability for Restructuring Charges
| (millions) |
Termination of Benefits |
Other Costs | Total | |||||||||
| Beginning balance, Jul. 1, 2009 |
$ | — | $ | — | $ | — | ||||||
| Costs incurred and charged to expense |
25.1 | 0.6 | 25.7 | |||||||||
| Costs paid/settled |
(22.0 | ) | (0.6 | ) | (22.6 | ) | ||||||
| Non-cash expense |
(2.2 | ) | — | (2.2 | ) | |||||||
| Adjustments |
— | — | — | |||||||||
| Ending balance, Dec. 31, 2009 |
$ | 0.9 | $ | — | $ | 0.9 | ||||||
Restructuring Charges by Segment
| (millions) |
Tampa Electric |
PGS | Other (1) | Total | ||||||||||||
| Total costs expected to be incurred |
$ | 18.4 | $ | 4.7 | $ | 4.0 | $ | 27.1 | ||||||||
| Current period costs incurred |
(18.4 | ) | (4.7 | ) | (2.6 | ) | (25.7 | ) | ||||||||
| Adjustments |
— | — | — | — | ||||||||||||
| Total costs remaining |
$ | — | $ | — | $ | 1.4 | $ | 1.4 | ||||||||
| (1) | Restructuring costs incurred at the parent company. |
119
Table of Contents
TECO ENERGY, INC.
NOTES TO CONSOLIDATED FINANCIAL STATEMENTS—(Continued)
| 22. | Accounting for Derivative Instruments and Hedging Activities |
From time to time, TECO Energy and its affiliates enter into futures, forwards, swaps and option contracts for the following purposes:
| • | To limit the exposure to price fluctuations for physical purchases and sales of natural gas in the course of normal operations at Tampa Electric and PGS; |
| • | To limit the exposure to interest rate fluctuations on debt securities at TECO Energy and its affiliates; and |
| • | To limit the exposure to price fluctuations for physical purchases of fuel at TECO Coal. |
TECO Energy and its affiliates use derivatives only to reduce normal operating and market risks, not for speculative purposes. The company’s primary objective in using derivative instruments for regulated operations is to reduce the impact of market price volatility on ratepayers.
The risk management policies adopted by TECO Energy provide a framework through which management monitors various risk exposures. Daily and periodic reporting of positions and other relevant metrics are performed by a centralized risk management group which is independent of all operating companies.
The company applies the accounting standards for derivative instruments and hedging activities. These standards require companies to recognize derivatives as either assets or liabilities in the financial statements, to measure those instruments at fair value, and to reflect the changes in the fair value of those instruments as either components of OCI or in net income, depending on the designation of those instruments. The changes in fair value that are recorded in OCI are not immediately recognized in current net income. As the underlying hedged transaction matures or the physical commodity is delivered, the deferred gain or loss on the related hedging instrument must be reclassified from OCI to earnings based on its value at the time of the instrument’s settlement. For effective hedge transactions, the amount reclassified from OCI to earnings is offset in net income by the market change of the amount paid or received on the underlying physical transaction.
New accounting standards for disclosures became effective for financial statements issued for fiscal years and interim periods beginning after Nov. 15, 2008. This new standard requires enhanced disclosures about a company’s derivative activities and how the related hedged items affect a company’s financial position, financial performance and cash flows. The new requirements include quantitative disclosures about the company’s fair value amounts of gains and losses associated with derivative instruments, as well as disclosures about credit-risk-related contingent features in derivative agreements. The company adopted this new standard effective Jan. 1, 2009.
The company applies the accounting standards for regulated operations to financial instruments used to hedge the purchase of natural gas for its regulated companies. These standards, in accordance with the FPSC, permit the changes in fair value of natural gas derivatives to be recorded as regulatory assets or liabilities to reflect the impact of hedging activities on the fuel recovery clause. As a result, these changes are not recorded in OCI (see Note 3).
A company’s physical contracts qualify for the normal purchase/normal sale (NPNS) exception to derivative accounting rules, provided they meet certain criteria. Generally, NPNS applies if the company deems the counterparty creditworthy, if the counterparty owns or controls resources within the proximity to allow for physical delivery of the commodity, if the company intends to receive physical delivery and if the transaction is reasonable in relation to the company’s business needs. As of Dec. 31, 2009, all of the company’s physical contracts qualify for the NPNS exception.
The following table presents the derivatives that are designated as cash flow hedges at Dec. 31, 2009 and Dec. 31, 2008:
Total Derivatives
| (millions) |
Dec. 31, 2009 |
Dec. 31, 2008 | ||||
| Current assets |
$ | 0.8 | $ | — | ||
| Long-term assets |
0.2 | 0.1 | ||||
| Total assets |
$ | 1.0 | $ | 0.1 | ||
| Current liabilities (1) |
$ | 34.0 | $ | 141.8 | ||
| Long-term liabilities |
3.6 | 19.4 | ||||
| Total liabilities |
$ | 37.6 | $ | 161.2 | ||
120
Table of Contents
TECO ENERGY, INC.
NOTES TO CONSOLIDATED FINANCIAL STATEMENTS—(Continued)
| (1) | Amounts presented above are on a gross basis, with asset and liability positions netted by counterparty in accordance with accounting standards for derivatives and hedging. The Consolidated Condensed Balance Sheets reflect the company’s net positions reduced by posted collateral of $9.7 million at Dec. 31, 2008, permitted by these accounting standards. As of Dec. 31, 2009, there was no outstanding collateral held or posted with counterparties. |
The following table presents the derivative hedges of heating oil contracts at Dec. 31, 2009 and Dec. 31, 2008 to limit the exposure to changes in the market price for diesel fuel:
Heating Oil Derivatives
| (millions) |
Dec. 31, 2009 |
Dec. 31, 2008 | ||||
| Current assets |
$ | — | $ | — | ||
| Long-term assets |
0.2 | — | ||||
| Total assets |
$ | 0.2 | $ | — | ||
| Current liabilities |
$ | 0.9 | $ | 21.4 | ||
| Long-term liabilities |
— | 4.6 | ||||
| Total liabilities |
$ | 0.9 | $ | 26.0 | ||
The following table presents the derivative hedges of natural gas contracts at Dec. 31, 2009 and Dec. 31, 2008 to limit the exposure to changes in market price for natural gas used to produce energy, natural gas purchased for resale to customers and natural gas used as a component price for explosives purchased:
Natural Gas Derivatives
| (millions) |
Dec. 31, 2009 |
Dec. 31, 2008 | ||||
| Current assets |
$ | 0.8 | $ | — | ||
| Long-term assets |
— | 0.1 | ||||
| Total assets |
$ | 0.8 | $ | 0.1 | ||
| Current liabilities |
$ | 33.1 | $ | 120.4 | ||
| Long-term liabilities |
3.6 | 14.8 | ||||
| Total liabilities |
$ | 36.7 | $ | 135.2 | ||
The ending balance in accumulated other comprehensive income (AOCI) related to the cash flow hedges and previously settled interest rate swaps at Dec. 31, 2009 is a net loss of $7.3 million after tax and accumulated amortization. This compares to a net loss of $25.1 million in AOCI after tax and accumulated amortization at Dec. 31, 2008.
The following table presents the fair values and locations of derivative instruments recorded on the balance sheet at Dec. 31, 2009:
Derivatives Designated As Hedging Instruments
| Asset Derivatives |
Liability Derivatives | |||||||||
| (millions) at Dec. 31, 2009 |
Balance Sheet Location |
Fair Value |
Balance Sheet Location |
Fair Value | ||||||
| Commodity Contracts: |
||||||||||
| Heating oil derivatives: |
||||||||||
| Current |
Derivative assets | $ | — | Derivative liabilities | $ | 0.9 | ||||
| Long-term |
Derivative assets | 0.2 | Derivative liabilities | — | ||||||
| Natural gas derivatives: |
||||||||||
| Current |
Derivative assets | 0.8 | Derivative liabilities | 33.1 | ||||||
| Long-term |
Derivative assets | — | Derivative liabilities | 3.6 | ||||||
| Total derivatives designated as hedging instruments |
$ | 1.0 | $ | 37.6 | ||||||
121
Table of Contents
TECO ENERGY, INC.
NOTES TO CONSOLIDATED FINANCIAL STATEMENTS—(Continued)
The following table presents the effect of energy related derivatives on the fuel recovery clause mechanism in the Consolidated Condensed Balance Sheet as of Dec. 31, 2009:
| (millions) at Dec. 31, 2009 |
Balance Sheet Location (1) |
Fair Value |
Balance Sheet Location (1) |
Fair Value | ||||||
| Commodity Contracts: |
||||||||||
| Natural gas derivatives: |
||||||||||
| Current |
Regulatory liabilities | $ | 0.8 | Regulatory assets | $ | 33.1 | ||||
| Long-term |
Regulatory liabilities | — | Regulatory assets | 3.6 | ||||||
| Total |
$ | 0.8 | $ | 36.7 | ||||||
| (1) | Natural gas derivatives are deferred, in accordance with accounting standards for regulated operations and all increases and decreases in the cost of natural gas supply are passed on to customers with the fuel recovery clause mechanism. As gains and losses are realized in future periods, they will be recorded as fuel costs in the Consolidated Condensed Statements of Income. |
Based on the fair value of the instruments at Dec. 31, 2009, net pretax losses of $32.3 million are expected to be reclassified from regulatory assets or liabilities to the Consolidated Condensed Statements of Income within the next twelve months.
The following table presents the effect of hedging instruments on OCI and income for the years ended Dec. 31:
| (millions) |
Amount of Gain/ (Loss) on Derivatives Recognized in OCI |
Location of Gain/(Loss) Reclassified From AOCI Into Income |
Amount of Gain/(Loss) Reclassified From AOCI Into Income |
|||||||
| Derivatives in Cash Flow Hedging Relationships |
Effective Portion(1) | Effective Portion(1) | ||||||||
| 2009 |
||||||||||
| Interest rate contracts: |
$ | (0.3 | ) | Interest expense | $ | (2.0 | ) | |||
| Commodity contracts: |
||||||||||
| Heating oil derivatives |
2.8 | Mining related costs | (13.3 | ) | ||||||
| Total |
$ | 2.5 | $ | (15.3 | ) | |||||
| 2008 |
||||||||||
| Interest rate contracts: |
$ | (3.4 | ) | Interest expense | $ | (1.0 | ) | |||
| Commodity contracts: |
||||||||||
| Heating oil derivatives |
(12.4 | ) | Mining related costs | 4.1 | ||||||
| Total |
$ | (15.8 | ) | $ | 3.1 | |||||
| 2007 |
||||||||||
| Interest rate contracts: |
$ | (6.4 | ) | Interest expense | $ | — | ||||
| Commodity contracts: |
||||||||||
| Heating oil derivatives |
4.1 | Mining related costs | 4.0 | |||||||
| Total |
$ | (2.3 | ) | $ | 4.0 | |||||
| (1) | Changes in OCI and AOCI are reported in after-tax dollars. |
For derivative instruments that meet cash flow hedge criteria, the effective portion of the gain or loss on the derivative is reported as a component of OCI and reclassified into earnings in the same period or period during which the hedged transaction affects earnings. Gains and losses on the derivatives representing either hedge ineffectiveness or hedge components excluded from the assessment of effectiveness are recognized in current earnings. For the years ended Dec. 31, 2009, 2008 and 2007, all hedges were effective.
122
Table of Contents
TECO ENERGY, INC.
NOTES TO CONSOLIDATED FINANCIAL STATEMENTS—(Continued)
The following table presents the derivative activity for instruments classified as qualifying cash flow hedges for the years ended Dec. 31:
| (millions) |
Fair Value Asset/(Liability) |
Amount of Gain/(Loss) Recognized in OCI(1) |
Amount of Gain/(Loss) Reclassified From AOCI Into Income |
|||||||||
| 2009 |
||||||||||||
| Interest rate swaps |
$ | — | $ | (0.3 | ) | $ | (2.0 | ) | ||||
| Heating oil derivatives |
(0.7 | ) | 2.8 | (13.3 | ) | |||||||
| Total |
$ | (0.7 | ) | $ | 2.5 | $ | (15.3 | ) | ||||
| 2008 |
||||||||||||
| Interest rate swaps |
$ | — | $ | (3.4 | ) | $ | (1.0 | ) | ||||
| Heating oil derivatives |
(26.3 | ) | (12.4 | ) | 4.1 | |||||||
| Total |
$ | (26.3 | ) | $ | (15.8 | ) | $ | 3.1 | ||||
| 2007 |
||||||||||||
| Interest rate swaps |
$ | (8.2 | ) | $ | (6.4 | ) | $ | — | ||||
| Heating oil derivatives |
— | 4.1 | 4.0 | |||||||||
| Total |
$ | (8.2 | ) | $ | (2.3 | ) | $ | 4.0 | ||||
| (1) | Changes in OCI and AOCI are reported in after-tax dollars. |
The maximum length of time over which the company is hedging its exposure to the variability in future cash flows extends to Dec. 31, 2011 for both financial natural gas and financial heating oil fuel contracts. The following table presents by commodity type the company’s derivative volumes that, as of Dec. 31, 2009, are expected to settle during the 2010 and 2011 fiscal years:
| (millions) Year |
Heating Oil Contracts (Gallons) |
Natural Gas Contracts (MMBTUs) | ||||||
| Physical | Financial | Physical | Financial | |||||
| 2010 |
— | 9.4 | — | 37.6 | ||||
| 2011 |
— | 4.5 | — | 8.4 | ||||
| Total |
— | 13.9 | — | 46.0 | ||||
The company is exposed to credit risk primarily through entering into derivative instruments with counterparties to limit its exposure to the commodity price fluctuations associated with diesel fuel and natural gas. Credit risk is the potential loss resulting from a counterparty’s nonperformance under an agreement. The company manages credit risk with policies and procedures for, among other things, counterparty analysis, exposure measurement, and exposure monitoring and mitigation.
It is possible that volatility in commodity prices could cause the company to have material credit risk exposures with one or more counterparties. If such counterparties fail to perform their obligations under one or more agreements, the company could suffer a material financial loss. However, as of Dec. 31, 2009, substantially all of the counterparties with transaction amounts outstanding in the company’s energy portfolio are rated investment grade by the major rating agencies. The company assesses credit risk internally for counterparties that are not rated.
The company has entered into commodity master arrangements with its counterparties to mitigate credit exposure to those counterparties. The company generally enters into the following master arrangements: (1) Edison Electric Institute agreements (EEI)—standardized power sales contracts in the electric industry; (2) International Swaps and Derivatives Association agreements (ISDA)—standardized financial gas and electric contracts; and (3) North American Energy Standards Board agreements (NAESB)—standardized physical gas contracts. The company believes that entering into such agreements reduces the risk from default by creating contractual rights relating to creditworthiness, collateral and termination.
The company has implemented procedures to monitor the creditworthiness of our counterparties and to consider nonperformance in valuing counterparty positions. The company monitors counterparties’ credit standing, including those that are experiencing financial problems, have significant swings in credit default swap rates, have credit rating changes by external rating agencies, or have changes in ownership. Net liability positions are generally not adjusted as the company uses derivative transactions as hedges and has the ability and intent to perform under each of these contracts. In the instance of net asset positions, the company considers general market conditions and the observable financial health and outlook of specific counterparties, forward looking data such as credit
123
Table of Contents
TECO ENERGY, INC.
NOTES TO CONSOLIDATED FINANCIAL STATEMENTS—(Continued)
default swaps, when available, and historical default probabilities from credit rating agencies in evaluating the potential impact of nonperformance risk to derivative positions. As of Dec. 31, 2009, substantially all positions with counterparties are net liabilities.
Certain TECO Energy derivative instruments contain provisions that require the company’s debt, or in the case of derivative instruments where Tampa Electric Company is the counterparty, Tampa Electric Company’s debt, to maintain an investment grade credit rating from any or all of the major credit rating agencies. If debt ratings, including Tampa Electric Company’s, were to fall below investment grade, it could trigger these provisions, and the counterparties to the derivative instruments could request immediate payment or demand immediate and ongoing full overnight collateralization on derivative instruments in net liability positions. The company has no other contingent risk features associated with any derivative instruments.
The table below presents the fair value of the overall contractual contingent liability positions for the company’s derivative activity at Dec 31, 2009:
Contingent Features
| (millions) At Dec. 31, 2009 |
Fair Value Asset/(Liability) (1) |
Derivative Exposure Asset/ (Liability) |
Posted Collateral | ||||||||
| Credit Rating |
$ | (36.7 | ) | $ | (36.7 | ) | $ | — | |||
| (1) | Amount excludes $0.1 million of asset positions. |
| 23. | Fair Value Measurements |
Determination of Fair Value
The company measures fair value using the procedures set forth below for all assets and liabilities measured at fair value that were previously carried at fair value pursuant to other accounting guidelines.
When available, the company uses quoted market prices on assets and liabilities traded on an exchange to determine fair value and classifies such items as Level 1. In some cases where a market exchange price is available, but the assets and liabilities are traded in a secondary market, the company makes use of acceptable practical expedients to calculate fair value, and classifies such items as Level 2.
If observable transactions and other market data are not available, fair value is based upon internally developed models that use, when available, current market-based or independently-sourced market parameters such as interest rates, currency rates or option volatilities. Items valued using internally generated models are classified according to the lowest level input or value driver that is most significant to the valuation. Thus, an item may be classified as Level 3 even though there may be significant inputs that are readily observable.
Items Measured at Fair Value on a Recurring Basis
The following table sets forth by level within the fair value hierarchy the company’s financial assets and liabilities that were accounted for at fair value on a recurring basis as of Dec. 31, 2009. As required by accounting standards for fair value measurements, financial assets and liabilities are classified in their entirety based on the lowest level of input that is significant to the fair value measurement. The company’s assessment of the significance of a particular input to the fair value measurement requires judgment, and may affect the valuation of fair value assets and liabilities and their placement within the fair value hierarchy levels. For natural gas and heating oil swaps, the market approach was used in determining fair value. For other investments, the income approach was used.
Recurring Fair Value Measures
| (millions) |
At fair value as of Dec. 31, 2009 | |||||||||||
| Level 1 | Level 2 | Level 3 | Total | |||||||||
| Assets |
||||||||||||
| Natural gas swaps |
$ | — | $ | 0.8 | $ | — | $ | 0.8 | ||||
| Heating oil swaps |
— | 0.2 | — | 0.2 | ||||||||
| Total |
$ | — | $ | 1.0 | $ | — | $ | 1.0 | ||||
| Liabilities |
||||||||||||
| Natural gas swaps |
$ | — | $ | 36.7 | $ | — | $ | 36.7 | ||||
| Heating oil swaps |
— | 0.9 | — | 0.9 | ||||||||
| Total |
$ | — | $ | 37.6 | $ | — | $ | 37.6 | ||||
124
Table of Contents
TECO ENERGY, INC.
NOTES TO CONSOLIDATED FINANCIAL STATEMENTS—(Continued)
Natural gas and heating oil swaps are over-the-counter swap instruments. The primary pricing inputs in determining the fair value of these swaps are the New York Mercantile Exchange (NYMEX) quoted closing prices of exchange-traded instruments. These prices are applied to the notional amounts of active positions to determine the reported fair value.
The primary pricing inputs in determining the fair value of interest rate swaps are LIBOR swap rates as reported by Bloomberg. For each instrument, the projected forward swap rate is used to determine the stream of cash flows over the life of the contract. The cash flows are then discounted using a spot discount rate to determine the fair value. A $1.3 million liability, primarily in interest rate swaps, is held on the books of unconsolidated affiliates of TECO Guatemala, but is reflected in “Investment in unconsolidated affiliates” on the TECO Energy, Inc. Consolidated Condensed Balance Sheets.
The table below details the change in value and eventual sale of auction rate securities backed by pools of student loans. These securities were recorded in the “Other investments” line of the Consolidated Condensed Balance Sheets. As a result of auction failures and the lack of an alternative active market, the valuation technique for this security was an income approach using a discounted cash flow model and was considered Level 3 within the three tier fair value hierarchy. The model assumed a continuation of failed auctions and interest payments at the default rate. Cash flows were discounted at a rate approximating current market spreads for similar securities.
Based on the protracted disruption of the market for these securities and the uncertain potential for its recovery, the company no longer expected to hold the securities indefinitely to recover the original value. Accordingly, the impairment was deemed other-than-temporary and recognized in “Other income” on the Consolidated Condensed Statement of Income for the year ended Dec. 31, 2009.
During the second quarter of 2009, one of the two securities was sold for the remaining fair value of $7.3 million. During the third quarter of 2009, the second security was sold for its remaining fair value of $2.5 million.
Assets Measured at Fair Value on a Recurring Basis Using Unobservable Inputs (Level 3)
| (millions) |
Auction Rate Securities |
|||
| Balance at Dec. 31, 2008 |
$ | 13.3 | ||
| Transfers to Level 3 |
— | |||
| Change in fair market value included in earnings |
(4.1 | ) | ||
| Balance at Mar. 31, 2009 |
$ | 9.2 | ||
| Transfers to Level 3 |
— | |||
| Change in fair market value included in earnings |
— | |||
| Settled |
(7.3 | ) | ||
| Balance at Jun. 30, 2009 |
$ | 1.9 | ||
| Transfers to Level 3 |
— | |||
| Change in fair market value |
0.6 | |||
| Settled |
(2.5 | ) | ||
| Included in earnings |
— | |||
| Balance at Sep. 30, 2009 |
$ | — | ||
| Transfers to Level 3 |
— | |||
| Change in fair market value |
— | |||
| Settled |
— | |||
| Included in earnings |
— | |||
| Balance at Dec. 31, 2009 |
$ | — | ||
125
Table of Contents
TECO ENERGY, INC.
NOTES TO CONSOLIDATED FINANCIAL STATEMENTS—(Continued)
| 24. | TECO Finance, Inc. |
TECO Finance, Inc. (TECO Finance) is a wholly-owned subsidiary of TECO Energy, Inc. TECO Finance’s sole purpose is to raise capital for TECO Energy’s diversified businesses. TECO Energy is a full and unconditional guarantor of TECO Finance’s securities (see Note 7). TECO Finance meets the definition of a significant subsidiary by virtue of its total assets exceeding 10% of the total assets of TECO Energy, Inc. consolidated as of Dec. 31, 2009. As required by Regulation S-X, condensed financial data for TECO Finance is presented below:
TECO Finance, Inc.
Condensed Balance Sheets
| (millions) |
Dec. 31, 2009 |
Dec. 31, 2008 |
||||||
| Assets |
||||||||
| Current assets |
||||||||
| Cash |
$ | 0.1 | $ | — | ||||
| Advances-intercompany |
662.5 | 769.7 | ||||||
| Total current assets |
662.6 | 769.7 | ||||||
| Non-current assets |
||||||||
| Deferred tax asset |
36.8 | 18.6 | ||||||
| Unamortized debt expense |
21.6 | 25.3 | ||||||
| Total non-current assets |
58.4 | 43.9 | ||||||
| Total assets |
$ | 721.0 | $ | 813.6 | ||||
| Liabilities and Capital |
||||||||
| Current liabilities |
||||||||
| Notes payable |
$ | — | $ | 64.0 | ||||
| Interest payable |
10.3 | 9.9 | ||||||
| Total current liabilities |
10.3 | 73.9 | ||||||
| Non-current liabilities |
||||||||
| Long-term debt |
900.1 | 900.3 | ||||||
| Total liabilities |
910.4 | 974.2 | ||||||
| Capital |
||||||||
| Common stock and paid in capital |
0.1 | 0.1 | ||||||
| Retained deficit |
(189.5 | ) | (160.7 | ) | ||||
| Total capital |
(189.4 | ) | (160.6 | ) | ||||
| Total liabilities and capital |
$ | 721.0 | $ | 813.6 | ||||
TECO Finance, Inc.
Condensed Statements of Operations
| (millions) For the years ended Dec. 31, |
2009 | 2008 | 2007 | |||||||||
| Revenues |
$ | — | $ | — | $ | — | ||||||
| Interest charges |
||||||||||||
| Interest expense |
46.9 | 43.7 | 2.2 | |||||||||
| Loss before benefit from income taxes |
(46.9 | ) | (43.7 | ) | (2.2 | ) | ||||||
| Income tax benefit |
(18.2 | ) | (16.8 | ) | (0.8 | ) | ||||||
| Net loss |
$ | (28.7 | ) | $ | (26.9 | ) | $ | (1.4 | ) | |||
126
Table of Contents
TECO ENERGY, INC.
NOTES TO CONSOLIDATED FINANCIAL STATEMENTS—(Continued)
TECO Finance, Inc.
Condensed Statements of Cash Flows
| (millions) For the years ended Dec. 31, |
2009 | 2008 | 2007 | |||||||||
| Cash flows from operating activities |
||||||||||||
| Net loss |
$ | (28.7 | ) | $ | (26.9 | ) | $ | (1.4 | ) | |||
| Adjustments to reconcile net loss to net cash from operating activities: |
||||||||||||
| Deferred taxes |
(18.2 | ) | (16.8 | ) | (0.8 | ) | ||||||
| Interest payable |
0.3 | 8.1 | 1.8 | |||||||||
| Other assets |
3.7 | 3.7 | (1.7 | ) | ||||||||
| Other liabilities |
(0.2 | ) | (0.2 | ) | — | |||||||
| Cash flows used in operating activities |
(43.1 | ) | (32.1 | ) | (2.1 | ) | ||||||
| Cash flows from financing activities |
||||||||||||
| Advances |
107.2 | (32.1 | ) | 2.2 | ||||||||
| Short-term debt or notes |
(64.0 | ) | 64.0 | — | ||||||||
| Cash flows provided by financing activities |
43.2 | 31.9 | 2.2 | |||||||||
| Net increase (decrease) in cash |
0.1 | (0.2 | ) | 0.1 | ||||||||
| Cash at the beginning of the year |
— | 0.2 | 0.1 | |||||||||
| Cash at end of the year |
$ | 0.1 | $ | — | $ | 0.2 | ||||||
| 25. | Quarterly Data (unaudited) |
Financial data by quarter is as follows:
| (millions, except per share amounts) Quarter ended |
Dec. 31 | Sep. 30 | Jun. 30 | Mar. 31 | ||||||||
| 2009 |
||||||||||||
| Revenues |
$ | 765.0 | $ | 896.3 | $ | 825.2 | $ | 824.0 | ||||
| Income from operations |
$ | 119.4 | $ | 135.0 | $ | 123.1 | $ | 82.7 | ||||
| Net income |
$ | 53.5 | $ | 64.8 | $ | 60.9 | $ | 34.7 | ||||
| Earnings per share (EPS)—basic |
$ | 0.25 | $ | 0.30 | $ | 0.29 | $ | 0.16 | ||||
| Earnings per share (EPS)—diluted |
$ | 0.25 | $ | 0.30 | $ | 0.29 | $ | 0.16 | ||||
| Dividends paid per common share |
$ | 0.20 | $ | 0.20 | $ | 0.20 | $ | 0.20 | ||||
| Stock price per common share (1) |
||||||||||||
| High |
$ | 16.71 | $ | 14.64 | $ | 12.41 | $ | 12.97 | ||||
| Low |
$ | 13.45 | $ | 11.16 | $ | 10.28 | $ | 8.41 | ||||
| Close |
$ | 16.22 | $ | 14.08 | $ | 11.93 | $ | 11.15 | ||||
| Quarter ended |
Dec. 31 | Sep. 30 | Jun. 30 | Mar. 31 | ||||||||
| 2008 |
||||||||||||
| Revenues |
$ | 770.3 | $ | 926.1 | $ | 887.2 | $ | 791.7 | ||||
| Income from operations |
$ | 88.5 | $ | 116.5 | $ | 102.4 | $ | 77.6 | ||||
| Net income |
$ | 22.0 | $ | 58.2 | $ | 51.4 | $ | 30.8 | ||||
| Earnings per share (EPS)—basic |
$ | 0.10 | $ | 0.28 | $ | 0.24 | $ | 0.15 | ||||
| Earnings per share (EPS)—diluted |
$ | 0.10 | $ | 0.27 | $ | 0.24 | $ | 0.15 | ||||
| Dividends paid per common share |
$ | 0.20 | $ | 0.20 | $ | 0.20 | $ | 0.195 | ||||
| Stock price per common share (1) |
||||||||||||
| High |
$ | 16.05 | $ | 21.80 | $ | 21.99 | $ | 17.75 | ||||
| Low |
$ | 10.50 | $ | 15.36 | $ | 15.97 | $ | 14.48 | ||||
| Close |
$ | 12.35 | $ | 15.73 | $ | 21.49 | $ | 15.95 | ||||
| (1) | Trading prices for common shares |
127
Table of Contents
TECO ENERGY, INC.
NOTES TO CONSOLIDATED FINANCIAL STATEMENTS—(Continued)
| 26. | Subsequent Events |
The company has evaluated all events subsequent to the balance sheet date of Dec. 31, 2009 through the date of filing, Feb. 26, 2010.
Tampa Electric Company Accounts Receivable Facility
On Feb. 19, 2010, Tampa Electric Company and TEC Receivables Corp. (TRC), a wholly-owned subsidiary of Tampa Electric Company, amended their $150 million accounts receivable collateralized borrowing facility, entering into Amendment No. 8 to the Loan and Servicing Agreement with certain lenders named therein and Citicorp North America, Inc. as Program Agent. The amendment (i) extends the maturity date to Feb. 18, 2011, (ii) provides that TRC will continue to pay program and liquidity fees, which, pursuant to the amendment, will total 100 basis points, (iii) provides that the interest rates on the borrowings will be based on prevailing asset-backed commercial paper rates, unless such rates are not available from conduit lenders, in which case the rates will be at an interest rate equal to, at Tampa Electric Company’s option, either Citibank’s prime rate (or the federal funds rate plus 50 basis points, if higher) or a rate based on the London interbank offer rate (if available) plus a margin and (iv) makes other technical changes.
TECO Energy, Inc. and TECO Finance, Inc. Tender Offers
On Feb. 22, 2010 TECO Energy and TECO Finance announced tender offers for up to $300.0 million of four series of notes maturing in 2011 and 2012. The purpose of the tender offers is to manage TECO Energy and TECO Finance debt maturities by retiring the tendered notes and issuing replacement debt with longer maturities.
Neither TECO Energy nor TECO Finance will be obligated to accept for purchase, and pay for, validly tendered notes pursuant to any of the tender offers if we have not closed on, and received anticipated proceeds from, a registered offering of notes to be issued by TECO Finance and guaranteed by TECO Energy. We intend to use the proceeds from the closing of the offering to retire TECO Energy’s floating rate notes due 2010 at maturity and to purchase tendered notes.
128
Table of Contents
INDEX TO CONSOLIDATED FINANCIAL STATEMENTS AND SUPPLEMENTARY DATA
All other financial statement schedules have been omitted since they are not required, are inapplicable or the required information is presented in the financial statements or notes thereto.
129
Table of Contents
Report of Independent Registered Certified Public Accounting Firm
To the Board of Directors and Shareholders of Tampa Electric Company:
In our opinion, the consolidated financial statements listed in the accompanying index present fairly, in all material respects, the financial position of Tampa Electric Company and its subsidiaries (the Company) at December 31, 2009 and 2008, and the results of their operations and their cash flows for each of the three years in the period ended December 31, 2009 in conformity with accounting principles generally accepted in the United States of America. In addition, in our opinion, the financial statement schedule listed in the accompanying index presents fairly, in all material respects, the information set forth therein when read in conjunction with the related consolidated financial statements. Also in our opinion, the Company maintained, in all material respects, effective internal control over financial reporting as of December 31, 2009, based on criteria established in Internal Control - Integrated Framework issued by the Committee of Sponsoring Organizations of the Treadway Commission (COSO). The Company’s management is responsible for these financial statements and financial statement schedules, for maintaining effective internal control over financial reporting and for its assessment of the effectiveness of internal control over financial reporting, included in the accompanying Management’s Report on Internal Control Over Financial Reporting. Our responsibility is to express opinions on these financial statements, on the financial statement schedules, and on the Company’s internal control over financial reporting based on our integrated audits. We conducted our audits in accordance with the standards of the Public Company Accounting Oversight Board (United States). Those standards require that we plan and perform the audits to obtain reasonable assurance about whether the financial statements are free of material misstatement and whether effective internal control over financial reporting was maintained in all material respects. Our audits of the financial statements included examining, on a test basis, evidence supporting the amounts and disclosures in the financial statements, assessing the accounting principles used and significant estimates made by management, and evaluating the overall financial statement presentation. Our audit of internal control over financial reporting included obtaining an understanding of internal control over financial reporting, assessing the risk that a material weakness exists, and testing and evaluating the design and operating effectiveness of internal control based on the assessed risk. Our audits also included performing such other procedures as we considered necessary in the circumstances. We believe that our audits provide a reasonable basis for our opinions.
A company’s internal control over financial reporting is a process designed to provide reasonable assurance regarding the reliability of financial reporting and the preparation of financial statements for external purposes in accordance with generally accepted accounting principles. A company’s internal control over financial reporting includes those policies and procedures that (i) pertain to the maintenance of records that, in reasonable detail, accurately and fairly reflect the transactions and dispositions of the assets of the company; (ii) provide reasonable assurance that transactions are recorded as necessary to permit preparation of financial statements in accordance with generally accepted accounting principles, and that receipts and expenditures of the company are being made only in accordance with authorizations of management and directors of the company; and (iii) provide reasonable assurance regarding prevention or timely detection of unauthorized acquisition, use, or disposition of the company’s assets that could have a material effect on the financial statements.
Because of its inherent limitations, internal control over financial reporting may not prevent or detect misstatements. Also, projections of any evaluation of effectiveness to future periods are subject to the risk that controls may become inadequate because of changes in conditions, or that the degree of compliance with the policies or procedures may deteriorate.
| /s/ PricewaterhouseCoopers LLP |
| Tampa, Florida |
| February 25, 2010 |
130
Table of Contents
Consolidated Balance Sheets
Assets
| (millions) |
Dec. 31, 2009 |
Dec. 31, 2008 |
||||||
| Property, plant and equipment |
||||||||
| Utility plant in service |
||||||||
| Electric |
$ | 6,065.9 | $ | 5,514.9 | ||||
| Gas |
1,017.2 | 964.4 | ||||||
| Construction work in progress |
303.0 | 462.4 | ||||||
| Property, plant and equipment, at original costs |
7,386.1 | 6,941.7 | ||||||
| Accumulated depreciation |
(1,988.1 | ) | (1,868.5 | ) | ||||
| 5,398.0 | 5,073.2 | |||||||
| Other property |
4.4 | 4.5 | ||||||
| Total property, plant and equipment (net) |
5,402.4 | 5,077.7 | ||||||
| Current assets |
||||||||
| Cash and cash equivalents |
5.5 | 3.6 | ||||||
| Receivables, less allowance for uncollectibles of $1.6 at Dec. 31, 2009 and 2008. |
228.6 | 236.1 | ||||||
| Inventories, at average cost |
||||||||
| Fuel |
85.8 | 76.8 | ||||||
| Materials and supplies |
55.8 | 61.8 | ||||||
| Current regulatory assets |
109.2 | 272.6 | ||||||
| Current derivative assets |
0.8 | — | ||||||
| Taxes receivable |
16.8 | 0.2 | ||||||
| Prepayments and other current assets |
12.0 | 14.1 | ||||||
| Total current assets |
514.5 | 665.2 | ||||||
| Deferred debits |
||||||||
| Unamortized debt expense |
20.1 | 22.3 | ||||||
| Long-term regulatory assets |
335.6 | 325.3 | ||||||
| Long-term derivative assets |
— | 0.1 | ||||||
| Other |
1.2 | 18.0 | ||||||
| Total deferred debits |
356.9 | 365.7 | ||||||
| Total assets |
$ | 6,273.8 | $ | 6,108.6 | ||||
The accompanying notes are an integral part of the consolidated financial statements.
131
Table of Contents
TAMPA ELECTRIC COMPANY
Consolidated Balance Sheets—Continued
Liabilities and Capital
| (millions) |
Dec. 31, 2009 |
Dec. 31, 2008 |
||||||
| Capital |
||||||||
| Common stock |
$ | 1,802.4 | $ | 1,802.4 | ||||
| Accumulated other comprehensive loss |
(6.1 | ) | (6.8 | ) | ||||
| Retained earnings |
307.5 | 295.0 | ||||||
| Total capital |
2,103.8 | 2,090.6 | ||||||
| Long-term debt, less amount due within one year |
1,994.4 | 1,894.8 | ||||||
| Total capitalization |
4,098.2 | 3,985.4 | ||||||
| Current liabilities |
||||||||
| Long-term debt due within one year |
3.7 | 5.5 | ||||||
| Notes payable |
55.0 | 29.0 | ||||||
| Accounts payable |
206.1 | 262.5 | ||||||
| Customer deposits |
151.2 | 144.6 | ||||||
| Current regulatory liabilities |
85.4 | 21.7 | ||||||
| Current derivative liabilities |
33.1 | 119.4 | ||||||
| Current deferred income taxes |
15.9 | 36.6 | ||||||
| Interest accrued |
27.7 | 27.1 | ||||||
| Taxes accrued |
12.1 | 20.1 | ||||||
| Other |
16.5 | 11.2 | ||||||
| Total current liabilities |
606.7 | 677.7 | ||||||
| Deferred credits |
||||||||
| Non-current deferred income taxes |
543.8 | 447.6 | ||||||
| Investment tax credits |
10.8 | 11.2 | ||||||
| Long-term derivative liabilities |
3.6 | 14.8 | ||||||
| Long-term regulatory liabilities |
602.6 | 588.2 | ||||||
| Other |
408.1 | 383.7 | ||||||
| Total deferred credits |
1,568.9 | 1,445.5 | ||||||
| Total liabilities and capital |
$ | 6,273.8 | $ | 6,108.6 | ||||
The accompanying notes are an integral part of the consolidated financial statements.
132
Table of Contents
Consolidated Statements of Income and Comprehensive Income
| (millions) For the years ended Dec. 31, |
2009 | 2008 | 2007 | |||||||||
| Revenues |
||||||||||||
| Electric (includes franchise fees and gross receipts taxes of $92.2 in 2009, $85.0 in 2008 and $87.4 in 2007) |
$ | 2,194.3 | $ | 2,091.2 | $ | 2,188.4 | ||||||
| Gas (includes franchise fees and gross receipts taxes of $23.5 in 2009, $24.2 in 2008 and $23.8 in 2007) |
455.6 | 687.9 | 599.1 | |||||||||
| Total revenues |
2,649.9 | 2,779.1 | 2,787.5 | |||||||||
| Expenses |
||||||||||||
| Operations |
||||||||||||
| Fuel |
909.9 | 819.4 | 947.9 | |||||||||
| Purchased power |
177.6 | 305.4 | 271.9 | |||||||||
| Cost of natural gas sold |
242.7 | 476.6 | 389.9 | |||||||||
| Other |
318.3 | 277.3 | 279.8 | |||||||||
| Maintenance |
128.9 | 121.4 | 113.9 | |||||||||
| Depreciation and amortization |
244.6 | 227.5 | 218.7 | |||||||||
| Restructuring |
23.1 | — | — | |||||||||
| Taxes, federal and state |
110.9 | 97.8 | 99.8 | |||||||||
| Taxes, other than income |
179.7 | 171.2 | 174.6 | |||||||||
| Total expenses |
2,335.7 | 2,496.6 | 2,496.5 | |||||||||
| Income from operations |
314.2 | 282.5 | 291.0 | |||||||||
| Other income |
||||||||||||
| Allowance for other funds used during construction |
9.3 | 6.3 | 4.5 | |||||||||
| Taxes, non-utility federal and state |
(0.8 | ) | (1.4 | ) | (1.7 | ) | ||||||
| Other income, net |
4.3 | 8.0 | 12.2 | |||||||||
| Total other income |
12.8 | 12.9 | 15.0 | |||||||||
| Interest charges |
||||||||||||
| Interest on long-term debt |
128.2 | 124.5 | 118.3 | |||||||||
| Other interest |
11.2 | 10.6 | 12.6 | |||||||||
| Allowance for borrowed funds used during construction |
(4.5 | ) | (2.4 | ) | (1.7 | ) | ||||||
| Total interest charges |
134.9 | 132.7 | 129.2 | |||||||||
| Net income |
192.1 | 162.7 | 176.8 | |||||||||
| Other comprehensive loss, net of tax |
||||||||||||
| Net unrealized gains (losses) on cash flow hedges |
0.7 | (1.8 | ) | (5.0 | ) | |||||||
| Other comprehensive income (loss), net of tax |
0.7 | (1.8 | ) | (5.0 | ) | |||||||
| Comprehensive income |
$ | 192.8 | $ | 160.9 | $ | 171.8 | ||||||
The accompanying notes are an integral part of the consolidated financial statements.
133
Table of Contents
Consolidated Statements of Cash Flows
| (millions) For the years ended Dec. 31, |
2009 | 2008 | 2007 | |||||||||
| Cash flows from operating activities |
||||||||||||
| Net income |
$ | 192.1 | $ | 162.7 | $ | 176.8 | ||||||
| Adjustments to reconcile net income to net cash from operating activities: |
||||||||||||
| Depreciation |
244.6 | 227.5 | 218.7 | |||||||||
| Deferred income taxes |
73.2 | 75.8 | (45.6 | ) | ||||||||
| Investment tax credits, net |
(0.4 | ) | (0.9 | ) | (2.5 | ) | ||||||
| Allowance for funds used during construction |
(9.3 | ) | (6.3 | ) | (4.5 | ) | ||||||
| Gain on sale of business/assets, pretax |
(0.6 | ) | (0.4 | ) | (0.4 | ) | ||||||
| Deferred recovery clause |
136.6 | (115.8 | ) | 123.7 | ||||||||
| Receivables, less allowance for uncollectibles |
7.5 | 2.7 | (3.9 | ) | ||||||||
| Inventories |
(3.0 | ) | (14.4 | ) | (9.2 | ) | ||||||
| Prepayments |
2.1 | (2.5 | ) | (0.3 | ) | |||||||
| Taxes accrued |
(24.6 | ) | 6.0 | 9.5 | ||||||||
| Interest accrued |
0.6 | 3.6 | (3.1 | ) | ||||||||
| Accounts payable |
(41.8 | ) | 7.0 | (20.1 | ) | |||||||
| Other |
54.0 | 11.4 | 5.9 | |||||||||
| Cash flows from operating activities |
631.0 | 356.4 | 445.0 | |||||||||
| Cash flows from investing activities |
||||||||||||
| Capital expenditures |
(583.5 | ) | (548.7 | ) | (423.0 | ) | ||||||
| Allowance for funds used during construction |
9.3 | 6.3 | 4.5 | |||||||||
| Net proceeds from sale of assets |
2.2 | 6.3 | 0.4 | |||||||||
| Cash flows used in investing activities |
(572.0 | ) | (536.1 | ) | (418.1 | ) | ||||||
| Cash flows from financing activities |
||||||||||||
| Common stock |
— | 292.0 | 81.8 | |||||||||
| Proceeds from long-term debt |
102.0 | 327.8 | 444.1 | |||||||||
| Repayment of long-term debt/Purchase in-lieu-of redemption |
(5.5 | ) | (292.5 | ) | (356.9 | ) | ||||||
| Net increase (decrease) in short-term debt |
26.0 | 4.0 | (23.0 | ) | ||||||||
| Dividends |
(179.6 | ) | (159.9 | ) | (166.1 | ) | ||||||
| Cash flows from (used in) financing activities |
(57.1 | ) | 171.4 | (20.1 | ) | |||||||
| Net increase (decrease) in cash and cash equivalents |
1.9 | (8.3 | ) | 6.8 | ||||||||
| Cash and cash equivalents at beginning of period |
3.6 | 11.9 | 5.1 | |||||||||
| Cash and cash equivalents at end of period |
$ | 5.5 | $ | 3.6 | $ | 11.9 | ||||||
| Supplemental disclosure of cash flow information |
||||||||||||
| Cash paid during the year for: |
||||||||||||
| Interest |
$ | 127.7 | $ | 120.9 | $ | 123.3 | ||||||
| Income taxes |
$ | 62.3 | $ | 18.4 | $ | 135.0 | ||||||
The accompanying notes are an integral part of the consolidated financial statements.
134
Table of Contents
Consolidated Statements of Retained Earnings
| (millions) For the years ended Dec. 31, |
2009 | 2008 | 2007 | ||||||
| Balance, beginning of year |
$ | 295.0 | $ | 295.6 | $ | 284.9 | |||
| Add: Net income |
192.1 | 162.7 | 176.8 | ||||||
| 487.1 | 458.3 | 461.7 | |||||||
| Deduct: |
|||||||||
| Implementation of accounting standards for post-retirement benefits |
— | 3.4 | — | ||||||
| Cash dividends on capital stock |
|||||||||
| Common |
179.6 | 159.9 | 166.1 | ||||||
| Balance, end of year |
$ | 307.5 | $ | 295.0 | $ | 295.6 | |||
The accompanying notes are an integral part of the consolidated financial statements.
Consolidated Statements of Capitalization
| (millions, except share amounts) |
Current Redemption Price |
Capital Stock Outstanding Dec. 31, |
Cash Dividends Paid (1) | |||||||||
| Shares | Amount | Per Share |
Amount | |||||||||
| Common stock—without par value |
||||||||||||
| 25 million shares authorized |
||||||||||||
| 2009 |
N/A | 10 | $ | 1,802.4 | (2) | $ | 179.6 | |||||
| 2008 |
N/A | 10 | $ | 1,802.4 | (2) | $ | 159.9 | |||||
| Preferred stock—$100 par value 1.5 million shares authorized, none outstanding. |
||||||||||||
| Preferred stock—no par 2.5 million shares authorized, none outstanding. |
||||||||||||
| Preference stock—no par 2.5 million shares authorized, none outstanding. |
||||||||||||
| (1) | Quarterly dividends paid on Feb. 27, May 28, Aug. 28 and Nov. 27 during 2009. |
Quarterly dividends paid on Feb. 28, May 28, Aug. 28 and Nov. 28 during 2008.
| (2) | Not meaningful. |
The accompanying notes are an integral part of the consolidated financial statements.
135
Table of Contents
TAMPA ELECTRIC COMPANY
Consolidated Statements of Capitalization—Continued
| Long-Term Debt (millions) Dec. 31, |
Due | 2009 | 2008 | |||||||||
| Tampa Electric |
Installment contracts payable (1): | |||||||||||
| 5.1% Refunding bonds (effective rate of 5.7%) |
2013 | $ | 60.7 | $ | 60.7 | |||||||
| 5.65% Refunding bonds (effective rate of 5.9%) (2) |
2018 | 54.2 | 54.2 | |||||||||
| Variable rate bonds repurchased in 2008 (5) |
2020 | — | — | |||||||||
| 5.5% Refunding bonds (effective rate of 6.2%) |
2023 | 86.4 | 86.4 | |||||||||
| 5.15% Refunding bonds (effective rate of 5.4%) (6) |
2025 | 51.6 | 51.6 | |||||||||
| Variable rate bonds repurchased in 2008 (5) |
2030 | — | — | |||||||||
| 5.0% Refunding bonds (effective rate of 5.9%) (7) |
2034 | 86.0 | 86.0 | |||||||||
| Notes (3): 6.875% (effective rate of 7.0%) |
2012 | 210.0 | 210.0 | |||||||||
| 6.375% (effective rate of 7.4%) |
2012 | 330.0 | 330.0 | |||||||||
| 6.25% (effective rate of 6.3%) (4) |
2014-2016 | 250.0 | 250.0 | |||||||||
| 6.10% (effective rate of 6.4%) |
2018 | 200.0 | 100.0 | |||||||||
| 6.55% (effective rate of 6.6%) |
2036 | 250.0 | 250.0 | |||||||||
| 6.15% (effective rate of 6.2%) |
2037 | 190.0 | 190.0 | |||||||||
| 1,768.9 | 1,668.9 | |||||||||||
| Peoples Gas System |
Senior Notes (3)(4): | |||||||||||
| 10.30% |
2009 | — | 1.8 | |||||||||
| 9.93% |
2010 | 1.0 | 2.0 | |||||||||
| 8.00% |
2010-2012 | 9.5 | 12.2 | |||||||||
| Notes (3): 6.875% (effective rate of 7.0%) | 2012 | 40.0 | 40.0 | |||||||||
| 6.375% (effective rate of 7.4%) |
2012 | 70.0 | 70.0 | |||||||||
| 6.10% (effective rate of 7.0%) |
2018 | 50.0 | 50.0 | |||||||||
| 6.15% (effective rate of 6.2%) |
2037 | 60.0 | 60.0 | |||||||||
| 230.5 | 236.0 | |||||||||||
| 1,999.4 | 1,904.9 | |||||||||||
| Unamortized debt premium (discount), net |
(1.3 | ) | (4.6 | ) | ||||||||
| 1,998.1 | 1,900.3 | |||||||||||
| Less amount due within one year |
3.7 | 5.5 | ||||||||||
| Total long-term debt |
1,994.4 | 1,894.8 | ||||||||||
| Total capital |
2,103.8 | 2,090.6 | ||||||||||
| Total capitalization |
$ | 4,098.2 | $ | 3,985.4 | ||||||||
The accompanying notes are an integral part of the consolidated financial statements.
| (1) | Tax-exempt securities. |
| (2) | These bonds were converted in March 2008 from an auction rate mode to a fixed rate mode through maturity on May 15, 2018. |
| (3) | These securities are subject to redemption in whole or in part, at any time, at the option of the company. |
| (4) | These long-term debt agreements contain various restrictive financial covenants. |
| (5) | In March 2008 these bonds, which were in auction rate mode, were purchased in lieu of redemption by Tampa Electric Company. These held variable rate bonds have par amounts of $20 million and $75 million due in 2020 and 2030, respectively. |
| (6) | These bonds were converted in March 2008 from an auction rate mode to a fixed rate mode for the term ending Sep. 1, 2013. |
| (7) | These bonds were converted in March 2008 from an auction rate mode to a fixed rate mode for the term ending Mar. 15, 2012. |
136
Table of Contents
TAMPA ELECTRIC COMPANY
Consolidated Statements of Capitalization—Continued
At Dec. 31, 2009, total long-term debt had a carrying amount of $1,999.4 million and an estimated fair market value of $2,115.4 million. At Dec. 31, 2008, total long-term debt had a carrying amount of $1,904.9 million and an estimated fair market value of $1,822.6 million. The estimated fair market value of long-term debt was based on quoted market prices for the same or similar issues, on the current rates offered for debt of the same remaining maturities, or for long-term debt issues with variable rates that approximate market rates, at carrying amounts. The carrying amount of long-term debt due within one year approximated fair market value because of the short maturity of these instruments (see Note 13).
A substantial part of the tangible assets of Tampa Electric is pledged as collateral for the first mortgage bonds issued under Tampa Electric’s first mortgage bond indentures. There are currently no bonds outstanding under Tampa Electric’s first mortgage bond indenture, and Tampa Electric could cause the lien associated with this indenture to be released at any time. Maturities and annual sinking fund requirements of long-term debt for the years 2010 through 2014 and thereafter are as follows:
Long-Term Debt Maturities
| Dec. 31, (millions) |
2010 | 2011 | 2012 | 2013 | 2014 | Thereafter | Total Long-term debt | ||||||||||||||
| Tampa Electric |
$ | — | $ | — | $ | 540.0 | $ | 60.7 | $ | 83.3 | $ | 1,084.9 | $ | 1,768.9 | |||||||
| PGS |
3.7 | 3.4 | 113.4 | — | — | 110.0 | 230.5 | ||||||||||||||
| Total long-term debt maturities |
$ | 3.7 | $ | 3.4 | $ | 653.4 | $ | 60.7 | $ | 83.3 | $ | 1,194.9 | $ | 1,999.4 | |||||||
The accompanying notes are an integral part of the consolidated financial statements.
137
Table of Contents
NOTES TO CONSOLIDATED FINANCIAL STATEMENTS
| 1. | Significant Accounting Policies |
The significant accounting policies are as follows:
Basis of Accounting
Tampa Electric Company maintains its accounts in accordance with recognized policies prescribed or permitted by the Florida Public Service Commission (FPSC) and the Federal Energy Regulatory Commission (FERC). These policies conform with generally accepted accounting principles (GAAP) in all material respects.
The impact of the accounting guidance for the effects of certain types of regulation has been minimal in the company’s experience, but when cost recovery is ordered over a period longer than a fiscal year, costs are recognized in the period that the regulatory agency recognizes them in accordance with this guidance.
The company’s retail and wholesale businesses are regulated by the FPSC and related FERC, respectively. Prices allowed by both agencies are generally based on recovery of prudent costs incurred plus a reasonable return on invested capital.
Principles of Consolidation
Tampa Electric Company is a wholly-owned subsidiary of TECO Energy, Inc., and is comprised of the Electric division, generally referred to as Tampa Electric, and the Natural Gas division, generally referred to as Peoples Gas System (PGS). All significant intercompany balances and intercompany transactions have been eliminated in consolidation. The use of estimates is inherent in the preparation of financial statements in accordance with GAAP. Actual results could differ from these estimates.
For entities that are determined to meet the definition of a variable interest entity (VIE), Tampa Electric Company obtains information, where possible, to determine if it is the primary beneficiary of the VIE. If Tampa Electric Company is determined to be the primary beneficiary, then the VIE is consolidated and a minority interest is recognized for any other third-party interests. If Tampa Electric Company is not the primary beneficiary, then the VIE is accounted for using the equity or cost method of accounting. In certain circumstances this can result in Tampa Electric Company consolidating entities in which it has less than a 50% equity investment and deconsolidating entities in which it has a majority equity interest (see Note 14).
Planned Major Maintenance
Tampa Electric and PGS expense major maintenance costs as incurred. Concurrent with a planned major maintenance outage, the cost of adding or replacing retirement units-of-property is capitalized in conformity with FPSC and FERC regulations.
Cash Equivalents
Cash equivalents are highly liquid, high-quality investments purchased with an original maturity of three months or less. The carrying amount of cash equivalents approximated fair market value because of the short maturity of these instruments.
Depreciation
Tampa Electric computes depreciation expense by applying composite, straight-line rates (approved by the state regulatory agency) to the investment in depreciable property. Total depreciation expense for the years ended Dec. 31, 2009, 2008 and 2007 was $239.5 million, $224.3 million and $215.5 million, respectively. There were no material plant acquisition adjustments in 2009, 2008 or 2007. The provision for total regulated utility plant in service, expressed as a percentage of the original cost of depreciable property was 3.6% for 2009 and 2008 and 3.7% for 2007. Construction work-in progress is not depreciated until the asset is completed or placed in service.
Allowance for Funds Used During Construction (AFUDC)
AFUDC is a non-cash credit to income with a corresponding charge to utility plant which represents the cost of borrowed funds and a reasonable return on other funds used for construction. The base on which AFUDC is calculated excludes construction work-in-progress which has been included in rate base and prior to May 2009, a $36 million threshold established in the company’s last rate case, but eliminated in the most recent proceeding. The rate used to calculate AFUDC is revised periodically to reflect significant changes in Tampa Electric’s cost of capital. The rate was 8.16% for May through December 2009 and 7.79% for January through April 2009 and all of 2008 and 2007. Total AFUDC for 2009, 2008 and 2007 was $13.8 million, $8.7 million and $6.2 million, respectively.
138
Table of Contents
TAMPA ELECTRIC COMPANY
NOTES TO CONSOLIDATED FINANCIAL STATEMENTS—(Continued)
Deferred Income Taxes
Tampa Electric Company utilizes the liability method in the measurement of deferred income taxes. Under the liability method, the temporary differences between the financial statement and tax bases of assets and liabilities are reported as deferred taxes measured at current tax rates. Tampa Electric and PGS are regulated, and their books and records reflect approved regulatory treatment, including certain adjustments to accumulated deferred income taxes and the establishment of a corresponding regulatory tax liability reflecting the amount payable to customers through future rates.
Investment Tax Credits
Investment tax credits have been recorded as deferred credits and are being amortized as reductions to income tax expense over the service lives of the related property.
Inventory
Tampa Electric Company values materials, supplies and fossil fuel inventory (coal, oil and natural gas) using a weighted-average cost method. These materials, supplies, and fuel inventories are carried at the lower of weighted-average cost or market, unless evidence indicates that the weighted-average cost (even if in excess of market) will be recovered with a normal profit upon sale in the ordinary course of business.
Revenue Recognition
Tampa Electric Company recognizes revenues consistent with the SEC’s Staff Accounting Bulletin (SAB) 104, Revenue Recognition in Financial Statements. Except as discussed below, Tampa Electric Company recognizes revenues on a gross basis when earned for the physical delivery of products or services and the risks and rewards of ownership have transferred to the buyer.
The regulated utilities’ (Tampa Electric and PGS) retail businesses and the prices charged to customers are regulated by the FPSC. Tampa Electric’s wholesale business is regulated by the FERC. See Note 3 for a discussion of significant regulatory matters and the applicability of the accounting for the effects of certain types of regulation to the company.
Revenues and Cost Recovery
Revenues include amounts resulting from cost recovery clauses which provide for monthly billing charges to reflect increases or decreases in fuel, purchased power, conservation and environmental costs for Tampa Electric and purchased gas, interstate pipeline capacity and conservation costs for PGS. These adjustment factors are based on costs incurred and projected for a specific recovery period. Any over- or under-recovery of costs plus an interest factor are taken into account in the process of setting adjustment factors for subsequent recovery periods. Over-recoveries of costs are recorded as regulatory liabilities, and under-recoveries of costs are recorded as regulatory assets.
Certain other costs incurred by the regulated utilities are allowed to be recovered from customers through prices approved in the regulatory process. These costs are recognized as the associated revenues are billed. The regulated utilities accrue base revenues for services rendered but unbilled to provide a closer matching of revenues and expenses (see Note 3). As of Dec. 31, 2009 and 2008, unbilled revenues of $51.6 million and $47.4 million, respectively, are included in the “Receivables” line item on Tampa Electric Company’s Consolidated Balance Sheets.
Tampa Electric purchases power on a regular basis primarily to meet the needs of its retail customers. Tampa Electric purchased power from non-TECO Energy affiliates at a cost of $177.6 million, $305.4 million and $271.9 million, for the years ended Dec. 31, 2009, 2008 and 2007, respectively. The prudently incurred purchased power costs at Tampa Electric have historically been recovered through an FPSC-approved cost recovery clause.
Accounting for Excise Taxes, Franchise Fees and Gross Receipts
Tampa Electric Company is allowed to recover certain costs incurred from customers through prices approved by the FPSC. The amounts included in customers’ bills for franchise fees and gross receipt taxes are included as revenues on the Consolidated Statements of Income. These amounts totaled $115.7 million, $109.2 million and $111.2 million, for the years ended Dec. 31, 2009, 2008 and 2007, respectively. Franchise fees and gross receipt taxes payable by the regulated utilities are included as an expense on the Consolidated Statements of Income in “Taxes, other than income”. For the years ended Dec. 31, 2009, 2008 and 2007, these totaled $115.6 million, $109.0 million and $110.9 million, respectively. Excise taxes paid by the regulated utilities are not material and are expensed as incurred.
139
Table of Contents
TAMPA ELECTRIC COMPANY
NOTES TO CONSOLIDATED FINANCIAL STATEMENTS—(Continued)
Asset Impairments
Tampa Electric Company applies the provisions of the accounting guidance for long-lived assets. The accounting guidance addresses accounting and reporting for the impairment or disposal of long-lived assets, including the disposal of a component of a business.
In accordance with the accounting guidance, the company assesses whether there has been an impairment of its long-lived assets and certain intangibles held and used by the company when such impairment indicators exist. Indicators of impairment did not exist for any long-lived asset.
Restrictions on Dividend Payments and Transfer of Assets
Certain long-term debt at PGS contains restrictions that limit the payment of dividends and distributions on the common stock of Tampa Electric Company. See Note 8 for additional information on significant financial covenants.
Receivables and Allowance for Uncollectible Accounts
Receivables consist of services billed to residential, commercial, industrial and other customers. An allowance for doubtful accounts is established based on Tampa Electric’s and PGS’s collection experience. Circumstances that could affect Tampa Electric’s and PGS’s estimates of uncollectible receivables include, but are not limited to, customer credit issues, the level of natural gas prices, customer deposits and general economic conditions. Accounts are written off once they are deemed to be uncollectible.
| 2. | New Accounting Pronouncements |
Measuring Liabilities at Fair Value
In August 2009, the FASB issued an accounting standards update that clarifies how to measure the fair value of a liability when there is not a quoted price in an active market for a liability. This update provides clarification that in circumstances in which a quoted price in an active market for the identical liability is not available, a reporting entity is required to measure fair value using alternative techniques including, but not limited to: 1) the quoted price of the identical liability when traded as an asset or 2) quoted prices for similar liabilities or similar liabilities when traded as assets. It was effective for the first reporting period beginning after issuance. The new requirement did not have an impact on the company’s results of operations, statement of position or cash flows.
The FASB Accounting Standards Codification and the Hierarchy of Generally Accepted Accounting Principles
In June 2009, the FASB issued guidance that names the FASB Accounting Standards Codification (Codification) as the single source of authoritative U.S. GAAP for non-governmental entities recognized by the FASB. It became effective in the third quarter and supersedes all U.S. GAAP accounting standards, aside from rules and interpretive releases issued by the SEC. The Codification is not intended to change GAAP; rather, it changes all referencing of U.S. GAAP including the notes to financial statements. Therefore, it did not have an impact on the company’s results of operations, statement of position or cash flows.
Variable Interest Entities
In June 2009, the FASB issued guidance that amended the analysis to determine the primary beneficiary of a VIE. It requires an enterprise to determine whether the enterprise’s variable interest or interests give it a controlling financial interest in a VIE. This analysis identifies the primary beneficiary of a VIE as the enterprise that has both 1) the power to direct the activities of a VIE that most significantly impact the entity’s economic performance, and 2) the obligation to absorb losses of the entity that could potentially be significant to the VIE or the right to receive benefits from the entity that could potentially be significant to the VIE.
This guidance is effective for fiscal years beginning after Nov. 15, 2009. The company adopted this guidance on Jan. 1, 2010. This new guidance does not have a significant impact on the company’s results of operations, statement of position or cash flows.
Subsequent Events
In May 2009, the FASB issued guidance that requires companies to disclose the date through which they evaluated subsequent events and whether that date corresponds with the filing of their financial statements. It became effective for fiscal periods ending after Jun. 15, 2009, and the adoption did not have an impact on the company’s results of operations, statement of position or cash flows.
140
Table of Contents
TAMPA ELECTRIC COMPANY
NOTES TO CONSOLIDATED FINANCIAL STATEMENTS—(Continued)
Fair Value Measurements
In September 2006, the FASB issued guidance that defines fair value, establishes a framework for measuring fair value under GAAP, and expands required disclosures about fair value measurements. The guidance emphasizes that fair value is a market-based measurement, not an entity-specific measurement, and states that a fair value measurement should be determined based on the assumptions that market participants would use in pricing the asset or liability. The guidance applies under other accounting pronouncements that require or permit fair value measurements.
The effective date was for fiscal years beginning after Nov. 15, 2007. In November of 2007, the FASB informally granted a one year deferral for non-financial assets and liabilities. In February 2008, the FASB formally delayed the effective date of the fair value guidance to fiscal years beginning after Nov. 15, 2008 for non-financial assets and non-financial liabilities except for items that are required to be recognized or disclosed at fair value at least annually in the company’s financial statements. As a result, the company adopted the fair value guidance effective Jan. 1, 2008 for financial assets and liabilities and Jan. 1, 2009 for non-financial assets and liabilities. No adoption adjustment was necessary. Financial assets and liabilities of the company measured at fair value include derivatives and certain investments, for which fair values are primarily based on observable inputs. Non-financial assets and liabilities of the company measured at fair value include asset retirement obligations (AROs) when they are incurred and any long-lived assets or equity-method investments that are impaired in a currently reported period.
In April 2009, the FASB issued additional guidance to address fair value valuation concerns in the current market environment. These concerns included applying the fair value model when the market for an asset is not active, when there are other-than-temporary impairments (OTTI) of debt and equity securities and when to include interim disclosures about the fair value of financial instruments.
When the market for an asset is not active, the newly issued guidance affirms that the objective of fair value is the price that would be received to sell the asset in an orderly transaction (that is, not a forced liquidation or distressed sale) between market participants at the measurement date in the inactive market. The determination of whether a transaction was not orderly should be based on the weight of the evidence. An entity is required to disclose a change in valuation technique and the related inputs resulting from the application of the new guidance and to quantify its impact. Retrospective application was not permitted. The new guidance became effective for interim and annual periods ending after Jun. 15, 2009. This did not materially affect the company’s results of operations, statement of position or cash flows.
The OTTI guidance is applicable to debt securities and requires that a company recognize the credit component of an OTTI in earnings and the remaining portion in other comprehensive income if management asserts it does not have the intent to sell the security and it is more likely than not it will not have to sell the security before recovery of its cost basis. It requires an entity to present, separately in the financial statement where the components of other comprehensive income are reported, the amounts recognized in accumulated other comprehensive income related to the noncredit portion of OTTI recognized for available-for-sale and held-to-maturity debt securities. Additionally, disclosure requirements were amended and are required for interim periods. The guidance became effective for interim and annual periods ending after Jun. 15, 2009 and did not materially affect the company’s results of operations, statement of position or cash flows.
Interim disclosures of fair value information, including methods and significant assumptions in measuring fair value, for financial instruments are required under the new guidance. The guidance became effective for interim and annual periods ending after Jun. 15, 2009 and had no impact on the company’s results of operations, statement of position or cash flows.
Employers’ Disclosures about Postretirement Benefit Plan Assets
In December 2008, the FASB issued guidance that requires enhanced disclosures about plan assets of defined benefit pension plans or other postretirement plans, including the concentrations of risk in those plans. The guidance was effective for fiscal years ending after Dec. 15, 2009 and is significant to the company’s financial statement disclosures but has no impact on the company’s results of operations, statement of position or cash flows.
In September 2009, the FASB issued an accounting standards update that allows reporting entities to use net asset value (NAV) as an estimate of fair value for certain investments. The guidance became effective for interim and annual periods ending after Dec. 15, 2009. The guidance had an impact on the company’s postretirement benefit plan footnote, as some of the company’s pension plan assets use NAV to estimate fair value.
141
Table of Contents
TAMPA ELECTRIC COMPANY
NOTES TO CONSOLIDATED FINANCIAL STATEMENTS—(Continued)
Disclosures about Derivative Instruments and Hedging Activities
In March 2008, the FASB issued guidance to enhance the disclosure framework for derivatives and hedging. Enhanced disclosures about the purpose of an entity’s derivative instruments, how derivative instruments and hedged items are accounted for, and how the entity’s financial position, cash flows and performance are enhanced by the derivative instruments and hedged items are required for fiscal years and interim periods beginning after Nov. 15, 2008. The guidance was significant to the company’s financial statement disclosures but had no impact on its results of operations, statement of position or cash flows.
Additionally, in April 2008, the FASB revised previously issued implementation guidance to reflect the enhanced disclosures required by the new guidance. These revisions are significant to the company’s financial statement disclosures but have no impact on its results of operations, statement of position or cash flows.
| 3. | Regulatory |
Tampa Electric’s and PGS’ retail businesses are regulated by the FPSC. Tampa Electric is subject to regulation by the Federal Energy Regulatory Commission (FERC) under the Public Utility Holding Company Act of 2005 (PUHCA 2005). However, pursuant to a waiver granted in accordance with the FERC’s regulations, TECO Energy is not subject to certain accounting, record-keeping and reporting requirements prescribed by the FERC’s regulations under PUHCA 2005. The operations of PGS are regulated by the FPSC separately from the regulation of Tampa Electric. The FPSC has jurisdiction over rates, service, issuance of securities, safety, accounting and depreciation practices and other matters. In general, the FPSC sets rates at a level that allows a utility such as PGS to collect total revenues (revenue requirements) equal to its cost of providing service, plus a reasonable return on invested capital.
Base Rates—Tampa Electric
In order for Tampa Electric to continue meeting customers’ growing needs for reliable, efficient and affordable electric service, Tampa Electric filed with the FPSC for a base rate increase in August 2008. In March 2009, the FPSC approved an increase to base rates, effective on May 7, 2009, of $104.3 million that reflected a return on equity of 11.25%, which is the middle of a range between 10.25% and 12.25%. Additionally, the FPSC approved a 2010 portion of the base rate increase of $33.5 million, subject to need and prudency, effective Jan. 1, 2010 for capital additions placed in service in 2009, bringing the total approved base rate increase to $137.8 million.
In May 2009, Tampa Electric filed a Motion for Reconsideration (Motion) regarding the calculation of the annual revenue requirements approved by the FPSC. In July 2009, the FPSC approved Tampa Electric’s Motion resulting in an overall weighted cost of capital of 8.29%, compared to the 8.11% previously approved. This change increased the previously approved $104.3 million to $113.6 million and the $33.5 million 2010 portion to $34.1 million, bringing the total approved base rate increase to $147.7 million.
In connection with the base rate request, the FPSC rejected the intervenors’ arguments that the approved 2010 increase for recovery of costs associated with five combustion turbines and rail facilities violated the intervenors due process rights, Florida Statutes or FPSC rules. On Sep. 14, 2009, the intervenors filed an appeal to the Florida Supreme Court. Tampa Electric will oppose this appeal and it is not expected to affect the timing of the increase. On Feb. 24, 2010, the intervenors filed appellate briefs. There is no specific time frame for a resolution. If the intervenors were to eventually prevail, there would be revenues subject to refund.
On Oct. 12, 2009, Tampa Electric filed its petition supporting the continuing need for the combustion turbines, the commercial in service of the equipment and the costs incurred to place the combustion turbines and rail facilities in service and requesting the proposed rates to be put into effect in January 2010 as authorized by the Commission. On Dec. 1, 2009 the Commission determined, based in part on its staff audit of the actual costs of the CTs, the 2010 portion should be reduced $8.4 million to $25.7 million, subject to refund. An evidentiary hearing will be held during 2010 regarding the continuing need for the CTs, the appropriate amount to be recovered and the resulting rates. The increase in base rates became effective in January 2010 as ordered by the FPSC, subject to refund.
Base Rates—PGS
Recognizing the significant decline in ROE, PGS filed with the FPSC for a $3.7 million interim rate increase in August 2008. The FPSC approved an interim rate increase of $2.4 million effective Oct. 29, 2008. PGS also filed in August 2008 with the FPSC for a $26.5 million base rate increase. On May 5, 2009, the FPSC approved a base rate increase of $19.2 million that became effective on Jun. 18, 2009 and reflects a return on equity of 10.75%, which is the middle of a range between 9.75% and 11.75%. The allowed equity in capital structure is 54.7% from all investor sources of capital on an allowed rate base of $560.8 million.
142
Table of Contents
TAMPA ELECTRIC COMPANY
NOTES TO CONSOLIDATED FINANCIAL STATEMENTS—(Continued)
Cost Recovery—Tampa Electric
Tampa Electric’s fuel, purchased power, conservation and certain environmental costs are recovered through levelized monthly charges established pursuant to the FPSC’s cost recovery clauses. These charges, which are reset annually in an FPSC proceeding, are based on estimated costs of fuel, environmental compliance, conservation programs and purchased power and estimated customer usage for a specific recovery period, with a true-up adjustment to reflect the variance of actual costs from the projected costs. The FPSC may disallow recovery of any costs that it considers imprudently incurred.
The FPSC determined in 2004 and 2005 that it was appropriate for Tampa Electric to recover SCR operating costs through the ECRC as well as earn a return on its SCR investment installed on Big Bend Units 1 through 4 for NOx control in compliance with the environmental consent decree. The SCRs for Big Bend Units 4, 3 and 2 entered service in 2007, 2008 and 2009, respectively, and cost recovery started in 2007, 2008 and 2009, respectively. The SCR for Big Bend Unit 1 is scheduled to enter service in May 2010, and cost recovery for the capital investment will commence in 2010.
Cost Recovery—PGS
PGS recovers the costs it pays for gas supply and interstate transportation for system supply through the purchased gas adjustment (PGA) clause. This charge is designed to recover the costs incurred by PGS for purchased gas, and for holding and using interstate pipeline capacity for the transportation of gas it delivers to its customers. These charges may be adjusted monthly based on a cap approved annually by the FPSC. The cap is based on estimated costs of purchased gas and pipeline capacity, and estimated customer usage for a specific recovery period, with a true-up adjustment to reflect the variance of actual costs and usage from the projected charges for prior periods. In November, the FPSC approved the PGS annual purchased gas adjustment cap factor for January 2010 through December 2010.
In addition to PGS’ base rates and purchased gas adjustment clause charges, PGS customers (except interruptible customers) also pay a per-therm conservation charge for all gas. This charge is intended to permit PGS to recover its costs incurred in developing and implementing energy conservation programs, which are mandated by Florida law and approved and supervised by the FPSC. PGS is permitted to recover, on a dollar-for-dollar basis, prudently incurred expenditures made in connection with these programs if it demonstrates that the programs are cost effective for its ratepayers. The FPSC requires natural gas utilities to offer transportation-only service to all non-residential customers. As a result, PGS receives its base rate for distribution regardless of whether a customer decides to opt for transportation-only service or continue bundled service. As of Dec. 31, 2009, PGS had approximately 15,250 transportation-only customers out of 31,400 eligible customers.
In addition to economic regulation, PGS is subject to the FPSC’s safety jurisdiction, pursuant to which the FPSC regulates the construction, operation and maintenance of PGS’ distribution system. In general, the FPSC has implemented this by adopting the Minimum Federal Safety Standards and reporting requirements for pipeline facilities and transportation of gas prescribed by the U.S. Department of Transportation in Parts 191, 192 and 199, Title 49, Code of Federal Regulations.
PGS is also subject to federal, state and local environmental laws and regulations pertaining to air and water quality, land use, noise and aesthetics, solid waste and other environmental matters.
Other Items
Storm Damage Cost Recovery
Tampa Electric accrues $8.0 million annually effective May 2009, an increase of $4.0 million from the prior year, to a FERC-authorized and FPSC-approved self-insured storm damage reserve. This reserve was created after Florida’s investor owned utilities (IOUs) were unable to obtain transmission and distribution insurance coverage due to destructive acts of nature. Tampa Electric’s storm reserve was $29.3 million and $22.7 million as of Dec. 31, 2009 and 2008, respectively.
Regulatory Assets and Liabilities
Tampa Electric and PGS maintain their accounts in accordance with recognized policies of the FPSC. In addition, Tampa Electric maintains its accounts in accordance with recognized policies prescribed or permitted by the FERC.
Tampa Electric and PGS apply the accounting standards for regulated operations. Areas of applicability include: deferral of revenues under approved regulatory agreements; revenue recognition resulting from cost recovery clauses that provide for monthly billing charges to reflect increases or decreases in fuel, purchased power, conservation and environmental costs; and the deferral of costs as regulatory assets to the period that the regulatory agency recognizes them when cost recovery is ordered over a period longer than a fiscal year.
143
Table of Contents
TAMPA ELECTRIC COMPANY
NOTES TO CONSOLIDATED FINANCIAL STATEMENTS—(Continued)
Details of the regulatory assets and liabilities as of Dec. 31, 2009 and 2008 are presented in the following table:
Regulatory Assets and Liabilities
| (millions) |
Dec. 31, 2009 |
Dec. 31, 2008 | ||||
| Regulatory assets: |
||||||
| Regulatory tax asset (1) |
$ | 69.0 | $ | 65.1 | ||
| Other: |
||||||
| Cost recovery clauses |
89.4 | 266.8 | ||||
| Post-retirement benefit asset |
229.1 | 220.3 | ||||
| Deferred bond refinancing costs (2) |
18.0 | 21.7 | ||||
| Environmental remediation |
21.2 | 10.8 | ||||
| Competitive rate adjustment |
3.1 | 4.7 | ||||
| Other |
15.0 | 8.5 | ||||
| Total other regulatory assets |
375.8 | 532.8 | ||||
| Total regulatory assets |
444.8 | 597.9 | ||||
| Less: Current portion |
109.2 | 272.6 | ||||
| Long-term regulatory assets |
$ | 335.6 | $ | 325.3 | ||
| Regulatory liabilities: |
||||||
| Regulatory tax liability (1) |
$ | 19.6 | $ | 17.5 | ||
| Other: |
||||||
| Cost recovery clauses |
61.4 | 3.4 | ||||
| Environmental remediation |
19.9 | 10.6 | ||||
| Transmission and delivery storm reserve |
29.3 | 22.7 | ||||
| Deferred gain on property sales (3) |
2.8 | 4.1 | ||||
| Accumulated reserve-cost of removal |
554.3 | 551.2 | ||||
| Other |
0.7 | 0.4 | ||||
| Total other regulatory liabilities |
668.4 | 592.4 | ||||
| Total regulatory liabilities |
688.0 | 609.9 | ||||
| Less: Current portion |
85.4 | 21.7 | ||||
| Long-term regulatory liabilities |
$ | 602.6 | $ | 588.2 | ||
| (1) | Related to plant life and derivative positions. |
| (2) | Amortized over the term of the related debt instrument. |
| (3) | Amortized over a 5-year period with various ending dates. |
All regulatory assets are being recovered through the regulatory process. The following table further details our regulatory assets and the related recovery periods:
Regulatory assets
| (millions) Dec. 31, |
2009 | 2008 | ||||
| Clause recoverable (1) |
$ | 92.5 | $ | 271.5 | ||
| Components of rate base (2) |
238.1 | 227.7 | ||||
| Regulatory tax assets (3) |
69.0 | 65.1 | ||||
| Capital structure and other (3) |
45.2 | 33.6 | ||||
| Total |
$ | 444.8 | $ | 597.9 | ||
| (1) | To be recovered through cost recovery clauses approved by the FPSC on a dollar for dollar basis in the next year. |
| (2) | Primarily reflects allowed working capital, which is included in rate base and earns a rate of return as permitted by the FPSC. |
| (3) | “Regulatory tax assets” and “Capital structure and other” regulatory assets have a recoverable period longer than a fiscal year and are recognized over the period authorized by the regulatory agency. Also included are unamortized bond refinancing costs which are amortized over the life of the related debt instruments. See footnotes 1 and 2 in the prior table for additional information. |
144
Table of Contents
TAMPA ELECTRIC COMPANY
NOTES TO CONSOLIDATED FINANCIAL STATEMENTS—(Continued)
| 4. | Income Tax Expense |
Tampa Electric Company is included in the filing of a consolidated federal income tax return with TECO Energy and its affiliates. Tampa Electric Company’s income tax expense is based upon a separate return computation. For the three years presented, Tampa Electric Company’s effective tax rate differs from the statutory rate principally due to state income taxes, amortization of investment tax credits, and AFUDC equity benefit. The decrease in the 2009 effective tax rate compared to 2008 is principally due to a favorable tax adjustment to deferred tax balances recorded in prior years and increased AFUDC equity benefit offset by increased state income taxes, an uncertain tax position reserve and lower investment tax credit.
Income tax expense consists of the following components:
Income Tax Expense
| (millions) |
Federal | State | Total | |||||||||
| 2009 |
||||||||||||
| Currently payable |
$ | 24.4 | $ | 14.5 | $ | 38.9 | ||||||
| Deferred |
71.7 | 1.5 | 73.2 | |||||||||
| Amortization of investment tax credits |
(0.4 | ) | — | (0.4 | ) | |||||||
| Total income tax expense |
$ | 95.7 | $ | 16.0 | $ | 111.7 | ||||||
| Included in other income, net |
(0.8 | ) | ||||||||||
| Included in operating expenses |
$ | 110.9 | ||||||||||
| 2008 |
||||||||||||
| Currently payable |
$ | 18.8 | $ | 5.5 | $ | 24.3 | ||||||
| Deferred |
67.0 | 8.8 | 75.8 | |||||||||
| Amortization of investment tax credits |
(0.9 | ) | — | (0.9 | ) | |||||||
| Total income tax expense |
$ | 84.9 | $ | 14.3 | $ | 99.2 | ||||||
| Included in other income, net |
(1.4 | ) | ||||||||||
| Included in operating expenses |
$ | 97.8 | ||||||||||
| 2007 |
||||||||||||
| Currently payable |
$ | 128.5 | $ | 21.2 | $ | 149.7 | ||||||
| Deferred |
(39.2 | ) | (6.4 | ) | (45.6 | ) | ||||||
| Amortization of investment tax credits |
(2.5 | ) | — | (2.5 | ) | |||||||
| Total income tax expense |
$ | 86.8 | $ | 14.8 | $ | 101.6 | ||||||
| Included in other income, net |
(1.8 | ) | ||||||||||
| Included in operating expenses |
$ | 99.8 | ||||||||||
145
Table of Contents
TAMPA ELECTRIC COMPANY
NOTES TO CONSOLIDATED FINANCIAL STATEMENTS—(Continued)
Deferred taxes result from temporary differences in the recognition of certain liabilities or assets for tax and financial reporting purposes. The principal components of Tampa Electric Company’s deferred tax assets and liabilities recognized in the balance sheet are as follows:
Deferred Income Tax Assets and Liabilities
| (millions) As of Dec. 31, |
2009 | 2008 | ||||||
| Deferred income tax assets (1) |
||||||||
| Medical benefits |
$ | 45.8 | $ | 47.6 | ||||
| Insurance reserves |
22.9 | 20.5 | ||||||
| Investment tax credits |
6.1 | 7.0 | ||||||
| Hedging activities |
3.9 | 4.3 | ||||||
| Pension and post-retirement benefits |
88.3 | 85.0 | ||||||
| Other |
28.6 | 22.5 | ||||||
| Total deferred income tax assets |
$ | 195.6 | $ | 186.9 | ||||
| Deferred income tax liabilities (1) |
||||||||
| Property related |
$ | (620.4 | ) | $ | (521.4 | ) | ||
| Deferred fuel |
(21.5 | ) | (52.9 | ) | ||||
| Pension and post-retirement benefits |
(88.3 | ) | (85.0 | ) | ||||
| Pension |
(25.1 | ) | (11.8 | ) | ||||
| Total deferred income tax liabilities |
$ | (755.3 | ) | $ | (671.1 | ) | ||
| Net deferred income tax liability |
$ | (559.7 | ) | $ | (484.2 | ) | ||
| (1) | Certain property related assets and liabilities have been netted. |
Deferred income tax assets and liabilities above are included in the balance sheet as follows:
| (millions) As of Dec. 31, |
2009 | 2008 | ||||||
| Current deferred tax liabilities |
$ | (15.9 | ) | $ | (36.6 | ) | ||
| Non-current deferred tax liabilities |
(543.8 | ) | (447.6 | ) | ||||
| Total |
$ | (559.7 | ) | $ | (484.2 | ) | ||
The total income tax provisions differ from amounts computed by applying the federal statutory tax rate to income before income taxes for the following reasons:
Effective Income Tax Rate
| (millions) |
2009 | 2008 | 2007 | |||||||||
| Income tax expense at federal statutory rate of 35% |
$ | 106.3 | $ | 91.7 | $ | 97.4 | ||||||
| Increase (decrease) due to |
||||||||||||
| State income tax, net of federal income tax |
10.3 | 9.3 | 9.5 | |||||||||
| Equity portion of AFUDC |
(3.2 | ) | (2.2 | ) | (1.5 | ) | ||||||
| Domestic production deduction |
— | — | (2.8 | ) | ||||||||
| Other |
(1.7 | ) | 0.4 | (1.0 | ) | |||||||
| Total income tax expense on consolidated statements of income |
$ | 111.7 | $ | 99.2 | $ | 101.6 | ||||||
| Income tax expense as a percent of income from continuing operations, before income taxes |
36.8 | % | 37.9 | % | 36.5 | % | ||||||
The company accounts for uncertain tax positions as required by FASB accounting guidance. This guidance addresses the determination of whether tax benefits claimed or expected to be claimed on a tax return should be recorded in the financial statements. Under the guidance, Tampa Electric Company may recognize the tax benefit from an uncertain tax position only if it is more likely than not that the tax position will be sustained on examination by the taxing authorities, based on the technical merits of the position. The tax benefits recognized in the financial statements from such a position should be measured based on the largest benefit that has a greater than fifty percent likelihood of being realized upon ultimate settlement. The guidance also provides guidance on derecognition, classification, interest and penalties on income taxes, accounting in interim periods and requires increased disclosures. Tampa Electric Company adopted the guidance effective Jan. 1, 2007 with no impact.
146
Table of Contents
TAMPA ELECTRIC COMPANY
NOTES TO CONSOLIDATED FINANCIAL STATEMENTS—(Continued)
A reconciliation of the beginning and ending amount of unrecognized tax benefits is as follows:
| (millions) |
2009 | ||
| Balance at Jan. 1 |
$ | — | |
| Increases due to tax positions related to prior years |
0.7 | ||
| Increases due to tax positions related to current year |
— | ||
| Decreases due to tax positions related to prior years |
— | ||
| Decreases due to tax positions related to current year |
— | ||
| Decreases due to settlements with taxing authorities |
— | ||
| Decreases due to payments to taxing authorities |
— | ||
| Decreases due to expiration of statute of limitations |
— | ||
| Balance at Dec. 31 |
$ | 0.7 | |
The company recognizes interest and penalties associated with uncertain tax positions in “Operation other expense—Other” in the Consolidated Statements of Income. In 2009, the company recorded $28,000 of pre-tax charges for interest only. Additionally, the company has recorded $28,000 of interest on the balance sheet as of Dec. 31, 2009. No amounts have been recorded for penalties.
The Internal Revenue Service (IRS) concluded its examination of federal income tax returns for the year 2008 during 2009. The IRS proposed an audit adjustment relating to the recovery of environmental costs, which the Company formally appealed in January 2010. The company anticipates the appeal could take a few years to resolve and believes that it has provided an adequate reserve related to this matter. The U.S. federal statute of limitations remains open for the year 2006 and onward. Year 2009 is currently under examination by the IRS under the Compliance Assurance Program, a program in which TECO Energy is a participant. Florida’s statute of limitations is 3 years from the filing of an income tax return. The state impact of any federal changes remains subject to examination by various states for a period of up to one year after formal notification to the states. Years still open to examination by Florida’s tax authorities include 2006 and onward. The company does not expect the settlement of audit examinations to significantly change the total amount of unrecognized tax benefits within the next 12 months.
| 5. | Employee Postretirement Benefits |
Tampa Electric Company recognizes in its statement of financial position the over-funded or under-funded status of its postretirement benefit plans. This status is measured as the difference between the fair value of plan assets and the projected benefit obligation (PBO) in the case of its defined benefit plan, or the accumulated postretirement benefit obligation (APBO) in the case of its other postretirement benefit plan. As a result of the application of the accounting guidance for certain types of regulation, changes in the funded status are reflected, net of estimated tax benefits, in the benefit liabilities and regulatory assets. The results of operations are not impacted.
Pension Benefits
Tampa Electric Company is a participant in the comprehensive retirement plans of TECO Energy, including a non-contributory defined benefit retirement plan that covers substantially all employees. Benefits are based on employees’ age, years of service and final average earnings. Where appropriate and reasonably determinable, the portion of expenses, income, gains or losses allocable to Tampa Electric Company are presented. Otherwise, such amounts presented reflect the amount allocable to all participants of the TECO Energy retirement plans.
The Pension Protection Act of 2006 (PPA), became effective Jan. 1, 2008 and requires companies to, among other things, maintain certain defined minimum funding thresholds (or face plan benefit restrictions), pay higher premiums to the Pension Benefit Guaranty Corporation if they sponsor defined benefit plans, amend plan documents and provide additional plan disclosures in regulatory filings and to plan participants.
The Worker, Retiree, and Employer Recovery Act of 2008 (WRERA) was signed into law on Dec. 23, 2008. WRERA grants plan sponsors relief from certain funding requirements and benefits restrictions, and also provides some technical corrections to the PPA. There are two primary provisions that impact funding results for TECO Energy. First, for plans funded less than 100%, required shortfall contributions will be based on a percentage of the funding target until 2011, rather than the funding target of 100%. These percentages are 94% and 96% in 2009 and 2010, respectively. Second, one of the technical corrections, referred to as asset smoothing, allows the use of asset averaging subject to certain limitations in the determination of funding requirements. The Jan. 1, 2010 estimate assumes adoption of the asset smoothing methodology under WRERA and includes an additional 2009 plan year contribution expected to be made in 2010.
147
Table of Contents
TAMPA ELECTRIC COMPANY
NOTES TO CONSOLIDATED FINANCIAL STATEMENTS—(Continued)
For the year ended Dec. 31, 2009, TECO Energy’s pension plan experienced actual asset returns of approximately 19.8%. The qualified pension plan’s actuarial value of assets, including credit balance, was 103.67% of the PPA funded target as of Jan. 1, 2009 and is estimated at 90% of the PPA funded target as of Jan. 1, 2010.
Amounts disclosed for pension benefits also include the unfunded obligations for the supplemental executive retirement plan (SERP). This is a non-qualified, non-contributory defined benefit retirement plan available to certain members of senior management.
Other Postretirement Benefits
TECO Energy and its subsidiaries currently provide certain postretirement health care and life insurance benefits for substantially all employees retiring after age 50 meeting certain service requirements. Where appropriate and reasonably determinable, the portion of expenses, income, gains or losses allocable to Tampa Electric Company are presented. Otherwise, such amounts presented reflect the amount allocable to all participants of the TECO Energy postretirement health care and life insurance plans. Postretirement benefit levels are substantially unrelated to salary. The company reserves the right to terminate or modify the plans in whole or in part at any time.
On Dec. 8, 2003, the Medicare Prescription Drug, Improvement and Modernization Act of 2003 (the MMA) was signed into law. Beginning in 2006, the MMA added prescription drug coverage to Medicare, with a 28% tax-free subsidy to encourage employers to retain their prescription drug programs for retirees, along with other key provisions. TECO Energy’s current retiree medical program for those eligible for Medicare (generally over age 65) includes coverage for prescription drugs. The company has determined that prescription drug benefits available to certain Medicare-eligible participants under its defined-dollar-benefit postretirement health care plan are at least “actuarially equivalent” to the standard drug benefits that are offered under Medicare Part D.
On May 19, 2004, the FASB issued accounting and disclosure requirements related to the MMA. The guidance requires (a) that the effects of the federal subsidy be considered an actuarial gain and recognized in the same manner as other actuarial gains and losses and (b) certain disclosures for employers that sponsor postretirement health care plans that provide prescription drug benefits. TECO Energy and its subsidiaries adopted this guidance retroactive for the second quarter of 2004.
The company received subsidy payments under Part D for the 2007 and 2008 plan years. Its 2009 Part D subsidy application with the Centers for Medicare and Medicaid Services (CMS) was approved in Dec. 2008 and the company expects to receive the payment later this year.
148
Table of Contents
TAMPA ELECTRIC COMPANY
NOTES TO CONSOLIDATED FINANCIAL STATEMENTS—(Continued)
TECO Energy Consolidated
Obligations and Funded Status
| Pension Benefits | Other Benefits | |||||||||||||||
| (millions) |
2009 | 2008 | 2009 | 2008 | ||||||||||||
| Change in benefit obligation |
||||||||||||||||
| Net benefit obligation at prior measurement date (1) |
$ | 555.4 | $ | 557.2 | $ | 188.9 | $ | 195.7 | ||||||||
| Effect of eliminating early measurement date |
n/a | 4.8 | n/a | 1.4 | ||||||||||||
| Service cost |
15.7 | 15.4 | 2.9 | 4.1 | ||||||||||||
| Interest cost |
33.7 | 31.9 | 11.2 | 12.0 | ||||||||||||
| Plan participants’ contributions |
— | — | 3.5 | 3.8 | ||||||||||||
| Actuarial (gain) loss |
29.6 | 3.3 | 16.6 | (5.7 | ) | |||||||||||
| Plan amendments |
0.4 | — | — | (9.4 | ) | |||||||||||
| Curtailment |
(0.8 | ) | — | — | — | |||||||||||
| Special termination benefits |
— | — | — | — | ||||||||||||
| Gross benefits paid |
(46.3 | ) | (54.5 | ) | (16.4 | ) | (13.8 | ) | ||||||||
| Settlements |
— | (2.7 | ) | — | — | |||||||||||
| Federal subsidy on benefits paid |
n/a | n/a | 0.9 | 0.8 | ||||||||||||
| Net benefit obligation at measurement date (1) |
$ | 587.7 | $ | 555.4 | $ | 207.6 | $ | 188.9 | ||||||||
| Change in plan assets |
||||||||||||||||
| Fair value of plan assets at prior measurement date (1) |
$ | 360.7 | $ | 492.7 | $ | — | $ | — | ||||||||
| Effect of eliminating early measurement date |
n/a | 28.4 | n/a | — | ||||||||||||
| Actual return on plan assets (2) |
66.3 | (119.1 | ) | — | — | |||||||||||
| Employer contributions |
8.2 | 15.9 | 12.9 | 10.0 | ||||||||||||
| Plan participants’ contributions |
— | — | 3.5 | 3.8 | ||||||||||||
| Settlements |
— | (2.7 | ) | — | — | |||||||||||
| Gross benefits paid |
(46.3 | ) | (54.5 | ) | (16.4 | ) | (13.8 | ) | ||||||||
| Fair value of plan assets at measurement date (1) |
$ | 388.9 | $ | 360.7 | $ | — | $ | — | ||||||||
| Funded status |
||||||||||||||||
| Fair value of plan assets (3) |
$ | 388.9 | $ | 360.7 | $ | — | $ | — | ||||||||
| Benefit obligation (PBO/APBO) |
587.7 | 555.4 | 207.6 | 188.9 | ||||||||||||
| Funded status at measurement date (1) |
(198.8 | ) | (194.7 | ) | (207.6 | ) | (188.9 | ) | ||||||||
| Net contributions after measurement date |
— | — | — | — | ||||||||||||
| Unrecognized net actuarial loss |
228.7 | 237.2 | 18.3 | 1.0 | ||||||||||||
| Unrecognized prior service (benefit) cost |
(2.1 | ) | (2.7 | ) | 6.5 | 7.3 | ||||||||||
| Unrecognized net transition (asset) obligation |
— | — | 6.5 | 8.8 | ||||||||||||
| Accrued liability at end of year |
$ | 27.8 | $ | 39.8 | $ | (176.3 | ) | $ | (171.8 | ) | ||||||
| Amounts Recognized in Balance Sheet |
||||||||||||||||
| Regulatory assets |
$ | 181.7 | $ | 186.3 | $ | 47.4 | $ | 34.0 | ||||||||
| Accrued benefit costs and other current liabilities |
(7.2 | ) | (1.8 | ) | (13.4 | ) | (13.6 | ) | ||||||||
| Deferred credits and other liabilities |
(191.6 | ) | (193.0 | ) | (194.2 | ) | (175.3 | ) | ||||||||
| Accumulated other comprehensive loss (income) (pretax) |
44.9 | 48.3 | (16.1 | ) | (16.9 | ) | ||||||||||
| Net amount recognized at end of year |
$ | 27.8 | $ | 39.8 | $ | (176.3 | ) | $ | (171.8 | ) | ||||||
| (1) | The measurement dates were Dec. 31, 2009 and Dec. 31, 2008. |
| (2) | The actual return on plan assets differed from expectations due to general market conditions. |
| (3) | The Market Related Value (MRV) of plan assets is used as the basis for calculating the expected return on plan assets (EROA) component of periodic pension expense. MRV reflects the fair value of plan assets adjusted for experience gains and losses (i.e. the differences between actual investment returns and expected returns) spread over five years. |
149
Table of Contents
TAMPA ELECTRIC COMPANY
NOTES TO CONSOLIDATED FINANCIAL STATEMENTS—(Continued)
Tampa Electric Company
Amounts recognized in balance sheet
| Pension Benefits | Other Benefits | |||||||||||||||
| (millions) |
2009 | 2008 | 2009 | 2008 | ||||||||||||
| Regulatory assets |
$ | 181.7 | $ | 186.3 | $ | 47.4 | $ | 34.0 | ||||||||
| Accrued benefit costs and other current liabilities |
(6.0 | ) | (1.1 | ) | (10.5 | ) | (10.1 | ) | ||||||||
| Deferred credits and other liabilities |
(150.8 | ) | (152.0 | ) | (151.2 | ) | (134.3 | ) | ||||||||
| $ | 24.9 | $ | 33.2 | $ | (114.3 | ) | $ | (110.4 | ) | |||||||
The accumulated benefit obligation for TECO Energy Consolidated defined benefit pension plans was $530.1 million at Dec. 31, 2009 and $504.9 million at Dec. 31, 2008.
Assumptions used to determine benefit obligations at Dec. 31, 2009 and 2008:
| Pension Benefits | Other Benefits | |||||||||||
| 2009 | 2008 | 2009 | 2008 | |||||||||
| Discount rate |
5.75 | % | 6.05 | % | 5.60 | % | 6.05 | % | ||||
| Rate of compensation increase |
4.25 | % | 4.25 | % | 4.25 | % | 4.25 | % | ||||
| Healthcare cost trend rate |
||||||||||||
| Initial rate |
n/a | n/a | 8.00 | % | 8.50 | % | ||||||
| Ultimate rate |
n/a | n/a | 5.00 | % | 5.00 | % | ||||||
| Year rate reaches ultimate |
n/a | n/a | 2016 | 2015 | ||||||||
A one-percentage-point change in assumed health care cost trend rates would have the following effect on Tampa Electric Company’s benefit obligation:
| (millions) |
Increase | Decrease | |||||
| Effect on postretirement benefit obligation |
$ | 5.9 | $ | (4.8 | ) | ||
Components of TECO Energy consolidated net periodic benefit cost
| (millions) |
Pension Benefits | Other Benefits | |||||||||||||||||||
| 2009 (1) | 2008 (1) | 2007 (2) | 2009 (1) | 2008 (1) | 2007 (2) | ||||||||||||||||
| Service cost |
$ | 15.7 | $ | 15.4 | $ | 16.0 | $ | 2.9 | $ | 4.1 | $ | 5.3 | |||||||||
| Interest cost |
33.6 | 31.9 | 33.0 | 11.3 | 12.0 | 12.2 | |||||||||||||||
| Expected return on plan assets |
(37.8 | ) | (39.0 | ) | (36.3 | ) | — | — | — | ||||||||||||
| Amortization of: |
|||||||||||||||||||||
| Actuarial loss |
8.7 | 4.0 | 9.1 | — | — | — | |||||||||||||||
| Prior service (benefit) cost |
(0.4 | ) | (0.4 | ) | (0.5 | ) | 0.8 | 1.8 | 2.8 | ||||||||||||
| Transition (asset) obligation |
— | — | — | 2.3 | 2.3 | 2.5 | |||||||||||||||
| Curtailment loss |
0.2 | — | (0.4 | ) | — | — | 6.4 | ||||||||||||||
| Settlement loss |
— | 0.9 | — | — | — | — | |||||||||||||||
| Net periodic benefit cost |
$ | 20.0 | $ | 12.8 | $ | 20.9 | $ | 17.3 | $ | 20.2 | $ | 29.2 | |||||||||
| (1) | Benefit Cost was measured for the twelve months ended Dec. 31, 2009 and 2008. The company elected a 15-month transition approach allowed by accounting standards for employer’s defined benefit pension and other post-retirement plans to move from an early measurement date of Sep. 30, 2007 to a year end measurement date of Dec. 31, 2008. In connection with this election, the company recorded after-tax charges to Retained Earnings of $2.2 million for Pensions and $3.1 million for Other Postretirement Benefits in the fourth quarter of 2008. |
| (2) | Benefit Cost was measured for the twelve months ended Sep. 30, 2007. |
In addition to the costs shown above, $0.6 million of special termination benefit costs were recognized in 2007 related to pension benefits. Tampa Electric Company’s portion of the net periodic benefit costs for pension benefits was $15.4 million, $8.4 million and $14.1 million for 2009, 2008 and 2007, respectively. Tampa Electric Company’s portion of the net periodic benefit costs for other benefits was $13.6 million, $13.9 million and $14.5 million for 2009, 2008 and 2007, respectively.
150
Table of Contents
TAMPA ELECTRIC COMPANY
NOTES TO CONSOLIDATED FINANCIAL STATEMENTS—(Continued)
The estimated net loss and prior service benefit for the defined benefit pension plans that will be amortized by Tampa Electric Company from regulatory assets into net periodic benefit cost over the next fiscal year are $10.2 million and $0.5 million. The estimated prior service cost and transition obligation for the other postretirement benefit plan that will be amortized from regulatory asset into net periodic benefit cost over the next fiscal year totals $1.0 million and $1.8 million, respectively.
Assumptions used to determine net periodic benefit cost for years ended Dec. 31,
| Pension Benefits | Other Benefits | |||||||||||||||||
| 2009 | 2008 | 2007 | 2009 | 2008 | 2007 | |||||||||||||
| Discount rate |
6.05 | % | 6.20 | % | 5.85 | % | 6.05 | % | 6.20 | % | 5.85 | % | ||||||
| Expected long-term return on plan assets |
8.25 | % | 8.25 | % | 8.25 | % | n/a | n/a | n/a | |||||||||
| Rate of compensation increase |
4.25 | % | 4.25 | % | 4.00 | % | 4.25 | % | 4.25 | % | 4.00 | % | ||||||
| Healthcare cost trend rate |
||||||||||||||||||
| Initial rate |
n/a | n/a | n/a | 8.50 | % | 9.25 | % | 9.50 | % | |||||||||
| Ultimate rate |
n/a | n/a | n/a | 5.00 | % | 5.25 | % | 5.25 | % | |||||||||
| Year rate reaches ultimate |
n/a | n/a | n/a | 2016 | 2016 | 2015 | ||||||||||||
The discount rate assumption was based on a cash flow matching technique developed by our outside actuaries and a review of current economic conditions. This technique matches the yields from high-quality (Aa-graded, non-callable) corporate bonds to the company’s projected cash flows for the benefit plans to develop a present value that is converted to a discount rate.
The expected return on assets assumption was based on historical returns, fixed income spreads and equity premiums consistent with our portfolio and asset allocation. A change in asset allocations could have a significant impact on the expected return on assets. Additionally, expectations of long-term inflation, real growth in the economy and a provision for active management and expenses paid were incorporated in the assumption. For the year ended Dec. 31, 2009, TECO Energy’s pension plan experienced actual asset returns of approximately 19.8%.
The compensation increase assumption was based on the same underlying expectation of long-term inflation together with assumptions regarding real growth in wages and company-specific merit and promotion increases.
A one-percentage-point change in assumed health care cost trend rates would have the following effect on Tampa Electric Company’s expense:
| (millions) |
1% Increase |
1% Decrease |
|||||
| Effect on periodic cost |
$ | 0.3 | $ | (0.2 | ) | ||
Pension Assets
Pension plan assets (plan assets) are invested in a mix of equity and fixed income securities. The company’s investment objective is to obtain above-average returns while minimizing volatility of expected returns over the long term. The company’s strategy is to hire proven managers and allocate assets to reflect a mix of investment styles, emphasize preservation of principal to minimize the impact of declining markets, and stay fully invested except for cash to meet benefit payment obligations and plan expenses. The company targets a higher allocation to equity securities than fixed income securities since the company believes that equity securities are expected to outperform fixed income securities.
| Asset Category |
Target Allocation |
Actual Allocation, End of Year | |||||||
| 2009 | 2008 | ||||||||
| Equity securities |
55-65 | % | 66 | % | 56 | % | |||
| Fixed income securities |
35-45 | % | 34 | % | 44 | % | |||
| Total |
100 | % | 100 | % | |||||
The company reviews the plan’s asset allocation periodically and re-balances the investment mix to maximize asset returns, optimize the matching of investment yields with the plan’s expected benefit obligations, and minimize pension cost.
The Plan’s investments are held by a trust fund administered by JP Morgan. JP Morgan measures fair value using the procedures set forth below for all investments. When available, JP Morgan uses quoted market prices on investments traded on an
151
Table of Contents
TAMPA ELECTRIC COMPANY
NOTES TO CONSOLIDATED FINANCIAL STATEMENTS—(Continued)
exchange to determine fair value and classifies such items as Level 1. In some cases where a market exchange price is available, but the investments are traded in a secondary market, JP Morgan makes use of acceptable practical expedients to calculate fair value, and the company classifies these items as Level 2.
If observable transactions and other market data are not available, fair value is based upon third party developed models that use, when available, current market-based or independently-sourced market parameters such as interest rates, currency rates or option volatilities. Items valued using third party generated models are classified according to the lowest level input or value driver that is most significant to the valuation. Thus, an item may be classified as Level 3 even though there may be significant inputs that are readily observable.
The following table sets forth by level within the fair value hierarchy the Plan’s investments as of Dec. 31, 2009. As required by the fair value accounting standards, the investments are classified in their entirety based on the lowest level of input that is significant to the fair value measurement. The Plan’s assessment of the significance of a particular input to the fair value measurement requires judgment, and may affect the valuation of fair value assets and liabilities and their placement within the fair value hierarchy levels. For cash equivalents, the cost approach was used in determining fair value. For bonds and U.S. government agencies, the income approach was used. For other investments, the market approach was used.
| (millions) |
At Fair Value as of Dec. 31, 2009 | |||||||||||||
| Level 1 | Level 2 | Level 3 | Total | |||||||||||
| Net cash |
$ | 37.2 | $ | — | $ | — | $ | 37.2 | ||||||
| Cash equivalents |
— | 10.6 | — | 10.6 | ||||||||||
| Equity securities |
||||||||||||||
| Common stocks |
94.1 | — | — | 94.1 | ||||||||||
| Preferred stocks |
— | 1.0 | — | 1.0 | ||||||||||
| American depository receipt (ADR) |
7.1 | 1.1 | — | 8.2 | ||||||||||
| Real estate investment trust (REIT) |
1.1 | — | — | 1.1 | ||||||||||
| Commingled fund |
— | 22.8 | — | 22.8 | ||||||||||
| Mutual fund |
127.2 | — | — | 127.2 | ||||||||||
| Total equity securities |
229.5 | 24.9 | — | 254.4 | ||||||||||
| Fixed income securities |
||||||||||||||
| Municipal bonds |
0.7 | 3.2 | — | 3.9 | ||||||||||
| Government bonds |
— | 27.5 | — | 27.5 | ||||||||||
| Corporate bonds |
— | 24.3 | — | 24.3 | ||||||||||
| Mortgage back securities (MBS) |
— | 25.7 | — | 25.7 | ||||||||||
| Asset backed securities (ABS) |
— | 0.7 | — | 0.7 | ||||||||||
| Collateralized mortgage obligation/Real estate mortgage investment conduit |
— | 3.9 | — | 3.9 | ||||||||||
| Mutual fund |
— | 0.9 | — | 0.9 | ||||||||||
| Total fixed income securities |
0.7 | 86.2 | — | 86.9 | ||||||||||
| Options |
— | (0.3 | ) | — | (0.3 | ) | ||||||||
| Miscellaneous |
— | 0.1 | — | 0.1 | ||||||||||
| Total |
$ | 267.4 | $ | 121.5 | $ | — | $ | 388.9 | ||||||
| • | Net cash represents cash, net accounts receivables and accounts payables. |
| • | Cash equivalents are valued using cost due to their short term nature. Additionally, cash equivalents are backed by 102% collateral. |
| • | The primary pricing inputs in determining the fair value of the Level 1 assets, excluding the mutual fund, are quoted prices in active markets. |
| • | The primary pricing inputs in determining the fair value of Level 2 preferred stock and ADR are prices of similar securities and benchmark quotes. |
| • | The commingled fund invests primarily in international equity securities, normally excluding securities issued in the U.S., with large- and mid-market capitalizations. The fund may invest in “value” or “growth” securities and is not limited to a particular investment style. The fund is valued using the net asset value (NAV), as determined by the fund’s trustee in accordance with U.S. GAAP, at year end. For redemption, written notice of the amount to be withdrawn must be given no later than 4:00 p.m. eastern standard time. |
152
Table of Contents
TAMPA ELECTRIC COMPANY
NOTES TO CONSOLIDATED FINANCIAL STATEMENTS—(Continued)
| • | The primary pricing input in determining the Level 1 mutual fund is the mutual fund’s NAV. The Level 1 mutual fund is an open-ended mutual fund and the NAV is validated with purchases and sales at NAV, making this a Level 1 asset. |
| • | The primary pricing inputs in determining the fair value Level 2 municipal bonds are benchmark yields, historical spreads, sector curves, rating updates, and prepayment schedules. The primary pricing inputs in determining the fair value of government bonds are the U.S. treasury curve, CPI, and broker quotes, if available. The primary pricing inputs in determining the fair value of corporate bonds are the U.S. treasury curve, base spreads, YTM, and benchmark quotes. Asset backed securities (ABS) and collateralized mortgage obligations (CMO) are priced using TBA prices, treasury curves, swap curves, cash flow information, and bids and offers as inputs. Mortgage backed securities (MBS) are priced using TBA prices, treasury curves, average lives, spreads, and cash flow information. |
| • | The primary pricing input in determining the fair value of the Level 2 mutual fund is its NAV at year end. Shares may be purchased at the NAV without sales charges or other fees. Since this mutual fund is a private fund, it is a Level 2 asset. The fund invests primarily in emerging market fixed income securities. For redemption, written notice of the amount to be withdrawn must be given no later than 4:00 p.m. eastern standard time. Redemption proceeds will normally be received within three business days. |
| • | Level 2 options are valued using the bid-ask spread and the last price. |
There were no assets classified as level 3 assets in 2008 or 2009.
Other Postretirement Benefit Plan Assets
There are no assets associated with TECO Energy’s other postretirement benefits plan.
Contributions
TECO Energy’s policy is to fund the qualified pension plan at or above amounts determined by its actuaries to meet ERISA guidelines for minimum annual contributions and minimize PBGC premiums paid by the plan. TECO Energy contributed $6.7 million to this plan in 2009 and $11.7 million in 2008, which met the minimum funding requirements for both 2009 and 2008. Tampa Electric Company’s portion of the contribution in 2009 and 2008 was $6.1 million and $9.5 million, respectively. TECO Energy plans to contribute the minimum required contribution of $19.5 million in 2010 with potential additional contributions of $20 – $25 million to maintain certain funding thresholds. Tampa Electric Company’s portion of the 2010 minimum required contribution is $15.9 million. TECO Energy estimates annual contributions to range from $25 – $90 million per year in 2011 to 2014 based on current assumptions. Tampa Electric Company’s portion of the contributions range from $20 – $75 million per year in 2011 to 2014.
The SERP is funded annually to meet the benefit obligations. The company made contributions of $1.5 million and $4.2 million to this plan in 2009 and 2008, respectively. In 2010, the company expects to make a contribution of about $8.4 million to this plan.
The other postretirement benefits are funded annually to meet benefit obligations. The company’s contribution toward health care coverage for most employees who retired after the age of 55 between Jan. 1, 1990 and Jun. 30, 2001 is limited to a defined dollar benefit based on service. The company contribution toward pre-65 and post-65 health care coverage for most employees retiring on or after Jul. 1, 2001 is limited to a defined dollar benefit based on an age and service schedule. In 2010, the company expects to make a contribution of about $14.0 million. Tampa Electric Company’s portion of the expected contribution is $11.0 million.
153
Table of Contents
TAMPA ELECTRIC COMPANY
NOTES TO CONSOLIDATED FINANCIAL STATEMENTS—(Continued)
Benefit Payments
The following benefit payments, which reflect expected future service, as appropriate, are expected to be paid:
| Expected Benefit Payments—TECO Energy Consolidated (including projected service and net of employee contributions) |
Pension Benefits |
Other Postretirement Benefits | ||||||||
| Expected benefit payments (millions): |
Gross | Expected Federal Subsidy |
||||||||
| 2010 |
$ | 52.7 | $ | 15.2 | $ | (1.2 | ) | |||
| 2011 |
$ | 49.4 | $ | 16.4 | $ | (1.4 | ) | |||
| 2012 |
$ | 50.0 | $ | 17.3 | $ | (1.5 | ) | |||
| 2013 |
$ | 50.4 | $ | 17.9 | $ | (1.7 | ) | |||
| 2014 |
$ | 51.3 | $ | 18.0 | $ | (1.8 | ) | |||
| 2015-2019 |
$ | 273.6 | $ | 92.9 | $ | (11.0 | ) | |||
Defined Contribution Plan
The company has a defined contribution savings plan covering substantially all employees of TECO Energy and its subsidiaries (the Employers) that enables participants to save a portion of their compensation up to the limits allowed by IRS guidelines. The company and its subsidiaries match up to 6% of the participant’s payroll savings deductions. Effective in July 2004, employer matching contributions were 30% of eligible participant contributions with additional incentive match of up to 70% of eligible participant contributions based on the achievement of certain operating company financial goals. In April 2007, the employer matching contributions were changed to 50% of eligible participant contributions, with an additional incentive match of up to 50%. For the years ended Dec. 31, 2009, 2008 and 2007, the company and its subsidiaries recognized expense totaling $8.1 million, $7.1 million and $8.6 million, respectively, related to the matching contributions made to this plan. Tampa Electric Company’s portion of expense totaled $6.5 million, $5.1 million and $5.8 million for 2009, 2008, and 2007, respectively.
6. Short-Term Debt
At Dec. 31, 2009 and 2008, the following credit facilities and related borrowings existed:
Credit Facilities
| Dec. 31, 2009 | Dec. 31, 2008 | |||||||||||||||||
| (millions) |
Credit Facilities |
Borrowings Outstanding (1) |
Letters of Credit Outstanding |
Credit Facilities |
Borrowings Outstanding (1) |
Letters of Credit Outstanding | ||||||||||||
| Recourse: |
||||||||||||||||||
| Tampa Electric Company: |
||||||||||||||||||
| 5-year facility |
$ | 325.0 | $ | 55.0 | $ | 0.7 | $ | 325.0 | $ | — | $ | 1.4 | ||||||
| 1-year accounts receivable facility |
150.0 | — | — | 150.0 | 29.0 | — | ||||||||||||
| Total |
$ | 475.0 | $ | 55.0 | $ | 0.7 | $ | 475.0 | $ | 29.0 | $ | 1.4 | ||||||
| (1) | Borrowings outstanding are reported as notes payable. |
At Dec. 31, 2009, these credit facilities require commitment fees ranging from 7.0 – 125.0 basis points (see Note 17). The weighted average interest rate on outstanding notes payable at Dec. 31, 2009 and 2008 was 0.64% and 2.13%, respectively.
Tampa Electric Company Accounts Receivable Facility
On Dec. 16, 2009, Tampa Electric Company and TEC Receivables Corp. (TRC), a wholly-owned subsidiary of Tampa Electric Company, amended their $150 million accounts receivable collateralized borrowing facility, entering into Amendment No. 7 to the Loan and Servicing Agreement with certain lenders named therein and Citicorp North America, Inc. as Program Agent. The amendment extends the maturity date to Mar. 17, 2010. Please refer to Note 17 for additional information.
154
Table of Contents
TAMPA ELECTRIC COMPANY
NOTES TO CONSOLIDATED FINANCIAL STATEMENTS—(Continued)
| 7. | Common Stock |
Tampa Electric Company is a wholly-owned subsidiary of TECO Energy, Inc.
| (millions, except shares) |
Common Stock | Issue Expense |
Total | ||||||||
| Shares | Amount | ||||||||||
| Balance Dec. 31, 2009 |
10 | $ | 1,802.4 | $ | — | $ | 1,802.4 | ||||
| Balance Dec. 31, 2008 (1) |
10 | $ | 1,802.4 | $ | — | $ | 1,802.4 | ||||
| (1) | TECO Energy, Inc. made equity contributions to Tampa Electric of $292.0 million in 2008 to support capital needs associated with generation expansion and environmental projects. |
| 8. | Commitments and Contingencies |
Legal Contingencies
From time to time, Tampa Electric Company is involved in various other legal, tax and regulatory proceedings before various courts, regulatory commissions and governmental agencies in the ordinary course of its business. Where appropriate, accruals are made in accordance with guidance for accounting for contingencies, to provide for matters that are probable of resulting in an estimable, material loss. While the outcome of such proceedings is uncertain, management does not believe that their ultimate resolution will have a material adverse effect on the company’s results of operations or financial condition.
Superfund and Former Manufactured Gas Plant Sites
Tampa Electric Company, through its Tampa Electric and Peoples Gas divisions, is a potentially responsible party (PRP) for certain superfund sites and, through its Peoples Gas division, for certain former manufactured gas plant sites. While the joint and several liability associated with these sites presents the potential for significant response costs, as of Dec. 31, 2009, Tampa Electric Company has estimated its ultimate financial liability to be approximately $19.9 million, and this amount has been accrued in the company’s financial statements. This amount is higher than prior estimates to reflect a 2009 study for the costs of remediation primarily related to one site. The environmental remediation costs associated with these sites, which are expected to be paid over many years, are not expected to have a significant impact on customer prices.
The estimated amounts represent only the estimated portion of the cleanup costs attributable to Tampa Electric Company. The estimates to perform the work are based on actual estimates obtained from contractors, or Tampa Electric Company’s experience with similar work adjusted for site specific conditions and agreements with the respective governmental agencies. The estimates are made in current dollars, are not discounted and do not assume any insurance recoveries.
Allocation of the responsibility for remediation costs among Tampa Electric Company and other PRPs is based on each party’s relative ownership interest in or usage of a site. Accordingly, Tampa Electric Company’s share of remediation costs varies with each site. In virtually all instances where other PRPs are involved, those PRPs are considered creditworthy.
Factors that could impact these estimates include the ability of other PRPs to pay their pro-rata portion of the cleanup costs, additional testing and investigation which could expand the scope of the cleanup activities, additional liability that might arise from the cleanup activities themselves or changes in laws or regulations that could require additional remediation. These costs are recoverable through customer rates established in subsequent base rate proceedings.
Long-Term Commitments
Tampa Electric Company has commitments under long-term leases, primarily for building space, capacity payments, office equipment and heavy equipment. Total rental expense included in the Consolidated Statements of Income for the years ended Dec. 31, 2009, 2008 and 2007 was $2.3 million, $2.0 million and $1.9 million, respectively.
155
Table of Contents
TAMPA ELECTRIC COMPANY
NOTES TO CONSOLIDATED FINANCIAL STATEMENTS—(Continued)
The following table is a schedule of future minimum lease payments at Dec. 31, 2009 for all leases with non-cancelable lease terms in excess of one year:
Future Minimum Lease Payments
| (millions) |
Capacity Payments (1) |
Operating Leases |
Total | ||||||
| Year ended Dec. 31: |
|||||||||
| 2010 |
$ | 8.6 | $ | 2.5 | $ | 11.1 | |||
| 2011 |
8.8 | 2.2 | 11.0 | ||||||
| 2012 |
9.0 | 2.1 | 11.1 | ||||||
| 2013 |
9.1 | 2.2 | 11.3 | ||||||
| 2014 |
9.3 | 2.2 | 11.5 | ||||||
| Thereafter |
39.2 | 21.2 | 60.4 | ||||||
| Total future minimum lease payments |
$ | 84.0 | $ | 32.4 | $ | 116.4 | |||
| (1) | This schedule includes the fixed capacity payments required under a capacity and tolling agreement of Tampa Electric which commenced Jan.1, 2009. In accordance with accounting standards for arrangements that may contain a lease, the company evaluated the agreement and concluded based on the criteria that the agreement met the lease definition. Prudently incurred capacity payments are recoverable under an FPSC-approved cost recovery clause (See Note 3). |
Guarantees and Letters of Credit
Tampa Electric Company accounts for guarantees in accordance with the applicable accounting standards. Upon issuance or modification of a guarantee the company determines if the obligation is subject to either or both of the following:
| • | Initial recognition and initial measurement of a liability; and/or |
| • | Disclosure of specific details of the guarantee. |
Generally, guarantees of the performance of a third party or guarantees that are based on an underlying (where such a guarantee is not a derivative) are likely to be subject to the recognition and measurement, as well as the disclosure provisions. Such guarantees must initially be recorded at fair value, as determined in accordance with the interpretation.
Alternatively, guarantees between and on behalf of entities under common control or that are similar to product warranties are subject only to the disclosure provisions of the interpretation. The company must disclose information as to the term of the guarantee and the maximum potential amount of future gross payments (undiscounted) under the guarantee, even if the likelihood of a claim is remote. At Dec. 31, 2009, TECO Energy had provided a $20.0 million fuel purchase guarantee and a $0.2 million letter of credit on behalf of Tampa Electric Company.
At Dec. 31, 2009, Tampa Electric Company was not obligated under guarantees, but had $0.7 million of letters of credit outstanding.
Letters of Credit -Tampa Electric Company
| (millions) Letters of Credit for the Benefit of: |
2010 | 2011-2014 | After 2014 |
Total | Liabilities Recognized at Dec. 31, 2009 | ||||||||||
| Tampa Electric |
|||||||||||||||
| Letters of credit |
$ | — | $ | — | $ | 0.7 | $ | 0.7 | $ | — | |||||
| Total |
$ | — | $ | — | $ | 0.7 | $ | 0.7 | $ | — | |||||
Financial Covenants
In order to utilize its bank credit facilities, Tampa Electric Company must meet certain financial tests as defined in the applicable agreements. In addition, Tampa Electric Company has certain restrictive covenants in specific agreements and debt instruments. At Dec. 31, 2009, Tampa Electric Company was in compliance with applicable financial covenants.
156
Table of Contents
TAMPA ELECTRIC COMPANY
NOTES TO CONSOLIDATED FINANCIAL STATEMENTS—(Continued)
9. Related Party Transactions
In October 2003, Tampa Electric signed a five-year contract renewal with an affiliate company, TECO Transport, for integrated waterborne fuel transportation services effective Jan. 1, 2004. The contract called for inland river and ocean transportation along with river terminal storage and blending services for up to 5.5 million tons of coal annually through 2008. In December 2007, TECO Energy sold TECO Transport to an unaffiliated party.
A summary of activities between Tampa Electric Company and its affiliates follows:
Net transactions with affiliates:
| (millions) |
2009 | 2008 | 2007 | ||||||
| Fuel and interchange related, net (2) |
$ | — | $ | — | $ | 93.2 | |||
| Administrative and general, net |
$ | 19.8 | $ | 21.0 | $ | 19.6 | |||
Amounts due from or to affiliates of the company at Dec. 31,
| (millions) |
2009 | 2008 | ||||||
| Accounts receivable (1) |
$ | 2.7 | $ | 1.5 | ||||
| Accounts payable (1) |
$ | 6.5 | $ | 6.9 | ||||
| (1) | Accounts receivable and accounts payable were incurred in the ordinary course of business and do not bear interest. |
| (2) | Amounts related to the transportation, transfer and storage of coal by TECO Transport. |
Tampa Electric Company had certain transactions, in the ordinary course of business, with entities in which directors of Tampa Electric Company had interests. Tampa Electric Company paid legal fees of $1.6 million, $1.9 million and $1.3 million for the years ended Dec. 31, 2009, 2008 and 2007, respectively, to Ausley McMullen, P.A. of which Mr. Ausley (a director of Tampa Electric Company) is an employee.
| 10. | Segment Information |
Tampa Electric Company is a public utility operating within the state of Florida. Through its Tampa Electric division, it is engaged in the generation, purchase, transmission, distribution and sale of electric energy to almost 667,000 customers in West Central Florida. Its Peoples Gas System division is engaged in the purchase, distribution and marketing of natural gas for more than 334,000 residential, commercial, industrial and electric power generation customers in the state of Florida.
Segment Information
| (millions) |
Tampa Electric |
Peoples Gas |
Other & eliminations |
Tampa Electric Company | |||||||||
| 2009 |
|||||||||||||
| Revenues—outsiders |
$ | 2,193.5 | $ | 455.6 | $ | — | $ | 2,649.1 | |||||
| Revenues—affiliates |
1.3 | 15.2 | (15.7 | ) | 0.8 | ||||||||
| Total revenues |
2,194.8 | 470.8 | (15.7 | ) | 2,649.9 | ||||||||
| Depreciation and amortization |
200.4 | 44.2 | — | 244.6 | |||||||||
| Restructuring charges |
18.4 | 4.7 | — | 23.1 | |||||||||
| Total interest charges |
116.2 | 18.7 | — | 134.9 | |||||||||
| Provision for taxes |
98.4 | 13.3 | — | 111.7 | |||||||||
| Net income |
$ | 160.2 | $ | 31.9 | $ | — | $ | 192.1 | |||||
| Total assets |
5,457.5 | 826.0 | (9.7 | ) | 6,273.8 | ||||||||
| Capital expenditures |
$ | 533.0 | $ | 50.5 | $ | — | $ | 583.5 | |||||
| 2008 |
|||||||||||||
| Revenues—outsiders |
$ | 2,089.8 | $ | 688.4 | $ | — | $ | 2,778.2 | |||||
| Revenues—affiliates |
1.4 | — | (0.5 | ) | 0.9 | ||||||||
| Total revenues |
2,091.2 | 688.4 | (0.5 | ) | 2,779.1 | ||||||||
| Depreciation and amortization |
185.6 | 41.9 | — | 227.5 | |||||||||
| Total interest charges |
114.7 | 18.2 | (0.2 | ) | 132.7 | ||||||||
| Provision for taxes |
81.9 | 17.3 | — | 99.2 | |||||||||
| Net income |
$ | 135.6 | $ | 27.1 | $ | — | $ | 162.7 | |||||
| Total assets |
5,294.7 | 823.4 | (9.5 | ) | 6,108.6 | ||||||||
| Capital expenditures |
$ | 479.7 | $ | 69.0 | $ | — | $ | 548.7 | |||||
157
Table of Contents
TAMPA ELECTRIC COMPANY
NOTES TO CONSOLIDATED FINANCIAL STATEMENTS—(Continued)
| (millions) |
Tampa Electric |
Peoples Gas |
Other & eliminations |
Tampa Electric Company | |||||||||
| 2007 |
|||||||||||||
| Revenues—outsiders |
$ | 2,186.6 | $ | 599.7 | $ | — | $ | 2,786.3 | |||||
| Revenues—affiliates |
1.8 | — | (0.6 | ) | 1.2 | ||||||||
| Total revenues |
2,188.4 | 599.7 | (0.6 | ) | 2,787.5 | ||||||||
| Depreciation and amortization |
178.6 | 40.1 | — | 218.7 | |||||||||
| Total interest charges |
112.2 | 17.1 | (0.1 | ) | 129.2 | ||||||||
| Provision for taxes |
85.2 | 16.4 | — | 101.6 | |||||||||
| Net income |
$ | 150.3 | $ | 26.5 | $ | — | $ | 176.8 | |||||
| Total assets |
4,672.5 | 754.3 | (7.5 | ) | 5,419.3 | ||||||||
| Capital expenditures |
$ | 373.8 | $ | 49.2 | $ | — | $ | 423.0 | |||||
| 11. | Asset Retirement Obligations |
Tampa Electric Company accounts for asset retirement obligations under applicable accounting standards. An asset retirement obligation (ARO) for a long-lived asset is recognized at fair value at inception of the obligation if there is a legal obligation under an existing or enacted law or statute, a written or oral contract, or by legal construction under the doctrine of promissory estoppel. Retirement obligations are recognized only if the legal obligation exists in connection with or as a result of the permanent retirement, abandonment or sale of a long-lived asset.
When the liability is initially recorded, the carrying amount of the related long-lived asset is correspondingly increased. Over time, the liability is accreted to its estimated future value. The corresponding amount capitalized at inception is depreciated over the remaining useful life of the asset. The liability must be revalued each period based on current market prices.
For the year ended Dec. 31, 2008, increased cost of removal of materials used in the generation and transmission of electricity resulted in a $1.7 million estimated cash flow revision at Tampa Electric Company.
Reconciliation of beginning and ending carrying amount of asset retirement obligations:
| Dec. 31, | ||||||
| (millions) |
2009 | 2008 | ||||
| Beginning Balance |
$ | 30.0 | $ | 27.1 | ||
| Revisions to estimated cash flows |
— | 1.7 | ||||
| Other(1) |
1.5 | 1.2 | ||||
| Ending Balance |
$ | 31.5 | $ | 30.0 | ||
| (1) | Accretion recorded as a deferred asset. |
As regulated utilities, Tampa Electric and PGS must file depreciation and dismantlement studies periodically and receive approval from the FPSC before implementing new depreciation rates. Included in approved depreciation rates is either an implicit net salvage factor or a cost of removal factor, expressed as a percentage. The net salvage factor is principally comprised of two components—a salvage factor and a cost of removal or dismantlement factor. Tampa Electric Company uses current cost of removal or dismantlement factors as part of the estimation method to approximate the amount of cost of removal in accumulated depreciation.
| 12. | Accounting for Derivative Instruments and Hedging Activities |
From time to time, Tampa Electric Company enters into futures, forwards, swaps and option contracts for the following purposes:
| • | To limit the exposure to price fluctuations for physical purchases and sales of natural gas in the course of normal operations; and |
| • | To limit the exposure to interest rate fluctuations on debt securities. |
Tampa Electric Company uses derivatives only to reduce normal operating and market risks, not for speculative purposes. Tampa Electric Company’s primary objective in using derivative instruments for regulated operations is to reduce the impact of market price volatility on ratepayers.
158
Table of Contents
TAMPA ELECTRIC COMPANY
NOTES TO CONSOLIDATED FINANCIAL STATEMENTS—(Continued)
The risk management policies adopted by Tampa Electric Company provide a framework through which management monitors various risk exposures. Daily and periodic reporting of positions and other relevant metrics are performed by a centralized risk management group which is independent of all operating companies.
Tampa Electric Company applies the accounting standards for derivatives and hedging. These standards require companies to recognize derivatives as either assets or liabilities in the financial statements, to measure those instruments at fair value, and to reflect the changes in the fair value of those instruments as either components of other comprehensive income (OCI) or in net income, depending on the designation of those instruments. The changes in fair value that are recorded in OCI are not immediately recognized in current net income. As the underlying hedged transaction matures or the physical commodity is delivered, the deferred gain or loss on the related hedging instrument must be reclassified from OCI to earnings based on its value at the time of the instrument’s settlement. For effective hedge transactions, the amount reclassified from OCI to earnings is offset in net income by the market change of the amount paid or received on the underlying physical transaction.
New accounting standards for disclosures became effective for financial statements issued for fiscal years and interim periods beginning after Nov. 15, 2008. This new standard requires enhanced disclosures about a company’s derivative activities and how the related hedged items affect a company’s financial position, financial performance and cash flows. The new requirements include qualitative disclosures about the company’s fair value amounts of gains and losses associated with derivative instruments, as well as disclosures about credit-risk-related contingent features in derivative agreements. The company adopted this new standard effective Jan. 1, 2009.
Tampa Electric Company applies accounting standards for regulated operations to financial instruments used to hedge the purchase of natural gas for the regulated companies. These standards, in accordance with the FPSC, permit the changes in fair value of natural gas derivatives to be recorded as regulatory assets or liabilities to reflect the impact of hedging activities on the fuel recovery clause. As a result, these changes are not recorded in OCI (see Note 3).
A company’s physical contracts qualify for the normal purchase/normal sale (NPNS) exception to derivative accounting rules, provided they meet certain criteria. Generally, NPNS applies if the company deems the counterparty creditworthy, if the counterparty owns or controls resources within the proximity to allow for physical delivery of the commodity, if the company intends to receive physical delivery and if the transaction is reasonable in relation to the company’s business needs. As of Dec. 31, 2009, all of Tampa Electric Company’s physical contracts qualify for the NPNS exception.
The following table presents the derivative hedges of natural gas contracts at Dec. 31, 2009 and Dec. 31, 2008 to limit the exposure to changes in the market price for natural gas used to produce energy and natural gas purchased for resale to customers:
Natural Gas Derivatives
| (millions) |
Dec. 31, 2009 |
Dec. 31, 2008 | ||||
| Current assets |
$ | 0.8 | $ | — | ||
| Long-term assets |
— | 0.1 | ||||
| Total assets |
$ | 0.8 | $ | 0.1 | ||
| Current liabilities (1) |
$ | 33.1 | $ | 120.1 | ||
| Long-term liabilities |
3.6 | 14.8 | ||||
| Total liabilities |
$ | 36.7 | $ | 134.9 | ||
| (1) | Amounts presented above are on a gross basis, with asset and liability positions netted by counterparty in accordance with accounting standards for derivatives and hedging. The Consolidated Condensed Balance Sheets reflect Tampa Electric Company’s net positions reduced by posted collateral of $0.7 million at Dec. 31, 2008, permitted by these accounting standards. As of Dec. 31, 2009, there was no outstanding collateral held or posted with counterparties. |
The ending balance in accumulated other comprehensive income (AOCI) related to previously settled interest rate swaps at Dec. 31, 2009 is a net loss of $6.1 million after tax and accumulated amortization. This compares to a net loss of $6.8 million in AOCI after tax and accumulated amortization at Dec. 31, 2008.
159
Table of Contents
TAMPA ELECTRIC COMPANY
NOTES TO CONSOLIDATED FINANCIAL STATEMENTS—(Continued)
The following table presents the effect of energy related derivatives on the fuel recovery clause mechanism in the Consolidated Condensed Balance Sheet as of Dec. 31, 2009:
Energy Related Derivatives
| (millions) at Dec. 31, 2009 |
Asset Derivatives |
Liability Derivatives | ||||||||
| Balance Sheet Location (1) |
Fair Value |
Balance Sheet Location (1) |
Fair Value | |||||||
| Commodity Contracts: |
||||||||||
| Natural gas derivatives: |
||||||||||
| Current |
Regulatory liabilities | $ | 0.8 | Regulatory assets | $ | 33.1 | ||||
| Long-term |
Regulatory liabilities | — | Regulatory assets | 3.6 | ||||||
| Total |
$ | 0.8 | $ | 36.7 | ||||||
| (1) | Natural gas derivatives are deferred in accordance with accounting standards for regulated operations and all increases and decreases in the cost of natural gas supply are passed on to customers with the fuel recovery clause mechanism. As gains and losses are realized in future periods, they will be recorded as fuel costs in the Consolidated Condensed Statements of Income. |
Based on the fair value of the instruments at Dec. 31, 2009, net pretax losses of $32.3 million are expected to be reclassified from regulatory assets to the Consolidated Condensed Statements of Income within the next twelve months.
The following table presents the effect of hedging instruments on OCI and income for the years ended Dec. 31:
| (millions) | Amount of Gain/(Loss) on Derivatives Recognized in OCI |
Location of Gain/(Loss) Reclassified From AOCI Into Income |
Amount of Gain/(Loss) Reclassified From AOCI Into Income |
|||||||
| Derivatives in Cash Flow Hedging Relationships |
Effective Portion(1) |
Effective Portion(1) | ||||||||
| 2009 |
||||||||||
| Interest rate contracts: |
$ | — | Interest expense | $ | (0.7 | ) | ||||
| Total |
$ | — | $ | (0.7 | ) | |||||
| 2008 |
||||||||||
| Interest rate contracts: |
$ | (2.2 | ) | Interest expense | $ | (0.4 | ) | |||
| Total |
$ | (2.2 | ) | $ | (0.4 | ) | ||||
| 2007 |
||||||||||
| Interest rate contracts: |
$ | (5.0 | ) | Interest expense | $ | — | ||||
| Total |
$ | (5.0 | ) | $ | — | |||||
| (1) | Changes in OCI and AOCI are reported in after-tax dollars. |
For derivative instruments that meet cash flow hedge criteria, the effective portion of the gain or loss on the derivative is reported as a component of OCI and reclassified into earnings in the same period or period during which the hedged transaction affects earnings. Gains and losses on the derivatives representing either hedge ineffectiveness or hedge components excluded from the assessment of effectiveness are recognized in current earnings. For the years ended Dec. 31, 2009, 2008 and 2007, all hedges were effective.
160
Table of Contents
The following table presents the derivative activity for instruments classified as qualifying cash flow hedges for the years ended Dec. 31:
| (millions) |
Fair Value Asset/(Liability) |
Amount of Gain/(Loss) Recognized in OCI(1) |
Amount of Gain/(Loss) Reclassified From AOCI Into Income |
|||||||||
| 2009 |
||||||||||||
| Interest rate swaps |
— | — | (0.7 | ) | ||||||||
| Total |
$ | — | $ | — | $ | (0.7 | ) | |||||
| 2008 |
||||||||||||
| Interest rate swaps |
— | (2.2 | ) | (0.4 | ) | |||||||
| Total |
$ | — | $ | (2.2 | ) | $ | (0.4 | ) | ||||
| 2007 |
||||||||||||
| Interest rate swaps |
(8.2 | ) | (5.0 | ) | — | |||||||
| Total |
$ | (8.2 | ) | $ | (5.0 | ) | $ | — | ||||
| (1) | Changes in OCI and AOCI are reported in after-tax dollars. |
The maximum length of time over which the company is hedging its exposure to the variability in future cash flows extends to Dec. 31, 2011 for the financial natural gas contracts. The following table presents by commodity type the company’s derivative volumes that, as of Dec. 31, 2009, are expected to settle during the 2010 and 2011 fiscal years:
| (millions) Year |
Natural Gas Contracts (MMBTUs) | |||
| Physical | Financial | |||
| 2010 |
— | 37.6 | ||
| 2011 |
— | 8.4 | ||
| Total |
— | 46.0 | ||
Tampa Electric Company is exposed to credit risk primarily through entering into derivative instruments with counterparties to limit its exposure to the commodity price fluctuations associated with natural gas. Credit risk is the potential loss resulting from a counterparty’s nonperformance under an agreement. The company manages credit risk with policies and procedures for, among other things, counterparty analysis, exposure measurement, and exposure monitoring and mitigation.
It is possible that volatility in commodity prices could cause Tampa Electric Company to have material credit risk exposures with one or more counterparties. If such counterparties fail to perform their obligations under one or more agreements, the company could suffer a material financial loss. However, as of Dec. 31, 2009, substantially all of the counterparties with transaction amounts outstanding in the company’s energy portfolio are rated investment grade by the major rating agencies. Tampa Electric Company assesses credit risk internally for counterparties that are not rated.
Tampa Electric Company has entered into commodity master arrangements with its counterparties to mitigate credit exposure to those counterparties. The company generally enters into the following master arrangements: (1) Edison Electric Institute agreements (EEI)—standardized power sales contracts in the electric industry; (2) International Swaps and Derivatives Association agreements (ISDA)—standardized financial gas and electric contracts; and (3) North American Energy Standards Board agreements (NAESB)—standardized physical gas contracts. Tampa Electric Company believes that entering into such agreements reduces the risk from default by creating contractual rights relating to creditworthiness, collateral and termination.
Tampa Electric Company has implemented procedures to monitor the creditworthiness of our counterparties and to consider nonperformance in valuing counterparty positions. Tampa Electric Company monitors counterparties’ credit standing, including those that are experiencing financial problems, have significant swings in credit default swap rates, have credit rating changes by external rating agencies, or have changes in ownership. Net liability positions are generally not adjusted as Tampa Electric Company uses derivative transactions as hedges and has the ability and intent to perform under each of these contracts. In the instance of net asset positions, Tampa Electric Company considers general market conditions and the observable financial health and outlook of specific counterparties, forward looking data such as credit default swaps, when available, and historical default probabilities from credit rating agencies in evaluating the potential impact of nonperformance risk to derivative positions. As of Dec. 31, 2009, substantially all positions with counterparties are net liabilities.
Certain of Tampa Electric Company’s derivative instruments contain provisions that require Tampa Electric Company’s debt to maintain an investment grade credit rating from any or all of the major credit rating agencies. If debt ratings were to fall below
161
Table of Contents
TAMPA ELECTRIC COMPANY
NOTES TO CONSOLIDATED FINANCIAL STATEMENTS—(Continued)
investment grade, it could trigger these provisions, and the counterparties to the derivative instruments could request immediate payment or demand immediate and ongoing full overnight collateralization on derivative instruments in net liability positions. Tampa Electric Company has no other contingent risk features associated with any derivative instruments.
The table below presents the fair value of the overall contractual contingent liability positions for Tampa Electric Company’s derivative activity at Dec. 31, 2009:
Contingent Features
| (millions) At Dec. 31, 2009 |
Fair Value Asset/(Liability) 1 |
Derivative Exposure Asset/(Liability) |
Posted Collateral | ||||||||
| Credit Rating |
$ | (35.9 | ) | $ | (35.9 | ) | $ | — | |||
| Total |
$ | (35.9 | ) | $ | (35.9 | ) | $ | — | |||
| 13. | Fair Value |
Determination of Fair Value
Tampa Electric Company measures fair value using the procedures set forth below for all assets and liabilities measured at fair value that were previously carried at fair value pursuant to other accounting guidelines.
When available, Tampa Electric Company uses quoted market prices on assets and liabilities traded on an exchange to determine fair value and classifies such items as Level 1. In some cases where a market exchange price is available, but the assets and liabilities are traded in a secondary market, Tampa Electric Company makes use of acceptable practical expedients to calculate fair value, and classifies such items as Level 2.
If observable transactions and other market data are not available, fair value is based upon internally developed models that use, when available, current market-based or independently-sourced market parameters such as interest rates, currency rates or option volatilities. Items valued using internally generated models are classified according to the lowest level input or value driver that is most significant to the valuation. Thus, an item may be classified in Level 3 even though there may be significant inputs that are readily observable.
Items Measured at Fair Value on a Recurring Basis
The following table sets forth by level within the fair value hierarchy the company’s financial assets and liabilities that were accounted for at fair value on a recurring basis as of Dec. 31, 2009. As required by accounting standards for fair value measurements, financial assets and liabilities are classified in their entirety based on the lowest level of input that is significant to the fair value measurement. The company’s assessment of the significance of a particular input to the fair value measurement requires judgment, and may affect the valuation of fair value assets and liabilities and their placement within the fair value hierarchy levels. For all assets and liabilities presented below the market approach was used in determining fair value.
Recurring Derivative Fair Value Measures
| At fair value as of Dec. 31, 2009 | ||||||||||||
| (millions) |
Level 1 | Level 2 | Level 3 | Total | ||||||||
| Assets |
||||||||||||
| Natural gas swaps |
$ | — | $ | 0.8 | $ | — | $ | 0.8 | ||||
| Total |
$ | — | $ | 0.8 | $ | — | $ | 0.8 | ||||
| Liabilities |
||||||||||||
| Natural gas swaps |
$ | — | $ | 36.7 | $ | — | $ | 36.7 | ||||
| Total |
$ | — | $ | 36.7 | $ | — | $ | 36.7 | ||||
Natural gas swaps are over-the-counter swap instruments. The primary pricing inputs in determining the fair value of natural gas swaps are the New York Mercantile Exchange (NYMEX) quoted closing prices of exchange-traded instruments. These prices are applied to the notional amounts of active positions to determine the reported fair value.
162
Table of Contents
TAMPA ELECTRIC COMPANY
NOTES TO CONSOLIDATED FINANCIAL STATEMENTS—(Continued)
Tampa Electric Company considered the impact of nonperformance risk in determining the fair value of derivatives. Tampa Electric Company considered the net position with each counterparty, past performance of both parties and the intent of the parties, indications of credit deterioration, and whether the markets in which we transact have experienced dislocation. At Dec. 31, 2009, the fair value of derivatives was not materially affected by nonperformance risk. Tampa Electric Company’s net positions with substantially all counterparties were liability positions.
| 14. | Variable Interest Entities |
Tampa Electric Company accounts for VIEs under accounting standards for consolidations. In accordance with these standards, the company evaluates for consolidation all long-term agreements with VIEs in which contractual, ownership or other pecuniary interests in that entity change with changes in the fair value of the entity’s net assets. A party to an agreement that absorbs a majority of the entity’s expected losses, receives a majority of its expected residual returns, or both, is considered to be the primary beneficiary and is required to consolidate that entity. In addition to these quantitative factors, the company evaluates qualitative factors that would indicate that a transfer of risk from the entity to the company has occurred. The transfer of substantial risk from the entity to the company could result in a determination that the company is the primary beneficiary of the entity. While we review each contract individually, for purposes of analyzing PPAs, the determining factors are generally the length of the agreement and which entity absorbs the fuel risk.
Tampa Electric has entered into multiple PPAs with wholesale energy providers in Florida to ensure the ability to meet customer energy demand and to provide lower cost options in the meeting of this demand. These agreements are with similar entities and contain similar provisions. They range in size from 121 to 370 MW of available capacity. Some of these provisions provide for the transfer or sharing of a number of risks inherent in the generation of energy. Some of these risks include: operating and maintenance; regulatory; credit; commodity/fuel; and energy market risk. In most instances, Tampa Electric has reviewed these risks and has determined that the owners of these entities have retained the majority of these risks over the expected life of the underlying generating assets and are the primary beneficiaries. As a result, Tampa Electric is not required to consolidate any of these entities. Tampa Electric purchased $105.5 million, $167.2 million and $109.7 million under these PPAs for the years ended Dec. 31, 2009, 2008, and 2007, respectively.
In one instance Tampa Electric’s agreement with the entity for 370 MW of capacity was entered into prior to Dec. 31, 2003, the effective date of these standards. Under these standards, Tampa Electric is required to make an exhaustive effort to obtain sufficient information to determine if this entity is a VIE and which holder of the variable interests is the primary beneficiary. The owners of this entity are not willing to provide the information necessary to make these determinations, have no obligation to do so and the information is not available publicly. As a result, Tampa Electric is unable to determine if this entity is a VIE and if so, which variable interest holder, if any, is the primary beneficiary. Tampa Electric has no obligation to this entity beyond the purchase of capacity; therefore, the maximum exposure for Tampa Electric is the obligation to pay for such capacity under terms of the PPA at rates that could be unfavorable to the wholesale market. Tampa Electric purchased $31.7 million, $71.6 million and $54.5 million under this PPA for the years ended Dec. 31, 2009, 2008, and 2007, respectively.
Tampa Electric Company does not provide any material financial or other support to any of the VIEs it is involved with, nor is Tampa Electric Company under any obligation to absorb losses associated with these VIEs. Tampa Electric Company’s involvement with the remaining VIEs does not affect its Consolidated Balance Sheets, Statements of Income or Cash Flows.
163
Table of Contents
TAMPA ELECTRIC COMPANY
NOTES TO CONSOLIDATED FINANCIAL STATEMENTS—(Continued)
| 15. | Other Comprehensive Income |
Tampa Electric Company reported the following other comprehensive income (loss) for the years ended Dec. 31, 2009, 2008 and 2007, related to changes in the fair value of cash flow hedges and amortization of unrecognized benefit costs associated with the company’s pension plans:
Other comprehensive income (loss)
| (millions) |
Gross | Tax | Net | |||||||||
| 2009 |
||||||||||||
| Unrealized loss on cash flow hedges |
$ | — | $ | — | $ | — | ||||||
| Plus: Gain reclassified to net income |
1.2 | (0.5 | ) | 0.7 | ||||||||
| Gain on cash flow hedges |
1.2 | (0.5 | ) | 0.7 | ||||||||
| Total other comprehensive income |
$ | 1.2 | $ | (0.5 | ) | $ | 0.7 | |||||
| 2008 |
||||||||||||
| Unrealized loss on cash flow hedges |
$ | (3.6 | ) | $ | 1.4 | $ | (2.2 | ) | ||||
| Less: Loss reclassified to net income |
0.7 | (0.3 | ) | 0.4 | ||||||||
| Loss on cash flow hedges |
(2.9 | ) | 1.1 | (1.8 | ) | |||||||
| Total other comprehensive loss |
$ | (2.9 | ) | $ | 1.1 | $ | (1.8 | ) | ||||
| 2007 |
||||||||||||
| Unrealized loss on cash flow hedges |
$ | (8.2 | ) | $ | 3.2 | $ | (5.0 | ) | ||||
| Less: Gain reclassified to net income |
— | — | — | |||||||||
| Loss on cash flow hedges |
(8.2 | ) | 3.2 | (5.0 | ) | |||||||
| Total other comprehensive loss |
$ | (8.2 | ) | $ | 3.2 | $ | (5.0 | ) | ||||
Accumulated other comprehensive loss
| (millions) Dec. 31, |
2009 | 2008 | ||||||
| Net unrealized loss from cash flow hedges (1) |
$ | (6.1 | ) | $ | (6.8 | ) | ||
| Total accumulated other comprehensive loss |
$ | (6.1 | ) | $ | (6.8 | ) | ||
| (1) | Net of tax benefit of $3.8 million and $4.3 million as of Dec. 31, 2009 and 2008, respectively. |
| 16. | Restructuring Charges |
On Jul. 30, 2009, TECO Energy, Inc. announced organizational changes and a new senior executive team structure as part of its response to industry changes, economic uncertainties and its commitment to maintain a lean and efficient organization. As a second step in response to these factors, on Aug. 31, 2009, the company decided on a total reduction in force which included approximately 216 jobs at Tampa Electric Company. The reduction in force was substantially completed by Dec. 31, 2009. In connection with this reduction in force, Tampa Electric Company incurred $23.1 million related to severance and benefits recognized on the Consolidated Condensed Statements of Income under “Restructuring charges” for the year ended Dec. 31, 2009. The total cash payments related to these actions are expected to be $26.3 million, including $4.9 million for the settlement of pension obligations (see Note 5), paid during 2009 and early 2010.
Restructuring Charges to be Incurred
| (millions) |
Termination of Benefits |
Other Costs | Total | ||||||||
| Total costs expected to be incurred |
$ | 23.1 | $ | — | $ | 23.1 | |||||
| Current period costs incurred |
(23.1 | ) | — | (23.1 | ) | ||||||
| Adjustments |
— | — | — | ||||||||
| Total costs remaining |
$ | — | $ | — | $ | — | |||||
164
Table of Contents
TAMPA ELECTRIC COMPANY
NOTES TO CONSOLIDATED FINANCIAL STATEMENTS—(Continued)
Accrued Liability for Restructuring Charges
| (millions) |
Termination of Benefits |
Other Costs | Total | ||||||||
| Beginning balance, Jul. 1, 2009 |
$ | — | $ | — | $ | — | |||||
| Costs incurred and charged to expense |
23.1 | — | 23.1 | ||||||||
| Costs paid/settled |
(20.4 | ) | — | (20.4 | ) | ||||||
| Non-cash expense |
(1.8 | ) | — | (1.8 | ) | ||||||
| Adjustments |
— | — | — | ||||||||
| Ending balance, Dec. 31, 2009 |
$ | 0.9 | $ | — | $ | 0.9 | |||||
Restructuring Charges by Segment
| (millions) |
Tampa Electric |
PGS | Total | |||||||||
| Total costs expected to be incurred |
$ | 18.4 | $ | 4.7 | $ | 23.1 | ||||||
| Current period costs incurred |
(18.4 | ) | (4.7 | ) | (23.1 | ) | ||||||
| Adjustments |
— | — | — | |||||||||
| Total costs remaining |
$ | — | $ | — | $ | — | ||||||
| 17. | Subsequent Events |
Tampa Electric Company has evaluated all events subsequent to the balance sheet date of Dec. 31, 2009 through the date of filing, Feb. 26, 2010.
Tampa Electric Company Accounts Receivable Facility
On Feb. 19, 2010, Tampa Electric Company and TEC Receivables Corp. (TRC), a wholly-owned subsidiary of Tampa Electric Company, amended their $150 million accounts receivable collateralized borrowing facility, entering into Amendment No. 8 to the Loan and Servicing Agreement with certain lenders named therein and Citicorp North America, Inc. as Program Agent. The amendment (i) extends the maturity date to Feb. 18, 2011, (ii) provides that TRC will continue to pay program and liquidity fees, which, pursuant to the amendment, will total 100 basis points, (iii) provides that the interest rates on the borrowings will be based on prevailing asset-backed commercial paper rates, unless such rates are not available from conduit lenders, in which case the rates will be at an interest rate equal to, at Tampa Electric Company’s option, either Citibank’s prime rate (or the federal funds rate plus 50 basis points, if higher) or a rate based on the London interbank offer rate (if available) plus a margin and (iv) makes other technical changes.
165
Table of Contents
| Item 9. | CHANGES IN AND DISAGREEMENTS WITH ACCOUNTANTS ON ACCOUNTING AND FINANCIAL DISCLOSURE. |
None.
| Item 9A. | CONTROLS AND PROCEDURES. |
TECO Energy, Inc.
Conclusions Regarding Effectiveness of Disclosure Controls and Procedures.
TECO Energy’s management, with the participation of its principal executive officer and principal financial officer, has evaluated the effectiveness of TECO Energy’s disclosure controls and procedures (as such term is defined in Rules 13a-15(e) and 15d-15(e) under the Securities Exchange Act of 1934, as amended (the “Exchange Act”)) as of the end of the period covered by this annual report, Dec. 31, 2009 (the “Evaluation Date”). Based on such evaluation, TECO Energy’s principal executive officer and principal financial officer have concluded that, as of the Evaluation Date, TECO Energy’s disclosure controls and procedures are effective.
Management’s Report on Internal Control over Financial Reporting.
Our management is responsible for establishing and maintaining adequate internal control over financial reporting, as such term is defined in Rule 13a-15(f) of the Securities Exchange Act of 1934, as amended. We conducted an evaluation of the effectiveness of TECO Energy, Inc.’s internal control over financial reporting as of Dec. 31, 2009 based on the framework in Internal Control—Integrated Framework issued by the Committee of Sponsoring Organizations of the Treadway Commission. Based on our evaluation under this framework, our management concluded that TECO Energy, Inc.’s internal control over financial reporting was effective as of Dec. 31, 2009.
TECO Energy’s internal control over financial reporting as of Dec. 31, 2009 has been audited by PricewaterhouseCoopers LLP, an independent registered certified public accounting firm, as stated in their report which is on page 85 of this report.
Because of its inherent limitations, internal control over financial reporting may not prevent or detect misstatements. A control system, no matter how well designed and operated, can provide only reasonable assurance with respect to financial statement preparation and presentation. Projections of any evaluation of effectiveness to future periods are subject to the risk that controls may become inadequate because of changes in conditions, or that the degree of compliance with the policies or procedures may deteriorate.
Changes in Internal Control over Financial Reporting.
There was no change in TECO Energy’s internal control over financial reporting (as defined in Rules 13a-15(f) and 15d-15(f) under the Exchange Act) identified in connection with the evaluation of TECO Energy’s internal controls that occurred during TECO Energy’s last fiscal quarter that has materially affected, or is reasonably likely to materially affect, such controls.
Tampa Electric Company
Conclusions Regarding Effectiveness of Disclosure Controls and Procedures.
Tampa Electric Company’s management, with the participation of its principal executive officer and principal financial officer, has evaluated the effectiveness of Tampa Electric Company’s disclosure controls and procedures (as such term is defined in Rules 13a-15(e) and 15d-15(e) under the Securities Exchange Act of 1934, as amended (the “Exchange Act”)) as of the end of the period covered by this annual report, Dec. 31, 2009 (the “Evaluation Date”). Based on such evaluation, Tampa Electric Company’s principal executive officer and principal financial officer have concluded that, as of the Evaluation Date, Tampa Electric Company’s disclosure controls and procedures are effective.
Management’s Report on Internal Control over Financial Reporting.
Our management is responsible for establishing and maintaining adequate internal control over financial reporting, as such term is defined in Rule 13a-15(f) of the Securities Exchange Act of 1934, as amended. We conducted an evaluation of the effectiveness of Tampa Electric Company’s internal control over financial reporting as of Dec. 31, 2009 based on the framework in Internal Control—Integrated Framework issued by the Committee of Sponsoring Organizations of the Treadway Commission. Based on our evaluation under this framework, our management concluded that Tampa Electric Company’s internal control over financial reporting was effective as of Dec. 31, 2009.
Tampa Electric Company’s internal control over financial reporting as of Dec. 31, 2009 has been audited by PricewaterhouseCoopers LLP, an independent registered certified public accounting firm, as stated in their report which is on page 130 of this report.
166
Table of Contents
Because of its inherent limitations, internal control over financial reporting may not prevent or detect misstatements. A control system, no matter how well designed and operated, can provide only reasonable assurance with respect to financial statement preparation and presentation. Projections of any evaluation of effectiveness to future periods are subject to the risk that controls may become inadequate because of changes in conditions, or that the degree of compliance with the policies or procedures may deteriorate.
Changes in Internal Control over Financial Reporting.
There was no change in Tampa Electric Company’s internal control over financial reporting (as defined in Rules 13a-15(f) and 15d-15(f) under the Exchange Act) identified in connection with the evaluation of Tampa Electric Company’s internal controls that occurred during Tampa Electric Company’s last fiscal quarter that has materially affected, or is reasonably likely to materially affect, such controls.
| Item 9B. | OTHER INFORMATION. |
None.
167
Table of Contents
PART III
| Item 10. | DIRECTORS, EXECUTIVE OFFICERS AND CORPORATE GOVERNANCE. |
| (a) | The information required by Item 10 with respect to the directors of the registrant is included under the caption “Election of Directors” in TECO Energy’s definitive proxy statement for its Annual Meeting of Shareholders to be held on May 5, 2010 (Proxy Statement) and is incorporated herein by reference. |
| (b) | The information required by Item 10 concerning executive officers of the registrant is included under the caption “Executive Officers of the Registrant” on page 29 of this report. |
| (c) | The information required by Item 10 concerning Section 16(a) Beneficial Ownership Reporting Compliance is included under that caption in the Proxy Statement and is incorporated herein by reference. |
| (d) | Information regarding TECO Energy’s Audit Committee, including the committee’s financial experts, is included under the caption “Committees of the Board” in the Proxy Statement, and is incorporated herein by reference. |
| (e) | TECO Energy has adopted a code of ethics applicable to all of its employees, officers and directors. The text of the Standards of Integrity is available in the Corporate Governance section of the Investors page of the company’s website at www.tecoenergy.com. Any amendments to or waivers of the Standards of Integrity for the benefit of any executive officer or director will also be posted on the website. |
| Item 11. | EXECUTIVE COMPENSATION. |
The information required by Item 11 is included in the Proxy Statement beginning with the caption “Compensation Discussion and Analysis” and ending with “Post-Termination Benefits” just above the caption “Ratification of Appointment of Auditor”, and under the caption “Compensation of Directors” and is incorporated herein by reference.
168
Table of Contents
| Item 12. | SECURITY OWNERSHIP OF CERTAIN BENEFICIAL OWNERS AND MANAGEMENT AND RELATED STOCKHOLDER MATTERS. |
The information required by Item 12 is included under the captions “Share Ownership”, and “Equity Compensation Plan Information” in the Proxy Statement, and is incorporated herein by reference.
| Item 13. | CERTAIN RELATIONSHIPS AND RELATED TRANSACTIONS, AND DIRECTOR INDEPENDENCE. |
The information required by Item 13 is included under the captions “Certain Relationships and Related Person Transactions” and “Director Independence” in the Proxy Statement, and is incorporated herein by reference.
| Item 14. | PRINCIPAL ACCOUNTING FEES AND SERVICES. |
The information required by Item 14 for TECO Energy is included under the caption “Item 2—Ratification of Appointment of Independent Auditor” in the Proxy Statement and is incorporated herein by reference.
Tampa Electric Company incurred $0.7 million, $0.8 million and $0.8 million in audit-related fees rendered by PricewaterhouseCoopers for 2009, 2008 and 2007, respectively, including $0.3 million related to Sarbanes-Oxley in each of the three years. No other fees for services rendered by PricewaterhouseCoopers were incurred at Tampa Electric Company in those years.
169
Table of Contents
PART IV
| Item 15. | EXHIBITS, FINANCIAL STATEMENT SCHEDULES. |
| (a) | Certain Documents Filed as Part of this Form 10-K |
| 1. | Financial Statements |
TECO Energy, Inc. Financial Statements—See index on page 76
Tampa Electric Company Financial Statements—See index on page 129
| 2. | Financial Statement Schedules |
Condensed Parent Company Financial Statements Schedule I—pages 171-174
TECO Energy, Inc. Schedule II—page 175
Tampa Electric Company Schedule II—page 176
| 3. | Exhibits—See index beginning on page 180 |
| (b) | The exhibits filed as part of this Form 10-K are listed on the Exhibit Index immediately preceding such Exhibits. The Exhibit Index is incorporated herein by reference. |
| (c) | The financial statement schedules filed as part of this Form 10-K are listed in paragraph (a)(2) above, and follow immediately. |
170
Table of Contents
SCHEDULE I—CONDENSED PARENT COMPANY FINANCIAL STATEMENTS
TECO ENERGY, INC.
PARENT COMPANY ONLY
Condensed Balance Sheets
| (millions) Assets |
Dec. 31, 2009 |
Dec. 31, 2008 |
||||||
| Current assets |
||||||||
| Cash and cash equivalents |
$ | 21.9 | $ | 0.2 | ||||
| Advances to affiliates |
213.4 | 204.4 | ||||||
| Accounts receivable from affiliates |
7.2 | 7.4 | ||||||
| Accounts receivable |
— | 0.2 | ||||||
| Interest receivable from affiliates |
1.6 | 1.8 | ||||||
| Other current assets |
0.9 | 1.1 | ||||||
| Total current assets |
245.0 | 215.1 | ||||||
| Property, plant and equipment |
||||||||
| Property, plant and equipment |
0.6 | 0.7 | ||||||
| Accumulated depreciation |
(0.2 | ) | (0.2 | ) | ||||
| Total property, plant and equipment |
0.4 | 0.5 | ||||||
| Other assets |
||||||||
| Investment in subsidiaries |
2,660.5 | 2,671.7 | ||||||
| Deferred income taxes |
657.6 | 732.5 | ||||||
| Other assets |
8.5 | 22.9 | ||||||
| Total other assets |
3,326.6 | 3,427.1 | ||||||
| Total assets |
$ | 3,572.0 | $ | 3,642.7 | ||||
| Liabilities and capital |
||||||||
| Current liabilities |
||||||||
| Long-term debt, current |
$ | 102.8 | $ | — | ||||
| Accounts payable to affiliates |
0.4 | 0.4 | ||||||
| Accounts payable |
3.6 | 4.9 | ||||||
| Interest payable |
3.9 | 4.5 | ||||||
| Taxes accrued |
0.2 | 0.2 | ||||||
| Advances from affiliates |
1,030.8 | 1,158.2 | ||||||
| Other current liabilities |
0.6 | 1.6 | ||||||
| Total current liabilities |
1,142.3 | 1,169.8 | ||||||
| Other liabilities |
||||||||
| Long-term debt-others |
301.0 | 403.9 | ||||||
| Other liabilities |
24.0 | 22.9 | ||||||
| Total other liabilities |
325.0 | 426.8 | ||||||
| Capital |
||||||||
| Common equity |
213.9 | 212.9 | ||||||
| Additional paid in capital |
1,530.8 | 1,518.2 | ||||||
| Retained earnings |
365.7 | 322.6 | ||||||
| Accumulated other comprehensive loss |
(5.7 | ) | (7.6 | ) | ||||
| Total capital |
2,104.7 | 2,046.1 | ||||||
| Total liabilities and capital |
$ | 3,572.0 | $ | 3,642.7 | ||||
The accompanying notes are an integral part of the condensed financial statements.
171
Table of Contents
SCHEDULE I—CONDENSED PARENT COMPANY FINANCIAL STATEMENTS—(Continued)
TECO ENERGY, INC.
PARENT COMPANY ONLY
Condensed Statements of Income
| For the years ended Dec. 31, (millions) |
2009 | 2008 | 2007 | |||||||||
| Revenues |
$ | — | $ | — | $ | — | ||||||
| Expenses |
||||||||||||
| Administrative and general expenses |
4.5 | 4.2 | 5.7 | |||||||||
| Other taxes |
0.7 | 0.8 | 0.9 | |||||||||
| Transaction (gain) costs related to sale of business |
— | (0.2 | ) | 27.1 | ||||||||
| Restructuring charges |
2.6 | — | — | |||||||||
| Depreciation and amortization |
0.2 | 0.2 | 0.4 | |||||||||
| Total expenses |
8.0 | 5.0 | 34.1 | |||||||||
| Loss from operations |
(8.0 | ) | (5.0 | ) | (34.1 | ) | ||||||
| Other income (expense) |
||||||||||||
| Loss on debt extinguishment |
— | — | (32.9 | ) | ||||||||
| Interest income |
0.2 | — | — | |||||||||
| Other income |
(5.2 | ) | 2.0 | 1.4 | ||||||||
| Earnings from investments in subsidiaries |
243.0 | 192.1 | 504.6 | |||||||||
| Total other income |
238.0 | 194.1 | 473.1 | |||||||||
| Interest income (expense) |
||||||||||||
| Interest income |
||||||||||||
| Affiliates |
— | — | 27.3 | |||||||||
| Others |
— | — | 9.3 | |||||||||
| Interest expense |
||||||||||||
| Others |
(25.2 | ) | (28.1 | ) | (121.3 | ) | ||||||
| Total interest expense |
(25.2 | ) | (28.1 | ) | (84.7 | ) | ||||||
| Income before income taxes |
204.8 | 161.0 | 354.3 | |||||||||
| Income tax benefit |
(9.1 | ) | (1.4 | ) | (58.9 | ) | ||||||
| Net income |
$ | 213.9 | $ | 162.4 | $ | 413.2 | ||||||
The accompanying notes are an integral part of the condensed financial statements.
172
Table of Contents
SCHEDULE I—CONDENSED PARENT COMPANY FINANCIAL STATEMENTS—(Continued)
TECO ENERGY, INC.
PARENT COMPANY ONLY
Condensed Statements of Cash Flows
| For the years ended Dec. 31, (millions) |
2009 | 2008 | 2007 | |||||||||
| Cash flows from operating activities |
$ | 311.7 | $ | 428.0 | $ | 395.5 | ||||||
| Cash flows from investing activities |
||||||||||||
| Restricted cash |
0.4 | (0.1 | ) | (0.2 | ) | |||||||
| Capital expenditures |
— | — | (0.1 | ) | ||||||||
| Investment in subsidiaries |
— | (271.0 | ) | (67.8 | ) | |||||||
| Net change in affiliate advances |
(134.5 | ) | (67.4 | ) | 166.7 | |||||||
| Other non-current investments |
9.8 | (42.3 | ) | 42.3 | ||||||||
| Cash flows (used in) from investing activities |
(124.3 | ) | (380.8 | ) | 140.9 | |||||||
| Cash flows from financing activities |
||||||||||||
| Dividends to shareholders |
(170.8 | ) | (168.6 | ) | (163.0 | ) | ||||||
| Common stock |
5.1 | 21.8 | 14.0 | |||||||||
| Repayment of long-term debt |
— | — | (668.7 | ) | ||||||||
| Debt exchange premium |
— | — | (21.2 | ) | ||||||||
| Cash flows used in financing activities |
(165.7 | ) | (146.8 | ) | (838.9 | ) | ||||||
| Net increase (decrease) in cash and cash equivalents |
21.7 | (99.6 | ) | (302.5 | ) | |||||||
| Cash and cash equivalents at beginning of period |
0.2 | 99.8 | 402.3 | |||||||||
| Cash and cash equivalents at end of period |
$ | 21.9 | $ | 0.2 | $ | 99.8 | ||||||
| Supplemental Data |
||||||||||||
| Dividends from subsidiaries included in cash flows from operating activities |
$ | 254.2 | $ | 408.4 | $ | 388.7 | ||||||
The accompanying notes are an integral part of the condensed financial statements.
173
Table of Contents
SCHEDULE I—CONDENSED PARENT COMPANY FINANCIAL STATEMENTS—(Continued)
TECO ENERGY, INC.
PARENT COMPANY ONLY
Notes to Condensed Financial Statements
| 1. | Basis of Presentation |
TECO Energy, Inc., on a stand alone basis, (the parent company) has accounted for majority-owned subsidiaries using the equity basis of accounting. These financial statements are presented on a condensed basis. Additional disclosures relating to the parent company financial statements are included under the TECO Energy Notes to Consolidated Financial Statements, which information is hereby incorporated by reference. These parent company condensed financial statements are required under Regulation S-X due to their net assets exceeding 25% of the consolidated net assets of TECO Energy, Inc.
The use of estimates is inherent in the preparation of financial statements in accordance with generally accepted accounting principles. Actual results could differ from those estimates. Certain prior year amounts were reclassified to conform to the current year presentation.
| 2. | Long-term Obligations |
In connection with debt tender and exchange transactions, $32.9 million of premiums and fees were expensed and are included in “Loss on debt extinguishment” on the Condensed Parent Income Statement for the year ended Dec. 31, 2007. See Note 7 to the TECO Energy Consolidated Financial Statements for a description and details of long-term debt obligations of the parent company.
| 3. | Commitments and Contingencies |
See Note 12 to the TECO Energy Consolidated Financial Statements for a description of all material contingencies and guarantees outstanding of the parent company.
| 4. | Sale of TECO Transport |
On Dec. 4, 2007, TECO Diversified, Inc., a wholly-owned subsidiary of the company, sold its entire interest in TECO Transport Corporation for cash to an unaffiliated investment group. In connection with this sale, TECO Energy Parent Only incurred transaction-related charges of $27.1 million.
| 5. | Restructuring Charges |
On Jul. 30, 2009, TECO Energy, Inc. announced organizational changes and a new senior executive team structure as part of its response to industry changes, economic uncertainties and its commitment to maintain a lean and efficient organization. As a second step in response to these factors, on Aug. 31, 2009, the company decided on a total reduction in force which included approximately 13 jobs at the parent company. The reduction in force was substantially completed by Dec. 31, 2009. In connection with this reduction in force, the parent company incurred $2.5 million related to severance and benefits recognized on the Condensed Statements of Income under “Restructuring charges” for the year ended Dec. 31, 2009. The total cash payments related to these actions are expected to be $2.1 million and paid during 2009 and early 2010.
| 6. | Subsequent Events |
The parent company has evaluated all events subsequent to the balance sheet date of Dec. 31, 2009 through the date of filing, Feb. 26, 2010.
On Feb. 22, 2010 TECO Energy and TECO Finance announced tender offers for up to $300.0 million of four series of notes maturing in 2011 and 2012. The purpose of the tender offers is to manage TECO Energy and TECO Finance debt maturities by retiring the tendered notes and issuing replacement debt with longer maturities.
Neither TECO Energy nor TECO Finance will be obligated to accept for purchase, and pay for, validly tendered notes pursuant to any of the tender offers if we have not closed on, and received anticipated proceeds from, a registered offering of notes to be issued by TECO Finance and guaranteed by TECO Energy. We intend to use the proceeds from the closing of the offering to retire TECO Energy’s floating rate notes due 2010 at maturity and to purchase tendered notes.
174
Table of Contents
SCHEDULE II—VALUATION AND QUALIFYING ACCOUNTS AND RESERVES
TECO ENERGY, INC.
VALUATION AND QUALIFYING ACCOUNTS AND RESERVES
For the Years Ended Dec. 31, 2009, 2008 and 2007
(millions)
| Balance at Beginning of Period |
Additions | Payments & Deductions (1) |
Balance at End of Period | ||||||||||||
| Charged to Income |
Other Charges |
||||||||||||||
| Allowance for Uncollectible Accounts: |
|||||||||||||||
| 2009 |
$ | 3.5 | $ | 9.1 | $ | — | $ | 9.6 | $ | 3.0 | |||||
| 2008 |
$ | 3.3 | $ | 8.1 | $ | — | $ | 7.9 | $ | 3.5 | |||||
| 2007 |
$ | 4.6 | $ | 6.8 | $ | — | $ | 8.1 | $ | 3.3 | |||||
| (1) | Write-off of individual bad debt accounts |
175
Table of Contents
SCHEDULE II—VALUATION AND QUALIFYING ACCOUNTS AND RESERVES
TAMPA ELECTRIC COMPANY
VALUATION AND QUALIFYING ACCOUNTS AND RESERVES
For the Years Ended Dec. 31, 2009, 2008 and 2007
(millions)
| Balance at Beginning of Period |
Additions | Payments & Deductions (1) |
Balance at End of Period | ||||||||||||
| Charged to Income |
Other Charges |
||||||||||||||
| Allowance for Uncollectible Accounts: |
|||||||||||||||
| 2009 |
$ | 1.6 | $ | 9.0 | $ | — | $ | 9.0 | $ | 1.6 | |||||
| 2008 |
$ | 1.4 | $ | 8.1 | $ | — | $ | 7.9 | $ | 1.6 | |||||
| 2007 |
$ | 1.2 | $ | 6.8 | $ | — | $ | 6.6 | $ | 1.4 | |||||
| (1) | Write-off of individual bad debt accounts |
176
Table of Contents
Pursuant to the requirements of Section 13 or 15(d) of the Securities Exchange Act of 1934, the Registrant has duly caused this report to be signed on its behalf by the undersigned, thereunto duly authorized.
| TECO ENERGY, INC. | ||||||||
| Dated: February 26, 2010 | By: | /S/ SHERRILL W. HUDSON | ||||||
| Sherrill W. Hudson, Chairman of the Board, Director and Chief Executive Officer | ||||||||
Pursuant to the requirements of the Securities Exchange Act of 1934, this report has been signed by the following persons on behalf of the registrant and in the capacities indicated on February 26, 2010:
| Signature |
Title | |||
| /S/ SHERRILL W. HUDSON Sherrill W. Hudson |
Chairman of the Board, Director and Chief Executive Officer (Principal Executive Officer) | |||
| /S/ SANDRA W. CALLAHAN Sandra W. Callahan |
Vice President-Finance and Accounting and Chief Financial Officer (Chief Accounting Officer) (Principal Financial and Principal Accounting Officer) | |||
| Signature |
Title |
Signature |
Title | |||
| /S/ C. DUBOSE AUSLEY C. Dubose Ausley |
Director | /S/ TOM L. RANKIN Tom L. Rankin |
Director | |||
| /S/ JAMES L. FERMAN, JR. James L. Ferman, JR. |
Director | /S/ WILLIAM D. ROCKFORD William D. Rockford |
Director | |||
| /S/ JOSEPH P. LACHER Joseph P. Lacher |
Director | /S/ J. THOMAS TOUCHTON J. Thomas Touchton |
Director | |||
| /S/ LORETTA A. PENN Loretta A. Penn |
Director | /S/ PAUL L. WHITING Paul L. Whiting |
Director | |||
| /S/ JOHN B. RAMIL John B. Ramil |
Director | |||||
177
Table of Contents
Pursuant to the requirements of Section 13 or 15(d) of the Securities Exchange Act of 1934, the Registrant has duly caused this report to be signed on its behalf by the undersigned, thereunto duly authorized.
| TAMPA ELECTRIC COMPANY | ||||||||
| Dated: February 26, 2010 | By: | /S/ SHERRILL W. HUDSON | ||||||
| Sherrill W. Hudson, Chairman of the Board, Director and Chief Executive Officer | ||||||||
Pursuant to the requirements of the Securities Exchange Act of 1934, this report has been signed by the following persons on behalf of the registrant and in the capacities indicated on February 26, 2010:
| Signature |
Title | |||
| /S/ SHERRILL W. HUDSON Sherrill W. Hudson |
Chairman of the Board, Director and Chief Executive Officer (Principal Executive Officer) | |||
| /S/ SANDRA W. CALLAHAN Sandra W. Callahan |
Vice President-Finance and Accounting and Chief Financial Officer (Chief Accounting Officer) (Principal Financial and Principal Accounting Officer) | |||
| Signature |
Title |
Signature |
Title | |||
| /S/ C. DUBOSE AUSLEY C. Dubose Ausley |
Director | /S/ TOM L. RANKIN Tom L. Rankin |
Director | |||
| /S/ JAMES L. FERMAN, JR. James L. Ferman, JR. |
Director | /S/ WILLIAM D. ROCKFORD William D. Rockford |
Director | |||
| /S/ JOSEPH P. LACHER Joseph P. Lacher |
Director | /S/ J. THOMAS TOUCHTON J. Thomas Touchton |
Director | |||
| /S/ LORETTA A. PENN Loretta A. Penn |
Director | /S/ PAUL L. WHITING Paul L. Whiting |
Director | |||
| /S/ JOHN B. RAMIL John B. Ramil |
Director | |||||
178
Table of Contents
Supplemental Information to Be Furnished With Reports Filed Pursuant to Section 15(d) of the Act by Registrants Which Have Not Registered Securities Pursuant to Section 12 of the Act
No annual report or proxy material has been sent to Tampa Electric Company’s security holders because all of its equity securities are held by TECO Energy, Inc.
179
Table of Contents
| Exhibit No. |
Description |
|||
| 3.1 | Articles of Incorporation of TECO Energy, Inc., as amended on Apr. 20, 1993 (Exhibit 3, Form 10-Q for the quarter ended Mar. 31, 1993 of TECO Energy, Inc.). | * | ||
| 3.2 | Bylaws of TECO Energy, Inc., as amended effective Oct. 29, 2009 (Exhibit 3.1, Form 8-K dated Oct. 29, 2009 of TECO Energy, Inc.). | * | ||
| 3.3 | Articles of Incorporation of Tampa Electric Company (Exhibit 3 to Registration Statement No. 2-70653 of Tampa Electric Company). | * | ||
| 3.4 | Bylaws of Tampa Electric Company, as amended effective Jan. 30, 2008 (Exhibit 3.4, Form 10-K for 2007 of TECO Energy, Inc. and Tampa Electric Company) | * | ||
| 4.1 | Loan and Trust Agreement among Hillsborough County Industrial Development Authority, Tampa Electric Company and The Bank of New York Trust Company of Florida, N.A., as trustee, dated as of Jun. 1, 2002 (including the form of bond). (Exhibit 4.5, Amendment No. 1 to Form 10-K for 2004 of TECO Energy, Inc. and Tampa Electric Company). | * | ||
| 4.2 | Loan and Trust Agreement among Hillsborough County Industrial Development Authority, Tampa Electric Company and The Bank of New York Trust Company, N.A., as trustee, dated as of Jan. 5, 2006 (including the form of bond) (Exhibit 4.1, Form 8-K dated Jan. 19, 2006 of Tampa Electric Company). | * | ||
| 4.3 | Indenture between Tampa Electric Company and The Bank of New York, as trustee, dated as of Jul. 1, 1998 (Exhibit 4.1, Registration Statement No. 333-55873 of Tampa Electric Company). | * | ||
| 4.4 | Third Supplemental Indenture between Tampa Electric Company and The Bank of New York, as trustee, dated as of Jun. 15, 2001 (Exhibit 4.2, Form 8-K dated Jun. 25, 2001 of Tampa Electric Company). | * | ||
| 4.5 | Fourth Supplemental Indenture between Tampa Electric Company and The Bank of New York, as trustee, dated as of Aug. 15, 2002 (Exhibit 4.2, Form 8-K dated Aug. 26, 2002 of Tampa Electric Company). | * | ||
| 4.6 | Fifth Supplemental Indenture between Tampa Electric Company and The Bank of New York, as trustee, dated as of May 1, 2006 (Exhibit 4.16, Form 8-K dated May 12, 2006 of Tampa Electric Company). | * | ||
| 4.7 | Amended and Restated Note Agreement dated as of May 30, 1997 between Tampa Electric Company (successor by merger to Peoples Gas System, Inc.) and The Prudential Insurance Company of America (Exhibit 4.2, Form 8-K dated Dec. 15, 2004 of TECO Energy, Inc. and Tampa Electric Company). | * | ||
| 4.8 | Letter Amendment No. 1 dated as of Dec. 9, 2004 to the Amended and Restated Note Agreement dated as of May 30, 1997 between Tampa Electric Company (successor by merger to Peoples Gas System, Inc.) and The Prudential Insurance Company of America (Exhibit 4.1, Form 8-K dated Dec. 15, 2004 of TECO Energy, Inc., and Tampa Electric Company). | * | ||
| 4.9 | Note Purchase Agreement among Tampa Electric Company and the Purchasers party thereto, dated as of Apr. 11, 2003 (Exhibit 10.1, Form 8-K dated Apr. 14, 2003 of Tampa Electric Company). | * | ||
| 4.10 | Loan and Trust Agreement dated as of May 1, 2007 among Polk County Industrial Development Authority, Tampa Electric Company and The Bank of New York Trust Company, N.A., as trustee (including the form of Bond) (Exhibit 4.1, Form 8-K dated May 14, 2007 of Tampa Electric Company). | * | ||
| 4.11 | Sixth Supplemental Indenture dated as of May 25, 2007 between Tampa Electric Company and The Bank of New York, as trustee, supplementing the Indenture dated as of Jul. 1, 1998, as amended (Exhibit 4.18, Form 8-K dated May 25, 2007 of Tampa Electric Company). | * | ||
| 4.12 | 6.15% Notes due 2037 (Exhibit 4.19, Form 8-K dated May 25, 2007 of Tampa Electric Company). | * | ||
| 4.13 | Seventh Supplemental Indenture dated as of May 1, 2008 between Tampa Electric Company and The Bank of New York, as trustee, supplementing the Indenture dated as of Jul. 1, 1998, as amended (Exhibit 4.20, Form 8-K dated May 16, 2008 of Tampa Electric Company). | * | ||
| 4.14 | 6.10% Notes due 2018 (Exhibit 4.21, Form 8-K dated May 16, 2008 of Tampa Electric Company, and Exhibit 4.25, Form 8-K dated July 7, 2009 of Tampa Electric Company). | * | ||
| 4.15 | Loan and Trust Agreement dated as of Jul. 2, 2007 among Hillsborough County Industrial Development Authority, Tampa Electric Company and The Bank of New York Trust Company, N.A., as trustee (including the form of Bond) (Exhibit 4.1, Form 8-K dated Jul. 25, 2007 of Tampa Electric Company). | * | ||
180
Table of Contents
| 4.16 | First Supplemental Loan and Trust Agreement dated as of Mar. 26, 2008 among Hillsborough County Industrial Development Authority, Tampa Electric Company and The Bank of New York Trust Company, N.A., as trustee (Exhibit 4.1, Form 8-K dated Mar. 26, 2008 of Tampa Electric Company). | * | ||
| 4.17 | Indenture between TECO Energy, Inc. and The Bank of New York, as trustee, dated as of Aug. 17, 1998 (Exhibit 4.1, Form 8-K dated Sep. 20, 2000 of TECO Energy, Inc.). | * | ||
| 4.18 | Third Supplemental Indenture dated as of Dec. 1, 2000 between TECO Energy, Inc. and The Bank of New York, as trustee (Exhibit 4.21, Form 8-K dated Dec. 20, 2000 of TECO Energy, Inc.). | * | ||
| 4.19 | Fourth Supplemental Indenture dated as of Apr. 30, 2001 between TECO Energy, Inc. and The Bank of New York, as trustee (Exhibit 4.28, Form 8-K dated May 1, 2001 of TECO Energy, Inc.). | * | ||
| 4.20 | Fifth Supplemental Indenture dated as of Sep. 10, 2001 between TECO Energy, Inc. and The Bank of New York, as trustee (Exhibit 4.16, Form 8-K dated Sep. 26, 2001 of TECO Energy, Inc.). | * | ||
| 4.21.1 | Sixth Supplemental Indenture dated as of Jan. 15, 2002 between TECO Energy, Inc. and The Bank of New York, as trustee (Exhibit 4.28, Form 8-K dated Jan. 15, 2002 of TECO Energy, Inc.). | * | ||
| 4.21.2 | Amended and Restated Trust Agreement of TECO Capital Trust II among TECO Funding Company II, LLC, The Bank of New York and The Bank of New York (Delaware), dated as of Jan. 15, 2002 (Exhibit 4.31, Form 8-K dated Jan. 15, 2002 of TECO Energy, Inc.). | * | ||
| 4.21.3 | Amended and Restated Limited Liability Agreement of TECO Funding Company II, LLC, dated as of Jan. 15, 2002 (Exhibit 4.33, Form 8-K dated Jan. 15, 2002 of TECO Energy, Inc.). | * | ||
| 4.21.4 | Guarantee Agreement by and between TECO Energy, Inc., as Guarantor and The Bank of New York, dated as of Jan. 15, 2002 (Exhibit 4.35, Form 8-K dated Jan. 15, 2002 of TECO Energy, Inc. | * | ||
| 4.22 | Seventh Supplemental Indenture dated as of May 1, 2002 between TECO Energy, Inc. and The Bank of New York, as trustee (Exhibit 4.15, Form 8-K dated May 13, 2002 of TECO Energy, Inc.). | * | ||
| 4.23 | Ninth Supplemental Indenture dated as of Jun. 10, 2003 between TECO Energy, Inc. and The Bank of New York, as trustee (Exhibit 4.15, Form 8-K dated Jun. 13, 2003 of TECO Energy, Inc.). | * | ||
| 4.24 | Tenth Supplemental Indenture dated as of May 26, 2005 between TECO Energy, Inc. and The Bank of New York, as trustee (including the form of 6.75% Note) (Exhibit 4.1, Form 8-K dated May 26, 2005 of TECO Energy, Inc.). | * | ||
| 4.25 | Eleventh Supplemental Indenture dated as of Jun. 7, 2005 between TECO Energy, Inc. and The Bank of New York, as trustee (including the form of Floating Rate Note) (Exhibit 4.1, Form 8-K dated Jun. 7, 2005 of TECO Energy, Inc.). | * | ||
| 4.26 | Renewed Rights Agreement between TECO Energy, Inc. and The Bank of New York., as Rights Agent, as amended and restated as of Feb. 2, 2004 (Exhibit 1, Form 8-A/A, of TECO Energy, Inc. filed on Feb. 23, 2004). (which Agreement expired on May 7, 2009, as described on the Form 25 filed on May 12, 2009). | * | ||
| 4.27 | Indenture dated as of December 21, 2007 by and among TECO Finance, Inc., as issuer, TECO Energy, Inc., as guarantor, and The Bank of New York Trust Company, N.A., as trustee (Exhibit 4.1, Form 8-K dated Dec. 21, 2007 of TECO Energy, Inc.). | * | ||
| 4.28 | First Supplemental Indenture dated as of December 21, 2007 by and among TECO Finance, Inc., as issuer, TECO Energy, Inc., as guarantor, and The Bank of New York Trust Company, N.A., as trustee, supplementing the Indenture dated as of December 21, 2007 (including the form of TECO Finance 7.20% notes due 2011, TECO Finance 7.00% notes due 2012 and TECO Finance 6.572% notes due 2017) (Exhibit 4.2, Form 8-K dated Dec. 21, 2007 of TECO Energy, Inc.). | * | ||
| 4.29 | Second Supplemental Indenture dated as of December 21, 2007 by and among TECO Finance, Inc., as issuer, TECO Energy, Inc., as guarantor, and The Bank of New York Trust Company, N.A., as trustee, supplementing the Indenture dated as of December 21, 2007 (including the form of TECO Finance 6.75% notes due 2015) (Exhibit 4.3, Form 8-K dated Dec. 21, 2007 of TECO Energy, Inc.). | * | ||
| 10.1 | TECO Energy Group Supplemental Executive Retirement Plan, as amended and restated as of Nov. 1, 2007 (Exhibit 10.1, Form 10-K for 2007 of TECO Energy, Inc. and Tampa Electric Company). | * | ||
| 10.2 | TECO Energy Group Supplemental Disability Income Plan, dated as of Mar. 20, 1989 (Exhibit 10.22, Form 10-K for 1988 of TECO Energy, Inc.). | * | ||
| 10.3 | TECO Energy Group Supplemental Retirement Benefits Trust Agreement, effective as of Nov. 17, 2008 (Exhibit 10.3, Form 10-K for 2008 of TECO Energy, Inc. and Tampa Electric Company). | * | ||
| 10.4 | Annual Incentive Compensation Plan for TECO Energy and subsidiaries, revised as of Feb. 4, 2009 (Exhibit 10.4, Form 10-K for 2008 of TECO Energy, Inc. and Tampa Electric Company). | * | ||
| 10.5 | Form of Change-in-Control Severance Agreement between TECO Energy, Inc. and Executive Officers. (Exhibit 10.1, Form 10-Q for the quarter ended September 30, 2008 of TECO Energy, Inc. and Tampa Electric Company) | * | ||
181
Table of Contents
| 10.6 | Change-in-Control Severance Agreement between TECO Energy, Inc. and Sandra W. Callahan (Exhibit 10.1, Form 8-K dated Feb. 5, 2010 of TECO Energy, Inc.) | * | ||
| 10.7 | TECO Energy Directors’ Deferred Compensation Plan, as amended and restated effective as of Aug. 1, 2007 (Exhibit 10.3, Form 10-Q for the quarter ended Sep. 30, 2007 of TECO Energy, Inc. and Tampa Electric Company). | * | ||
| 10.8 | Amendment No. 1 to TECO Energy Directors’ Deferred Compensation Plan, effective as of Apr. 29, 2009 (Exhibit 10.1, Form 10-Q for the quarter ended Jun. 30, 2009 of TECO Energy, Inc. and Tampa Electric Company) | * | ||
| 10.9 | Form of Nonstatutory Stock Option under the TECO Energy, Inc. 1996 Equity Incentive Plan (and its successor plan) (Exhibit 10.5, Form 10-Q for the quarter ended Jun. 30, 1999 of TECO Energy, Inc.). | * | ||
| 10.10 | TECO Energy, Inc. 1997 Director Equity Plan (Exhibit 10.1, Form 8-K dated Apr. 16, 1997 of TECO Energy, Inc.). | * | ||
| 10.11 | Form of Nonstatutory Stock Option under the TECO Energy, Inc. 1997 Director Equity Plan, dated as of Jan. 29, 2003 (Exhibit 10.28, Form 10-K for 2002 of TECO Energy, Inc. and Tampa Electric Company). | * | ||
| 10.12 | Form of Restricted Stock Agreement under the TECO Energy, Inc. 1997 Director Equity Plan (Exhibit 10.3, Form 10-Q for the quarter ended Jun. 30, 2006 of TECO Energy, Inc. and Tampa Electric Company). | * | ||
| 10.13 | TECO Energy, Inc. 2004 Equity Incentive Plan (Exhibit 10.2, Form 10-Q for the quarter ended Mar. 31, 2004 of TECO Energy, Inc. and Tampa Electric Company). | * | ||
| 10.14 | Form of Restricted Stock Agreement between TECO Energy, Inc. and certain officers under the TECO Energy, Inc. 2004 Equity Incentive Plan (Exhibit 10.2, Form 10-Q for the quarter ended Jun. 30, 2008 of TECO Energy, Inc. and Tampa Electric Company). | * | ||
| 10.15 | Form of Restricted Stock Agreement between TECO Energy, Inc. and certain officers under the TECO Energy, Inc. 2004 Equity Incentive Plan (Exhibit 10.2, Form 10-Q for the quarter ended Jun. 30, 2009 of TECO Energy, Inc. and Tampa Electric Company). | * | ||
| 10.16 | Form of Restricted Stock Agreement between TECO Energy, Inc. and certain officers under the TECO Energy, Inc. 2004 Equity Incentive Plan (Exhibit 10.14, Form 10-K for 2008 of TECO Energy, Inc. and Tampa Electric Company). | * | ||
| 10.17 | Form of Performance Shares Agreement between TECO Energy, Inc. and certain officers under the TECO Energy, Inc. 2004 Equity Incentive Plan (Exhibit 10.1, Form 10-Q for the quarter ended Jun. 30, 2008 of TECO Energy, Inc. and Tampa Electric Company). | * | ||
| 10.18 | Form of Performance Shares Agreement between TECO Energy, Inc. and certain officers under the TECO Energy, Inc. 2004 Equity Incentive Plan (Exhibit 10.3, Form 10-Q for the quarter ended Jun. 30, 2009 of TECO Energy, Inc. and Tampa Electric Company). | * | ||
| 10.19 | Form of Restricted Stock Agreement between TECO Energy, Inc. and S. W. Hudson under the TECO Energy, Inc. 2004 Equity Incentive Plan. (Exhibit 10.3, Form 10-Q for the quarter ended Jun. 30, 2008 of TECO Energy, Inc. and Tampa Electric Company). | * | ||
| 10.20 | Nonstatutory Stock Option granted to S. W. Hudson, dated as of Jul. 6, 2004, under the TECO Energy, Inc. 2004 Equity Incentive Plan (Exhibit 10.1, Form 10-Q for the quarter ended Jun. 30, 2004 of TECO Energy, Inc. and Tampa Electric Company). | * | ||
| 10.21 | Compensatory Arrangements with Executive Officers of TECO Energy, Inc. | |||
| 10.22 | Compensatory Arrangements with Non-Management Directors of TECO Energy, Inc. | |||
| 10.23 | Insurance Agreement dated as of Jan. 5, 2006 between Tampa Electric Company and Ambac Assurance Corporation (Exhibit 10.1, Form 8-K dated Jan. 19, 2006 of Tampa Electric Company). | * | ||
| 10.24 | Second Amended and Restated Credit Agreement dated as of May 9, 2007, among TECO Finance, Inc., as Borrower, TECO Energy, Inc. as Guarantor, JPMorgan Chase Bank, N.A., as Administrative Agent, and the Lenders and LC Issuing Banks party thereto (Exhibit 4.1, Form 8-K dated May 9, 2007 of TECO Energy, Inc.). | * | ||
| 10.25 | Second Amended and Restated Credit Agreement dated as of May 9, 2007, among Tampa Electric Company, as Borrower, Citibank, N.A., as Administrative Agent, and the Lenders and LC Issuing Banks party thereto (Exhibit 4.2, Form 8-K dated May 9, 2007 of Tampa Electric Company). | * | ||
| 10.26 | Purchase and Contribution Agreement dated as of Jan. 6, 2005, between Tampa Electric Company as the Originator and TEC Receivables Corporation as the Purchaser (Exhibit 4.1, Form 8-K dated Jan. 6, 2005 of TECO Energy, Inc. and Tampa Electric Company). | * | ||
| 10.27 | Loan and Servicing Agreement dated as of Jan. 6, 2005, among TEC Receivables Corp. as Borrower, Tampa Electric Company as Servicer, certain lenders named therein and Citicorp North America, Inc. as Program Agent (Exhibit 4.2, Form 8-K dated Jan. 6, 2005 of TECO Energy, Inc. and Tampa Electric Company). | * | ||
182
Table of Contents
| 10.28.1 | Omni bus Amendment No. 3 to Loan and Servicing Agreement dated as of December 22, 2006, among TEC Receivables Corp. as Borrower, Tampa Electric Company as Servicer, certain lenders named therein and Citicorp North America, Inc. as Program Agent (also amending the agreement identified in Exhibit 10.26 here in). | |||
| 10.28.2 | Amendment No. 6 to Loan and Servicing Agreement dated as of December 18, 2008, among TEC Receivables Corp. as Borrower, Tampa Electric Company as Servicer, certain lenders named therein and Citicorp North America, Inc. as Program Agent (Exhibit 99.1, Form 8-K dated Dec.18, 2008 of TECO Energy, Inc. and Tampa Electric Company). | * | ||
| 10.28.3 | Amendment No. 8 to Loan and Servicing Agreement dated as of February 19, 2010, among TEC Receivables Corp. as Borrower, Tampa Electric Company as Servicer, certain lenders named therein and Citicorp North America, Inc. as Program Agent. | |||
| 10.29 | Insurance Agreement dated as of May 14, 2007 between Tampa Electric Company and Financial Guaranty Insurance Company (Exhibit 10.1, Form 8-K dated May 14, 2007 of Tampa Electric Company). | * | ||
| 10.30 | Retirement Agreement and General Release between Peoples Gas Systems and William N. Cantrell dated Aug. 11, 2009 (Exhibit 10.1, Form 8-K dated Aug. 11, 2009 of TECO Energy, Inc. and Tampa Electric Company). | * | ||
| 10.31 | Retirement Agreement and General Release between Tampa Electric Comapany and Charles R. Black dated Aug. 31, 2009 (Exhibit 10.1, Form 8-K dated Aug. 31, 2009 of TECO Energy, Inc. and Tampa Electric Company). | * | ||
| 12.1 | Ratio of Earnings to Fixed Charges – TECO Energy, Inc. | |||
| 12.2 | Ratio of Earnings to Fixed Charges – Tampa Electric Company. | |||
| 21 | Subsidiaries of the Registrant. | |||
| 23.1 | Consent of Independent Certified Public Accountants – TECO Energy, Inc. | |||
| 23.2 | Consent of Independent Certified Public Accountants – Tampa Electric Company. | |||
| 23.3 | Consent of Marshall Miller & Associates. | |||
| 31.1 | Certification of the Chief Executive Officer of TECO Energy, Inc. pursuant to Securities Exchange Act Rules 13a-14(a) and 15d-14(a) as adopted pursuant to Section 302 of the Sarbanes- Oxley Act of 2002. | |||
| 31.2 | Certification of the Chief Financial Officer of TECO Energy, Inc. pursuant to Securities Exchange Act Rules 13a-14(a) and 15d-14(a) as adopted pursuant to Section 302 of the Sarbanes- Oxley Act of 2002. | |||
| 31.3 | Certification of the Chief Executive Officer of Tampa Electric Company pursuant to Securities Exchange Act Rules 13a-14(a) and 15d-14(a) as adopted pursuant to Section 302 of the Sarbanes- Oxley Act of 2002. | |||
| 31.4 | Certification of the Chief Financial Officer of Tampa Electric Company to Securities Exchange Act Rules 13a-14(a) and 15d-14(a) as adopted pursuant to Section 302 of the Sarbanes- Oxley Act of 2002. | |||
| 32.1 | Certification of the Chief Executive Officer and Chief Financial Officer of TECO Energy, Inc. pursuant to 18 U.S.C. Section 1350 as adopted pursuant to Section 906 of the Sarbanes-Oxley Act of 2002. (1) | |||
| 32.2 | Certification of the Chief Executive Officer and Chief Financial Officer of Tampa Electric Company pursuant to 18 U.S.C. Section 1350 as adopted pursuant to Section 906 of the Sarbanes-Oxley Act of 2002. (1) | |||
| (1) | This certification accompanies the Annual Report on Form 10-K and is not filed as part of it. |
| * | Indicates exhibit previously filed with the Securities and Exchange Commission and incorporated herein by reference. Exhibits filed with periodic reports of TECO Energy, Inc. and Tampa Electric Company were filed under Commission File Nos. 1-8180 and 1-5007, respectively. |
Certain instruments defining the rights of holders of long-term debt of TECO Energy, Inc. and its consolidated subsidiaries authorizing in each case a total amount of securities not exceeding 10% of total assets on a consolidated basis are not filed herewith. TECO Energy, Inc. will furnish copies of such instruments to the Securities and Exchange Commission upon request.
Certain instruments defining the rights of holders of long-term debt of Tampa Electric Company authorizing in each case a total amount of securities not exceeding 10% of total assets on a consolidated basis are not filed herewith. Tampa Electric Company will furnish copies of such instruments to the Securities and Exchange Commission upon request.
Executive Compensation Plans and Arrangements
Exhibits 10.1 through 10.22, and Exhibits 10.30 and 10.31 above are management contracts or compensatory plans or arrangements in which executive officers or directors of TECO Energy, Inc. participate.
183