Attached files
Table of Contents
UNITED STATES
SECURITIES AND EXCHANGE COMMISSION
WASHINGTON, D.C. 20549
FORM 10-K
(Mark One)
| x | ANNUAL REPORT PURSUANT TO SECTION 13 OR 15(d) OF THE SECURITIES EXCHANGE ACT OF 1934 |
For the fiscal year ended December 31, 2009
OR
| ¨ | TRANSITION REPORT PURSUANT TO SECTION 13 OR 15(d) OF THE SECURITIES EXCHANGE ACT OF 1934 |
For the transition period from to
| COMMISSION FILE NUMBER | 001-32432 | |||
| 333-88168 |
SYNIVERSE HOLDINGS, INC.
SYNIVERSE TECHNOLOGIES, INC.
(Exact name of registrant as specified in its charter)
| Delaware | 30-0041666 | |
| Delaware | 06-1262301 | |
| (State or other jurisdiction of incorporation or organization) | (I.R.S. Employer Identification No.) |
8125 Highwoods Palm Way
Tampa, Florida 33647
(Address of principal executive office)
(Zip code)
(813) 637-5000
(Registrant’s telephone number, including area code)
Securities registered pursuant to section 12(b) of the Exchange Act:
| Title of each class |
Name of each exchange on which registered | |
| Syniverse Holdings, Inc. Common Stock, $0.001 per share | New York Stock Exchange |
Securities registered pursuant to section 12(g) of the Exchange Act: None
Indicate by check mark if the registrant is a well-known seasoned issuer, as defined in Rule 405 of the Securities Act. Yes x No ¨
Indicate by check mark if the registrant is not required to file reports pursuant to Section 13 or Section 15(d) of the Act.
| Syniverse Holdings, Inc. |
Yes ¨ No x | |||
| Syniverse Technologies, Inc. |
Yes x No ¨ |
Indicate by check mark whether the registrant: (1) has filed all reports required to be filed by Section 13 or 15(d) of the Securities Exchange Act of 1934 during the past 12 months (or for such shorter period that the registrant was required to file such reports), and (2) has been subject to such filing requirements for the past 90 days. Yes x No ¨
Indicate by check mark whether the registrant has submitted electronically and posted on its corporate Web site, if any, every Interactive Data File required to be submitted and posted pursuant to Rule 405 of Regulations S-T (§232.405 of this chapter) during the preceding 12 months (or for such shorter period that the registrant was required to submit and post such files). Yes ¨ No ¨
Indicate by check mark if disclosure of delinquent filers pursuant to Item 405 of Regulation S-K (§229.405 of this chapter) is not contained herein, and will not be contained, to the best of Registrant’s knowledge, in definitive proxy or information statements incorporated by reference in Part III of this Form 10-K or any amendment to this Form 10-K. ¨
Indicate by check mark whether the registrant is a large accelerated filer, an accelerated filer, a non-accelerated filer, or a smaller reporting company. See the definitions of “large accelerated filer,” “accelerated filer” and “smaller reporting company” in Rule 12b-2 of the Exchange Act.
| Large accelerated filer x | Accelerated filer ¨ | Non-accelerated filer ¨ | Smaller reporting company ¨ |
(Do not check if a smaller reporting company)
Indicate by check mark whether the registrant is a shell company (as defined in Rule 12b-2 of the Exchange Act). Yes ¨ No x
As of June 30, 2009, the last business day of the Registrants’ most recently completed second fiscal quarter, the aggregate market value of their common equity held by non-affiliates was $1,093,901,210 based on the closing sales price as reported on the New York Stock Exchange. This calculation of market value has been made for the purposes of this report only and should not be considered as an admission or conclusion by the Registrants that any person is in fact an affiliate of the Registrants.
As of February 24, 2010, there were 69,385,368 shares of Syniverse Holdings, Inc.’s common stock outstanding. As of February 24, 2010 there were 2,000 shares of Syniverse Technologies, Inc.’s common stock outstanding, all of which are owned of record by Syniverse Holdings, Inc.
Documents Incorporated by Reference
The information called for by Part III is incorporated by reference to the definitive proxy statement for the registrant’s 2010 Annual Meeting of Stockholders, which will be filed with the Securities and Exchange Commission not later than 120 days after December 31, 2009.
Table of Contents
SYNIVERSE TECHNOLOGIES, INC.
FORM 10-K
FOR THE YEAR ENDED DECEMBER 31, 2009
TABLE OF CONTENTS
| Page | ||||
| PART I | ||||
| Item 1. |
6 | |||
| Item 1A. |
22 | |||
| Item 1B. |
31 | |||
| Item 2. |
31 | |||
| Item 3. |
31 | |||
| Item 4 |
31 | |||
| PART II | ||||
| Item 5. |
32 | |||
| Item 6. |
34 | |||
| Item 7. |
Management’s Discussion and Analysis of Financial Condition and Results of Operations |
36 | ||
| Item 7A. |
54 | |||
| Item 8. |
55 | |||
| Item 9. |
Changes in and Disagreements with Accountants on Accounting and Financial Disclosure |
55 | ||
| Item 9A. |
55 | |||
| Item 9B. |
58 | |||
| PART III | ||||
| Item 10. |
59 | |||
| Item 11. |
59 | |||
| Item 12. |
Security Ownership of Certain Beneficial Owners and Management and Related Stockholder Matters |
59 | ||
| Item 13. |
Certain Relationships and Related Transactions and Director Independence |
59 | ||
| Item 14. |
59 | |||
| PART IV | ||||
| Item 15. |
60 | |||
| 107 | ||||
| 108 | ||||
2
Table of Contents
CAUTIONARY NOTICE REGARDING FORWARD-LOOKING STATEMENTS
Certain of the statements in this Report, including, without limitation, those related to our future operations or results under the caption entitled “Management’s Discussion and Analysis of Financial Condition and Results of Operations,” may constitute “forward-looking statements” for purposes of Section 27A of the Securities Act of 1933 and Section 21E of the Securities Exchange Act of 1934. Forward-looking statements include statements with respect to our beliefs, plans, objectives, goals, targets, expectations, anticipations, assumptions, estimates, intentions and future performance, and involve known and unknown risks, uncertainties and other factors, many of which may be beyond our control, and which may cause our actual results, performance or achievements, or the global telecommunications industry or economy generally, to be materially different from future results, performance or achievements expressed or implied by such forward-looking statements.
All statements other than statements of historical fact are statements that may be forward-looking statements. You can identify these forward-looking statements through our use of words such as “may,” “will,” “anticipate,” “assume,” “should,” “indicate,” “would,” “believe,” “contemplate,” “expect,” “estimate,” “continue,” “plan,” “target,” “point to,” “project,” “predict,” “could,” “intend,” “potential,” and other similar words and expressions of the future or otherwise regarding the outlook for our future business and financial performance and/or the performance of the global telecommunications industry and economy generally. Such forward looking statements include, without limitation, statements regarding:
| • | expectations of growth of the global wireless telecommunications industry, including increases in new wireless technologies including smartphones, wireless subscribers, wireless usage, roaming, mobile data, number portability and SMS and MMS messaging; |
| • | increases in demand for our services due to growth of the global wireless telecommunications industry, greater technology complexity and the introduction of new and incompatible wireless technologies; |
| • | expectations of increases in our 2010 revenue; |
| • | expectations of increases in our revenue generated outside North America due to increasing sales to new and existing global customers; |
| • | our beliefs of the effects that the current economic conditions will have on our business; |
| • | 2010 capital expenditures; and |
| • | the sufficiency of our cash on hand, cash available from operations and cash available from our revolving line of credit to fund our operations, debt service and capital expenditures. |
The forward-looking statements may not be realized due to a variety of factors, including, without limitation:
| • | system failures, security breaches, delays and other problems; |
| • | the loss of major customers; |
| • | current economic conditions; |
| • | the inability of enacted legislation to stabilize the United States financial system; |
| • | the lack of provisions in most of our customer contracts related to minimum payments; |
| • | future consolidation among our customers that may cause decreased transaction volume and/or a reduction in our pricing; |
| • | the failure to adapt to rapid technological changes in the telecommunications industry; |
| • | intense competition in our market for services; |
| • | the advantages that many of our competitors have over us; |
| • | uncertain results from our continued expansion into international markets; |
| • | the costs and difficulties of acquiring and integrating complementary business and technologies; |
3
Table of Contents
| • | the difficulties of successfully integrating our operations with the acquisition of VeriSign’s messaging business (VM3); |
| • | the failure to achieve or sustain market acceptance at desired pricing levels or transaction volumes; |
| • | the inability of our customers to successfully implement our services; |
| • | the risk exposure related to our reliance on third-party providers for communications software, hardware and infrastructure; |
| • | the capacity limits on our network and application platforms and inabilities to expand and upgrade our systems to meet demand; |
| • | the reduction in levels of our customers’ subscriber usage patterns; |
| • | the failure to obtain additional capital on acceptable terms, or at all; |
| • | the failure to service our substantial debt; |
| • | our stock price volatility and volatility in the market generally; |
| • | regulations affecting our customers and us and future regulations to which they or we become subject to; |
| • | changes in accounting policies and procedures; |
| • | the inability to obtain or retain licenses or authorizations that may be required to sell our services internationally; |
| • | the failure to protect our intellectual property rights; |
| • | claims that we are in violation of intellectual property rights and any indemnities to our customers required therefrom; |
| • | the loss of key personnel and inabilities to successfully attract and retain personnel; |
| • | customer migrations from our services to in-house solutions; and |
| • | fluctuations in currency exchange rates. |
Although we presently believe that the plans, expectations and results expressed in or suggested by the forward-looking statements are reasonable, these forward-looking statements are based upon information presently available to our management and are inherently subjective, uncertain and subject to change, due to any number of risks and uncertainties, including, without limitation, those risks and factors discussed in this Annual Report on Form 10-K for the year ended December 31, 2009 under the captions “Management’s Discussion and Analysis of Financial Condition and Results of Operations – Forward-Looking Statements” and “Risk Factors,” and otherwise in the reports and filings that we make with the Securities and Exchange Commission. New factors emerge from time to time, and it is not possible for us to predict the nature, or assess the potential impact, of each new factor on our business. Accordingly, you should not place undue reliance on any forward-looking statements, since those statements speak only as of the date that they are made. We have no obligation and do not undertake to publicly update, revise or correct any of the forward-looking statements after the date of this Report, or after the respective dates on which such statements otherwise are made, whether as a result of new information, future events, or otherwise, except as otherwise may be required by law.
Market, Ranking and Other Data
The data included herein regarding markets and ranking, including the size of certain service markets and our position and the position of our competitors and customers within these markets, is based on independent industry publications, reports from government agencies or other published industry sources and our estimates are based on our management’s knowledge and experience in the markets in which we operate. When we rank
4
Table of Contents
our customers by size, we base those rankings on the number of subscribers our customers serve. When we describe our market position, we base those descriptions on the number of subscribers serviced by our customers. Our estimates have been based on information obtained from our customers, suppliers, trade and business organizations and other contacts in the markets in which we operate. We believe these estimates to be accurate as of the date of this Annual Report. However, this information may prove to be inaccurate because of the methods by which we obtain certain data for our estimates, because this information cannot always be verified with complete certainty due to limits on the availability and reliability of raw data, the voluntary nature of the data gathering process and other limitations and uncertainties inherent in a survey of market size. In addition, the provided market data is not a guaranty of future market characteristics because consumption patterns and consumer preferences can and do change.
5
Table of Contents
PART I
| ITEM 1. | BUSINESS |
Overview
We are a leading enabler of wireless voice and data services for telecommunications companies worldwide. For over 20 years, we have served as one of the wireless industry’s only operator-neutral intermediaries, solving the challenges that arise as new technologies, standards and protocols emerge. Our data clearinghouse, network and technology services solve technical and operational challenges for the wireless industry by translating incompatible communication standards and protocols and simplifying operator interconnectivity. Our suite of transaction-based services allows our customers to deliver seamless voice, data and next generation services to wireless subscribers, including wireless voice and data roaming, Short Message Service (SMS), Multimedia Messaging Services (MMS), number portability and value-added roaming services.
Demand for our services is driven primarily by wireless voice and data traffic, subscriber roaming activity, SMS and MMS messaging, number porting and next generation IP applications. The global wireless telecommunications industry is expected to grow due to continued subscriber growth, increased usage and deployment of new services. In addition, subscriber adoption of new technologies and services can also drive demand for our services due to the resulting increase in interoperability complexities. The global wireless industry relies on an extensive and complex set of communication standards, technical protocols, network interfaces and systems that must successfully communicate with one another in order to provide voice and data services to subscribers in their local markets and when roaming. The proliferation of these standards has resulted in technological incompatibilities, which are increasingly difficult to manage as new technologies and services are introduced and deployed. We believe that as telecommunications usage expands and complexity continues to increase, the demand for our services will grow.
We have developed a broad set of innovative interoperability solutions in response to the evolving needs of our customers. Through our integrated suite of services, we enable our customers to provide their subscribers with enhanced services including:
| • | national and international wireless voice and data roaming; |
| • | wireless data services, including SMS and MMS, across incompatible standards and protocols; |
| • | intelligent network services such as number portability and advanced IP service offerings; and |
| • | value-added roaming services. |
Our service platforms also enable our customers to rapidly and cost-effectively deploy next-generation wireless services including enhanced wireless data and value-added roaming services.
We generate the majority of our revenue on a per-transaction basis, and often receive revenue from multiple transactions during a single call or data session. The remainder of our revenue is generated from custom software development fees, hardware sales, professional services, and recurring, non-transaction fees for network connections and software maintenance.
6
Table of Contents
Executive Overview
Financial Highlights
For the year ended December 31, 2009, total revenue decreased $23.4 million, or 4.6%, to $483.0 million from $506.4 million for the same period in 2008. Net income decreased $12.8 million, or 16.3%, to $65.7 million for the year ended December 31, 2009 from $78.5 million for the same period in 2008. Diluted earnings per share was $0.96 and $1.15 for the years ended December 31, 2009 and 2008, respectively.
Technology Interoperability services revenues decreased $23.9 million, or 7.5%, to $293.8 million for the year ended December 31, 2009 from $317.7 million for the same period in 2008. The revenue decrease was driven by decreases in data clearinghouse services primarily resulting from lower prices associated with the renewal of the Verizon Wireless (Verizon) contract in September 2008 and the loss of mobile data roaming (MDR) transactions between Alltel and Sprint Nextel resulting from the Alltel/Sprint Nextel insourcing initiative combined with the Verizon acquisition of Alltel Corporation (Alltel). The impact of these decreases is partially offset by increased roaming volumes and messaging revenues of $33.2 million in the fourth quarter associated with our acquisition of the messaging business of VeriSign, Inc. (VM3). In addition, our technology turnkey solutions offering has experienced lower sales due to reduced capital spending by customers in the Asia Pacific region related to the economic downturn and increased competition.
Number Portability services revenues increased $2.4 million, or 8.1%, to $31.7 million for the year ended December 31, 2009 from $29.3 million for the same period in 2008 due to increased porting volumes. Network services revenues increased $0.3 million, or 0.2%, to $122.8 million for the year ended December 31, 2009 from $122.5 million for the same period in 2008. Revenues from Call Processing services, Enterprise Solutions and Off-Network Database Queries decreased a total of $2.1 million for the year ended December 31, 2009 as compared to the same period in 2008.
Business Developments
Acquisition of the Messaging Business of VeriSign, Inc.
On August 24, 2009, we entered into an acquisition agreement to acquire the messaging business of VeriSign, Inc. (VeriSign) for a purchase price of $175.0 million, subject to certain adjustments to reflect fluctuations in working capital. Under the acquisition agreement, we acquired the stock of VeriSign ICX Corporation and certain other assets associated with VeriSign’s Inter-Carrier Gateway, Premium Messaging Gateway, PictureMail Service and Mobile Enterprise Solutions businesses (collectively VM3). On October 23, 2009, the purchase was completed for cash proceeds of $175.0 million including final working capital adjustments of $0.5 million, which was paid subsequent to December 31, 2009. As of December 31, 2009, we have incurred $3.5 million of acquisition-related costs which are included in general and administrative expenses.
Through the acquisition of VM3, we believe we will expand our current messaging operations to achieve the solution’s scale, reach and capabilities needed to provide mobile customers with new service offerings to meet their subscribers’ growing need for messaging services.
Acquisition of Wireless Solutions International
On May 15, 2009, we acquired certain assets of Wireless Solutions International (WSI). The acquisition was funded by a cash payment from our existing cash balances and common stock. We believe the acquisition of this GSM Association (GSMA)-certified roaming hub provider will further enhance our global roaming reach.
India Number Portability Services
In February 2009, we entered into a joint venture agreement to implement number portability services in India. This joint venture was awarded the license for Zone 1, which includes the service areas of Delhi, Mumbai
7
Table of Contents
and nine other areas. We expect to provide India’s telecommunications customers with number portability clearinghouse and centralized database solutions for the next 10 years. The service offering is dependent on completing the processing platform and database, provider readiness and regulatory confirmation of the implementation timeline.
The Indian telecommunications regulatory authority announced an official delay in the implementation timeline to March 31, 2010. Our readiness efforts are continuing despite this announcement. We believe that further delays may be possible, which are dependent on provider readiness to implement number portability.
2008 Events Affecting 2009
During 2008, we became aware of several developments that have impacted our growth rates in 2009. These developments include the Alltel/Sprint Nextel insourcing initiative, the Verizon acquisition of Alltel and the Verizon renewal. Each of these developments is described below.
Alltel/Sprint Nextel Insourcing Initiative
In order to manage the expense associated with the significant volume growth in mobile data, Alltel and Sprint Nextel directly connected their IP backbone networks in January 2009. Thus, they no longer use Syniverse as a third party intermediary to manage the connectivity and exchange of billing records between their mobile data roaming platforms. Our revenue and net income for 2009 include the impact of this insourcing initiative from the January 2009 effective date.
Verizon Acquisition of Alltel
During the second quarter of 2008, Verizon announced that it would acquire Alltel. Verizon completed its acquisition of Alltel in January 2009. The impact of the combination of these two customers on us ranged across a variety of services, and affected revenues we receive not only from Verizon and Alltel, but from other roaming partners as well. As of December 31, 2009, we believe that all of the expected impact of the integration has been realized.
Verizon Renewal
Effective September 30, 2008, we have extended our contract with Verizon for three years at reduced prices. Verizon uses a large suite of services, for its data clearing and roaming operations – products such as MDR, data clearinghouse, Visibility, UniRoam and a number of other services. Verizon’s new terms and pricing remain transaction-based, primarily affecting Technology Interoperability Services.
Refer to “Item 7—Management’s Discussion and Analysis of Financial Condition and Results of Operations” for a detailed explanation of these results.
Business Description
We have built our reputation over the past 20 years by designing comprehensive solutions that solve wireless technology complexities as new technology standards and protocols emerge. Our integrated suite of services is described below.
Technology Interoperability Services
We operate one of the largest wireless clearinghouses globally, enabling the accurate invoicing and settlement of domestic and global wireless roaming telephone calls and wireless data events. We also provide financial settlement services, SMS and MMS routing and translation, roaming fraud prevention services, interstandard roaming solutions and MDR services between providers. We are a trusted intermediary and primary
8
Table of Contents
connection point between hundreds of wireless providers. In addition, we have expanded our mobile data solutions to include mobile broadband solutions, prepaid applications and value-added roaming services. We primarily generate revenue by charging per-transaction processing fees pursuant to long term contracts. We expect that increasing wireless roaming, mobile data and SMS and MMS volume will drive growth in our Technology Interoperability services.
Our technology interoperability services include:
| • | Data Clearinghouse Services. We process and exchange proprietary subscriber roaming usage data on a secure and confidential basis to support financial settlement between wireless customers and subscriber invoicing for services used while roaming. Our clearinghouse services support multiple billing formats including TAP for GSM customers and CIBER for CDMA customers. We also support Remote Authentication Dial-In User Service or RADIUS, and IPDR formats for wireless data transactions including messaging, mobile commerce, content, and location-based applications. Customers use our solutions to access custom, on-line reports providing business intelligence, trends and daily and monthly summaries of key data. Customers use these reports to track their net financial positions with their roaming partners. |
| • | Messaging Services. Our messaging services reliably translate, route and deliver SMS, MMS and other message formats across disparate networks. We accomplish the translating, routing and delivering of messages by mapping a message to a phone number, determining the appropriate operator, routing the message accurately and resolving incompatibility issues among CDMA, GSM and VoIP providers. Our services can deliver messages domestically and globally to multiple devices and platforms. |
| • | Roaming Facilitation. Our roaming facilitation capabilities allow wireless subscribers to receive voice and data services while roaming on another operator’s network, regardless of differing technology standards. We simplify inter-standard and global voice roaming by providing our customers with subscriber call origination, automatic call delivery and subscriber invoicing data. In addition, we offer value-added services to improve the subscribers’ experience while increasing the customers’ roaming revenues. |
| • | Mobile Data Roaming. Our mobile data roaming services provide connectivity and reach to CDMA mobile customers to expand the availability of mobile data services to their subscribers while roaming on other networks. These services provide customers with the ability to manage and control their data networks while improving the type and quality of service their subscribers receive. |
| • | DataNet. Our near-real time roaming data exchange service helps to reduce the losses our customers suffer from fraud by simplifying the management of roaming data collection, translation, analysis and routing between wireless operators. |
| • | Financial Settlement Services. We provide financial settlement services to GSM and CDMA customers worldwide. Our financial settlement services support the efficient and timely payment of roaming related charges by wireless operators to their roaming network partners across domestic and international boundaries. |
| • | Value-Added Roaming Services. We provide a suite of ancillary value-added roaming services to our customers, including re-rating, invoicing, reporting, tariff maintenance, inter-working services, TAP generation, conversion, Steering of Roaming, Welcome SMS, business intelligence and outsourcing and training. |
The acquisition of VM3 has resulted in the expansion of our global messaging capabilities and our integrated suite of services to include:
| • | Inter-Carrier Gateway enables customers to deliver inter-carrier person-to-person SMS and MMS messages across geographies and technologies. While we currently offer these services as described above in our Messaging Services, we have expanded our scale and reach in this offering. In addition, with the acquisition, we have gained a larger Tier 1 customer base for these services. |
9
Table of Contents
| • | PictureMail provides a state-of-the-art MMS platform with core components that include a hosted MMS service center (MMSC) for MMS routing, handset photo applications, a social networking interface, and photo storage and sharing capabilities. |
| • | Premium Messaging Gateway manages our customer’s delivery of “off-portal” or third-party content to subscribers. |
| • | Mobile Enterprise Solutions (MES) enables businesses to send time- and event-based messages or alerts via voice, text message or email to subscribers, employees or partners, and allows our customers to offer their high-value enterprise subscribers a broader array of services, including enterprise paging, mobile financial services and other advanced applications. |
Major customers who utilize our technology interoperability services include Verizon, Sprint Nextel, AT&T Mobility, U.S. Cellular, Bell Mobility, Virgin Mobile, Telus Communications and Centennial Cellular.
Network Services
We interconnect customers through our SS7 network to a suite of intelligent database services and provide wireless and fixed line call signaling services. Our intelligent database services include caller ID, local number portability, line information database and toll-free number routing. Customers also use our SS7 signaling solutions to set-up, translate and route telephone calls both domestically and globally. We also provide customers cost-effective, single-point connectivity to other widely used communication networks (such as Frame Relay and Internet Protocol) to support voice, SMS messaging, MMS messaging, VoIP and data roaming services.
By operating one of the largest independent SS7 networks, we provide our customers access to substantially the entire U.S. public-switched telecommunications network, global connectivity, operator-grade reliability and intelligent network services that provides a migration path for customers transitioning to all IP infrastructures. Our network architecture provides a robust, reliable, and highly redundant signaling platform. In addition, our intelligent network databases also permit customers to offer value-added calling features to their subscribers.
Our primary network services include SS7 network services, IP networking services, intelligent network database services and IPX transport services. We generate revenues from these services primarily by charging per-transaction processing fees, circuit fees, port fees and software license fees.
Our network services include:
| • | SS7 Network Services. We operate one of the largest independent SS7 networks in the United States. Our SS7 network supports the call set-up, routing and delivery of wireless and fixed line telephone calls and supports access to intelligent network database services. Our global signaling gateway for customers and other network providers translates between the predominant North American signaling standard (American National Standards Institute SS7) and other global signaling standards such as International Telecommunications Union C7. We also provide customers with network analysis tools that monitor subscriber activity. |
| • | IP Networking Services. Our IP networking services provide customers cost-effective single-point connectivity to many widely used communication networks such as Frame Relay and Internet Protocol. We provide a suite of services that enables subscribers to have seamless access to their home operators’ GPRS, HSPA (GSM) or 1x-RTT, 1xEV-DO (CDMA) data network while roaming both nationally and globally. This Internet Protocol based virtual private network offers secure access to home based e-commerce, public Internet, corporate intranets and e-mail systems to roaming subscribers. We also manage network circuits that interconnect operators’ cell sites and switches across local and regional boundaries. |
10
Table of Contents
| • | Intelligent Network Database Services. Our intelligent network database services enable customers to offer enhanced services and features to subscribers. Our caller ID service provides access to calling name databases, allowing customers to query local exchange carriers and other major independent telephone operators to reduce the “name not available” messages that subscribers receive. We provide access to all U.S. regional number portability databases to support call routing to subscribers who have ported their telephone number to a different service provider. We also access databases that provide routing for toll free numbers. We access line information databases to provide enhanced services such as validating telephone numbers, billing information and calling card data. |
| • | IPX Transport Service. IPX is an open, standardized, IP connectivity model for multiple types of service providers. IPX Transport Service is a global, private, IP network which supports end-to-end quality of service. IPX Transport network provides the ability to operate, bill, and manage customized, ubiquitous services over a single transport facility. Specific service examples available over IPX Transport include: Roaming Exchange—GRX, CRX, MDR, CDMA, Wifi, and GPRS/UMTS. Signaling traffic will be supported over the IP network via the industry standard SS7oIP—SCTP/ Sigtran protocols. |
Major customers who utilize our network services include AT&T Mobility, Sprint Nextel, T-Mobile, Verizon Wireless, U.S. Cellular, MetroPCS, Videotron and Cox Communications.
Number Portability Services
We are a leading provider of number portability services to U.S. and Canadian customers, as well as customers in other countries including Singapore. These services enable subscribers to switch operators while keeping the same telephone number. As number portability-related technology and operational complexities were identified, we developed solutions that facilitated the exchange of information between operators and transmitted information to regional industry databases. These services route and track the multiple transactions involved in porting numbers between service providers and identify and facilitate problem resolution when porting transactions are not successful. These services also manage the unique challenges of porting numbers between wireless and fixed line providers and from operators who have chosen to manually process porting transactions.
We have been designated as a master database administrator in Singapore, expanding our suite of number portability services. Our centralized number portability database solution for Singapore supplies all mobile operators with the ability to port numbers by providing the ability to agree and coordinate ports between themselves. In the future, we will also support fixed and emerging operators who are required to port numbers in Singapore. In addition, our solution will maintain the master routing database for ported numbers and provide updates to operators for use in routing calls or SMS messages.
In February 2009, we entered into a joint venture agreement to implement number portability services in India. This joint venture was awarded the license for Zone 1, which includes the service areas of Delhi, Mumbai and nine other areas. We expect to provide India’s telecommunications operators with number portability clearinghouse and centralized database solutions for the next 10 years. The service offering is dependent on completing the processing platform and database, operator readiness and regulatory confirmation of the implementation timeline.
We generate revenues from number portability services primarily by charging per-transaction fees and fixed fees. We anticipate that subscriber growth and international implementation of number portability will present opportunities for us to grow our number portability services operations.
Call Processing Services
We provide global call handling and fraud management solutions that enable subscribers from one operator to make and receive telephone calls while roaming on another operator’s network. We support global roaming by
11
Table of Contents
connecting wireless operators and by resolving geographic and operator differences in subscriber verification, call delivery and signaling network protocols. We also offer customers comprehensive fraud detection and fraud prevention services.
Our primary call processing services include signaling solutions and fraud prevention services. We generate revenues from these services primarily by charging per-transaction processing fees.
Our Call Processing Services include:
| • | Signaling Solutions. Our services verify a CDMA subscriber’s eligibility to receive service while roaming internationally in another operator’s market. Our signaling solutions also resolve conflicting global numbering plans and overlapping system identifiers to allow subscribers to roam when the visited service provider may not normally recognize the subscriber. |
| • | Fraud Prevention Services. We provide multiple services to customers to minimize the financial losses associated with subscriber fraud. Our fraud profiling solutions collect usage data from mobile switches to create a unique profile for each subscriber based upon the subscriber’s call activity. |
Enterprise Solutions
We enable customers to offer billing consolidation and data management services to large enterprise subscribers. Our solutions consolidate subscriber usage data on to one invoice and offer robust online reporting and analysis tools that enable enterprise subscribers to manage their telecommunications-related costs. We generate revenues from this service on a per-subscriber processing basis.
Off-Network Database Queries
We provide our customers with the ability to connect to various third-party intelligent network database providers. These providers charge us a per-transaction fee for access to their databases, which we pass on to our customers with little or no margin.
Segments
We operate as a single operating segment, since our chief operating decision maker decides resource allocations on the basis of our consolidated financial results.
Revenues by service offerings are as follows:
| Year Ended December 31, | |||||||||
| 2009 | 2008 | 2007 | |||||||
| Technology Interoperability Services |
$ | 293,782 | $ | 317,685 | $ | 184,471 | |||
| Network Services |
122,804 | 122,529 | 124,788 | ||||||
| Number Portability Services |
31,654 | 29,291 | 27,128 | ||||||
| Call Processing Services |
28,126 | 29,720 | 31,421 | ||||||
| Enterprise Solutions |
1,322 | 2,387 | 4,084 | ||||||
| Off Network Database Queries |
5,303 | 4,744 | 5,632 | ||||||
| Total Revenues |
$ | 482,991 | $ | 506,356 | $ | 377,524 | |||
12
Table of Contents
Revenues by geographic region based on the “bill to” location on the invoice, are as follows:
| Year Ended December 31, | |||||||||
| 2009 | 2008 | 2007 | |||||||
| North America (U.S. and Canada) |
$ | 351,378 | $ | 361,438 | $ | 291,186 | |||
| Asia Pacific |
39,392 | 46,445 | 41,725 | ||||||
| Caribbean and Latin America (includes Mexico) |
32,817 | 30,666 | 23,860 | ||||||
| Europe, Middle East and Africa |
54,101 | 63,063 | 15,121 | ||||||
| Off Network Database Queries (i) |
5,303 | 4,744 | 5,632 | ||||||
| Total Revenues |
$ | 482,991 | $ | 506,356 | $ | 377,524 | |||
| (i) | Off-Network Database Queries are not allocated to geographic regions. |
For the years ended December 31, 2009, 2008 and 2007, we derived 68.7%, 67.9% and 73.3%, respectively, of our revenues from customers in the United States.
In January 2010, we began implementing changes to our internal operating structure as a result of the acquisition of the VM3 messaging business in October 2009. In line with our strategies and realignment of our services to better coordinate our operations with similar type service offerings, we are reorganizing our operations into three primary lines of business with business leaders heading each line of business with profitability responsibility for their respective business unit. This ensures that we are aligning our resources closer to where decisions are made that affect our customers. Our corporate and shared service functions are streamlining their organizations and focusing them on core activities that can more efficiently support the goals of the business units. Our new operating structure has resulted in changes to our reportable business segments beginning in the first quarter of 2010.
The three lines of business as well as the services included in each are as follows:
| • | Roaming. The Roaming line of business will include all of the services currently included in our Technology Interoperability Services, with the exception of the technology turn-key solutions and Messaging Services including the VM3 assets, which will be included in a separate line of business as described below. In addition, Roaming will include all of the services currently described in our Call Processing Services section. |
| • | Messaging. The Messaging line of business will include our existing Messaging Services and the services of the recently acquired VM3 business, as currently described in our Technology Interoperability Services section. |
| • | Network. The Network line of business will include all of the services currently included in our Network Services and Enterprise Solutions sections, as well as our Number Portability Services. |
In addition, we will also report a separate “Other” category, which will be comprised of our technology turn-key solutions, also known as our ITHL business; sales, marketing, corporate administrative and other functions. Our ITHL business provides value-added services to customers in the Asia Pacific region. The ITHL operations are different from our core transaction-based revenue generating services.
We will begin reporting these new segments in our first interim reporting period ending March 31, 2010.
Industry Summary
The global wireless industry has grown significantly since its inception as wireless services have become increasingly available and affordable. According to CTIA—The Wireless Association, the U.S. wireless industry has grown from an estimated total subscriber base of 97.0 million in 2000 to 276.6 million by mid-year 2009, a
13
Table of Contents
185% increase. CTIA also reported that twelve-month total wireless service revenues grew from $45.3 billion to $151.2 billion in the 9 years ending June 2009, a 234% increase. Additionally, reported annualized wireless minutes have grown to over 2.25 trillion in June 2009. This expanding subscriber base and corresponding growth in industry revenues has been driven by improved service quality, greater national and international wireless roaming coverage, decreased pricing and the growth in messaging, mobile data and content services.
On a global basis, similar trends have been cited by Informa, an industry research firm. According to an Informa forecast:
| • | Total worldwide subscribers will rise by 23% from 2008—2013 to nearly 3.5 billion, while global roaming subscribers are expected to rise by 64% to 600 million over the same period. |
| • | Global roaming revenues are expected to increase by 27% from 2008—2013 to nearly $32 billion, with a rising share of roaming revenues from data and SMS. |
| • | Data and SMS share of mobile roaming revenues is expected to rise steadily from 2008—2013. Global non-messaging data roaming revenues will grow at an average of 29% per year over the forecast period, with annual revenues in 2013 reaching $1.4 billion. Non-messaging data revenues will overtake SMS revenues in 2012 with over 20% annual growth in 2013. |
Wireless industry growth has been accompanied by a steady introduction of new and often incompatible technologies. This has resulted in the proliferation of different network architectures, including various mobile switch types (such as those manufactured by Alcatel-Lucent, Nortel, Ericsson and Motorola), diverse signaling standards (such as Code Division Multiple Access, or CDMA; Global System for Mobile Communication, or GSM; Integrated Digital Enhanced Network, or iDEN; Long Term Evolution, or LTE, WiMAX and Wi-Fi), distinct billing record formats (such as Cellular Intercarrier Billing Exchange Record, or CIBER; Transferred Account Procedure, or TAP; and Remote Authentication Dial-In User Service, or RADIUS) and multiple network protocols (such as Frame Relay, SS7 and Internet Protocol). This has created significant technological incompatibilities and operational challenges for wireless customers.
As a result, many customers utilize third-party technology services providers like us to:
| • | serve as a trusted intermediary for proprietary data exchange between competitive wireless operators; |
| • | provide centralized, single point connectivity to the systems and networks of multiple operators; |
| • | enable communication between new and legacy operator systems by resolving incompatibilities associated with geographic and operator variations in communication protocols; |
| • | simplify the operational challenges associated with operator differences in the timing of new technology deployment; |
| • | offer access to a range of intelligent network database services required for enhanced wireless services; and |
| • | rapidly develop new solutions to meet emerging wireless industry technology complexities and to support next generation services such as wireless data and VoIP. |
Market Opportunity
We expect the technology complexities and operational challenges faced by communications providers to continue to grow as the industry evolves. These complexities and challenges are driven by a variety of wireless industry trends including the growth in the number of wireless telephone subscribers, the volume of wireless roaming telephone calls and the growing volume of SMS and MMS messages and wireless data events. In addition, we believe the emergence of next-generation wireless communication services such as WiMAX, LTE and VoIP, future possible government mandated changes, and new applications for existing communications services will drive future industry growth.
14
Table of Contents
Technology Interoperability Services
The proliferation and evolution of incompatible communication protocols, messaging/data formats and billing standards has made it increasingly difficult for our customers to connect systems and networks and to share the information required to offer seamless global wireless voice and data services to subscribers. Technology service providers solve these interoperability problems by offering wireless roaming clearinghouse services, SMS and MMS messaging translation and routing services, and wireless data roaming facilitation and clearinghouse solutions to support emerging mobile data services.
Clearinghouses translate various network signaling and billing protocols to allow different operators to offer and be compensated for roaming services. These wireless clearinghouses serve as trusted third parties for the collection, translation and distribution of the information required to monitor and invoice services provided by one operator to numerous other operators’ subscribers. Demand for clearinghouse services is primarily driven by the number of domestic and international wireless roaming subscribers. We expect that increased roaming traffic volumes will drive incremental technology interoperability and clearinghouse transaction volumes for the industry.
The growth of SMS and MMS messaging is also driving significant operational challenges for our customers. Cross-operator SMS messaging and MMS messaging requires extensive network connectivity and complex message protocol conversion between wireless operators. Operator-grade message translation and routing are critical to wireless operators who increasingly rely on messaging services to drive incremental revenue growth and to improve customer retention.
According to Portio Research, a mobile and wireless sector research firm, worldwide SMS traffic is expected to grow from 5.5 trillion messages in 2009 to 11.5 trillion messages in 2014 (a compound annual growth rate of approximately 16%), with this growth expected to be driven by an increase in the SMS traffic in North America challenging Asia Pacific’s lead position in the worldwide SMS market. Worldwide MMS traffic is expected to grow from 119.0 billion messages in 2009 to 385.1 billion messages in 2014 (a compound annual growth rate of approximately 26%), and this growth is expected to be driven by an increase in MMS traffic in North America and European regions with continued strong contributions from Asia Pacific.
The emergence of mobile data and premium content services are also driving demand for clearinghouse services, translation services and roaming facilitation services. This growth has been and will continue to be supported by the deployment of next generation data networks. We believe the increase in data roaming will drive the need for data clearinghouse services that simplify network connectivity and the exchange of invoicing data between multiple operators.
Network Services
SS7 networks are a core element of today’s telecommunications infrastructure. SS7 is the telecommunications industry’s standard network signaling protocol used by substantially all operators to enable the setup and delivery of telephone calls and to offer enhanced calling features like caller ID. Outsourced network services provide operators cost effective, single point connectivity to an SS7 network, other widely used communication networks and critical databases. As a result, operators avoid the cost and complexity of managing individual network connections to multiple operators, eliminate the expense of licensing and maintaining intelligent network revenues databases and reduce the need for building capital-intensive network infrastructure. Drivers of network services include subscriber growth, roaming call volume growth, roaming data growth and SMS messaging volume growth.
In addition, data roaming requires operators to support packet-switched, Internet Protocol-based communications protocols including General Packet Radio Service, or GPRS; High Speed Packet Access, or HSPA; 1 x Radio Transmission Technology, or 1xRTT; and 1 x Evolution—Data Optimized, or 1xEV-DO (technology designed to support faster data transmission). Technology service providers support data roaming
15
Table of Contents
services and enable subscribers to access their home wireless data services (such as public Internet, corporate intranets, e-mail and m-commerce) while abroad or beyond the reach of their home network. The emergence of Internet Protocol-based signaling solutions and database services associated with VoIP will also require network, routing and translation services to communicate with legacy networks. VoIP offers traditional voice telephone services but at a significantly lower cost by bypassing the traditional telephone network.
In February 2009, we launched our IP Packet eXchange Network Transport solution, or IPX, to help global operators keep up with increasing volumes while maintaining quality of service for subscribers. IPX provides our customers’ access to a full suite of mobile data services via a single ubiquitous network while supporting emerging 3G Plus solutions. Via this global network solution, operators connect to a single network to utilize a full suite of data services. This approach means customers can reduce costs by adding additional services or increasing capacity without needing to connect to additional networks.
Number Portability Services
In 1996, the United States Federal Communications Commission, or FCC, mandated number portability services to encourage competition by permitting subscribers to change operators while retaining their current telephone numbers. Regulators in Canada, Singapore and India have also mandated number portability. Other jurisdictions around the world are currently mandating or are analyzing the need for the implementation of number portability services. To facilitate the portability of telephone numbers, operators exchange information with other operators and transmit information to regional number portability databases in order to support call routing. Implementation of number portability services impacts nearly every system within operator operations including network signaling and routing, switching, billing, point of sale and customer care.
Technology service providers enable operators to implement number portability services to their customers by streamlining the ordering and communication processes that organize, prioritize and route number portability transactions between operators and industry databases. These services must be able to route and track the multiple transactions involved in porting numbers between service providers, identify and facilitate problem resolution, manage the unique challenges of porting between fixed line and wireless operators, and interface to operators who have chosen less automated porting solutions.
Following the introduction of number portability services in the U.S., the telecommunications industry experienced rapid consumer adoption. We expect the drivers of number portability services demand will be continued increase in the number of wireless subscribers, operator competition and increased regulatory focus, and adoption of number portability services in other countries around the world. In addition, there has been a greater tendency of subscribers to transition away from fixed lines to wireless or VoIP services.
Call Processing Services
Call processing solutions support the proper authentication, handling and routing of telephone calls in order to reduce fraud and to allow CDMA wireless subscribers to make and accept telephone calls while roaming on another operator’s network. Wireless roaming growth is causing new call routing and delivery complexities for operators. Due to geographic and operator differences in subscriber verification, call delivery and signaling network protocols, these services require extensive data management capabilities.
Drivers of call processing demand include international wireless subscriber growth and international wireless roaming call volume growth. Operators are increasingly using SS7 networks to replace traditional call processing functionality and to address wireless subscriber fraud issues.
Customers
We provide our services to approximately 700 telecommunications operators and to over 100 enterprise customers in approximately 160 countries. Our customers include wireless operators, telecommunications providers, internet service providers and social networking portals, cable companies and other non-traditional
16
Table of Contents
enterprise clients. We serve most of the largest global wireless telecommunications providers including American Moviles, AT&T Mobility, China Mobile, China Unicom, Orange, Reliance Communications, Sprint Nextel, T-Mobile, Telecom Italia, Telefonica, Telenor, TeliaSonera, Turkcell, Telecom Italia, Verizon Wireless, VimpelCom and Vodafone. We believe that maintaining strong relationships with our customers is one of our core competencies and that maintaining these relationships is critical to our success.
For the year ended December 31, 2009, sales to one customer were 21.0% of total revenues. No other customer represented more than 10% of revenues for the year ended December 31, 2009, although a significant amount of our remaining revenues were generated from services provided to a small number of other customers. We expect two customers will individually represent more than 10% of revenues in 2010 as a result of the acquisition of VM3.
Our three largest customers for the year ended December 31, 2009 represented approximately 35% of our revenues in the aggregate, while our ten largest customers for the year ended December 31, 2009 represented approximately 50% of our revenues in the aggregate. In 2010, we expect our three largest customers will represent approximately 42% of our revenues in the aggregate, while our ten largest customers are anticipated to represent approximately 59% of our revenues with the acquisition of VM3.
Competition
We have a number of competitors for each specific service that we offer.
| • | Technology Interoperability Services. Our primary competitors include MACH, TNS, Inc. and Sybase. Certain wireless operators also choose to deploy in-house interoperability and billing solutions for clearing their own and affiliate traffic. |
| • | Network Services. Our competitors for SS7 network connectivity and intelligent network services include TNS, Inc., AT&T, Tata Communications Limited and local exchange carriers. Wireless and fixed line operators may also choose to deploy and manage their own in-house SS7 networks. Our network services compete with a variety of companies including TNS, Inc. and Aicent in the U.S. and Cable & Wireless, Global Crossing, France Telecom, BICS, KPN and Qwest internationally. |
| • | Number Portability Services. Our primary competitors in the United States for number portability services are NeuStar and Telcordia. Internationally, primary competitors include Telcordia, Neustar and Accenture, as well as several other smaller companies. |
| • | Call Processing Services. Our call processing services primarily compete with products from Tata Communications Limited and TNS, Inc. |
| • | Enterprise Solutions. Certain wireless operators have developed their own services for enterprise account management. |
Competitive factors in the market for our services primarily include breadth and quality of services offered, price, development capability and new product innovation.
Competitive Strengths
We believe that the following strengths differentiate us in the marketplace:
| • | Leading provider of roaming enablement, signaling and interoperability solutions to the wireless industry. We believe we are a leading provider of roaming, signaling and interoperability solutions to wireless operators worldwide. Our solutions allow wireless operators to deliver seamless voice, data and next-generation services to wireless subscribers, including roaming, SMS, MMS, MDR, caller ID, number portability and value-added services. We believe our extensive experience solving interoperability challenges of the wireless industry positions us well as new technology incompatibilities and complexities emerge with the introduction of new wireless voice and data services. |
17
Table of Contents
| • | Global customer base. We currently provide our services to approximately 700 telecommunications operators and to over 100 enterprise customers in approximately 160 countries. |
| • | Transaction-based business model with recurring revenues and strong operating cash flows. Our historical success in customer retention, growth in transaction volumes and ability to leverage existing technology platforms to serve additional customers enable us to generate a high level of recurring revenues and strong operating cash flows. |
| • | Extensive and collaborative relationships. We maintain collaborative relationships with many of our customers and have jointly developed applications and services designed specifically to meet their business requirements. This unique positioning enables us to more effectively anticipate, identify and address evolving industry needs and opportunities. |
| • | Proven track record of technology innovation enables us to address the evolving needs of our customers. We have a long history of providing solutions to the wireless industry for over 20 years. Moreover, we believe that we are and will continue to be a leading developer and provider of next-generation technology services to our customers. These services include messaging, wireless data, interactive video, VoIP and other IP-based solutions. |
| • | Experienced management team with deep customer relationships. Our senior management team has significant industry knowledge and deep customer relationships developed over an average of 19 years of telecommunications and technology industry experience. |
Strategy
In order to strengthen our market leadership position, enhance growth and maximize profitability, we intend to:
| • | Optimize our current business. We continue to seek opportunities to more efficiently manage our business in order to maximize our operational effectiveness, competitiveness and profitability. We anticipate furthering these efforts as we continue our global expansion. |
We have substantially completed our data clearinghouse upgrades resulting from the integration of BSG Wireless, which we acquired in December 2007. We have consolidated and integrated technology and operational platforms which we expect will generate significant cost saving synergies. In addition, we have been successful at selling new services to our existing customers and have been successful in retaining our customer base with a 99% customer retention rate in 2009.
| • | Expand product offerings. We believe that we are well positioned to develop innovative services that solve complexities associated with new market participants and new technologies. In 2009, we launched Syniverse NEXT, an advanced messaging hub solution. This solution provides interworking between operators for the exchange of presence data, SMS, and MMS messages across networks, protocols and message types. Our IPX Network Transport service also expands our current network service offerings. This solution brings the next generation network to our customers who need the ability to deliver new, differentiated global applications and services, including advanced video and multimedia, to their subscribers. In addition, through the acquisition of the VM3 messaging business, we expanded our current messaging operations to achieve additional scale, reach and capabilities needed to provide our customers with new service offerings to meet their subscribers’ growing need for messaging services. |
We intend to pursue sales opportunities with non-traditional customer segments and new entrants into the mobile messaging market, such as cable companies, Internet providers and portals. We intend to continue to sell incremental services to our existing customers to further diversify our revenue and increase per-customer revenues.
| • | Continue to expand globally. We are aggressively pursuing global expansion opportunities in new markets. We have continued to expand our sales and support offices in Europe, Asia Pacific and Latin America. This expansion has helped us win contracts with leading operators in many countries |
18
Table of Contents
| including the United Kingdom, France, China, Italy, Russia, India, Brazil and Africa. For the year ended December 31, 2009, 26.4% of our total revenues (excluding off-network database queries) were generated outside of North America as compared to 27.9% for the year ended December 31, 2008. The decline in the percentage of revenue generated outside of North America is attributable to the acquisition of VM3, which generated a large majority of its revenue within the United States. Going forward, we expect the percentage of our revenue generated outside North America to increase due to increasing sales to new and existing global customers. |
| • | Pursue new business opportunities. We continue to seek opportunities to acquire businesses that expand our range of services, increase economies of scale, provide opportunities to increase our customer base and cross-selling opportunities and enter new geographies. In October 2009, we completed the acquisition of the VM3 messaging business. Through this acquisition, we believe we will expand our current messaging operations to achieve the solution’s scale, reach and capabilities needed to provide our customers with new service offerings to meet their subscribers’ growing need for messaging services. In May 2009, we acquired certain assets of WSI, a roaming hub provider that further enhances our global reach. We are assessing roaming and interoperability opportunities in emerging areas, such as mobile advertising, mobile payments, location-based services, driven by subscriber and operator trends. |
Sales and Marketing
As of December 31, 2009, our sales and marketing organizations included 169 people who identify and address customer needs and concerns, deliver comprehensive services and offer a comprehensive customer support system.
| • | Sales. Our sales department is geographically diverse and globally focused. Sales directors are organized geographically with global offices responsible for North America, Caribbean and Latin America, Asia Pacific and Europe/Middle East/Africa. Account managers are product specialists and work as a team to respond to customer needs. |
| • | Marketing. Our marketing organization is comprised primarily of marketing communications employees. This organization is responsible for consistent communications and brand management globally. This includes product marketing, media relations, tradeshow and event planning and marketing communications. |
Technology and Operations
Technology
As of December 31, 2009, our technology group was comprised of 513 professionals. This group performs all functions associated with the design, development, testing, implementation and operational support of our services. The primary functions of the Technology group include Product Management, Product Development and Life Cycle, Operational Support Services, Technology Services and Research and Development.
| • | Product Management. Working with the sales organization, product managers are responsible for managing the product’s positioning throughout the life cycle as well as managing costs and pricing. These responsibilities include developing strategic product and market plans, specifying product requirements, planning development resources and managing product launches. |
| • | Product Development and Life Cycle. Delivers new product developments, enhancements and maintenance releases and develops integrated solutions that address customer needs across multiple areas including billing, messaging, decision support and reporting. |
| • | Operational Support Services. Provides 24x7 operational product support to ensure a high level of service and system availability. |
| • | Technology Services. Responsible for maintaining the high overall quality of customer service through centralized testing, system/data base administration and configuration management. |
19
Table of Contents
| • | Research & Development. Responsible for researching new telecommunications technologies and identify solutions which facilitate technology migration and interoperability functionality for operators. |
Operations
As of December 31, 2009, we had 317 employees dedicated to managing internal operations and customer support functions. Key functions include:
| • | Customer Service, Documentation and Training. Provides “front-line” support for our global customers. Documentation and Training group publishes the technical documentation accompanying portfolio of services in multiple languages and also travels nationally and globally to provide strategic customer training. |
| • | Operator Business Process Outsourcing. Manages the outsourcing of operators’ personnel operations. |
| • | Internal Operations Support. Manages internal hardware and software technology programs as well as the Local Area Network, Internet, email and departmental servers for the employees. Other internal operations functions include information security, facilities management and disaster recovery. |
As of December 31, 2009, we had 83 employees dedicated to network provisioning, monitoring and support.
| • | Network Operations Center. We maintain a state-of-the-art Network Operations Center that actively monitors applications, network and connections to customers. The Network Operations Center provides support both domestically and globally 24 hours a day, seven days a week, 365 days a year. The Network Operations Center proactively identifies potential application, operating system, network, switch connectivity and call processing problems. These problems are managed through resolution with customers in conjunction with Inter-Exchange Operators, Local Exchange Operators, field engineering, our internal product support and development teams and vendors. |
| • | Network Services. Designs, develops and supports our SS7 and Internet Protocol-based Intelligent Network Service offerings. Employees within Network Services work closely with other functional departments and vendors to ensure that we are engineering and monitoring cost effective and reliable network solutions which meet customers’ needs. |
Employees
As of December 31, 2009, we had approximately 1,289 employees (as measured on a full-time equivalent basis). Certain of our employees in various countries outside of the United States are subject to laws providing representation rights to employees on workers councils. Management believes that employee relations are good.
Governmental Regulation
Certain services we offer are subject to regulation by the FCC that could have an indirect effect on our business. In particular, end-user revenues from selected services are used to determine our contribution to the FCC’s Universal Service Fund. Additionally, we are certified by certain state utility regulatory commissions to resell intrastate private line services although we do not currently engage in the resell of services on an intrastate basis. Some of our customers may also be subject to federal or state regulation that could have an indirect effect on our business. We do not offer services that are deemed to be common carrier telecommunications services.
Intellectual Property Rights
We attempt to protect our intellectual property rights in the United States and in foreign countries through a combination of patent, trademark, copyright and trade secret laws, as well as licensing agreements and agreements preventing the unauthorized disclosure and use of our intellectual property. We currently maintain approximately 264 registrations and 36 applications in approximately 43 countries covering our marks; over 25
20
Table of Contents
patents and 70 patent applications, several jointly-owned with Verizon Wireless in the United States and in foreign countries; and over 40 U.S. Copyright Registrations covering numerous software applications. In addition, we maintain certain trade secrets for which, in order to maintain the confidentiality of such trade secrets, we have not sought patent protection.
Where to Find Additional Information
We file annual and quarterly reports, proxy statements and other information with the SEC. You may read and print materials that we have filed with the SEC from its website at www.sec.gov. In addition, certain of our SEC filings, including our annual report on Form 10-K, our quarterly reports on Form 10-Q, our current reports on Form 8-K, and amendments to those reports filed or furnished pursuant to Section 13 or 15(d) of the Exchange Act can be viewed and printed from the investor information section of our website at www.syniverse.com, free of charge, as soon as reasonably practicable after they are electronically filed with, or furnished to, the SEC. Certain materials relating to our corporate governance, including our senior financial officers’ code of ethics, are also available in the investor information section of our website. Our website and the information contained or incorporated therein are not intended to be incorporated into this report.
Copies of our filings, specified exhibits and corporate governance materials are also available, free of charge, by writing to us using the address on the cover of this Form 10-K. You may also telephone our investor relations office directly at (813) 637-5007.
Our SEC filings may also be viewed and copied at the following SEC Public Reference Room and at the offices of the New York Stock Exchange where our common stock is quoted under the symbol “SVR”.
SEC Public Reference Room
100 F Street, N.E.
Washington, DC 20549
(You may call the SEC at 1-800-SEC-0330 for further information on the public reference room.)
NYSE Euronext
20 Broad Street
New York, NY 10005
21
Table of Contents
| ITEM 1A. | RISK FACTORS |
The following are certain risks associated with our business, an investment in our securities, and with achieving the forward-looking statements contained in this report or in our news releases, Web sites, public filings, investor and analyst conferences or elsewhere, include, but are not limited to, the risk factors described below. Any of the risk factors described below could cause our actual results to differ materially from expectations and could have a material adverse effect on our business, financial condition or operating results. We may not succeed in addressing these challenges and risks.
System failures, security breaches, delays and other problems could harm our reputation and business, cause us to lose customers and expose us to customer liability.
Our success depends on our ability to provide reliable services to our customers. Our operations could be interrupted by any damage to or failure of:
| • | our computer software or hardware, or our customers’ or suppliers’ computer software or hardware; |
| • | our networks, our customers’ networks or our suppliers’ networks; and |
| • | our connections and outsourced service arrangements with third parties. |
Our systems and operations are also vulnerable to damage or interruption from:
| • | power loss, transmission cable cuts and other telecommunications failures; |
| • | hurricanes, fires, earthquakes, floods and other natural disasters; |
| • | interruption of service due to potential facility migrations; |
| • | computer viruses or software defects; |
| • | physical or electronic break-ins, sabotage, intentional acts of vandalism and similar events; and |
| • | errors by our employees or third-party service providers. |
Because many of our services play a mission-critical role for our customers, any damage to or failure of the infrastructure we rely on, including that of our customers and vendors, could disrupt the operation of our network and the provision of our services, result in the loss of current and potential customers and expose us to potential customer liability.
We depend on a small number of customers for a significant portion of our revenues and the loss of any of our major customers would harm us.
Our three largest customers for the year ended December 31, 2009 represented approximately 35% of our revenues in the aggregate, while our ten largest customers for the year ended December 31, 2009 represented approximately 50% of our revenues in the aggregate. We expect to continue to depend upon a small number of customers for a significant percentage of our revenues. In 2010, we expect our three largest customers will represent approximately 42% of our revenues in the aggregate, while our ten largest customers are anticipated to represent approximately 59% of our revenues with the acquisition of VM3. Because our major customers represent such a large part of our business, the loss of any of our major customers would negatively impact our business.
Most of our customer contracts do not provide for minimum payments at or near our historical levels of revenues from these customers.
Although some of our customer contracts require our customers to make minimum payments to us, these minimum payments are substantially less than the revenues that we have historically earned from these customers. If our customers decide for any reason not to continue to purchase services from us at current levels or at current prices, to terminate their contracts with us or not to renew their contracts with us, our revenues would decline.
22
Table of Contents
Future consolidation among our customers may cause us to lose transaction volume and reduce our prices, which would negatively impact our financial performance.
In the past, consolidation among our customers has caused us to lose transaction volume and to reduce prices. In the future, our transaction volume and pricing may decline for similar reasons. Such consolidation activities may take the form of business combinations, strategic partnerships, or other business arrangements between the operators. For example, during the second quarter of 2008 Verizon announced that it would acquire Alltel. Verizon completed this acquisition in January 2009. The impact to us of the consolidation is described under “Business Developments” in Item 7. “Management’s Discussion and Analysis of Financial Condition and Results of Operations.”
We may not be able to expand our customer base to make up any revenue declines if we lose customers or if our transaction volumes decline as a result of consolidation activities. Our attempts to diversify our customer base and reduce our reliance on particular customers may not be successful.
If we do not adapt to rapid technological change in the telecommunications industry, we could lose customers or market share.
Our industry is characterized by rapid technological change, frequent new service introductions and changing customer demands. Significant technological changes could make our technology and services obsolete. Our success depends in part on our ability to adapt to our rapidly changing market by continually improving the features, functionality, reliability and responsiveness of our existing services and by successfully developing, introducing and marketing new features, services and applications to meet changing customer needs. We cannot assure you that we will be able to adapt to these challenges or respond successfully or in a cost-effective way to adequately meet them. Our failure to do so would impair our ability to compete, retain customers or maintain our financial performance. We sell our services primarily to telecommunications companies. Our future revenues and profits will depend, in part, on our ability to sell to new market participants.
The market for our services is intensely competitive and many of our competitors have advantages over us.
We compete in markets that are intensely competitive and rapidly changing. Increased competition could result in fewer customer orders, reduced pricing, reduced gross and operating margins and loss of market share, any of which could harm our business. We face competition from large, well-funded providers of similar services, such as Neustar, Sybase, MACH, TNS, Inc. and other existing communications, billing and technology companies. We are aware of major Internet service providers, software developers and smaller entrepreneurial companies that are focusing significant resources on developing and marketing services that will compete with the services we offer. We anticipate increased competition in the telecommunications industry and the entrance of new competitors into our business.
We expect that competition will remain intense in the near term and that our primary long-term competitors may not yet have entered the market. Many of our current and potential competitors have significantly more employees and greater financial, technical, marketing and other resources than we do. Our competitors may be able to respond more quickly to new or emerging technologies and changes in customer requirements than we can. In addition, many of our current and potential competitors have greater name recognition and more extensive customer bases that they can use to their advantage.
Our customers may develop in-house solutions and migrate part or all of the services that we provide them to these in-house solutions.
We believe that certain customers may choose to internally deploy certain functionality currently provided by our services. In recent years, we have experienced a loss of revenue streams from certain of our services as some of our customers have decided to meet their needs for these services in-house. For example, in order to
23
Table of Contents
manage the expense associated with the significant volume growth in mobile data, Alltel and Sprint Nextel have directly connected their IP backbone networks. Thus, they no longer use Syniverse as a third party intermediary to manage the connectivity and exchange of billing records between their mobile data roaming platforms beginning in January 2009.
Our failure to achieve or sustain market acceptance at desired pricing levels or transaction volumes could impact our ability to maintain profitability or positive cash flow.
Competition and industry consolidation have resulted in pricing pressure, which we expect to continue in the future and which we expect to continue to address through our volume-based pricing strategy. This pricing pressure could cause large reductions in the selling price of our services. For example, consolidation in the wireless services industry in the United States over the past several years could give our customers increased transaction volume leverage in pricing negotiations. Our competitors or our customers’ in-house solutions may also provide services at a lower cost, significantly increasing pricing pressures on us. While historically pricing pressure has been largely offset by volume increases and the introduction of new services, in the future we may not be able to offset the effects of any price reductions.
Our continued expansion into international markets is subject to uncertainties that could affect our operating results.
Our growth strategy contemplates continued expansion of our operations into foreign jurisdictions. International operations and business expansion plans are subject to numerous risks, including:
| • | the difficulty of enforcing agreements and collecting receivables through certain foreign legal systems; |
| • | fluctuations in currency exchange rates; |
| • | foreign customers may have longer payment cycles than customers in the U.S.; |
| • | U.S. and foreign import, export and related regulatory controls on trade; |
| • | tax rates in some foreign countries may exceed those of the U.S. and foreign earnings may be subject to withholdings requirements or the imposition of tariffs, exchange controls or other restrictions; |
| • | general economic and political conditions in the countries where we operate may have an adverse effect on our operations in those countries or not be favorable to our growth strategy; |
| • | unexpected changes in regulatory requirements; |
| • | the difficulties associated with managing a large organization spread throughout various countries; |
| • | the risk that foreign governments may adopt regulations or take other actions that would have a direct or indirect adverse impact on our business and market opportunities; and |
| • | the potential difficulty in enforcing intellectual property rights in certain foreign countries. |
For the year ended December 31, 2009, 26.4% of our total revenues (excluding off-network database queries) were generated outside of North America as compared to 27.9% for the year ended December 31, 2008. As we continue to expand our business globally, our success will depend, in large part, on our ability to anticipate and effectively manage these and other risks associated with our international operations. However, any of these factors could result in higher costs or reduced revenues for our international operations.
The costs and difficulties of acquiring and integrating complementary businesses and technologies could impede our future growth, diminish our competitiveness and harm our operations.
As part of our growth strategy, we intend to consider acquiring complementary businesses. Recent and future acquisitions could result in potentially dilutive issuances of equity securities, the incurrence of debt and
24
Table of Contents
contingent liabilities and an increase in amortization expense related to identifiable intangible assets acquired, which could harm our business, financial condition and results of operations. Risks we could face with respect to acquisitions include:
| • | greater than expected costs, management time and effort involved in identifying, completing and integrating acquisitions; |
| • | potential disruption of our ongoing business and difficulty in maintaining our standards, controls, information systems and procedures; |
| • | entering into markets and acquiring technologies in areas in which we have little experience; |
| • | acquiring intellectual property which may be subject to various challenges from others; |
| • | the inability to successfully integrate the services, products and personnel of any acquisition into our operations; |
| • | the inability to achieve expected synergies; |
| • | a need to incur debt, which may reduce our cash available for operations and other uses, or a need to issue equity securities, which may dilute the ownership interests of existing stockholders; |
| • | realizing little, if any, return on our investment; and |
| • | unforeseen integration difficulties may cause service disruptions. |
Difficulty in integrating technology may harm our business.
Following the acquisition of the VM3 messaging business, we have begun to integrate certain technology platforms. This integration includes establishing new data centers and relocating certain facilities. This process may be slower or more difficult than we currently contemplate. Furthermore, we may encounter unanticipated difficulties in this process, which could cause integration difficulties and customer disruptions. The measures that we have taken to date or plan to take in the future may not adequately resolve those issues. If we fail to successfully integrate technology platforms, our ability to achieve cost efficiencies expected to result from the acquisition of the VM3 messaging business may be impaired, which may adversely affect our future financial position, results of operations and customer relationships.
The inability of our customers to successfully implement our services could harm our business.
Significant technical challenges can arise for our customers when they implement our services. Our customers’ ability to support the deployment of our services and integrate them successfully within their operations depends, in part, on our customers’ technological capabilities and the level of technological complexity involved. Difficulty in deploying those services could increase our customer service support costs, delay the recognition of revenues until the services are implemented and reduce our operating margins.
Our reliance on third-party providers for communications software, hardware and infrastructure exposes us to a variety of risks we cannot control.
Our success depends on software, equipment, network connectivity and infrastructure hosting services supplied by our vendors and customers. We cannot assure you that we will be able to continue to purchase the necessary software, equipment and services from these vendors on acceptable terms or at all. If we are unable to maintain current purchasing terms or ensure service availability with these vendors and customers, we may lose customers and experience an increase in costs in seeking alternative supplier services.
Our business also depends upon the capacity, reliability and security of the infrastructure owned and managed by third parties, including our vendors and customers, that is used by our technology interoperability services, network services, number portability services, call processing services and enterprise solutions. We
25
Table of Contents
have no control over the operation, quality or maintenance of a significant portion of that infrastructure and whether those third parties will upgrade or improve their software, equipment and services to meet our and our customers’ evolving requirements. We depend on these companies to maintain the operational integrity of our services. If one or more of these companies is unable or unwilling to supply or expand its levels of service to us in the future, our operations could be severely interrupted. In addition, rapid changes in the telecommunications industry have led to industry consolidation. This consolidation may cause the availability, pricing and quality of the services we use to vary and could lengthen the amount of time it takes to deliver the services that we use.
Inability to develop or maintain relationships with material vendors.
Certain of our products are dependent on third-party vendors and our inability to develop or maintain relationships with these vendors could result in a significant disruption to the services we provide. If we are unable to maintain current purchasing terms or ensure service availability with these vendors, we may lose customers and experience an increase in costs in seeking alternative supplier services. The failure to develop and maintain vendor relationships and any resulting disruptions to the provision of our services could have a material adverse impact on our operations.
Fluctuations in currency exchange rates may adversely affect our results of operations.
A growing part of our business consists of sales made to customers outside the United States. A portion of the net revenues we receive from such sales is denominated in currencies other than the U.S. dollar. Additionally, portions of our cost of net revenues and our other operating expenses are incurred by our international operations and denominated in local currencies. While fluctuations in the value of these net revenues, costs and expenses as measured in U.S. dollars have not materially affected our results of operations historically, we cannot assure you that adverse currency exchange rate fluctuations will not have a material impact in the future. In addition, our balance sheet reflects non-U.S. dollar denominated assets and liabilities, including intercompany balances eliminated in consolidation, which can be adversely affected by fluctuations in currency exchange rates.
We may need additional capital in the future and it may not be available on acceptable terms, or at all.
We may require more capital in the future to:
| • | fund our operations; |
| • | enhance and expand the range of services we offer; |
| • | maintain and expand our network; and |
| • | respond to competitive pressures and potential strategic opportunities, such as investments, acquisitions and international expansion. |
We cannot assure you that additional financing will be available on terms favorable to us, or at all. The terms of available financing may place limits on our financial and operating flexibility. In addition, our senior credit facility and the indenture governing our 7 3/4% senior subordinated notes contain financial and other restrictive covenants that will limit our ability to incur indebtedness or obtain financing. If adequate funds are not available on acceptable terms, we may be forced to reduce our operations or abandon expansion opportunities. Moreover, even if we are able to continue our operations, our failure to obtain additional financing could reduce our competitiveness as our competitors may provide better-maintained networks or offer an expanded range of services.
Our financial results may be adversely affected if we have to impair our intangible assets or goodwill.
As a result of our acquisitions, a significant portion of our total assets consist of intangible assets (including goodwill). Goodwill and intangible assets, net of amortization, together accounted for approximately 70% and
26
Table of Contents
67% of the total assets on our balance sheet as of December 31, 2009 and December 31, 2008, respectively. We may not realize the full fair value of our intangible assets and goodwill. We expect to engage in additional acquisitions, which may result in our recognition of additional intangible assets and goodwill. Under current accounting standards, we are able to amortize certain intangible assets over the useful life of the asset, while goodwill is not amortized. We evaluate on a regular basis whether all or a portion of our goodwill intangible assets may be impaired. Under current accounting rules, any determination that impairment has occurred would require us to write-off the impaired portion of goodwill and such intangible assets, resulting in a charge to our earnings. Such a write-off could adversely affect our financial condition and results of operations.
Our substantial indebtedness could have a material adverse effect on our financial health and prevent us from fulfilling our obligations.
We have significant debt service obligations. As of December 31, 2009, we had outstanding indebtedness of approximately $512.5 million (including the current portion of $3.4 million). We are the borrower of all of this outstanding indebtedness.
Our substantial debt could have important consequences to investors. For example, it could:
| • | make it more difficult for us to satisfy our obligations with respect to our indebtedness; |
| • | require us to dedicate a substantial portion of our cash flow from operations to payments on our debt, which will reduce the funds available for working capital, capital and development expenditures, acquisitions and other general corporate purposes; |
| • | limit our flexibility in planning for, or reacting to, changes in the manufacture, production, distribution or marketing of our services, customer demand, competitive pressures and the industries we serve; |
| • | place us at a competitive disadvantage compared to our competitors that are less leveraged than we are; |
| • | increase our vulnerability to both general and industry-specific adverse economic conditions; and |
| • | limit our ability to borrow additional funds. |
We may incur substantial additional debt in the future. The addition of further debt to our current debt levels could intensify the leverage-related risks that we now face.
In addition, our debt contains financial and other restrictive covenants that may limit our ability to engage in activities that may be in our long-term best interests. Our failure to comply with those covenants could result in an event of default, which if not cured or waived, could result in the acceleration of all our debts.
Our stock price may be volatile.
The trading price of our common stock could be subject to wide fluctuations in response to various factors, some of which are beyond our control, such as:
| • | actual or anticipated variations in quarterly results of operations; |
| • | changes in intellectual property rights of us or our competitors; |
| • | announcements of technological innovations; |
| • | the introduction of new products or changes in product; |
| • | pricing by us or our competitors; |
| • | changes in financial estimates by securities analysts; |
| • | announcements of significant acquisitions, strategic partnerships, joint ventures or capital commitments by us or our competitors; |
| • | additions or departures of key personnel; and |
| • | generally adverse market conditions. |
27
Table of Contents
We have anti-takeover protections that may delay or prevent a change in control that could benefit our stockholders.
We have adopted a stockholder rights plan that may discourage, delay or prevent a change of control and make any future unsolicited acquisition attempt more difficult.
On November 16, 2008, our Board of Directors adopted a stockholder rights plan which declared a dividend of one preferred share purchase right (the “Right”) for each outstanding share of Common Stock, par value $0.001 per share (the “Common Shares”), of the Company. The dividend was payable on November 28, 2008 to the stockholders of record on that date. Each Right entitles the registered holder to purchase from the Company one one-thousandth of a share (a “Unit”) of Series A Junior Participating Preferred Stock, par value $0.01 per share (the “Preferred Shares”), at a price of $33 per one one-thousandth of a Preferred Share (the “Purchase Price”), subject to adjustment. Each Unit has designations and powers, preferences and rights, and the qualifications, limitations and restrictions designed to make it the economic equivalent of a Common Share. The description and terms of the Rights are set forth in the Rights Agreement dated November 16, 2008.
Under the plan, the stock rights will become exercisable only when a public announcement or notice to us has been made that a person or group has acquired, or obtained the right to acquire beneficial ownership of 15% or more of the outstanding shares of our Common Shares, other than as a result of an offer approved by the Board of Directors of the Company and (ii) 10 business days (or, if determined by the Board of Directors, a specified or unspecified later date) following the commencement or announcement of an intention to make a tender offer or exchange offer which, if successful, would cause the bidder to own 15% of more of our outstanding Common Shares. Until a Right is exercised, the holder thereof, will have no rights as a stockholder, other than rights resulting from such holder’s ownership of Common Shares, including, without limitation, the right to vote or to receive dividends.
Regulations affecting our customers and us and future regulations to which they or we may become subject may harm our business.
Although we do not offer services that are deemed to be common carrier telecommunication services, certain of the services we offer are subject to regulation by the United States Federal Communications Commission, or FCC, that could have an indirect effect on our business. The U.S. telecommunications industry has been subject to continuing deregulation since 1984 and the European and Asian telecommunications industries are also subject to continued deregulation. We cannot predict when, or upon what terms and conditions, further regulation or deregulation might occur or the effect regulation or deregulation may have on our business. Several services that we offer may be indirectly affected by regulations imposed upon potential users of those services, which may increase our costs of operations. In addition, future services we may provide could be subject to direct regulation.
Capacity limits on our network and application platforms may be difficult to project and we may not be able to expand and upgrade our systems to meet increased use.
As customers’ usage of our services increases, we will need to expand and upgrade our network and application platforms. We may not be able to accurately project the rate of increase in usage of our services. In addition, we may not be able to expand and upgrade, in a timely manner, our systems, networks and application platforms to accommodate increased usage of our services. If we do not appropriately expand and upgrade our systems and networks and application platforms, we may lose customers and our operating performance may suffer.
We may not be able to receive or retain licenses or authorizations that may be required for us to sell our services internationally.
The sales and marketing of our services and related products internationally are subject to the U.S. Export Control regime and similar regulations in other countries. In the United States, items of a commercial nature are generally subject to regulatory control by the U.S. Department of Commerce’s Bureau of Industry and Security
28
Table of Contents
and to Export Administration Regulations though other international trade regulations may apply as well. In the future, regulatory authorities may require us to obtain export licenses or other export authorizations to export our services or related products abroad, depending upon the nature of items being exported, as well as the country to which the export is to be made. We cannot assure you that any of our applications for export licenses or other authorizations will be granted or approved. Furthermore, the export license/export authorization process is often time-consuming. Violation of export control regulations could subject us to fines and other penalties, such as losing the ability to export for a period of years, which would limit our revenue growth opportunities and significantly hinder our attempts to expand our business internationally.
Failure to protect our intellectual property rights adequately may have a material adverse affect on our results of operations or our ability to compete.
We attempt to protect our intellectual property rights in the United States and in foreign countries through a combination of patent, trademark, copyright and trade secret laws, as well as licensing agreements and agreements preventing the unauthorized disclosure and use of our intellectual property. We cannot assure you that these protections will be adequate to prevent competitors from copying or reverse engineering our services, or independently developing and marketing services that are substantially equivalent to or superior to our own. Moreover, third parties may be able to successfully challenge, oppose, invalidate or circumvent our patents, trademarks, copyrights and trade secret rights. We may fail or be unable to obtain or maintain adequate protections for certain of our intellectual property in the United States or certain foreign countries or our intellectual property rights may not receive the same degree of protection in foreign countries as they would in the United States because of the differences in foreign trademark, patent and other laws concerning proprietary rights. Such failure or inability to obtain or maintain adequate protection of our intellectual property rights for any reason could have a material adverse effect on our business, results of operations and financial condition.
Monitoring and protecting our intellectual property rights is difficult and costly. From time to time, we may be required to initiate litigation or other action to enforce our intellectual property rights or to establish their validity. Such action could result in substantial cost and diversion of resources and management attention and we cannot assure you that any such action will be successful.
If third parties claim that we are in violation of their intellectual property rights, it could have a negative impact on our results of operations and ability to compete.
We face the risk of claims that we have infringed the intellectual property rights of third parties. For example, significant litigation regarding patent rights exists in our industry. Our competitors in both the U.S. and foreign countries, many of which have substantially greater resources than we have and have made substantial investments in competing technologies, may have applied for or obtained, or may in the future apply for and obtain, patents that will prevent, limit or otherwise interfere with our ability to make and sell our products and services. We have not conducted an independent review of patents issued to third parties. The large number of patents, the rapid rate of new patent issuances, the complexities of the technology involved and uncertainty of litigation increase the risk of business assets and management’s attention being diverted to patent litigation.
It is possible that third parties will make claims of infringement against us or against our licenses in connection with their use of our technology. Any claims, even those without merit, could:
| • | be expensive and time-consuming to defend; |
| • | cause us to cease making, licensing, using or selling equipment, services or products that incorporate the challenged intellectual property; |
| • | require us to redesign our equipment, services or products, if feasible; |
| • | divert management’s attention and resources; and |
| • | require us to enter into royalty or licensing agreements in order to obtain the right to use necessary intellectual property. |
29
Table of Contents
Any royalty or licensing agreements, if required, may not be available to us on acceptable terms or at all. A successful claim of infringement against us or one of our licensees in connection with a third party’s use of our technology could result in our being required to pay significant damages, enter into costly license or royalty agreements or stop the sale of certain products, any of which could have a negative impact on our operating profits and harm our future prospects.
If our products infringe on the intellectual property rights of others, we may be required to indemnify our customers for any damages they suffer.
We generally indemnify our customers with respect to infringement by our products of the proprietary rights of third parties. Third parties may assert infringement claims against our customers. These claims may require us to initiate or defend protracted and costly litigation on behalf of our customers, regardless of the merits of these claims. If any of these claims succeed, we may be forced to pay damages on behalf of our customers or may be required to obtain licenses for the products they use. If we cannot obtain all necessary licenses on commercially reasonable terms, our customers may be forced to stop using our products.
We depend on key personnel to manage our business effectively and may not be successful in attracting and retaining such personnel.
We depend on the performance of our senior management team and other key employees. Our success also depends on our ability to attract, integrate, train, retain and motivate these individuals and additional highly skilled technical and sales and marketing personnel, both in the United States and abroad. The loss of the services of any of our senior management team or other key employees or failure to attract, integrate, train, retain and motivate additional key employees could harm our business.
Unfavorable general economic conditions in the United States or in other major global markets could negatively impact our financial performance.
Unfavorable general economic conditions have recently deteriorated due to credit conditions resulting from slower economic activity, concerns about inflation and deflation, volatility in energy costs, decreased consumer confidence, reduced corporate profits and capital spending. Adverse business conditions and liquidity concerns in the United States or in one or more of our other major markets, could adversely affect our customers in the wireless communications markets and thus impact our financial performance. These conditions make it difficult for our customers, our vendors and us to accurately forecast and plan future business activities, and they could cause further slow spending on our services. Furthermore, during challenging economic times such as recession or economic slowdown, our customers or vendors may face issues gaining timely access to sufficient credit, which could impair their ability to make timely payments or provide services to us. If that were to occur, we may be required to increase our allowance for doubtful accounts and our accounts receivable outstanding would be negatively impacted. The current economic downturn and any future downturn may reduce our revenue or our percentage of revenue growth on a quarter-to-quarter basis. We cannot predict the timing, strength or duration of any economic slowdown or subsequent economic recovery, world-wide, or in the telecommunications industry. If the economy or the markets in which we operate do not improve from their current condition or if they continue to deteriorate, our customers or potential customers could continue to reduce or further delay their use of our services, which would adversely impact our revenues and ultimately our profitability. In addition, we may record additional charges related to the restructuring of our business and the impairment of our goodwill and other long-lived assets, and our business, financial condition and results of operations will likely be materially and adversely affected.
Demand for our services is driven primarily by wireless voice and data traffic, subscriber roaming activity, SMS and MMS messaging, number porting and next generation IP applications. Changes in subscriber usage patterns could be affected in any recession or economic downturn in the United States or any other country where we do business and could negatively impact the number of transactions processed and adversely affect our revenues and earnings.
30
Table of Contents
| ITEM 1B. | UNRESOLVED STAFF COMMENTS |
None.
| ITEM 2. | PROPERTIES |
Our headquarters is located in a 199,000 square foot leased office space in Tampa, Florida. The lease term for the headquarters facility is eleven years and commenced on November 1, 2005. At our option, we have the right to renew the lease for two additional periods of five years each. The headquarters facility is a multi-purpose facility that supports our corporate administrative, North American sales, technology and operations functions. In addition, we lease several smaller offices throughout North America including office space in Mountain View, California and 22,153 square feet in Santa Cruz, California for technology and operations functions which are under a transition services agreement with VeriSign, Inc. as a result of the VM3 acquisition.
We lease several offices for our Asia Pacific operations including 8,812 square feet in Hong Kong, 4,384 square feet in Singapore, 3,882 square feet in Malaysia and 31,069 square feet in Bangalore, India. The Bangalore, India facility is under a transition services agreement with VeriSign, Inc. as a result of the VM3 acquisition.
In Europe, we have leases for office space as follows: 20,782 square feet in Russelsheim, Germany and 6,441 square feet in London, England. These facilities comprise technology and operations functions.
We consider our facilities and equipment suitable and adequate for our business as currently conducted with the exception of the facilities that we are currently occupying under a transition services agreement with VeriSign, Inc. resulting from the acquisition of VM3. As a result, we have entered into new leases for 36,003 square feet in Campbell, California and 40,835 square feet in Bangalore, India to replace these facilities and we will be relocating our employees to these new facilities in 2010.
| ITEM 3. | LEGAL PROCEEDINGS |
We are currently a party to various claims and legal actions that arise in the ordinary course of business. We believe such claims and legal actions, individually and in the aggregate, will not have a material adverse effect on our business, financial condition, results of operations or cash flows.
| ITEM 4. | SUBMISSION OF MATTERS TO A VOTE OF SECURITY HOLDERS |
No matter was submitted to a vote of security holders during the fourth quarter of calendar year 2009.
31
Table of Contents
PART II
| ITEM 5. | MARKET FOR REGISTRANT’S COMMON EQUITY, RELATED STOCKHOLDER MATTERS AND ISSUER PURCHASES OF EQUITY SECURITIES |
Syniverse Holdings, Inc.
Our common stock is listed on the New York Stock Exchange under the symbol “SVR.” Public trading of our common stock commenced on February 10, 2005. Prior to that date, there was no public trading market for our common stock.
The following table sets forth the high and low sales closing prices per share for our common stock as reported on the New York Stock Exchange for the years ended December 31, 2009 and 2008:
| 2009 |
High | Low | ||||
| First quarter |
$ | 17.22 | $ | 11.26 | ||
| Second quarter |
$ | 16.96 | $ | 12.12 | ||
| Third quarter |
$ | 19.39 | $ | 14.48 | ||
| Fourth quarter |
$ | 18.92 | $ | 15.82 | ||
| 2008 |
High | Low | ||||
| First quarter |
$ | 18.86 | $ | 13.53 | ||
| Second quarter |
$ | 22.35 | $ | 15.74 | ||
| Third quarter |
$ | 18.62 | $ | 14.23 | ||
| Fourth quarter |
$ | 19.08 | $ | 7.23 | ||
On February 24, 2010, the last reported sale price of our common stock on The New York Stock Exchange was $16.45 per share. As of February 19, 2010 there were 15,596 holders of record of our common stock.
We have not paid any dividends on our common stock during the past two fiscal years and do not intend to pay dividends on our common stock in the foreseeable future. In addition, our indenture and new senior credit facility include restrictions on our ability to pay cash dividends on our common stock.
Equity Compensation Plan Information
See Item 12 “Security Ownership of Certain Beneficial Owners and Management and Related Stockholder Matters” for information regarding shares of common stock authorized for issuance under our equity compensation plans.
32
Table of Contents
Stock Performance Graph
The following stock performance graph and accompanying table compare the shareholders’ cumulative return on the common stock from February 10, 2005 to December 31, 2009 with the cumulative total return of the Russell 2000 Index and the Dow Jones U.S. Mobile Telecommunications Index over the same period. The comparative data assumes that $100.00 was invested on the date of our initial public offering, February 10, 2005, in the common stock and in each of the indices referred to above and that any dividends were reinvested. The stock price performance shown in the table set forth below is not necessarily indicative of future stock price performance.
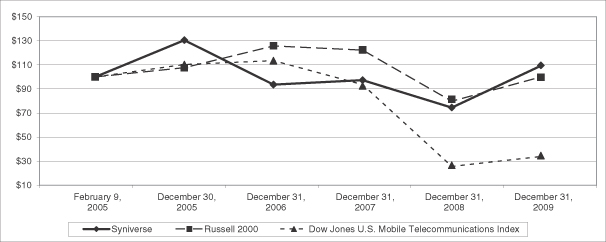
| February 9, 2005 |
December 31, 2005 |
December 31, 2006 |
December 31, 2007 |
December 31, 2008 |
December 31, 2009 | |||||||
| Syniverse |
100.00 | 130.63 | 93.69 | 97.38 | 74.63 | 109.25 | ||||||
| Russell 2000 |
100.00 | 107.59 | 125.88 | 122.43 | 79.82 | 99.95 | ||||||
| Dow Jones U.S. Mobile Telecommunications Index |
100.00 | 110.32 | 113.59 | 93.55 | 25.73 | 33.99 |
Syniverse Technologies, Inc.
There is currently no established public trading market for the common stock, no par value, of Syniverse Technologies, Inc., a company which is wholly-owned by Syniverse Holdings, Inc.
Syniverse Technologies, Inc. has not paid any dividends on its common stock during the past two fiscal years and does not intend to pay dividends on its common stock in the foreseeable future. In addition, our indenture and senior credit facility include restrictions on its ability to pay cash dividends on its common stock.
Syniverse Technologies, Inc. does not have any shares of common stock authorized for issuance under any equity compensation plans.
33
Table of Contents
| ITEM 6. | SELECTED HISTORICAL FINANCIAL DATA |
The following table sets forth certain of our historical financial data for the most recent five years. We have derived the selected historical consolidated financial data as of December 31, 2009 and 2008 and for the years ended December 31, 2009, 2008 and 2007 from our audited consolidated financial statements and the related notes included elsewhere herein. The selected historical consolidated financial data as of December 31, 2007, 2006 and 2005 and for the years ended December 31, 2006 and 2005 have been derived from our audited consolidated financial statements, which are not included in this filing. The selected historical financial data set forth below is not necessarily indicative of the results of our future operations and should be read in conjunction with the discussion under the heading “Management’s Discussion and Analysis of Financial Condition and Results of Operations,” and the historical consolidated financial statements and accompanying notes included elsewhere herein.
| Year Ended December 31, | ||||||||||||||||||||
| 2009 | 2008 | 2007 | 2006 | 2005 | ||||||||||||||||
| (dollars in thousands, except per share data) | ||||||||||||||||||||
| Statement of Operations Data (3): |
||||||||||||||||||||
| Revenues |
||||||||||||||||||||
| Technology Interoperability |
$ | 293,782 | $ | 317,685 | $ | 184,471 | $ | 138,655 | $ | 108,429 | ||||||||||
| Network Services |
122,804 | 122,529 | 124,788 | 124,832 | 132,120 | |||||||||||||||
| Number Portability Services |
31,654 | 29,291 | 27,128 | 28,766 | 50,836 | |||||||||||||||
| Call Processing Services |
28,126 | 29,720 | 31,421 | 29,315 | 28,619 | |||||||||||||||
| Enterprise Solutions |
1,322 | 2,387 | 4,084 | 7,289 | 11,026 | |||||||||||||||
| Revenues Excluding Off-Network |
||||||||||||||||||||
| Database Queries |
477,688 | 501,612 | 371,892 | 328,857 | 331,030 | |||||||||||||||
| Off-Network Database Queries |
5,303 | 4,744 | 5,632 | 8,162 | 10,761 | |||||||||||||||
| Total Revenues |
482,991 | 506,356 | 377,524 | 337,019 | 341,791 | |||||||||||||||
| Costs and expenses: |
||||||||||||||||||||
| Cost of operations |
172,950 | 165,236 | 137,520 | 134,641 | 129,190 | |||||||||||||||
| Sales and marketing |
38,789 | 45,549 | 30,637 | 25,446 | 23,344 | |||||||||||||||
| General and administrative |
74,502 | 79,241 | 56,937 | 58,508 | 49,396 | |||||||||||||||
| Depreciation and amortization (1) |
60,397 | 55,344 | 42,867 | 41,172 | 46,815 | |||||||||||||||
| Restructuring (2) |
2,583 | (29 | ) | 2,211 | 1,006 | 143 | ||||||||||||||
| 349,221 | 345,341 | 270,172 | 260,773 | 248,888 | ||||||||||||||||
| Operating income |
133,770 | 161,015 | 107,352 | 76,246 | 92,903 | |||||||||||||||
| Other income (expense), net: |
||||||||||||||||||||
| Interest income |
323 | 1,894 | 2,049 | 1,824 | 1,957 | |||||||||||||||
| Interest expense |
(28,890 | ) | (37,246 | ) | (25,603 | ) | (27,328 | ) | (34,647 | ) | ||||||||||
| Loss on extinguishment of debt |
— | — | — | (924 | ) | (42,804 | ) | |||||||||||||
| Other income (expense), net |
939 | (402 | ) | (69 | ) | 332 | 1,436 | |||||||||||||
| (27,628 | ) | (35,754 | ) | (23,623 | ) | (26,096 | ) | (74,058 | ) | |||||||||||
| Income before provision for (benefit from) income taxes |
106,142 | 125,261 | 83,729 | 50,150 | 18,845 | |||||||||||||||
| Provision for (benefit from) income taxes |
40,465 | 46,797 | 31,310 | (39,574 | ) | 9,041 | ||||||||||||||
| Net income |
65,677 | 78,464 | 52,419 | 89,724 | 9,804 | |||||||||||||||
| Preferred stock dividends |
— | — | — | — | (4,195 | ) | ||||||||||||||
| Net loss attributable to noncontrolling interest |
(590 | ) | — | — | — | — | ||||||||||||||
| Net income attributable to Syniverse Holdings, Inc. |
$ | 66,267 | $ | 78,464 | $ | 52,419 | $ | 89,724 | $ | 5,609 | ||||||||||
| Net income per common share: |
||||||||||||||||||||
| Basic |
$ | 0.96 | $ | 1.15 | $ | 0.77 | $ | 1.34 | $ | 0.09 | ||||||||||
| Diluted |
$ | 0.96 | $ | 1.15 | $ | 0.77 | $ | 1.33 | $ | 0.09 | ||||||||||
| Weighted average common shares outstanding: |
||||||||||||||||||||
| Basic |
68,031 | 67,675 | 67,333 | 66,943 | 61,973 | |||||||||||||||
| Diluted |
68,153 | 67,731 | 67,401 | 67,298 | 62,978 | |||||||||||||||
| Common stock dividends |
— | — | — | — | — | |||||||||||||||
34
Table of Contents
| Year Ended December 31, | ||||||||||||||||||||
| 2009 | 2008 | 2007 | 2006 | 2005 | ||||||||||||||||
| (dollars in thousands, except per share data) | ||||||||||||||||||||
| Other Financial Data: |
||||||||||||||||||||
| Net cash provided by (used in): |
||||||||||||||||||||
| Operating activities |
$ | 142,373 | $ | 163,972 | $ | 121,262 | $ | 97,811 | $ | 110,577 | ||||||||||
| Investing activities |
(215,256 | ) | (41,642 | ) | (301,953 | ) | (63,683 | ) | (32,555 | ) | ||||||||||
| Financing activities |
1,317 | (903 | ) | 202,275 | (57,052 | ) | (46,603 | ) | ||||||||||||
| Capital expenditures |
(37,654 | ) | (40,819 | ) | (27,665 | ) | (19,921 | ) | (34,001 | ) | ||||||||||
| Balance Sheet Data (at end of period): |
||||||||||||||||||||
| Cash and cash equivalents |
$ | 91,934 | $ | 165,605 | $ | 49,086 | $ | 26,704 | $ | 49,294 | ||||||||||
| Property and equipment, net |
64,315 | 50,251 | 43,856 | 42,880 | 43,426 | |||||||||||||||
| Total assets |
1,309,724 | 1,199,834 | 1,107,550 | 784,147 | 771,358 | |||||||||||||||
| Total debt |
512,464 | 513,813 | 522,935 | 311,561 | 367,794 | |||||||||||||||
| Total stockholder’s equity |
621,154 | 535,842 | 470,792 | 414,794 | 322,639 | |||||||||||||||
| (1) | Depreciation and amortization amounts exclude accretion of debt discount and amortization of deferred finance costs, which are both included in interest expense in the statement of operations data. |
| (2) | Restructuring expense is comprised primarily of severance benefits associated with our cost rationalization initiatives, which were implemented in September 2005, February 2006, August 2006, January 2007, June 2007 and December 2009. The restructurings for 2005, 2006 and 2009 were related to internal reorganizations. The restructurings in 2007 were related to a facility closing and internal reorganization. |
| (3) | Results include the following acquisitions in the respective periods subsequent to the acquisition date: VM3 acquisition completed in October 2009, WSI acquisition completed in May 2009, BSG Wireless acquisition completed in December 2007 and ITHL acquisition completed in June 2006. |
35
Table of Contents
| ITEM 7. | MANAGEMENT’S DISCUSSION AND ANALYSIS OF FINANCIAL CONDITION AND RESULTS OF OPERATIONS |
The following discussion and analysis contains forward-looking statements about our plans and expectations of what may happen in the future. Forward-looking statements are based on a number of assumptions and estimates that are inherently subject to significant risks and uncertainties, and our results could differ materially from the results anticipated by our forward-looking statements as a result of many known and unknown factors, including but not limited to those discussed in “Item 1A—Risk Factors” of this report. See also “Cautionary Notice Regarding Forward-Looking Statements” located above “Item 1—Business.”
You should read the following discussion and analysis in conjunction with “Item 6—Selected Financial Data” and “Item 8—Financial Statements and Supplementary Data” appearing elsewhere in this annual report.
Business
We are a leading enabler of wireless voice and data services for telecommunications companies worldwide. For over 20 years, we have served as one of the wireless industry’s only operator-neutral intermediaries, solving the challenges that arise as new technologies, standards and protocols emerge. Our data clearinghouse, network and technology services solve technical and operational challenges for the wireless industry by translating incompatible communication standards and protocols and simplifying operator interconnectivity. Our suite of transaction-based services allows operators to deliver seamless voice, data and next generation services to wireless subscribers, including wireless voice and data roaming, SMS and MMS, number portability and value-added roaming services.
Demand for our services is driven primarily by wireless voice and data traffic, subscriber roaming activity, SMS and MMS messaging, number porting and next generation IP applications. The global wireless telecommunications industry is expected to grow due to continued subscriber growth, increased usage and deployment of new services. In addition, subscriber adoption of new wireless technologies and services can also drive demand for our services due to the resulting increase in interoperability complexities. The global wireless industry relies on an extensive and complex set of communication standards, technical protocols, network interfaces and systems that must successfully communicate with one another in order to provide voice and data services to subscribers in their local markets and when roaming. The proliferation of these standards has resulted in technological incompatibilities, which are increasingly difficult to manage as new wireless technologies and services are introduced and deployed. We believe that as wireless usage expands and complexity continues to increase, the demand for our services will grow.
We have developed a broad set of innovative interoperability solutions in response to the evolving needs of our customers. Through our integrated suite of services, we enable customers to provide their subscribers with enhanced services including:
| • | national and international wireless voice and data roaming; |
| • | wireless data services, including SMS and MMS, across incompatible standards and protocols; |
| • | intelligent network services such as wireless number portability and advanced IP service offerings; and |
| • | value-added roaming services. |
Our service platforms also enable operators to rapidly and cost-effectively deploy next-generation wireless services including enhanced wireless data, wireless Voice-over-Internet Protocol, or VoIP, and value-added roaming services.
We provide our services to approximately 700 telecommunications operators and to over 100 enterprise customers in approximately 160 countries. Our customers include wireless operators, telecommunications providers, internet service providers and social networking portals, cable companies and other non-traditional enterprise clients. We serve most of the largest global wireless telecommunications providers including AT&T
36
Table of Contents
Mobility, Sprint Nextel, T-Mobile, Verizon Wireless, China Mobile, American Moviles, Telenor, Telefonica, Orange, China Unicom, TeliaSonera, Vodafone, Reliance Communications, Turkcell, Telecom Italia and VimpelCom. We believe that maintaining strong relationships with our customers is one of our core competencies and that maintaining these relationships is critical to our success.
Services
We provide an integrated suite of services to wireless telecommunications operators that meet the evolving technology requirements of the wireless industry. These services include:
| • | Technology Interoperability Services. We operate one of the largest wireless data clearinghouses globally, enabling the accurate invoicing and settlement of domestic and global wireless roaming telephone calls and wireless data events. We also provide financial settlement services, Short Message Service (SMS), Multimedia Messaging Services (MMS) routing and translation, roaming fraud prevention services, interstandard roaming solutions and Mobile Data Roaming (MDR) services between operators. In addition, we have expanded our mobile data solutions to include interactive video and mobile broadband solutions, prepaid applications and value-added roaming services. Wireless operators send data records to our service platforms for processing, aggregation, translation and distribution between operators. |
| • | Network Services. We connect disparate wireless and fixed line operator networks and enable access to intelligent network database services like caller ID and provide translation and routing services to support the establishment and delivery of telephone calls through our SS7 hub. SS7 is the telecommunications industry’s standard network signaling protocol used by substantially all operators to enable critical telecommunications functions such as number portability, toll-free calling services and caller ID. |
| • | Number Portability Services. Our leading number portability services are used by many wireless operators, including most domestic operators, to enable wireless subscribers to switch service providers while keeping the same telephone number. We also provide these services to all wireless operators in Canada and Singapore. |
| • | Call Processing Services. We provide wireless operators with global call handling, signaling and fraud management solutions that enable wireless subscribers from one operator to make and accept telephone calls while roaming on another operator’s network. |
| • | Enterprise Solutions. Our enterprise wireless data management platform enables operators to offer large corporate customers reporting and analysis tools to manage telecom-related expenses. |
| • | Off-Network Database Queries. We provide our customers with the ability to connect to various third-party intelligent network database providers. These providers charge us a per-transaction fee for access to their databases, which we pass on to our customers with little or no margin. |
The completion of the VM3 acquisition has resulted in the expansion of our global messaging capabilities and the expansion of our integrated suite of services to include:
| • | Inter-Carrier Gateway enables operators to deliver inter-carrier person-to-person SMS and MMS messages across geographies and technologies. While we currently offer these services as described above in our Messaging Services, we have expanded our scale and reach in this offering. In addition, with the acquisition, we have gained a larger Tier 1 customer base for these services. |
| • | PictureMail provides state-of-the-art MMS platform with core components that include a hosted MMS service center (MMSC) for MMS routing, handset photo applications, a social networking interface, and photo storage and sharing capabilities. |
| • | Premium Messaging Gateway manages delivery of “off-portal” or third-party content to subscribers. |
37
Table of Contents
| • | Mobile Enterprise Solutions (MES) enables businesses to send time- and event-based messages or alerts via voice, text message or email to customers, employees or partners, and allows operators to offer their high-value enterprise customers a broader array of services, including enterprise paging, mobile financial services and other advanced applications. |
Executive Overview
Financial Highlights
For the year ended December 31, 2009, total revenue decreased $23.4 million, or 4.6%, to $483.0 million from $506.4 million for the same period in 2008. Net income decreased $12.8 million, or 16.3%, to $65.7 million for the year ended December 31, 2009 from $78.5 million for the same period in 2008. Diluted earnings per share was $0.96 and $1.15 for the years ended December 31, 2009 and 2008, respectively.
Technology Interoperability services revenues decreased $23.9 million, or 7.5%, to $293.8 million for the year ended December 31, 2009 from $317.7 million for the same period in 2008. The revenue decrease was driven by lower prices associated with the renewal of the Verizon Wireless (Verizon) contract in September 2008 and the loss of mobile data roaming transactions between Alltel Corporation (Alltel) and Sprint Nextel resulting from the Alltel/Sprint Nextel insourcing initiative combined with the Verizon acquisition of Alltel. The impact of these decreases is partially offset by increased roaming volumes and messaging revenues of $33.2 million in the fourth quarter associated with our acquisition of the messaging business of VeriSign, Inc. In addition, our technology turnkey solutions offering has experienced lower sales due to reduced capital spending by operators in the Asia Pacific region related to the economic downturn and increased competition.
Number Portability services revenues increased $2.4 million, or 8.1%, to $31.7 million for the year ended December 31, 2009 from $29.3 million for the same period in 2008 due to increased porting volumes. Network services revenues increased $0.3 million, or 0.2%, to $122.8 million for the year ended December 31, 2009 from $122.5 million for the same period in 2008. Revenues from Call Processing services, Enterprise Solutions and Off-Network Database Queries decreased a total of $2.1 million for the year ended December 31, 2009 as compared to the same period in 2008.
Acquisitions
Acquisition of the Messaging Business of VeriSign, Inc.
On August 24, 2009, we entered into an acquisition agreement to acquire the messaging business of VeriSign, Inc. (VeriSign) for a purchase price of $175.0 million, subject to certain adjustments to reflect fluctuations in working capital. Under the acquisition agreement, we acquired the stock of VeriSign ICX Corporation and certain other assets associated with VeriSign’s Inter-Carrier Gateway, Premium Messaging Gateway, PictureMail Service and Mobile Enterprise Solutions businesses (collectively VM3). On October 23, 2009, the purchase was completed for cash proceeds of $175.0 million including final working capital adjustments of $0.5 million, which was paid subsequent to December 31, 2009. As of December 31, 2009, we have incurred $3.5 million of acquisition-related costs which are included in general and administrative expenses.
Through the acquisition of VM3, we believe we will expand our current messaging operations to achieve the solution’s scale, reach and capabilities needed to provide mobile operators with new service offerings to meet customers’ growing need for messaging services.
Acquisition of Wireless Solutions International
On May 15, 2009, we acquired certain assets of Wireless Solutions International (WSI). The acquisition was funded by a cash payment from our existing cash balances and common stock. We believe the acquisition of this GSM Association (GSMA)-certified roaming hub provider will further enhance our global roaming reach.
38
Table of Contents
Acquisition of BSG Wireless
On December 19, 2007, we acquired the wireless data clearing and financial settlement business (BSG Wireless) of Billing Services Group Limited (BSG) pursuant to a Share Purchase Agreement, dated April 1, 2007. Under the Purchase Agreement, we acquired all of the outstanding share capital of Billing Services Group Luxembourg S. à r.l. and Billing Services Group Asia Limited from BSG for an aggregate purchase price of $294.4 million in cash, which included debt repaid at closing and acquisition related costs of $7.4 million. The acquisition was funded through the draw down of our amended and restated credit facility. The acquisition enabled us to combine our industry-leading technology interoperability and network services capabilities with BSG Wireless’ GSM data clearing expertise, European, Middle Eastern and Asian operator relationships, and financial clearing and settlement capabilities.
Business Developments
India Number Portability Services
In February 2009, we entered into a joint venture agreement to implement number portability services in India. This joint venture was awarded the license for Zone 1, which includes the service areas of Delhi, Mumbai and nine other areas. We expect to provide India’s telecommunications operators with number portability clearinghouse and centralized database solutions for the next 10 years. The service offering is dependent on completing the processing platform and database, operator readiness and regulatory confirmation of the implementation timeline.
The Indian telecommunications regulatory authority announced an official delay in the implementation timeline to March 31, 2010. Our readiness efforts are continuing despite this announcement. We believe that further delays may be possible, which are dependent on operator readiness to implement number portability.
2008 Events Affecting 2009
During 2008, we became aware of several developments that have impacted our growth rates in 2009. These developments include the Alltel/Sprint Nextel insourcing initiative, the Verizon acquisition of Alltel and the Verizon renewal. Each of these developments is described below.
Alltel/Sprint Nextel Insourcing Initiative
In order to manage the expense associated with the significant volume growth in mobile data, Alltel and Sprint Nextel directly connected their IP backbone networks in January 2009. Thus, they no longer use Syniverse as a third party intermediary to manage the connectivity and exchange of billing records between their mobile data roaming platforms. Our revenue and net income for 2009 include the impact of this insourcing initiative from the January 2009 effective date.
Verizon Acquisition of Alltel
During the second quarter of 2008, Verizon announced that it would acquire Alltel. Verizon completed its acquisition of Alltel in January 2009. The impact of the combination of these two customers on us ranged across a variety of services, and affected revenues we receive not only from Verizon and Alltel, but from other roaming partners as well. As of December 31, 2009, we believe that all of the expected impact of the integration has been realized.
Verizon Renewal
Effective September 30, 2008, we have extended our contract with Verizon for three years at reduced prices. Verizon uses a large suite of services, for its data clearing and roaming operations – products such as MDR, data clearinghouse, Visibility, UniRoam and a number of other services. Verizon’s new terms and pricing remain transaction-based, primarily affecting Technology Interoperability Services.
39
Table of Contents
Revenues
Most of our revenues are transaction-based charges under long-term contracts, typically with terms averaging three years in duration. From time to time, if a contract expires and we have not previously negotiated a new contract or renewal with the customer, we continue to provide services on a month to month billing schedule under the terms of the expired contract as we negotiate new agreements or renewals. Most of the services and solutions we offer to our customers are based on applications, network connectivity and technology platforms owned and operated by us. We also generate revenues through the sale of software licenses, hardware and professional services. We generate our revenues through the sale of our technology interoperability services, network services, number portability services, call processing services, enterprise solutions and off-network database queries to telecommunications operators throughout the world. Generally, there is a slight increase in wireless roaming telephone usage and corresponding revenues in the high-travel months of our second and third fiscal quarters. In addition, for our messaging services, revenues generally grow sequentially through the calendar year with volumes peaking in the fourth quarter holiday season.
Future increases or decreases in revenues are dependent on many factors, such as industry subscriber growth, subscriber habits, and volume and pricing trends, with few of these factors known in advance. From time to time, specific events such as customer contract renewals at different terms, a customer contract termination, a customer’s decision to change technologies or to provide solutions in-house, or a consolidation of operators will be known to us and then we can estimate their impact on our revenues.
Costs and Expenses
Our costs and expenses consist of cost of operations, sales and marketing, general and administrative and depreciation and amortization.
| • | Cost of operations includes data processing costs, network costs, revenue share service provider arrangements, facilities costs, hardware costs, licensing fees, personnel costs associated with service implementation, training and customer care and off-network database query charges. |
| • | Sales and marketing includes personnel costs, advertising costs, trade show costs and relationship marketing costs. |
| • | General and administrative includes research and development expenses, a portion of the expenses associated with our facilities, business development expenses, and expenses for executive, finance, legal, human resources and other administrative departments and professional service fees relating to these functions. Our research and development expenses, which are primarily personnel, relate to technology creation, enhancement and maintenance of new and existing services. |
| • | Depreciation and amortization relate primarily to our property and equipment including our SS7 network, computer equipment, infrastructure facilities related to information management, capitalized software and other intangible assets recorded in purchase accounting. |
40
Table of Contents
Results of Operations
Comparison of 2009 and 2008
| Year Ended December 31, 2009 |
% of Revenues |
Year Ended December 31, 2008 |
% of Revenues |
2009 vs. 2008 $ |
Change % |
||||||||||||||||
| (dollars in thousands) | |||||||||||||||||||||
| Revenues: |
|||||||||||||||||||||
| Technology Interoperability Services |
$ | 293,782 | 60.8 | % | $ | 317,685 | 62.7 | % | (23,903 | ) | (7.5 | )% | |||||||||
| Network Services |
122,804 | 25.4 | % | 122,529 | 24.2 | % | 275 | 0.2 | % | ||||||||||||
| Number Portability Services |
31,654 | 6.6 | % | 29,291 | 5.8 | % | 2,363 | 8.1 | % | ||||||||||||
| Call Processing Services |
28,126 | 5.8 | % | 29,720 | 5.9 | % | (1,594 | ) | (5.4 | )% | |||||||||||
| Enterprise Solutions |
1,322 | 0.3 | % | 2,387 | 0.5 | % | (1,065 | ) | (44.6 | )% | |||||||||||
| Revenues excluding Off-Network Database |
|||||||||||||||||||||
| Queries |
477,688 | 98.9 | % | 501,612 | 99.1 | % | (23,924 | ) | (4.8 | )% | |||||||||||
| Off-Network Database Queries |
5,303 | 1.1 | % | 4,744 | 0.9 | % | 559 | 11.8 | % | ||||||||||||
| Total Revenues |
482,991 | 100.0 | % | 506,356 | 100.0 | % | (23,365 | ) | (4.6 | )% | |||||||||||
| Costs and expenses: |
|||||||||||||||||||||
| Cost of operations |
172,950 | 35.8 | % | 165,236 | 32.6 | % | 7,714 | 4.7 | % | ||||||||||||
| Sales and marketing |
38,789 | 8.0 | % | 45,549 | 9.0 | % | (6,760 | ) | (14.8 | )% | |||||||||||
| General and administrative |
74,502 | 15.4 | % | 79,241 | 15.6 | % | (4,739 | ) | (6.0 | )% | |||||||||||
| Depreciation and amortization |
60,397 | 12.5 | % | 55,344 | 10.9 | % | 5,053 | 9.1 | % | ||||||||||||
| Restructuring |
2,583 | 0.5 | % | (29 | ) | (0.0 | )% | 2,612 | (9006.9 | )% | |||||||||||
| 349,221 | 72.3 | % | 345,341 | 68.2 | % | 3,880 | 1.1 | % | |||||||||||||
| Operating income |
133,770 | 27.7 | % | 161,015 | 31.8 | % | (27,245 | ) | (16.9 | )% | |||||||||||
| Other income (expense), net: |
|||||||||||||||||||||
| Interest income |
323 | 0.1 | % | 1,894 | 0.4 | % | (1,571 | ) | (82.9 | )% | |||||||||||
| Interest expense |
(28,890 | ) | (6.0 | )% | (37,246 | ) | (7.4 | )% | 8,356 | (22.4 | )% | ||||||||||
| Other, net |
939 | 0.2 | % | (402 | ) | (0.1 | )% | 1,341 | (333.6 | )% | |||||||||||
| (27,628 | ) | (5.7 | )% | (35,754 | ) | (7.1 | )% | 8,126 | (22.7 | )% | |||||||||||
| Income before provision for income taxes |
106,142 | 22.0 | % | 125,261 | 24.7 | % | (19,119 | ) | (15.3 | )% | |||||||||||
| Provision for income taxes |
40,465 | 8.4 | % | 46,797 | 9.2 | % | (6,332 | ) | (13.5 | )% | |||||||||||
| Net income |
65,677 | 13.6 | % | 78,464 | 15.5 | % | (12,787 | ) | (16.3 | )% | |||||||||||
| Less: Net loss attributable to noncontrolling interests |
(590 | ) | (0.1 | )% | — | 0.0 | % | (590 | ) | (100.0 | )% | ||||||||||
| Net income attributable to Syniverse Holdings, Inc. |
$ | 66,267 | 13.7 | % | $ | 78,464 | 15.5 | % | $ | (12,197 | ) | (15.5 | )% | ||||||||
Revenues
Total revenues decreased $23.4 million to $483.0 million for the year ended December 31, 2009 from $506.4 million for the same period in 2008. The decrease in revenues was primarily due to decreases in Technology Interoperability Services, Call Processing Services and Enterprise Solutions offset in part by an increase in Network Services, Number Portability Services and Off-Network Database Queries and the addition of VM3 messaging revenues of $33.2 million in the fourth quarter of 2009.
Technology Interoperability Services revenues decreased $23.9 million to $293.8 million for the year ended December 31, 2009 from $317.7 million for the same period in 2008. The revenue decrease was driven by lower
41
Table of Contents
prices associated with the renewal of the Verizon contract in September 2008 and the loss of mobile data roaming transactions between Alltel and Sprint Nextel resulting from the Alltel/Sprint Nextel insourcing initiative combined with the Verizon acquisition of Alltel. The impact of these decreases is partially offset by increased roaming volumes and messaging revenues of $33.2 million in the fourth quarter associated with our acquisition of VM3. In addition, our technology turnkey solutions offering has experienced lower sales due to reduced capital spending by operators in the Asia Pacific region related to the economic downturn and increased competition.
Network Services revenues increased $0.3 million to $122.8 million for the year ended December 31, 2009 from $122.5 million for the same period in 2008.
Number Portability Services revenues increased $2.4 million to $31.7 million for the year ended December 31, 2009 from $29.3 million for the same period in 2008. The increase in revenues was primarily due to organic volume growth and our Singapore number portability services.
Call Processing Services revenues decreased $1.6 million to $28.1 million for the year ended December 31, 2009 from $29.7 million for the same period in 2008. The decrease in revenues was due to continued declines in our legacy fraud-related services and Signaling Solutions due to the September 2008 Verizon renewal and expected network migrations, which was partially offset by higher call processing volumes. We expect this decline in revenue for our legacy fraud-related services to continue.
Enterprise Solutions Services revenues decreased $1.1 million to $1.3 million for the year ended December 31, 2009 from $2.4 million for the same period in 2008. The decrease in revenues was primarily due to a lower number of subscribers on our enterprise wireless data management platform, which we expect to continue.
Off-Network Database Queries revenues increased $0.6 million to $5.3 million for the year ended December 31, 2009 from $4.7 million for the same period in 2008. The increase in revenues was primarily driven by increased volumes. We pass these off-network database query fees onto our customers, with little or no margin, based upon the charges we receive from the third-party database providers. We expect these services to decline in future periods.
Expenses
Cost of operations increased $7.8 million to $173.0 million for the year ended December 31, 2009 from $165.2 million for the same period in 2008. The increase was primarily due to operating costs associated with our acquisition of VM3 in the fourth quarter offset by lower costs associated with our technology turnkey solutions offering as a result of reduced capital spending by operators in the Asia Pacific region, lower performance-based compensation and lower data processing costs as a result of our cost reduction efforts. As a percentage of revenue, cost of operations is expected to increase from 35.8% in 2009 to approximately 38% for 2010 as a result of the full year impact of the VM3 acquisition, which has historically produced lower margins than our core businesses.
Sales and marketing expenses decreased $6.7 million to $38.8 million for the year ended December 31, 2009 from $45.5 million for the same period in 2008. The decrease was primarily due to lower sales incentives, performance-based compensation and discretionary expenses offset by increased costs associated with VM3 services in the fourth quarter.
General and administrative decreased $4.7 million to $74.5 million for the year ended December 31, 2009 from $79.2 million for the same period in 2008. The decrease was primarily due to lower performance-based compensation and discretionary expenses partially offset by an increase of $3.4 million in professional services primarily related to the acquisition of the VM3 business.
42
Table of Contents
Depreciation and amortization expenses increased $5.1 million to $60.4 million for the year ended December 31, 2009 from $55.3 million for the same period in 2008. The increase was primarily due to additional amortization of acquired intangible assets from our acquisition of VM3.
Restructuring expense was $2.6 million for the year ended December 31, 2009. In December 2009, we completed a restructuring plan to reduce our workforce in Asia Pacific to better align our operating costs to the economic environment and eliminated certain redundant positions in Europe and North America. As a result of this plan, we incurred severance related costs of $2.6 million.
Other
Interest income decreased $1.6 million to $0.3 million for the year ended December 31, 2009 from $1.9 million for the same period in 2008. The decrease was due to lower yields earned on outstanding cash balances.
Interest expense decreased $8.3 million to $28.9 million for the year ended December 31, 2009 from $37.2 million for the same period in 2008. The decrease was primarily due to lower interest rates on our senior credit facility.
Other, net increased $1.3 million to $0.9 million for the year ended December 31, 2009 from $(0.4) million for the same period in 2008. The increase was primarily due to foreign currency transaction gains on foreign denominated cash balances and intercompany accounts as a result of our global presence.
Provision for income taxes decreased $6.3 million to $40.5 million for the year ended December 31, 2009 from $46.8 million for the same period in 2008. During the year ended December 31, 2009 and 2008, the effective tax rate was 38.1% and 37.4%, respectively. The increase in our effective tax rate is attributed to the mix of income from domestic and foreign tax jurisdictions with higher tax rates offset by our tax planning initiatives. We believe our effective tax rate may increase in 2010 due to the operations of VM3 as a large portion of the revenues generated by these messaging services are in domestic jurisdictions subject to higher tax rates.
43
Table of Contents
Results of Operations
Comparison of 2008 and 2007
| Year Ended December 31, 2008 |
% of Revenues |
Year Ended December 31, 2007 |
% of Revenues |
2008 vs. 2007 $ |
Change % |
||||||||||||||||
| (dollars in thousands) | |||||||||||||||||||||
| Revenues: |
|||||||||||||||||||||
| Technology Interoperability Services |
$ | 317,685 | 62.7 | % | $ | 184,471 | 48.8 | % | 133,214 | 72.2 | % | ||||||||||
| Network Services |
122,529 | 24.2 | % | 124,788 | 33.1 | % | (2,259 | ) | (1.8 | )% | |||||||||||
| Number Portability Services |
29,291 | 5.8 | % | 27,128 | 7.2 | % | 2,163 | 8.0 | % | ||||||||||||
| Call Processing Services |
29,720 | 5.9 | % | 31,421 | 8.3 | % | (1,701 | ) | (5.4 | )% | |||||||||||
| Enterprise Solutions |
2,387 | 0.5 | % | 4,084 | 1.1 | % | (1,697 | ) | (41.6 | )% | |||||||||||
| Revenues excluding Off-Network Data Base |
|||||||||||||||||||||
| Queries |
501,612 | 99.1 | % | 371,892 | 98.5 | % | 129,720 | 34.9 | % | ||||||||||||
| Off-Network Database Queries |
4,744 | 0.9 | % | 5,632 | 1.5 | % | (888 | ) | (15.8 | )% | |||||||||||
| Total Revenues |
506,356 | 100.0 | % | 377,524 | 100.0 | % | 128,832 | 34.1 | % | ||||||||||||
| Costs and expenses: |
|||||||||||||||||||||
| Cost of operations |
165,236 | 32.6 | % | 137,520 | 36.4 | % | 27,716 | 20.2 | % | ||||||||||||
| Sales and marketing |
45,549 | 9.0 | % | 30,637 | 8.1 | % | 14,912 | 48.7 | % | ||||||||||||
| General and administrative |
79,241 | 15.6 | % | 56,937 | 15.1 | % | 22,304 | 39.2 | % | ||||||||||||
| Depreciation and amortization |
55,344 | 10.9 | % | 42,867 | 11.4 | % | 12,477 | 29.1 | % | ||||||||||||
| Restructuring |
(29 | ) | (0.0 | )% | 2,211 | 0.6 | % | (2,240 | ) | (101.3 | )% | ||||||||||
| 345,341 | 68.2 | % | 270,172 | 71.6 | % | 75,169 | 27.8 | % | |||||||||||||
| Operating income |
161,015 | 31.8 | % | 107,352 | 28.4 | % | 53,663 | 50.0 | % | ||||||||||||
| Other income (expense), net: |
|||||||||||||||||||||
| Interest income |
1,894 | 0.4 | % | 2,049 | 0.5 | % | (155 | ) | (7.6 | )% | |||||||||||
| Interest expense |
(37,246 | ) | (7.4 | )% | (25,603 | ) | (6.8 | )% | (11,643 | ) | 45.5 | % | |||||||||
| Other, net |
(402 | ) | (0.1 | )% | (69 | ) | (0.0 | )% | (333 | ) | 482.6 | % | |||||||||
| (35,754 | ) | (7.1 | )% | (23,623 | ) | (6.3 | )% | (12,131 | ) | 51.4 | % | ||||||||||
| Income before provision for income taxes |
125,261 | 24.7 | % | 83,729 | 22.2 | % | 41,532 | 49.6 | % | ||||||||||||
| Provision for income taxes |
46,797 | 9.2 | % | 31,310 | 8.3 | % | 15,487 | 49.5 | % | ||||||||||||
| Net income |
$ | 78,464 | 15.5 | % | $ | 52,419 | 13.9 | % | $ | 26,045 | 49.7 | % | |||||||||
Revenues
Total revenues increased $128.8 million to $506.4 million for the year ended December 31, 2008 from $377.5 million for the same period in 2007. The increase in revenues was primarily due to growth in Technology Interoperability Services driven by organic volume growth in our wireless data clearinghouse services, SMS and MMS interoperability, MDR services and the addition of $54.9 million of revenues from BSG Wireless.
Technology Interoperability Services revenues increased $133.2 million to $317.7 million for the year ended December 31, 2008 from $184.5 million for the same period in 2007. The increase in revenues was primarily due to organic volume growth in our wireless data clearinghouse services, SMS and MMS interoperability, MDR and the addition of $54.9 million of revenues from BSG Wireless for the year ended December 31, 2008.
Network Services revenues decreased $2.3 million to $122.5 million for the year ended December 31, 2008 from $124.8 million for the same period in 2007. The decrease in revenues was primarily due to customer migrations off our services platform partially offset by increases in our SS7 and data networking products.
44
Table of Contents
Number Portability Services revenues increased $2.2 million to $29.3 million for the year ended December 31, 2008 from $27.1 million for the same period in 2007. The increase was primarily driven by an increase in wireless porting volumes resulting from both specific promotions of certain significant wireless operators in the U.S. and other porting activities.
Call Processing Services revenues decreased $1.7 million to $29.7 million for the year ended December 31, 2008 from $31.4 million for the same period in 2007. The decrease in revenues was due to continued declines in our legacy fraud-related services and Signaling Solutions due to expected network migrations. We expect this decline to continue for our legacy fraud-related services.
Enterprise Solutions revenues decreased $1.7 million to $2.4 million for the year ended December 31, 2008 from $4.1 million for the same period in 2007. The decrease in revenues was primarily due to a lower number of subscribers on our enterprise wireless data management platform. We expect this decline to continue.
Off-Network Database Queries revenues decreased $0.9 million to $4.7 million for the year ended December 31, 2008 from $5.6 million for the same period in 2007. The decrease in revenues was primarily driven by customers moving to direct access and billing arrangements with third-party intelligent network database providers. We pass these off-network database query fees onto our customers, with little or no margin, based upon the charges we receive from the third-party database providers. We expect this decline to continue.
Costs and expenses
Cost of operations increased $27.7 million to $165.2 million for the year ended December 31, 2008 from $137.5 million for the same period in 2007. The increase was primarily due to expenses incurred by BSG Wireless, increased performance compensation and higher data processing costs commensurate with higher revenues.
Sales and marketing expenses increased $14.9 million to $45.5 million for the year ended December 31, 2008 from $30.6 million for the same period in 2007. The increase was primarily due to higher employee-related expenses for our global expansion, increased performance compensation and expenses incurred by BSG Wireless.
General and administrative expenses increased $22.3 million to $79.2 million for the year ended December 31, 2008 from $56.9 million for the same period in 2007. The increase was primarily due to expenses incurred by BSG Wireless and increases in legal fees, travel, sales incentive and performance compensation commensurate with higher revenues and severance and relocation expenses associated with changes in our senior management team.
Depreciation and amortization expenses increased $12.4 million to $55.3 million for the year ended December 31, 2008 from $42.9 million for the same period in 2007. The increase was primarily due to additional amortization of acquired intangible assets from our acquisition of BSG Wireless.
Restructuring expense was $2.2 million for the year ended December 31, 2007. In January 2007, we completed a restructuring plan resulting in the closure of our Oklahoma office, the elimination of certain executive positions, and the termination of 10 employees. As a result, we incurred $0.7 million in severance related costs and $1.3 million in costs associated with the lease of our corporate aircraft. In June 2007, we committed to a restructuring plan affecting our technology development and support groups. We estimated that the plan would result in the elimination of 56 employees over the remainder of the year. As a result, we accrued $0.6 million in severance related costs. During the third and fourth quarter of 2007, we experienced a higher than expected level of attrition among the employees impacted by the offshoring plan resulting in a reduction of our severance liability of $0.4 million.
45
Table of Contents
Other
Interest income was $1.9 million and $2.0 million for the years ended December 31, 2008 and 2007, respectively. Interest income was primarily earned on outstanding cash balances.
Interest expense increased $11.6 million to $37.2 million for the year ended December 31, 2008 from $25.6 million for the same period in 2007. The increase was primarily due to higher outstanding debt resulting from the financing of our acquisition of BSG Wireless in December 2007.
Other, net increased $0.3 million to $(0.4) million for the year ended December 31, 2008 from $(0.1) million for the same period in 2007. The increase was primarily due to foreign currency transaction losses as a result of our global expansion.
Provision for income taxes increased $15.5 million to $46.8 million for the year ended December 31, 2008 from $31.3 million for the same period in 2007. The increase in income taxes was primarily due to higher income before taxes. Our effective tax rates for the years ended December 31, 2008 and 2007 was approximately 37.4%.
Liquidity and Capital Resources
Cash Flow Information
Cash and cash equivalents were $91.9 million at December 31, 2009 as compared to $165.6 million at December 31, 2008. The following table sets forth, for the periods indicated, selected consolidated cash flow information (in thousands).
| Year Ended December 31, | ||||||||||||
| 2009 | 2008 | 2007 | ||||||||||
| Net cash provided by operating activities |
$ | 142,373 | $ | 163,972 | $ | 121,262 | ||||||
| Net cash used in investing activities |
(215,256 | ) | (41,642 | ) | (301,953 | ) | ||||||
| Net cash provided by (used) in financing activities |
1,317 | (903 | ) | 202,275 | ||||||||
| Effect of exchange rate changes on cash |
(2,105 | ) | (4,908 | ) | 798 | |||||||
| Net (decrease) increase in cash |
$ | (73,671 | ) | $ | 116,519 | $ | 22,382 | |||||
Net cash provided by operating activities was $142.4 million for the year ended December 31, 2009 as compared to $164.0 million for the same period in 2008. The decrease was primarily related to lower net income adjusted for non-cash items and timing of working capital items including estimated tax payments. Changes in non-cash items were driven primarily by higher depreciation and amortization related to VM3 acquired property and equipment and intangibles offset by a decrease in deferred income tax expense. The overall decrease in working capital was largely related to a decline in variable performance compensation and by additional obligations owed to VeriSign, Inc. associated with a transition services agreement entered into as a part of the VM3 acquisition.
Net cash used in investing activities was $215.3 million for the year ended December 31, 2009, which includes $37.7 million for capital expenditures, $3.1 million for the acquisition of WSI and $174.5 million for the acquisition of VM3. Net cash used in investing activities was $41.6 million for the year ended December 31, 2008, which includes $40.8 million for capital expenditures and an adjustment of $0.8 million related to the acquisition of BSG Wireless. Net cash used in investing activities was $302.0 million for the year ended December 31, 2007, which includes $273.6 million, net of acquired cash, for the acquisition of BSG Wireless and $27.7 million for capital expenditures.
Capital expenditures for property and equipment, including capitalized software costs, decreased $3.1 million to $37.7 million for the year ended December 31, 2009 from $40.8 million for the same period in 2008.
46
Table of Contents
For the year ended December 31, 2009 we incurred approximately $37.7 million for capital expenditures related to investment in network capacity and our new IPX infrastructure, upgrading our business continuity and disaster recovery platform and capitalized software for new products and services. Capital expenditures for property and equipment, including capitalized software costs, increased $13.1 million to $40.8 million for the year ended December 31, 2008 from $27.7 million for the same period in 2007. For the year ended December 31, 2008 we incurred approximately $40.8 million for capital expenditures primarily for network infrastructure to support customer growth, non-network production upgrades and capitalized software. For the year ended December 31, 2007 we incurred approximately $27.7 million for capital expenditures primarily for non-network production upgrades, investment in our messaging infrastructure to support our anticipated growth and capitalized software development. We expect total capital expenditures in 2010 to be approximately 9.2% of revenues (excluding Off-Network Database Queries), which includes approximately $11.0 million for one-time capital expenditures related to the integration of VM3.
Net cash provided by financing activities was $1.3 million for the year ended December 31, 2009, which includes principal payments on our senior credit facility of $3.4 million offset by $3.8 million for issuances of stock related to stock-based compensation and $1.0 million in capital contributions received from partners holding a noncontrolling interest in a joint venture. Net cash used in financing activities was $0.9 million for the year ended December 31, 2008, which includes principal payments on our senior credit facility of $3.5 million offset by $2.6 million for issuances of stock related to stock-based compensation. Net cash provided by financing activities was $202.3 million for the year ended December 31, 2007, which includes $290.0 million of borrowings to fund our acquisition of BSG Wireless partially offset by principal payments on our senior credit facility of $81.6 million and debt issuance costs paid in connection with our amended and restated credit facility of $7.2 million.
On October 6, 2008, we entered into an interest rate swap agreement to hedge $100.0 million of our U.S.-denominated term loan under our senior credit facility. The hedge effectively swaps variable rate interest expense based on 1-month LIBOR to a fixed rate interest expense thereby reducing our exposure to interest rate fluctuations. The effective date of the swap is October 31, 2008 and the maturity date is October 31, 2010. The fixed rate is 5.26% based on our 2.76% swap rate plus our 2.50% applicable margin.
Our principal sources of liquidity are cash flows generated from operations and borrowings under our senior credit facility. Our principal uses of cash are to meet debt service requirements, finance our capital expenditures, make acquisitions and provide working capital. We expect that cash on hand, cash available from operations, and the availability of cash under our revolving line of credit will be sufficient to fund our operations, debt service and capital expenditures for the foreseeable future.
Debt and Credit Facilities
Amended and Restated Senior Credit Facility
On August 9, 2007, we entered into a $464.0 million amended and restated credit agreement, the senior credit facility, with Lehman Brothers Inc. and Deutsche Bank Securities Inc. as joint lead arrangers and joint book-running managers, Lehman Commercial Paper Inc., as administrative agent, Deutsche Bank AG New York Branch, as syndication agent, Bear Stearns Corporate Lending Inc. and LaSalle Bank National Association, as co-documentation agents and the lenders from time to time parties thereto. The obligations under the senior credit facility are unconditionally guaranteed by Syniverse Holdings, Inc. and all material U.S. domestic subsidiaries of Syniverse Technologies, Inc. (the “Guarantors”) and are secured by a security interest in substantially all of the tangible and intangible assets of Syniverse Technologies, Inc. and the Guarantors. The obligations under the senior credit facility are also secured by a pledge of the capital stock of Syniverse Technologies, Inc. and its direct and indirect U.S. subsidiaries.
47
Table of Contents
The senior credit facility provides for aggregate borrowings of $464.0 million as follows:
| • | a term loan of $112.0 million in aggregate principal amount; |
| • | a delayed draw term loan of $160.0 million in aggregate principal; |
| • | a Euro-denominated delayed draw term loan facility of the equivalent of $130.0 million; |
| • | a revolving credit line of $42.0 million; and |
| • | a Euro-denominated revolving credit line of the equivalent of $20.0 million. |
On December 19, 2007, the delayed draw term loans of $290.0 million (delayed draw term loan of $160.0 million and Euro-denominated delayed draw term loan of the equivalent of $130.0 million) were used to fund the acquisition of the BSG Wireless described in Note 4 of our consolidated financial statements, including the repayment of existing debt and to pay related transaction fees and expenses. The delayed draw term loans were subject to a commitment fee of 1.25% per annum on undrawn amounts.
The applicable margin for the base rate term loan and the base rate revolving loans is 1.50%. U.S. dollar denominated borrowings bear interest at either a base rate or, at our option, a LIBOR rate. The applicable margin for the Eurodollar term loan, Euro-denominated term loan and Eurodollar revolving loans is 2.50%. Euro-denominated borrowings under the senior credit facility bear interest at a EURIBOR rate. The term loan facilities require regularly scheduled quarterly payments of principal and interest, and the entire amount of the term loan facilities will mature on August 9, 2014. The full amount borrowed under the revolving credit line will mature on August 9, 2013. In the event we fail to refinance our 7 3/4% senior subordinated notes by February 15, 2013, then the maturity date of our term loan facilities and revolving credit line will be accelerated to February 15, 2013.
On May 4, 2009, we entered into an Amendment, Waiver, Resignation and Appointment Agreement, or the amendment, with Lehman Commercial Paper Inc., Bank of America, N.A., and certain of the other parties to the senior credit facility. Pursuant to the amendment, Lehman Commercial Paper has resigned as administrative agent and Bank of America has been appointed as successor administrative agent under the senior credit facility. The amendment also provides for other modifications of the senior credit facility including the termination of Lehman Commercial Paper’s commitments under our undrawn revolving credit lines of $28.2 million and provides for Bank of America to extend commitments under our undrawn revolving credit lines of $10.0 million. This modification reduces our revolving credit lines from $62.0 million to $43.8 million.
As of December 31, 2009, we had an aggregate face amount of $337.5 million of outstanding indebtedness under our senior credit facility representing $211.0 million in U.S. dollar denominated term loans, $126.5 million in Euro-denominated term loans, $29.6 million available under the revolving credit line and $14.2 million available under the Euro-denominated revolving credit line. As of December 31, 2009, the applicable interest rate was 2.73% on the term loan based on the LIBOR option and 2.97% on the Euro-denominated delayed term loan based on the EURIBOR option.
The senior credit facility contains covenants that will limit our ability and that of our Guarantors to, among other things, incur or guarantee additional indebtedness, create liens, pay dividends on or repurchase stock, make certain types of investments, restrict dividends or other payments from our subsidiaries, enter into transactions with affiliates and sell assets or merge with other companies. The senior credit facility also requires compliance with financial covenants, including a maximum ratio of total indebtedness to Consolidated EBITDA. As of December 31, 2009, we believe we are in substantial compliance with all of our covenants contained in the senior credit facility.
7 3/4% Senior Subordinated Notes Due 2013
On August 24, 2005, we completed a private offering of $175.0 million in aggregate principal amount of our 7 3/4% senior subordinated notes due 2013. Interest on the notes accrues at the rate of 7 3/4% per annum and is payable semi-annually in arrears on February 15 and August 15, commencing on February 15, 2006.
48
Table of Contents
The indenture governing our 7 3/4% senior subordinated notes due 2013 contains certain covenants that among other things, limit our ability to incur additional indebtedness and issue preferred stock, pay dividends, make other restricted payments and investments, create liens, incur restrictions on the ability of our subsidiaries to pay dividends or other payments to them, sell assets, merge or consolidate with other entities, and enter into transactions with affiliates. As of December 31, 2009, we believe we are in substantial compliance with all of the covenants contained in the indenture governing our senior subordinated notes.
Non-GAAP Financial Measures
We believe that the disclosure of adjusted EBITDA, operating free cash flow, adjusted net income and cash net income is useful to investors as these non-GAAP measures form the basis of how our executive team and Board of Directors evaluates our performance. By disclosing these non-GAAP measures, we believe that we create for investors a greater understanding of, and an enhanced level of transparency into, the means by which our management team operates our company. We also believe these measures can assist investors in comparing our performance to that of other companies on a consistent basis without regard to certain items that do not directly affect our ongoing operating performance or cash flows.
Adjusted EBITDA, operating free cash flow, adjusted net income and cash net income have limitations as analytical tools, and should not be relied on or considered in isolation or as a substitute for GAAP measures, such as net income, cash flows from operating activities and other consolidated income or other cash flows statement data prepared in accordance with GAAP. In addition, these non-GAAP measures may not be comparable to other similarly titled measures of other companies. Because of these limitations, adjusted EBITDA and operating free cash flow should not be considered as measures of discretionary cash available to us to invest in the growth of our business. Adjusted net income and cash net income also should not be considered as a replacement for, or a measure that should be used or analyzed in lieu of, net income. We attempt to compensate for these limitations by relying primarily upon our GAAP results and using adjusted EBITDA, operating free cash flow, adjusted net income and cash net income as supplemental information only.
Adjusted EBITDA and Operating Free Cash Flow
Adjusted EBITDA is determined by adding the following items to net income: interest expense, net, provision for income taxes, depreciation and amortization, restructuring, non-cash stock compensation, BSG Wireless transition expenses, and messaging acquisition and integration expenses.
Operating free cash flow is determined by subtracting capital expenditures from, and adding the change in working capital due to payment of BSG pre-acquisition contractual obligation, cash received in legal settlement and ITHL contingent payment to net cash provided by operating activities.
We utilize adjusted EBITDA and operating free cash flow because we believe that adjusted EBITDA and operating free cash flow provide useful information regarding our continuing operating results. We rely on adjusted EBITDA and operating free cash flow as primary measures to review and assess the operating performance of our management team in connection with our executive compensation and bonus plans. We also review adjusted EBITDA and operating free cash flow to compare our current operating results with corresponding periods and with the operating results of other companies in our industry. In addition, we utilize adjusted EBITDA and operating free cash flow as an assessment of our overall liquidity and our ability to meet our debt service obligations.
Adjusted Net Income and Cash Net Income
Cash net income is determined by first calculating adjusted net income. Adjusted net income is calculated by (i) adding the following items to net income: provision for income taxes, restructuring, non-cash stock compensation, BSG Wireless transition expenses, messaging acquisition and integration expenses, and purchase
49
Table of Contents
accounting amortization; (ii) adjusting the resulting pre-tax sum for a provision for income taxes at an assumed long-term tax rate of 37.5% (39% for all periods through December 31, 2007), which excludes the effect of our net operating losses; and (iii) adding to that sum the cash benefit of our tax-deductible goodwill. The cash benefit is a result of the differing treatments of approximately $436 million of goodwill on our balance sheet at December 31, 2009 ($362 million for periods ending December 31, 2008 and 2007), which primarily is the result of acquisitions that we made from Verizon in February 2002, IOS North America in September 2004 and VM3 in October 2009. Specifically, while this goodwill is not amortized for GAAP purposes, the amortization of goodwill is, nonetheless, deductible in calculating our taxable income and, hence, reduces actual cash tax liabilities.
Reconciliation of Non-GAAP Measures to GAAP
A reconciliation of adjusted net income, cash net income and adjusted EBITDA to net income, the closest GAAP financial measure, is presented in the financial tables below.
| Year Ended | ||||||||||||
| December 31, 2009 |
December 31, 2008 |
December 31, 2007 |
||||||||||
| (dollars in thousands) | ||||||||||||
| Reconciliation to adjusted net income and cash net income |
||||||||||||
| Net income |
$ | 65,677 | $ | 78,464 | $ | 52,419 | ||||||
| Add provision for income taxes |
40,465 | 46,797 | 31,310 | |||||||||
| Income before provision for income taxes |
106,142 | 125,261 | 83,729 | |||||||||
| Restructuring |
2,583 | (29 | ) | 2,211 | ||||||||
| Non-cash stock compensation |
7,939 | 5,205 | 3,564 | |||||||||
| BSG Wireless transition expenses |
6,819 | 13,159 | — | |||||||||
| Messaging acquisition and integration expenses |
4,666 | — | — | |||||||||
| Purchase accounting amortization |
29,769 | 28,650 | 18,812 | |||||||||
| Adjusted income before provision for income taxes |
157,918 | 172,246 | 108,316 | |||||||||
| Less assumed provision for income taxes at 37.5% for 2009 and 39% for 2008 and 2007 |
(59,219 | ) | (67,176 | ) | (42,243 | ) | ||||||
| Adjusted net income |
98,699 | 105,070 | 66,073 | |||||||||
| Add cash savings of tax deductible goodwill (1) |
9,592 | 9,204 | 9,204 | |||||||||
| Cash net income |
$ | 108,291 | $ | 114,274 | $ | 75,277 | ||||||
| (1) | Represents the cash benefit realized currently as a result of the tax deductibility of goodwill amortization. |
| Year Ended | ||||||||||
| December 31, 2009 |
December 31, 2008 |
December 31, 2007 | ||||||||
| (dollars in thousands) | ||||||||||
| Reconciliation to adjusted EBITDA |
||||||||||
| Net income |
$ | 65,677 | $ | 78,464 | $ | 52,419 | ||||
| Interest expense, net |
28,567 | 35,352 | 23,554 | |||||||
| Provision for income taxes |
40,465 | 46,797 | 31,310 | |||||||
| Depreciation and amortization |
60,397 | 55,344 | 42,867 | |||||||
| Restructuring |
2,583 | (29 | ) | 2,211 | ||||||
| Non-cash stock compensation |
7,939 | 5,205 | 3,564 | |||||||
| BSG Wireless transition expenses |
6,819 | 13,159 | — | |||||||
| Messaging acquisition and integration expenses |
4,666 | — | — | |||||||
| Adjusted EBITDA |
$ | 217,113 | $ | 234,292 | $ | 155,925 | ||||
50
Table of Contents
A reconciliation of operating free cash flow to net cash provided by operating activities, the closest GAAP measure, is presented in the financial tables below.
| Year Ended | ||||||||||||
| December 31, 2009 |
December 31, 2008 |
December 31, 2007 |
||||||||||
| (dollars in thousands) | ||||||||||||
| Reconciliation to operating free cash flow |
||||||||||||
| Net cash provided by operating activities |
$ | 142,373 | $ | 163,972 | $ | 121,262 | ||||||
| Capital expenditures |
(37,654 | ) | (40,819 | ) | (27,665 | ) | ||||||
| Change in working capital due to payment of BSG pre-acquisition contractual obligation |
— | 5,440 | — | |||||||||
| Cash received in legal settlement |
— | — | (2,500 | ) | ||||||||
| Change in working capital due to ITHL contingent payment |
— | — | 6,160 | |||||||||
| Operating free cash flow |
$ | 104,719 | $ | 128,593 | $ | 97,257 | ||||||
Effect of Inflation
Inflation generally affects us by increasing our cost of labor, equipment and new materials. We do not believe that inflation has had any material effect on our results of operations during the years ended December 31, 2009 and 2008.
Critical Accounting Policies and Estimates
The preparation of our financial statements in conformity with accounting principles generally accepted in the United States requires us to make estimates and judgments that affect our reported amounts of assets and liabilities, revenues and expenses. We consider an accounting estimate to be critical if it requires assumptions to be made that were uncertain at the time the estimate was made and changes in the estimate or different estimates that could have been selected could have a material impact on our consolidated results of operations or financial condition. We have identified the following critical accounting policies that affect the more significant estimates and judgments.
Revenue Recognition
We derive revenues from six categories: Technology Interoperability Services, Network Services, Number Portability Services, Call Processing Services, Enterprise Solutions and Off-Network Database Queries. The revenue recognition policy for each of these areas is described in Note 2 of Notes to Consolidated Financial Statements contained in this report.
Stock-Based Compensation
We recognize stock-based payments in our consolidated statements of income based on their grant-date fair values. The fair value of options are determined using the Black-Scholes model. The Black-Scholes model requires the input of subjective assumptions, including the expected life of the option, risk-free rate, expected dividend yield, and the price volatility of the underlying stock. Judgment is also required in estimating the number of stock awards that are expected to vest as a result of satisfaction of time-based vesting schedules or the achievement of certain performance conditions. We recognize compensation expense, reduced for estimated forfeitures, on a straight-line basis over the requisite service period of the award, which is generally the vesting term of the outstanding stock awards. If actual results or future changes in estimates differ significantly from our current estimates, stock-based compensation could increase or decrease. For further discussion of our stock-based compensation, refer to Note 7 of Notes to Consolidated Financial Statements contained in this report.
51
Table of Contents
Impairment Losses on Long-Lived Assets
We review our long-lived assets, including property and equipment, capitalized software and intangibles with definite lives for impairment when events or changes in circumstances indicate the carrying value of such assets may not be recoverable. We also evaluate the useful life of our assets each reporting period, and if deemed to be shorter than originally estimated, would result in an increase in our annual depreciation and/or amortization expense.
If an impairment indicator exists, we perform a comparison of the carrying value of the assets with the assets’ expected future undiscounted cash flows without interest costs. An impairment loss is recognized if the carrying amount of a long-lived asset is not recoverable and exceeds its fair value. The carrying amount of a long-lived asset is deemed to not be recoverable if it exceeds the sum of its undiscounted cash flows. Estimates of expected future cash flows are management’s best estimate based on reasonable and supportable assumptions and projections. If actual market conditions are less favorable than those projected by management, asset impairment charges may be required. Management continues to evaluate overall industry and company-specific circumstances and conditions to identify indicators of impairment. No impairment was recognized for the year ended December 31, 2009.
Impairment Losses on Goodwill
We evaluate goodwill for impairment at least annually, or more frequently if indicators of impairment arise, in accordance with the provisions of generally accepted accounting standards. Our evaluation of goodwill is measured by a two-step impairment test. The first step compares the fair value of our reporting unit with its carrying amount, including goodwill. If the carrying amount of our reporting unit exceeds its fair value, we then compare the implied fair value of the reporting unit’s goodwill with the carrying amount of that goodwill. An impairment loss would be recognized to the extent that the carrying amount of the reporting unit’s goodwill exceeds the implied fair value of that goodwill. Estimates are based on reasonable and supportable assumptions and projections. If actual market conditions are less favorable than those projected by management, an impairment loss may be required to be recognized. Management will continue to evaluate overall industry and company-specific circumstances and conditions as necessary. In addition, we do not believe that our single reporting unit is at risk of failing the initial step for calculating goodwill impairment as of December 31, 2009. No impairment was recognized for the year ended December 31, 2009.
Recent Accounting Pronouncements
Recently Adopted Accounting Pronouncements
In December 2007, the Financial Accounting Standards Board (FASB) issued new consolidations guidance specifically related to accounting for noncontrolling interests. This guidance establishes accounting and reporting standards for ownership interests in subsidiaries held by parties other than the parent, changes in a parent’s ownership of a noncontrolling interest, calculation and disclosure of the consolidated net income attributable to the parent and the noncontrolling interest, changes in a parent’s ownership interest while the parent retains its controlling financial interest and fair value measurement of any retained noncontrolling equity investment. This guidance is effective for financial statements issued for fiscal years beginning after December 15, 2008, and interim periods within those fiscal years. We adopted the new guidance on January 1, 2009, which did not have a material impact on our consolidated financial position and results of operations.
In December 2007, the FASB issued new guidance on business combinations. The revised guidance establishes how acquirers recognize and measure the consideration transferred, identifiable assets acquired, liabilities assumed, noncontrolling interests, and goodwill acquired in a business combination. This guidance also expands required disclosures surrounding the nature and financial effects of business combinations. The provisions of this accounting guidance are effective, on a prospective basis, for fiscal years beginning after December 15, 2008. We adopted this guidance on January 1, 2009. During the year ended December 31, 2009,
52
Table of Contents
we completed two acquisitions which were both accounted for under the acquisition method in accordance with this guidance. Please refer to Notes 5 and 6 to our Notes to Consolidated Financial Statements for the impact on our consolidated financial position and results of operation of adopting this guidance.
In May 2009, the FASB issued new guidance on subsequent events. This accounting guidance establishes general standards of accounting for, and disclosures of, events that occur after the balance sheet date but before financial statements are issued or are available to be issued. This guidance was effective for interim or fiscal periods ending after June 15, 2009. We adopted the provisions of this guidance on July 1, 2009. Adoption of the accounting guidance did not have a material impact on our consolidated financial position and results of operations.
Recently Issued Accounting Pronouncements
In June 2009, the FASB issued new consolidations guidance specifically related to variable interest entities. This accounting guidance eliminates exceptions to consolidating qualifying special-purpose entities, contains new criteria for determining the primary beneficiary, and increases the frequency of required reassessments to determine whether a company is the primary beneficiary of a variable interest entity. In addition, this guidance also contains a new requirement that any term, transaction, or arrangement that does not have a substantive effect on an entity’s status as a variable interest entity, a company’s power over a variable interest entity, or a company’s obligation to absorb losses or its right to receive benefits of an entity must be disregarded in applying the provisions. The elimination of the qualifying special-purpose entity concept and its consolidation exceptions means more entities will be subject to consolidation assessments and reassessments. The provisions of this guidance are effective as of the beginning of an enterprise’s first fiscal year beginning after November 15, 2009, and for interim periods within that first period, with earlier adoption prohibited. We are currently assessing the potential impacts, if any, on our consolidated financial position and results of operations.
In September 2009, the FASB issued Accounting Standards Update (ASU) 2009-13, Multiple-Deliverable Revenue Arrangements, which is included in the ASC in Topic 605 (Revenue Recognition). ASU 2009-13 amends previous revenue recognition guidance to require an entity to apply the relative selling price allocation method in order to a estimate selling price for all units of accounting, including delivered items, when vendor-specific objective evidence or acceptable third-party evidence does not exist. ASU 2009-13 is effective for revenue arrangements entered into or materially modified in fiscal years beginning on or after June 15, 2010 and shall be applied on a prospective basis. Earlier application is permitted as of the beginning of an entity’s fiscal year. We are currently assessing the potential impact of ASU 2009-13 on our consolidated financial position and results of operations.
In September 2009, the FASB issued ASU 2009-14, Certain Revenue Arrangements That Include Software Elements, which is included in the ASC in Topic 985 (Software). ASU 2009-14 amends previous software revenue recognition to exclude all tangible products containing both software and non-software components that function together to deliver the product’s essential functionality. ASU 2009-14 is effective for revenue arrangements entered into or materially modified in fiscal years beginning on or after June 15, 2010 and shall be applied on a prospective basis. Earlier application is permitted as of the beginning of an entity’s fiscal year. We are currently assessing the impact of ASU 2009-14 on our consolidated financial position and results of operations.
In January 2010, the FASB issued ASU 2010-06, Improving Disclosures about Fair Value Measurements, which is included in the ASC in Topic 820 (Fair Value Measurements and Disclosures). ASU 2010-06 requires new disclosures on the amount and reason for transfers in and out of Level 1 and 2 fair value measurements. ASU 2010-06 also requires disclosure of activities, including purchases, sales, issuances, and settlements within the Level 3 fair value measurements and clarifies existing disclosure requirements on levels of disaggregation and disclosures about inputs and valuation techniques. ASU 2010-06 is effective for interim and annual reporting periods beginning after December 15, 2009. We are currently assessing the potential impact of ASU 2010-06 on our consolidated financial position and results of operations.
53
Table of Contents
Contractual Obligations and Commitments
As of December 31, 2009, our contractual obligations consist of our debt, operating leases for real estate, equipment and service contracts, purchase obligations for equipment and services, finance obligations and pension plan liabilities.
| Contractual Obligations |
Total | Payments Due by Period (in thousands) | |||||||||||||
| Less Than 1 Year |
1 to 3 Years |
3 to 5 Years |
More Than 5 Years | ||||||||||||
| Long-term debt obligations including interest (1) |
$ | 615,232 | $ | 28,594 | $ | 61,149 | $ | 525,489 | $ | — | |||||
| Operating lease obligations |
47,967 | 12,391 | 14,822 | 11,857 | 8,897 | ||||||||||
| Purchase obligations (2) |
42,601 | 15,601 | 26,167 | 833 | — | ||||||||||
| Financing obligations (4) |
649 | 649 | — | — | — | ||||||||||
| Pension obligation (3) |
1,268 | 12 | 47 | 116 | 1,093 | ||||||||||
| Total (5) |
$ | 707,717 | $ | 57,247 | $ | 102,185 | $ | 538,295 | $ | 9,990 | |||||
| (1) | The interest rate on the term loans is at 2.5% plus LIBOR for the U.S. denominated portion and 2.5% plus EURIBOR for the Euro-denominated portion, with LIBOR assumed to be 0.23% and EURIBOR assumed to be 0.47%. Net interest on the interest rate swap is assumed to be 2.53%. |
| (2) | Amounts represent primarily purchase obligations for equipment and services. Certain of these obligations represent fees that we would incur if we were to cancel or terminate the underlying purchase agreement. |
| (3) | Represents estimated obligations from a noncontributory defined benefit retirement plan associated with one of our foreign subsidiaries. While the estimated total liability is actuarially determined, there are no definitive payments by period, as pension contributions. |
| (4) | Amounts represent financing agreements for certain of our network equipment |
| (5) | The timing of cash outflows related to liabilities for uncertain tax positions, and the interest thereon, as established pursuant to the accounting guidance in ASC 740, "Income Taxes", cannot be estimated and, therefore, has not been included in the table. See Note 20 of Note to Consolidated Financial Statements |
Off-Balance Sheet Arrangements
We provide financial settlement services to wireless operators to support the payment of roaming related charges to their roaming network partners. In accordance with our contract with the customer, funds are held by us as an agent on behalf of our customers to settle their roaming related charges to other operators. These funds and the corresponding liability are not reflected in our consolidated balance sheet. The off-balance sheet amounts totaled approximately $152.7 million and $101.3 million as of December 31, 2009 and 2008, respectively.
We have also used off-balance sheet financing in recent years primarily in the form of operating leases for facility space and some equipment leasing and we expect to continue these practices. We do not use any other type of joint venture or special purpose entities that would create off-balance sheet financing. We believe that our decision to lease our office space and equipment is similar to that used by many other companies of our size and does not have a material impact to our financial statements.
| ITEM 7A. | QUANTITATIVE AND QUALITATIVE DISCLOSURES ABOUT MARKET RISK |
Interest Rate Market Risk
We are exposed to changes in interest rates on our senior credit facility. Our senior credit facility is variable rate debt. Interest rate changes therefore generally do not affect the market value of such debt but do impact the amount of our interest payments and, therefore, our future earnings and cash flows, assuming other factors are held constant. As of December 31, 2009 and December 31, 2008, we had $337.5 million and $338.8 million, respectively, of variable rate debt outstanding on our senior credit facility. Holding other variables constant, including levels of indebtedness, a one percentage point increase in interest rates on our variable debt would have
54
Table of Contents
had an estimated impact on pre-tax earnings and cash flows for the next year of approximately $3.4 million. Under the terms of the senior credit facility at least 25% of our funded debt must bear interest that is effectively fixed. As a result, we may from time to time be required to enter into interest rate protection agreements establishing a fixed maximum interest rate with respect to a portion of our total indebtedness.
On October 6, 2008, we entered into an agreement to hedge $100.0 million of our U.S.-denominated term loan under our senior credit facility. The hedge effectively swaps variable rate interest expense based on 1-month LIBOR to a fixed rate interest expense thereby reducing our exposure to interest rate fluctuations. The effective date of the swap is October 31, 2008 and the maturity date is October 31, 2010. The fixed rate is 5.26% based on our 2.76% swap rate plus our 2.50% applicable margin.
Foreign Currency Market Risk
Although the majority of our operations are conducted in United States dollars, our significant foreign operations are conducted in Euros and Great Britain Pounds. On a less significant basis, we conduct operations in the various currencies of the Asia-Pacific region, Canada and Latin America, several of which are directly tied to the movement in the United States dollar. Consequently, a portion of our revenues and expenses may be affected by fluctuations in foreign currency exchange rates. We are also affected by fluctuations in exchange rates on assets and liabilities related to our foreign operations. We have not hedged our translation risk on foreign currency exposure through the use of derivative instruments.
A 10% change in average foreign currency rates against the United States dollar during the year ended December 31, 2009 compared to the average foreign currency exchange rates during the year would have increased or decreased our revenues and net income by approximately $6.6 million and $1.2 million, respectively.
| ITEM 8. | FINANCIAL STATEMENTS AND SUPPLEMENTARY DATA |
Our financial statements required by this item are set forth as a separate section of this Annual Report on Form 10-K. See page 61 for an index to our “Consolidated Financial Statements”, which are incorporated by reference here in.
| ITEM 9. | CHANGES IN AND DISAGREEMENTS WITH ACCOUNTANTS ON ACCOUNTING AND FINANCIAL DISCLOSURE |
Not applicable.
| ITEM 9A. | CONTROLS AND PROCEDURES |
Evaluation of Disclosure Controls
Our management, including our principal executive officer and principal financial officer, concluded an evaluation of the effectiveness of our disclosure controls and procedures as of December 31, 2009. Our evaluation tested controls and other procedures designed to ensure that information required to be disclosed by us in the reports that we file or submit under the Securities Exchange Act of 1934, as amended, or the Exchange Act, is recorded, processed, summarized and reported within the time periods specified in the SEC’s rules and forms. Based on our evaluation, as of December 31, 2009, our management, including our principal executive officer and principal financial officer, concluded that our disclosure controls and procedures were effective.
Changes in Internal Control Over Financial Reporting
There were no changes in our internal control over financial reporting during our most recently completed fiscal quarter that have materially affected or are reasonably likely to materially affect our internal control over financial reporting.
55
Table of Contents
Management’s Report on Internal Control Over Financial Reporting
Management is responsible for establishing and maintaining adequate internal control over financial reporting, as such term is defined in the Exchange Act Rules13a-15(f). Internal control over financial reporting is a process designed to provide reasonable assurance regarding the reliability of financial reporting and the preparation of financial statements for external purposes in accordance with generally accepted accounting principles. Internal control over financial reporting includes those policies and procedures that (1) pertain to the maintenance of records that, in reasonable detail, accurately and fairly reflect the transactions and dispositions of our assets; (2) provide reasonable assurance that transactions are recorded as necessary to permit preparation of financial statements in accordance with generally accepted accounting principles, and that receipts and expenditures are being made only with proper authorizations; and (3) provide reasonable assurance regarding prevention of timely detection of unauthorized acquisition, use, or disposition of our assets that could have a material effect on the financial statements.
Because of its inherent limitations, internal control over financial reporting may not prevent or detect misstatements. Also, projections of any evaluation of effectiveness to future periods are subject to the risk that controls may become inadequate because of changes in conditions, or that the degree of compliance with the policies or procedures may deteriorate.
Under the supervision and with the participation of management, including our principal executive officer and principal financial officer, our management has evaluated the effectiveness of our internal control over financial reporting as of December 31, 2009 based on the criteria established in a report entitled Internal Control—Integrated Framework issued by the Committee of Sponsoring Organizations of the Treadway Commission, or COSO. Based on its assessment, management concluded that we maintained effective internal control over financial reporting as of December 31, 2009.
Management’s assessment of and conclusion on the effectiveness of internal control over financial reporting does not include the internal controls of the VM3 messaging business, acquired on October 23, 2009. The VM3 messaging business, which is included in the 2009 consolidated balance sheet of Syniverse Holdings, Inc., constituted $223.5 million (17%) and $180.6 million (29%) of total and net assets, respectively and $33.2 million (7%) and $5.6 million (9%) of revenue and net income, respectively, as of and for the year ended December 31, 2009.
The effectiveness of internal control over financial reporting as of December 31, 2009 has been audited by Ernst & Young LLP, the independent registered certified public accounting firm who also audited the Company’s consolidated financial statements, as stated in their report below.
56
Table of Contents
Report of Independent Registered Certified Public Accounting Firm
The Board of Directors and Stockholders of
Syniverse Holdings, Inc.
We have audited Syniverse Holdings, Inc.’s internal control over financial reporting as of December 31, 2009, based on criteria established in Internal Control—Integrated Framework issued by the Committee of Sponsoring Organizations of the Treadway Commission (the COSO criteria). Syniverse Holdings, Inc.’s management is responsible for maintaining effective internal control over financial reporting, and for its assessment of the effectiveness of internal control over financial reporting included in the accompanying Management’s Report on Internal Control Over Financial Reporting. Our responsibility is to express an opinion on the company’s internal control over financial reporting based on our audit.
We conducted our audit in accordance with the standards of the Public Company Accounting Oversight Board (United States). Those standards require that we plan and perform the audit to obtain reasonable assurance about whether effective internal control over financial reporting was maintained in all material respects. Our audit included obtaining an understanding of internal control over financial reporting, assessing the risk that a material weakness exists, testing and evaluating the design and operating effectiveness of internal control based on the assessed risk, and performing such other procedures as we considered necessary in the circumstances. We believe that our audit provides a reasonable basis for our opinion.
A company’s internal control over financial reporting is a process designed to provide reasonable assurance regarding the reliability of financial reporting and the preparation of financial statements for external purposes in accordance with generally accepted accounting principles. A company’s internal control over financial reporting includes those policies and procedures that (1) pertain to the maintenance of records that, in reasonable detail, accurately and fairly reflect the transactions and dispositions of the assets of the company; (2) provide reasonable assurance that transactions are recorded as necessary to permit preparation of financial statements in accordance with generally accepted accounting principles, and that receipts and expenditures of the company are being made only in accordance with authorizations of management and directors of the company; and (3) provide reasonable assurance regarding prevention or timely detection of unauthorized acquisition, use, or disposition of the company’s assets that could have a material effect on the financial statements.
Because of its inherent limitations, internal control over financial reporting may not prevent or detect misstatements. Also, projections of any evaluation of effectiveness to future periods are subject to the risk that controls may become inadequate because of changes in conditions, or that the degree of compliance with the policies or procedures may deteriorate.
As indicated in the accompanying Management’s Report on Internal Control Over Financial Reporting, management’s assessment of and conclusion on the effectiveness of internal control over financial reporting did not include the internal controls of VM3, which is included in the 2009 consolidated financial statements of Syniverse Holdings, Inc. and constituted $223.5 million (17%) and $180.6 million (29%) of total and net assets respectively, as of December 31, 2009 and $33.2 million (7%) and $5.6 million (9%) of revenues and net income, respectively, for the year then ended. Our audit of internal control over financial reporting of Syniverse Holdings, Inc. also did not include an evaluation of the internal control over financial reporting of VM3.
In our opinion, Syniverse Holdings, Inc. maintained, in all material respects, effective internal control over financial reporting as of December 31, 2009, based on the COSO criteria.
We also have audited, in accordance with the standards of the Public Company Accounting Oversight Board (United States), the consolidated balance sheets of Syniverse Holdings, Inc. as of December 31, 2009 and 2008, and the related consolidated statements of income, changes in stockholders’ equity, and cash flows for each of the three years in the period ended December 31, 2009 of Syniverse Holdings, Inc. and our report dated February 26, 2010 expressed an unqualified opinion thereon.
/s/ Ernst & Young LLP
Certified Public Accountants
Tampa, Florida
February 26, 2010
57
Table of Contents
| ITEM 9B. | OTHER INFORMATION |
Not applicable.
58
Table of Contents
PART III
| ITEM 10. | DIRECTORS, EXECUTIVE OFFICERS AND CORPORATE GOVERNANCE |
We will provide information relating to our directors and executive officers under the captions “Proposal 1—Election of Directors—Nominees,” and “Executive Compensation and Other Information,” in our proxy statement for the 2010 annual meeting of stockholders to be held on May 6, 2010. We will provide information regarding compliance with Section 16(a) of the Securities Exchange Act of 1934 by our directors and executive officers and beneficial owners of more than 10% of our common stock under the caption “Section 16(a) Beneficial Ownership Reporting Compliance” in the Proxy Statement. All of the preceding information is incorporated in this Item 10 by reference.
Our Chief Executive Officer, Tony G. Holcombe, certifies that the previous year’s Annual Written Affirmation certification was submitted to the NYSE without qualifications.
Code of Ethics
We have adopted a Code of Ethics that applies to all employees. A copy of our Code of Ethics is available on our website www.syniverse.com, under the heading “Corporate Governance”, free of charge.
| ITEM 11. | EXECUTIVE COMPENSATION |
We will provide information relating to executive compensation under the captions “Proposal—Election of Directors—Director Compensation,” “Executive Compensation and Other Information” and “Compensation Committee Interlocks and Insider Participation” in the Proxy Statement. That information is incorporated in this Item 11 by reference.
| ITEM 12. | SECURITY OWNERSHIP OF CERTAIN BENEFICIAL OWNERS AND MANAGEMENT AND RELATED STOCKHOLDER MATTERS |
We will provide information regarding ownership of our common stock by specified persons under the captions “Equity Compensation Plans,” “Summary Compensation Table” and “Security Ownership of Certain Beneficial Owners and Management” in the Proxy Statement. That information is incorporated in this Item 12 by reference.
| ITEM 13. | CERTAIN RELATIONSHIPS AND RELATED TRANSACTIONS AND DIRECTOR INDEPENDENCE |
We will provide information regarding certain relationships and related transactions and director independence under the caption “Certain Transactions” and “Elections of Directors—Director Independence” in the Proxy Statement. That information is incorporated in this Item 13 by reference.
| ITEM 14. | PRINCIPAL ACCOUNTING FEES AND SERVICES |
We will provide information regarding the fees we paid to our independent auditors, Ernst & Young LLP, during the last two fiscal years and certain other related information under the caption “Independent Public Accounting Firm—Services and Fees of Ernst & Young LLP” in our Proxy Statement. That information is incorporated in this Item 14 by reference.
59
Table of Contents
PART IV
| ITEM 15. | EXHIBITS AND FINANCIAL STATEMENT SCHEDULES |
| Page | ||
| (a) 1. Index to Financial Statements |
||
| Report of Independent Registered Certified Public Accounting Firm |
62 | |
| Consolidated Balance Sheets |
63 | |
| Consolidated Statements of Income |
64 | |
| Consolidated Statements of Changes in Stockholders’ Equity |
65 | |
| Consolidated Statements of Cash Flows |
66 | |
| Notes to Consolidated Financial Statements |
67 | |
| 2. Financial Statement Schedule |
||
| Schedule II—Valuation and Qualifying Accounts |
106 | |
All other schedules have been omitted since the required information is not present in amounts sufficient to require submission of the schedule, or because the information required is included in our consolidated financial statements or note thereto.
(b) See Exhibit Index
60
Table of Contents
INDEX TO CONSOLIDATED FINANCIAL STATEMENTS
SYNIVERSE HOLDINGS, INC.
61
Table of Contents
REPORT OF INDEPENDENT REGISTERED CERTIFIED PUBLIC ACCOUNTING FIRM
The Board of Directors and Stockholders of
Syniverse Holdings, Inc.
We have audited the accompanying consolidated balance sheets of Syniverse Holdings, Inc. as of December 31, 2009 and 2008, and the related consolidated statements of income, changes in stockholders’ equity, and cash flows for each of the three years in the period ended December 31, 2009. Our audits also included the financial statement schedule listed in the Index at Item 15(a). These financial statements and schedule are the responsibility of the Company’s management. Our responsibility is to express an opinion on these financial statements and schedule based on our audits.
We conducted our audits in accordance with the standards of the Public Company Accounting Oversight Board (United States). Those standards require that we plan and perform the audit to obtain reasonable assurance about whether the financial statements are free of material misstatement. An audit includes examining, on a test basis, evidence supporting the amounts and disclosures in the financial statements. An audit also includes assessing the accounting principles used and significant estimates made by management, as well as evaluating the overall financial statement presentation. We believe that our audits provide a reasonable basis for our opinion.
In our opinion, the financial statements referred to above present fairly, in all material respects, the consolidated financial position of Syniverse Holdings, Inc. at December 31, 2009 and 2008, and the consolidated results of its operations and its cash flows for each of the three years in the period ended December 31, 2009, in conformity with U.S. generally accepted accounting principles. Also, in our opinion, the related financial statement schedule, when considered in relation to the basic financial statements taken as a whole, presents fairly in all material respects the information set forth therein.
As discussed in Note 3 to the consolidated financial statements, on January 1, 2009, the Company changed its method of accounting for business combinations.
We also have audited, in accordance with the standards of the Public Company Accounting Oversight Board (United States), Syniverse Holdings, Inc.’s internal control over financial reporting as of December 31, 2009, based on criteria established in Internal Control-Integrated Framework issued by the Committee of Sponsoring Organizations of the Treadway Commission and our report dated February 26, 2010, expressed an unqualified opinion thereon.
/s/ Ernst & Young LLP
Certified Public Accountants
Tampa, Florida
February 26, 2010
62
Table of Contents
CONSOLIDATED BALANCE SHEETS
(AMOUNTS IN THOUSANDS EXCEPT SHARE DATA)
| December 31, 2009 |
December 31, 2008 |
|||||||
| ASSETS | ||||||||
| Current assets: |
||||||||
| Cash |
$ | 91,934 | $ | 165,605 | ||||
| Accounts receivable, net of allowances of $7,290 and $2,347, respectively |
126,127 | 88,782 | ||||||
| Prepaid and other current assets |
20,813 | 20,971 | ||||||
| Total current assets |
238,874 | 275,358 | ||||||
| Property and equipment, net |
64,315 | 50,251 | ||||||
| Capitalized software, net |
75,249 | 60,184 | ||||||
| Deferred costs, net |
7,388 | 7,288 | ||||||
| Goodwill |
685,710 | 596,662 | ||||||
| Identifiable intangibles, net |
234,938 | 208,518 | ||||||
| Other assets |
3,250 | 1,573 | ||||||
| Total assets |
$ | 1,309,724 | $ | 1,199,834 | ||||
| LIABILITIES AND STOCKHOLDERS’ EQUITY | ||||||||
| Current liabilities: |
||||||||
| Accounts payable |
$ | 8,020 | $ | 7,311 | ||||
| Transition services payable |
16,609 | — | ||||||
| Accrued payroll and related benefits |
9,832 | 20,111 | ||||||
| Accrued interest |
5,150 | 5,160 | ||||||
| Accrued income taxes |
1,468 | 9,891 | ||||||
| Deferred revenues |
6,197 | 4,260 | ||||||
| Other accrued liabilities |
32,042 | 28,975 | ||||||
| Current portion of Term Note B |
3,452 | 3,431 | ||||||
| Total current liabilities |
82,770 | 79,139 | ||||||
| Long-term liabilities: |
||||||||
| Deferred tax liabilities |
87,254 | 65,546 | ||||||
| 7 3/4% senior subordinated notes due 2013 |
175,000 | 175,000 | ||||||
| Term Note B, less current maturities |
334,012 | 335,382 | ||||||
| Other long-term liabilities |
9,534 | 8,925 | ||||||
| Total liabilities |
688,570 | 663,992 | ||||||
| Stockholders’ equity: |
||||||||
| Preferred stock, $0.001 par value; 300,000 shares authorized; no shares issued |
— | — | ||||||
| Common stock, $0.001 par value; 100,300,000 shares authorized; 69,574,505 shares issued and 69,382,507 shares outstanding and 68,847,632 shares issued and 68,455,634 shares outstanding at December 31, 2009 and December 31, 2008, respectively |
69 | 68 | ||||||
| Additional paid-in capital |
483,227 | 471,524 | ||||||
| Retained earnings |
149,582 | 83,315 | ||||||
| Accumulated other comprehensive loss |
(12,205 | ) | (19,035 | ) | ||||
| Common stock held in treasury, at cost; 191,998 and 391,998 at December 31, 2009 and December 31, 2008, respectively |
(15 | ) | (30 | ) | ||||
| Total Syniverse Holdings Inc. stockholders' equity |
620,658 | 535,842 | ||||||
| Noncontrolling interest |
496 | — | ||||||
| Total equity |
621,154 | 535,842 | ||||||
| Total liabilities and stockholders’ equity |
$ | 1,309,724 | $ | 1,199,834 | ||||
See accompanying notes to consolidated financial statements
63
Table of Contents
CONSOLIDATED STATEMENTS OF INCOME
(AMOUNTS IN THOUSANDS EXCEPT PER SHARE DATA)
| Year Ended December 31, | ||||||||||||
| 2009 | 2008 | 2007 | ||||||||||
| Revenues |
$ | 482,991 | $ | 506,356 | $ | 377,524 | ||||||
| Costs and expenses: |
||||||||||||
| Cost of operations (excluding depreciation and amortization shown separately below) |
172,950 | 165,236 | 137,520 | |||||||||
| Sales and marketing |
38,789 | 45,549 | 30,637 | |||||||||
| General and administrative |
74,502 | 79,241 | 56,937 | |||||||||
| Depreciation and amortization |
60,397 | 55,344 | 42,867 | |||||||||
| Restructuring |
2,583 | (29 | ) | 2,211 | ||||||||
| 349,221 | 345,341 | 270,172 | ||||||||||
| Operating income |
133,770 | 161,015 | 107,352 | |||||||||
| Other income (expense), net: |
||||||||||||
| Interest income |
323 | 1,894 | 2,049 | |||||||||
| Interest expense |
(28,890 | ) | (37,246 | ) | (25,603 | ) | ||||||
| Other, net |
939 | (402 | ) | (69 | ) | |||||||
| (27,628 | ) | (35,754 | ) | (23,623 | ) | |||||||
| Income before provision for income taxes |
106,142 | 125,261 | 83,729 | |||||||||
| Provision for income taxes |
40,465 | 46,797 | 31,310 | |||||||||
| Net income |
65,677 | 78,464 | 52,419 | |||||||||
| Less: Net loss attributable to noncontrolling interest |
(590 | ) | — | — | ||||||||
| Net income attributable to Syniverse Holdings, Inc. |
$ | 66,267 | $ | 78,464 | $ | 52,419 | ||||||
| Net income per common share: |
||||||||||||
| Basic |
$ | 0.96 | $ | 1.15 | $ | 0.77 | ||||||
| Diluted |
$ | 0.96 | $ | 1.15 | $ | 0.77 | ||||||
| Weighted average common shares outstanding: |
||||||||||||
| Basic |
68,031 | 67,675 | 67,333 | |||||||||
| Diluted |
68,153 | 67,731 | 67,401 | |||||||||
See accompanying notes to consolidated financial statements
64
Table of Contents
CONSOLIDATED STATEMENTS OF CHANGES IN STOCKHOLDERS’ EQUITY
(AMOUNTS IN THOUSANDS)
| Stockholders of Syniverse Holdings, Inc. | Noncontrolling Interest |
Total | ||||||||||||||||||||||||||||
| Common Stock | Additional Paid-In Capital |
Retained Earnings/ (Accumulated Deficit) |
Accumulated Other Comprehensive Income (Loss) |
Treasury Stock |
||||||||||||||||||||||||||
| Shares | Amount | |||||||||||||||||||||||||||||
| Balance, December 31, 2006 |
68,039 | $ | 68 | $ | 459,125 | $ | (44,777 | ) | $ | 406 | $ | (28 | ) | $ | — | $ | 414,794 | |||||||||||||
| Net income |
— | — | 52,419 | — | — | — | 52,419 | |||||||||||||||||||||||
| Other comprehensive income— |
||||||||||||||||||||||||||||||
| Foreign currency translation adjustment |
— | — | — | 1,785 | — | — | 1,785 | |||||||||||||||||||||||
| Comprehensive income |
54,204 | |||||||||||||||||||||||||||||
| Cumulative effect of adoption of ASC 740 (formerly FIN No. 48) |
— | — | (2,791 | ) | — | — | — | (2,791 | ) | |||||||||||||||||||||
| Issuance of stock for stock options exercised |
247 | — | 670 | — | — | — | — | 670 | ||||||||||||||||||||||
| Stock-based compensation |
— | 3,564 | — | — | — | — | 3,564 | |||||||||||||||||||||||
| Issuances of stock under employee stock purchase plan |
50 | — | 730 | — | — | — | — | 730 | ||||||||||||||||||||||
| Minimum tax withholding on restricted stock awards |
(33 | ) | — | (378 | ) | — | — | — | — | (378 | ) | |||||||||||||||||||
| Purchase of treasury stock |
— | — | — | — | — | (1 | ) | — | (1 | ) | ||||||||||||||||||||
| Balance, December 31, 2007 |
68,303 | $ | 68 | $ | 463,711 | $ | 4,851 | $ | 2,191 | $ | (29 | ) | $ | — | $ | 470,792 | ||||||||||||||
| Net income |
— | — | 78,464 | — | — | — | 78,464 | |||||||||||||||||||||||
| Other comprehensive income— |
||||||||||||||||||||||||||||||
| Foreign currency translation adjustment, net of tax of $1,692 |
— | — | — | (19,641 | ) | — | — | (19,641 | ) | |||||||||||||||||||||
| Change in minimum pension liability, net of tax of $148 |
— | — | — | 247 | — | — | 247 | |||||||||||||||||||||||
| Net change in fair value of interest rate swap, net of tax benefit of $(1,092) |
— | — | — | (1,832 | ) | — | — | (1,832 | ) | |||||||||||||||||||||
| Comprehensive income |
57,238 | |||||||||||||||||||||||||||||
| Issuance of stock for stock options exercised |
127 | — | 1,987 | — | — | — | — | 1,987 | ||||||||||||||||||||||
| Stock-based compensation |
— | 5,205 | — | — | — | — | 5,205 | |||||||||||||||||||||||
| Excess tax benefit from stock options exercised |
— | 479 | — | — | — | — | 479 | |||||||||||||||||||||||
| Issuances of stock under employee stock purchase plan |
78 | — | 823 | — | — | — | — | 823 | ||||||||||||||||||||||
| Minimum tax withholding on restricted stock awards |
(40 | ) | — | (681 | ) | — | — | — | — | (681 | ) | |||||||||||||||||||
| Purchase of treasury stock |
(12 | ) | — | — | — | — | (1 | ) | — | (1 | ) | |||||||||||||||||||
| Balance, December 31, 2008 |
68,456 | $ | 68 | $ | 471,524 | $ | 83,315 | $ | (19,035 | ) | $ | (30 | ) | $ | — | $ | 535,842 | |||||||||||||
| Net income (loss) |
— | — | 66,267 | — | — | (590 | ) | 65,677 | ||||||||||||||||||||||
| Other comprehensive income— |
||||||||||||||||||||||||||||||
| Foreign currency translation adjustment, net of tax benefit of $(1,478) |
— | — | — | 5,773 | — | 105 | 5,878 | |||||||||||||||||||||||
| Change in minimum pension liability, net of tax benefit of $(7) |
— | — | — | 3 | — | — | 3 | |||||||||||||||||||||||
| Net change in fair value of interest rate swap, net of tax benefit of $(365) |
— | — | — | 1,054 | — | — | 1,054 | |||||||||||||||||||||||
| Comprehensive income |
72,612 | |||||||||||||||||||||||||||||
| Issuance of stock for stock options exercised |
664 | 1 | 2,661 | — | — | — | — | 2,662 | ||||||||||||||||||||||
| Stock-based compensation |
— | 7,939 | — | — | — | — | 7,939 | |||||||||||||||||||||||
| Excess tax benefit from stock-based compensation |
— | 684 | — | — | — | — | 684 | |||||||||||||||||||||||
| Issuances of stock under employee stock purchase plan |
97 | — | 932 | — | — | — | — | 932 | ||||||||||||||||||||||
| Minimum tax withholding on restricted stock awards |
(34 | ) | — | (498 | ) | — | — | — | — | (498 | ) | |||||||||||||||||||
| Issuance of treasury stock |
200 | — | (15 | ) | — | — | 15 | — | — | |||||||||||||||||||||
| Capital contribution from noncontrolling interest in a joint venture |
981 | 981 | ||||||||||||||||||||||||||||
| Balance, December 31, 2009 |
69,383 | $ | 69 | $ | 483,227 | $ | 149,582 | $ | (12,205 | ) | $ | (15 | ) | $ | 496 | $ | 621,154 | |||||||||||||
See accompanying notes to consolidated financial statements
65
Table of Contents
CONSOLIDATED STATEMENTS OF CASH FLOWS
(DOLLARS IN THOUSANDS)
| Year Ended December 31, | ||||||||||||
| 2009 | 2008 | 2007 | ||||||||||
| Cash flows from operating activities |
||||||||||||
| Net income |
$ | 65,677 | $ | 78,464 | $ | 52,419 | ||||||
| Adjustments to reconcile net income to net cash provided by operating activities: |
||||||||||||
| Depreciation and amortization including amortization of deferred debt issuance costs |
62,125 | 57,115 | 44,104 | |||||||||
| Provision for (recovery of) uncollectible accounts |
644 | 24 | (169 | ) | ||||||||
| Deferred income tax expense |
17,485 | 25,751 | 26,127 | |||||||||
| Stock-based compensation |
7,939 | 5,205 | 3,564 | |||||||||
| Other, net |
82 | 3,198 | 1,075 | |||||||||
| Changes in operating assets and liabilities, net of acquisitions: |
||||||||||||
| Accounts receivable |
(7,205 | ) | (10,999 | ) | 211 | |||||||
| Other current assets |
1,147 | (1,317 | ) | (733 | ) | |||||||
| Accounts payable |
(1,073 | ) | 10,499 | 2,469 | ||||||||
| Transition services payable |
6,499 | — | — | |||||||||
| Other current liabilities |
(11,316 | ) | (3,875 | ) | (9,126 | ) | ||||||
| Other assets and liabilities |
369 | (93 | ) | 1,321 | ||||||||
| Net cash provided by operating activities |
142,373 | 163,972 | 121,262 | |||||||||
| Cash flows from investing activities |
||||||||||||
| Capital expenditures |
(37,654 | ) | (40,819 | ) | (27,665 | ) | ||||||
| Acquisitions, net of acquired cash |
(177,602 | ) | (823 | ) | (274,288 | ) | ||||||
| Net cash used in investing activities |
(215,256 | ) | (41,642 | ) | (301,953 | ) | ||||||
| Cash flows from financing activities |
||||||||||||
| Debt issuance costs paid |
— | — | (7,180 | ) | ||||||||
| Borrowings under Term Note B |
— | — | 290,000 | |||||||||
| Principal payments on senior credit facility |
(3,444 | ) | (3,510 | ) | (81,566 | ) | ||||||
| Issuances of stock under employee stock purchase plan |
932 | 823 | 730 | |||||||||
| Issuances of stock for stock options exercised |
2,662 | 1,987 | 670 | |||||||||
| Minimum tax withholding on restricted stock awards |
(498 | ) | (681 | ) | (378 | ) | ||||||
| Excess tax benefit from stock-based compensation |
684 | 479 | — | |||||||||
| Purchase of treasury stock |
— | (1 | ) | (1 | ) | |||||||
| Capital contribution from noncontrolling interest in a joint venture |
981 | — | — | |||||||||
| Net cash provided by (used in) financing activities |
1,317 | (903 | ) | 202,275 | ||||||||
| Effect of exchange rate changes on cash |
(2,105 | ) | (4,908 | ) | 798 | |||||||
| Net (decrease) increase in cash |
(73,671 | ) | 116,519 | 22,382 | ||||||||
| Cash at beginning of period |
165,605 | 49,086 | 26,704 | |||||||||
| Cash at end of period |
$ | 91,934 | $ | 165,605 | $ | 49,086 | ||||||
| Supplemental cash flow information |
||||||||||||
| Interest paid |
$ | 26,790 | $ | 36,054 | $ | 24,477 | ||||||
| Income taxes paid |
29,182 | 11,110 | 6,042 | |||||||||
See accompanying notes to consolidated financial statements
66
Table of Contents
NOTES TO CONSOLIDATED FINANCIAL STATEMENTS
(AMOUNTS IN THOUSANDS EXCEPT SHARE AND PER SHARE DATA)
1. Description of Business
We are a leading enabler of wireless voice and data services for telecommunications companies worldwide. We were incorporated in Delaware on November 9, 2001 and we completed our initial public offering on February 10, 2005. For over 20 years, including our time as part of our former parent company, we have served as one of the wireless industry’s operator-neutral intermediaries, solving the challenges that arise as new technologies, standards and protocols emerge. Our data clearinghouse, network and technology services solve technical and operational challenges for the wireless industry by translating incompatible communication standards and protocols and simplifying operator interconnectivity. Our suite of transaction-based services allows operators to deliver seamless voice, data and next generation services to wireless subscribers, including wireless voice and data roaming, Short Message Service (SMS), Multimedia Messaging Services (MMS), number portability and wireless value-added services. We currently provide our services to approximately 700 telecommunications operations and to over 100 enterprise customers in approximately 160 countries.
2. Summary of Significant Accounting Policies
Basis of Presentation and Principles of Consolidation
The consolidated financial statements include the accounts of Syniverse Holdings, Inc. (Syniverse Inc.) all of its wholly owned subsidiaries and a variable interest entity (VIE) for which Syniverse Inc. is deemed to be the primary beneficiary. References to “the Company”, “us”, or “we” include all of the consolidated companies. Noncontrolling interest is recognized for the portion not owned by us of a consolidated joint venture. These consolidated financial statements have been prepared in accordance with accounting principles generally accepted in the United States and present our financial position, results of operations and cash flows. All significant intercompany balances and transactions have been eliminated. We have evaluated subsequent events for potential recognition and/or disclosure through February 26, 2010, which is the date the consolidated financial statements included in this Annual Report on Form 10-K were filed with the Securities and Exchange Commission.
Use of Estimates
We prepare our financial statements using accounting principles generally accepted in the United States, which require management to make estimates and assumptions that affect reported amounts of assets and liabilities and disclosures of contingent assets and liabilities at the date of the financial statements, as well as the reported revenues and expenses during the period. Actual results could differ from those estimates.
67
Table of Contents
Revenue Recognition
The majority of our revenues are transaction-based charges under long-term contracts, typically averaging three years in duration. From time to time, if a contract expires and we have not previously negotiated a new contract or renewal with the customer, we continue to provide services under the terms of the expired contract on a month-to-month billing schedule as we negotiate new agreements or renewals. Our revenues are primarily the result of the sale of our technology interoperability services, network services, number portability services, call processing services, enterprise solutions and off-network database queries to wireless operators throughout the world. Generally, there is a seasonal increase in wireless roaming telephone usage and corresponding revenues in the high-travel months of our second and third fiscal quarters. In addition, for our messaging services, revenues generally grow sequentially through the calendar year with volumes peaking during the fourth quarter holiday seasons.
| • | Technology Interoperability Services primarily generate revenues by charging per-transaction processing fees. For our wireless roaming clearinghouse, SMS services, MMS services, DataNet services, interstandard roaming solutions and Mobile Data Roaming (MDR) services, revenues vary based on the number or size of data/messaging records provided to us by our customers for aggregation, translation and distribution among operators. We recognize revenues at the time the transactions are processed. For our financial clearinghouse and settlement services, revenues vary based on the number of invoices or roaming agreements managed on the customer’s behalf. We recognize revenues at the time the services are performed. Additionally, we provide solutions with multiple product and service elements which may include software and hardware products, as well as installation services, post-contract customer support and training. In those cases, we recognize revenue attributable to an element in a customer arrangement when persuasive evidence of an arrangement exists, delivery has occurred, the fee is fixed or determinable and collectability is probable. |
| • | Network Services primarily generate revenues by charging per-transaction processing fees. In addition, our customers pay monthly connection fees based on the number of network connections as well as the number of switches with which a customer communicates. The per-transaction fees are based on the number of intelligent network messages and intelligent network database queries made through our network and are recognized as revenues at the time the transactions are processed. |
| • | Number Portability Services primarily generate revenues by charging per-transaction processing fees, monthly fixed fees, and fees for customer implementations. We recognize processing revenues at the time the transactions are processed. We recognize monthly fixed fees as revenues on a monthly basis as the services are performed. We defer revenues and incremental customer-specific costs related to customer implementations and recognize these fees and costs on a straight-line basis over the life of the initial customer agreements. |
| • | Call Processing Services primarily generate revenues by charging per-transaction processing fees. The per-transaction fee is based on the number of validation, authorization and other call processing messages generated by wireless subscribers. We recognize processing fee revenues at the time the transactions are processed. |
| • | Enterprise Solutions primarily generate revenues by charging per-subscriber fees. We recognize these revenues at the time the service is performed. |
| • | Off-Network Database Queries primarily generate revenues by providing access to database providers. We pass these charges onto our customers, with little or no margin, based upon the charges we receive from the third party intelligent network database providers. We recognize revenues at the time the transactions are processed. |
Research and Development
Research and development costs are charged to expense as incurred. Research and development costs which are included in general and administrative expense in the consolidated statements of income amounted to $9,863, $9,703 and $5,987 for the years ended December 31, 2009, 2008 and 2007, respectively.
68
Table of Contents
Stock-Based Compensation
We recognize stock-based payments in our consolidated statements of income based on their grant-date fair values. We recognize compensation expense, reduced for estimated forfeitures, on a straight-line basis over the requisite service period of the award, which is generally the vesting term of the outstanding stock awards. Please refer to Note 7 for further discussion regarding stock-based compensation.
Cash and Cash Equivalents
We consider all highly liquid investments of operating cash with original maturities of three months or less to be a cash or cash equivalent. Cash and cash equivalents include money market funds and various deposit accounts and are stated at cost, which approximates fair value.
Customer Accounts
We provide financial settlement services to wireless operators to support the payment of roaming related charges to their roaming network partners. In accordance with our contract with the customer, funds are held by us as an agent on behalf of our customers to settle their roaming related charges to other operators. These funds and the corresponding liability are not reflected in our consolidated balance sheet. The off-balance sheet amounts totaled approximately $152,747 and $101,311 as of December 31, 2009 and 2008, respectively.
Accounts Receivable
Accounts receivable are recorded at net realizable value which is the amount that we expect to collect on our gross customer trade receivables. We establish an allowance for estimated losses from the inability of our customers to pay as well as for specific receivables with known collection problems due to circumstances such as liquidity or bankruptcy. Collection problems are identified using an aging of receivables analysis based on invoice due dates. Items that are deemed uncollectible are written off against the allowance for collection losses. We do not require deposits or other collateral from our customers. If actual customer performance were to deteriorate to an extent not expected by us, additional allowances may be required. As of December 31, 2009 and 2008, our allowance for doubtful accounts was $1,470 and $786, respectively.
We maintain an allowance for credit memos based on our historical credit memo activity. In addition, we establish allowances for credit memos resulting from specific customer matters. This allowance is recorded as a direct reduction of accounts receivable and revenues. Since our allowances for credit memos are derived in large part from specific customer matters, our estimates have been consistent with our actual credit memo experience. If our billing errors or discrepancies are not resolved satisfactorily or our customers’ disputes over billing are not resolved satisfactorily, increases to the allowance would be required. As of December 31, 2009 and 2008, our allowance for credit memos was $5,820 and $1,561, respectively.
Property and Equipment, Net
Property and equipment consist primarily of computer hardware and network equipment, leasehold improvements and furniture, which are recorded at cost and depreciated using the straight-line method over the estimated remaining lives. Leasehold improvements are depreciated over the expected shorter of the term of the lease or life of asset.
The asset lives used are presented in the following table:
| Average Lives (In Years) | ||||
| Computers and Equipment |
5 | |||
| Furniture and fixtures |
6 | |||
| Leasehold improvements |
2 – 11 |
69
Table of Contents
When the depreciable assets are replaced, retired or otherwise disposed of, the related cost and accumulated depreciation are deducted from the respective accounts and any gains or losses on disposition are recognized in income. Repairs and maintenance costs are expensed as incurred.
Capitalized Software Costs
We capitalize the cost of internal-use software, which has a useful life in excess of one year. Subsequent additions, modifications or upgrades to internal-use software are capitalized only to the extent that they allow the software to perform a task it previously did not perform. Software maintenance and training costs are expensed in the period in which they are incurred. Capitalized computer software costs are amortized using the straight-line method over a period of 3-12 years.
Goodwill
Goodwill represents the excess of costs over fair value of assets of businesses acquired. Goodwill is not amortized, but is tested for impairment at the reporting-unit level, at least annually on October 1, or more frequently if indicators of impairment arise. A reporting unit is an operating segment or one level below an operating segment, referred to as a component. We have not identified any components within our single operating segment and, hence, have a single reporting unit for purposes of our goodwill impairment test.
Identifiable Intangible Assets
Our identifiable intangible assets represent customer-related intangible assets, such as customer contracts and customer relationships associated with our acquisitions. We amortize identifiable intangible assets over their contractual or estimated useful lives of 2 to 20 years using the straight-line method. Estimated useful lives are determined primarily based on forecasted cash flows, which includes estimates for the revenues, expenses and customer attrition associated with the assets.
Impairment of Long-Lived Assets
We evaluate for impairment our depreciable and amortizable long-lived assets including property and equipment, capitalized software and amortizable identifiable intangible assets. We utilize the three-step approach for recognizing and measuring the impairment of assets to be held and used. That is, (1) we consider whether indicators of impairment are present; (2) if indicators of impairment are present, we determine whether the sum of the estimated undiscounted future cash flows attributable to the long-lived asset in question is less than its carrying amount; and (3) if less, we recognize an impairment loss based on the excess of the carrying amount of the long-lived asset over its respective fair value. Fair value is estimated based on discounted future cash flows. Assets to be sold are stated at the lower of the assets’ carrying amount or fair value and depreciation is no longer recognized. We believe the carrying values of our long-lived assets, including property and equipment, capitalized software and identifiable intangible assets, were not impaired as of December 31, 2009 and 2008.
Income Taxes
We provide for federal, state and foreign income taxes currently payable, as well as for those deferred due to timing differences between reporting income and expenses for financial statement purposes versus tax purposes. Deferred tax assets and liabilities are recognized for the future tax consequences attributable to temporary differences between the financial statement carrying amounts of existing assets and liabilities and their respective tax bases. Deferred tax assets and liabilities are measured using enacted income tax rates expected to apply to taxable income in the years in which those temporary differences are expected to be recovered or settled. The effect of a change in income tax rates is recognized as income or expense in the period that includes the enactment date.
70
Table of Contents
We, and our eligible subsidiaries, file a consolidated U.S. federal income tax return. All subsidiaries incorporated outside of the U.S. are consolidated for financial reporting purposes, however, they are not eligible to be included in our consolidated U.S. federal income tax return. Separate provisions for income taxes have been recorded for these entities. We intend to reinvest substantially all of the unremitted earnings of our non-U.S. subsidiaries and postpone their remittance indefinitely. Accordingly, no provision for U.S. income taxes for these non-U.S. subsidiaries was recorded in the accompanying consolidated statements of income.
Interest in Joint Ventures
We hold a 5% interest in the joint venture mTLD Top Level Domain, Ltd., a joint venture formed to provide mobile data and content domain name registry services and development guidelines. We account for this investment using the cost method of accounting. As of December 31, 2009 and 2008, our investment was $888 and is included in other assets. On February 10, 2010, this entity was sold thus dissolving our interest in the joint venture and the resulting investment. The sale agreement contains certain long-term escrow requirements and as such no resulting gain or loss will be recorded until those requirements have been satisfied which we anticipate will be completed in August 2011.
In February 2009, we entered into a joint venture agreement to implement number portability services in India. Our economic interest in the joint venture is 37.5%. We expect to provide India’s telecommunications operators with number portability clearinghouse and centralized database solutions for the next 10 years. We have determined that the joint venture is a variable interest entity (VIE). The framework for identifying VIE’s and determining when a company should include the assets, liabilities, noncontrolling interests and results of operations of a VIE in its consolidated financial statements requires a VIE to be consolidated if a party with an ownership, contractual or other financial interest in the VIE (a variable interest holder) is obligated to absorb a majority of the risk of loss from the VIE’s activities, is entitled to receive a majority of the VIE’s residual returns (if no party absorbs a majority of the VIE’s losses), or both. A variable interest holder that consolidates the VIE is called the primary beneficiary. We have determined that we are the primary beneficiary of the joint venture. As a result, we have consolidated the joint venture.
Fair Value of Financial Instruments
We record our financial assets and liabilities at fair value. The accounting standard for fair value provides a framework for measuring fair value, clarifies the definition of fair value and expands disclosures regarding fair value measurements. Fair value is defined as the price that would be received to sell an asset or paid to transfer a liability in an orderly transaction between market participants at the reporting date. The accounting standard prescribes methods for measuring fair value, establishes a fair value hierarchy based on the inputs used to measure fair value and expands disclosures about fair value measurements. See Note 15 for more information, including a listing of our assets and liabilities required to be measured at fair value on a recurring basis and where they are classified within the hierarchy as of December 31, 2009.
Derivative Instruments and Hedging Activities
Derivative instruments are recorded on the consolidated balance sheets as assets or liabilities and measured at fair value. For derivatives designated as cash flow hedges, the effective portion of the changes in fair value of the derivatives are recorded in accumulated other comprehensive income (loss) and subsequently recognized in earnings when the hedged items impact income. Changes in the fair value of derivatives not designated as hedges and the ineffective portion of cash flow hedges are recorded in current earnings. We have designated our interest rate swap as a cash flow hedge that effectively swaps variable rate interest based on 1-month LIBOR to a fixed rate interest thereby reducing our exposure to interest rate fluctuations. We do not hold or enter into financial instruments for speculative trading purposes. See Note 14 for more information on our interest rate swap.
71
Table of Contents
Foreign Currencies
We have operations in subsidiaries in Europe, primarily the United Kingdom and Germany, and the Asia-Pacific region whose functional currency is their local currency. Gains and losses on transactions denominated in currencies other than the functional currencies are included in determining net income for the period and which are included in other income (expense), net in the consolidated income statements. For the three years ended December 31, 2009, 2008 and 2007, we recorded foreign currency transaction gains (losses) of $939, $(401) and $(40), respectively.
The assets and liabilities of subsidiaries whose functional currency is other than the U.S. Dollar are translated at the period-end rate of exchange. The resulting translation adjustment is recorded as a component of accumulated other comprehensive income (loss) and is included in stockholders’ equity. Translation gains and losses on intercompany balances which are deemed to be of a long-term investment nature are also recorded as a component of other comprehensive income. Income statement items are translated at the average rates prevailing during the period.
Accumulated Other Comprehensive (Loss) Income
Accumulated other comprehensive (loss) income is comprised of changes in our currency translation adjustment account, net of tax, changes in our minimum pension liability account, net of tax and changes in the fair value of our interest rate swap, net of tax. Accumulated other comprehensive (loss) income for the three years ended December 31, 2009, 2008 and 2007 is as follows:
| Foreign Currency Translation Gain (Loss) |
Change in Minimum Pension Liability |
Net Change in Fair Value of Interest Rate Swap |
Total | ||||||||||||
| Balance, December 31, 2006 |
$ | 406 | $ | — | $ | — | $ | 406 | |||||||
| Changes |
1,785 | — | — | 1,785 | |||||||||||
| Balance, December 31, 2007 |
2,191 | — | — | 2,191 | |||||||||||
| Changes |
(19,641 | ) | 247 | (1,832 | ) | (21,226 | ) | ||||||||
| Balance, December 31, 2008 |
(17,450 | ) | 247 | (1,832 | ) | (19,035 | ) | ||||||||
| Changes |
5,773 | 3 | 1,054 | 6,830 | |||||||||||
| Balance, December 31, 2009 |
$ | (11,677 | ) | $ | 250 | $ | (778 | ) | $ | (12,205 | ) | ||||
Segment Information
For all periods reported, we operated as a single segment, since our chief operating decision maker decides resource allocations on the basis of our consolidated financial results. Revenues by service offerings were as follows:
| Year Ended December 31, | |||||||||
| 2009 | 2008 | 2007 | |||||||
| Technology Interoperability Services |
$ | 293,782 | $ | 317,685 | $ | 184,471 | |||
| Network Services |
122,804 | 122,529 | 124,788 | ||||||
| Number Portability Services |
31,654 | 29,291 | 27,128 | ||||||
| Call Processing Services |
28,126 | 29,720 | 31,421 | ||||||
| Enterprise Solutions |
1,322 | 2,387 | 4,084 | ||||||
| Off-Network Database Queries |
5,303 | 4,744 | 5,632 | ||||||
| Total Revenues |
$ | 482,991 | $ | 506,356 | $ | 377,524 | |||
72
Table of Contents
Revenues by geographic region, based on the “bill to” location on the invoice, were as follows:
| Year Ended December 31, | |||||||||
| 2009 | 2008 | 2007 | |||||||
| North America (U.S. and Canada) |
$ | 351,378 | $ | 361,438 | $ | 291,186 | |||
| Asia Pacific |
39,392 | 46,445 | 41,725 | ||||||
| Caribbean and Latin America |
32,817 | 30,666 | 23,860 | ||||||
| Europe, Middle East and Africa |
54,101 | 63,063 | 15,121 | ||||||
| Off-Network Database Queries (i) |
5,303 | 4,744 | 5,632 | ||||||
| Total Revenues |
$ | 482,991 | $ | 506,356 | $ | 377,524 | |||
| (i) | Off-Network Database Queries are not allocated to geographic regions. |
For the year ended December 31, 2009, 2008 and 2007, we derived 68.7% and 67.9% and 73.3%, respectively, of our revenues from customers in the United States.
Long-lived assets by geographic location were as follows:
| Year Ended December 31, | ||||||
| 2009 | 2008 | |||||
| North America (U.S. and Canada) |
$ | 751,847 | $ | 604,508 | ||
| Asia Pacific |
41,664 | 42,870 | ||||
| Caribbean and Latin America |
46 | 32 | ||||
| Europe, Middle East and Africa |
266,655 | 268,205 | ||||
| Total |
$ | 1,060,212 | $ | 915,615 | ||
In January 2010, we began implementing changes to our internal operating structure as a result of the acquisition of the VM3 messaging business in October 2009. In line with our strategies and realignment of our services to better coordinate our operations with similar type service offerings, we are reorganizing our operations into three primary lines of business with business leaders heading each line of business with profitability responsibility for their respective business unit. This ensures that we are aligning our resources closer to where decisions are made that affect our customers. Our corporate and shared service functions are streamlining their organizations and focusing them on core activities that can more efficiently support the goals of the business units. Our new operating structure has resulted in changes to our reportable business segments beginning in the first quarter of 2010.
The three lines of business as well as the services included in each are as follows:
| • | Roaming. The Roaming line of business will include all of the services currently included in our Technology Interoperability Services, with the exception of the technology turn-key solutions and Messaging Services including the VM3 assets, which will be included in a separate line of business as described below. In addition, Roaming will include all of the services currently described in our Call Processing Services section. |
| • | Messaging. The Messaging line of business will include our existing Messaging Services and the services of the recently acquired VM3 business, as currently described in our Technology Interoperability Services section. |
| • | Network. The Network line of business will include all of the services currently included in our Network Services and Enterprise Solutions sections, as well as our Number Portability Services. |
In addition, we will also report a separate “Other” category, which will be comprised of our technology turn-key solutions, also known as our ITHL business; sales, marketing, corporate administrative and other functions. Our ITHL business provides value-added services to customers in the Asia Pacific region. The ITHL operations are different from our core transaction-based revenue generating services.
73
Table of Contents
We will begin reporting these new segments in our first interim reporting period ending March 31, 2010.
Net Income Per Common Share
Basic net income per common share includes no dilution and is computed by dividing earnings available to common shareholders by the weighted average number of common shares outstanding for the period. Diluted net income per common share includes the potential dilution from the exercise of stock options and restricted stock.
On January 1, 2009, we adopted the provisions of ASC 260, Earnings Per Share, as it relates to determining whether instruments granted in share-based payment transactions are participating securities. Under the revised provisions, unvested share-based payment awards that contain nonforfeitable rights to dividends or dividend equivalents (whether paid or unpaid) are treated as participating securities and are included in the computation of earnings per share pursuant to the two-class method in accordance with ASC 260. Certain of our unvested share-based payment awards contain nonforfeitable rights to dividends and dividend equivalents. Upon adoption of this guidance, we used the two-class method in the computation of earnings per share for the year ended December 31, 2009 and retrospectively adjusted our net income per common share data for the years ended December 31, 2008 and 2007 to conform to the provisions in the guidance.
The following table displays the computation of net income per common share using the two-class method:
| Years Ended December 31, | ||||||||||||
| 2009 | 2008 | 2007 | ||||||||||
| Basic and diluted net income per common share: |
||||||||||||
| Net income attributable to Syniverse Holdings, Inc. |
$ | 66,267 | $ | 78,464 | $ | 52,419 | ||||||
| Less: net income allocated to restricted stock |
(776 | ) | (824 | ) | (670 | ) | ||||||
| Net income available to common shareholders |
$ | 65,491 | $ | 77,640 | $ | 51,749 | ||||||
| Determination of basic and diluted shares: |
||||||||||||
| Basic weighted-average common shares outstanding |
68,031,261 | 67,674,501 | 67,333,061 | |||||||||
| Unvested common stock |
— | — | 47,515 | |||||||||
| Potentially dilutive stock options and restricted stock |
121,890 | 56,866 | 20,370 | |||||||||
| Diluted weighted-average common shares outstanding |
68,153,151 | 67,731,367 | 67,400,946 | |||||||||
| Basic net income per common share |
$ | 0.96 | $ | 1.15 | $ | 0.77 | ||||||
| Diluted net income per common share |
$ | 0.96 | $ | 1.15 | $ | 0.77 | ||||||
For the years ended December 31, 2009, 2008 and 2007 options to purchase 1,456,911, 603,076 and 534,480 shares of common stock were outstanding during the periods but were not included in the computation of diluted earnings per share because their effect would be anti-dilutive. Performance-based restricted shares and equity awards not considered to be participating securities are excluded from the diluted weighted-average common shares outstanding.
Reclassifications
Certain prior year balances have been reclassified to conform to the 2009 presentations.
3. Recent Accounting Pronouncements
Recently Adopted Accounting Pronouncements
In December 2007, the Financial Accounting Standards Board (FASB) issued new consolidations guidance specifically related to accounting for noncontrolling interests. This guidance establishes accounting and reporting standards for ownership interests in subsidiaries held by parties other than the parent, changes in a parent’s
74
Table of Contents
ownership of a noncontrolling interest, calculation and disclosure of the consolidated net income attributable to the parent and the noncontrolling interest, changes in a parent’s ownership interest while the parent retains its controlling financial interest and fair value measurement of any retained noncontrolling equity investment. This guidance is effective for financial statements issued for fiscal years beginning after December 15, 2008, and interim periods within those fiscal years. We adopted the new guidance on January 1, 2009, which did not have a material impact on our consolidated financial position and results of operations.
In December 2007, the FASB issued new guidance on business combinations. The revised guidance establishes how acquirers recognize and measure the consideration transferred, identifiable assets acquired, liabilities assumed, noncontrolling interests, and goodwill acquired in a business combination. This guidance also expands required disclosures surrounding the nature and financial effects of business combinations. The provisions of this accounting guidance are effective, on a prospective basis, for fiscal years beginning after December 15, 2008. We adopted this guidance on January 1, 2009. During the year ended December 31, 2009, we completed two acquisitions which were both accounted for under the acquisition method in accordance with this guidance. Please refer to Notes 5 and 6 to our Notes to Consolidated Financial Statements for the impact on our consolidated financial position and results of operation of adopting this guidance.
In May 2009, the FASB issued new guidance on subsequent events. This accounting guidance establishes general standards of accounting for, and disclosures of, events that occur after the balance sheet date but before financial statements are issued or are available to be issued. This guidance was effective for interim or fiscal periods ending after June 15, 2009. We adopted the provisions of this guidance on July 1, 2009. Adoption of the accounting guidance did not have a material impact on our consolidated financial position and results of operations.
Recently Issued Accounting Pronouncements
In June 2009, the FASB issued new consolidations guidance specifically related to variable interest entities. This accounting guidance eliminates exceptions to consolidating qualifying special-purpose entities, contains new criteria for determining the primary beneficiary, and increases the frequency of required reassessments to determine whether a company is the primary beneficiary of a variable interest entity. In addition, this guidance also contains a new requirement that any term, transaction, or arrangement that does not have a substantive effect on an entity’s status as a variable interest entity, a company’s power over a variable interest entity, or a company’s obligation to absorb losses or its right to receive benefits of an entity must be disregarded in applying the provisions. The elimination of the qualifying special-purpose entity concept and its consolidation exceptions means more entities will be subject to consolidation assessments and reassessments. The provisions of this guidance are effective as of the beginning of an enterprise’s first fiscal year beginning after November 15, 2009, and for interim periods within that first period, with earlier adoption prohibited. We are currently assessing the potential impacts, if any, on our consolidated financial position and results of operations.
In September 2009, the FASB issued Accounting Standards Update (ASU) 2009-13, Multiple-Deliverable Revenue Arrangements, which is included in the ASC in Topic 605 (Revenue Recognition). ASU 2009-13 amends previous revenue recognition guidance to require an entity to apply the relative selling price allocation method in order to a estimate selling price for all units of accounting, including delivered items, when vendor-specific objective evidence or acceptable third-party evidence does not exist. ASU 2009-13 is effective for revenue arrangements entered into or materially modified in fiscal years beginning on or after June 15, 2010 and shall be applied on a prospective basis. Earlier application is permitted as of the beginning of an entity’s fiscal year. We are currently assessing the potential impact of ASU 2009-13 on our consolidated financial position and results of operations.
In September 2009, the FASB issued ASU 2009-14, Certain Revenue Arrangements That Include Software Elements, which is included in the ASC in Topic 985 (Software). ASU 2009-14 amends previous software revenue recognition to exclude all tangible products containing both software and non-software components that
75
Table of Contents
function together to deliver the product’s essential functionality. ASU 2009-14 is effective for revenue arrangements entered into or materially modified in fiscal years beginning on or after June 15, 2010 and shall be applied on a prospective basis. Earlier application is permitted as of the beginning of an entity’s fiscal year. We are currently assessing the impact of ASU 2009-14 on our consolidated financial position and results of operations.
In January 2010, the FASB issued ASU 2010-06, Improving Disclosures about Fair Value Measurements, which is included in the ASC in Topic 820 (Fair Value Measurements and Disclosures). ASU 2010-06 requires new disclosures on the amount and reason for transfers in and out of Level 1 and 2 fair value measurements. ASU 2010-06 also requires disclosure of activities, including purchases, sales, issuances, and settlements within the Level 3 fair value measurements and clarifies existing disclosure requirements on levels of disaggregation and disclosures about inputs and valuation techniques. ASU 2010-06 is effective for interim and annual reporting periods beginning after December 15, 2009. We are currently assessing the potential impact of ASU 2010-06 on our consolidated financial position and results of operations.
4. Acquisition of BSG Wireless
On December 19, 2007, we acquired the wireless data clearing and financial settlement business (BSG Wireless) of Billing Services Group Limited (BSG) pursuant to a Share Purchase Agreement, dated April 1, 2007. Under the Purchase Agreement, we acquired all of the outstanding share capital of Billing Services Group Luxembourg S. à r.l. and Billing Services Group Asia Limited from BSG for an aggregate purchase price of $294,402 in cash including acquisition related costs of $7,431. The acquisition was funded through the draw down of our amended and restated credit facility, which included a delayed draw term loan of $160,000 in aggregate principal amount and a Euro-denominated delayed draw term loan facility of the equivalent of $130,000 intended to finance this acquisition.
The acquisition was accounted for using the purchase method of accounting. The total purchase price of $294,402 was allocated to the assets and liabilities based upon their fair value as of the date of the transaction. The fair value of the intangible assets (customer relationship and capitalized software) and pension liabilities was determined using an income and replacement cost approach. The following table summarizes the allocation of the purchase price based on the fair value of the net assets acquired and liabilities assumed at the acquisition date. We finalized our purchase price allocation in 2008, which resulted in a net decrease to goodwill of $3,603.
| Amount | Estimated Useful Life | ||||
| Cash |
$ | 20,025 | |||
| Accounts receivable |
9,708 | ||||
| Other current assets |
872 | ||||
| Property and equipment |
1,133 | 1 – 5 years | |||
| Capitalized software |
14,018 | 5 years | |||
| Customer relationships |
61,300 | 9 years | |||
| Goodwill |
213,857 | ||||
| Total assets |
$ | 320,913 | |||
| Accounts payable |
864 | ||||
| Other accrued liabilities |
12,129 | ||||
| Other long-term liabilities |
4,991 | ||||
| Deferred tax liabilities |
8,527 | ||||
| Total liabilities |
$ | 26,511 | |||
| Total purchase price |
$ | 294,402 | |||
The customer relationships were valued using discounted future cash flows. The valuation considered historical financial results and expected and historical trends. The future cash flows for the customer
76
Table of Contents
relationships were discounted using a weighted average cost of capital, which was based upon an analysis of the cost of capital for guideline companies within the technology industry. The capitalized software was valued using a replacement cost method based upon internally developed estimates. The useful lives of the intangible assets were based on the period over which we expect these assets to contribute directly or indirectly to the future cash flows. The estimated useful lives of the customer relationships and software intangible assets are 9 and 5 years, respectively, and are being amortized over their estimated useful lives using the straight-line method.
In connection with the BSG Wireless acquisition, we formulated a restructuring plan, which consists primarily of the elimination of redundant positions. As a result of this plan, we recorded $2,027 of employee termination benefits as liabilities in the purchase accounting . As of December 31, 2008, all of these amounts had been paid.
The fair values assigned to the remaining tangible assets and liabilities were internally developed. The purchase price over the fair values assigned to the net assets has resulted in the recognition of $213,857 in goodwill, which is subject to at least an annual impairment review. We expect that the goodwill recorded will be deductible for tax purposes.
5. Acquisition of Wireless Solutions International
On May 15, 2009, we acquired certain assets of Wireless Solutions International (WSI) pursuant to an Asset Purchase Agreement including the stock of Rapid Roaming Inc., for an aggregate purchase price of $3,488 on the date of acquisition which was funded by existing cash balances and an award of 200,000 shares of common stock to WSI and five individuals. These five individuals, along with the sole shareholder of WSI at the time of its acquisition, became employees of the Company on the closing date. Each award of shares has been placed into escrow and will be disbursed in 32 months if certain employment conditions are met.
The transaction was accounted for under the acquisition method. The total purchase price of $3,488 was allocated to the assets and liabilities based upon their fair value as of the date of the acquisition. Assets acquired primarily consisted of $389 of cash, $433 of accounts receivables, $700 of software technology, $200 of customer relationships as well as liabilities assumed of $738. Goodwill in the amount of $2,504 was recorded in relation to this acquisition. The common stock award of 200,000 shares was issued from treasury shares and is accounted for as stock-based compensation due to the employment conditions of the award.
WSI provides a GSM Association (GSMA)-certified Open Connectivity roaming hub and global managed roaming and wireless network solutions that further enhance our global roaming reach.
6. Acquisition of the Messaging Business of VeriSign, Inc.
On August 24, 2009, we entered into an acquisition agreement to acquire the messaging business of VeriSign, Inc. (VeriSign) for a purchase price of $175,000, subject to certain adjustments to reflect fluctuations in working capital. Under the acquisition agreement, we acquired the stock of VeriSign ICX Corporation and certain other assets associated with VeriSign’s Inter-Carrier Gateway, Premium Messaging Gateway, PictureMail Service and Mobile Enterprise Solutions businesses (collectively VM3 Business). On October 23, 2009, the purchase was completed for cash proceeds of $175,000 including final working capital adjustments of $497, which was paid subsequent to December 31, 2009. Through the acquisition of VM3, we believe we will expand our current messaging operations to achieve the solution’s scale, reach and capabilities needed to provide our customers with new service offerings to meet their subscribers’ growing need for messaging services as well as expand our customer base for these services to include Tier 1 customers.
77
Table of Contents
The acquisition was accounted for using the acquisition method of accounting. The total purchase price of $175,000 was allocated to the assets and liabilities based upon their estimated fair value as of the date of the transaction. The fair value of the customer relationships and capitalized software was determined using an income approach. The cost approach was used for certain acquired software licenses. The following table summarizes the preliminary allocation of the purchase price based on the estimated fair value of the net assets acquired and liabilities assumed at the acquisition date.
| Amount | Estimated Useful Life | ||||
| Accounts receivable |
$ | 29,123 | |||
| Other current assets |
1,976 | ||||
| Property and equipment |
11,427 | 1 – 5 years | |||
| Capitalized software |
18,400 | 5 –10 years | |||
| Customer relationships |
45,300 | 2 – 9 years | |||
| Goodwill |
81,305 | ||||
| Other assets |
473 | ||||
| Total assets |
$ | 188,004 | |||
| Accounts payable |
7,765 | ||||
| Other accrued liabilities |
294 | ||||
| Other liabilities |
3,250 | ||||
| Deferred revenue |
1,695 | ||||
| Total liabilities |
$ | 13,004 | |||
| Total purchase price |
$ | 175,000 | |||
The customer relationships and capitalized software were valued using discounted future cash flows. The valuation considered historical financial results and expected and historical trends. The future cash flows for the customer relationships were discounted using a weighted average cost of capital, which was based upon an analysis of the cost of capital for guideline companies within the technology industry. The useful lives of the intangible assets were based on the period over which we expect these assets to contribute directly or indirectly to the future cash flows. The estimated useful lives of the customer relationships and software intangible assets range from 2 to 10 years and are being amortized over their estimated useful lives using the straight-line method.
The fair values assigned to the remaining tangible assets and liabilities were internally developed. The purchase price over the fair values assigned to the net assets has resulted in the recognition of $81,305 in goodwill, which is subject to at least an annual impairment review. We expect that the majority of goodwill recorded will be deductible for tax purposes.
78
Table of Contents
Since the acquisition was completed on October 23, 2009, VM3’s operating results have been included in our consolidated statements of income since that date. Revenues and net income generated by VM3 since the acquisition date and included in our consolidated statements of income were $33,160 and $5,632, respectively. The unaudited pro forma results presented below include the effects of the VM3 acquisition as if it had been consummated beginning on January 1, 2008. Pro forma adjustments arise primarily due to the asset revaluations. Because the selected pro forma consolidated financial information is based upon VM3’s financial position and operating results during the period when VM3 was not under the control, influence or management of Syniverse, the selected pro forma financial information below is not necessarily indicative of either future results of operations or results that might have been achieved had the acquisition been consummated on January 1, 2008:
| Pro Forma for the Year Ended December 31, | ||||||
| 2009 | 2008 | |||||
| (unaudited) | ||||||
| Revenues |
$ | 604,405 | $ | 642,895 | ||
| Operating income |
144,617 | 174,237 | ||||
| Net income |
72,077 | 86,265 | ||||
| Net income per common share: |
||||||
| Basic |
$ | 1.05 | $ | 1.26 | ||
| Diluted |
$ | 1.05 | $ | 1.26 | ||
7. Stock-Based Compensation
Syniverse has three stock-based compensation plans, the Founders’ Stock Option Plan for non-employee directors, executives and other key employees of Syniverse, the Directors’ Stock Option Plan, which provides for grants to independent directors, and the 2006 Long-Term Equity Incentive Plan, which provides compensation to non-employee directors, executives and other key employees of Syniverse through grants of incentive or non-qualified stock options, restricted stock, restricted stock units, stock appreciation rights (“SARs”), performance awards or any combination of the foregoing.
The impact to our income from operations of recording stock-based compensation for the years ended December 31, 2009, 2008 and 2007 was as follows:
| Year Ended December 31, | |||||||||
| 2009 | 2008 | 2007 | |||||||
| Cost of operations |
$ | 319 | $ | 169 | $ | 212 | |||
| Sales and marketing |
1,882 | 1,233 | 650 | ||||||
| General and administrative |
5,738 | 3,803 | 2,702 | ||||||
| Total stock-based compensation |
$ | 7,939 | $ | 5,205 | $ | 3,564 | |||
During the year ended December 31, 2009, we issued 195,269 shares related to stock option exercises and 96,547 shares related to the employee stock purchase plan. During the year ended December 31, 2008, we issued 151,339 shares related to stock option exercises and 78,357 shares related to employee stock purchase plan issuances.
Option Plans
On May 16, 2002, our Board of Directors adopted a Founders’ Stock Option Plan for non-employee directors, executives and other key employees of Syniverse. In addition, the Board of Directors adopted a Directors’ Stock Option Plan on August 2, 2002, which provided for option grants to independent directors to purchase up to 20,000 shares upon election to the board. The plans had a term of five years and provided for the granting of options to purchase shares of Syniverse’s common stock.
79
Table of Contents
Under the plans, the options have an initial exercise price based on the fair value of each share, as determined by the Board. The per share exercise price of each stock option will not be less than the fair market value of the stock on the date of the grant or, in the case of an equity holder owning more than 10% of the outstanding stock of Syniverse, the price for incentive stock options is not less than 110% of such fair market value. The Board of Syniverse reserved 402,400 shares of common stock, par value $.001 per share for issuance under the Founders’ plan and 160,360 shares under the Directors’ plan.
Both the Founder’s Stock Option Plan and the Directors’ Stock Option Plan have expired and the Board of Syniverse no longer grants options under these plans. As of December 31, 2008, there were options to purchase 135,234 shares outstanding under the Founder’s Stock Option Plan and options to purchase 100,240 shares outstanding under the Directors’ Stock Option Plan.
All options issued under the plans are presumed to be nonqualified stock options unless otherwise indicated in the option agreement. Each option has an exercisable life of no more than 10 years from the date of grant for both nonqualified and incentive stock options in the case of grants under the Founders’ Stock Option Plan and under the Directors’ Stock Option Plan. Generally, the options under these plans vest 20% after the first year and 5% per quarter thereafter.
2006 Long-Term Equity Incentive Plan
On May 9, 2006, our Board of Directors adopted the 2006 Long-Term Equity Incentive Plan (the “Incentive Plan”). The Incentive Plan provides incentive compensation through grants of incentive or non-qualified stock options, restricted stock, restricted stock units, stock appreciation rights (“SARs”), performance awards, or any combination of the foregoing. The Incentive Plan is designed to allow for the grant of long term incentive awards that conform to the requirements for tax deductible “performance based” compensation under Section 162(m) of the Internal Revenue Code of 1986, as amended.
Under the Incentive Plan, 6,000,000 shares of common stock were authorized for issuance, of which 1,000,000 shares may be issued as restricted stock, restricted stock units, options, or performance shares. The number of shares and price per share is determined by the Compensation Committee (the “Committee”) for those awards granted. However, the exercise price of any option may not be less than 100% of the fair market value of a share of common stock on the date of grant and the exercise price of an incentive option awarded to a person who owns stock constituting more than 10% of Syniverse’s voting power may not be less than 110% of the fair market value on the date of grant. Those eligible to participate in the Incentive Plan are limited to directors (including non-employee directors), officers (including non-employee officers), employees of Syniverse and its subsidiaries selected by the Committee, including participants located outside the United States. Determinations made by the Committee under the Incentive Plan need not be uniform and may be made selectively among eligible individuals under the Incentive Plan.
At the 2009 Annual Meeting of Shareholders held on May 8, 2009, the shareholders of Syniverse, Inc. approved the Syniverse Holdings, Inc. Amended and Restated 2006 Long-Term Equity Incentive Plan (the Amended and Restated 2006 Plan). The Amended and Restated 2006 Plan includes 3,000,000 additional shares of the Company’s common stock all of which may be issued in any form allowed under the Amended and Restated 2006 Plan, resulting in a total of 9,000,000 shares reserved and available for issuance pursuant to awards granted (or to be granted) under the Amended and Restated 2006 Plan. As of December 31, 2009, there were 2,276,779 options outstanding under the Amended and Restated 2006 Plan.
As of December 31, 2009, there were 2,480,977 total options outstanding for all Plans. The options outstanding under the Founder’s Stock Option Plan and the Director’s Stock Option Plan vest 5% each quarter while all other options vest at 33 1/3% per year. As of December 31, 2009, there were 802,550 unvested restricted shares outstanding, which had been granted to certain directors, executive officers and other employees. Restricted stock awards issued prior to the Amended and Restated 2006 Plan vest 20% per year. Restricted stock awards issued subsequent to the Amended and Restated 2006 Plan vest 33 1/ 3% per year for those issued to
80
Table of Contents
directors and three-year cliff vest for all other issuances. As of December 31, 2009, there were 133,590 unvested performance-based restricted shares outstanding all of which were issue during the third quarter of 2009. The performance-based restricted shares cliff vest on December 31, 2011 and are based on the achievement of certain financial metrics.
Accounting for Stock-Based Compensation
Stock Options
The fair values of stock option grants are amortized as compensation expense on a straight-line basis over the vesting period of the grants. The fair value for these options was estimated at the date of grant using a Black-Scholes option-pricing model with the following weighted-average assumptions:
| Year Ended December 31, | |||||||||
| 2009 | 2008 | 2007 | |||||||
| Risk-free interest rate |
2.2 | % | 3.8 | % | 4.7 | % | |||
| Volatility factor |
50.0 | 34.0 | 34.0 | ||||||
| Dividend yield |
— | — | — | ||||||
| Weighted average expected life of options (in years) |
5 | 5 | 5 | ||||||
The Black-Scholes option valuation model was developed for use in estimating the fair value of traded options, which have no vesting restrictions and are fully transferable. In addition, option valuation models require the input of highly subjective assumptions including the expected stock price volatility. Prior to February 10, 2005, Syniverse’s common stock was not traded on public markets. Therefore, a volatility of 0% was used in the Black-Scholes option valuation model for options issued prior to our initial public offering. We use average historical volatility for options issued subsequent to our initial public offering.
The accounting guidance requires companies to estimate potential forfeitures of stock grants and adjust compensation cost recorded accordingly. Forfeitures are estimated based on an average of our historical experience over the preceding 7 year period excluding certain option grants from the management team in place prior to our initial public offering as these represent options issued in a period of high turnover.
The following table summarizes information about our stock-based compensation activity:
| Stock Options |
Shares | Weighted- Average Exercise Price |
Weighted- Average Remaining Contractual Term |
Aggregate Intrinsic Value (000s) | |||||||
| Outstanding at December 31, 2008 |
1,785,877 | $ | 14.84 | 8.35 | |||||||
| Granted |
1,076,520 | $ | 14.43 | ||||||||
| Exercised |
(195,269 | ) | $ | 13.73 | |||||||
| Cancelled |
(186,151 | ) | $ | 15.36 | |||||||
| Outstanding at December 31, 2009 |
2,480,977 | $ | 14.71 | 7.68 | $ | 7,263 | |||||
Options vested and exercisable, December 31,
| Shares | Weighted- Average Exercise Price |
Weighted- Average Remaining Contractual Term |
Aggregate Intrinsic Value (000s) | |||||||
| 2008 |
475,968 | $ | 13.97 | 6.70 | ||||||
| 2009 |
809,734 | $ | 14.70 | 6.79 | $ | 2,376 | ||||
81
Table of Contents
During the years ended December 31, 2009, 2008 and 2007:
| • | the weighted average fair value per share of stock options granted to employees was $6.47, $5.81 and $5.06, respectively; |
| • | the total intrinsic value of stock options exercised was $825, $964 and $130, respectively; and |
| • | the total fair value of stock options that vested during the periods was $2,963, $1,590 and $613, respectively. |
The amount of cash received from the exercise of stock options was $2,662, $1,987 and $670 for the years ended December 31, 2009, 2008 and 2007, respectively. Tax benefits of $684, $479 and $0 were realized from the exercise of those options for the years end December 31, 2009, 2008 and 2007, respectively. Cash was not used to settle any equity instruments previously granted. There was no stock-based compensation cost capitalized into assets for the years ended December 31, 2009, 2008 and 2007, respectively.
A summary of our unvested shares activity is as follows:
| Stock Options |
Shares | Weighted- Average Grant Date Fair Value | ||||
| Unvested at December 31, 2008 |
1,309,909 | $ | 5.58 | |||
| Granted |
1,076,520 | $ | 6.47 | |||
| Vested |
(534,334 | ) | $ | 5.54 | ||
| Forfeited |
(180,852 | ) | $ | 6.23 | ||
| Unvested at December 31, 2009 |
1,671,243 | $ | 6.10 | |||
Restricted Stock
Restricted stock awards are issued and measured at market value on the date of grant. Vesting of restricted stock is based solely on time vesting. Vesting of performance-based restricted stock is based on time vesting as well as the achievement of certain financial metrics.
Changes in our restricted stock were as follows:
| Restricted Stock |
Shares | Weighted- Average Grant Date Fair Value | ||||
| Unvested at December 31, 2008 |
604,800 | $ | 15.06 | |||
| Granted |
450,820 | $ | 17.15 | |||
| Vested |
(155,940 | ) | $ | 15.03 | ||
| Forfeited |
(97,130 | ) | $ | 15.04 | ||
| Unvested at December 31, 2009 |
802,550 | $ | 16.24 | |||
Activity related to our performance-based restricted stock were as follows:
| Performance-Based Restricted Stock |
Shares | Weighted- Average Grant Date Fair Value | ||||
| Unvested at December 31, 2008 |
— | $ | — | |||
| Granted |
143,970 | $ | 17.50 | |||
| Vested |
— | $ | — | |||
| Forfeited |
(10,380 | ) | $ | 17.50 | ||
| Unvested at December 31, 2009 |
133,590 | $ | 17.50 | |||
82
Table of Contents
During the years ended December 31, 2009, 2008 and 2007:
| • | the weighted average fair value per share of restricted stock granted to employees was $17.24, $17.15 and $13.15, respectively; |
| • | the total intrinsic value of restricted stock vested during the periods was $2,342, $2,933 and $1,754, respectively; and |
| • | the total fair value of restricted stock vested during the periods was $2,433, $2,409 and $1,957, respectively. |
As of December 31, 2009, there was $7,648 of total unrecognized compensation cost related to stock options and $15,284 related to restricted stock and performance share awards. The weighted average recognition period for the remaining unrecognized stock-based compensation cost is approximately two years.
Employee Stock Purchase Plan
On May 9, 2006, our Board of Directors adopted the 2006 Employee Stock Purchase Plan (the “Purchase Plan”). All employees, including Directors who are employees and all employees of any subsidiary, are eligible to participate in any one or more of the offerings to purchase common stock under the Purchase Plan. Eligible employees may purchase a limited number of shares of Syniverse’s common stock at 85% of the market value during a series of offering periods. The purchase price is set based on the price on the New York Stock Exchange at the close of either the first or the last trading day of the offering period, whichever is lower. The fair value of shares issued under the Purchase Plan is estimated on the commencement date of each offering period using the Black-Scholes option pricing model.
The following weighted-average assumptions were used in the model:
| Year Ended December 31, | |||||||||
| 2009 | 2008 | 2007 | |||||||
| Risk-free interest rate |
0.3 | % | 3.3 | % | 5.0 | % | |||
| Volatility factor |
42 | 33 | 34 | ||||||
| Dividend yield |
— | — | — | ||||||
| Expected life (in months) |
6 | 6 | 6 | ||||||
Beginning in 2007, each offering period is divided into semi-annual purchase intervals beginning June 1 and December 1 and has a maximum term of six months. The following table summarizes the Purchase Plan activity:
| Year ended December 31, | |||||||||
| 2009 | 2008 | 2007 | |||||||
| Shares Purchased |
96,547 | 78,357 | 49,776 | ||||||
| Average Price |
$ | 11.64 | $ | 10.19 | $ | 11.46 | |||
| Compensation expense |
$ | 306 | $ | 371 | $ | 159 | |||
As of December 31, 2009, approximately 260,226 shares were reserved for future issuance. As of December 31, 2009, there were 243 enrollments under the Purchase Plan.
8. Concentration of Business
Financial instruments that subject us to concentrations of credit risk are limited to our trade receivables from major customers and cash and cash equivalents. One customer represented more than 10% of accounts receivable for the year ended December 31, 2009. One customer represented more than 10% of accounts receivable for the year ended December 31, 2008. Our cash and cash equivalents are placed with high credit quality financial institutions and are invested in short-term maturity, highly-rate securities.
83
Table of Contents
Sales to one customer were 21.0%, 15.0% and 14.9% of total revenues for the years ended December 31, 2009, 2008 and 2007, respectively. The increase in 2009 from 2008 was caused by the merger of one of our customers with our significant customer. No other customer represented more than 10% of revenues for the years ended December 31, 2009, 2008 and 2007, although a significant amount of our remaining revenues were generated from services provided to a small number of other customers.
9. Property and Equipment
Property and equipment, net, consists of the following:
| December 31, 2009 |
December 31, 2008 |
|||||||
| Computers and Equipment |
$ | 137,019 | $ | 111,432 | ||||
| Furniture and fixtures |
3,397 | 3,558 | ||||||
| Leasehold improvements |
10,971 | 10,775 | ||||||
| Construction in progress |
5,813 | 1,056 | ||||||
| 157,200 | 126,821 | |||||||
| Accumulated depreciation |
(92,885 | ) | (76,570 | ) | ||||
| Total |
$ | 64,315 | $ | 50,251 | ||||
Depreciation expense related to property and equipment is included in depreciation and amortization in the accompanying consolidated statements of income and was $17,482, $15,779 and $14,023 for the years ended December 31, 2009, 2008 and 2007, respectively.
10. Capitalized Software
Capitalized software, net, consists of the following:
| December 31, 2009 |
December 31, 2008 |
|||||||
| Software |
$ | 188,195 | $ | 149,980 | ||||
| Accumulated amortization |
(112,946 | ) | (89,796 | ) | ||||
| Total |
$ | 75,249 | $ | 60,184 | ||||
Amortization expense related to capitalized software is included in depreciation and amortization in the accompanying consolidated statements of income and was $22,445, $20,032 and $16,111 for the years ended December 31, 2009, 2008 and 2007, respectively.
11. Identifiable Intangibles and Goodwill
Identifiable intangibles, net consists of the following:
| December 31, 2009 |
December 31, 2008 |
|||||||
| Customer relationships |
$ | 343,039 | $ | 293,327 | ||||
| Other intangibles |
868 | 426 | ||||||
| 343,907 | 293,753 | |||||||
| Less accumulated amortization on: |
||||||||
| Customer relationships |
(108,482 | ) | (84,809 | ) | ||||
| Other intangibles |
(487 | ) | (426 | ) | ||||
| (108,969 | ) | (85,235 | ) | |||||
| Identifiable intangibles, net |
$ | 234,938 | $ | 208,518 | ||||
84
Table of Contents
Intangible assets are amortized over their estimated useful lives. The weighted average amortization period is 16 years for customer relationships and 4 years for other intangibles. Amortization expense of intangibles was $20,470, $19,533, and $12,733 for the year ended December 31, 2009, 2008 and 2007, respectively.
The estimated amortization expense of intangibles as of December 31, 2009 for the next five fiscal years is as follows:
| Year ended December 31, 2010 |
$ | 29,349 | |
| Year ended December 31, 2011 |
28,666 | ||
| Year ended December 31, 2012 |
26,949 | ||
| Year ended December 31, 2013 |
26,375 | ||
| Year ended December 31, 2014 |
25,894 |
Estimated amortization expense for intangibles denominated in currencies other than the United States dollar is based on foreign exchange rates as of December 31, 2009.
The following table discloses the changes in the carrying amount of goodwill for the years ended December 31, 2009 and 2008:
| December 31, 2009 |
December 31, 2008 |
||||||
| Balance at beginning of year |
$ | 596,662 | $ | 616,304 | |||
| WSI acquisition |
2,504 | — | |||||
| VM3 acquisition |
81,305 | — | |||||
| Purchase price adjustments from acquisitions |
— | (3,603 | ) | ||||
| Effect of foreign currency translation |
5,239 | (16,039 | ) | ||||
| Balance at end of year |
$ | 685,710 | $ | 596,662 | |||
12. Leasing Arrangements
We lease certain facilities and equipment for use in our operations, all of which are operating leases. We record operating lease expenses on a straight-line basis over the term of the lease after taking into consideration rent holidays, rent escalations and leasehold incentives. Total rent expense under operating leases amounted to $9,363, $8,710 and $6,915 for the years ended December 31, 2009, 2008 and 2007, respectively. These leases contain various renewal options that could extend the terms of the leases beyond 2014 at our option.
As of December 31, 2009, the aggregate future minimum lease commitments under non-cancelable leases are as follows:
| Year ended December 31, 2010 |
$ | 12,391 | |
| Year ended December 31, 2011 |
8,088 | ||
| Year ended December 31, 2012 |
6,735 | ||
| Year ended December 31, 2013 |
6,385 | ||
| Year ended December 31, 2014 |
5,471 | ||
| Thereafter |
8,897 | ||
| $ | 47,967 | ||
85
Table of Contents
13. Debt and Credit Facilities
The following are the amounts outstanding at December 31, 2009 and 2008:
| December 31, 2009 |
December 31, 2008 |
|||||||
| USD denominated Term Note B due August 2014, interest payable quarterly, principal payable quarterly beginning December 2007 |
$ | 211,002 | $ | 213,162 | ||||
| EURO denominated Term Note B due August 2014, interest payable quarterly, principal payable quarterly beginning December 2007 |
126,462 | 125,651 | ||||||
| $175,000 Senior Subordinated Notes due August 15, 2013, bearing interest at 7 3/4%, interest payable semi-annually beginning February 2006, principal payable upon maturity |
175,000 | 175,000 | ||||||
| Total |
512,464 | 513,813 | ||||||
| Less current portion |
(3,452 | ) | (3,431 | ) | ||||
| Long-term debt |
$ | 509,012 | $ | 510,382 | ||||
Maturities of long-term debt for the years succeeding December 31, 2009 are as follows:
| 2010 |
$ | 3,452 | |
| 2011 |
3,452 | ||
| 2012 |
3,452 | ||
| 2013 |
178,452 | ||
| 2014 |
323,656 | ||
| Total |
$ | 512,464 | |
We incurred debt issuance costs of $7,180 associated with our senior credit facility and $4,740 associated with our 7 3/4% Senior Subordinated Notes, which are included in deferred costs on the consolidated balance sheets. We amortize these costs over the term of the debt to interest expense using the effective interest method. Amortization expense for the years ended December 31, 2009, 2008 and 2007 for debt issuance costs was $1,727, $1,742 and $1,173, respectively.
Amended and Restated Senior Credit Facility
On August 9, 2007, we entered into a $464,000 amended and restated credit agreement (the “senior credit facility”) with Lehman Brothers Inc. and Deutsche Bank Securities Inc. as joint lead arrangers and joint book-running managers, Lehman Commercial Paper Inc., as administrative agent, Deutsche Bank AG New York Branch, as syndication agent, Bear Stearns Corporate Lending Inc. and LaSalle Bank National Association, as co-documentation agents and the lenders from time to time parties thereto. The obligations under the senior credit facility are unconditionally guaranteed by Syniverse Holdings, Inc. and all material U.S. domestic subsidiaries of Syniverse Technologies, Inc. (the “Guarantors”) and are secured by a security interest in substantially all of the tangible and intangible assets of Syniverse Technologies, Inc. and the Guarantors. The obligations under the senior credit facility are also secured by a pledge of the capital stock of Syniverse Technologies, Inc. and its direct and indirect U.S. subsidiaries.
The senior credit facility originally provided for aggregate borrowings of $464,000 as follows:
| • | a term loan of $112,000 in aggregate principal amount; |
| • | a delayed draw term loan of $160,000 in aggregate principal; |
| • | a Euro-denominated delayed draw term loan facility of the equivalent of $130,000 at the draw date; |
| • | a revolving credit line of $42,000; and |
| • | a Euro-denominated revolving credit line of the equivalent of $20,000. |
86
Table of Contents
As of December 31, 2009 and 2008, we had $337,464 ($211,002 in U.S. dollar denominated term loans and $126,462 in Euro-denominated term loans) and $338,813 ($213,162 in U.S. dollar denominated term loans and $125,651 in Euro-denominated term loans), respectively, of outstanding indebtedness under the term loans. As of December 31, 2009, the applicable interest rate was 2.73% on the term loan and revolving credit line based on the LIBOR option and 2.97% on the Euro-denominated term loan and Euro-denominated credit line based on the EURIBOR option. As of December 31, 2009 and 2008, the balance of our revolving credit line and Euro-denominated credit line was $0.
The credit agreement allows us to request letters of credit up to an aggregate of $15,000. We are required to pay a fee equal to the applicable margin then in effect in respect to revolving loans and a fee to the issuing lender of 1/8 of 1% per annum in addition to normal and customary fees paid to the issuer of the letter of credit. On December 31, 2009, we had a Euro letter of credit outstanding of the equivalent of $1,857.
On December 19, 2007, the delayed draw term loans of $290,000 were used to fund the acquisition of BSG Wireless described in Note 4 above, including the repayment of existing debt of Billing Services Group and to pay related transaction fees and expenses. The delayed draw term loans were subject to a commitment fee of 1.25% per annum on undrawn amounts.
U.S. dollar denominated borrowings under the senior credit facility bear interest at variable rates, at Syniverse’s option, of either:
| • | a base rate generally defined as the sum of (i) the higher of (x) the prime rate (as quoted on Page 5 of the British Banking Association Telerate screen) and (y) the federal funds effective rate, plus one half percent (0.50%) per annum and (ii) an applicable margin or, |
| • | a LIBOR rate generally defined as the sum of (i) the rate at which Eurodollar deposits for one, two, three, six or nine months and, if available to the lenders under the applicable credit facility, twelve months (as selected by us) are offered in the interbank Eurodollar market and (ii) an applicable margin. |
Euro-denominated borrowings under the senior credit facility bear interest at variable rates, at Syniverse’s option, of either:
| • | a base rate generally defined as the sum of (i) the higher of (x) the prime rate (as quoted on Page 5 of the British Banking Association Telerate screen) and (y) the federal funds effective rate, plus one half percent (0.50%) per annum and (ii) an applicable margin or, |
| • | a EURIBOR rate generally defined as the sum of (i) the rate at which Euro deposits for one, two, three, six or nine months and, if available to the lenders under the applicable credit facility, twelve months (as selected by us) are offered in the interbank Euro market and (ii) an applicable margin. |
The applicable margin for the base rate term loan and base rate revolving loans is 1.50% and the applicable margin for the Eurodollar term loan, Euro-denominated term loan and Eurodollar revolving loans is 2.50%. The term loan facilities require regularly scheduled quarterly payments of principal and the entire amount of the term loan facilities will mature on August 9, 2014. The timing of interest payments is determined by the rate selected. The full amount borrowed under the revolving credit line will mature on August 9, 2013. In the event we fail to refinance our 7 3/4% senior subordinated notes by February 15, 2013, then the maturity date of our term loan facilities and revolving credit line will be accelerated to February 15, 2013.
On May 4, 2009, we entered into an Amendment, Waiver, Resignation and Appointment Agreement, or the amendment, with Lehman Commercial Paper Inc., Bank of America, N.A., and certain of the other parties to the senior credit facility. Pursuant to the amendment, Lehman Commercial Paper has resigned as administrative agent and Bank of America has been appointed as successor administrative agent under the senior credit facility.
87
Table of Contents
The amendment also provides for other modifications of the senior credit facility including the termination of Lehman Commercial Paper’s commitments under our undrawn revolving credit lines of $28,200 and provides for Bank of America to extend commitments under our undrawn revolving credit lines of $10,000. This modification reduces our revolving credit lines from $62,000 to $43,800.
We are required to pay a commitment fee on the difference between committed amounts and amounts actually utilized under the revolving credit facility at a rate of 0.50% per annum for any quarter where our consolidated leverage ratio is greater than 3.0 to 1, 0.375% per annum for any quarter which our consolidated leverage ratio is greater than 2.0 to 1, but less than or equal to 3.0 to 1 and 0.25% for any fiscal quarter in which our consolidated leverage ratio is equal to or less than 2.0 to 1.
Under the terms of the senior credit facility at least 25% of our funded debt must bear interest that is effectively fixed. To that extent, we may be required to enter into interest rate protection agreements establishing a fixed maximum interest rate with respect to a portion of our total indebtedness. In October 2008, we entered into an interest rate swap that effectively fixes our funded debt at 53.5%.
The senior credit facility contains covenants that will limit our ability and that of our Guarantors to, among other things, incur or guarantee additional indebtedness, create liens, pay dividends on or repurchase stock, make certain types of investments, restrict dividends or other payments from our subsidiaries, enter into transactions with affiliates and sell assets or merge with other companies. The senior credit facility also requires compliance with financial covenants, including a maximum ratio of total indebtedness to Consolidated EBITDA.
Our obligations under the senior credit facility and the guarantees are secured by:
| • | a perfected first priority security interest in all of our tangible and intangible assets and all of the tangible and intangible assets of Syniverse. and each of its direct and indirect subsidiaries, subject to certain customary exceptions, and |
| • | a pledge of (i) all of the capital stock of the direct and indirect domestic subsidiaries and (ii) two-thirds of the capital stock of certain first-tier foreign subsidiaries, if any. |
7 3/4% Senior Subordinated Notes Due 2013
On August 24, 2005, we completed a private offering of $175,000 of our 7 3/4% Senior Subordinated Notes due 2013. Interest on the notes accrue at the rate of 7 3/4% per annum and are payable semi-annually in arrears on February 15 and August 15, commencing on February 15, 2006. The net proceeds were used to tender $144,750 of our outstanding 12 3/4% senior subordinated notes due 2009. On February 1, 2006, the remaining funds were used to redeem the remaining 12 3/4% senior subordinated notes due 2009 not tendered in August 2005 of $14,500, plus payment of related premium of approximately $924. The balance of funds necessary for the redemption was paid from cash on hand.
The 7 3 /4% Senior Subordinated Notes due 2013 are general unsecured obligations of Syniverse Technologies, Inc., and are unconditionally guaranteed by Syniverse Holdings, Inc. and each of the domestic subsidiaries of Syniverse Holdings, Inc. At any time prior to August 15, 2008, we may on any one or more occasions redeem up to 35% of the aggregate principal amount of notes issued under the indenture (including additional notes, if any) at a redemption price of 107.75% of the principal amount, plus accrued and unpaid interest and liquidated damages, if any, to the redemption date, with the net cash proceeds of one or more qualifying equity offerings by us or a contribution to our common equity capital made with the net cash proceeds of a concurrent equity offering by us (but excluding any reserved contribution); provided that:
| (1) | at least 65% of the aggregate principal amount of notes issued under the indenture (including additional notes, if any) remains outstanding immediately after the occurrence of such redemption; and |
| (2) | the redemption occurs within 90 days of the date of the closing of such equity offering. |
88
Table of Contents
The notes may be redeemed, in whole or in part, at any time prior to August 15, 2009, at our option upon not less than 30 nor more than 60 days’ notice, at a redemption price equal to 100% of the principal amount of the notes redeemed plus the applicable premium as of, and accrued and unpaid interest and liquidated damages, if any, to, the applicable redemption date, subject to the rights of note holders on the relevant record date to receive interest on the relevant interest payment date.
Except pursuant to the two preceding paragraphs, the notes will not be redeemable at our option prior to August 15, 2009. We are not prohibited, however, from acquiring the notes by means other than a redemption, whether pursuant to a tender offer or otherwise, assuming such acquisition does not otherwise violate the terms of the indenture.
After August 15, 2009, we may redeem all or a part of the notes upon not less than 30 nor more than 60 days’ notice, at the redemption prices (expressed as percentages of principal amount) set forth below plus accrued and unpaid interest and liquidated damages, if any, on the notes redeemed, to the applicable redemption date, if redeemed during the twelve-month period beginning on August 15 of the years indicated below, subject to the rights of note holders on the relevant record date to receive interest on the relevant interest payment date:
| Year |
Percent | ||
| 2009 |
103.875 | % | |
| 2010 |
101.938 | % | |
| 2011 and thereafter |
100.000 | % |
Unless we default in the payment of the redemption price, interest will cease to accrue on the notes or portions thereof called for redemption on the applicable redemption date, we are not required to make mandatory redemption or sinking fund payments with respect to the notes.
The notes contain various other provisions in the event of a change in control or asset sales, and they also contain certain covenants that will, among other things, limit our ability to incur additional indebtedness and issue preferred stock, pay dividends, make other restricted payments and investments, create liens, incur restrictions on the ability of their subsidiaries to pay dividends or other payments to them, sell assets, merge or consolidate with other entities, and enter into transactions with affiliates.
14. Derivative Instruments and Hedging Activities
On October 6, 2008, we entered into an interest rate swap agreement with a notional amount of $100,000. The purpose of this transaction was to provide a hedge against the effects of changes in interest rates on our U.S.-denominated term loan under our senior credit facility which carries a variable interest rate. The hedge effectively swaps variable rate interest expense based on 1-month LIBOR to a fixed rate interest expense thereby reducing our exposure to interest rate fluctuations. Under the terms of the interest rate swap, we pay a fixed rate of 5.26% based on our 2.76% swap rate plus our 2.50% applicable margin and receive payments from our counterparty based on the 1-month LIBOR over the life of the agreement without an exchange of the underlying principal amount. Interest rate differentials paid or received under the swap agreement are recognized as adjustments to interest expense. The effective date of the swap is October 31, 2008 and the maturity date is October 31, 2010.
We have designated the interest rate swap as a cash flow hedge. The counterparty to this interest rate swap agreement is a major financial institution, and we do not anticipate nonperformance by this counterparty. As of December 31, 2009 and 2008, the fair value of our interest rate swap (based on Level 2 inputs) is $1,871 and $2,925, respectively, which is recorded in other accrued liabilities in the consolidated balance sheets and is offset by a corresponding amount in accumulated other comprehensive income (loss) within the accompanying consolidated statement of stockholders’ equity. There was no ineffective portion of the swap during the year ended December 31, 2009 and 2008. For the year ended December 31, 2009, we recognized other comprehensive gain of $1,054, net of tax.
89
Table of Contents
Net Investment Hedge of a Foreign Operation
We have designated our Euro-denominated debt described in Note 13 as a net investment hedge of certain foreign operations. For the years ended December 31, 2009, 2008 and 2007, $(2,139), $5,655 and $(2,932), respectively, related to the revaluation of the debt from Euros to US dollars was included as a component of accumulated other comprehensive (loss) income.
15. Fair Value of Financial Instruments
The accounting standards for fair value require disclosure about how fair value is determined for assets and liabilities and establishes a hierarchy for which these assets and liabilities must be grouped, based on significant levels of inputs. The three-tier fair value hierarchy, which prioritizes the inputs used in the valuation methodologies is as follows:
Level 1—Quoted prices for identical assets and liabilities in active markets.
Level 2—Observable inputs other than quoted prices included in Level 1, such as quoted prices for similar assets and liabilities in active markets, quoted prices for identical or similar assets and liabilities in markets that are not active, or other inputs that are observable or can be corroborated by observable market data.
Level 3—Unobservable inputs for the asset or liability.
As of December 31, 2009 and 2008, we held an interest rate swap that is required to be measured at fair value on a recurring basis. The following tables shows the fair value measurement on a recurring basis as of December 31, 2009 and 2008:
| Fair Value Measurements at Reporting Date Using | ||||||||||||||
| December 31, 2009 |
Quoted Prices in Active Markets for Identical Assets (Level 1) |
Significant Other Observable Inputs (Level 2) |
Significant Unobservable Inputs (Level 3) | |||||||||||
| Liabilities |
||||||||||||||
| Interest rate swap |
$ | (1,871 | ) | $ | — | $ | (1,871 | ) | $ | — | ||||
| Fair Value Measurements at Reporting Date Using | ||||||||||||||
| December 31, 2008 |
Quoted Prices in Active Markets for Identical Assets (Level 1) |
Significant Other Observable Inputs (Level 2) |
Significant Unobservable Inputs (Level 3) | |||||||||||
| Liabilities |
||||||||||||||
| Interest rate swap |
$ | (2,925 | ) | $ | — | $ | (2,925 | ) | $ | — | ||||
We have elected to use the income approach to value our interest rate swap, using observable Level 2 market expectations at measurement date and standard valuation techniques to convert future amounts to a single present value amount assuming that participants are motivated, but not compelled to transact.
Cash and cash equivalents, accounts receivable, accounts payable and accrued expenses are reflected in the financial statements at their carrying value, which approximate their fair value due to their short maturity.
The carrying amounts and fair values of our long-term debt as of December 31, 2009 and 2008 are as follows:
| 2009 | 2008 | |||||||||||
| Carrying Value |
Fair Value |
Carrying Value |
Fair Value | |||||||||
| Term Note B |
$ | 337,464 | $ | 325,653 | $ | 338,813 | $ | 304,932 | ||||
| 7 3/4% Senior Subordinated Notes, due 2013 |
175,000 | $ | 173,915 | 175,000 | $ | 89,250 | ||||||
90
Table of Contents
The fair value of the 7 3/4% Senior Subordinated Notes due 2013 is based upon quoted market prices in inactive markets for similar instruments (Level 2). The fair value of the Term Note B is based upon quoted market prices in active markets for similar instruments (Level 2).
16. Commitments and Contingencies
We are currently a party to various claims and legal actions that arise in the ordinary course of business. We believe such claims and legal actions, individually and in the aggregate, will not have a material adverse effect on our business, financial condition or results of operations. As of December 31, 2009, we have considered all of the claims and disputes of which we are aware and have provided for probable losses.
17. Restructurings
In August 2006, we completed a restructuring plan in our operations and marketing groups, resulting in the termination of 30 employees. As a result, we incurred $741 in severance related costs and made payments of $710 through the fourth quarter of 2007. The balance in this restructuring accrual was reduced to zero during the first quarter of 2008. In January 2007, we completed a restructuring plan resulting in the closure of our Oklahoma office, the elimination of certain executive positions, and the termination of 10 employees. As a result, we incurred $664 in severance related costs and $1,384 in costs associated with the lease termination of our corporate aircraft described below. In June 2007, we committed to a restructuring plan affecting our technology development and support groups. We estimated that the plan would result in the elimination of 56 employees over the remainder of the year. As a result, we accrued $572 in severance related costs. During the third and fourth quarter of 2007, we experienced a higher than expected level of attrition among the employees impacted by the offshoring plan resulting in a reduction of our severance liability of $449. The balance in this restructuring accrual was reduced to zero during the third quarter of 2008.
Effective March 1, 2002, we entered into an operating lease for the use of an executive aircraft. The lease was for seven years, ending March 1, 2009, and required monthly payments plus actual expenses for maintenance, fuel and other usage related charges. We had an option to purchase the aircraft 36 months after the commencement date of the lease at a price of $6,650 but did not exercise this option. Our former CEO and one of his affiliated entities were entitled to use the aircraft and were required to pay for the actual use of the aircraft related to the affiliated entity. In January 2007, we ceased use of our corporate aircraft and terminated the lease in June 2007. This early termination resulted in the recording of $1,384 in restructuring costs.
In connection with the BSG Wireless acquisition in December 2007, we formulated a restructuring plan, which consisted primarily of the elimination of redundant positions. As a result of this plan, we estimated $2,027 of employee termination benefits as liabilities in our purchase accounting. The balance in this restructuring accrual was reduced to zero during the fourth quarter of 2008.
91
Table of Contents
For the year ended December 31, 2007, we had the following activity in our restructuring accruals:
| December 31, 2006 Balance |
Additions | Payments | Reductions | December 31, 2007 Balance | |||||||||||||
| August 2006 Restructuring |
|||||||||||||||||
| Termination costs |
$ | 156 | $ | 73 | $ | (198 | ) | $ | (11 | ) | $ | 20 | |||||
| January 2007 Restructuring |
|||||||||||||||||
| Termination costs |
— | 664 | (457 | ) | (22 | ) | 185 | ||||||||||
| Contract termination costs |
— | 1,384 | (1,384 | ) | — | — | |||||||||||
| June 2007 Restructuring |
|||||||||||||||||
| Termination costs |
— | 572 | — | (449 | ) | 123 | |||||||||||
| December 2007 Restructuring* |
|||||||||||||||||
| Termination costs |
— | 2,027 | — | — | 2,027 | ||||||||||||
| Total |
$ | 156 | $ | 4,720 | $ | (2,039 | ) | $ | (482 | ) | $ | 2,355 | |||||
For the year ended December 31, 2008, we had the following activity in our restructuring accruals:
| December 31, 2007 Balance |
Additions | Payments | Reductions | December 31, 2008 Balance | |||||||||||||
| August 2006 Restructuring |
|||||||||||||||||
| Termination costs |
$ | 20 | $ | — | $ | — | $ | (20 | ) | $ | — | ||||||
| January 2007 Restructuring |
|||||||||||||||||
| Termination costs |
185 | — | (185 | ) | — | — | |||||||||||
| June 2007 Restructuring |
|||||||||||||||||
| Termination costs |
123 | 37 | (114 | ) | (46 | ) | — | ||||||||||
| December 2007 Restructuring* |
|||||||||||||||||
| Termination costs |
2,027 | — | (1,289 | ) | (738 | )† | — | ||||||||||
| Total |
$ | 2,355 | $ | 37 | $ | (1,588 | ) | $ | (804 | ) | $ | — | |||||
| * | These accruals were reflected in purchase accounting. |
| † | These amounts were adjustments to goodwill. |
In December 2009, we completed a restructuring plan to reduce our workforce in Asia Pacific to better align our operating costs to the economic environment and eliminated certain redundant positions in Europe and North America. As a result of this plan, we incurred severance related costs of $2,583. Through December 2009, we have paid $538 related to this plan. We expect to pay the remainder of these benefits in 2010.
For the year ended December 31, 2009, we had the following activity in our restructuring accruals:
| December 31, 2008 Balance |
Additions | Payments | Reductions | December 31, 2009 Balance | ||||||||||||
| December 2009 Restructuring |
||||||||||||||||
| Termination costs |
$ | — | $ | 2,583 | $ | (538 | ) | $ | — | $ | 2,045 | |||||
| Total |
$ | — | $ | 2,583 | $ | (538 | ) | $ | — | $ | 2,045 | |||||
18. Employee Benefits
Savings Plans of Syniverse
In 2002, we adopted a 401(k) plan covering all employees subject to certain eligibility requirements. Under this plan, a certain percentage of eligible employee contributions are matched. Contributions made to the 401(k) plan were $2,804, $2,558 and $2,263 for the years ended December 31, 2009, 2008 and 2007, respectively.
92
Table of Contents
Pension Plan
As part of the BSG Wireless acquisition described in Note 4, we assumed a noncontributory, unfunded defined benefit retirement plan for employees located in Germany. The benefits are based on employees’ annual compensation. The plan benefits are paid to employees at least 65 years of age that have been employed a minimum of ten years. We recorded pension liabilities of $4,872 and $4,335 as of December 31, 2009 and 2008, respectively, which are included in other long-term liabilities on the consolidated balance sheet.
Assumptions used in determining the benefit obligations for pension and other postretirement plans as of December 31, 2009 and 2008, were as follows:
| Discount rate |
6.0 | % | |
| Average compensation increase (salaried employees only) |
3.0 | % |
The following table provides a reconciliation of benefit obligation, plan assets, and funded status of the plan as of December 31, 2009 and 2008:
| December 31, | ||||||
| 2009 | 2008 | |||||
| Projected benefit obligation |
$ | 4,872 | $ | 4,335 | ||
| Plan assets at fair value |
— | — | ||||
| Net liability in other long-term liabilities |
$ | 4,872 | $ | 4,335 | ||
The following table provides a reconciliation of the change in the benefit obligation for year ended December 31, 2009 and 2008:
| December 31, | ||||||||
| 2009 | 2008 | |||||||
| Benefit obligation at beginning of year |
$ | 4,335 | $ | 4,466 | ||||
| Service cost |
206 | 222 | ||||||
| Interest cost |
256 | 235 | ||||||
| Actuarial (gain) or loss |
(3 | ) | (392 | ) | ||||
| Benefits paid |
(7 | ) | (4 | ) | ||||
| Effect of currency translation |
85 | (192 | ) | |||||
| Balance at end of year |
$ | 4,872 | $ | 4,335 | ||||
Net benefit cost for the year ended December 31, 2009 and 2008, included the following components:
| December 31, | ||||||
| 2009 | 2008 | |||||
| Service cost on benefits earned during the year |
$ | 206 | $ | 222 | ||
| Interest cost on projected benefit obligation |
256 | 235 | ||||
| Net benefit expense |
$ | 462 | $ | 457 | ||
93
Table of Contents
We estimate benefit payments for each of the next five years and in aggregate for the five years thereafter as follows:
| Fiscal year: |
|||
| 2010 |
$ | 12 | |
| 2011 |
18 | ||
| 2012 |
29 | ||
| 2013 |
51 | ||
| 2014 |
65 | ||
| 2015 – 2019 |
$ | 1,093 |
19. Stockholder Rights Plan
On November 16, 2008, our Board of Directors adopted a stockholder rights plan which declared a dividend of one preferred share purchase right (the “Right”) for each outstanding share of Common Stock, par value $0.001 per share (the “Common Shares”), of the Company. The dividend was payable on November 28, 2008 to the stockholders of record on that date. Each Right entitles the registered holder to purchase from the Company one one-thousandth of a share (a “Unit”) of Series A Junior Participating Preferred Stock, par value $0.01 per share (the “Preferred Shares”), at a price of $33 per one one-thousandth of a Preferred Share (the “Purchase Price”), subject to adjustment. Each Unit has designations and powers, preferences and rights, and the qualifications, limitations and restrictions designed to make it the economic equivalent of a Common Share. The description and terms of the Rights are set forth in the Rights Agreement dated November 16, 2008. As of December 31, 2009, there were 69,383 Preferred Shares issuable under the plan.
The Rights will separate from the common stock and will become exercisable only when a public announcement or notice to the company has been made that a person or group has acquired, or obtained the right to acquire beneficial ownership of 15% or more of the outstanding shares of the Company’s common stock (an “Acquiring Person”), other than as a result of an offer approved by the Board of Directors of the Company and (ii) 10 business days (or, if determined by the Board of Directors, a specified or unspecified later date) following the commencement or announcement of an intention to make a tender offer or exchange offer which, if successful, would cause the bidder to own 15% of more of the outstanding Common Shares (the earlier of such dates being called the “Distribution Date”). Until a Right is exercised, the holder thereof, as such, will have no rights as a stockholder of the Company, other than rights resulting from such holder’s ownership of Common Shares, including, without limitation, the right to vote or to receive dividends.
20. Income Taxes
The components of income tax expense are as follows:
| Year Ended December 31, | ||||||||||
| 2009 | 2008 | 2007 | ||||||||
| Current: |
||||||||||
| Federal |
$ | 17,867 | $ | 18,152 | $ | 3,734 | ||||
| Foreign |
5,477 | 2,072 | 920 | |||||||
| State and local |
1,771 | 822 | 529 | |||||||
| 25,115 | 21,046 | 5,183 | ||||||||
| Deferred |
||||||||||
| Federal |
14,380 | 19,993 | 23,317 | |||||||
| Foreign |
(1,221 | ) | 3,140 | 132 | ||||||
| State and local |
2,191 | 2,618 | 2,678 | |||||||
| 15,350 | 25,751 | 26,127 | ||||||||
| Provision for income taxes |
$ | 40,465 | $ | 46,797 | $ | 31,310 | ||||
94
Table of Contents
The income tax expense differs from amounts computed by applying the U.S. statutory rate of 35% to pre-tax income from operations as follows:
| Year Ended December 31, | |||||||||
| 2009 | 2008 | 2007 | |||||||
| Statutory federal income tax rate |
35.0 | % | 35.0 | % | 35.0 | % | |||
| State and local income tax, net of federal tax benefit |
3.7 | 3.4 | 3.8 | ||||||
| Impact of foreign tax rates |
1.0 | (0.9 | ) | (0.6 | ) | ||||
| Tax credits |
(0.9 | ) | 0.0 | 0.0 | |||||
| Interest expense |
(1.9 | ) | 0.0 | 0.0 | |||||
| Other, net |
(1.7 | ) | (0.4 | ) | 0.8 | ||||
| Change in valuation allowance |
2.9 | 0.3 | (1.6 | ) | |||||
| 38.1 | % | 37.4 | % | 37.4 | % | ||||
On January 1, 2007 we adopted FASB Interpretation No. 48, Accounting for Uncertainty in Income Taxes, which is now codified in ASC 740, Income Taxes, resulting in a change to our reserve for uncertain tax positions which was accounted for as a $2,791 cumulative effect adjustment to decrease the beginning balance of retained earnings on our balance sheet. No further activity occurred in this account during the remainder of 2007. As of December 31, 2009, we had $10,615 of total gross unrecognized tax benefits.
We are currently under examination for German corporate income and trade tax for our German subsidiary for tax years 2005 through 2007. This subsidiary was acquired with the BSG Wireless transaction in December 2007. In periods prior to and including December 31, 2007 our tax provision included a position that the German tax authority has questioned as a result of tax law changes in 2008, and the authority’s interpretation of the same. Subsequent to December 31, 2009, through this examination, we became aware of an uncertain tax position. While we intend to vigorously defend our tax position, the outcome of our position may not be supportable due to the German tax authority’s current guidance and related examination. Based on the position of the taxing authority and in accordance with the guidance for accounting for uncertainty in income taxes, we have recorded an additional $2,653 million of tax expense for the year ended December 31, 2009.
The total amount of unrecognized tax benefits that, if recognized, would affect the effective tax rate, was $8,768 at December 31, 2009. A reconciliation of the beginning and ending amount of unrecognized tax benefits is as follows:
| Year Ended December 31, | |||||||
| 2009 | 2008 | ||||||
| Balance at January 1 |
$ | 9,079 | $ | 9,016 | |||
| Additions based on tax positions related to the current year |
111 | 2 | |||||
| Additions for tax positions of prior years |
2,812 | 61 | |||||
| Reductions for lapse of statute of limitations |
(1,387 | ) | — | ||||
| Balance at December 31 |
$ | 10,615 | $ | 9,079 | |||
We recognize accrued interest and penalties related to uncertain tax positions as a component of income tax expense. Accrued interest and penalties were $248, $14 and $0 in the years ended December 31, 2009, 2008 and 2007, respectively.
Tax years 2006 through 2009 and 2005 through 2009 are subject to examination by the federal and state taxing authorities, respectively. There are no federal and state income tax examinations currently in process. In our international tax jurisdictions, numerous tax years remain subject to examination by tax authorities, including tax returns for at least 2004 and subsequent years in all of our major international tax jurisdictions.
95
Table of Contents
In the next twelve months, it is reasonably possible that our unrecognized tax benefits could change due to payments for our resolution of tax matters for open years. These payments and resolutions would reduce our unrecognized tax benefits by $40.
We intend to directly re-invest income from all of our foreign subsidiaries. The aggregate undistributed earnings of our foreign subsidiaries for which no U.S. deferred tax liability has been recorded is approximately $24,278 at December 31, 2009. Determination of the amount of unrecognized deferred tax liability on these undistributed earnings is not practicable.
The components of pretax income from operations are as follows:
| Year Ended December 31, | |||||||||
| 2009 | 2008 | 2007 | |||||||
| United States |
$ | 94,807 | $ | 108,259 | $ | 81,052 | |||
| Foreign |
11,335 | 17,002 | 2,677 | ||||||
| $ | 106,142 | $ | 125,261 | $ | 83,729 | ||||
Deferred income tax assets and liabilities are recorded due primarily to different carrying amounts for financial and income tax reporting purposes arising from cumulative temporary differences. Significant components of deferred tax assets (liabilities) are shown in the following table:
| December 31, 2009 | December 31, 2008 | |||||||||||||||
| Current | Non-Current | Current | Non-Current | |||||||||||||
| Deferred Tax Liabilities: |
||||||||||||||||
| Intangibles |
$ | — | $ | (83,673 | ) | $ | (1,613 | ) | $ | (72,581 | ) | |||||
| Deferrals |
(674 | ) | — | — | (168 | ) | ||||||||||
| Accrued expenses |
(269 | ) | — | (7 | ) | — | ||||||||||
| Property & equipment |
— | (2,910 | ) | — | — | |||||||||||
| Foreign currency translation |
— | (2,646 | ) | — | (148 | ) | ||||||||||
| Total Deferred Tax Liabilities |
(943 | ) | (89,229 | ) | (1,620 | ) | (72,897 | ) | ||||||||
| Deferred Tax Assets: |
||||||||||||||||
| Property & equipment |
— | — | — | 4,661 | ||||||||||||
| Employee benefit accruals |
777 | 3,993 | 1,283 | 1,757 | ||||||||||||
| Accounts receivable |
329 | — | 202 | — | ||||||||||||
| Deferrals |
— | 1,024 | — | — | ||||||||||||
| Interest |
— | 1,666 | — | — | ||||||||||||
| Capital loss carryforward |
— | 901 | — | 906 | ||||||||||||
| Net operating loss carryforwards |
2,137 | 13,866 | 958 | 12,703 | ||||||||||||
| Interest rate swap |
— | 728 | — | 1,093 | ||||||||||||
| Other, net |
181 | — | (25 | ) | 167 | |||||||||||
| 3,424 | 22,178 | 2,418 | 21,287 | |||||||||||||
| Less: Valuation allowance |
(579 | ) | (14,064 | ) | (319 | ) | (9,541 | ) | ||||||||
| Total Deferred Tax Assets |
2,845 | 8,114 | 2,099 | 11,746 | ||||||||||||
| Net Deferred Tax Asset (Liability) |
$ | 1,902 | $ | (81,115 | ) | $ | 479 | $ | (61,151 | ) | ||||||
The activity in deferred tax assets during 2009 includes the deferred tax impact of the loss on the interest rate swap and a foreign currency translation adjustment totaling $2,863 to increase the deferred tax liability on accumulated other comprehensive income (loss). These items did not impact deferred income tax expense for the year ended December 31, 2009.
96
Table of Contents
Our deferred tax assets arise primarily from accumulated foreign net operating losses (NOL’s) of $49,870 and accumulated state NOL’s of $89,725. The foreign NOL’s remain available indefinitely to offset future taxable income in specific jurisdictions subject to applicable tax laws and regulations while state NOL’s in specific jurisdictions will expire if not utilized between tax years 2009 and 2025. We continue to maintain a valuation allowance for deferred tax assets primarily associated with certain foreign and state NOL’s and capital loss carryforwards. The net change in the deferred income tax valuation allowance was an increase of $4,783 for the year ended December 31, 2009 and a decrease of $1,993 for the year ended December 31, 2008.
We have determined that it is more likely than not that we will realize the benefit of our net deferred tax assets for which we have not established a valuation allowance.
21. Quarterly Financial Information (Unaudited)
The following presents quarterly financial results for the year ended December 31, 2009.
| First Quarter 2009 |
Second Quarter 2009 |
Third Quarter 2009 |
Fourth Quarter 2009 | |||||||||
| Revenues |
$ | 108,924 | $ | 113,478 | $ | 116,662 | $ | 143,927 | ||||
| Operating income |
29,696 | 32,697 | 35,976 | 35,401 | ||||||||
| Net income |
16,032 | 16,478 | 17,572 | 15,595 | ||||||||
| Net income attributable to Syniverse Holdings, Inc. |
16,032 | 16,531 | 17,744 | 15,960 | ||||||||
| Basic net income per common share |
$ | 0.23 | $ | 0.24 | $ | 0.26 | $ | 0.23 | ||||
| Diluted net income per common share |
$ | 0.23 | $ | 0.24 | $ | 0.26 | $ | 0.23 | ||||
The following presents quarterly financial results for the year ended December 31, 2008.
| First Quarter 2008 |
Second Quarter 2008 |
Third Quarter 2008 |
Fourth Quarter 2008 | |||||||||
| Revenues |
$ | 115,645 | $ | 127,619 | $ | 137,169 | $ | 125,923 | ||||
| Operating income |
35,121 | 40,171 | 49,418 | 36,305 | ||||||||
| Net income |
15,393 | 20,352 | 25,467 | 17,252 | ||||||||
| Basic net income per common share |
$ | 0.23 | $ | 0.30 | $ | 0.38 | $ | 0.25 | ||||
| Diluted net income per common share |
$ | 0.23 | $ | 0.30 | $ | 0.37 | $ | 0.25 | ||||
22. Supplemental Consolidating Financial Information
Syniverse Technologies, Inc.’s (Syniverse) payment obligations under the senior subordinated notes are guaranteed by Syniverse Holdings, Inc. (Syniverse Inc.) and all domestic subsidiaries of Syniverse Holdings, Inc. including Highwoods Corporation, Syniverse ICX and Syniverse Brience (collectively, the “Guarantors”). The results of Syniverse Technologies BV, Syniverse Holdings Limited and Perfect Profits International Limited are included as non-guarantors. Such guarantees are full, unconditional and joint and several. The following supplemental financial information sets forth, on an unconsolidated basis, balance sheets, statements of income, and statements of cash flows information for Syniverse Holdings, Inc., the Guarantors and the non-guarantor subsidiaries. The supplemental financial information reflects the investment of Syniverse Holdings, Inc. and Syniverse Technologies, Inc. using the equity method of accounting.
In 2009, we have revised the presentation of the previously reported supplemental consolidating guarantor and non-guarantor subsidiaries’ balance sheets, statements of income and statements of cash flows for all prior periods. We identified certain domestic guarantors that were not previously reported as subsidiary guarantors. This change in classification had no effect on the audited consolidated balance sheets, statements of income or statements of cash flows. All prior periods have been corrected for comparative presentation.
97
Table of Contents
CONSOLIDATING BALANCE SHEET
AS OF DECEMBER 31, 2009
| Syniverse Inc. |
Syniverse | Subsidiary Guarantors |
Subsidiary Non-Guarantors |
Eliminations | Consolidated | ||||||||||||||||||
| ASSETS | |||||||||||||||||||||||
| Current assets: |
|||||||||||||||||||||||
| Cash |
$ | 44 | $ | 59,630 | $ | 13,568 | $ | 18,692 | $ | — | $ | 91,934 | |||||||||||
| Accounts receivable, net of allowances |
— | 60,902 | 52,568 | 12,657 | — | 126,127 | |||||||||||||||||
| Accounts receivable—affiliates |
7,626 | (25,547 | ) | 60,649 | 3,846 | (46,574 | ) | — | |||||||||||||||
| Prepaid and other current assets |
— | 11,503 | 6,202 | 3,108 | — | 20,813 | |||||||||||||||||
| Total current assets |
7,670 | 106,488 | 132,987 | 38,303 | (46,574 | ) | 238,874 | ||||||||||||||||
| Property and equipment, net |
— | 48,022 | 13,745 | 2,548 | — | 64,315 | |||||||||||||||||
| Capitalized software, net |
— | 38,977 | 32,171 | 4,101 | — | 75,249 | |||||||||||||||||
| Deferred costs, net |
— | 7,388 | — | — | — | 7,388 | |||||||||||||||||
| Goodwill |
— | 363,822 | 288,110 | 33,778 | — | 685,710 | |||||||||||||||||
| Identifiable intangibles, net |
— | 142,051 | 90,762 | 2,125 | — | 234,938 | |||||||||||||||||
| Other assets |
— | 2,984 | (2,670 | ) | 2,936 | — | 3,250 | ||||||||||||||||
| Investment in subsidiaries |
613,727 | 554,725 | — | — | (1,168,452 | ) | — | ||||||||||||||||
| Total assets |
$ | 621,397 | $ | 1,264,457 | $ | 555,105 | $ | 83,791 | $ | (1,215,026 | ) | $ | 1,309,724 | ||||||||||
| LIABILITIES AND STOCKHOLDERS’ EQUITY |
|||||||||||||||||||||||
| Current liabilities: |
|||||||||||||||||||||||
| Accounts payable |
$ | — | $ | 5,445 | $ | 703 | $ | 1,872 | $ | — | $ | 8,020 | |||||||||||
| Accounts payable—affiliates |
301 | 36,941 | (1,514 | ) | 11,342 | (47,070 | ) | — | |||||||||||||||
| Transition services payable |
— | — | 16,609 | — | — | 16,609 | |||||||||||||||||
| Accrued payroll and related benefits |
469 | 3,056 | 3,270 | 3,037 | — | 9,832 | |||||||||||||||||
| Accrued interest |
— | 5,150 | — | — | — | 5,150 | |||||||||||||||||
| Accrued income taxes |
(31 | ) | (1,171 | ) | 2,473 | 197 | — | 1,468 | |||||||||||||||
| Deferred revenues |
— | 1,196 | 2,423 | 2,578 | — | 6,197 | |||||||||||||||||
| Other accrued liabilities |
— | 15,143 | 13,021 | 3,878 | — | 32,042 | |||||||||||||||||
| Current portion of Term Note B |
— | 3,452 | — | — | — | 3,452 | |||||||||||||||||
| Total current liabilities |
739 | 69,212 | 36,985 | 22,904 | (47,070 | ) | 82,770 | ||||||||||||||||
| Long-term liabilities: |
|||||||||||||||||||||||
| Deferred tax liabilities |
— | 70,338 | 13,017 | 3,899 | — | 87,254 | |||||||||||||||||
| 7 3/4% senior subordinated notes due 2013 |
— | 175,000 | — | — | — | 175,000 | |||||||||||||||||
| Term Note B, less current maturities |
— | 334,012 | — | — | — | 334,012 | |||||||||||||||||
| Other long-term liabilities |
— | 2,168 | 5,319 | 2,047 | — | 9,534 | |||||||||||||||||
| Total liabilities |
739 | 650,730 | 55,321 | 28,850 | (47,070 | ) | 688,570 | ||||||||||||||||
| Stockholders’ equity: |
|||||||||||||||||||||||
| Common stock |
69 | — | 116,630 | 165 | (116,795 | ) | 69 | ||||||||||||||||
| Additional paid-in capital |
483,227 | 476,850 | 469,402 | 48,920 | (995,172 | ) | 483,227 | ||||||||||||||||
| Retained earnings |
149,582 | 149,582 | (72,575 | ) | 3,132 | (80,139 | ) | 149,582 | |||||||||||||||
| Accumulated other comprehensive (loss) income |
(12,205 | ) | (12,205 | ) | (13,673 | ) | 758 | 25,120 | (12,205 | ) | |||||||||||||
| Common stock held in treasury, at cost |
(15 | ) | (15 | ) | — | — | 15 | (15 | ) | ||||||||||||||
| Total Syniverse Holdings Inc. stockholders’ equity |
620,658 | 614,212 | 499,784 | 52,975 | (1,166,971 | ) | 620,658 | ||||||||||||||||
| Noncontrolling interest |
— | (485 | ) | — | 1,966 | (985 | ) | 496 | |||||||||||||||
| Total equity |
620,658 | 613,727 | 499,784 | 54,941 | (1,167,956 | ) | 621,154 | ||||||||||||||||
| Total liabilities and stockholders’ equity |
$ | 621,397 | $ | 1,264,457 | $ | 555,105 | $ | 83,791 | $ | (1,215,026 | ) | $ | 1,309,724 | ||||||||||
98
Table of Contents
CONSOLIDATING STATEMENT OF INCOME
FOR THE YEAR ENDED DECEMBER 31, 2009
| Syniverse Inc. |
Syniverse | Subsidiary Guarantors |
Subsidiary Non-Guarantors |
Eliminations | Consolidated | |||||||||||||||||||
| Revenues |
$ | — | $ | 369,371 | $ | 75,821 | $ | 37,799 | $ | — | $ | 482,991 | ||||||||||||
| Costs and expenses: |
||||||||||||||||||||||||
| Cost of operations (excluding depreciation and amortization shown separately below) |
319 | 131,702 | 24,649 | 16,280 | — | 172,950 | ||||||||||||||||||
| Sales and marketing |
1,882 | 20,878 | 4,618 | 11,411 | — | 38,789 | ||||||||||||||||||
| General and administrative |
5,738 | 57,520 | 292 | 10,952 | — | 74,502 | ||||||||||||||||||
| Depreciation and amortization |
— | 43,486 | 14,089 | 2,822 | — | 60,397 | ||||||||||||||||||
| Restructuring |
— | 1,008 | 709 | 866 | — | 2,583 | ||||||||||||||||||
| 7,939 | 254,594 | 44,357 | 42,331 | — | 349,221 | |||||||||||||||||||
| Operating income (loss) |
(7,939 | ) | 114,777 | 31,464 | (4,532 | ) | — | 133,770 | ||||||||||||||||
| Other income (expense), net: |
||||||||||||||||||||||||
| Income from equity investment |
70,790 | 17,830 | — | — | (88,620 | ) | — | |||||||||||||||||
| Interest income |
— | 125 | 110 | 88 | — | 323 | ||||||||||||||||||
| Interest expense |
— | (28,890 | ) | — | — | — | (28,890 | ) | ||||||||||||||||
| Other, net |
— | 172 | (1 | ) | 768 | — | 939 | |||||||||||||||||
| 70,790 | (10,763 | ) | 109 | 856 | (88,620 | ) | (27,628 | ) | ||||||||||||||||
| Income (loss) before provision for income taxes |
62,851 | 104,014 | 31,573 | (3,676 | ) | (88,620 | ) | 106,142 | ||||||||||||||||
| Provision (benefit) for income taxes |
(2,826 | ) | 33,224 | 10,829 | (762 | ) | — | 40,465 | ||||||||||||||||
| Net income |
65,677 | 70,790 | 20,744 | (2,914 | ) | (88,620 | ) | 65,677 | ||||||||||||||||
| Less: Net loss attributable to noncontrolling interest |
— | (590 | ) | — | — | — | (590 | ) | ||||||||||||||||
| Net income attributable to Syniverse Holdings, Inc. |
$ | 65,677 | $ | 71,380 | $ | 20,744 | $ | (2,914 | ) | $ | (88,620 | ) | $ | 66,267 | ||||||||||
99
Table of Contents
CONSOLIDATING STATEMENT OF CASH FLOWS
FOR THE YEAR ENDED DECEMBER 31, 2009
| Syniverse Inc. |
Syniverse | Subsidiary Guarantors |
Subsidiary Non- Guarantors |
Eliminations | Consolidated | |||||||||||||||||||
| Cash flows from operating activities |
||||||||||||||||||||||||
| Net income |
$ | 65,677 | $ | 70,790 | $ | 20,744 | $ | (2,914 | ) | $ | (88,620 | ) | $ | 65,677 | ||||||||||
| Adjustments to reconcile net income to net cash provided by operating activities: |
||||||||||||||||||||||||
| Depreciation and amortization including amortization of deferred debt issuance costs |
— | 45,214 | 14,089 | 2,822 | — | 62,125 | ||||||||||||||||||
| Provision for (recovery of) uncollectible accounts |
— | 368 | 293 | (17 | ) | — | 644 | |||||||||||||||||
| Deferred income tax benefit (expense) |
— | 15,311 | 2,702 | (528 | ) | — | 17,485 | |||||||||||||||||
| Income from equity investment |
(70,790 | ) | (17,830 | ) | — | — | 88,620 | — | ||||||||||||||||
| Stock-based compensation |
7,939 | — | — | — | — | 7,939 | ||||||||||||||||||
| Other, net |
— | 43 | 25 | 14 | — | 82 | ||||||||||||||||||
| Changes in operating assets and liabilities, net of acquisition: |
||||||||||||||||||||||||
| Accounts receivable |
— | 5,371 | (12,203 | ) | (373 | ) | — | (7,205 | ) | |||||||||||||||
| Other current assets |
— | 58,919 | (53,877 | ) | (3,895 | ) | — | 1,147 | ||||||||||||||||
| Accounts payable |
— | (10,663 | ) | 10,088 | (498 | ) | — | (1,073 | ) | |||||||||||||||
| Transition services payable |
— | — | 6,499 | — | — | 6,499 | ||||||||||||||||||
| Other current liabilities |
(3,894 | ) | (14,451 | ) | 5,870 | 1,159 | — | (11,316 | ) | |||||||||||||||
| Other assets and liabilities |
(2,712 | ) | (2,408 | ) | 4,279 | 1,210 | — | 369 | ||||||||||||||||
| Net cash (used in) provided by operating activities |
(3,780 | ) | 150,664 | (1,491 | ) | (3,020 | ) | — | 142,373 | |||||||||||||||
| Cash flows from investing activities |
||||||||||||||||||||||||
| Capital expenditures |
— | (28,524 | ) | (7,927 | ) | (1,203 | ) | — | (37,654 | ) | ||||||||||||||
| Acquisitions, net of acquired cash |
— | (177,602 | ) | — | — | — | (177,602 | ) | ||||||||||||||||
| Net cash used in investing activities |
— | (206,126 | ) | (7,927 | ) | (1,203 | ) | — | (215,256 | ) | ||||||||||||||
| Cash flows from financing activities |
||||||||||||||||||||||||
| Principal payments on senior credit facility |
— | (3,444 | ) | — | — | (3,444 | ) | |||||||||||||||||
| Issuances of stock under employee stock purchase plan |
932 | — | — | — | — | 932 | ||||||||||||||||||
| Issuance of stock for stock options exercised |
2,662 | — | — | — | — | 2,662 | ||||||||||||||||||
| Minimum tax withholding on restricted stock awards |
(498 | ) | — | — | — | — | (498 | ) | ||||||||||||||||
| Excess tax benefit from stock based compensation |
684 | — | — | — | 684 | |||||||||||||||||||
| Capital contribution from noncontrolling interest in a joint venture |
— | (985 | ) | — | 1,966 | — | 981 | |||||||||||||||||
| Net cash provided by (used in) financing activities |
3,780 | (4,429 | ) | — | 1,966 | — | 1,317 | |||||||||||||||||
| Effect of exchange rate changes on cash |
— | 607 | (5,117 | ) | 2,405 | — | (2,105 | ) | ||||||||||||||||
| Net (decrease) increase in cash |
— | (59,284 | ) | (14,535 | ) | 148 | — | (73,671 | ) | |||||||||||||||
| Cash at beginning of period |
44 | 118,914 | 28,103 | 18,544 | — | 165,605 | ||||||||||||||||||
| Cash at end of period |
$ | 44 | $ | 59,630 | $ | 13,568 | $ | 18,692 | $ | — | $ | 91,934 | ||||||||||||
100
Table of Contents
CONSOLIDATING BALANCE SHEET
AS OF DECEMBER 31, 2008
| Syniverse Inc. |
Syniverse | Subsidiary Guarantors |
Subsidiary Non-Guarantors |
Eliminations | Consolidated | |||||||||||||||||||
| ASSETS | ||||||||||||||||||||||||
| Current assets: |
||||||||||||||||||||||||
| Cash |
$ | 44 | $ | 118,914 | $ | 28,103 | $ | 18,544 | $ | — | $ | 165,605 | ||||||||||||
| Accounts receivable, net of allowances |
— | 66,207 | 10,333 | 12,242 | — | 88,782 | ||||||||||||||||||
| Accounts receivable—affiliates |
5,122 | (55 | ) | 2,587 | 1,861 | (9,515 | ) | — | ||||||||||||||||
| Prepaid and other current assets |
— | 10,146 | 7,737 | 3,088 | — | 20,971 | ||||||||||||||||||
| Total current assets |
5,166 | 195,212 | 48,760 | 35,735 | (9,515 | ) | 275,358 | |||||||||||||||||
| Property and equipment, net |
— | 47,277 | 1,015 | 1,959 | — | 50,251 | ||||||||||||||||||
| Capitalized software, net |
— | 42,178 | 12,871 | 5,135 | — | 60,184 | ||||||||||||||||||
| Deferred costs, net |
— | 7,288 | — | — | — | 7,288 | ||||||||||||||||||
| Goodwill |
— | 361,319 | 201,629 | 33,714 | — | 596,662 | ||||||||||||||||||
| Identifiable intangibles, net |
— | 153,833 | 51,939 | 2,746 | — | 208,518 | ||||||||||||||||||
| Other assets |
— | 249 | (680 | ) | 2,004 | — | 1,573 | |||||||||||||||||
| Investment in subsidiaries |
531,184 | 351,248 | — | — | (882,432 | ) | — | |||||||||||||||||
| Total assets |
$ | 536,350 | $ | 1,158,604 | $ | 315,534 | $ | 81,293 | $ | (891,947 | ) | $ | 1,199,834 | |||||||||||
| LIABILITIES AND STOCKHOLDERS’ EQUITY | ||||||||||||||||||||||||
| Current liabilities: |
||||||||||||||||||||||||
| Accounts payable |
$ | — | $ | 3,271 | $ | 1,146 | $ | 2,894 | $ | — | $ | 7,311 | ||||||||||||
| Accounts payable—affiliates |
298 | 3,480 | (6,318 | ) | 12,055 | (9,515 | ) | — | ||||||||||||||||
| Accrued payroll and related benefits |
241 | 16,694 | 1,027 | 2,149 | — | 20,111 | ||||||||||||||||||
| Accrued interest |
— | 5,160 | — | — | — | 5,160 | ||||||||||||||||||
| Accrued taxes |
(31 | ) | 9,834 | 774 | (686 | ) | — | 9,891 | ||||||||||||||||
| Deferred revenues |
— | 802 | 709 | 2,749 | — | 4,260 | ||||||||||||||||||
| Other accrued liabilities |
— | 19,127 | 6,805 | 3,043 | — | 28,975 | ||||||||||||||||||
| Current portion of Term Note B |
— | 3,431 | — | — | — | 3,431 | ||||||||||||||||||
| Total current liabilities |
508 | 61,799 | 4,143 | 22,204 | (9,515 | ) | 79,139 | |||||||||||||||||
| Long-term liabilities: |
||||||||||||||||||||||||
| Deferred tax liabilities |
— | 51,136 | 9,972 | 4,438 | — | 65,546 | ||||||||||||||||||
| 7 3/4% Senior Subordinated Notes due 2013 |
— | 175,000 | — | — | — | 175,000 | ||||||||||||||||||
| Term Note B, less current maturities |
— | 335,382 | — | — | — | 335,382 | ||||||||||||||||||
| Other long-term liabilities |
— | 4,103 | 4,822 | — | — | 8,925 | ||||||||||||||||||
| Total long-term liabilities |
508 | 627,420 | 18,937 | 26,642 | (9,515 | ) | 663,992 | |||||||||||||||||
| Stockholders' equity: |
||||||||||||||||||||||||
| Common stock |
68 | — | 116,630 | 115 | (116,745 | ) | 68 | |||||||||||||||||
| Additional paid-in capital |
471,524 | 466,934 | 294,401 | 47,929 | (809,264 | ) | 471,524 | |||||||||||||||||
| Retained earnings |
83,315 | 83,315 | (95,134 | ) | 6,775 | 5,044 | 83,315 | |||||||||||||||||
| Accumulated other comprehensive income (loss) |
(19,035 | ) | (19,035 | ) | (19,300 | ) | (168 | ) | 38,503 | (19,035 | ) | |||||||||||||
| Common stock held in treasury, at cost |
(30 | ) | (30 | ) | — | — | 30 | (30 | ) | |||||||||||||||
| Total stockholders’ equity |
535,842 | 531,184 | 296,597 | 54,651 | (882,432 | ) | 535,842 | |||||||||||||||||
| Total liabilities and stockholders’ equity |
$ | 536,350 | $ | 1,158,604 | $ | 315,534 | $ | 81,293 | $ | (891,947 | ) | $ | 1,199,834 | |||||||||||
101
Table of Contents
CONSOLIDATING STATEMENT OF INCOME
FOR THE YEAR ENDED DECEMBER 31, 2008
| Syniverse Inc. |
Syniverse | Subsidiary Guarantors |
Subsidiary Non-Guarantors |
Eliminations | Consolidated | ||||||||||||||||||
| Revenues |
$ | — | $ | 406,152 | $ | 55,079 | $ | 45,125 | $ | — | $ | 506,356 | |||||||||||
| Costs and expenses: |
|||||||||||||||||||||||
| Cost of operations (excluding depreciation and amortization shown separately below) |
170 | 133,518 | 10,369 | 21,179 | — | 165,236 | |||||||||||||||||
| Sales and marketing |
1,232 | 29,482 | 4,251 | 10,584 | — | 45,549 | |||||||||||||||||
| General and administrative |
3,065 | 61,756 | 9,534 | 4,886 | — | 79,241 | |||||||||||||||||
| Depreciation and amortization |
— | 41,716 | 10,687 | 2,941 | — | 55,344 | |||||||||||||||||
| Restructuring |
— | (29 | ) | — | — | (29 | ) | ||||||||||||||||
| 4,467 | 266,443 | 34,841 | 39,590 | — | 345,341 | ||||||||||||||||||
| Operating income (loss) |
(4,467 | ) | 139,709 | 20,238 | 5,535 | — | 161,015 | ||||||||||||||||
| Other income (expense), net: |
|||||||||||||||||||||||
| Income from equity investment |
81,261 | 21,783 | — | — | (103,044 | ) | — | ||||||||||||||||
| Interest income |
1 | 592 | 973 | 328 | — | 1,894 | |||||||||||||||||
| Interest expense |
— | (37,246 | ) | — | — | — | (37,246 | ) | |||||||||||||||
| Other, net |
— | (281 | ) | (127 | ) | 6 | — | (402 | ) | ||||||||||||||
| 81,262 | (15,152 | ) | 846 | 334 | (103,044 | ) | (35,754 | ) | |||||||||||||||
| Income before provision for income taxes |
76,795 | 124,557 | 21,084 | 5,869 | (103,044 | ) | 125,261 | ||||||||||||||||
| Provision for (benefit from) income taxes |
(1,669 | ) | 43,296 | 711 | 4,459 | — | 46,797 | ||||||||||||||||
| Net income |
$ | 78,464 | $ | 81,261 | $ | 20,373 | $ | 1,410 | $ | (103,044 | ) | $ | 78,464 | ||||||||||
102
Table of Contents
CONSOLIDATING STATEMENT OF CASH FLOWS
FOR THE YEAR ENDED DECEMBER 31, 2008
| Syniverse Inc. |
Syniverse | Subsidiary Guarantors |
Subsidiary Non-Guarantors |
Eliminations | Consolidated | |||||||||||||||||||
| Cash flows from operating activities |
||||||||||||||||||||||||
| Net income |
$ | 78,464 | $ | 81,261 | $ | 20,373 | $ | 1,410 | $ | (103,044 | ) | $ | 78,464 | |||||||||||
| Adjustments to reconcile net income to net cash provided by operating activities: |
||||||||||||||||||||||||
| Depreciation and amortization including amortization of deferred debt issuance costs |
— | 43,760 | 10,688 | 2,667 | — | 57,115 | ||||||||||||||||||
| Provision for (recovery of) uncollectible accounts |
— | 397 | 16 | (389 | ) | — | 24 | |||||||||||||||||
| Deferred income tax expense |
— | 23,299 | 2,062 | 390 | — | 25,751 | ||||||||||||||||||
| Income from equity investment |
(81,261 | ) | (21,783 | ) | — | — | 103,044 | — | ||||||||||||||||
| Stock-based compensation |
5,205 | — | — | — | — | 5,205 | ||||||||||||||||||
| Other, net |
(479 | ) | 3,677 | — | — | — | 3,198 | |||||||||||||||||
| Changes in operating assets and liabilities: |
||||||||||||||||||||||||
| Accounts receivable |
— | (4,164 | ) | (3,288 | ) | (3,547 | ) | — | (10,999 | ) | ||||||||||||||
| Other current assets |
— | (2,166 | ) | (356 | ) | 1,205 | — | (1,317 | ) | |||||||||||||||
| Accounts payable |
— | 3,632 | 466 | 6,401 | — | 10,499 | ||||||||||||||||||
| Other current liabilities |
(1,718 | ) | 12,275 | (13,697 | ) | (735 | ) | — | (3,875 | ) | ||||||||||||||
| Other assets and liabilities |
(2,817 | ) | 2,538 | (97 | ) | 283 | — | (93 | ) | |||||||||||||||
| Net cash provided by (used in) operating activities |
(2,606 | ) | 142,726 | 16,167 | 7,685 | — | 163,972 | |||||||||||||||||
| Cash flows from investing activities |
||||||||||||||||||||||||
| Capital expenditures |
— | (34,599 | ) | (3,727 | ) | (2,493 | ) | — | (40,819 | ) | ||||||||||||||
| Acquisition of BSG Wireless, net of acquired cash |
— | (823 | ) | — | — | — | (823 | ) | ||||||||||||||||
| Net cash used in investing activities |
— | (35,422 | ) | (3,727 | ) | (2,493 | ) | — | (41,642 | ) | ||||||||||||||
| Cash flows from financing activities |
||||||||||||||||||||||||
| Principal Payments on senior credit facility |
— | (3,510 | ) | — | — | — | (3,510 | ) | ||||||||||||||||
| Issuances of stock under employee stock purchase plan |
823 | — | — | — | — | 823 | ||||||||||||||||||
| Issuance of stock for stock options exercised |
1,987 | — | — | — | — | 1,987 | ||||||||||||||||||
| Minimum tax withholding on restricted stock awards |
(681 | ) | — | — | — | — | (681 | ) | ||||||||||||||||
| Excess tax benefit from stock-based compensation |
479 | — | — | — | — | 479 | ||||||||||||||||||
| Purchase of treasury stock |
(1 | ) | — | — | — | — | (1 | ) | ||||||||||||||||
| Net cash provided by financing activities |
2,607 | (3,510 | ) | — | — | — | (903 | ) | ||||||||||||||||
| Effect of exchange rate changes on cash |
— | (1 | ) | (4,439 | ) | (468 | ) | — | (4,908 | ) | ||||||||||||||
| Net increase in cash |
1 | 103,793 | 8,001 | 4,724 | — | 116,519 | ||||||||||||||||||
| Cash at beginning of period |
43 | 15,121 | 20,102 | 13,820 | — | 49,086 | ||||||||||||||||||
| Cash at end of period |
$ | 44 | $ | 118,914 | $ | 28,103 | $ | 18,544 | $ | — | $ | 165,605 | ||||||||||||
103
Table of Contents
CONSOLIDATING STATEMENT OF INCOME
FOR THE YEAR ENDED DECEMBER 31, 2007
| Syniverse Inc. |
Syniverse | Subsidiary Guarantors |
Subsidiary Non-Guarantors |
Eliminations | Consolidated | |||||||||||||||||||
| Revenues |
$ | — | $ | 337,722 | $ | — | $ | 39,802 | $ | — | $ | 377,524 | ||||||||||||
| Costs and expenses: |
||||||||||||||||||||||||
| Cost of operations (excluding depreciation and amortization shown separately below) |
212 | 120,413 | — | 16,895 | — | 137,520 | ||||||||||||||||||
| Sales and marketing |
650 | 21,344 | — | 8,643 | — | 30,637 | ||||||||||||||||||
| General and administrative |
2,057 | 45,939 | 7 | 8,934 | — | 56,937 | ||||||||||||||||||
| Depreciation and amortization |
— | 40,045 | — | 2,822 | — | 42,867 | ||||||||||||||||||
| Restructuring |
— | 2,211 | — | — | 2,211 | |||||||||||||||||||
| 2,919 | 229,952 | 7 | 37,294 | — | 270,172 | |||||||||||||||||||
| Operating income (loss) |
(2,919 | ) | 107,770 | (7 | ) | 2,508 | — | 107,352 | ||||||||||||||||
| Other income (expense), net: |
||||||||||||||||||||||||
| Income from equity investment |
54,230 | 1,630 | — | — | (55,860 | ) | — | |||||||||||||||||
| Interest income |
2 | 1,700 | — | 347 | — | 2,049 | ||||||||||||||||||
| Interest expense |
— | (25,602 | ) | — | (1 | ) | — | (25,603 | ) | |||||||||||||||
| Other, net |
— | 108 | — | (177 | ) | — | (69 | ) | ||||||||||||||||
| 54,232 | (22,164 | ) | — | 169 | (55,860 | ) | (23,623 | ) | ||||||||||||||||
| Income before provision for (benefit from) income taxes |
51,313 | 85,606 | (7 | ) | 2,677 | (55,860 | ) | 83,729 | ||||||||||||||||
| Provision for (benefit from) income taxes |
(1,106 | ) | 31,376 | — | 1,040 | — | 31,310 | |||||||||||||||||
| Net income |
$ | 52,419 | $ | 54,230 | $ | (7 | ) | $ | 1,637 | $ | (55,860 | ) | $ | 52,419 | ||||||||||
104
Table of Contents
CONSOLIDATING STATEMENT OF CASH FLOWS
FOR THE YEAR ENDED DECEMBER 31, 2007
| Syniverse Inc. |
Syniverse | Subsidiary Guarantors |
Subsidiary Non-Guarantors |
Eliminations | Consolidated | |||||||||||||||||||
| Cash flows from operating activities |
||||||||||||||||||||||||
| Net income (loss) |
$ | 52,419 | $ | 54,230 | $ | (7 | ) | $ | 1,637 | $ | (55,860 | ) | $ | 52,419 | ||||||||||
| Adjustments to reconcile net income to net cash provided by operating activities: |
||||||||||||||||||||||||
| Depreciation and amortization including amortization of deferred debt issuance costs |
— | 41,481 | — | 2,623 | — | 44,104 | ||||||||||||||||||
| Recovery of uncollectible accounts |
— | (169 | ) | — | — | — | (169 | ) | ||||||||||||||||
| Deferred income tax expense |
— | 24,099 | — | 2,028 | — | 26,127 | ||||||||||||||||||
| Income from equity investment |
(54,230 | ) | (1,630 | ) | — | — | 55,860 | — | ||||||||||||||||
| Stock-based compensation |
3,564 | — | — | — | — | 3,564 | ||||||||||||||||||
| Other, net |
— | 1,075 | — | — | — | 1,075 | ||||||||||||||||||
| Changes in operating assets and liabilities, net of acquisitions: |
||||||||||||||||||||||||
| Accounts receivable |
— | (612 | ) | 7 | 816 | — | 211 | |||||||||||||||||
| Other current assets |
— | (1,435 | ) | — | 702 | — | (733 | ) | ||||||||||||||||
| Accounts payable |
— | 1,427 | — | 1,042 | — | 2,469 | ||||||||||||||||||
| Other current liabilities |
(1,106 | ) | (5,773 | ) | — | (2,247 | ) | — | (9,126 | ) | ||||||||||||||
| Other assets and liabilities |
(1,611 | ) | 2,688 | — | 244 | — | 1,321 | |||||||||||||||||
| Net cash (used in) provided by operating activities |
(964 | ) | 115,381 | — | 6,845 | — | 121,262 | |||||||||||||||||
| Cash flows from investing activities |
||||||||||||||||||||||||
| Capital expenditures |
— | (26,792 | ) | — | (873 | ) | — | (27,665 | ) | |||||||||||||||
| Acquisitions, net of acquired cash |
— | (293,641 | ) | 20,102 | (749 | ) | — | (274,288 | ) | |||||||||||||||
| Net cash (used in) provided by investing activities |
— | (320,433 | ) | 20,102 | (1,622 | ) | — | (301,953 | ) | |||||||||||||||
| Cash flows from financing activities |
||||||||||||||||||||||||
| Debt issuance costs paid |
— | (7,180 | ) | — | — | — | (7,180 | ) | ||||||||||||||||
| Borrowings under Term Note B |
— | 290,000 | — | — | — | 290,000 | ||||||||||||||||||
| Principal payments on senior credit facility |
— | (81,566 | ) | — | — | — | (81,566 | ) | ||||||||||||||||
| Issuances of stock under employee stock purchase plan |
730 | — | — | — | — | 730 | ||||||||||||||||||
| Issuances of stock for stock options exercised |
670 | — | — | — | — | 670 | ||||||||||||||||||
| Minimum tax withholding on restricted stock awards |
(433 | ) | — | — | 55 | — | (378 | ) | ||||||||||||||||
| Purchase of treasury stock |
(1 | ) | — | — | — | — | (1 | ) | ||||||||||||||||
| Net cash provided by financing activities |
966 | 201,254 | — | 55 | — | 202,275 | ||||||||||||||||||
| Effect of exchange rate changes on cash |
— | (1 | ) | — | 799 | — | 798 | |||||||||||||||||
| Net increase (decrease) in cash |
2 | (3,799 | ) | 20,102 | 6,077 | — | 22,382 | |||||||||||||||||
| Cash at beginning of period |
41 | 18,920 | — | 7,743 | — | 26,704 | ||||||||||||||||||
| Cash at end of period |
$ | 43 | $ | 15,121 | $ | 20,102 | $ | 13,820 | $ | — | $ | 49,086 | ||||||||||||
105
Table of Contents
Schedule II—Valuation and Qualifying Accounts
Syniverse Holdings, Inc.
(Amounts in Thousand)
| Column A |
Column B | Column C | Column D | Column E | ||||||||||
| Description |
Balance at Beginning of Period |
Charged to Costs and Expenses |
Write-offs of Uncollectible Accounts |
Balance at end of Period | ||||||||||
| Allowance for doubtful accounts: |
||||||||||||||
| Year ended December 31, 2007 |
$ | 1,117 | $ | (169 | )(2) | $ | (186 | )(1) | $ | 762 | ||||
| Year ended December 31, 2008 |
$ | 762 | $ | 190 | $ | (166 | ) | $ | 786 | |||||
| Year ended December 31, 2009 |
$ | 786 | $ | 898 | (3) | $ | (214 | ) | $ | 1,470 | ||||
| (1) | Includes a $236 addition recorded for ITHL at time of acquisition. |
| (2) | Includes recovery of amounts previously provided for. |
| (3) | Includes $161 acquired allowance from VM3 messaging business. |
| Column A |
Column B | Column C | Column D | Column E | ||||||||||
| Description |
Balance at Beginning of Period |
Charged to Costs and Expenses |
Deductions | Balance at end of Period | ||||||||||
| Allowance for credit memos: |
||||||||||||||
| Year ended December 31, 2007 |
$ | 3,248 | $ | 1,651 | $ | (2,342 | ) | $ | 2,557 | |||||
| Year ended December 31, 2008 |
$ | 2,557 | $ | 2,430 | $ | (3,426 | ) | $ | 1,561 | |||||
| Year ended December 31, 2009 |
$ | 1,561 | $ | 8,753 | (1) | $ | (4,494 | ) | $ | 5,820 | ||||
| (1) | Includes $568 acquired allowance from VM3 messaging business. |
| Column A |
Column B | Column C | Column D | Column E | ||||||||||
| Description |
Balance at Beginning of Period |
Charged to Costs and Expenses |
Deductions | Balance at end of Period | ||||||||||
| Valuation allowance for deferred income taxes: |
||||||||||||||
| Year ended December 31, 2007 |
$ | 10,472 | $ | 5,673 | (3) | $ | (4,292 | )(4) | $ | 11,853 | ||||
| Year ended December 31, 2008 |
$ | 11,853 | $ | 709 | (1) | $ | (2,702 | )(5) | $ | 9,860 | ||||
| Year ended December 31, 2009 |
$ | 9,860 | $ | 5,220 | (1) | $ | (437 | )(2) | $ | 14,643 | ||||
| (1) | Recognition of current period NOL. |
| (2) | Reduction related to partial reversal of valuation allowance. |
| (3) | Addition recorded for BSG Wireless at time of acquisition. |
| (4) | Reduction related to partial reversal of valuation allowance and cumulative effect of adoption of the new provisions of ASC 740 (formerly FIN No. 48). |
| (5) | Reduction related to goodwill adjustment. |
106
Table of Contents
Pursuant to the requirements of Section 13 or 15(d) of the Securities Act of 1934, the registrant has duly caused this report to be signed on its behalf by the undersigned, thereunto duly authorized, on the 26th day of February, 2010.
| SYNIVERSE HOLDINGS, INC. | ||
| SYNIVERSE TECHNOLOGIES, INC. | ||
| By: | /s/ DAVID W. HITCHCOCK | |
| David W. Hitchcock Chief Financial Officer (Principal Financial Officer) | ||
| /s/ MARTIN A. PICCIANO | ||
| Martin A. Picciano Senior Vice President and Chief Accounting Officer (Principal Accounting Officer) | ||
Pursuant to the requirements of the Securities Exchange Act of 1934, this report has been signed by the following persons in the capacities and on the dates indicated:
| Signatures |
Capacity |
Dates | ||
| /s/ ROBERT J. MARINO Robert J. Marino |
Chairman |
February 26, 2010 | ||
| /s/ TONY G. HOLCOMBE Tony G. Holcombe |
Chief Executive Officer, President and Director (Principal Executive Officer) |
February 26, 2010 | ||
| /s/ JASON FEW Jason Few |
Director |
February 26, 2010 | ||
| /s/ ROBERT J. GERRARD, JR. Robert J. Gerrard, Jr. |
Director |
February 26, 2010 | ||
| /s/ JAMES B. LIPHAM James B. Lipham |
Director |
February 26, 2010 | ||
| /s/ FRITZ VON MERING Fritz von Mering |
Director |
February 26, 2010 | ||
| /s/ WENDY J. MURDOCK Wendy J. Murdock |
Director |
February 26, 2010 | ||
| /s/ JACK PEARLSTEIN Jack Pearlstein |
Director |
February 26, 2010 | ||
| /s/ TIMOTHY SAMPLES Timothy Samples |
Director |
February 26, 2010 | ||
107
Table of Contents
| Exhibit No. |
Description | |
| 3.1 | Restated Certificate of Incorporation of TSI Telecommunication Services Inc. (n/k/a Syniverse Technologies, Inc.)(1) | |
| 3.2 | Certificate of Amendment of Restated Certificate of Incorporation of Syniverse Technologies, Inc. (2) | |
| 3.3 | Second Amended and Restated Certificate of Syniverse Holdings, Inc. (3) | |
| 3.4 | Bylaws of Syniverse Technologies, Inc. (1) | |
| 3.5 | Amended and Restated Bylaws of Syniverse Holdings, Inc. (3) | |
| 4.1 | Rights Agreement, dated November 16, 2008, between Syniverse Holdings, Inc. and American Stock Transfer and Trust Company, LLC (4) | |
| 4.2 | Form of Certificate of Common Stock of Syniverse Holdings, Inc. (3) | |
| 4.3 | Indenture, dated August 24, 2005, among Syniverse Technologies, Inc., Syniverse Holdings, Inc., Syniverse Technologies of Virginia, Inc., Synivere Brience, LLC and The Bank of New York Trust Company, N.A. (5) | |
| 4.4 | Notation of Guarantee, dated August 24, 2005 by Syniverse Holdings, Inc., Syniverse Technologies of Virginia, Inc. and Syniverse Brience, LLC with respect to the Rule 144A 7 1/4% Global Note (6) | |
| 4.5 | Notation of Guarantee, dated August 24, 2005 by Syniverse Holdings, Inc., Syniverse Technologies of Virginia, Inc. and Syniverse Brience, LLC with respect to the Regulation S 7 1/4% Global Note (6) | |
| 10.1 | Amended and Restated Credit Agreement, dated as of August 9, 2007, among Syniverse Holdings, Inc., a Delaware corporation, Syniverse Technologies, Inc., a Delaware corporation, the several banks and other financial institutions or entities from time to time parties thereto, Lehman Brothers Inc. and Deutsche Bank Securities Inc., as joint lead arrangers and joint book-running managers, Lehman Commercial Paper Inc., as administrative agent, Deutsche Bank AG New York, as syndication agent, and Bear Stearns Corporate Lending Inc. and LaSalle Bank National Association as co-documentation agents. (7) | |
| 10.2 | Guarantee and Collateral Agreement, dated February 15, 2005, among Syniverse Holdings, Inc., Syniverse Technologies, Inc. and certain of their respective Subsidiaries, and Lehman Commercial Paper Inc., as Administrative Agent (8) | |
| 10.3 | Amendment, Waiver, Registration and Appointment Agreement, dated as of May 4, 2009 by and among Syniverse Holdings, Inc., Syniverse Technologies, Inc., the other financial institutions party thereto, Lehman Commercial Paper Inc., and Bank of America N.A. (9) | |
| 10.4 | Acquisition Agreement dated as of August 24, 2009 by and among VeriSign, Inc. and certain of its subsidiaries and Syniverse Holdings, Inc., as amended (10) | |
| †10.5 | Syniverse Holdings, Inc. Amended and Restated Founders’ Stock Option Plan (11) | |
| †10.6 | Syniverse Holdings, Inc. Amended and Restated Non-employee directors Stock Option Plan (11) | |
| †10.7 | Form of Amended and Restated Restricted Stock Grant Agreement (12) | |
| †10.8 | Form of Amended and Restated Non-qualified Stock Option Award Agreement (12) | |
| †10.9 | Syniverse Holdings, Inc. Amended and Restated 2006 Long-term Equity Incentive Plan (9) | |
108
Table of Contents
| Exhibit No. |
Description | |
| †10.10 | Form of Amended and Restated 2006 Long-Term Equity Incentive Plan Restricted Stock Grant Agreement for Non-employee Directors (9) | |
| †10.11 | Form of Amended and Restated 2006 Long-Term Equity Incentive Plan Non-qualified Stock Option Award Agreement for Non-employee Directors (9) | |
| †10.12 | Form of Amended and Restated 2006 Long-Term Equity Incentive Plan Performance Based Restricted Stock Agreement for use for international employees (10) | |
| †10.13 | Form of Amended and Restated 2006 Long-Term Equity Incentive Plan Performance Based Restricted Stock Agreement for use for domestic employees (10) | |
| †10.14 | Form of Amended and Restated 2006 Long-Term Equity Incentive Plan Non-qualified Stock Option Award Agreement for employees (10) | |
| †10.15 | Form of Amended and Restated 2006 Long-Term Equity Incentive Plan Restricted Stock Grant Agreement for use for international employees (10) | |
| †10.16 | Form of Amended and Restated 2006 Long-Term Equity Incentive Plan Restricted Stock Grant Agreement for use for domestic employees (10) | |
| †10.17 | Amended and Restated Senior management Agreement dated as of February 9, 2005 by and among Syniverse Holdings, LLC, Syniverse Holdings, Inc., Syniverse Technologies, Inc. and Eugene Bergen Henegouwen (13) | |
| †10.18 | Employment Agreement dated as of January 9, 2006 by and among Syniverse Holdings, Inc. and Syniverse Technologies, Inc. and Tony G. Holcombe (14) | |
| †10.19 | Amendment No. 1 to the Employment Agreement, dated as of December 30, 2008, by and among Syniverse Holdings, Inc., Syniverse Technologies, Inc. and Tony G. Holcombe (15) | |
| †10.20 | Employment Agreement dated as of May 24, 2007 by and among Syniverse Holdings, Inc., Synvierse Technologies, Inc. and David W. Hitchcock (16) | |
| †10.21 | Amendment No. 1 to the Employment Agreement, dated as of December 18, 2008, by and among Syniverse Holdings, Inc., Syniverse Technologies, Inc. and David W. Hitchcock (15) | |
| †10.22 | Employment Agreement dated as of January 14, 2008, by and among Syniverse Holdings, Inc., Syniverse Technologies, Inc. and Jeffrey Gordon (17) | |
| †10.23 | Amendment No. 1 to the Employment Agreement, dated as of December 30, 2008, by and among Syniverse Holdings, Inc., Syniverse Technologies, Inc. and Jeffrey Gordon (15) | |
| †10.24 | Employment Agreement, dated as of March 10, 2008 by and among Synvierse Holdings, Inc., Synvierse Technologies, Inc. and Alfredo T. de Cardenas (17) | |
| †10.25 | Amendment No. 1 to the Employment Agreement, dated as of December 18, 2008, by and among Syniverse Holdings, Inc., Syniverse Technologies, Inc. and Alfredo T. De Cardenas (15) | |
| 10.26 | Office Lease dated as of February 28, 2005 by and between 581 Highwoods L.P. and Syniverse Technologies, Inc. (11) | |
| 10.27 | Intellectual Property Agreement, dated February 14, 2002 among Verizon Information Services, Inc., Verizon Communications Inc. and Syniverse Technologies, Inc. (1) | |
| *12.1. | Computation of ratio of earnings to fixed charges. | |
| *21.1. | Subsidiaries of Syniverse Holdings, Inc. | |
109
Table of Contents
| Exhibit No. |
Description | |
| *23.1. | Consent of Ernst & Young LLP, independent registered certified public accounting firm. | |
| *31.1 | Certifications pursuant to Section 302 of the Sarbanes-Oxley Act of 2002 by the Chief Executive Officer. | |
| *31.2 | Certifications pursuant to Section 302 of the Sarbanes-Oxley Act of 2002 by the Chief Financial Officer. | |
| *32.1 | Certifications pursuant to Section 906 of the Sarbanes-Oxley Act of 2002 by the Chief Executive Officer. | |
| *32.2 | Certifications pursuant to Section 906 of the Sarbanes-Oxley Act of 2002 by the Chief Financial Officer. | |
| † | Compensatory plan or agreement. |
| * | Filed herewith. |
| (1) | Incorporated by reference to the Registrants’ Registration Statement on Form S-4 (Registration No. 333-88168) |
| (2) | Incorporated by reference to Syniverse Holdings, LLC and Syniverse Technologies, Inc.’s Annual Report on Form 10-K for the fiscal year ended December 31, 2003 |
| (3) | Incorporated by reference to Amendment No. 4 to Synvierse Holdings, Inc.’s Registration Statement on Form s-1/A (Registration No. 333-120444). |
| (4) | Incorporated by reference to Syniverse Holdings, Inc.’s Current Report on Form 8-K filed November 17, 2008 |
| (5) | Incorporated by reference to Registrants’ Current Report on Form 8-K filed August 24, 2005 |
| (6) | Incorporated by reference to Registrants’ Registration Statement on Form S-4 (Registration No. 333-129186) |
| (7) | Incorporated by reference to Registrants’ Current Report on Form 8-K, filed August 10, 2007 |
| (8) | Incorporated by reference to Registrants’ Current Report on Form 8-K filed February 18, 2005 |
| (9) | Incorporated by reference to Registrants’ Quarterly Report on Form 10-Q for the quarter ended June 30, 2009 |
| (10) | Incorporated by reference to Registrants’ Quarterly Report on Form 10-Q for the quarter ended September 30, 2009 |
| (11) | Incorporated by reference to Registrants’ Annual Report on Form 10-K for the fiscal year ended December 31, 2004 |
| (12) | Incorporated by reference to Registrants’ Current Report on Form 8-K filed August 17, 2006 |
| (13) | Incorporated by reference to Syniverse Holdings, LLC and Syniverse Technologies, Inc.’s Current Report on Form 8-K dated February 7, 2005 |
| (14) | Incorporated by reference to Registrants’ Current Report on Form 8-K filed January 10, 2006 |
| (15) | Incorporated by reference to Registrants’ Annual Report on Form 10-K for the fiscal year ended December 31, 2008 |
| (16) | Incorporated by reference to Registrants’ Current Report on Form 8-K filed May 30, 2007 |
| (17) | Incorporated by reference to Registrants’ Quarterly Report on Form 10-Q for the quarter ended March 31, 2008 |
110