Attached files
| file | filename |
|---|---|
| EX-31.1 - EX-31.1 - STILLWATER MINING CO /DE/ | d71255exv31w1.htm |
| EX-23.1 - EX-23.1 - STILLWATER MINING CO /DE/ | d71255exv23w1.htm |
| EX-23.2 - EX-23.2 - STILLWATER MINING CO /DE/ | d71255exv23w2.htm |
| EX-32.1 - EX-32.1 - STILLWATER MINING CO /DE/ | d71255exv32w1.htm |
| EX-31.2 - EX-31.2 - STILLWATER MINING CO /DE/ | d71255exv31w2.htm |
| EX-32.2 - EX-32.2 - STILLWATER MINING CO /DE/ | d71255exv32w2.htm |
Table of Contents
UNITED STATES
SECURITIES AND EXCHANGE COMMISSION
Washington, D.C. 20549
FORM 10-K
| þ | Annual Report Pursuant to Section 13 or 15(d) of the Securities Exchange Act of 1934 | |
| for the fiscal year ended December 31, 2009. |
OR
| o | Transition Report Pursuant to Section 13 or 15(d) of the Securities Exchange Act of 1934 | |
| for the transition period from to |
Commission File Number 1-13053
STILLWATER MINING COMPANY
(Exact name of registrant as specified in its charter)
| DELAWARE | 81-0480654 | |
| (State or other jurisdiction of incorporation or organization) |
(I.R.S. Employer Identification No.) |
536 EAST PIKE AVENUE, COLUMBUS, MONTANA 59019
(Address of principal executive offices and zip code)
(406) 373-8700
(Registrant’s telephone number, including area code)
Securities registered pursuant to Section 12(b) of the Act:
| TITLE OF EACH CLASS | NAME OF EACH EXCHANGE ON WHICH REGISTERED |
|
| Common Stock, $0.01 par value | The New York Stock Exchange | |
| Preferred Stock Purchase Rights | The New York Stock Exchange |
Securities registered pursuant to Section 12(g) of the Act: None
Indicate by check mark if the registrant is a well-known seasoned issuer (as defined in Rule 405 of
the Securities Act). o YES þ NO
Indicate by check mark if the registrant is not required to file reports pursuant to Section 13 or
Section 15(d) of the Act. o YES þ NO
Indicate by check mark whether the registrant (1) has filed all reports required to be filed by
Section 13 or 15(d) of the Securities Exchange Act of 1934 during the preceding 12 months (or for
such shorter period that the registrant was required to file such reports), and (2) has been
subject to such filing requirements for the past 90 days. þ YES o NO
Indicate by check mark whether the registrant has submitted electronically and posted on its
corporate Web site, if any, every Interactive Date File required to be submitted and posted
pursuant to Rule 405 of Regulation S-T (§232.405 of this chapter) during the preceding 12 months
(or for such shorter period that the registrant was required to
submit and post such files). YES o
NO o
Indicate by check mark if disclosure of delinquent filers pursuant to Item 405 of Regulation S-K is
not contained herein, and will not be contained, to the best of registrant’s knowledge, in
definitive proxy or information statements incorporated by reference in Part III of this Form 10-K
or any amendment to this Form 10-K. þ
Indicate by check mark whether the registrant is a large accelerated filer, an accelerated filer, a
non-accelerated filer, or a smaller reporting company. See the definitions of “large accelerated
filer,” “accelerated filer” and “smaller reporting company” in Rule 12b-2 of the Exchange Act.
(Check one):
| Large accelerated filer o | Accelerated filer þ | Non-accelerated filer o | Smaller reporting company o | |||
| (Do not check if a smaller reporting company) |
Indicate by check mark whether the registrant is a shell company (as defined in Exchange Act Rule
12b-2). o YES þ NO
As of June 30, 2009, assuming a price of $5.71 per share, the closing sale price on the New York
Stock Exchange, the aggregate market value of shares of voting and non-voting common equity held by
non-affiliates was approximately $246,638,237.
As of February 23, 2010, the Company had outstanding 97,151,324 shares of common stock, par value
$0.01 per share.
DOCUMENTS INCORPORATED BY REFERENCE
Certain information required in Part III of this Annual Report on Form 10-K is incorporated
herein by reference to the registrant’s Proxy Statement for its 2010 Annual Meeting of
Stockholders.
TABLE OF CONTENTS
| ITEMS 1, 1A, AND 2 BUSINESS, RISK FACTORS AND PROPERTIES | 6 | |||||||
| ITEM 3 | 42 | |||||||
| ITEM 4 | 42 | |||||||
| ITEM 5 | 43 | |||||||
| ITEM 6 | 44 | |||||||
| ITEM 7 | 52 | |||||||
| ITEM 7A | 67 | |||||||
| ITEM 8 | 69 | |||||||
| ITEM 9 | 97 | |||||||
| ITEM 9A | 97 | |||||||
| ITEM 9B | 98 | |||||||
| ITEM 10 | 98 | |||||||
| ITEM 11 | 100 | |||||||
| ITEM 12 | 100 | |||||||
| ITEM 13 | 100 | |||||||
| ITEM 14 | 100 | |||||||
| ITEM 15 | 101 | |||||||
| 105 | ||||||||
| EX-23.1 | ||||||||
| EX-23.2 | ||||||||
| EX-31.1 | ||||||||
| EX-31.2 | ||||||||
| EX-32.1 | ||||||||
| EX-32.2 | ||||||||
Table of Contents
GLOSSARY OF SELECTED MINING TERMS
The following is a glossary of selected mining terms used in the Form 10-K that may be technical in
nature:
Adit
|
A horizontal tunnel or drive, open to the surface at one end, which is used as an entrance to a mine. | |
Anorthosite
|
Igneous rock composed almost wholly of the mineral plagioclase feldspar. | |
Assay
|
The analysis of the proportions of metals in ore, or the testing of an ore or mineral for composition, purity, weight, or other properties of commercial interest. | |
Catalysts
|
Catalysts are materials that facilitate one or more chemical reactions without being consumed in the reaction themselves. As referenced in this report, platinum-group metals serve as catalysts within the catalytic converters used in automotive exhaust and pollution control systems and, where so indicated, within similar applications in petroleum refining or other chemical processes. | |
Close-spaced drilling
|
The drilling of holes designed to extract representative samples of rock in a target area. | |
Concentrate
|
A mineral processing product that generally describes the material that is produced after crushing and grinding ore effecting significant separation of gangue (waste) minerals from the metal and/or metal minerals, and discarding the waste and minor amounts of metal and/or metal minerals. The resulting “concentrate” of metal and/or metal minerals typically has an order of magnitude higher content of metal and/or metal minerals than the beginning ore material. | |
Crystallize
|
Process by which matter becomes crystalline (solid) from a gaseous, fluid or dispersed state. The separation, usually from a liquid phase on cooling, of a solid crystalline phase. | |
Cut-off grade
|
The lowest grade of mineralized material that qualifies as ore in a given deposit. The grade above which minerals are considered economically mineable considering the following parameters: estimates over the relevant period of mining costs, ore treatment costs, smelting and refining costs, process and refining recovery rates, royalty expenses, by-product credits, general and administrative costs, and PGM prices. | |
Decline
|
A gently sloped underground excavation constructed for purposes of moving mobile equipment, materials, supplies or personnel from surface openings to deeper mine workings or as an alternative to hoisting in a shaft for mobilization of equipment and materials between mine levels. | |
Dilution
|
An estimate of the amount of waste or low-grade mineralized rock which will be mined with the ore as part of normal mining practices in extracting an ore body. | |
Drift
|
A major horizontal access tunnel used for the transportation of ore or waste. | |
Ductility
|
Property of a solid material that undergoes more or less plastic deformation before it ruptures. The ability of a material to stretch without fracturing. | |
Fault
|
A geologic fracture or a zone of fractures along which there has been displacement of the sides relative to one another parallel to the fracture. | |
Filter cake
|
The PGM-bearing product that is shipped from the base metal refinery, as the Company’s final product, to a third-party toll refinery for the final extractive stages in the refining process. | |
Footwall
|
The underlying side of a fault, ore body, or mine working; especially the wall rock beneath an inclined vein, fault, or reef. |
2
Table of Contents
Gabbro rocks (See Mafic/Ultramafic) |
A group of dark-colored igneous rocks composed primarily of the minerals plagioclase feldspar and clinopyroxene, with minor orthopyroxene. | |
Gangue material
|
The non-metalliferous or waste metalliferous mineral in the ore. | |
Grade
|
The average metal content, as determined by assay of a volume of ore. For precious metals, grade is normally expressed as troy ounces per ton of ore or as grams per metric tonne of ore. | |
Hanging wall
|
The overlying side of a fault, ore body, or mine working; especially the wall rock above an inclined vein, fault, or reef. (Compare “footwall.”) | |
Hoist
|
See shaft | |
Jackleg drill
|
A manually operated rock drill, generally powered by compressed air, used to drill holes for blasting rock and to install ground support hardware. | |
Lenticular-shaped
|
Resembling in shape the cross section of a double-convex lens. | |
Load-haul-dump
|
A vehicle used underground to scoop up mined material and move it to a central collection or discharge point. Generally called an “LHD” by miners. | |
Lode claims
|
Claims to the mineral rights along a lode (vein) structure of mineralized material on Federal land; typically in the U.S. lode claims are 1,500 feet in length and 600 feet wide along the trend of the mineralized material. | |
Mafic rocks
|
Igneous rocks composed chiefly of dark, ferromagnesian minerals in addition to lighter-colored feldspars. | |
Matrix
|
The finer-grained material between the larger particles of a rock or the material surrounding mineral particles. | |
Mill
|
A processing plant that produces a concentrate of the valuable minerals or metals contained in an ore. The concentrate must then be treated in some other type of plant, such as a smelter, to effect recovery of the pure metal. Term used interchangeably with concentrator. | |
Mill site claims
|
Claiming of Federal land for mill site purposes or other operations connected with mining lode claims. Used for nonmineralized land not necessarily contiguous with the vein or lode. | |
Mineral beneficiation
|
A treatment process separating the valuable minerals from the host material. | |
Mineralization
|
The concentration of metals and their compounds in rocks, and the processes involved therein. | |
Mineralized material
|
A mineralized body which has been delineated by appropriately spaced drilling and/or underground sampling to support a general estimate of available tonnage and average grade of metals. Such a deposit does not qualify as a reserve until a comprehensive evaluation based upon unit cost, grade, recoveries, and other material factors conclude legal and economic feasibility. | |
Mouat Agreement
|
Mining and Processing Agreement dated March 16, 1984 regarding the Mouat family. The Mouat royalty stems back to the formation of Stillwater Mining Company at which time claims staked by the Mouats’ forebears in 1876 were leased to Stillwater Mining Company. | |
Net smelter royalty
|
A share of revenue paid by the Company to the owner of a royalty interest generally calculated based on the imputed value of the PGM concentrate delivered to the smelter. At Stillwater Mining Company, royalties are calculated on the mineral production subject to each royalty as a percentage of the revenue received by the Company after deducting treatment, refining and transportation charges paid to third parties, and certain other costs incurred in connection with processing the concentrate at the Columbus smelter. |
3
Table of Contents
Norite
|
Coarse-grained igneous rock composed of the minerals plagioclase feldspar and orthopyroxene. | |
Ore
|
That part of a mineral deposit which could be economically and legally extracted or produced at the time of reserve determination. | |
Outcrop
|
The part of a rock formation that appears at the earth’s surface often protruding above the surrounding ground. | |
PGM
|
The platinum group metals collectively and in any combination of palladium, platinum, rhodium, ruthenium, osmium, and iridium. Reference to PGM grades for the Company’s mine operations include measured quantities of palladium and platinum only. References to PGM grades associated with recycle materials typically include palladium, platinum and rhodium. | |
PGM rich matte
|
Matte is an intermediate product of smelting; an impure metallic sulfide mixture made by melting sulfide ore concentrates. PGM rich matte is a matte with an elevated level of platinum group metals. | |
Probable (indicated) reserves |
Reserves for which quantity and grade and/or quality are computed from information similar to that used for proven (measured) reserves, but the sites for inspection, sampling, and measurement are farther apart or are otherwise less adequately spaced. The degree of assurance, although lower than that for proven (measured) reserves, is high enough to assume continuity between points of observation. | |
Proven (measured) reserves |
Reserves for which (a) quantity is computed from dimensions revealed in outcrops, trenches, workings or drill holes; grade and/or quality are computed from the results of detailed sampling; and (b) the sites for inspection, sampling and measurement are spaced so closely and the geologic character is so well defined that size, shape, depth and mineral content of reserves are well established. | |
Recovery
|
The percentage of contained metal actually extracted from ore in the course of processing such ore. | |
Reef
|
A layer precipitated within the Stillwater Layered Igneous Complex enriched in platinum group metal-bearing minerals, chalcopyrite, pyrrhotite, pentlandite, and other sulfide materials. The J-M Reef, which the Company mines, occurs at a regular stratigraphic position within the Stillwater Complex. Note: this use of “reef” is uncommon and originated in South Africa where it is used to describe the PGM-bearing Merensky, UG2, and other similar layers in the Bushveld Complex. | |
Refining
|
The final stage of metal production in which residual impurities are removed from the metal. | |
Reserves
|
That part of a mineral deposit which could be economically and legally extracted or produced at the time of the reserve determination. | |
Recycling materials
|
Spent PGM-bearing materials collected for reprocessing from automotive, petroleum, chemical, medical, food and other catalysts. Additionally, PGMs for recycling may be sourced from scrap electronics and thermocouples, old jewelry and materials used in manufacturing glass. | |
Shaft
|
A vertical or steeply inclined excavation for the purposes of opening and servicing an underground mine. It is usually equipped with a hoist at the top which lowers and raises a conveyance for handling personnel and materials. | |
Slag
|
Slag is a nonmetallic product resulting from the mutual dissolution of flux and nonmetallic impurities during smelting. A silica rich slag is a smelting slag that contains a relatively high level of silica. | |
Sill
|
(1) With respect to a mine opening, the base or floor of the excavated area (stope); (2) With respect to intrusive rock, a tabular intrusive unit that is conformable with surrounding rock layers. |
4
Table of Contents
Slusher
|
(1) An electric double-drum winch with two steel ropes attached to an open-bottomed scoop that transports (drags) ore from the rock face to a loading point, where the ore is discharged. (2) A very selective mining method in which small ore stopes are mined using a slusher. | |
Smelting
|
Heating ore or concentrate material with suitable flux materials at high temperatures creating a fusion of these materials to produce a melt consisting of two layers with a slag of the flux and gangue (waste) minerals on top and molten impure metals below. This generally produces an unfinished product (matte) requiring refining. | |
Sponge
|
A granular (shot) form of PGM. Commonly, the form required for manufacture of many PGM-based chemicals and catalysts. | |
Stope
|
A localized area of underground excavation from which ore is extracted. | |
Strike
|
The course, direction or bearing of a vein or a layer of rock. | |
Tailings
|
That portion of the mined material that remains after the valuable minerals have been extracted. | |
Tolling
|
Processing of material owned by others for a fee without taking title to the material. | |
Troy ounce
|
A unit measure used in the precious metals industry. A troy ounce is equal to 31.10 grams. The amounts of palladium and platinum produced and/or sold by the Company are reported in troy ounces. There are 12 troy ounces to a troy pound. | |
Ultramafic rocks
|
Igneous rocks composed chiefly of dark, ferromagnesian minerals in the absence of significant lighter-colored feldspars. | |
Vein
|
A mineralized zone having regular development in length, width and depth that clearly separates it from neighboring rock. | |
Wall rock
|
The rock adjacent to, enclosing, or including a vein, layer, or dissemination of ore minerals. See “Hanging wall” and “Footwall” above. |
5
Table of Contents
PART I
ITEMS 1, 1A, AND 2
BUSINESS, RISK FACTORS AND PROPERTIES
BUSINESS, RISK FACTORS AND PROPERTIES
INTRODUCTION AND 2009 HIGHLIGHTS
Stillwater Mining Company (the Company) is engaged in the development, extraction, processing,
refining and marketing of palladium, platinum and associated metals (platinum group metals or PGMs)
from a geological formation in south central Montana known as the J-M Reef and from the recycling
of spent catalytic converters. The J-M Reef is the only known significant primary source of
platinum group metals inside the United States and one of the significant resources outside South
Africa and Russia. Associated by-product metals at the Company’s operations include significant
amounts of nickel and copper and minor amounts of gold, silver and rhodium. The J-M Reef is a
narrow but extensive mineralized zone containing PGMs, which has been traced over a strike length
of approximately 28 miles.
The Company conducts mining operations at the Stillwater Mine near Nye, Montana and at the
East Boulder Mine near Big Timber, Montana. Ore extraction at both mines takes place within the
J-M Reef. The Company operates concentrating plants at each mining operation to upgrade the mined
production into a concentrate form. The Company operates a smelter and base metal refinery at
Columbus, Montana which further upgrade the mined concentrates into a PGM-rich filter cake. The
filter cake is shipped to third-party custom refiners for final refining before being sold to third
parties.
Besides processing mine concentrates, the Company also recycles spent catalyst material at the
smelter and base metal refinery to recover the contained PGMs — palladium, platinum and rhodium.
The Company currently has catalyst sourcing arrangements with two suppliers and spot arrangements
with other suppliers who ship spent catalysts to the Company for processing to recover the PGMs.
The Company smelts and refines the spent catalysts within the same process stream as for the mined
production.
The Company has a sales agreement with Ford Motor Company (Ford) and had an agreement, until
July 2009, with General Motors Corporation (GM) to supply PGMs from the mines for use in automotive
catalytic converters. On July 22, 2009, as part of the GM bankruptcy proceedings, the bankruptcy
court approved a GM petition to reject its obligations under the Company’s supply agreement,
thereby nullifying the agreement with retroactive effect from July 7, 2009. The GM supply
agreement was scheduled to expire on December 31, 2012. The sales agreement with Ford Motor
Company will expire at the end of 2010.
PGMs are rare precious metals with unique physical properties that are used in diverse
industrial applications and in jewelry. The largest use for PGMs currently is in the automotive
industry for the production of catalysts that reduce harmful automobile emissions. Besides being
used in catalytic converters, palladium is used in jewelry, in the production of electronic
components for personal computers, cellular telephones and facsimile machines, as well as in dental
applications and in petroleum and industrial catalysts. Platinum’s largest use after catalytic
converters is for jewelry. Industrial uses for platinum, in addition to automobile and industrial
catalysts, include the manufacturing of data storage disks, fiberglass, paints, nitric acid,
anti-cancer drugs, fiber optic cables, fertilizers, unleaded and high-octane gasoline and fuel
cells. Rhodium, produced in the Company’s recycling operations and to a limited extent as a
by-product from mining, also is used in automotive catalytic converters to reduce nitrogen oxides
and in jewelry as a plating agent to provide brightness.
At December 31, 2009, the Company had proven and probable ore reserves of approximately 41.0
million tons with an average grade of 0.50 ounce of PGMs per ton containing approximately 20.6
million ounces of palladium and platinum at an in-situ ratio of about 3.57 parts palladium to one
part platinum. See “Business, Risk Factors, and Properties — Proven and Probable Ore Reserves”.
Worldwide Financial and Credit Crises
The Company was heavily impacted, particularly in late 2008 and through the first half of
2009, by the ongoing world financial crisis. As credit markets tightened, automotive demand
dropped steeply in the U. S. and Western Europe, pulling down demand for PGMs in catalytic
converters, the Company’s principal market. In light of world events and the sharp decrease in PGM
prices, during the fourth quarter of 2008 the Company underwent a major restructuring of its
operations in an effort to conserve cash and reduce anticipated losses. The restructuring of the
Company’s operations resulted in a dramatic improvement in productivity at both mines and only a
limited reduction in the scope of its mining
6
Table of Contents
operations. The Company recognized its exposure to the combined effect of low PGM prices, the
forthcoming expiration of its automobile agreements and reduced demand for its metals and concluded
to cut back its operating and cash costs to a level that would preserve the Company’s cash position
at the reduced PGM prices prevailing during the fourth quarter of 2008. While subsequent to that
time PGM prices have strengthened substantially, there can be no assurance that PGM market prices
will not decline again in the future, and in view of the impending loss of floor prices in its
sales agreement with Ford, the Company continues its efforts to optimize its cost structure and
improve mining productivities.
The world financial crisis also negatively impacted the Company’s recycling segment, which has
proven for a number of years to be a profitable ancillary business and which for the Company has
unique advantages. (The Company’s smelting and refining facilities have available capacity and are
designed to process PGM containing materials. Recycle material is blended with mine concentrate
for smelting and refining. The copper and nickel contained in the concentrate naturally collect
PGMs from the material during the smelting process). However, the volumes of catalytic material
available in the recycling market are sensitive to PGM prices, and along with the collapse of PGM
prices during the second half of 2008, the Company saw recycling volumes drop off precipitously.
The Company had advanced working capital to recycling collectors to facilitate their collection
efforts, and with the sharp drop in prices, these collectors suffered inventory losses and were
unable to fully repay the advances. Consequently, the Company wrote off $26.0 million of these
advances at the end of 2008. Subsequently, the Company has restructured its recycling business
model to reduce its financial exposure as a result of such abrupt market changes. The volumes of
material recycled have gradually recovered during 2009. See “Business, Risk Factors and Properties
— Risk Factors.”
2009 — In Review:
| • | The Company’s revenues, in terms of dollars and ounces sold, for 2009, 2008 and 2007 were: |
| Year ended December 31, | Sales Revenues | Troy Ounces Sold | ||||||||||||||||||||||||||||||||||||||
| (in thousands) | Palladium | Platinum | Rhodium | Other (1) | Total | Palladium | Platinum | Rhodium | Other(3) | Total | ||||||||||||||||||||||||||||||
2009 |
||||||||||||||||||||||||||||||||||||||||
Mine production |
$ | 143,514 | $ | 139,733 | $ | 6,453 | $ | 17,192 | $ | 306,892 | 393 | 123 | 4 | 15 | 535 | |||||||||||||||||||||||||
PGM recycling |
14,947 | 45,736 | 18,666 | 2,439 | 81,788 | 53 | 40 | 9 | — | 102 | ||||||||||||||||||||||||||||||
Other (2) |
2,679 | 3,028 | 45 | — | 5,752 | 12 | 3 | — | — | 15 | ||||||||||||||||||||||||||||||
Total |
$ | 161,140 | $ | 188,497 | $ | 25,164 | $ | 19,631 | $ | 394,432 | 458 | 166 | 13 | 15 | 652 | |||||||||||||||||||||||||
2008 |
||||||||||||||||||||||||||||||||||||||||
Mine production |
$ | 163,433 | $ | 160,171 | $ | 16,474 | $ | 20,286 | $ | 360,364 | 399 | 115 | 2 | 19 | 535 | |||||||||||||||||||||||||
PGM recycling |
47,760 | 227,358 | 197,469 | 2,801 | 475,388 | 119 | 131 | 25 | — | 275 | ||||||||||||||||||||||||||||||
Other (2) |
19,980 | — | — | — | 19,980 | 49 | — | — | — | 49 | ||||||||||||||||||||||||||||||
Total |
$ | 231,173 | $ | 387,529 | $ | 213,943 | $ | 23,087 | $ | 855,732 | 567 | 246 | 27 | 19 | 859 | |||||||||||||||||||||||||
2007 |
||||||||||||||||||||||||||||||||||||||||
Mine production |
$ | 162,811 | $ | 114,645 | $ | 23,407 | $ | 30,414 | $ | 331,277 | 425 | 120 | 4 | 20 | 569 | |||||||||||||||||||||||||
PGM recycling |
36,505 | 149,061 | 138,798 | 2,030 | 326,394 | 102 | 119 | 24 | — | 245 | ||||||||||||||||||||||||||||||
Other (2) |
15,365 | — | — | — | 15,365 | 44 | — | — | — | 44 | ||||||||||||||||||||||||||||||
Total |
$ | 214,681 | $ | 263,706 | $ | 162,205 | $ | 32,444 | $ | 673,036 | 571 | 239 | 28 | 20 | 858 | |||||||||||||||||||||||||
| (1) | “Other” column includes gold, silver, nickel and copper by-product sales from mine production and revenue from processing recycling materials on a toll basis. | |
| (2) | “Other” row includes sales of metal purchased in the open market. | |
| (3) | “Other” column includes gold and silver by-product ounces sold. Not reflected in the “other” ounce column in the table above are approximately 856,000 pounds and 776,000 pounds of nickel and copper, respectively, sold in 2009. Comparative sales in 2008 were approximately 931,000 pounds and 940,000 pounds of nickel and copper, respectively. Sales in 2007 included approximately 1.2 million pounds of nickel and approximately 942,000 pounds of copper. |
| • | The Company reported a net loss of $9.2 million, or $0.10 per diluted share, for the year ended December 31, 2009, compared to a net loss of $116.9 million, or $1.26 per diluted share, in 2008. Contributing to the net loss in 2009 was an $8.1 million non-cash charge related to the issuance in October of approximately 1.8 million common shares in exchange for $15 million principal amount of the Company’s outstanding 1.875% convertible debentures. Additional charges taken in 2009 included $10.9 million of lower-of-cost-or-market inventory adjustments, $0.6 million to write-off certain trade receivables and a $0.5 million write-down of advances on recycling inventory purchases. See “Management’s Discussion and Analysis of Financial Condition and Results of Operations — Year Ended December 31, 2009 Compared to Year Ended December 31, 2008.” |
7
Table of Contents
| • | In 2009, the Company’s mining operations produced a total of 529,900 ounces of palladium and platinum, 6.2% better than the 498,900 ounces produced in 2008. Total consolidated cash cost per ounce (a non-GAAP measure of extraction efficiency) averaged $360 in 2009, compared with $405 in 2008. This decrease in cash costs per ounce reflected the effect of an approximate 27% reduction in workforce (including contractors) late in 2008, and the resulting efficiency improvements achieved in various mining and support functions, as well as generally lower material costs. Mine production for 2010 is projected at 515,000 combined ounces of palladium and platinum, and as in 2009, the Company plans to continue its emphasis on mining efficiency and cost reduction, rather than pushing to increase mine production at this time. Total consolidated cash costs per ounce (a non-GAAP measure) for 2010 currently are projected to be in line with 2009 at $360 per ounce. See Part II, Item 6 “Selected Financial and Operating Data” for further discussion of non-GAAP measures. | |
| • | Revenues from PGM recycling fell 82.8% during 2009, decreasing to $81.8 million in 2009, from $475.4 million in 2008, a direct result of the decrease in volumes processed and lower PGM prices. Recycled ounces sold decreased in 2009 to 102,000 ounces compared to 275,000 ounces in 2008 and the Company’s combined average realization on recycling sales (which include palladium, platinum and rhodium) decreased to $779 per ounce in 2009 from $1,715 per ounce in 2008, reflecting much lower PGM prices. In addition to purchased material, the Company processed 128,000 ounces of PGMs on a tolling basis in 2009 up from 126,000 tolled ounces in 2008. Recycled volumes fed to the smelter totaled 251,000 ounces of PGMs in 2009, down 36.9% from 398,100 ounces in 2008; mostly the result of lower availability of recycling materials in the market in early 2009 but also resulting from the Company’s modified commercial approach to the business. Recycling volumes gradually strengthened as 2009 progressed. As recycling volumes diminished in late 2008, the Company’s cash balances benefitted from a reduction in the amount of working capital required to sustain recycling activities; these volumes, and the associated working capital have increased somewhat as the recycling market gradually recovered during 2009. Working capital associated with recycling activities in the form of inventories and advances was $28.6 million and $22.1 million at December 31, 2009 and 2008, respectively. The year-end 2009 balance reflects the write-down of $0.5 million against advances on inventory purchases during 2009; the year-end 2008 balance is shown net of the $26.0 million write-off against advances on inventory purchases recorded in 2008. |
| • | The Company’s 2009 capital expenditures totaled $39.5 million, down from $82.3 million in 2008. Capital spending in 2009 reflected scaled-back development spending in the mines and completion of various critical infrastructure projects. Capitalized development expenditures totaled $25.9 million in 2009, down substantially from $55.9 million in 2008 and somewhat below that necessary to sustain production over the long term. One major infrastructure project completed during 2009 was construction of a second electric furnace at the smelter, a project that was begun during 2008. Capital spending in 2010 is budgeted at about $50 million, which management believes is adequate to sustain the developed state of both mines at current levels of production. For a discussion of certain risks associated with the Company’s business, see “Business, Risk Factors and Properties — Current Operations”, and “— Risk Factors” and “Management’s Discussion and Analysis of Financial Condition and Results of Operations”. |
2010 — Looking Forward
The Company believes its actions over the past 18 months have been measured and appropriate.
In the face of the worldwide financial crisis, decreased demand for automobiles, extremely volatile
commodity prices, the termination of the General Motors sales agreement and the looming expiration
of the Ford agreement, the Company significantly changed its operations, as described above and
throughout this Annual Report. From a management perspective, the Company currently sees its focus
along the following lines:
| • | Although commodity prices have improved from their lows in the fourth quarter of 2008, the Company is not proposing at this time any significant changes to its restructured mining plan adopted at the end of 2008 and continuously fine-tuned during 2009. It will continue to emphasize mining efficiency and cost reduction rather than returning to a focus on increasing mine production. The Company believes it is prudent to monitor the worldwide industrial recession and recovery, as well as commodity prices, before directing its attention toward increased production and broadened capital spending. The year 2010 will include some growth in development spending at both mines, but only by an amount sufficient to sustain their current production levels going forward. The Company views its existing cash balance ($201.2 million at December 31, 2009) as an important cushion to be utilized carefully as circumstances require. In light of tight credit markets and relatively high borrowing costs, the Company has not sought to put a revolving line of credit into place at this time. |
8
Table of Contents
| • | The Company believes it has seen signs of a recovery in its PGM recycling business and expects to increase its recycling volumes processed as conditions permit. However, the Company also expects to maintain tighter controls over funding advances, which may constrain achieving the kind of strong revenue growth in this business seen in 2007 and early 2008. At the same time, the Company expects the tighter controls to result in the funding advances being more secure. |
| • | The Company will continue to review potential growth opportunities in other sectors of the business in an effort to address concerns over its narrow focus on a single commodity at a single location in an effort to diversify business risks and opportunities. While the Company’s relatively low debt and stable balance sheet may be helpful in this effort, a need to avoid over-leveraging the Company or unduly diluting existing shareholders is likely to limit the size of potential acquisitions. Management intends to balance the benefits and risks of any such opportunity carefully before moving ahead. |
HISTORY OF THE COMPANY
Mineral exploration in the Stillwater Complex dates from at least the late nineteenth century,
with early mining activities — primarily for chromium — beginning in the 1920s. Palladium and
platinum were discovered within the Stillwater Complex, by geologists from Johns Manville
Corporation (Manville) in the early 1970s, in what then became known as the J-M Reef. In 1979, a
Manville subsidiary entered into a partnership agreement with Chevron U.S.A. Inc. (Chevron) to
develop PGMs discovered in the J-M Reef. Manville and Chevron explored and developed the
Stillwater property and commenced commercial underground mining in 1986.
Stillwater Mining Company was incorporated in 1992 and on October 1, 1993, Chevron and
Manville transferred substantially all assets, liabilities and operations at the Stillwater
property into the Company, with Chevron and Manville each receiving a 50% ownership interest in the
Company’s stock. In September 1994, the Company redeemed Chevron’s entire 50% ownership. The
Company subsequently completed an initial public offering in December 1994 and Manville sold a
portion of its shares through the offering, reducing its ownership percentage to approximately 27%.
In August 1995, Manville sold its remaining ownership interest in the Company to a group of
institutional investors. The Company’s common stock is publicly traded on the New York Stock
Exchange (NYSE) under the symbol “SWC”.
On June 23, 2003, the Company completed a stock purchase transaction with MMC Norilsk Nickel
(Norilsk Nickel), whereby a subsidiary of Norilsk Nickel became a majority stockholder of the
Company. On that date, the parties entered into a Stockholders Agreement governing the terms of
Norilsk Nickel’s investment in the Company. A copy of the Stockholders Agreement was included in
the Company’s Report on Form 8-K filed on June 23, 2003. As of December 31, 2009, Norilsk Nickel
controlled approximately 51.5% of the Company’s outstanding common shares and held $80 million of
the Company’s $166.5 million outstanding 1.875% convertible debentures maturing in 2028.
GEOLOGY OF THE J-M REEF
The Stillwater Complex, which hosts the J-M Reef ore deposit, is located in the Beartooth
Mountains in south central Montana. It is situated along the northern edge of the Beartooth Uplift
and Plateau, which rise to elevations in excess of 10,000 feet above sea level. The plateau and
Stillwater Complex have been deeply incised by the major drainages and tributaries of the
Stillwater and Boulder Rivers down to elevations at the valley floor of approximately 5,000 feet.
Geologically the Stillwater Layered Igneous Complex is composed of a succession of ultramafic
to mafic rocks derived from a large complex magma body emplaced deep in the Earth’s crust an
estimated 2.7 billion years ago. The molten mass was sufficiently large and fluid at the time of
emplacement to allow its chemical constituents to crystallize slowly and sequentially, with the
heavier mafic minerals settling more rapidly toward the base of the cooling complex. The lighter,
more siliceous suites crystallized more slowly and also settled into layered successions of norite,
gabbroic and anorthosite suites. This systematic process resulted in mineral segregations being
deposited into extensive and relatively uniform layers of varied mineral concentrations.
The uniquely PGM-enriched J-M Reef and its characteristic host rock package represent one such
layered sequence. The geosciences community believes that the PGM-enriched suite and other
minerals characterizing the J-M Reef accumulated at the same time and by the same mechanisms of
formation as the rocks enclosing them. Over time, the orientation of a portion of the original
horizontal reef and layered igneous complex was faulted an estimated 20,000 feet to the northeast
and was tilted upward at angles of 50 to 90 degrees to the north by the Beartooth Uplift.
Localized
faulting and intrusive mafic dikes are also evident along the 28-mile strike length of exposed
Stillwater Complex. The impact of these structural events is localized along the J-M Reef and
affect the percent mineable tonnage in an area, create
9
Table of Contents
additional dilution, or result in below cut-off grade and barren zones within the reef. The
impacts on ore reserves of these events are quantified in the percent mineable discussion under
“Ore Reserves.” The upper portion and exposed edge of the uplifted reef complex were eroded
forming the lenticular-shaped surface exposure of the Stillwater Complex and J-M Reef package
evident today.
The J-M Reef package has been traced at its predictable geologic position and with unusual
overall uniformity over considerable distances within the uplifted portion of the Stillwater
Complex. The surface outcrops of the reef have been examined, mapped and sampled for approximately
28 miles along its east-southeasterly course and over a known expression of over 8,200 feet
vertically. The predictability of the J-M Reef has been further confirmed in subsurface mine
workings of the Stillwater and East Boulder Mines and by over 27,000 drill hole penetrations.
The PGMs in the J-M Reef consist primarily of palladium, platinum and a minor amount of
rhodium. The reef also contains significant amounts of nickel and copper and trace amounts of gold
and silver. Five-year production figures from the Company’s mining operations on the J-M Reef are
summarized in Part II, Item 6, “Selected Financial and Operating Data.”
ORE RESERVE DETERMINATION
As of December 31, 2009, the Company’s total proven palladium and platinum ore reserves were
4.6 million tons at an average grade of 0.56 ounce per ton, containing 2.6 million ounces of
palladium and platinum, representing a decrease of 9.0% in proven contained ounces from December
31, 2008. The Company’s total probable palladium and platinum ore reserves at December 31, 2009,
were 36.4 million tons at an average grade of 0.50 ounce per ton, containing 18.0 million ounces of
palladium plus platinum, an increase of 2.3% in probable contained ounces from December 31, 2008.
Combined, the Company’s total proven and probable palladium and platinum ore reserves were 41.0
million tons at an average grade of 0.50 ounce per ton, containing 20.6 million ounces of palladium
plus platinum, a modest increase of 0.7% in total proven and probable contained ounces from
December 31, 2008.
Methodology
The Company utilizes statistical methodologies to calculate ore reserves based on
interpolation between and projection beyond sample points. Interpolation and projection are
limited by certain modifying factors including geologic boundaries, economic considerations and
constraints imposed by safe mining practices. Sample points consist of variably spaced drill core
intervals through the J-M Reef obtained from drill sites located on the surface and in underground
development workings. Results from all sample points within the ore reserve area are evaluated and
applied in determining the ore reserve.
For proven ore reserves, distances between samples range from 25 to 100 feet but are typically
spaced at 50-foot intervals both horizontally and vertically. The sample data for proven ore
reserves consists of survey data, lithologic data and assay results. Quality Assurance/Quality
Control (QA/QC) protocols are in place at both mine sites to test the sampling and analysis
procedures. To test assay accuracy and reproducibility, pulps from core samples are resubmitted
and compared. To test for sample label errors or cross-contamination, blank core (waste core)
samples are submitted with the mineralized sample lots and compared. The QA/QC protocols are
practiced on both resource development and production samples. The resulting data is entered into
a 3-dimensional modeling software package and is analyzed to produce a 3-dimensional solid block
model of the resource. The assay values are further analyzed by a geostatistical modeling
technique (kriging) to establish a grade distribution within the 3-dimensional block model.
Dilution is then applied to the model and a diluted tonnage and grade are calculated for each
block. Ore and waste tons, contained ounces and grade are then calculated and summed for all
blocks. A percent mineable factor based on historic geologic unit values is applied and the final
proven reserve tons and grade are calculated.
Two types of cut-off grades are recognized for the J-M Reef, a geologic cut-off boundary and
an economic cut-off grade. The geologic cut-off boundary of 0.3 troy ounces of palladium plus
platinum per ton is an inherent characteristic of the formation of the J-M Reef and is used for
calculation of the proven and probable reserves. The economic cut-off grade is lower than the
geologic cut-off and can vary between the mines based on cost and efficiency factors. The
determination of the economic cut-off grade is completed on a round by round basis and is driven
primarily by excess mill capacity and geologic character encountered at the face. See “Proven and
Probable Ore Reserves — Discussion” for reserve sensitivity to metal pricing.
10
Table of Contents
Probable ore reserves are based on longer projections, up to a maximum radius of 1,000 feet
beyond the limit of existing drill hole sample intercepts of the J-M Reef obtained from surface and
underground drilling. Statistical modeling and the established continuity of the J-M Reef as
determined from results of over 20 years of mining activity to date support the Company’s technical
confidence in estimates of tonnage and grade over this projection distance. Where appropriate,
projections for the probable ore reserve determination are constrained by any known or anticipated
restrictive geologic features. The probable reserve estimate of tons and grade is based on the
projection of factors calculated from adjacent proven reserve blocks or from diamond drilling data
where available. The factors consist of a probable area, proven yield in tons per foot of footwall
lateral, average grade and percent mineable. The area is calculated based on projections up to a
maximum of 1,000-feet; the proven yield in tons per foot of footwall lateral and grade are
calculated based on long-term proven ore reserve results in adjacent areas; and the percent
mineable is calculated based on long-term experience from actual mining in adjacent areas.
Contained ounces are calculated based on area divided by 300 (square feet) times proven yield in
tons per foot of footwall lateral times grade (ounces per ton) times percent mineable (%).
The Company reviews its methodology for calculating ore reserves on an annual basis.
Conversion, an indicator of the success in upgrading probable ore reserves to proven ore reserves,
is evaluated annually as part of the reserve process. The annual review examines the effect of new
geologic information, changes implemented or planned in mining practices and mine economics on
factors used for the estimation of probable ore reserves. The review includes an evaluation of the
Company’s rate of conversion of probable reserves to proven reserves.
The proven and probable ore reserves are then modeled as a long-term mine plan and additional
factors including process recoveries, mining methods, metal prices, mine operating productivities
and costs and capital estimates are applied to determine the overall economics of the ore reserves.
SEC Guidelines
The United States Securities and Exchange Commission (SEC) have established guidelines
contained in Industry Guide No. 7 to assist registered companies as they estimate ore reserves.
These guidelines set forth technical, legal and economic criteria for determining whether the
Company’s ore reserves can be classified as proven and probable.
The SEC’s economic guidelines have not historically constrained the Company’s ore reserves,
and did not constrain the ore reserves at December 31, 2009. Under these guidelines, ore may be
classified as proven or probable if extraction and sale result in positive cumulative undiscounted
cash flow. The Company utilizes both the historical trailing twelve-quarter average combined PGM
market price and the current PGM market price in ascertaining these cumulative undiscounted cash
flows. In testing ore reserves at December 31, 2009, the Company applied the trailing
twelve-quarter combined average PGM market price of about $556 per ounce, based upon the
twelve-quarter average palladium price of about $324 per ounce and the twelve-quarter average
platinum price of about $1,362 per ounce.
The Company believes that it is appropriate to use a long-term average price for measuring ore
reserves as such a price, better matches the period over which the reserves will ultimately be
mined. However, should metal prices decline substantially from their present level for an extended
period, the twelve-quarter trailing average price might also decline and could result in a
reduction of the Company’s reported ore reserves.
The Company’s board of directors has established an Ore Reserve Committee, which met three
times during 2009 with management who also met with outside experts to review ore reserve methodology, to
identify best practices in the industry and to receive reports on the progress and results of the
Company’s mine development efforts. The Committee has reviewed the Company’s ore reserves as
reported at December 31, 2009, having met with management and with the Company’s independent
consultant on ore reserves.
Results
The December 31, 2009, ore reserves were reviewed by Behre Dolbear & Company, Inc. (Behre
Dolbear), third party independent consultants, who are experts in mining, geology and ore reserve
determination. The Company has utilized Behre Dolbear to carry out independent reviews and
inventories of the Company’s ore reserves since 1990. Behre Dolbear has consented to be a named
expert herein. See “Business, Risk Factors and Properties — Risk Factors — Ore Reserves Are Very
Difficult to Estimate and Ore Reserve Estimates May Require Adjustment in the Future; Changes in
Ore Grades, Mining Practices and Economic Factors Could Materially Affect the Company’s Production
and Reported Results.”
11
Table of Contents
The Stillwater Mine proven and probable ore reserves at year-end 2009 decreased by 3.5% in
terms of ore tons from those reported at year-end 2008. The East Boulder Mine proven and probable
ore reserves at year-end 2009 increased by 15.9% in ore tons from those reported at year-end 2008.
Overall, the Company’s estimated proven and probable ore reserves based on ore tons increased by
7.3% in 2009. The Company’s ore reserve determination for 2009, calculated at December 31, 2009,
was limited by geologic certainty and not by economic constraints.
PROVEN AND PROBABLE ORE RESERVES
The Company’s proven ore reserves are generally expected to be extracted utilizing existing
mine infrastructure. However, additional infrastructure development will be required to extract
the Company’s probable ore reserves. Based on the 2010 mining plans at each mine, the year-end
2009 proven ore reserves of 2.6 million tons at the Stillwater Mine and 2.0 million tons at the
East Boulder Mine represent an adequate level of proven ore reserves to support planned mining
activities. The long-term proven ore reserve targets are 2.8 million tons at the Stillwater Mine
and 2.0 million tons at the East Boulder Mine, which reflect adequate ore reserves to support
production at the planned capacity of each facility.
The grade of the Company’s ore reserves, measured in combined platinum and palladium ounces
per ton, is a composite average of samples in all reserve areas. As is common in underground
mines, the grade mined and the recovery rate achieved varies depending on the area being mined. In
particular, mill head grade varies significantly between the Stillwater and East Boulder Mines, as
well as within different areas of each mine. During 2009, 2008 and 2007, the average mill head
grade for all tons processed from the Stillwater Mine was 0.56, 0.51 and 0.55 PGM ounces per ton of
ore, respectively. During 2009, 2008 and 2007 the average mill head grade for all tons processed
from the East Boulder Mine remained consistent at about 0.38 PGM ounces per ton of ore.
Concentrator feeds at both mines typically include, along with the ore, some PGM-bearing material
that is below the cut-off grade for reserves (reef waste) but that is economic to process so long
as there is capacity available in the concentrator.
As of December 31, 2009, 2008 and 2007 the Company’s proven and probable ore reserves were as
follows:
| DECEMBER 31, 2009 | DECEMBER 31, 2008 | DECEMBER 31, 2007 | ||||||||||||||||||||||||||||||||||
| AVERAGE | CONTAINED | AVERAGE | CONTAINED | AVERAGE | CONTAINED | |||||||||||||||||||||||||||||||
| TONS | GRADE | OUNCES | TONS | GRADE | OUNCES | TONS | GRADE | OUNCES | ||||||||||||||||||||||||||||
| (000’s) | (OUNCE/TON) | (000’S) | (000’s) | (OUNCE/TON) | (000’S) | (000’s) | (OUNCE/TON) | (000’S) | ||||||||||||||||||||||||||||
Stillwater Mine (2) |
||||||||||||||||||||||||||||||||||||
Proven Reserves
|
2,606 | 0.66 | 1,712 | 2,911 | 0.65 | 1,898 | 2,784 | 0.65 | 1,796 | |||||||||||||||||||||||||||
Probable Reserves
|
13,748 | 0.63 | 8,688 | 14,030 | 0.64 | 8,911 | 14,360 | 0.61 | 8,791 | |||||||||||||||||||||||||||
Total Proven and Probable
Reserves (1)
|
16,354 | 0.64 | 10,400 | 16,941 | 0.64 | 10,809 | 17,144 | 0.62 | 10,586 | (4) | ||||||||||||||||||||||||||
East Boulder Mine (2) |
||||||||||||||||||||||||||||||||||||
Proven Reserves
|
2,036 | 0.43 | 867 | 2,066 | 0.45 | 935 | 2,017 | 0.46 | 921 | |||||||||||||||||||||||||||
Probable Reserves
|
22,607 | 0.41 | 9,347 | 19,202 | 0.45 | 8,717 | 20,868 | 0.46 | 9,660 | |||||||||||||||||||||||||||
Total Proven and Probable
Reserves (1)
|
24,643 | 0.41 | 10,214 | 21,268 | 0.45 | 9,652 | 22,885 | 0.46 | 10,581 | |||||||||||||||||||||||||||
Total Company Reserves (2) |
||||||||||||||||||||||||||||||||||||
Proven Reserves
|
4,642 | 0.56 | 2,579 | 4,977 | 0.57 | 2,833 | 4,800 | 0.57 | 2,717 | |||||||||||||||||||||||||||
Probable Reserves
|
36,355 | 0.50 | 18,035 | 33,232 | 0.53 | 17,628 | 35,228 | 0.52 | 18,451 | |||||||||||||||||||||||||||
Total Proven and Probable
Reserves (1)
|
40,997 | 0.50 | 20,614 | 38,209 | 0.54 | 20,461 | 40,028 | 0.53 | 21,167 | (3)(4) | ||||||||||||||||||||||||||
| (1) | Reserves are defined as that part of a mineral deposit that could be economically and legally extracted or produced at the time of the reserve determination. Proven ore reserves are defined as ore reserves for which (a) quantity is computed from dimensions revealed in outcrops, trenches, workings or drill holes; grade and/or quality are computed from the results of detailed sampling and (b) the sites for inspection, sampling and measurement are spaced so closely and the geologic character is so well defined that size, shape, depth and mineral content of ore reserves are well-established. Probable ore reserves are defined as ore reserves for which quantity and grade and/or quality are computed from information similar to that used for proven ore reserves, but the sites for inspection, sampling, and measurement are farther apart or are otherwise less adequately spaced. The degree of assurance, although lower than that for proven ore reserves, is high enough to assume continuity between points of observation. The proven and probable ore reserves reflect variations in the PGM content and structural impacts on the J-M Reef. These variations are the result of localized depositional and structural influences on the distributions of economic PGM mineralization. Geologic domains within the reserve boundaries of the two mines include areas where as little as 0% and up to 100% of the J-M Reef is economically mineable. The ore reserve estimate gives effect to these assumptions. See “Business, Risk Factors and Properties — Risk Factors” and “Management’s Discussion and Analysis of Financial Condition and Results of Operations — Factors That May Affect Future Results and Financial Condition.” | |
| (2) | Expressed as palladium plus platinum in-situ ounces at a ratio of approximately 3.57 parts palladium to 1 part platinum. The Stillwater Mine is at a 3.53 to 1 ratio and the East Boulder Mine is 3.60 to 1. |
12
Table of Contents
| (3) | Average mining and processing losses of approximately 18.1% must be deducted to arrive at the estimated saleable ounces. | |
| (4) | Columns do not add mathematically due to rounding. |
Discussion
The Company’s total proven and probable ore reserves at December 31, 2009, have increased by
about 2% or 1.0 million tons over the past two years. In 2009, proven and probable tons increased
7.3% while contained ounces slightly increased by 0.7% from those reported December 31, 2008. In
2008, proven and probable tons decreased 4.5% while contained ounces decreased 3.3% from those
reported December 31, 2007. The Company’s mine development efforts over the past several years
have focused on converting probable reserves to proven reserves, rather than on adding new probable
reserves.
Proven reserves have decreased over the past two years. In 2009, total proven tons decreased
by about 3.3% and total contained ounces decreased by 5.0% from those reported December 31, 2007.
Changes in proven and probable ore reserves are due to the net effect of:
| • | Additions to proven ore reserves from new definition drilling, | ||
| • | Deletions as proven reserves are mined, | ||
| • | Deletions from probable ore reserves as areas are converted by new drilling from probable to proven ore reserves, | ||
| • | Additions from development activity to convert mineralized inventory to probable ore reserves, | ||
| • | Additions and deletions from adjustments to ore reserve estimation factors and mine planning criteria. The cut-off grade used in mine planning is .3 ounces of platinum and palladium per ton for the Stillwater Mine and is .2 ounces of platinum and palladium per ton for the East Boulder Mine, depending on the mining method employed. The economic value of this cut-off grade varies with platinum and palladium prices and with the different mining methods employed, their costs and their efficiency. |
The Company’s production levels for palladium and platinum are driven by the number of ore
tons mined, the mill head grade of the ore and the metallurgical recovery percentages. The Company
measures its net mine production in terms of the number of ounces contained in the mill
concentrate, adjusted for subsequent processing losses expected to be incurred in smelting and
refining. The Company defines an ounce of metal as “produced” at the time it is transferred from
the mine site and received at the concentrator. Depreciation and amortization costs are
inventoried at each stage of production.
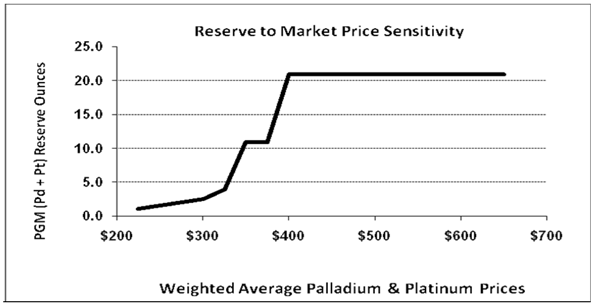
The graph above provides a general indication of the sensitivity of the Company’s ore reserves
to the long-term weighted average price of platinum and palladium, assuming the relative
proportions of the two metals realized at the Company’s mines. It is based on the mine plan and
model the Company uses to measure reserve economics, and reflects some reductions in capital
spending at lower price levels where reserves are economically constrained. It does not
13
Table of Contents
provide for any adjustments to the planned mining sequence or to the mix of mining methods at lower
prices, but instead is derived from a single planning scenario. As such, it should be regarded as
indicative rather than definitive.
The economic analysis of proven and probable reserves at the end of 2009 identified that at a
palladium and platinum combined price of about $400 per ounce the stated level of reserves would
begin to be reduced by economic constraints. This combined price at which ore reserves become
constrained by economics has decreased from $517 per ounce in the analysis performed in 2008 and
$454 per ounce shown in 2007. The variation in these threshold prices reflects year-on-year
changes in mining costs, current development and production method assumptions, adjustments to ore
grade and mine plans, and economic performance due to changing market prices during those periods.
The Company has not tested the ore reserves beyond the level shown above because of the expense of
accessing and drilling to establish ore reserves and because of the extensive life of a 20.6
million ounce reserve.
IMPAIRMENT OF LONG-LIVED ASSETS
The Company reviews and evaluates its long-lived assets for impairment when events or changes
in circumstances indicate that the related carrying amounts may not be recoverable. Impairment is
considered to exist if total estimated future cash flows on an undiscounted basis are less than the
carrying amount of the asset. The estimation of future cash flows takes into account estimates of
recoverable ounces, PGM prices (long-term sales contract prices and historical pricing trends or
third party projections of future prices rather than prices at a point in time as an indicator of
longer-term future prices), production levels, and capital and reclamation expenditures, all based
on life-of-mine plans and projections. If the assets are impaired, a calculation of fair market
value is performed, and if fair market value is lower than the carrying value of the assets, the
assets are reduced to their fair market value.
The Company determined that there was no material event or change in circumstances requiring
the Company to test its long-lived assets for impairment at December 31, 2009. In contrast, during
the latter part of 2008 the Company concluded that the economic circumstances in which the Company
operates had changed significantly. Therefore, at the end of 2008, the Company assessed whether
total estimated undiscounted future cash flows at the Stillwater and the East Boulder Mines would
be sufficient to recoup the carrying amount of each asset. Based on the mine plans as of December
31, 2008 and an assessment of long-term pricing, the Company determined that undiscounted future
cash flows at the Stillwater Mine were sufficient to return the carrying value, but the
undiscounted future cash flows projected at the East Boulder Mine were not sufficient to cover the
carrying value there. Consequently, with the assistance of Behre Dolbear, the Company assessed the
fair value of the East Boulder Mine assets and concluded that a valuation adjustment was needed at
East Boulder. Accordingly, the Company recorded a $67.3 million charge against earnings at
December 31, 2008, reducing the carrying value of the East Boulder Mine assets to $161.4 million.
Assumptions underlying future cash flows are subject to certain risks and uncertainties. Any
differences between projections and actual outcomes for key factors such as PGM prices, recoverable
ounces, and/or the Company’s operating performance could have a material effect on the Company’s
ability to recover the carrying amounts of its long-lived assets and so could potentially lead to
impairment charges in the future.
CURRENT OPERATIONS
The Company’s operations are located in south central Montana. The Company conducts mining
and milling operations at the Stillwater Mine near Nye, Montana and at the East Boulder Mine near
Big Timber, Montana. Both mines are located on mine claims that follow the apex of the J-M Reef.
The Company operates a smelter and base metal refinery, and recycling facilities at Columbus,
Montana.
14
Table of Contents
Properties and Facilities — February 2010
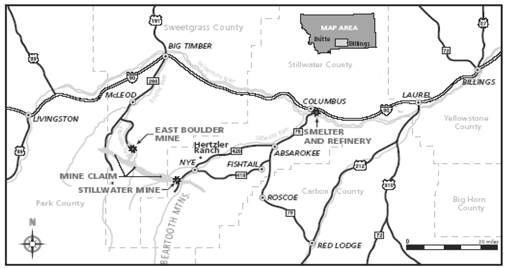
The Company’s corporate headquarters are located in Columbus, Montana near its smelter and
refinery facilities.
The Company’s original long-term development strategy and certain elements of its current
planning and mining practices on the J-M Reef ore deposit were founded upon initial feasibility and
engineering studies conducted in the 1980’s. Initial mine designs and practices were established
in response to available technologies and the particular characteristics and challenges of the J-M
Reef ore deposit. The Company’s current development plans, mining methods and ore extraction
schedules are designed to provide systematic access to and development of the ore deposit within
the framework of current and forecast economic, regulatory and technological considerations as well
as the specific characteristics of the J-M Reef ore deposit. Some of the challenges inherent in
the development of the J-M Reef include:
| • | Surface access limitations (property ownership and environmental sensitivity); |
| • | Topographic and climatic extremes involving rugged mountainous terrain and substantial elevation differences; |
| • | Specific configuration of the mineralized zone (narrow — average width 5 feet, depth — up to 1.5 miles of vertical extent, and long — approximately 28 miles in length), dipping downward at an angle varying from near vertical to 38 degrees; |
| • | A deposit which extends both laterally and to depth from available mine openings, with travel distances underground from portal to working face of up to six miles; and |
| • | Proven and probable ore reserves extending for a lateral distance of approximately 34,000 feet at the Stillwater Mine and approximately 17,000 feet at the East Boulder Mine — a combined extent underground of approximately 9.7 miles, with active underground travelways and ramps on multiple levels totaling more than 100 miles in extent that must be maintained and supported logistically. |
SAFETY
Mining operations are conducted at the Stillwater Mine and at the East Boulder Mine and
involve the use of heavy machinery and drilling and blasting in confined spaces. The pursuit of
safety excellence at the Company continues with the utilization since 2001 of the Company’s “G.E.T.
(Guide, Educate and Train) Safe” safety and health management systems. Efforts are focused on
accident prevention, seeking safer methods of mining and increased employee awareness and training.
Areas of specific focus include enhanced work place examinations, safety standards implementation
and compliance, accident/incident investigations, near miss reporting and use of loss control
representatives who are part of the mining workforce. Employee-led focus teams have been
successful in proactively solving many safety related challenges. The Company continues to use
focus teams to address specific safety and health related issues. One of these areas in particular
has been in the area of compliance with the Mine Safety and Health Administration (MSHA) diesel
particulate matter (DPM) standards. At year end, the Company believes all underground operations
are in compliance with these stringent standards through the use of; blended bio-diesel fuels, post
exhaust treatments, power train advances and high secondary ventilation standards.
15
Table of Contents
During 2009, the overall Company reportable accident incidence rate increased to 4.1 verses
3.3 at the end of 2008 while the severity rate remained essentially unchanged. The Company
believes this increase is related to an increased effort around near miss and minor incident
reporting, and thereby, important for fully understanding the source of injuries to the Company’s
employees. While up somewhat from 2008, the 2009 results equate to a 67% reduction in incidence
rates for Company employees and contractors since the inception of the “G.E.T. Safe” safety
management systems in 2001. One area of notable improvement was the East Boulder Operations where
their total incident rate dropped by over 61% to a 1.8 total reportable incident rate for the
entire mine site. The metallurgical complex in Columbus, Montana, continued to maintain a low
incidence rate while being recognized by the Montana Department of Labor and Occupational Safety
and Health Administration (OSHA) as a leader in workplace safety. In May of 2009, the Company’s
base metal refinery in Columbus, Montana was recognized for thirteen years of operation without a
lost-time accident; this accident-free record subsequently has continued through the end of 2009.
The analytical laboratory achieved eight years of operation without a lost-time accident during
2009.
The smelter, base metal refinery and laboratory continue to participate in and support the
Montana Department of Labor’s Safety and Health Achievement Recognition Program (SHARP). They have
all received SHARP recognition numerous times. The smelter received SHARP recognition in December
of 2008. The base metal refinery and laboratory both applied for and received SHARP recognition in
2009.
The SHARP program recognizes employers who have demonstrated exemplary achievements in
workplace safety and health. By meeting the SHARP inspection requirements, these facilities may be
exempt from general OSHA inspections for one year. During 2009, employee participation and
involvement was further enhanced through the continued implementation of internal safety auditing
processes.
EMPLOYEES
The following table indicates the number of Company employees (excluding contractors) in the
respective areas:
| Number of Employees | ||||||||||||
| at December 31, | ||||||||||||
| SITE | 2009 | 2008 | 2007 | |||||||||
Stillwater Mine
|
797 | 869 | 845 | |||||||||
East Boulder Mine
|
265 | 261 | 551 | |||||||||
Smelter and Refinery Complex
|
158 | 169 | 161 | |||||||||
Administrative Support
|
53 | 65 | 68 | |||||||||
Total
|
1,273 | 1,364 | 1,625 | |||||||||
In response to sharply lower market prices for the Company’s principal products,
palladium and platinum, during the fourth quarter of 2008 the Company issued a notice at the East
Boulder Mine under the WARN Act and restructured its workforce company-wide. Some of the miners at
the East Boulder Mine were transferred to the Stillwater Mine to bolster operations there,
replacing contractors and provisional employees. Staff and support personnel at all Company
locations also were reduced. As part of the same effort, in early January 2009 the Company
consolidated its corporate functions in Columbus, Montana, and closed the headquarters office in
Billings, Montana.
All of the Company’s hourly employees at the Stillwater Mine, the East Boulder Mine, the
smelter and the base metal refinery are represented by the United Steelworkers of America (USW).
The Company is party to a four-year labor agreement expiring on July 1, 2011, that covers
substantially all hourly workers at the Stillwater Mine, the smelter and the base metal refinery
and provides for annual wage increases of approximately 3.5% per annum. Separately, the labor
contract covering all hourly workers at the East Boulder Mine is due to expire on July 1, 2012.
See “Business, Risk Factors and Properties — Risk Factors — Limited Availability of Additional
Mining Personnel and Uncertainty of Labor Relations May Affect the Company’s Ability to Achieve Its
Production Targets.”
STILLWATER MINE
The Company conducts underground mining operations at its wholly-owned Stillwater Mine, near
Nye, Montana. The Stillwater Mine facility accesses, extracts and processes PGM ores from the
eastern portion of the J-M Reef using
mine openings located in the Stillwater Valley. In addition, the Company owns and maintains
ancillary buildings that contain the concentrator, shop and warehouse, changing facilities,
headframe, hoist house, paste plant, water treatment, storage facilities and office. All surface
structures and tailings management facilities are located within the 2,450 acre Stillwater Mine
Operating Permit area. Ore reserves developed at the Stillwater Mine are controlled by patented
mining
16
Table of Contents
claims either leased or owned outright by the Company. The mine is located approximately 85 miles
southwest of Billings, Montana, and is accessed by a paved road. The mine has adequate water and
power from established sources. See “Business, Risk Factors and Properties — Risk Factors —
Uncertainty of Title to Properties — The Validity of Unpatented Mining Claims is Subject to Title
Risk.”
The Stillwater Mine accesses and has developed a 5.9-mile-long underground segment of the J-M
Reef, between the elevations of 2,000 and 7,300 feet above sea level. Access to the ore at the
Stillwater Mine is accomplished by means of a 1,950-foot vertical shaft and by a system of
horizontal adits and drifts driven parallel to the strike of the J-M Reef at vertical intervals of
between 150 feet and 300 feet. Seven main adits have been driven from surface portals on the west
and east slopes of the Stillwater Valley at various elevations between 5,000 and 5,900 feet above
sea level. Several additional principal levels have been developed below the 5,000-foot level down
to the 3,200-foot elevation, accessed from a vertical shaft and the associated shaft ramp system.
Ore from this region of the mine is hauled by truck and/or rail to the shaft, where it is crushed
and hoisted out of the mine. The Company is continuing to develop a decline system below the
3,200-foot elevation to access and develop deeper areas in the central part of the mine below those
currently serviced by the existing shaft. At the end of 2009, this decline system extended down to
the 2,000 foot level.
The 1,950-foot vertical shaft was constructed between 1994 and 1997 as part of the Company’s
plan to increase output from 1,000 to 2,000 tons of ore per day and was sunk adjacent to the
concentrator (starting at the 5,000-foot elevation) to increase efficiency of the operation. Ore
and any waste rock to be transported to the surface from the off-shaft and deeper areas of the mine
are crushed prior to being hoisted up the shaft. The production shaft and underground crushing
station reduce haulage times and costs, facilitate the handling of ore and waste and improve the
grinding capabilities of the concentrator. Ore from above the 5,000-foot west elevation is hauled
to the surface by rail. Waste material not used for backfilling in underground excavations is
transported to the surface and placed in permitted waste rock disposal sites.
The Stillwater Mine currently uses its 29 footwall lateral drifts and 6 primary ramps and
vertical excavations to provide personnel and equipment access, supply haulage and drainage, intake
and exhaust ventilation systems, muck haulage, backfill plant access, powder storage and/or
emergency egress. The footwall lateral and primary ramp systems will continue to provide support
for production and ongoing development activities. In addition, certain mine levels are required
as an integral component of the ventilation system and serve as required intake and/or exhaust
levels, or as parallel splits to maintain electrical ventilation horsepower balance and to meet
MSHA requirements. MSHA regulations require the Company to designate alternate (secondary)
escapeways from mine workings. These levels, in addition to comprising critical functional
components of the ventilation and escapeway system, serve as permanent mine service and utility
infrastructure for road and rail transportation, dewatering and backfill pumping facilities. They
have been designed and are intended to be used for the life of the mine.
During 2007, the Company began construction of a second major decline ramp from the 3500 level
of the existing shaft with eventual development down to about the 1900-foot elevation. A study
that the Company completed during 2006 determined that the most cost-effective access to these
lower levels would be via electric truck haulage on a dedicated ramp bringing mined material up to
a transfer station on the shaft for hoisting out of the mine. Work on these ramps progressed
during 2009, but future development below the 2000 level will not be needed for several years and
so was deferred as a cash-conserving measure until the development is actually needed. In the
future, the Company expects to install a horizontal rail haulage system on the 2000 level to
transport ore and waste material from the deeper mining faces to the electric truck ramps.
Prior to 1994, almost all of the Company’s mining activities utilized captive cut-and-fill
stoping methods. This is a manpower-intensive mining method that extracts the ore body in eight to
ten foot high horizontal cuts within the reef, accessed from vertical raises and mined with
conventional jackleg drills and slushers. The open space created by the extraction of each cut is
backfilled with waste rock and coarse concentrator tailings and becomes the floor for the next
level of mining as the process moves upward. Commencing in 1994, the Company introduced two
mechanized mining methods: ramp-and-fill and sub-level stoping. Ramp-and-fill is a mining method
in which a series of horizontal cuts are extracted from the ore body using mobile equipment.
Access to the ore body is from ramps driven within or adjacent to the ore body allowing the use of
hydraulic drills and load-haul-dump equipment. Sub-level stoping is a mining method in which
blocks of the reef approximately 50 feet high and up to 75 feet in length are extracted in 30-foot
intervals utilizing mobile long-hole drills and remote control rubber tired load-haul-dump
equipment. The reef is mined in a retreat sequence and mined out areas are filled with development
waste or sand backfill as appropriate. Traditionally, captive cut-and-fill has been viewed as
being more selective in nature than either ramp-and-fill or sub-level stoping, but it also requires
miners with special skills and is generally less productive. Other factors considered in
determining the most
17
Table of Contents
appropriate mining method for each area include the amount of ancillary development required
as well as the ore grade and ground conditions expected. The Company determines the appropriate
mining method to be used on a stope-by-stope basis utilizing an engineering and economic analysis.
The Company processes ore from the Stillwater Mine through a surface concentrator facility
(mill) adjacent to the Stillwater Mine shaft. The mill has a permitted design capacity of 3,000
tons per day. During 2009, an average of 1,992 tons of ore and 137 tons of sub-grade material were
processed through the mill per calendar day. In addition, on average the mill processed 111 tons
per calendar day of smelter slag. Crushed ore is fed into the concentrator, mixed with water and
ground to slurry in the concentrator’s mill circuits to liberate the PGM-bearing sulfide minerals
from the rock matrix. Various reagents are added to the slurry, which then is agitated in a froth
flotation circuit to separate the valuable sulfides from the waste rock. In this circuit, the
sulfide minerals are successively floated, recycled, reground and refloated to produce a
concentrate suitable for further processing. The flotation concentrate, which represents
approximately 1.5% of the original ore weight, is filtered, placed in large bins and then
transported by truck 46 miles to the Company’s metallurgical complex in Columbus, Montana. In
2009, 52% of the tailings material from the mill was returned to the mine and used as fill material
to provide support for additional mining activities. The balance was placed in tailings
containment areas on the surface. No additional steps are necessary to treat any tailings placed
back into the mine or into the impoundments, as they are environmentally inert. Tailings are
disposed of into the impoundment areas pursuant to the Company’s operating permits. Mill recovery
of PGMs is historically about 92%. During 2008, failure of a critical drive gear on part of the
fine grinding circuit caused recoveries to temporarily drop down to the 91% range.
In 1998, the Company received an amendment to its existing operating permit providing for the
construction of a lined surface tailings impoundment that would serve the Stillwater Mine for
approximately the next 30 years. This facility, located about eight miles from the mine and
generally referred to as the Hertzler impoundment, was placed into operation in late 2000. See
“Business, Risk Factors and Properties — Current Operations — Regulatory and Environmental
Matters — Permitting and Reclamation”.
During 2009, the Stillwater Mine produced 393,800 ounces of palladium and platinum, 12.7%
higher than the 349,400 ounces produced in 2008. This improvement in production was attributable
in part to the additional miners transferred to the Stillwater Mine from the East Boulder Mine at
the end of 2008, along with somewhat higher ore grades in 2009 and improved productivities. The
Stillwater Mine’s total cash costs (a non-GAAP measure) averaged $344 per ounce in 2009 compared to
$383 per ounce in 2008. These total cash costs are net of recycling and by-product sales credits
— without the benefit of these credits, Stillwater Mine’s total cash costs would have averaged
$397 per ounce in 2009 and $516 per ounce in 2008. Analysis of this 22.9% improvement indicates
about half was attributable to lower contractor and materials costs in 2009 and most of the
remainder to the increased production from improved mining productivities. See “Selected Financial
and Operating Data” for further discussion of non-GAAP measures.
EAST BOULDER MINE
The East Boulder Mine is located in Sweet Grass County, Montana, approximately 32 miles
southeast of the town of Big Timber and is accessed by a public road. The East Boulder Mine is
fully permitted independently of the Stillwater Mine and comprises a second distinct mining
operation accessing the western portion of the J-M Reef. The mine consists of underground mine
development and surface support facilities, including a concentrator, shop and warehouse, changing
facilities, storage facilities, office and tailings management facility. All mine facilities are
wholly owned and operated by the Company. Surface facilities for the East Boulder Mine are
situated on unpatented mill site claims maintained on federal lands located within the Gallatin
National Forest and administered by the U.S. Forest Service. All surface facilities, including the
tailings management complex, are located within a 977-acre operating permit area. Proven and
probable ore reserves for the mine are controlled by patented mining claims owned by the Company.
Development of the East Boulder Mine began in 1998, and it commenced commercial production
effective January 1, 2002.
From the surface facilities at East Boulder, the J-M reef is accessed by two 18,500-foot long,
15-foot diameter horizontal tunnels driven into the mountain. These tunnels are equipped with rail
haulage and intersect the ore body at an elevation 6,450 feet above sea level. Within the mine,
the ore body currently is developed from seven levels of horizontal footwall lateral drifts driven
parallel to the J-M Reef totaling approximately 37,500 feet in length, and from four primary ramps
totaling approximately 16,815 feet of development. The ore body is accessed vertically by ramp
systems tying together the footwall laterals and driven approximately every 2,500 feet along the
length of the deposit. During 2009, active mining areas were consolidated into five production
zones including two areas below the primary 6,450 haulage level.
18
Table of Contents
The mined ore is transported horizontally out of the East Boulder Mine by rail haulage to the
mine portal, where it is processed through the East Boulder concentrator facility, which has a
permitted mill capacity of 2,000 tons per day. Concentrates produced in the mill are transported
approximately 75 miles to the Company’s metallurgical complex in Columbus, Montana.
In 2009, approximately 48% of the East Boulder mine tailings material was returned to the mine
and used for backfill in mined out voids to provide a foundation upon which additional mining
activities can occur. The balance was placed in surface tailings containment areas. In 2008,
approximately 57% of the mine tailings were returned to the mine; sandfill activity was reduced
significantly in the 2009 mine plan. No additional steps are necessary to treat any tailings
placed back into the mine or into the impoundments, as they are environmentally inert and tailings
placed into the impoundment areas are disposed of pursuant to the Company’s operating permits. The
current impoundment area has an estimated life of approximately 20 years at the original planned
production and processing rate of 2,000 tons per day. Mill recovery of the PGMs contained in the
ore was about 89% in 2009 and 90% in 2008 and 2007.
In late 2008, as PGM prices declined, East Boulder Mine’s operating and cash margins turned
sharply negative, and mining operations there were suspended while the Company considered its
options. After review, only five active mining areas were brought back into service, each staffed
by a mining team who were given responsibility to bring cost performance in line with PGM prices.
In conjunction with the reorganization, the company-wide workforce was reduced by 218 employees and
32 contractors. In total, staffing at the East Boulder Mine declined from 526 employees at the end
of November 2008 to 261 employees at year end 2008 (excluding contractors). Many of the remaining
East Boulder miners accepted positions at the Stillwater Mine, which had been short of skilled
miners in some areas.
Along with this reorganization, the mine plan at the East Boulder Mine was changed. Mine
development was initially scaled back to a single crew, and the mining team in each of the five
active mining areas, were given greater responsibility for supporting their own activities thereby
reducing significantly the amount of support labor required by operations. Overall, this
restructuring has been effective, with the East Boulder Mine production at 136,100 ounces in 2009,
down only 9.0% from the 149,500 ounces produced in 2008 despite the more than 50% reduction in the
mine workforce.
The East Boulder Mine’s total cash costs (a non-GAAP measure) were $407 per ounce in 2009
compared to $456 per ounce in 2008. These total cash costs include the benefit in each period of
recycling and by-product credits — if these credits are excluded, the resulting cash costs would
have been $471 per ounce in 2009 and $607 per ounce in 2008. The lower costs were driven mostly by
reduced labor and materials costs, coupled with a strong improvement in mining productivities.
See Part II, Item 6 “Selected Financial and Operating Data” for further discussion of non-GAAP
measures.
EXPLORATION AND DEVELOPMENT
The J-M Reef has been explored from the surface along its entire 28-mile strike length by
surface sampling and drilling. Surface exploration drilling consists of an array of over 900 drill
holes with a maximum horizontal spacing between holes of 1,000 feet. Exploration activities
historically also included driving and then drilling from two exploratory underground adits not
currently in active use, the West Fork Adit and the Frog Pond Adit. Comprehensive evaluation of
PGM mineralization encountered in the J-M Reef has allowed delineation of indicated ore reserves
adjacent to the Stillwater and East Boulder Mines and confirmation of the existence of mineralized
material over much of the remaining strike length. Exploration to date has defined sufficient
probable ore reserves to sustain mining for a number of years in the future. It is the Company’s
practice to systematically convert its established probable ore reserves to the proven ore category
as mine development progresses by performing definition drilling and evaluation coincident with
planned advances of underground development.
A key element of the Company’s development activities in the Stillwater Complex consists of
ongoing efforts to convert its established probable ore reserves into proven ore reserves by
extending the lateral and vertical development of the Stillwater and East Boulder Mines. These
ongoing activities involve constructing and extending mine development workings to access
established ore reserves and continuously advancing definition drilling, engineering and mine plans
to replace depleted ore reserves. During 2009, 2008 and 2007, $25.9 million, $55.9 million and
$65.5 million, respectively, were incurred in connection with capitalized mine development and are
included in total capital expenditures. Beginning in 2004 the Company undertook an initiative to
expand its proven ore reserves to equal 40 months of production at full permitted capacity. This
initiative has reached a point where both mines have achieved in excess of 40 months of proven
reserves at current production rates. Consequently, the sharply reduced development spending in
2009 should not impair
19
Table of Contents
the long-term viability of the operations at these production rates. Development spending in
2010 is planned to be about $29.8 million, which should be sufficient at planned production rates
to maintain the current level of operations.
The following table outlines measures that are used by the Company to gauge progress on
resource development activities:
| Location and Development Activity | 2009 | 2008 | 2007 | |||||||||
Stillwater Mine |
||||||||||||
New Primary Development (equivalent feet)(1)
|
12,323 | 25,047 | 26,033 | |||||||||
New Footwall Lateral (equivalent feet)(1)
|
8,430 | 10,836 | 10,987 | |||||||||
New Definition drilling (feet)
|
292,701 | 358,761 | 311,607 | |||||||||
East Boulder Mine |
||||||||||||
New Primary Development (equivalent feet)(1)
|
3,602 | 9,963 | 13,015 | |||||||||
New Footwall Lateral (equivalent feet)(1)
|
1,522 | 4,254 | 6,283 | |||||||||
New Definition drilling (feet)
|
64,448 | 140,944 | 179,845 | |||||||||
| (1) | Based on one linear foot of excavation, 11 feet wide by 12 feet high (cross-section of 132 ft.2). |
METALLURGICAL COMPLEX
Smelter The Company owns a smelter facility and associated real estate located in
Columbus, Montana. The smelter facility consists of two electric furnaces, two top blown rotary
converters (TBRC’s), a matte granulator and gas handling and solution regeneration systems. The
smelter’s capacity is approximately 120 tons of total feed per day.
During 2009, the Company completed construction of the second smelter furnace at the Columbus
facility. The new furnace is intended to accommodate forecasted levels of future processing,
mitigate any potential operational risk (virtually all of the Company’s metal production is
dependent on the availability of the smelter facility), and allow the Company to continue
processing during periodic scheduled maintenance shutdowns. Capital expenditures in 2009 included
about $6.5 million toward completion of the second electric furnace which in total cost $21.4
million and was under the projected cost by 15%.
Concentrates from the mine sites are transported to the smelter, dried, and fed into an
electric furnace, commingled with spent catalyst materials collected by the Company’s recycling
business segment. The combined feed is melted in the furnace, where the lighter silica-rich slag
separates out into a distinct layer that floats on the heavier nickel-copper PGM-rich matte. The
matte is tapped from the furnace periodically and granulated. This granulated furnace matte is
then re-melted and processed in a TBRC, which extracts iron from the converter matte. The
converter matte is poured from the TBRC, granulated and transferred to the base metals refinery for
further processing. The granulated converter matte, approximately 6% of the original smelter feed
by weight, consists principally of copper and nickel sulfides containing about 1.5% PGMs. The slag
is separately tapped from the furnace, cooled and returned to the mine for reprocessing.
The gases released from the smelting operations are routed through a gas/liquid scrubbing
system, which removes approximately 99.8% of the contained sulfur dioxide. Spent scrubbing
solution is treated in a process that converts the sulfur dioxide into gypsum, or calcium sulfate,
and regenerates clean scrubbing solution. The gypsum is sold for use as a soil amendment by
farmers and as a water treatment additive in the coal bed methane industry.
Base Metal Refinery The Company’s base metal refinery is located on property the
Company owns adjacent to the smelter in Columbus, Montana.
The base metal refinery utilizes the patented Sherritt Process, whereby a sulfuric acid
solution dissolves the nickel, copper, cobalt and residual iron in the converter matte. These
metals are separated from the PGM-bearing converter matte and the copper and nickel ultimately are
marketed as by-products. Iron is precipitated from an iron-copper-nickel-cobalt solution and is
returned to the smelter to be processed and removed in the slag. A nickel crystallizer circuit
produces a crystalline nickel sulfate by-product containing minor amounts of cobalt, which is
marketed under sales contracts with various companies. A copper electrowinning circuit removes
copper from solution as cathode copper that
is marketed to copper refiners for upgrading to commercial grade material. The removal of
these metals upgrades the PGM fraction of the converter matte product substantially from about 1.5%
PGMs to approximately 37% PGMs.
20
Table of Contents
The base metal refinery produces a palladium, platinum and rhodium-rich filter cake, which
also contains minor amounts of gold and silver. This filter cake is shipped to third-party
precious metal refineries in New Jersey and California under tolling agreements that provide the
Company with returns of finished metal. The palladium and platinum metals are returned to the
Company’s account as 99.95% purity sponge; rhodium, gold and silver are also returned to the
Company’s account. The refined metal is then available for delivery to the Company’s customers.
The Company pays its refiners a per-ounce refining charge for the toll processing of the refined
filter cake, and they also retain a small percentage of the contained metals.
PGM RECYCLING
The Company regularly sources spent catalytic converter materials containing PGM metals from
third-party suppliers and processes them through its metallurgical complex. Such materials may
either be purchased outright or may be processed and returned to the supplier for a tolling fee.
The spent catalytic material is collected by the third party suppliers, primarily from automobile
repair shops and automobile yards that disassemble old cars for the recycling of their parts. The
Company also processes spent PGM catalysts from petroleum refineries and other sources, normally on
a tolling basis.
Upon receipt of the PGM materials for recycling, they are crushed and sampled prior to being
commingled with mine concentrates for smelting in the electric furnace. Nickel and copper sulfides
which occur naturally in the mine concentrates act as a metallurgical collector to facilitate the
chemical extraction of the PGMs from the recycled material.
In acquiring recycled automotive catalysts, the Company sometimes advances funds to its
suppliers in order to facilitate procurement efforts. During 2009, the Company modified its
recycling business model to narrow the amount of advances outstanding to such suppliers while at
the same time continuing to support and grow the recycling segment. Total outstanding procurement
advances to recycling suppliers totaled $3.6 million at December 31, 2009. In the current business
environment, the Company has generally limited working capital advances to new suppliers for
material that has been procured and awaiting transit or physically in transit to the Company’s
processing facilities.
Recycled ounces sold in 2009 decreased to 102,000 ounces compared to 275,000 ounces in 2008.
In addition to purchased material, the Company processed 128,000 ounces of PGMs on a tolling basis
in 2009, up from 126,000 tolled ounces in 2008. In total, recycled volumes fed to the smelter
decreased to 251,000 ounces of PGMs in 2009, down 37% from 398,100 ounces in 2008. The decrease in
volumes came early in 2009 following the steep drop in PGM prices during the latter half of 2008.
As the year 2009 progressed, and PGM prices increased, volumes began to steadily recover.
The Company records revenue and costs of metals sold for the processing of these recycled
materials. Revenues from recycling declined substantially to $81.8 million in 2009, from $475.4
million and $326.4 million in 2008 and 2007, respectively, the result of much lower PGM prices and
reduced availability of recycling material in 2009. Costs of metals sold were $76.5 million,
$449.5 million and $306.8 million for 2009, 2008 and 2007, respectively — most of these costs are
associated with purchasing the recycled material for processing. Earnings from the processing of
recycled catalysts in 2009, 2008 and 2007, including financing charges to customers, were $5.9
million, $6.7 million and $26.2 million, respectively. Following the steep drop in PGM prices and
doubts as to collectability under various commitments with suppliers, the 2009 and 2008 recycling
results included write-downs of $0.5 million and $26.0 million, respectively, of advances to
suppliers in its recycling business.
Because of the significant quantities of recycling material typically processed through its
smelter and base metal refinery and the substantial time required for processing, the Company
usually carries large inventories of recycling material in process. Working capital associated
with these recycling activities as inventories and advances was $28.6 million and $22.1 million at
December 31, 2009 and 2008, respectively.
OTHER PROPERTIES
The Company owns a warehouse facility in Columbus, Montana and leases office space in Columbus
and Billings, Montana. The Company’s corporate office was located in the office space leased in
Billings, Montana until early 2009, at which time the corporate office was relocated to Columbus,
Montana. The annual expense for office leases totals $0.3 million per year. The Company is still
party to the office lease in Billings, Montana, periodically uses it for business meetings, and to
date has not been able to sublease the facility on acceptable terms. The Company also owns parcels
of
21
Table of Contents
rural land in Stillwater and Sweet Grass Counties, Montana, near its mine sites totaling
approximately 4,367 acres and additional properties in the communities of Columbus and Big Timber,
Montana, which are used as support facilities.
LONG-TERM FINANCING
Convertible Debentures
On March 12, 2008, the Company issued and sold $181.5 million aggregate principal amount of
senior convertible debentures due 2028 (debentures). The debentures pay interest at 1.875% per
annum, payable semi-annually on March 15 and September 15 of each year, commencing September 15,
2008. The debentures will mature on March 15, 2028, subject to earlier repurchase or conversion.
Each $1,000 principal amount of debentures is initially convertible, at the option of the holders,
into approximately 42.5351 shares of the Company’s common stock, at any time prior to the maturity
date. The conversion rate is subject to certain adjustments, but will not be adjusted for accrued
interest or any unpaid interest. The conversion rate initially represents a conversion price of
$23.51 per share. Holders of the debentures may require the Company to repurchase all or a portion
of their debentures on March 15, 2013, March 15, 2018 and March 15, 2023, or upon the occurrence of
certain events including a change in control. The Company may redeem the debentures for cash
beginning on or after March 22, 2013.
The debentures were sold to an “accredited investor” within the meaning of Rule 501 under the
Securities Act of 1933, as amended (the “Securities Act”), in reliance upon the private placement
exemption afforded by Section 4(2) of the Securities Act. The initial investor offered and resold
the debentures to “qualified institutional buyers” under Rule 144A of the Securities Act. An
affiliate of MMC Norilsk Nickel, with the approval of the Company’s public directors, purchased $80
million of the debentures, thereby maintaining its majority ownership position in the Company.
In connection with the issuance of the debentures, the Company agreed to file and maintain an
effective shelf registration statement with the Securities and Exchange Commission (SEC) for the
resale of the debentures and the common stock issuable upon conversion of the debentures until the
earlier of (1) the date the debentures or the common stock issuable upon conversion of the
debentures is eligible to be sold to the public pursuant to Rule 144 of the Securities Act or (2)
the date on which there are no outstanding registrable securities. Except for the debentures held
by Company affiliates, the minimum holding period prescribed in Rule 144 has now elapsed, and
management believes the debentures are eligible to be sold to the public in the secondary market.
During the fourth quarter of 2009, the Company filed a $450 million shelf registration
statement. The registration became effective on December 8, 2009, and permits the Company to issue
any of various public debt or equity instruments for financing purposes so long as the registration
statement remains effective. The Company has no immediate plans to issue securities under the
shelf registration, but management believes that the shelf may facilitate access to additional
liquidity in the future. However, there is no assurance that debt or equity capital would be
available to the Company in the public markets should the Company determine to issue securities
under the shelf registration.
In connection with the issuance of the debentures, the Company incurred $5.1 million of
issuance costs, which primarily consisted of investment banking fees, legal and other professional
fees. These costs are classified within other noncurrent assets and are being amortized as
interest expense using the effective interest method over the term from issuance through the first
date that the holders can require repurchase of the debentures, which is March 15, 2013.
Amortization expense related to the issuance costs of the debentures was $1.0 million and $0.8
million for 2009 and 2008, respectively, and the interest expense on the debentures was $3.3
million and $2.7 million for 2009 and 2008, respectively. The Company made cash payments of $3.4
million and $1.7 million for interest on the debentures during 2009 and 2008, respectively.
In October 2009, the Company undertook the exchange of $15 million face amount of the
convertible debentures for 1.84 million shares of the Company’s common stock. The debentures so
acquired have been retired, leaving $166.5 million face value of the debentures outstanding at
December 31, 2009. None of the Company’s convertible debentures held by MMC Norilsk Nickel were
involved in the exchange transaction. Because the number of shares issued in this transaction
exceeded the 42.5351 shares per $1,000 of face value specified in the bond indenture, accounting
principles required that the Company expense the value of the excess shares as an “inducement
loss.” Consequently, the Company recorded a loss on the exchange transaction of $8.1 million
during the fourth quarter of 2009.
22
Table of Contents
PGM SALES AND HEDGING
Mine Production
Palladium, platinum, rhodium, gold and silver are sold to a number of consumers and dealers
with whom the Company has established trading relationships. Refined platinum group metals (PGMs)
of 99.95% purity (rhodium of 99.9%) in sponge-form are transferred upon sale from the Company’s
account at third-party refineries to the account of the purchaser. By-product metals are normally
sold at market prices to customers, brokers or outside refiners. Copper and nickel by-products, however, are produced at less than commercial grade, so prices for
these metals typically reflect a quality discount. By-product sales are included in revenues from
mine production. During 2009, 2008 and 2007, total by-product (copper, nickel, gold, silver and
mined rhodium) sales were $23.6 million, $36.8 million and $53.8 million, respectively.
The Company has a sales agreement with Ford Motor Company covering a portion of production
from the mines that contains guaranteed floor and ceiling prices for metal delivered. Metal sales
under the agreement, when not affected by the guaranteed floor or ceiling prices, are priced at a
slight discount to market. Under this sales agreement, the Company currently has committed 80% of
its palladium production and 70% of its platinum production from mining through 2010. None of the
Company’s palladium or platinum production after 2010 is currently committed. At sufficiently low
PGM price levels, the absence of the pricing floors after 2010 could have a material adverse effect
on the Company. The Company restructured its operations in order to mitigate this exposure and has
reduced its operating costs significantly, but the loss of the Ford agreement will increase the
Company’s financial exposure to low PGM prices.
Metal delivery commitments under the sales agreement generally fluctuate based upon fixed
percentages of actual mine production. The agreement also contains termination provisions that
allow the purchaser to terminate in the event the Company breaches certain provisions of the
agreement and the Company fails to cure the breach within periods ranging from 10 to 30 days of
notice by the purchaser. The sales agreement qualifies for the normal sales exception, and
consequently, sales under the agreement are not subject to hedge accounting because they require
physical delivery and do not settle net. The floors and ceilings embedded within the sales
agreement have economic characteristics and risks clearly and closely related to the economic
characteristics and risks of the host agreement and so are treated as part of the host agreement,
not as separate derivative instruments.
The Company has historically entered into derivative contracts and hedging arrangements from
time to time to manage the effect on the Company’s cash flow of fluctuation in the price of
palladium and platinum from mine production. Hedging activities consist of fixed forwards for
future delivery of specific quantities of PGMs at specific prices, and financially settled forwards
that provide for net cash settlement of forward sales. Gains or losses can occur as a result of
hedging strategies if the derivative contracts ultimately settle at prices above or below market.
The Company settled its last remaining financially settled forward agreements covering future
anticipated platinum sales out of mine production during the second quarter of 2008. Consequently,
after June 30, 2008, the Company was no longer party to any further hedges on its mined platinum
production. The Company recorded an offset to revenue in 2008 of $12.8 million representing the
loss on its platinum hedges during that year. See Note 6 “Derivative Instruments” to the Company’s
2009 audited financial statements for further information.
PGM Recycling
The Company has capacity available in its smelter and base metal refinery and purchases
catalyst materials from third parties for recycling in those facilities to recover PGMs. The
Company has entered into sourcing arrangements for catalyst material with several suppliers. Under
these sourcing arrangements, the Company may from time to time advance cash to suppliers for
purchase and collection of these spent catalyst materials. These advances are reflected as
advances on inventory purchases and included in other assets on the Company’s balance sheet until
such time as the material has been physically received and title has transferred to the Company.
Following the steep drop in PGM prices and doubts as to collectability under various commitments
with suppliers, the 2009 and 2008 recycling results included write-downs of $0.5 million and $26.0
million, respectively, of advances to suppliers in its recycling business. See “Business, Risk
Factors and Properties — Risk Factors — Reliance on Third Parties for Sourcing of Recycling
Materials and the Concentration of Recycling Sources Creates the Potential for Losses.”
The Company regularly enters into fixed forward sales related to recycling of catalysts.
These fixed forward sales transactions in the recycling business have not been accounted for as
derivatives because they qualify as “normal purchases/normal sales” under generally accepted
accounting principles. Metals from processing recycled materials are
23
Table of Contents
generally sold forward at the time the material is purchased and they are delivered against
the forward sales contracts when the ounces are recovered.
Between the time the General Motors agreement was amended and renegotiated in August of 2007
and the subsequent rejection of the agreement through the bankruptcy court in July 2009, the
Company generally elected to fulfill a portion of its delivery commitments under the amended
agreement out of recycled palladium. Consequently, a portion of the Company’s palladium from
recycling from time to time was priced using financially settled forward sales, which allowed the
Company to price the metal forward. Because these financially settled forward sales inherently
settled net, they were not eligible for the normal sales exemption. The Company elected not to
designate these financially settled forward sales as hedges. Changes in fair value of these
financially settled forwards at the end of each accounting period were reflected in recycling
revenue. The corresponding net realized loss on these derivatives in 2009 and 2008 was $0.2
million in each year. There were no financially settled forward contracts outstanding at December
31, 2009.
All of the Company’s recycling forward sales transactions open at December 31, 2009, will
settle at various periods through May 2010. See Note 6 “Derivative Instruments” to the Company’s
2009 audited financial statements for more information. The Company has credit agreements with its
major trading partners that provide for margin deposits in the event that forward prices for metals
exceed the Company’s hedged prices by a predetermined margin limit. No margin deposits were
required or outstanding as of December 31, 2009 or 2008.
Other
The Company makes other open market purchases of PGMs from time to time for resale to third
parties. The Company recognized revenue of $5.8 million and $20.0 million on ounces purchased in
the open market and re-sold for the years ended December 31, 2009 and 2008, respectively. These
purchases for resale were essentially breakeven transactions undertaken for the convenience of
certain customers.
TITLE AND ROYALTIES
The Company holds 995 patented and unpatented lode or mill site claims covering approximately
16,000 acres along the apex of the J-M Reef mineral zone and on adjacent federal lands utilized for
the Company’s operations facilities. The Company believes that approximately 130 of these claims
cover 100% of the known apex of the J-M Reef. The Company’s remaining unpatented claims either
adjoin the apex of the J-M Reef or secure sites for surface operations. Prior to the federal
moratorium on processing new applications for mining claim patents, the Company had leasehold
control on one patented claim under the Mouat Agreement, had been granted patents on 34 of its own
claims (a combined total of 735 acres), and had 33 patent applications pending on 135 additional
mining claims covering an area of 2,249 acres. The applications included claims owned directly by
the Company or held by the Company in leasehold. During the fourth quarter of 2001, 31 new patents
were issued to the Company for 126 mining claims covering 2,126 acres. At year-end 2001, patents
had been issued for all submitted applications involving the claims owned directly by the Company.
In a decision dated April 30, 2002, the Montana State Office of the Bureau of Land Management (BLM)
rejected two mineral patent applications submitted prior to July 13, 1993 covering 123 acres in
nine mining claims held by the Company in leasehold under the Mouat Agreement. The Company joined
with the Mouat interests in appealing the BLM decision to the U.S. Department of the Interior Board
of Land Appeals (IBLA). On April 25, 2005, Administrative Judges for the IBLA ruled in favor of
the Mouat Interests’ and Company’s appeal and remanded the cases to the BLM with instruction to
issue the pending patents. As of the date of this filing, the Certificates of Patent had not yet
been issued; however, the Company considers the matter resolved and expects the patents to be
granted in due course. The Company presently maintains 825 active unpatented mining and mill site
claims. Unpatented mining claims may be located on lands open to mineral appropriation and are
generally considered to be subject to greater title risk than other real property interests because
the validity of unpatented mining claims is often uncertain and such claims are more commonly
subject to challenges of third parties, regulatory or statutory changes, or contests by the federal
government. The validity of an unpatented mining claim or mill site claim, in terms of
establishing and maintaining possessory rights, depends on strict compliance with a complex body of
federal and state statutory and decision law regarding the location, qualifying discovery of
valuable minerals, occupancy and beneficial use by the claimant.
Of the Company’s 995 controlled claims, 868 are subject to royalties, including 840 subject to
a 5% net smelter royalty payable to Franco Nevada U.S. Corporation (formerly Newmont Capital
Limited), 143 subject to a 0.35% net smelter royalty payable to the Mouat family, and 115 subject
to both royalties. During 2009, 2008 and 2007, the Company incurred royalty expenses of $10.6
million, $14.6 million and $15.7 million, respectively. At December 31, 2009, 100% of the
Company’s proven and probable ore reserves were secured by either its control of 161 patented
mining
24
Table of Contents
claims or the nine current first-half certified claims pending final action under the April
2005 appeal ruling by the IBLA. Processing facilities at the East Boulder Mine are situated on 127
validated unpatented mill site claims.
REGULATORY AND ENVIRONMENTAL MATTERS
General The Company’s business is subject to extensive federal, state and local
government controls and regulations, including regulation of mining and exploration which could
involve the discharge of materials and contaminants into the environment, disturbance of land,
reclamation of disturbed lands, associated potential impacts to threatened or endangered species
and other environmental concerns. In particular, statutes including, but not limited to, the Clean
Air Act, the Clean Water Act, the Solid Waste Disposal Act, the Emergency Planning and Community
Right-to-Know Act, the Endangered Species Act and the National Environmental Policy Act, impose
permit requirements, effluent standards, air emission standards, waste handling and disposal
restrictions and other design and operational requirements, as well as record keeping and reporting
requirements, upon various aspects of mineral exploration, extraction and processing. In addition,
the Company’s existing mining operations may become subject to additional environmental control and
mitigation requirements if applicable federal, state and local laws and regulations governing
environmental protection, land use and species protection are amended or become more stringent in
the future. The Company is aware that federal regulation under the Solid Waste Disposal Act
governing the manner in which secondary materials and by-products of mineral extraction and
beneficiation are handled, stored and reclaimed or reused are subject to frequency review by the
agencies which could affect the Company’s facility design, operations, and permitting requirements.
See “Business, Risk Factors and Properties — Risk Factors — Changes to Regulations and
Compliance with Regulations Could Affect Production, Increase Costs and Cause Delays.”
The Stillwater Mine and the East Boulder Mine are located on the northern edge of the
Absaroka-Beartooth Wilderness Area, about 30 miles north of Yellowstone National Park. Due to the
proximity of the Company’s operations to Yellowstone National Park and a wilderness area, the
Company’s operations are subject to stringent environmental controls that may adversely impact the
Company’s operations. For example, increasingly stringent requirements may be adopted under the
Clean Water Act, Clean Air Act or Endangered Species Act which could require installation of
environmental controls not required of competitors located overseas. See “Business, Risk Factors
and Properties — Risk Factors — Changes to Regulations and Compliance with Regulations Could
Affect Production, Increase Costs and Cause Delays.”
The Company’s past and future activities may also cause it to be subject to liabilities under
provisions of the Comprehensive Environmental Response, Compensation and Liability Act of 1980, as
amended (CERCLA), and analogous state law. Such laws impose strict liability on certain categories
of potentially responsible parties including current property owners for releases or threatened
releases of hazardous substances into the environment that result in cleanup and other remediation
costs.
Generally compliance with the above statutes requires the Company to obtain permits issued by
federal, state and local regulatory agencies and to file various reports, monitor performance and
keep records of its operations affecting the environment. Certain permits require periodic renewal
or review of their conditions. The Company cannot predict whether it will be able to renew such
permits or whether material changes in permit conditions will be imposed. Non-renewal of permits
or the imposition of additional conditions could have a material adverse effect on the Company’s
financial condition and results of operations. See “Business, Risk Factors and Properties — Risk
Factors — If the Company is Unable to Obtain Surety Coverage to Collateralize Its Reclamation
Liabilities, Operating Permits May Be Affected.”
For the past several years, the Company has employed various measures in an effort to protect
the health of the Company’s workforce and to comply with much stricter MSHA limits on DPM exposure
for the underground miners. These measures have included using catalytic converters, filters,
enhanced ventilation regimens, modifying certain mining practices underground, and has experimented
with various bio-diesel blends. The new DPM limits were delayed for a time, but ultimately went
into effect on May 20, 2008. Compliance with the revised MSHA DPM standards continues to be a
challenge within the mining industry. However, as a result of its internal efforts to reduce DPM
exposure, recent sampling indicates that the Company has achieved compliance with the new standards
at the East Boulder Mine as well as at the Stillwater Mine. No assurance can be given that any
lack of compliance in the future will not impact the Company.
Nitrogen concentrates in groundwater have been elevated above background levels at both the
Stillwater Mine and the East Boulder Mine as a result of operational activities and discharges
currently authorized under permit. Noncompliance with standards have occurred in some instances
and are being addressed by the Company through action plans approved
25
Table of Contents
by the appropriate federal and state regulatory agencies. In view of its good-faith efforts
to comply and progress to date in implementing remedial and advanced treatment technologies, the
Company does not believe that failure to be in strict compliance will have a material adverse
effect on the Company.
The Company believes that its operations and facilities comply in all material respects with
current federal, state and local permits and regulations, and that it holds all necessary permits
for its operations at the Stillwater and East Boulder Mines and to complete all of its planned
expansion projects. However, compliance with existing and future laws and regulations may require
additional control measures and expenditures, which cannot be estimated at this time. Compliance
requirements for new mines and mills may require substantial additional control measures that could
materially affect permitting and proposed construction schedules for such facilities. Under
certain circumstances, facility construction may be delayed pending regulatory approval. The cost
of complying with future laws and regulations may render currently operating or future properties
less profitable and could adversely affect the level of the Company’s ore reserves and, in the
worst case, render its mining operations uneconomic.
Permitting and Reclamation Operating Permits 00118 and 00149 issued by the Montana
Department of State Lands encompass approximately 2,475 acres at the Stillwater Mine located in
Stillwater County, Montana and 977 acres at the East Boulder Mine located in Sweet Grass County,
Montana. The permits delineate lands that may be subject to surface disturbance. At present,
approximately 437 acres have been disturbed at the Stillwater Mine, and 210 acres have been
disturbed at the East Boulder Mine. The Company employs concurrent reclamation wherever feasible.
Reclamation regulations affecting the Company’s operations are promulgated and enforced by the
Hard Rock Bureau of the Montana Department of Environmental Quality (DEQ). The United States
Forest Service (USFS) may impose additional reclamation requirements during the permitting process.
For regulatory purposes, reclamation does not mean restoring the land to its pre-mining state.
Rather, it means returning the post-mining land to a state which has stability and utility
comparable to pre-mining conditions. Major reclamation requirements include stabilization and
revegetation of disturbed lands, controlling storm water and drainage from portals and waste rock
dumps, removal of roads and structures, treating and the elimination of process solutions,
treatment and the elimination of mine water prior to discharge and visual aesthetics. See
“Management’s Discussion and Analysis of Financial Condition and Results of Operations.”
Permits governing air and water quality are issued to the Company by the Montana DEQ, which
has been delegated such authority by the federal government. Operating permits issued to the
Company by the Montana DEQ and the USFS do not have an expiration date but are subject to periodic
reviews. The reviews evaluate bonding levels, monitor reclamation progress, and assess compliance
with all permit requirements and mitigation measures.
In April 1996, the Company submitted a permit amendment application for the expansion of the
Stillwater Mine. This expansion proposal included siting and construction of a new tailings
impoundment and removal of the 2,000 tons of ore per day production cap. During 1997, as a result
of this application, the Montana DEQ began preparation of an Environmental Impact Statement (EIS)
in order to assess the environmental impacts of the amendment. The Montana DEQ issued the final
EIS in 1998, subsequent to review of draft issuances and a public hearing. In November 1998, the
Montana DEQ and the USFS issued the Record of Decision. There were no material changes from the
original application.
In the first quarter of 1999, an environmental group filed a complaint against the Montana DEQ
challenging the adequacy of the EIS and reclamation provisions developed in connection with the
amendment to the permit. The Company was not named in the complaint. In mid-2000, the Company
signed an agreement with the group and its affiliates (the “Councils”). Under the terms of the
agreement, the Councils withdrew litigation against the Montana DEQ. The Councils also agreed not
to file a protest against the renewal of the Company’s water quality permit at the East Boulder
Mine. For its part, the Company agreed to programs that reduce traffic flows to both the
Stillwater Mine and the East Boulder Mine. In addition, the Company is funding expanded monitoring
programs and the development of a watershed partnership for the Boulder River basin to assist
residents in improving the quality of surface and ground water. In August of 2005, this agreement
was mutually amended to acknowledge the progress made in implementing the agreement and completing
and finalizing many of the agreement requirements. Additionally, future commitments were reviewed
and amended as appropriate in an effort to bring the agreement current with existing environmental
conditions, updated technical data and changes to schedules and monitoring plans resulting from
information gathered during the previous 5-year period. The Company estimates the total cost of
all the environmental programs associated with the implementation of the agreement to be between
$0.2 million and $0.3 million annually.
26
Table of Contents
Included in the Company’s total capital spending in 2009 were environmental capital
expenditures of $1.2 million, primarily related to the ventilation system for the second electric
furnace at the smelter in Columbus, Montana. Comparable environmental capital expenditures in 2008
and 2007 were $1.1 million and $0.8 million, respectively. The Company’s environmental operating
expenses were $2.7 million, $3.6 million and $2.9 million in 2009, 2008 and 2007, respectively.
The Company’s 2010 operating expenditures for environmental compliance (excluding capital
expenditures) are expected to total approximately $3.6 million and will be expensed as incurred.
COMPETITION: PALLADIUM AND PLATINUM MARKET
GENERAL
Palladium and platinum are rare precious metals with unique physical qualities that are used
in diverse industrial applications and in the jewelry industry. The development of a less
expensive alternative alloy or synthetic material with the same characteristics as PGMs for
industrial purposes could reduce demand for the Company’s products and drive down PGM prices.
Although the Company is unaware of any such alloy or material, there can be no assurance that none
will be developed. Jewelry demand is influenced by a variety of external factors, including
fashion trends, metal prices and the general state of the economy. Adverse changes in any of these
factors could negatively affect the Company’s financial performance.
Significant quantities of platinum and palladium are held in inventory by investors, trading
houses and government entities. The number of ounces in each of these inventories is not always
disclosed publicly, nor is it clear under what circumstances these holdings might be brought to
market. For example, in the past, the Russian Federation has held large inventories of palladium
as strategic inventory, selling substantial volumes from time to time without warning into the
market. Some have suggested that these Russian government inventories are nearly depleted. There
is no official disclosure of the size of the Russian inventories or clarity as to plans for future
sales. Also, new exchange-traded funds, or ETFs, have been introduced recently that may enable
more investors to participate in the PGM markets, potentially resulting in more metal being held in
inventory. The overhang from these significant investment holdings of platinum and palladium makes
it more difficult to predict accurately future supply and demand for these metals and may
contribute to added PGM price volatility.
The Company competes with other suppliers of PGMs, some of which are significantly larger than
the Company and have access to greater mineral reserves and financial and commercial resources.
Some significant suppliers produce platinum in greater quantities than palladium and thus currently
enjoy average per ounce revenue greater than the Company. Some significant suppliers of PGMs
produce palladium and platinum as by-products of other production. See “Global Supply” below. New
mines may open over the next several years, increasing supply. Furthermore, the volume of PGMs
recovered through recycling scrap sources, mostly spent automotive and industrial catalysts, is
increasing. There can be no assurance that the Company will be successful in competing with these
existing and emerging PGM producers. See “Business, Risk Factors and Properties — Risk Factors”
and “Management’s Discussion and Analysis of Financial Condition and Results of Operations.”
GLOBAL DEMAND
The unique physical qualities of PGMs include: (1) a high melting point; (2) excellent
conductivity and ductility; (3) a high level of resistance to corrosion; (4) strength and
durability; and (5) strong catalytic properties.
Johnson Matthey reports that demand for palladium (net of recycling volumes) likely decreased
by approximately 3.76% to 6.52 million ounces during 2009. Their Platinum 2009 Interim Review
Report published in November 2009 (Johnson Matthey or the Johnson Matthey report), projected that
2009 palladium demand decreased from 2008 as a result of the general economic downturn,
particularly in automotive demand, although partially offset by stronger investor interest in
palladium. They projected that growth in automotive demand in China would partially offset the
downturn in the U.S. and Western Europe.
The largest application for palladium is in automotive catalytic converters. In 2009, this
industry consumed approximately 2.9 million ounces (net of recycling), or about 45% of the
worldwide palladium demand. (Johnson Matthey estimates that an additional 950,000 palladium ounces
generated from recycling also were consumed in catalytic converters during 2009, down from 1.1
million ounces in 2008.) Overall, net consumption of palladium in catalytic converters is off by
about 12% from 2008. Industrial demand for palladium includes applications in electronics and the
chemical industry; Johnson Matthey indicates year-on-year demand for industrial palladium declined
nearly 7.6% to about
27
Table of Contents
1.3 million ounces. Johnson Matthey estimates that approximately 1.0 million ounces, or about
15% of 2009 palladium demand, was consumed in the production of electronic components for personal
computers, cellular telephones, facsimile machines and other devices. Jewelry demand for 2009 was
projected by Johnson Matthey to increase by about 7.6% over the previous year to about 0.92 million
ounces. The increased jewelry demand reflects Johnson Matthey’s view that recycling of palladium
jewelry in China has now fallen off, so a higher percentage of sales there now represent new
demand. Johnson Matthey also reported that dentistry continues to be a major user of palladium for
gold-based dental alloys, and that dental demand remained about flat at approximately 0.6 million
ounces, or 9.3% of total palladium demand for 2009. According to Johnson Matthey, investment
demand increased sharply in 2009 to an estimated 635,000 ounces, about 9.7% of total 2009 palladium
demand; that compares to investment demand of about 420,000 ounces in 2008, representing about 6.2%
of total 2008 demand.
According to Johnson Matthey, demand for palladium in the next several years is expected to
continue growing, driven primarily by recovery in the automotive sector, stock replenishment and
increasing use of palladium in diesel catalytic converters. Over the past several years, the
pricing disparity between platinum and palladium has driven research into substituting palladium
for platinum in diesel catalytic converters, whereby the palladium content reportedly now can be
increased to as much as 50% of the total PGMs in diesel catalytic converters being produced today.
Jewelry consumption is maturing in China, but interest in palladium continues to grow in other
markets, particularly with the introduction of a palladium hallmark during 2009 in the United
Kingdom. The effect of the introduction in early 2010 of new exchange-traded funds in New York for
platinum and palladium on the demand for these metals remains to be determined.
Johnson Matthey estimates that palladium supplied into the market, including sales out of
Russian government inventories, exceeded demand by about 655,000 ounces in 2009. Prices for
palladium in 2009, based on London Bullion Market Association afternoon postings, ranged from a low
of $179 per ounce on January 15, 2009 to end 2009 at a high of $393 per ounce.
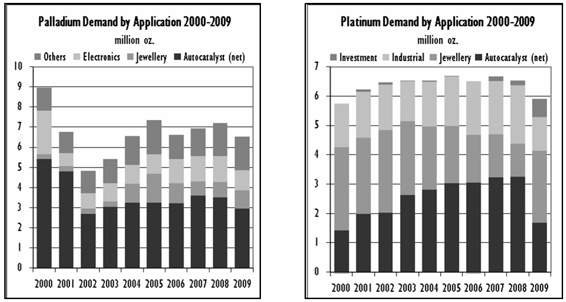
Charts reproduced from the Johnson Matthey Platinum 2009 Interim Review. Permission to
reproduce was neither sought nor obtained.
Johnson Matthey reports that 2009 demand for platinum (net of recycling volumes) probably declined by 4.4% to about 5.9 million ounces in 2009 from 6.2 million ounces in 2008. (Johnson Matthey estimates that platinum supplied from recycling totaled 800,000 ounces in 2009, down from 1.1 million ounces in 2008.) Platinum purchases by the auto catalyst sector (net of recycling volumes)
declined during 2009 by 34.9% to 1.68 million ounces, driven principally by sharply lower demand for diesel-powered automobiles in Europe. Johnson Matthey anticipates that diesel demand will recover in the future as the European economy improves.
28
Table of Contents
Jewelry demand for platinum in 2009 was driven by restocking during 2009, with demand for
platinum in the jewelry sector up year on year by 79.5% to 2.45 million ounces, reflecting the
impact much lower platinum prices in 2009. Industrial uses of platinum include the production of data storage disks, fiberglass, paints,
nitric acid, anti-cancer drugs, fiber optic cables, fertilizers, unleaded and high-octane gasoline
and fuel cells. Johnson Matthey projects that industrial consumption of platinum during 2009
declined by about 35%, reflecting the impact of the worldwide economic downturn during the (year).
In Johnson Matthey’s view, the outlook for platinum demand is dependent on the timing of a
worldwide economic recovery, which should gradually restore some of the automotive and industrial
demand for the metal. The inventory restocking in the jewelry industry during 2009 is unlikely to
be repeated in the immediate future. However, with the arrival of a platinum ETF in the United
States, investment demand could strengthen somewhat during 2010.
Johnson Matthey estimates that platinum supplied to the market in 2009 exceeded demand by
about 0.14 million ounces. The price of platinum during 2009, based on London Bullion Market
Association afternoon postings, ranged from a high of $1,494 per ounce, reached on December 3,
2009, compared to a low of $918 per ounce on January 15, 2009, and closed the year trading at
$1,461 per ounce. See “Business, Risk Factors and Properties – Risk Factors – Users of PGMs May
Reduce Their Consumption and Substitute Other Materials for Palladium and Platinum.”
GLOBAL SUPPLY
On the supply side, Johnson Matthey noted that their tally of 2009 PGM supply includes about
960,000 ounces of palladium transferred out of Russian state inventories during the year into
Switzerland and then subsequently sold. Johnson Matthey acknowledges that, going forward, these
Russian inventory sales constitute a significant uncertainty in projecting annual palladium supply.
Including these state transfers, Johnson Matthey reports that palladium supplied to market in 2009
of 7.175 million ounces declined by just 1.85% from 2008 levels.
The leading global sources of palladium and platinum production are mines located in the
Republic of South Africa and the Russian Federation. The Johnson Matthey report estimates that
South Africa provided approximately 35.3% of the palladium and 78.0% of the platinum sold worldwide
during 2009. The same report also estimates that the Russian Federation, both as a by-product of
nickel production from Norilsk Nickel and from transfers out of government inventories, provided
approximately 49.6% of the palladium and approximately 12.3% of the platinum sold worldwide in 2009
(see charts below). (In preparing these estimates, Johnson Matthey treats PGM recycling volumes
as an offset against demand, rather than as new supply.)
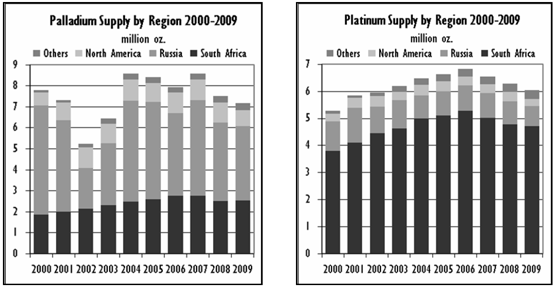
Charts reproduced from the Johnson Matthey Platinum 2009 Interim Review. Permission to
reproduce was neither sought nor obtained.
29
Table of Contents
Supply numbers provided by Johnson Matthey are for metals entering the market and do not
necessarily represent metals produced during the years shown. For palladium this may constitute a
significant year-to-year difference because of unpredictable releases out of the substantial
inventories held by the Russian Federation, as well as those held by the auto companies and
investors. For platinum this inventory effect is less significant, as inventories held by
governments or private institutions have not been as material recently. According to Johnson
Matthey, annual worldwide mine production of palladium for 2009 is estimated at 6.5 million ounces,
down from about 6.6 million ounces in 2008. Annual worldwide production of platinum for 2009 is
estimated at 6.1 million ounces, up slightly from about 5.9 million ounces in 2008, mostly
reflecting production issues during 2008 in South Africa.
Johnson Matthey comments that the outlook for palladium in the future is sensitive to activity
from the Russian state inventories. Their outlook assumes that there will be additional Russian
inventory sales during 2010, which likely would create a surplus of palladium in the markets yet
again. However, they also note that investors seem to be aware of the imbalance between palladium
mine production and demand, and some appear to anticipate supply imbalances over the longer term if
the Russian inventory sales end. They also note that investor holdings of both platinum and
palladium have buoyed the market during 2009, but their effect is less certain going forward.
In addition to mine sources, PGMs are recovered from automotive catalytic converters acquired
from scrap dealers. A growing industry has developed in the collection and recovery of PGMs from
scrap sources, including automotive catalytic converters, electronic and communications equipment
and petroleum catalysts. Volumes were affected by the lower PGM prices during the first half of
2009 but strengthened fairly steadily throughout the year as prices improved. Johnson Matthey
estimates 2009 worldwide recoveries from recycling provided 955,000 million ounces of palladium and
800,000 ounces of platinum, down from 1.12 million ounces each of palladium and platinum in 2008.
PRICES
Stillwater Mining Company’s revenue and earnings depend significantly on world palladium and
platinum market prices. The Company has no direct control over these prices, but is working to
foster PGM demand growth by encouraging new uses for these metals. PGM prices can fluctuate
widely. The Company does have the ability to hedge prices and has contractual floor prices that
tend to mitigate some of the price exposure. See “Management’s Discussion and Analysis of
Financial Condition and Results of Operations — Revenue” and “Factors That May Affect Future
Results and Financial Condition.” The volatility of palladium and platinum prices is illustrated
in the following table of the London Bullion Market Association afternoon postings of annual high,
low and average prices per ounce since 1999. The accompanying charts also demonstrate this
volatility. See “Business, Risk Factors and Properties — Risk Factors — Vulnerability to Metals
Price Volatility — Changes in Supply and Demand Could Reduce Market Prices,” in the following
section.
| PALLADIUM | PLATINUM | |||||||||||||||||||||||
| YEAR | HIGH | LOW | AVERAGE | HIGH | LOW | AVERAGE | ||||||||||||||||||
1999 |
$ | 454 | $ | 285 | $ | 358 | $ | 457 | $ | 342 | $ | 377 | ||||||||||||
2000 |
$ | 970 | $ | 433 | $ | 680 | $ | 622 | $ | 414 | $ | 544 | ||||||||||||
2001 |
$ | 1,090 | $ | 315 | $ | 604 | $ | 640 | $ | 415 | $ | 529 | ||||||||||||
2002 |
$ | 435 | $ | 222 | $ | 338 | $ | 607 | $ | 453 | $ | 539 | ||||||||||||
2003 |
$ | 269 | $ | 148 | $ | 201 | $ | 840 | $ | 603 | $ | 691 | ||||||||||||
2004 |
$ | 333 | $ | 178 | $ | 230 | $ | 936 | $ | 767 | $ | 846 | ||||||||||||
2005 |
$ | 295 | $ | 172 | $ | 201 | $ | 1,012 | $ | 844 | $ | 897 | ||||||||||||
2006 |
$ | 404 | $ | 261 | $ | 320 | $ | 1,355 | $ | 982 | $ | 1,143 | ||||||||||||
2007 |
$ | 382 | $ | 320 | $ | 355 | $ | 1,544 | $ | 1,118 | $ | 1,303 | ||||||||||||
2008 |
$ | 582 | $ | 164 | $ | 352 | $ | 2,273 | $ | 763 | $ | 1,576 | ||||||||||||
2009 |
$ | 393 | $ | 179 | $ | 264 | $ | 1,494 | $ | 918 | $ | 1,204 | ||||||||||||
2010* |
$ | 462 | $ | 395 | $ | 434 | $ | 1,627 | $ | 1,475 | $ | 1,563 | ||||||||||||
| * | (Through February 17, 2010) |
AVAILABLE INFORMATION
The Company’s Internet Website is http://www.stillwatermining.com. The Company makes
available, free of charge, through its Internet Website, its annual reports on Form 10-K, quarterly
reports on Form 10-Q, current reports on Form 8-K, corporate proxy statements, and any amendments
to those reports, as soon as reasonably practicable after the Company
30
Table of Contents
electronically files such materials with, or furnishes them to, the Securities & Exchange
Commission. These documents will also be provided free of charge in print, upon request.
RISK FACTORS
Set forth below are certain risks faced by the Company.
THE WORLDWIDE FINANCIAL AND CREDIT CRISES CREATE VULNERABILITY FOR THE COMPANY
The Company has been affected by the world financial crisis, which continues to affect —
directly and indirectly — a number of financial and commodity markets. In light of world events
and the sharp decrease in PGM prices during the fourth quarter of 2008, the Company restructured
its operations in an effort to conserve cash and reduce anticipated losses. The restructuring of
the Company’s operations resulted in dramatic changes and essentially reduced the scope of its
mining operations while also reducing its mining costs. The Company recognizes that its combined
exposures to low PGM prices, the upcoming expiration of its remaining automobile agreement that
contains pricing floors and the fluctuating demand for its products create substantial risks for
the Company. Consequently, the Company’s management believes that it is in the interests of
shareholders for management to continue to focus at this stage on controlling expenditures and
improving productivity, rather than trying to grow overall mine production. However, even with this
emphasis, there can be no assurance that the Company will succeed in maintaining the cost
reductions it has already achieved or that it will be able to achieve further efficiencies.
The Company’s primary business remains in the mining of PGM’s. As a comparatively low-margin
producer, given the Company’s palladium to platinum ratio, over the years management has continued
to focus on ways to lower its costs. In the low PGM price environment that prevailed through much
of 2009, management restructured the business to focus on maintaining cash and remaining in a
position to take advantage of improved pricing, if and when that should occur. Thus, the Company
operated during 2009 in preservation mode in order to minimize cash costs, maintain operations at
its mines and keep employed its skilled set of miners. While PGM prices have strengthened recently
and the Company’s mining costs have declined, any return to lower PGM prices could still impair the
Company’s operating margins and cash flow.
As a result of the sale of an issue of convertible debentures in March 2008, the Company
raised approximately $181.5 million, the proceeds of which were used to eliminate an outstanding
bank credit agreement balance and for general corporate purposes. As of the end of 2009, the
Company had on hand approximately $201.2 million of cash and highly liquid investments, up from
$180.8 million at the end of 2008. The Company is seeking to maintain its current liquidity in the
face of the current financial crisis, but no assurances can be given that the Company will be
successful. The Company has not succeeded in the current environment in securing a successor
revolving credit agreement. Absent a line of credit, the Company is therefore vulnerable if its
cash position weakens.
The Company’s convertible debenture offering includes a provision that allows the debenture
holders to redeem their holdings at par on certain future dates or upon occurrence of certain other
events, including a change of control of the Company. Approximately 51.5% of the Company’s common
shares are controlled by MMC Norilsk Nickel, a Russian mining company. Should MMC Norilsk Nickel
elect to sell its entire shareholding, that transfer would likely be considered a change in control
for purposes of the Company’s debenture offering. Upon such a change of control, all or any part
of the debenture offering could be redeemed by the holders for repayment at face value. While at
December 31, 2009, the Company had sufficient liquidity available to be able to meet such a
requirement, given the volatility of PGM markets there can be no assurance upon the occurrence of a
change of control in the future that the Company would have adequate liquidity available to meet
the demands of the debenture holders.
The world financial crisis also had a negative effect on the Company’s recycling segment,
which in stronger markets has proven to be a profitable ancillary business that utilizes available
capacity in the smelting and refining facilities. Following the steep drop in PGM prices and amid
doubts as to collectability under various commitments with suppliers, at the end of 2008 the
Company wrote off $26.0 million of advances to suppliers in its recycling business. The Company
has since restructured its recycling business model to reduce its financial exposure in this
business, while at the same time continuing to support and foster the recycling segment. While the
Company now believes that it has substantially reduced its exposures within this business, there
can be no assurance that it will not incur losses in the future on these activities.
31
Table of Contents
VULNERABILITY TO METALS PRICE VOLATILITY-CHANGES IN SUPPLY AND DEMAND COULD REDUCE MARKET PRICES
Because the Company’s sole source of revenue is the sale of platinum group metals, changes in
the market price of platinum group metals may significantly affect profitability. Many factors
beyond the Company’s control influence the market prices of these metals. These factors include
global supply and demand, speculative activities, international political and economic conditions,
currency exchange rates, and production levels and costs in other PGM-producing countries,
principally Russia and South Africa.
Over the last few years, the market price of palladium has been extremely volatile. After
reaching a record high price level of $1,090 per ounce in January 2001, the price of palladium
declined over a 27-month period until hitting a low of $148 per ounce in April 2003. Thereafter,
the price gradually recovered, posting a high of $582 per ounce in April 2008 and then declining
sharply to a low of $164 per ounce in December 2008. Palladium prices recovered during 2009,
ending the year at $393 per ounce. As of February 17, 2010, the market price of palladium (based
on the London Bullion Market Association afternoon fixing) was $440 per ounce.
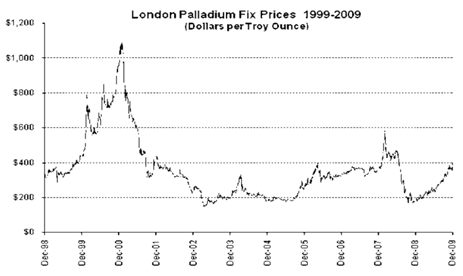
The market price of platinum trended generally upward from $440 per ounce at the end of 2001
to $1,530 at the end of 2007. In late January 2008, following the announcement of electrical power
shortages in South Africa, the price rose sharply, peaking in March at $2,273 per ounce in London.
Thereafter, the price declined steeply as the economy deteriorated in the second half of 2008,
hitting a low of $756 per ounce before ending 2008 at $898 per ounce. During 2009, prices
generally recovered, and platinum ended the year quoted in London at $1,461 per ounce. As of
February 17, 2010, the London Bullion Market Association afternoon fixing for platinum was $1,542
per ounce.
32
Table of Contents
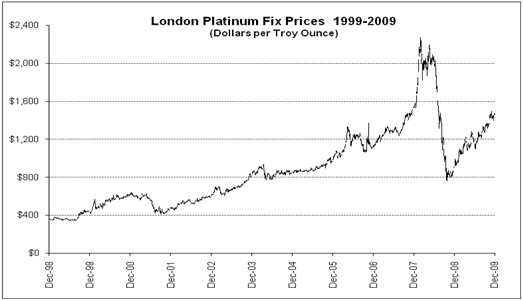
A prolonged or significant economic contraction in the United States or worldwide could put
further downward pressure on market prices of PGMs, particularly if demand for PGMs continued to
decline in connection with reduced automobile demand and more restricted availability of investment
credit. If other producers or investors release substantial volumes of platinum group metals from
stockpiles or otherwise, the increased supply could reduce the prices of palladium and platinum.
Changes in currency exchange rates, and particularly a significant weakening of the South African
rand, could reduce relative costs of production and improve the competitive cost position of South
African PGM producers. This in turn could make additional PGM investment attractive in South
Africa and reduce the worldwide competitiveness of the Company’s North American operations.
Reductions in PGM prices would adversely affect the Company’s revenues, profits and cash
flows. Protracted periods of low metal prices could significantly reduce revenues and the
availability of required development funds, particularly after the Company’s remaining supply
agreement expires at the end of 2010, to levels that could cause portions of the Company’s ore
reserves and production plan to become uneconomic. This could cause substantial reductions to PGM
production or suspension of mining operations, impair asset values, and reduce the Company’s proven
and probable ore reserves. See “Business, Risk Factors and Properties — Competition: Palladium
and Platinum Market” for further explanation of these factors.
Extended periods of high commodity prices may create economic dislocations that may be
destabilizing to PGM supply and demand and ultimately to the broader markets. Periods of high PGM
market prices generally are beneficial to the Company’s current financial performance. However,
strong PGM prices also create economic pressure to identify or create alternate technologies that
ultimately could depress future long-term demand for PGMs, and at the same time may incentivize
development of otherwise marginal mining properties. Similarly, markets for PGM jewelry are
primarily driven by discretionary spending that tends to decline during periods of high prices and
may drive the industry toward developing new, more affordable jewelry materials. See “Risk Factors
— Users of PGMs May Reduce Their Consumption and Substitute Other Materials for Palladium and
Platinum” for additional discussion of these risks.
THE COMPANY DEPENDS UPON A FEW CUSTOMERS AND ITS SALES AND OPERATIONS COULD SUFFER IF IT LOSES ANY OF THEM
The Company is party to a sales agreement with Ford Motor Company for palladium and platinum
produced from its mines which is scheduled to expire at the end of 2010. The Company’s revenues
for the year ended December 31, 2009, included 77.8% from mine production. For more information
about the Company’s sales agreements, see “Business, Risk Factors and Properties — Current
Operations — PGM Sales and Hedging Activities.” For additional discussion of hedging risks, see
“Risk Factors — Hedging and Sales Agreements Could Limit the Realization of Higher Metal Prices.”
As a result of this sales agreement, the Company is subject to the customer’s compliance with
the terms of the agreement, its ability to terminate or suspend the agreement and the customer’s
willingness and ability to pay. The loss of
33
Table of Contents
this agreement would likely require the Company to sell at prevailing market prices, which
might expose it to lower metal prices as compared to the floor prices in the sales agreement. In
the event the Company becomes involved in a disagreement with its customer or one of the
counterparties to its forward sales, their compliance with the associated agreements may be at
risk. In such an event, the Company’s operating plans could be threatened. Thus, termination or
breach by a customer could adversely impact the Company’s operations and financial results.
In July 2009, General Motors Corporation rejected in bankruptcy its supply agreement with the
Company. Shortly afterward, PGM prices increased sufficiently that the Company was not sustaining
any current losses as a result of losing the contractual floor prices in the General Motors
agreement. However, loss of the floor prices also increases the Company’s potential exposure to a
future downturn in PGM prices, and as a result the Company is now more vulnerable to fluctuations
in underlying PGM prices. The agreement also provided a firm sales commitment for a portion of the
Company’s mine production, and while terminal markets exist for platinum and palladium that allow
the Company to sell its production at market prices, without the agreement there can be no
certainty that the Company will be able to sell its production during a time of significant market
disruption
The loss of the Ford agreement when it expires at the end of 2010 (or before then under
extenuating circumstances) could require the Company to sell all its mined PGMs at prevailing
market prices, which at times might expose the Company to lower metal prices as compared to the
floor prices under the agreement. Thus, termination of the Ford supply agreement could have a
material adverse effect on the Company.
The Company also enters into fixed forward sales and from time to time financially settled
forward contracts for metal produced from recycling of catalysts, normally at the time the catalyst
material is purchased. For the Company’s fixed forward sales related to recycling of catalysts,
the Company is subject to the customers’ compliance with the terms of the agreements, their ability
to terminate or suspend the agreements and their willingness and ability to pay. The loss of any
of these agreements or failure of a counterparty to perform could require the Company to sell or
purchase the contracted metal at a loss in the open market. The Company’s revenues for the year
ended December 31, 2009, included 20.7% from recycling sales and 1.5% from other sales.
FAILURE TO RENEW SALES AGREEMENTS FOR OUNCES PRODUCED FROM MINE PRODUCTION COULD RESULT IN CURTAILMENT OR CLOSURE OF OPERATIONS
The Company’s sales agreement with Ford Motor Company in total represented about 53.4% of the
Company’s 2009 revenues. The agreement applies to a portion of the ounces from the Company’s mine
production through December 2010. Under the agreement, the Company currently has committed 80% of
its mined palladium production and 70% of its mined platinum production through 2010. Metal sales
are priced at a modest discount to market, with floor and ceiling prices that apply to all or a
portion of the sales. Accordingly, the Company benefits if the market price drops below the floor
price of the agreement but is unable to realize the full market price if the market price exceeds
the ceiling price of the agreement. The Ford agreement will expire at the end of 2010. Once this
agreement expires, if it is not renewed or replaced with an agreement having similar provisions,
the Company will be directly dependent on PGM market prices, without the price protection or risk
due to the floors and ceilings in the current Ford agreement. Should the Company be unable to
renew the Ford agreement on similar terms and if the market price of PGMs subsequently proves
insufficient to cover the Company’s operating and capital costs of production, then the Company’s
operations might have to be curtailed, suspended or closed.
RELIANCE ON THIRD PARTIES FOR SOURCING OF RECYCLING MATERIALS AND THE CONCENTRATION OF RECYCLING SOURCES CREATES THE POTENTIAL FOR LOSSES
The Company has available smelter and base metal refinery capacity and purchases catalyst
materials from third parties for recycling activities to recover PGMs. The Company has entered
into sourcing arrangements for catalyst material with several suppliers, one of which provides most
of the Company’s catalyst for recycling. The Company is subject to the suppliers’ compliance with
the terms of these arrangements and their ability to terminate or suspend the agreement. Should
one of these sourcing arrangements be terminated, the Company could suffer a loss of profitability
as a result of the termination. This loss could negatively affect the Company’s business,
financial condition and results of operations. Similarly, these suppliers source material from
various third parties in a competitive market, and there can be no assurance of the suppliers’
continuing ability to source material on behalf of the Company at current volumes and prices. Any
continuing issue associated with the suppliers’ ability to source material could have an adverse
effect on the Company’s profitability.
34
Table of Contents
Under these sourcing arrangements, the Company may from time to time advance cash to support
the purchase and collection of these spent catalyst materials. These advances are reflected as
advances on inventory purchases and included in other assets on the Company’s balance sheet until
such time as the material has been received and title has transferred to the Company. In some
cases, the Company has a security interest in the materials that the suppliers have procured but
the Company has not yet received. However, a portion of the advances are unsecured and the
unsecured portion of these advances is fully at risk.
Following the sharp decline in PGM prices during the second half of 2008, the volume of spent
catalyst material received from the Company’s recycling suppliers diminished significantly. This
was an industry-wide trend in which some of the suppliers incurred significant inventory losses,
and a few even exited the business. Following the decline in PGM prices and doubts as to
collectability under various commitments with suppliers, the 2009 and 2008 recycling results
included write-downs of $0.5 million and $26.0 million, respectively, of advances to suppliers in
its recycling business. Subsequently, the Company has restructured its recycling business model in
an effort to reduce the need for unsecured advances. However, there can be no assurance that the
Company will not incur additional recycling losses in the future.
AN EXTENDED PERIOD OF LOW RECYCLING VOLUMES AND WEAK PGM PRICES COULD PUT THE COMPANY’S OPERATIONS AT ADDITIONAL RISK
The Company’s recycling segment generates supplemental earnings and cash flow to help support
the economics of the mining business when PGM prices are low. The recycling segment in turn
depends upon the copper and nickel produced in mine concentrates to extract the PGMs in recycled
material within the Company’s processing facilities. The economics of the recycling segment to a
large extent have been regarded as incremental within the processing operations, with the result
that recycling volumes have attracted only an incremental share of the processing costs.
Volumes of recycling materials available in the marketplace diminished substantially in
response to the drop in PGM prices in late 2008 and early 2009. These lower recycling volumes
result in less earnings and cash flow from the recycling segment, and therefore less economic
support for the mining operations. Should it become necessary at any point to reduce or suspend
operations at the mines, the proportion of processing costs allocated to the recycling segment
would increase substantially, making the recycling segment less profitable. Further, the ability
to operate the smelter and refinery without significant volumes of mine concentrates has never been
demonstrated and would likely require modification to the processing facilities. There is no
assurance that the recycling facilities can operate profitably in the absence of significant mine
concentrates, or that capital would be available to complete necessary modifications to the
processing facilities.
THE COMPANY MAY BE COMPETITIVELY DISADVANTAGED AS A PRIMARY PGM PRODUCER WITH A PREPONDERANCE OF PALLADIUM.
The Company’s products compete in a global market place with the products of other primary
producers of PGMs and with companies that produce PGMs as a by-product. In many cases, the other
primary producers mine ore reserves with a higher ratio of platinum to palladium than the Company
and as a result enjoy higher average realizations per ounce than Stillwater Mining Company. The
Company also competes with mining companies that produce PGMs as a by-product of their primary
commodity, principally nickel.
Because the Company’s U.S. based cost structure is denominated in dollars, in periods when the
U.S. dollar is relatively strong, the Company’s competitors may still operate profitably, while the
Company may not. Furthermore, non-primary producers of PGMs who regard PGMs as a by-product will
generally continue to produce and sell PGMs when prices are low, as PGMs are not their principal
commodity.
ACHIEVEMENT OF THE COMPANY’S PRODUCTION GOALS IS SUBJECT TO UNCERTAINTIES
Based on the complexity and uncertainty involved in operating underground mines, it is
challenging to provide accurate production and cost forecasts. The Company cannot be certain that
either the Stillwater or the East Boulder Mine will achieve the production levels forecasted or
that the expected operating cost levels will be achieved or that funding will be available from
internal and external sources in requisite amounts or on acceptable terms to sustain the necessary
ongoing development work. Failure to achieve the Company’s production forecast negatively affects
the Company’s revenues, profits and cash flows. As the extent of underground operations continues
to expand at depth and horizontally, it is likely that operating costs will increase unless
employee productivity is increased commensurately.
35
Table of Contents
Also, as additional underground infrastructure is constructed, amortization expense may
increase unless additional ore reserves are identified. Such increased costs could adversely
affect the Company’s profitability.
The East Boulder Mine commenced commercial operations in 2002 and has never reached its
original planned 2,000 ton-per-day operating rate on a sustainable basis. Ore grades at the East
Boulder Mine also are typically lower than comparable grades at the Stillwater Mine. Partially as
a result thereof, production costs per ounce at the East Boulder Mine have been significantly
higher than originally expected. The Company has put in place various operating plans and programs
that are intended to reduce production costs at both the East Boulder and Stillwater Mines,
however, there can be no assurance that these plans and programs will be implemented effectively,
and actual production, cash operating costs and economic returns achieved in the future may differ
significantly from those currently estimated or those established in future studies and estimates.
At the East Boulder Mine, total cash costs per PGM ounce (a non-GAAP measure) decreased to $407 in
2009, from $456 in 2008. While the lower East Boulder costs followed upon some specific operating
changes at the mine, there is no certainty that the improved efficiencies will be maintained in the
future.
During 2007 and 2008, attrition rates at the Stillwater and East Boulder Mines exceeded
already high historical experience, resulting in shortages of skilled miners and disruptions to
mining efficiency. With the more difficult economic conditions during 2009, the Company saw these
attrition rates decline to levels well below the historical trend, with accompanying improvements
in productivity. While the Company believes that the improvements in productivity realized during
2009 were attributable to more than just a more stable workforce, if the economy recovers
significantly in the future, the competition for skilled miners may resume and the Company may see
its employee attrition rates climb. This in turn could prove disruptive to the Company’s workforce
and result in lower productivity. See “Risk Factors —
Limited Availability of Additional Mining Personnel and Uncertainty of Labor Relations May Affect
the Company’s Ability to Achieve Its Production Targets” below for further discussion of this and
related issues.
ORE RESERVES ARE VERY DIFFICULT TO ESTIMATE AND ORE RESERVE ESTIMATES MAY REQUIRE ADJUSTMENT IN THE
FUTURE; CHANGES IN ORE GRADES, MINING PRACTICES AND ECONOMIC FACTORS COULD MATERIALLY AFFECT THE
COMPANY’S PRODUCTION AND REPORTED RESULTS
Ore reserve estimates are necessarily imprecise and depend to some extent on statistical
inferences drawn from limited drilling, which may prove unreliable. Reported ore reserves are
comprised of a proven component and a probable component. (See Glossary for definitions.) For
proven ore reserves, distances between samples can range from 25 to 100 feet, but are typically
spaced at 50-foot intervals both horizontally and vertically. The sample data for proven ore
reserves consists of survey data, lithologic data and assay results. The Company enters this data
into a 3-dimensional modeling software package, where it is analyzed to produce a 3-dimensional
solid block model of the resource. The assay values are further analyzed by a geostatistical
modeling technique (kriging) to establish a grade distribution within the 3-dimensional block
model. Dilution is then applied to the model and a diluted tonnage and grade is calculated for
each block.
Probable ore reserves are based on longer projections, up to a maximum radius of 1,000 feet
beyond the limit of existing drill-hole sample intercepts of the J-M Reef obtained from surface and
underground drilling. Statistical modeling and established continuity of the J-M Reef as
determined from results of mining activity to date support the Company’s technical confidence in
estimates of tonnage and grade over this projection distance. Where appropriate, projections for
the probable ore reserve determination are constrained by any known or anticipated restrictive
geologic features. The probable ore reserve estimate of tons and grade is based on the projection
of factors calculated from adjacent proven ore reserve blocks or from diamond drilling data where
available. The factors consist of a probable area, proven yield in tons per foot of footwall
lateral, average grade and percent mineable. The area is calculated based on projections up to a
maximum of 1,000-feet from known drill contacts; the proven yield (in tons per foot of footwall
lateral) and grade are calculated based on long-term proven ore reserve results in adjacent areas;
and the percent mineable is calculated based on long-term experience from actual mining in adjacent
areas. Contained ounces are calculated based on area divided by 300 (square feet) times proven
yield in tons per foot of footwall lateral times grade (ounces per ton) times percent mineable (%).
As a result, probable ore reserve estimates are less reliable than estimates of proven ore
reserves. Both proven and probable ore reserve projections are also limited where appropriate by
certain modifying factors, including geologic evidence, economic criteria and mining constraints.
Actual period-to-period conversion of probable ore reserves to proven ore reserves may result
in increases or decreases to the total reported amount of ore reserves. Conversion, an indicator
of the success in upgrading probable ore reserves to proven ore reserves, is evaluated annually as
described under “Business, Risk Factors, and Properties — Proven
36
Table of Contents
and Probable Ore Reserves”. Conversion rates are affected by a number of factors, including
geological variability, quantity of tonnage represented by the period drilling, applicable mining
methods and changes in safe mining practices, economic considerations and new regulatory
requirements.
The following table illustrates the conversion rates of probable to proven ore reserve tons
realized by year from 2000 through 2009:
| Historic | ||||||||||||||||||||||||||||||||||||||||||||
| Year ended | Weighted | |||||||||||||||||||||||||||||||||||||||||||
| December 31, | Average (2) | 2009 | 2008 | 2007 | 2006 | 2005 | 2004 | 2003 | 2002 | 2001 | 2000 | |||||||||||||||||||||||||||||||||
| (in percent) | ||||||||||||||||||||||||||||||||||||||||||||
Stillwater Mine |
90 | 83 | 74 | 68 | 94 | 101 | 62 | 52 | 71 | 104 | 111 | |||||||||||||||||||||||||||||||||
East Boulder Mine (1) |
95 | 24 | 71 | 107 | 91 | 110 | 125 | 86 | 91 | 88 | * | |||||||||||||||||||||||||||||||||
| (1) | The East Boulder Mine commenced full-time commercial production on January 1, 2002. | |
| (2) | Historic Weighted Average period is 1997 to 2009. |
Ore reserve estimates are expressions of professional judgment based on knowledge,
experience and industry practice. The Company cannot be certain that its estimated ore reserves
are accurate, and future conversion and production experience could differ materially from such
estimates. Should the Company encounter mineralization or formations at any of its mines or
projects different from those predicted by drilling, sampling and similar examinations, reserve
estimates may have to be adjusted and mining plans may have to be altered in a way that might
adversely affect the Company’s operations. Declines in the market prices of platinum group metals
may render the mining of some or all of the Company’s ore reserves uneconomic. The grade of ore
may vary significantly from time to time and between the Stillwater Mine and the East Boulder Mine,
as with any mining operation. The Company cannot provide assurance that any particular quantity of
metal may be recovered from the ore reserves. Moreover, short-term factors relating to the ore
reserves, such as the availability of production workplaces, the need for additional development of
the ore body or the processing of new or different ore types or grades, may impair the Company’s
profitability in any particular accounting period.
AN EXTENDED PERIOD OF LOW PGM PRICES COULD RESULT IN A REDUCTION OF ORE RESERVES AND POTENTIAL FURTHER ASSET IMPAIRMENT CHARGE
The Company reviews and evaluates its long-lived assets for impairment when events and changes
in circumstances indicate that the related carrying amounts of its assets may not be recoverable.
Impairment is considered to exist if the total estimated future cash flows on an undiscounted basis
are less than the carrying amount of the asset. Estimations of future cash flows take into account
estimates of recoverable ounces, PGM prices (considering current and historical prices, long-term
sales contracts prices, price trends and related factors), production levels and capital and
reclamation expenditures, all based on life-of-mine plans and projections.
If the Company determines that the carrying value of a long-lived asset is not recoverable and
the asset is impaired, then the Company must determine the fair value of the impaired asset. If
fair value is lower than the carrying value of the assets, then the carrying value must be adjusted
down to the fair value. If the fair value of the impaired asset is not readily determinable
through equivalent or comparable market price information, the Company normally engages the
services of third-party valuation experts to develop or corroborate fair value assessments.
Were the Company to experience a prolonged period of low PGM prices adversely affecting the
determination of ore reserves, the Company could face one or more impairment adjustments.
Assumptions underlying future cash flows are subject to risks and uncertainties. Any differences
between projections and actual outcomes for key factors such as PGM prices, recoverable ounces,
and/or the Company’s operating performance could have a material effect on the Company’s ability to
recover the carrying amounts of its long-lived assets, potentially resulting in impairment charges
in the future. The Company has estimated that as of December 31, 2009, the combined long-term PGM
market price level below which
ore reserves start to be constrained economically is about $400 per ounce. See “Business,
Risk Factors and Properties — Proven and Probable Ore Reserves” for a chart illustration.
Lower prices also can affect the economic justification of ore reserves, and the Company has
reviewed its ore reserves at December 31, 2009. As in past years, the Company also engaged Behre
Dolbear as third-party independent geological experts to review and express their opinion on the
Company’s reserve calculations. The Company performs its
37
Table of Contents
ore reserve economic assessment using a
twelve-quarter trailing price in order to level out short-term volatility in metals prices, viewing
the twelve-quarter trailing average as a reasonable surrogate for long-term future PGM prices over
the period when the reserves will be mined. The Company’s combined twelve-quarter trailing
weighted average price for platinum and palladium at December 31, 2009, was about $556 per ounce.
At this price, the Company’s geologic ore reserves at each mine can be shown to generate
(undiscounted) positive cash flow over the life of the reserve. Consequently, the Company’s ore
reserves were not constrained economically at December 31, 2009.
It is important to note that, if PGM prices were to fall for an extended period, the trailing
twelve-quarter price will gradually decline. Following the Company’s methodology, there can be no
assurance that the Company’s reported proven and probable ore reserves will not be constrained
economically in the future.
USERS OF PGMS MAY REDUCE THEIR CONSUMPTION AND SUBSTITUTE OTHER MATERIALS FOR PALLADIUM AND PLATINUM
High PGM prices may lead users of PGMs to substitute other materials for palladium and
platinum or to reduce the amounts they consume. The automobile, jewelry, electronics and dental
industries are the largest consumers of palladium. All of these applications are sensitive to
prices. In response to supply concerns and high market prices for palladium, some automobile
manufacturers in the past have sought alternatives to palladium and so reduced their palladium
purchases. There has been some substitution of other metals for palladium in the automobile,
electronics and dental applications. High platinum prices likewise tend to reduce demand by
driving users toward alternative metals. The principal demand for platinum is in the automobile
and chemical industries and for jewelry. Substitution in all of these industries may increase
significantly if PGM market prices rise or if supply becomes unreliable. Significant substitution
for any reason, in the absence of alternative uses for PGMs being identified, could result in a
material and sustained PGM price decrease, which would negatively affect the Company’s revenues and
profitability.
High PGM prices also drive users toward ever more efficient utilization of PGMs. In the past,
the development of new flow geometries and substrate configurations have resulted in “thrifting
down” the amount of PGMs in catalytic converters required to meet emission standards. Recently,
apparently in response to high PGM prices, certain PGM consumers have announced new nanotechnology
applications that may allow further significant reductions in the volume of PGMs required in each
catalytic converter. These emerging applications could tend to drive down PGM demand in the future
and result in lower PGM prices.
To the extent existing and future environmental regulations tend to create disincentives for
the use of internal combustion engines, demand for platinum and palladium in automotive catalytic
converters could be reduced. This in turn could drive down PGM prices and could impair the
Company’s financial performance.
IF THE COMPANY IS UNABLE TO OBTAIN SURETY COVERAGE TO COLLATERALIZE ITS RECLAMATION LIABILITIES, OPERATING PERMITS MAY BE AFFECTED
The Company is required to post surety bonds, letters of credit, cash or other acceptable
financial instruments to guarantee the future performance of reclamation activities at the
Stillwater and East Boulder Mines. The total availability of bonding capacity from the U.S.
insurance industry has declined in recent years. During 2008, the State of Montana increased the
required bonding levels at the Company’s mining operations and may require an additional increase
in the future. The aggregate surety amount in place at the East Boulder Mine was $13.7 million at
the end of 2009, comprised of $6.2 million of surety bonds and a $7.5 million letter of credit. At
December 31, 2009, the Stillwater Mine carried reclamation bonds totaling $19.5 million, including
an increase of $10.0 million voluntarily put in place during the fourth quarter of 2008, pending
the outcome of the current EIS being completed by the State of Montana. Should increased bonding
requirements be imposed in the future and the Company finds itself unable to obtain the required
bonds or otherwise provide acceptable surety, the ability to operate under existing operating
permits would likely be curtailed, which could have a significant adverse affect on the Company’s
operations.
MINING RISKS AND POTENTIAL INADEQUACY OF INSURANCE COVERAGE — THE COMPANY’S BUSINESS IS SUBJECT TO SIGNIFICANT RISKS THAT MAY NOT BE COVERED BY INSURANCE
Underground mining and milling, smelting and refining operations involve a number of risks and
hazards, including:
| • | unusual and unexpected rock formations affecting ore or wall rock characteristics, |
38
Table of Contents
| • | ground or slope failures, | |
| • | cave-ins, ground water influx, rock bursts and other mining or ground-related problems, | |
| • | environmental hazards, | |
| • | industrial accidents, | |
| • | organized labor disputes or work slow-downs, | |
| • | metallurgical and other processing, smelting or refining problems, | |
| • | wild fires, flooding and periodic interruptions due to inclement or hazardous weather conditions or other acts of God, | |
| • | mechanical equipment failure and facility performance problems, and | |
| • | availability and cost of critical materials, equipment and skilled manpower. |
Such risks could result in damage to, or destruction of, mineral properties or production
facilities, personal injury or death, environmental damage, delays in mining or processing,
monetary losses and possible legal liability. Several fatal accidents and other non-fatal serious
injuries have occurred at the Company’s mines since operations began in 1986. Future industrial
accidents or occupational disease occurrences could have a material adverse effect on the Company’s
business and operations. The Company cannot be certain that its insurance will cover certain risks
associated with mining or that it will be able to maintain insurance to cover these risks at
economically feasible premiums. The Company might also become subject to liability for
environmental damage or other hazards which may be uninsurable or for which it may elect not to
insure because of premium costs or commercial impracticality. Such events could result in a
prolonged interruption in operations that would have a negative effect on the Company’s ability to
generate revenues, profits, and cash flow.
HEDGING AND SALES AGREEMENTS COULD LIMIT THE REALIZATION OF HIGHER METAL PRICES
The Company enters into derivative contracts and other hedging arrangements from time to time
in an effort to reduce the negative effect of price changes on its cash flow. These arrangements
typically consist of contracts that require the Company to deliver specific quantities of metal, or
to financially settle the obligation in the future at specific prices. The Company may also hedge
pricing through the sale of call options and the purchase of put options. See “Business, Risk
Factors and Properties — Current Operations — PGM Sales and Hedging Activities” for a discussion
of the Company’s hedge positions. While hedging transactions are intended to reduce the negative
effects of price decreases, they have also prevented the Company at times from benefiting fully
from price increases. If PGM prices are above the price at which future production has been
hedged, the Company will experience an opportunity loss upon settlement.
The Company has a sales agreement that provides for a floor price and a ceiling price for
sales of a portion of its production. To the extent PGM prices exceed the ceiling price of the
sales agreement, the Company will not receive full market price at the time of sale. For a
description of this agreement, see “Business, Risk Factors and Properties — Current Operations —
PGM Sales and Hedging Activities”.
CHANGES TO REGULATIONS AND COMPLIANCE WITH REGULATIONS COULD AFFECT PRODUCTION, INCREASE COSTS AND CAUSE DELAYS
The Company’s business is subject to extensive federal, state and local environmental controls
and regulations, including regulations associated with the implementation of the Clean Air Act,
Clean Water Act, Resource Conservation and Recovery Act, Metals Mines Reclamation Act and numerous
permit stipulations as documented in the Record of
Decision for each operating entity. This body of laws is continually changing and, as a
general matter, is becoming more restrictive. Compliance with these regulations requires the
Company to obtain permits issued by federal, state and local regulatory agencies. Certain permits
require periodic renewal and/or review of the Company’s performance. The Company cannot predict
whether it will be able to renew such permits or whether material changes in permit conditions will
be imposed. Nonrenewal of permits or the imposition of additional conditions could eliminate or
severely restrict the Company’s ability to conduct its operations. See “Business, Risk Factors and
Properties — Current Operations —
39
Table of Contents
Regulatory and Environmental Matters.”
Compliance with existing and future environmental laws and regulations may require additional
control measures and expenditures, which the Company cannot reasonably predict. Environmental
compliance requirements for new or expanded mining operations may require substantial additional
control measures that could materially affect permitting and proposed construction schedules for
such facilities. Under certain circumstances, facility construction may be delayed pending
regulatory approval. Expansion may require new environmental permitting at the Stillwater Mine and
mining and processing facilities at the East Boulder Mine. Private parties may pursue legal
challenges of the Company’s permits. See “Business, Risk Factors and Properties — Current
Operations — Regulatory and Environmental Matters.”
The Company’s activities are also subject to extensive federal, state and local laws and
regulations governing matters relating to mine safety, occupational health, labor standards,
prospecting, exploration, production, exports, smelting and refining operations and taxes.
Compliance with these and other laws and regulations, including requirements implemented under
guidance from of the Department of Homeland Security, could require additional capital outlays,
which could negatively impact the Company’s cash flow.
The Company’s mining operations are located adjacent to the Absaroka-Beartooth Wilderness Area
and are situated approximately 30 miles from the northern boundary of Yellowstone National Park.
While the Company works closely and cooperatively with local environmental organizations, the
Montana Department of Environmental Quality and the United States Forest Service, there can be no
assurance that future political or regulatory efforts will not further restrict or seek to
terminate the Company’s operations in this sensitive area.
For the past several years, the Company has been experimenting with various bio-diesel blends
and modifying some of its mining practices underground in an effort to comply with more restrictive
MSHA limits on DPM exposure for underground miners. These new limits were delayed for a time, but
they ultimately went into effect on May 20, 2008. Compliance with the revised MSHA DPM standards
continues to be a challenge within the mining industry. However, as a result of its internal
efforts to reduce DPM exposure, recent sampling indicates that the Company has achieved compliance
with the new standards at the East Boulder Mine and is nearly in compliance with them at the
Stillwater Mine.
The Company is attempting to achieve full compliance with the standards and continues to
consult with the applicable governmental agencies. No assurance can be given that any lack of
compliance will not impact the Company. However, in view of its good-faith efforts to comply and
progress to date, the Company does not believe that failure to be in strict compliance will have a
material adverse effect on the Company.
Various legislative initiatives have been introduced and, in some cases, enacted mandating
additional safety and health measures for mining employees and providing stronger penalties for
failure to comply. The Company believes it has a highly effective safety program in place for its
employees, but there can be no assurance that the Company will be in compliance with future
legislated initiatives nor that the Company will not incur significant penalties under these
initiatives.
THE COMPANY’S CREDIT RATING IS BELOW INVESTMENT GRADE, POTENTIALLY LIMITING FUTURE CREDIT AVAILABILITY AND INCREASING POTENTIAL BORROWING COSTS
In December 2007, Moody’s Investor Service lowered Stillwater Mining Company’s rating from B1
to B2, and during 2008 it was lowered to Caa1. Standard and Poor’s in December 2008 lowered the
Company’s corporate rating from B+ to B-, and then in December 2009, citing stable liquidity and
higher PGM prices, increased the corporate rating to B. Comments from both agencies regularly
express concern with the Company’s lack of diversity, pending termination of the Ford Motor Company
agreement, relatively high mining costs and volatile pricing environment. The Company’s low credit
ratings will likely make it more difficult and more costly to obtain some forms of third-party
financing in the future. Although the Company believes it has adequate liquidity available at the
current time, should the Company need to access the credit markets in the future, the Company’s
comparatively low credit rating would likely be an impediment to obtaining additional debt or lines
of credit. In the credit environment existing in 2009, the Company has not been able
to secure a revolving credit agreement upon reasonable terms. Should the Company require
additional credit capacity in the future and be unable to obtain it, the Company might not be able
to meet its obligations as they come due and so could be compelled to restructure or seek
protection from creditors.
40
Table of Contents
LIMITED AVAILABILITY OF ADDITIONAL MINING PERSONNEL AND UNCERTAINTY OF LABOR RELATIONS MAY AFFECT
THE COMPANY’S ABILITY TO ACHIEVE ITS PRODUCTION TARGETS
The Company’s operations depend significantly on the availability of qualified miners.
Historically, the Company has experienced periods of high turnover with respect to its miners,
particularly during the strong metal markets of 2007 and early 2008. In addition, the Company must
compete for individuals skilled in the operation and development of underground mining properties.
The number of such persons is limited, and significant competition exists to obtain their skills.
The Company cannot be certain that it will be able to maintain an adequate supply of miners and
other personnel or that its labor expenses will not increase as a result of a shortage in supply of
such workers. Failure to maintain an adequate supply of miners could result in lower mine
production and impair the Company’s financial performance.
The Company had 1,273 employees at December 31, 2009. About 661 employees located at the
Stillwater Mine and 122 employees at the Columbus processing facilities are covered by a collective
bargaining agreement with USW Local 11-0001, expiring July 1, 2011. As of December 31, 2009, about
211 employees at the East Boulder Mine were covered by a separate collective bargaining agreement
with USW Local 11-0001, which will expire on July 1, 2012. There is no assurance that the Company
can achieve a timely or satisfactory renewal of either of these agreements as they expire. A
strike or other work stoppage by the Company’s represented employees could result in a significant
disruption of the Company’s operations and higher ongoing labor costs.
In response to the limited availability of skilled underground miners, beginning in 2005 the
Company initiated a new miner training program whereby it has from time to time hired individuals
largely inexperienced in mining and providing intensive, supervised training in skills critical to
underground mining in the Company’s operations. This training program requires dedicating
significant time and personnel to the training effort, and consequently was scaled back
significantly during 2009. These new and less experienced miners, even after training, generally
will require several years of experience to achieve the productivity level of the Company’s regular
mining workforce. There is no assurance that these new miners will achieve the assumed level of
productivity as they gain experience, nor that the Company will be able to retain these new workers
in the face of other employment opportunities.
UNCERTAINTY OF TITLE TO PROPERTIES — THE VALIDITY OF UNPATENTED MINING CLAIMS IS SUBJECT TO TITLE RISK
The Company has a number of unpatented mining and mill site claims. See “Business, Risk
Factors and Properties — Current Operations —Title and Royalties.” The validity of unpatented
mining claims on public lands is often uncertain and possessory rights of claimants may be subject
to challenge. Unpatented mining claims may be located on lands open to appropriation of mineral
rights and are generally considered to be subject to greater title risk than other real property
interests because the validity of unpatented mining claims is often uncertain and vulnerable to
challenges by third parties or the federal government. The validity of an unpatented mining claim
or mill site, in terms of its location and its maintenance, depends on strict compliance with a
complex body of federal and state statutory and decisional law and, for unpatented mining claims,
the existence of a discovery of valuable minerals. In addition, few public records exist to
definitively control the issues of validity and ownership of unpatented mining claims or mill
sites. While the Company pays annual maintenance fees and has obtained mineral title reports and
legal opinions for some of the unpatented mining claims or mill sites in accordance with the mining
laws and what the Company believes is standard industry practice, the Company cannot be certain
that the mining laws will not be changed nor that the Company’s possessory rights to any of its
unpatented claims may not be deemed defective and challenged. Any change in the mining law could
include the imposition of a federal royalty provision on unpatented claims, which could have an
adverse effect on the Company’s economic performance.
THE COMPLEXITY OF PROCESSING PLATINUM GROUP METALS POSES OPERATIONAL AND ENVIRONMENTAL RISKS IN ADDITION TO TYPICAL MINING RISKS
The Company’s processing facilities include concentrators at each mine site that grind the ore
and extract the contained metal sulfides, and a smelter and base metal refinery located in
Columbus, Montana. These processes
ultimately produce a PGM filter cake that is shipped for final refining to third party
refiners. The Columbus operations involve pyrometallurgical and hydrometallurgical processes that
utilize high temperatures, pressures, caustic chemicals and acids to extract PGMs and other metals
from the concentrator matte. These processes also generate waste gases that are scrubbed to
eliminate sulfur dioxide emissions. While the environmental and safety performance of these
facilities to date has been outstanding, there can be no assurance that incidents such as solution
spills, sulfur dioxide discharges, explosions or accidents involving hot metals and product spills
in transportation will not occur in the future. Such
41
Table of Contents
incidents potentially could result in more
stringent environmental or operating restrictions on these facilities and additional expenses to
the Company, which could have a negative impact on its results of operations and cash flows.
Further, the Company processes virtually all of its metals through these processing facilities, and
any incident interrupting processing operations for an extended period would have a material
adverse effect on the Company’s performance.
ITEM 3
LEGAL PROCEEDINGS
The Company is involved in various claims and legal actions arising in the ordinary course of
business, primarily employee lawsuits and employee injury claims. In the opinion of management,
the ultimate disposition of these types of matters is not expected to have a material adverse
effect on the Company’s financial position, results of operations or liquidity.
On June 1, 2009, General Motors Corporation, filed for bankruptcy protection. The filing had
been widely anticipated, and at the time of the filing, the Company had no receivables outstanding
with General Motors. Subsequently, however, General Motors filed a petition with the bankruptcy
court seeking to reject its executory agreement with the Company, effective July 7, 2009. The
Company in turn filed an objection with the court to the General Motors petition on July 16, 2009.
Following a hearing in bankruptcy court on July 22, 2009, the court approved the General Motors
petition, thereby nullifying the Company’s supply agreement, which was scheduled to expire on
December 31, 2012 with retroactive effect from July 7, 2009. The Company has filed a proof claim
(damages) with the Court. No appeal was filed.
ITEM 4
SUBMISSION OF MATTERS TO A VOTE OF SECURITY HOLDERS
Not Applicable
42
Table of Contents
PART II
ITEM 5
MARKET FOR REGISTRANT’S COMMON EQUITY, RELATED STOCKHOLDER MATTERS AND ISSUER PURCHASES OF EQUITY SECURITIES
PERFORMANCE GRAPH
The following chart compares the yearly percentage change in the Company’s cumulative
total stockholder return on Common Stock, with the cumulative total return on the following
indices, assuming an initial investment of $100 on December 31, 2004 and the reinvestment of all
dividends: (i) the Russell 2000 and (ii) the Peer Group. The performance shown is not necessarily
indicative of future performance.
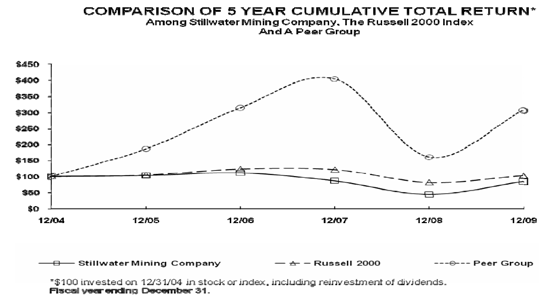
Cumulative Total Return
| 12/31/05 | 12/31/06 | 12/31/07 | 12/31/08 | 12/31/09 | ||||||||||||||||
Stillwater Mining Company |
$ | 102.75 | $ | 110.92 | $ | 85.79 | $ | 43.87 | $ | 84.19 | ||||||||||
Russell 2000 |
104.55 | 123.76 | 121.82 | 80.66 | 102.58 | |||||||||||||||
Peer Group |
185.75 | 314.05 | 403.52 | 160.63 | 306.97 | |||||||||||||||
Notwithstanding anything to the contrary set forth in any of the Company’s previous or future
filings made under the Securities Act of 1933, as amended, or the Exchange Act that might
incorporate this report or future filings made by the Company under those statutes, the preceding
stock performance graph is not to be incorporated by reference into any such prior filings, nor
shall such graph or report be incorporated by reference into any future filings made by the Company
under those statutes. The Peer Group referenced above includes Stillwater Mining Company, Anglo
Platinum Limited, Impala Platinum Holdings Limited, Lonmin PLC, and North American Palladium
Limited.
43
Table of Contents
ITEM 6
SELECTED FINANCIAL DATA
| (in thousands, except per share and current ratio data) | 2009 | 2008 | 2007 | 2006 | 2005 | |||||||||||||||
INCOME STATEMENT DATA |
||||||||||||||||||||
Revenues |
||||||||||||||||||||
Mine production (2) |
$ | 306,892 | $ | 360,364 | $ | 331,277 | $ | 334,834 | $ | 285,641 | ||||||||||
PGM recycling |
81,788 | 475,388 | 326,394 | 269,941 | 90,695 | |||||||||||||||
Sales of palladium received in Norilsk Nickel transaction |
— | — | — | 17,637 | 87,309 | |||||||||||||||
Other |
5,752 | 19,980 | 15,365 | 33,366 | 65,252 | |||||||||||||||
Total revenues |
$ | 394,432 | $ | 855,732 | $ | 673,036 | $ | 655,778 | $ | 528,897 | ||||||||||
Costs and Expenses |
||||||||||||||||||||
Costs of metals sold: |
||||||||||||||||||||
Mine production (2) |
209,140 | 283,793 | 256,942 | 242,612 | 211,606 | |||||||||||||||
PGM recycling (3) |
76,483 | 449,497 | 306,757 | 249,861 | 84,336 | |||||||||||||||
Sales of palladium received in Norilsk Nickel transaction |
— | — | — | 10,785 | 74,542 | |||||||||||||||
Other |
5,741 | 19,892 | 14,289 | 32,300 | 65,163 | |||||||||||||||
Total costs of metals sold |
291,364 | 753,182 | 577,988 | 535,558 | 435,647 | |||||||||||||||
Depreciation and amortization |
||||||||||||||||||||
Mine production |
70,239 | 82,792 | 82,396 | 83,583 | 79,032 | |||||||||||||||
PGM recycling |
178 | 192 | 142 | 100 | 55 | |||||||||||||||
Total depreciation and amortization |
70,417 | 82,984 | 82,538 | 83,683 | 79,087 | |||||||||||||||
General and administrative |
28,926 | 70,816 | 28,285 | 28,018 | 20,333 | |||||||||||||||
Impairment of property, plant and equipment |
— | 67,254 | — | — | — | |||||||||||||||
Operating income (loss) |
$ | 3,725 | $ | (118,504 | ) | $ | (15,775 | ) | $ | 8,519 | $ | (6,170 | ) | |||||||
Induced conversion loss |
$ | (8,097 | ) | $ | — | $ | — | $ | — | $ | — | |||||||||
Total income tax benefit (provision) |
$ | 30 | $ | 32 | $ | — | $ | (10 | ) | $ | (13 | ) | ||||||||
Net income (loss) |
$ | (9,218 | ) | $ | (116,943 | ) | $ | (15,103 | ) | $ | 8,512 | $ | (12,688 | ) | ||||||
Other comprehensive income (loss), net of tax |
$ | 70 | $ | 5,865 | $ | 9,578 | $ | 1,799 | $ | (12,437 | ) | |||||||||
Comprehensive income (loss) |
$ | (9,148 | ) | $ | (111,078 | ) | $ | (5,525 | ) | $ | 10,311 | $ | (25,125 | ) | ||||||
Pro-forma net income (loss) assuming the new amortization method is applied retroactively (1) |
$ | (9,218 | ) | $ | (116,943 | ) | $ | (15,103 | ) | $ | 8,512 | $ | (12,688 | ) | ||||||
Weighted average common shares outstanding |
||||||||||||||||||||
Basic |
94,852 | 93,025 | 92,016 | 91,260 | 90,702 | |||||||||||||||
Diluted |
94,852 | 93,025 | 92,016 | 91,580 | 90,702 | |||||||||||||||
Basic earnings (loss) per share |
$ | (0.10 | ) | $ | (1.26 | ) | $ | (0.16 | ) | $ | 0.09 | $ | (0.14 | ) | ||||||
Diluted earnings (loss) per share |
$ | (0.10 | ) | $ | (1.26 | ) | $ | (0.16 | ) | $ | 0.09 | $ | (0.14 | ) | ||||||
Pro-forma amounts assuming the new amortization method is applied retroactively (1) |
||||||||||||||||||||
Basic earnings (loss) per share |
$ | (0.10 | ) | $ | (1.26 | ) | $ | (0.16 | ) | $ | 0.09 | $ | (0.14 | ) | ||||||
Diluted earnings (loss) per share |
$ | (0.10 | ) | $ | (1.26 | ) | $ | (0.16 | ) | $ | 0.09 | $ | (0.14 | ) | ||||||
CASH FLOW DATA |
||||||||||||||||||||
Net cash provided by operating activities |
$ | 59,672 | $ | 114,243 | $ | 56,422 | $ | 96,963 | $ | 141,134 | ||||||||||
Net cash used in investing activities |
$ | (54,723 | ) | $ | (74,567 | ) | $ | (80,967 | ) | $ | (78,909 | ) | $ | (134,261 | ) | |||||
Net cash (used in) provided by financing activities |
$ | (88 | ) | $ | 60,683 | $ | (2,379 | ) | $ | (9,954 | ) | $ | (22,665 | ) | ||||||
| (1) | See Note 3 “Change in Amortization Method for Mine Development Assets” to the Company’s audited financial statements as filed in the Company’s 2006 Annual Report on Form 10-K. | |
| (2) | See Note 2 “Reclassifications” to the Company’s 2008 audited financial statements for further information. | |
| (3) | Costs from PGM recycling have been revised to include additional recycling costs for the years 2008, 2007, 2006 and 2005. See Note 3 “Correction of Immaterial Error” to the Company’s 2009 and 2008 audited financial statements for further information. |
44
Table of Contents
ITEM 6
SELECTED FINANCIAL DATA
(Continued)
| (in thousands, except per share and current ratio data) | 2009 | 2008 | 2007 | 2006 | 2005 | |||||||||||||||
BALANCE SHEET DATA |
||||||||||||||||||||
Cash and cash equivalents |
$ | 166,656 | $ | 161,795 | $ | 61,436 | $ | 88,360 | $ | 80,260 | ||||||||||
Inventories |
$ | 88,544 | $ | 72,178 | $ | 119,586 | $ | 108,664 | $ | 87,820 | ||||||||||
Total current assets |
$ | 318,598 | $ | 282,535 | $ | 259,854 | $ | 286,108 | $ | 270,097 | ||||||||||
Property, plant and equipment, net |
$ | 358,866 | $ | 393,412 | $ | 465,054 | $ | 460,328 | $ | 445,199 | ||||||||||
Total assets |
$ | 724,772 | $ | 723,029 | $ | 743,330 | $ | 757,792 | $ | 722,643 | ||||||||||
Current portion of long-term debt and capital lease obligations |
$ | — | $ | 97 | $ | 1,209 | $ | 1,674 | $ | 1,776 | ||||||||||
Portion of debt repayable upon liquidation of finished palladium
in inventory |
$ | — | $ | — | $ | — | $ | — | $ | 7,324 | ||||||||||
Total current liabilities |
$ | 49,476 | $ | 55,108 | $ | 68,974 | $ | 85,590 | $ | 69,087 | ||||||||||
Long-term debt and capital lease obligations |
$ | 195,977 | $ | 210,947 | $ | 126,841 | $ | 129,007 | $ | 132,307 | ||||||||||
Total liabilities |
$ | 278,384 | $ | 301,735 | $ | 225,003 | $ | 243,467 | $ | 227,913 | ||||||||||
Stockholders’ equity |
$ | 446,388 | $ | 421,294 | $ | 518,327 | $ | 514,325 | $ | 494,730 | ||||||||||
Working capital |
$ | 269,122 | $ | 229,213 | $ | 190,880 | $ | 200,518 | $ | 201,010 | ||||||||||
Current ratio |
6.4 | 5.2 | 3.8 | 3.3 | 3.9 | |||||||||||||||
45
Table of Contents
OPERATING AND COST DATA
| (in thousands, except per ounce and per ton costs) | 2009 | 2008 | 2007 | 2006 | 2005 | |||||||||||||||
Consolidated: |
||||||||||||||||||||
Ounces produced: |
||||||||||||||||||||
Palladium |
407 | 384 | 413 | 463 | 428 | |||||||||||||||
Platinum |
123 | 115 | 124 | 138 | 126 | |||||||||||||||
Total |
530 | 499 | 537 | 601 | 554 | |||||||||||||||
Tons milled |
1,086 | 1,060 | 1,169 | 1,289 | 1,206 | |||||||||||||||
Mill head grade (ounce per ton) |
0.52 | 0.50 | 0.50 | 0.51 | 0.50 | |||||||||||||||
Sub-grade tons milled (1) |
98 | 146 | 75 | 62 | 80 | |||||||||||||||
Sub-grade mill head grade (ounce per ton) |
0.20 | 0.17 | 0.12 | 0.13 | 0.15 | |||||||||||||||
Total tons milled (1) |
1,184 | 1,206 | 1,244 | 1,351 | 1,286 | |||||||||||||||
Combined mill head grade (ounce per ton) |
0.50 | 0.46 | 0.48 | 0.49 | 0.48 | |||||||||||||||
Total mill recovery (%) |
91 | 91 | 91 | 91 | 91 | |||||||||||||||
Total operating costs per ounce (Non-GAAP) (2) (8) |
$ | 310 | $ | 336 | $ | 268 | $ | 239 | $ | 277 | ||||||||||
Total cash costs per ounce (Non-GAAP) (2) (8) |
$ | 360 | $ | 405 | $ | 330 | $ | 294 | $ | 322 | ||||||||||
Total production costs per ounce (Non-GAAP) (2) (8) |
$ | 495 | $ | 569 | $ | 487 | $ | 431 | $ | 470 | ||||||||||
Total operating costs per ton milled (Non-GAAP) (2) (8) |
$ | 139 | $ | 139 | $ | 116 | $ | 106 | $ | 119 | ||||||||||
Total cash costs per ton milled (Non-GAAP) (2) (8) |
$ | 161 | $ | 167 | $ | 143 | $ | 131 | $ | 139 | ||||||||||
Total production costs per ton milled (Non-GAAP) (2) (8) |
$ | 222 | $ | 236 | $ | 210 | $ | 192 | $ | 202 | ||||||||||
Stillwater Mine: |
||||||||||||||||||||
Ounces produced: |
||||||||||||||||||||
Palladium |
302 | 268 | 274 | 314 | 293 | |||||||||||||||
Platinum |
92 | 81 | 85 | 95 | 88 | |||||||||||||||
Total |
394 | 349 | 359 | 409 | 381 | |||||||||||||||
Tons milled |
727 | 690 | 640 | 739 | 710 | |||||||||||||||
Mill head grade (ounce per ton) |
0.58 | 0.54 | 0.60 | 0.60 | 0.57 | |||||||||||||||
Sub-grade tons milled (1) |
50 | 78 | 75 | 62 | 80 | |||||||||||||||
Sub-grade mill head grade (ounce per ton) |
0.20 | 0.16 | 0.12 | 0.13 | 0.15 | |||||||||||||||
Total tons milled (1) |
777 | 768 | 715 | 801 | 790 | |||||||||||||||
Combined mill head grade (ounce per ton) |
0.56 | 0.51 | 0.55 | 0.56 | 0.53 | |||||||||||||||
Total mill recovery (%) |
92 | 91 | 92 | 92 | 92 | |||||||||||||||
Total operating costs per ounce (Non-GAAP) (2) (8) |
$ | 297 | $ | 318 | $ | 233 | $ | 227 | $ | 269 | ||||||||||
Total cash costs per ounce (Non-GAAP) (2) (8) |
$ | 344 | $ | 383 | $ | 294 | $ | 280 | $ | 313 | ||||||||||
Total production costs per ounce (Non-GAAP) (2) (8) |
$ | 469 | $ | 521 | $ | 425 | $ | 400 | $ | 453 | ||||||||||
Total operating costs per ton milled (Non-GAAP) (2) (8) |
$ | 150 | $ | 144 | $ | 117 | $ | 116 | $ | 130 | ||||||||||
Total cash costs per ton milled (Non-GAAP) (2) (8) |
$ | 174 | $ | 174 | $ | 147 | $ | 143 | $ | 151 | ||||||||||
Total production costs per ton milled (Non-GAAP) (2) (8) |
$ | 238 | $ | 237 | $ | 214 | $ | 204 | $ | 218 | ||||||||||
East Boulder Mine: |
||||||||||||||||||||
Ounces produced: |
||||||||||||||||||||
Palladium |
105 | 116 | 139 | 149 | 135 | |||||||||||||||
Platinum |
31 | 34 | 39 | 43 | 38 | |||||||||||||||
Total |
136 | 150 | 178 | 192 | 173 | |||||||||||||||
Tons milled |
359 | 370 | 529 | 550 | 496 | |||||||||||||||
Mill head grade (ounce per ton) |
0.40 | 0.42 | 0.38 | 0.39 | 0.40 | |||||||||||||||
Sub-grade tons milled (1) |
48 | 68 | — | — | — | |||||||||||||||
Sub-grade mill head grade (ounce per ton) |
0.20 | 0.19 | — | — | — | |||||||||||||||
Total tons milled (1) |
407 | 438 | 529 | 550 | 496 | |||||||||||||||
Combined mill head grade (ounce per ton) |
0.38 | 0.38 | 0.38 | 0.39 | 0.40 | |||||||||||||||
Total mill recovery (%) |
89 | 90 | 90 | 89 | 89 | |||||||||||||||
Total operating costs per ounce (Non-GAAP) (2) (8) |
$ | 347 | $ | 378 | $ | 338 | $ | 264 | $ | 295 | ||||||||||
Total cash costs per ounce (Non-GAAP) (2) (8) |
$ | 407 | $ | 456 | $ | 404 | $ | 324 | $ | 343 | ||||||||||
Total production costs per ounce (Non-GAAP) (2) (8) |
$ | 572 | $ | 682 | $ | 613 | $ | 498 | $ | 508 | ||||||||||
Total operating costs per ton milled (Non-GAAP) (2) (8) |
$ | 116 | $ | 130 | $ | 114 | $ | 92 | $ | 103 | ||||||||||
Total cash costs per ton milled (Non-GAAP) (2) (8) |
$ | 136 | $ | 156 | $ | 136 | $ | 113 | $ | 120 | ||||||||||
Total production costs per ton milled (Non-GAAP) (2) (8) |
$ | 191 | $ | 234 | $ | 206 | $ | 174 | $ | 177 | ||||||||||
46
Table of Contents
| (in thousands, where noted) | 2009 | 2008 | 2007 | 2006 | 2005 | |||||||||||||||
SALES AND PRICE DATA |
||||||||||||||||||||
Ounces sold (000) |
||||||||||||||||||||
Mine production: |
||||||||||||||||||||
Palladium (oz.) |
393 | 399 | 425 | 466 | 431 | |||||||||||||||
Platinum (oz.) |
123 | 115 | 120 | 138 | 135 | |||||||||||||||
Total |
516 | 514 | 545 | 604 | 566 | |||||||||||||||
PGM recycling: (5) |
||||||||||||||||||||
Palladium (oz.) |
53 | 119 | 102 | 100 | 46 | |||||||||||||||
Platinum (oz.) |
40 | 131 | 119 | 127 | 68 | |||||||||||||||
Rhodium (oz.) |
9 | 25 | 24 | 22 | 12 | |||||||||||||||
Total |
102 | 275 | 245 | 249 | 126 | |||||||||||||||
Other: (6) |
||||||||||||||||||||
Palladium (oz.) |
12 | 49 | 44 | 96 | 456 | |||||||||||||||
Platinum (oz.) |
3 | — | — | 3 | 13 | |||||||||||||||
Rhodium (oz.) |
— | — | — | 6 | 26 | |||||||||||||||
Total |
15 | 49 | 44 | 105 | 495 | |||||||||||||||
By-products from mining: (7) |
||||||||||||||||||||
Rhodium (oz.) |
4 | 2 | 4 | 4 | 3 | |||||||||||||||
Gold (oz.) |
9 | 9 | 11 | 11 | 11 | |||||||||||||||
Silver (oz.) |
6 | 10 | 9 | 6 | 6 | |||||||||||||||
Copper (lb.) |
776 | 940 | 942 | 892 | 911 | |||||||||||||||
Nickel (lb.) |
856 | 932 | 1,171 | 1,585 | 1,307 | |||||||||||||||
Average
realized price per
ounce
(3) |
||||||||||||||||||||
Mine production: |
||||||||||||||||||||
Palladium ($/oz.) |
$ | 365 | $ | 410 | $ | 384 | $ | 370 | $ | 356 | ||||||||||
Platinum ($/oz.) |
$ | 1,137 | $ | 1,387 | $ | 953 | $ | 868 | $ | 821 | ||||||||||
Combined ($/oz.) (4) |
$ | 549 | $ | 630 | $ | 509 | $ | 484 | $ | 467 | ||||||||||
PGM recycling: (5) |
||||||||||||||||||||
Palladium ($/oz.) |
$ | 282 | $ | 401 | $ | 353 | $ | 319 | $ | 195 | ||||||||||
Platinum ($/oz.) |
$ | 1,143 | $ | 1,735 | $ | 1,247 | $ | 1,124 | $ | 873 | ||||||||||
Rhodium ($/oz.) |
$ | 2,088 | $ | 7,807 | $ | 5,732 | $ | 4,374 | $ | 1,740 | ||||||||||
Other: (6) |
||||||||||||||||||||
Palladium ($/oz.) |
$ | 213 | $ | 409 | $ | 351 | $ | 292 | $ | 199 | ||||||||||
Platinum ($/oz.) |
$ | 1,041 | $ | — | $ | — | $ | 1,028 | $ | 893 | ||||||||||
Rhodium ($/oz.) |
$ | — | $ | — | $ | — | $ | 3,222 | $ | 1,916 | ||||||||||
By-products from mining: (7) |
||||||||||||||||||||
Rhodium ($/oz.) |
$ | 1,543 | $ | 7,939 | $ | 6,217 | $ | 4,516 | $ | 2,155 | ||||||||||
Gold ($/oz.) |
$ | 983 | $ | 877 | $ | 699 | $ | 603 | $ | 444 | ||||||||||
Silver ($/oz.) |
$ | 15 | $ | 14 | $ | 13 | $ | 12 | $ | 7 | ||||||||||
Copper ($/lb.) |
$ | 2.14 | $ | 2.94 | $ | 3.34 | $ | 2.91 | $ | 1.55 | ||||||||||
Nickel ($/lb.) |
$ | 7.48 | $ | 9.72 | $ | 16.91 | $ | 10.04 | $ | 5.96 | ||||||||||
Average market price per ounce
(4) |
||||||||||||||||||||
Palladium ($/oz.) |
$ | 263 | $ | 352 | $ | 355 | $ | 320 | $ | 201 | ||||||||||
Platinum ($/oz.) |
$ | 1,204 | $ | 1,578 | $ | 1,303 | $ | 1,143 | $ | 897 | ||||||||||
Combined ($/oz.) (4) |
$ | 487 | $ | 628 | $ | 564 | $ | 508 | $ | 366 | ||||||||||
| (1) | Sub-grade tons milled includes reef waste material only. Total tons milled includes ore tons and sub-grade tons only. | |
| (2) | Total operating costs include costs of mining, processing and administrative expenses at the mine site (including mine site overhead and credits for metals produced other than palladium and platinum from mine production). Total cash costs include total operating costs plus royalties, insurance and taxes other than income taxes. Total production costs include total cash costs plus asset retirement costs and depreciation and amortization. Income taxes, corporate general and administrative expenses, asset impairment write-downs, gain or loss on disposal of property, plant and |
47
Table of Contents
| equipment, restructuring costs, interest income and expense are not included in total operating costs, total cash costs or total production costs. Operating costs per ton, operating costs per ounce, cash costs per ton, cash costs per ounce, production costs per ton and production costs per ounce are non-GAAP measurements that management uses to monitor and evaluate the efficiency of its mining operations. These measures of cost are not defined under U.S. Generally Accepted Accounting Principles (GAAP). Please see “Reconciliation of Non-GAAP Measures to Costs of Revenues” and the accompanying discussion for additional detail. | ||
| (3) | The Company’s average realized price represents revenues, which include the effect of any applicable agreement floor and ceiling prices, hedging gains and losses realized on commodity instruments and agreement discounts, divided by ounces sold. The average market price represents the average London Bullion Market Association afternoon postings for the actual months of the period. | |
| (4) | The Company reports a combined average realized and market price of palladium and platinum at the same ratio as ounces that are produced from the base metal refinery. | |
| (5) | Ounces sold and average realized price per ounce from PGM recycling relate to ounces produced from processing of catalyst materials. | |
| (6) | Ounces sold and average realized price per ounce from other relate to ounces purchased in the open market for resale. Ounces in the years 2006 and 2005 also included palladium ounces received in the Norilsk Nickel transaction. | |
| (7) | By-product metals sold reflect contained metal. Realized prices reflect net values (discounted due to product form and transportation and marketing charges) per unit received. | |
| (8) | Costs per ounce/ton have been revised due to a correction of an immaterial error in the costs of sales for recycled ounces in the full year of 2008, fourth quarter of 2008 and fourth quarter of 2009. |
Reconciliation of Non-GAAP measures to costs of revenues
The Company utilizes certain non-GAAP measures as indicators in assessing the performance of
its mining and processing operations during any period. Because of the processing time required to
complete the extraction of finished PGM products, there are typically lags from one to three months
between ore production and sale of the finished product. Sales in any period include some portion
of material mined and processed from prior periods as the revenue recognition process is completed.
Consequently, while costs of revenues (a GAAP measure included in the Company’s Statement of
Operations and Comprehensive Income/(Loss)) appropriately reflects the expense associated with the
materials sold in any period, the Company has developed certain non-GAAP measures to assess the
costs associated with its producing and processing activities in a particular period and to compare
those costs between periods.
While the Company believes that these non-GAAP measures may also be of value to outside
readers, both as general indicators of the Company’s mining efficiency from period to period and as
insight into how the Company internally measures its operating performance, these non-GAAP measures
are not standardized across the mining industry and in most cases will not be directly comparable
to similar measures that may be provided by other companies. These non-GAAP measures are only
useful as indicators of relative operational performance in any period, and because they do not
take into
account the inventory timing differences that are included in costs of revenues, they cannot
meaningfully be used to develop measures of profitability. A reconciliation of these measures to
costs of revenues for each period shown is provided as part of the following tables, and a
description of each non-GAAP measure is provided below.
Total Costs of Revenues: For the Company on a consolidated basis, this measure is equal to
consolidated costs of revenues, as reported in the Statement of Operations and Comprehensive
Income/(Loss). For the Stillwater Mine, East Boulder Mine, and PGM recycling and other, the
Company segregates the expenses within costs of revenues that are directly associated with each of
these activities and then allocates the remaining facility costs included in consolidated costs of
revenues in proportion to the monthly volumes from each activity. The resulting total costs of
revenues measures for the Stillwater Mine, East Boulder Mine and PGM recycling and other are equal
in total to consolidated costs of revenues as reported in the Company’s Statement of Operations and
Comprehensive Income/(Loss).
Total Production Costs (Non-GAAP): Calculated as total costs of revenues (for each mine or
consolidated) adjusted to exclude gains or losses on asset dispositions, costs and profit from PGM
recycling, and changes in product inventories. This non-GAAP measure provides an indication of the
total costs incurred in association with production and processing in a period, before taking into
account the timing differences resulting from inventory changes and before any effect of asset
dispositions or recycling activities. The Company uses it as a comparative measure of the level of
total production and processing activities in a period, and may be compared to prior periods or
between the Company’s mines. As noted above, because this measure does not take into account the
inventory timing differences that are included in costs of revenues, it cannot be used to develop
meaningful measures of earnings or profitability.
48
Table of Contents
When divided by the total tons milled in the respective period, Total Production Cost per Ton
Milled (Non-GAAP) – measured for each mine or consolidated – provides an indication of the cost per
ton milled in that period. Because of variability of ore grade in the Company’s mining operations,
production efficiency underground is frequently measured against ore tons produced rather than
contained PGM ounces. And because ore tons are first actually weighed as they are fed into the
mill, mill feed is the first point at which production tons are measured precisely. Consequently,
Total Production Cost per Ton Milled (Non-GAAP) is a general measure of production efficiency, and
is affected both by the level of Total Production Costs (Non-GAAP) and by the volume of tons
produced and fed to the mill.
When divided by the total recoverable PGM ounces from production in the respective period,
Total Production Cost per Ounce (Non-GAAP) – measured for each mine or consolidated – provides an
indication of the cost per ounce produced in that period. Recoverable PGM ounces from production
are an indication of the amount of PGM product extracted through mining in any period. Because
extracting PGM material is ultimately the objective of mining, the cost per ounce of extracting and
processing PGM ounces in a period is a useful measure for comparing extraction efficiency between
periods and between the Company’s mines. Consequently, Total Production Cost per Ounce
(Non-GAAP) in any period is a general measure of extraction efficiency, and is affected by the
level of Total Production Costs (Non-GAAP), by the grade of the ore produced and by the volume of
ore produced in the period.
Total Cash Costs (Non-GAAP): This non-GAAP measure is calculated (for each mine or
consolidated) as total costs of revenues adjusted to exclude gains or losses on asset dispositions,
costs and profit from PGM recycling, depreciation and amortization and asset retirement costs and
changes in product inventories. The Company uses this measure as a comparative indication of the
cash costs related to production and processing in any period. As noted above, because this
measure does not take into account the inventory timing differences that are included in costs of
revenues, it cannot be used to develop meaningful measures of earnings or profitability.
When divided by the total tons milled in the respective period, Total Cash Cost per Ton Milled
(Non-GAAP) – measured for each mine or consolidated– provides an indication of the level of cash
costs incurred per ton milled in that period. Because of variability of ore grade in the Company’s
mining operations, production efficiency underground is frequently measured against ore tons
produced rather than contained PGM ounces. And because ore tons are first weighed as they are fed
into the mill, mill feed is the first point at which production tons are measured precisely.
Consequently, Total Cash Cost per Ton Milled (Non-GAAP) is a general measure of production
efficiency, and is affected both by the level of Total Cash Costs (Non-GAAP) and by the volume of
tons produced and fed to the mill.
When divided by the total recoverable PGM ounces from production in the respective period,
Total Cash Cost per Ounce (Non-GAAP) - measured for each mine or consolidated- provides an
indication of the level of cash costs incurred per PGM ounce produced in that period. Recoverable PGM ounces
from production are an indication of the amount of PGM product extracted through mining in any period.
Because ultimately extracting PGM material is the objective of mining, the cost per ounce of extracting and processing
PGM ounces in a period is a useful measure for comparing extraction efficiency between periods and between the Company’s mines.
Consequently, Total Cash Cost per Ounce (Non-GAAP) in any period is a general measure of extraction efficiency, and is affected by
the level of Total Cash Costs (Non-GAAP), by the grade of the ore produced and by the volume of ore produced in the period.
Total Operating Costs (Non-GAAP): This non-GAAP measure is derived from Total Cash Costs (Non-GAAP) for each mine or
consolidated by excluding royalty, tax and insurance expenses from Total Cash Costs (Non-GAAP). Royalties, taxes and insurance
costs are contractual or governmental obligations outside of the control of the Company’s mining operations, and in the case of royalties and most taxes, are driven more by the level of sales realizations rather than by operating efficiency. Consequently, Total Operating Costs (Non-GAAP) is a useful indicator of the level of production and processing costs incurred in a period that are under the control of mining operations. As noted above, because this measure does not take into account the inventory
timing differences that are included in costs of revenues, it cannot be used to develop meaningful measures of earnings or profitability.
When divided by the total tons milled in the respective period, Total Operating Cost per Ton Milled (Non-GAAP) - measured for each mine or consolidated- provides an indication of the level of controllable cash costs incurred per ton milled in that period. Because of variability of ore grade in the Company’s mining operations, production efficiency underground is frequently measured against ore tons produced
rather than contained PGM ounces. And because ore tons are first actually weighed as they are fed into the mill, mill feed is the first point at which production tons are measured precisely. Consequently, Total Operating Cost per Ton Milled (Non-GAAP) is a general measure of production efficiency, and is affected both by the level of Total Operating Costs (Non-GAAP) and by the volume of tons produced and fed to the mill.
49
Table of Contents
When divided by the total recoverable PGM ounces from production in the respective
period, Total Operating Cost per Ounce (Non-GAAP) — measured for each mine or consolidated—
provides an indication of the level of controllable cash costs incurred per PGM ounce produced in
that period. Recoverable PGM ounces from production are an indication of the amount of PGM product
extracted through mining in any period. Because ultimately extracting PGM material is the
objective of mining, the cost per ounce of extracting and processing PGM ounces in a period is a
useful measure for comparing extraction efficiency between periods and between the Company’s mines.
Consequently, Total Operating Cost per Ounce (Non-GAAP) in any period is a general measure of
extraction efficiency, and is affected by the level of Total Operating Costs (Non-GAAP), by the
grade of the ore produced and by the volume of ore produced in the period.
| (in thousands, except per ounce and per ton data) | 2009 | 2008 | 2007 | 2006 | 2005 | |||||||||||||||
Consolidated: |
||||||||||||||||||||
Total operating costs (Non-GAAP) |
$ | 164,142 | $ | 167,660 | $ | 143,988 | $ | 143,561 | $ | 153,455 | ||||||||||
Total cash costs (Non-GAAP) |
$ | 190,757 | $ | 201,915 | $ | 177,384 | $ | 176,462 | $ | 178,624 | ||||||||||
Total production costs (Non-GAAP) |
$ | 262,364 | $ | 284,130 | $ | 261,778 | $ | 259,036 | $ | 260,373 | ||||||||||
Divided by total ounces |
530 | 499 | 537 | 601 | 554 | |||||||||||||||
Divided by total tons milled |
1,184 | 1,206 | 1,244 | 1,351 | 1,286 | |||||||||||||||
Total operating cost per ounce (Non-GAAP) |
$ | 310 | $ | 336 | $ | 268 | $ | 239 | $ | 277 | ||||||||||
Total cash cost per ounce (Non-GAAP) |
$ | 360 | $ | 405 | $ | 330 | $ | 294 | $ | 322 | ||||||||||
Total production cost per ounce (Non-GAAP) |
$ | 495 | $ | 569 | $ | 487 | $ | 431 | $ | 470 | ||||||||||
Total operating cost per ton milled (Non-GAAP) |
$ | 139 | $ | 139 | $ | 116 | $ | 106 | $ | 119 | ||||||||||
Total cash cost per ton milled (Non-GAAP) |
$ | 161 | $ | 167 | $ | 143 | $ | 131 | $ | 139 | ||||||||||
Total production cost per ton milled (Non-GAAP) |
$ | 222 | $ | 236 | $ | 210 | $ | 192 | $ | 202 | ||||||||||
Reconciliation to consolidated costs of revenues: |
||||||||||||||||||||
Total operating costs (Non-GAAP) |
$ | 164,142 | $ | 167,660 | $ | 143,988 | $ | 143,561 | $ | 153,455 | ||||||||||
Royalties, taxes and other |
26,615 | 34,255 | 33,396 | 32,901 | 25,169 | |||||||||||||||
Total cash costs (Non-GAAP) |
$ | 190,757 | $ | 201,915 | $ | 177,384 | $ | 176,462 | $ | 178,624 | ||||||||||
Asset retirement costs |
606 | 885 | 734 | 650 | 535 | |||||||||||||||
Depreciation and amortization |
70,239 | 82,792 | 82,396 | 83,583 | 79,032 | |||||||||||||||
Depreciation and amortization (in inventory) |
762 | (1,462 | ) | 1,264 | (1,659 | ) | 2,182 | |||||||||||||
Total production costs (Non-GAAP) |
$ | 262,364 | $ | 284,130 | $ | 261,778 | $ | 259,036 | $ | 260,373 | ||||||||||
Change in product inventories |
(6,797 | ) | 32,916 | 11,848 | 41,642 | 141,512 | ||||||||||||||
Cost of PGM recycling |
76,483 | 449,497 | 306,757 | 249,861 | 84,838 | |||||||||||||||
PGM recycling — depreciation |
178 | 192 | 142 | 100 | 55 | |||||||||||||||
Add: Profit from PGM recycling |
5,908 | 32,671 | 26,180 | 25,972 | 7,023 | |||||||||||||||
Total consolidated costs of revenues (2) |
$ | 338,136 | $ | 799,406 | $ | 606,705 | $ | 576,611 | $ | 493,801 | ||||||||||
Stillwater Mine: |
||||||||||||||||||||
Total operating costs (Non-GAAP) |
$ | 116,913 | $ | 110,931 | $ | 83,758 | $ | 92,827 | $ | 102,470 | ||||||||||
Total cash costs (Non-GAAP) |
$ | 135,353 | $ | 133,571 | $ | 105,391 | $ | 114,323 | $ | 119,220 | ||||||||||
Total production costs (Non-GAAP) |
$ | 184,614 | $ | 181,812 | $ | 152,679 | $ | 163,420 | $ | 172,477 | ||||||||||
Divided by total ounces |
394 | 349 | 359 | 409 | 381 | |||||||||||||||
Divided by total tons milled |
777 | 768 | 715 | 801 | 790 | |||||||||||||||
Total operating cost per ounce (Non-GAAP) |
$ | 297 | $ | 318 | $ | 233 | $ | 227 | $ | 269 | ||||||||||
Total cash cost per ounce (Non-GAAP) |
$ | 344 | $ | 383 | $ | 294 | $ | 280 | $ | 313 | ||||||||||
Total production cost per ounce (Non-GAAP) |
$ | 469 | $ | 521 | $ | 425 | $ | 400 | $ | 453 | ||||||||||
Total operating cost per ton milled (Non-GAAP) |
$ | 150 | $ | 144 | $ | 117 | $ | 116 | $ | 130 | ||||||||||
Total cash cost per ton milled (Non-GAAP) |
$ | 174 | $ | 174 | $ | 147 | $ | 143 | $ | 151 | ||||||||||
Total production cost per ton milled (Non-GAAP) |
$ | 238 | $ | 237 | $ | 214 | $ | 204 | $ | 218 | ||||||||||
50
Table of Contents
| (in thousands, per ounce and per ton data) | 2009 | 2008 | 2007 | 2006 | 2005 | |||||||||||||||
Stillwater Mine continued: |
||||||||||||||||||||
Reconciliation to costs of revenues: |
||||||||||||||||||||
Total operating costs (Non-GAAP) |
$ | 116,913 | $ | 110,931 | $ | 83,758 | $ | 92,827 | $ | 102,470 | ||||||||||
Royalties, taxes and other |
18,440 | 22,640 | 21,633 | 21,496 | 16,750 | |||||||||||||||
Total cash costs (Non-GAAP) |
$ | 135,353 | $ | 133,571 | $ | 105,391 | $ | 114,323 | $ | 119,220 | ||||||||||
Asset retirement costs |
507 | 645 | 512 | 470 | 370 | |||||||||||||||
Depreciation and amortization |
47,527 | 47,748 | 46,521 | 49,620 | 52,295 | |||||||||||||||
Depreciation and amortization (in inventory) |
1,227 | (152 | ) | 255 | (993 | ) | 592 | |||||||||||||
Total production costs (Non-GAAP) |
$ | 184,614 | $ | 181,812 | $ | 152,679 | $ | 163,420 | $ | 172,477 | ||||||||||
Change in product inventories |
(7,393 | ) | 7,524 | (2,872 | ) | 1,882 | 6,773 | |||||||||||||
Add: Profit from PGM recycling |
4,395 | 21,889 | 17,299 | 18,015 | 4,805 | |||||||||||||||
Total costs of revenues (2) |
$ | 181,616 | $ | 211,225 | $ | 167,106 | $ | 183,317 | $ | 184,055 | ||||||||||
East Boulder Mine: |
||||||||||||||||||||
Total operating costs (Non-GAAP) |
$ | 47,229 | $ | 56,729 | $ | 60,230 | $ | 50,734 | $ | 50,985 | ||||||||||
Total cash costs (Non-GAAP) |
$ | 55,404 | $ | 68,344 | $ | 71,993 | $ | 62,139 | $ | 59,404 | ||||||||||
Total production costs (Non-GAAP) |
$ | 77,750 | $ | 102,318 | $ | 109,099 | $ | 95,616 | $ | 87,897 | ||||||||||
Divided by total ounces |
136 | 150 | 178 | 192 | 173 | |||||||||||||||
Divided by total tons milled |
407 | 438 | 529 | 550 | 496 | |||||||||||||||
Total operating cost per ounce (Non-GAAP) |
$ | 347 | $ | 378 | $ | 338 | $ | 264 | $ | 295 | ||||||||||
Total cash cost per ounce (Non-GAAP) |
$ | 407 | $ | 456 | $ | 404 | $ | 324 | $ | 343 | ||||||||||
Total production cost per ounce (Non-GAAP) |
$ | 572 | $ | 682 | $ | 613 | $ | 498 | $ | 508 | ||||||||||
Total operating cost per ton milled (Non-GAAP) |
$ | 116 | $ | 130 | $ | 114 | $ | 92 | $ | 103 | ||||||||||
Total cash cost per ton milled (Non-GAAP) |
$ | 136 | $ | 156 | $ | 136 | $ | 113 | $ | 120 | ||||||||||
Total production cost per ton milled (Non-GAAP) |
$ | 191 | $ | 234 | $ | 206 | $ | 174 | $ | 177 | ||||||||||
Reconciliation to costs of revenues: |
||||||||||||||||||||
Total operating costs (Non-GAAP) |
$ | 47,229 | $ | 56,729 | $ | 60,230 | $ | 50,734 | $ | 50,985 | ||||||||||
Royalties, taxes and other |
8,175 | 11,615 | 11,763 | 11,405 | 8,419 | |||||||||||||||
Total cash costs (Non-GAAP) |
$ | 55,404 | $ | 68,344 | $ | 71,993 | $ | 62,139 | $ | 59,404 | ||||||||||
Asset retirement costs |
99 | 240 | 222 | 180 | 165 | |||||||||||||||
Depreciation and amortization |
22,712 | 35,044 | 35,877 | 33,963 | 26,737 | |||||||||||||||
Depreciation and amortization (in inventory) |
(465 | ) | (1,310 | ) | 1,007 | (666 | ) | 1,591 | ||||||||||||
Total production costs (Non-GAAP) |
$ | 77,750 | $ | 102,318 | $ | 109,099 | $ | 95,616 | $ | 87,897 | ||||||||||
Change in product inventories |
(5,145 | ) | 5,500 | 432 | (439 | ) | (4,967 | ) | ||||||||||||
Add: Profit from PGM recycling |
1,513 | 10,782 | 8,881 | 7,957 | 2,218 | |||||||||||||||
Total costs of revenues (2) |
$ | 74,118 | $ | 118,600 | $ | 118,412 | $ | 103,134 | $ | 85,148 | ||||||||||
PGM recycling and Other: (1) |
||||||||||||||||||||
Reconciliation to costs of revenues: |
||||||||||||||||||||
Cost of open market purchases and palladium received in Norilsk Nickel transaction |
$ | 5,741 | $ | 19,892 | $ | 14,288 | $ | 40,199 | $ | 139,705 | ||||||||||
PGM recycling — depreciation |
178 | 192 | 142 | 100 | 55 | |||||||||||||||
Cost of PGM recycling |
76,483 | 449,497 | 306,757 | 249,861 | 84,838 | |||||||||||||||
Total costs of revenues |
$ | 82,402 | $ | 469,581 | $ | 321,187 | $ | 290,160 | $ | 224,598 | ||||||||||
| (1) | PGM recycling and Other (2005 through 2006) include PGM recycling, sales of palladium received in the Norilsk Nickel transaction and metal purchased on the open market for re-sale. | |
| (2) | Revenue from the sale of mined by-products are credited against gross production costs for Non-GAAP presentation. Revenue from the sale of mined by-products are reported on the Company’s financial statements as mined revenue and are included in consolidated costs of revenues. Total costs of revenues in the above table have been reduced by approximately $23.6 million, $36.8 million, $53.8 million, $42.6 million and $21.4 million in the years 2009, 2008, 2007, 2006 and 2005, respectively. |
51
Table of Contents
ITEM 7
MANAGEMENT’S DISCUSSION AND ANALYSIS OF
FINANCIAL CONDITION AND RESULTS OF OPERATIONS
FINANCIAL CONDITION AND RESULTS OF OPERATIONS
The following discussion should be read in conjunction with the Company’s Financial Statements
and Notes, included elsewhere in this report, and the information contained in Part II, Item 6
“Selected Financial and Operating Data.”
OVERVIEW
PRINCIPAL FACTORS AFFECTING STILLWATER MINING COMPANY
Stillwater Mining Company is a Delaware corporation, listed on the New York Stock Exchange and
headquartered in Columbus, Montana. The Company mines, processes, refines and markets platinum and
palladium ores from two underground mines situated within the J-M Reef, an extensive trend of PGM
mineralization located in Stillwater and Sweet Grass Counties in south central Montana. The mined
ore is crushed and concentrated in a mill located at each of the mine sites and then trucked to
Columbus, Montana, where the concentrates are further processed in a smelter and base metals
refinery into a PGM-rich filter cake. The filter cake then is shipped to third parties for final
refining into finished metal.
PGM ore grades in the J-M Reef are some of the best in the world, but are palladium rich and,
because of the uplifted configuration of the reef, costly and complex to mine. The mines compete
primarily with PGM ore reserves within South Africa’s Bushveld Complex, which generally enjoy a
much higher proportion of platinum content and are less steeply dipping, and with nickel mines in
the Russian Federation which produce PGMs as a major by-product and so at a very low marginal cost.
Consequently, in periods of low PGM prices, Stillwater Mining Company’s palladium rich production
ratio and cost structure may put it at a disadvantage to these competitors. See “Business, Risk
Factors and Properties — Risk Factors — The Company May Be Competitively Disadvantaged As A
Primary PGM Producer With A Preponderance Of Palladium” for further discussion.
In response to the steep deterioration in PGM prices during the second half of 2008, the
Company reacted by restructuring its operations, targeting its business plan for 2009 toward
preserving cash and maintaining the Company’s viability in the face of a severe economic downturn
of uncertain duration. Further complicating this effort was the recognition that the Company’s
largest sales agreement, which includes a floor price structure that tends to protect the Company
during periods of low PGM prices, is slated to expire at the end of 2010, and that demand for
automobiles, the principal industry served by PGM suppliers, had largely collapsed along with the
general economy.
The restructuring of the Company’s operations in late 2008 resulted in transfers and employee
layoffs, elimination of many contractors, revisions to the Company’s mining processes, closure of
the corporate offices in Billings, and severe restrictions on operating and capital expenditures.
In total, the Company reduced its workforce to 1,336 by March 31, 2009, from 1,656 at September 30,
2008. During the same period, mostly by transferring between mines, the miner workforce at the
East Boulder Mine was reduced to 111 from 170, while the Stillwater Mine increased its number of
miners to 312 from 241. In addition, another 45 contract miners not included in these totals were
released from service, mostly at the Stillwater Mine. Following cutbacks at the corporate office,
the remaining employees there were transferred from Billings to various other existing offices in
Columbus and at the mines. Several corporate programs, including market development, recruiting,
exploration and investor relations, were eliminated or sharply curtailed. Capital spending, which
had totaled about $82.3 million in 2008, was reduced to $39.5 million in 2009. At year end 2009,
the Company’s workforce (including contractors) totaled 1,353 following continuing adjustments to
the late 2008 restructuring, for a total workforce reduction (including contractors) from September
30, 2008 just short of 27%.
Although the restructuring efforts were corporate-wide, the most radical restructuring took
place at the Company’s East Boulder Mine. East Boulder’s ore grades are consistently lower than
those at the Stillwater Mine, and as a result its cash costs per ounce tend to be significantly
higher. In the low-price environment of late 2008, it was clear that without substantial changes
to East Boulder’s operations, the mine would be consuming cash at an unacceptable rate. Following
a brief shutdown while management evaluated its options, the Company proposed a restructuring
alternative that, while drastically reducing the mine’s workforce, held out hope for the mine’s
continuing viability. The restructuring plan involved cutting back on the number of mining areas
at East Boulder and assigning small, essentially self-sufficient teams to each of those areas. The
teams would be responsible for most of their own support, bringing their own supplies to the
52
Table of Contents
workface and installing most utilities themselves. The total mine workforce at East Boulder
was to be reduced by more than 50%, from 539 down to 256 employees. Capital spending at the mine
was cut from the $19.1 million spent in 2008 to just $4.0 million budgeted for 2009, which included
only enough capital spending to keep the immediate mining areas functioning. The Company projected
that with these and other cost-cutting changes, the mine could operate at a cash breakeven level
given the PGM prices prevailing at the end of 2008.
By, almost any measure, the benefits of the Company’s corporate restructuring exceeded
expectations. The Company had initially projected total 2009 mine production from the two mines
would be about 496,000 ounces; the mines together produced 529,900 ounces in 2009. The Stillwater
Mine was budgeted to produce about 371,000 ounces and produced almost 393,800 ounces for the year.
Total cash costs at Stillwater were projected at $378 per ounce and averaged $344 per ounce,
benefiting from the mine’s improved productivity. Similarly, East Boulder production for 2009 was
budgeted at about 125,000 ounces at a cash cost of $461 per ounce; the mine produced 136,100 ounces
in 2009 at an average cash cost of $407 per ounce. Comparing East Boulder’s production in 2009 to
the prior year, 2008 output was 149,500 ounces, so despite reducing the workforce there by 50%,
2009 production at East Boulder only declined by 9%. Because of the higher productivities at East
Boulder, the mine also was able to accomplish substantially more development work than planned
during 2009, for the most part without bringing in any additional resources. While management
believes that these higher productivities should be sustainable in the future, mine production
would almost certainly decline over time without an increased level of spending for capital
development in 2010 and thereafter. Consequently, higher development spending is included in the
Company’s 2010 business plan.
In looking more closely at the improvement in cash cost per ounce at both mines, it appears
that about half of the cost reduction was attributable to lower prices for materials and energy
consumed in the operations, including steel, explosives, fuel and electricity, and to the
elimination of contract miners. Some portion of this savings might reasonably be expected to
reverse as the economy recovers and commodity prices rise. The remaining savings, however, was the
result of improved productivity — producing more ounces per labor hour worked. Because the miners
are incentivized to increase productivity, their individual compensation increases as a result of
these improvements — suggesting that a portion of these productivity gains may be sustainable
going forward.
A large share of the Company’s mine production is sold under a sales agreement with Ford Motor
Company that will expire at the end of 2010. Under this sales agreement, the Company has committed
80% of its mined palladium production and 70% of its mined platinum production during 2010 to Ford.
This agreement includes floor prices on palladium and platinum that have provided a measure of
financial protection to the Company during periods of low PGM prices. Unless this agreement is
renewed or replaced on similarly favorable terms, after 2010, the Company will be fully exposed to
the volatility of PGM market prices. Should the PGM markets experience a substantial and sustained
pricing downturn, in the absence of these floor prices the Company could be forced to curtail all
or a portion of its operations, the Company’s future financial performance could be impaired and
its ongoing viability called into question.
During 2009, the Company’s other long-term PGM supply agreement, with General Motors
Corporation, was rejected as part of the General Motors bankruptcy proceedings. The Company did
not have any outstanding receivables from General Motors at the time of the bankruptcy filing, but
rejection of the agreement did eliminate its pricing floor on palladium and therefore a portion of
the Company’s downside price protection. Loss of the GM agreement did not have any adverse
financial consequences on the Company during 2009, as the palladium price moved above the GM floor
price following the bankruptcy action.
To protect itself against the loss of the downside price protection in these long-term supply
agreements, the Company has taken a number of actions. Principal among these is a continuing
effort to drive down the cash cost of mining operations, thereby allowing the Company to maintain a
positive cash margin down to as low a pricing level as it can. Over the past several years, the
Company has invested heavily in the developed state of the two mines, getting ahead on mine
development so that if it became necessary to scale back capital expenditures for mine development
during a period of low PGM prices, the Company could do so without significantly impairing future
performance. The Company also has deliberately targeted to maintain a relatively strong corporate
liquidity position, providing a financial reserve in the event of a pricing downturn. And the
Company’s recycling operations, although sensitive to price, provide an added source of financial
support in addition to the mines. With all this, however, there is no certainty that the Company
would be able to survive an extended major decline in PGM prices in the absence of the contractual
pricing floors.
The Company recycles spent catalyst materials through its processing facilities in Columbus,
Montana, recovering palladium, platinum and rhodium from these materials. The recycling segment
has proven to be a profitable ancillary business that utilizes available capacity in the Company’s
smelting and refining facilities at minimal incremental cost to
53
Table of Contents
the Company. However, the recycling business has also proven to be very sensitive to PGM
prices, and volumes of recycling material available in the market have dropped very sharply when
PGM prices have declined as has profitability. During the price collapse in late 2008, some
entities in the recycling supply chain were caught with inventory on hand as prices declined,
apparently incurring substantial losses. The Company had made working capital advances to some of
these suppliers in this period to assist them in procuring recycling materials. At the end of
2008, the Company concluded that a substantial portion of these advances were no longer
collectible, and consequently the Company took a non-cash charge in 2008 of $26.0 million against
its advances on inventory purchases for recycling, reducing its 2008 profit in the recycling
segment to $6.7 million. Reflecting lower recycling volumes and PGM prices in 2009, recycling
segment earnings in 2009 totaled $5.9 million.
During 2009, the Company modified its recycling business model, increasing the percentage
of material that is toll processed for a fee on behalf of others, placing tighter restrictions on
cash advances to suppliers and broadening its base of direct suppliers. The volume of recycled
material available to the Company has gradually increased during 2009 as PGM prices have
strengthened. With this gradual volume growth, the Company has also seen inventory working capital
requirements begin to increase again. At the end of 2009, recycling working capital in inventories
and advances totaled $28.6 million, up from $22.1 million at the end of 2008 — but substantially
below the $176.9 million reported at June 30, 2008, before PGM prices collapsed. Supplier advances
outstanding at December 31, 2009, (excluding those written down at the end of 2008) totaled $3.6
million. A portion of these advances is secured by material in supplier inventory, but the
remainder is not secured and remains at risk. See “Business, Risk Factors and Properties — Risk
Factors — Reliance On Third Parties For Sourcing Of Recycling Materials And The Concentration Of
Recycling Sources Creates The Potential For Losses” for further discussion.
The Company’s recycling activities are substantially dependent on the availability in the
smelter of the copper and nickel contained in the mine concentrates. Copper and nickel bind with
the PGMs from recycling in the smelter and so aid in collecting the PGMs. Should it become
necessary at some point to reduce or suspend operations at the mines, the proportion of operating
costs allocated to the recycling segment could increase, making the recycling segment less
competitive. Further, in order to operate the smelter and refinery without significant volumes of
mine concentrates, modifications to the processing facilities would probably be required. There is
no assurance that the recycling facilities can operate profitably in the absence of significant
concentrates from the mines, or that capital would be available under those circumstances to
complete any necessary modifications to the processing facilities.
On March 12, 2008, the Company issued and sold $181.5 million aggregate principal amount of
senior convertible debentures due 2028. The terms of these debentures are described in more detail
in the section below entitled Convertible Debentures. On October 2, 2009, in a private
transaction the Company redeemed $15 million in principal value of these outstanding convertible
debentures in exchange for 1.84 million common shares of the Company. Management viewed this
transaction as slightly improving the Company’s long-term liquidity position on economically
advantageous terms, however, accounting principles required that the fair value of any shares
issued in such an exchange in excess of the 42.5351 shares per debenture conversion ratio specified
in the indenture be treated as expense. Consequently, the Company recognized a non-cash
“inducement loss” of $8.1 million on the exchange transaction.
2009 RESULTS AND COMMENTARY
The Company reported a net loss of $9.2 million for the year 2009, compared to a loss of
$116.9 million for the year 2008. For the fourth quarter of 2009, the Company incurred a loss of
$6.2 million, compared to a net loss of $133.8 million in the last quarter of 2008. The 2009
full-year results include charges of $10.9 million for lower-of-cost-or-market inventory
adjustments, a non-cash “inducement loss” of $8.1 million on the exchange of 1.84 million of the
Company’s common shares for $15 million face amount of the Company’s convertible debentures, and
$1.1 million to write-down uncollectible advances and receivables. The 2009 results reflect the
challenges of very low PGM prices early in 2009, with associated inventory adjustments and other
write-downs, followed by a gradual strengthening of PGM prices and improved performance as the year
progressed. As already noted, the fourth quarter of 2009 included an $8.1 million non-cash charge
for shares issued in exchange for debt. From a liquidity perspective, cash and cash equivalents
increased by $4.9 million during 2009, and short-term investments increased by $15.5 million.
During the fourth quarter of 2009, cash and cash equivalents decreased by $14.5 million, while
short-term investments increased by $15.5 million. A detailed comparison of these outcomes is
presented below in “Results of Operations — Year Ended December 31, 2009, Compared to Year Ended
December 31, 2008.”
During 2009, the Company’s mining operations produced a total of 529,900 ounces of palladium
and platinum, including 407,000 ounces of palladium and 122,900 ounces of platinum, exceeding both
initial guidance for the year of
54
Table of Contents
496,000 ounces and the most recent guidance of 515,000 ounces. This increase in mine
production primarily reflected higher than projected mining productivities at both operations.
In 2009, the Company processed 251,000 ounces of recycled PGMs in its smelting and refining
facilities, a 36.9% decrease from the 398,100 total ounces processed in 2008. The lower volumes
processed during 2009 reflect the decline in recycling volumes available generally following the
drop in PGM prices during the second half of 2008. During 2009, the Company restructured its
arrangements with its largest recycling supplier and broadened the base of suppliers it deals with
directly. The Company has also increased the percentage of tolling material it processes and has
restricted working capital advances significantly.
Capital spending was cut back severely in 2009, as the Company’s objective to remain at least
cash neutral during the economic downturn sharply limited the scope of mine development and
equipment purchases for the year. Actual 2009 capital expenditures of $39.5 million were about on
target with the Company’s public guidance for the year of about $39 million. Most of the 2009
capital was allocated to mine development initiatives necessary to support current production.
While spending at both mines for 2009 was budgeted short of the pace required to replace the proven
reserves mined during the year, with overall productivities significantly better, primary
development footage, while within the spending budget, was 25% ahead of plan at 15,900 feet. This
improvement in development productivity is significant, in that even with the sharp cutback in
development spending the Stillwater Mine was able to achieve adequate new development footage in
2009 to sustain its current level of production and the East Boulder Mine, once the benefit of its
restructuring was in place, achieved sustainable development rates in the fourth quarter of 2009.
The 2009 budget also included about $6.45 million to complete construction — started in 2008 — and
commission the second electric furnace at the smelter in Columbus.
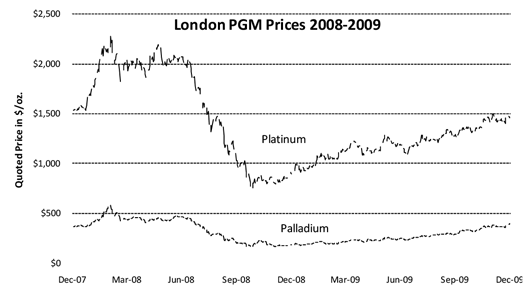
Following on a very volatile 2008, market prices for platinum and palladium gradually
recovered from their initial lows as 2009 progressed. As the chart above shows, announcements of
power shortages in South Africa early in 2008, on top of already robust commodity markets, created
something of a pricing bubble for PGMs during the first half of 2008. This reversed fairly abruptly
in the second half of 2008 as credit markets deteriorated and economic recession loomed. Combined
with severe financial pressures on and PGM inventory liquidations by the automotive industry, the
primary customer for PGMs, the economic situation brought PGM prices down steeply. The year 2009
saw some pricing stability gradually return, as investor interest in commodities as a store of
economic value and an inflation hedge served to spark some demand that took up slack from the
ailing automotive industry. As of December 31, 2009, palladium and platinum were quoted in London
at $393 and $1,461 per ounce, respectively; corresponding prices at December 31, 2008, were $183
per ounce for palladium and $898 per ounce for platinum.
Typically, the Company’s mines produce about 3.3 times as much palladium as platinum, a
relationship driven by the relative percentages of the two metals in the ore and by metal
recoveries achieved during processing. (See Note 2 to the Ore Reserves table on page 12 for a
discussion of the in-situ ratio of palladium to platinum in the ore. Floor and ceiling prices in
the Company’s sales agreements also affect the Company’s realizations. The Company’s average
realization per
55
Table of Contents
sold ounce on combined platinum and palladium sales from mining for 2009 was $549
per ounce, comprised of $365 per ounce for palladium and $1,137 per ounce for platinum; for the
fourth quarter of 2009, the corresponding average realization was $579 per ounce. This compares to
an average realization of $630 per platinum and palladium ounce sold for the full year 2008, and
$498 per ounce for the fourth quarter of 2008.
Putting these realizations into perspective, mining cost of sales for the full year 2009 —
including depreciation and amortization but excluding corporate overhead and adjusting for the
benefit of by-product revenues — averaged the equivalent of $497 per ounce, indicating a margin on
mining operations of about $52 per ounce. For the fourth quarter of 2009, with somewhat stronger
market prices, mining costs of sales net of by-product proceeds averaged $494 per ounce, for a
mining margin of about $85 per ounce. For the full year 2008, despite higher average realizations,
the corresponding mining margin on average was negative by about $12 per ounce (excluding the
impairment charge at East Boulder); and for the fourth quarter of 2008 the Company’s mining margin
was extremely negative at about $210 per ounce. While the improvement in margins in 2009 is
partially due to higher PGM prices, it also reflects significantly lower average mining expenses.
The Company’s reported loss for 2009 of $9.2 million was derived primarily from two sources.
The first, which has already been discussed, is the $8.1 million non-cash inducement loss recorded
during the fourth quarter in conjunction with the exchange of shares for debentures. The other
factor relates mostly to the first quarter, when for a time while
prices were low and the Company was still in the process of restructuring the mines, mining
costs exceeded the realizable value of production, resulting in lower-of-cost-or-market adjustments
to the amounts carried in inventory. Such adjustments during the 2009 first quarter totaled about
$9.8 million. Thereafter, as mining productivities improved and PGM prices increased, such
adjustments diminished both in frequency and in size.
Late in the third quarter of 2008, management recognized the urgent need to make substantial
changes to the Company’s operations in the face of looming heavy losses. In particular, there was
a need to resolve the cost picture at the East Boulder Mine. As a result, after considerable
debate, the East Boulder operating plan was radically restructured, introducing a leaner,
team-based mining approach, with each team intended to be more or less self sufficient and focused
on its specific mining area. A total of 47 miners were transferred from East Boulder to
Stillwater, allowing the Stillwater Mine to fully staff its mining operations and replace 32
higher-cost mining contractors with Company employees. The restructuring also required terminating
over 200 employees at the East Boulder Mine. These changes were implemented in December 2008.
Various other broad-based changes were implemented at about the same time to conserve
corporate cash. Capital expenditures and any discretionary expenditures were cut back sharply at
all locations, with development limited to only what was necessary to maintain current operations.
Staffing at all locations was revisited in an effort to bring support costs into line with recent
lower production levels. Contractors were replaced by Company employees wherever feasible. The
corporate office in Billings was closed, with the remaining corporate staff reassigned to offices
in Columbus or at the mines. The project to install a second electric furnace at the smelter was
reviewed, but was deemed far enough along and of sufficient strategic importance that it should be
completed with elements of the project restructured to save costs. Purchasing arrangements with
suppliers were also addressed to ensure competitive pricing terms.
The Company’s stated objective for 2009 was to remain at least cash neutral from an operating
perspective, without taking any benefit from cash generated by reductions in working capital
associated with the recycling business. The Company more than achieved this goal, growing balance
sheet cash and investments during 2009 by $20.4 million and in addition generating another $7.1
million that was reinvested into recycling working capital. However, because PGM prices rose
during the year, the question arises as to how much of the benefit is attributable to higher
prices. Based on the year-end PGM prices noted above as compared to average prices actually
realized in 2009, it appears that the benefit to the Company’s liquidity of the higher than planned
PGM prices during 2009 was about $31.5 million. That suggests that the Company would have been
within about $2 million of its objective of cash neutrality, even without the benefit of the higher
prices.
As part of its cash conservation effort during 2009, the Company scaled back capital
expenditures for mine development, reducing them temporarily to a level below that required to keep
proven reserves level in the face of ongoing mine production. Consequently, the Company’s ore
reserves declined, although modestly, during 2009. As in past years, the Company has engaged Behre
Dolbear as third party independent geological experts to review and express an expert opinion on
the Company’s ore reserve calculations. The Company performs its ore reserve economic assessment
using a twelve-quarter trailing price in order to level out short-term volatility in metals prices.
The Company regards the twelve-quarter trailing average as a reasonable surrogate for long-term
future PGM prices over the period
56
Table of Contents
when the reserves will be mined. The combined twelve-quarter
trailing weighted average price for platinum and palladium at December 31, 2009, was about $556 per
ounce. At this price, the Company’s geologic ore reserves at each mine can be shown to generate
(undiscounted) positive cash flow over the life of the reserve. Consequently, the Company’s ore
reserves were not constrained economically at December 31, 2009.
It is important to note that the Company’s ore reserve estimates are dependent upon PGM
prices, and should PGM prices decline for an extended period the trailing twelve-quarter price will
also decline. At a sufficiently low price level, the Company’s ore reserves might no longer
generate positive cash flows. Following the Company’s methodology, should prices fall there can be
no assurance that the Company’s reported proven and probable ore reserves will not be constrained
economically in the future. The Company’s efforts to restructure its mining operations are
intended to improve mining productivity and reduce average costs to a level that minimizes, to the
extent possible, the Company’s future exposure to potential periods of lower PGM prices.
The Company also has reviewed the carrying value of its assets for impairment at December 31,
2009. The Company determined that there have been no material events or changes in circumstances
during the fourth quarter of 2009, or subsequently, that indicate the likelihood of any impairment
of long-lived assets. In view of the economic situation at the end of 2008, the Company with
assistance from Behre Dolbear assessed the fair value of the East Boulder Mine assets as of
December 31, 2008, and concluded that a valuation adjustment was needed at that time.
Consequently, the Company’s
reported earnings at December 31, 2008, included a $67.3 million impairment charge that
reduced the carrying value of the East Boulder Mine assets to $161.4 million.
In December of 2009, Standard and Poor’s upgraded the Company’s debt rating from B- to B,
citing improved market conditions and adequate liquidity. Both Moody’s Investors Service and
Standard and Poor’s had downgraded the Company’s corporate credit rating by two notches during 2008
as economic conditions deteriorated. At issue has been the Company’s strong dependence on its
automotive agreements, lack of geographic or product diversity, metal market price volatility, and
difficult cost structure. In view of the current restrictive credit markets and the Company’s
strong liquidity position, management has elected to defer seeking to put a revolving credit
facility in place until market conditions improve. However, there is no assurance that the Company
will be successful in securing an adequate revolving credit facility when it does seek to do so.
The pending expiration of the Company’s supply agreement with Ford Motor Company at the end of
2010 creates exposure to any extended decline in PGM market prices. The floor price for palladium
in the Ford agreement has been a significant financial support for the Company during periods of
low PGM prices in the past. Although the Company may negotiate a replacement supply agreement with
Ford or other industry participants, it is not likely that analogous floor price provisions would
be included in such an agreement. Consequently, the Company has focused its strategic efforts on
positioning itself for life after the Ford agreement. To this end, the Company has been working to
improve the efficiency and productivity of its mining operations so that its competitiveness at low
PGM prices is correspondingly improved. Likewise, the Company has supported efforts to develop new
applications for PGMs and to open new markets for them, seeking to strengthen demand and so sustain
higher metals prices in the longer term. Continued efforts to diversify the Company, both
internally and externally, are intended to decrease the Company’s dependence on the price of just
one or two operations and one or two commodities for financial viability. Management continues to
focus on all of these objectives in preparing for a post-auto agreement environment and may
increase the level of resources applied to these efforts during 2010.
Statistically, the Company’s safety performance — a key management focus — during 2009 was
mixed, with excellent results at the East Boulder Mine but an increase in the reportable incident
rate at the Stillwater Mine. Overall, the Company’s rate of medical reportable incidents in 2009
was 4.1 incidents per 200,000 hours worked, up from the rate of 3.3 in 2008. Management is working
closely with the Company’s workforce in an effort to address this increase. Areas of specific
focus from a safety perspective include instilling and encouraging a cultural emphasis on safety,
enhancing pre-shift work place examinations, reviewing safety standards implementation and
compliance, standardizing accident/incident investigations and near miss reporting and designating
loss control representatives who are part of the mining workforce. Employee-led focus teams have
been successful in addressing many safety related challenges.
The Company’s environmental performance continued its excellent track record during 2009.
Environmental compliance is a very high priority in view of the pristine area in which the Company
operates. The Company has a record of open communication and cooperative, proactive involvement
with local and regional environmental groups. The Company’s ground-breaking 2000 Good Neighbor
Agreement with these groups provides a vehicle for facilitating such communication and addressing
issues cooperatively.
57
Table of Contents
In light of the recent Environmental Protection Agency’s determination to regulate carbon
dioxide emissions as hazardous to health, the Company has assessed its exposure to likely
restrictions on such emissions. The Company’s principal sources of CO2 emissions are
limited to a comparatively few internal combustion engines in vehicles and mining equipment, and to
stationary sources such as process heaters, dryers and converters that consume natural gas. The
Company already utilizes buses to transport its workforce to and from the mines and utilizes
biodiesel fuels in its operations in order to reduce its carbon footprint. Consequently, any taxes
or added restrictions on emissions are unlikely to have any direct material effect on the Company’s
operations. The Company’s physical exposure to climate change is minimal. The Company’s
operations are not materially dependent upon weather patterns or seasonal availability of water.
The relatively remote location of the mines presents some exposure to severe weather, particularly
winter snowfall that can restrict access to the mine sites, but the Company already regularly
addresses this issue during the winter months in Montana. Similarly, summer wildfires can
temporarily restrict access to the mines, but their duration tends to be relatively short.
Probably the Company’s most significant exposure to greenhouse gas regulation is the potential
consequence of a substantial longer-term movement away from internal combustion engines on the
demand for PGMs in catalytic converters. Such a major shift in automotive demand could depress PGM
prices and impair the Company’s financial performance. Regulatory constraints on other industries
also could affect the price or availability of electricity and other materials, driving up the
Company’s operating costs.
The Company’s mining permits require that, in conjunction with its mining and processing
activities, it must provide adequate financial surety in support of its permit obligations to
complete final reclamation and remediation once mining operations cease. As of December 31, 2009,
the Company had outstanding approximately $32.7 million of surety bonds and letters of credit in
favor of state and federal agencies to guarantee its final reclamation commitments. Regulatory
authorities are currently in the midst of updating an EIS, which when finalized will determine
whether or not the existing surety amounts are sufficient. In the interim, however, as the economy
weakened late in 2008, the Company agreed to increase its surety bonding by an additional $10
million as an interim measure to alleviate concerns aired by the agencies involved and to allow
time for the EIS to be completed. Upon completion of the EIS, it is likely that additional surety
increases will be required.
The shortages of skilled manpower and the high employee attrition rates that challenged the
Company during the strong commodities markets of 2006 through 2008 have abated with the economic
downturn in late 2008 and throughout 2009. As already noted, the restructuring at the East Boulder
Mine provided an opportunity to transfer skilled miners over to the Stillwater Mine, largely
alleviating the shortages there and allowing the Company to replace higher-cost contractors with
its own employees. The lower attrition rates have brought some stability to the Company’s mining
operations and undoubtedly contributed to the improved productivities seen during 2009. However,
this shift in the labor market has been driven mostly by lower metal prices and the weak economy,
and there is no assurance that the same challenges will not reappear as commodity prices recover.
Outlook
Looking forward, management projects that the Company’s mine production for 2010 will be about
515,000 ounces of palladium and platinum, generally in the same range as the Company’s guidance
given for 2009. During 2010, the Company will continue to focus on optimizing mining costs at both
operations rather than on maximizing production. However, as in 2009, there may be opportunity for
some upside on production as additional mining efficiencies are achieved. Total cash costs per
ounce (a non-GAAP measure of extraction efficiency) for 2010 are projected at $360, again in the
same range as was achieved during 2009. As already noted, the 2009 level of capital expenditures
was less than required to sustain the current level of mining operations over the longer term.
However, the improved mining efficiencies should help to provide sustainability going forward. The
heavy capital investment in 2005 through 2008 to expand the developed state of the mines had
positioned the Company well to endure the cut in capital spending in 2009 during economic downturn.
Total capital expenditures are expected to increase to about $50 million in 2010, which when
coupled with the higher development productivity should be adequate to sustain long-term operations
at the current production level.
These 2010 targets assume that PGM market prices on balance will continue to strengthen over
the longer term. Strong investment interest in PGMs lifted pricing somewhat during 2009 and may
cause it to continue to strengthen in 2010, but in the end there can be no sustainable recovery in
PGM pricing until the economy rebuilds enough momentum to free up consumer credit so the automotive
markets recover. Automotive and related demand for platinum and palladium in normal years
comprises around 50% of the market demand for these metals, so recovery of automotive demand is
critical to the supply/demand balance for PGMs.
58
Table of Contents
On the supply side of the industry, the recent economic downturn led to several higher-cost
PGM mines being placed on care and maintenance, with operations suspended at least until prices
recover sufficiently to justify reopening them. One of these properties, the Lac des Iles Mine in
Canada owned by North American Palladium, has announced recently that it will reopen sometime in
the first half of 2010. However, several other properties in South Africa remain shuttered,
constrained not only by weak platinum demand but also by a comparatively strong local currency that
has offset some of the recovery seen during 2009 in dollar-denominated metal prices. Reportedly,
reinvestment levels at existing mines and funding for new PGM exploration have also been severely
curtailed in the present environment. Palladium production at Norilsk Nickel in the past two or
three years also has fallen short of previous peak output levels, presumably reflecting a lower
average PGM grade in the mix of ores they are mining.
Once the automotive industry begins showing signs of recovery, the already improved PGM
pricing should benefit from the increased demand. Automobile industry sources have indicated that
substantial research effort over the past several years has gone into opportunities to substitute
palladium in applications that currently use platinum and rhodium. This substitution is expected
to benefit palladium, the Company’s principal product. Taken together with increasingly stringent
emission control regulations worldwide and continuing growth in vehicle demand in the developing
world, along with growing emphasis on recycling, management is reasonably optimistic regarding the
longer-term future of these businesses. This future is not without risks, however, and should the
present economic downturn worsen substantially or
extend for several years, the Company’s viability could be severely challenged — particularly
after the Ford agreement expires.
RESULTS OF OPERATIONS
YEAR ENDED DECEMBER 31, 2009 COMPARED TO YEAR ENDED DECEMBER 31, 2008
Revenues - The Company’s total revenues, including proceeds from the sale of by-products,
totaled $394.4 million in 2009, a decrease of 53.9% compared to revenues of $855.7 million in 2008.
This substantial year-on-year decline in total revenues reflects much lower recycling sales
volumes in 2009 as compared to 2008, as well as lower PGM realizations in 2009.
Revenues from mine production totaled $306.9 million in 2009 (including $23.6 million from
by-products), compared to $360.4 million in 2008 (of which $36.8 million was from by-products).
Palladium and platinum ounces sold from mine production were 515,700 in 2009, compared to 514,100
ounces in 2008 — essentially flat. The combined average realization on these palladium and
platinum sales (including the effects of hedging and of floor and ceiling prices in the underlying
agreements) was $549 per ounce in 2009 and $630 per ounce in 2008.
Revenues from PGM recycling declined 82.8% during 2009, to $81.8 million from $475.4 million
in 2008. Recycling ounces sold during 2009 totaled 102,000 ounces, a decrease of 62.9% compared to
the 275,000 ounces sold in 2008. The Company’s combined average realization on recycling sales
(which include palladium, platinum and rhodium) decreased substantially to $779 per ounce in 2009
from $1,715 per ounce in 2008, paralleling the drop in PGM prices generally. In addition to
purchased recycling material, the Company toll processed 128,000 ounces of PGMs during 2009, up
from 126,000 tolled ounces in 2008. Overall, recycling volumes processed during 2009 totaled
251,000 ounces of PGMs, down 36.9% from the 398,100 ounces processed in 2008, as weak PGM prices in
2009 reduced the volume of recycled catalytic converters available in the market.
In addition to mine and recycling sales, the Company recognized other revenue of $5.8 million
and $20.0 million for metal purchased in the open market and resold in 2009 and 2008, respectively.
Costs of Metals Sold — Cost of metals sold, which excludes depreciation expense, was $291.4
million in 2009, compared to $753.2 million in 2008, a 61.3% decrease. The largest share of this
decrease was attributable to recycling. Volumes of purchased recycling material were sharply lower
in 2009, which along with lower PGM prices reduced the total cost to purchase recycling material.
Overall, recycling cost of metals sold declined to $76.5 million in 2009 from $449.5 million in
2008. The average acquisition cost of metal purchased in the Company’s recycling segment
(including platinum, palladium and rhodium) decreased to $674 per ounce in 2009 from $1,534 per
ounce in 2008, reflecting lower PGM prices in 2009 in response to weakened demand from the
automotive sector.
During 2009, the Company’s mining operations produced 529,900 ounces of PGMs, including
407,000 ounces of palladium and 122,900 ounces of platinum. This represented a 6.2% increase from
2008, when the Company’s mining operations produced 498,900 ounces of PGMs, including 384,100 of
palladium and 114,800 ounces of platinum. The
59
Table of Contents
Stillwater Mine produced 393,800 ounces of PGMs in
2009, compared with 349,400 ounces of PGMs in 2008, a 12.7% increase. The East Boulder Mine
produced 136,100 ounces of PGMs in 2009, down 9.0% compared with the 149,500 ounces of PGMs
produced there in 2008, but the 2009 production was accomplished with less than 50% of the 2008
workforce.
The cost of metals sold from mine production, despite higher 2009 production, decreased to
$209.1 million in 2009, compared to $283.8 million in the prior year, a 26.3% improvement. The
Company’s mining costs decreased during 2009 mainly as a result of a lower level of employment,
lower prices for key consumables such as fuel, power, steel and explosives, improved efficiencies
in mining processes, much reduced reliance on contractors and redirection of mining out of some
higher-cost areas.
The cost of metals sold for metal purchased in the open market for resale was $5.7 million in
2009, compared to $19.9 million in 2008.
Depreciation and amortization - Depreciation and amortization expense was $70.4 million in
2009, compared to $83.0 million in 2008. To a large extent, the lower expense in 2009 was the
result of a $67.3 million impairment adjustment to the carrying value of the East Boulder Mine
taken at the end of 2008, resulting in lower amortization rates
in 2009.
Marketing - The Company reduced its market development efforts for palladium to some extent
during 2009. The Company spent $2.0 million in support of marketing programs during 2009, down
from $5.7 million in 2008.
General and administrative - Excluding marketing expenses discussed above, general and
administrative costs were $25.1 million in 2009, compared to $26.7 million in 2008, a 6.0%
decrease, as increased share-based compensation expense partially offset other corporate cost
reductions.
Other corporate costs — In 2009, corporate adjustments included a $1.1 million provision for
uncollectable receivables and advances and $0.1 million for marking investments to market. In
2008, such adjustments included a $67.3 million asset impairment write-down at the East Boulder
Mine, a $29.4 million provision for uncollectable receivables and advances (mostly associated with
recycling activities), a $3.4 million charge to mark investments to market, and $5.4 million for
restructuring costs.
Interest income and expense - Interest income decreased to $1.8 million in 2009 from $11.1
million in 2008, reflecting lower interest rates and much lower financing income on recycling
balances in 2009. The Company’s balance of cash and related liquid assets earning interest
increased to $201.2 million at December 31, 2009, from $180.8 million reported at December 31,
2008. Inventories and advances associated with recycling increased to $28.6 million at year-end
2009 from $22.1 million at the end of 2008. The Company’s outstanding long-term debt balance was
$196.0 million at December 31, 2009, down from $211.0 million at December 31, 2008. The decrease
in long-term debt was mostly attributable to a transaction which converted $15.0 million principal
balance of the Company’s convertible debentures into approximately 1.84 million shares of common
stock. The Company also paid off the final $0.1 million of principal on its education impact bonds
in May 2009. Interest expense declined to $6.8 million in 2009, from $9.7 million in 2008; the
Company replaced its outstanding credit facilities with a 1.875% convertible debenture offering in
March 2008.
Other comprehensive income (loss), net of tax - The Company recorded a gain in other
comprehensive income of $70,000 in 2009 compared to a gain of $5.9 million in 2008. The 2009 gain
represented unrealized gains on investments. The 2008 gain included $12.8 million of realized
hedging losses reclassified to income, partially offset by $6.3 million representing the change in
fair value of derivatives held, and $0.7 of unrealized losses on investments.
YEAR ENDED DECEMBER 31, 2008 COMPARED TO YEAR ENDED DECEMBER 31, 2007
Revenues - In view of the higher prices realized for the Company’s by-product sales in the
past several years, the Company modified its reporting for by-products in 2008 to include sales
proceeds from by-products within its sales revenues from mining. Previously, these proceeds were
netted against costs of revenues. The 2007 results discussed in the following comparison reflect
the reporting change.
The Company’s total revenues, including proceeds from the sale of by-products, totaled $855.7
million in 2008, compared to $673.0 million in 2007, a 27.1% increase. This increase was net of
hedging losses on forward sales of platinum of $12.8 million on 15,000 ounces hedged in 2008, and
$31.7 million on 98,500 ounces hedged in 2007. The
60
Table of Contents
increase in total revenues reflects
substantially higher average realized prices, particularly in the first six months of 2008, which
more than offset lower mine production sales volumes in 2008.
Revenues from mine production were $360.4 million in 2008 (including $36.8 million from
by-products), compared to $331.3 million in 2007 (of which $53.8 million was from by-products), an
8.8% increase. The increase was attributable to the higher realized market prices in early 2008
which more than made up for the lower volume of mined ounces sold in 2008. Platinum and palladium
ounces sold from mine production were 514,100 in 2008, compared to 544,800 ounces in 2007. The
average realization on these platinum and palladium sales (including the effects of hedging and of
floor and ceiling prices in the underlying agreements) was $630 per ounce in 2008 and $509 per
ounce in 2007. Reduced by-product revenues were generally due to lower sales in 2008, particularly
for rhodium and nickel.
Revenues from PGM recycling grew 45.6% during 2008, increasing to $475.4 million in 2008, from
$326.4 million in 2007. Recycled ounces sold increased in 2008 to 275,000 ounces compared to
245,000 ounces in 2007 and the Company’s combined average realization on recycling sales (which
include palladium, platinum and rhodium) increased to $1,715 per ounce in 2008 from $1,313 per
ounce in 2007. The Company processed increased volumes of recycled materials on a tolling basis in
2008. The Company toll processed 126,000 ounces of PGMs during 2008, up from 112,000 tolled ounces
in 2007. Total recycling volume increased to 398,100 ounces of PGMs in 2008 up 6.7% from 373,000
ounces in 2007.
The Company recognized other revenue of $20.0 million and $15.4 million for metal purchased in
the open market and resold in 2008 and 2007, respectively.
Costs of Metals Sold — Costs of metals sold, which excludes depreciation expense and no longer
includes credits for by-products, was $753.2 million in 2008, compared to $578.0 million in 2007, a
30.3% increase. Even though the volume of purchased recycling material increased from year to year,
significantly higher PGM prices drove up the acquisition cost of the material, which largely
accounted for an increase in recycling costs of metals sold to $449.5 million in 2008 from $306.8
million in 2007. The average acquisition cost of metal in the Company’s recycling segment
(including platinum, palladium and rhodium) increased to $1,534 per ounce in 2008 from $1,171 per
ounce in 2007, reflecting much higher 2008 average prices for PGMs, particularly for platinum and
rhodium.
During 2008, the Company’s mining operations produced 498,900 ounces of PGMs, including
384,100 and 114,800 ounces of palladium and platinum, respectively. This represents about a 7.2%
decrease from 2007, during which the Company’s mining operations produced 537,500 ounces of PGMs,
including 413,400 and 124,100 ounces of palladium and platinum, respectively. The Stillwater Mine
produced 349,400 ounces of PGMs in 2008, compared with 359,300 ounces of PGMs in 2007, a 2.8%
decrease. The East Boulder Mine produced 149,500 ounces of PGMs in 2008, compared with 178,200
ounces of PGMs in 2007, a 16.1% year-on-year decrease. The lower production in 2008 reflected the
restructuring at the East Boulder Mine and somewhat lower ore grades associated with the specific
mining areas in 2008 at the Stillwater Mine.
The costs of metals sold from mine production, despite lower 2008 production, increased to
$283.8 million in 2008, compared to $256.9 million in the prior year, a 10.5% increase. The
Company’s mining costs increased during 2008 mostly as a result of higher commodity prices for
materials consumed in mining.
The costs of metals sold on palladium purchases for resale was $19.9 million in 2008, compared
to $14.3 million in 2007.
Depreciation and amortization - Depreciation and amortization expense was $83.0 million in
2008, compared to $82.5 million in 2007. Although amortization rates per ton mined were generally
higher in 2008 than in 2007, the lower tonnage produced in 2008 more than offset the effect of the
higher tonnage rates.
Exploration — The Company participated in several early stage exploration programs during 2008
and 2007, spending $2.5 million and $1.1 million to meet commitments under these programs during
2008 and 2007, respectively. In addition, the Company expended $0.9 million in 2008 and $1.7
million in 2007 toward equity investments in exploration companies. During 2008, the Company also
wrote down a portion of its equity investments in these ventures to fair value, taking charges
totaling nearly $3.4 million.
Marketing - The Company continued its market development efforts for palladium during 2008,
largely in support of the Palladium Alliance International, spending $5.7 million on marketing, up
slightly from $5.6 million in 2007.
61
Table of Contents
General and administrative - General and administrative costs were $24.2 million in 2008,
compared to $21.8 million in 2007, an 11.0% increase, reflecting higher payroll and contractor
costs. In addition to these costs, the Company separately incurred about $5.4 million in
restructuring costs during 2008, mostly associated with employee and contract terminations and
re-location of the Billings corporate office.
Other corporate costs — In 2008, such adjustments included a $67.3 million asset impairment
write-down at the East Boulder Mine, a $29.4 million provision for uncollectable receivables and
advances (mostly associated with recycling activities), a $3.4 million charge to mark investments
to market, and $5.4 million for restructuring costs.
Interest income and expense - Interest income decreased to $11.1million in 2008 from $11.7
million in 2007, on the result of lower recycling balances in the last quarter of 2008. The
Company’s balance of cash and related liquid assets earning interest increased to $180.8 million at
December 31, 2008, from $89.0 million reported at December 31, 2007. This increase was partially
attributable to decreases in working capital in the Company’s recycling segment that resulted from
lower PGM prices and lower inventories later in the year. Inventories and advances associated with
recycling decreased to $22.1 million at year-end 2008 from $86.7 million at the end of 2007. The
Company outstanding long-term debt balance was $211.0 million at December 31, 2008, up from $128.0
million at December 31, 2007. The Company replaced its debt facilities during 2008, increasing the
level of borrowings by about $83 million. The added borrowings
helped the Company accommodate significant growth in its recycling segment during the first
nine months of 2008.
Interest expense declined to $9.7 million in 2008, from $11.3 million in 2007 as the increased
debt balances partially offset the benefit of much lower interest rates. The 2008 expense included
$2.2 million of unamortized financing costs that were written off in conjunction with the Company’s
refinancing.
Total income tax provision - The Company recorded a small tax benefit of $32,000 in 2008
related to a refundable minimum tax credit and only a de minimis income tax expense in 2007,
reflecting certain state minimum taxes paid. Changes in the Company’s net deferred tax assets have
been offset by the change in the related valuation allowance, as the Company does not project any
opportunity to benefit from its tax loss carry-forwards.
Other comprehensive income (loss), net of tax - The Company recorded a gain in other
comprehensive income of $5.9 million in 2008 compared to a gain of $9.6 million in 2007. The 2008
gain included $12.8 million of realized hedging losses reclassified to income, partially offset by
$6.3 million representing the change in fair value of derivatives held, and $0.7 million of
unrealized losses on investments. The 2007 gain included $31.7 million of realized hedging losses
reclassified to income, partially offset by $22.4 million representing the change in fair value of
derivatives held, and $0.3 of unrealized gains on investments.
LIQUIDITY AND CAPITAL RESOURCES
For 2009, net cash provided by operating activities was $59.7 million compared to $114.2
million and $56.4 million for 2008 and 2007, respectively. The Company’s net cash flow from
operating activities is affected by several key factors, including net realized prices for its
products, cash costs of production, and the level of PGM production from the mines.
The $9.2 million reported loss for 2009 included $103.3 million of non-cash charges, including
$70.4 million of depreciation and amortization, $14.4 million of stock compensation expense, $8.1 million stock issuance expense related to the debt to equity transaction, and $10.9
million of lower-of-cost-or-market inventory adjustments.
At December 31, 2009, the Company’s available balance of cash and cash equivalents (excluding
restricted cash) was $166.7 million and it reported $196.0 million of debt outstanding. If highly
liquid short-term investments are included with available cash, the Company’s balance sheet
liquidity at December 31, 2009, increases to $201.2 million. Corresponding balances at December
31, 2008, included $161.8 million of available cash and cash equivalents, $211.0 million of
outstanding debt, and available cash plus liquid investments of $180.8 million. The Company
exchanged $15 million face amount of its outstanding convertible debentures for about 1.84 million
common shares during the fourth quarter of 2009. The remaining $166.5 million of convertible
debentures will reach their date of first call in March 2013, and the Company believes most holders
are likely to convert their debentures or redeem them at par at that time.
The Company, at interest rate levels prevailing at December 31, 2009, will be required to fund
approximately $5.5 million in total interest payments during 2010 related to its outstanding debt
obligations. No principal payments against outstanding debt are scheduled to come due in 2010. In
view of the current restrictive credit environment and relatively
62
Table of Contents
high risk spreads, the Company
has chosen not to put in place a revolving credit agreement at this time. While the lack of a
credit agreement may create some vulnerability, the Company believes that its liquidity on hand is
adequate to cover its needs for the foreseeable future.
During the fourth quarter of 2009, the Company filed a $450 million shelf registration
statement. The registration became effective on December 8, 2009, and permits the Company to issue
any of various public debt or equity instruments for financing purposes so long as the registration
statement remains effective. The Company has no immediate plans to issue securities under the
shelf registration, but management believes that the shelf may facilitate access to additional
liquidity in the future. However, there is no assurance that debt or equity capital would be
available to the Company in the public markets should the Company determine to issue securities
under the shelf registration.
The Company’s financial performance is affected by changes in PGM prices. At the PGM price
levels prevailing at December 31, 2009, absent separate hedging arrangements, any change in the
price of platinum generally would flow through almost dollar-for-dollar to cash flow from
operations, subject only to (1) price ceilings on 14% of the mines’ platinum production to be sold
under the Company’s sales agreement, and (2) certain costs — severance taxes and royalties on mine
production — which adjust upward or downward with market prices. At the December 31, 2009,
closing platinum
price of $1,466 per ounce and 2009 production levels, the annual effect of the price ceiling
would be to reduce the Company’s revenue by about $10.6 million.
Under the Company’s sales agreement for mined production, a change in the market price of
palladium also would flow through directly to cash flow from operations, subject only to (1) floor
prices affecting 70% of the Company’s sales from mine production, and (2) an offset for severance
taxes and royalties that are based on the realized price. At the December 31, 2009, closing
palladium price of $393 per ounce, the contractual floor prices would have no effect on revenues.
In the Company’s recycling activities, upon purchasing recycled material for processing the
Company simultaneously enters into a fixed forward contract that determines the future selling
price of the contained PGMs, effectively locking in a sales margin. So for outstanding recycling
lots, a change in the market price of platinum and palladium on sales of recycling materials would
have little or no effect on margins earned from this activity and on cash flow from operations.
However, a general change in market prices would affect margins on future purchases by about the
same percentage as the change in price. It normally takes existing lots of recycling material two
to three months from the date of receipt to flow through to sales.
Changes in the cash costs of production generally flow through dollar-for-dollar into cash
flow from operations. A reduction due to grade in total mine production of 10%, or just over
50,000 ounces per year, would reduce cash flow from operations by an estimated $30 million per year
at the price and cost levels prevailing at December 31, 2009.
Net cash used in investing activities was $54.7 million, $74.6 million and $81.0 million in
2009, 2008 and 2007, respectively. The Company’s investing activities primarily represent capital
expenditures and net sales and purchases of short term investments. Capital expenditures totaled
$39.5 million, $82.3 million and $87.9 million in 2009, 2008 and 2007, respectively. The Company
also expended $0.9 million and $1.7 million to acquire equity interests in two small exploration
companies during 2008 and 2007, respectively. No exploration investments were made in 2009.
All significant company-wide repair and maintenance costs in connection with planned major
maintenance activities are expensed as incurred. The Company does not accrue in advance for major
maintenance activities, but, when practicable, tries to disclose in advance in its public filings
any planned major maintenance activities that may affect operations.
Net cash used in financing activities was a net $0.1 million and $2.4 million in 2009 and
2007, respectively, compared to net cash provided by financing activities of $60.7 million in 2008.
Convertible Debentures
On March 12, 2008, the Company issued and sold $181.5 million aggregate principal amount of
senior convertible debentures due 2028 (debentures). The debentures pay interest at 1.875% per
annum, payable semi-annually on March 15 and September 15 of each year, commencing September 15,
2008. The debentures will mature on March 15, 2028, subject to earlier repurchase or conversion.
Each $1,000 principal amount of debentures is initially convertible, at the option of the holders,
into approximately 42.5351 shares of the Company’s common stock, at any time prior to the
63
Table of Contents
maturity
date. The conversion rate is subject to certain adjustments, but will not be adjusted for accrued
interest or any unpaid interest. The conversion rate initially represents a conversion price of
$23.51 per share. Holders of the debentures may require the Company to repurchase all or a portion
of their debentures on March 15, 2013, March 15, 2018 and March 15, 2023, or upon the occurrence of
certain events including a change in control. The Company may redeem the debentures for cash
beginning on or after March 22, 2013.
The debentures were sold to an “accredited investor” within the meaning of Rule 501 under the
Securities Act of 1933, as amended (the “Securities Act”), in reliance upon the private placement
exemption afforded by Section 4(2) of the Securities Act. The initial investor offered and resold
the debentures to “qualified institutional buyers” under Rule 144A of the Securities Act. An
affiliate of MMC Norilsk Nickel, with the approval of the Company’s independent directors,
purchased $80 million of the debentures, thereby maintaining its majority ownership position in the
Company.
In October 2009, the Company undertook the exchange of $15 million face amount of the
convertible debentures in exchange for 1.84 million shares of the Company’s common stock. The
debentures so acquired have been retired, leaving $166.5 million face value of the debentures
outstanding at December 31, 2009.
CONTRACTUAL OBLIGATIONS
The Company is obligated to make future payments under various contracts such as its debt
agreements. The following table represents significant contractual cash obligations and other
commercial commitments and the related interest payments as of December 31, 2009:
| (in thousands) | 2010 | 2011 | 2012 | 2013 | 2014 | Thereafter | Total | |||||||||||||||||||||
Convertible debentures |
$ | — | $ | — | $ | — | $ | 166,500 | $ | — | $ | — | $ | 166,500 | ||||||||||||||
Exempt Facility Revenue Bonds |
— | — | — | — | — | 30,000 | 30,000 | |||||||||||||||||||||
Operating leases |
303 | 303 | 297 | 264 | 233 | — | 1,400 | |||||||||||||||||||||
Asset retirement obligations |
— | — | — | — | — | 144,271 | 144,271 | |||||||||||||||||||||
Payments of interest (1) |
5,522 | 5,522 | 5,522 | 3,961 | 2,400 | 13,200 | 36,127 | |||||||||||||||||||||
Other noncurrent liabilities |
— | 8,592 | — | — | — | — | 8,592 | |||||||||||||||||||||
Total |
$ | 5,825 | $ | 14,417 | $ | 5,819 | $ | 170,725 | $ | 2,633 | $ | 187,471 | $ | 386,890 | ||||||||||||||
| (1) | Interest payments on the convertible debentures noted in the above table are calculated up to March 15, 2013, the date the holders of the debentures can exercise their put option. |
Interest payments noted in the table above assume no changes in interest rates. Amounts
included in other noncurrent liabilities that are anticipated to be paid in 2011 include workers’
compensation costs, property taxes and severance taxes.
FACTORS THAT MAY AFFECT FUTURE RESULTS AND FINANCIAL CONDITION
Some statements contained in this report are forward-looking statements within the meaning of
Section 27A of the Securities Act of 1933, as amended, and Section 21E of the Securities Exchange
Act of 1934, as amended, and, therefore, involve uncertainties or risks that could cause actual
results to differ materially. These statements may contain words such as “desires,” “believes,”
“anticipates,” “plans,” “expects,” “intends,” “estimates” or similar expressions. These statements
are not guarantees of the Company’s future performance and are subject to risks, uncertainties and
other important factors that could cause its actual performance or achievements to differ
materially from those expressed or implied by these forward-looking statements. Such statements
include, but are not limited to, comments regarding the duration and overall effects of the current
worldwide financial and credit crises, the effects of restructuring the Company’s operations and
maintaining a skilled work force, the automotive market and the health of the automobile
manufacturers, expansion plans and realignment of operations, costs, grade, production and recovery
rates, permitting, labor matters, financing needs and the terms of future credit facilities,
capital expenditures, increases in processing capacity, cost reduction measures, safety, timing for
engineering studies, and environmental permitting, and compliance, litigation and the palladium and
platinum market. Additional information regarding factors that could cause results to differ
materially from management’s expectations is found in the section entitled “Business, Risk Factors
and Properties — Risk Factors” above.
The Company intends that the forward-looking statements contained herein be subject to the
above-mentioned statutory safe harbors. Investors are cautioned not to rely on forward-looking
statements. The Company disclaims any
64
Table of Contents
obligation to update forward-looking statements.
CRITICAL ACCOUNTING POLICIES
Mine Development Expenditures — Capitalization and Amortization
Mining operations are inherently capital intensive, generally requiring substantial capital
investment for the initial and concurrent development and infrastructure of the mine. Many of
these expenditures are necessarily incurred well in advance of actual extraction of ore.
Underground mining operations such as those conducted by the Company require driving tunnels and
sinking shafts that provide access to the underground ore body and construction and development of
infrastructure, including electrical and ventilation systems, rail and other forms of
transportation, shop facilities, material handling areas and hoisting systems. Ore mining and
removal operations require significant underground facilities used to conduct mining operations and
to transport the ore out of the mine to processing facilities located above ground.
Contemporaneously with mining, additional development is undertaken to provide access to
ongoing extensions of the ore body, allowing more ore to be produced. In addition to the
development costs that have been previously incurred, these ongoing development expenditures are
necessary to access and support all future mining activities.
Mine development expenditures incurred to date to increase existing production, develop new
ore bodies or develop mineral property substantially in advance of production are capitalized.
Mine development expenditures consist of vertical shafts, multiple surface adits and underground
infrastructure development including footwall laterals, ramps, rail and transportation, electrical
and ventilation systems, shop facilities, material handling areas, ore handling facilities,
dewatering and pumping facilities. Many such facilities are required not only for current
operations, but also for all future planned operations.
Expenditures incurred to sustain existing production and access specific ore reserve blocks or
stopes provide benefit to ore reserve production over limited periods of time (secondary
development) and are charged to operations as incurred. These costs include ramp and stope access
excavations from primary haulage levels (footwall laterals), stope material rehandling/laydown
excavations, stope ore and waste pass excavations and chute installations, stope ventilation raise
excavations and stope utility and pipe raise excavations.
The Company calculates amortization of capitalized mine development costs by the application
of an amortization rate to current production. The amortization rate is based upon un-amortized
capitalized mine development costs, and the related ore reserves. Capital development expenditures
are added to the un-amortized capitalized mine development costs as the related assets are placed
into service. In the calculation of the amortization rate, changes in ore reserves are accounted
for as a prospective change in estimate. Ore reserves and the further benefit of capitalized mine
development costs are based on significant management assumptions. Any changes in these
assumptions, such as a change in the mine plan or a change in estimated proven and probable ore
reserves could have a material effect on the expected period of benefit resulting in a potentially
significant change in the amortization rate and/or the valuations of related assets. The Company’s
proven ore reserves are generally expected to be extracted utilizing its existing mine development
infrastructure. Additional capital expenditures will be required to access the Company’s estimated
probable ore reserves. These anticipated capital expenditures are not included in the current
calculation of depreciation and amortization.
The Company’s method of accounting for development costs is as follows:
| • | Unamortized costs of the shaft at the Stillwater Mine and the initial development at the East Boulder Mine are treated as life-of-mine infrastructure costs, amortized over total proven and probable reserves at each location, and | ||
| • | All ongoing development costs of footwall laterals, ramps and associated facilities are amortized over the ore reserves in the immediate and geologically relevant vicinity of the development. |
The calculation of the amortization rate, and therefore the annual amortization charge to
operations, could be materially affected to the extent that actual production in the future is
different from current forecasts of production based on proven and probable ore reserves. This
would generally occur to the extent that there were significant changes in any of the factors or
assumptions used in determining ore reserves. These factors could include: (1) an expansion of
proven and probable ore reserves through development activities, (2) differences between estimated
and actual costs of mining due to differences in grade or metal recovery rates, and (3) differences
between actual commodity
prices and commodity
65
Table of Contents
price assumptions used in the estimation of ore
reserves.
Asset Impairment
The Company reviews and evaluates its long-lived assets for impairment when events or changes
in circumstances indicate that the related carrying amounts may not be recoverable. Impairment is
considered to exist if total estimated future cash flows on an undiscounted basis are less than the
carrying amount of the asset. The estimation of future cash flows takes into account estimates of
recoverable ounces, PGM prices (long-term sales contract prices and historical pricing trends or
third party projections of future prices rather than prices at a point in time as an indicator of
longer-term future prices), production levels, and capital and reclamation expenditures, all based
on life-of-mine plans and projections. If the assets are impaired, a calculation of fair market
value is performed, and if fair market value is lower than the carrying value of the assets, the
assets are reduced to their fair market value.
Income Taxes
Income taxes are determined using the asset and liability approach. This method gives
consideration to the future tax consequences of temporary differences between the financial
reporting basis and the tax basis of assets and liabilities based on currently enacted tax rates.
Deferred tax assets and liabilities are measured using enacted tax rates expected to apply to
taxable income in the years in which those temporary differences are expected to be recovered or
settled. The effect on deferred tax assets and liabilities of a change in tax rates is recognized
in income in the period that includes the enactment date.
In assessing the realizability of deferred tax assets, management considers whether it is more
likely than not that some portion or all of the deferred tax assets will not be realized. Each
quarter, management considers the scheduled reversal of deferred tax liabilities, projected future
taxable income, and tax planning strategies in making this assessment. A valuation allowance has
been provided at December 31, 2009 and 2008, for the portion of the Company’s net deferred tax
assets for which it is more likely than not that they will not be realized. Based on the Company’s
current financial projections, and in view of the level of tax depreciation and depletion
deductions available, it appears unlikely that the Company will owe any income taxes for the
foreseeable future. However, if average realized PGM prices were to increase substantially in the
future, the Company could owe income taxes prospectively on the resulting higher taxable income.
Post-closure Reclamation Costs
The Company recognizes the fair value of a liability for an asset retirement obligation in the
period in which it is incurred if a reasonable estimate of fair value can be made. The fair value
of the liability is added to the carrying amount of the associated asset and this additional
carrying amount is depreciated over the life of the asset. The liability is accreted at the end of
each period through charges to operating expense. If the obligation ultimately is settled for
other than the carrying amount of the liability, the Company will recognize a gain or loss at the
time of settlement.
Accounting for reclamation obligations requires management to make estimates for each mining
operation of the future costs the Company will incur to complete final reclamation work required to
comply with existing laws and regulations. Actual costs incurred in future periods could differ
from amounts estimated. Additionally, future changes to environmental laws and regulations could
increase the extent of reclamation and remediation work that the Company is required to perform.
Any such increases in future costs could materially impact the amounts charged to operations for
reclamation and remediation.
The Company reviewed its asset retirement assumptions at December 31, 2009, and recorded a
reduction of $0.6 million and $0.8 million for the Stillwater Mine and the East Boulder Mine,
respectively, due to an increase in the estimated mine lives of both mines. See Note 16 “Asset
Retirement Obligation” to the Company’s 2009 audited financial statements for further information.
Derivative Instruments
The Company from time to time enters into derivative financial instruments, including fixed
forward sales, cashless put and call option collars and financially settled forward sales to manage
the effect of changes in the prices of palladium and platinum on the Company’s revenue.
Derivatives are reported on the balance sheet at fair value and, if the derivative is not
designated as a hedging instrument, changes in fair value are recognized in earnings in the period
of change. If the
66
Table of Contents
derivative is designated as a hedge and to the extent such hedge is determined
to be highly effective, changes in fair value are either (a) offset by the change in fair value of
the hedged asset or liability (if applicable) or (b) reported as a component of other comprehensive
income in the period of change, and subsequently recognized in the determination of net income in
the period the offsetting hedged transaction occurs. The Company primarily uses derivatives to
hedge metal prices and to manage interest rate risk. The Company also enters into financially
settled forwards related to its recycling segment which are not accounted for as cash flow hedges.
The realized and unrealized gains or losses are recognized in net income in each period. See Note
6 “Derivative Instruments” to the Company’s 2009 audited financial statements for further
information.
ITEM 7A
QUANTITATIVE AND QUALITATIVE DISCLOSURE ABOUT MARKET RISK
QUANTITATIVE AND QUALITATIVE DISCLOSURE ABOUT MARKET RISK
The Company is exposed to market risk, including the effects of adverse changes in metal
prices and interest rates as discussed below.
COMMODITY PRICE RISK
The Company produces and sells palladium, platinum and associated by-product metals directly
to its customers and also through third parties. As a result, financial performance can be
materially affected when prices for these commodities fluctuate. In order to manage commodity
price risk and to reduce the impact of fluctuation in prices, the Company enters into long-term
contracts and from time to time uses various derivative financial instruments. Because the Company
hedges only with instruments that have a high correlation with the value of the hedged
transactions, changes in the fair value of the derivatives are expected to be highly effective in
offsetting changes in the value of the hedged transaction.
The Company has a sales agreement with Ford Motor Company that covers a significant portion of
the Company’s mined PGM production through December 2010 and stipulates floor and ceiling prices
for metal delivered. The Company from time to time also purchases platinum and rhodium in the open
market for resale under various supply arrangements. See “Business, Risk Factors and Properties —
Current Operations — PGM Sales and Hedging ” and Note 6 “Derivative Instruments” to the Company’s
2009 audited financial statements for a more detailed discussion of the Company’s open positions.
In July of 2009, a long-term PGM supply agreement between the Company and General Motors
Corporation was rejected by General Motors through its bankruptcy process. This agreement
contained guaranteed minimum selling prices for palladium ounces delivered under the agreement that
provided the Company with a measure of financial protection during periods of low palladium prices.
While the Company did not incur any direct financial loss during 2009 as a result of the rejection
of the General Motors supply agreement, loss of the agreement does increase the Company’s exposure
to PGM market volatility on about 20% of its mined palladium sales.
The Company’s remaining long-term automotive supply agreement with Ford Motor Company is
scheduled to expire on December 31, 2010. The floor prices in that agreement apply to 70% of the
Company’s mined platinum ounces and 80% of the Company’s mined palladium ounces. If the Ford
agreement is not renegotiated or replaced on terms similar to those in the existing agreement, then
once the existing agreement expires, the Company’s mining revenues will be fully exposed to
prevailing market prices. In the current economic environment, the Company believes it is unlikely
that any replacement PGM supply agreement, whether or not with Ford, will include terms comparable
to those in the existing agreement. Consequently, without these pricing provisions, the risk will
increase that the Company may not be able to operate profitably during future downturns in PGM
prices.
The fair value of the Company’s principal long-lived assets is determined in part by the value
the market assigns to the Company’s underlying ore reserves. These values are sensitive to changes
in market prices for PGMs. The Company reviews and evaluates its long-lived assets for impairment
when events and changes in circumstances indicate that the related carrying amounts of its assets
may not be recoverable. The Company has reviewed its operations at December 31, 2009, and
concluded that there was no material event or change in circumstances that would require a review
of the Company’s long-lived assets for impairment. Upon performing a similar review at December
31, 2008, the Company recorded an impairment provision reducing the East Boulder operations’
carrying value by $67.3 million in 2008. In the future, if PGM prices were to decline and remain
depressed for a sustained period, the Company could face additional impairment adjustments to the
carrying values of its long-lived assets.
67
Table of Contents
The Company from time to time enters into fixed forward sales and financially settled forward
sales transactions that may or may not be accounted for as cash-flow hedges to mitigate the price
risk in its PGM recycling and mine production activities. In fixed forward transactions, normally
metals contained in spent catalytic materials are sold forward at the time the materials are
purchased and then are delivered against the fixed forward contracts when the finished ounces are
recovered. The Company has elected to account for these transactions as normal purchases and
normal sales. Financially settled forward sales provide another mechanism to offset fluctuations
in metal prices associated with future production, particularly in circumstances where the Company
elects to retain control of the final disposition of the metal. In financially settled forward
sales, the parties agree in advance to a net financial settlement in the future based on the
difference between the market price of the metal on the settlement date and a forward price set at
inception. Consequently, at the settlement date, the Company receives the difference between the
forward price and the market price if the market price is below the forward price, and the Company
pays the difference between the forward price and the market price if the market price is above the
forward price. No metal changes hands between the parties in these financially settled
transactions. The Company generally has accounted for financial settled forward transactions as
cash flow hedges. However, if the Company determines not to document them as cash flow hedges,
these transactions are
marked to market in each accounting period and the realized and unrealized gains or losses are
recognized in net income in each period. As of December 31, 2009 and 2008, the Company was not
party to any financially settled forward agreements.
From time to time the Company also enters into financially settled forwards related to its
recycling segment which are not accounted for as cash flow hedges. The realized and unrealized
gains or losses are recognized in net income in each period. All commodity instruments outstanding
at December 31, 2009, are expected to be settled within the next five months. See Note 6
"Derivative Instruments” to the Company’s 2009 audited financial statements for further
information.
INTEREST RATE RISK
At December 31, 2009, all of the Company’s outstanding long-term debt was subject to fixed
rates of interest. Interest income on payments to the Company’s recycling suppliers is generally
linked to short-term inter-bank rates.
The Company’s convertible debentures do not contain financial covenants, other than change in
control protection and investor make-whole provisions. Consequently, the Company is not subject to
conventional financial covenants at this time.
The Company’s financial performance depends significantly on the automotive industry’s need
for PGMs in catalytic converters. Generally, about 50% of the demand for palladium and platinum is
generated by catalytic converter requirements. Should existing or future regulations limiting
greenhouse gas emissions result in a substantial longer-term shift away from internal combustion
engines in automobiles, the resulting drop in demand could depress PGM prices and impair the
Company’s financial performance.
68
Table of Contents
ITEM 8
FINANCIAL STATEMENTS AND SUPPLEMENTARY DATA
FINANCIAL STATEMENTS AND SUPPLEMENTARY DATA
Report of Independent Registered Public Accounting Firm
The Board of Directors and Stockholders
Stillwater Mining Company:
Stillwater Mining Company:
We have audited the accompanying balance sheets of Stillwater Mining Company as of December 31,
2009 and 2008, and the related statements of operations and comprehensive loss, changes in
stockholders’ equity, and cash flows for each of the years in the three-year period ended December
31, 2009. These financial statements are the responsibility of the Company’s management. Our
responsibility is to express an opinion on these financial statements based on our audits.
We conducted our audits in accordance with the standards of the Public Company Accounting Oversight
Board (United States). Those standards require that we plan and perform the audit to obtain
reasonable assurance about whether the financial statements are free of material misstatement. An
audit includes examining, on a test basis, evidence supporting the amounts and disclosures in the
financial statements. An audit also includes assessing the accounting principles used and
significant estimates made by management, as well as evaluating the overall financial statement
presentation. We believe that our audits provide a reasonable basis for our opinion.
In our opinion, the financial statements referred to above present fairly, in all material
respects, the financial position of Stillwater Mining Company as of December 31, 2009 and 2008, and
the results of its operations and its cash flows for each of the years in the three-year period
ended December 31, 2009, in conformity with U.S. generally accepted accounting principles.
We also have audited, in accordance with the standards of the Public Company Accounting Oversight
Board (United States), Stillwater Mining Company’s internal control over financial reporting as of
December 31, 2009, based on criteria established in Internal Control — Integrated Framework issued
by the Committee of Sponsoring Organizations of the Treadway Commission (COSO), and our report
dated February 26, 2010 expressed an unqualified opinion on the effectiveness of the Company’s
internal control over financial reporting.
\s\ KPMG LLP
Billings, Montana
February 26, 2010
February 26, 2010
69
Table of Contents
Report of Independent Registered Public Accounting Firm
The Board of Directors and Stockholders
Stillwater Mining Company:
Stillwater Mining Company:
We have audited Stillwater Mining Company’s internal control over financial reporting as of
December 31, 2009, based on criteria established in Internal Control — Integrated Framework issued
by the Committee of Sponsoring Organizations of the Treadway Commission (COSO). Stillwater Mining
Company’s management is responsible for maintaining effective internal control over financial
reporting and for its assessment of the effectiveness of internal control over financial reporting,
included in the accompanying Management Report on Internal Control over Financial Reporting. Our
responsibility is to express an opinion on the Company’s internal control over financial reporting
based on our audit.
We conducted our audit in accordance with the standards of the Public Company Accounting Oversight
Board (United States). Those standards require that we plan and perform the audit to obtain
reasonable assurance about whether effective internal control over financial reporting was
maintained in all material respects. Our audit included obtaining an understanding of internal
control over financial reporting, assessing the risk that a material weakness exists, and testing
and evaluating the design and operating effectiveness of internal control based on the assessed
risk. Our audit also included performing such other procedures as we considered necessary in the
circumstances. We believe that our audit provides a reasonable basis for our opinion.
A company’s internal control over financial reporting is a process designed to provide reasonable
assurance regarding the reliability of financial reporting and the preparation of financial
statements for external purposes in accordance with generally accepted accounting principles. A
company’s internal control over financial reporting includes those policies and procedures that (1)
pertain to the maintenance of records that, in reasonable detail, accurately and fairly reflect the
transactions and dispositions of the assets of the company; (2) provide reasonable assurance that
transactions are recorded as necessary to permit preparation of financial statements in accordance
with generally accepted accounting principles, and that receipts and expenditures of the company
are being made only in accordance with authorizations of management and directors of the company;
and (3) provide reasonable assurance regarding prevention or timely detection of unauthorized
acquisition, use, or disposition of the company’s assets that could have a material effect on the
financial statements.
Because of its inherent limitations, internal control over financial reporting may not prevent or
detect misstatements. Also, projections of any evaluation of effectiveness to future periods are
subject to the risk that controls may become inadequate because of changes in conditions, or that
the degree of compliance with the policies or procedures may deteriorate.
In our opinion, Stillwater Mining Company maintained, in all material respects, effective internal
control over financial reporting as of December 31, 2009, based on criteria established in Internal
Control — Integrated Framework issued by the Committee of Sponsoring Organizations of the Treadway
Commission.
We also have audited, in accordance with standards of the Public Company Accounting Oversight Board
(United States), the balance sheets of Stillwater Mining Company as of December 31, 2009 and 2008,
and the related statements of operations and comprehensive loss, changes in stockholders’ equity,
and cash flows for each of the years in the three-year period ended December 31, 2009, and our
report dated February 26, 2010, expressed an unqualified opinion on those financial statements.
\s\ KPMG LLP
Billings, Montana
February 26, 2010
February 26, 2010
70
Table of Contents
STILLWATER MINING COMPANY
STATEMENTS OF OPERATIONS AND COMPREHENSIVE LOSS
(in thousands, except per share data)
| Year ended December 31, | 2009 | 2008 | 2007 | |||||||||
REVENUES |
||||||||||||
Mine production |
$ | 306,892 | $ | 360,364 | $ | 331,277 | ||||||
PGM recycling |
81,788 | 475,388 | 326,394 | |||||||||
Other |
5,752 | 19,980 | 15,365 | |||||||||
Total revenues |
394,432 | 855,732 | 673,036 | |||||||||
COSTS AND EXPENSES |
||||||||||||
Costs of metals sold: |
||||||||||||
Mine production |
209,140 | 283,793 | 256,942 | |||||||||
PGM recycling |
76,483 | 449,497 | 306,757 | |||||||||
Other |
5,741 | 19,892 | 14,289 | |||||||||
Total costs of metals sold |
291,364 | 753,182 | 577,988 | |||||||||
Depreciation and amortization: |
||||||||||||
Mine production |
70,239 | 82,792 | 82,396 | |||||||||
PGM recycling |
178 | 192 | 142 | |||||||||
Total depreciation and amortization |
70,417 | 82,984 | 82,538 | |||||||||
Total costs of revenues |
361,781 | 836,166 | 660,526 | |||||||||
Marketing |
1,987 | 5,705 | 5,586 | |||||||||
General and administrative |
25,080 | 26,712 | 22,879 | |||||||||
Restructuring |
— | 5,420 | — | |||||||||
Impairment of long-term investments |
119 | 3,374 | — | |||||||||
Loss on trade receivables |
595 | 3,410 | — | |||||||||
Loss on advances on inventory purchases |
456 | 25,999 | — | |||||||||
Impairment of property, plant and equipment |
— | 67,254 | — | |||||||||
(Gain)/loss on disposal of property, plant
and equipment |
689 | 196 | (180 | ) | ||||||||
Total costs and expenses |
390,707 | 974,236 | 688,811 | |||||||||
OPERATING INCOME (LOSS) |
3,725 | (118,504 | ) | (15,775 | ) | |||||||
OTHER INCOME (EXPENSE) |
||||||||||||
Other |
79 | 144 | 236 | |||||||||
Interest income |
1,846 | 11,103 | 11,705 | |||||||||
Interest expense |
(6,801 | ) | (9,718 | ) | (11,269 | ) | ||||||
Induced conversion loss |
(8,097 | ) | — | — | ||||||||
LOSS BEFORE INCOME TAX BENEFIT (PROVISION) |
(9,248 | ) | (116,975 | ) | (15,103 | ) | ||||||
Income tax benefit (provision) |
30 | 32 | — | |||||||||
NET LOSS |
(9,218 | ) | (116,943 | ) | (15,103 | ) | ||||||
Other comprehensive income, net of tax |
70 | 5,865 | 9,578 | |||||||||
COMPREHENSIVE LOSS |
$ | (9,148 | ) | $ | (111,078 | ) | $ | (5,525 | ) | |||
See accompanying notes to financial statements.
71
Table of Contents
STILLWATER MINING COMPANY
STATEMENTS OF OPERATIONS AND COMPREHENSIVE LOSS
(in thousands, except per share data)
(Continued)
| Year ended December 31, | 2009 | 2008 | 2007 | |||||||||
BASIC AND DILUTED LOSS PER
SHARE |
||||||||||||
Net loss |
$ | (9,218 | ) | $ | (116,943 | ) | $ | (15,103 | ) | |||
Weighted average common
shares outstanding |
||||||||||||
Basic |
94,852 | 93,025 | 92,016 | |||||||||
Diluted |
94,852 | 93,025 | 92,016 | |||||||||
Basic loss per share |
||||||||||||
Net loss |
$ | (0.10 | ) | $ | (1.26 | ) | $ | (0.16 | ) | |||
Diluted loss per share |
||||||||||||
Net loss |
$ | (0.10 | ) | $ | (1.26 | ) | $ | (0.16 | ) | |||
See accompanying notes to financial statements.
72
Table of Contents
STILLWATER MINING COMPANY
BALANCE SHEETS
(in thousands, except share and per share amounts)
| December 31, | 2009 | 2008 | ||||||
ASSETS |
||||||||
Current assets |
||||||||
Cash and cash equivalents |
$ | 166,656 | $ | 161,795 | ||||
Investments, at fair market value |
34,515 | 18,994 | ||||||
Inventories |
88,544 | 72,178 | ||||||
Trade receivables |
2,073 | 2,369 | ||||||
Deferred income taxes |
18,130 | 17,443 | ||||||
Other current assets |
8,680 | 9,756 | ||||||
Total current assets |
318,598 | 282,535 | ||||||
Property, plant and equipment, net |
358,866 | 393,412 | ||||||
Restricted cash |
38,045 | 35,595 | ||||||
Other noncurrent assets |
9,263 | 11,487 | ||||||
Total assets |
$ | 724,772 | $ | 723,029 | ||||
LIABILITIES AND STOCKHOLDERS’ EQUITY |
||||||||
Current liabilities |
||||||||
Accounts payable |
$ | 8,901 | $ | 14,662 | ||||
Accrued payroll and benefits |
26,481 | 24,111 | ||||||
Property, production and franchise taxes payable |
10,405 | 10,749 | ||||||
Current portion of long-term debt |
— | 97 | ||||||
Other current liabilities |
3,689 | 5,489 | ||||||
Total current liabilities |
49,476 | 55,108 | ||||||
Long-term debt |
195,977 | 210,947 | ||||||
Deferred income taxes |
18,130 | 17,443 | ||||||
Accrued workers compensation |
4,737 | 6,761 | ||||||
Asset retirement obligation |
6,209 | 7,028 | ||||||
Other noncurrent liabilities |
3,855 | 4,448 | ||||||
Total liabilities |
$ | 278,384 | $ | 301,735 | ||||
Stockholders’ equity |
||||||||
Preferred stock, $0.01 par value, 1,000,000 shares authorized, none issued |
— | — | ||||||
Common stock, $0.01 par value, 200,000,000 shares authorized, 96,732,185 and
93,665,855 shares issued and outstanding |
967 | 937 | ||||||
Paid-in capital |
674,869 | 640,657 | ||||||
Accumulated deficit |
(229,358 | ) | (220,140 | ) | ||||
Accumulated other comprehensive loss |
(90 | ) | (160 | ) | ||||
Total stockholders’ equity |
446,388 | 421,294 | ||||||
Total liabilities and stockholders’ equity |
$ | 724,772 | $ | 723,029 | ||||
See accompanying notes to financial statements.
73
Table of Contents
STILLWATER MINING COMPANY
STATEMENTS OF CASH FLOWS
(in thousands)
| Year ended December 31, | 2009 | 2008 | 2007 | |||||||||
CASH FLOWS FROM OPERATING ACTIVITIES |
||||||||||||
Net loss |
$ | (9,218 | ) | $ | (116,943 | ) | $ | (15,103 | ) | |||
Adjustments to reconcile net loss to net cash provided
by operating activities: |
||||||||||||
Depreciation and amortization |
70,417 | 82,984 | 82,538 | |||||||||
Lower of cost or market inventory adjustments |
10,892 | 16,623 | 6,013 | |||||||||
Induced conversion loss |
8,097 | — | — | |||||||||
Restructuring costs |
— | 5,420 | — | |||||||||
Impairment of long-term investments |
119 | 3,374 | — | |||||||||
Impairment of property, plant, and equipment |
— | 67,254 | — | |||||||||
Loss on trade receivables |
595 | 3,410 | — | |||||||||
Loss on advances on inventory purchases |
456 | 25,999 | — | |||||||||
(Gain)/loss on disposal of property, plant and equipment |
689 | 196 | (180 | ) | ||||||||
Accretion of asset retirement obligation |
606 | 885 | 734 | |||||||||
Stock issued under employee benefit plans |
4,767 | 5,992 | 5,470 | |||||||||
Amortization of debt issuance costs |
1,036 | 3,214 | 500 | |||||||||
Share based compensation |
6,674 | 5,063 | 3,805 | |||||||||
Changes in operating assets and liabilities: |
||||||||||||
Inventories |
(26,496 | ) | 29,323 | (15,672 | ) | |||||||
Advances on inventory purchases |
(262 | ) | (901 | ) | (4,205 | ) | ||||||
Trade receivables |
296 | 6,365 | 3,864 | |||||||||
Employee compensation and benefits |
2,379 | (1,968 | ) | 596 | ||||||||
Accounts payable |
(5,761 | ) | (3,560 | ) | (6,896 | ) | ||||||
Property, production and franchise taxes payable |
(937 | ) | 566 | (780 | ) | |||||||
Workers compensation |
(2,024 | ) | (3,221 | ) | (272 | ) | ||||||
Restricted cash |
(2,450 | ) | (9,540 | ) | (2,100 | ) | ||||||
Forward hedges |
— | (2,812 | ) | 747 | ||||||||
Other |
(203 | ) | (3,480 | ) | (2,637 | ) | ||||||
NET CASH PROVIDED BY OPERATING ACTIVITIES |
59,672 | 114,243 | 56,422 | |||||||||
CASH FLOWS FROM INVESTING ACTIVITIES |
||||||||||||
Capital expenditures |
(39,534 | ) | (82,277 | ) | (87,876 | ) | ||||||
Purchases of long-term investments |
— | (948 | ) | (1,687 | ) | |||||||
Proceeds from disposal of property, plant and equipment |
603 | 329 | 396 | |||||||||
Purchases of investments |
(47,551 | ) | (41,095 | ) | (64,925 | ) | ||||||
Proceeds from maturities of investments |
31,759 | 49,424 | 73,125 | |||||||||
NET CASH USED IN INVESTING ACTIVITIES |
(54,723 | ) | (74,567 | ) | (80,967 | ) | ||||||
CASH FLOWS FROM FINANCING ACTIVITIES |
||||||||||||
Payments on long-term debt and capital lease obligations |
(97 | ) | (98,539 | ) | (2,631 | ) | ||||||
Payments for debt issuance costs |
— | (5,098 | ) | — | ||||||||
Proceeds from issuance of convertible debentures |
— | 181,500 | — | |||||||||
Issuance of common stock |
9 | 2,990 | 252 | |||||||||
Restricted cash |
— | (20,170 | ) | — | ||||||||
NET CASH (USED IN) PROVIDED BY FINANCING ACTIVITIES |
(88 | ) | 60,683 | (2,379 | ) | |||||||
CASH AND CASH EQUIVALENTS |
||||||||||||
Net increase (decrease) |
4,861 | 100,359 | (26,924 | ) | ||||||||
Balance at beginning of year |
161,795 | 61,436 | 88,360 | |||||||||
BALANCE AT END OF YEAR |
$ | 166,656 | $ | 161,795 | $ | 61,436 | ||||||
See accompanying notes to financial statements.
74
Table of Contents
STILLWATER MINING COMPANY
STATEMENTS OF CHANGES IN STOCKHOLDERS’ EQUITY
(in thousands)
| Shares | Accumulated Other | Total Stockholders’ | ||||||||||||||||||||||
| Outstanding | Common Stock | Paid-in Capital | Accumulated Deficit | Comprehensive Loss | Equity | |||||||||||||||||||
BALANCE AT DECEMBER 31, 2006 |
91,515 | $ | 915 | $ | 617,107 | $ | (88,094 | ) | $ | (15,603 | ) | $ | 514,325 | |||||||||||
Net loss |
— | — | — | (15,103 | ) | — | (15,103 | ) | ||||||||||||||||
Change in net unrealized gains on derivative |
||||||||||||||||||||||||
financial instruments |
— | — | — | — | 9,247 | 9,247 | ||||||||||||||||||
Change in fair market value of securities |
— | — | — | — | 331 | 331 | ||||||||||||||||||
Common stock issued under employee benefit
plans |
488 | 5 | 5,465 | — | — | 5,470 | ||||||||||||||||||
Stock option expense |
— | — | 392 | — | — | 392 | ||||||||||||||||||
Common stock issued under stock plans |
29 | — | 252 | — | — | 252 | ||||||||||||||||||
Common stock issued under Directors’
deferral plan |
5 | 4 | 74 | — | — | 78 | ||||||||||||||||||
Nonvested shares of common stock granted to
officers and employees |
368 | — | — | — | — | — | ||||||||||||||||||
Amortization of unearned nonvested stock |
— | — | 4,374 | — | — | 4,374 | ||||||||||||||||||
Forfeiture of nonvested stock |
— | — | (1,039 | ) | — | — | (1,039 | ) | ||||||||||||||||
BALANCE AT DECEMBER 31, 2007 |
92,405 | $ | 924 | $ | 626,625 | $ | (103,197 | ) | $ | (6,025 | ) | $ | 518,327 | |||||||||||
Net loss |
— | — | — | (116,943 | ) | — | (116,943 | ) | ||||||||||||||||
Change in net unrealized gains on derivative |
||||||||||||||||||||||||
financial instruments |
— | — | — | — | 6,533 | 6,533 | ||||||||||||||||||
Change in fair market value of securities |
— | — | — | — | (668 | ) | (668 | ) | ||||||||||||||||
Common stock issued under employee benefit
plans |
815 | 8 | 5,984 | — | — | 5,992 | ||||||||||||||||||
Stock option expense |
— | — | 380 | — | — | 380 | ||||||||||||||||||
Common stock issued under stock plans |
237 | 3 | 2,987 | — | — | 2,990 | ||||||||||||||||||
Common stock issued under Directors’
deferral plan |
8 | 2 | 59 | — | — | 61 | ||||||||||||||||||
Nonvested shares of common stock granted to
officers and employees |
201 | — | — | — | — | — | ||||||||||||||||||
Amortization of unearned nonvested stock |
— | — | 4,654 | — | — | 4,654 | ||||||||||||||||||
Forfeiture of nonvested stock |
— | — | (32 | ) | — | — | (32 | ) | ||||||||||||||||
BALANCE AT DECEMBER 31, 2008 |
93,666 | $ | 937 | $ | 640,657 | $ | (220,140 | ) | $ | (160 | ) | $ | 421,294 | |||||||||||
Net loss |
— | — | — | (9,218 | ) | — | (9,218 | ) | ||||||||||||||||
Change in fair market value of securities |
— | — | — | — | 70 | 70 | ||||||||||||||||||
Common stock issued under employee benefit
plans |
887 | 9 | 4,758 | — | — | 4,767 | ||||||||||||||||||
Stock option expense |
— | — | 238 | — | — | 238 | ||||||||||||||||||
Common stock issued under stock plans |
2 | — | 9 | — | — | 9 | ||||||||||||||||||
Common stock issued under Directors’
deferral plan |
7 | — | 32 | — | — | 32 | ||||||||||||||||||
Nonvested shares of common stock granted to
officers and employees |
327 | 3 | — | — | — | 3 | ||||||||||||||||||
Common stock issued for conversion of
long-term
debt |
1,843 | 18 | 22,774 | 22,792 | ||||||||||||||||||||
Amortization of unearned nonvested stock |
— | — | 6,463 | — | — | 6,463 | ||||||||||||||||||
Forfeiture of nonvested stock |
— | — | (62 | ) | — | — | (62 | ) | ||||||||||||||||
BALANCE AT DECEMBER 31, 2009 |
96,732 | $ | 967 | $ | 674,869 | $ | (229,358 | ) | $ | (90 | ) | $ | 446,388 | |||||||||||
See accompanying notes to financial statements.
75
Table of Contents
STILLWATER MINING COMPANY
NOTES TO THE FINANCIAL STATEMENTS
NOTE 1
NATURE OF OPERATIONS
NATURE OF OPERATIONS
Stillwater Mining Company, a Delaware corporation, is engaged in the development, extraction,
processing, refining and marketing of palladium, platinum and associated metals (platinum group
metals or PGMs) from a geological formation in south central Montana known as the J-M Reef and from
the recycling of spent catalytic converters. The J-M Reef is a twenty-eight (28) mile long
geologic formation containing the largest known deposit of platinum group metals (PGMs) in the
United States.
The Company’s mining operations consist of the Stillwater Mine located on the J-M Reef in Nye,
Montana, the East Boulder Mine, located at the western end of the J-M Reef in Sweet Grass County,
Montana and a smelter and base metal refinery located in Columbus, Montana. The Company processes
its mining concentrates and recycles spent catalyst material received from third parties to recover
PGMs at the smelter and base metal refinery.
The Company’s operations can be significantly affected by risks and uncertainties associated
with the mining and recycling industry as well as those specifically related to its operations.
The most significant risks and uncertainties the Company faces are (i) expiration of the sales
agreement with Ford Motor Company at the end of 2010 (see Note 5) and (ii) price volatility of
palladium and platinum.
Additional risks and uncertainties include but are not limited to the following: economic and
political events affecting supply and demand for these metals, mineral reserve estimation,
environmental restrictions and obligations, governmental regulations, ownership of and access to
mineral reserves, stable workforce and increased surety requirements.
The Company evaluates subsequent events through the date the financial statements are issued.
No subsequent events were identified that required additional disclosure through the date of this
filing.
NOTE 2
SUMMARY OF SIGNIFICANT ACCOUNTING POLICIES
SUMMARY OF SIGNIFICANT ACCOUNTING POLICIES
CASH AND CASH EQUIVALENTS
Cash and cash equivalents consist of all cash balances and all highly liquid investments
purchased with an original maturity of three months or less.
RESTRICTED CASH
Restricted cash consists of cash equivalents that have been posted as collateral on
outstanding letters of credit. The restrictions on the balances lapse upon expiration of the
letters of credit which currently have terms of one year or less. Restricted cash is classified as
noncurrent as the Company anticipates renewing the letters of credit (associated with reclamation
obligations) upon expiration.
INVESTMENTS
Investment securities at December 31, 2009, consist of a mutual fund and federal agency notes
and commercial paper with stated maturities in excess of three months but less than one year. All
securities are deemed by management to be available-for-sale and are reported at fair value.
Unrealized holding gains and losses on available-for-sale securities are excluded from earnings
and are reported as a separate component of other comprehensive income (loss) until realized. A
decline in the market value of any available-for-sale security below cost that is deemed to be
other-than-temporary results in a reduction of the carrying amount of the security to fair value.
The impairment is charged to earnings and a new cost basis for the security is established.
The Company’s long-term investments were originally recorded at cost due to less than 20%
equity interest and no significant Company control over the investees. A decline in the market
value of these long-term investments that is deemed to be other-than-temporary will result in a
reduction of the carrying amount of the investment to fair value. The
76
Table of Contents
impairment is charged to earnings and a new cost basis for the investment is established.
INVENTORIES
Metals inventories are carried at the lower of current realizable value or average cost taking
into consideration the Company’s long-term sales contracts and average unit costs. Production
costs include the cost of direct labor and materials, depreciation and amortization, and overhead
costs relating to mining and processing activities. Materials and supplies inventories are valued
at the lower of average cost or fair market value.
RECEIVABLES
Trade receivables and other receivable balances recorded in other current assets are reported
at outstanding principal amounts, net of an allowance for doubtful accounts. Management evaluates
the collectability of receivable account balances to determine the allowance, if any. Management
considers the other party’s credit risk and financial condition, as well as current and projected
economic and market conditions, in determining the amount of the allowance. Receivable balances
are written off when management determines that the balance is uncollectable. The Company wrote
off $0.6 million and $3.4 million of its receivable balance in 2009 and 2008, respectively, when it
was determined that ultimate repayment was questionable. The Company determined that no allowance
against its receivable balances at December 31, 2009 and 2008 were necessary.
PROPERTY, PLANT AND EQUIPMENT
Plant facilities and equipment are recorded at cost and depreciated using the straight-line
method over estimated useful lives ranging from three to seven years or, for capital leases, the
term of the related leases, if shorter. Maintenance and repairs are charged to cost of revenues as
incurred.
Capitalized mine development costs are expenditures incurred to increase existing production,
develop new ore bodies or develop mineral property substantially in advance of production.
Capitalized mine development costs include a vertical shaft, multiple surface adits and underground
infrastructure development including footwall laterals, ramps, rail and transportation, electrical
and ventilation systems, shop facilities, material handling areas, ore handling facilities,
dewatering and pumping facilities. These expenditures are capitalized and amortized over the life
of the mine or over a shorter mining period, depending on the period benefited by those
expenditures, using the units-of-production method. The Company utilizes total proven and probable
ore reserves, measured in tons, as the basis for determining the life of mine and uses the ore
reserves in the immediate and relevant vicinity as the basis for determining the shorter mining
period.
The Company calculates amortization of capitalized mine development costs in any vicinity by
applying an amortization rate to the relevant current production. The amortization rates are each
based upon a ratio of un-amortized capitalized mine development costs to the related ore reserves.
Capital development expenditures are added to the un-amortized capitalized mine development costs
and amortization rates updated as the related assets are placed into service. In the calculation
of the amortization rate, changes in ore reserves are accounted for as a prospective change in
estimate. Ore reserves and the further benefit of capitalized mine development costs are
determined based on management assumptions. Any significant changes in these assumptions, such as
a change in the mine plan or a change in estimated proven and probable ore reserves, could have a
material effect on the expected period of benefit resulting in a potentially significant change in
the amortization rate and/or the valuations of related assets. The Company’s proven ore reserves
are generally expected to be extracted utilizing its existing mine development infrastructure.
Additional capital expenditures will be required to access the Company’s estimated probable ore
reserves. These anticipated capital expenditures are not included in the current calculation of
depreciation and amortization.
Expenditures incurred to sustain existing production and directly access specific ore reserve
blocks or stopes provide benefit to ore reserve production over limited periods of time (secondary
development) and are charged to operations as incurred. These costs include ramp and stope access
excavations from the primary haulage levels (footwall laterals), stope material rehandling/laydown
excavations, stope ore and waste pass excavations and chute installations, stope ventilation raise
excavations and stope utility and pipe raise excavations.
Interest is capitalized on expenditures related to major construction or development projects
and is amortized using the same method as the related asset. Interest capitalization is
discontinued when the asset is placed into operation or when development and construction cease.
77
Table of Contents
LEASES
The Company classifies a lease as either capital or operating. All capital leases are
depreciated either over the useful life of the asset or over the lease term.
ASSET IMPAIRMENT
The Company reviews and evaluates its long-lived assets for impairment when events and changes
in circumstances indicate that the related carrying amounts of its assets may not be recoverable.
Impairment is considered to exist if the total estimated future cash flows on an undiscounted basis
are less than the carrying amount of the asset. Future cash flows include estimates of recoverable
ounces, PGM prices (historical prices or third-party projections of future prices, long-term sales
contracts prices, price trends and related factors), production levels and capital and reclamation
expenditures, all based on life-of-mine plans and projections. If the assets are impaired, a
calculation of fair market value is performed, and if the fair market value is lower than the
carrying value of the assets, the assets are reduced to their fair market value.
Assumptions underlying future cash flows are subject to risks and uncertainties. Any
differences between significant assumptions and market conditions such as PGM prices, lower than
expected recoverable ounces, and/or the Company’s operating performance could have a material
effect on the Company’s determination of ore reserves, or its ability to recover the carrying
amounts of its long-lived assets resulting in potential additional impairment charges.
FAIR VALUE OF FINANCIAL INSTRUMENTS
The Company’s non-derivative financial instruments consist primarily of cash equivalents,
trade receivables, investments, revenue bond debt, and capital lease obligations. The carrying
amounts of cash equivalents and trade receivables approximate fair value due to their short
maturities. The carrying amounts of investments approximate fair value based on market quotes.
Fair value is defined as the price that would be received to sell an asset or paid to transfer
a liability (an exit price) in an orderly transaction between market participants. A fair value hierarchy was established which requires an entity to maximize the use of observable
inputs and minimize the use of unobservable inputs when measuring fair value. The fair value
hierarchy distinguishes among three levels of inputs that may be utilized when measuring fair
value: Level 1 inputs (using quoted prices in active markets for identical assets or liabilities),
Level 2 inputs (using external inputs other than level 1 prices such as quoted prices for similar
assets and liabilities in active markets or inputs that are observable for the asset or liability)
and Level 3 inputs (unobservable inputs supported by little or no market activity and based on
internal assumptions used to measure assets and liabilities). The classification of each financial
asset or liability within the above hierarchy is determined based on the lowest level input that is
significant to the fair value measurement.
REVENUE RECOGNITION
Revenue is comprised of mine production revenue, PGM recycling revenue and other sales
revenue. Mine production revenue consists of the sales of palladium and platinum extracted by the
Company’s mining operations, including any realized hedging gains or losses, and is reduced by
sales discounts associated with automotive agreements. Mine production revenue also consists of
the sales of by-products (rhodium, gold, silver, copper and nickel) extracted by mining operations.
PGM recycling revenue consists of the sales of recycled palladium, platinum and rhodium derived
from spent catalytic materials, including any unrealized and realized hedging gains or losses.
Other sales revenue consists of sales of PGMs that were acquired on the open market for resale.
Revenue is recognized when persuasive evidence of an arrangement exists, delivery has occurred
either physically or through an irrevocable transfer of metals to customers’ accounts, the price is
fixed or determinable, no related obligations remain and collectability is probable. Under the
terms of sales contracts and purchase orders received from customers, the Company recognizes
revenue when the product is in a refined and saleable form and title passes, which is typically
when the product is transferred from the account of the Company to the account of the customer.
Under certain of its sales agreements, the Company instructs a third party refiner to transfer
metal from the Company’s account to the customer’s account; at this point, the Company’s account at
the third party refinery is reduced and the purchaser’s account is increased by the number of
ounces of metal sold. These transfers are irrevocable and the Company has no further
responsibility for the delivery of the metals. Under other sales agreements, physical conveyance
occurs by the Company arranging for shipment of metal from the third party refinery to the
purchaser. In these cases, revenue is recognized at the
78
Table of Contents
point when title passes contractually to the purchaser. Sales discounts are recognized when
the related revenue is recorded. The Company classifies any sales discounts as a reduction in
revenue.
HEDGING PROGRAM
From time to time, the Company enters into derivative financial instruments, including fixed
forwards, cashless put and call option collars and financially settled forwards to manage the
effect of changes in the prices of palladium and platinum on the Company’s revenue and to manage
interest rate risk. Derivatives are reported on the balance sheet at fair value and, if the
derivative is not designated as a hedging instrument, changes in fair value must be recognized in
earnings in the period of change. If the derivative is designated as a hedge, and to the extent
such hedge is determined to be highly effective, changes in fair value are either (a) offset by the
change in fair value of the hedged asset or liability (if applicable) or (b) reported as a
component of other comprehensive income (loss) in the period of change, and subsequently recognized
in the determination of net income (loss) in the period the offsetting hedged transaction occurs.
If an instrument is settled early, any gains or losses are immediately recognized as adjustments to
the revenue recorded for the related hedged production.
Unrealized derivative gains and losses recorded in current and non-current assets and
liabilities and amounts recorded in other comprehensive income (loss) and in current period
earnings are non-cash items and therefore are taken into account in the preparation of the
statement of cash flows based on their respective balance sheet classifications.
RECLAMATION AND ENVIRONMENTAL COSTS
The fair value of a liability for an asset retirement obligation is recognized in the period
in which it is incurred if a reasonable estimate of fair value can be made. The fair value of the
liability is added to the carrying amount of the associated asset and this additional carrying
amount is depreciated over the life of the asset. The liability is accreted at the end of each
period through charges to operating expense. If the obligation is settled for other than the
carrying amount of the liability, the Company will recognize a gain or loss on settlement.
Accounting for reclamation obligations requires management to make estimates for each mining
operation of the future costs the Company will incur to complete final reclamation work required to
comply with existing laws and regulations. Actual costs incurred in future periods could differ
from amounts estimated. Additionally, future changes to environmental laws and regulations could
increase the extent of reclamation and remediation work that the Company is required to perform.
Any such increases in future costs could materially impact the amounts charged in future periods to
operations for reclamation and remediation.
INCOME TAXES
The Company determines income taxes using the asset and liability approach which results in
the recognition of deferred tax assets and liabilities for the expected future tax consequences of
temporary differences between the carrying amounts and the tax basis of those assets and
liabilities, as well as operating loss and tax credit carryforwards, using enacted tax rates in
effect in the years in which the differences are expected to reverse. Deferred tax assets and
liabilities are measured using enacted tax rates expected to apply to taxable income in the years
in which those temporary differences are expected to be recovered or settled. The effect on
deferred tax assets and liabilities of a change in tax rates is recognized in income in the period
that includes the enactment date.
In assessing the realizability of deferred tax assets, management considers whether it is more
likely than not that some portion or all of the deferred tax assets will not be realized. Each
quarter, management considers the scheduled reversal of deferred tax liabilities, projected future
taxable income, and tax planning strategies in making this assessment. A valuation allowance has
been provided at December 31, 2009 and 2008, for the portion of the Company’s net deferred tax
assets for which it is more likely than not that they will not be realized. Based on the Company’s
current financial projections, and in view of the level of tax depreciation and depletion
deductions available, it appears unlikely that the Company will owe any income taxes for the
foreseeable future. However, if average realized PGM prices continue to increase substantially in
the future, the Company could owe income taxes prospectively on the resulting higher taxable
income.
79
Table of Contents
STOCK-BASED COMPENSATION
Costs resulting from all share-based payment transactions are recognized in the financial
statements over the respective vesting periods and determined using a fair-value-based measurement
method. The fair values for stock options and other stock-based compensation awards issued to
employees are estimated at the date of grant using a Black-Scholes option pricing model.
EARNINGS (LOSS) PER COMMON SHARE
Basic earnings (loss) per share is computed by dividing net earnings (loss) available to
common stockholders by the weighted average number of common shares outstanding during the period.
Diluted earnings (loss) per share reflect the potential dilution that could occur if the Company’s
dilutive outstanding stock options or nonvested shares were exercised and the Company’s convertible
debt was converted. No adjustments were made to reported net income (loss) in the computation of
basic or diluted earnings (loss) per share as of December 31, 2009, 2008 or 2007. The Company
currently has only one class of equity shares outstanding.
COMPREHENSIVE INCOME (LOSS)
Comprehensive income (loss) includes net income (loss), as well as other changes in
stockholders’ equity that result from transactions and events other than those with stockholders.
The Company’s only significant elements of other comprehensive income in 2009 consisted of
unrealized gains and losses related to available-for-sale marketable securities. In 2008 and 2007,
comprehensive income (loss) consisted of unrealized gains and losses on derivative financial
instruments related to commodity price hedging activities and available-for-sale marketable
securities.
DEBT ISSUANCE COSTS
Costs associated with the issuance of debt are included in other noncurrent assets and are
amortized over the term of the related debt using the effective interest method.
USE OF ESTIMATES
The preparation of the Company’s financial statements in conformity with United States
generally accepted accounting principles requires management to make estimates and assumptions that
affect the amounts reported in these financial statements and accompanying notes. The more
significant areas requiring the use of management’s estimates relate to mineral reserves,
reclamation and environmental obligations, valuation allowance for deferred tax assets, useful
lives utilized for depreciation, amortization and accretion calculations, future cash flows from
long-lived assets, fair value of long-lived assets, and fair value of derivatives. Actual results
could differ from these estimates.
RECLASSIFICATION
Prior year amounts previously disclosed as advances on inventory purchases have been
consolidated into other assets to conform to the current year presentation on the Company’s balance
sheet. Exploration expense in 2008 and 2007 has been included in general and administrative
expenses to conform to the current year presentation on the Company’s income statement.
NOTE 3
CORRECTION OF IMMATERIAL ERROR
CORRECTION OF IMMATERIAL ERROR
In the fourth quarter of 2009, the Company identified an error in the number of ounces in its
finished goods inventory related to the identification of purchased and tolled material. The
Company identified a total understatement of its recycling costs of goods sold of $1.3 million.
The cumulative impact for the years 2003 through 2008 was a $1.2 million understatement of costs of
goods sold and was immaterial overall to previously reported quarterly and annual periods.
The Company assessed the materiality of this error in accordance with Staff Accounting
Bulletin (SAB) No. 108 and determined that the error was immaterial to previously reported amounts
contained in its periodic reports and the Company intends to correct this error through subsequent
periodic filings. The effect of recording this immaterial correction in the statements of
operations for the two fiscal years impacted, balance sheet as of December 31, 2008, and for the
fiscal 2009 quarterly periods to be reported in subsequent periodic filings are as follows:
80
Table of Contents
| For the Quarter Ended | For the Quarter Ended | For the Quarter Ended | ||||||||||||||||||||||
| September 30, 2009 | June 30, 2009 | March 31, 2009 | ||||||||||||||||||||||
| As | As | As | As | As | As | |||||||||||||||||||
| (in thousands) | Reported | Revised | Reported | Revised | Reported | Revised | ||||||||||||||||||
PGM recycling costs of goods sold |
$ | 24,482 | $ | 24,593 | $ | 10,874 | $ | 10,863 | $ | 20,305 | $ | 20,299 | ||||||||||||
Net income (loss) |
4,430 | 4,319 | 4,229 | 4,240 | (11,616 | ) | (11,610 | ) | ||||||||||||||||
Comprehensive income (loss) |
4,522 | 4,411 | 4,310 | 4,321 | (11,650 | ) | (11,644 | ) | ||||||||||||||||
Inventory |
76,458 | 75,128 | 81,011 | 79,792 | 67,645 | 66,416 | ||||||||||||||||||
Accumulated deficit |
(221,862 | ) | (223,192 | ) | (226,292 | ) | (227,511 | ) | (230,521 | ) | (231,750 | ) | ||||||||||||
Total shareholders’ equity |
428,193 | 426,863 | 420,507 | 419,288 | 413,586 | 412,357 | ||||||||||||||||||
| For the Year Ended | For the Year Ended | |||||||||||||||
| December 31, 2008 | December 31, 2007 | |||||||||||||||
| As | As | As | As | |||||||||||||
| (in thousands) | Reported | Revised | Reported | Revised | ||||||||||||
PGM recycling costs of
goods sold |
$ | 445,299 | $ | 449,497 | $ | 307,137 | $ | 306,757 | ||||||||
Operating income (loss) |
(114,306 | ) | (118,504 | ) | (16,155 | ) | (15,775 | ) | ||||||||
Net income (loss) |
(112,745 | ) | (116,943 | ) | (15,483 | ) | (15,103 | ) | ||||||||
Comprehensive income (loss) |
(106,880 | ) | (111,078 | ) | (5,905 | ) | (5,525 | ) | ||||||||
Inventory |
73,413 | 72,178 | 116,623 | 119,586 | ||||||||||||
Accumulated deficit |
(218,905 | ) | (220,140 | ) | (106,160 | ) | (103,197 | ) | ||||||||
Total shareholders’ equity |
422,529 | 421,294 | 515,364 | 518,327 | ||||||||||||
NOTE 4
ASSET IMPAIRMENT
ASSET IMPAIRMENT
The Company has determined that there was no material event or change in circumstances
requiring the Company to test its long-lived assets for impairment at December 31, 2009. The
Company recorded a $67.3 million charge against earnings at December 31, 2008, reducing the
carrying value of the East Boulder Mine assets to $161.4 million.
Assumptions underlying estimates of future cash flows are subject to risks and uncertainties.
Any differences between significant assumptions and market conditions such as PGM prices, lower
than expected recoverable ounces, and/or the company’s operating performance could have a material
effect on the company’s determination of ore reserves, or its ability to recover the carrying
amounts of its long lived assets, resulting in potential additional impairment charges.
NOTE 5
SALES
SALES
Mine Production
Palladium, platinum, rhodium, gold and silver are sent to third party refineries for final
processing from where they are sold to a number of consumers and dealers with whom the Company has
established trading relationships. Refined platinum group metals (PGMs) of 99.95% purity (rhodium
of 99.9%) in sponge form are transferred upon sale from the Company’s account at third party
refineries to the account of the purchaser. By-product precious metals are normally sold
at market prices to customers, brokers or outside refiners. By-products of copper and nickel
are produced by the Company at less than commercial grade, so prices for these metals typically
reflect a quality discount. By-product sales are included in revenues from mine production.
During 2009, 2008 and 2007, total by-product (copper, nickel, gold, silver and mined rhodium) sales
were $23.6 million, $36.8 million and $53.8 million, respectively.
81
Table of Contents
The Company has a sales agreement with Ford Motor Company covering a portion of production
from the mines, that contains guaranteed floor and ceiling prices for metal delivered. Metal sales
under the agreement, when not affected by the guaranteed floor or ceiling prices, are priced at a
slight discount to market. Under this sales agreement, the Company currently has committed 80% of
its palladium production and 70% of its platinum production from mining through 2010. None of the
Company’s platinum or palladium production after 2010 is currently committed.
The agreement contains termination provisions that allow the purchaser to terminate in the
event the Company breaches certain provisions of the agreement and the Company does not cure the
breach within specified periods ranging from 10 to 30 days of notice.
PGM Recycling
The Company purchases spent catalyst materials from third parties and processes these
materials in its facilities in Columbus, Montana to recover palladium, platinum and rhodium to sell
to various third parties. The Company has entered into sourcing arrangements for catalyst material
with several suppliers. Under these sourcing arrangements, the Company from time to time may
advance cash to suppliers for purchase and collection of these spent catalyst materials. These
advances are reflected as advances on inventory purchases and included in other assets on the
Company’s balance sheet until such time as the material has been physically received and title has
transferred to the Company. In some cases the Company holds a security interest in materials
procured by suppliers but not yet received by the Company. Once the material is physically
received and title has transferred, the associated advance is reclassified into inventories.
Finance charges on these advances collected in advance of being earned are recorded as unearned
income and are included in other current liabilities on the Company’s balance sheet. The Company
recorded write-downs of advances on these recycling inventory purchases of $0.5 million and $26.0
million during 2009 and 2008, respectively. The Company also has various spot purchase and tolling
arrangements with other suppliers of spent catalytic materials, but the volumes from these
arrangements are less significant.
At the same time the Company purchases material for recycling, it typically enters into a
fixed forward contract for future delivery of the PGMs contained in the material at a price
consistent with the purchase cost of the recycled material. The contract commits the Company to
deliver finished metal on a specified date that normally corresponds to the expected out-turn date
for the metal from the final refiner. This arrangement largely eliminates the Company’s exposure
to fluctuations in market prices during processing, but it also creates an obligation to deliver
metal in the future that could be subject to operational risks. If the Company were unable to
complete the processing of the recycled material by the contractual delivery date, it could be
required to purchase substitute finished metal in the open market to cover its commitments, and
then would bear the cost (or benefit) of any change in market price relative to the price
stipulated in the delivery contract.
Other
The Company makes other open market purchases of PGMs from time to time for resale to third
parties. The Company recognized revenue of $5.8 million on 12,600 ounces of palladium and 2,900
ounces of platinum that were purchased in the open market and re-sold for the year ended December
31, 2009. The Company recognized revenue of $20.0 million and $15.4 million on 48,800 and 43,800
ounces of palladium that were purchased in the open market and re-sold for the year ended December
31, 2008 and 2007, respectively.
NOTE 6
DERIVATIVE INSTRUMENTS
DERIVATIVE INSTRUMENTS
The Company uses various derivative financial instruments to manage the Company’s exposure to
changes in interest rates and PGM market commodity prices. Some of these derivative transactions
are designated as hedges. Because the Company hedges only with instruments that have a high
correlation with the value of the underlying exposures, changes in the derivatives’ fair value are
expected to be offset by changes in the value of the hedged transaction.
Commodity Derivatives
The Company regularly enters into fixed forward contracts and financially settled forward
contracts to offset the price risk in its PGM recycling activity. From time to time, it also enters into these types of
contracts on portions of its mine production. In fixed forward transactions, the Company agrees to
deliver a stated quantity of metal on a specific future date at a price stipulated in advance. The
Company uses fixed forward transactions primarily to price in advance the metals acquired for
processing in its recycling segment. Under financially settled forward transactions, at each
settlement
82
Table of Contents
date the Company receives the difference between the forward price and the market price
if the market price is below the forward price and the Company pays the difference between the
forward price and the market price if the market price is above the forward price. These
financially settled forward contracts are settled in cash at maturity and do not require physical
delivery of metal at settlement. The Company normally uses financially settled forward contracts
with third parties to reduce its exposure to price risk on metal it is obligated to deliver under
long-term sales agreements.
Mine Production
At present the Company is not party to hedges on its mined platinum production. In the second
quarter of 2008, the Company settled the remaining financially settled forward agreements covering
future anticipated platinum sales out of mine production. Realized losses on hedges of mined
platinum in 2008 and 2007 were $12.8 million and $31.7 million, respectively, and were recorded as
an adjustment to mine production revenue.
PGM Recycling
The Company enters into fixed forward sales relating to PGM recycling of catalysts materials.
The metals from PGM recycled materials are sold forward at the time of purchase and delivered
against the fixed forward contracts when the ounces are recovered. All of these fixed forward
sales contracts open at December 31, 2009, will settle at various periods through May 2010. The
Company has credit agreements with its major trading partners that provide for margin deposits in
the event that forward prices for metals exceed the Company’s hedged prices by a predetermined
margin limit. As of December 31, 2009 and 2008, no such margin deposits were outstanding or due.
From time to time, the Company also enters into financially settled forward contracts on
recycled materials for which it hasn’t entered into a fixed forward sale. Such contracts are
utilized when the Company wishes to establish a firm forward price for recycled metal as of a
specific future date. No financially settled forward contracts were outstanding at December 31,
2009. The Company generally has not designated these contracts as cash flow hedges, so they are
marked to market at the end of each accounting period with the change in the fair value of the
derivatives being reflected in the income statement. The corresponding net realized loss on these
derivatives in 2009, 2008 and 2007 was $0.2 million and was recorded as a component of recycling
revenue.
The following is a summary of the Company’s commodity derivatives as of December 31, 2009:
| PGM Recycling: | ||||||||||||||||||||||||
| Fixed Forwards | ||||||||||||||||||||||||
| Platinum | Palladium | Rhodium | ||||||||||||||||||||||
| Settlement Period | Ounces | Avg. Price | Ounces | Avg. Price | Ounces | Avg. Price | ||||||||||||||||||
First Quarter 2010 |
12,962 | $ | 1,371 | 15,537 | $ | 351 | 2,911 | $ | 1,849 | |||||||||||||||
Second Quarter 2010 |
1,438 | $ | 1,469 | 1,428 | $ | 382 | 859 | $ | 2,452 | |||||||||||||||
The Following is the Effect of Derivative Instruments on the Statements of
Operations and Comprehensive Income (Loss) for the periods ended December 31,
Derivatives Designated as Cash Flow Hedges
Effective Portion
(in thousands)
| Location of | ||||||||||||||||||||||||||||
| Gain/(Loss) When | Amount of Gain or (Loss) Reclassified | |||||||||||||||||||||||||||
| Designated Derivative | Amount of Gain or (Loss) Recognized in AOCI | Reclassified | from AOCI into Income | |||||||||||||||||||||||||
| 2009 | 2008 | 2007 | 2009 | 2008 | 2007 | |||||||||||||||||||||||
Financially settled forward contracts |
$ | — | $ | (6,261 | ) | $ | (22,422 | ) | Mine production revenue | $ | — | $ | (12,794 | ) | $ | (31,669 | ) | |||||||||||
Ineffective portion of derivatives was not significant at December 31, 2009, 2008 or 2007.
83
Table of Contents
The Following is the Effect of Derivative Instruments on the Statements of
Operations and Comprehensive Income (Loss) for the periods ended December 31,
(in thousands)
| Location of Gain/(Loss) | ||||||||||||||||
| Derivatives Not Designated as Cash Flow Hedges | Recognized in Income | Amount of Gain or (Loss) Recognized in Income | ||||||||||||||
| 2009 | 2008 | 2007 | ||||||||||||||
Fixed
forward contracts |
Other revenue | $ | 5 | $ | — | $ | — | |||||||||
Fixed
forward contracts |
Other revenue | $ | (2 | ) | $ | — | $ | — | ||||||||
Financially settled forward contracts |
PGM recycling revenue | $ | — | $ | 150 | $ | (174 | ) | ||||||||
Fixed forward contracts |
PGM recycling revenue | $ | 243 | $ | — | $ | — | |||||||||
Fixed forward contracts |
PGM recycling revenue | $ | (47 | ) | $ | — | $ | — | ||||||||
Fair Value of Derivative Instruments
(in thousands)
As of December 31,
| Derivatives | Asset Derivatives | Liability Derivatives | ||||||||||||||||||||||||||||||
| Designated as Cash | Balance Sheet | Fair Value | Balance Sheet | Fair Value | ||||||||||||||||||||||||||||
| Flow Hedges | Location | 2009 | 2008 | 2007 | Location | 2009 | 2008 | 2007 | ||||||||||||||||||||||||
Financially settled
forward commodity contracts |
$ | — | $ | — | $ | — | Other current liabilities | $ | — | $ | — | $ | 6,424 | |||||||||||||||||||
NOTE 7
SHARE-BASED PAYMENTS
SHARE-BASED PAYMENTS
STOCK PLANS
The Company sponsors stock option plans (the “Plans”) that enable the Company to grant stock
options or nonvested shares to employees and non-employee directors. The Company has options
outstanding under three separate plans: the 1994 Incentive Plan, the General Plan and the 2004
Equity Incentive Plan. During 2004, the 1994 Incentive Plan was terminated and in early 2008, the
General Plan was terminated. Shares of common stock that have been authorized for issuance under
the 1994 Incentive Plan and the General Plan were 1,400,000 and 1,151,000, respectively. While no
additional options may be issued under these two plans, options issued prior to the termination
dates remain outstanding.
A total of 5,250,000 shares of common stock have been authorized for issuance under the 2004
Equity Incentive Plan, of which approximately 2,230,000 shares remain reserved and available for
grant as of December 31, 2009.
Awards granted under the Plans may consist of incentive stock options (ISOs) or non-qualified
stock options (NQSOs), stock appreciation rights (SARs), nonvested shares or other stock-based
awards, with the exception that non-employee directors may not be granted SARs and only employees
of the Company may be granted ISOs.
The Compensation Committee of the Company’s Board of Directors administers the Plans and
determines the exercise price, exercise period, vesting period and all other terms of instruments
issued under the Plans. Directors’ options vest over a six month period after date of grant.
Officers’ and employees’ options vest ratably over a three year period after date of grant.
Officers’ and directors’ options expire ten years after the date of grant. All other options
expire five to ten years after the date of grant, depending upon the original grant date. The
Company received approximately $9,200, $3.0 million and $0.3 million, in cash from the exercise of
stock options in 2009, 2008 and 2007, respectively.
84
Table of Contents
Nonvested Shares:
Nonvested shares granted to non-management directors certain members of management and other
employees as of December 31, 2009, 2008 and 2007, along with the related compensation expense are
detailed in the following table:
| Nonvested | Market | Compensation | ||||||||||||||||||||
| Shares | Value on | Expense | ||||||||||||||||||||
| Grant Date | Vesting Date | Granted | Grant Date | 2009 | 2008 | 2007 | ||||||||||||||||
May 7, 2004 |
May 7, 2007 | 348,170 | $ | 4,460,058 | $ | — | $ | — | $ | 495,562 | ||||||||||||
May 3, 2005 |
May 3, 2008 | 225,346 | $ | 1,654,040 | — | 147,446 | 260,656 | (1) | ||||||||||||||
April 27, 2006 |
April 27, 2009 | 288,331 | $ | 4,731,512 | 421,524 | 1,264,571 | 1,056,171 | (1) | ||||||||||||||
February 22, 2007 |
February 22, 2010 | 426,514 | $ | 5,433,788 | 1,407,082 | (3) | 1,420,002 | (2) | 1,242,863 | (1) | ||||||||||||
May 3, 2007 |
November 3, 2007 | 17,654 | $ | 280,000 | — | — | 280,000 | |||||||||||||||
February 4, 2008 |
February 4, 2011 | 16,741 | $ | 225,000 | 75,313 | 68,098 | — | |||||||||||||||
March 6, 2008 |
March 6, 2011 | 287,592 | $ | 5,283,065 | 1,701,370 | (3) | 1,435,344 | (2) | — | |||||||||||||
May 8, 2008 |
November 8, 2008 | 19,719 | $ | 280,010 | — | 280,010 | — | |||||||||||||||
December 9,2008 |
June 9, 2009 | 12,987 | $ | 40,000 | 33,333 | 6,667 | — | |||||||||||||||
January 26, 2009 |
July 26, 2009 | 9,852 | $ | 40,000 | 40,000 | — | — | |||||||||||||||
March 14, 2009 |
March 14, 2012 | 642,000 | $ | 1,964,520 | 523,138 | — | — | |||||||||||||||
April 16, 2009 |
March 14, 2012 | 328,819 | $ | 1,624,366 | 393,973 | (3) | — | — | ||||||||||||||
April 16, 2009 |
March 14, 2010 | 375,404 | $ | 1,854,496 | 1,430,977 | (3) | — | — | ||||||||||||||
May 7, 2009 |
November 7, 2009 | 55,656 | $ | 320,022 | 320,022 | — | — | |||||||||||||||
August 5, 2009 |
February 5, 2010 | 5,857 | $ | 40,000 | 32,173 | — | — | |||||||||||||||
September 21, 2009 |
March 21, 2010 | 5,070 | $ | 40,000 | 22,320 | — | — | |||||||||||||||
Total compensation expense of nonvested shares |
$ | 6,401,225 | $ | 4,622,138 | $ | 3,335,252 | ||||||||||||||||
| (1) | 78,493, 57,148, and 44,554 nonvested shares granted in 2007, 2006, and 2005, respectively, were forfeited in 2007 due to the resignation of one member of the Company’s senior management. Compensation expense in 2007 has been reduced to reflect compensation expense of $255,318, $494,949, and $281,606 recognized in 2007, 2006, and 2005, respectively, due to this resignation. Compensation expense in 2007 was also reduced by approximately $7,000 for forfeiture of approximately 3,200 nonvested shares granted to certain members of management and other employees who terminated employment in 2007. | |
| (2) | Compensation expense in 2008 was reduced by approximately $32,400 for forfeiture of approximately 7,600 nonvested shares granted in 2008 and 2007 to certain members of management and other employees who terminated employment in 2008. | |
| (3) | Compensation expense in 2009 was reduced by approximately $62,500 for forfeiture of approximately 14,100 nonvested shares granted in 2009, 2008 and 2007 to certain members of management and other employees who terminated employment in 2009. |
Deferral Plans:
The Stillwater Mining Company Non-Employee Directors’ Deferral Plan, allows non-employee
directors to defer all or any portion of the compensation received as directors, in accordance with
the provisions of Section 409A of the Internal Revenue Code and associated Treasury regulations.
All amounts deferred under this plan are fully vested, and each participant elects the deferral
period and form of the compensation (cash or Company common stock). The plan provides for a
Company matching contribution equal to 20% of the participant’s deferred amount. Each participant
elects the form of the Company match (cash or Company common stock). Compensation expense that was
deferred in common stock related to the Non-Employee Directors’ Deferral Plan was $34,900, $66,550
and $94,850 in 2009, 2008 and 2007, respectively. The Company match was made in Company common
stock.
The Stillwater Mining Company Nonqualified Deferred Compensation Plan, allows officers of the
Company to defer up to 60% of their salaries and up to 100% of cash compensation other than salary
in accordance with the provisions of Section 409A of the Internal Revenue Code and associated
Treasury regulations. All amounts deferred under this plan are fully vested, and each participant
elects the deferral period and form of the compensation (cash or Company common stock). For each
Plan year, the Company matches the amount of compensation deferred during that year up to a
85
Table of Contents
maximum
of 6% of the participant’s total compensation for the calendar year. Compensation expense deferred
in cash was $171,500, $174,200 and $121,000 in 2009, 2008 and 2007, respectively.
Stock Options:
The Company recognizes compensation expense associated with its stock option grants based on
fair market value on the date of grant using a Black-Scholes option pricing model. Stock option
grants to employees generally vest in annual installments over a three year period. The Company
recognizes stock option expense ratably over the vesting period of the options. If options are
canceled or forfeited prior to vesting, the Company stops recognizing the related expense effective
with the date of forfeiture, but does not recapture expense taken previously. The compensation
expense related to the fair value of stock options in 2009 was approximately $0.2 million. The
compensation expense related to the fair value of stock options in 2008 and 2007 was approximately
$0.4 million in each year. Compensation expense related to the fair value of stock options was
recorded in general and administrative expense.
The fair value for options in 2009, 2008 and 2007 was estimated at the date of grant using a
Black-Scholes option pricing model with the following weighted-average assumptions:
| Year ended December 31, | 2009 | 2008 | 2007 | |||||||||
Weighted average expected lives (years) |
3.6 | 3.8 | 3.9 | |||||||||
Interest rate |
1.9 | % | 2.6 | % | 4.5 | % | ||||||
Volatility |
67 | % | 58 | % | 56 | % | ||||||
Dividend yield |
0 | 0 | 0 | |||||||||
Stock option activity for the years ended December 31, 2009, 2008 and 2007, is summarized as
follows (excluding the effect of nonvested shares):
| Weighted-Average | ||||||||||||
| Weighted Average | Grant-Date Fair | |||||||||||
| Shares | Exercise Price | Value | ||||||||||
Options outstanding at December 31, 2006 |
1,350,911 | $ | 20.02 | |||||||||
Options exercisable at December 31, 2006 |
1,209,644 | |||||||||||
2007 Activity |
||||||||||||
Options granted |
73,450 | 11.59 | $ | 5.44 | ||||||||
Options exercised |
(29,375 | ) | 9.14 | |||||||||
Options canceled/forfeited |
(118,961 | ) | 16.01 | |||||||||
Options outstanding at December 31, 2007 |
1,276,025 | $ | 20.16 | |||||||||
Options exercisable at December 31, 2007 |
1,149,830 | 21.11 | ||||||||||
2008 Activity |
||||||||||||
Options granted |
87,100 | 11.72 | $ | 5.35 | ||||||||
Options exercised |
(236,690 | ) | 12.75 | |||||||||
Options canceled/forfeited |
(96,775 | ) | 16.22 | |||||||||
Options outstanding at December 31, 2008 |
1,029,660 | $ | 21.52 | |||||||||
Options exercisable at December 31, 2008 |
905,266 | 22.90 | ||||||||||
2009 Activity |
||||||||||||
Options granted |
6,984 | 7.26 | $ | 3.58 | ||||||||
Options exercised |
(1,699 | ) | 5.41 | |||||||||
Options canceled/forfeited |
(241,887 | ) | 23.36 | |||||||||
Options outstanding at December 31, 2009 |
793,058 | $ | 20.87 | |||||||||
Options exercisable at December 31, 2009 |
742,123 | 21.56 | ||||||||||
The total intrinsic value of stock options exercised during the years ended December 31, 2009,
2008 and 2007 was $6,000, $1,835,000, and $147,000, respectively. At December 31, 2009, the total
intrinsic value was $295,000 and $231,000 for stock options outstanding and exercisable,
respectively.
86
Table of Contents
The following table summarizes information for outstanding and exercisable options as of
December 31, 2009:
| Options Outstanding | Options Exercisable | |||||||||||||||||||
| Average | Weighted | Weighted | ||||||||||||||||||
| Range of | Number | Remaining | Average | Number | Average | |||||||||||||||
| Exercise Price | Outstanding | Contract Life | Exercise Price | Exercisable | Exercise Price | |||||||||||||||
$ 2.53 — $4.66 |
11,592 | 6.7 | $ | 3.72 | 6,539 | $ | 3.18 | |||||||||||||
$ 4.67 — $9.33 |
93,056 | 4.9 | $ | 7.04 | 75,550 | $ | 6.97 | |||||||||||||
$ 9.34 — $13.99 |
89,426 | 6.1 | $ | 11.73 | 72,828 | $ | 11.74 | |||||||||||||
$14.00 — $18.65 |
89,350 | 4.2 | $ | 15.56 | 81,122 | $ | 15.55 | |||||||||||||
$18.66 — $23.31 |
256,834 | 2.1 | $ | 19.34 | 253,284 | $ | 19.32 | |||||||||||||
$23.32 — $27.98 |
17,825 | 1.0 | $ | 26.48 | 17,825 | $ | 26.48 | |||||||||||||
$27.99 — $32.64 |
84,275 | 0.1 | $ | 30.40 | 84,275 | $ | 30.40 | |||||||||||||
$32.65 — $37.30 |
101,200 | 1.1 | $ | 34.71 | 101,200 | $ | 34.71 | |||||||||||||
$37.31 — $38.76 |
49,500 | 0.9 | $ | 38.34 | 49,500 | $ | 38.34 | |||||||||||||
| 793,058 | 2.7 | $ | 20.87 | 742,123 | $ | 21.56 | ||||||||||||||
A summary of the status of the Company’s nonvested stock options as of December 31, 2009, and
changes during the year then ended, is presented below:
| Weighted-Average | ||||||||
| Nonvested Options | Options | Grant-Date Fair Value | ||||||
Nonvested options at January 1, 2009 |
124,394 | $ | 5.29 | |||||
Options granted |
6,984 | 3.58 | ||||||
Options vested |
(43,471 | ) | 5.40 | |||||
Options forfeited |
(36,972 | ) | 5.30 | |||||
Nonvested options at December 31, 2009 |
50,935 | $ | 4.96 | |||||
Total compensation cost related to nonvested stock options not yet recognized is $91,400,
$20,300, and $1,400 for 2010, 2011 and 2012, respectively.
Employee Benefit Plans:
The Company has adopted two savings plans, which qualify under section 401(k) of the U.S.
Internal Revenue Code, covering essentially all non-bargaining and bargaining employees. Employees
may elect to contribute up to 60% of eligible compensation, subject to the Employee Retirement
Income Security Act of 1974 (ERISA) limitations. The Company is required to make matching
contributions equal to 100% of the employee’s contribution up to 6% of the employee’s compensation.
Matching contributions are made with common stock of the Company. During 2009, 2008 and 2007, the
Company issued approximately 0.9 million, 0.8 million and 0.5 million shares of common stock,
respectively, with a market value on the respective grant dates of $4.8 million, $6.0 million and
$5.5 million, respectively, to match employees’ contributions. The Company made no cash
contributions to the plans in 2009, 2008 or 2007.
87
Table of Contents
NOTE 8
INCOME TAXES
INCOME TAXES
The components of the Company’s deferred tax liabilities (assets) are comprised of the
following temporary differences and carry forwards at December 31, 2009 and 2008:
| December 31, (in thousands) | 2009 | 2008 | ||||||
Mine development costs |
$ | 80,369 | $ | 76,138 | ||||
Inventory |
16 | 1,550 | ||||||
Total deferred tax liabilities |
80,385 | 77,688 | ||||||
Noncurrent liabilities |
(9,262 | ) | (8,829 | ) | ||||
Property and equipment |
(29,349 | ) | (27,373 | ) | ||||
Current liabilities |
(18,145 | ) | (18,994 | ) | ||||
Long-term investments |
(1,376 | ) | (1,329 | ) | ||||
Net operating loss and other carryforwards |
(135,271 | ) | (136,112 | ) | ||||
Total deferred tax assets |
(193,403 | ) | (192,637 | ) | ||||
Valuation allowance |
113,018 | 114,949 | ||||||
Net deferred tax assets |
(80,385 | ) | (77,688 | ) | ||||
Net deferred tax liabilities |
$ | — | $ | — | ||||
In assessing the realizability of deferred tax assets, management considers whether it is more
likely than not that some portion or all of the deferred tax assets will not be realized.
Management considers the scheduled reversal of deferred tax liabilities, projected future taxable
income, and tax planning strategies in making this assessment. The Company provided a valuation
allowance in 2009 and 2008 to reflect the estimated amount of deferred tax assets which may not be
realized principally due to the expiration of the net operating loss carry forwards (NOL’s) as
management considers it more likely than not that the NOL’s will not be realized based upon
projected future taxable income.
Reconcilement of the federal income tax provision at the applicable statutory income tax rate
to the effective rate is as follows:
| Year ended December 31, (in thousands) | 2009 | 2008 | 2007 | |||||||||
Income (loss) before income taxes |
$ | (9,248 | ) | $ | (116,975 | ) | $ | (15,103 | ) | |||
Income tax (benefit) or expense at statutory rate of 35% |
$ | (3,237 | ) | $ | (40,941 | ) | $ | (5,286 | ) | |||
State income tax benefit, net of federal benefit |
(406 | ) | (5,132 | ) | (663 | ) | ||||||
Change in valuation allowance |
(1,931 | ) | 46,347 | 5,959 | ||||||||
Other |
5,544 | (306 | ) | (10 | ) | |||||||
Net income tax benefit |
$ | (30 | ) | $ | (32 | ) | $ | — | ||||
At December 31, 2009, the Company had approximately $360 million of regular tax net operating
loss carry forwards expiring during 2010 through 2029. Usage of $189 million of these net
operating losses is limited to approximately $9.5 million annually as a result of the change in
control of the Company that occurred in connection with the Norilsk Nickel transaction in 2003.
Usage of net operating losses incurred after the change in control is not subject to this
limitation.
The Company recorded a tax benefit of $30,000 and $32,000 in 2009 and 2008, respectively,
related to a refundable minimum tax credit. No cash payments for income taxes related to state tax
payments were made in 2009, 2008 or 2007.
The Company had no unrecognized tax benefits at December 31, 2009 or 2008. The Company’s
policy is to recognize interest and penalties on unrecognized tax benefits in Income tax provision
in the Statements of Operations and Comprehensive Income (Loss). There was no interest or
penalties for the year ended December 31, 2009. The tax years subject to examination by the taxing
authorities are the years ending December 31, 2008, 2007 and 2006.
88
Table of Contents
NOTE 9
COMPREHENSIVE INCOME (LOSS)
COMPREHENSIVE INCOME (LOSS)
Comprehensive income (loss) consists of earnings items and other gains and losses affecting
stockholders’ equity that are excluded from current net income (loss). As of December 31, 2009,
such items consisted of unrealized losses on available-for-sale marketable securities. In 2008 and
2007, comprehensive income (loss) consisted of unrealized gains and losses on derivative financial
instruments related to commodity price hedging activities and available-for-sale marketable
securities.
The following summary sets forth the changes in AOCI during 2009, 2008 and 2007:
| Accumulated | ||||||||||||
| Available for | Other | |||||||||||
| Sale | Commodity | Comprehensive | ||||||||||
| (in thousands) | Securities | Instruments | Loss | |||||||||
Balance at December 31, 2006 |
$ | 177 | $ | (15,780 | ) | $ | (15,603 | ) | ||||
Reclassification to earnings |
— | 31,669 | 31,669 | |||||||||
Change in value |
331 | (22,422 | ) | (22,091 | ) | |||||||
Comprehensive income |
$ | 331 | $ | 9,247 | $ | 9,578 | ||||||
Balance at December 31, 2007 |
$ | 508 | $ | (6,533 | ) | $ | (6,025 | ) | ||||
Reclassification to earnings |
6 | 12,794 | 12,800 | |||||||||
Change in value |
(674 | ) | (6,261 | ) | (6,935 | ) | ||||||
Comprehensive income (loss) |
$ | (668 | ) | $ | 6,533 | $ | 5,865 | |||||
Balance at December 31, 2008 |
$ | (160 | ) | $ | — | $ | (160 | ) | ||||
Reclassification to earnings |
— | — | — | |||||||||
Change in value |
70 | — | 70 | |||||||||
Comprehensive income (loss) |
$ | 70 | $ | — | $ | 70 | ||||||
Balance at December 31, 2009 |
$ | (90 | ) | $ | — | $ | (90 | ) | ||||
NOTE 10
SEGMENT INFORMATION
SEGMENT INFORMATION
The Company operates two reportable business segments: Mine Production and PGM Recycling.
These segments are managed separately based on fundamental differences in their operations.
The Mine Production segment consists of two business components: the Stillwater Mine and the
East Boulder Mine. The Mine Production segment is engaged in the development, extraction,
processing and refining of PGMs. The Company sells PGMs from mine production under long-term sales
agreements, through derivative financial instruments and in open PGM markets. The financial
results of the Stillwater Mine and the East Boulder Mine have been aggregated, as both have similar
products, processes, customers, distribution methods and economic characteristics.
The PGM Recycling segment is engaged in the recycling of spent catalyst material to recover
the PGMs contained in the material. The Company allocates costs of the smelter and base metal
refinery to both the Mine Production segment and to the PGM Recycling segment for internal and
segment reporting purposes because the Company’s smelting and refining facilities support the PGM
extraction of both business segments.
The All Other group primarily consists of assets, revenues, and expenses of various corporate
and support functions.
89
Table of Contents
The Company evaluates performance and allocates resources based on income or loss before
income taxes. The following financial information relates to the Company’s business segments:
| (in thousands) | Mine | PGM | All | |||||||||||||
| Year ended December 31, 2009 | Production | Recycling | Other | Total | ||||||||||||
Revenues |
$ | 306,892 | $ | 81,788 | $ | 5,752 | $ | 394,432 | ||||||||
Depreciation and amortization |
$ | 70,239 | $ | 178 | $ | — | $ | 70,417 | ||||||||
Interest income |
$ | — | $ | 786 | $ | 1,060 | $ | 1,846 | ||||||||
Interest expense |
$ | — | $ | — | $ | 6,801 | $ | 6,801 | ||||||||
Income (loss) before induced conversion loss |
$ | 26,873 | $ | 5,910 | $ | (33,934 | ) | $ | (1,151 | ) | ||||||
Induced conversion loss |
$ | — | $ | — | $ | 8,097 | $ | 8,097 | ||||||||
Income (loss) before income tax benefit (provision) |
$ | 26,873 | $ | 5,910 | $ | (42,031 | ) | $ | (9,248 | ) | ||||||
Capital expenditures |
$ | 38,520 | $ | 911 | $ | 103 | $ | 39,534 | ||||||||
Total assets |
$ | 408,146 | $ | 30,860 | $ | 285,766 | $ | 724,772 | ||||||||
| (in thousands) | Mine | PGM | All | |||||||||||||
| Year ended December 31, 2008 | Production | Recycling | Other | Total | ||||||||||||
Revenues |
$ | 360,364 | $ | 475,388 | $ | 19,980 | $ | 855,732 | ||||||||
Depreciation and amortization |
$ | 82,792 | $ | 192 | $ | — | $ | 82,984 | ||||||||
Interest income |
$ | — | $ | 6,979 | $ | 4,124 | $ | 11,103 | ||||||||
Interest expense |
$ | — | $ | 1 | $ | 9,717 | $ | 9,718 | ||||||||
Income (loss) before impairment charge |
$ | (6,413 | ) | $ | 32,671 | $ | (43,196 | ) | $ | (16,938 | ) | |||||
Impairment charge |
$ | 67,254 | $ | 25,999 | $ | 6,784 | $ | 100,037 | ||||||||
Income (loss) before income tax benefit (provision) |
$ | (73,667 | ) | $ | 6,672 | $ | (49,980 | ) | $ | (116,975 | ) | |||||
Capital expenditures |
$ | 81,657 | $ | 306 | $ | 314 | $ | 82,277 | ||||||||
Total assets |
$ | 448,312 | $ | 23,324 | $ | 251,393 | $ | 723,029 | ||||||||
| (in thousands) | Mine | PGM | All | |||||||||||||
| Year ended December 31, 2007 | Production | Recycling | Other | Total | ||||||||||||
Revenues |
$ | 331,277 | $ | 326,394 | $ | 15,365 | $ | 673,036 | ||||||||
Depreciation and amortization |
$ | 82,396 | $ | 142 | $ | — | $ | 82,538 | ||||||||
Interest income |
$ | — | $ | 6,684 | $ | 5,021 | $ | 11,705 | ||||||||
Interest expense |
$ | — | $ | — | $ | 11,269 | $ | 11,269 | ||||||||
Income (loss) before income tax benefit (provision) |
$ | (7,843 | ) | $ | 26,179 | $ | (33,439 | ) | $ | (15,103 | ) | |||||
Capital expenditures |
$ | 87,257 | $ | 382 | $ | 237 | $ | 87,876 | ||||||||
Total assets |
$ | 516,308 | $ | 89,511 | $ | 137,511 | $ | 743,330 | ||||||||
90
Table of Contents
NOTE 11
INVESTMENTS
The cost, gross unrealized gains, gross unrealized losses, and fair market value of
available-for-sale investment securities by major security type and class of security at December
31, are as follows:
| Gross | Gross | |||||||||||||||
| unrealized | unrealized | Fair | ||||||||||||||
| (in thousands) | Cost | gains | losses | market value | ||||||||||||
2009 |
||||||||||||||||
Federal agency notes |
$ | 28,102 | $ | — | $ | (54 | ) | $ | 28,048 | |||||||
Commercial paper |
6,500 | — | (33 | ) | 6,467 | |||||||||||
Mutual funds |
752 | — | (3 | ) | 749 | |||||||||||
Total |
$ | 35,354 | $ | — | $ | (90 | ) | $ | 35,264 | |||||||
2008 |
||||||||||||||||
Federal agency notes |
$ | 17,926 | $ | 69 | $ | — | $ | 17,995 | ||||||||
Commercial paper |
998 | 1 | — | 999 | ||||||||||||
Mutual funds |
579 | — | (230 | ) | 349 | |||||||||||
Total |
$ | 19,503 | $ | 70 | $ | (230 | ) | $ | 19,343 | |||||||
The mutual funds included in the investment table above are included in other noncurrent
assets on the balance sheet.
NOTE 12
INVENTORIES
INVENTORIES
For purposes of inventory accounting, the market value of inventory is generally deemed equal
to the Company’s current cost of replacing the inventory, provided that: (1) the market value of
the inventory may not exceed the estimated selling price of such inventory in the ordinary course
of business less reasonably predictable costs of completion and disposal, and (2) the market value
may not be less than net realizable value reduced by an allowance for a normal profit margin. In
order to reflect inventory costs in excess of market values, the Company, during 2009, 2008 and
2007, reduced the aggregate inventory carrying value of certain components of its in-process and
finished goods inventories by $10.9 million, $16.6 million and $6.0 million, respectively.
The costs of PGM inventories as of any date are determined based on combined production costs
per ounce and include all inventoriable production costs, including direct labor, direct materials,
depreciation and amortization and other overhead costs relating to mining and processing activities
incurred as of such date.
Inventories reflected in the accompanying balance sheets at December 31 consisted of the
following:
| (in thousands) | 2009 | 2008 | ||||||
Metals inventory |
||||||||
Raw ore |
$ | 1,163 | $ | 1,050 | ||||
Concentrate and in-process |
23,985 | 14,892 | ||||||
Finished goods |
45,114 | 35,251 | ||||||
| 70,262 | 51,193 | |||||||
Materials and supplies |
18,282 | 20,985 | ||||||
Total inventory |
$ | 88,544 | $ | 72,178 | ||||
The Company also holds in its possession materials it processes on a toll basis for customers — until the tolled material is transported to a third party refiner.
91
Table of Contents
NOTE 13
EARNINGS (LOSS) PER COMMON SHARE
EARNINGS (LOSS) PER COMMON SHARE
No adjustments were made to reported net income (loss) in the computation of basic
earnings (loss) per share or diluted earnings (loss) per share in 2009, 2008 or 2007. The Company
currently has only one class of equity shares outstanding.
Outstanding options to purchase 760,619, 888,879 and 1,058,982 weighted average shares were
excluded from the computation of diluted earnings (loss) per share in 2009, 2008 and 2007
respectively, because the Company reported losses in these years and so the effect would have been
antidilutive and inclusion of these options would have reduced the net loss per share.
There was no effect of outstanding nonvested shares on diluted weighted average shares
outstanding in 2009, 2008 or 2007 because the Company reported net losses in these years and
inclusion of any of these shares would have reduced the net loss per share amounts.
All shares of common stock applicable to the outstanding convertible debentures were
excluded from the computation of diluted weighted average shares in 2009 and 2008 because the net
effect of assuming all the debentures were converted would have been antidilutive.
NOTE 14
DEBT OBLIGATIONS
DEBT OBLIGATIONS
Convertible Debentures
On March 12, 2008, the Company issued and sold $181.5 million aggregate principal amount of
senior convertible debentures due March 15, 2028 (debentures). The debentures pay interest at
1.875% per annum, payable semi-annually on March 15 and September 15 of each year, and commenced on
September 15, 2008. The debentures will mature on March 15, 2028, subject to earlier repurchase or
conversion. Each $1,000 principal amount of debentures is initially convertible, at the option of
the holders, into approximately 42.5351 shares of the Company’s common stock, at any time prior to
the maturity date. The conversion rate is subject to certain adjustments, but will not be adjusted
for accrued interest or any unpaid interest. The conversion rate initially represents a conversion
price of $23.51 per share. Holders of the debentures may require the Company to repurchase all or
a portion of their debentures on March 15, 2013, March 15, 2018 and March 15, 2023, or at any time
before March 15, 2028 upon the occurrence of certain events including a change in control. The
Company may redeem the debentures for cash beginning on or after March 22, 2013.
After issuance of the debentures, the Company used a portion of the proceeds to repay its term
loan facility and revolving credit facility. The term loan facility and the revolving credit
facility were fully repaid and terminated on March 12, 2008. Interest expense for 2008 included
approximately $2.2 million for the write-off of unamortized fees associated with the termination of
the credit facility. Amortization expense related to the issuance costs of the debentures was $1.0
million and $0.8 million in 2009 and 2008, respectively, and the interest expense on the debentures
was $3.3 million and $2.7 million in 2009 and 2008, respectively. The Company made cash payments
of $3.4 million and $1.7 million for interest on the debentures during 2009 and 2008, respectively.
In October 2009, the Company undertook the exchange of $15 million face amount of the
convertible debentures for 1.84 million shares of the Company’s common stock. The debentures so
acquired have been retired, leaving $166.5 million face value of the debentures outstanding at
December 31, 2009. Because the number of shares issued in this transaction exceeded the 42.5351
shares per $1,000 of face value specified in the bond indenture, the Company expensed the value of
the additional shares as an “inducement loss.” Consequently, the Company recorded a loss on the
exchange transaction of $8.1 million during the fourth quarter of 2009.
EXEMPT FACILITY REVENUE BONDS
During 2000, the Company completed a $30 million offering of Exempt Facility Revenue Bonds,
Series 2000, through the State of Montana Board of Investments. The bonds were issued by the State
of Montana Board of Investments to finance a portion of the costs of constructing and equipping
certain sewage and solid waste disposal
facilities at both the Stillwater Mine and the East Boulder Mine. The bonds mature on July 1,
2020, and have a stated interest rate of 8.00% with interest paid semi-annually. The bonds have an
effective interest rate of 8.57%. Net proceeds
92
Table of Contents
from the offering were $28.7 million. The balance
outstanding for the years ended December 31, 2009 and 2008 was $29.5 million and $29.4 million,
respectively, which is net of unamortized discount of $0.5 million and $0.6 million, respectively.
CASH PAID FOR INTEREST
The Company made cash payments for interest of $5.8 million, $5.4 million and $10.1 million
for the years ended December 31, 2009, 2008 and 2007, respectively.
NOTE 15
PROPERTY, PLANT AND EQUIPMENT
PROPERTY, PLANT AND EQUIPMENT
Property, plant and equipment at December 31 consisted of the following:
| (in thousands) | 2009 | 2008 | ||||||
Machinery and equipment |
$ | 52,724 | $ | 52,503 | ||||
Buildings and structural components |
132,007 | 113,990 | ||||||
Mine development |
429,416 | 387,206 | ||||||
Land |
7,069 | 6,403 | ||||||
Construction-in-progress: |
||||||||
Stillwater Mine |
40,332 | 47,516 | ||||||
East Boulder Mine |
6,776 | 14,085 | ||||||
Other |
1,991 | 16,765 | ||||||
| 670,315 | 638,468 | |||||||
Less accumulated depreciation and amortization |
(311,449 | ) | (245,056 | ) | ||||
Total property, plant, and equipment |
$ | 358,866 | $ | 393,412 | ||||
The Company’s capital expenditures for the years ended December 31, were as follows:
| (in thousands) | 2009 | 2008 | 2007 | |||||||||
Stillwater Mine |
$ | 26,682 | $ | 46,513 | $ | 47,864 | ||||||
East Boulder Mine |
4,447 | 19,097 | 33,991 | |||||||||
Other |
8,405 | 16,667 | 6,021 | |||||||||
Total capital expenditures |
$ | 39,534 | $ | 82,277 | $ | 87,876 | ||||||
93
Table of Contents
NOTE 16
ASSET RETIREMENT OBLIGATION
ASSET RETIREMENT OBLIGATION
The following summary sets forth the annual changes to the Company’s asset retirement
obligation in 2009, 2008 and 2007:
| Stillwater | East Boulder | |||||||||||
| (in thousands) | Mine | Mine | Total | |||||||||
Balance at December 31,
2006 |
$ | 5,816 | $ | 2,734 | $ | 8,550 | ||||||
Liabilities incurred |
1,222 | — | 1,222 | |||||||||
Accretion expense |
512 | 222 | 734 | |||||||||
Revision of estimated cash flows |
— | — | — | |||||||||
Balance at December 31, 2007 |
$ | 7,550 | $ | 2,956 | $ | 10,506 | ||||||
Liabilities incurred |
— | — | — | |||||||||
Accretion expense |
644 | 241 | 885 | |||||||||
Revision of estimated cash flows |
(2,301 | ) | (2,062 | ) | (4,363 | ) | ||||||
Balance at December 31, 2008 |
$ | 5,893 | $ | 1,135 | $ | 7,028 | ||||||
Liabilities incurred |
— | — | — | |||||||||
Accretion expense |
507 | 99 | 606 | |||||||||
Revision of estimated cash flows |
(645 | ) | (780 | ) | (1,425 | ) | ||||||
Balance at December 31, 2009 |
$ | 5,755 | $ | 454 | $ | 6,209 | ||||||
Revisions during 2009 and 2008 resulted from changes in estimated timing of abandonment. In
2009, the Company increased the estimated mine life of the Stillwater Mine from the year 2030 to
2032; and it increased the estimated mine life of the East Boulder Mine from the year 2055 to 2074.
In 2008, the Company increased the estimated mine life of the Stillwater Mine five years; and it
increased the estimated mine life of the East Boulder Mine by 15 years. In 2007, the Company
recorded a $1.2 million adjustment to the future reclamation obligation at the Stillwater Mine
related to an increase in the estimated reclamation costs. No adjustment to the asset retirement
obligation for the East Boulder Mine was made in 2007.
At December 31, 2009, the Company had posted surety bonds with the State of Montana in the
amount of $25.8 million, and had obtained a letter of credit of $7.5 million to satisfy the current
$33.3 million of financial guarantee requirements determined by the regulatory agencies. The
Company anticipates these financial guarantee requirements may increase once the state finalizes
its environmental impact statement which was completed in 2008. However the Company to date has
not received a final environmental impact statement from the state.
NOTE 17
FAIR VALUE MEASUREMENTS
FAIR VALUE MEASUREMENTS
Financial assets and liabilities measured at fair value on a recurring basis at December 31,
2009, consisted of the following:
| (in thousands) | Fair Value Measurements | |||||||||||||||
| Total | Level 1 | Level 2 | Level 3 | |||||||||||||
Mutual funds |
$ | 749 | $ | 749 | $ | — | $ | — | ||||||||
Investments |
$ | 34,515 | $ | 34,515 | $ | — | $ | — | ||||||||
The fair value of mutual funds and investments, consisting of federal agency notes and
commercial paper, is based on market prices which are readily available.
94
Table of Contents
The Company’s long-term investments are carried on the balance sheet at cost. The Company
determined that its long-term investments, representing equity holdings in two exploration
companies, were other than temporarily impaired and recorded a write-down of $0.1 million in 2009.
The estimated fair value of the Company’s $166.5 million, 1.875% convertible debentures using
Level 2 inputs was $139.0 million at December 31, 2009. The Company used its current trading data
to determine the fair value of the convertible debentures. The fair value of the Company’s $30
million 8% Series 2000 exempt facility revenue bonds using Level 3 inputs was $25.6 million, at
December 31, 2009. The Company used implicit interest rates of comparable
unsecured obligations to calculate the fair value of the revenue bonds.
NOTE 18
RELATED PARTIES
RELATED PARTIES
The Palladium Alliance International (PAI) promotes palladium in the worldwide jewelry market.
Currently, the PAI receives a significant portion of its funding from the Company. In 2009, 2008
and 2007, the Company made contributions of $1.7 million, $5.2 million and $4.8 million,
respectively, to PAI. These contributions are accounted for in marketing expense.
MMC Norilsk Nickel has held a majority interest in the Company since June of 2003. As of
December 31, 2009, Norilsk Nickel controlled approximately 51.5% of the Company’s outstanding
common shares, as well as holding $80 million of the Company’s $166.5 million outstanding in 1.875%
convertible debentures due 2028. The Company arranges certain services on behalf of Norilsk Nickel
for which the Company is periodically reimbursed. Amounts due from Norilsk Nickel at December 31,
2009 and 2008 were $0.3 million and $0.2 million, respectively.
NOTE 19
COMMITMENTS AND CONTINGENCIES
COMMITMENTS AND CONTINGENCIES
The Company manages risk through insurance coverage, credit monitoring and diversification of
suppliers and customers.
REFINING AGREEMENTS
The Company has contracted with two entities to refine its filter cake production. Even
though there are a limited number of PGM refiners, the Company believes that it is not economically
dependent upon any one refiner.
OPERATING LEASES
The Company has operating leases for various office equipment and office space expiring at
various dates through December 31, 2014. Total rental expense for cancelable and non-cancelable
operating leases was $1.5 million, $1.8 million and $2.0 million in 2009, 2008 and 2007,
respectively.
95
Table of Contents
Future minimum lease payments for operating leases with terms in excess of one year are as follows:
| Year ended (in thousands) | Minimum Lease Payment | |||
2010 |
$ | 303 | ||
2011 |
303 | |||
2012 |
297 | |||
2013 |
264 | |||
2014 |
233 | |||
Total |
$ | 1,400 | ||
SIGNIFICANT CUSTOMERS
Total sales to significant customers as a percentage of total revenues for the years ended
December 31 were as follows:
| 2009 | 2008 | 2007 | ||||||||||
Customer A |
53 | % | 30 | % | 33 | % | ||||||
Customer B |
21 | % | 25 | % | 27 | % | ||||||
Customer C |
* | 13 | % | * | ||||||||
Customer D |
* | 11 | % | * | ||||||||
| 74 | % | 79 | % | 60 | % | |||||||
| * | Represents less than 10% of total revenues |
LABOR UNION CONTRACTS
As of December 31, 2009, the Company had approximately 62% and 17% of its active labor force
covered by collective bargaining agreements expiring on July 1, 2011 and July 1, 2012,
respectively.
LEGAL PROCEEDINGS
The Company is involved in various claims and legal actions arising in the ordinary course of
business, primarily employee lawsuits. In the opinion of management, the ultimate disposition of
these matters is not expected to have a material adverse effect on the Company’s financial
position, results of operations or liquidity.
REGULATIONS AND COMPLIANCE
For the past several years, the Company has been experimenting with various bio-diesel blends
and modifying some of its mining practices underground in an effort to comply with much stricter
Mine Safety and Health Administration (MSHA) limits on diesel particulate matter (DPM) exposure for
underground miners. These new limits were delayed for a time, but they ultimately went into effect
on May 20, 2008. Compliance with the revised MSHA DPM standards continues to be a challenge within
the mining industry. However, as a result of its internal efforts to reduce DPM exposure, recent
sampling indicates that the Company has achieved compliance with the new standards at both the East
Boulder Mine and the Stillwater Mine.
At year end, the Company believes all underground operations are in compliance with these
standards through the use of blended bio-diesel fuels, post exhaust treatments, power train
advances and high secondary ventilation standards. No assurance can be given that any lack of
compliance in the future will not impact the Company.
96
Table of Contents
NOTE 20
QUARTERLY DATA (UNAUDITED)
QUARTERLY DATA (UNAUDITED)
Quarterly earnings data for the years ended December 31, 2009 and 2008 were as follows:
| (in thousands, except per share data) | 2009 Quarter Ended | |||||||||||||||
| March 31 | June 30 | September 30 | December 31 | |||||||||||||
Revenue |
$ | 85,818 | $ | 94,787 | $ | 112,004 | $ | 101,823 | ||||||||
Depreciation and amortization |
$ | 17,165 | $ | 17,087 | $ | 18,549 | $ | 17,616 | ||||||||
Operating income (loss) |
$ | (10,539 | ) | $ | 5,493 | $ | 5,630 | $ | 3,141 | |||||||
Net income (loss) |
$ | (11,610 | ) | $ | 4,240 | $ | 4,319 | $ | (6,167 | ) | ||||||
Comprehensive income (loss) |
$ | (11,644 | ) | $ | 4,321 | $ | 4,411 | $ | (6,236 | ) | ||||||
Basic earnings (loss) per share |
$ | (0.12 | ) | $ | 0.04 | $ | 0.05 | $ | (0.07 | ) | ||||||
Diluted earnings (loss) per share |
$ | (0.12 | ) | $ | 0.04 | $ | 0.05 | $ | (0.07 | ) | ||||||
| 2008 Quarter Ended | ||||||||||||||||
| March 31 | June 30 | September 30 | December 31 | |||||||||||||
Revenue |
$ | 186,364 | $ | 233,150 | $ | 254,182 | $ | 182,036 | ||||||||
Depreciation and amortization |
$ | 20,695 | $ | 21,795 | $ | 19,000 | $ | 21,494 | ||||||||
Operating income (loss) |
$ | 4,580 | $ | 16,141 | $ | (4,916 | ) | $ | (134,309 | ) | ||||||
Net income (loss) |
$ | 3,137 | $ | 17,107 | $ | (3,382 | ) | $ | (133,805 | ) | ||||||
Comprehensive income (loss) |
$ | 3,225 | $ | 23,011 | $ | (3,454 | ) | $ | (133,860 | ) | ||||||
Basic earnings (loss) per share |
$ | 0.03 | $ | 0.18 | $ | (0.04 | ) | $ | (1.43 | ) | ||||||
Diluted earnings (loss) per share |
$ | 0.03 | $ | 0.18 | $ | (0.04 | ) | $ | (1.43 | ) | ||||||
ITEM 9
CHANGES IN AND DISAGREEMENTS WITH
ACCOUNTANTS ON ACCOUNTING AND FINANCIAL DISCLOSURE
CHANGES IN AND DISAGREEMENTS WITH
ACCOUNTANTS ON ACCOUNTING AND FINANCIAL DISCLOSURE
Not Applicable
ITEM 9A
CONTROLS AND PROCEDURES
CONTROLS AND PROCEDURES
| (a) | Disclosure Controls and Procedures. | |
| The Company’s management, with the participation of the Company’s Chief Executive Officer and Chief Financial Officer, has evaluated the effectiveness of the Company’s disclosure controls and procedures (as such term is defined in Rules 13a-15(e) and 15d-15(e) under the Securities Exchange Act of 1934, as amended (the “Exchange Act”)), as of the end of the period covered by this report. Based on such evaluation, the Company’s Chief Executive Officer and Chief Financial Officer have concluded that, as of the end of such period, the Company’s disclosure controls and procedures are effective in recording, processing, summarizing and reporting, on a timely basis, information required to be disclosed by the Company in the reports that it files or submits under the Exchange Act. | ||
| (b) | Changes in Internal Control Over Financial Reporting. | |
| In evaluating the registrant’s internal control over financial reporting, as required by Rules 13a-15(d) and 15d-15(d) of the Exchange Act, for the quarter ended December 31, 2009, management determined that during the fourth quarter of 2009 there were no changes to the registrant’s internal control over financial reporting (as such term is defined in Rules 13a-15(f) and 15d-15(f) of the Exchange Act) that have materially affected, or are reasonably likely to materially affect, the registrant’s internal control over financial reporting. | ||
| (c) | Internal Control Over Financial Reporting. | |
| The Company, under the supervision and with the participation of the Company’s Chief Executive Officer and Chief Financial Officer, has conducted an evaluation of the effectiveness of its internal control over financial |
97
Table of Contents
| reporting as of December 31, 2009, and has concluded that, as December 31, 2009, the Company’s internal control over financial reporting was effective. |
The Company’s independent registered public accounting firm has issued an audit opinion on the
effectiveness of the Company’s internal control over financial reporting. This report appears
within Item 8 of this Annual Report on Form 10-K.
Management’s Report on Internal Control over Financial Reporting.
| Our management is responsible for establishing and maintaining adequate internal control over financial reporting, as such term is defined in Rule 13a-15(f) of the Exchange Act. Under the supervision and with the participation of our management, including our Chief Executive Officer and Chief Financial Officer, we conducted an evaluation of the effectiveness of our internal control over financial reporting based upon the framework in Internal Control Integrated Framework issued by the Committee of Sponsoring Organizations of the Treadway Commission (COSO). Based on that evaluation, our management concluded that our internal control over financial reporting is effective, as of December 31, 2009. |
ITEM 9B
OTHER INFORMATION
OTHER INFORMATION
Not Applicable
PART III
ITEM 10
DIRECTORS, EXECUTIVE OFFICERS AND CORPORATE GOVERNANCE
DIRECTORS, EXECUTIVE OFFICERS AND CORPORATE GOVERNANCE
With regard to directors and corporate governance, reference is made to the information set
forth under the caption “Nominees for Election” in the Company’s Proxy Statement for the 2010
Annual Meeting of Stockholders to be filed pursuant to Regulation 14A, which information is
incorporated herein by reference.
Set forth below is certain information concerning the individuals who were executive officers
of the Company as of December 31, 2009.
| Name | Age | Position | ||||
Francis R. McAllister
|
67 | Chairman of the Board and Chief Executive Officer | ||||
Greg R. Struble
|
52 | Executive Vice President and Chief Operating Officer | ||||
John R. Stark
|
57 | Vice President, Human Resources, Secretary and Corporate Counsel | ||||
Gregory A Wing
|
60 | Vice President and Chief Financial Officer | ||||
Terrell I. Ackerman
|
56 | Vice President, General Manager East Boulder Operations | ||||
The following are brief biographies of the Company’s executive officers and new directors:
EXECUTIVE OFFICERS
Francis R. McAllister (age 67) was appointed Chairman of the Board and Chief Executive Officer
of the Company effective February 12, 2001. Mr. McAllister was appointed a Director of the Company
on January 9, 2001. Prior to his appointment to the Board, Mr. McAllister served with ASARCO
Incorporated from 1966 to 1999, most recently as Chairman and Chief Executive Officer in 1999, as
Chief Operating Officer from 1998 to 1999, as Executive Vice President — Copper Operations from
1993 to 1998, as Chief Financial Officer from 1982 to 1993 and in various professional and
management positions from 1966 to 1982. He currently serves on the Board of Directors of Cliffs
Natural Resources Incorporated, an iron ore mining Company. Mr. McAllister received his MBA from
New York University, his Bachelor of Science — Finance from the University of Utah, and attended
the Advanced Management Program at Harvard Business School.
Greg R. Struble (age 52) joined Stillwater Mining Company as the Company’s Executive Vice
President and Chief Operating Officer effective February 4, 2008. Mr. Struble had served
previously as Project Manager for Barrick Gold
Corporation’s Cortez Hills Project and Joint Venture. Prior to joining Barrick, he was
General Manager of Meridian Gold’s El Peñón Mine in Chile from 2003 to 2007, where he also oversaw
the final closure of the San Cristobel Mine.
98
Table of Contents
From 1997 to 2003, he was General Manager and
Underground General Manager of AngloGold’s Jerritt Canyon Mine in Nevada. And from 1983 to 1993,
Mr. Struble served in positions of increasing responsibility with Homestake Mining Company based in
South Dakota. Mr. Struble is a graduate of Michigan Technological University with a Bachelor of
Science degree in Mining Engineering.
John R. Stark (age 57) was appointed Vice President, Human Resources on September 21, 1999,
and was subsequently appointed Secretary and Corporate Counsel on May 29, 2001 and July 17, 2001,
respectively. In 2003, Mr. Stark assumed the duties and responsibilities of the Chief Commercial
Officer (including oversight of the recycling segment). Mr. Stark has a varied background in
corporate administration and human resources. He was previously with Molycorp, Inc. in 1996 as
Manager of Sales and Administration; Western Mobile, Inc., an international construction material
supplier, from 1992 to 1996; and with AMAX Inc. for 13 years until 1992. Mr. Stark received his
Juris Doctor degree from the University of Denver School of Law and holds a Bachelor of Arts degree
in economics from the University of Montana.
Gregory A. Wing (age 60) became the Company’s Vice President and Chief Financial Officer
effective March 22, 2004. Previously, Mr. Wing served as the Vice President and Chief Financial
Officer of Black Beauty Coal Company from 1995 through 2003. Prior to joining Black Beauty, Mr.
Wing was with The Pittsburg and Midway Coal Mining Company, a subsidiary of Chevron Corporation, as
Manager of Financial Planning and Analysis. From 1986 to 1989, he was employed by Chevron
Corporation as Senior Analyst in Corporation Planning, and from 1980 to 1986, he was with Arabian
American Oil Company in Dhahran, Saudi Arabia. Mr. Wing received a Bachelor of Arts in Physics and
an M.B.A in Accounting and Finance, both from the University of California at Berkeley.
Terrell I. Ackerman (age 56) is currently Vice President, General Manager – East Boulder Mine
Operations. Mr. Ackerman joined the Company in March 2000 as Director of Corporate Planning after
2 years as an independent consultant. During 1998 and 1999, Mr. Ackerman conducted feasibility
studies, operational and mine planning reviews for various underground operations. Prior to this
time, Mr. Ackerman was VP and General Manager of BHP Copper’s San Manuel Operation in Arizona. Mr.
Ackerman held increasing roles of accountability for Magma Copper Company starting as an
underground engineer in training in 1976. Mr. Ackerman received a Bachelor of Science degree in
Mine Engineering from the University of Idaho College of Mines.
For information concerning the Company’s executive officers, reference is made to the
information set forth under the caption “Section 16(a) Beneficial Ownership Compliance” in the
Company’s Proxy Statement for the 2010 Annual Meeting of Stockholders to be filed pursuant to
Regulation 14A, which information is incorporated herein by reference.
Audit Committee Financial Expert
Federal regulations and New York Stock Exchange listing requirements require the board to
determine if a member of its audit committee is an “audit committee financial expert.” According
to these requirements, an audit committee member can be designated an audit committee financial
expert only when the audit committee member satisfies five specified qualification requirements,
such as experience (or “experience actively supervising” others engaged in) preparing, auditing,
analyzing, or evaluating financial statements presenting a level of accounting complexity
comparable to what is encountered in connection with the Company’s financial statements. The
regulations further require such qualifications to have been acquired through specified means of
experience or education. While the board has confidence in the ability and the effectiveness of
its audit committee, the board has determined that no current audit committee member qualifies as
an audit committee financial expert. However, the board believes that the current members of the
audit committee are qualified and collectively have sufficient extensive financial training and
experience to carry out the duties and responsibilities of the audit committee.
New Directors of the Company
Michael S. Parrett was elected to the Company’s board of directors on May 7, 2009. Mr.
Parrett has been an independent consultant since 2002. During 2003, 2004 and the first quarter of
2005 Mr. Parrett served as a financial consultant to the Stillwater Mining Company. From 1990-2001
he was Chief Financial Officer, President of Rio Algom and Chief Executive of Billiton Base Metals.
From 1983-1989 Mr. Parrett performed various financial functions, including Controller, CFO,
Treasurer, Controller Marketing and Director Internal Audit at Falconbridge Limited. He has served
as a chairman at Gabriel Resources since December 2005 and on the Board of Directors of Fording
Coal Limited
from 2003 to 2008 and Pengrowth Corporation since 2004. Mr. Parrett is a Chartered Accountant
and received his Bachelor of Arts from York University.
99
Table of Contents
Mark V. Sander, a nominee of Norimet Limited was elected to the Company’s board of directors
on August 5, 2009. Mr. Sander brings to the Company’s board extensive experience in mining and
natural resources. He holds a PhD in Ore Deposits and Exploration from Stanford University.
Ajay Paliwal, a nominee of Norimet Limited was elected to the Company’s board of directors on
September 21, 2009. Mr. Paliwal is a chartered accountant based in the United Kingdom. He is a
founder of Jiva Capital, a firm dedicated to private equity investment and consulting services in
the global mining and metals sector. Until August 2008 Mr. Paliwal was Group Deputy CFO of Vedanta
Resources plc and between 2002 and 2005 he led Ernst & Young’s UK mining transaction business.
Prior to that, Mr. Paliwal spent eleven years at PricewaterhouseCoopers. He holds a BEng (Hons) in
Chemical Engineering from the University College of London.
Code of Ethics
The Company’s code of ethics requires honest and ethical conduct; avoidance of conflicts of
interest; compliance with applicable governmental laws, rules and regulations; full, fair,
accurate, timely, and understandable disclosure in reports and documents filed with the SEC and in
other public communications made; and accountability for adherence to the code. The code of ethics
can be accessed via the Company’s internet website at http://www.stillwatermining.com. Printed
copies will be provided upon request.
Corporate Governance
The Company’s corporate governance principles, corporate governance and nominating committee
charter, compensation committee charter and audit committee charter can be accessed via the
Company’s internet website at http://www.stillwatermining.com
NYSE CEO Certification
Pursuant to Section 303A.12(a) of the NYSE Listed Company Manual, the Company’s chief
executive officer submitted a certification, dated June 1, 2009, that to his knowledge, as of such
date, the Company was not in violation of any NYSE listing standards.
ITEM 11
EXECUTIVE COMPENSATION
EXECUTIVE COMPENSATION
Reference is made to the information set forth under the caption “Executive Compensation” in
the Company’s Proxy Statement for the 2010 Annual Meeting of Stockholders to be filed pursuant to
Regulation 14A, which information is incorporated herein by reference.
ITEM 12
SECURITY OWNERSHIP OF CERTAIN BENEFICIAL
OWNERS AND MANAGEMENT AND RELATED STOCKHOLDERS MATTERS
SECURITY OWNERSHIP OF CERTAIN BENEFICIAL
OWNERS AND MANAGEMENT AND RELATED STOCKHOLDERS MATTERS
Reference is made to the information set forth under the caption “Security Ownership of
Principal Stockholders and Management” in the Company’s Proxy Statement for the 2010 Annual Meeting
of Stockholders to be filed pursuant to Regulation 14A, which information is incorporated herein by
reference.
ITEM 13
CERTAIN RELATIONSHIPS AND RELATED TRANSACTIONS, AND DIRECTOR INDEPENDENCE
CERTAIN RELATIONSHIPS AND RELATED TRANSACTIONS, AND DIRECTOR INDEPENDENCE
Reference is made to the information set forth under the caption “Certain Relationships and
Related Transactions and Director Independence” in the Company’s Proxy Statement for the 2010
Annual Meeting of Stockholders to be filed pursuant to Regulation 14A, which information is
incorporated herein by reference.
ITEM 14
PRINCIPAL ACCOUNTING FEES AND SERVICES
PRINCIPAL ACCOUNTING FEES AND SERVICES
Reference is made to the information set forth under the caption “Principal Accounting Fees
and Services” in the Company’s Proxy Statement for the 2010 Annual Meeting of Stockholders to be
filed pursuant to Regulation 14A, which
information is incorporated herein by reference.
100
Table of Contents
PART IV
ITEM 15
EXHIBITS, FINANCIAL STATEMENT SCHEDULES
EXHIBITS, FINANCIAL STATEMENT SCHEDULES
| (a) | Documents filed as part of this Form 10-K |
| 1. | Financial Statements and Supplementary Data |
| Page | ||||
| 69 | ||||
| 71 | ||||
| 73 | ||||
| 74 | ||||
| 75 | ||||
| 76 | ||||
| 2. | Financial Statement Schedules (not applicable) |
| (b) | See Exhibit Index below | |
| (c) | Not applicable |
101
Table of Contents
EXHIBITS
| Number | Description | |
2.1
|
Exchange Agreement for 10,000 shares of common stock, dated October 1, 1993 (incorporated by reference to Exhibit 2.1 to the Registrant’s Registration Statement on Form S-1 (File No. 33-85904) as declared effective by the Commission on December 15, 1994 (the “1994 S-1”)). | |
3.1
|
Restated Certificate of Incorporation of Stillwater Mining Company, dated October 23, 2003 (incorporated by reference to Exhibit 3.1 to the Form 10-Q for the quarterly period ended September 30, 2003, filed on October 27, 2003). | |
3.2
|
Amended and Restated By-Laws of Stillwater Mining Company, (incorporated by reference to Exhibit 3.2 to the Form 8-K filed on December 29, 2004). | |
4.1
|
Form of Indenture, dated April 29, 1996, between Stillwater Mining Company and Colorado National Bank with respect to the Company’s 7% Convertible Subordinated Notes Due 2003 (incorporated by reference to Exhibit 4.1 of the Registrant’s Form 8-K, dated April 29, 1996). | |
4.2
|
Rights Agreement, dated October 26, 1995 (incorporated by reference to Form 8-A, filed on October 30, 1995). | |
4.3
|
Amendment No. 1, dated as of November 20, 2002, to the Rights Agreement between Stillwater Mining Company and Computershare Trust Company, Inc. (incorporated by reference to Exhibit 4.1 of the Registrant’s Form 8-K, dated November 21, 2002). | |
10.2
|
Mining and Processing Agreement, dated March 16, 1984 regarding the Mouat family; and Compromise of Issues Relating to the Mining and Processing Agreement (incorporated by reference to Exhibit 10.8 to the 1994 S-1). | |
10.3
|
Conveyance of Royalty Interest and Agreement between Stillwater Mining Company and Manville Mining Company, dated October 1, 1993 (incorporated by reference to Exhibit 10.9 to the 1994 S-1). | |
10.4
|
Palladium Sales Agreement, made as of August 13, 1998, between Stillwater Mining Company and Ford Motor Company (portions of the agreement have been omitted pursuant to a confidential treatment request) (incorporated by reference to Exhibit 10.1 to the Registrant’s Form 8-K, dated July 21, 1998). | |
10.5
|
Palladium and Platinum Sales Agreement, made as of August 17, 1998, between Stillwater Mining Company and General Motors Corporation (portions of the agreement have been omitted pursuant to a confidential treatment request) (incorporated by reference to Exhibit 10.3 to the Registrant’s Form 8-K, dated July 21, 1998). | |
10.7
|
Employment Agreement between Francis R. McAllister and Stillwater Mining Company, dated July 23, 2001 (incorporated by reference to Exhibit 10.1 to the Form 10-Q for the quarterly period ended September 30, 2001). | |
10.8
|
Employment agreement between John R. Stark and Stillwater Mining Company dated July 23, 2001 (incorporated by reference to Exhibit 10.18 to the Form 10-K for the year ended December 31, 2001). | |
10.9
|
First Amendment Agreement to Palladium Sales Agreement between Stillwater Mining Company and Ford Motor Company, dated October 27, 2000 (incorporated by reference to Exhibit 10.20 of the Registrant’s 2000 10-K) (portions of the agreement have been omitted pursuant to a confidential treatment request). | |
10.10
|
Second Amendment Agreement to Palladium and Platinum Sales Agreement between Stillwater Mining Company and Ford Motor Company, dated March 27, 2001 (incorporated by reference to Exhibit 10.1 to the Form 10-Q for the quarterly period ended March 31, 2001) (portions of the agreement have been omitted pursuant to a confidential treatment request). | |
10.11
|
First Amendment Agreement to Palladium and Platinum Sales Agreement between Stillwater Mining Company and General Motors Corporation, dated November 20, 2000 (incorporated by reference to Exhibit 10.21 of the Registrant’s 2000 10-K) (portions of the agreement have been omitted pursuant to a confidential treatment request). | |
10.12
|
Refining Agreement between Stillwater Mining Company and Catalyst and Chemicals Division of Johnson Matthey Inc. dated July 27, 2000 (incorporated by reference to Exhibit 10.22 of the Registrant’s 2000 10-K) (portions of the agreement have been omitted pursuant to a confidential treatment request). | |
10.13
|
Second Amendment Agreement to Palladium and Platinum Sales Agreement between Stillwater Mining Company and General Motors Corporation, dated February 14, 2001 (incorporated by reference to Exhibit 10.24 of the Registrant’s 2001 10-K). |
102
Table of Contents
| Number | Description | |
10.14
|
Employment Agreement between Greg R. Struble and Stillwater Mining Company, dated February 4, 2008 (incorporated by reference to Exhibit 10.1 to the Form 8-K filed February 11, 2008). | |
10.15
|
2008 Restricted Stock Unit Agreement between Greg R. Struble and Stillwater Mining Company, dated February 4, 2008 (incorporated by reference to Exhibit 10.2 to the Form 8-K filed February 11, 2008). | |
10.16
|
Third Amendment to Palladium and Platinum Sales Agreement between Stillwater Mining Company and Ford Motor Company, dated March 13, 2002 (incorporated by reference to Exhibit 10.33 of the Registrant’s 2002 10-K) (portions of the agreement have been omitted pursuant to a confidential treatment request). | |
10.17
|
Employment Agreement between Terrell I. Ackerman and Stillwater Mining Company dated May 8, 2002 (incorporated by reference to Exhibit 10.34 of the Registrant’s 2002 10-K). | |
10.18
|
Amended and Restated General Employee Stock Plan, dated October 23, 2003 (incorporated by reference to Exhibit 10.1 to the Form 10-Q for the quarterly period ended September 30, 2003). | |
10.19
|
Employment Agreement between Stephen A. Lang and Stillwater Mining Company dated September 1, 2003 (incorporated by reference to Exhibit 10.2 to the Form 10-Q for the quarterly period ended September 30, 2003). | |
10.20
|
Stock Purchase Agreement between Stillwater Mining Company and MMC Norilsk Nickel and Norimet Ltd. dated June 23, 2003 (incorporated by reference to Exhibit 10.1 to the Form 8-K, dated June 23, 2003). | |
10.21
|
Registration Rights Agreement, Stillwater Mining Company and Norimet Ltd. dated June 23, 2003. (incorporated by reference to Exhibit 10.2 to the Form 8-K dated June 23, 2003). | |
10.23
|
Palladium Sales Agreement, made as of March 3, 2004, among Stillwater Mining Company and Engelhard Corporation (incorporated by reference to Exhibit 10.39 to the Form 10-K filed on March 15, 2004(portions of this agreement have been omitted pursuant to a confidential treatment request). | |
10.24
|
Employment Agreement between Gregory A. Wing and Stillwater Mining Company dated as of March 22, 2004 (incorporated by reference to Exhibit 10.40 to the Form 10-K filed on March 15, 2004). | |
10.25
|
Articles of Agreement between Stillwater Mining Company (East Boulder) Paper, Allied Industrial, Chemical and Energy Workers International Union, ratified July 2002 (incorporated by reference to Exhibit 10.41 to the Form 10-K filed on March 15, 2004). | |
10.26
|
Amendment No. 1 to Stockholders Agreement, dated as of March 19, 2004, made by and among Stillwater Mining Company and MMC Norilsk Nickel (incorporated by reference to Exhibit 2.1 to the Form 10-Q filed on May 7, 2004). | |
10.28
|
Articles of Agreement between Stillwater Mining Company (Stillwater Mine & Mill, and the Processing and Warehouse facilities) Paper, Allied Industrial, Chemical and Energy Workers International Union, ratified July 19, 2004 (incorporated by reference to Exhibit 10.1 to the Form 10-Q filed on August 5, 2004). | |
10.29
|
Credit Agreement, dated August 3, 2004, between Stillwater Mining Company and TD Securities (USA), Ltd. (incorporated by reference to Exhibit 10.2 to the Form 10-Q filed on August 5, 2004). | |
10.30
|
Fourth Amendment to Palladium and Platinum Sales Agreement between Stillwater Mining Company and Ford Motor Company, dated February 20, 2003 (incorporated by reference to Exhibit 10.1 to the Form 10-Q filed on November 2, 2004). | |
10.31
|
Fifth Amendment to Palladium and Platinum Sales Agreement between Stillwater Mining Company and Ford Motor Company, dated May 4, 2004 (incorporated by reference to Exhibit 10.1 to the Form 10-Q filed on November 2, 2004). | |
10.33
|
Contract between Stillwater Mining Company and USW International Union, Local 1, East Boulder Unit, effective July 10, 2005 (incorporated by reference to Exhibit 10.1 to the Form 10-Q filed on August 8, 2005). | |
10.34
|
409A Nonqualified Deferred Compensation Plan, (incorporated by reference to exhibit 10.34 to the Form 10-K filed on March 16, 2006). | |
10.35
|
2004 Equity Incentive Plan (incorporated by reference to Appendix A to the Proxy statement, dated April 29, 2004). | |
10.36
|
409A Non-Employee Directors Deferred Compensation Plan (incorporated by reference to Exhibit 10.1 to the Form-8K dated May 9, 2005). | |
10.37
|
Amendment No. 1 to Credit Agreement, dated August 3, 2004, between Stillwater Mining Company and TD Securities (USA), Ltd., dated January 31, 2006 (incorporated by reference to Exhibit 10.1 to the Form 8-K dated February 3, 2006). |
103
Table of Contents
| Number | Description | |
10.38
|
Amendment No. 2 and Waiver to Credit Agreement, dated August 3, 2004, between Stillwater Mining Company and TD Securities (USA), Ltd., dated November 5, 2007 (incorporated by reference to Exhibit 10.1 to the Form 8-K dated November 8, 2007). | |
10.39
|
Articles of Agreement between Stillwater Mining Company (Stillwater Mine & Mill, and the Processing and Warehouse facilities) and United Steel Workers (USW) Local 11-0001, ratified July 16, 2007 (incorporated by reference to Exhibit 10.1 to the Form 10-Q filed on August 7, 2007). | |
10.40
|
Supplemental Memorandum of Understanding between Stillwater Mining Company (Stillwater Mine & Mill, and the Processing and Warehouse facilities) and United Steel Workers (USW) Local 11-0001, ratified September 4, 2007 (incorporated by reference to Exhibit 10.2 to the Form 10-Q filed on November 6, 2007). | |
10.41
|
Third Amendment Agreement to Palladium and Platinum Sales Agreement between Stillwater Mining Company and General Motors Corporation, dated August 8, 2007 (portions of the agreement have been omitted pursuant to a confidential treatment request), (incorporated by reference to Exhibit 10.3 to the Form 10-Q filed on November 6, 2007). | |
10.42
|
Palladium and Rhodium Sales Agreement, made as of August 8, 2007, between Stillwater Mining Company and General Motors Corporation (portions of the agreement have been omitted pursuant to a confidential treatment request), (incorporated by reference to Exhibit 10.4 to the Form 10-Q filed on November 6, 2007). | |
10.43
|
First Amendment Agreement to Palladium and Rhodium Sales Agreement between Stillwater Mining Company and General Motors Corporation, dated December 9, 2008 (portions of the agreement have been omitted pursuant to a confidential treatment request) (incorporated by reference to Exhibit 10.43 to the Form 10-K filed on March 16, 2009). | |
10.44
|
Memorandum of Understanding between Stillwater Mining Company East Boulder Operation and United Steel Workers International Union, Local 11-001, East Boulder Unit, dated December 1, 2008 (incorporated by reference to Exhibit 10.44 to the Form 10-K filed on March 16, 2009). | |
10.45
|
Form of 1.875% Convertible Senior Note due 2028 (incorporated by reference to Exhibit 4.2 to the Registrant’s form 8-K, dated March 14, 2008). | |
10.46
|
Amendment No. 1 to Stockholders Agreement, dated March 10, among Stillwater Mining Company, MMC Norilsk Nickel, and Norimet Limited (incorporated by reference to Exhibit 10.1 to the Registrant’s form 8-K, dated March 14, 2008). | |
10.47
|
Indenture, dated as of March 12, 2008, among Stillwater Mining Company, Law Debenture Trust Company of New York, and Deutsche Bank Trust Company Americas. (incorporated by reference to Exhibit 4.1 to the Registrant’s form 8-K, dated March 14, 2008). | |
10.48
|
Registration Rights Agreement, dated as of March 12, 2008, between Stillwater Mining Company and Deutsche Bank. (incorporated by reference to Exhibit 4.3 to the Registrant’s form 8-K, dated March 14, 2008). | |
10.49
|
Amended and Restated Secondary Materials Processing Agreement, dated as of June 7, 2005, among Stillwater Mining Company and Power Mount Incorporated (incorporated by reference to Exhibit 10.1 to the Registrant’s form 8-K, dated December 9, 2008) (portions of the agreement have been omitted pursuant to a confidential treatment request). | |
10.50
|
Purchase Agreement, Stillwater Mining Company and Deutsche Bank, dated March 6, 2008. (incorporated by reference to Exhibit 99.1 to the Registrant’s form 8-K, dated March 7, 2008). | |
10.51
|
Second Amendment Agreement to Palladium and Rhodium Sales Agreement between Stillwater Mining Company and General Motors Corporation, dated March 5, 2009 (portions of the agreement have been omitted pursuant to a confidential treatment request), (incorporated by reference to Exhibit 10.1 to the form 10-Q filed on August 7, 2009). | |
18.1
|
Preferability letter from KPMG LLP dated March 30, 2005. (incorporated by reference to Exhibit 18.1 to the Form 10-K filed on March 31, 2005). | |
23.1
|
Consent of KPMG LLP, Independent Registered Public Accounting Firm (filed herewith). | |
23.2
|
Consent of Behre Dolbear & Company, Inc. (filed herewith). | |
31.1
|
Rule 13a-14(a)/15d-14(a) Certification – Chief Executive Officer, (filed herewith). | |
31.2
|
Rule 13a-14(a)/15d-14(a) Certification – Vice President and Chief Financial Officer, (filed herewith). | |
32.1
|
Section 1350 Certification, (filed herewith). | |
32.2
|
Section 1350 Certification, (filed herewith). |
104
Table of Contents
SIGNATURES
Pursuant to the requirements of Section 13 or 15(d) of the Securities Exchange Act of 1934,
the Registrant has duly caused this report to be signed on its behalf by the undersigned, thereunto
duly authorized.
| STILLWATER MINING COMPANY (“Registrant”) |
||||
| Dated: February 26, 2010 | By: | /s/ Francis R. McAllister | ||
| Francis R. McAllister | ||||
| Chairman and Chief Executive Officer | ||||
Pursuant to the requirements of the Securities Exchange Act of 1934, this report has been
signed below by the following persons on behalf of the registrant and in the capacities and on the
dates indicated.
| Signature and Title | Date | |||
/s/ Francis R. McAllister
|
February 26, 2010 | |||
Chairman, Chief Executive Officer and Director |
||||
(Principal Executive Officer) |
||||
/s/ Gregory A. Wing
|
February 26, 2010 | |||
Vice President and Chief Financial Officer |
||||
(Principal Accounting Officer) |
||||
/s/ Craig L. Fuller
|
February 26, 2010 | |||
/s/ Patrick M. James
|
February 26, 2010 | |||
/s/ Steven S. Lucas
|
February 26, 2010 | |||
/s/ Mark V. Sander
|
February 26, 2010 | |||
/s/ Sheryl K. Pressler
|
February 26, 2010 | |||
/s/ Ajay Paliwal
|
February 26, 2010 | |||
/s/ Michael S. Parrett
|
February 26, 2010 | |||
/s/ Michael Schiavone
|
February 26, 2010 | |||
105