Attached files
| file | filename |
|---|---|
| EX-32.1 - EX-32.1 - Phase Forward Inc | a2196808zex-32_1.htm |
| EX-32.2 - EX-32.2 - Phase Forward Inc | a2196808zex-32_2.htm |
| EX-31.2 - EX-31.2 - Phase Forward Inc | a2196808zex-31_2.htm |
| EX-31.1 - EX-31.1 - Phase Forward Inc | a2196808zex-31_1.htm |
| EX-21.1 - EX-21.1 - Phase Forward Inc | a2196808zex-21_1.htm |
| EX-23.1 - EX-23.1 - Phase Forward Inc | a2196808zex-23_1.htm |
UNITED STATES
SECURITIES AND EXCHANGE COMMISSION
Washington, D.C. 20549
FORM 10-K
| ý | ANNUAL REPORT PURSUANT TO SECTION 13 OR 15(d) OF THE SECURITIES EXCHANGE ACT OF 1934 | |
For the fiscal year ended December 31, 2009 |
||
or |
||
o |
TRANSITION REPORT PURSUANT TO SECTION 13 OR 15(d) OF THE SECURITIES EXCHANGE ACT OF 1934 |
|
Commission File Number: 000-50839
Phase Forward Incorporated
(Exact name of registrant as specified in its charter)
| Delaware (State or other jurisdiction of incorporation or organization) |
04-3386549 (I.R.S. Employer Identification No.) |
77 Fourth Avenue
Waltham, Massachusetts 02451
(Address of principal executive offices)
(888) 703-1122
(Registrant's telephone number, including area code)
Securities registered pursuant to Section 12(b) of the Act:
Title of each class
|
Name of each exchange on which registered
|
|
|---|---|---|
| Common Stock, par value $0.01 per share | The NASDAQ Stock Market LLC |
Securities
registered pursuant to Section 12(g) of the Act:
None
Indicate by check mark if the registrant is a well-known seasoned issuer, as defined in Rule 405 of the Securities Act. Yes o No ý
Indicate by check mark if the registrant is not required to file reports pursuant to Section 13 or Section 15(d) of the Act. Yes o No ý
Indicate by check mark whether the registrant (1) has filed all reports required to be filed by Section 13 or 15(d) of the Securities Exchange Act of 1934 during the preceding 12 months (or for such shorter period that the registrant was required to file such reports), and (2) has been subject to such filing requirements for the past 90 days. Yes ý No o
Indicate by check mark whether the registrant has submitted electronically and posted on its corporate Web site, if any, every Interactive Data File required to be submitted and posted pursuant to Rule 405 of Regulation S-T (§232.405 of this chapter) during the preceding 12 months (or for such shorter period that the registrant was required to submit and post such files). Yes o No o
Indicate by check mark if disclosure of delinquent filers pursuant to Item 405 of Regulation S-K is not contained herein, and will not be contained, to the best of registrant's knowledge, in definitive proxy or information statements incorporated by reference in Part III of this Form 10-K or any amendment to this Form 10-K. o
Indicate by check mark whether the registrant is a large accelerated filer, an accelerated filer, a non-accelerated filer, or a smaller reporting company. See the definitions of "large accelerated filer," "accelerated filer" and "smaller reporting company" in Rule 12b-2 of the Exchange Act. (Check one):
| Large accelerated filer ý | Accelerated filer o | Non-accelerated filer o (Do not check if a smaller reporting company) |
Smaller reporting company o |
Indicate by check mark whether the registrant is a shell company (as defined in Rule 12b-2 of the Exchange Act). Yes o No ý
Aggregate market value of the voting stock held by non-affiliates of the registrant.
Date
|
Non-Affiliate Voting Shares Outstanding
|
Aggregate Market Value
|
||
|---|---|---|---|---|
| June 30, 2009 | 42,134,968 | $636,659,366 |
Shares of voting stock held by each officer and director and by each person who owns 5% or more of the outstanding common stock have been excluded in that such persons may be deemed to be affiliates. This determination of affiliate status is not necessarily a conclusive determination for other purposes. The registrant has no shares of non-voting stock authorized or outstanding.
Number of shares outstanding of each of the registrant's classes of common stock, as of the latest practicable date.
Date
|
Class
|
Outstanding Shares
|
||
|---|---|---|---|---|
| February 19, 2010 | Common Stock, $0.01 par value per share | 43,573,422 |
DOCUMENTS INCORPORATED BY REFERENCE
Portions of the registrant's definitive Proxy Statement for the registrant's 2010 Annual Meeting of Stockholders, which is expected to be filed pursuant to Regulation 14A within 120 days of the registrant's fiscal year ended December 31, 2009, are incorporated by reference into Part III of the Form 10-K. With the exceptions of the portions of the Proxy Statement expressly incorporated by reference, such document shall not be deemed filed with this Form 10-K.
PHASE FORWARD INCORPORATED
ANNUAL REPORT ON
FORM 10-K
FOR THE YEAR ENDED DECEMBER 31, 2009
2
This Annual Report on Form 10-K ("Annual Report") contains forward-looking statements within the meaning of Section 27A of the Securities Act of 1933, as amended, and Section 21E of the Securities and Exchange Act of 1934, as amended, and is subject to the "safe harbor" created by those sections. This Annual Report contains express or implied forward-looking statements relating to, among other things, Phase Forward's expectations and assumptions concerning management's forecast of financial performance, the performance of Phase Forward's products and services, future business and operations plans of Phase Forward's customers, the ability of Phase Forward's customers to realize benefits from the use of Phase Forward's products and services, the performance of Phase Forward's competitors and future changes in competitive factors, external pricing pressures, the impact on Phase Forward's securities portfolio due to illiquid credit markets/general market conditions, Phase Forward's corporate documents and their effect on shareholder action, changes in government regulations (e.g. HIPAA regulations), and management's plans, objectives and strategies. Some of the forward-looking statements can be identified by the use of forward-looking terms such as "believes," "expects," "may," "will," "should," "could," "seek," "intends," "plans," "estimates," "anticipates" or other comparable terms. Forward-looking statements involve inherent risks and uncertainties. A number of important factors could cause actual results to differ materially from those in the forward-looking statements. We urge you to consider the risks and uncertainties discussed elsewhere in this Annual Report under "Item 1A. Risk Factors" in evaluating our forward-looking statements. We have no plans to update our forward-looking statements to reflect events or circumstances occurring after the date of this report. We caution readers not to place undue reliance upon any such forward-looking statements, which speak only as of the date made.
Overview
Phase Forward Incorporated is a provider of an Integrated Clinical Research Suite, or ICRS, of enterprise-level software products, services and hosted solutions for use in our customers' global clinical trial and drug safety monitoring activities. Our customers include pharmaceutical, biotechnology and medical device companies, as well as academic institutions, governmental regulatory agencies, contract research organizations, or CROs, and other entities engaged in clinical trial and drug safety monitoring activities. By automating essential elements of the clinical trial and drug safety monitoring processes, we believe our products allow our customers to accelerate the market introduction of new medical therapies and corresponding revenues, reduce overall research and development expenditures, enhance existing data quality control efforts, increase drug safety compliance and reduce clinical and economic risk.
Our electronic data capture and clinical data management products are designed to offer our customers enterprise-level automation of time-consuming, paper-based clinical trial processes and to scale securely, reliably and cost-effectively for clinical trials involving substantial numbers of clinical sites and patients worldwide. Our clinical data analysis systems consist of a clinical data repository and a statistical computing environment, which we refer to collectively as our Clinical Development Center. Our drug safety products are designed to enable customers to detect, analyze and manage product safety throughout the product life cycle. Our interactive response technologies, or IRT, are designed to streamline the randomization process and drug supply chain management of our customers' clinical trials. Our integrated clinical research suite products are supported by comprehensive consulting and training services and application hosting and support capabilities on a global scale. Our integrated clinical research suite is comprised of four general categories that include the following software products, which we generally offer under term enterprise licenses or as a hosted application solution delivered through a standard Web-browser:
- •
- Electronic Data Capture (EDC)
3
- •
- InForm™, our Internet-based electronic data capture solution
for collection and transmission of patient information in clinical trials;
- •
- LabPas™, our system for Phase I clinic automation; and
- •
- OutcomeLogix™, our ePRO and late phase solution for data
capture which supports data entry via web interface and/or mobile interface for handheld devices, which we acquired as a result of the acquisition of Maaguzi, LLC in July 2009.
- •
- Clinical Data Management
- •
- Clintrial™, our clinical data management solution;
- •
- WebSDM™, our system for validating and reviewing clinical
trial data represented in formats meeting industry standards, such as those established by the Clinical Data Interchange Standards Consortium, or CDISC; and
- •
- Clinical Development Center, which includes our controlled clinical data
repository product for storing and managing clinical trials data (both data and metadata), as well as our metadata-driven controlled statistical control environment for automation and tracking of
routine and repetitious statistical programming and analysis, which we acquired as a result of the acquisition of Waban Software, Inc. in April 2009.
- •
- Drug Safety
- •
- Empirica™ Trace, our adverse event management solution for
monitoring drug safety and reporting adverse events that occur during and after conclusion of the clinical trial process;
- •
- Empirica Signal, our data mining and signal detection solution for
post-marketing data; and
- •
- Empirica Study (formerly known as CTSD™), our signal detection solution for data from clinical
trials.
- •
- Interactive Response Technology (IRT)
- •
- Phase Forward™ IRT (formerly known as Clarix™), our Web-integrated interactive response technology; and
- •
- Covance IVRS/IWRS, a legacy phone-integrated interactive response technology, which we acquired from Covance, Inc. in August 2009. (While we have existing trials running on the Covance IVRS/IWRS system, we do not intend to sell this offering or implement any new trials for use on this system.)
Our Strategy
Our objective is to provide an ICRS of technology solutions to automate and integrate the management of the entire clinical development process from study initiation and regulatory submission through post-approval trials and pharmacovigilance with a single source of accountability and delivery. Also, for each component of our Integrated Clinical Research Suite, our objective is to become the standard for electronic data capture, data management, interactive response technology, drug safety reporting and signal detection in global clinical trial and drug safety monitoring activities. Key strategic directives include:
- •
- Increase penetration within our customer base for existing solutions. We believe that there is a significant opportunity to increase the use of our InForm, OutcomeLogix and Phase Forward IRT solutions within our customer base. Furthermore, the decentralized nature of many of our customers offers us the opportunity to increase use of our currently-deployed software products, services and hosted solutions within their enterprises by targeting additional functional areas and business units.
4
- •
- Expand adoption of additional solutions within our existing customer
base. We believe that there is a significant opportunity to migrate existing customers that are utilizing one or more of our product
offerings to a comprehensive solution that integrates additional components of our integrated clinical research suite of software products on an enterprise-wide basis. We believe that a
large percentage of our current customers would benefit from the integration of our software solutions and the related benefits of delivery from a single vendor, and we intend to continue to pursue
these cross-selling opportunities.
- •
- Expand the customer base for our software products, services and hosted
solutions. We believe that adoption growth for electronic data capture, clinical data management, interactive response technology, drug safety reporting and signal detection
solutions and other automation solutions is at varying stages for our different products and service offerings in the clinical trial and safety monitoring marketplace. Our current base of over 335
customers includes pharmaceutical, biotechnology and medical device companies, as well as academic institutions, governmental regulatory agencies and CROs of all sizes. We intend to secure additional
customers by leveraging our industry position and domain expertise in technology development, sales and customer support.
- •
- Continue to capitalize on our technology position and expand our product
offerings. Our domain expertise and advanced technologies, some of which we acquired through the acquisition of other companies or businesses, have enabled us to become
well-positioned as a single-source vendor of an end-to-end integrated clinical research suite to pharmaceutical, biotechnology, medical device companies and CROs,
as well as academic institutions, governmental regulatory agencies and other entities engaged in clinical trial and safety monitoring activities. We intend to strengthen our position by leveraging our
technology development resources to enhance our current product offerings and to introduce additional integrated software solutions to our suite. In addition to continuing to enhance our existing
software products, services and hosted solutions through internal development, we intend to develop new software products, services and hosted solutions through internal development, possible
acquisitions and relationships with third-party technology providers with the intent of strengthening our market position. For instance, in 2009 we added the OutcomeLogix and Clinical Development Center solution to our product portfolio as a result of our
acquisitions of Maaguzi, LLC and Waban Software, Inc, respectively.
- •
- Continue to provide a superior level of global customer service and support. In light of the critical importance of the clinical trial and drug safety monitoring activities of our global customers, the delivery of a high level of multinational customer service and multilingual support with deep regulatory expertise is essential, and we believe a significant differentiating characteristic of our business strategy. We intend to leverage the knowledge and extensive expertise of our employees in the areas of clinical trial management and drug development, drug supply management, drug safety and regulatory approval to provide customers with exceptional support and consulting services that accelerate the adoption of our technologies.
5
Our Business Model
Our software solutions are generally provided to our customers for enterprise adoption through multi-year term licenses of generally two to five years with periodic fees or as fully-hosted solutions for customers who prefer a hosted solution, as detailed in the following table.
| |
Available As: | ||||
|---|---|---|---|---|---|
Product
|
Term License | Hosted Application | |||
Electronic Data Capture |
|||||
InForm |
Yes | Yes | |||
LabPas |
Yes | Yes | |||
OutcomeLogix |
No | Yes | |||
Clinical Data Management |
|||||
Clintrial |
Yes | No | |||
WebSDM |
Yes | Yes | |||
Clinical Development Center |
Yes | Yes | |||
Drug Safety |
|||||
Empirica Trace |
Yes | Yes | |||
Empirica Signal |
Yes | Yes | |||
Empirica Study |
Yes | Yes | |||
Interactive Response Technology |
|||||
Phase Forward IRT |
No | Yes | |||
Covance IVRS/IWRS |
No | Yes | |||
While we have existing trials running on the Covance IVRS/IWRS system, we do not intend to sell this offering or implement any new trials for use on this system.
We may in the future make products that are presently available under either a term license or on a hosted application basis (but not both) available to customers under both modes of offering.
Our pricing model and the contractual nature of our services and support solutions, which generally requires us to recognize revenue ratably over the life of a contract, provides us with a level of multi-year financial reporting stability. We believe this business model differentiates us from many of our competitors, as our current and potential customers frequently look to long-term financial stability as a key criterion in evaluating a vendor to utilize in the clinical development process.
Our Software Solutions and Services
While we offer our software solutions as part of an integrated clinical research suite, any of our products may be licensed or used as a hosted solution on a stand-alone basis, subject to availability in the desired mode of offering. Our software solutions also offer integration capabilities with certain complementary commercial or internally-developed applications used by our customers. We believe that all of our software products, services and hosted solutions may be used in a manner that will allow our customers to comply with current applicable global regulatory requirements, including applicable rules established by the U.S. Food and Drug Administration, or FDA, and other governmental regulatory authorities, regarding the use of software in the clinical development process. We have a dedicated team that monitors regulatory developments applicable to our customers and their clinical trial and drug safety monitoring activities.
6
Our product line is comprised of four general categories (electronic data capture, clinical data management, drug safety and interactive response technology) that include the following primary product and service offerings:
Electronic Data Capture
InForm is our Internet-based electronic data capture software solution that helps reduce the inefficiencies, inaccuracies and costs associated with paper-based clinical data collection methodologies that are traditionally employed at the remote sites where clinical trial participants are monitored. Through the InForm platform, our customers can deploy customized electronic case report forms, or eCRFs, in multiple languages for on-site clinical data input, which incorporate automated edit checking and deliver enterprise-level visibility to data at an accelerated rate previously unavailable through paper-based clinical trial data collection approaches. Our InForm product also includes an integrated reporting module that gives users timely visibility to the operating efficiencies of the trial and into the clinical data as it is collected. InForm's Internet-based platform and automated site assessment capabilities facilitate rapid, cost efficient multi-site deployment. InForm is highly scalable and has been utilized by our customers to run clinical trials involving, collectively, hundreds of thousands of patients across multiple continents. In addition to its availability through term licenses, customers may elect to use InForm through our fully-hosted deployment program, which includes application hosting as well as clinical trial site assessment, training and support. An offline version of our InForm product is also offered where network connections are not reliable or available. We also offer modules and add-on products for the InForm software, which include:
- •
- Central Coding™, which enables automatic or manual coding of
clinical drug names and indications, adverse event terms and patient medical history. The Central Coding product may also be used with our Clintrial
solution.
- •
- Central Designer™, a tool to facilitate the creation of
electronic case report forms easier through a centralized development environment with a flexible and intuitive user interface, as well as through increased use of templates and reuse of study
components. The Central Designer product may also be used with our Clintrial solution.
- •
- InForm Adapter, which provides a set of published Web services interfaces
that enable the secure, and in some instances bi-directional, exchange of data and information with the InForm environment.
- •
- InForm CRF Submit, a module that streamlines the preparation process for
archives and electronic submissions to regulatory agencies by producing Adobe® Portable Document Format (PDF) editions of the InForm
electronic eCRFs.
- •
- InForm Architect™, a tool that allows users without extensive coding knowledge to design electronic case report forms.
LabPas is our software solution for Phase I clinic automation. The LabPas workflow and sample management software targets the critical quality and resource needs of Phase I clinical research. The LabPas product supports the deployment of personal digital assistants, or PDAs, to enable clinicians to scan patient and collection vessel barcodes, providing real-time electronic data entry for collection times, comments, dosing, vital signs and adverse events. LabPas has additional modules for trial subject recruitment, management of storage conditions for collected samples and for laboratory information management.
OutcomeLogix is our electronic patient reported outcomes, or ePRO, and late phase solution. The OutcomeLogix software enables the collection and management of patient reported outcome information directly from patients through a standard Web-browser. This solution is designed to facilitate improvements in patient reporting compliance, quality and efficiencies compared to paper-based data collection and management methods. The OutcomeLogix software also provides a data collection and management solution tailored to the specific requirements of late phase studies such as observational studies and registries.
7
Clinical Data Management
Clintrial is our clinical data management software solution that allows customers to input, monitor, correct, code and analyze clinical data collected through integration with our InForm platform or third party solutions, as well as through traditional paper-based methods. Our Clintrial platform employs comprehensive tools for automated data entry control and tracking, error checking, industry-standard clinical coding, quality assurance and data import/export. Clintrial features an architecture that can manage thousands of clinical trials per customer and accommodate highly intricate study designs with little degradation of performance over a large amount of data.
WebSDM is our solution for validating and reviewing clinical trial data. Developed through a Cooperative Research and Development Agreement, or CRADA, with the U.S. Food and Drug Administration, or FDA, WebSDM helps customers validate and review clinical trial data represented according to industry data standards established by CDISC. The WebSDM product loads and validates datasets and permits customers to browse both the clinical data and any discrepancies identified during the validation process, so that data problems may be addressed prior to submission of New Drug Applications to the FDA.
Clinical Development Center is our controlled solution for storing and integrating clinical data and information in a central repository, and automating and managing statistical analysis, reporting and submissions. The Clinical Development Center solution consists of a Clinical Data Repository, which is a secure and managed environment for receiving, integrating, transforming and storing clinical data, information and standards, and a Statistical Control Environment, which is a controlled solution to automate and track the statistical analysis process, providing end-to-end traceability of data, analysis and reports.
Drug Safety
Empirica Trace is our drug safety software solution that helps customers comply with the complex global safety regulations and reporting deadlines associated with clinical research, post-approval marketing and drug surveillance by expediting the clinical evaluation and tracking of adverse events. Through Empirica Trace, our customers can enter adverse event data from multiple sources, code, reconcile and analyze the data reports, and then submit required adverse event reports to regulatory authorities via electronic or paper-based methods. Our Empirica Trace product provides customers with near real-time visibility of drug safety data, thereby facilitating compliance with regulatory reporting deadlines and more timely identification of therapeutics that may pose risks to patients. Our Empirica Trace product also includes a reporting module that enables users to generate various reports containing safety and adverse event data. The current version of the Empirica Trace product integrates with our Electronic Case Submissions Module, or Empirica Gateway, automating the exchange of electronic case safety information with regulatory agencies, affiliates and partners.
Empirica Signal is our drug safety software solution for data mining and signal management that allows customers to detect safety signals in databases of adverse event reports. It can be used in conjunction with in-house adverse event databases (such as customer databases containing adverse event reports collected through use of our Empirica Trace solution), or large databases of reports gathered by public health agencies such as the FDA and the World Health Organization. We also offer an extended version of Empirica Signal, called Signal Management, which is a workflow solution that helps large organizations to assemble and track information on drug-event combinations of interest and to prioritize work among multiple safety reviewers.
8
Empirica Study (formerly known as CTSD) is our drug safety software solution for clinical trials signal detection that supports customers in the early detection of drug safety problems during clinical development. Empirica Study manages a repository of clinical trial data and allows users to specify, execute and interpret data mining runs to detect differences in the safety profile of the drug under development and the corresponding profile for placebo or other comparator treatments. This repository supports the loading of data in formats meeting standards established by CDISC, which develops and supports global, platform-independent data standards that enable information system interoperability to improve medical research and related areas of healthcare. Our Empirica Study product includes built-in safety screens for differences in reported adverse events, critical laboratory values, vital signs, ECG measurements, and other data collected during a clinical trial. Empirica Study also supports workflow for managing and documenting the resolution of any safety signals that are identified.
Interactive Response Technology
Phase Forward IRT is our Web-integrated interactive response technology that helps streamline the randomization process and drug supply chain management of our customers' clinical trials. It is presently offered only on a hosted application basis. Phase Forward IRT is used for subject randomization, predictive medication inventory management, and operational management and reporting in clinical trials. By automating the randomization process and centralizing the overall supply chain for dispensing medical kits, our Phase Forward IRT solution helps our customers better manage their medical kit inventories, which reduces drug waste and helps keep costs under control. The Phase Forward IRT operational and reporting functionalities are accessed via a Web interface through a standard Web-browser. We also provide a related module, Phase Forward IRT Forecasting, which enables customers to develop and test forecasts for supplies strategies pre- and post-study go-live. By linking to live studies running in Phase Forward IRT, customers can compare forecasts to actual data to facilitate review and potential amendment of strategies.
Covance IVRS/IWRS is a legacy phone-integrated interactive response technology which we acquired from Covance Inc. in August 2009. While we have existing trials running on the Covance IVRS/IWRS system, we do not intend to sell this offering or implement any new trials for use on this system.
Integrated Offerings
While we offer our software solutions as part of an integrated clinical research suite, any of our products may be licensed or used as a hosted solution on a stand-alone basis (subject to availability in the desired mode of offering). We intend to continue to develop integration across the components of our integrated clinical research suite to provide value and efficiencies to our customers.
Services
Our products are supported by comprehensive consulting and training services and application hosting and support capabilities on a global scale. In addition to our U.S. headquarters, we have offices with services personnel in Australia, Belgium, France, India, Japan, Romania and the United Kingdom.
Application Hosting Services. In addition to making our InForm, LabPas, Clintrial, WebSDM, Clinical Development Center and Empirica software products available to customers through licenses, we offer our InForm, LabPas, WebSDM, Clinical Development Center and Empirica software products as hosted application solutions delivered through a standard Web-browser, with customer support and training services. Our Interactive Response Technology and OutcomeLogix solutions are presently available only on a hosted application basis. To date, our hosted solutions have been related primarily to our InForm and Phase Forward IRT offering. In the future we may make products that are currently available only through licenses available as hosted applications and products that are currently available only as hosted applications available through licenses.
9
Consulting Services. Consulting services include the design and documentation of the processes related to our customers' use of our products and services in their clinical trials and safety monitoring activities. Consulting services also include project planning and management services, guidance on best practices in using our software products, data management and configuration services for data mining and reporting, as well as implementation services consisting of application architecture design, systems integration, installation and validation. Consulting services can be sold on a stand-alone basis or as part of a bundled arrangement. In some circumstances, we sell additional follow on consulting services to a customer at a later date even if the customer purchased consulting services at the time of the initial license purchase under a bundled arrangement.
Customer Support. We have a multinational professional services organization to support our software products and hosted solutions worldwide. Our multilingual technical support staff is available 24 hours per day, seven days per week. Customer support includes training services, telephone support and software maintenance. We bundle customer support in our software term licenses.
Our Customers
As of December 31, 2009, we had over 335 customers, including all of the top 10 pharmaceutical companies and 19 of the top 20 pharmaceutical companies as measured in terms of total revenues. In determining the number of customers, we have treated all affiliated entities as one customer, even if we have customer relationships with more than one entity or group within a larger organization. Our representative customers include leading pharmaceutical, biotechnology, medical device companies, regulatory agencies, academic institutions, CROs and other entities engaged in clinical trial and safety monitoring activities. Some of our representative customers include:
| Pharmaceutical | Biotechnology | Contract Research Organizations | |||
|---|---|---|---|---|---|
Allergan, Inc. |
Aerovance, Inc. |
Everest Clinical Research |
|||
Alliance Pharma Ltd. |
Alexion Pharmaceuticals, Inc. |
ICON Clinical PLC |
|||
AstraZeneca Pharmaceuticals LP |
Asklep, Inc. |
Medpace, Inc. |
|||
Bayer Healthcare AG |
Atherogenics, Inc. |
Novella Clinical, Inc. |
|||
Eli Lilly and Company |
Celgene Corporation |
Onmicare Clinical Research, Inc. |
|||
Forest Laboratories, Inc. |
Genzyme Corporation |
PAREXEL International Corporation |
|||
GlaxoSmithKline, Inc. |
Merck Serono International S.A. |
Prologue Research International, Inc. |
|||
Institut de Recherches Internationales |
Morphotek, Inc. |
Quintiles Transnational Corp. |
|||
Servier |
Theravance |
RTI International |
|||
Mayne Pharma, Inc. |
United Therapeutics Corporation |
SGS |
|||
Merck & Co., Inc. |
Veristat, Inc. |
||||
Mitsubishi Tonabe Pharma Corporation |
|||||
Novartis AG |
|||||
Orexigen Therapeutics, Inc. |
|||||
Otsuka America Pharmaceutical, Inc. |
|||||
Reckitt Benckiser plc |
|||||
sanofi-aventis |
|||||
Takeda Pharmaceutical Company Ltd. |
|||||
The Procter & Gamble Company |
|||||
10
| Government and Regulatory | Medical Devices | Academic | |||
|---|---|---|---|---|---|
U.K. Medicines and Healthcare products |
Bausch & Lomb Incorporated |
Aurum Institute for Health Research |
|||
Regulatory Agency (MHRA) |
Biotronik AG |
Cancer Research UK |
|||
U.S. Center for Disease Control |
Boston Scientific Corporation |
Children's Hospital Boston |
|||
U.S. Department of Defense (DoD) |
Brainsgate Ltd. |
Children's Hospital of Philadelphia |
|||
U.S. Food and Drug Administration |
CardioDynamics International Corp. |
Dana Farber Cancer Institute |
|||
(FDA) |
Conceptus, Inc. |
Duke Clinical Research Institute |
|||
|
GE Healthcare Ltd. |
Guandong University |
|||
|
Medtronic, Inc. |
Harvard Clinical Research Institute |
|||
|
Philips Oral Healthcare, Inc. |
Massachusetts General Hospital |
|||
|
Q-MED AB |
Mayo Clinic College of Medicine |
|||
|
Stryker Biotech, LLC |
National Health & Medical Research Council |
|||
Sales and Marketing
We sell our products and services through a direct sales force and through relationships with CROs and other channel arrangements. Our marketing efforts focus on raising awareness for our products and services and generating qualified sales leads. As of December 31, 2009, we had 99 employees in sales and marketing.
Direct Sales. Our direct sales force, which is the source of the majority of our revenues, is operated out of six field offices, as well as our headquarters in Waltham, Massachusetts. In addition, follow-on sales are accomplished by the efforts of sales professionals, sales engineers, project managers and other consulting services professionals.
Channel Arrangements. In Japan, we have established channel relationships to market and sell our InForm, Clintrial and Empirica Trace products. We also have channel relationships in the United States, Europe and Asia with a number of major CROs that enable them to market and sell our hosted solutions.
Marketing. Our marketing strategy is to generate qualified sales leads, build our brand and establish our technology solutions as the standard for electronic data capture, clinical data management, drug safety and interactive response in the clinical trial and safety monitoring marketplace. Our principal marketing initiatives target key executives and decision makers within our existing and prospective customers, and include:
- •
- hosting of an annual international user conference in the United States and regional conferences in Europe and Japan;
- •
- participation in, and sponsorship of, user conferences for complementary products and services, trade shows, workshops,
seminars and industry events;
- •
- publication of articles and opinion pieces in trade magazines and journals;
- •
- participation in industry standards and bodies;
- •
- press and industry analyst relations; and
- •
- webinars, direct mail and email campaigns.
The marketing organization also works closely with our customers, our direct sales organization and CROs to collect and prioritize customer feedback to help guide our product development efforts.
11
Research and Development
We believe that our future success will depend on our ability to continue to enhance and broaden our software products, services and hosted solutions to meet the evolving needs of clinical trial sponsors and other entities engaged in clinical trial and drug safety monitoring activities. As of December 31, 2009, we had 218 employees in research and development. Our research and development efforts are focused on developing new, complementary software solutions, as well as enhancing our existing software solutions through the addition of increased functionality and integration among our various products, as well as through integration of third-party software. From time to time, we supplement our internal research and development resources with outside developers. Our research and development expenses were $20.1 million in 2007, $25.5 million in 2008 and $37.5 million in 2009.
Technology
The technology incorporated into our products is designed to provide customers with ease of use, efficiency, flexibility, data visibility and system scalability to handle high-volume, global trials and drug safety monitoring activities. Our products are generally designed using Web-based technologies, enabling rapid and global deployment whether hosted by Phase Forward or licensed by our customers. Most of our products employ HTTP and HTTPS architecture for end user access over a web interface. We use leading-edge programming technologies such as .NET framework, Java and XML, and established standards including service oriented architecture (SOA), C# and C++. A few of our products are client/server based and designed for controlled deployment internally on customer networks. All of our products operate with one or more database server(s) running either Oracle or SQL databases.
Our products employ different reporting functionality, including proprietary reporting capabilities or third-party tools. For example, our InForm product is integrated with IBM's Cognos ReportNet® software. Our Phase Forward IRT product utilizes VXML standards to facilitate telephone and web integration. Certain products support multi-lingual interfaces, including Japanese. We design our products to meet emerging industry standards such as those published by the International Conference on Harmonisation of Technical Requirements for Registration of Pharmaceuticals for Human Use ("ICH') and CDISC. For example, our Empirica Trace drug safety software and its Empirica Gateway module support electronic submissions to the FDA and to the EMEA Eudravigilance system using the ICH E2B message format.
12
Competition
The market for electronic data collection, clinical data management, drug safety and interactive response systems is highly competitive, rapidly evolving, fragmented and is subject to changing technology, shifting customer needs, changes in laws and regulations, and frequent introductions of new products and services. We compete with systems and paper-based processes utilized by existing or prospective customers, as well as other commercial vendors of electronic data capture applications, clinical data management systems, drug safety software and interactive response technology, including:
- •
- vendors of electronic data capture, clinical data management, drug safety and interactive response product suites,
particularly Oracle Clinical, a business unit of Oracle Corporation, and Perceptive Informatics, a subsidiary of PAREXEL International Corporation;
- •
- vendors of stand-alone electronic data capture, data management, drug safety, Phase I clinic automation and
interactive response products, such as: ArisGlobal LLC; Datatrak International, Inc.; DrugLogic, Inc.; Logos Technologies Ltd.; Medidata Solutions Worldwide, Inc.;
and SAS Institute;
- •
- systems developed internally by existing or prospective customers;
- •
- CROs with internally developed or acquired electronic data capture solutions, clinical data management systems, drug
safety systems, Phase I clinic automation solutions or interactive response technology; and
- •
- consulting firms and systems integrators offering services for clinical trial or drug safety implementations.
Our ability to remain competitive will depend to a great extent upon our ongoing performance in the areas of product development, customer support and service delivery. We believe that the principal competitive factors in our market include the following:
- •
- the ability to provide a broad integrated clinical research suite from a single vendor;
- •
- product functionality and breadth of integration among electronic data capture, clinical data management, drug safety and
interactive response solutions;
- •
- performance, security, scalability, flexibility and reliability of the solutions;
- •
- low total cost of ownership and demonstrable benefits for customers;
- •
- speed and ease of implementation and integration;
- •
- reputation and financial stability of the vendor;
- •
- global reach and depth of expertise and quality of consulting, help-desk, training and other services; and
- •
- sales and marketing capabilities, and the quality of customer support.
We believe that we generally compete favorably with our competitors on the basis of these factors. However, some of our competitors and potential competitors have greater name recognition, longer operating histories and significantly greater resources. There can be no assurance that our current or prospective competitors will not offer or develop products or services that are superior to, or that achieve greater market acceptance than, our products and services.
Government Regulation
The software solutions that we design, market and sell are used by organizations that are subject to a complex array of U.S. federal and state laws and regulations, including regulation by the FDA, as well as additional regulations by foreign governments.
13
The conduct of clinical trials of drugs, biological products and medical devices is subject to regulation by the FDA and other regulatory bodies. Postmarket safety monitoring and reporting is also subject to regulation by FDA and other regulatory bodies. FDA regulations govern many aspects of the clinical trial process, including recordkeeping, reporting, data privacy, and protection of human subjects. Postmarket safety monitoring and reporting is also subject to various regulations. Use of our software products, services and hosted solutions by entities engaged in these activities must be done in a manner that is compliant with these regulations and should be done in a manner that follows applicable regulatory guidance. Failure to do so could, for example, have an adverse impact on a clinical trial sponsor's ability to obtain regulatory approval of new drugs, biological products or medical devices. If our product and service offerings fail to allow our customers and potential customers to operate in a manner that is compliant with applicable regulations and follows regulatory guidance, clinical trial sponsors and other entities engaged in clinical trial and safety monitoring activities may be unwilling to use our software products, services and hosted solutions. Accordingly, we design our product and service offerings to allow our customers and potential customers to operate in a manner that is compliant with applicable regulations and follows applicable regulatory guidance. We also expend considerable time and effort monitoring regulatory developments that could impact the use of our products and services by our customers and use this information in designing or modifying our product and service offerings.
The following is an overview of some of the regulations that our customers and potential customers are required to comply with in the conduct of clinical trials and postmarket safety reporting, as well as in some of the other activities in which our customers may engage.
Government Regulation of Clinical Trials and Adverse Event Reporting
Demand for our software products, services and hosted solutions is largely a function of the regulatory requirements associated with the investigation and approval of drugs, biologics and medical devices, as well as the monitoring of and reporting on the safety of these products. The clinical testing of drugs, biologics and medical devices is subject to regulation by the U.S. Food and Drug Administration, or FDA, and other governmental authorities worldwide. The use of software during the clinical trial process must adhere to the regulations pertaining to Good Clinical Practices and other various codified FDA regulations, and should adhere to regulatory guidance such as the Consolidated Guidance for Industry from the International Conference on Harmonisation regarding Good Clinical Practice for Europe, Japan and the United States and other guidance documents. The use of software to assist in postapproval adverse event reporting must adhere to FDA's adverse event reporting regulations for drugs, devices and biological products. Our products, services and hosted solutions are developed using our domain expertise and are designed to allow compliance with applicable rules and regulations, and conformance with applicable guidance. The foregoing regulations and regulatory guidance are subject to change at any time. Changes in regulations and regulatory guidance to either more or less stringent conditions could adversely affect our business and the software products, services and hosted solutions we make available to our customers. Further, a material violation by us or our customers of Good Clinical Practices could result in a warning letter from the FDA, the suspension or termination of clinical trials, investigator disqualification, debarment, the rejection or withdrawal of a product marketing application, criminal prosecution or civil penalties, any of which could have a material adverse effect on our business, results of operations or financial condition.
In recent years, efforts have been made to streamline the drug approval process and coordinate U.S. standards with those of other developed countries. Changes in the level of regulation, including a relaxation in regulatory requirements or the introduction of simplified drug approval procedures, could have a material adverse effect on the demand for our software products, services and hosted solutions. Several competing proposals to reform the system of health care delivery in the United States have been considered and are currently being considered by Congress and the Executive Branch.
14
To date, none of the proposals has been adopted. While it is difficult to predict the impact of any proposal which may be adopted in the future, proposals that cause or contribute to a reduction in clinical research and development expenditures could have a material adverse impact on the demand for our software products, services and hosted solutions. For example, proposals to place caps on drug prices could limit the profitability of existing or planned drug development programs, making investment in new drugs and therapies less attractive to pharmaceutical companies. Likewise, a proposal for government-funded universal health care could subject expenditures for health care to governmental budget constraints and limits on spending. Finally, the uncertainty surrounding the possible adoption and impact of any health care reforms could cause our customers to delay planned research and development until some of these uncertainties are resolved.
Regulation of the use of Electronic Systems in Clinical Trials
In addition to the aforementioned regulations and regulatory guidance, the FDA has developed regulations and regulatory guidance concerning electronic records and electronic signatures. The regulations pertaining to electronic records and electronic signatures are codified in 21 CFR Part 11, and FDA recommendations incorporating 21 CFR Part 11 considerations into clinical trials are provided in a guidance document entitled Computerized Systems Used in Clinical Trials. This regulatory guidance stipulates that computerized systems used to create, modify, maintain, archive, retrieve or transmit clinical trial data intended for submission to the FDA must meet certain standards for attributability, accuracy, retrievability, traceability, inspectability, validity, security and dependability. Other guidance documents have been issued that also contain recommendations regarding the implementation of 21 CFR Part 11. We have designed our software to incorporate regulatory requirements and guidelines, but we cannot assure you that the design of our software solutions will continue to reflect regulatory requirements and guidelines as they change. Any changes in applicable regulations that are inconsistent with the design of any of our software solutions or which reduce the overall level of record-keeping or other controls or performances of clinical trials may have a material adverse effect on our business and operations. If we fail to offer solutions that allow our customers to comply with applicable regulations, it could result in the suspension or termination of on-going clinical trials, the disqualification of data for submission to regulatory authorities, or the withdrawal of approved marketing applications.
Regulation of the Internet
The U.S. government and the governments of some states and foreign countries have also attempted to regulate activities on the Internet. Any new legislation or regulation regarding the Internet could decrease our potential revenues or otherwise harm our business, financial condition and operating results. For instance, proposed federal, state and foreign privacy regulations and other laws restricting the collection, use and disclosure of personal information could limit our customers' ability to use the information in our databases to generate revenues or subject us to additional administrative or compliance burdens or potential liabilities.
Regulation of Personally Identifiable and Medical Information
Regulation of the use, protection and disclosure of personal and medical information is complex and growing. Federal legislation in the United States, known as the Health Insurance Portability and Accountability Act of 1996, or HIPAA, imposes a number of requirements on the use and disclosure of "protected health information" which is individually identifiable, including standards for the use and disclosure by the health care facilities and providers who are involved in clinical trials. HIPAA also imposes on these healthcare facilities and providers standards to assure the confidentiality of health information stored or processed electronically, including a series of administrative, technical and physical security procedures. There are also state privacy laws concerning personal and medical information that impose similar or additional requirements. This may affect us in several ways.
15
Many users of our products and services are directly regulated under HIPAA and such state privacy laws, and to the extent our products cannot be utilized in a manner that is consistent with the users' HIPAA compliance requirements, our products will likely not be selected. In addition, we may be directly affected by HIPAA and similar state privacy laws, including recently adopted Massachusetts data security regulations, which impose stringent information security requirements to all businesses and persons that own, license, store or maintain certain personal information about Massachusetts residents. Under HIPAA and such state privacy laws, to the extent we perform functions or activities on behalf of customers that are regulated by these privacy laws, such customers may be required to obtain satisfactory assurance, in the form of a written agreement or certification that we will comply with a number of the same HIPAA or state law requirements. We may be burdened with compliance with such agreements or certifications, and breach of such an agreement or certification may result in contractual liability to our customer or other adverse consequences. Regulation of personal and medical information generally is increasing at the state and federal levels in the United States and elsewhere, and such regulations may negatively affect our business.
Intellectual Property
Our success and ability to compete are dependent on our ability to develop and maintain the proprietary aspects of our technology and operate without infringing the proprietary rights of others. We rely upon a combination of trademark, trade secret, copyright, patent and unfair competition laws, as well as license agreements and other contractual provisions, to protect our intellectual property and other proprietary rights. In addition, we attempt to protect our intellectual property and proprietary information by requiring our employees and consultants to enter into confidentiality, non-competition and assignment of inventions agreements. These legal protections afford only limited protection for our technology. We have registered trademarks and service marks in the United States and abroad, and applications for the registration of additional trademarks and service marks. Our principal trademarks are our company name "Phase Forward", the company name of our subsidiary, "Lincoln Technologies", and our product names, "InForm", "Clintrial", "Clintrace", "Empirica", "WebSDM", "LabPas", and "OutcomeLogix." We may or may not choose to register some or all of our trademarks. If we apply for trademark registration, we cannot predict whether registrations will be approved or, if approved, will provide meaningful protection. In addition, we have been granted a patent by the U.S. Patent and Trademark Office. We cannot predict whether this patent will provide meaningful protection. Our agreements with employees, consultants and others who participate in development activities could be breached. We may not have adequate remedies for any breach, and our trade secrets may otherwise become known or independently developed by our competitors or other third parties. In addition, the laws of some foreign countries do not protect proprietary rights to the same extent as the laws of the United States, and effective copyright, patent, trademark and trade secret protection may not be available in those jurisdictions.
We have licensed in the past, and expect that we may license in the future, certain of our proprietary rights, such as trademarks, technology or copyrighted material, to third parties. Due to rapid technological change, we believe that factors such as the technological and creative skills of our personnel, new product and service developments and enhancements to existing products and services are more important than the various legal protections of our technology to establishing and maintaining a technology leadership position.
In addition, we license, and expect to continue to license, third-party technologies and other intellectual property rights that are incorporated into some elements of our services and solutions.
Despite our efforts to protect our proprietary rights, unauthorized parties may attempt to copy aspects of our software solutions or to obtain and use information that we regard as proprietary. The laws of many countries do not protect our proprietary rights to as great an extent as do the laws of the United States. Litigation may be necessary in the future to enforce our intellectual property rights or to determine the validity and scope of the proprietary rights of others. Any such litigation could result in substantial costs and diversion of resources and could have a material adverse effect on our business, operating results or financial condition.
16
There can be no assurance that our means of protecting our proprietary rights will be adequate or that our competitors will not independently develop similar technology. Any failure to meaningfully protect our intellectual property and other proprietary rights could have a material adverse effect on our business, operating results or financial condition.
In addition, if any of our software solutions is covered by third-party patents or other intellectual property rights, we could be subject to infringement actions. We cannot assure you that our software solutions do not infringe patents held by others or that they will not in the future. Any infringement claims made against us could cause us to incur substantial costs defending against the claim, even if the claim is without merit, and could distract our management from our business. Moreover, any settlement of or adverse judgment resulting from such claims could require us to pay substantial amounts or obtain a license to continue to use the technology that is the subject of the claim, or otherwise restrict or prohibit our use of the technology.
Any required licenses, however, may not be available to us on acceptable terms, if at all. If we do not obtain any required licenses, we could encounter delays in product introductions if we attempt to design around the technology at issue or to find another provider of suitable alternative technology to permit us to continue offering the applicable software solution. In addition, we generally provide in our customer agreements that we will indemnify our customers against third-party infringement claims relating to our technology provided to the customer, which could obligate us to fund significant amounts.
Business Segments and Geographic Information
We view our operations and manage our business as one operating segment. For information regarding net revenues by geographic regions for each of the last three years, see the notes to our 2009 consolidated financial statements contained in this Annual Report.
For information regarding risks and dependencies associated with foreign operations, see risk factors listed in the "Item 1A. Risk Factors" contained in this Annual Report.
Employees
As of December 31, 2009, we had a total of 939 employees, with 413 employees at our headquarters in Waltham, Massachusetts, 197 at other locations in the United States, and 329 employees in our Australia, Belgium, France, India, Japan, Romania and United Kingdom offices. Of these employees, 503 are in services, 218 are in research and development, 99 are in sales and marketing and 119 are in general and administration. We also retain outside contractors from time to time to supplement our services and research and development staff on an as needed basis. None of our employees are covered by a collective bargaining agreement. We consider our relations with our employees to be good.
Available Information
We were incorporated in Delaware in 1997. We maintain a number of subsidiaries in the United States and abroad, including Lincoln Technologies, Inc., Clarix LLC, Waban Software, Inc. and Maaguzi LLC in the United States, Phase Forward Europe Limited in the United Kingdom, Phase Forward SAS in France, Phase Forward Software Services India Private Limited and Waban Software Private Limited in India, Phase Forward Pty. Limited in Australia, Phase Forward Japan KK in Japan, Phase Forward, SPRL in Belgium and Phase Forward Software SRL in Romania. We also maintain Phase Forward Securities Corporation, a Massachusetts securities corporation. Our Internet website address is http://www.phaseforward.com. Our Annual Report on Form 10-K, Quarterly Reports on Form 10-Q, Current Reports on Form 8-K and amendments to those reports filed or furnished
17
pursuant to Section 13(a) or 15(d) of the Securities Exchange Act of 1934, as well as reports relating to our securities filed by others pursuant to Section 16 of such act, are available through the investor relations page of our internet website accessible at www.phaseforward.com free of charge as soon as reasonably practicable after we electronically file such material with, or furnish it to, the Securities and Exchange Commission (the "SEC"). The SEC maintains an internet site that contains reports, proxy and information statements, and other information regarding issuers that file electronically with the SEC. The address of that site is http://www.sec.gov.
We operate in a rapidly changing environment that involves a number of risks, some of which are beyond our control. This discussion highlights some of the risks which may affect future operating results. These are the risks and uncertainties we believe are most important for you to consider. Additional risks and uncertainties not presently known to us, which we currently deem immaterial or which are similar to those faced by other companies in our industry or business in general, may also impair our business operations. If any of the following risks or uncertainties actually occurs, our business, financial condition and operating results would likely suffer.
Risks Related to Our Company
Our operating results may fluctuate and could cause the market price of our common stock to fall rapidly and without notice.
Our revenues and operating results are difficult to predict and may fluctuate from quarter to quarter, particularly because of the evolving market in which we operate and our term license model. Our results of operations in any given quarter will be based on a number of factors, including:
- •
- the timing and mix of license and services revenues, and the amount and type of service required in delivering certain
projects;
- •
- changes in the timing of our operating expenses;
- •
- the impact of the current ongoing global financial crisis on our business and our customers' businesses;
- •
- the integration success of our recent acquisitions, and the timing, size and integration success of potential future
acquisitions;
- •
- changes in our customers' purchasing patterns;
- •
- the financial condition of our current and potential customers;
- •
- our ability to introduce new products and services and enhancements to our existing products and services on a timely
basis;
- •
- the timing of our product sales and the length of our sales and implementation cycles;
- •
- new competitors and introduction of enhanced products from new or existing competitors;
- •
- our ability to hire and retain qualified personnel;
- •
- changes in the regulatory environment related to the clinical trial and safety evaluation and monitoring market;
- •
- the extent to which our software products, services and hosted solutions achieve or maintain market acceptance; and
- •
- unforeseen legal expenses, including litigation costs.
18
A significant portion of our operating expenses are relatively fixed in nature and planned expenditures are based in part on expectations regarding future revenues. Accordingly, unexpected revenue shortfalls or operating expenses may decrease our gross margins and could cause significant changes in our operating results from quarter to quarter. Results of operations in any quarterly period should not be considered indicative of the results to be expected for any future period. In addition, our future quarterly operating results may fluctuate and may not meet the expectations of securities analysts or investors. If this occurs, the trading price of our common stock could fall substantially either suddenly or over time.
We may lose or delay revenues related to our hosted solutions and consulting services if our customers terminate or delay their contracted projects with us.
Certain of our hosted and other service and consulting contracts are subject to cancellation by our customers at any time with limited notice. Entities engaged in clinical trials may terminate or delay a clinical trial for various reasons including the failure of the tested product to satisfy safety or efficacy requirements, unexpected or undesired clinical results, decisions to de-emphasize a particular product or forego a particular clinical trial, decisions to downsize clinical development programs, insufficient patient enrollment or investigator recruitment and production problems resulting in shortages of required clinical supplies. In the case of our hosted solutions, any termination or delay in the clinical trials would likely result in a consequential delay or termination in those customers' service contracts. We have experienced terminations and delays of our customer service contracts in the past and expect to experience additional terminations and delays in the future. Because we do not recognize any portion of a hosted service contract's revenues until the implementation cycle is complete, the termination or delay of our customers' clinical trials could result in decreased or delayed revenues under these contracts which could materially harm our business.
We may acquire or make investments in companies or technologies that could cause disruption of our business and loss of value or dilution to our stockholders.
From time to time, we evaluate potential investments in, and acquisitions of, complementary technologies, services and businesses. We have made in the past, and may make in the future, acquisitions or significant investments in other businesses. For example, we acquired Lincoln Technologies, Inc., or Lincoln, in 2005, Green Mountain Logic, Inc., or Green Mountain, in 2007, Clarix LLC, or Clarix, in 2008, and each of Waban Software, Inc., or Waban, Maaguzi LLC, or Maaguzi, and the Interactive Voice and Web Response Service business of Covance, Inc. in 2009. Entering into an acquisition entails many risks, any of which could harm our business, including:
- •
- difficulties in integrating the operations, technologies, products, existing contracts and personnel of the target company
and realizing the anticipated synergies of the combined businesses;
- •
- managing the risks and challenges of entering markets or types of businesses in which we have limited or no direct
experience;
- •
- the price we pay or other resources that we devote may exceed the value we eventually realize or the value we could have
realized if we had allocated the purchase price or other resources to another opportunity;
- •
- potential loss of key employees, customers and strategic alliances from either our current business or the target
company's business;
- •
- the diversion of management's attention from other business concerns; and
- •
- assumption of unanticipated problems or latent liabilities, such as problems with the quality of the target company's products.
19
In addition, we could discover deficiencies withheld from us in an acquisition due to fraud or otherwise not uncovered in our due diligence prior to the acquisition. These deficiencies could include problems in internal controls, data adequacy and integrity, product quality and regulatory compliance, any of which could result in us becoming subject to penalties or other liabilities. Acquisitions also frequently result in the recording of goodwill and other intangible assets which are subject to potential impairments in the future that could harm our financial results. If any of the foregoing were to occur, our financial condition and results of operations could be materially adversely impacted. In addition, if we finance any future acquisitions by issuing equity securities or convertible debt, our existing stockholders may be diluted or the market price of our stock may be adversely affected. The failure to successfully evaluate and execute acquisitions or investments or otherwise adequately address these risks could materially harm our business and financial results.
The global nature of our business exposes us to multiple risks.
For the year ended 2009, approximately 39% of our revenues were derived from international operations. For the same period, approximately 25% of our revenues were in currencies other than the U.S. dollar. We expect that our international operations will continue to account for a significant portion of our revenues. As a result of our international operations, we are exposed to many risks and uncertainties, including:
- •
- fluctuations in foreign currency exchange and interest rates;
- •
- the impact of the current global financial crisis on our business and our customers' businesses;
- •
- potential fluctuations in foreign economies;
- •
- difficulties in staffing, managing and supporting operations in multiple countries;
- •
- difficulties in enforcing agreements and collecting receivables through foreign legal systems and other relevant legal
issues;
- •
- tariff and international trade barriers;
- •
- fewer legal protections for intellectual property and contract rights abroad;
- •
- different and changing legal and regulatory requirements in the jurisdictions in which we currently operate or may operate
in the future;
- •
- difficulties in obtaining any necessary governmental authorizations for the export of our products to certain foreign
jurisdictions;
- •
- government currency control and restrictions on repatriation of earnings; and
- •
- political and economic changes, hostilities and other disruptions in regions where we currently operate or may operate in the future.
Negative developments in any of these areas in one or more countries could result in a reduction in demand for our software products, services and hosted solutions, the cancellation or delay of orders already placed, threats to our intellectual property, difficulty in collecting receivables, and a higher cost of doing business, any of which could adversely affect our business, results of operations or financial condition. Moreover, with regard to our international operations, we frequently enter into transactions in currencies other than the U.S. dollar and we incur operating expenses in currencies other than the U.S. dollar. This creates a foreign currency exchange risk for us that could have a material adverse effect on our results of operations and financial condition. Although from time to time, we enter into forward foreign exchange contracts to hedge the foreign currency exposure of non-U.S. dollar denominated third-party and intercompany receivables and cash balances, we cannot assure you that these contracts will be successful in mitigating our foreign currency exposure risk.
20
Some of our investments are subject to significant market risk.
At December 31, 2009, we held $135.5 million in cash, cash equivalents, short-term and long-term investments. Although we do not issue or invest in financial instruments or their derivatives for trading or speculative purposes, these assets are exposed to a variety of market risks, including changes in interest rates and the market value of our investments. In addition, included within our investment portfolio at December 31, 2008 and 2009 were $24.1 million and $23.8 million, respectively, of auction rate securities, or ARS, at par value. The types of ARS that we own are backed by student loans, 95% of which are guaranteed under the Federal Family Education Loan Program, and all had credit ratings of AAA (or equivalent) from a recognized rating agency. The ARS are classified as long-term investments and short-term investments in our accompanying consolidated balance sheet included in this Annual Report for the year ended December 31, 2008 and 2009, respectively, and are recorded at fair market value. Historically, the carrying value of ARS approximated fair market value due to the frequent resetting of the interest rates. The auctions have historically provided a liquid market for these securities as investors could readily sell their investments at auction. Auctions are held every 28 days. Following successful auctions in January 2008, substantially all of our ARS have subsequently experienced failed auctions, as the amount of securities submitted for sale has exceeded the amount of purchase orders due to the liquidity issues experienced in the global credit and capital markets. The result of a failed auction is that these ARS continue to pay interest in accordance with their terms until the next successful auction; however, liquidity will be limited until there is a successful auction or until such time as other markets for these ARS investments develop, unless an alternative liquidation opportunity is presented to the ARS holder. We performed a fair value calculation of our ARS as of December 31, 2008 and concluded that the fair value was $18.0 million, a decline of $6.0 million from par value. As of December 31, 2009, $0.3 million of the ARS were called by the respective issuers at par value and we concluded that the fair value of the remaining ARS was $19.4 million. As a result of the recent instability in the market for auction rate securities, there may be a future decline in the value of our auction rate securities. A further decline in the value of these securities that is not temporary could materially adversely affect our liquidity and income.
In November 2008, we accepted an offer from UBS AG, or UBS, with respect to all of our ARS held at the time of the agreement. Under our agreement with UBS, we received certain rights which entitle us to sell our ARS to UBS affiliates during the period from June 30, 2010 to July 20, 2012, for a price equal to par value. In accepting the offer, we granted UBS the authority to sell or auction the ARS at par at any time up until the expiration date of the offer and released UBS from any claims relating to the marketing and sale of ARS. UBS's obligations under the offer are not secured by its assets and do not require UBS to obtain any financing to support its performance obligations under the offer. UBS has disclaimed any assurance that it will have sufficient financial resources to satisfy its obligations under the offer. If UBS has insufficient funding to buy back the ARS and the auction process continues to fail, then we may incur further losses on the carrying value of the ARS.
Ongoing uncertainty in the financial markets in the United States and elsewhere in the world may adversely affect our operating results and financial condition.
As widely reported, financial markets in the United States, Europe and Asia have been experiencing ongoing disruption and uncertainty in the last two years, including, among other things, extreme volatility in security prices, severely diminished liquidity and credit availability, rating downgrades of certain investments and declining valuations of others. Governments have taken unprecedented actions intended to address extreme market conditions that include severely restricted credit and declines in real estate values. While currently these conditions have not impaired our ability to access credit markets and finance operations, there can be no assurance that there will not be a further deterioration in financial markets and confidence in major economies. These economic developments affect businesses in a number of ways. The current tightening of credit in financial markets adversely affects the ability of our customers and suppliers to obtain financing for significant purchases and operations, and could result in a decrease in demand for our products and services.
21
Our customers' ability to pay for our software solutions may also be impaired, which may lead to an increase in our allowance for doubtful accounts and write-offs of accounts receivable. Our global business is also adversely affected by decreases in the general level of economic activity, such as decreases in business and consumer spending. We are unable to predict the likely duration and severity of the current disruption in financial markets and adverse economic conditions in the United States and other countries. Should these economic conditions result in our not meeting our revenue growth objectives, our operating results and financial condition could be adversely affected.
The loss of one or more major customers could materially and adversely affect our results of operations and financial condition.
Our top five customers accounted for approximately 28% of our revenues during 2009. The loss of any of our major customers could have a material adverse effect on our results of operations or financial condition. We may not be able to maintain our customer relationships, and our customers may delay performance under or fail to renew their agreements with us, which could adversely affect our results of operations or financial condition. Any reduction in the amount of revenue that we derive from these customers, without an offsetting increase in new sales to other customers, could have a material adverse effect on our operating results. A significant change in the liquidity or financial position of any of these customers could also have a material adverse effect on the collectability of our accounts receivables, our liquidity and our future operating results.
Our business could be seriously harmed by our dependence on a limited number of suppliers.
We depend upon a limited number of suppliers for specific components of our software products and hosted solutions. We may increase our dependence on certain suppliers as we continue to develop and enhance our software and service solutions. Our dependence on a limited number of suppliers leaves us vulnerable to having an inadequate supply of required components, services capacity, price increases, delayed supplier performance and poor component and services quality. For instance, we rely on Oracle Corporation to supply the database component of most of our software solutions and on SunGard Data Systems Inc. to provide server facilities for some of our hosting services. Oracle Corporation also offers a software package that is competitive with our products and services. If we are unable to obtain components for our software solutions from third-party suppliers in the quantities and of the quality that we need, on a timely basis or at acceptable prices, we may not be able to deliver our software products, services and hosted solutions on a timely or cost-effective basis to our customers, and our business, results of operations and financial condition could be seriously harmed. Moreover, delays or interruptions in our service, including without limitation delays or interruptions resulting from a change in suppliers, may reduce our revenues, cause customers to terminate their contracts and adversely affect our customer renewals. If these companies were to terminate their arrangements with us or we were otherwise required to find alternative suppliers to provide the required capacity and quality on a timely basis, sales of our products and services would be delayed. To qualify a new supplier and familiarize it with our products, quality standards and other requirements is a costly and time-consuming process. We cannot assure you that we would be able to establish alternative relationships on acceptable terms.
22
Interruptions or delays in service from our third-party providers could impair the delivery of our hosted solutions and other services and harm our business.
We host some of our software solutions and information technology systems at third-party facilities. Consequently, the occurrence of a natural disaster, technical or service lapses, other unanticipated problems at the facilities of our third-party providers or a combination of one or more of the foregoing factors could result in unanticipated interruptions in our customers' access to our hosted solutions or impair our access to our information technology systems. Our hosted services may also be subject to sabotage, intentional acts of malfeasance and similar misconduct due to the nature of the Internet. In the past, Internet users have occasionally experienced difficulties with Internet and online services due to system or security failures. We cannot assure you that our business interruption insurance will adequately compensate our customers or us for losses that may occur. Even if covered by insurance, any failure or breach of security of our systems could damage our reputation and cause us to lose customers. Further, certain of our hosted solutions are subject to service level agreements that guarantee up to 99% server availability. In the event that we fail to meet those levels, whether resulting from an interruption in service caused by our technology or that of a third-party provider, we could be subject to customer credits or termination of these customer contracts.
We may be required to spend substantial time and expense before we recognize a significant portion of the revenues, if any, attributable to our customer contracts.
The sales cycle for some of our software solutions frequently takes in excess of nine months from initial customer contact to contract execution. During this time, we may expend substantial time, effort and financial resources without realizing any revenues with respect to the potential sale. In addition, while we generally begin recognizing revenues upon the execution of our agreements for software term licenses and related services, it may be difficult for us to rapidly increase our revenues through additional sales in any period, as license revenues and, when applicable, related services revenues, from new customers are recognized over the applicable license term, typically one to five years. As a result, we may not recognize significant revenues, if any, from some customers despite incurring considerable expense related to our sales, implementation, and service delivery processes. Even if we do realize revenues from a contract, our term license model may keep us from recognizing a significant portion of these revenues (including revenues for related services) during the same period in which sales, implementation, and service delivery expenses were incurred. Timing differences of this nature could cause our service gross margins and profitability to fluctuate significantly from quarter to quarter. In addition, if we enter into an agreement with a customer that specifies or otherwise requires that we deliver a specific product or version that is not yet generally available, our term license pricing model may prevent us from recognizing a significant portion of the license and related service revenues under that contract until delivery of such specified product or version occurs. Accordingly, delays in product or version release dates, whether caused by factors such as unforeseen technology issues or otherwise, could further negatively impact the timing of our revenue under such contracts. Similarly, a decline in new or renewed software term licenses in any one quarter will not necessarily be fully reflected in the revenues in that quarter and may negatively affect our revenues in future quarters. This could also cause our operating results to fluctuate from quarter to quarter.
Failure of our technology and products could harm our business and operating results.
The technology underlying our software products and hosted solutions processes vast amounts of clinical and safety data. Customers relying on our products to collect, manage and report clinical and safety information, randomize patients, and manage inventory and clinical trial operations may have a greater sensitivity to product errors and security vulnerabilities than customers of software products in general. In the past, failures of our technology and human error have negatively impacted the data capture, management or reporting capabilities of our products, and new errors may be detected in the future.
23
Any delay or failure of our technology may result in the disruption of our customers' clinical trial or safety evaluation and monitoring processes and could harm our business and operating results. Product or service errors, as well as any difficulties in introducing, installing and maintaining new products and versions or difficulties training customers and their staffs on the utilization of new products and versions, could materially and adversely affect our reputation, result in loss of revenue or delay in revenue recognition, result in significant costs to us and impair our ability to sell our products and services in the future. The costs incurred in correcting any defects or errors may be substantial and could adversely affect our operating margins. In addition, security breaches, whether intentional or accidental, could expose us to a risk of loss of data, litigation and possible liability.
If we are unable to retain our personnel and hire additional skilled personnel, we may be unable to achieve our goals.
Our future success depends upon our ability to attract, train and retain highly skilled employees and contract workers, particularly our management team, sales and marketing personnel, professional services personnel and software engineers. Each of our executive officers and other employees could terminate his or her relationship with us at any time. The loss of any member of our management team might significantly delay or prevent the achievement of our business or development objectives and could materially harm our business. In addition, because of the technical nature of our software products, services and hosted solutions and the dynamic market in which we compete, any failure to attract and retain qualified direct sales, professional services and product development personnel, as well as our contract workers, could have a material adverse affect on our ability to generate sales, successfully develop new software products, services and hosted solutions or software enhancements or deliver services and solutions as requested by our customers.
Our software products and hosted solutions are at varying stages of market acceptance and the failure of any of our products to achieve or maintain wide acceptance would harm our operating results.
We began offering our InForm electronic data capture software solution for clinical trials in December 1998. Although the Clintrial and Empirica Trace products were introduced over 10 years ago, we did not begin offering these products until after our acquisition of Clinsoft Corporation, or Clinsoft, in 2001. We began offering our, Empirica Signal, Empirica Study and WebSDM products after our August 2005 acquisition of Lincoln, our LabPas product after our October 2007 acquisition of Green Mountain, our IRT solution after our September 2008 acquisition of Clarix, our Clinical Development Center solution after our April 2009 acquisition of Waban, and our OutcomeLogix solution after our July 2009 acquisition of Maaguzi. Continued use of our InForm, Clintrial, WebSDM an Empirica software products and, and broad and timely acceptance of our LabPas, Phase Forward IRT, Clinical Development Center and OutcomeLogix products, as well as integrated solutions combining one or more of our software products, is critical to our future success and is subject to a number of significant risks, some of which are outside our control. These risks include:
- •
- our customers' and prospective customers' desire for and acceptance of our electronic data capture, clinical data
management, drug safety and interactive response technology solutions;
- •
- our ability to meet product development and release schedules;
- •
- our software products and hosted solutions' ability to support large numbers of users and manage vast amounts of data;
- •
- our ability to significantly expand our internal resources and increase our capital and operating expenses to support the anticipated growth and continued integration of our software products, services and hosted solutions; and
24
- •
- our customers' ability to use our software products and hosted solutions, train their employees and successfully deploy our technology in their clinical trial and safety evaluation and monitoring activities.
Our failure to address, mitigate or manage these risks would seriously harm our business, particularly if the failure of any or all of our software products or hosted solutions to achieve market acceptance negatively affects our sales of our other products and services.
Failure to manage our rapid growth effectively could harm our business.
We have been experiencing an ongoing period of rapid growth as a result of personnel hiring and acquisitions that places a significant strain on our operational and financial resources and our personnel. For example, in the year ended 2009 alone, the number of our employees increased from 718 to 939. We have also experienced rapid growth in the number of clinical trials we host, the number of customer relationships we manage and the number of end-users of our products. To manage our anticipated future growth effectively, we must continue to maintain and may need to enhance our information technology infrastructure, financial and accounting systems and controls and manage expanded operations in geographically distributed locations. We will also be required to attract, integrate, train and retain a significant number of qualified sales and marketing personnel, professional services personnel, software engineers and other management personnel. Our failure to manage our rapid growth effectively could have a material adverse effect on our business, operating results or financial condition.
Claims that we or our technologies infringe upon the intellectual property or other proprietary rights of a third party may require us to incur significant costs, to enter into royalty or licensing agreements or to develop or license substitute technology.
We have been, and may in the future be, subject to claims that our technologies infringe upon the intellectual property or other proprietary rights of a third party. For instance, in February 2006, we settled a lawsuit against us and one of our customers which alleged that we infringed a patent claimed to be owned by the plaintiffs. We incurred substantial professional fees in connection with this claim and agreed to make a one-time payment of $8.5 million in order to settle this litigation. In addition, the vendors who provide us with technology that we use in our technology could become subject to similar infringement claims. Although we believe that our software solutions do not infringe the patents or other intellectual property rights of any third party, we cannot assure you that our technology does not infringe patents or other intellectual property rights held or owned by others or that they will not in the future. Any future claims of infringement could cause us to incur substantial costs defending against the claim, even if the claim is without merit, and could distract our management from our business. Moreover, any settlement or adverse judgment resulting from the claim could require us to pay substantial amounts or obtain a license to continue to use the technology that is the subject of the claim, or otherwise restrict or prohibit our use of the technology. There can be no assurance that we would be able to obtain a license from the third party asserting the claim on commercially reasonable terms, if at all, that we would be able to successfully develop alternative technology on a timely basis, if at all, or that we would be able to obtain a license from another provider of suitable alternative technology to permit us to continue offering, and our customers to continue using, the applicable technology. In addition, we generally provide in our customer agreements that we will indemnify our customers against third-party infringement claims relating to our technology provided to the customer, which could obligate us to fund significant amounts. Infringement claims asserted against us or our vendors may have a material adverse effect on our business, results of operations or financial condition.
25
We may be unable to adequately protect, and we may incur significant costs in defending, our intellectual property and other proprietary rights.
Our success depends on our ability to protect our intellectual property and other proprietary rights. We rely upon a combination of trademark, trade secret, copyright, patent and unfair competition laws, as well as license agreements and other contractual provisions, to protect our intellectual property and other proprietary rights. In addition, we attempt to protect our intellectual property and proprietary information by requiring certain of our employees and consultants to enter into confidentiality, non-competition and assignment of inventions agreements. To the extent that our intellectual property and other proprietary rights are not adequately protected, third parties might gain access to our proprietary information, develop and market products or services similar to ours, or use trademarks similar to ours, each of which could materially harm our business. Existing U.S. federal and state intellectual property laws offer only limited protection. Moreover, the laws of other countries in which we market our software products, services and hosted solutions may afford little or no effective protection of our intellectual property. If we resort to legal proceedings to enforce our intellectual property rights or to determine the validity and scope of the intellectual property or other proprietary rights of others, the proceedings could be burdensome and expensive, even if we were to prevail. The failure to adequately protect our intellectual property and other proprietary rights may have a material adverse effect on our business, results of operations or financial condition.
In the course of conducting our business, we possess or could be deemed to possess personal medical information in connection with the conduct of clinical trials, which if we fail to keep properly protected, could subject us to significant liability.
Our software solutions are used to collect, manage and report information in connection with the conduct of clinical trial and safety evaluation and monitoring activities. This information is or could be considered to be personal medical information of the clinical trial participants or patients. Regulation of the use and disclosure of personal medical information is complex and growing. Increased focus on individuals' rights to confidentiality of their personal information, including personal medical information, could lead to an increase of existing and future legislative or regulatory initiatives giving direct legal remedies to individuals, including rights to damages, against entities deemed responsible for not adequately securing such personal information. In addition, courts may look to regulatory standards in identifying or applying a common law theory of liability, whether or not that law affords a private right of action. Since we receive and process personal information of clinical trial participants and patients from customers utilizing our hosted solutions, there is a risk that we could be liable if there were a breach of any obligation to a protected person under contract, standard of practice or regulatory requirement. If we fail to properly protect this personal information that is in our possession or deemed to be in our possession, we could be subjected to significant liability.
We may not be able to obtain capital when desired on favorable terms, if at all, or without dilution to our stockholders.
We anticipate that our current cash and cash equivalents will be sufficient to meet our current needs for general corporate purposes for at least the next twelve months. However, we may need or desire additional financing to execute on our current or future business strategies, including to:
- •
- enhance our operating infrastructure;
- •
- develop new or enhance existing software products, services and hosted solutions; or
- •
- otherwise respond to competitive pressures; or
- •
- acquire businesses or technologies.
26
If we raise additional funds through the issuance of equity or convertible debt securities, the percentage ownership of our stockholders could be significantly diluted, and these newly issued securities may have rights, preferences or privileges senior to those of existing stockholders. If we incur debt financing, a substantial portion of our operating cash flow may be dedicated to the payment of principal and interest on such indebtedness, thus limiting funds available for our business activities. We cannot assure you that additional financing will be available on terms favorable to us, or at all. In this regard, the availability of such financing may be adversely impacted by current economic conditions, including the effects of the recent disruptions to the credit and financial markets in the United States and worldwide. If adequate funds are not available or are not available on acceptable terms, when we desire them, our ability to fund our operations, take advantage of unanticipated opportunities, develop or enhance our software products, services and hosted solutions, or otherwise respond to competitive pressures would be significantly limited.
We could incur substantial costs resulting from product liability claims relating to our products or services or our customers' use of our products or services.
Any failure or errors in a customer's clinical trial, post-approval or adverse event reporting obligations caused or allegedly caused by our products or services could result in a claim for substantial damages against us by our customers or the clinical trial participants, regardless of our responsibility for the failure. Although we are generally entitled to indemnification under our customer contracts against claims brought against us by third parties arising out of our customers' use of our products, we might find ourselves entangled in lawsuits against us that, even if unsuccessful, divert our resources and energy and adversely affect our business. Further, in the event we seek indemnification from a customer, we cannot assure you that a court will enforce our indemnification right if challenged by the customer obligated to indemnify us or that the customer will be able to fund any amounts for indemnification owed to us. We also cannot assure you that our existing general liability insurance coverage will continue to be available on reasonable terms or will be available in amounts sufficient to cover one or more large claims, or that the insurer will not disclaim coverage as to any future claim.
We and our products and services could be subjected to governmental regulation, requiring us to incur significant compliance costs or to cease offering our products and services.
The clinical trial process and safety evaluation, monitoring and reporting activities are subject to extensive and strict regulation by the FDA, as well as other regulatory authorities worldwide. Our electronic data capture, management and safety products and services could be subjected to state, federal and foreign regulations. We cannot assure you that our products and service offerings will comply with applicable regulations and regulatory guidelines as they develop or as they may be applied in the future. If our products or services fail to comply with any applicable government regulations or guidelines, we could incur significant liability or be forced to cease offering our applicable products or services. Also, conforming our products and services to any applicable regulations and guidelines could substantially increase our operating expenses.
In recent years, efforts have been made to streamline the drug approval process and coordinate U.S. standards with those of other developed countries. Changes in the level of regulation, including a relaxation in regulatory requirements or the introduction of simplified drug approval procedures, could have a material adverse effect on the demand for our software products, services and hosted solutions. Several competing proposals to reform the system of health care delivery in the United States have been considered and are currently being considered by Congress and the Executive. To date, none of the proposals has been adopted. While it is difficult to predict the impact of any proposal which may be adopted in the future, proposals that cause or contribute to a reduction in clinical research and development expenditures could have a material adverse impact on the demand for our software products, services and hosted solutions.
27
For example, proposals to place caps on drug prices could limit the profitability of existing or planned drug development programs, making investment in new drugs and therapies less attractive to pharmaceutical companies. Likewise, a proposal for government-funded universal health care could subject expenditures for health care to governmental budget constraints and limits on spending. Finally, the uncertainty surrounding the possible adoption and impact of any health care reforms could cause our customers to delay planned research and development until some of these uncertainties are resolved.
Risks Related to Our Industry
We depend primarily on the pharmaceutical, biotechnology and medical device industries and are therefore subject to risks relating to changes in these industries.
Our business depends on the clinical trial, post-approval and safety evaluation and monitoring activities conducted or sponsored by pharmaceutical, biotechnology and medical device companies and other entities engaged in these activities. General economic downturns, increased consolidation or decreased competition in the industries in which these companies operate could result in fewer products under development or decreased pressure to accelerate product approval which, in turn, could materially adversely impact our revenues. Recent disruptions in the world credit and equity markets as well as the related failures of several large financial institutions may also result in a global downturn in spending on clinical trial, post-approval and safety evaluation and monitoring activities. Any significant downturn in demand and spending for such solutions could lead to increased pressure on us to reduce prices or offer reduced services, and could adversely affect our business, results of operations, and financial condition. The adverse effects of any sustained downturn in demand or spending may be exacerbated by our research and development investments, strategic investments and merger and acquisition activity, as well as customer service and support, which may continue at the same or greater spending levels despite any such downturn. Our operating results may also be adversely impacted by other developments that affect these industries generally, including:
- •
- changes in general business conditions;
- •
- the discovery of safety issues with approved products or products in clinical development;
- •
- changes in the purchasing patterns of entities conducting clinical research and monitoring safety;
- •
- changes in government regulation;
- •
- the assertion of product liability claims;
- •
- changes in governmental price controls or third-party reimbursement practices; and
- •
- changes in medical practices.
In addition, any decrease in research and development expenditures or in the size, scope or frequency of clinical trial, post approval and safety evaluation and monitoring activities conducted or sponsored by pharmaceutical, biotechnology or medical device companies or other entities as a result of the foregoing or other factors could materially adversely affect our operations or financial condition.
We operate in a highly competitive industry and if we are not able to compete effectively, our business and operating results will be harmed.
The market for our software products, services and hosted solutions is characterized by rapidly changing technologies, evolving industry standards and frequent new product and service introductions and enhancements that may render existing products and services obsolete. Accordingly, we are susceptible to rapid and significant declines in market share due to unforeseen changes in the features, functions or pricing of competing products.
28
Barriers to entry are relatively low and, with the introduction of new technologies and new market entrants, we expect that competition will increase. Increased competition is likely to result in pricing pressures, which could negatively impact our sales, gross margins or market share. Our failure to compete effectively could materially adversely affect our business, financial condition or results of operations.
Some of our current competitors, as well as many of our potential competitors, have greater name recognition, longer operating histories and significantly greater resources. As a result, our competitors may be able to respond more quickly and effectively than we can to new or changing opportunities, technologies, standards, regulations and laws, or customer requirements. In addition, current and potential competitors have established, and may in the future establish, cooperative relationships with vendors of complementary products, technologies or services to increase the availability of their products to the marketplace. Accordingly, new competitors or alliances may emerge that have greater market share, larger customer bases, more widely adopted proprietary technologies, greater marketing expertise and larger sales forces than we have, which could put us at a competitive disadvantage. Further, in light of these advantages, even if our products and services are more effective than the product or service offerings of our competitors, current or potential customers might accept competitive products and services in lieu of purchasing our software products, services and hosted solutions. We cannot assure you that we can maintain or enhance our competitive position against current and future competitors.
Changing customer or prospective customer requirements could decrease the demand for our products and services, which would adversely affect our revenues and operating results.
Our future success will depend in large part on our ability to enhance and broaden our software products, services and hosted solutions to meet the evolving needs of our customers and prospective customers. To achieve our goals, we need to effectively respond to our customers' and prospective customers' needs, technological changes and new industry standards and developments in a timely manner. If we are unable to enhance our existing product and service offerings or develop or acquire new products and services to meet changing requirements, demand for our software products, services and hosted solutions could suffer and our revenues and operating results could be materially adversely affected. We could also incur substantial costs if we need to modify our products or services, or information technology infrastructure, to adapt to technological changes or new industry standards or developments.
Changes in regulations and regulatory guidance applicable to our customers or potential customers and the approval process for their products may result in our inability to continue to do business.
Demand for our software products, services and hosted solutions is largely a function of regulation and regulatory guidance associated with the approval and safety tracking of drugs, biological products and medical devices imposed upon the clinical trial process and post-approval activities by the U.S. federal government and related regulatory authorities such as the U.S. Food and Drug Administration, or FDA, and by foreign governments. In recent years, efforts have been made to streamline the FDA approval process and coordinate U.S. standards with those of other developed countries. Any change in the scope of applicable regulations and regulatory guidance could alter the type or amount of clinical trial or safety evaluation and monitoring spending or negatively impact interest in our software products, services and hosted solutions. Any regulatory reform that limits or reduces the research and development or safety spending of our customers or potential customers upon which our business depends could have a material adverse effect on our revenues or gross margins.
29
In addition, any failure to conform our software products, services and hosted solutions to domestic or international changes in regulations and regulatory guidance applicable to our customers or potential customers and the approval process for their products may result in our inability to continue to do business. Changing our software products, services and hosted solutions to allow our customers to comply with future changes in regulation or regulatory guidance, either domestically or internationally, could cause us to incur substantial costs. We cannot assure you that our product and service offerings will allow our customers and potential customers to stay in compliance with regulations and regulatory guidance as they develop. If our product and service offerings fail to allow our customers and potential customers to operate in a manner that is compliant with applicable regulations and regulatory guidance, clinical trial sponsors and other entities engaged in clinical trial and safety evaluation and monitoring activities may be unwilling to use our software products, services and hosted solutions.
Consolidation among our clients could cause us to lose clients, decrease the market for our products and result in a reduction of our revenues.
Our customer base could decline because of consolidation, and we may not be able to expand sales of our products and services to new clients. Consolidation in the pharmaceutical, biotechnology and medical device industries and among CROs has increased in recent years, and this trend could continue in light of the global economic downturn. In addition, new companies or organizations that result from such consolidation may decide that our products and services are no longer needed because of their own internal processes or the use of alternative systems. As these entities consolidate, competition to provide products and services to industry participants will become more intense and the importance of establishing relationships with large industry participants will become greater. These industry participants may try to use their market power to negotiate price reductions for our products and services. Also, if consolidation of larger current customers occurs, the combined organization may represent a larger percentage of business for us and, as a result, we are likely to rely more significantly on the combined organization's revenues to continue to achieve growth.
Risks Related to our Common Stock
The market price and trading volume of our common stock may be volatile, which could result in substantial losses for investors purchasing shares in the public markets and subject us to securities class action litigation. The current market price of our common stock may not be indicative of future market prices and we may be unable to sustain or increase the value of an investment in our common stock.
The trading price of our common stock may fluctuate significantly and, accordingly, may not be indicative of future trading prices and we may be unable to sustain or increase the value of an investment in our common stock. Some of the factors that may cause the market price of our common stock to fluctuate include:
- •
- changes in general economic, industry and market conditions;
- •
- changes in estimates of our financial results or recommendations by securities analysts;
- •
- changes in estimates of the market size and opportunities available to us;
- •
- guidance of our expected future results, which is different than reported expectations of securities analysts
- •
- investors' general perception of us;
- •
- financial results that are below estimates of such results;
- •
- period-to-period fluctuations in our financial results or those of companies that are perceived to
be similar to us;
- •
- changes in market valuations of similar companies;
30
- •
- announcements by us or our competitors of significant products, contracts, acquisitions or strategic alliances;
- •
- success of competitive products and technologies;
- •
- future issuances of securities or the incurrence of debt by us, or other changes in our capital structure;
- •
- the failure of any of our software products, services and hosted solutions to achieve or maintain commercial success;
- •
- regulatory developments in the United States and foreign countries;
- •
- additions or departures of key personnel; and
- •
- litigation involving our company or our general industry or both.
In addition, the stock market in general, and the NASDAQ Stock Market and the market for technology companies in particular, have experienced extreme price and volume fluctuations that may have been unrelated or disproportionate to the operating performance of the listed companies. There have been dramatic fluctuations in the market prices of securities of technology companies such as us. These price fluctuations may be rapid and severe and may leave investors little time to react. Broad market and industry factors may seriously harm the market price of our common stock, regardless of our operating performance. Sharp drops in the market price of our common stock expose us to securities class-action litigation. Such litigation could result in substantial expenses and a diversion of management's attention and resources, which would seriously harm our business, financial condition, and results of operations.
Sales of large blocks of our common stock could cause the market price of our common stock to drop significantly, even if our business is doing well.
Some stockholders may acquire or own large blocks of shares of 5% or more of our outstanding capital. We cannot predict the effect that public sales of these shares or the availability of these shares for sale will have on the market price of our common stock, if any. If our stockholders, and particularly our directors and officers, sell substantial amounts of our common stock in the public market, or if the public perceives that such sales could occur, this could have an adverse impact on the market price of our common stock, even if there is no relationship between such sales and the performance of our business.
In the future, we may also issue additional shares to our employees, directors or consultants, in connection with corporate alliances or acquisitions, and issue additional shares in follow-on offerings to raise additional capital. Due to these factors, sales of a substantial number of shares of our common stock in the public market could occur at any time. Such sales could reduce the market price of our common stock.
On November 3, 2009, our board of directors authorized the repurchase of up to $40.0 million of our common stock, par value $0.01 per share, through a share repurchase program. We completed this repurchase program on February 16, 2010. In 2009, 942,862 shares of our common stock had been purchased as part of this repurchase program at an average price of $14.86 per share. On February 12, 2010, our board of directors increased the amount available under the share repurchase program by an additional $25.0 million. As authorized by the program, shares may be purchased in the open market or through privately negotiated transactions in a manner consistent with applicable securities laws and regulations, including pursuant to a Rule 10b5-1 plan. This share repurchase program does not obligate us to acquire any specific number of shares and may be extended, suspended or discontinued at any time. All repurchases are expected to be funded from cash and cash equivalents.
31
While our board of directors has approved the share purchasing guidelines, the timing of the repurchases and the exact number of shares of common stock to be purchased will be determined at our management's discretion, and will depend upon market conditions and other factors, including price, corporate and regulatory requirements and alternative investment opportunities. The new repurchase program is currently scheduled to terminate on December 31, 2010.
Delaware law and our corporate documents may prevent or frustrate a change in control or a change in management that stockholders believe is desirable.
Provisions of our certificate of incorporation and bylaws and Delaware law may discourage, delay or prevent a merger, acquisition or other change in control that stockholders may consider favorable, including transactions in which you might otherwise receive a premium for your shares. These provisions may also prevent or frustrate attempts by our stockholders to replace or remove our management. These provisions include:
- •
- limitations on the removal of directors;
- •
- advance notice requirements for stockholder proposals and nominations;
- •
- the inability of stockholders to act by written consent or to call special meetings; and
- •
- the ability of our board of directors to designate the terms of and issue new series of preferred stock without stockholder approval, which could be used to institute a stockholders rights plan, or a poison pill, that would work to dilute the stock ownership of a potential hostile acquirer, likely preventing acquisitions that have not been approved by our board of directors.
The affirmative vote of the holders of at least 75% of our shares of capital stock entitled to vote is necessary to amend or repeal the above provisions of our certificate of incorporation. In addition, absent approval of our board of directors, our bylaws may only be amended or repealed by the affirmative vote of the holders of at least 75% of our shares of capital stock entitled to vote.
In addition, Section 203 of the Delaware General Corporation Law prohibits a publicly held Delaware corporation from engaging in a business combination with an interested stockholder, generally a person which together with its affiliates owns, or within the last three years has owned, 15% of our voting stock, for a period of three years after the date of the transaction in which the person became an interested stockholder, unless the business combination is approved in a prescribed manner.
The existence of the foregoing provisions could limit the price that investors might be willing to pay in the future for shares of our common stock.
32
Item 1B. Unresolved Staff Comments
As of the date of the filing of this Annual Report, there were no unresolved comments regarding our periodic or current reports from the staff of the Securities and Exchange Commission that were issued 180 days or more preceding the end of our 2009 fiscal year.
Our corporate headquarters are located at 77 Fourth Avenue, Waltham, Massachusetts, where we lease approximately 165,129 square feet. The term of the lease expires in 2019, subject to extension under certain conditions for up to two additional five-year terms. We also lease approximately 44,907 square feet of office space in West Conshohocken, Pennsylvania. The term of this lease expires in 2019, subject to extension under certain conditions for up to two additional five-year terms. In addition we lease approximately 14,960 square feet of office space in Maidenhead, England under a lease that expires in May 2012, and we lease smaller offices for our regional locations and individual offices in various locations to accommodate field sales and service personnel. We believe these facilities and additional or alternative space available to us will be adequate to meet our needs for the foreseeable future.
From time to time and in the ordinary course of business, we are subject to various claims, charges and litigation. Although the outcome of litigation cannot be predicted with certainty and some lawsuits, claims or proceedings may be disposed of unfavorably to us, we do not believe that we are currently a party to any material legal proceedings.
Item 4. Submission of Matters to a Vote of Security Holders
No matters were submitted to a vote of security holders in the quarter ended December 31, 2009.
33
Item 5. Market for Registrant's Common Equity, Related Stockholder Matters and Issuer Purchases of Equity Securities
Stock Market Information
Our common stock is traded on the NASDAQ Global Select Market under the symbol PFWD. Prior to January 2, 2009 our common stock was traded on the NASDAQ Global Market. The following table sets forth the high and low sales prices as quoted on the NASDAQ Global Market for the periods indicated, as adjusted to the nearest cent. These over-the-counter market quotations reflect inter-dealer prices, without retail mark-up, mark-down or commission and may not necessarily represent actual transactions.
| |
Common Stock Price | ||||||||||||
|---|---|---|---|---|---|---|---|---|---|---|---|---|---|
| |
2009 | 2008 | |||||||||||
| |
High | Low | High | Low | |||||||||
First quarter |
$ | 15.58 | $ | 11.33 | $ | 22.24 | $ | 14.33 | |||||
Second quarter |
16.42 | 10.18 | 19.61 | 15.90 | |||||||||
Third quarter |
15.73 | 12.30 | 22.99 | 17.20 | |||||||||
Fourth quarter |
17.04 | 12.67 | 21.17 | 9.01 | |||||||||
On February 19, 2010 the last reported sale price of our common stock on The NASDAQ Global Select Market was $12.02 per share.
Holders
As of February 19, 2010 there were approximately 142 stockholders of record of our common stock based on the records of our transfer agent.
Dividends
We currently intend to retain any earnings to fund the operation, development, and expansion of our business. We have not paid any cash dividends on our capital stock in the last two fiscal years and do not currently anticipate paying any cash dividends on our capital stock in the foreseeable future.
Issuer Purchases of Equity Securities
Under the terms of our 2004 Amended and Restated Stock Option and Incentive Plan, or the 2004 Plan, we have issued shares of restricted stock to our employees. On the date that these restricted shares vest, we withhold, via a net exercise provision pursuant to our applicable restricted stock agreements and the 2004 Plan, the number of vested shares (based on the closing price of our common stock on such vesting date) equal to tax withholdings required by us. Up until May 2009 the shares withheld from the grantees to settle their tax liability were reallocated to the number of shares available for issuance under the 2004 Plan; in May 2009 the 2004 Plan was amended and shares withheld from the grantees to settle taxes are no longer reallocated to the number of shares available for issuance. For the year ended December 31, 2009, we withheld an aggregate of 204,623 common shares under restricted stock awards at an average price of $14.11 per share.
34
Purchases of Equity Securities by the Issuer and Affiliated Purchasers
On November 3, 2009, our board of directors authorized the repurchase of up to $40.0 million of our common stock, par value $0.01 per share, through a share repurchase program. We completed this repurchase program on February 16, 2010. In 2009, 942,862 shares of our common stock had been purchased as part of this repurchase program at an average price of $14.86 per share. On February 12, 2010, our board of directors increased the amount available under the share repurchase program by an additional $25.0 million. As authorized by the program, shares may be purchased in the open market or through privately negotiated transactions in a manner consistent with applicable securities laws and regulations, including pursuant to a Rule 10b5-1 plan maintained by us.
This share repurchase program does not obligate us to acquire any specific number of shares and may be extended, suspended or discontinued at any time. All repurchases are expected to be funded from our cash and investment balances. While our board of directors have approved the share purchasing guidelines, the timing of the repurchases and the exact number of shares of common stock to be purchased were determined at management's discretion, and depended upon market conditions and other factors, including price, corporate and regulatory requirements and alternative investment opportunities. The new repurchase program is currently scheduled to terminate on December 31, 2010.
Through February 16, 2010, we repurchased 2,877,569 shares of our common stock for an aggregate purchase price, including applicable brokers' fees, of $40.0 million pursuant to this stock repurchase program.
The following table sets forth our purchases of equity securities for the three months ended December 31, 2009:
Period
|
(a) Total number of shares purchased |
(b) Average Price Paid per Share(1) |
(c) Total number of shares purchased as part of publicly announced plans or programs |
(d) Approximate dollar value of shares that may yet be purchased under the plans or programs (in thousands) |
||||||||||
|---|---|---|---|---|---|---|---|---|---|---|---|---|---|---|
November 3, 2009—November 30, 2009 |
201,451 | $ | 14.88 | 201,451 | $ | 37,002 | ||||||||
December 1, 2009—December 31, 2009 |
741,111 | 14.89 | 741,411 | 25,964 | ||||||||||
Total |
942,862 | 942,862 | ||||||||||||
- (1)
- Includes applicable brokers' fees and commissions
Equity Compensation Plan Information
See Part III, Item 12 for information regarding securities authorized for issuance under our equity compensation plans.
35
Stock Performance Graph
The information contained in the performance graph shall not be deemed to be "soliciting material" or to be "filed" with the Securities and Exchange Commission, and such information shall not be incorporated by reference into any future filing under the Securities Act or Exchange Act, except to the extent that Phase Forward specifically incorporates it by reference into such filing.
This graph compares the performance of Phase Forward common stock with the performance of the NASDAQ Composite Index and the NASDAQ Computer & Data Processing Stocks Index. This graph assumes a $100 investment in Phase Forward common stock at the $8.17 per share closing price on December 31, 2004. Historical stock performance is not necessarily indicative of future price performance.
COMPARISON OF 5 YEAR CUMULATIVE TOTAL RETURN*
Among Phase Forward Incorporated, The NASDAQ Composite Index
And The NASDAQ Computer & Data Processing Index
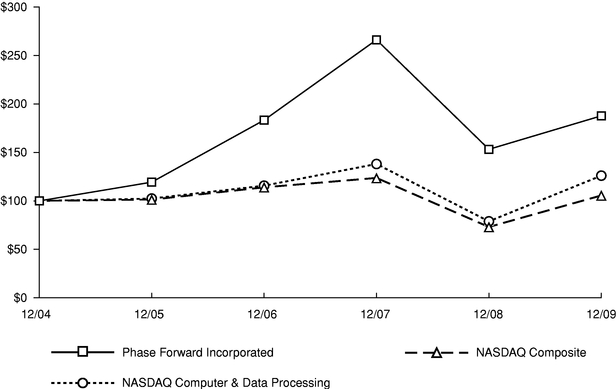
- *
- $100 invested on 12/31/04 in stock or index, including reinvestment of dividends. Fiscal year ending December 31.
36
Item 6. Selected Financial Data
SELECTED CONSOLIDATED FINANCIAL DATA
(in thousands, except per share data)
The selected historical financial data set forth below as of December 31, 2008 and 2009 and for the years ended December 31, 2007, 2008 and 2009 are derived from our audited consolidated financial statements, which are included elsewhere in this Annual Report. The selected historical financial data set forth below as of December 31, 2005, 2006 and 2007 and for the years ended December 31, 2005 and 2006 are derived from audited consolidated financial statements, which are not included in this Annual Report.
The following selected consolidated financial data should be read in conjunction with our consolidated financial statements, the related notes and "Management's Discussion and Analysis of Financial Condition and Results of Operations "included elsewhere in this Annual Report. The historical results are not necessarily indicative of the results to be expected for any future period.
| |
Year Ended December 31, | ||||||||||||||||
|---|---|---|---|---|---|---|---|---|---|---|---|---|---|---|---|---|---|
| |
2005(1) | 2006 | 2007(6) | 2008(7) | 2009(8) | ||||||||||||
Consolidated Statement of Operations: |
|||||||||||||||||
Revenues: |
|||||||||||||||||
License |
$ | 35,001 | $ | 40,893 | $ | 48,784 | $ | 52,704 | $ | 59,837 | |||||||
Service |
52,080 | 65,720 | 85,505 | 117,480 | 153,420 | ||||||||||||
Total revenues |
87,081 | 106,613 | 134,289 | 170,184 | 213,257 | ||||||||||||
Cost of revenues: |
|||||||||||||||||
License(3) |
2,513 | 2,698 | 2,361 | 2,715 | 2,519 | ||||||||||||
Service(2),(3) |
31,224 | 38,663 | 53,098 | 70,225 | 89,916 | ||||||||||||
Total cost of revenues |
33,737 | 41,361 | 55,459 | 72,940 | 92,435 | ||||||||||||
Gross margin: |
|||||||||||||||||
License |
32,488 | 38,195 | 46,423 | 49,989 | 57,318 | ||||||||||||
Service |
20,856 | 27,057 | 32,407 | 47,255 | 63,504 | ||||||||||||
Total gross margin |
53,344 | 65,252 | 78,830 | 97,244 | 120,822 | ||||||||||||
Operating expenses: |
|||||||||||||||||
Sales and marketing(2),(3) |
16,033 | 21,158 | 25,209 | 28,021 | 33,750 | ||||||||||||
Research and development(2),(3) |
14,330 | 16,621 | 20,116 | 25,500 | 37,526 | ||||||||||||
General and administrative(2),(3) |
14,836 | 18,174 | 20,220 | 26,821 | 36,067 | ||||||||||||
Litigation settlement |
8,500 | — | — | — | — | ||||||||||||
Lease exit costs |
(92 | ) | — | — | 527 | — | |||||||||||
Impairment of intangible assets |
— | — | — | — | 2,293 | ||||||||||||
In-process research and development |
— | — | 300 | — | — | ||||||||||||
Total operating expenses |
53,607 | 55,953 | 65,845 | 80,869 | 109,636 | ||||||||||||
(Loss) income from operations |
(263 | ) | 9,299 | 12,985 | 16,375 | 11,186 | |||||||||||
Other income (expense): |
|||||||||||||||||
Interest income |
1,735 | 2,848 | 7,081 | 5,863 | 1,744 | ||||||||||||
Interest expense |
(143 | ) | — | — | — | — | |||||||||||
Other income (expense) |
(157 | ) | (19 | ) | (35 | ) | (1,039 | ) | 513 | ||||||||
Total other income |
1,435 | 2,829 | 7,046 | 4,824 | 2,257 | ||||||||||||
Income before provision for (benefit from) income taxes |
1,172 | 12,128 | 20,031 | 21,199 | 13,443 | ||||||||||||
(Benefit from) provision for income taxes |
(2,169 | ) | (221 | ) | (9,170 | ) | 7,354 | 5,397 | |||||||||
Net income applicable to common stockholders |
$ | 3,341 | $ | 12,349 | $ | 29,201 | $ | 13,845 | $ | 8,046 | |||||||
Net income per share applicable to common stockholders: |
|||||||||||||||||
Basic(4) |
$ | 0.10 | $ | 0.36 | $ | 0.76 | $ | 0.33 | $ | 0.19 | |||||||
Diluted(4) |
$ | 0.10 | $ | 0.35 | $ | 0.72 | $ | 0.32 | $ | 0.18 | |||||||
Weighted average number of common shares used in computing per share amounts: |
|||||||||||||||||
Basic(4) |
33,026 | 34,104 | 38,642 | 42,092 | 42,663 | ||||||||||||
Diluted(4) |
35,092 | 35,737 | 40,739 | 43,942 | 44,437 | ||||||||||||
37
| |
As of December 31, | |||||||||||||||
|---|---|---|---|---|---|---|---|---|---|---|---|---|---|---|---|---|
| |
2005(1) | 2006 | 2007(6) | 2008(7) | 2009 | |||||||||||
Consolidated Balance Sheet Data: |
||||||||||||||||
Unrestricted cash, cash equivalents, short-term and long-term investments |
$ | 60,586 | $ | 69,635 | $ | 182,622 | $ | 177,465 | $ | 135,542 | ||||||
Working capital, net of deferred revenue(5) |
71,282 | 91,708 | 194,272 | 193,284 | 159,198 | |||||||||||
Total assets |
139,944 | 160,651 | 305,869 | 367,890 | 389,956 | |||||||||||
Total deferred revenue |
46,494 | 50,655 | 67,130 | 88,518 | 98,374 | |||||||||||
Accumulated deficit |
(101,045 | ) | (88,696 | ) | (59,495 | ) | (45,650 | ) | (37,604 | ) | ||||||
Total stockholders' equity |
66,717 | 88,021 | 216,437 | 237,673 | 245,328 | |||||||||||
- (1)
- On
August 25, 2005, we acquired all of the outstanding capital stock of Lincoln Technologies, Inc. ("Lincoln"). Accordingly, the results of
Lincoln have been included in the accompanying consolidated financial statements since the date of acquisition.
- (2)
- Cost of revenues and operating expenses include stock-based compensation expense, as follows:
| |
Year Ended December 31, | |||||||||||||||
|---|---|---|---|---|---|---|---|---|---|---|---|---|---|---|---|---|
| |
2005 | 2006 | 2007 | 2008 | 2009 | |||||||||||
Cost of service revenues |
$ | 60 | $ | 258 | $ | 702 | $ | 1,618 | $ | 2,018 | ||||||
Sales and marketing |
30 | 502 | 1,061 | 1,377 | 2,078 | |||||||||||
Research and development |
166 | 394 | 813 | 1,182 | 3,750 | |||||||||||
General and administrative |
351 | 1,868 | 3,002 | 4,168 | 5,451 | |||||||||||
- (3)
- Cost
of revenues and operating expenses include amortization of intangible assets, as follows:
| |
Year Ended December 31, | |||||||||||||||
|---|---|---|---|---|---|---|---|---|---|---|---|---|---|---|---|---|
| |
2005 | 2006 | 2007 | 2008 | 2009 | |||||||||||
Cost of license revenues |
$ | 113 | $ | 360 | $ | 403 | $ | 792 | $ | 765 | ||||||
Cost of service revenues |
— | — | — | 61 | 1,096 | |||||||||||
Sales and marketing |
— | 510 | 464 | 693 | 1,744 | |||||||||||
Research and development |
127 | — | — | — | — | |||||||||||
General and administrative |
67 | — | — | 34 | 103 | |||||||||||
- (4)
- For
information regarding the computation of per share amounts refer to Note 2 of the notes to our 2009 consolidated financial statements contained
in this Annual Report.
- (5)
- Working
capital consists of current assets less current liabilities, net of deferred revenue.
- (6)
- In
2007, we acquired all of the outstanding capital stock of Green Mountain Logic, Inc. ("Green Mountain"). Accordingly, the results of Green
Mountain have been included in the accompanying consolidated financial statements since the date of acquisition. The Green Mountain acquisition is further described in Note 3 of the notes to
our 2009 consolidated financial statements contained in this Annual Report.
- (7)
- In
2008, we acquired all of the outstanding membership interests of Clarix LLC ("Clarix"). Accordingly, the results of Clarix have been included in
the accompanying consolidated financial statements since the date of acquisition. The Clarix acquisition is further described in Note 3 of the notes to our 2009 consolidated financial
statements contained in this Annual Report.
- (8)
- In 2009, we acquired all of the outstanding common stock of Waban Software, Inc. ("Waban"), all of the outstanding membership interests of Maaguzi LLC ("Maaguzi"), and the Interactive Voice and Web Response Services business ("Covance IVRS/IWRS") of Covance Inc. Accordingly, the results of Waban, Maaguzi and Covance IVRS/IWRS have been included in the accompanying consolidated financial statements since the respective dates of acquisition. The Waban, Maaguzi and Covance IVRS/IWRS acquisitions are further described in Note 3 of the notes to our 2009 consolidated financial statements contained in this Annual Report.
38
Item 7. Management's Discussion and Analysis of Financial Condition and Results of Operations
The information contained in this section has been derived from our consolidated financial statements and should be read together with our consolidated financial statements and related notes included elsewhere in this Annual Report.
Overview
Phase Forward Incorporated is a provider of an integrated clinical research suite of enterprise-level software products, services and hosted solutions for use in our customers' global clinical trial and drug safety monitoring activities. Our customers include pharmaceutical, biotechnology and medical device companies, as well as academic institutions, governmental regulatory agencies, contract research organizations, or CROs, and other entities engaged in clinical trial and drug safety monitoring activities. By automating essential elements of the clinical trial and drug safety monitoring processes, we believe our products allow our customers to accelerate the market introduction of new medical therapies and corresponding revenues, reduce overall research and development expenditures, enhance existing data quality control efforts, increase drug safety compliance and reduce clinical and economic risk.
Fiscal Year
Our fiscal year ends on December 31. Reference to 2009, for example, refers to the fiscal year ended December 31, 2009.
Repurchase of our Equity Securities
On November 3, 2009, our board of directors authorized the repurchase of up to $40.0 million of our common stock, par value $0.01 per share, through a share repurchase program. We completed this repurchase program on February 16, 2010. In 2009, 942,862 shares of our common stock had been purchased as part of this repurchase program at an average price of $14.86 per share. On February 12, 2010, our board of directors increased the amount available under the share repurchase program by an additional $25.0 million. As authorized by the program, shares may be purchased in the open market or through privately negotiated transactions in a manner consistent with applicable securities laws and regulations, including pursuant to a Rule 10b5-1 plan maintained by us. This share repurchase program does not obligate us to acquire any specific number of shares and may be extended, suspended or discontinued at any time. All repurchases are expected to be funded from cash and investments balances. While our board of directors has approved the share purchase guidelines, the timing of the repurchase and the exact number of shares of common stock to be purchased will be determined at our management's discretion, and will depend upon market conditions and other factors, including price, corporate and regulatory requirements and alternative investment opportunities. The new repurchase program is currently scheduled to terminate on December 31, 2010.
Acquisitions
From time to time we have expanded our product and service offerings through the acquisition of other businesses or technologies. These transactions include the acquisitions of Clinsoft Corporation ("Clinsoft") in 2001, Lincoln Technologies, Inc. ("Lincoln") in 2005 and the more recent acquisitions of Green Mountain Logic, Inc. ("Green Mountain"), Clarix LLC ("Clarix"), Waban Software, Inc. ("Waban"), Maaguzi LLC ("Maaguzi"), and the Interactive Voice and Web Response Services business ("Covance IVRS/IWRS") of Covance Inc. which are described below.
39
Covance IVRS/IWRS
On August 20, 2009, we acquired the Covance IVRS/IWRS business. The aggregate purchase price was $10.0 million in cash. The results of Covance IVRS/IWRS have been included in our consolidated financial statements since the date of acquisition.
Maaguzi
On July 27, 2009, we acquired all of the outstanding membership interests of Maaguzi, a privately-held innovative provider of a Web-based product called OutcomeLogix, which is an electronic patient reported outcomes (ePRO) and late phase solutions. The aggregate purchase price was $11.0 million in cash. The results of Maaguzi have been included in our consolidated financial statements since the date of acquisition.
Waban
On April 22, 2009, we acquired all of the outstanding common stock of Waban, a privately-held provider of platform solutions for the automation and compliance of clinical data analysis and reporting. Waban's software, which we have branded our Clinical Development Center product, provides automation, traceability and control of the key activities involved in the integration, analysis and reporting on clinical trial data. The aggregate purchase price was $13.8 million in cash. The results of Waban have been included in our consolidated financial statements since the date of acquisition.
Clarix
On September 5, 2008, we acquired all of the outstanding membership interests of Clarix, a privately-held provider of Web-integrated interactive response technology, or IRT, for clinical trial management. The Clarix product, which we have branded our Phase Forward IRT product, is used for subject randomization, predictive medication inventory management, and operational management in reporting clinical trials. The aggregate purchase price was $41.3 million. The results of Clarix have been included in our consolidated financial statements since the date of acquisition.
Green Mountain Logic
On October 30, 2007, we acquired all of the outstanding capital stock of Green Mountain, a privately-held process automation software company that provides targeted solutions for the life sciences industry, including the LabPas Phase I clinic automation software. The acquired technology and products of Green Mountain provide us with a solution targeted for Phase I clinical trials. The aggregate purchase price was $5.4 million. The results of Green Mountain have been included in our consolidated financial statements since the date of acquisition.
Litigation Settlement
None.
Sources of Revenues
We derive our revenues from software licenses and services of our ICRS products, which can be purchased on a stand-alone basis. Our product line is comprised of four general categories that include the following software products:
- •
- Electronic Data Capture (EDC)
- •
- InForm, our Internet-based electronic data capture solution for collection and transmission of patient information in clinical trials;
40
- •
- LabPas, our system for Phase I clinic automation; and
- •
- OutcomeLogix, our ePRO and late phase solution for data capture which
supports data entry via web interface and/or mobile interface for handheld devices, which we acquired as a result of the acquisition of Maaguzi, LLC in July 2009.
- •
- Clinical Data Management
- •
- Clintrial, our clinical data management solution; and
- •
- WebSDM, our system for validating and reviewing clinical trial data
represented in formats meeting industry standards, such as those established by the Clinical Data Interchange Standards Consortium, or CDISC; and
- •
- Clinical Development Center, which includes our controlled clinical data
repository product for storing and managing clinical trials data (both data and metadata), as well as our metadata-driven controlled statistical control environment for automation and tracking of
routine and repetitious statistical programming and analysis, which we acquired as a result of the acquisition of Waban Software, Inc. in April 2009.
- •
- Drug Safety
- •
- Empirica Trace, our adverse event management solution for monitoring drug
safety and reporting adverse events that occur during and after conclusion of the clinical trial process;
- •
- Empirica Signal, our data mining and signal detection solution for
post-marketing data; and
- •
- Empirica Study (formerly known as CTSD), our signal detection solution for data from clinical trials.
- •
- Interactive Response Technology (IRT)
- •
- Phase Forward IRT (formerly known as Clarix), our Web-integrated interactive response technology; and
- •
- Covance IVRS/IWRS, a legacy phone-integrated interactive response technology, which we acquired from Covance, Inc. in August 2009.
41
We generally offer our software products under term enterprise licenses or as a hosted application solution delivered through a standard Web-browser. The following table details these offerings:
| |
Available As: | ||||
|---|---|---|---|---|---|
| Product |
Term License |
Hosted Application |
|||
Electronic Data Capture |
|||||
InForm |
Yes | Yes | |||
LabPas |
Yes | Yes | |||
OutcomeLogix |
No | Yes | |||
Clinical Data Management |
|||||
Clintrial |
Yes | No | |||
WebSDM |
Yes | Yes | |||
Clinical Development Center |
Yes | Yes | |||
Drug Safety |
|||||
Empirica Trace |
Yes | Yes | |||
Empirica Signal |
Yes | Yes | |||
Empirica Study |
Yes | Yes | |||
Interactive Response Technology |
|||||
Phase Forward IRT |
No | Yes | |||
Covance IVRS/IWRS |
No | Yes | |||
License revenues are derived principally from the sale of term licenses for our software products while service revenues are derived principally from our delivery of the hosted solutions, consulting services and customer support, including training, for all of our products. We generally recognize revenues ratably over the life of a license or service contract. While we have existing trials running on the Covance IVRS/IWRS system, we do not intend to sell this offering or implement any new trials for use on this system.
Our backlog consists of the total future value of our customer contracts, whether billed or unbilled. Revenues for a future period are a function of a portion of the beginning backlog, new customer contracts and renewals. Although we do not believe that total backlog is useful to predict revenues in a given period, we do monitor and utilize the amount that is expected to convert to revenues over the next twelve months. As of December 31, 2009, we expect between $200 million and $205 million of our total backlog to be recognized as revenues in 2010.
One customer, GlaxoSmithKline, accounted for approximately 15% and 12% of our total revenues in the years 2007 and 2008, respectively, and $1.8 million and $0.9 million of accounts receivable outstanding as of December 31, 2007 and 2008, respectively. For the year ended December 31, 2009 no customers accounted for 10% or more of our total revenue for the period. Our top 20 customers accounted for approximately 65%, 62% and 61% of our total revenues, net of reimbursable out-of-pocket expenses, in the years 2007, 2008 and 2009, respectively.
License Revenues
We derive our license revenues principally from the sale of term licenses for the following software products: InForm, our Internet-based electronic data capture, or EDC, solution; Clintrial and WebSDM, our clinical data management solutions; our drug safety solutions, including our Empirica Trace, Empirica Signal and Empirica Study products; our LabPas Phase I clinic automation solution; and our Clinical Development Center products for clinical data analysis. Although each of our software solutions is available as a stand-alone enterprise application, we offer integrated enterprise solutions incorporating certain of our electronic data capture, data management and analysis, and drug safety products.
42
License revenues for our InForm electronic data capture software solution, either on a stand-alone or integrated basis, are determined primarily by the number, complexity and duration of the clinical trials and the number of participants in each clinical trial. License revenues for our Clintrial, Clinical Development Center, WebSDM, Empirica Trace, Empirica Signal, Empirica Study and LabPas software solutions are determined primarily by the number of users accessing the software solution. Except as discussed below, we enter into software license agreements for our InForm, Clintrial and Empirica Trace products with terms generally of three to five years with payment terms generally annually in advance. License agreements for our other licensed products are generally annual or multi-year with payment terms generally annually in advance. License revenues are recognized ratably over the duration of the software term license agreement, to the extent that amounts are fixed or determinable and collectable.
We continue to sell additional perpetual licenses of certain products to our existing customers with the option to purchase customer support, and may in the future do so for new customers based on customer requirements or market conditions. We recognize revenues on the perpetual licenses upon delivery of the software when all other revenue recognition criteria are met. We continue to provide and charge for maintenance and support on our products to those customers who do not convert to our software term license arrangements. We will continue our efforts to convert our entire customer base to software term license arrangements. However, we anticipate that some customers will not convert and instead will continue to make annual customer support payments.
Service Revenues
Application Hosting Services. In addition to making our InForm, LabPas, Clintrial, WebSDM, Clinical Development Center and Empirica software products available to customers through licenses, we offer our InForm, LabPas, WebSDM, Clinical Development Center and Empirica software products as hosted application solutions delivered through a standard Web-browser, with customer support and training services. Our Interactive Response Technology and OutcomeLogix solutions are presently available only on a hosted application basis. To date, our hosted solutions have been related primarily to our InForm and Phase Forward IRT offerings. In the future, we may make products that are currently available only through licenses available as hosted applications and products that are currently available only as hosted applications available through licenses.
Revenues resulting from the InForm and OutcomeLogix hosting service consist of three stages for each clinical trial:
- •
- First stage—trial and application set up, including design of
electronic case report forms and edit checks, installation and server configuration of the system;
- •
- Second stage—application hosting and related support services;
and
- •
- Third stage—services required to close out, or lock, the database for the clinical trial.
Revenues resulting from the Phase Forward IRT and Covance IVRS/IWRS hosting service also consist of three stages for each clinical trial:
- •
- First stage—trial and application set up, including design and
set up of the subject randomization and medication inventory management, installation and server configuration of the system;
- •
- Second stage—application hosting and related support services;
and
- •
- Third stage—services required to close out, or lock, the clinical trial.
Services provided for the first and third stages of both InForm, Phase Forward IRT and OutcomeLogix are provided on a fixed fee basis depending upon the complexity of the trial and system requirements.
43
Services for the second stage are charged separately as a fixed monthly fee. We recognize revenues from all stages of the hosting service ratably over the hosting period. Fees charged and costs incurred for the trial system design, set up and implementation are deferred until the start of the hosting period and are amortized and recognized ratably over the estimated hosting period. The deferred costs include direct costs related to the trial and application set up. Fees for the first and third stages of the services are billed based upon milestones. Fees for application hosting and related services in the second stage are generally billed quarterly in advance. Bundled into this revenue element are the revenues attributable to the software license used by the customer.
In the event that an application hosting customer cancels a statement of work, all deferred revenues are recognized and all deferred set up costs are expensed. In addition, certain termination-related fees may be charged and if so, such fees are recognized in the period of termination.
Revenues resulting from hosting services for our Empirica Signal, Empirica Study and WebSDM products consist of installation and server configuration, application hosting and related support services. Services for these offerings are charged monthly as a fixed fee. Revenues are recognized ratably over the period of the service.
In addition, application hosting service revenues include hosting services associated with term license customers and reimbursable out-of-pocket expenses.
Consulting Services. Consulting services include the design and documentation of the processes related to our customers' use of our products and services in their clinical trials and safety monitoring activities. Consulting services also include project planning and management services, guidance on best practices in using our software products, data management and configuration services for data mining and reporting, as well as implementation services consisting of application architecture design, systems integration, installation and validation. Consulting services can be sold on a stand-alone basis or as part of a bundled arrangement. In some circumstances, we sell additional follow on consulting services to a customer at a later date even if the customer purchased consulting services at the time of the initial license purchase under a bundled arrangement. Revenues from consulting services included in either a multiple element software license agreement or in an application hosting agreement are recognized ratably over the term of the arrangement. The value of our consulting services sold within a bundled arrangement is equal to the value of consulting services sold on a stand-alone basis, as the activities performed under both types of arrangements are similar in nature. The associated costs are expensed as incurred. We may also enter into arrangements to provide consulting services separate from a license arrangement. In these situations, revenue is recognized on either a time-and-materials basis or using the proportional performance method. If we are not able to produce reasonably dependable estimates, revenue is recognized upon completion of the project and final acceptance from the customer. If significant uncertainties exist about project completion or receipt of payment, the revenue is deferred until the uncertainty is resolved. Provisions for estimated losses on contracts are recorded during the period in which they are resolved. Provisions for estimated losses on contracts are recorded during the period in which they are identified.
Customer Support. We have a multinational services organization to support our software products and hosted solutions worldwide. Customer support includes multilingual training services, telephone support and software maintenance. We bundle customer support in our software term licenses and allocate 10% of the value of the license to customer support revenues. The customer support services rate of 10% for multi-year term-based licenses reflects a significant discount from the rate for customer support services associated with perpetual licenses due to the reduction in the time period during which the customer can utilize the upgrades and enhancements. We believe this rate is substantive and represents an amount we believe reasonable to be allocated. Our customer support revenues also consist of customer support fees paid by perpetual license customers. Customer support revenues are recognized ratably over the period of the customer support or term license agreement, with payment terms generally annually in advance.
44
Cost of Revenues and Operating Expenses
We allocate overhead expenses such as rent and occupancy charges and employee benefit costs to all departments based on headcount. As such, general overhead expenses are reflected in cost of service revenues and in the sales and marketing, research and development, and general and administrative expense categories.
Cost of Revenues. Costs of license revenues consist primarily of the amortization of royalties paid for certain modules within our Clintrial software product as well as our InForm software product. In addition, costs of revenues include expense for the amortization of acquired technologies associated with acquisitions. The costs of license revenues vary based upon the mix of revenues from software licenses for our products. We operate our service organization on a global basis as one distinct unit, and do not segment costs for our various service revenue elements. These services include performing application hosting, consulting and customer support services. Costs for these services consist primarily of employee-related costs associated with these services, amortization of the deferred clinical trial set up costs, allocated overhead, outside contractors, royalties associated with providing customer support for use with the Clintrial and InForm software products and reimbursable out-of-pocket expenses. Costs of services also include hosting costs that primarily consist of hosting facility fees and server depreciation and amortization of acquired technologies associated with the acquisition of Clarix and Maaguzi.
The costs of service revenues vary based upon the number of employees in the service organization, the type of work performed, and royalties associated with revenues derived from providing customer support, as well as costs associated with the flexible use of outside contractors to support internal resources. We supplement the trial design and set up activity for our InForm, Phase Forward IRT and OutcomeLogix application hosting services through the use of outside contractors. This allows us to utilize outside contractors in those periods where trial design and set up activity is highest while reducing the use of outside contractors in those periods where trial activity lessens, allowing for a more flexible delivery model. The percentage of the services workforce represented by outside contractors varies from period to period depending on the volume of specific support required. The costs of service revenues is significantly higher as a percentage of revenues as compared to our costs of license revenues primarily due to the employee-related and outside contractor expenses associated with providing services.
Gross Margin. Our gross margin on license revenues varies based on the mix of royalty- and non-royalty-bearing license revenues and the amount of amortization of acquired technologies. Our gross margin on service revenues varies primarily due to variations in the utilization levels of the professional service team and the timing of expense and revenue recognition under our service arrangements. In situations where the service revenues are recognized ratably over the software license term, our costs associated with delivery of the services are recognized as the services are performed, which is typically during the first 6 to 12 months of the contract period. Accordingly, our gross margin on service revenues will vary significantly over the life of a contract due to the timing, amount and type of service required in delivering certain projects. In addition, consolidated gross margin will vary depending upon the mix of license and service revenues.
Sales and Marketing. Sales and marketing expenses consist primarily of employee-related expenses, including travel, marketing programs which include product marketing expenses such as trade shows, workshops and seminars, corporate communications, other brand building and advertising, allocated overhead and the amortization of commissions. In addition, sales and marketing include expense for the amortization of intangible assets associated with our acquisitions.
45
We expect that sales and marketing expenses will continue to increase in absolute dollars as commission expense increases with our revenues and as we continue to expand sales coverage and to build brand awareness through what we believe are the most cost effective channels available, but may fluctuate quarter over quarter due to the timing of marketing programs.
Research and Development. Research and development expenses consist primarily of employee-related expenses, allocated overhead and outside contractors. We focus our research and development efforts on increasing the functionality, performance and integration of our software products. We expect that in the future, research and development expenses will increase in absolute dollars as we continue to add features and functionality to our products, introduce additional integrated software solutions to our product suite and expand our product and service offering.
General and Administrative. General and administrative expenses consist primarily of employee-related expenses, professional fees, primarily consisting of expenses for accounting, compliance with the Sarbanes-Oxley Act of 2002, and legal services, including litigation, information technology and other corporate expenses and allocated overhead. We expect that in the future our general and administrative expenses will increase in absolute dollars as we add personnel and incur additional costs related to the growth of our business and operations.
Lease Exit Costs. Lease exit costs were $0.5 million in 2008 resulting from the relocation of our corporate headquarters in December 2008. These costs include approximately $0.4 million relating to the estimated future obligation under the non-cancelable lease, which expired in February 2009, for our prior headquarters location and approximately $0.1 million of write-offs of related abandoned leasehold improvements and fixed assets associated with this lease. For the year ended December 31, 2009 there were no lease exit costs.
In-process Research and Development. In-process research and development expense represents product development efforts that were under way at Green Mountain at the time of acquisition for which technological feasibility had not yet been established. Technological feasibility is established when either of the following criteria is met: (1) detailed program design has been completed, documented and traced to product specifications and its high-risk development issues have been resolved; or (2) a working model of the product has been finished and determined to be complete and consistent with the product design. As of the date of the acquisition, Green Mountain had not completed product designs or working models for the in-process technology, and we determined that there was no future alternative use for the technologies beyond the stated purpose of the specific research and development projects. The fair value of the in-process research and development effort was, therefore, expensed at the time of the acquisition. The estimated fair market value was determined using a discounted cash flow model, based on a discount rate which took into consideration the nature of the expected product to be developed, history of successful new product introduction, and the project's relatively short development time. Key assumptions used in the in-process research and development valuation consisted of the expected completion date for the in-process project, revenue and expense projections assuming future release of the product, and a risk-adjusted discount rate. Starting in 2009 the Company adopted Accounting Standards Codification ("ASC") 805, Business Combinations and accordingly all in-process research and development acquired is capitalized as an intangible asset.
Impairment of intangible assets. Based on the results of our annual impairment analysis, we recorded an impairment charge of $2.3 million related to the trade name acquired as part of the Clarix acquisition in 2008. The trade name, which was originally considered to have an indefinite useful life, was determined to be impaired during the fourth quarter of 2009. Additionally, based upon our impairment review, we determined that the Clarix trade name now has a definite life of four years. Accordingly, we began to amortize the remaining fair value of the trade name over this period beginning in the fourth quarter of 2009.
46
Stock-Based Compensation Expenses. Our cost of service revenues, sales and marketing, research and development, and general and administrative expenses include stock-based compensation expense. Stock-based compensation expense is the fair value of outstanding stock options and restricted stock awards and units, which are recognized over the respective stock option and award or unit service periods. During 2007, 2008 and 2009, we recorded $5.6 million, $8.3 million and $13.3 million of aggregate stock-based compensation expense, respectively.
Foreign Currency Translation
With regard to our international operations, we frequently enter into transactions in currencies other than the U.S. dollar. As a result, our revenues, expenses and cash flows are subject to fluctuations due to changes in foreign currency exchange rates, particularly changes in the euro, British pound, Australian dollar, Indian rupee, Japanese yen and Romanian leu. In 2007, 2008 and 2009, approximately 49%, 44% and 39%, respectively, of our revenues were generated in locations outside the United States. During the same periods, 35%, 31% and 25%, respectively, of our revenues were in currencies other than the U.S. dollar, as are many of the associated expenses. In periods when the U.S. dollar declines in value as compared to the foreign currencies in which we conduct business, our foreign currency-based revenues and expenses generally increase in value when translated into U.S. dollars.
Critical Accounting Policies and Estimates
Our financial statements are prepared in accordance with accounting principles generally accepted in the United States. The preparation of these financial statements requires us to make estimates and assumptions that affect the reported amounts of assets, liabilities and disclosure of contingent assets and liabilities at the date of the financial statements and the reported amounts of revenues and expenses during the reporting periods. On an ongoing basis, we evaluate our estimates and assumptions with our audit committee, including those related to revenue recognition, deferred set up costs, commissions and royalties, accounts receivable reserves, stock-based compensation expense, long-lived assets, intangibles assets and goodwill, income taxes, contingencies and litigation. We base our estimates on historical experience and on various other assumptions that are believed to be reasonable under the circumstances, the results of which form the basis for making judgments about the carrying values of assets and liabilities that are not readily apparent from other sources. There have been no material changes to these estimates for the periods presented in this Annual Report. Our actual results may differ from these estimates under different assumptions or conditions.
We believe that of our significant accounting policies, which are described in Note 2 of the notes to our 2009 consolidated financial statements included in this Annual Report, the following accounting policies involve a greater degree of judgment and complexity. Accordingly, these are the policies we believe are the most critical to aid in fully understanding and evaluating our consolidated financial condition and results of operations.
Revenue Recognition and Deferred Set Up Costs. Customers generally have the ability to terminate application hosting, consulting and training service agreements upon 30 days notice. License agreements, multiple element arrangements, including license and services agreements and certain application hosting services can generally be terminated by either party for material breach of obligations not corrected within 30 days after notice of the breach.
We recognize revenues when all of the following conditions are satisfied: (1) there is persuasive evidence of an arrangement; (2) the product or service has been provided to the customer; (3) the collection of our fees is probable; and (4) the amount of fees to be paid by the customer is fixed or determinable.
47
We generally enter into software term licenses for our InForm, Clintrial, Empirica Trace and Clinical Development Center products with our customers for 3- to 5-year periods. License agreements for our Empirica Signal, Empirica Study and WebSDM products are generally annual or multi-year terms. We do not license our Phase Forward IRT, OutcomeLogix and Covance IVRS/IWRS products, which are presently hosted applications. These arrangements typically include multiple elements: software license, consulting services and customer support. We bill our customers in accordance with the terms of the underlying contract. Generally, we bill license fees annually in advance for each year of the license term. Our payment terms are generally net 30 days.
Our software license revenues are earned from the sale of off-the-shelf software requiring no significant modification or customization subsequent to delivery to the customer. Consulting services, which can also be performed by third-party consultants, are deemed to be non-essential to the functionality of the software and typically are for trial configuration, implementation planning, loading of software, building simple interfaces and running test data and documentation of procedures.
Customer support includes training services, telephone support and software maintenance. We generally bundle customer support with the software license for the entire term of the arrangement. As a result, we generally recognize revenues for all elements, including consulting services, ratably over the term of the software license and support arrangement. We allocate the revenues recognized for these arrangements to the different elements based on management's estimate of the relative fair value of each element. For our term-based licenses, we allocate to consulting services the anticipated service effort and value throughout the term of the arrangement at an amount that would have been allocated had those services been sold separately to the customer. The value of our consulting services sold within a bundled arrangement is equal to the value of consulting services sold on a stand-alone basis, as the activities performed under both types of arrangements are similar in nature. The remaining value is allocated to license and support services, with 10% of this amount allocated to support services. The customer support services rate of 10% for multi-year term-based licenses reflects a significant discount from the rate for customer support services associated with perpetual licenses due to the reduction in the time period during which the customer can utilize the upgrades and enhancements. We believe this rate is substantive and represents a reasonable basis of allocation. We have allocated the estimated fair value to our multiple element arrangements to provide meaningful disclosures about each of our revenue streams. The costs associated with the consulting and customer support services are expensed as incurred. There are instances in which we sell software licenses based on usage levels. These software licenses can be based on estimated usage, in which case the license fee charged to the customer is fixed based on this estimate. When the fee is fixed, the revenues are generally recognized ratably over the contractual term of the arrangement. If the fee is based on actual usage, and therefore variable, the revenues are recognized in the period of use. Revenues from certain follow-on consulting services, which are sold separately to customers with existing software licenses and are not considered part of a multiple element arrangement, are recognized as the services are performed.
We continue to sell additional perpetual licenses for the Clintrial, Empirica Trace and Clinical Development Center software products in certain situations to our existing customers with the option to purchase customer support, and may in the future do so for new customers based on customer requirements or market conditions. For our Clintrial and Empirica Trace products we have established vendor specific objective evidence of fair value for the customer support. Accordingly, license revenues are recognized upon delivery of the software and when all other revenue recognition criteria are met. Customer support revenues are recognized ratably over the term of the underlying support arrangement. For our Clinical Development Center products vendor specific objective evidence of fair value for the customer support has not been established, and therefore, revenue for the entire agreement is recognized ratably over the term of the underlying support agreement. We continue to generate customer support and maintenance revenues from our perpetual license customer base. Training revenues are recognized as earned.
48
In addition to making our InForm, LabPas, Clintrial, WebSDM, Clinical Development Center and Empirica software products available to customers through licenses, we offer our InForm, LabPas, WebSDM, Clinical Development Center and Empirica software products as hosted application solutions delivered through a standard Web-browser, with customer support and training services. Our Interactive Response Technology and OutcomeLogix solutions are presently available only on a hosted application basis. To date, our hosted solutions have been related primarily to our InForm and Phase Forward IRT offerings. In the future, we may make products that are currently available only through licenses available as hosted applications and products that are currently available only as hosted applications available through licenses.
Revenues resulting from InForm and OutcomeLogix application hosting services consist of three stages for each clinical trial: the first stage involves application set up, including design of electronic case report forms and edit checks, installation and server configuration of the system; the second stage involves application hosting and related support services; and the third stage involves services required to close out, or lock, the database for the clinical trial. Revenues resulting from Phase Forward IRT and Covance IVRS/IWRS application hosting services also consist of three stages for each clinical trial: the first stage involves application set up, including design and set up for the subject randomization and medication inventory management, installation and server configuration of the system; the second stage involves application hosting and related support services; and the third stage involves services required to close out, or lock, the database for the clinical trial. Services provided for InForm, Phase Forward IRT, OutcomeLogix and Covance IVRS/IWRS for the first and third stages are provided on a fixed fee basis based upon the complexity of the trial and system requirements. Services for the second stage are charged separately as a fixed monthly fee. We recognize revenue from all stages of the InForm, Phase Forward IRT, OutcomeLogix and Covance IVRS/IWRS hosting service ratably over the hosting period. Fees charged and costs incurred for the trial system design, set up and implementation are deferred as applicable, until the start of the hosting period and then amortized and recognized, as applicable, ratably over the estimated hosting period. The deferred costs include incremental direct costs with third parties and certain internal direct costs related to the trial and application set up. These costs include salary and benefits associated with direct labor costs incurred during trial set up, as well as third-party subcontract fees and other contract labor costs. Work performed outside the original scope of work is contracted for separately as an additional fee and is generally recognized ratably over the remaining term of the hosting period. Fees for the first and third stages of the services are billed based upon milestones. Fees for application hosting and related services in the second stage are billed quarterly in advance. Bundled into this revenue element are the revenues attributable to the software license used by the customer.
Revenues resulting from hosting services for our Empirica Signal, Empirica Study and WebSDM products consist of installation and server configuration, application hosting and related support services. Services for these offerings are charged monthly as a fixed fee. Revenues are recognized ratably over the period of the service.
In the event that an application hosting customer cancels its related statement of work, all deferred revenues are recognized and all deferred set up costs are expensed. In addition, certain termination related fees may be charged and if so, such fees are recognized in the period of termination.
We deferred $3.4 million, $4.5 million and $5.2 million of set up costs and amortized $2.7 million, $3.9 million and $3.6 million of set up costs in 2007, 2008 and 2009, respectively. The amortization of deferred set up costs is a component of cost of services.
We may also enter into arrangements to provide consulting services separate from a license arrangement. In these situations, revenue is recognized on either a time-and-materials basis or using the proportional performance method. If we are not able to produce reasonably dependable estimates, revenue is recognized upon completion of the project and final acceptance from the customer.
49
If significant uncertainties exist about project completion or receipt of payment, the revenue is deferred until the uncertainty is resolved. Provisions for estimated losses on contracts are recorded during the period in which they are identified.
Deferred revenues represent amounts billed or cash received in advance of revenue recognition.
Accounting for Prepaid Sales Commissions and Royalties. For arrangements where we recognize revenue over the relevant contract period, we defer related commission payments to our direct sales force and software license royalties paid to third parties and amortize these amounts over the same period that the related revenues are recognized. This is done to better match commission and royalty expenses with the related revenues. Commission payments are nonrefundable unless amounts due from a customer are determined to be uncollectible or if the customer subsequently changes or terminates the level of service, in which case commissions which were paid are recoverable by us. We deferred $9.4 million, $9.4 million and $9.8 million of commissions and amortized to sales and marketing expense $7.5 million, $8.6 million and $7.8 million in 2007, 2008 and 2009, respectively. Royalty obligations are based upon the license and customer support revenues earned for certain products in an arrangement. We have the right to recover the royalties in the event the arrangement is cancelled. We deferred $2.5 million, $2.6 million and $2.5 million of royalties and amortized to cost of revenues $2.6 million, $2.7 million and $2.5 million in 2007, 2008 and 2009, respectively.
Accounts Receivable Reserve. We maintain allowances for doubtful accounts for estimated losses resulting from the inability of our customers to make required payments. We regularly evaluate the collectability of our trade receivables based on a combination of factors, which may include dialogue with the customer to determine the cause of non-payment, the use of collection agencies, and/or the use of litigation. In the event it is determined that the customer may not be able to meet its full obligation to us, we record a specific allowance to reduce the related receivable to the amount that we expect to recover given all information available to us. We continuously monitor collections from our customers and maintain a provision for estimated credit losses based upon our historical experience and any specific customer collection issues that we have identified. While such credit losses have historically been within our expectations and the provisions established, we cannot guarantee that we will continue to experience the same credit loss rates in the future. If the financial condition of our customers were to deteriorate, resulting in an impairment of their ability to make payments, additional allowances may be required. Our accounts receivable reserves were $0.3 million, $0.6 million and $0.8 million as of December 31, 2007, 2008 and 2009, respectively.
Accounting for Income Taxes. We are subject to income taxes in both the United States and foreign jurisdictions, and we use estimates in determining our provision for income taxes. We account for income taxes using the asset and liability method for accounting and reporting for income taxes. Under this method, deferred tax assets and liabilities are recognized based on temporary differences between the financial reporting and income tax bases of assets and liabilities using statutory rates. This process requires that we project our current tax liability and estimate our deferred tax assets and liabilities, including net operating loss and tax credit carryforwards. In assessing the need for a valuation allowance, we have considered our recent operating results, future taxable income projections and all prudent and feasible tax planning strategies.
Accounting for Stock-Based Awards. On January 1, 2006, we started to recognize expense related to the fair value of stock-based compensation awards. Management elected to use the modified prospective transition method and therefore has not restated our financial results for prior periods. Under this transition method, stock-based compensation expense for the years ended December 31, 2007, 2008 and 2009 includes compensation expense for all stock-based compensation awards granted on or after March 15, 2004 (the filing date for the initial registration statement for our initial public offering), based on the estimated grant-date fair value.
50
For service-based options and restricted stock units and awards, we recognize compensation expense on a straight-line basis over the requisite service period of the award. For performance-based options, we recognize expense over the estimated performance period. In addition the benefits of tax deductions in excess of recognized stock-based compensation is reported as a financing activity rather than an operating activity in the statements of cash flows. This requirement can have the effect of reducing net operating cash flows and increasing net financing cash flows in certain periods. To date, we have not recorded these benefits as they have not been realized.
We use the Black-Scholes option pricing model to determine the weighted average fair value of options granted. See Note 2 of the notes to our 2009 consolidated financial statements included in this Annual Report for further discussion.
During 2007, 2008 and 2009, we recorded $5.6 million, $8.3 million and $13.3 million of aggregate stock-based compensation expense, respectively. For the years ended 2007, 2008 and 2009, stock-based compensation expense reduced basic earnings per share by $0.21, $0.13 and $0.19, respectively, and diluted earnings per share by $0.20, $0.12 and $0.18, respectively. As of December 31, 2009, we had $29.8 million of unrecognized stock-based compensation expense related to stock-based awards that we expect to recognize over a weighted average period of 2.43 years.
Other Significant Estimates
Goodwill and Intangible Assets Impairment. We review the carrying value of goodwill and intangible assets annually based upon the expected future discounted operating cash flows of our business. Our cash flow estimates are based on historical results adjusted to reflect our best estimate of our operating results in future periods. Actual results may differ materially from these estimates. The timing and size of impairment charges, if any, involves the application of management's judgment regarding the estimates and could significantly affect our operating results.
51
Overview of Results of Operations for the Years Ended December 31, 2008 and 2009
Total revenues increased by 25%, or $43.1 million, in 2009 compared to 2008 primarily due to an increase in total service revenues of 31%, or $35.9 million, and to a lesser extent, an increase in license revenues of 14%, or $7.1 million. Our revenue growth included a 40% increase in revenues from contract research organizations, or CROs, which increased to $47.9 million from $33.7 million. The increase in services revenues is primarily associated with revenues from application hosting services due to increased production trials under management for our InForm license customers as well as trials under management as a result of our recent acquisitions of Clarix, Maaguzi, and Covance IVRS/IWRS. Through these recent acquisitions, our objective is to provide an Integrated Clinical Research Suite (ICRS) of technology solutions, which consists of multiple products that can be purchased on a stand-alone basis, to automate and integrate the entire clinical development process from study initiation and regulatory submission through post-approval trials. Our ability to provide ICRS as a single source vendor and to continue to provide the product functionality and performance that our customers require will be a major factor in our ability to continue to increase revenues.
Our gross margin increased by 24%, or $23.6 million, in 2009 compared to 2008, primarily due to a higher increase in revenues in relation to cost of revenues. The increase in gross margins is primarily due to the increase in services gross margin resulting from higher services revenues and lower services expense as a percentage of related revenues. With the continued shift in our revenues from license revenues to services revenues associated primarily with our recent acquisitions and our ICRS strategy, our ability to continue to maintain our overall gross margins will depend on our ability to continue to increase services efficiencies and lower our cost of delivery.
Operating income in 2009 of $11.2 million decreased by $5.2 million, or 32%, compared to 2008. Operating income for 2008 and 2009 included $8.3 million and $13.3 million of stock-based compensation expense, respectively, and $1.6 million and $3.7 million of amortization expense related to acquisitions, respectively. We expect to increase operating income through increased revenues from our recent acquisitions and execution of our ICRS strategy and through our ability to lower services and operating expenses as a percentage of revenues through improved efficiencies throughout our services organization and leveraging our operating expenses as revenues continue to increase.
The results of 2009 compared to 2008 were impacted by foreign exchange rate fluctuations, resulting in a decrease in revenue of approximately $3.1 million, or 2% of revenues, and a decrease in expense of approximately $4.7 million, or 3% of expenses.
As of December 31, 2009, we had $109.1 million of unrestricted cash, cash equivalents and short-term investments, a decrease of $50.3 million from $159.4 million at December 31, 2008. In addition, as of December 31, 2009, we had $26.4 million in long-term investments and $4.3 million in current-assets associated with a securities settlement agreement with UBS AG. As of December 31, 2009, we had no outstanding debt.
52
Revenues
| |
Year Ended December 31, | |
|
|||||||||||||||||
|---|---|---|---|---|---|---|---|---|---|---|---|---|---|---|---|---|---|---|---|---|
| |
2008 | 2009 | Change | |||||||||||||||||
Revenues by Product Line(1)
|
Amount | Percentage of Revenues |
Amount | Percentage of Revenues |
Amount | % | ||||||||||||||
| |
(in thousands) |
|||||||||||||||||||
Electronic data capture |
$ | 128,466 | 75 | % | $ | 155,065 | 73 | % | $ | 26,599 | 21 | % | ||||||||
Clinical data management |
23,086 | 14 | 22,798 | 11 | (288 | ) | (1 | ) | ||||||||||||
Safety |
16,786 | 10 | 23,373 | 10 | 6,587 | 39 | ||||||||||||||
Interactive response technology |
1,846 | 1 | 12,021 | 6 | 10,175 | 551 | ||||||||||||||
Total |
$ | 170,184 | 100 | % | $ | 213,257 | 100 | % | $ | 43,073 | 25 | % | ||||||||
- (1)
- Revenues by Product Line include product license revenues and product-related service revenues.
The increase in electronic data capture revenues is primarily due to an increase in application hosting services of $17.6 million, and to a lesser extent, the introduction of our OutcomeLogix product offering following the acquisition of Maaguzi in July 2009. In addition, there were increases in license revenues and consulting services revenues of $5.7 million and $0.7 million, respectively. The increase in safety was primarily due to increases in consulting services, license revenue and application hosting services of $5.3 million, $1.3 million and $0.7 million, respectively. The increase in interactive response technology revenues is primarily related to the 2009 period including a full year of application hosting services revenues relating to the acquisition of Clarix in September 2008, while the 2008 period only includes four months of revenue related to that acquisition. To a lesser extent the increase is attributable to revenues related to the acquisition of Covance IVRS/IWRS in August 2009.
| |
Year Ended December 31, | |
|
|||||||||||||||||
|---|---|---|---|---|---|---|---|---|---|---|---|---|---|---|---|---|---|---|---|---|
| |
2008 | 2009 | Change | |||||||||||||||||
Revenues by Type
|
Amount | Percentage of Revenues |
Amount | Percentage of Revenues |
Amount | % | ||||||||||||||
| |
(in thousands) |
|||||||||||||||||||
License |
$ | 52,704 | 31 | % | $ | 59,837 | 28 | % | $ | 7,133 | 14 | % | ||||||||
Application hosting services |
90,784 | 53 | 120,366 | 57 | 29,582 | 33 | ||||||||||||||
Consulting services |
13,904 | 8 | 19,693 | 9 | 5,789 | 42 | ||||||||||||||
Customer support |
12,792 | 8 | 13,361 | 6 | 569 | 4 | ||||||||||||||
Total |
$ | 170,184 | 100 | % | $ | 213,257 | 100 | % | $ | 43,073 | 25 | % | ||||||||
Total revenues increased in 2009 as compared to 2008, primarily due to increases in application hosting and license revenues. The increase in 2009 revenues associated with our application hosting services was partially due to a 17% increase in production trials under management from approximately 920 at the end of 2008 to approximately 1,072 at the end of 2009, which includes application hosting services trials, InForm production trials and trials hosted for our InForm license customers. The increase in production trials relates to a relative increase in the number of customers who purchase all trial-related services from us, customers who license InForm and build their own studies. Our application hosting services also increased due to the impact of additional trials under management as a result of our recent acquisitions of Clarix, Maaguzi and Covance IVRS/IWRS, with Phase Forward IRT production trials increasing 141% from 64 at the end of 2008 to 154 at the end of 2009. The increase in license revenues was primarily the result of additional electronic data capture revenues from both new and existing customers, and to a lesser extent, growth in sales relating to our safety products. The increase in consulting services was primarily attributable to additional revenue related to consulting services provided for our safety products for both new and existing customers, and to a lesser extent, growth in sales relating to our electronic data capture products.
53
The increase in customer support revenues was primarily due to increases in safety product and electronic data capture. Our revenues were not significantly impacted by price increases or decreases. Inflation had only a nominal impact on our revenues.
| |
Year Ended December 31, | |
|
|||||||||||||||||
|---|---|---|---|---|---|---|---|---|---|---|---|---|---|---|---|---|---|---|---|---|
| |
2008 | 2009 | |
|
||||||||||||||||
| |
Change | |||||||||||||||||||
| |
|
Percentage of Revenues | |
Percentage of Revenues | ||||||||||||||||
Revenues by Geography
|
Amount | Amount | Amount | % | ||||||||||||||||
| |
(in thousands) |
|||||||||||||||||||
North America |
$ | 94,555 | 56 | % | $ | 130,536 | 61 | % | $ | 35,981 | 38 | % | ||||||||
United Kingdom |
51,417 | 30 | 57,572 | 27 | 6,155 | 12 | ||||||||||||||
France |
15,099 | 9 | 15,788 | 8 | 689 | 5 | ||||||||||||||
Asia Pacific |
9,113 | 5 | 9,361 | 4 | 248 | 3 | ||||||||||||||
International subtotal |
75,629 | 44 | 82,721 | 39 | 7,092 | 9 | ||||||||||||||
Total |
$ | 170,184 | 100 | % | $ | 213,257 | 100 | % | $ | 43,073 | 25 | % | ||||||||
The increase in revenues worldwide was primarily due to an increase in electronic data capture revenues, interactive response technology revenues and safety revenues of $26.6 million, $10.2 million and $6.6 million, respectively. The increase in North American revenues is primarily related to an increase in electronic data capture revenues, interactive response technology revenues and safety revenues of $19.7 million, $10.1 million and $5.1 million, respectively. The increase in interactive response technology revenues is primarily a result of the 2009 period including a full year of application hosting services revenues relating to the acquisition of Clarix in September 2008, while the 2008 period only includes four months of revenues related to that acquisition. To a lesser extent, the increase is attributable to revenues related to the acquisition of Covance IVRS/IWRS in August 2009. The increase in international revenues is primarily the result of increases in electronic data capture revenues and safety revenues of $6.9 million and $1.5 million, respectively. These increases were partially offset by a decrease in clinical data management revenues of $1.4 million.
Cost of Revenues
| |
Year Ended December 31, | |
|
|||||||||||||||||
|---|---|---|---|---|---|---|---|---|---|---|---|---|---|---|---|---|---|---|---|---|
| |
2008 | 2009 | Change | |||||||||||||||||
Costs of Revenues
|
Amount | Percentage of Related Revenues |
Amount | Percentage of Related Revenues |
Amount | % | ||||||||||||||
| |
(in thousands) |
|||||||||||||||||||
License |
$ | 2,715 | 5 | % | $ | 2,519 | 1 | % | $ | (196 | ) | (7 | )% | |||||||
Services |
70,225 | 60 | 89,916 | 42 | 19,691 | 28 | ||||||||||||||
Total |
$ | 72,940 | 43 | % | $ | 92,435 | 43 | % | $ | 19,495 | 27 | % | ||||||||
The cost of license revenues decreased in 2009 primarily due to a decrease in the cost of royalties associated with our InForm software product of $0.2 million. The increase in cost of services in 2009 was primarily due to increases in employee-related expenses of $8.3 million related to a headcount increase of 100 people, and increases in depreciation and amortization and facilities expenses of $4.0 million and $2.5 million, respectively. We also had expense increases for outside contractors, network hosting services, telephone and internet access and computer-related expenses of $2.0 million, $1.1 million, $0.8 million and $0.8 million, respectively. Computer-related expenses include hardware and software support agreements as well as computer accessories.
54
Gross Margin
| |
2008 | 2009 | Change | |||||||||||||||||
|---|---|---|---|---|---|---|---|---|---|---|---|---|---|---|---|---|---|---|---|---|
Gross Margin
|
Amount | Percentage of Related Revenues |
Amount | Percentage of Related Revenues |
Amount | % | ||||||||||||||
| |
(in thousands) |
|||||||||||||||||||
License |
$ | 49,989 | 95 | % | $ | 57,318 | 96 | % | $ | 7,329 | 15 | % | ||||||||
Services |
47,255 | 40 | 63,504 | 41 | 16,249 | 34 | ||||||||||||||
Total |
$ | 97,244 | 57 | % | $ | 120,822 | 57 | % | $ | 23,578 | 24 | % | ||||||||
The overall gross margin percentage remained the same in 2009 as compared to 2008. The license gross margin percentage increased in 2009 as compared to 2008 due to increased license sales in products that do not carry an associated royalty expense. The services gross margin percentage increased during 2009 due to lower services expenses as a percentage of related revenues. This was due to increased efficiencies resulting in a decrease in services expense per services employee. It is likely that gross margin, as a percentage of revenues, will fluctuate quarter by quarter due to the timing and mix of license and service revenues, and the type, amount and timing of service required in delivering certain projects.
Operating Expenses
| |
Year Ended December 31, | |
|
|||||||||||||||||
|---|---|---|---|---|---|---|---|---|---|---|---|---|---|---|---|---|---|---|---|---|
| |
2008 | 2009 | Change | |||||||||||||||||
Operating Expenses
|
Amount | Percentage of Revenues |
Amount | Percentage of Revenues |
Amount | % | ||||||||||||||
| |
(in thousands) |
|||||||||||||||||||
Sales and marketing |
$ | 28,021 | 16 | % | $ | 33,750 | 16 | % | $ | 5,729 | 20 | % | ||||||||
Research and development |
25,500 | 15 | 37,526 | 17 | 12,026 | 47 | ||||||||||||||
General and administrative |
26,821 | 16 | 36,067 | 17 | 9,246 | 34 | ||||||||||||||
Impairment of intangible assets |
— | — | 2,293 | 1 | 2,293 | 100 | ||||||||||||||
Lease exit costs |
527 | — | — | — | (527 | ) | (100 | ) | ||||||||||||
Total |
$ | 80,869 | 47 | % | $ | 109,636 | 51 | % | $ | 28,767 | 36 | % | ||||||||
Sales and Marketing. Sales and marketing expenses increased in 2009 primarily due to employee-related expense of $1.8 million related to a headcount increase of 24 people, as well as an increase in amortization of intangible assets of $1.0 million. We also had increases in marketing expenses, stock-based compensation, facilities expenses and depreciation expenses of $0.8 million, $0.7 million, $0.5 million and $0.3 million, respectively. We expect that our sales and marketing expense will continue to increase in absolute dollars as commission expense increases with our revenues and as we continue to expand sales coverage and to build brand awareness through what we believe are the most cost effective channels available. We expect that such increases may fluctuate, however, due to the timing of marketing programs.
Research and Development. Research and development expenses increased in 2009 primarily due to employee-related expenses of $6.8 million related to a headcount increase of 77 people. We also had expense increases related to stock-based compensation, facilities expenses, depreciation and telephone and internet access expenses of $2.6 million, $1.5 million, $0.5 million and $0.5 million, respectively. We expect that our research and development costs will continue to increase in absolute dollars as we continue to add features and functionality to our products, introduce additional integrated software solutions to our product suite and expand our product and service offerings.
55
General and Administrative. General and administrative expenses increased in 2009 primarily due to increases related to employee-related expenses of $3.4 million related to a headcount increase of 20 people, as well as increases in stock-based compensation expense of $1.3 million, and computer-related expenses of $0.9 million. We also had expense increases related to outside contractors, facilities, depreciation and professional fees expenses of $0.8 million, $0.7 million, $0.7 million and $0.7 million, respectively. Computer-related expenses include hardware and software support agreements as well as computer accessories. We expect that in the future our general and administrative expenses will increase in absolute dollars as we add personnel and incur additional costs related to the growth of our business and operations.
Impairment of intangible assets. Based on the results of our annual impairment analysis, we recorded an impairment charge of $2.3 million related to the trade name acquired as part of the Clarix acquisition in 2008. The trade name, which was originally considered to have an indefinite useful life, was determined to be impaired during the fourth quarter of 2009. Additionally, based upon our impairment review, we determined that the Clarix trade name now has a definite life of four years. Accordingly, we began to amortize the remaining fair value of the trade name over this period beginning in the fourth quarter of 2009.
Lease exit costs. Lease exit costs were $0.5 million in 2008, resulting from the relocation of our corporate headquarters from 880 Winter Street to 77 Fourth Avenue in Waltham, Massachusetts. These costs include approximately $0.4 million relating to the estimated future obligation under the prior non-cancelable lease and approximately $0.1 million of write-offs for related abandoned leasehold improvements and fixed assets associated with this lease. There were no lease exit costs in 2009.
Other Income (Expense)
| |
Year Ended December 31, | |
|
|||||||||||||||||
|---|---|---|---|---|---|---|---|---|---|---|---|---|---|---|---|---|---|---|---|---|
| |
2008 | 2009 | Change | |||||||||||||||||
Other Income
|
Amount | Percentage of Revenues |
Amount | Percentage of Revenues |
Amount | % | ||||||||||||||
| |
(in thousands) |
|||||||||||||||||||
Interest income |
$ | 5,863 | 3 | % | $ | 1,744 | 1 | % | $ | (4,119 | ) | (70 | )% | |||||||
Other, net |
(1,039 | ) | — | 513 | — | 1,552 | 149 | |||||||||||||
Total other income |
$ | 4,824 | 3 | % | $ | 2,257 | 1 | % | $ | (2,567 | ) | (53 | )% | |||||||
The decrease in interest income in 2009 was primarily due to the net decrease in cash and cash equivalents and short and long-term investments as well as a decline in interest rates. The increase in other, net in 2009 was primarily due to increases in the fair value associated with our auction rate securities.
Provision for Income Taxes
| |
Year Ended December 31, | |
|
||||||||||||||||
|---|---|---|---|---|---|---|---|---|---|---|---|---|---|---|---|---|---|---|---|
| |
2008 | 2009 | Change | ||||||||||||||||
Provision for income taxes
|
Amount | Percentage of Revenues |
Amount | Percentage of Revenues |
Amount | % | |||||||||||||
| |
(in thousands) |
||||||||||||||||||
Provision for income taxes |
$ | 7,354 | 4 | % | $ | 5,397 | 3 | % | $ | (1,957 | ) | 27 | |||||||
Our effective tax rates for 2008 and 2009 were 35% and 40%, respectively. The increase in our effective tax rate is primarily due to an increase in non-deductable stock-compensation expense. Our statutory tax rate for 2008 and 2009 was 38%. See Note 6 of the notes to our 2009 consolidated financial statements contained in this Annual Report for further discussion.
56
Overview of Results of Operations for the Years Ended December 31, 2007 and 2008
Total revenues increased by 27%, or $35.9 million, in 2008 compared to 2007 primarily due to an increase in total service revenues of 37%, or $32.0 million, and to a lesser extent, an increase in license revenues of 8%, or $3.9 million.
Our gross margin increased by 23%, or $18.4 million, in 2008 compared to 2007, primarily due to the increase in service revenues. Services gross margin increased $14.8 million, or 46%, due to increased revenues and increased efficiencies in the service organization. In addition, gross license margin increased $3.6 million, or 8%.
Operating income in 2008 of $16.4 million increased by $3.4 million, or 26%, compared to 2007. Operating income for 2007 and 2008 included $5.6 million and $8.3 million, respectively, of stock-based compensation expense.
The results of 2008 compared to 2007 were impacted by foreign exchange rate fluctuations, resulting in an increase in revenue of approximately $2.5 million, or 2% of revenues, and a decrease in expense of approximately $0.5 million, or less than 1% of expenses.
As of December 31, 2008, we had $159.4 million of unrestricted cash, cash equivalents and short-term investments, an increase of $0.9 million from $158.6 million at December 31, 2007. In addition, as of December 31, 2008, we had $18.0 million in long-term investments and $5.3 million in long-term assets associated with a securities settlement agreement with UBS AG. In September, 2008, we acquired Clarix for an aggregate purchase price of $41.3 million. As of December 31, 2008, we had no outstanding debt.
Revenues
| |
Year Ended December 31, | |
|
|||||||||||||||||
|---|---|---|---|---|---|---|---|---|---|---|---|---|---|---|---|---|---|---|---|---|
| |
2007 | 2008 | Change | |||||||||||||||||
Revenues by Product Line(1)
|
Amount | Percentage of Revenues | Amount | Percentage of Revenues | Amount | % | ||||||||||||||
| |
(in thousands) |
|||||||||||||||||||
Electronic data capture |
$ | 96,997 | 72 | % | $ | 128,466 | 75 | % | $ | 31,469 | 32 | % | ||||||||
Clinical data management |
21,199 | 16 | 23,086 | 14 | (1,887 | ) | 9 | |||||||||||||
Safety |
16,093 | 12 | 16,786 | 10 | 693 | 4 | ||||||||||||||
Interactive response technology |
— | — | 1,846 | 1 | 1,846 | NM | * | |||||||||||||
Total |
$ | 134,289 | 100 | % | $ | 170,184 | 100 | % | $ | 35,895 | 27 | % | ||||||||
- (1)
- Revenues
by Product Line include product license revenues and product-related service revenues.
- *
- Not meaningful
The increase in electronic data capture revenues in 2008 is primarily due to increases in application hosting services and license revenues of $31.1 million and $2.7 million, respectively, compared to the same period in 2007. These increases are partially offset by decreases in both consulting services and customer support, totaling $2.2 million. The increase in clinical data management revenues can be attributed to an increase in license revenues and consulting services revenues of $1.2 million and $0.8 million, respectively. The increase in safety revenues is primarily due to increases in application hosting services and customer support of $0.3 million and $0.2 million, respectively. The inclusion of interactive response technology revenues in 2008 is due to the introduction of a new offering following the acquisition of Clarix on September 5, 2008.
57
| |
Year Ended December 31, | |
|
|||||||||||||||||
|---|---|---|---|---|---|---|---|---|---|---|---|---|---|---|---|---|---|---|---|---|
| |
2007 | 2008 | Change | |||||||||||||||||
Revenues by Type
|
Amount | Percentage of Revenues | Amount | Percentage of Revenues | Amount | % | ||||||||||||||
| |
(in thousands) |
|||||||||||||||||||
License |
$ | 48,784 | 36 | % | $ | 52,704 | 31 | % | $ | 3,920 | 8 | % | ||||||||
Application hosting services |
57,563 | 43 | 90,784 | 53 | 33,221 | 58 | ||||||||||||||
Consulting services |
13,346 | 10 | 13,904 | 8 | 558 | 4 | ||||||||||||||
Customer support |
14,596 | 11 | 12,792 | 8 | (1,804 | ) | (12 | ) | ||||||||||||
Total |
$ | 134,289 | 100 | % | $ | 170,184 | 100 | % | $ | 35,895 | 27 | % | ||||||||
Total revenues increased in 2008 as compared to 2007, primarily due to increases in application hosting services and license revenues. The increase in 2008 revenues associated with our application hosting services was due to a 19% increase in InForm production trials under management from approximately 770 at the end of 2007 to approximately 920 at the end of 2008, which includes both InForm application hosting services trials as well as trials hosted for our electronic data capture license customers. The increase in InForm production trials is primarily from customers who purchase all trial-related services from us and who do not have a separate license to InForm, as well as an increase in the average fee per trial. Our application hosting services also increased due to the impact of additional trials under management as a result of our recent acquisition of Clarix. The decrease in customer support revenues in 2008 was due primarily to decreases in both training services and software support revenues related to electronic data capture, primarily InForm. Our revenues were not significantly impacted by price increases or decreases. Inflation had only a nominal impact on our revenues.
| |
Year Ended December 31, | |
|
|||||||||||||||||
|---|---|---|---|---|---|---|---|---|---|---|---|---|---|---|---|---|---|---|---|---|
| |
2007 | 2008 | |
|
||||||||||||||||
| |
Change | |||||||||||||||||||
| |
|
Percentage of Revenues | |
Percentage of Revenues | ||||||||||||||||
Revenues by Geography
|
Amount | Amount | Amount | % | ||||||||||||||||
| |
(in thousands) |
|||||||||||||||||||
North America |
$ | 68,283 | 51 | % | $ | 94,555 | 56 | % | $ | 26,272 | 38 | % | ||||||||
United Kingdom |
46,575 | 35 | 51,417 | 30 | 4,842 | 10 | ||||||||||||||
France |
11,901 | 9 | 15,099 | 9 | 3,198 | 27 | ||||||||||||||
Asia Pacific |
7,530 | 5 | 9,113 | 5 | 1,583 | 21 | ||||||||||||||
International subtotal |
66,006 | 49 | 75,629 | 44 | 9,623 | 15 | ||||||||||||||
Total |
$ | 134,289 | 100 | % | $ | 170,184 | 100 | % | $ | 35,895 | 27 | % | ||||||||
The increase in revenues worldwide was primarily due to an increase in application hosting service and license revenues. The increase in North American revenues is primarily related to additional application hosting services as well as an increase in electronic data capture and clinical data management license revenues. The growth in international revenues is primarily related to additional application hosting services as well as an increase in consulting revenues related to clinical data management, electronic data capture and safety revenues.
58
Cost of Revenues
| |
Year Ended December 31, | |
|
|||||||||||||||||
|---|---|---|---|---|---|---|---|---|---|---|---|---|---|---|---|---|---|---|---|---|
| |
2007 | 2008 | Change | |||||||||||||||||
Costs of Revenues
|
Amount | Percentage of Related Revenues |
Amount | Percentage of Related Revenues |
Amount | % | ||||||||||||||
| |
(in thousands) |
|||||||||||||||||||
License |
$ | 2,361 | 5 | % | $ | 2,715 | 5 | % | $ | 354 | 15 | % | ||||||||
Services |
53,098 | 62 | 70,225 | 60 | 17,127 | 32 | ||||||||||||||
Total |
$ | 55,459 | 41 | % | $ | 72,940 | 43 | % | $ | 17,481 | 32 | % | ||||||||
The costs of license revenues increased in 2008 primarily due to a $0.4 million increase in amortization of intangible assets. The increase in cost of services in 2008 was primarily due to increases in employee-related and outside contractor expenses of $7.6 million and $4.5 million, respectively, associated with a headcount increase of 138 people, of which 66 came from the Clarix acquisition, and the delivery of increased services revenues. We also had expense increases for depreciation, stock-based compensation, and hosting facility fees of $2.0 million, $1.0 million and $0.9 million, respectively. Other cost of services expense increased in 2008 by approximately $0.9 million, including facilities, telephone and royalty expenses.
Gross Margin
| |
Year Ended December 31, | |
|
|||||||||||||||||
|---|---|---|---|---|---|---|---|---|---|---|---|---|---|---|---|---|---|---|---|---|
| |
2007 | 2008 | Change | |||||||||||||||||
Gross Margin
|
Amount | Percentage of Related Revenues |
Amount | Percentage of Related Revenues |
Amount | % | ||||||||||||||
| |
(in thousands) |
|||||||||||||||||||
License |
$ | 46,423 | 95 | % | $ | 49,989 | 95 | % | $ | 3,566 | 8 | % | ||||||||
Services |
32,407 | 38 | 47,255 | 40 | 14,848 | 46 | ||||||||||||||
Total |
$ | 78,830 | 59 | % | $ | 97,244 | 57 | % | $ | 18,414 | 23 | % | ||||||||
The license gross margin percentage was unchanged in 2008 as compared to 2007 at 95% of related revenues as expenses grew proportionately with revenues. The services gross margin percentage increased during 2008 due to lower services expenses as a percentage of related revenues. This was due to increased efficiencies resulting in a decrease in services expense per services employee. The overall gross margin percentage decreased in 2008 due to the decline in license revenue as a percentage of total revenues, which was partially offset by the higher services gross margin percentage.
59
Operating Expenses
| |
Year Ended December 31, | |
|
|||||||||||||||||
|---|---|---|---|---|---|---|---|---|---|---|---|---|---|---|---|---|---|---|---|---|
| |
2007 | 2008 | Change | |||||||||||||||||
Operating Expenses
|
Amount | Percentage of Revenues | Amount | Percentage of Revenues | Amount | % | ||||||||||||||
| |
(in thousands) |
|||||||||||||||||||
Sales and marketing |
$ | 25,209 | 19 | % | $ | 28,021 | 16 | % | $ | 2,812 | 11 | % | ||||||||
Research and development |
20,116 | 15 | 25,500 | 15 | 5,384 | 27 | ||||||||||||||
General and administrative |
20,220 | 15 | 26,821 | 16 | 6,601 | 33 | ||||||||||||||
In-process research and development |
300 | — | — | — | (300 | ) | NM | * | ||||||||||||
Lease exit costs |
— | — | 527 | — | 527 | NM | * | |||||||||||||
Total |
$ | 65,845 | 49 | % | $ | 80,869 | 47 | % | $ | 15,024 | 23 | % | ||||||||
- *
- Not meaningful
Sales and Marketing. Sales and marketing expenses increased in 2008 primarily due to a $1.2 million increase in commission expense related to an increase in orders and revenues, as well as an increase of $0.7 million in employee-related expenses associated with a headcount increase of 11 people. We also experienced increases in stock-based compensation expense of $0.3 million, amortization expense of $0.2 million and recruiting, travel and outside contractor expenses of approximately $0.3 million.
Research and Development. Research and development expenses increased in 2008 primarily due to employee-related expenses of $2.8 million associated with a headcount increase of 24 people. There were also expense increases for outside contractors and stock-based compensation expense and facilities, recruiting and depreciation expense of $1.4 million, $.04 million and $0.5 million, respectively.
General and Administrative. General and administrative expenses increased in 2008 primarily due to an increase in employee-related expenses of $2.6 million and stock-based compensation expense of $1.2 million, related to a headcount increase of 36 people as well as an increase in bonuses. In addition, we had increases in depreciation expense, professional expense, computer-related and bad debt expense of $0.7 million, $0.5 million, $0.4 million and $0.2 million, respectively. Computer-related expenses include hardware and software support agreements as well as computer accessories. Furthermore, there were increases in other general and administrative expenses including recruiting, outside contractors' expense, travel and facilities expenses of $0.7 million.
Lease Exit Costs. Lease exit costs were $0.5 million in 2008, resulting from the relocation of our corporate headquarters from 880 Winter Street to 77 Fourth Avenue in Waltham, Massachusetts. These costs include approximately $0.4 million relating to the estimated future obligation under the prior non-cancelable lease and approximately $0.1 million of write-offs for related abandoned leasehold improvements and fixed assets associated with this lease.
In-Process Research and Development. In-process research and development expenses were $0.3 million in 2007, resulting from the 2007 acquisition of Green Mountain. In-process research and development expense represents product development efforts that were under way at Green Mountain at the time of acquisition for which technological feasibility had not yet been established. There were no in-process research and development expenses resulting from the acquisition of Clarix in 2008.
60
Other Income (Expense)
| |
Year Ended December 31, | |
|
|||||||||||||||||
|---|---|---|---|---|---|---|---|---|---|---|---|---|---|---|---|---|---|---|---|---|
| |
2007 | 2008 | Change | |||||||||||||||||
Other Income
|
Amount | Percentage of Revenues | Amount | Percentage of Revenues | Amount | % | ||||||||||||||
| |
(in thousands) |
|||||||||||||||||||
Interest income |
$ | 7,081 | 5 | % | $ | 5,863 | 3 | % | $ | (1,218 | ) | (17 | )% | |||||||
Other expense |
(35 | ) | — | (1,039 | ) | — | (1,004 | ) | NM | * | ||||||||||
Total other income |
$ | 7,046 | 5 | % | $ | 4,824 | 3 | % | $ | (2,222 | ) | (29 | )% | |||||||
- *
- Not meaningful
The decrease in interest income in 2008 was primarily due to a decrease in interest rates. The increase in other expense is primarily attributable to a net $0.7 million loss associated with the $6.0 million impairment loss on our auction rate securities, offset by a $5.3 million gain recorded on the securities settlement agreement. In addition, we had foreign exchange losses associated with exchange rate fluctuations.
(Benefit from) Provision for Income Taxes
| |
Year Ended December 31, | |
|
||||||||||||||
|---|---|---|---|---|---|---|---|---|---|---|---|---|---|---|---|---|---|
| |
2007 | 2008 | Change | ||||||||||||||
Benefit/provision for income taxes
|
Amount | Percentage of Revenues | Amount | Percentage of Revenues | Amount | $ | |||||||||||
| |
(in thousands) |
||||||||||||||||
(Benefit from) provision for income taxes |
$ | (9,170 | ) | (7 | )% | $ | 7,354 | 4 | % | $ | 16,524 | NM* | |||||
- *
- Not meaningful
The effective tax rate for 2008 increased to 35% compared to an effective tax rate benefit of 46% for 2007. In 2007, we determined that it was more likely than not that we would realize the full value of our remaining deferred tax asset and therefore reduced the valuation allowance by $22.7 million. The benefit of the release in valuation allowance was realized through reductions to income tax expense of $16.5 million which resulted in an 80% benefit to the effective tax rate and to goodwill of $6.1 million.
Non-GAAP Financial Information
We provide non-GAAP revenues, income from operations, net income, and net income per share applicable to common stockholders data as additional information for our operating results. These measures are not in accordance with, or an alternative for, generally accepted accounting principles and may be different from non-GAAP measures used by other companies. We believe these non-GAAP measures are useful to investors because this supplemental information facilitates comparisons to prior periods. We use these non-GAAP measures to evaluate our financial results, develop budgets and manage expenditures. Investors are encouraged to review the reconciliations of these non-GAAP financial measures to the comparable GAAP results.
The table below presents a reconciliation of GAAP to non-GAAP revenues, income from operations and net income and net income per share applicable to common stockholders for the three and twelve months ended December 31, 2008 and 2009. Non-GAAP results exclude the impact of stock-based compensation expense, amortization of intangible assets, the effects of purchase accounting adjustment to record deferred revenues and backlog assumed in acquisitions at fair value, impairment of intangible assets and restructuring expenses.
61
Reconciliation of GAAP Revenues, GAAP Income From Operations and GAAP Net Income (Loss) to
Non-GAAP Revenues, Non-GAAP Income From Operations and Non-GAAP Net Income (Loss)
(unaudited)
(in thousands, except per share amounts)
| |
Three Months Ended December 31, | Twelve Months Ended December 31, | ||||||||||||
|---|---|---|---|---|---|---|---|---|---|---|---|---|---|---|
| |
2008 | 2009 | 2008 | 2009 | ||||||||||
TOTAL REVENUES: |
||||||||||||||
GAAP total revenues |
$ | 48,322 | $ | 58,821 | $ | 170,184 | $ | 213,257 | ||||||
Deferred revenues and backlog adjustments related to acquisitions(1) |
779 | 597 | 980 | 2,995 | ||||||||||
Non-GAAP total revenues |
$ | 49,101 | $ | 59,418 | $ | 171,164 | $ | 216,252 | ||||||
INCOME FROM OPERATIONS: |
||||||||||||||
GAAP income from operations |
$ | 3,372 | $ | 539 | $ | 16,375 | $ | 11,186 | ||||||
Stock-based compensation expense |
2,314 | 4,107 | 8,345 | 13,297 | ||||||||||
Amortization of intangible assets |
505 | 1,174 | 1,580 | 3,708 | ||||||||||
Deferred revenues and backlog adjustments related to acquisitions(1) |
779 | 597 | 980 | 2,995 | ||||||||||
Lease exit costs |
527 | — | 527 | — | ||||||||||
Impairment of intangible assets |
— | 2,293 | — | 2,293 | ||||||||||
Restructuring |
— | — | — | 86 | ||||||||||
Non-GAAP income from operations |
$ | 7,497 | $ | 8,710 | $ | 27,807 | $ | 33,565 | ||||||
NET INCOME (LOSS): |
||||||||||||||
GAAP net income (loss) |
$ | 2,708 | $ | (68 | ) | $ | 13,845 | $ | 8,046 | |||||
Stock-based compensation expense, net of tax |
1,715 | 3,019 | 5,449 | 8,969 | ||||||||||
Amortization of intangible assets, net of tax |
374 | 863 | 1,032 | 2,501 | ||||||||||
Deferred revenues and backlog adjustments related acquisitions, net of tax(1) |
577 | 439 | 618 | 2,020 | ||||||||||
Lease exit costs, net of tax |
391 | — | 333 | — | ||||||||||
Impairment of intangible assets, net of tax |
— | 1,691 | — | 1,547 | ||||||||||
Restructuring, net of tax |
— | — | — | 59 | ||||||||||
Non-GAAP net income |
$ | 5,765 | $ | 5,944 | $ | 21,277 | $ | 23,142 | ||||||
GAAP net income per share applicable to common stockholders: |
||||||||||||||
Diluted |
$ | 0.06 | $ | (0.00 | ) | $ | 0.32 | $ | 0.18 | |||||
Non-GAAP net income per share applicable to common stockholders: |
||||||||||||||
Diluted |
$ | 0.13 | $ | 0.13 | $ | 0.48 | $ | 0.52 | ||||||
- (1)
- Fair value adjustments to deferred revenues and backlog. Purchase accounting requires that deferred revenue assumed in an acquisition be recorded and subsequently recognized at its fair value as of the time of the acquisition. Consequently, we do not recognize the full amount of these deferred revenues and backlog. We add back non-GAAP revenues associated with deferred revenues and backlog that were excluded as a result of purchase accounting adjustments, as we believe that this provides information about the operating impact of the acquired business in a manner consistent with the revenue recognition for our pre-existing products and services.
62
Liquidity and Capital Resources
Our principal sources of liquidity were cash, cash equivalents, and short-term and long-term investments totaling $177.5 million and $135.5 million at December 31, 2008 and 2009, respectively, and accounts receivable of $40.0 million and $56.0 million, respectively. For the years ended December 31, 2008 and 2009 we had no outstanding debt and, in general, we do not enter into long-term binding purchase commitments. We currently expect to retain any future earnings for use in the operation and expansion of our business, including our stock repurchase program, and do not anticipate paying any cash dividends on our common stock.
We believe that our existing cash, cash equivalents, short-term investments and cash provided by operating activities will be sufficient to meet our working capital and capital expenditure needs over at least the next 12 months. Our future capital requirements will depend on many factors, including our rate of revenue growth, the expansion of our marketing and sales activities, the timing and extent of spending to support product development efforts, the timing of introductions of new products and services and enhancements to existing products and services and the continuing market acceptance of our products and services. From time to time, we may also enter into agreements with respect to potential investments in, or acquisitions of, businesses, services or technologies, which could also require us to seek additional equity or debt financing. To the extent that existing cash and securities and cash from operations are insufficient to fund our future activities, we may need to raise additional funds through public or private equity or debt financing.
Substantially all of our long-lived assets as of December 31, 2008 and December 31, 2009 are located in the United States.
Net Operating Loss Carryforwards
At December 31, 2009, we had $19.2 million of net operating loss carryforwards that may be used to offset future U.S. federal taxable income, which may reduce our future cash tax liability. In addition, we had $20.3 million of net operating losses resulting from excess tax deductions related to stock-based compensation. We will realize the benefit of these excess tax deductions through increases to stockholders' equity in the periods in which the losses are utilized to reduce tax payments. At December 31, 2009, we had $3.7 million of federal research and development tax credit carryforwards that may be utilized to offset future U.S. taxes. In addition, we had $0.4 million of federal research and development tax credits resulting from excess tax deductions related to stock-based compensation, the benefits of these credits will be realized through increases to stockholders' equity in the periods in which the credits are utilized to offset future U.S. taxes. The net operating loss and tax credit carryforward periods extend through 2029. We also had $4.5 million of research and development tax credit carryforwards and $1.4 million of investment tax credits that may be utilized to offset future Massachusetts state taxable income. The Massachusetts research and development tax credit carryforward period extends through 2024. The Massachusetts investment tax credits begin to expire in 2010. The federal and state net operating loss carryforwards and research and development tax credits are subject to review and possible adjustment by the taxing authorities. Also, the Internal Revenue Code contains provisions that may limit the net operating loss and tax credit carryforwards available in any given year in the event of certain changes in the ownership interests of significant stockholders. We currently expect to realize the benefit of all recorded deferred tax assets as of December 31, 2009. Our conclusion that such assets will be recovered is based upon our expectation that our future earnings combined with tax planning strategies available to us will provide sufficient taxable income to realize recorded tax assets.
63
We may be required to make cash outlays related to our unrecognized tax benefits. However, due to the uncertainty of the timing of future cash flows associated with our unrecognized tax benefits, we are unable to make reasonably reliable estimates of the period of cash settlement, if any, with the respective taxing authorities. Accordingly, unrecognized tax benefits of $1.6 million as of December 31, 2009 have been excluded from the contractual obligations table below under Contractual Obligations. For further information on unrecognized tax benefits, see Note 6 in the notes to our 2009 consolidated financial statements included in this Annual Report.
Auction Rate Securities
Included within our investment portfolio at December 31, 2008 and 2009 were $24.1 million and $23.8 million, respectively, of auction rate securities, or ARS, at par value, which are classified as long-term investments and short-term investments, respectively, on our consolidated balance sheets, and recorded at fair market value. These ARS are debt instruments issued by various states throughout the United States to finance student loans. The types of ARS that we own are backed by student loans, 95% of which are guaranteed under the Federal Family Education Loan Program, and all had credit ratings of AAA (or equivalent) from a recognized rating agency. Historically, the carrying value of ARS approximated fair value due to the frequent resetting of the interest rates. With the liquidity issues experienced in the global credit and capital markets, our ARS have experienced multiple failed auctions. While we continue to earn and receive interest on these investments at the maximum contractual rate, the estimated fair value of these ARS no longer approximates par value.
In November 2008, we accepted an offer from UBS AG, or UBS, with respect to all of our ARS held at that time. Under our agreement with UBS, we received certain rights which entitle us to sell our ARS to UBS affiliates during the period from June 30, 2010 to July 20, 2012, for a price equal to par value. In accepting the offer, we granted UBS the authority to sell or auction the ARS at par at any time up until the expiration date of our agreement with UBS and released UBS from any claims relating to the marketing and sale of the ARS. UBS's obligations under the agreement are not secured by its assets and do not require UBS to obtain any financing to support its performance obligations. UBS has disclaimed any assurance that it will have sufficient financial resources to satisfy its obligations under the agreement. If UBS has insufficient funding to buy back the ARS and the auction process continues to fail, then we may incur further losses on the carrying value of the ARS.
In prior periods and up through the execution of our signed settlement agreement with UBS in November 2008, the ARS were classified as available-for-sale securities and were reported at fair value, with temporary unrealized gains/(losses) excluded from earnings and reported in a separate component of stockholders' equity and other-than-temporary unrealized losses included in earnings. Upon the execution of the settlement agreement with UBS, we elected to make a one-time transfer of the ARS from available-for-sale securities to trade securities. Accordingly, on a prospective basis, all unrealized gains/(losses) for these trading securities will be included in earnings.
We performed a fair value calculation of our ARS as of December 31, 2008 and 2009. Fair value was determined using a secondary market indications method (direct discounts) and a discounted cash flow method as recent auctions of these securities were not successful, resulting in our continuing to hold these securities and issuers paying interest at the maximum contractual rate. This valuation technique considers the following: time left to maturity, the rate of interest paid on the securities, the amount of principal to be repaid to the holders of the securities; the credit worthiness of the issuer and guarantors (if any) and the sufficiency of the collateral; trading characteristics of the securities; ability to borrow against the ARS; evidence from secondary market sales; and the market-clearing yield for the securities. Based upon the valuation performed, we concluded that the fair value of these ARS at December 31, 2008 was $18.0 million, a decline of $6.0 million from par value. As our signed settlement agreement with UBS indicates that we intend to sell our ARS to UBS affiliates before their stated maturity under the ARS terms, the decline in fair value was deemed other-than-temporary. Accordingly, we recorded a loss on these securities of $6.0 million in our consolidated statement of income for the year ended December 31, 2008.
64
As of December 31, 2009, it remained our intent to sell the ARS on June 30, 2010 in accordance with our rights under the settlement agreement, and accordingly they were reclassified from long-term investments to short-term investments in the consolidated balance sheet as of December 31, 2009. As of December 31, 2009, we concluded that the fair value of these ARS was $19.4 million and therefore, we recorded a change in fair value of the securities of $1.6 million in our consolidated statement of income for the year ended December 31, 2009.
We elected to measure the fair value of the settlement agreement (the "put option") under the fair value option. Fair value was determined using a discounted cash flow method which considered the following factors: the term of the agreement, the availability to borrow against the ARS, the creditworthiness of UBS and current market interest rates. Based on the valuation performed, we concluded that the fair value of the put option was $5.3 million. Accordingly, we recorded a gain of $5.3 million in the consolidated statement of income for the year ended December 31, 2008 with a corresponding long-term asset, "securities settlement agreement" in the consolidated balance sheet at December 31, 2008. As of December 31, 2009, it remained our intent to sell the ARS on June 30, 2010 in accordance with our rights under the settlement agreement, and accordingly we reclassified the fair value of the "securities settlement agreement" from long-term-assets to current assets in the consolidated balance sheet and concluded that the fair market value of the securities settlement agreement was $4.3 million, resulting in a decrease of $1.0 million in fair value being recorded in our consolidated statement of income for the year ended December 31, 2009.
Cash Flows
Cash provided by and used in operating activities has historically been affected by changes in working capital accounts, primarily deferred revenues, accounts receivable and accrued expenses, and add-backs of non-cash expense items such as depreciation and amortization and stock-based compensation expense. Fluctuations within accounts receivable and deferred revenues are primarily related to the timing of billings to our customers, payments from our customers and the associated revenue recognition. Movements in deferred costs are related to the volume and stages of hosted clinical trials and movements in accrued expenses and accounts payable are due to the timing of certain transactions.
Net Cash Provided by Operating Activities. Net cash provided by operating activities was $33.4 million in 2009, which was more than net income of $8.0 million. The difference is primarily due to non-cash adjustments of $17.1 million of depreciation and amortization expense, $13.3 million of stock-based compensation expense, $2.6 million of deferred income tax expense, a $2.3 million impairment of intangible assets and a $1.0 million gain in fair value on the securities settlement agreement, partially offset by a $1.6 million change in the fair value of investments offset by other various changes in working capital accounts.
Net Cash Used in Investing Activities. Net cash used in investing activities was $109.5 million during 2009, which was primarily due to the purchase of short-term and long-term investments of $107.5 million, cash paid for the acquisitions of Maaguzi, Waban and Covance IVRS/IWRS of $34.7 million, and capital expenditures of $29.2 million. These decreases in cash were partially offset by $61.5 million of proceeds from maturities of short-term and long-term investments.
Net Cash Used In Financing Activities. Net cash used in financing activities was $14.4 million in 2009, consisting of the purchase of treasury stock of $14.0 million and withholding taxes associated with the vesting of restricted stock awards of $2.9 million, partially off-set by proceeds from the issuance of common stock of $2.5 million.
65
Contractual Obligations
Our principal commitments consist of obligations under non-cancelable operating leases for office space. The following table of our material contractual obligations as of December 31, 2009 summarizes the aggregate effect that these obligations are expected to have on our cash flows in the periods indicated:
| |
Payments Due by Period | |||||||||||||||
|---|---|---|---|---|---|---|---|---|---|---|---|---|---|---|---|---|
Contractual Obligations
|
Total | 1 year or less | 2-3 years | 4-5 years | More than 5 years | |||||||||||
| |
(in thousands) |
|||||||||||||||
Operating lease obligations |
$ | 83,440 | $ | 10,041 | $ | 19,166 | $ | 17,552 | $ | 36,681 | ||||||
Total |
$ | 83,440 | $ | 10,041 | $ | 19,166 | $ | 17,552 | $ | 36,681 | ||||||
The above table includes the lease entered into on February 13, 2008 with BP Fourth Avenue, L.L.C. to secure office space for our corporate headquarters at 77 Fourth Avenue, Waltham, Massachusetts. The commencement date for occupancy under the lease was December 2008.
The lease provides for the rental of 165,129 rentable square feet of space and has an initial term of 10 years and three months. We can, subject to certain conditions, extend this term by exercising up to two consecutive five year options. We are not required to pay any rent for the first three months of the initial lease term. Thereafter, the annual rent on the lease for years one through five will be $6.6 million, or approximately $0.5 million per month. For years six through ten, the annual rent will be $7.2 million, or approximately $0.6 million per month. The total base rent payable in the initial term is $69.1 million.
In addition to base rent, commencing on January 1, 2010, the lease for our current headquarters requires us to pay our proportionate share of the amount by which defined operating expenses incurred by the landlord exceed the base year (2009) operating expenses, as defined in the lease. The lease also requires us to pay our proportionate share of the amount by which real estate taxes paid or incurred by the landlord exceed the tax base year (fiscal 2010), as defined in the lease. In addition, we are receiving lease incentives, including free rent for the first three months of occupancy, which totaled approximately $1.6 million, and allowances for tenant improvements totaling approximately $8.1 million. The allowances for tenant improvements are being amortized on a straight-line basis over the lease term as a reduction of rental expense.
In connection with the signing of the lease for our current headquarters, we have deposited with the landlord an unconditional, irrevocable letter of credit in the landlord's favor in the amount of $1.0 million.
The above table also includes the lease which we entered into on August 17, 2009 with KBS Five Tower Bridge, L.L.C. to secure office space for our IRT business operations at 300 Barr Harbor Drive, West Conshohocken, Pennsylvania. The commencement date for occupancy under the lease was September 2009. The lease provides for the rental of 44,907 square feet of space and has an initial term of 10 years and one month. We can, subject to certain conditions, extend this term by exercising up to two consecutive five year options. The annual rent under this lease for the first year is $1.3 million, or approximately $0.1 million per month, with annual escalations in rent for each subsequent year in the amount fifty cents per square foot. The total base rent payable in the initial term is $14.2 million.
In addition to base rent, commencing on January 1, 2012, the lease for our IRT operations requires us to pay our proportionate share of the amount by which defined operating expenses incurred by the landlord exceed the base year operating expenses, as defined in the lease. The lease also requires us to pay our proportionate share of the amount by which real estate taxes paid or incurred by the landlord exceed the tax base year, as defined in the lease.
66
Recently Issued Accounting Pronouncements
In June 2009, the Financial Accounting Standards Board ("FASB") issued the ASC as the single source of authoritative U.S. GAAP recognized by the FASB to be applied by nongovernmental entities in preparation of financial statements in conformity with U.S. GAAP. While the adoption of the ASC as of September 30, 2009 changes how we reference accounting standards, the adoption did not have an impact on our financial position, results of operations, cash flows, or accounting policies.
In May 2009, the FASB issued ASC 855, Subsequent Events. ASC 855 establishes general standards of accounting for and disclosure of events that occur after the balance sheet date but before financial statements are issued or are available to be issued. The adoption of ASC 855 had no impact on our financial condition or results of operations.
In December 2007, the FASB issued ASC 805, Business Combinations. ASC 805 is effective for fiscal years beginning on or after December 15, 2008 and applies to all business combinations. ASC 805 provides that, upon initially obtaining control, an acquirer shall recognize 100 percent of the fair values of acquired assets, including goodwill, and assumed liabilities, with only limited exceptions, even if the acquirer has not acquired 100 percent of its target. As a consequence, the current step acquisition model will be eliminated. Additionally, ASC 805 changes current practice, in part, as follows: (1) contingent consideration arrangements will be fair valued at the acquisition date and included on that basis in the purchase price consideration; (2) transaction costs will be expensed as incurred, rather than capitalized as part of the purchase price; (3) pre-acquisition contingencies, such as legal issues, will generally have to be accounted for in purchase accounting at fair value; (4) in order to accrue for a restructuring plan in purchase accounting, the requirements in ASC 420, Exit or Disposal Cost Obligations, would have to be met at the acquisition date; and (5) in-process research and development charges will no longer be recorded. With the adoption of ASC 805 goodwill is no longer reduced when utilizing net operating loss carry forwards for which a full valuation allowance exists. The adoption of ASC 805 could materially change the accounting for business combinations consummated subsequent to January 1, 2009, and was effective for our acquisitions of Waban, Maguzzi and Covance IVRS/IWRS in 2009.
In April 2009, the FASB issued FASB Staff Position No. 141(R)-1 ("FSP FAS 141(R)-1"), Accounting for Assets Acquired and Liabilities Assumed in a Business Combination That Arise from Contingencies (subsequently this standard has been codified under FASB ASC Topic 805). The revised authoritative guidance provides additional clarification on the initial recognition and measurement of assets acquired and liabilities assumed in a business combination that arise from contingencies. The revised authoritative guidance is effective for all fiscal years beginning on or after December 15, 2008. To date, the revised authoritative guidance has not had a significant impact on the accounting for any businesses acquired. However, it may have a material impact on how we account for future acquisitions.
In October 2009, the FASB issued Accounting Standards Update ("ASU") No. 2009-13, "Revenue Recognition (Topic 605)—Multiple-Deliverable Revenue Arrangements." ASU No. 2009-13 addresses the accounting for multiple-deliverable arrangements to enable vendors to account for products or services (deliverables) separately rather than as a combined unit. This guidance establishes a selling price hierarchy for determining the selling price of a deliverable, which is based on: (a) vendor-specific objective evidence; (b) third-party evidence; or (c) estimates. This guidance also eliminates the residual method of allocation and requires that arrangement consideration be allocated at the inception of the arrangement to all deliverables using the relative selling price method. In addition, this guidance significantly expands required disclosures related to a vendor's multiple-deliverable revenue arrangements.
67
ASU No. 2009-13 is effective prospectively for revenue arrangements entered into or materially modified in fiscal years beginning on or after June 15, 2010 and early adoption is permitted. A company may elect, but will not be required, to adopt the amendments in ASU No. 2009-13 retrospectively for all prior periods. We adopted ASU No. 2009-13 on January 1, 2010 and do not expect that the adoption of this guidance will have a material effect on our consolidated financial position and results of operations.
Off-Balance Sheet Arrangements
We do not have any special purpose entities or off-balance sheet arrangements.
Item 7A. Quantitative and Qualitative Disclosures about Market Risk
We are exposed to a variety of market risks, including changes in interest rates and the market value of our investments.
Financial Instruments, Other Financial Instruments
Financial instruments meeting fair value disclosure requirements consist of cash equivalents, short-term investments, securities settlement agreement, accounts receivable, accounts payable, forward foreign exchange contracts and a line of credit. The fair value of these financial instruments approximates their carrying amount.
Foreign Currency Exchange Risk
Our results of operations and cash flows are subject to fluctuations due to changes in foreign currency exchange rates, particularly changes in the euro, British pound, Australian dollar and Japanese yen. Except for revenue transactions in Japan, we enter into transactions directly with substantially all of our foreign customers.
Percentage of revenues and expenses in foreign currency is as follows:
| |
Year Ended December 31, | |||||||||
|---|---|---|---|---|---|---|---|---|---|---|
| |
2007 | 2008 | 2009 | |||||||
Revenues generated in locations outside the United States |
49 | % | 44 | % | 38 | % | ||||
Revenues in currencies other than the United States dollar |
35 | 31 | 25 | |||||||
Expenses in currencies other than the United States dollar |
29 | 27 | 22 | |||||||
During 2009, 14%, 7% and 4% of our revenues were in euros, British pound and Japanese yen, respectively, and 12%, 5% and 4% of our expenses were in British pound, euro and Japanese yen, respectively.
As of December 31, 2008 and 2009, we had $11.1 million and $22.6 million, respectively, of receivables denominated in currencies other than the U.S. dollar. We also maintain cash accounts denominated in currencies other than the local currency which exposes us to foreign exchange rate movements.
In addition, although our foreign subsidiaries have intercompany accounts that eliminate upon consolidation, such accounts expose us to foreign currency rate movements. Exchange rate fluctuations on short-term intercompany accounts are recorded in our consolidated statements of income under "other income (expense)", while exchange rate fluctuations on long-term intercompany accounts are recorded in our consolidated balance sheets under "accumulated other comprehensive (loss) income" (a separate component of stockholders' equity), as they are considered part of our net investment and hence do not give rise to gains or losses.
68
We have implemented a risk management program under which we measure foreign currency exchange risk monthly and manage those exposures through the use of various operating strategies and, as more fully described in Note 2 of the notes to our 2009 consolidated financial statements included in this Annual Report. We regularly purchase short-term foreign currency forward contracts, designed to hedge fluctuation in non-functional currencies and our subsidiaries against the U.S. dollar. This process is designed to minimize foreign currency translation exposures that could otherwise affect consolidated results of operations. The terms of these contracts are generally for periods of one month.
Currently, our largest foreign currency exposures are the British pound and euro, primarily because our European operations have a higher proportion of our local currency denominated expenses. Relative to foreign currency exposures existing at December 31, 2008 and 2009, a 10% unfavorable movement in foreign currency exchange rates would expose us to significant losses in earnings or cash flows or significantly diminish the fair value of our foreign currency financial instruments. For the year ended December 31, 2009, we estimated that a 10% unfavorable movement in foreign currency exchange rates would have decreased revenues by $5.3 million, decreased expenses by $4.5 million and decreased operating income by $0.8 million. This estimate assumes that all currencies move in the same direction at the same time and the ratio of non-U.S. dollar denominated revenue and expenses to U.S. dollar denominated revenue and expenses does not change from current levels. Since a large portion of our revenue is deferred revenue that is recorded at different foreign currency exchange rates, the impact to revenue of a change in foreign currency exchange rates is recognized over time, whereas the impact to expenses is more immediate, as expenses are recognized at the current foreign currency exchange rate in effect at the time the expense is incurred. All of the potential changes noted above are based on sensitivity analyses performed on our financial results as of December 31, 2009.
As of December 31, 2008 and 2009, we entered into forward foreign exchange contracts to hedge approximately $12.7 million and $6.2 million, respectively, of receivables, intercompany accounts and cash balances denominated in currencies other than the U.S. dollar. We recorded foreign currency losses of $0.6 million and $0.1 million for the years ended December 31, 2008 and 2009, respectively. We settle forward foreign exchange contracts in cash. As of December 31, 2008 and 2009, we recorded $(1.1) million and $0.2 million, respectively, of foreign exchange gains/(losses) in other income (expense) as a result of outstanding forward foreign exchange contracts.
Interest Rate Sensitivity
We had unrestricted cash, cash equivalents, short-term and long-term investments totaling $135.5 million at December 31, 2009. These amounts were invested primarily in money market funds, corporate bonds and government agency securities, and are held for working capital purposes. We do not use derivative financial instruments in our investment portfolio. We have established investment guidelines relative to credit quality, diversification, marketability and performance measurement designed to maintain safety and liquidity. With the exception of auction rate securities, investments in securities are invested primarily in high quality securities of a short duration and historically have not been materially affected by fluctuations in interest rates. With the exception of auction rate securities, which are recorded at fair value, investments are reported at amortized cost. We considered the historical volatility of short-term and long-term interest rates and determined that, due to the size and duration of our investment portfolio, a 100-basis-point increase in interest rates would not have any material exposure to changes in the fair value of our portfolio at December 31, 2009. A decline in interest rates, however, would reduce future investment income.
We believe that our existing cash, cash equivalents, short-term investments and cash provided by operating activities will be sufficient to meet our working capital and capital expenditure needs over at least the next 12 months.
69
Item 8. Financial Statements and Supplementary Data
The consolidated financial statements and supplementary data of Phase Forward Incorporated are listed under Part IV, Item 15, in this Annual Report.
Item 9. Changes in and Disagreements with Accountants on Accounting and Financial Disclosure
None.
Item 9A. Controls and Procedures.
(1) Evaluation of Disclosure Controls and Procedures
We maintain disclosure controls and procedures that are designed to ensure that information required to be disclosed in our reports filed under the Securities Exchange Act of 1934, as amended, is recorded, processed, summarized and reported within the time periods specified in the Securities and Exchange Commission's rules and forms, and that such information is accumulated and communicated to our management, including our Chief Executive Officer and Chief Financial Officer, as appropriate, to allow timely decisions regarding required disclosure. In designing and evaluating the disclosure controls and procedures, management recognized that any controls and procedures, no matter how well designed and operated, can provide only reasonable assurance of achieving the desired control objectives, as ours are designed to do, and management necessarily was required to apply its judgment in evaluating the cost-benefit relationship of possible controls and procedures.
As of December 31, 2009, we carried out an evaluation, under the supervision and with the participation of our management, including our Chief Executive Officer and Chief Financial Officer, of the effectiveness of the design and operation of our disclosure controls and procedures, as defined in Rules 13a-15(e) and 15d-15(e) under the Securities Exchange Act of 1934, as amended. Based upon that evaluation, our Chief Executive Officer and Chief Financial Officer concluded that our disclosure controls and procedures are effective at that reasonable assurance level in (i) enabling us to record, process, summarize and report information required to be included in our periodic Securities and Exchange Commission filings within the required time period and (ii) ensuring that information required to be disclosed in the reports that we file or submit under the Securities Exchange Act is accumulated and communicated to our management, including our Chief Executive Officer and Chief Financial Officer, to allow timely decisions regarding required disclosure.
(2) Report of Management on Internal Control over Financial Reporting
We are responsible for establishing and maintaining adequate internal control over financial reporting. Internal control over financial reporting is defined in Rule 13a-15(f) and 15d-15(f) under the Securities Exchange Act of 1934, as amended, as a process designed by, or under the supervision of our principal executive and principal financial officers and effected by our board of directors, management and other personnel to provide reasonable assurance regarding the reliability of financial reporting and the preparation of financial statements for external purposes in accordance with generally accepted accounting principles and includes those policies and procedures that:
- •
- pertain to the maintenance of records that in reasonable detail accurately and fairly reflect the transactions and
disposition of our assets;
- •
- provide reasonable assurance that transactions are recorded as necessary to permit preparation of financial statements in accordance with generally accepted accounting principles, and that our receipts and expenditures are being made only in accordance with authorization of our management and directors; and
70
- •
- provide reasonable assurance regarding prevention or timely detection of unauthorized acquisition, use or disposition of our assets that could have a material effect on the financial statements.
Our internal control system was designed to provide reasonable assurance to our management and board of directors regarding the preparation and fair presentation of published financial statements. Because of its inherent limitations, internal control over financial reporting may not prevent or detect misstatements. Projections of any evaluation of effectiveness to future periods are subject to the risks that controls may become inadequate because of changes in conditions, or that the degree of compliance with the policies or procedures may deteriorate.
We have assessed the effectiveness of our internal control over financial reporting as of December 31, 2009. In making this assessment, we used the criteria set forth by the Committee of Sponsoring Organizations of the Treadway Commission (COSO) in Internal Control-Integrated Framework. Based on our assessment, we believe that, as of December 31, 2009, our internal control over financial reporting is effective at a reasonable assurance level based on these criteria.
Our independent registered public accounting firm, Ernst & Young, LLP, issued an attestation report on our internal control over financial reporting. This report is contained in Section 4 below.
(3) Changes in Internal Controls Over Financial Reporting
There have been no changes in our internal control over financial reporting that occurred during the last fiscal quarter that have materially affected, or are reasonably likely to materially affect, our internal control over financial reporting.
(4) Report of Independent Registered Public Accounting Firm
Report of Independent Registered Public Accounting Firm
The
Board of Directors and Stockholders
Phase Forward Incorporated
We have audited Phase Forward Incorporated's internal control over financial reporting as of December 31, 2009, based on criteria established in Internal Control—Integrated Framework issued by the Committee of Sponsoring Organizations of the Treadway Commission (the COSO criteria). Phase Forward Incorporated's management is responsible for maintaining effective internal control over financial reporting, and for its assessment of the effectiveness of internal control over financial reporting included in the accompanying Report of Management on Internal Control Over Financial Reporting. Our responsibility is to express an opinion on the company's internal control over financial reporting based on our audit.
We conducted our audit in accordance with the standards of the Public Company Accounting Oversight Board (United States). Those standards require that we plan and perform the audit to obtain reasonable assurance about whether effective internal control over financial reporting was maintained in all material respects. Our audit included obtaining an understanding of internal control over financial reporting, assessing the risk that a material weakness exists, testing and evaluating the design and operating effectiveness of internal control based on the assessed risk, and performing such other procedures as we considered necessary in the circumstances. We believe that our audit provides a reasonable basis for our opinion.
A company's internal control over financial reporting is a process designed to provide reasonable assurance regarding the reliability of financial reporting and the preparation of financial statements for external purposes in accordance with generally accepted accounting principles.
71
A company's internal control over financial reporting includes those policies and procedures that (1) pertain to the maintenance of records that, in reasonable detail, accurately and fairly reflect the transactions and dispositions of the assets of the company; (2) provide reasonable assurance that transactions are recorded as necessary to permit preparation of financial statements in accordance with generally accepted accounting principles, and that receipts and expenditures of the company are being made only in accordance with authorizations of management and directors of the company; and (3) provide reasonable assurance regarding prevention or timely detection of unauthorized acquisition, use, or disposition of the company's assets that could have a material effect on the financial statements.
Because of its inherent limitations, internal control over financial reporting may not prevent or detect misstatements. Also, projections of any evaluation of effectiveness to future periods are subject to the risk that controls may become inadequate because of changes in conditions, or that the degree of compliance with the policies or procedures may deteriorate.
In our opinion, Phase Forward Incorporated maintained, in all material respects, effective internal control over financial reporting as of December 31, 2009, based on the COSO criteria.
We also have audited, in accordance with the standards of the Public Company Accounting Oversight Board (United States), the consolidated balance sheets of Phase Forward Incorporated as of December 31, 2008 and 2009, and the related consolidated statements of income, stockholders' equity and comprehensive income, and cash flows for each of the three years in the period ended December 31, 2009 of Phase Forward Incorporated and our report dated February 26, 2010 expressed an unqualified opinion thereon.
| /s/ Ernst & Young LLP |
Boston,
Massachusetts
February 26, 2010
Subsequent Event
On February 12, 2010, our board of directors authorized the repurchase of up to an additional $25.0 million of our common stock, par value $0.01 per share, through a share repurchase program. As authorized by the program, shares may be purchased in the open market or through privately negotiated transactions in a manner consistent with applicable securities laws and regulations, including pursuant to a Rule 10b5-1 plan maintained by us. This share repurchase program does not obligate us to acquire any specific number of shares and may be extended, suspended or discontinued at any time. All repurchases are expected to be funded from cash and investment balances. While our board of directors has approved the share purchasing guidelines, the timing of the repurchases and the exact number of shares of common stock to be purchased will be determined at our management's discretion, and will depend upon on market conditions and other factors, including price, corporate and regulatory requirements and alternative investment opportunities. The repurchase program is currently scheduled to terminate on December 31, 2010.
72
Information required by Items 10, 11, 12, 13 and 14 of Part III is omitted from this Annual Report and will be filed in a definitive proxy statement or by an amendment to this Annual Report not later than 120 days after the end of the year covered by this Annual Report.
Our policy governing transactions in our securities by directors, officers and employees permits our officers, directors and certain other persons to enter into trading plans complying with Rule 10b5-1 under the Securities Exchange Act of 1934, as amended. We have been advised that our Senior Vice President, Legal and Regulatory Services, D. Ari Buchler, our Senior Vice President, Integration and Product Strategy, Martin Young, and our Senior Vice President, Sales and Marketing, Stephen J. Powell, have each entered into a trading plan covering periods after the date of this Annual Report in accordance with Rule 10b5-1 and our policy governing transactions in our securities. Generally, under these trading plans, the individual relinquishes control over the transactions once the trading plan is put into place. Accordingly, sales under these plans may occur at any time, including possibly before, simultaneously with, or immediately after significant events involving our company.
We anticipate that, as permitted by Rule 10b5-1 and our policy governing transactions in our securities, some or all of our officers, directors and employees may establish trading plans in the future. We intend to disclose the names of executive officers and directors who establish a trading plan in compliance with Rule 10b5-1 and the requirements of our policy governing transactions in our securities in our future quarterly and annual reports on Form 10-Q and 10-K filed with the Securities and Exchange Commission. However, we undertake no obligation to update or revise the information provided herein, including for revision or termination of an established trading plan, other than in such quarterly and annual reports.
Item 15. Exhibits, Financial Statements and Schedules
- (a)
- The
following documents are filed as part of this report:
- (1)
- Financial Statements
- (2)
- Financial Statement Schedules
Report of Independent Registered Public Accounting Firm on Consolidated Financial Statements
Consolidated Balance Sheets as of December 31, 2008 and 2009
Consolidated Statements of Income for the years ended December 31, 2007, 2008 and 2009
Consolidated Statements of Stockholders' Equity and Comprehensive Income for the years ended December 31, 2007, 2008 and 2009
Consolidated Statements of Cash Flows for the years ended December 31, 2007, 2008 and 2009
Notes to Consolidated Financial Statements
All schedules have been omitted because they are not required or because the required information is given in the Consolidated Financial Statements or Notes thereto.
73
| Exhibit No. | Description | ||
|---|---|---|---|
| 2.1 | # | Agreement and Plan of Merger by and among Phase Forward, Merger Sub, Lincoln and Lincoln SR dated as of August 16, 2005. (Incorporated by reference herein to Exhibit 2.1 of the Company's Current Report on Form 8-K filed with the SEC on August 31, 2005.) | |
| 2.2 | Amendment No. 1 to Agreement and Plan of Merger by and among Phase Forward, Lincoln and Lincoln SR dated as of September 13, 2006. (Incorporated by reference herein to Exhibit 10.1 of the Company's Current Report on Form 8-K filed with the SEC on September 15, 2006.) | ||
| 2.3 | Unit Purchase Agreement by and among Clarix LLC, the Member Representative (as defined therein), the Selling Interest Holders listed therein, and Phase Forward Incorporated dated as of September 5, 2008. (Incorporated by reference herein to Exhibit 2.1 of the Company's Current Report on Form 8-K filed with the SEC on September 11, 2008.) | ||
| 2.4 | Agreement and Plan of Merger by and among Phase Forward Incorporated, Waban Software, Inc., Pecan Acquisition Corp. and the Securityholder Representative, dated as of April 22, 2009. (Incorporated by reference herein to Exhibit 2.1 of the Company's Current Report on Form 8-K filed with the SEC on April 22, 2009.) | ||
| 3.1 | Amended and Restated Certificate of Incorporation of the Registrant dated July 20, 2004. (Incorporated by reference herein to the exhibits to the Company's Registration Statement on Form S-1 (File No. 333-113594), as amended.) | ||
| 3.2 | Amended and Restated Bylaws of the Registrant. (Incorporated by reference herein to the exhibits to the Company's Registration Statement on Form S-1 (File No. 333-113594), as amended.) | ||
| 3.3 | Amendment No. 1 to the Amended and Restated By-laws. (Incorporated by reference herein to Exhibit 3.1 of the Company's Current Report on Form 8-K filed with the SEC on May 13, 2009.) | ||
| 4.1 | Specimen Certificate for shares of the Registrant's Common Stock. (Incorporated by reference herein to the exhibits to the Company's Registration Statement on Form S-1 (File No. 333-113594), as amended.) | ||
| 10.1 | + | 1997 Stock Option Plan. (Incorporated by reference herein to the exhibits to the Company's Registration Statement on Form S-1 (File No. 333-113594), as amended.) | |
| 10.2 | + | Amended and Restated 2003 Non-Employee Director Stock Option Plan, as amended. (Incorporated by reference herein to Exhibit 10.1 of the Company's Quarterly Report on Form 10-Q filed with the SEC on August 10, 2005.) | |
| 10.3 | + | Amendment No. 1 to the 2004 Stock Option and Incentive Plan as Amended and Restated March 2006. (Incorporated by reference herein to Exhibit 10.4 to the Company's Quarterly Report on Form 10-Q filed with the SEC on May 3, 2007.) | |
| 10.4 | + | Amended and Restated 2004 Employee Stock Purchase Plan. (Incorporated by reference herein to Exhibit 10.4 of the Company's Annual Report on Form 10-K filed with the SEC on March 13, 2006.) | |
| 10.5 | + | Form of Incentive Stock Option Agreement. (Incorporated by reference herein to Exhibit 10.4 of the Company's Quarterly Report on Form 10-Q filed with the SEC on November 10, 2004.) | |
| 10.6 | + | Form of Non-Statutory Stock Option Agreement. (Incorporated by reference herein to Exhibit 10.5 of the Company's Quarterly Report on Form 10-Q filed with the SEC on November 10, 2004.) | |
| 10.7 | + | Form of Non-Statutory Stock Option Agreement (U.K.). (Incorporated by reference herein to Exhibit 10.3 of the Company's Quarterly Report on Form 10-Q filed with the SEC on August 10, 2005.) | |
| 10.8 | + | Form of Stock Option Grant Certificate under the Registrant's Amended and Restated 1997 Stock Option Plan. (Incorporated by reference herein to Exhibit 10.1 of the Company's Current Report on Form 8-K filed with the SEC on December 30, 2005.) | |
74
| Exhibit No. | Description | ||
|---|---|---|---|
| 10.9 | + | Form of Restricted Stock Award Agreement. (Incorporated by reference herein to Exhibit 10.1 to the Company's Current Report on Form 8-K filed with the SEC on June 12, 2006.) | |
| 10.10 | + | Form of Restricted Stock Unit Award Agreement. (Incorporated by reference herein to Exhibit 10.24 to the Company's Annual Report on Form 10-K filed with the SEC on March 1, 2007.) | |
| 10.11 | + | Form of Restricted Stock Unit Award Agreement. (Incorporated by reference herein to Exhibit 10.3 of the Company's Current Report on Form 8-K filed with the SEC on March 6, 2007.) | |
| 10.12 | + | Form of Phase Forward Incorporated Restricted Stock Unit Award Agreement for Clarix LLC Founders (Incorporated by reference herein to Exhibit 99.1 to the Company's Registration Statement on Form S-8 (File No. 333-153335).) | |
| 10.13 | + | Form of Phase Forward Incorporated Restricted Stock Unit Award Agreement for Clarix LLC Employees (Incorporated by reference herein to exhibit 99.1 to the Company's Registration Statement on Form S-8 (File No. 333-153335).) | |
| 10.14 | + | Phase Forward Incorporated Management Incentive Plan (Effective January 1, 2009) (Incorporated by reference herein to Exhibit 10.1 to the Company's Current Report on Form 8-K filed with the SEC on February 13, 2009.) | |
| 10.15 | + | Summary of cash compensation practices for non-employee directors. (Incorporated by reference herein to Exhibit 10.24 to the Company's Annual Report on Form 10-K filed with the SEC on March 17, 2008.) | |
| 10.16 | + | Form of Executive Agreement between the Registrant and its officers, as amended March 7, 2005 and June 6, 2006, as restated on February 28, 2008 and as further amended on November 4, 2008. (Incorporated by reference herein to Exhibit 10.17 to the Company's Annual Report on Form 10-K filed with the SEC on February 27, 2009.) | |
| 10.17 | + | Form of Management Retention Agreement. (Incorporated by reference herein to the Exhibit 10.3 to the Company's Current Report on Form 8-K filed with the SEC on September 11, 2008.) | |
| 10.18 | + | Form of Management Retention Agreement. (Incorporated by reference herein to the Exhibit 10.4 to the Current Report on Form 8-K filed with the SEC on September 11, 2008.) | |
| 10.19 | + | Form of Indemnification Agreement between the Registrant and each of its directors and certain executive officers. (Incorporated by reference herein to the exhibits to the Company's Registration Statement on Form S-1 (File No. 333-113594), as amended.) | |
| 10.20 | License Agreement by and among Mark L. Kozam d/b/a MLK Software and Datasci, LLC, and the Company. (Incorporated by reference herein to Exhibit 10.5 of the Company's Quarterly Report on Form 10-Q filed with the SEC on May 10, 2006.) | ||
| 10.21 | Sublease Agreement between the Registrant and BMC Software, Inc. (Incorporated by reference herein to the exhibits to the Company's Registration Statement on Form S-1 (File No. 333-113594), as amended.) | ||
| 10.22 | Lease dated February 13, 2008 between Phase Forward Incorporated and BP Fourth Avenue, L.L.C. (Incorporated by reference herein to Exhibit 10.1 to the Company's Current Report on Form 8-K filed with the SEC on February 19, 2008.) | ||
| 10.23 | Seventh Loan Modification Agreement with Silicon Valley Bank (Incorporated by reference herein to Exhibit 10.6 to the Company's Quarterly Report on Form 10-Q filed with the SEC on May 10, 2006.) | ||
| 10.24 | + | Form of Phase Forward Incorporated Restricted Stock Unit Award Agreement (Key Employee Form.) (Incorporated by reference herein to Exhibit 99.1 of the Company's Registration Statement on Form S-8 filed with the SEC on April 22, 2009.) | |
| 10.25 | + | Form of Phase Forward Incorporated Restricted Stock Unit Award Agreement (Standard Employee Form.) (Incorporated by reference herein to Exhibit 99.2 of the Company's Registration Statement on Form S-8 filed with the SEC on April 22, 2009.) | |
75
| Exhibit No. | Description | ||
|---|---|---|---|
| 10.26 | + | Phase Forward Incorporated Management Incentive Plan. (Incorporated by reference herein to the exhibits to the Company's Current Report on Form 8-K filed with the SEC on February 13, 2009.) | |
| 10.27 | + | Non-Employee Directors' Deferred Compensation Program Plan. (Incorporated by reference herein to the exhibits to the Company's Quarterly Report on Form 10-Q filed with the SEC on May 8, 2009.) | |
| 10.28 | + | Amended and Restated 2004 Stock Option and Incentive Plan (Incorporated by reference herein to Exhibit 10.1 of the Company's Current Report on Form 8-K filed with the SEC on May 13, 2009). | |
| 10.29 | + | Senior Executive's Service Agreement between Phase Forward Europe Limited and Stephen Powell. (Incorporated by reference herein to exhibit 10.1 on the Company's current report on Form 8-K filed with the SEC on February 5, 2010.) | |
| 21.1 | * | Subsidiaries of the Registrant. | |
| 23.1 | * | Consent of Ernst & Young LLP, Independent Registered Public Accounting Firm. | |
| 31.1 | * | Certification of CEO pursuant to Rule 13a-14(a) and 15d-14(a) under the Securities Exchange Act of 1934. | |
| 31.2 | * | Certification of CFO pursuant to Rules 13a-14(a) and 15d-14(a) under the Securities Exchange Act of 1934. | |
| 32.1 | * | Certification of CEO pursuant to 18 U.S.C. 1350, as adopted pursuant to Section 906 of the Sarbanes-Oxley Act of 2002. | |
| 32.2 | * | Certification of CFO pursuant to 18 U.S.C. 1350, as adopted pursuant to Section 906 of the Sarbanes-Oxley Act of 2002. | |
- +
- Indicates
a management contract or any compensatory plan, contract or arrangement.
- #
- Confidential
treatment requested for portions of this document.
- *
- Filed herewith.
76
Pursuant to the requirements of Section 13 or 15(d) of the Securities Exchange Act of 1934, as amended, the registrant has duly caused this report to be signed on its behalf by the undersigned, thereunto duly authorized on the 26th day of February, 2010.
| PHASE FORWARD INCORPORATED | ||||
By: |
/s/ ROBERT K. WEILER Robert K. Weiler President and Chief Executive Officer |
|||
Pursuant to the requirements of the Securities Exchange Act of 1934, as amended, this Annual Report has been signed below by the following persons on behalf of the registrant and in the capacities and on the dates indicated.
| Signature | Title | Date | ||
|---|---|---|---|---|
| /s/ ROBERT K. WEILER Robert K. Weiler |
President, Chief Executive Officer and Chairman of the Board (principal executive officer) | February 26, 2010 | ||
/s/ CHRISTOPHER A. MENARD Christopher A. Menard |
Senior Vice President, Chief Financial Officer and Treasurer (principal accounting officer and principal financial officer) |
February 26, 2010 |
||
/s/ PAUL A. BLEICHER, M.D., PH.D. Paul A. Bleicher, M.D., Ph.D |
Director |
February 26, 2010 |
||
/s/ AXEL BICHARA Axel Bichara |
Director |
February 26, 2010 |
||
/s/ PAUL G. JOUBERT Paul G. Joubert |
Director |
February 26, 2010 |
||
/s/ RICHARD A. D'AMORE Richard A. D'Amore |
Director |
February 26, 2010 |
||
/s/ GARY E. HAROIAN Gary E. Haroian |
Director |
February 26, 2010 |
||
/s/ KENNETH I. KAITIN, PH.D Kenneth I. Kaitin, Ph.D |
Director |
February 26, 2010 |
||
/s/ DENNIS R. SHAUGHNESSY Dennis R. Shaughnessy |
Director |
February 26, 2010 |
77
Phase Forward Incorporated
Consolidated Financial Statements
F-1
Report of Independent Registered Public Accounting Firm
The
Board of Directors and Stockholders
Phase Forward Incorporated
We have audited the accompanying consolidated balance sheets of Phase Forward Incorporated as of December 31, 2008 and 2009, and the related consolidated statements of income, stockholders' equity and comprehensive income, and cash flows for each of the three years in the period ended December 31, 2009. These financial statements are the responsibility of the Company's management. Our responsibility is to express an opinion on these financial statements based on our audits.
We conducted our audits in accordance with the standards of the Public Company Accounting Oversight Board (United States). Those standards require that we plan and perform the audit to obtain reasonable assurance about whether the financial statements are free of material misstatement. An audit includes examining, on a test basis, evidence supporting the amounts and disclosures in the financial statements. An audit also includes assessing the accounting principles used and significant estimates made by management, as well as evaluating the overall financial statement presentation. We believe that our audits provide a reasonable basis for our opinion.
In our opinion, the financial statements referred to above present fairly, in all material respects, the consolidated financial position of Phase Forward Incorporated at December 31, 2008 and 2009, and the consolidated results of its operations and its cash flows for each of the three years in the period ended December 31, 2009, in conformity with U.S. generally accepted accounting principles.
As discussed in Note 2 to the consolidated financial statements, the Company changed its method of accounting for business combinations with the adoption of the guidance originally issued in FASB Statement No. 141(R), Business Combinations (codified in FASB ASC Topic 805, Business Combinations), effective January 1, 2009.
We also have audited, in accordance with the standards of the Public Company Accounting Oversight Board (United States), Phase Forward Incorporated's internal control over financial reporting as of December 31, 2009, based on criteria established in Internal Control-Integrated Framework issued by the Committee of Sponsoring Organizations of the Treadway Commission and our report dated February 26, 2010 expressed an unqualified opinion thereon.
| /s/ Ernst & Young LLP | ||
| Boston, Massachusetts February 26, 2010 |
F-2
Phase Forward Incorporated
Consolidated Balance Sheets
(in thousands, except per share amounts)
| |
As of December 31, | ||||||||
|---|---|---|---|---|---|---|---|---|---|
| |
2008 | 2009 | |||||||
Assets |
|||||||||
Current assets: |
|||||||||
Cash and cash equivalents |
$ | 131,550 | $ | 41,862 | |||||
Restricted cash, current portion |
500 | — | |||||||
Short-term investments |
27,893 | 67,241 | |||||||
Securities settlement agreement |
— | 4,345 | |||||||
Accounts receivable, net of allowance of $578 and $781 in 2008 and 2009, respectively |
39,999 | 56,034 | |||||||
Acquired future billings, current portion |
1,129 | 172 | |||||||
Deferred set up costs, current portion |
2,393 | 2,786 | |||||||
Prepaid commissions and royalties, current portion |
4,524 | 5,449 | |||||||
Prepaid expenses and other current assets |
4,773 | 6,287 | |||||||
Deferred income taxes, current portion |
12,895 | 9,521 | |||||||
Total current assets |
225,656 | 193,697 | |||||||
Acquired future billings, net of current portion |
962 | 396 | |||||||
Property and equipment, net |
36,615 | 52,840 | |||||||
Deferred set up costs, net of current portion |
1,630 | 2,835 | |||||||
Prepaid commissions and royalties, net of current portion |
4,277 | 5,375 | |||||||
Intangible assets, net of accumulated amortization of $3,624 and $7,332 in 2008 and 2009, respectively |
27,586 | 41,661 | |||||||
Goodwill |
39,125 | 59,027 | |||||||
Deferred income taxes, net of current portion |
7,107 | 5,465 | |||||||
Restricted cash, net of current portion |
962 | 962 | |||||||
Long-term investments |
18,022 | 26,439 | |||||||
Securities settlement agreement |
5,322 | — | |||||||
Other assets |
626 | 1,259 | |||||||
Total assets |
$ | 367,890 | $ | 389,956 | |||||
Liabilities and Stockholders' Equity |
|||||||||
Current liabilities: |
|||||||||
Accounts payable |
$ | 8,895 | $ | 5,909 | |||||
Accrued expenses |
22,686 | 27,050 | |||||||
Leasehold incentive obligation, current portion |
791 | 956 | |||||||
Deferred revenues, current portion |
79,918 | 85,896 | |||||||
Total current liabilities |
112,290 | 119,811 | |||||||
Deferred rent, net of current portion |
564 | 2,115 | |||||||
Leasehold incentive obligation, net of current portion |
7,248 | 7,914 | |||||||
Deferred revenues, net of current portion |
8,600 | 12,478 | |||||||
Other long-term liabilities |
1,515 | 2,310 | |||||||
Total liabilities |
130,217 | 144,628 | |||||||
Commitments and contingencies (Note 9) |
|||||||||
Stockholders' equity: |
|||||||||
Preferred stock, $0.01 par value: |
|||||||||
Authorized—5,000 shares |
|||||||||
Issued—0 shares |
— | — | |||||||
Common stock, $0.01 par value: |
|||||||||
Authorized—100,000 shares |
|||||||||
Issued—42,986 and 43,577 shares in 2008 and 2009, respectively |
430 | 436 | |||||||
Additional paid-in capital |
283,676 | 296,572 | |||||||
Treasury stock, 37 and 980 shares at cost |
(111 | ) | (14,147 | ) | |||||
Accumulated other comprehensive (loss) income |
(672 | ) | 71 | ||||||
Accumulated deficit |
(45,650 | ) | (37,604 | ) | |||||
Total stockholders' equity |
237,673 | 245,328 | |||||||
Total liabilities and stockholders' equity |
$ | 367,890 | $ | 389,956 | |||||
See accompanying notes.
F-3
Phase Forward Incorporated
Consolidated Statements of Income
(in thousands, except per share amounts)
| |
Year Ended December 31, | ||||||||||
|---|---|---|---|---|---|---|---|---|---|---|---|
| |
2007 | 2008 | 2009 | ||||||||
Revenues: |
|||||||||||
License |
$ | 48,784 | $ | 52,704 | $ | 59,837 | |||||
Service |
85,505 | 117,480 | 153,420 | ||||||||
Total revenues |
134,289 | 170,184 | 213,257 | ||||||||
Costs of revenues: |
|||||||||||
License(2) |
2,361 | 2,715 | 2,519 | ||||||||
Service(1), (2) |
53,098 | 70,225 | 89,916 | ||||||||
Total cost of revenues |
55,459 | 72,940 | 92,435 | ||||||||
Gross margin: |
|||||||||||
License |
46,423 | 49,989 | 57,318 | ||||||||
Service |
32,407 | 47,255 | 63,504 | ||||||||
Total gross margin |
78,830 | 97,244 | 120,822 | ||||||||
Operating expenses: |
|||||||||||
Sales and marketing(1), (2) |
25,209 | 28,021 | 33,750 | ||||||||
Research and development(1) |
20,116 | 25,500 | 37,526 | ||||||||
General and administrative(1), (2) |
20,220 | 26,821 | 36,067 | ||||||||
In-process research and development |
300 | — | — | ||||||||
Impairment of intangible assets |
— | — | 2,293 | ||||||||
Lease exit costs |
— | 527 | — | ||||||||
Total operating expenses |
65,845 | 80,869 | 109,636 | ||||||||
Income from operations |
12,985 | 16,375 | 11,186 | ||||||||
Other income (expense): |
|||||||||||
Interest income |
7,081 | 5,863 | 1,744 | ||||||||
Other, net |
(35 | ) | (1,039 | ) | 513 | ||||||
Total other income, net |
7,046 | 4,824 | 2,257 | ||||||||
Income before (benefit from) provision for income taxes |
20,031 | 21,199 | 13,443 | ||||||||
(Benefit from) provision for income taxes |
(9,170 | ) | 7,354 | 5,397 | |||||||
Net income |
$ | 29,201 | $ | 13,845 | $ | 8,046 | |||||
Net income per share applicable to common stockholders: |
|||||||||||
Basic |
$ | 0.76 | $ | 0.33 | $ | 0.19 | |||||
Diluted |
$ | 0.72 | $ | 0.32 | $ | 0.18 | |||||
Weighted average number of common shares used in net income per share calculations: |
|||||||||||
Basic |
38,642 | 42,092 | 42,663 | ||||||||
Diluted |
40,739 | 43,942 | 44,437 | ||||||||
- (1)
- Amounts include stock-based compensation expense, as follows:
Costs of service revenues |
$ | 702 | $ | 1,618 | $ | 2,018 | ||||
Sales and marketing |
1,061 | 1,377 | 2,078 | |||||||
Research and development |
813 | 1,182 | 3,750 | |||||||
General and administrative |
3,002 | 4,168 | 5,451 |
- (2)
- Amounts include amortization expense of acquired intangible assets, as follows:
Cost of license revenues |
$ | 403 | $ | 792 | $ | 765 | ||||
Cost of service revenues |
— | 61 | 1,096 | |||||||
Sales and marketing |
464 | 693 | 1,744 | |||||||
General and administrative |
— | 34 | 103 |
See accompanying notes.
F-4
Phase Forward Incorporated
Consolidated Statements of Stockholders' Equity
and Comprehensive Income
(in thousands, except per share
amounts)
| |
Common Stock | |
||||||||||
|---|---|---|---|---|---|---|---|---|---|---|---|---|
| |
Number of Shares |
$0.01 Par Value |
Additional Paid-in Capital |
|||||||||
Balance at December 31, 2006 |
35,529 | $ | 355 | $ | 176,545 | |||||||
Foreign currency translation adjustment |
— | — | — | |||||||||
Issuance of common stock under employee stock-based compensation plans |
880 | 9 | 3,370 | |||||||||
Issuance of common stock under employee stock purchase plan |
16 | — | 290 | |||||||||
Forfeitures of restricted stock awards |
(26 | ) | — | — | ||||||||
Issuance of common stock under public offering, net of costs |
6,325 | 64 | 89,086 | |||||||||
Stock-based compensation expense |
— | — | 5,578 | |||||||||
Net income |
— | — | — | |||||||||
Total comprehensive income |
||||||||||||
Balance at December 31, 2007 |
42,724 |
428 |
274,869 |
|||||||||
Foreign currency translation adjustment |
— | — | — | |||||||||
Issuance of common stock under employee stock-based compensation plans |
275 | 3 | 1,673 | |||||||||
Issuance of common stock under employee stock purchase plan |
34 | — | 511 | |||||||||
Forfeitures of restricted stock awards |
(7 | ) | — | — | ||||||||
Withholding taxes in connection with restricted stock |
— | — | (1,723 | ) | ||||||||
Retirement of restricted stock awards |
(87 | ) | (1 | ) | 1 | |||||||
Restricted stock units issued |
47 | — | — | |||||||||
Stock-based compensation expense |
— | — | 8,345 | |||||||||
Net income |
— | — | — | |||||||||
Total comprehensive income |
||||||||||||
Balance at December 31, 2008 |
42,986 |
430 |
283,676 |
|||||||||
Purchase of treasury stock |
— | — | — | |||||||||
Foreign currency translation adjustment |
— | — | — | |||||||||
Issuance of common stock under employee stock-based compensation plans |
372 | 4 | 2,038 | |||||||||
Issuance of common stock under employee stock purchase plan |
33 | — | 451 | |||||||||
Forfeitures of restricted stock awards |
(4 | ) | — | — | ||||||||
Withholding taxes in connection with restricted stock |
— | — | (2,888 | ) | ||||||||
Retirement of restricted stock awards |
(79 | ) | (1 | ) | 1 | |||||||
Restricted stock units issued |
269 | 3 | (3 | ) | ||||||||
Stock-based compensation expense |
— | — | 13,297 | |||||||||
Net income |
— | — | — | |||||||||
Total comprehensive income |
||||||||||||
Balance at December 31, 2009 |
43,577 |
$ |
436 |
$ |
296,572 |
|||||||
F-5
Phase Forward Incorporated
Consolidated Statements of Stockholders' Equity
and Comprehensive Income (Continued)
(in thousands, except
per share amounts)
| |
Treasury Stock |
Accumulated Other Comprehensive Income (Loss) |
Accumulated Deficit |
Total Stockholders' Equity |
Comprehensive Income |
|||||||||||||
|---|---|---|---|---|---|---|---|---|---|---|---|---|---|---|---|---|---|---|
Balance at December 31, 2006 |
$ | (111 | ) | $ | (72 | ) | $ | (88,696 | ) | $ | 88,021 | $ | — | |||||
Foreign currency translation adjustment |
— | 818 | — | 818 | 818 | |||||||||||||
Issuance of common stock under employee stock-based compensation plans |
— | — | — | 3,379 | — | |||||||||||||
Issuance of common stock under employee stock purchase plan |
— | — | — | 290 | — | |||||||||||||
Forfeitures of restricted stock awards |
— | — | — | — | — | |||||||||||||
Issuance of common stock under public offering, net of costs |
— | — | — | 89,150 | — | |||||||||||||
Stock-based compensation expense |
— | — | — | 5,578 | — | |||||||||||||
Net income |
— | — | 29,201 | 29,201 | 29,201 | |||||||||||||
Total comprehensive income |
$ | 30,019 | ||||||||||||||||
Balance at December 31, 2007 |
(111 |
) |
746 |
(59,495 |
) |
216,437 |
||||||||||||
Foreign currency translation adjustment |
— | (1,418 | ) | — | (1,418 | ) | (1,418 | ) | ||||||||||
Issuance of common stock under employee stock-based compensation plans |
— | — | — | 1,676 | — | |||||||||||||
Issuance of common stock under employee stock purchase plan |
— | — | — | 511 | — | |||||||||||||
Forfeitures of restricted stock awards |
— | — | — | — | — | |||||||||||||
Withholding taxes in connection with restricted stock |
— | — | — | (1,723 | ) | — | ||||||||||||
Retirement of restricted stock awards |
— | — | — | — | — | |||||||||||||
Restricted stock units issued |
— | — | — | — | — | |||||||||||||
Stock-based compensation expense |
— | — | — | 8,345 | ||||||||||||||
Net income |
— | — | 13,845 | 13,845 | 13,845 | |||||||||||||
Total comprehensive income |
$ | 12,427 | ||||||||||||||||
Balance at December 31, 2008 |
(111 |
) |
(672 |
) |
(45,650 |
) |
237,673 |
|||||||||||
Purchase of treasury stock |
(14,036 | ) | — | — | (14,036 | ) | — | |||||||||||
Foreign currency translation adjustment |
— | 743 | — | 743 | 743 | |||||||||||||
Issuance of common stock under employee stock-based compensation plans |
— | — | — | 2,042 | — | |||||||||||||
Issuance of common stock under employee stock purchase plan |
— | — | — | 451 | — | |||||||||||||
Forfeitures of restricted stock awards |
— | — | — | — | — | |||||||||||||
Withholding taxes in connection with restricted stock |
— | — | — | (2,888 | ) | — | ||||||||||||
Retirement of restricted stock awards |
— | — | — | — | — | |||||||||||||
Restricted stock units issued |
— | — | — | — | — | |||||||||||||
Stock-based compensation expense |
— | — | — | 13,297 | — | |||||||||||||
Net income |
— | — | 8,046 | 8,046 | 8,046 | |||||||||||||
Total comprehensive income |
$ | 8,789 | ||||||||||||||||
Balance at December 31, 2009 |
$ |
(14,147 |
) |
$ |
71 |
$ |
(37,604 |
) |
$ |
245,328 |
||||||||
See accompanying notes.
F-6
Phase Forward Incorporated
Consolidated Statements of Cash Flows
(in thousands)
| |
Year Ended December 31, | |||||||||||
|---|---|---|---|---|---|---|---|---|---|---|---|---|
| |
2007 | 2008 | 2009 | |||||||||
Operating activities |
||||||||||||
Net income |
$ | 29,201 | $ | 13,845 | $ | 8,046 | ||||||
Adjustments to reconcile net income to net cash provided by operating activities: |
||||||||||||
Depreciation and amortization |
6,928 | 10,198 | 17,068 | |||||||||
Stock-based compensation |
5,578 | 8,345 | 13,297 | |||||||||
In-process research and development fee expense |
300 | — | — | |||||||||
Loss on disposal of fixed assets |
— | 454 | 55 | |||||||||
Amortization of leasehold incentive obligation |
— | (66 | ) | 831 | ||||||||
Provision for allowance for doubtful accounts |
56 | 322 | 311 | |||||||||
Deferred income taxes |
(10,775 | ) | 6,525 | 2,596 | ||||||||
Amortization of discounts or premiums on investments |
43 | (112 | ) | (135 | ) | |||||||
Impairment of intangible assets |
— | — | 2,293 | |||||||||
Change in fair value of investments |
— | 6,028 | (1,598 | ) | ||||||||
Change in fair value of securities settlement agreement |
— | (5,322 | ) | 977 | ||||||||
Other |
42 | — | — | |||||||||
Changes in assets and liabilities: |
||||||||||||
Accounts receivable and acquired future billings |
(5,176 | ) | (2,916 | ) | (12,911 | ) | ||||||
Deferred costs |
(2,450 | ) | (1,925 | ) | (3,365 | ) | ||||||
Prepaid expenses and other current assets |
(1,476 | ) | (651 | ) | (1,680 | ) | ||||||
Accounts payable |
(1,719 | ) | 7,485 | (3,283 | ) | |||||||
Accrued expenses |
6,194 | 3,932 | 2,999 | |||||||||
Deferred revenue |
16,292 | 18,914 | 6,375 | |||||||||
Deferred rent |
(589 | ) | 196 | 1,551 | ||||||||
Net cash provided by operating activities |
42,449 | 65,252 | 33,427 | |||||||||
Investing activities |
||||||||||||
Increase (decrease) in restricted cash |
— | (1,462 | ) | 500 | ||||||||
Proceeds from maturities and sale of short-term and long-term investments |
78,897 | 55,291 | 61,478 | |||||||||
Purchase of short-term and long-term investments |
(100,694 | ) | (57,901 | ) | (107,510 | ) | ||||||
Purchase of property and equipment |
(13,407 | ) | (21,501 | ) | (29,207 | ) | ||||||
Decrease in other assets |
2 | — | — | |||||||||
Cash paid for acquisitions of businesses, net of cash acquired |
(8,891 | ) | (40,848 | ) | (34,732 | ) | ||||||
Net cash used in investing activities |
(44,093 | ) | (66,421 | ) | (109,471 | ) | ||||||
Financing activities |
||||||||||||
Proceeds from issuance of common stock |
92,819 | 2,185 | 2,493 | |||||||||
Withholding taxes in connection with vesting of restricted stock awards |
— | (1,723 | ) | (2,888 | ) | |||||||
Purchase of treasury stock |
— | — | (14,036 | ) | ||||||||
Net cash provided by (used in) financing activities |
92,819 | 462 | (14,431 | ) | ||||||||
Effect of exchange rate changes on cash and cash equivalents |
57 | (1,144 | ) | 787 | ||||||||
Net increase (decrease) increase in cash and cash equivalents |
91,232 | (1,851 | ) | (89,688 | ) | |||||||
Cash and cash equivalents at beginning of year |
42,169 | 133,401 | 131,550 | |||||||||
Cash and cash equivalents at end of year |
133,401 | 131,550 | 41,862 | |||||||||
Short-term and long-term investments at end of year |
49,221 | 45,915 | 93,680 | |||||||||
Total cash, cash equivalents, short-term and long-term investments at end of year |
$ | 182,622 | $ | 177,465 | $ | 135,542 | ||||||
Supplemental disclosure of cash flow information |
||||||||||||
Cash paid for income taxes |
$ | 388 | $ | 1,205 | $ | 2,120 | ||||||
See accompanying notes.
F-7
Phase Forward Incorporated
Consolidated Statements of Cash Flows (Continued)
(in thousands)
| |
Year Ended December 31, | ||||||||||
|---|---|---|---|---|---|---|---|---|---|---|---|
| |
2007 | 2008 | 2009 | ||||||||
Supplemental disclosure of non-cash financing activities |
|||||||||||
Release of valuation allowance |
$ | 16,535 | $ | — | $ | — | |||||
Supplemental disclosure of non-cash investing activities |
|||||||||||
Leasehold improvements directly paid by lessor of new facility |
$ | — | $ | 8,104 | $ | 1,640 | |||||
Supplemental disclosure of cash flows related to acquisitions of businesses (Note 3) |
|||||||||||
Cash paid for acquisitions: |
|||||||||||
Payment of additional cash consideration upon achievement of certain financial targets |
$ | 3,500 | $ | — | $ | — | |||||
Fair value of assets acquired |
306 | 4,672 | 3,300 | ||||||||
Liabilities assumed |
(652 | ) | (2,917 | ) | (7,820 | ) | |||||
Acquired intangible assets |
1,500 | 25,810 | 19,853 | ||||||||
Cost in excess of net assets acquired |
3,943 | 13,718 | 19,431 | ||||||||
In-process research and development expense |
300 | — | — | ||||||||
Cash paid |
8,897 | 41,283 | 34,764 | ||||||||
Less cash acquired |
6 | 435 | 32 | ||||||||
Total cash paid for acquisitions of businesses, net of cash acquired |
$ | 8,891 | $ | 40,848 | $ | 34,732 | |||||
See accompanying notes.
F-8
Phase Forward Incorporated
Notes to Consolidated Financial Statements
(in thousands, except share and per share amounts)
1. Organization and Operations
Phase Forward Incorporated (the "Company" or "Phase Forward") is a provider of an Integrated Clinical Research Suite ("ICRS") of enterprise-level software products, services and hosted solutions for use in its customers' global clinical trial and drug safety monitoring activities. The Company's customers include pharmaceutical, biotechnology and medical device companies, as well as academic institutions, governmental regulatory agencies, contract research organizations ("CROs") and other entities engaged in clinical trial and drug safety monitoring activities. By automating essential elements of the clinical trial and drug safety monitoring processes, the Company believes that its products allow customers to accelerate the market introduction of new medical therapies and corresponding revenues, reduce overall research and development expenditures, enhance existing data quality control efforts, increase drug safety compliance and reduce clinical and economic risk.
The Company has operations in the United States, Australia, Belgium, France, India, Japan, Romania and the United Kingdom.
2. Summary of Significant Accounting Policies
The accompanying consolidated financial statements reflect the application of certain accounting policies as described in this note and elsewhere in the accompanying consolidated financial statements.
The Company believes that a critical accounting policy is one that is both important to the portrayal of the Company's financial condition and results and requires management's most difficult, subjective or complex judgments, often as the result of the need to make estimates about the effect of matters that are inherently uncertain.
Subsequent Events
The Company has evaluated all subsequent events through February 26, 2010, the date these financial statements were issued, and determined that there are no material recognized or unrecognized subsequent events.
Common Stock Repurchase
On February 12, 2010, the Company's Board of Directors authorized the repurchase of up to $25,000 of its common stock, par value $0.01 per share, through a share repurchase program. As authorized by the program, shares may be purchased in the open market or through privately negotiated transactions in a manner consistent with applicable securities laws and regulations, including pursuant to a Rule 10b5-1 plan maintained by the Company. This share repurchase program does not obligate the Company to acquire any specific number of shares and may be extended, suspended or discontinued at any time. All repurchases are expected to be funded from the Company's cash and investment balances. While the Company's Board of Directors has approved the share purchasing guidelines, the timing of the repurchases and the exact number of shares of common stock to be purchased will be determined at the Company management's discretion, and will depend upon on market conditions and other factors, including price, corporate and regulatory requirements and alternative investment opportunities. The repurchase program is currently scheduled to terminate on December 31, 2010.
F-9
Phase Forward Incorporated
Notes to Consolidated Financial Statements (Continued)
Principles of Consolidation
The consolidated financial statements include the accounts of the Company and its wholly owned subsidiaries. All significant intercompany balances and transactions have been eliminated in consolidation.
Management's Estimates and Uncertainties
The preparation of financial statements in conformity with accounting principles generally accepted in the United States requires management to make estimates and assumptions that affect the reported amounts of assets and liabilities and disclosure of contingent assets and liabilities at the date of the financial statements and the reported amounts of revenues and expenses during the reporting periods.
Significant estimates relied upon in preparing these consolidated financial statements include revenue recognition, allowances for doubtful accounts, provisions for losses on uncompleted contracts, expected future cash flows used to evaluate the recoverability of long-lived assets, estimated fair values of long-lived assets used to record impairment charges related to intangible assets and goodwill, amortization periods, expected future cash flows and assumptions used in determining the fair value and related gains (losses) of investments (auction rate securities) and the settlement agreement entered into with respect to the Company's auction rate securities, restructuring and other related charges, contingent liabilities, stock-based compensation expense and the recoverability of the Company's net deferred tax assets and related valuation allowance.
Although the Company regularly assesses these estimates, actual results could differ materially from these estimates. Changes in estimates are recorded in the period in which they become known. The Company bases its estimates on historical experience and various other assumptions that it believes to be reasonable under the circumstances. Actual results may differ from management's estimates if these results differ from historical experience or other assumptions do not turn out to be substantially accurate, even if such assumptions were reasonable when made.
The Company is subject to a number of risks similar to those of other companies of similar size in its industry, including, but not limited to, rapid technological changes, competition, limited number of suppliers, customer concentration, integration of acquisitions, government regulations, management of international activities, protection of proprietary rights, patent litigation and dependence on key individuals.
Revenue Recognition and Deferred Set Up Costs
The Company derives revenues from software licenses and services of its ICRS products which can be purchased on a stand-alone basis. License revenues are derived principally from the sale of term licenses for the following software products offered by the Company: InForm™, Clintrial™, WebSDM™, Empirica™ Trace, Empirica™ Signal, Empirica™ Study and Clinical Development Center. Service revenues are derived principally from the Company's delivery of the hosted solutions of its InForm, Phase Forward IRT ™, Empirica Signal, Empirica Study, WebSDM, OutcomeLogix™ and Covance IVRS/IWRS software products, and consulting services and customer support, including training, for all of the Company's products.
F-10
Phase Forward Incorporated
Notes to Consolidated Financial Statements (Continued)
The components of revenues are as follows:
| |
Year Ended December 31, | |||||||||
|---|---|---|---|---|---|---|---|---|---|---|
| |
2007 | 2008 | 2009 | |||||||
License |
$ | 48,784 | $ | 52,704 | $ | 59,837 | ||||
Application hosting services |
57,563 | 90,784 | 120,366 | |||||||
Consulting services |
13,346 | 13,904 | 19,693 | |||||||
Customer support |
14,596 | 12,792 | 13,361 | |||||||
Total |
$ | 134,289 | $ | 170,184 | $ | 213,257 | ||||
Customers generally have the ability to terminate application hosting, consulting and training service agreements upon 30 days notice. License agreements, multiple element arrangements, including license and service agreements and certain application hosting services can generally be terminated by either party for material breach of obligations not corrected within 30 days after notice of the breach.
The Company recognizes revenues when all of the following conditions are satisfied: (1) there is persuasive evidence of an arrangement; (2) the product or service has been provided to the customer; (3) the collection of fees is probable; and (4) the amount of fees to be paid by the customer is fixed or determinable.
The Company generally enters into software term licenses for its InForm, Clintrial, Empirica Trace and Clinical Development Center products with its customers for 3 to 5 year periods. License agreements for other licensed products are generally for annual or multi-year terms. These arrangements typically include multiple elements: software license, consulting services and customer support. The Company bills its customers in accordance with the terms of the underlying contract. Generally, the Company bills license fees annually in advance for each year of the license term. Payment terms are generally net 30 days.
The Company's software license revenues are earned from the sale of off-the-shelf software requiring no significant modification or customization subsequent to delivery to the customer. Consulting services, which can also be performed by third-party consultants, are deemed to be non-essential to the functionality of the software and typically are for trial configuration, implementation planning, loading of software, building simple interfaces and running test data and documentation of procedures.
Customer support includes training services, telephone support and software maintenance. The Company generally bundles customer support with the software license for the entire term of the arrangement. As a result, the Company generally recognizes revenues for all elements, including consulting services, ratably over the term of the software license and support arrangement. The Company allocates the revenues recognized for these arrangements to the different elements based on management's estimate of the relative fair value of each element. For its term-based licenses, the Company allocates to consulting services, the anticipated service effort and value throughout the term of the arrangement at an amount that would have been allocated had those services been sold separately to the customer. The value of the Company's consulting services sold within a bundled arrangement is equal to the value of consulting services sold on a stand-alone basis, as the activities performed under both types of arrangements are similar in nature. The remaining value is allocated to license and support services, with 10% of this amount allocated to support services. The customer support services rate of 10% for multi-year term-based licenses reflects a significant discount from the rate for customer support services associated with perpetual licenses due to the reduction in the time period during which the customer can utilize the upgrades and enhancements. The Company believes this rate is substantive and represents an amount it believes reasonable to be allocated.
F-11
Phase Forward Incorporated
Notes to Consolidated Financial Statements (Continued)
The Company has allocated the estimated fair value to its multiple element arrangements to provide meaningful disclosures about each of its revenue streams. The costs associated with the consulting and customer support services are expensed as incurred. There are instances in which the Company sells software licenses based on usage levels. These software licenses can be based on estimated usage, in which case the license fee charged to the customer is fixed based on this estimate. When the fee is fixed, the revenues are generally recognized ratably over the contractual term of the arrangement. If the fee is based on actual usage, and therefore variable, the revenues are recognized in the period of use. Revenues from certain follow-on consulting services, which are sold separately to customers with existing software licenses and are not considered part of a multiple element arrangement, are recognized as the services are performed.
The Company continues to sell additional perpetual licenses for the Clintrial, Empirica Trace and Clinical Development Center software products in certain situations to existing customers with the option to purchase customer support, and may in the future do so for new customers based on customer requirements or market conditions. For Clintrial and Empirica Trace products the Company has established vendor specific objective evidence of fair value for the customer support. Accordingly, license revenues are recognized upon delivery of the software and when all other revenue recognition criteria are met. Customer support revenues are recognized ratably over the term of the underlying support arrangement. For Clinical Development Center products vendor specific objective evidence of fair value for the customer support has not been established, and therefore, revenue for the entire agreement is recognized ratably over the term of the underlying support agreement. The Company generates customer support and maintenance revenues from its perpetual license customer base. Training revenues are recognized as earned.
In addition to making InForm, LabPas, Clintrial, WebSDM, Clinical Development Center and Empirica software products available to customers through licenses, the Company offers its InForm, LabPas, WebSDM, Clinical Development Center and Empirica software products as hosted application solutions delivered through a standard Web-browser, with customer support and training services. The Company's Interactive Response Technology and OutcomeLogix solutions are presently available only on a hosted application basis. To date, hosted solutions have been related primarily to InForm and Phase Forward IRT offerings. In the future, the Company may make products that are currently available only through licenses available as hosted applications and products that are currently available only as hosted applications available through licenses.
Revenues resulting from InForm and OutcomeLogix application hosting services consist of three stages for each clinical trial: the first stage involves application set up, including design of electronic case report forms and edit checks, installation and server configuration of the system; the second stage involves application hosting and related support services; and the third stage involves services required to close out, or lock, the database for the clinical trial. Revenues resulting from Phase Forward IRT and Covance IVRS/IWRS application hosting services also consist of three stages for each clinical trial: the first stage involves application set up, including design and set up for the subject randomization and medication inventory management, installation and server configuration of the system; the second stage involves application hosting and related support services; and the third stage involves services required to close out, or lock, the database for the clinical trial. Services provided for the InForm, Phase Forward IRT, OutcomeLogix and Covance IVRS/IWRS products for the first and third stages are provided on a fixed-fee basis based upon the complexity of the trial and system requirements. Services for the second stage are charged separately as a fixed monthly fee. The Company recognizes revenues from all stages of the InForm, Phase Forward IRT, OutcomeLogix and Covance IVRS/IWRS hosting services ratably over the hosting period.
F-12
Phase Forward Incorporated
Notes to Consolidated Financial Statements (Continued)
Fees charged and costs incurred for the trial system design, set up and implementation are deferred until the start of the hosting period and are amortized and recognized ratably over the estimated hosting period. The deferred costs include incremental direct costs with third parties and certain internal direct costs related to the trial and application set up. These costs include salary and benefits associated with direct labor costs incurred during trial set up, as well as third-party subcontract fees and other contract labor costs. Work performed outside the original scope of work is contracted for separately as an additional fee and is generally recognized ratably over the remaining term of the hosting period. Fees for the first and third stages of the service are billed based upon milestones. Fees for application hosting and related services in the second stage are generally billed quarterly in advance. Bundled into this revenue element are revenues attributable to the software license used by the customer.
Revenues resulting from hosting services for the Empirica Signal, Empirica Study and WebSDM products consist of installation and server configuration, application hosting and related support services. Services for this offering are generally charged a monthly fixed fee. Revenues are recognized ratably over the period of the service.
In the event that an application hosting customer cancels its related statement of work, all deferred revenues are recognized and all deferred set up costs are expensed. In addition, certain termination related fees may be charged and if so, such fees are recognized in the period of termination.
Provisions for estimated losses on uncompleted contracts are made on a contract-by-contract basis and are recognized in the period in which such losses become probable and can be reasonably estimated.
The Company deferred $3,423, $4,469 and $5,233 of set up costs and amortized $2,663, $3,855 and $3,635 of set up costs during the years ended December 31, 2007, 2008 and 2009, respectively. The amortization of deferred set up costs is a component of costs of service revenues.
The Company may also enter into arrangements to provide consulting services separate from a license arrangement. In these situations, revenue is recognized on either a time-and-materials basis or using the proportional performance method. If the Company is not able to produce reasonably dependable estimates, revenue is recognized upon completion of the project and final acceptance from the customer. If significant uncertainties exist about project completion or receipt of payment, the revenue is deferred until the uncertainty is resolved. Provisions for estimated losses on contracts are recorded during the period in which they are identified.
Deferred revenues represent amounts billed or cash received in advance of revenue recognition.
The Company included $776, $811 and $885 of reimbursable out-of-pocket expenses in service revenues and cost of service revenues in the years ended December 31, 2007, 2008 and 2009, respectively.
Internal Use Software and Website Development Costs
The Company capitalizes qualifying computer software costs, which are incurred during the application development stage, and amortizes them over the software's estimated useful life. The Company capitalized $951 and $1,457 in the years ended December 31, 2008 and 2009, respectively, related to Company-wide financial systems, of which certain portions became operational in September 2009 and October 2009, and outside software development costs associated with the Company's hosting operation, which became operational in March 2009. Capitalized amounts for operational systems and hosting operations include software and direct external implementation costs and are classified as "Property and Equipment, net" in the accompanying consolidated financial statements.
F-13
Phase Forward Incorporated
Notes to Consolidated Financial Statements (Continued)
The Company-wide financial system is being amortized over five years while the outside software development costs associated with the Company's hosting operation is being amortized over three years. Amortization expense was $148, $67 and $200 during the years ended December 31, 2007, 2008 and 2009, respectively.
Computer Software Development Costs and Research and Development Expenses
The Company sells products in a market that is subject to rapid technological change, new product development and changing customer needs. Accordingly, the Company has evaluated the establishment of technological feasibility of its products and concluded that technological feasibility is not established until the development stage of the product is nearly complete. The Company defines technological feasibility as the completion of a working model. The time period during which costs could be capitalized, from the point of reaching technological feasibility until the time of general product release, is very short, and consequently, the amounts that could be capitalized are not material to the Company's financial position or results of operations. Therefore, the Company has charged all such costs to research and development expense in the period incurred.
Prepaid Sales Commissions and Royalties
For arrangements where revenues are recognized over the relevant contract period, the Company defers related commissions paid to its direct sales force and software license royalties paid to third parties, and amortizes these expenses over the period in which the related revenues are recognized.
Commission payments are nonrefundable unless the sales representatives do not achieve their specific quota, amounts due from a customer are determined to be uncollectible or if the customer subsequently changes or terminates the level of service, in which case commissions paid are recoverable by the Company. The Company deferred $9,381, $9,445 and $9,778 of commissions and amortized to sales and marketing expense $7,455, $8,642 and $7,778 during the years ended December 31, 2007, 2008 and 2009, respectively.
The Company's royalty obligation is based upon the license and customer support revenues earned for certain products in an arrangement. The Company has the right to recover the royalties in the event the arrangement is cancelled. The Company deferred $2,497, $2,622 and $2,499 of royalties and amortized to cost of revenues $2,591, $2,696 and $2,476 during the years ended December 31, 2007, 2008 and 2009, respectively.
Warranties and Indemnification
The Company's software license arrangements and hosting services are typically warranted to perform in a manner consistent with general industry standards that are reasonably applicable and substantially in accordance with the Company's product documentation under normal use and circumstances. The Company's arrangements also include certain provisions for indemnifying customers against liabilities if its products or services infringe a third party's intellectual property rights. See the discussion of possible indemnification obligations in Note 9.
The Company has entered into service level agreements with some of its hosted application customers warranting certain levels of uptime reliability and permitting those customers to receive credits against monthly hosting fees or terminate their agreements in the event that the Company fails to meet those levels.
F-14
Phase Forward Incorporated
Notes to Consolidated Financial Statements (Continued)
To date, the Company has not incurred any material costs as a result of such indemnifications and has not accrued any liabilities related to such obligations in the accompanying consolidated financial statements.
Net Income Per Share
Basic net income per common share for all periods presented was determined by dividing net income applicable to common stockholders by the weighted average number of common shares outstanding during the period. Weighted average shares outstanding exclude unvested restricted common stock. Diluted net income per share includes the effects of all dilutive, potentially issuable common shares using the treasury stock method.
The calculation of basic and diluted net income per share is as follows:
| |
Year Ended December 31, | ||||||||||
|---|---|---|---|---|---|---|---|---|---|---|---|
| |
2007 | 2008 | 2009 | ||||||||
Numerator: |
|||||||||||
Net income applicable to common stockholders |
$ | 29,201 | $ | 13,845 | $ | 8,046 | |||||
Denominator: |
|||||||||||
Weighted average common shares outstanding |
39,569,061 | 42,815,398 | 43,135,149 | ||||||||
Less weighted average unvested restricted common shares outstanding |
(927,374 | ) | (723,208 | ) | (471,915 | ) | |||||
Basic weighted average common shares outstanding |
38,641,687 | 42,092,190 | 42,663,234 | ||||||||
Dilutive effect of common stock options |
1,683,927 | 1,299,620 | 1,042,831 | ||||||||
Dilutive effect of unvested restricted common stock awards and units |
413,315 | 550,553 | 731,329 | ||||||||
Diluted weighted average common shares outstanding |
40,738,929 | 43,942,363 | 44,437,393 | ||||||||
Net income per share applicable to common stockholders: |
|||||||||||
Basic |
$ | 0.76 | $ | 0.33 | $ | 0.19 | |||||
Diluted |
$ | 0.72 | $ | 0.32 | $ | 0.18 | |||||
The following common share equivalents and unvested restricted shares have been excluded from the computation of diluted weighted average common shares outstanding as of December 31, 2007, 2008 and 2009 as their effect would have been anti-dilutive.
| |
As of December 31, | |||||||||
|---|---|---|---|---|---|---|---|---|---|---|
| |
2007 | 2008 | 2009 | |||||||
Unvested restricted common stock awards and units |
64,720 | 21,643 | 63,875 | |||||||
F-15
Phase Forward Incorporated
Notes to Consolidated Financial Statements (Continued)
Foreign Currency Translation
The financial statements of the Company's foreign subsidiaries are translated into U.S. dollars, which is the Company's reporting currency. The functional currency of the Company's subsidiaries in Australia, Belgium, France, India, Japan, Romania and the United Kingdom are the local currencies of those countries. Accordingly, the assets and liabilities of the Company's foreign subsidiaries are translated into U.S. dollars using the exchange rate in effect at each balance sheet date. Revenue and expense accounts are translated using an average rate of exchange during the period. Gains and losses arising from transactions denominated in foreign currencies are primarily related to intercompany accounts that have been determined to be temporary in nature and cash accounts and accounts receivable denominated in non-functional currencies. The Company has recorded foreign currency losses of approximately $(42), $(554) and $(110) for the years ended December 31, 2007, 2008 and 2009, respectively. Such losses are included in other income in the accompanying consolidated statements of income.
Foreign currency translation adjustments are accumulated as a separate component of other comprehensive income as a separate component of stockholders' equity.
Derivative Instruments
The Company has adopted the accounting and disclosure requirements whereby all derivative instruments are recorded on the balance sheet at their fair value. The Company enters into forward foreign exchange contracts to hedge transactions denominated in currencies other than the functional currencies of the Company or its subsidiaries against currency fluctuations. These forward contracts are used to reduce the Company's risk associated with foreign currency exchange rate changes, as the gains or losses on these contracts are intended to offset the gains or losses on the underlying exposures. The Company does not engage in foreign currency speculation. See Note 12 for further discussion on the forward foreign exchange contracts.
Cash, Cash Equivalents, Short-term and Long-term Investments
Securities that the Company has the intent and ability to hold to maturity are reported at amortized cost and are classified as held-to-maturity. Securities for which it is not the Company's intent to hold to maturity are classified as either available-for-sale securities or trading securities. Available-for-sale securities are reported at fair value, with temporary unrealized gains/(losses) excluded from earnings and reported in a separate component of stockholders' equity and other than temporary unrealized losses included in earnings. Trading securities are reported at fair value, with unrealized gains/(losses) included in earnings. The Company considers all highly liquid investments with original maturities of 90 days or less at the time of purchase to be cash equivalents and investments with original maturities of between 91 days and one year to be short-term investments. The Company considers investments with maturities greater than one year to be long-term investments. All securities, with the exception of auction rate securities ("ARS"), are classified as held-to-maturity securities. The ARS are debt instruments issued by various municipalities throughout the United States. In prior periods and up through the execution of the signed settlement agreement with UBS AG ("UBS") in November 2008 as further discussed below, the ARS were classified as available-for-sale because it was the Company's intent not to hold them to maturity. Upon the execution of the settlement agreement with UBS, the Company elected to make a one-time transfer of the ARS from available-for-sale securities to trading securities. Accordingly, on a prospective basis, all unrealized gains/(losses) for these trading securities have been included in earnings.
F-16
Phase Forward Incorporated
Notes to Consolidated Financial Statements (Continued)
Cash, cash equivalents, short-term and long-term investments as of December 31, 2008 and 2009 consist of the following:
| |
December 31, 2008 | |
||||||||||
|---|---|---|---|---|---|---|---|---|---|---|---|---|
Description
|
Contracted Maturity |
Amortized Cost |
Fair Market Value |
Balance Per Balance Sheet |
||||||||
Cash |
Demand | $ | 22,487 | $ | 22,487 | $ | 22,487 | |||||
Money market funds |
Demand | 109,063 | 109,063 | 109,063 | ||||||||
Total cash and cash equivalents |
$ | 131,550 | $ | 131,550 | $ | 131,550 | ||||||
U.S. agency notes |
236 days | $ | 2,000 | $ | 2,000 | $ | 2,000 | |||||
Municipal bonds |
1 day | 1,000 | 1,000 | 1,000 | ||||||||
Corporate bonds |
127 days | 24,893 | 24,884 | 24,893 | ||||||||
Total short-term investments |
$ | 27,893 | $ | 27,884 | $ | 27,893 | ||||||
Auction rate securities |
26 years | $ | 24,050 | $ | 18,022 | $ | 18,022 | |||||
Total long-term investments |
$ | 24,050 | $ | 18,022 | $ | 18,022 | ||||||
| |
December 31, 2009 | |
||||||||||
|---|---|---|---|---|---|---|---|---|---|---|---|---|
Description
|
Contracted Maturity |
Amortized Cost |
Fair Market Value |
Balance Per Balance Sheet |
||||||||
Cash |
Demand | $ | 19,367 | $ | 19,367 | $ | 19,367 | |||||
Money market funds |
Demand | 22,495 | 22,495 | 22,495 | ||||||||
Total cash and cash equivalents |
$ | 41,862 | $ | 41,862 | $ | 41,862 | ||||||
U.S. agency notes |
138 days | $ | 22,348 | $ | 22,413 | $ | 22,348 | |||||
Corporate bonds |
177 days | 25,523 | 25,678 | 25,523 | ||||||||
Auction rate securities |
181 days | 23,800 | 19,370 | 19,370 | ||||||||
Total short-term investments |
$ | 71,671 | $ | 67,461 | $ | 67,241 | ||||||
U.S. agency notes |
499 days | $ | 13,742 | $ | 14,577 | $ | 13,742 | |||||
Corporate bonds |
460 days | 12,697 | 12,898 | 12,697 | ||||||||
Total long-term investments |
$ | 26,439 | $ | 27,475 | $ | 26,439 | ||||||
To date the Company has no material realized gains or losses from the sale of cash equivalents or short-term investments.
As of December 31, 2008 and 2009, the Company held ARS totaling $24,050 and $23,800, respectively, at par value, which were classified as long-term investments and short-term investments, respectively, in the accompanying consolidated balance sheets, and which are recorded at fair value. These ARS are debt instruments issued by various states throughout the United States to finance student loans. The types of ARS that the Company owns are backed by student loans, 95% of which are guaranteed under the Federal Family Education Loan Program, and all have credit ratings of AAA (or equivalent) from a recognized rating agency. Historically, the carrying value of ARS approximated fair value due to the frequent resetting of the interest rates. With the liquidity issues experienced in the global credit and capital markets, the Company's ARS have experienced multiple failed auctions. While the Company continues to earn and receive interest on these investments at the maximum contractual rate, the estimated fair value of these ARS no longer approximates par value.
F-17
Phase Forward Incorporated
Notes to Consolidated Financial Statements (Continued)
In November 2008, the Company accepted an offer from and entered into an agreement (the "Agreement") with UBS with respect to all of the Company's ARS held at that time. As a UBS client who holds ARS, the Company will receive certain rights, which will entitle the Company to sell ARS to UBS affiliates during the period from June 30, 2010 to July 2, 2012 for a price equal to par value. In accepting the Agreement, the Company granted UBS the authority to sell or auction the ARS at par at any time up until the expiration date of the Agreement and released UBS from any claims relating to the marketing and sale of ARS. UBS obligations under the Agreement are not secured by its assets and do not require UBS to obtain any financing to support its performance obligations under the Agreement. UBS has disclaimed any assurance that it will have sufficient financial resources to satisfy its obligations under the Agreement. If UBS has insufficient funding to buy back the ARS and the auction process continues to fail, the Company may incur further losses on the carrying value of the ARS.
The Company performed a fair value calculation of these ARS as of December 31, 2008 and 2009. Fair value was determined using a secondary market indications method (direct discounts) and a discounted cash flow method as recent auctions of these securities were not successful, resulting in the Company continuing to hold these securities and issuers paying interest at the maximum contractual rate. This valuation technique considers the following: time left to maturity, the rate of interest paid on the securities, the amount of principal to be repaid to the holders of the securities; the credit worthiness of the issuer and guarantors (if any) and the sufficiency of the collateral; trading characteristics of the securities; ability to borrow against the ARS; evidence from secondary market sales; and the market-clearing yield for the securities. Based upon the valuation performed, the Company concluded that the fair value of these ARS at December 31, 2008 was $18,022, a decline of $6,028 from par value. Since the Company's signed Agreement with UBS indicates that the Company intends to sell the ARS to UBS affiliates before their stated maturity dates under the terms of the ARS, the decline in fair value is deemed other-than-temporary. Accordingly, the Company recorded a loss on these securities of $6,028 in the accompanying consolidated statement of income for the year ended December 31, 2008 as it was deemed to be other-than-temporary.
As of December 31, 2009, the Company concluded that the fair value of these ARS increased to $19,370, and therefore, recorded the change in fair value of these securities from December 31, 2008 of $1,598 in the accompanying consolidated statement of income for the year ended December 31, 2009. During the year ended December 31, 2009, $250 of the Company's ARS were called by the respective issuers at par value. As of December 31, 2009, it remained the Company's intent to sell the ARS on June 30, 2010 in accordance with its rights under the Agreement. Accordingly, the ARS were reclassified from long-term investments to short-term investments in the accompanying consolidated balance sheet as of December 31, 2009.
Fair value of the Company's put option was determined using a discounted cash flow method, which considered the following factors: term of the agreement, the availability to borrow against the ARS, the creditworthiness of UBS and current market interest rates. Based on the valuation performed, the Company concluded that the fair value of the put option was $5,322 as of December 31, 2008. Accordingly, a gain of $5,322 was recorded in the accompanying consolidated statement of income for the year ended December 31, 2008 with a corresponding long-term asset, "securities settlement agreement", in the consolidated balance sheet at December 31, 2008. Based on the valuation performed as of December 31, 2009 the Company concluded that the fair market value of the securities settlement agreement was $4,345, resulting in a decrease in fair value of $977. Accordingly, the Company recorded a loss of $977 in the accompanying consolidated statement of income for the year ended December 31, 2009. As of December 31, 2009, it remained the Company's intent to sell the ARS on June 30, 2010 in accordance with its rights under the settlement agreement and, accordingly, the Company reclassified the fair value of the "securities settlement agreement" from long-term-assets to current assets in the accompanying consolidated balance sheet as of December 31, 2009.
Refer to Note 13 for further discussion on Fair Value Measurements.
F-18
Phase Forward Incorporated
Notes to Consolidated Financial Statements (Continued)
Property and Equipment
Property and equipment are stated at cost. Depreciation and amortization are computed using the straight-line method based on the estimated useful lives of the related assets as follows:
Asset Classification
|
Estimated Useful Life | |
|---|---|---|
Office and computer equipment |
3-5 years | |
Purchased computer software |
3-5 years | |
Furniture and fixtures |
5-7 years | |
Leasehold improvements |
Life of lease |
Property and equipment consists of the following:
| |
Year Ended December 31, | ||||||
|---|---|---|---|---|---|---|---|
| |
2008 | 2009 | |||||
Office and computer equipment |
$ | 31,714 | $ | 38,403 | |||
Purchased computer software |
16,105 | 25,424 | |||||
Furniture and fixtures |
5,520 | 6,198 | |||||
Leasehold improvements |
13,650 | 18,852 | |||||
|
66,989 | 88,877 | |||||
Less accumulated depreciation |
(30,374 | ) | (36,037 | ) | |||
Property and equipment, net |
$ | 36,615 | $ | 52,840 | |||
Depreciation expense for the years ended December 31, 2007, 2008, and 2009 was $6,061, $8,629 and $13,367, respectively. Expenditures for maintenance and repairs are charged to expense as incurred, whereas major betterments are capitalized as additions to property and equipment.
Impairment of Long-Lived Assets
The Company reviews long-lived assets and certain identifiable intangible assets subject to amortization for impairment whenever events or changes in circumstances indicate that the carrying amount of an asset may not be recoverable. During this review, the Company reevaluates the significant assumptions used in determining the original cost and estimated lives of long-lived assets. Although the assumptions may vary from asset to asset, they generally include operating results, changes in the use of the asset, cash flows and other indicators of value. Management then determines whether the remaining useful life continues to be appropriate or whether there has been an impairment of long-lived assets based primarily upon whether expected future undiscounted cash flows are sufficient to support the assets' recovery. If impairment exists, the Company would adjust the carrying value of the asset to fair value, generally determined by a discounted cash flow analysis.
For the years ended December 31, 2007, 2008 and 2009, the Company has not identified any impairment of its long-lived assets or amortizable intangible assets. (See below for a discussion of the Clarix trade name impairment).
F-19
Phase Forward Incorporated
Notes to Consolidated Financial Statements (Continued)
Goodwill and Intangible Assets
Goodwill and intangible assets that have indefinite useful lives are not amortized but are evaluated for impairment annually or whenever events or changes in circumstances indicate that the carrying value may not be recoverable. Intangible assets that have finite lives are amortized over their useful lives. Intangible assets that are subject to amortization are reviewed for impairment in accordance with the provisions discussed above.
In assessing the recoverability of goodwill and other intangible assets, the Company must make assumptions regarding the estimated future cash flows and other factors to determine the fair value of these assets. If these estimates or their related assumptions change in the future, the Company may be required to record impairment charges against these assets in the reporting period in which the impairment is determined. The Company has determined that it has one reporting unit based on the Company's organizational structure.
For intangible assets that have indefinite useful lives, the impairment evaluation includes a comparison of the carrying value of the intangible asset to that intangible asset's fair value. The fair value of the asset is based upon the net present value of future cash flows, including a terminal value calculation. If the intangible asset's estimated fair value exceeds its carrying value, no impairment exists. If the fair value of the intangible asset does not exceed its carrying value, then an impairment loss shall be recognized in an amount equal to that excess.
For goodwill, the impairment evaluation includes a comparison of the carrying value of the reporting unit for which goodwill and other intangible assets are attributable, to that reporting unit's fair value. The fair value of the reporting unit is based upon the net present value of future cash flows, including a terminal value calculation. If the reporting unit's estimated fair value exceeds the reporting unit's carrying value, no impairment of goodwill exists. If the fair value of the reporting unit does not exceed its carrying value, then further analysis would be required to determine the amount of the impairment, if any.
The Company uses a two-phase process for impairment testing of goodwill. The first phase screens for impairment at the reporting unit level, while the second phase, if necessary, measures the impairment, if any, of goodwill at the reporting unit level.
If the Company determines that there is an impairment in either an intangible asset or goodwill, the Company will be required to record an impairment charge in the reporting period in which the impairment is determined.
Consistent with prior years, the Company conducted its annual impairment test of goodwill during the fourth quarter of its fiscal year. Based on the results of the first step of the goodwill impairment test as of October 1, 2009, the annual goodwill impairment test date, the Company has determined that no impairment had taken place during the year ended December 31, 2009, as the carrying amount of the Company's reporting unit was less than the fair value and, therefore, the second step of the goodwill impairment test was not necessary. Additionally, the Company did not identify any indicators of impairment through December 31, 2009 and was not required to perform an updated analysis at December 31, 2009.
The Company conducted its annual impairment test of indefinite lived intangible assets during the fourth quarter of its fiscal year. Based on the results, the Company determined that the value of the trade name acquired from Clarix, previously recorded as an asset with an indefinite useful life, was impaired. As a result, the Company recorded an impairment charge of $2,293 in the consolidated statement of income for the year ended December 31, 2009.
F-20
Phase Forward Incorporated
Notes to Consolidated Financial Statements (Continued)
Additionally, the Company also determined that the trade name no longer had an indefinite useful life. Accordingly, the Company determined that the remaining useful life of the Clarix trade name was 4 years and began to amortize this intangible asset beginning the fourth quarter of 2009.
Concentration of Credit Risk
Except as follows, the Company has no significant off-balance-sheet risk or credit risk concentrations. Financial instruments that subject the Company to potential credit risks are principally cash and cash equivalents, short and long-term investments, accounts receivable, forward foreign exchange contracts and the UBS securities settlement agreement. The Company maintains its cash, cash equivalents, short and long-term investments and forward foreign exchange contracts with credit worthy financial institutions. Concentrated credit risk with respect to accounts receivable is limited to large, creditworthy customers. The Company's customers are principally located in the United States, Europe and Asia. Although the Company is directly affected by the overall financial condition of the pharmaceutical, biotechnology and medical device industries, management does not believe significant credit risk exists as of December 31, 2009. The Company has not experienced significant losses related to receivables from individual customers or groups of customers in any specific industry or geographic area. The Company maintains an allowance for doubtful accounts based on accounts past due according to contractual terms and historical collection experience. Actual losses when incurred are charged to the allowance. The Company's losses related to collection of accounts receivable have consistently been within management's expectations. Due to these factors, no additional credit risk beyond amounts provided for collection losses, which the Company reevaluates on a monthly basis based on specific review of receivable agings and the period that any receivables are beyond the standard payment terms, is believed by management to be probable in the Company's accounts receivable. The Company does not require collateral or enter into master netting agreements to mitigate credit risk.
The following table summarizes the number of customers who individually comprise greater than 10% of total revenue and their aggregate percentage of the Company's total revenue.
| |
Revenue | |||||||
|---|---|---|---|---|---|---|---|---|
| |
Number of Customers |
Percent of Total Revenue |
||||||
Year ended December 31: |
||||||||
2007 |
1 | 15 | % | |||||
2008 |
1 | 12 | ||||||
2009 |
— | — | ||||||
As of December 31, 2007, 2008 and 2009, no customer represented greater than 10% of total accounts receivable.
The Company serves all of its hosting customers from third-party Web hosting facilities located in the United States and Europe. The Company does not control the operation of these facilities, and they are vulnerable to damage or interruption. The Company maintains redundant systems that can be used to provide service in the event the third-party Web hosting facilities become unavailable, although in such circumstances, the Company's service may be interrupted during the transition.
F-21
Phase Forward Incorporated
Notes to Consolidated Financial Statements (Continued)
The following table summarizes activity in the Company's allowance for doubtful accounts.
| |
Year Ended December 31, | |||||||||
|---|---|---|---|---|---|---|---|---|---|---|
| |
2007 | 2008 | 2009 | |||||||
Balance at beginning of period |
$ | 384 | $ | 270 | $ | 578 | ||||
Provision for allowance for doubtful accounts |
56 | 322 | 311 | |||||||
Write-offs |
(170 | ) | (14 | ) | (108 | ) | ||||
Balance at end of period |
$ | 270 | $ | 578 | $ | 781 | ||||
Disclosure of Fair Value of Financial Instruments
SFAS No. 107, Disclosure of Fair Value of Financial Instruments (subsequently this standard has been codified under FASB ASC 825, Financial Instruments), requires disclosure about fair value of financial instruments. Financial instruments consist of cash equivalents, short-term and long-term investments, securities settlement agreement, accounts receivable, accounts payable and forward foreign exchange contracts. The estimated fair value of these financial instruments approximates their carrying amount due to the short-term nature of these investments.
Comprehensive Income
SFAS No. 130, Reporting Comprehensive Income (subsequently this standard has been codified under FASB ASC 220, Comprehensive Income), establishes standards for reporting and displaying comprehensive income and its components in the consolidated financial statements. Comprehensive income is defined as the change in equity of a business enterprise during a period from transactions and other events and circumstances from non-owner sources. Other than reported net income, comprehensive income solely consists of foreign currency translation adjustments and is disclosed in the accompanying consolidated statements of stockholders' equity and comprehensive income.
Stock-Based Compensation
On January 1, 2006, the Company started to recognize expense related to the fair value of stock-based compensation awards. Management elected to use the modified prospective transition method and therefore has not restated the Company's financial results for prior periods. Under this transition method, stock-based compensation expense for the years ended December 31, 2007, 2008 and 2009 includes compensation expense for all stock-based compensation awards granted on or after March 15, 2004 (the filing date for the initial registration statement for the Company's initial public offering), based on the estimated grant-date fair value.
For service-based options, the Company recognizes compensation expense on a straight-line basis over the requisite service period of the award. For performance-based options, the Company recognizes expense over the estimated performance period. In addition, the benefits of tax deductions in excess of recognized stock-based compensation is reported as a financing activity rather than an operating activity in the statements of cash flows. This requirement can have the effect of reducing net operating cash flows and increasing net financing cash flows in certain periods along with reducing taxes payable and increasing APIC. To date, the Company has not recorded these benefits as they have not yet been realized.
F-22
Phase Forward Incorporated
Notes to Consolidated Financial Statements (Continued)
For stock options issued, the fair value of each option grant is estimated on the date of grant using the Black-Scholes option pricing model, and an estimated forfeiture rate is applied when calculating stock-based compensation expense for the period. For the years ended December 31, 2007, 2008 and 2009, no stock options were granted, and therefore, typical inputs used in the Black-Scholes option pricing model such as risk-free interest rate, expected dividend yield, expected term and expected volatility were not used. For restricted stock awards and units issued, the fair value of each grant is calculated based on the Company's stock price on the date of grant and an estimated forfeiture rate is applied when calculating stock-based compensation expense for the period.
The Company applied forfeiture rates derived from an analysis of its historical data in determining the expense recorded in the Company's consolidated statements of income as follows:
| |
Year Ended December 31, | |||||||||
|---|---|---|---|---|---|---|---|---|---|---|
| |
2007 | 2008 | 2009 | |||||||
Restricted stock units and awards |
4.0 | % | 6.3 | % | 5.3 | % | ||||
Service-based stock options |
8.0 | % | 9.0 | % | 9.0 | % | ||||
Milestone options |
12.0 | % | 12.0 | % | 12.0 | % | ||||
In 2004, the Company adopted the Phase Forward Incorporated 2004 Employee Stock Purchase Plan (the "2004 ESPP"), which was amended effective December 1, 2005 and restated effective May 8, 2009 and is now considered a non-compensatory plan. See Note 11 for further discussion.
During the years ended December 31, 2007, 2008 and 2009, the Company recorded $5,578, $8,345 and $13,297, respectively, of aggregate stock-based compensation expense. As of December 31, 2009, there was $29,829 of unrecognized stock-based compensation expense related to stock-based awards that is expected to be recognized over a weighted average period of 2.43 years.
Income Taxes
The Company is subject to income taxes in both the United States and foreign jurisdictions, and uses estimates in determining the provision for income taxes. The Company accounts for income taxes using the asset and liability method for accounting and reporting for income taxes. Under this method, deferred tax assets and liabilities are recognized based on temporary differences between the financial reporting and income tax bases of assets and liabilities using statutory rates. This process requires that the Company project the current tax liability and estimate the deferred tax assets and liabilities, including net operating loss and tax credit carryforwards. In assessing the need for a valuation allowance, the Company has considered the recent operating results, future taxable income projections and all prudent and feasible tax planning strategies.
Advertising Expenses
Advertising costs are expensed as incurred. Advertising expenses totaled $22, $51 and $87 for the years ended December 31, 2007, 2008 and 2009, respectively.
Recently Issued Accounting Pronouncements
In June 2009, the Financial Accounting Standards Board ("FASB") issued the Accounting Standards Codification ("ASC") as the single source of authoritative U.S. GAAP recognized by the FASB to be applied by nongovernmental entities in preparation of financial statements in conformity with U.S. GAAP. While the adoption of the ASC as of September 30, 2009 changes how the Company references accounting standards, the adoption did not have an impact on the Company's financial position, results of operations, cash flows, or accounting policies.
F-23
Phase Forward Incorporated
Notes to Consolidated Financial Statements (Continued)
In May 2009, the FASB issued ASC 855-10, Subsequent Events. ASC 855-10 establishes general standards of accounting for and disclosure of events that occur after the balance sheet date but before financial statements are issued or are available to be issued. The adoption of ASC 855-10 had no impact on the Company's financial condition or results of operations.
In December 2007, the FASB issued ASC 805, Business Combinations. ASC 805 is effective for fiscal years beginning on or after December 15, 2008 and applies to all business combinations. ASC 805 provides that, upon initially obtaining control, an acquirer shall recognize 100 percent of the fair values of acquired assets, including goodwill, and assumed liabilities, with only limited exceptions, even if the acquirer has not acquired 100 percent of its target. As a consequence, the current step acquisition model will be eliminated. Additionally, ASC 805 changes current practice, in part, as follows: (1) contingent consideration arrangements will be fair valued at the acquisition date and included on that basis in the purchase price consideration; (2) transaction costs will be expensed as incurred, rather than capitalized as part of the purchase price; (3) pre-acquisition contingencies, such as legal issues, will generally have to be accounted for in purchase accounting at fair value; (4) in order to accrue for a restructuring plan in purchase accounting, the requirements in ASC 420, Exit or Disposal Cost Obligations, would have to be met at the acquisition date; and (5) in-process research and development charges will no longer be recorded. With the adoption of ASC 805 goodwill is no longer reduced when utilizing net operating loss carry forwards for which a full valuation allowance exists. The adoption of ASC 805 could materially change the accounting for business combinations consummated subsequent to January 1, 2009, and was effective for the Company's acquisitions of Waban, Maguzzi and Covance IVRS/IWRS in 2009.
In April 2009, the FASB issued FASB Staff Position No. 141(R)-1 ("FSP FAS 141(R)-1"), Accounting for Assets Acquired and Liabilities Assumed in a Business Combination That Arise from Contingencies (subsequently this standard has been codified under FASB ASC Topic 805). The revised authoritative guidance provides additional clarification on the initial recognition and measurement of assets acquired and liabilities assumed in a business combination that arise from contingencies. The revised authoritative guidance is effective for all fiscal years beginning on or after December 15, 2008. To date, the revised authoritative guidance has not had a significant impact on the accounting for any businesses acquired. However, it may have a material impact on how the Company accounts for future acquisitions.
In October 2009, the FASB issued Accounting Standards Update ("ASU") No. 2009-13, "Revenue Recognition (Topic 605)—Multiple-Deliverable Revenue Arrangements." ASU No. 2009-13 addresses the accounting for multiple-deliverable arrangements to enable vendors to account for products or services (deliverables) separately rather than as a combined unit. This guidance establishes a selling price hierarchy for determining the selling price of a deliverable, which is based on: (a) vendor-specific objective evidence; (b) third-party evidence; or (c) estimates. This guidance also eliminates the residual method of allocation and requires that arrangement consideration be allocated at the inception of the arrangement to all deliverables using the relative selling price method. In addition, this guidance significantly expands required disclosures related to a vendor's multiple-deliverable revenue arrangements. ASU No. 2009-13 is effective prospectively for revenue arrangements entered into or materially modified in fiscal years beginning on or after June 15, 2010 and early adoption is permitted. A company may elect, but will not be required, to adopt the amendments in ASU No. 2009-13 retrospectively for all prior periods. The Company adopted ASU No. 2009-13 on January 1, 2010 and does not expect that the adoption of this guidance will have a material effect on the consolidated financial position and results of operations.
F-24
Phase Forward Incorporated
Notes to Consolidated Financial Statements (Continued)
3. Acquisitions
Green Mountain Logic, Inc.
On October 30, 2007, the Company acquired all of the outstanding capital stock of Green Mountain Logic, Inc. ("Green Mountain"), a privately-held process automation software company that provides targeted solutions for the life sciences industry, including LabPas Phase I clinic automation software. The Company paid a premium to acquire the technology and products of Green Mountain, which provide the Company with a solution targeted for Phase I clinical trials. The aggregate purchase price was $5,397 in cash, of which $3,943 has been recorded as goodwill.
Purchase Price. The acquisition-date fair value of the consideration consisted of the following:
| |
Amount | |||
|---|---|---|---|---|
Initial cash paid |
$ | 5,250 | ||
Acquisition costs |
147 | |||
Total purchase price |
$ | 5,397 | ||
Allocations of Assets and Liabilities. The Company has allocated the purchase price for Green Mountain to the net tangible assets and intangible assets, deferred revenue, deferred tax liabilities and in-process R&D. The difference between the aggregate purchase price and the fair value of assets acquired and liabilities assumed, if any, is allocated to goodwill. The following table summarizes the allocation of the purchase price to the fair value of the assets acquired and liabilities assumed at the date of acquisition:
| |
Amount | |||
|---|---|---|---|---|
Current Assets |
$ | 287 | ||
Property, plant and equipment |
19 | |||
Intangible assets |
1,500 | |||
Goodwill |
3,943 | |||
Current liabilities |
(164 | ) | ||
Deferred revenue |
(103 | ) | ||
Deferred tax liabilities |
(385 | ) | ||
In-process R&D expense |
300 | |||
Net assets acquired |
$ | 5,397 | ||
Based on purchase accounting allocations, $1,300, $100 and $100 of the intangible assets acquired from Green Mountain relate to developed technology, customer relationships and trade names, respectively. The acquired intangible assets were valued using the discounted cash flows and relief-from royalty approaches. All intangible assets will be amortized over a period of 5 years. If an allocated asset becomes impaired or is abandoned, the carrying value of the related intangible asset will be written down to its fair value and an impairment charge will be taken in the period in which the impairment occurs. The acquired intangible assets are subject to review for impairment as indicators of impairment develop and, otherwise, at least annually. Additionally, the Company assumed certain liabilities in the acquisition including deferred revenue which was recorded at the fair value of the Company's remaining performance obligation using a cost-plus profit approach.
F-25
Phase Forward Incorporated
Notes to Consolidated Financial Statements (Continued)
The difference between the consideration transferred to acquire the business and the fair value of assets acquired and liabilities assumed is allocated to goodwill. As of December 31, 2009, there were no changes in the recognized amounts of goodwill resulting from the acquisition of Green Mountain. None of the goodwill is expected to be deductible for income tax purposes.
Green Mountain Financial Information. The results of Green Mountain have been included in the consolidated financial statements of the Company since the date of acquisition. The results of Green Mountain in the period from the acquisition date (October 30, 2007) to December 31, 2007 were immaterial to the Company's consolidated financial results. Pro forma results of operations for the year ended December 31, 2007, assuming the acquisition of Green Mountain had taken place at the beginning of the period would not differ significantly from the actual reported results.
Clarix LLC
On September 5, 2008, the Company acquired all of the outstanding membership interests of Clarix LLC ("Clarix"), a privately-held provider of Web-integrated interactive response technology which the Company has branded as Phase Forward IRT, for clinical trial management. Phase Forward IRT is used for subject randomization, predictive medication inventory management, and operational management in reporting clinical trials. The aggregate purchase price was $41,283 in cash, of which $13,718 has been recorded as goodwill. The Company acquired the technology of Clarix, to allow the Company to penetrate the IRT market and extend its electronic data capture solution. There were no earn-out provisions as a result of the acquisition.
Purchase Price. The acquisition-date fair value of the consideration consisted of the following:
| |
Amount | |||
|---|---|---|---|---|
Cash paid |
$ | 40,000 | ||
Acquisition costs |
1,283 | |||
Total purchase price |
$ | 41,283 | ||
Allocations of Assets and Liabilities. The Company has allocated the purchase price for Clarix to the net tangible assets and intangible assets and deferred revenue. The difference between the aggregate purchase price and the fair value of assets acquired and liabilities assumed, if any, is allocated to goodwill. The following table summarizes the allocation of the purchase price to the fair value of the assets acquired and liabilities assumed at the date of acquisition:
| |
Amount | |||
|---|---|---|---|---|
Current Assets |
$ | 3,323 | ||
Property, plant and equipment |
227 | |||
Other assets |
1,122 | |||
Intangible assets |
25,810 | |||
Goodwill |
13,718 | |||
Current liabilities |
(1,021 | ) | ||
Deferred revenues |
(1,896 | ) | ||
Net assets acquired |
$ | 41,283 | ||
Based on the purchase accounting allocations, $12,360, $8,310, $4,110, $720 and $310 of the intangible assets acquired from Clarix relate to developed technology, customer relationships, trade names, customer backlog and non-compete agreements, respectively.
F-26
Phase Forward Incorporated
Notes to Consolidated Financial Statements (Continued)
The acquired intangible assets were valued using the discounted cash flows and relief-from royalty approaches. Developed technology, customer relationships, trade names, customer backlog and non-compete agreements will be amortized over a period of 8 years, 13 years, 4 years, 3 years and 3 years, respectively. If an allocated asset becomes impaired or is abandoned, the carrying value of the related intangible asset will be written down to its fair value and an impairment charge will be taken in the period in which the impairment occurs. Additionally, the Company assumed certain liabilities in the acquisition including deferred revenue, which was recorded at the fair value of the Company's remaining performance obligation using a cost-plus profit approach. See Note 2 for further discussion of the impairment charge taken for the Clarix trade name.
The acquired intangible assets are subject to review for impairment as indicators of impairment develop and, otherwise, at least annually. Additionally, the Company assumed certain liabilities in the acquisition including deferred revenue which was recorded at the fair value of the Company's remaining performance obligation using a cost-plus profit approach.
The difference between the consideration transferred to acquire the business and the fair value of assets acquired and liabilities assumed is allocated to goodwill. All of the goodwill is expected to be deductible for income tax purposes.
Clarix Financial Information. The results of operations of Clarix have been included in the consolidated financial statements since the acquisition date. The results of Clarix in the period from the acquisition date (September 5, 2008) to December 31, 2008 were immaterial to the Company's consolidated financial results. Pro forma results of operations for the year ended December 31, 2008, assuming the acquisition of Clarix had taken place at the beginning of the period would not differ significantly from the actual reported results.
Waban Software, Inc.
On April 22, 2009, the Company acquired all of the outstanding common stock of Waban Software, Inc. ("Waban"), a privately-held provider of platform solutions for the automation and compliance of clinical data analysis and reporting. Waban's software, which the Company has branded as Clinical Development Center product, provides automation, traceability and control of the key activities involved in the integration, analysis and reporting on clinical trial data. The aggregate purchase price was $13,764 in cash, of which $7,850 has been recorded as goodwill. The Company acquired the technology of Waban to allow it to penetrate the market for statistical computing and clinical data repository solutions.
Purchase Price. All of the assets acquired and liabilities assumed in the transaction are recognized at their acquisition-date fair values, while transaction costs and restructuring costs associated with the transaction are expensed as incurred. The $13,764 purchase price for Waban is based on the acquisition-date fair value of the consideration transferred, which was calculated based on the initial cash paid following post-acquisition working capital adjustments. The purchase price excludes transaction fees of $352 which the Company paid on Waban's behalf on the acquisition date.
F-27
Phase Forward Incorporated
Notes to Consolidated Financial Statements (Continued)
Working capital adjustments were paid in fourth quarter of 2009. The acquisition-date fair value of the consideration consisted of the following:
| |
Amount | |||
|---|---|---|---|---|
Initial cash paid |
$ | 13,660 | ||
Working capital adjustments |
104 | |||
Total purchase price |
$ | 13,764 | ||
Allocations of Assets and Liabilities. The Company has allocated the purchase price for Waban to the net tangible assets and intangible assets, deferred income taxes and deferred revenue. The difference between the aggregate purchase price and the fair value of assets acquired and liabilities assumed, if any, is allocated to goodwill. The following table summarizes allocation of the purchase price to the fair values of the assets acquired and liabilities assumed at the acquisition date:
| |
Amount | |||
|---|---|---|---|---|
Current Assets |
$ | 772 | ||
Property, plant and equipment |
136 | |||
Other assets |
30 | |||
Intangible assets |
8,905 | |||
Goodwill |
7,850 | |||
Current liabilities |
(479 | ) | ||
Deferred income taxes |
(2,421 | ) | ||
Deferred revenues |
(1,029 | ) | ||
Net assets acquired |
$ | 13,764 | ||
Based on the purchase price allocations, $4,758, $3,174 and $973 of the intangible assets acquired from Waban relate to developed technology, customer relationships and trade names, respectively. The acquired intangible assets were valued using the discounted cash flows and relief-from royalty approaches. Developed technology, customer relationships and trade names will be amortized over a period of 15 years, 15 years and 8 years, respectively. If an allocated asset becomes impaired or is abandoned, the carrying value of the related intangible asset will be written down to its fair value and an impairment charge will be taken in the period in which the impairment occurs. The acquired intangible assets are subject to review for impairment as indicators of impairment develop and, otherwise, at least annually. Additionally, the Company assumed certain liabilities in the acquisition including deferred revenue, which was recorded at the fair value of the Company's remaining performance obligation using a cost-plus profit approach.
The difference between the consideration transferred to acquire the business and the fair value of assets acquired and liabilities assumed is allocated to goodwill. None of the goodwill is expected to be deductible for income tax purposes.
Waban Financial Information. The results of operations of Waban have been included in the consolidated financial statements since the acquisition date. The results of Waban in the period from the acquisition date (April 22, 2009) to December 31, 2009 were immaterial to the Company's consolidated financial results. Pro forma results of operations for the year ended December 31, 2009, assuming the acquisition of Waban had taken place at the beginning of the period would not differ significantly from the actual reported results.
F-28
Phase Forward Incorporated
Notes to Consolidated Financial Statements (Continued)
Maaguzi, LLC
On July 27, 2009, the Company acquired all of the outstanding membership interests of Maaguzi LLC ("Maaguzi"), a privately-held innovative provider of a Web-based product called OutcomeLogix, which is an electronic patient reported outcomes (ePRO) and late phase solution. The aggregate purchase price was $11,000 in cash, of which $6,301 has been recorded as goodwill. The acquisition of Maaguzi extends the Company's integrated clinical research suite and marks the Company's entry into the ePRO and observational studies markets. All of the assets acquired and liabilities assumed in the transaction are recognized at their acquisition-date fair values, while transaction costs of $139 associated with the transaction were expensed as incurred.
Allocations of Assets and Liabilities. The Company allocated the purchase price for Maaguzi to the net tangible assets and intangible assets and deferred revenue. The difference between the aggregate purchase price and the fair value of assets acquired and liabilities assumed, if any, is allocated to goodwill. The following table summarizes the fair values of the assets acquired and liabilities assumed at the acquisition date:
| |
Amount | |||
|---|---|---|---|---|
Current assets |
$ | 190 | ||
Property, plant and equipment |
197 | |||
Intangible assets |
5,338 | |||
Goodwill |
6,301 | |||
Current liabilities |
(339 | ) | ||
Deferred revenues |
(687 | ) | ||
Net assets acquired |
$ | 11,000 | ||
Based on the allocations, $1,229, $3,173, $886 and $50 of the intangible assets acquired from Maaguzi relate to developed technology, customer relationships, in-process research and development, and trade names, respectively. The acquired intangible assets were valued using the discounted cash flows and relief-from royalty approaches. Developed technology, customer relationships and trade names will be amortized over a period of 8 years, 18 years and 1 year, respectively. If an allocated asset becomes impaired or is abandoned, the carrying value of the related intangible asset will be written down to its fair value and an impairment charge will be taken in the period in which the impairment occurs. The acquired intangible assets are subject to review for impairment as indicators of impairment develop and, otherwise, at least annually. Additionally, the Company assumed certain liabilities in the acquisition including deferred revenue, which was recorded at the fair value of the Company's remaining performance obligation using a cost-plus profit approach.
The difference between the consideration transferred to acquire the business and the fair value of assets acquired and liabilities assumed is allocated to goodwill. All of the goodwill is expected to be deductible for income tax purposes.
Maaguzi Financial Information. The results of operations of Maaguzi have been included in the audited consolidated financial statements since the acquisition date. The results of Maaguzi in the period from the acquisition date (July 27, 2009) to December 31, 2009 were immaterial to the Company's consolidated financial results. Pro forma results of operations for the year ended December 31, 2009, assuming the acquisition of Maaguzi had taken place at the beginning of the period would not differ significantly from the actual reported results.
F-29
Phase Forward Incorporated
Notes to Consolidated Financial Statements (Continued)
Covance IVRS/IWRS
On August 20, 2009, the Company acquired the Interactive Voice and Web Response Services business of Covance Inc., ("Covance IVRS/IWRS"). The aggregate purchase price was $10,000 in cash, of which $5,280 has been recorded as goodwill. All of the assets acquired and liabilities assumed in the transaction are recognized at their acquisition-date fair values, while transaction costs of $186 associated with the transaction were expensed as incurred.
Allocations of Assets and Liabilities. The Company allocated the purchase price for Covance IVRS/IWRS to the net tangible assets and intangible assets and deferred revenue. The difference between the aggregate purchase price and the fair value of assets acquired and liabilities assumed, if any, is allocated to goodwill. The following table summarizes the fair values of the assets acquired and liabilities assumed at the acquisition date:
| |
Amount | |||
|---|---|---|---|---|
Current assets |
$ | 1,975 | ||
Intangible assets |
5,610 | |||
Goodwill |
5,280 | |||
Current liabilities |
(2,281 | ) | ||
Other long-term liabilities |
(584 | ) | ||
Net assets acquired |
$ | 10,000 | ||
Based on the allocations, $5,610 of the intangible assets acquired from Covance IVRS/IWRS relate to customer relationships which will be amortized over a period of 15 years. The acquired intangible assets were valued using the discounted cash flows and relief-from royalty approaches. If an allocated asset becomes impaired or is abandoned, the carrying value of the related intangible asset will be written down to its fair value and an impairment charge will be taken in the period in which the impairment occurs. The acquired intangible assets are subject to review for impairment as indicators of impairment develop and, otherwise, at least annually.
The difference between the consideration transferred to acquire the business and the fair value of assets acquired and liabilities assumed is allocated to goodwill. All of the goodwill is expected to be deductible for income tax purposes.
While the Company has existing trials running on the Covance IVRS/IWRS system, no new trials or offerings will be sold or implemented. As part of the purchase accounting, included in current liabilities, is $177 of severance.
Covance IVRS/IWRS Financial Information. The results of operations of Covance IVRS/IWRS have been included in the audited consolidated financial statements since the acquisition date. The results of Covance in the period from the acquisition date (August 20, 2009) to December 31, 2009 were immaterial to the Company's consolidated financial results. Pro forma results of operations for the year ended December 31, 2009, assuming the acquisition of Covance had taken place at the beginning of the period would not differ significantly from the actual reported results.
4. Goodwill and Intangible Assets
Goodwill and intangible assets that have indefinite lives are not amortized but are evaluated for impairment annually or whenever events or changes in circumstances indicate the carrying value may not be recoverable. Intangible assets that have finite lives are amortized over their useful lives.
F-30
Phase Forward Incorporated
Notes to Consolidated Financial Statements (Continued)
A rollforward of the net carrying amount of goodwill is as follows:
| |
Year Ended December 31, | ||||||
|---|---|---|---|---|---|---|---|
| |
2008 | 2009 | |||||
Balance at beginning of year |
$ | 25,511 | $ | 39,125 | |||
Increase associated with the acquisition of Clarix (see Note 3) |
13,718 | — | |||||
Increase associated with the acquisition of Waban (see Note 3) |
— | 7,850 | |||||
Increase associated with the acquisition of Maaguzi (see Note 3) |
— | 6,301 | |||||
Increase associated with the acquisition of Covance IVRS/IWRS (see Note 3) |
— | 5,280 | |||||
Purchase price adjustments |
(104 | ) | 471 | ||||
Balance at end of year |
$ | 39,125 | $ | 59,027 | |||
The Company conducted its annual impairment test of indefinite lived intangible assets during the fourth quarter of its fiscal year. Based on the results, the Company determined that the value of the trade name acquired from Clarix, previously recorded as an asset with an indefinite useful life, was impaired and no longer had an indefinite useful life. Accordingly, the Company included this intangible asset in the table below. See Note 2 for further discussion of the impairment charge taken in 2009 for the Clarix trade name.
Acquired intangible assets subject to amortization are amortized over their estimated useful lives based on either the pattern in which the economic benefits of the intangible asset are consumed or on a straight-line method. The estimated useful life represents the anticipated term of the acquired intangible assets. Finite-lived intangible assets consist of the following as of December 31, 2008 and 2009:
| |
|
As of December 31, 2008 | As of December 31, 2009 | ||||||||||||
|---|---|---|---|---|---|---|---|---|---|---|---|---|---|---|---|
Description
|
Estimated Useful Life | Gross Carrying Value | Accumulated Amortization | Gross Carrying Value | Accumulated Amortization | ||||||||||
Developed technology and know-how |
5 - 15 years | $ | 15,460 | $ | 1,743 | $ | 21,447 | $ | 3,604 | ||||||
Customer relationships |
5 - 20 years | 10,010 | 1,309 | 22,190 | 2,574 | ||||||||||
Non-compete agreements |
2 - 3 years | 610 | 335 | 610 | 438 | ||||||||||
Trade name |
1 - 8 years | 300 | 157 | 3,140 | 396 | ||||||||||
In process research and development |
8 years | — | — | 886 | — | ||||||||||
Customer backlog |
3 years | 720 | 80 | 720 | 320 | ||||||||||
Total |
$ | 27,100 | $ | 3,624 | $ | 48,993 | $ | 7,332 | |||||||
Amortization expense related to intangible assets for the years ended December 31, 2007, 2008 and 2009 was $867, $1,580 and $3,708, respectively.
F-31
Phase Forward Incorporated
Notes to Consolidated Financial Statements (Continued)
The estimated remaining amortization expense for each of the five succeeding fiscal years and thereafter is as follows:
Year ended December 31,
|
Amount | |||
|---|---|---|---|---|
2010 |
$ | 5,608 | ||
2011 |
4,987 | |||
2012 |
4,914 | |||
2013 |
4,543 | |||
2014 |
4,039 | |||
2015 and thereafter |
17,570 | |||
Total |
$ | 41,661 | ||
5. Accrued Expenses
Accrued expenses consist of the following:
| |
As of December 31, | ||||||
|---|---|---|---|---|---|---|---|
| |
2008 | 2009 | |||||
Accrued payroll and related benefits |
$ | 14,108 | $ | 17,278 | |||
Accrued royalties |
1,839 | 1,867 | |||||
Loss on foreign exchange contracts |
1,059 | — | |||||
Accrued outside contractors |
1,716 | 2,013 | |||||
Lease exit costs |
527 | — | |||||
Accrued other expenses |
3,437 | 6,476 | |||||
Total |
$ | 22,686 | $ | 27,634 | |||
6. Income Taxes
Income before the (benefit from) provision for income taxes consists of the following:
| |
Year Ended December 31, | |||||||||
|---|---|---|---|---|---|---|---|---|---|---|
| |
2007 | 2008 | 2009 | |||||||
Domestic |
$ | 18,348 | $ | 19,232 | $ | 10,933 | ||||
Foreign |
1,683 | 1,967 | 2,510 | |||||||
Total |
$ | 20,031 | $ | 21,199 | $ | 13,443 | ||||
F-32
Phase Forward Incorporated
Notes to Consolidated Financial Statements (Continued)
The (benefit from) provision for income taxes in the accompanying consolidated statements of income consists of the following:
| |
Year Ended December 31, | |||||||||||
|---|---|---|---|---|---|---|---|---|---|---|---|---|
| |
2007 | 2008 | 2009 | |||||||||
Current provision : |
||||||||||||
Federal |
$ | 876 | $ | 496 | $ | 475 | ||||||
State |
(9 | ) | 165 | 819 | ||||||||
Foreign |
738 | 168 | 1,507 | |||||||||
Total |
$ | 1,605 | $ | 829 | $ | 2,801 | ||||||
Deferred (benefit) provision: |
||||||||||||
Federal |
$ | (9,925 | ) | $ | 5,671 | $ | 2,851 | |||||
State |
(755 | ) | 465 | 348 | ||||||||
Foreign |
(95 | ) | 389 | (603 | ) | |||||||
Total |
$ | (10,775 | ) | $ | 6,525 | $ | 2,596 | |||||
Total (benefit) provision |
$ | (9,170 | ) | $ | 7,354 | $ | 5,397 | |||||
The Company has used net operating losses to reduce cash taxes payable in the years ended December 31, 2007, 2008 and 2009.
A reconciliation of the federal statutory rate to the Company's effective tax rate is as follows:
| |
Year Ended December 31, | ||||||||||
|---|---|---|---|---|---|---|---|---|---|---|---|
| |
2007 | 2008 | 2009 | ||||||||
Federal statutory rate |
35 | % | 35 | % | 35 | % | |||||
State tax |
3 | 3 | 3 | ||||||||
Tax credits (research and development) |
(5 | ) | (6 | ) | (13 | ) | |||||
Increase in tax reserves |
4 | 1 | 3 | ||||||||
Decrease in valuation allowance |
(83 | ) | — | — | |||||||
Stock-based compensation expense |
— | — | 11 | ||||||||
Other |
— | 2 | 1 | ||||||||
Effective tax rate |
(46 | )% | 35 | % | 40 | % | |||||
The approximate income tax effect of each type of temporary difference and carryforward as of December 31, 2008 and 2009 is as follows:
| |
As of December 31, | ||||||
|---|---|---|---|---|---|---|---|
| |
2008 | 2009 | |||||
Net operating loss carryforwards |
$ | 11,623 | $ | 7,307 | |||
Nondeductible reserves, accruals and other |
4,858 | 7,877 | |||||
Deferred compensation |
2,792 | 2,294 | |||||
Tax credits (research & development, AMT & foreign taxes) |
5,470 | 9,248 | |||||
Basis difference in fixed assets |
(3,741 | ) | (8,499 | ) | |||
Acquired intangible assets |
(1,000 | ) | (3,241 | ) | |||
|
$ | 20,002 | $ | 14,986 | |||
F-33
Phase Forward Incorporated
Notes to Consolidated Financial Statements (Continued)
The Company is subject to income taxes in both the United States and foreign jurisdictions, and uses estimates in determining its provision for income taxes. The Company accounts for income taxes using the asset and liability method for accounting and reporting for income taxes. Under this method, deferred tax assets and liabilities are recognized based on temporary differences between the financial reporting and income tax bases of assets and liabilities using statutory rates. This process requires the Company to project its current tax liability and estimate its deferred tax assets and liabilities, including net operating loss and tax credit carryforwards. In assessing the need for a valuation allowance, the Company considered its recent operating results, future taxable income projections and all prudent and feasible tax planning strategies. In the year ended December 31, 2007, the Company determined that it was more likely than not that it would realize the full value of its remaining deferred tax asset and therefore reduced the valuation allowance by an additional $22,665. The benefit of the release in valuation allowance was realized through reductions to income tax expense of $16,535 and to goodwill of $6,130.
At December 31, 2009, the Company had $19,246 of net operating loss carryforwards that may be used to offset future U.S. federal taxable income. In addition, the Company had $20,328 of net operating losses resulting from excess tax deductions related to stock-based compensation. The Company will realize the benefit of these excess tax deductions through increases to stockholders equity in the periods in which the losses are utilized to reduce tax payments. The Company had $3,735 of federal research and development tax credit carryforwards that may be utilized to offset future U.S. taxable income. In addition, the Company has $406 of federal research and development tax credits resulting from excess tax deductions related to stock-based compensation, the benefit of which will be realized through increases to stockholders' equity in the periods in which the credits are utilized to offset future U.S. taxes. The net operating loss and tax credit carryforward periods extend through 2029. The Company also had $4,486 of research and development tax credit carryforwards and $1,368 of investment tax credit carryforwards that may be utilized to offset future Massachusetts state income tax. The Massachusetts research and development tax credit carryforward period extends through 2024. The Massachusetts investment tax credit carryforwards begin to expire in 2010. The federal and state net operating loss carryforwards and research and development and investment tax credit carryforwards are subject to review and possible adjustment by the taxing authorities. Also, the Internal Revenue Code contains provisions that may limit the net operating loss and tax credit carryforwards available in any given year in the event of certain changes in the ownership interests of significant stockholders.
As of December 31, 2008 and 2009 the liability for unrecognized income tax benefits was $1,387 and $1,635, respectively. Of the balance as of December 31, 2009, entire amount would favorably impact the Company's tax rate if recognized. The Company recognizes interest and penalties as a component of income tax expense. As of December 31, 2008 and 2009, the Company had an accrual of $127 and $90, respectively, for the payment of interest and penalties related to its unrecognized tax positions.
The reconciliation of the gross amount of unrecognized tax benefits as of December 31, 2008 and 2009 is as follows:
| |
Year Ended December 31, 2008 |
Year Ended December 31, 2009 |
|||||
|---|---|---|---|---|---|---|---|
Balance at beginning of period |
$ | 1,374 | $ | 1,653 | |||
Decrease due to lapsing of statute of limitations |
— | (107 | ) | ||||
Increase related to current year tax positions |
279 | 413 | |||||
Balance at end of period |
$ | 1,653 | $ | 1,959 | |||
F-34
Phase Forward Incorporated
Notes to Consolidated Financial Statements (Continued)
As of December 31, 2009, the Company does not expect the amount of unrecognized tax benefits to change significantly over the next twelve months.
The Company files income tax returns in the United States, various U.S. state jurisdictions and various foreign jurisdictions. The statute of limitations for federal and state tax authorities is closed for years prior to December 31, 2006, although carryforward attributes that were generated prior to 2006 may still be subject to examination if they either have been or will be utilized to offset taxable income in tax years 2006 and forward. The statute of limitations for foreign tax jurisdictions is closed for tax years prior to December 31, 2004.
The Company's current intention is to reinvest the total amount of its unremitted foreign earnings in the local jurisdiction, to the extent they are generated and available, or to repatriate the earnings only when tax-effective. As such, the Company has not provided U.S. tax expense on $2,069 of the unremitted earnings of its foreign subsidiaries. If such earnings were distributed, it would result in approximately $73 of incremental U.S. tax expense.
7. Lease Exit and Restructuring Costs
Lease Exit Costs
The Company recorded lease exit costs of $527 for the year ended December 31, 2008 that related to the relocation of the Company's corporate headquarters in December 2008. Of this amount, $429 represented the loss on a facilities lease and $98 related to the abandonment of the related fixed assets and leasehold improvements. The facility lease loss represented two months of rent remaining under the Company's former lease and related operating expenses. The Company has recorded the lease exit costs in accrued expenses in the accompanying consolidated balance sheet.
There were no lease exit costs recorded for the year ended December 31, 2009.
Restructuring Costs
Restructuring costs of $216 were recorded in the Company's consolidated statement of income for the year ended December 31, 2009 in connection with the right sizing of the Company's various lines of business to better meet customer demands, and the release of underperforming employees.
8. Restricted Cash
As of December 31, 2008, the Company had a $500 collateral obligation for its prior corporate headquarters facility lease, which was secured by a certificate of deposit. The certificate of deposit was classified as "Restricted cash, current portion" in the audited consolidated balance sheets. In connection with the relocation of the Company's corporate headquarters, the $500 collateral obligation was terminated and, as such, this amount is no longer classified as "Restricted cash, current portion" as of December 31, 2009.
In connection with the signing of a lease on February 13, 2008 to secure office space for the Company's new corporate headquarters at 77 Fourth Avenue, Waltham, Massachusetts, the Company deposited with the landlord an unconditional, irrevocable letter of credit in the landlord's favor in the amount of $962, secured by a certificate of deposit. The certificate of deposit has been classified as "Restricted cash, net of current portion" in the audited consolidated balance sheets as of December 31, 2008 and December 31, 2009. See Note 9 for further discussion regarding this lease.
F-35
Phase Forward Incorporated
Notes to Consolidated Financial Statements (Continued)
9. Commitments and Contingencies
Operating Leases
On February 13, 2008, the Company entered into a lease ("Headquarters Lease") with BP Fourth Avenue, L.L.C. (the "Landlord") to secure office space for the Company's current corporate headquarters at 77 Fourth Avenue, Waltham, Massachusetts. The commencement date for occupancy under the Headquarters Lease was December 2008. The lease for the Company's previous corporate headquarters at 880 Winter Street in Waltham, Massachusetts expired in February 2009. The Headquarters Lease provides for the rental of 165,129 square feet of space and has an initial term of 10 years and three months. The Company can, subject to certain conditions, extend this term by exercising up to two consecutive five year options. The Company was not required to pay any rent for the first three months of the initial Headquarters Lease term. After the initial three months, the annual rent under the Headquarters Lease for years one through five is $6,600, or approximately $548 per month. For years six through ten, the annual rent will be $7,200, or approximately $603 per month. The total base rent payable in the initial term is $69,100. In connection with the signing of the Headquarters Lease, the Company has deposited with the Landlord an unconditional, irrevocable letter of credit in Landlord's favor in the amount of $962.
On August 17, 2009, the Company entered into a lease ("IRT Lease") with KBS Five Tower Bridge, L.L.C. to secure office space for the Company's Phase Forward IRT business operations at 300 Barr Harbor Drive, West Conshohocken, Pennsylvania. The commencement date for occupancy under the IRT Lease was September 2009. The IRT Lease provides for the rental of 44,907 square feet of space and has an initial term of 10 years and one month. The Company can, subject to certain conditions, extend this term by exercising up to two consecutive five-year options. The annual rent under the IRT Lease for the first year is $1,325, or approximately $110 per month, with annual escalations in rent for each subsequent year in the amount of $22, or fifty cents per rentable square foot. The total base rent payable in the initial term is $14,258.
The following table of material contractual obligations as of December 31, 2009 summarizes the aggregate effect that these obligations are expected to have on cash flows in the periods indicated:
| |
Amount | |||||
|---|---|---|---|---|---|---|
Year ended December 31, |
||||||
2010 |
$ | 10,041 | ||||
2011 |
10,007 | |||||
2012 |
9,159 | |||||
2013 |
8,527 | |||||
2014 |
9,025 | |||||
2015 and thereafter |
36,681 | |||||
Total minimum lease payments |
$ | 83,440 | ||||
Certain of the Company's leases have escalating rent payments. The Company records rent expense on a straight line basis over the term of the lease. Rent expense for the periods ended December 31, 2007, 2008 and 2009 was $3,349, $4,251and $9,215, respectively. As of December 31, 2008 and 2009, the Company has deferred rent of $564 and $2,115, respectively, of which $564 and $2,115, respectively, is classified as a long-term liability in the accompanying consolidated balance sheets.
F-36
Phase Forward Incorporated
Notes to Consolidated Financial Statements (Continued)
The Company does not have any special purpose entities or any off balance sheet financing arrangements.
Contingencies
From time to time and in the ordinary course of business, the Company is subject to various claims, charges and litigation. Intellectual property disputes often have a risk of injunctive relief which, if imposed against the Company, could materially and adversely affect its financial condition or results of operations. From time to time, third parties have asserted and may in the future assert intellectual property rights to technologies that are important to the Company's business and have demanded and may in the future demand that the Company license their technology. Although the outcome of litigation cannot be predicted with certainty and some lawsuits, claims or proceedings may be disposed of unfavorably to the Company, which could materially and adversely affect its financial condition or results of operations, the Company does not believe that it is currently a party to any material legal proceedings.
10. Leasehold Incentive Obligations
In conjunction with the February 2008 lease agreement for the Company's current headquarters, the landlord agreed to reimburse the Company for leasehold improvements totaling $8,104, which was received in 2008. The leasehold improvements are recognized in property and equipment on the consolidated balance sheet, with the corresponding reimbursement recognized as "leasehold incentive obligation" on the consolidated balance sheet. The amount of the incentive will be amortized on a straight-line basis over the lease term as a reduction of rental expense at the beginning of occupancy. The leasehold improvements in property and equipment will be amortized over the shorter of the lease term or the estimated useful life of the asset.
In conjunction with the August 2009 lease agreement for the Company's Phase Forward IRT operation, the landlord agreed to reimburse the Company for leasehold improvements totaling $2,133, of which $1,640 had been completed and reimbursed in 2009. The leasehold improvements are recognized in property and equipment on the consolidated balance sheet, with the corresponding reimbursement recognized as "leasehold incentive obligation" on the consolidated balance sheet. The amount of the incentive will be amortized on a straight-line basis over the lease term as a reduction of rental expense at the beginning of occupancy. The leasehold improvements in property and equipment will be amortized over the shorter of the lease term or the estimated useful life of the asset.
The Company amortized the leasehold incentive obligations as a reduction to rent expense for the two above leases of $66 and $809 for the years ended December 31, 2008 and 2009, respectively.
For additional information regarding the February 2008 lease and the August 2009 lease agreements, see Note 9.
11. Stockholders' Equity
Common Stock
For the years ended December 31, 2007, 2008 and 2009, the Company issued 899,933, 275,081, and 371,400 shares of common stock resulting in proceeds of $3,379, $1,676 and $2,042, respectively, from the exercise of common stock options. For the years ended December 31, 2007, 2008 and 2009, the Company issued 16,156, 33,703 and 32,907 shares of common stock resulting in proceeds of $290, $511 and $451, respectively, in connection with the Company's 2004 ESPP.
F-37
Phase Forward Incorporated
Notes to Consolidated Financial Statements (Continued)
On May 29, 2007, the Company sold 5,500,000 shares of common stock at $15.00 per share in a public offering, resulting in proceeds of $77,455 after deducting underwriters' discounts and offering related expenses. The Company also granted the underwriters an option for 30 days to purchase up to an additional 825,000 shares to cover over-allotments, if any, which was exercised in full on June 1, 2007, resulting in net proceeds of $11,695 after deducting underwriters' discounts. A summary of the terms of the offering can be found in the Company's Registration Statement No. 333-142328 on Form S-3, as filed with the Securities and Exchange Commission.
Stock-Based Compensation Plans
The Company currently has one plan under which it may grant stock-based compensation awards to its directors, employees and non-employees. The Company has two additional plans under which there are awards outstanding, but under which no future awards may be made.
In 2004, the Board of Directors and stockholders approved the Phase Forward Incorporated 2004 Stock Option and Incentive Plan (the "2004 Plan") which became effective upon the closing of the Company's initial public offering. The Company had reserved for issuance an aggregate of 1,500,000 shares of common stock under the 2004 Plan. Under the 2004 Plan, the Board of Directors may grant stock options and other equity interests in the Company to employees of the Company and non-employees. The exercise price of each option is determined by the Board of Directors. Stock options may not be granted with an exercise price less than the fair market value of the stock on the date of grant, as defined by the Board of Directors. Options granted under the 2004 Plan generally vest over a four to seven year period and expire ten years from the grant date. In February 2005, the Company granted options to certain employees to purchase a total of 419,000 shares of common stock that vest upon the earlier of attainment of specified milestones or 7 years from the date of grant. Of these February 2005 option grants, 289,250 options have since vested due to the achievement of milestones, 50,000 options were forfeited, and 79,750 remain unvested. Generally, the remainder of equity awards granted were service-based and vest over a period of four years from the date of grant. On May 3, 2006, the Company's stockholders approved an amendment to the 2004 Plan to increase the number of shares available for issuance from 1,500,000 shares to 3,500,000 shares. In 2006, the Company issued 1,113,175 unvested restricted stock awards and restricted stock units under the 2004 Plan. Generally, the balances of these unvested restricted stock awards and units vest 50% in two years; 75% in three years and 100% in four years. A total of 400,000 unvested restricted stock awards were granted to the Company's Chief Executive Officer and vest 25% in three years; 50% in four years and 100% in five years. In 2007, the Company issued 589,144 unvested restricted stock units under the 2004 Plan. Generally, the balances of these unvested restricted stock options and units vest 50% in two years; 75% in three years and 100% in four years. In 2008, the Company issued 988,307 unvested restricted stock units under the 2004 Plan. Generally, the balances of these unvested restricted stock options and units vest 50% in two years; 75% in three years and 100% in four years. On October 20, 2008, the Company approved the lapsing of restrictions on 25,000 restricted stock awards to its Former Chairman of the Board and Chief Strategy Officer resulting in additional stock-based compensation expense of $332 in 2008, of which $54 represented incremental expense. In addition, the Company approved the acceleration of the vesting of 6,250 shares of incentive stock options to the same individual. The acceleration resulted in additional stock-based compensation expense of $45 in 2008, of which $29 represented incremental expense. In 2009, the Company issued 1,457,136 unvested restricted stock units under the 2004 Plan. Generally, the balances of these unvested restricted stock options and units vest 50% in two years; 75% in three years and 100% in four years. A total of 400,000 unvested restricted stock awards were granted to the Company's Chief Executive Officer and vest approximately 30% in two years; 55% in three years and 100% in four years.
F-38
Phase Forward Incorporated
Notes to Consolidated Financial Statements (Continued)
In addition, the Company approved the modification of previously granted award agreements to the new Chief Financial Officer and Senior Vice President of Integration and Product Strategy. These modifications brought the terms of each agreement in line with the terms customarily found in the agreements granted to the Company's senior executives and had no impact on the Company's consolidated financial position and results of operations.
On May 2, 2007, the Company's stockholders approved an amendment to the 2004 Plan to increase the number of shares available for issuance under the plan by 481,505 shares, bringing total shares authorized for issuance under the 2004 Plan to 3,981,505. The increase is equal to the number of shares that were available for issuance under the Company's two other stock plans (the Phase Forward Incorporated 1997 Stock Option Plan and the Phase Forward Incorporated 2003 Non-Employee Director Stock Option Plan) at the date of the amendment. As part of that amendment, the Company decided that it will no longer issue any further shares under its two other plans.
On May 8, 2009, the Company's stockholders approved an amendment and restatement of the 2004 Plan to increase the number of share available for issuance under the plan by 1,500,000 shares, bringing total shares authorized for issuance under the 2004 Plan to 5,481,505. As of December 31, 2009, the Company had 782,034 shares available for grant under the 2004 Plan.
In 1997, the Company adopted the Phase Forward Incorporated 1997 Stock Option Plan (the "1997 Plan"). On May 2, 2007, the Company's stockholders approved an amendment to the 2004 Plan as discussed above. As part of that amendment, the Company decided that it will no longer issue any further shares under the 1997 Plan. Prior to the May 2, 2007 amendment to the 2004 Plan, under the 1997 Plan, the Board of Directors could grant incentive and nonqualified stock options to employees of the Company and non-employees. The exercise price of each option was determined by the Board of Directors. Incentive stock options could not be granted with an exercise price less than the fair market value of the stock on the date of grant, as defined by the Board of Directors. Options granted under the 1997 Plan generally vest over four or five year periods and expire ten years from the grant date. In January and March 2004, the Company granted options to certain employees to purchase a total of 205,000 shares of common stock that vest upon the earlier of 7 years from date of grant or the attainment of specified milestones. All of the options to purchase shares have since either vested upon the attainment of specified milestones in accordance with the original provisions of the award or been modified to change the vesting provisions to a 4-year service period. Options to purchase 26,250 shares were accelerated in December 2004. There was no incremental stock-based compensation in excess of the amounts that were previously recorded as deferred compensation.
In 2003, the Board of Directors and stockholders approved the Phase Forward Incorporated 2003 Non-Employee Director Stock Option Plan (the "2003 NED Plan"). As part of the amendment to the 2004 Plan as discussed above, the Company decided that it will no longer issue any further shares under the 2003 NED Plan. The Company reserved for issuance an aggregate of 362,000 shares of common stock under the 2003 NED Plan. Effective April 20, 2004, the 2003 NED Plan was amended to increase the number of shares the Company could grant under this plan to 562,000 shares. The 2003 NED Plan provided solely for the automatic, one-time grant of a nonqualified stock option to a non-employee director upon initial election to the Company's Board of Directors to purchase 100,000 shares of common stock. On September 23, 2005, the 2003 NED Plan was amended to reduce the one-time grant from 100,000 to 50,000 stock options. The exercise price of the options could not be less than 100% of the fair market value on the grant date. Options vest fully on the fifth anniversary of the date of grant, so long as the non-employee director has continuously served on the Board of Directors through such vesting date. If the non-employee director meets certain board attendance criteria, options may vest earlier at a rate of one-sixteenth at the end of each fiscal quarter following the date of grant.
F-39
Phase Forward Incorporated
Notes to Consolidated Financial Statements (Continued)
Non Plan Awards
In 2008 the Company granted 210,254 restricted stock units awarded to former employees of Clarix, which was acquired by the Company in September 2008. In 2009 the Company granted 197,582 restricted stock units awarded to former employees of Waban, which was acquired by the Company in April 2009. The awards granted in both years were made as "inducement" awards within the definitions of the NASDAQ rulings. The Company determined that these awards were not part of the purchase price of the acquisition as the awards vest over three or four year periods based on future service. As such, the Company will record stock-based compensation expense for these awards based on the fair value as of the date of grant.
Stock Option Activity
A summary of stock option activity under the Phase Forward Incorporated 1997 Stock Option Plan, the Phase Forward Incorporated 2004 Stock Option and Incentive Plan and the 2003 Non-Employee Director Stock Option Plan as of December 31, 2009, and changes during the year ended December 31, 2009, is as follows:
| |
Number of Shares |
Weighted Average Exercise Price per Share |
Weighted Average Remaining Contractual Term (years) |
Aggregate Intrinsic Value(2) |
||||||||||
|---|---|---|---|---|---|---|---|---|---|---|---|---|---|---|
Outstanding as of December 31, 2008 |
2,187,123 | $ | 4.83 | 4.76 | ||||||||||
Granted |
— | — | ||||||||||||
Exercised |
(371,400 | ) | 5.50 | $ | 3,371 | |||||||||
Canceled |
281 | 6.53 | ||||||||||||
Outstanding as of December 31, 2009 |
1,816,004 | $ | 4.70 | 3.69 | $ | 19,319 | ||||||||
Exercisable as of December 31, 2009 |
1,736,170 | $ | 4.63 | 3.62 | $ | 18,598 | ||||||||
Vested or expected to vest as of December 31, 2009(1) |
1,809,957 | $ | 4.70 | 3.68 | $ | 19,265 | ||||||||
- (1)
- The
vested or expected to vest options at December 31, 2009 include both the vested options and the number of options expected to vest calculated
after applying an estimated forfeiture rate to the unvested options.
- (2)
- The aggregate intrinsic value for shares outstanding, exercisable and vested is calculated based on the positive difference between the fair value per share of the Company's common stock on December 31, 2009 of $15.34, or the date of exercise, as applicable, and the exercise price of the underlying options.
F-40
Phase Forward Incorporated
Notes to Consolidated Financial Statements (Continued)
A summary of the status of the Company's unvested stock options as of December 31, 2009, and changes during the year ended December 31, 2009, is as follows:
Unvested Shares
|
Shares | Weighted Average Exercise Price Per Share |
|||||
|---|---|---|---|---|---|---|---|
Unvested at December 31, 2008 |
159,889 | $ | 7.15 | ||||
Granted |
— | — | |||||
Vested |
(80,336 | ) | 7.99 | ||||
Forfeited |
281 | 6.53 | |||||
Unvested at December 31, 2009 |
79,834 | $ | 6.30 | ||||
Restricted Stock Awards and Unit Activity
A summary of activity related to restricted common stock awards and unit awards as of December 31, 2009 and changes during the year ended December 31, 2009, is as follows:
| |
Number of Shares |
Market Price Per Share |
Weighted Average Grant Date Fair Value Per Share |
Weighted Average Remaining contractual Term (years) |
Aggregate Intrinsic Value(2) |
||||||||
|---|---|---|---|---|---|---|---|---|---|---|---|---|---|
Unvested at December 31, 2008 |
2,139,964 | $ | 10.85 - 23.20 | $15.66 | |||||||||
Granted |
1,457,136 | 11.10 - 16.59 | |||||||||||
Vested |
(606,722 | ) | 11.10 - 23.20 | ||||||||||
Forfeited |
(59,015 | ) | 10.85 - 23.03 | ||||||||||
Unvested at December 31, 2009 |
2,931,363 | $ | 10.85 - 23.20 | $15.21 | 2.46 | $44,967 | |||||||
Expected to be free of restrictions(1) |
2,388,395 | $ | 10.85 - 23.20 | $15.22 | 2.44 | $36,638 | |||||||
- (1)
- The
expected to be free of restrictions at December 31, 2009 was calculated by applying an estimated forfeiture rate to the unvested shares.
- (2)
- The aggregate intrinsic value is calculated based on the fair value per share of the Company's common stock on December 31, 2009 of $15.34.
Employee Stock Purchase Plan
In 2004, the Board of Directors and stockholders approved the 2004 ESPP, which became effective after the completion of the Company's initial public offering on July 20, 2004. The Company has reserved for issuance under this plan an aggregate of 320,000 shares of common stock. The 2004 ESPP allows eligible employees the opportunity to purchase shares of the Company's common stock through payroll deductions of up to 10% of a participant's annual compensation with a maximum of 5,000 shares available per participant during each payment period, subject to statutory limitations. The first payment period began on September 2, 2004 and ended on November 30, 2004. All subsequent payment periods consist of six-month periods commencing on December 1 and June 1 and ending on the last day of May and November. For the year ended December 31, 2009 the Company issued 32,907 shares of common stock under the 2004 ESPP resulting in proceeds of $451.
F-41
Phase Forward Incorporated
Notes to Consolidated Financial Statements (Continued)
Prior to December 1, 2005, the price per share under the 2004 ESPP for each payment period was the lesser of (1) 85% of the last reported sale price of the Company's common stock on the first business day of the payment period and (2) 85% of the last reported sale price of the common stock on the last business day of the payment period. Effective December 1, 2005, the Company amended the price provision of the 2004 ESPP such that the option price is now set at 95% of the last reported sale price of the common stock on the last business day of the payment period. Accordingly, the 2004 ESPP is considered a non-compensatory plan.
Stock Repurchase Program
On November 3, 2009, the Company's Board of Directors authorized the repurchase of up to $40,000 of its common stock, par value $0.01 per share, through a share repurchase program. On February 12, 2010, the Company's Board of Directors increased the amount available under the share repurchase program by an additional $25,000. As authorized by the program, shares may be purchased in the open market or through privately negotiated transactions in a manner consistent with applicable securities laws and regulations, including pursuant to a Rule 10b5-1 plan maintained by the Company.
This share repurchase program does not obligate the Company to acquire any specific number of shares and may be extended, suspended or discontinued at any time. All repurchases are expected to be funded from the Company's cash and investment balances. While the Company's Board of Directors have approved the share purchasing guidelines, the timing of the repurchases and the exact number of shares of common stock to be purchased were determined at the Company management's discretion, and depended upon market conditions and other factors, including price, corporate and regulatory requirements and alternative investment opportunities. The repurchase program is currently scheduled to terminate on December 31, 2010. For the year ended December 31, 2009, 942,862 shares of the Company's common stock had been purchased as part of this repurchase program at an average price of $14.86 per share.
12. Forward Foreign Exchange Contracts
The Company enters into transactions in currencies other than the U.S. dollar and holds cash in foreign currencies which expose the Company to transaction gains and losses as foreign currency exchange rates fluctuate against the U.S. dollar. The Company from time to time enters into forward foreign exchange contracts to hedge the foreign currency exposure of non-U.S. dollar denominated third-party and intercompany receivables and cash balances. The contracts, which relate to the British pound, euro, and the Japanese yen, generally have terms of one month. These hedges are deemed fair value hedges and have not been designated for hedge accounting. The gains or losses on the forward foreign exchange contracts along with the associated losses and gains on the revaluation and settlement of the short-term intercompany balances, accounts receivable and cash balances are recorded in current operations in other income.
F-42
Phase Forward Incorporated
Notes to Consolidated Financial Statements (Continued)
The following table summarizes the outstanding forward foreign exchange contracts held by the Company at December 31, 2008 and 2009:
| |
|
As of December 31, | |||||||||||||
|---|---|---|---|---|---|---|---|---|---|---|---|---|---|---|---|
| |
|
2008 | 2009 | ||||||||||||
Currency
|
Hedge Type | Local Currency Amount |
Approximate U.S. Dollar Equivalent |
Local Currency Amount |
Approximate U.S. Dollar Equivalent |
||||||||||
British pound |
Sale | — | $ | — | 1,000 | $ | 1,612 | ||||||||
British pound |
Buy | 1,200 | 1,765 | — | — | ||||||||||
Euro |
Sale | 7,500 | 10,454 | 3,200 | 4,571 | ||||||||||
Japanese yen |
Sale | 45,000 | 477 | — | — | ||||||||||
|
$ | 12,696 | $ | 6,183 | |||||||||||
The forward foreign exchange contracts are short-term and generally mature within one month of origination.
Realized and unrealized foreign currency gains and losses, net of hedging are accounted for in other income. The Company recorded foreign currency losses of $42, $554 and $110 for the years ended December 31, 2007, 2008 and 2009, respectively. The Company settles forward foreign exchange contracts in cash. As of December 31, 2008 and 2009, the Company recorded $(1,059) and $192, respectively, of foreign exchange gains/(losses) in other income (expense) as a result of outstanding forward foreign exchange contracts.
13. Fair Value Measurements
Fair value is an exit price, representing the price that would be received to sell an asset or paid to transfer a liability in an orderly transaction between market participants based on the highest and best use of the asset or liability. As such, fair value is a market-based measurement that should be determined based on assumptions that market participants would use in pricing an asset or liability. The Company uses valuation techniques to measure fair value that maximize the use of observable inputs and minimize the use of unobservable inputs. These inputs are prioritized as follows:
- •
- Level 1: Observable inputs such as quoted prices
for identical assets or liabilities in active markets;
- •
- Level 2: Inputs, other than the quoted prices in
active markets, that are observable either directly or indirectly such as quoted prices for similar assets or liabilities or market-corroborated inputs; and
- •
- Level 3: Unobservable inputs for which there is little or no market data, which require the reporting entity to develop its own assumptions about how market participants would price the assets or liabilities.
The valuation techniques that may be used to measure fair value are as follows:
- A.
- Market approach—Uses prices and other relevant information generated by market transactions involving identical or comparable assets or liabilities
F-43
Phase Forward Incorporated
Notes to Consolidated Financial Statements (Continued)
- B.
- Income approach—Uses valuation techniques to convert future amounts to a single present amount
based on current market expectations about those future amounts, including present value techniques, option-pricing models and excess earnings method
- C.
- Cost approach—Based on the amount that currently would be required to replace the service capacity of an asset (replacement cost)
The following table sets forth the Company's financial instruments carried at fair value using the lowest level of input as of December 31, 2009:
| |
Quoted Prices in Active Markets for Identical Items (Level 1) |
Significant Other Observable Inputs (Level 2) |
Significant Unobservable Inputs (Level 3) |
Total | |||||||||||
|---|---|---|---|---|---|---|---|---|---|---|---|---|---|---|---|
Assets: |
|||||||||||||||
Money market funds |
$ | 22,495 | $ | — | $ | — | $ | 22,495 | |||||||
Restricted cash |
962 | — | — | 962 | |||||||||||
Total cash equivalents and restricted cash |
$ | 23,457 | $ | — | $ | — | $ | 23,457 | |||||||
U.S. agency notes |
$ | — | $ | 22,348 | $ | — | $ | 22,347 | |||||||
Corporate bonds |
— | 25,523 | — | 25,523 | |||||||||||
Auction rate securities(1) |
— | — | 19,370 | 19,370 | |||||||||||
Securities settlement agreement |
— | — | 4,345 | 4,345 | |||||||||||
Total short-term investments |
$ | — | $ | 47,871 | $ | 23,715 | $ | 71,586 | |||||||
U.S. agency notes |
$ | — | $ | 13,742 | $ | — | $ | 13,742 | |||||||
Corporate bonds |
— | 12,697 | — | 12,697 | |||||||||||
Total long-term investments |
$ | — | $ | 26,439 | $ | — | $ | 26,439 | |||||||
Total assets |
$ | 23,457 | $ | 74,310 | $ | 23,715 | $ | 121,482 | |||||||
- (1)
- The Company's investments in ARS and the securities settlement agreement with UBS are classified within Level 3 because there are currently no active markets for ARS and the Company is unable to obtain independent valuations from market sources. Therefore, the ARS were primarily valued based on an income approach using an estimate of future cash flows. For additional information regarding ARS, see Note 2.
The following table sets forth a summary of changes in the fair value of the Company's Level 3 financial assets for the twelve months ended December 31, 2009:
| |
Level 3 Financial Assets |
|||
|---|---|---|---|---|
Balance, beginning of period |
$ | 23,344 | ||
Transfers in (out) of Level 3 |
— | |||
Sales |
(250 | ) | ||
Realized gains/(losses) |
— | |||
Unrealized gains/(losses) on securities held at period end |
621 | |||
Balance, end of period |
$ | 23,715 | ||
F-44
Phase Forward Incorporated
Notes to Consolidated Financial Statements (Continued)
Realized gains and losses from sales of the Company's investments are included in "Other income" and unrealized gains and losses are included as a separate component of equity, net of tax, unless the loss is determined to be other-than-temporary.
The Company measures eligible assets and liabilities at fair value with changes in value recognized in earnings. Fair value treatment may be elected either upon initial recognition of an eligible asset or liability or, for an existing asset or liability, if an event triggers a new basis of accounting. The Company did not elect to re-measure any of its existing financial assets or liabilities, and did not elect the fair value option for any financial assets and liabilities transacted in the year-ended December 31, 2009, except for the put option related to the Company's ARS that was recorded in conjunction with a settlement agreement with UBS as more fully described in Note 2.
14. Business Segments and Geographic Information
Disclosure requirements about segments of an enterprise and related information establishes standards for reporting information regarding operating segments in annual financial statements and requires selected information of those segments to be presented in interim financial reports issued to stockholders. Operating segments are identified as components of an enterprise about which separate discrete financial information is available for evaluation by the chief operating decision-maker, or decision-making group, in making decisions on how to allocate resources and assess performance. The Company's chief decision maker is the chief executive officer. The Company views its operations and manages its business as one operating segment.
Geographic Data
Financial information by geographic area for the years ended December 31, 2007, 2008 and 2009 are as follows:
The following table summarizes revenues recorded in each of the Company's principal sales office locations:
| |
Year Ended December 31, | ||||||||||
|---|---|---|---|---|---|---|---|---|---|---|---|
| |
2007 | 2008 | 2009 | ||||||||
Revenues: |
|||||||||||
North America |
$ | 68,283 | $ | 94,555 | $ | 130,536 | |||||
United Kingdom |
46,575 | 51,417 | 57,572 | ||||||||
France |
11,901 | 15,099 | 15,788 | ||||||||
Asia Pacific |
7,530 | 9,113 | 9,361 | ||||||||
|
$ | 134,289 | $ | 170,184 | $ | 213,257 | |||||
F-45
Phase Forward Incorporated
Notes to Consolidated Financial Statements (Continued)
The following table summarizes property and equipment, net by location within and outside the U.S.:
| |
As of December 31, | |||||||
|---|---|---|---|---|---|---|---|---|
| |
2008 | 2009 | ||||||
Property and equipment, net: |
||||||||
United States |
$ | 35,829 | $ | 50,812 | ||||
United Kingdom |
407 | 501 | ||||||
Other |
379 | 1,527 | ||||||
|
$ | 36,615 | $ | 52,840 | ||||
15. Employee Benefit Plan
On January 1, 1998, the Company adopted the Phase Forward Incorporated 401(k) Plan (the "401(k) Plan"). The 401(k) Plan allows employees to make pretax contributions up to the maximum allowable amount set by the Internal Revenue Service. Under the 401(k) Plan, the Company may match a portion of the employee contribution up to a defined maximum. The Company may, but is not obligated to, provide profit sharing to employees. For the years ended December 31, 2007 and 2008, the Company made no matching contributions. For the year ended December 31, 2009, the Company made matching contributions of $507, representing 50% of contributions per employee, up to a maximum Company contribution per employee of $3.
16. Quarterly Financial Data (unaudited)
The following table presents a summary of quarterly results of operations for 2008 and 2009:
| |
First Quarter |
Second Quarter |
Third Quarter |
Fourth Quarter |
||||||||||
|---|---|---|---|---|---|---|---|---|---|---|---|---|---|---|
Year ended December 31, 2008: |
||||||||||||||
Total revenues |
$ | 38,020 | $ | 40,851 | $ | 42,991 | $ | 48,322 | ||||||
Gross margin |
21,837 | 23,034 | 24,467 | 27,906 | ||||||||||
Net income applicable to common stockholders |
4,002 | 3,694 | 3,441 | 2,708 | ||||||||||
Net income per share applicable to common stockholders: |
||||||||||||||
Basic |
$ | 0.10 | $ | 0.09 | $ | 0.08 | $ | 0.06 | ||||||
Diluted |
$ | 0.09 | $ | 0.08 | $ | 0.08 | $ | 0.06 | ||||||
Year ended December 31, 2009: |
||||||||||||||
Total revenues |
$ | 48,816 | $ | 52,501 | $ | 53,119 | $ | 58,821 | ||||||
Gross margin |
28,351 | 30,471 | 29,484 | 32,516 | ||||||||||
Net income/(loss) applicable to common stockholders |
4,078 | 2,227 | 1,809 | (68 | ) | |||||||||
Net income/(loss) per share applicable to common stockholders: |
||||||||||||||
Basic |
$ | 0.10 | $ | 0.05 | $ | 0.04 | $ | (0.00 | ) | |||||
Diluted |
$ | 0.09 | $ | 0.05 | $ | 0.04 | $ | (0.00 | ) | |||||
F-46
| Exhibit No. |
Description | ||
|---|---|---|---|
| 2.1 | # | Agreement and Plan of Merger by and among Phase Forward, Merger Sub, Lincoln and Lincoln SR dated as of August 16, 2005. (Incorporated by reference herein to Exhibit 2.1 of the Company's Current Report on Form 8-K filed with the SEC on August 31, 2005.) | |
| 2.2 | Amendment No. 1 to Agreement and Plan of Merger by and among Phase Forward, Lincoln and Lincoln SR dated as of September 13, 2006. (Incorporated by reference herein to Exhibit 10.1 of the Company's Current Report on Form 8-K filed with the SEC on September 15, 2006.) | ||
| 2.3 | Unit Purchase Agreement by and among Clarix LLC, the Member Representative (as defined therein), the Selling Interest Holders listed therein, and Phase Forward Incorporated dated as of September 5, 2008. (Incorporated by reference herein to Exhibit 2.1 of the Company's Current Report on Form 8-K filed with the SEC on September 11, 2008.) | ||
| 2.4 | Agreement and Plan of Merger by and among Phase Forward Incorporated, Waban Software, Inc., Pecan Acquisition Corp. and the Securityholder Representative, dated as of April 22, 2009 (Incorporated by reference herein to Exhibit 2.1 of the Company's Current Report on Form 8-K filed with the SEC on April 22, 2009.) | ||
| 3.1 | Amended and Restated Certificate of Incorporation of the Registrant dated July 20, 2004. (Incorporated by reference herein to the exhibits to the Company's Registration Statement on Form S-1 (File No. 333-113594), as amended.) | ||
| 3.2 | Amended and Restated Bylaws of the Registrant. (Incorporated by reference herein to the exhibits to the Company's Registration Statement on Form S-1 (File No. 333-113594), as amended.) | ||
| 3.3 | Amendment No. 1 to the Amended and Restated By-laws. (Incorporated by reference herein to Exhibit 3.1 of the Company's Current Report on Form 8-K filed with the SEC on May 13, 2009.) | ||
| 4.1 | Specimen Certificate for shares of the Registrant's Common Stock. (Incorporated by reference herein to the exhibits to the Company's Registration Statement on Form S-1 (File No. 333-113594), as amended.) | ||
| 10.1 | + | 1997 Stock Option Plan. (Incorporated by reference herein to the exhibits to the Company's Registration Statement on Form S-1 (File No. 333-113594), as amended.) | |
| 10.2 | + | Amended and Restated 2003 Non-Employee Director Stock Option Plan, as amended. (Incorporated by reference herein to Exhibit 10.1 of the Company's Quarterly Report on Form 10-Q filed with the SEC on August 10, 2005.) | |
| 10.3 | + | Amendment No. 1 to the 2004 Stock Option and Incentive Plan as Amended and Restated March 2006. (Incorporated by reference herein to Exhibit 10.4 to the Company's Quarterly Report on Form 10-Q filed with the SEC on May 3, 2007.) | |
| 10.4 | + | Amended and Restated 2004 Employee Stock Purchase Plan. (Incorporated by reference herein to Exhibit 10.4 of the Company's Annual Report on Form 10-K filed with the SEC on March 13, 2006.) | |
| 10.5 | + | Form of Incentive Stock Option Agreement. (Incorporated by reference herein to Exhibit 10.4 of the Company's Quarterly Report on Form 10-Q filed with the SEC on November 10, 2004.) | |
| 10.6 | + | Form of Non-Statutory Stock Option Agreement. (Incorporated by reference herein to Exhibit 10.5 of the Company's Quarterly Report on Form 10-Q filed with the SEC on November 10, 2004.) | |
| 10.7 | + | Form of Non-Statutory Stock Option Agreement (U.K.). (Incorporated by reference herein to Exhibit 10.3 of the Company's Quarterly Report on Form 10-Q filed with the SEC on August 10, 2005.) | |
| 10.8 | + | Form of Stock Option Grant Certificate under the Registrant's Amended and Restated 1997 Stock Option Plan. (Incorporated by reference herein to Exhibit 10.1 of the Company's Current Report on Form 8-K filed with the SEC on December 30, 2005.) | |
| 10.9 | + | Form of Restricted Stock Award Agreement. (Incorporated by reference herein to Exhibit 10.1 to the Company's Current Report on Form 8-K filed with the SEC on June 12, 2006.) | |
| Exhibit No. |
Description | ||
|---|---|---|---|
| 10.10 | + | Form of Restricted Stock Unit Award Agreement. (Incorporated by reference herein to Exhibit 10.24 to the Company's Annual Report on Form 10-K filed with the SEC on March 1, 2007.) | |
| 10.11 | + | Form of Restricted Stock Unit Award Agreement. (Incorporated by reference herein to Exhibit 10.3 of the Company's Current Report on Form 8-K filed with the SEC on March 6, 2007.) | |
| 10.12 | + | Form of Phase Forward Incorporated Restricted Stock Unit Award Agreement for Clarix LLC Founders (Incorporated by reference herein to Exhibit 99.1 to the Company's Registration Statement on Form S-8 (File No. 333-153335).) | |
| 10.13 | + | Form of Phase Forward Incorporated Restricted Stock Unit Award Agreement for Clarix LLC Employees (Incorporated by reference herein to exhibit 99.1 to the Company's Registration Statement on Form S-8 (File No. 333-153335).) | |
| 10.14 | + | Phase Forward Incorporated Management Incentive Plan (Effective January 1, 2009) (Incorporated by reference herein to Exhibit 10.1 to the Company's Current Report on Form 8-K filed with the SEC on February 13, 2009.) | |
| 10.15 | + | Summary of cash compensation practices for non-employee directors. (Incorporated by reference herein to Exhibit 10.24 to the Company's Annual Report on Form 10-K filed with the SEC on March 17, 2008.) | |
| 10.16 | + | Form of Executive Agreement between the Registrant and its officers, as amended March 7, 2005 and June 6, 2006, as restated on February 28, 2008 and as further amended on November 4, 2008. (Incorporated by reference herein to Exhibit 10.17 to the Company's Annual Report on Form 10-K filed with the SEC on February 27, 2009.) | |
| 10.17 | + | Form of Management Retention Agreement. (Incorporated by reference herein to the Exhibit 10.3 to the Company's Current Report on Form 8-K filed with the SEC on September 11, 2008.) | |
| 10.18 | + | Form of Management Retention Agreement. (Incorporated by reference herein to the Exhibit 10.4 to the Current Report on Form 8-K filed with the SEC on September 11, 2008.) | |
| 10.19 | + | Form of Indemnification Agreement between the Registrant and each of its directors and certain executive officers. (Incorporated by reference herein to the exhibits to the Company's Registration Statement on Form S-1 (File No. 333-113594), as amended.) | |
| 10.20 | License Agreement by and among Mark L. Kozam d/b/a MLK Software and Datasci, LLC, and the Company. (Incorporated by reference herein to Exhibit 10.5 of the Company's Quarterly Report on Form 10-Q filed with the SEC on May 10, 2006.) | ||
| 10.21 | Sublease Agreement between the Registrant and BMC Software, Inc. (Incorporated by reference herein to the exhibits to the Company's Registration Statement on Form S-1 (File No. 333-113594), as amended.) | ||
| 10.22 | Lease dated February 13, 2008 between Phase Forward Incorporated and BP Fourth Avenue, L.L.C. (Incorporated by reference herein to Exhibit 10.1 to the Company's Current Report on Form 8-K filed with the SEC on February 19, 2008.) | ||
| 10.23 | Seventh Loan Modification Agreement with Silicon Valley Bank (Incorporated by reference herein to Exhibit 10.6 to the Company's Quarterly Report on Form 10-Q filed with the SEC on May 10, 2006.) | ||
| 10.24 | + | Form of Phase Forward Incorporated Restricted Stock Unit Award Agreement (Key Employee Form). (Incorporated by reference herein to Exhibit 99.1 of the Company's Registration Statement on Form S-8 filed with the SEC on April 22, 2009.) | |
| 10.25 | + | Form of Phase Forward Incorporated Restricted Stock Unit Award Agreement (Standard Employee Form). (Incorporated by reference herein to Exhibit 99.2 of the Company's Registration Statement on Form S-8 filed with the SEC on April 22, 2009.) | |
| 10.26 | + | Phase Forward Incorporated Management Incentive Plan. (Incorporated by reference herein to the exhibits to the Company's Current Report on Form 8-K filed with the SEC on February 13, 2009.) | |
| 10.27 | + | Non-Employee Directors' Deferred Compensation Program Plan. (Incorporated by reference herein to the exhibits to the Company's Quarterly Report on Form 10-Q filed with the SEC on May 8, 2009.) | |
| Exhibit No. |
Description | ||
|---|---|---|---|
| 10.28 | + | Amended and Restated 2004 Stock Option and Incentive Plan (Incorporated by reference herein to Exhibit 10.1 of the Company's Current Report on Form 8-K filed with the SEC on May 13, 2009). | |
| 10.29 | + | Senior Executive's Service Agreement between Phase Forward Europe Limited and Stephen Powell. (Incorporated by reference herein to exhibit 10.1 on the Company's current report on Form 8-K filed with the SEC on February 5, 2010.) | |
| 21.1 | * | Subsidiaries of the Registrant. | |
| 23.1 | * | Consent of Ernst & Young LLP, Independent Registered Public Accounting Firm. | |
| 31.1 | * | Certification of CEO pursuant to Rule 13a-14(a) and 15d-14(a) under the Securities Exchange Act of 1934. | |
| 31.2 | * | Certification of CFO pursuant to Rules 13a-14(a) and 15d-14(a) under the Securities Exchange Act of 1934. | |
| 32.1 | * | Certification of CEO pursuant to 18 U.S.C. 1350, as adopted pursuant to Section 906 of the Sarbanes-Oxley Act of 2002. | |
| 32.2 | * | Certification of CFO pursuant to 18 U.S.C. 1350, as adopted pursuant to Section 906 of the Sarbanes-Oxley Act of 2002. | |
- +
- Indicates
a management contract or any compensatory plan, contract or arrangement.
- #
- Confidential
treatment requested for portions of this document.
- *
- Filed herewith.