Attached files
Table of Contents
UNITED STATES
SECURITIES AND EXCHANGE COMMISSION
Washington, D.C. 20549
FORM 10-K
| x | ANNUAL REPORT PURSUANT TO SECTION 13 OR 15 (d) OF THE SECURITIES EXCHANGE ACT OF 1934 |
For the fiscal year ended December 31, 2009
Commission File Number 001-00395
NCR CORPORATION
(Exact name of registrant as specified in its charter)
| Maryland | 31-0387920 | |
| (State or other jurisdiction of incorporation or organization) |
(I.R.S. Employer Identification No.) |
| 3097 Satellite Boulevard Duluth, Georgia |
30096 | |
| (Address of principal executive offices) | (Zip Code) |
Registrant’s telephone number, including area code: (937) 445-5000
Securities registered pursuant to Section 12(b) of the Act:
| Title of each class |
Name of each exchange on which registered | |
| Common Stock, par value $.01 per share | New York Stock Exchange |
Securities registered pursuant to Section 12(g) of the Act: None
Indicate by check mark if the registrant is a well-known seasoned issuer, as defined in Rule 405 of the Securities Act. YES x NO ¨
Indicate by check mark if the registrant is not required to file reports pursuant to Section 13 or Section 15 (d) of the Act. YES ¨ NO x
Indicate by check mark whether the registrant (1) has filed all reports required to be filed by Section 13 or 15 (d) of the Securities Exchange Act of 1934 during the preceding 12 months (or for such shorter period that the registrant was required to file such reports), and (2) has been subject to such filing requirements for the past 90 days. YES x NO ¨
Indicate by check mark whether the registrant has submitted electronically and posted on its corporate Web site, if any, every Interactive File required to be submitted and posted pursuant to Rule 405 of Regulation S-T (§232.405 of this chapter) during the preceding 12 months (or for such shorter period that the registrant was required to submit and post such files). YES ¨ NO ¨
Indicate by check mark if disclosure of delinquent filers pursuant to Item 405 of Regulation S-K is not contained herein, and will not be contained, to the best of the registrant’s knowledge, in definitive proxy or information statements incorporated by reference in Part III of this Form 10-K or any amendment to this Form 10-K. x
Indicate by check mark whether the registrant is a large accelerated filer, an accelerated filer, a non-accelerated filer, or a smaller reporting company. See the definitions of “large accelerated filer,” “accelerated filer,” and “smaller reporting company” in Rule 12b-2 of the Exchange Act. (Check one):
Large accelerated filer x Accelerated filer ¨ Non-accelerated filer ¨ Smaller reporting company ¨
Indicate by check mark whether the registrant is a shell company (as defined in Rule 12b-2 of the Act). YES ¨ NO x
The aggregate market value of voting stock held by non-affiliates of the registrant as of June 30, 2009, was approximately $1.9 billion. As of February 16, 2010, there were approximately 159.7 million shares of common stock issued and outstanding.
Table of Contents
DOCUMENTS INCORPORATED BY REFERENCE
| Part III: | Portions of the Registrant’s Notice of Annual Meeting of Stockholders and Proxy Statement to be filed pursuant to Regulation 14A within 120 days after Registrant’s fiscal year end of December 31, 2009 are incorporated by reference. |
| Item |
Description |
Page | ||
| PART I | ||||
| 1. | 1 | |||
| 1A. | 7 | |||
| 1B. | 13 | |||
| 2. | 13 | |||
| 3. | 13 | |||
| 4. | 13 | |||
| PART II | ||||
| 5. | 14 | |||
| 6. | 15 | |||
| 7. | Management’s Discussion and Analysis of Financial Condition and Results of Operations |
17 | ||
| 7A. | 38 | |||
| 8. | 40 | |||
| 9. | Changes in and Disagreements with Accountants on Accounting and Financial Disclosure |
88 | ||
| 9A. | 88 | |||
| 9B. | 89 | |||
| PART III | ||||
| 10. | 90 | |||
| 11. | 92 | |||
| 12. | Security Ownership of Certain Beneficial Owners and Management and Related Stockholder Matters |
92 | ||
| 13. | Certain Relationships and Related Transactions, and Director Independence |
92 | ||
| 14. | 92 | |||
| PART IV | ||||
| 15. | Exhibits and Financial Statement Schedules | 93 | ||
This Report contains trademarks, service marks, and registered marks of NCR Corporation and its subsidiaries, and other companies, as indicated.
Table of Contents
| Item 1. | BUSINESS |
General
NCR Corporation and its subsidiaries (NCR or the Company, also referred to as “we”, “us” or “our”) provide technology and services that help businesses connect, interact and transact with their customers.
Businesses
NCR Corporation is a leading global technology company that provides innovative products and services to help businesses build stronger relationships with their customers. Through our presence at customer interaction points, such as automated teller machines (ATMs), retail point-of-sale (POS) workstations, self-service kiosks, self-check-in/out systems and DVD kiosks, our solutions enable companies to address consumer demand for convenience, value and individual service. NCR also provides a complete portfolio of services to help customers design, deploy, support and manage technology solutions for our products as well as select third-party products.
Industries Served
NCR provides specific solutions for customers in a range of industries such as financial services, retail and hospitality, travel and gaming, healthcare, and entertainment. NCR’s solutions are built on a foundation of long-established industry knowledge and consulting expertise, value-added software and hardware technology, global customer support services, and a complete line of business consumables and specialty media products.
Company History
NCR was originally incorporated in 1884 and was a publicly traded company on the New York Stock Exchange prior to its merger with a wholly-owned subsidiary of AT&T Corp. (AT&T) on September 19, 1991. Subsequently, on December 31, 1996, AT&T distributed all of its interest in NCR to its stockholders (the “Distribution”). NCR common stock is listed on the New York Stock Exchange and trades under the symbol “NCR”.
On September 30, 2007, NCR completed the spin-off of its Teradata Data Warehousing business through the distribution of a tax-free stock dividend to its stockholders. NCR distributed one share of common stock of Teradata Corporation (Teradata) for each share of NCR common stock to NCR stockholders of record as of the close of business on September 14, 2007. For more information regarding the spin-off of Teradata, refer to Management’s Discussion & Analysis (MD&A) in Item 7 and Note 12 of the Notes to Consolidated Financial Statements, “Discontinued Operations,” in Item 8 of Part II of this Form 10-K report (Report).
Operating Segments
Effective January 1, 2008, NCR reorganized its businesses and management thereof to a geographic model, changing from the previous model of global business units organized by product and service offering. For the year-ended December 31, 2009 and the prior periods reported in this Report, NCR categorizes its operations into three reportable segments: Americas, Europe, Middle East and Africa (EMEA) and Asia Pacific and Japan (APJ). Each of these segments derives revenue by selling products and services to the financial services, retail and hospitality, travel and gaming, healthcare, and entertainment industries. These products and services are described below.
The information required by Item 1 with respect to financial information regarding our reportable segments can be found in Item 7 of Part II of this Report under “Revenue and Gross Margin by Segment” as well as in Item 8 of Part II of this Report as part of Note 13 of the Notes to Consolidated Financial Statements, “Segment Information and Concentrations,” and is incorporated herein by reference.
1
Table of Contents
Products and Services
We sell products and services that help businesses connect, interact and transact with their customers. Our product and service offerings fall into the following categories:
ATMs and Financial Terminals
We provide financial institutions, retailers and independent deployers with financial-oriented self-service technologies, such as ATMs, cash dispensers, and software solutions, including the APTRA™ application suite and consulting services related to ATM security, software and bank branch optimization. ATM and Financial Terminal solutions are designed to quickly and reliably process consumer transactions and incorporate advanced features such as automated check cashing/deposit, automated cash deposit, web-enablement and bill payment. These solutions help enable businesses to reduce costs and generate new revenue streams while enhancing customer loyalty.
Self-Service Kiosks
NCR provides self-service kiosks to the retail and hospitality, travel and gaming, healthcare and entertainment industries. NCR’s versatile kiosk solutions can support numerous retail self-service functions, including self-checkout, wayfinding, bill payment and gift registries. We provide kiosk solutions to airlines that enable self check-in and to hotels/casinos that allow guests to check-in/out without assistance. These solutions create pleasant and convenient experiences for consumers and enable our customers to reduce costs. The kiosks for the hospitality industry provide consumers the ability to order and pay at restaurants while enabling our customers to streamline order processing and reduce operating costs. NCR’s healthcare kiosk solutions offer wireless self-check-in for patients, integrate with existing information systems and physician practice management systems to make the check-in and check-out processes more convenient for patients and helping to reduce costs and errors for our customers. NCR Entertainment solutions allow consumers to rent movies and games at their convenience.
Point of Sale
We provide retail-oriented technologies such as Point of Sale (POS) terminals, bar-code scanners, software and services to companies worldwide. Combining our retail industry expertise, software and hardware technologies, implementation and store performance consulting services, our solutions are designed to enable cost reductions and improve retailer operational efficiency while increasing the satisfaction of the retailer’s customers.
Check and Document Imaging
NCR’s Check and Document Imaging offerings provide end-to-end solutions for both traditional paper-based and image-based check and item processing. These solutions utilize advanced image recognition and workflow technologies to automate item processing, helping financial institutions increase efficiency and reduce operating costs. Consisting of hardware, software, consulting and support services, our comprehensive Check and Document Imaging solutions enable check and item-based transactions to be digitally captured, processed and retained within a flexible, scalable environment.
Services
Services are an essential and integrated component of NCR’s complete solution offerings. NCR provides maintenance and support services for all NCR product offerings described above. In addition to these maintenance and support services, NCR also provides other services including site assessment and preparation, staging, installation and implementation, systems management and complete managed services. NCR also services third-party computer hardware from select manufacturers, such as Cisco Systems, who value and leverage NCR’s global service capability. However, NCR’s strategy is to focus primarily on maintenance and
2
Table of Contents
support of NCR-branded products in order to capture higher margin services and significantly reduce redundant costs associated with supporting/servicing multiple third-party products.
In addition to the software solutions described previously, NCR is developing a suite of software and services such as Software as a Service, hosted services, online, mobile, transactional services and applications such as bill pay and digital signage. NCR is also focused on expanding the resale of third party networking products and related service offerings to a broader base of customers in the telecommunications and technology sectors.
Consumables
NCR develops, produces and markets a complete line of printer consumables for various print technologies. These products include two-sided thermal paper (2ST®), paper rolls for receipts in ATMs and POS solutions, inkjet and laser printer supplies, thermal transfer and ink ribbons, labels, laser documents, business forms, and specialty media items such as photo and presentation papers. Consumables are designed to optimize operations and improve transaction accuracy, while reducing overall costs.
Target Markets and Distribution Channels
NCR’s ATMs and financial terminal solutions primarily serve the financial services industry with particular focus on retail banking, which includes traditional providers of consumer banking and financial services. These solutions also serve the retail markets through convenience banking products for retailers designed to complement their core businesses. Customers are located throughout the world in both established and emerging markets. NCR has historically sold most of its ATMs and financial terminal products and services through a direct sales channel, although a portion of revenues is derived through distributors and value-added resellers.
NCR provides self-service kiosk and POS solutions to retail and hospitality, travel and gaming, healthcare and entertainment industries. Retail and hospitality customers include department stores, specialty retailers, mass merchandisers, catalog stores, supermarkets, hypermarkets, grocery stores, drug stores, wholesalers, convenience stores, fast food/quick service/table service and other restaurants. The travel and gaming customers include airlines, airports, car rental, hotel/lodging and casinos. NCR’s healthcare customers include hospitals, clinics and other healthcare providers. Self-service kiosk and POS solutions are sold through a direct sales force and through alliances with value-added resellers, distributors and dealers. NCR has focused its investments and resources on self-service technologies with expanded offerings to include DVD kiosks for the entertainment industry, self-ticketing for the travel industry and patient management check-in/out in the healthcare sector.
NCR’s imaging solutions primarily serve the financial services industry worldwide, with the primary focus on banks. NCR has historically distributed most of its imaging products and services through a direct sales channel, although certain revenues are derived through sales by value-added resellers and distributors.
Our Consumables products are sold to the financial services and retail and hospitality industries as well as customers involved in transportation and manufacturing. While the Company has a direct sales force in approximately 28 countries for consumables, these products are also sold through various channel partners including office product retailers, contract stationers, value-added resellers, original equipment manufacturers as well as through telemarketing and the internet.
Approximately 93% of our product sales are sold by our direct sales force, with the remainder sold through indirect channels, including value-added resellers, distributors, and dealers.
NCR provides service and support for NCR’s products and solutions through service contracts with our customers. NCR has also established managed service contracts with key customers and continues to pursue additional managed service relationships. Longer term managed service arrangements can help improve the efficiency and performance of the customer’s business, and also increase the strategic and financial importance of its relationship with NCR. We also provide services on competing technologies—for example, IBM retail
3
Table of Contents
technologies and Diebold ATMs. The primary sales channel for our services is NCR’s direct sales teams, which exist in all of NCR’s geographic operating segments. Our services professionals provide these services directly to end customers.
Competition
In the financial services industry, we compete with Diebold, Inc. and Wincor Nixdorf GmbH & Co. (Wincor), as well as many other regional firms, across all of our geographic segments. The primary factors of competition can vary, but typically include: value and quality of the solutions or products; total cost of ownership; industry knowledge of the vendor; the vendor’s ability to provide and support a total end-to-end solution; the vendor’s ability to integrate new and existing systems; the fit of the vendor’s strategic vision with the customer’s strategic direction; and the quality of the vendor’s support and consulting services.
NCR faces a variety of competitors in the retail and hospitality industry in all geographic segments. The Company believes that key competitive factors can vary by geographic area but typically include: value and quality of the solutions or products; total cost of ownership; industry knowledge of the vendor; and knowledge, experience and quality of the vendor’s consulting, deployment and support services. NCR’s competitors vary by market segment, product, service offering and geographic area, and include IBM, Wincor, Fujitsu, Hewlett-Packard, Dell, Honeywell and Datalogic, among others.
NCR faces a diverse group of competitors in the travel and gaming and entertainment industries. Competition in the travel industry includes IBM, SITA and IER. In the gaming industry, NCR’s key competitors are IBM, Wincor and Cummins. In the entertainment industry, competition comes from makers of DVD rental kiosks, including Coinstar, Inc. (through their Redbox DVD kiosk business). Competition in the entertainment industry is currently focused primarily in the United States.
NCR faces competition for services from other technology and service providers, as well as from service-only firms, in all geographies where it operates around the world. The primary services competitors are the companies identified in NCR’s other solutions. Global technology providers are becoming more focused on services as a core business strategy. NCR also competes with a range of smaller regional and local service companies that differ by geography.
Competition for printer consumables is significant and varies by geographic area and product group. The primary areas of competitive differentiation typically include: quality; logistics and supply chain management; and total cost of ownership. While price is always a factor, we focus on the customer’s total cost of ownership for our consumables products. Total cost of ownership takes into account not only the per-unit cost, but also service, usage, reporting and support costs. NCR’s competitors include, among others, RiteMade Paper and Schades.
NCR faces competition in the financial services industry for imaging solutions in all our geographic segments. The primary areas of competition can vary, but typically include: quality of the solutions or products; total cost of ownership; industry knowledge; the vendor’s ability to provide and support a total end-to-end solution; the vendor’s ability to integrate new and existing systems; the fit of the vendor’s strategic vision with the customer’s strategic direction; and the quality of the vendor’s support and consulting services. NCR’s competitors vary by product, service offering and geographic area, and include Metavante Corporation and Unisys Corporation, among others.
Research and Development
We remain focused on designing and developing products, services and solutions that anticipate our customers’ changing technological needs. The expenses for research and development were $141 million in 2009, $148 million in 2008, and $137 million in 2007. We anticipate that we will continue to have significant research and development expenditures in the future to provide a continuing flow of innovative, high-quality products and services to maintain and enhance our competitive position. Information regarding the accounting
4
Table of Contents
and costs included in research and development activities is included in Note 1 of the Notes to Consolidated Financial Statements, “Description of Business and Significant Accounting Policies,” in Item 8 of Part II of this Report and is incorporated herein by reference.
Patents and Trademarks
Our general policy is to seek patent protection for those innovations and improvements that are likely to be incorporated into our products and services, where such protection will improve our competitive position. NCR owns approximately 1,350 patents in the United States and a significant number in foreign countries. The foreign patents are generally counterparts of NCR’s U.S. patents. Many of the patents owned by NCR are licensed to others and NCR is licensed to use certain patents owned by others. While NCR’s portfolio of patents and patent applications in aggregate is of significant value to NCR, the Company does not believe that any particular individual patent is itself of material importance to NCR’s business as a whole.
NCR has registered certain trademarks and service marks in the United States and in a number of foreign countries. NCR considers the mark “NCR” and many of its other trademarks and service marks to be valuable assets.
Seasonality
Our sales are historically seasonal, with lower revenue in the first quarter and higher revenue in the fourth quarter of each year. Such seasonality also causes our working capital cash flow requirements to vary from quarter to quarter depending on variability in the volume, timing and mix of product sales. In addition, revenue in the third month of each quarter is typically higher than in the first and second months. Information regarding seasonality and its potential impact on our business is included in Item 1A of this Report under the caption, “Operating Results Fluctuations,” and is incorporated herein by reference.
Manufacturing and Raw Materials
In most cases, there are a number of vendors providing the services and producing the parts and components that we utilize. However, there are some services and components that are purchased from single sources due to price, quality, technology or other reasons. For example, we depend on computer chips and microprocessors from Intel Corporation and operating systems from Microsoft Corporation. Certain parts and components used in the manufacturing of our ATMs and the delivery of many of our retail solutions are also supplied by single sources. In addition, there are a number of key suppliers for our businesses who provide us with critical products for our solutions.
On a global basis, NCR manufactures its ATMs in facilities located in Columbus, Georgia, USA; Manaus, Brazil; Budapest, Hungary; Beijing, China and Puducherry, India. For payment solutions, self-checkouts and certain kiosks, NCR outsources the manufacturing in all geographic regions to Flextronics International Ltd., a provider of electronics manufacturing and integrated supply-chain services. Flextronics also procures a variety of components used in the manufacturing process on our behalf. Flextronics manufactures these NCR products in Columbia, South Carolina and Plano, Texas.
Refer to Item 1A of this Report under the caption, “Reliance on Third Parties” for further information regarding the potential impact of these relationships on our business operations. Additional information regarding sources and availability of raw materials is also included in Item 1A of this Report under the caption “Reliance on Third Parties,” and is incorporated herein by reference.
Employees
On December 31, 2009, NCR had approximately 21,500 employees and contractors.
5
Table of Contents
Information
NCR makes available through its website, free of charge, its Annual Report on Form 10-K, Quarterly Reports on Form 10-Q, definitive proxy statements on Form 14A and Current Reports on Form 8-K, and all amendments to such reports, as soon as reasonably practicable after these reports are electronically filed or furnished to the U.S. Securities and Exchange Commission (SEC) pursuant to Section 13(a) or 15(d) of the Securities Exchange Act of 1934. The SEC website (www.sec.gov) contains the reports, proxy statements and information statements, and other information regarding issuers that file electronically with the SEC. Also, the public may read and copy any materials the Company files with the SEC at the SEC’s Public Reference Room at 100 F Street, NE, Washington, DC 20549. Information on the operation of the Public Reference Room may be obtained by calling the SEC at 1-800-SEC-0330. NCR will furnish, without charge to a security holder upon written request, the Notice of Meeting and Proxy Statement for the 2010 Annual Meeting of Stockholders (the 2010 Proxy Statement), portions of which are incorporated herein by reference. NCR will furnish the Code of Conduct at no cost and any other exhibit at cost. Document requests are available by calling or writing to:
NCR—Investor Relations
3097 Satellite Boulevard
Duluth, GA 30096
Phone: 800-255-5627
E-Mail: investor.relations@ncr.com
Website: http://investor.ncr.com
Environmental Matters
Compliance with Federal, State, and local environmental regulations relating to the protection of the environment could have a material adverse impact on our capital expenditures, earnings or competitive position. While NCR does not currently expect to incur material capital expenditures related to compliance with such laws and regulations, and while NCR believes the amounts provided in its Consolidated Financial Statements are adequate in light of the probable and estimable liabilities, there can be no assurances that there will not be a material adverse impact on capital expenditures, earnings or competitive position. A detailed discussion of the current estimated impacts of compliance issues relating to environmental regulations, particularly the Fox River matter, is reported in Item 8 of Part II of this Report as part of Note 11 of the Notes to Consolidated Financial Statements, “Commitments and Contingencies,” and is incorporated herein by reference.
6
Table of Contents
| Item 1A. | RISK FACTORS |
This report and other documents that we file with the SEC, as well as other oral or written statements we may make from time to time, contain information based on management’s beliefs and include forward-looking statements (within the meaning of the Private Securities Litigation Reform Act of 1995) that involve a number of known and unknown risks, uncertainties and assumptions. These forward-looking statements are not guarantees of future performance, and there are a number of factors including, but not limited to, those listed below, that could cause actual outcomes and results to differ materially from the results contemplated by such forward-looking statements. We do not undertake any obligation to publicly update or revise any forward-looking statements, whether as a result of new information, future events or otherwise.
Economic Pressures Our business may be negatively affected by current global economic and credit conditions. The current economic climate could impact the ability of our customers to make capital expenditures, thereby affecting their ability to purchase our products or services. Additionally, customers in the financial services sector, which has been severely impacted by the credit crisis, have consolidated in response to the crisis and may continue to do so, which could further impact our business by reducing our customer base. Furthermore, our retail customers are operating in a challenging environment and are faced with weak consumer spending. As a result, these customers could face increased financial pressures that could impact their capital expenditures or ability to pay accounts receivable owed to NCR.
Our customers sometimes finance their purchases of our products and services through third party financing companies. Overall economic conditions may have a material effect on our customers’ ability to obtain such financing, which could result in an adverse effect on our operating results.
Our $500 million five-year unsecured revolving credit facility (the facility), which expires in 2012, is provided by a syndication of several banks that share the committed financing under the facility. Economic and credit market conditions have presented banks and financial institutions with significant challenges, which has led a number of such entities to seek capital from the U.S. federal government. Although we monitor the ability of the banks within the syndication to fulfill their counterparty responsibilities, future market conditions could affect the ability of one or more of these banks to provide the financing that has been committed under the facility. Additionally, the availability under the facility is determined by our compliance with certain financial debt covenants. The inability to access the full capacity of our facility, either from fulfillment of counterparty responsibilities or through our compliance with debt covenants, could have a material, adverse effect on our business, results of operations, and liquidity.
The extent of the impact of current economic conditions will depend on a number of factors, including the length and breadth of the U.S. and global recession, conditions in the global credit markets, and the effects of government actions to stimulate economic conditions.
Competition If we do not compete effectively within the technology industry, we will not be successful. We operate in the intensely competitive information technology industry. This industry is characterized by rapidly changing technology, evolving industry standards, frequent new product introductions, price and cost reductions, and increasingly greater commoditization of products, making differentiation difficult. Our competitors include other large companies in the technology industry, such as: IBM, Hewlett-Packard Company, Diebold, Inc., Wincor, Fujitsu, Unisys Corporation and Coinstar, Inc., some of which have more widespread distribution and penetration of their platforms and service offerings. In addition, we compete with companies in specific market segments, such as entry-level ATMs, imaging solutions, and business consumables and media products. Our future competitive performance and market position depend on a number of factors, including our ability to: react to competitive product and pricing pressures (particularly in the ATM marketplace); penetrate and meet the changing competitive requirements and deliverables in developing and emerging markets, such as India and China in the ATM market; exploit opportunities in new vertical markets, such as travel and gaming, healthcare, and entertainment; rapidly and continually design, develop and market, or otherwise maintain and introduce solutions and related products and services for our customers that are competitive in the marketplace; react on a timely basis to shifts in market demands; compete in reverse auctions for new and continuing business; reduce
7
Table of Contents
costs without creating operating inefficiencies; maintain competitive operating margins; improve product and service delivery quality; and effectively market and sell all of our diverse solutions. Our business and operating performance could be impacted by external competitive pressures, such as increasing price erosion and the entry of new competitors. Our customers sometimes finance our product sales through third-party financing companies. In the case of customer default, these financing companies may be forced to resell this equipment at discounted prices, thus impacting our ability to sell incremental units. The impact of these product and pricing pressures could include lower customer satisfaction, decreased demand for our solutions, loss of market share and reduction of operating profits.
Operating Results Fluctuations Our revenue and operating results could fluctuate for a number of reasons, including:
Manufacturing Insourcing During 2009, we announced that we would begin manufacturing advanced ATMs at our new facilities in Columbus, Georgia, USA and Manaus, Brazil, transitioning from an outsourcing arrangement with Flextronics International Ltd. We began production at both ATM manufacturing facilities during the fourth quarter of 2009. However, if we develop problems with product quality or on-time delivery to customers as a result of this decision, we could experience business interruption that could negatively impact our business and operating results.
Seasonality Our sales are historically seasonal, with lower revenue in the first quarter and higher revenue in the fourth quarter of each year. Such seasonality also causes our working capital cash flow requirements to vary from quarter to quarter depending on the variability in the volume, timing and mix of product sales. In addition, revenue in the third month of each quarter is typically higher than in the first and second months. These factors, among other things, make forecasting more difficult and may adversely affect our ability to manage working capital and to predict financial results accurately.
Foreign Currency Our revenue and operating income are subject to variability due to the effects of foreign currency fluctuations against the U.S. Dollar. We have exposure to approximately 50 functional currencies. Due to our global operations, weaknesses in some of these currencies are sometimes offset by strengths in others. The effects of currency fluctuations are partially mitigated by our hedging strategy; however, certain significant currency fluctuations could adversely affect our results of operations, including sales and gross margins.
Cost/Expense Reductions We are actively working to reduce our costs and expenses to improve operating profitability without jeopardizing the quality of our products or the effectiveness of our operations. Our success in achieving targeted cost and expense reductions depends on a number of factors, including our ability to achieve infrastructure rationalizations, drive lower component costs, improve supply chain efficiencies, and among other things, optimize the efficiency of our customer services resources. If we do not successfully execute on our cost reduction initiatives or if we experience delays in completing the implementation of these initiatives, our results of operations or financial condition could be adversely affected.
Contractual Obligations of Consulting Services We maintain a professional services consulting workforce to fulfill contracts that we enter into with our customers that may extend to multiple periods. Our profitability is largely a function of performing to customer contractual arrangements within the estimated costs to perform these obligations. If we exceed these estimated costs, our profitability related to these contracts may be negatively impacted. In addition, if we are unable to maintain appropriate utilization rates for our consultants, we may not be able to sustain profitability on these contracts.
Diversification While we believe the spin-off of Teradata on September 30, 2007 was the proper strategic move for both companies, following the spin-off, the Company is less diversified than before. Consequently, we must rely primarily on our self-service and assisted-service products (along with the associated services) to drive growth and profitability. If these products or service offerings suffer a significant decrease in demand or increase in costs, our results of operations or financial condition could be adversely affected.
Acquisitions and Divestitures As part of our strategy, we intend to selectively acquire and divest technologies, products and businesses. As these acquisitions and divestitures take place and we begin to include
8
Table of Contents
or exclude, as the case may be, the financial results related to these transactions, it could cause our operating results to fluctuate materially, depending on the size and nature of any future transactions. In addition, our operating results may be adversely affected if we are unable to properly integrate future acquisitions or if investments do not perform or meet our original expectations.
Investment in Entertainment As part of our strategy, we intend to expand our network of DVD-rental kiosks. Our success depends on a number of factors, including the timing of deployment of new DVD-rental kiosks to reach our roll-out target, securing new customer contracts, access to DVD inventory and average time for kiosks to reach maturity. If we do not successfully execute our strategy or if we experience unforeseen delays, our results of operations and financial condition could be adversely affected.
Pension Funds Consistent with local competitive practice and regulations, we sponsor pension plans in many of the countries where we do business. A number of these pension plans are supported by pension fund investments that are subject to financial market risk. Additionally, we are required to make a number of actuarial assumptions for each plan, including the expected long-term return on plan assets and the discount rate on a country-by-country basis after consultation with independent actuarial consultants. We examine interest rate levels and trends within each country, particularly yields on high-quality long-term corporate bonds, relative to our expected future benefit payments to determine our discount rate assumptions. Our long-term expected rate of return on asset assumptions are developed by considering the asset allocation and implementation strategies employed by each pension fund relative to capital market expectations.
In 2008, financial markets experienced significant volatility, with declining government bond yields and widening credit spreads on fixed income investments and poor performance in equity markets. Although the equity markets improved somewhat in 2009, we have a significant, underfunded pension obligation, which may require material increases in cash contributions in future years. Our financial position and liquidity could be materially impacted by these contributions. See “Effects of Pension, Postemployment and Postretirement Benefit Plans” and “Financial Condition, Liquidity And Capital Resources” sections of the MD&A included in Item 7 of Part II of this Report and Note 9, “Employee Benefit Plans” in the Notes to the Consolidated Financial Statements included in Item 8 of Part II of this Report for further information regarding the funded status of our plans and future cash contributions.
Our future financial results could be materially impacted by further volatility in the performance of financial markets, changes in regulations regarding funding requirements, and changes in the actuarial assumptions, including those described in our “Critical Accounting Policies and Estimates” section of the MD&A included in Item 7 of Part II of this Report.
Stock-based Compensation Similar to other companies, we use stock awards as a form of compensation for certain employees. All stock-based payments to employees, including grants of employee stock options, are required to be recognized in the financial statements based on their fair values. The amount recognized for stock compensation expense could vary depending on a number of assumptions or changes that may occur. For example, assumptions such as the risk-free rate, expected holding period and expected volatility that drive our valuation model could change. Other examples that could have an impact include changes in the mix and type of awards, changes in our compensation plans or tax rate, changes in our forfeiture rate, differences in actual results compared to management’s estimates for performance-based awards or an unusually high amount of expirations of stock options.
Income Taxes We are subject to income taxes in the United States and a number of foreign jurisdictions. We recognize deferred tax assets and liabilities based on the differences between the financial statement carrying amounts and the tax basis of assets and liabilities. Significant judgment is required in determining our provision for income taxes. We regularly review our deferred tax assets for recoverability and establish a valuation allowance if it is more likely than not that some portion or all of a deferred tax asset will not be realized. As a result of the significant declines in the value of pension plan assets and increases in the actuarially valued pension benefit obligations, our deferred tax assets increased significantly in 2008 and totaled $736 million at December 31, 2009. If we are unable to generate sufficient future taxable income, if there is a material change in the actual effective tax rates, if the time period within which the underlying temporary differences become
9
Table of Contents
taxable or deductible, or if the tax laws change unfavorably, then we could be required to increase our valuation allowance against our deferred tax assets, which could result in a material increase in our effective tax rate. Additionally, we are subject to ongoing tax audits in various jurisdictions both in the U.S. and internationally, the outcomes of which could result in the assessment of additional taxes. Our effective tax rate in the future could be adversely affected by changes in the mix of earnings in countries with differing statutory tax rates, the changes in the valuation of deferred tax assets and liabilities, changes in tax laws and regulations, and management’s assessment in regards to repatriation of earnings.
Real Estate Our strategy over the past several years with respect to owned and leased real estate has been to reduce our holdings of excess real estate. In line with this strategy, the exit of facilities may affect net income, and current and future real estate market conditions could impede our ability to reduce the size of our real estate portfolio or affect the amount of consideration received in any transactions.
Multinational Operations Our multinational operations expose us to business and legal risk in the various countries where we do business. For the years ended December 31, 2009 and 2008, the percentage of revenues from outside of the United States was 65% and 67%, respectively. We believe that our geographic diversity may help to mitigate some risks associated with geographic concentrations of operations (e.g., adverse changes in foreign currency exchange rates, deteriorating economic environments or business disruptions due to economic or political uncertainties). However, our ability to manufacture and sell our solutions domestically in the United States and internationally is subject to risks, which include among others: the impact of the global economic and credit crises on the stability of national economies, including those of countries where we have operations; political conditions in each country that could adversely affect demand for our solutions in these markets; the impact of a continued downturn in the global economy on demand for our products in these countries; currency exchange rate fluctuations that could result in lower demand for our products as well as generate currency translation losses; changes to and compliance with a variety of local laws and regulations that may increase our cost of doing business in these markets or otherwise prevent us from effectively competing in these markets; changing competitive requirements and deliverables in developing and emerging markets; and the impact of civil unrest relating to war and terrorist activity on the economy or markets in general, or on our ability, or that of our suppliers, to meet commitments.
Introduction of New Solutions If we do not swiftly and successfully develop and introduce new solutions in the competitive, rapidly changing environment in which we do business, our business results will be impacted. The development process for our solutions requires high levels of innovation from both our product development team and our suppliers of the components embedded in our solutions. In addition, the development process can be lengthy and costly, and requires us to commit a significant amount of resources to bring our business solutions to market. If we are unable to anticipate our customers’ needs and technological trends accurately, or are otherwise unable to complete development efficiently, we would be unable to introduce new solutions into the market on a timely basis, if at all, and our business and operating results could be impacted. Likewise, we sometimes make assurances to customers regarding the operability and specifications of new technologies, and our results could be impacted if we are unable to deliver such technologies as planned. Also, if we cannot successfully market and sell both existing and newly developed solutions, our business and operating results could be impacted. Our hardware and software-based solutions may contain known, as well as undetected errors, which may be found after the product introductions and shipments. While we attempt to remedy errors that we believe would be considered critical by our customers prior to shipment, we may not be able to detect or remedy all such errors, and this could result in lost revenues, delays in customer acceptance and incremental costs, each of which would impact our business and operating results.
Reliance on Third Parties If third-party suppliers upon which we rely are not available, our ability to bring our products to market in a timely fashion could be affected. In most cases, there are a number of vendors providing the services and producing the parts and components that we utilize. However, there are some services and components that are purchased from single sources due to price, quality, technology or other reasons. For example, we depend on transaction processing services from Accenture, computer chips and microprocessors from Intel Corporation, contract manufacturing from Flextronics International Ltd. and operating systems from Microsoft Corporation. Certain parts and components used in the manufacturing of our ATMs and the delivery of
10
Table of Contents
many of our retail solutions are also supplied by single sources. In addition, there are a number of key suppliers for our businesses who provide us with critical products for our solutions. If we were unable to purchase the necessary services, including contract manufacturing, parts, components or products from a particular vendor, and we had to find an alternative supplier, our new and existing product shipments and solution deliveries could be delayed, impacting our business and operating results.
We have, from time to time, formed alliances with third parties that have complementary products, software, services and skills. Many different relationships are formed by these alliances, such as outsourcing arrangements to manufacture hardware and subcontract agreements with third parties to perform services and provide products and software to our customers in connection with our solutions. For example, we rely on third parties for cash replenishment services for our ATM products. Also, some of these third parties have access to confidential NCR and customer data, the integrity and security of which we need to ensure. These alliances introduce risks that we cannot control, such as nonperformance by third parties and difficulties with or delays in integrating elements provided by third parties into our solutions. Lack of information technology infrastructure, shortages in business capitalization, and manual processes and data integrity issues of smaller suppliers can also create product time delays, inventory and invoicing problems, staging delays, as well as other operating issues. The failure of third parties to provide high-quality products or services that conform to required specifications or contractual arrangements could impair the delivery of our solutions on a timely basis, create exposure for non-compliance with our contractual commitments to our customers and impact our business and operating results.
Intellectual Property Our continuing ability to be a leading technology and services solutions provider could be negatively affected if we do not develop and protect intellectual property that drives innovation. To that end, it is critical that we continue to develop leading technologies to protect and enhance our proprietary rights in our intellectual property through patent, copyright, trademark and trade secret laws. These efforts include protection of the products and application, diagnostic and other software we develop. To the extent we are not successful, our business could be adversely impacted. Also, many of our offerings rely on technologies developed by others, and if we are unable to continue to obtain licenses for such technologies, our business would be impacted. Over the last several years, there has been an increase in the issuance of software and business method patents, and more companies are aggressively enforcing their intellectual property rights. This trend could impact NCR because, from time to time, we receive notices from third parties regarding patent and other intellectual property claims. Whether such claims are with or without merit, they may require significant resources to defend. If an infringement claim is successful, or in the event we are unable to license the infringed technology or to substitute similar non-infringing technology, our business could be adversely affected.
Work Environment Our restructuring and re-engineering initiatives could negatively impact productivity and business results. As part of our ongoing efforts to optimize our cost structure, from time to time, we shift and realign our employee resources, which could temporarily result in reduced productivity levels. In addition to reducing costs and expenses, we have initiatives to grow revenue, such as improving sales training, addressing sales territory requirements, maintaining and monitoring customer satisfaction with our solutions, and focusing on our strong value propositions. We typically have many initiatives underway. If we are not successful in managing our various restructuring and re-engineering initiatives, our business and operating results could be negatively impacted. On June 2, 2009, we announced the relocation of our world headquarters from Dayton, Ohio to Duluth, Georgia. If we do not effectively transition our workforce by identifying and relocating key positions, hiring qualified candidates in Georgia to fill the remaining positions, and ensuring uninterrupted handoffs of responsibilities from departing NCR associates to new associates, we could experience business disruption due to a loss of historical knowledge and a lack of business continuity that could negatively affect our operating results. If we are not successful in managing our other initiatives and minimizing any resulting loss in productivity, our business and operating results similarly could be negatively impacted.
If we do not attract and retain quality employees, we may not be able to meet our business objectives. Our employees are vital to our success. Our ability to attract and retain highly skilled technical, sales, consulting and other key personnel is critical, as these key employees are difficult to replace. If we are unable to attract or retain highly qualified employees by offering competitive compensation, secure work environments and leadership opportunities now and in the future, our business and operating results could be negatively impacted.
11
Table of Contents
If we do not maintain effective internal controls, accounting policies, practices, and information systems necessary to ensure reliable reporting of our results, our ability to comply with our legal obligations could be negatively affected. Our internal controls, accounting policies and practices, and internal information systems enable us to capture and process transactions in a timely and accurate manner in compliance with applicable accounting standards, laws and regulations, taxation requirements and federal securities laws and regulations. Our internal controls and policies are being closely monitored by management as we continue to implement a worldwide Enterprise Resource Planning (ERP) system. While we believe these controls, policies, practices and systems are adequate to ensure data integrity, unanticipated and unauthorized actions of employees or contractors (both domestic and international), temporary lapses in internal controls due to shortfalls in transition planning and oversight, or resource constraints, could lead to improprieties and undetected errors that could impact our financial condition, results of operations, or compliance with legal obligations. Moreover, while management has concluded that the Company’s internal control over financial reporting was effective as of December 31, 2009 (as set forth in “Management’s Report on Internal Control over Financial Reporting” included in Item 9A of this Report), due to their inherent limitations, such controls may not prevent or detect misstatements in our reported financial statements. Such limitations include, among other things, the potential for human error or circumvention of controls. Further, the Company’s internal control over financial reporting is subject to the risk that controls may become inadequate because of a failure to remediate control deficiencies, changes in conditions or a deterioration of the degree of compliance with established policies and procedures.
Our ability to effectively manage our business could be negatively impacted if we do not invest in and maintain reliable information systems. It is periodically necessary to replace, upgrade or modify our internal information systems. If we are unable to replace, upgrade or modify such systems in a timely and cost-effective manner, especially in light of demands on our information technology resources, our ability to capture and process financial transactions and therefore, our financial condition, results of operations, or ability to comply with legal and regulatory reporting obligations, may be impacted.
Acquisitions and Alliances If we do not successfully integrate acquisitions or effectively manage alliance activities, we may not drive future growth. As part of our overall solutions strategy, we intend to make investments in companies, products, services and technologies, either through acquisitions, investments, joint ventures or strategic alliances. Acquisitions and alliance activities inherently involve risks. The risks we may encounter include those associated with assimilating and integrating different business operations, corporate cultures, personnel, infrastructures and technologies or products acquired or licensed, and the potential for unknown liabilities within the acquired or combined business. Further, we make acquisitions and investments in order to acquire or obtain access to new technology or products that expand our offerings to new industry verticals, such as the entertainment industry. There is risk that the new technology or products may not perform as anticipated or that the new industry verticals may not meet estimated growth projections or expectations, in which case we may not be able to fully realize the benefit of our investments. An acquisition or alliance may also disrupt our ongoing business or we may not be able to successfully incorporate acquired products, services or technologies into our solutions and maintain quality. Further, we may not achieve the projected synergies once we have integrated the business into our operations, which may lead to additional costs not anticipated at the time of acquisition.
Environmental Our historical and ongoing manufacturing activities subject us to environmental exposures. Our facilities and operations are subject to a wide range of environmental protection laws, and we have investigatory and remedial activities underway at a number of facilities that we currently own or operate, or formerly owned or operated, to comply, or to determine compliance, with such laws. In addition, our products are subject to environmental laws in certain jurisdictions. Given the uncertainties inherent in such activities, there can be no assurances that the costs required to comply with applicable environmental laws will not impact future operating results. We have also been identified as a potentially responsible party in connection with certain environmental matters, including the Fox River matter, as further described in Note 11 of the Notes to Consolidated Financial Statements, “Commitments and Contingencies,” included in Item 8 of Part II of this Report; in “Environmental Matters” within Item 1 of Part I of this Report; and in “Environmental and Legal Contingencies” within the “Critical Accounting Policies and Estimates” section of the MD&A included in Item 7 of Part II of this Report, and we incorporate such disclosures by reference and make them a part of this
12
Table of Contents
discussion of risk factors. As described in more detail in such disclosures, we maintain an accrual for our potential liability relating to the Fox River matter that represents certain critical estimates and judgments made by us regarding our potential liability. NCR shares the future clean-up costs with Appleton Papers Inc. (API) based upon an agreement and an arbitration award (along with API, B.A.T. Industries p.l.c. is jointly and severally liable to NCR under the same agreement and award; also, Arjo Wiggins Appleton Ltd. indemnifies API for the Fox River matter, and NCR benefits indirectly from that obligation). Additionally, certain parties are responsible for indemnifying NCR for a portion of the amounts paid by NCR over a certain threshold. The ultimate costs associated with the Fox River matter, our share of those costs and any amounts received from insurers or those parties that owe an indemnification or cost-sharing obligation to NCR, including API, B.A.T. Industries p.l.c., Arjo Wiggins Appleton Ltd, AT&T and Alcatel/Lucent, are subject to a wide range of factors outside of our control, including such companies’ ability to pay on their obligations, which could impact our future operating results and the amount of the accrued liability.
Contingencies We face uncertainties with regard to regulations, lawsuits and other related matters. In the normal course of business, we are subject to proceedings, lawsuits, claims and other matters, including those that relate to the environment, health and safety, employee benefits, export compliance, intellectual property, data privacy and other regulatory compliance and general matters. Because such matters are subject to many uncertainties, their outcomes are not predictable and we must make certain estimates in our financial statements. While we believe that amounts provided in our Consolidated Financial Statements are currently adequate in light of the probable and estimable liabilities, there can be no assurances that the amounts required to satisfy alleged liabilities from such matters will not impact future operating results. Additionally, we are subject to diverse and complex laws and regulations, including those relating to corporate governance, public disclosure and reporting, which are rapidly changing and subject to many possible changes in the future. Although we do not believe that recent regulatory and legal initiatives will result in significant changes to our internal practices or our operations, changes in accounting standards, taxation requirements, and federal securities laws and regulations, among others, may substantially increase costs to our organization or could have an impact on our future operating results.
| Item 1B. | UNRESOLVED STAFF COMMENTS |
None.
| Item 2. | PROPERTIES |
As of January 1, 2010, NCR operated 214 facilities consisting of approximately 6.8 million square feet throughout the world. On a square footage basis, 40% of these facilities are owned and 60% are leased. Within the total facility portfolio, NCR operates 28 research and development and manufacturing facilities totaling 2.5 million square feet, 100% of which is leased. The remaining 6.1 million square feet of space includes office, repair, warehouse and other miscellaneous sites, and is 44% owned. NCR maintains facilities in 59 countries. NCR believes its plants and facilities are suitable and adequate, and have sufficient production capacity to meet its current needs.
NCR is headquartered in Duluth, Georgia.
| Item 3. | LEGAL PROCEEDINGS |
Information regarding legal proceedings is included in Item 8 of Part II of this Report as part of Note 11 of the Notes to Consolidated Financial Statements, “Commitments and Contingencies,” and is incorporated herein by reference.
| Item 4. | SUBMISSION OF MATTERS TO A VOTE OF SECURITY HOLDERS |
None.
13
Table of Contents
| Item 5. | MARKET FOR THE REGISTRANT’S COMMON EQUITY, RELATED STOCKHOLDER MATTERS AND ISSUER PURCHASES OF EQUITY SECURITIES |
NCR common stock is listed on the New York Stock Exchange and trades under the symbol “NCR.” There were approximately 128,375 holders of NCR common stock as of February 16, 2010. The following table presents the high and low per share prices for NCR common stock for each quarter of 2009 and 2008.
| 2009 | 2008 | |||||||||||||||
| High | Low | High | Low | |||||||||||||
| 1st Quarter |
$ | 15.24 | $ | 6.62 | 1st Quarter | $ | 25.08 | $ | 19.25 | |||||||
| 2nd Quarter |
$ | 13.02 | $ | 7.75 | 2nd Quarter | $ | 27.69 | $ | 22.85 | |||||||
| 3rd Quarter |
$ | 14.35 | $ | 10.65 | 3rd Quarter | $ | 28.09 | $ | 20.50 | |||||||
| 4th Quarter |
$ | 13.83 | $ | 9.18 | 4th Quarter | $ | 22.14 | $ | 12.23 | |||||||
Although historically NCR has not paid cash dividends and does not anticipate the payment of cash dividends on NCR common stock in the immediate future, the declaration of dividends would be subject to the discretion of NCR’s Board of Directors.
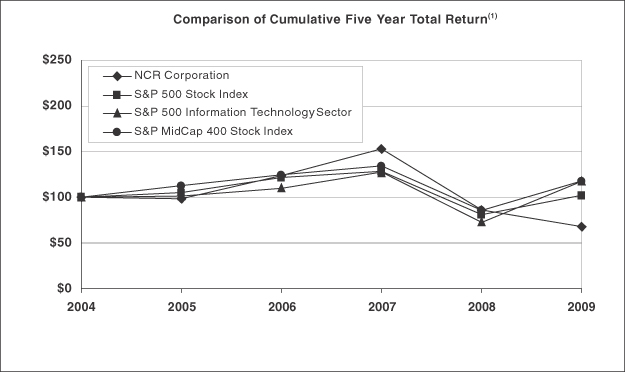
The following graph compares the relative investment performance of NCR stock, the Standard & Poor’s MidCap 400 Stock Index, Standard & Poor’s 500 Information Technology Sector and the Standard & Poor’s 500 Stock Index. This graph covers the five-year period from December 31, 2004 through December 31, 2009.
| Company / Index |
2005 | 2006 | 2007 | 2008 | 2009 | ||||||||||
| NCR Corporation(2) |
$ | 98 | $ | 124 | $ | 153 | $ | 86 | $ | 68 | |||||
| S&P 500 Stock Index |
$ | 105 | $ | 121 | $ | 128 | $ | 81 | $ | 102 | |||||
| S&P 500 Information Technology Sector |
$ | 101 | $ | 109 | $ | 127 | $ | 72 | $ | 117 | |||||
| S&P MidCap 400 Stock Index |
$ | 113 | $ | 124 | $ | 134 | $ | 86 | $ | 117 | |||||
| (1) | In each case, assumes a $100 investment on December 31, 2004, and reinvestment of all dividends, if any. |
| (2) | For the year ended December 31, 2007, includes a dividend of $26.45 per share based on the opening stock price of Teradata Corporation on October 1, 2007. |
14
Table of Contents
Purchase of Company Common Stock The 1999 Board of Directors’ authorization permits the Company to repurchase shares of outstanding common stock. On October 31, 2007, the NCR Board of Directors authorized an additional $250 million for stock repurchases under this program. The 2000 Board of Directors share repurchase program authorized the Company to purchase NCR common stock to the extent of cash received from the exercise of stock options and the purchase of shares under the NCR Employee Stock Purchase Plan (ESPP).
For the year ended December 31, 2009, there were no executed trades for shares of its common stock under the 1999 and 2000 Board of Directors share repurchase programs. As of December 31, 2009, the Company had a total remaining authorization of $37 million to repurchase outstanding shares of NCR common stock under the share repurchase programs.
In addition to those share purchases, the Company occasionally purchases vested restricted stock or exercised stock option shares from Section 16 officers, at the current market price to cover their withholding taxes. For 2009, the total of these purchases was 66,120 shares at an average price of $9.43 per share.
| Item 6. | SELECTED FINANCIAL DATA |
| In millions, except per share and employee and contractor amounts | ||||||||||||||||||||
| For the years ended December 31 | 2009 | 2008 | 2007 | 2006 | 2005 | |||||||||||||||
| Continuing Operations (a) |
||||||||||||||||||||
| Revenue |
$ | 4,612 | $ | 5,315 | $ | 4,970 | $ | 4,582 | $ | 4,561 | ||||||||||
| Income from operations |
$ | 97 | $ | 322 | $ | 219 | $ | 154 | $ | 120 | ||||||||||
| Other expense (income), net |
$ | 184 | $ | 34 | $ | (13 | ) | $ | (5 | ) | $ | 14 | ||||||||
| Income tax (benefit) expense |
$ | (57 | ) | $ | 58 | $ | 61 | $ | 8 | $ | (210 | ) | ||||||||
| (Loss) income from continuing operations (c) |
$ | (30 | ) | $ | 230 | $ | 171 | $ | 151 | $ | 316 | |||||||||
| (Loss) income from discontinued operations, net of tax |
$ | — | $ | (3 | ) | $ | 103 | $ | 231 | $ | 213 | |||||||||
| Basic earnings (loss) per common share attributable to NCR common shareholders: |
||||||||||||||||||||
| From continuing operations (a,c) |
$ | (0.21 | ) | $ | 1.40 | $ | 0.95 | $ | 0.84 | $ | 1.71 | |||||||||
| From discontinued operations |
$ | — | $ | (0.02 | ) | $ | 0.57 | $ | 1.28 | $ | 1.15 | |||||||||
| Total basic earnings (loss) per common share |
$ | (0.21 | ) | $ | 1.38 | $ | 1.52 | $ | 2.12 | $ | 2.86 | |||||||||
| Diluted earnings (loss) per common share attributable to NCR common shareholders: |
||||||||||||||||||||
| From continuing operations (a,c) |
$ | (0.21 | ) | $ | 1.38 | $ | 0.94 | $ | 0.83 | $ | 1.67 | |||||||||
| From discontinued operations |
$ | — | $ | (0.02 | ) | $ | 0.56 | $ | 1.26 | $ | 1.13 | |||||||||
| Total diluted earnings (loss) per common share |
$ | (0.21 | ) | $ | 1.36 | $ | 1.50 | $ | 2.09 | $ | 2.80 | |||||||||
| Cash dividends per share |
$ | — | $ | — | $ | — | $ | — | $ | — | ||||||||||
| As of December 31 |
||||||||||||||||||||
| Total assets |
$ | 4,094 | $ | 4,255 | $ | 4,780 | (b) | $ | 5,227 | $ | 5,287 | |||||||||
| Total debt |
$ | 15 | $ | 308 | $ | 308 | (b) | $ | 307 | $ | 307 | |||||||||
| Total NCR stockholders’ equity |
$ | 564 | $ | 440 | $ | 1,757 | (b) | $ | 1,881 | $ | 2,035 | |||||||||
| Number of employees and contractors |
21,500 | 22,400 | 23,200 | (b) | 28,900 | 28,200 | ||||||||||||||
| (a) | Continuing operations exclude the results of the Teradata Data Warehousing business which was spun-off through a tax free distribution to the Company’s stockholders on September 30, 2007. |
| (b) | Reflects NCR’s assets, debt, stockholders’ equity and number of employees and contractors from continuing operations following the spin-off of Teradata on September 30, 2007. |
| (c) | The following income (expense) amounts are included in income from continuing operations for the years ended December 31: |
15
Table of Contents
| In millions | 2009 | 2008 | 2007 | 2006 | 2005 | |||||||||||||||
| Reserve for legal matters |
$ | (4 | ) | $ | (8 | ) | $ | — | $ | — | $ | — | ||||||||
| Organizational realignment initiative |
— | (45 | ) | — | — | — | ||||||||||||||
| Manufacturing realignment initiative |
— | — | (38 | ) | — | — | ||||||||||||||
| Japan realignment initiative |
— | — | (18 | ) | — | — | ||||||||||||||
| Costs related to Teradata spin-off |
— | — | (12 | ) | — | — | ||||||||||||||
| Costs associated with the Fox River environmental matter, net of insurance recoveries |
(91 | ) | (18 | ) | (9 | ) | — | — | ||||||||||||
| Tax adjustments |
— | — | (10 | ) | — | 9 | ||||||||||||||
| Pension expense associated with early retirement programs |
— | — | — | (7 | ) | (14 | ) | |||||||||||||
| Reductions of prior year accruals |
— | — | — | — | 4 | |||||||||||||||
| Net gains from sales of real estate |
— | 13 | — | — | 11 | |||||||||||||||
| Contribution to NCR charitable foundation |
— | — | — | — | (5 | ) | ||||||||||||||
| Write-down of equity investments and related assets |
(30 | ) | — | — | — | (10 | ) | |||||||||||||
| Settlements of prior year tax audits |
— | — | — | — | 181 | |||||||||||||||
| Incremental costs directly related to the relocation of the worldwide headquarters |
(4 | ) | — | — | — | — | ||||||||||||||
| TOTAL |
$ | (129 | ) | $ | (58 | ) | $ | (87 | ) | $ | (7 | ) | $ | 176 | ||||||
16
Table of Contents
| Item 7. | MANAGEMENT’S DISCUSSION AND ANALYSIS OF FINANCIAL CONDITION AND RESULTS OF OPERATIONS (MD&A) |
BUSINESS OVERVIEW
NCR Corporation is a leading global technology company that provides innovative products and services to help businesses connect, interact and transact with their customers. Through our presence at customer interaction points, such as automated teller machines (ATMs), retail point-of-sale (POS) workstations, self-service kiosks, and self-check-in/out systems, our solutions enable companies to address consumer demand for convenience, value and individual service. We also provide support services for NCR’s solutions as well as select third-party products.
We deliver our products and solutions to many industries on a global basis, including: financial services; retail and hospitality; travel and gaming; healthcare; and entertainment. Starting January 1, 2008, NCR began management of its businesses on a geographic basis made up of three business segments: the Americas; Europe, Middle East, and Africa (EMEA); and Asia Pacific and Japan (APJ).
Our solutions are based on a foundation of long-established industry knowledge and consulting expertise, value-added software, hardware technology, global customer support services, and a complete line of business consumables and specialty media products.
NCR’s reputation has been built upon 125 years of providing quality products, services and solutions to our customers. At the heart of our customer and other business relationships is a commitment to acting responsibly, ethically and with the highest level of integrity. This commitment is reflected in NCR’s Code of Conduct, available on the corporate governance page of our website.
Spin-off of Teradata Data Warehousing Business On September 30, 2007, NCR completed the spin-off of its Teradata Data Warehousing business through the distribution of a tax-free dividend to its stockholders. NCR distributed one share of common stock of Teradata Corporation (Teradata) for each share of NCR common stock to NCR stockholders of record as of the close of business on September 14, 2007. Upon the distribution of Teradata, NCR stockholders received 100% (approximately 181 million shares) of the common stock of Teradata, which is now an independent public company trading under the symbol “TDC” on the New York Stock Exchange.
The results of operations and cash flows of Teradata have been presented as a discontinued operation for all periods presented in this Report. See Note 12, “Discontinued Operations,” in the Notes to Consolidated Financial Statements in Item 8 of Part II of this Report for a further discussion of the spin-off of Teradata. Unless otherwise noted, this MD&A excludes information related to the Teradata Data Warehousing business.
2009 FINANCIAL OVERVIEW
As more fully discussed in later sections of this MD&A, the following were significant themes and events for 2009:
| • | Significant investment in the entertainment kiosk strategy with the roll-out of DVD kiosks on track |
| • | Investment in global manufacturing and sourcing infrastructure with manufacturing facilities in Columbus, Georgia, USA and Manuas, Brazil opened during the fourth quarter of 2009 |
| • | Announcement of the move of the worldwide headquarters to Duluth, Georgia, USA |
| • | Sales declines across all geographic segments |
In 2009, we continued our focus on strategic initiatives to provide maximum value to our stakeholders. The initiatives and the results were as follows:
| 1) | Gain profitable share—We continue to optimize our investments in demand creation to increase NCR’s market share in areas with the greatest potential for profitable growth, which include |
17
Table of Contents
| opportunities in self-service technologies with our core financial services and retail customers. We intend to expand and strengthen our geographic presence and sales coverage in addition to penetrating adjacent single and multi-channel self-service solution segments. |
| 2) | Expand into emerging growth industry segments—The Company continues to focus on broadening the scope of our self-service solutions from our existing customers to expand these solution offerings to customers in newer industry-vertical markets including, travel and gaming, healthcare, and entertainment. We expect to grow our business in these industries through integrated service offerings in addition to targeted acquisitions and strategic partnerships. Our continued investment in our entertainment business, which enabled us to exceed our goal to roll-out our first 2,500 DVD-rental kiosks by the end of 2009, is one example of these efforts. |
| 3) | Build the lowest cost structure in our industry—The Company continues to focus on increasing the efficiency and effectiveness of our core functions and the productivity of our employees. We continued to make progress in this regard during 2009 with the opening of two new ATM manufacturing facilities located in Columbus, Georgia, USA and Manaus, Brazil, which began shipping product in the fourth quarter of 2009. NCR expects both plants to improve product margins as compared to our previous contract-based manufacturing of ATMs in the Americas. |
| 4) | Enhance our global service capability—The Company continues to execute various initiatives to enhance its global service capability. We continue to focus on improving our service positioning, increasing customer service attach rates for our products and continue to improve profitability in our services business. Our service capability can provide us a competitive advantage in winning customers and it provides NCR with an attractive and stable revenue source. |
| 5) | Focus on working capital and balance sheet—In 2009, we continued to focus on further improvement of our working capital position. The Company will continue to make investments in areas that generate maximum growth, such as self-service research and development and demand creation. |
STRATEGY OVERVIEW
Our strategic initiatives for 2010 include:
| 1) | Gain profitable share. We expect to continue to optimize our investments to increase NCR’s market share in areas with the greatest potential for profitable revenue growth, which include opportunities in self-service technologies with our core financial services and retail customers. We intend to expand and strengthen our geographic presence and sales coverage in addition to penetrating adjacent single and converged multi-channel self-service solution segments. |
| 2) | Expand into emerging growth industry segments. The Company expects to continue to focus on broadening the scope of our self-service solutions from our existing customers to expand these solution offerings to customers in newer industry-vertical markets including: entertainment, travel and gaming, and healthcare. We expect to grow our business in these industries through integrated service offerings in addition to targeted acquisitions and strategic partnerships. Additionally, we expect to continue the expansion of our network of DVD-rental kiosks to achieve our roll-out targets, and expand into the emerging entertainment segment of digital media download at kiosks. |
| 3) | Build the lowest cost structure and highest quality platforms in our industry. The Company is focusing on business process innovation by increasing the efficiency and effectiveness of our core functions and the productivity of our employees. While we made progress in this regard during 2008 and 2009, we expect that our execution in 2010 will continue to allow us to capture efficiencies and intended quality improvements and cost savings. |
| 4) | Enhance our global service capability. The Company continues to execute various initiatives to enhance its global service capability. We will continue to focus on improving our service positioning, increasing our service attach rates for our products, build new service offers, and continue to improve profitability in our services business. Our service capability can provide us a competitive advantage in winning customers and it provides NCR with an ever-more attractive and stable revenue source. |
18
Table of Contents
| 5) | Innovation and our people. NCR is committed to solution innovation across all customer industries. Our focus on innovation will be enabled by the integration of NCR Services into the customer industry solutions, as well as a model to apply best practices across all industries though one centralized research development organization and one business decision support function. Innovation is also driven through investments in training and developing our employees by taking advantage of our new world-class training centers. We expect that these steps and investments will accelerate the delivery of new innovative solutions focused on the needs of our customers and changes in consumer behavior. |
FUTURE TRENDS
Deteriorating macroeconomic conditions impacted NCR starting in the fourth quarter of 2008 and continued into 2009, especially in the financial services and retail industries. We expect that our performance in 2010 will continue to be challenged by these conditions. We are projecting that our capital spending in 2010 will be higher than what was experienced in 2009 due to our investment in the entertainment industry. We are forecasting 2010 revenue to be slightly higher than 2009. During this difficult economic environment, we will manage our costs effectively and balance our investments in areas that generate high returns.
We see the following as the most significant risks to the execution of our initiatives:
| • | Global economic and credit environment and its effect on the capital spending by our customers |
| • | Competition that can drive further price erosion and potential loss of market share |
| • | Introduction of products in new self-service markets |
RESULTS FROM CONTINUING OPERATIONS
The following table shows our results for the years ended December 31:
| In millions | 2009 | 2008 | 2007 | |||||||||
| Revenue |
$ | 4,612 | $ | 5,315 | $ | 4,970 | ||||||
| Gross margin |
$ | 883 | $ | 1,183 | $ | 1,040 | ||||||
| Gross margin as a percentage of revenue |
19.1 | % | 22.3 | % | 20.9 | % | ||||||
| Operating expenses |
||||||||||||
| Selling, general, and administrative expenses |
$ | 645 | $ | 713 | $ | 684 | ||||||
| Research and development expenses |
141 | 148 | 137 | |||||||||
| Income from operations |
$ | 97 | $ | 322 | $ | 219 | ||||||
The following table shows our revenues and gross margins from products and services, respectively, for the years ended December 31:
| In millions | 2009 | 2008 | 2007 | |||||||||
| Product revenue |
$ | 2,234 | $ | 2,861 | $ | 2,693 | ||||||
| Cost of products |
1,811 | 2,113 | 2,035 | |||||||||
| Product gross margin |
$ | 423 | $ | 748 | $ | 658 | ||||||
| Product gross margin as a percentage of revenue |
18.9 | % | 26.1 | % | 24.4 | % | ||||||
| Services revenue |
$ | 2,378 | $ | 2,454 | $ | 2,277 | ||||||
| Cost of services |
1,918 | 2,019 | 1,895 | |||||||||
| Services gross margin |
$ | 460 | $ | 435 | $ | 382 | ||||||
| Services gross margin as a percentage of revenue |
19.3 | % | 17.7 | % | 16.8 | % | ||||||
2009 compared to 2008 results discussion
Revenue
Revenue decreased 13% in 2009 from 2008 due to the continued recessionary economic environment, which has negatively impacted sales volumes for both products and services. Foreign currency fluctuations provided a negative impact of 1%. For the year ended December 31, 2009, our product revenue decreased 22% and services revenue decreased 3% compared to the year ended December 31, 2008. The decrease in our product revenue was
19
Table of Contents
due to declines across all of our geographic segments. This was primarily attributable to the overall market and economic conditions and their effect on our customers’ capital spending, especially customers in our primary industry verticals—financial services and retail and hospitality. Product revenue from the financial services industry decreased across all segments, while the retail and hospitality industry was challenging in the Americas and Europe, Middle East and Africa (EMEA) segments. The decrease in services revenue was primarily attributable to the impact of negative foreign currency fluctuations and declines in professional and installation related services, which are typically tied to new product sales and installations. Maintenance services declined slightly in comparison to the prior year which reflects the stable nature of recurring, maintenance based services despite an adverse market for new product sales.
Gross Margin
Gross margin as a percentage of revenue was 19.1% in 2009 compared to 22.3% in 2008. Product gross margin decreased 7.2 percentage points to 18.9% in 2009 compared to 26.1% in 2008. During 2009, product gross margin was adversely affected by approximately $22 million for the write-off of assets and the accrual of purchase commitments related to an equity investment. After considering this item, the decline in product gross margin was due to a change in product mix, decrease in volumes and continued pricing pressures which more than offset the cost savings achieved through our manufacturing realignment and continued focus on cost reduction actions.
Services gross margin increased 1.6 percentage points to 19.3% in 2009 compared to 17.7% in 2008. In 2009, services gross margin was negatively impacted by $77 million in higher pension expense, or 3.2% as a percentage of service revenue. In 2008, services gross margin was negatively impacted by $31 million of organizational realignment costs, or 1.3% as a percentage of service revenue. After considering these items, the services gross margin improvement is primarily due to lower labor and service delivery costs as a result of headcount reductions. These reductions were completed as part of our past organizational realignment efforts and have resulted in more efficient and lower cost service delivery in comparison to the prior year.
2008 compared to 2007 results discussion
Revenue
Revenue increased 7% in 2008 from 2007 due to growth in sales volume for both our products and services. The effects of foreign currency fluctuations provided a favorable impact to revenue of 2% in 2008. In 2008, our product revenue increased 6% and services revenue increased 8% as compared to 2007. The increase in revenues in both products and services was primarily attributable to sales growth across all of our geographic segments, although we experienced lower revenue in the fourth quarter of 2008 as compared to the fourth quarter of 2007. This was attributed to the overall market and economic conditions and its effect on capital spending, especially on customers in the retail and hospitality industry. During 2008, we experienced significant sales growth to customers in the financial services industry across most of our major geographic regions as customers continued to focus on customer interaction and deposit growth.
Gross Margin
Gross margin as a percentage of revenue increased to 22.3% in 2008 from 20.9% in 2007.
Product gross margin was 26.1% in 2008 compared to 24.4% in 2007. The increase in product gross margin is primarily attributed to the reduction in realignment costs incurred in 2008 as compared to 2007. In 2008, NCR incurred organizational realignment costs totaling $5 million, while we incurred approximately $48 million of manufacturing realignment costs in 2007. After considering the impact of these costs, 2008 product gross margin was comparable to 2007.
Services gross margin was 17.7% in 2008 compared to 16.8% in 2007. Organizational realignment costs negatively impacted gross margin by $31 million or approximately 1% in 2008, while 2007 gross margin was
20
Table of Contents
negatively impacted by Japan realignment costs of $19 million or approximately 1%. After considering the impact of these costs, services gross margin improved by 1% in 2008 as compared to 2007. The increase in gross margin was due to productivity improvements, focus on maintenance of NCR-branded products as well as reductions in the overall service delivery cost.
Restructuring and Re-engineering
Organizational Realignment On January 1, 2008, NCR began management of its business on a geographic basis, changing from a previous model of global business units organized by product and service offering. As a result, in the second quarter of 2008, NCR commenced a global realignment initiative to reduce redundancies and process inefficiencies to become more customer-focused and market-driven. This initiative is addressing legacy process inefficiencies and unbalanced resource allocation by focusing on organizational design, process re-engineering and business process outsourcing. The initiative has resulted in reductions in employment and productivity improvements, while freeing up funds to invest in growth programs such as sales, engineering, and market development.
As a result of this initiative, the Company recorded a total of $57 million in employee severance and other termination costs in 2008. Of these costs, $5 million was recorded as cost of products, $31 million was recorded as cost of services, $16 million was recorded as selling, general and administrative expense and the remaining $5 million was recorded as research and development expense. Of the $57 million total expense recognized in 2008, $40 million was recorded as a discrete postemployment benefit cost.
The realignment activities and the associated costs recognized during 2008 for approximately 900 employee terminations related to each of our reportable segments of Americas, EMEA and APJ.
The Company made $20 million in severance payments during 2009. As of December 31, 2009, there is a remaining accrued liability balance of $1 million, including immaterial effects from foreign currency translation. This liability is recorded in the Consolidated Balance Sheet in other current liabilities as the Company expects that payment of the remaining obligation will occur in first quarter 2010.
The actions taken to date generated annualized savings of approximately $40 million. The Company continues to identify additional opportunities focusing on organizational design, process re-engineering and business process outsourcing and therefore, expects additional realignment activities through 2010 as a result of this initiative. The costs and related savings from these additional activities are not reasonably estimable at this time as we are in the process of defining the scope of the activities and quantifying the impacts thereof.
The costs of these realignment initiatives are not expected to have a significant impact on the Company’s financial position, revenues, liquidity or sources and uses of capital resources. The realignment costs are expected to be funded by the Company’s cash on hand and cash flows from operations, and although this will result in short-term cash outflows, the Company expects future cost savings and no adverse impact to revenue as a result of these changes.
Manufacturing Realignment In the first quarter of 2007, the Company initiated a manufacturing realignment initiative primarily related to its ATM products, which included outsourcing certain manufacturing activities in the Americas region and shifting other manufacturing activities from high cost to low cost geographies in the EMEA region as well as the APJ region. This realignment resulted in approximately 1,100 employee terminations and, as expected, improved productivity and freed capital in order to invest the related cost savings in revenue-generating programs such as sales, engineering and market development. As a result of this realignment, in 2007, the Company recorded realignment costs of $40 million, in cost of products, related to employee severance and other termination benefits of which $32 million was recorded as a discrete post employment benefit cost. In addition, the Company incurred costs of $8 million associated with training, travel and professional services during the year ended December 31, 2007, which were directly related to this realignment initiative and were expensed as incurred. The remaining reserve balance of approximately $1 million as of December 31, 2008 was reversed in 2009.
21
Table of Contents
Japan Realignment In the third quarter of 2007, NCR commenced a realignment program in Japan, which was primarily focused on its customer services. The realignment program, which resulted in approximately 130 employee terminations, included actions to improve operating efficiency and strengthen the Company’s competitive position in Japan. As a result of this realignment program, in 2007, the Company recorded $28 million as a discrete postemployment benefit cost for employee severance ($19 million in cost of services and $9 million in selling, general and administrative expense). The reserve for this initiative was fully utilized during the year ended December 31, 2008. The actions taken to date generated annualized savings of approximately $10 to $12 million.
Real estate consolidation and restructuring One of the elements of our re-engineering initiatives is our real estate consolidation and restructuring plan where we continue to evaluate our real estate portfolio of owned and leased properties in order to lower our overall facility costs. During 2009, we sold 6 properties which was offset by leases for our new manufacturing facilities and office space obtained through our 2009 acquisitions. During 2008, we sold 8 properties, representing approximately 2% reduction in total properties from 2007. During 2007, we sold 7 properties, representing approximately a 3% reduction in total properties from 2006. In 2007, we also distributed 21 properties to Teradata in connection with its spin-off.
Effects of Pension, Postemployment and Postretirement Benefit Plans
NCR’s income from continuing operations for the years ended December 31 were impacted by certain employee benefit plans as shown below:
| In millions | 2009 | 2008 | 2007 | |||||||||
| Pension expense |
$ | 159 | $ | 25 | $ | 38 | ||||||
| Postemployment expense |
49 | 91 | 114 | |||||||||
| Postretirement benefit |
(3 | ) | (2 | ) | (1 | ) | ||||||
| Total Expense |
$ | 205 | $ | 114 | $ | 151 | ||||||
In 2009, pension expense increased to $159 million compared to $25 million in 2008 primarily due to the loss on invested plan assets that we experienced in 2008, which caused higher actuarial loss amortization and a lower expected return on plan assets. In 2009, approximately 44% of the pension expense was included in selling, general and administrative and research and development expenses, with the remaining 56% included in cost of products and services. In 2008, the decrease in pension expense from 2007 was primarily due to a reduction in actuarial loss amortization resulting from higher discount rates and the benefit of strong actual returns on plan assets in prior years. We currently expect pension expense of approximately $215 million in 2010. The expected increase in pension expense in 2010 is due to the ongoing amortization of actuarial losses that were driven by significant declines in asset values during 2008 as well as low global interest rates as of the end of 2009.
During 2009, NCR closed its United Kingdom-based manufacturing operation, resulting in a significant reduction in the number of employees enrolled in one of our defined benefit plans. The workforce reduction was accounted for as a curtailment and therefore, the actuarial liability associated with the plan was re-measured as of July 1, 2009. As a result, the pension liability and accumulated other comprehensive loss balances were increased by $35 million. This curtailment did not have a material impact on net loss for 2009.
In May of 2009, NCR completed the consultation process with employee representatives, which was required to freeze the benefits in one of our United Kingdom defined benefit plans, effective July 1, 2009. This action was accounted for as a curtailment and therefore, the actuarial liability associated with the plan was re-measured as of May 31, 2009. As a result, the prepaid pension asset and accumulated other comprehensive loss balances were reduced by $85 million. This curtailment did not have a material impact on net loss for 2009.
Postemployment expense (severance and disability medical) decreased to $49 million in 2009 compared to $91 million in 2008. This decrease was primarily driven by a discrete cost of $40 million related to the organizational realignment initiative recorded during 2008. In 2009, approximately 84% of total postemployment
22
Table of Contents
expense was included in cost of products and services, with the balance included in selling, general and administrative and research and development expenses. Postemployment expense decreased to $91 million in 2008 compared to $114 million in 2007, primarily driven by the reduced realignment activity in 2008. The realignment initiatives are described in more detail in the ‘Restructuring and Re-engineering’ section of this MD&A and Note 3, “Restructuring and Real Estate Transactions,” of the Notes to Consolidated Financial Statements included in Item 8 of Part II of this Report.
Postretirement plans provided a $3 million benefit in 2009, a $2 million benefit in 2008 and a $1 million benefit in 2007, primarily due to favorable claims experience in each of the years.
Selling, General and Administrative Expenses
Selling, general, and administrative expenses decreased $68 million to $645 million in 2009 from $713 million in 2008. In 2009, selling, general and administrative expenses included $53 million of pension costs as well as $6 million of incremental expenses directly related to the relocation of the worldwide headquarters. In 2008, selling, general and administrative expenses included $5 million of pension costs as well as $16 million of organizational realignment costs, $12 million of costs associated with legal matters offset by $23 million in gains from the sale of two properties in Canada. After considering these items, selling, general and administrative expenses decreased as a percentage of revenues from 13.2% in 2008 to 12.7% in 2009 primarily due to the continued cost reduction actions focused on limiting discretionary spending and the benefit of cost savings from the organizational realignment initiated in the prior year as well as reductions in incentive and stock-based compensation expense.
Selling, general, and administrative expenses increased $29 million to $713 million in 2008 from $684 million in 2007. In 2008, selling, general and administrative expenses included $5 million of pension costs as well as $16 million of organizational realignment costs, $12 million of costs associated with legal matters offset by $23 million in gains from the sale of two properties in Canada. In 2007, selling, general, and administrative expenses included $23 million of expenses related to the Japan realignment and the spin-off of Teradata. After considering these items, selling, general and administrative expenses remained relatively consistent as a percentage of revenues of 13.2% in 2008 compared to 13.3% in 2007.
Research and Development Expenses
Research and development expenses decreased by $7 million to $141 million in 2009 compared to $148 million in 2008. In 2009, research and development expenses included $17 million of pension costs. In 2008, research and development expenses included $9 million of pension costs and $5 million of organizational realignment costs. After considering these items, research and development expenses increased slightly as a percentage of revenues from 2.5% in 2008 to 2.7% in 2009 as we continue to invest in broadening our self-service solutions and are in line with management expectations. The decrease in expenses in 2009 is due to the focus on cost reductions including limits on discretionary spending, headcount reductions and the elimination of incentive compensation.
Research and development expenses increased by $11 million to $148 million in 2008 compared to $137 million in 2007. In 2008, research and development expenses included $5 million of organizational realignment costs. The remaining increase in expense in 2008 was due to new product introductions, including the NCR SelfServ family of ATMs, FastLane self check-out, XpressPort, and RealPOS 70XRT.
Interest and Other Income Items
Interest expense decreased to $10 million in 2009 compared to $22 million in 2008 and $24 million in 2007 primarily due to the repayment of the senior unsecured notes in June 2009.
Other expense, net was $174 million in 2009 compared to other expense, net of $12 million in 2008 and other income, net of $37 million in 2007. Other expense (income) includes items such as gains or losses on
23
Table of Contents
equity investments, costs and recoveries related to environmental matters that relate to businesses previously disposed of, and interest income. Interest income was $6 million in 2009, $23 million in 2008, and $55 million in 2007. The decrease in interest income in 2009 compared to 2008 and to 2007 is due to a combination of declining interest rates and lower invested cash balances throughout the years mainly due to the repayment of senior unsecured notes in 2009, share repurchases in 2008 and the distribution of cash related to the Teradata spin-off in 2007. Other expense, net included $142 million, $28 million and $14 million in 2009, 2008 and 2007, respectively, for net increases to the reserve related to the Fox River environmental matter. The 2009 net increase to the Fox River reserve was due to a $156 million net charge for a change in estimate associated with a fourth quarter court decision, partially offset by the receipt of $14 million of net insurance recoveries. Additionally, in 2009, other expense included $24 million related to the impairment of equity investments and related assets.
Income Taxes
The effective tax rate was 66% in 2009, 20% in 2008, and 26% in 2007. The 2009 tax benefit was favorably impacted by the non-proportional benefit of the significant environmental and impairment charges incurred in the United States and by the mix of taxable profits and losses by country. During 2008, we favorably settled examinations with the Internal Revenue Service (IRS) for the tax years of 2000 through 2006 that resulted in a $19 million tax benefit. In addition, the effective tax rate was benefited in 2008 by $26 million from the repatriation of earnings from international subsidiaries at an effective tax rate lower than previously estimated. These favorable items were partially offset by an unfavorable mix of taxable profits and losses by country. The tax rate in 2007 was unfavorably impacted by a $10 million net adjustment to increase tax expense. See Note 1, “Description of Business and Significant Accounting Policies,” of the Notes to Consolidated Financial Statements included in Item 8 of Part II of this Report for additional information on the net adjustment. We anticipate that our effective tax rate will be approximately 27% in 2010. However, changes in profit mix or other events, such as tax audit settlements or changes in our valuation allowances, could impact this anticipated rate.
During the fourth quarter of 2009, the Internal Revenue Service commenced an examination of our 2007 and 2008 income tax returns. While we are subject to numerous federal, state, and foreign tax audits, we believe that the appropriate reserves exist for issues that might arise from these audits. Should these audits be settled, the resulting tax effect could impact the tax provision and cash flows in future periods. At this time, the Company does not expect any significant changes in unrecognized tax benefits in 2010.
Results of Discontinued Operations
| For the years ended December 31 | 2008 | 2007 (1) | |||||
| In millions | |||||||
| Total revenue |
$ | — | $ | 1,223 | |||
| Total operating expenses |
4 | 1,046 | |||||
| Pretax (loss) income from discontinued operations |
(4 | ) | 177 | ||||
| Income tax (benefit) expense |
(1 | ) | 74 | ||||
| (Loss) income from discontinued operations |
$ | (3 | ) | $ | 103 | ||
| (1) | NCR completed the spin-off of the Teradata Data Warehousing business on September 30, 2007. |
Due to the spin-off, the Teradata Data Warehousing business has been classified as a discontinued operation in the Company’s consolidated financial statements for all periods presented. There was no operating activity related to the discontinued operation in 2009. For the year ended December 31, 2008, the expense related to discontinued operations was primarily due to professional and consulting fees. Income from discontinued operations for the year ended December 31, 2007 includes nine months of operations in 2007 as well as approximately $55 million of spin-related costs that were non-recurring and directly related to the spin-off transaction on September 30, 2007. These non-recurring costs were primarily for investment banking, legal, tax, accounting, and other professional and consulting fees. See Note 12, “Discontinued Operations” of the Notes to Consolidated Financial Statements included in Item 8 of Part II of this Report for additional information related to the Teradata spin-off.
24
Table of Contents
Revenue and Gross Margin by Segment
NCR’s products, services, and solutions enable our customers to connect, interact and transact with their customers and include: ATM hardware and software; traditional point-of-sale (POS) and self checkout solutions; self-service kiosk solutions; business consumables; solutions that digitally capture, process and retain item-based transactions; maintenance of NCR solutions; consulting, installation, implementation, and customer support services; as well as the maintenance and sale of third-party products and services. On January 1, 2008, we reorganized our business and the management thereof to a functional geographic model, changing from the previous model of global business units organized by product and service offering. In order to align the Company’s external reporting of its financial results with this organizational change, the Company modified its segment reporting. The Company now reports on three segments:
| • | Americas; |
| • | Europe, Middle East and Africa (EMEA); and |
| • | Asia Pacific and Japan (APJ). |
Each of these segments derives its revenues by selling products and services to the financial services, retail and hospitality, travel and gaming, healthcare, entertainment and software and technology services industries. In addition, each segment sells products and services across the entire NCR product and service portfolio within their geography. We have reclassified prior period segment information presented to conform to the current period presentation.
Segments are measured for profitability by the Company’s chief operating decision maker based on revenue and segment gross margin. For purposes of discussing our results by segment, we exclude the impact of certain items from segment gross margin, consistent with the manner by which management views each segment and reports our operating segment results. This format is useful to investors because it allows analysis and comparability of operating trends. It also includes the same information that is used by NCR management to make decisions regarding the segments and to assess our financial performance.
Certain amounts have been excluded from segment gross margin for each reporting segment presented below as follows:
| • | In 2009, pension expense of $89 million and $22 million of cost for the impairment of assets and accrual of purchase commitments related to an equity investment |
| • | In 2008, pension expense of $11 million and $36 million related to organizational realignment and legal costs |
| • | In 2007, pension expense of $24 million, $48 million related to manufacturing realignment costs and $19 million related to Japan realignment costs. |
Our segment results are reconciled to total income from operations reported under accounting principles generally accepted in the United States of America (otherwise known as GAAP) in Note 13, “Segment Information and Concentrations,” of the Notes to Consolidated Financial Statements included in Item 8 of Part II of this Report.
Americas Segment
The following table presents the Americas revenue and segment gross margin for the years ended December 31:
| Americas |
2009 | 2008 | 2007 | |||||||||
| In millions | ||||||||||||
| Revenue |
$ | 2,022 | $ | 2,269 | $ | 2,148 | ||||||
| Gross margin |
$ | 386 | $ | 437 | $ | 432 | ||||||
| Gross margin as a percentage of revenue |
19.1 | % | 19.3 | % | 20.1 | % | ||||||
25
Table of Contents
Americas revenue decreased 11% in 2009 compared to 2008 primarily due to a decline in product sales volumes in the United States (U.S.) and Latin America to customers in the financial services and retail and hospitality industries, which offset gains in emerging customer verticals such as entertainment and travel and gaming. While large financial institutions continue a deposit automation upgrade cycle, sales to mid-sized financial services institutions have been negatively impacted by the overall market conditions. In the U.S., customers in the retail and hospitality industry have been negatively impacted by continued decline in consumer spending and high unemployment rates. As a result, U.S. retailers have reduced capital spending and new store growth has been significantly curtailed. In Latin America, NCR achieved significant sales volume to a financial services customer in 2008 that was not repeated in 2009. Finally, recurring maintenance services decreased only slightly in 2009 as compared to 2008. This trend reflects the stable nature of recurring, maintenance-based services despite an adverse market for new product sales.
Gross margin as a percentage of revenue decreased 0.2 percentage points in 2009 compared to 2008 due to the focus on cost containment both for product and services revenue streams.
Americas revenue increased 6% in 2008 compared to 2007 due to higher sales volume from both products and services. Foreign currency fluctuations provided a minimal benefit to the year-over-year revenue comparison. The revenue increase was driven by growth in the United States and Caribbean and Latin America countries primarily in the financial services and software and technology industries, partially offset by declines in the retail and hospitality industries.
Gross margin as a percentage of revenue decreased 0.8 percentage points in 2008 as compared to 2007. This decrease in gross margin percentage was due to the unfavorable revenue mix in comparison to the prior year, primarily attributable to roll outs to large customers in the financial services and retail and hospitality industries at lower margins in 2008.
Europe, Middle East & Africa (EMEA) Segment
The following table presents EMEA revenue and segment gross margin for the years ended December 31:
| EMEA |
2009 | 2008 | 2007 | |||||||||
| In millions | ||||||||||||
| Revenue |
$ | 1,649 | $ | 2,066 | $ | 1,906 | ||||||
| Gross margin |
$ | 401 | $ | 556 | $ | 485 | ||||||
| Gross margin as a percentage of revenue |
24.3 | % | 26.9 | % | 25.4 | % | ||||||
EMEA revenue decreased 20% in 2009 compared to 2008. Foreign currency fluctuations negatively impacted the year-over-year comparison by 3%. The decrease in revenue was primarily driven by a reduction in product sales to customers in the financial services industry across Europe, the Middle East and Africa. Product sales to financial services customers in Turkey, Eastern Europe and Africa continue to be challenging due to market conditions. Product sales to the retail and hospitality industry were also lower across EMEA. Finally, after taking into account foreign currency fluctuations, recurring maintenance services increased slightly in 2009 as compared to 2008 primarily due to increases in the UK, Middle East and Africa. This trend reflects the stable nature of recurring, maintenance-based services despite an adverse market for new product sales.
Gross margin as a percentage of revenue decreased 2.6 percentage points in 2009 compared to 2008 which was primarily impacted by lower sales volumes coupled with a negative sales mix mainly seen in Germany, Italy and Eastern Europe which more than offset the impact of cost reductions from the lower manufacturing and service delivery costs as a result of the realignment initiatives.
EMEA revenue increased 8% in 2008 compared to 2007. Foreign currency fluctuations provided 2% of benefit to the year-over-year revenue comparison. The revenue increase was driven by strong demand and higher volume of sales for our products and services in Middle Eastern and African countries to financial services and retail and hospitality customers. In addition, the Eastern European countries also experienced significant revenue growth.
26
Table of Contents
Gross margin as a percentage of revenue increased 1.5 percentage points in 2008 as compared to 2007. The gross margin percentage increased as we continued to realize the benefits of lower manufacturing and service delivery costs as a result of the realignment initiatives.
Asia Pacific & Japan (APJ) Segment
The following table presents APJ’s revenue and segment gross margin for the years ended December 31:
| APJ |
2009 | 2008 | 2007 | |||||||||
| In millions | ||||||||||||
| Revenue |
$ | 941 | $ | 980 | $ | 916 | ||||||
| Gross margin |
$ | 207 | $ | 237 | $ | 216 | ||||||
| Gross margin as a percentage of revenue |
22.0 | % | 24.2 | % | 23.6 | % | ||||||
APJ revenue decreased 4% in 2009 compared to 2008. Foreign currency fluctuations provided a 1% benefit to the year-over-year comparison. The decrease in revenue was primarily driven by a reduction in product sales to financial services and retail and hospitality industry customers in Asia and Australia. The decline in revenue in Japan was primarily driven by a reduction in product sales to retail and hospitality industry customers. Finally, after taking into account foreign currency fluctuations, recurring maintenance-based revenue increased slightly in 2009 as compared to 2008. This trend reflects the stable nature of recurring, maintenance-based services despite an adverse market for new product sales.
Gross margin as a percentage of revenue decreased 2.2 percentage points in 2009 compared to 2008. During 2009, the Company recorded adjustments to decrease product revenue by $10 million and cost of products by $7 million, which resulted in a net decrease in gross margin of $3 million. The adjustments related to revenues incorrectly recognized during 2008 by the Company’s Japanese subsidiary. See Note 1, “Description of Business and Significant Accounting Policies,” of the Notes to the Consolidated Financial Statements included in Item 8 of Part II of this Report for additional information on these adjustments. Excluding the effect of this item, gross margin as a percentage of revenue decreased 2.1 percentage points which was primarily due to lower sales volumes coupled with a negative sales mix.
APJ revenue increased 7% in 2008 compared to 2007. Foreign currency fluctuations provided a 6% benefit to the year-over-year revenue comparison. Revenue increased in the APJ segment due to volume growth in both services and product sales primarily in China, Japan and Australia in the retail and hospitality and financial services industries.
Gross margin as a percentage of revenue increased 0.6 percentage points in 2008 as compared to 2007 as cost savings from prior realignment activities more than offset an unfavorable geographic and revenue mix.
FINANCIAL CONDITION, LIQUIDITY AND CAPITAL RESOURCES
For 2009, cash provided by operating activities decreased $192 million, which was largely attributable to the decrease in income compared to the prior year. Additionally, working capital improvements provided a more significant positive impact to NCR’s working capital position in 2008, which included reductions in receivables and inventory of $249 million and $25 million, respectively.
NCR’s management uses a non-GAAP measure called “free cash flow,” which we define as net cash provided by operating activities less capital expenditures for property, plant and equipment, and additions to capitalized software, to assess the financial performance of the Company. Free cash flow does not have a uniform definition under GAAP; therefore, NCR’s definition may differ from other companies’ definitions of this measure. The components used to calculate free cash flow are GAAP measures taken directly from the Consolidated Statements of Cash Flows. We believe free cash flow information is useful for investors because it relates the operating cash flow of the Company to the capital that is spent to continue and improve business operations. In particular, free cash flow indicates the amount of cash available after capital expenditures for,
27
Table of Contents
among other things, investments in the Company’s existing business, strategic acquisitions, repurchase of NCR stock and repayment of debt obligations. Free cash flow does not represent the residual cash flow available for discretionary expenditures since there may be other non-discretionary expenditures that are not deducted from the measure. This non-GAAP measure should not be considered a substitute for, or superior to, cash flows from operating activities under GAAP. The table below shows the changes in net cash provided by operating activities and capital expenditures for the years ended December 31:
| In millions | 2009 | 2008 | 2007 | |||||||||
| Cash provided by operating activities |
$ | 223 | $ | 415 | $ | 151 | ||||||
| Less: Expenditures for property, plant and equipment, net of grant reimbursements |
(112 | ) | (75 | ) | (64 | ) | ||||||
| Less: Additions to capitalized software |
(61 | ) | (63 | ) | (48 | ) | ||||||
| Free cash flow |
$ | 50 | $ | 277 | $ | 39 | ||||||
In 2009, cash provided by operating activities decreased $192 million, net capital expenditures increased $37 million, and capitalized software additions decreased $2 million, which contributed to a net decrease in free cash flow of $227 million in comparison to 2008. Capital expenditures were higher mainly due to planned expenditures related to investments in the entertainment industry. We expect free cash flow to be lower in 2010 than in 2009 due to additional capital investment in the entertainment industry, along with pension cash funding and severance payments.
For 2008, cash provided by operating activities increased $264 million, capital expenditures increased $11 million and additions to capitalized software increased $15 million, resulting in a net increase in free cash flow of $238 million compared to 2007. The increase in cash provided by operating activities was primarily driven by significant working capital improvements during 2008. Capital expenditures were higher in 2008 due to certain planned expenditures related to significant, new product roll outs in 2008 and investments in information technology.
Financing activities and certain other investing activities are not included in our calculation of free cash flow. During 2009, these other investing activities included net proceeds of $11 million from the sale of property and $41 million of expenditures related to acquisition and equity investment activity. Our financing activities in 2009 primarily consisted of the repayment of our $300 million senior unsecured notes. During 2008, other investing activities included net proceeds of $59 million from the sale of property and $65 million of expenditures related to acquisitions and equity investments. Our financing activities in 2008 primarily consisted of cash outflows for our share repurchase program, which totaled $494 million, offset by proceeds of $17 million from employee stock plans. The net impact of our share purchases and issuances in 2008 was a reduction of approximately 20.6 million shares outstanding as compared to 2007. The decline in inflows from stock plans was primarily due to fewer option exercises caused by market conditions and the decline in our stock price since 2008.
The share repurchases are part of a program authorized by NCR’s Board of Directors. Going forward, the amount of share repurchases may vary from past years depending on several factors, including the level of employee equity compensation awards, the level of stock option exercises, the level of activity related to the employee stock purchase plan, and additional authorizations by NCR’s Board of Directors, if any, to repurchase shares.
In 2009, there was no cash used or provided by discontinued operations. Net cash of $19 million was used by discontinued operations in 2008 and net cash provided by discontinued operations was $154 million in 2007. NCR completed the spin-off of Teradata on September 30, 2007 and activity in 2008 related solely to payments for activities and costs associated with the transaction, including the payment of amounts accrued for as of December 31, 2007.
Our cash and cash equivalents totaled $451 million as of December 31, 2009. We believe our cash flows from operations, the credit facilities we currently have in place, and other short- and long-term debt financing will be sufficient to satisfy our future working capital, research and development activities, capital expenditures,
28
Table of Contents
pension contributions and other financing requirements for at least the next twelve months. Our ability to generate future positive cash flows from operations is dependent on general economic conditions, competitive pressures and other business and risk factors described in Part I, Item IA of this Report. If we are unable to generate sufficient cash flows from operations, or otherwise comply with the terms of our credit facility, we may be required to seek additional financing alternatives. Also, as described below and in Note 9, “Employee Benefit Plans,” in the Notes to Consolidated Financial Statements in Item 8 of Part II of this Report, we expect to make pension, postemployment, and postretirement plan contributions of approximately $172 million in 2010. Additionally, during 2010 we expect to make approximately $47 million of remediation and other payments related to the Fox River environmental matter which we expect will be partially offset by insurance recoveries. We believe that we currently have sufficient cash flows from operations and existing financing to meet our operating requirements, pension, postemployment, and postretirement plan contributions and remediation payments related to the Fox River environmental matter.
Contractual Obligations In the normal course of business, we enter into various contractual obligations that impact, or could impact, the liquidity of our operations. The following table and discussion outlines our material obligations as of December 31, 2009, with projected cash payments in the years shown:
| In millions | Total Amounts |
2010 | 2011- 2012 |
2013- 2014 |
2015 and thereafter |
All Other | ||||||||||||
| Debt obligations |
$ | 15 | $ | 4 | $ | — | $ | — | $ | 11 | $ | — | ||||||
| Interest on debt obligations |
6 | 1 | 1 | 1 | 3 | — | ||||||||||||
| Estimated environmental liability payments |
322 | 47 | 68 | 75 | 132 | — | ||||||||||||
| Lease obligations |
243 | 53 | 84 | 64 | 42 | — | ||||||||||||
| Uncertain tax positions |
181 | — | — | — | — | 181 | ||||||||||||
| Purchase obligations |
827 | 697 | 63 | 67 | — | — | ||||||||||||
| Total obligations |
$ | 1,594 | $ | 802 | $ | 216 | $ | 207 | $ | 188 | $ | 181 | ||||||
As of December 31, 2009, we have short- and long-term debt totaling $15 million.
The estimated environmental liability payments included in the table of contractual obligations shown above are related to the Fox River environmental matter. The amounts shown are on a gross basis and do not include an estimate for payments to be received from insurers or indemnification parties. For additional information, refer to Note 11, “Commitments and Contingencies,” included in Item 8 of Part II of this Report.
Our lease obligations are primarily for certain sales and manufacturing facilities in various domestic and international locations. Purchase obligations represent committed purchase orders and other contractual commitments for goods or services. The purchase obligation amounts were determined through information in our procurement systems and payment schedules for significant contracts. Included in the amounts are committed payments in relation to the long-term service agreement with Accenture under which NCR’s transaction processing activities and functions are performed.
We have a $181 million liability related to our uncertain tax positions. Due to the nature of the underlying liabilities and the extended time often needed to resolve income tax uncertainties, we cannot make reliable estimates of the amount or timing of cash payments that may be required to settle these liabilities. For additional information, refer to Note 7, “Income Taxes,” of the Notes to Consolidated Financial Statements included in Item 8 of Part II of this Report.
We also have product warranties that may affect future cash flows. These items are not included in the table of obligations shown above, but are described in detail in Note 11 of the Notes to Consolidated Financial Statements, “Commitments and Contingencies,” included in Item 8 of Part II of this Report.
Our U.S. and international employee benefit plans, which are described in Note 9 of the Notes to Consolidated Financial Statements, “Employee Benefit Plans,” included in Item 8 of Part II of this Report, could require significant future cash payments. The funded status of NCR’s U.S. pension plans is an underfunded position of $822 million as of December 31, 2009 compared to an underfunded position of $1,019 million as of
29
Table of Contents
December 31, 2008. The improvement in our funded status is primarily attributable to the impact of the positive market environment on the fair value of plan assets in 2009 offset somewhat by an increase in the liability due to a decrease in the discount rate. The funded status of our international retirement plans declined from an underfunded position of $178 million as of December 31, 2008 to an underfunded position of $226 million as of December 31, 2009. Increases in the plan liabilities driven by decreases in discount rates were the main drivers of this change. The Company did not make any contributions to its U.S. qualified pension plan in 2009, and we do not expect to be required to make any contributions in 2010. Contributions to international and executive pension plans are expected to increase from $83 million in 2009 to approximately $110 million in 2010.
On August 6, 2007, the Company amended and renewed its $500 million, five-year unsecured revolving credit facility to update certain terms and conditions. This replacement credit facility contains certain representations and warranties; conditions; affirmative, negative and financial covenants; and events of default customary for such facilities. The key financial covenants include a total debt to consolidated EBITDA requirement for the period of four consecutive fiscal quarters not to exceed 3.00 to 1.00 and a minimum cash interest coverage ratio for the period of four consecutive fiscal quarters of not less than 4.00 to 1.00. The credit facility provides a grid-based interest rate that determines the margin charged in addition to the London Interbank Offered Rate (LIBOR) on borrowings. The rate is based on several factors including the credit rating of the Company and the amount of the Company’s aggregate borrowings under the facility. Additionally, the facility allows a portion of the availability to be used for outstanding letters of credits. As of December 31, 2009, no amount was outstanding under the facility; however the maximum borrowing available was reduced by $21 million for NCR’s usage of letters of credit.
Off-Balance Sheet Arrangements We have no significant contractual obligations not fully recorded on our consolidated balance sheets or fully disclosed in the notes to our consolidated financial statements. We have no material off-balance sheet arrangements as defined by SEC Regulation S-K 303 (a) (4) (ii).
See Note 11, “Commitments and Contingencies,” in the Notes to Consolidated Financial Statements in Item 8 of Part II of this Report for additional information on guarantees associated with NCR’s business activities.
30
Table of Contents
CRITICAL ACCOUNTING POLICIES AND ESTIMATES
Our consolidated financial statements are prepared in accordance with GAAP. In connection with the preparation of these financial statements, we are required to make assumptions, estimates and judgments that affect the reported amounts of assets, liabilities, revenues, expenses and the related disclosure of contingent liabilities. These assumptions, estimates and judgments are based on historical experience and assumptions that are believed to be reasonable at the time. However, because future events and their effects cannot be determined with certainty, the determination of estimates requires the exercise of judgment. Our critical accounting policies are those that require assumptions to be made about matters that are highly uncertain. Different estimates could have a material impact on our financial results. Judgments and uncertainties affecting the application of these policies and estimates may result in materially different amounts being reported under different conditions or circumstances. Our management continually reviews these estimates and assumptions to ensure that our financial statements are presented fairly and are materially correct.
In many cases, the accounting treatment of a particular transaction is specifically dictated by GAAP and does not require significant management judgment in its application. There are also areas in which management’s judgment in selecting among available alternatives would not produce a materially different result. The significant accounting policies and estimates that we believe are the most critical to aid in fully understanding and evaluating our reported financial results are discussed in the paragraphs below. Our senior management has reviewed these critical accounting policies and related disclosures with our independent registered public accounting firm and the Audit Committee of our Board of Directors (see Note 1, “Description of Business and Significant Accounting Policies,” of the Notes to Consolidated Financial Statements in Item 8 of Part II of this Report, which contains additional information regarding our accounting policies and other disclosures required by GAAP).
Revenue Recognition Product revenue includes sales of hardware equipment and software licenses for ATMs and financial terminals, self-service kiosks, POS terminals, check and document imaging products and consumables. Service revenue includes revenue from services and maintenance, installation, implementation, professional consulting, and complete systems management for all NCR product offerings noted above as well as for third-party products. NCR records revenue when it is realized, or realizable, and earned. NCR considers these criteria met when: (a) persuasive evidence of an arrangement exists; (b) the products or services have been delivered to the customer; (c) the sales price is fixed or determinable and free of contingencies or significant uncertainties; and (d) collectibility is reasonably assured. For product sales, delivery is deemed to occur when the customer has assumed risk of loss of the goods sold and all performance obligations are complete. For service sales, revenue is recognized either as the services are provided or, if applicable, after customer acceptance of the services.
NCR’s solution offerings typically include hardware, software, professional consulting services and maintenance support services, and as a result, the Company frequently enters into sales arrangements with customers that contain multiple elements or deliverables. For arrangements involving multiple deliverables, when deliverables include software and non-software products and services, NCR evaluates and separates each deliverable to determine whether it represents a separate unit of accounting based on the following criteria: (a) the delivered item has value to the customer on a stand-alone basis; (b) there is objective and reliable evidence of the fair value of the undelivered items; and (c) if the contract includes a general right of return relative to the delivered item, delivery or performance of the undelivered items is considered probable and substantially in the control of NCR. Each unit of accounting is then accounted for under the applicable revenue recognition guidance.
In situations where NCR’s solutions contain software that is more than incidental to the hardware and services, revenue related to software and software-related elements is recognized in accordance with authoritative guidance on software revenue recognition. Revenue for non-software elements, for which software is not essential to the functionality, is recognized in accordance with other relevant guidance on revenue recognition including the four criteria above. In situations when there is appropriate evidence of fair value for all undelivered elements, but not for delivered elements, the residual method is used to allocate the arrangement’s consideration. Under the residual method, the fair value of undelivered elements is deferred and the remaining portion of the
31
Table of Contents
arrangement fee is allocated to the delivered elements and recognized as revenue. Revenue for maintenance support services is recognized on a straight-line basis over the term of the service contract. In certain instances, customer acceptance is required prior to the passage of title and risk of loss of the delivered products. In such cases, no revenue is recognized until the customer acceptance is obtained. Delivery and acceptance generally occur in the same reporting period.
Revenue recognition for complex contractual arrangements, especially those with multiple elements, requires a significant level of judgment and is based upon a review of specific contracts, past experience, the selling price of undelivered elements when sold separately, creditworthiness of customers, international laws and other factors. Changes in judgments about these factors could impact the timing and amount of revenue recognized between periods.
Allowance for Doubtful Accounts We evaluate the collectibility of our accounts receivable based on a number of factors. We establish provisions for doubtful accounts using percentages of our accounts receivable balances as an overall proxy to reflect historical average credit losses and specific provisions for known issues. The percentages are applied to aged accounts receivable balances. Aged accounts are determined based on the number of days the receivable is outstanding, measured from the date of the invoice, or from the date of revenue recognition. As the age of the receivable increases, the provision percentage also increases. This policy is applied consistently among all of our operating segments.
Based on the factors below, we periodically review customer account activity in order to assess the adequacy of the allowances provided for potential losses. Factors include economic conditions and judgments regarding collectibility of account balances, each customer’s payment history and creditworthiness.
The allowance for doubtful accounts was $24 million as of December 31, 2009, $15 million as of December 31, 2008, and $19 million as of December 31, 2007. These allowances represent, as a percent of gross receivables, 2.6% in 2009, 1.6% in 2008, and 1.6% in 2007.
Given our experience, the reserves for potential losses are considered adequate, but if one or more of our larger customers were to default on its obligations, we could be exposed to potentially significant losses in excess of the provisions established. We continually evaluate our reserves for doubtful accounts and continued economic deterioration could lead to the need to increase our reserves.
Inventory Valuation Inventories are stated at the lower of cost or market, using the average cost method. Each quarter, we reassess raw materials, work-in-process, parts and finished equipment inventory costs to identify purchase or usage variances from standards, and valuation adjustments are made. Additionally, to properly provide for potential exposure due to slow-moving, excess, obsolete or unusable inventory, a reserve against inventory is established. This reserve is established based on forecasted usage, orders, technological obsolescence and inventory aging. These factors are impacted by market conditions, technology changes and changes in strategic direction, and require estimates and management judgment that may include elements that are uncertain. On a quarterly basis, we review the current market value of inventory and adjust for any inventory exposure due to age or excess of cost over market value.
We have inventory in more than 40 countries around the world. We purchase inventory from third party suppliers and manufacture inventory at our plants. This inventory is transferred to our distribution and sales organizations at cost plus mark-up. This mark-up is referred to as inter-company profit. Each quarter, we review our inventory levels and analyze our inter-company profit to determine the correct amount of inter-company profit to eliminate. Key assumptions are made to estimate product gross margins, the product mix of existing inventory balances and current period shipments. Over time, we refine these estimates as facts and circumstances change. If our estimates require refinement, our results could be impacted.
Our excess and obsolete reserves were $100 million as of December 31, 2009, $111 million as of December 31, 2008, and $147 million as of December 31, 2007. These reserves represent, as a percent of gross inventory, 12.7% in 2009, 13.8% in 2008, and 17.0% in 2007. The decrease in the excess and obsolete reserve in
32
Table of Contents
2009 was due to the scrapping of fully reserved spare parts inventory as well as improved inventory management and utilization. Although we strive to achieve a balance between market demands and risk of inventory obsolescence or excess quantities caused by these factors, it is possible that, should conditions change, additional reserves may be needed. Any changes in reserves will impact operating income during a given period. The policies described are consistently applied among all of our operating segments.
Warranty Reserves One of our key objectives is to provide superior quality products and services. To that end, we provide a standard manufacturer’s warranty extending up to 12 months, allowing our customers to seek repair of products under warranty at no additional cost. A corresponding estimated liability for potential warranty costs is also recorded at the time of the sale. We sometimes offer extended warranties in the form of product maintenance services to our customers for purchase. We defer the fair value of these revenues and recognize revenue over the life of the extended warranty period. Refer to Note 1 “Description of Business and Significant Accounting Policies” in the Notes to Consolidated Financial Statements in Item 8 of Part II of this Report for further information regarding our accounting for extended warranties.
Future warranty obligation costs are based upon historical factors such as labor rates, average repair time, travel time, number of service calls per machine and cost of replacement parts. When a sale is consummated, the total customer revenue is recognized and the associated warranty liability is recorded based upon the estimated cost to provide the service over the warranty period.
Total warranty costs were $47 million in 2009, $51 million in 2008, and $41 million in 2007. Warranty costs as a percent of total product revenues were 2.1% in 2009, 1.8% in 2008, and 1.5% in 2007. Historically, the principal factor used to estimate our warranty costs has been service calls per machine. Significant changes in this factor could result in actual warranty costs differing from accrued estimates. Although no near-term changes in our estimated warranty reserves are currently anticipated, in the unlikely event of a significant increase in warranty claims by one or more of our larger customers, costs to fulfill warranty obligations would be higher than provisioned, thereby impacting results.
Goodwill Goodwill is not amortized; instead, it is tested for impairment annually (in the fourth quarter) or more frequently if indicators of impairment exist or if a decision is made to sell a business. A significant amount of judgment is involved in determining if an indicator of impairment has occurred. Such indicators may include a decline in expected cash flows, a significant adverse change in legal factors or in the business climate, unanticipated competition, or slower growth rates, among others.
Goodwill is allocated among and evaluated for impairment at the reporting unit level, which is defined as an operating segment or one level below an operating segment. NCR has three reporting units, which are Americas, EMEA and APJ. Total goodwill is allocated among the reporting units as follows: $47 million related to Americas, $28 million related to EMEA and $25 million related to APJ.
The evaluation of impairment involves comparing the current fair value of each reporting unit to its carrying value, including goodwill. NCR uses a discounted cash flow model (DCF model) to estimate the current fair value of its reporting units when testing for impairment. A number of significant assumptions and estimates are involved in the application of the DCF model to forecast operating cash flows, including markets and market shares, sales volumes and prices, costs to produce, tax rates, capital spending, discount rate and working capital changes. Most of these assumptions vary among reporting units. The cash flow forecasts are generally based on approved strategic operating plans.
In the fourth quarter of 2009, the estimated fair value for each of the reporting units was in excess of its carrying value, resulting in no impairment.
In the event the estimated fair value of a reporting unit based on the DCF model is less than the carrying value, an additional analysis would be required. The additional analysis would compare the carrying value of the reporting unit’s goodwill with the implied fair value of that goodwill. The implied fair value of goodwill is the excess of the fair value of the reporting unit over the fair value amounts assigned to all of the assets and liabilities
33
Table of Contents
of that unit as if the reporting unit was acquired in a business combination and the fair value of the reporting unit represented the purchase price. If the carrying value of goodwill exceeds its implied fair value, an impairment loss equal to such excess would be recognized, which could significantly and adversely impact reported results of operations and stockholders’ equity.
Pension, Postretirement and Postemployment Benefits We sponsor domestic and foreign defined benefit pension and postemployment plans as well as domestic postretirement plans. As a result, we have significant pension, postretirement and postemployment benefit costs, which are developed from actuarial valuations. Actuarial assumptions attempt to anticipate future events and are used in calculating the expense and liability relating to these plans. These factors include assumptions we make about interest rates, expected investment return on plan assets, rate of increase in healthcare costs, total and involuntary turnover rates, and rates of future compensation increases. In addition, our actuarial consultants advise us about subjective factors such as withdrawal rates and mortality rates to use in our valuations. We generally review and update these assumptions on an annual basis at the beginning of each fiscal year. We are required to consider current market conditions, including changes in interest rates, in making these assumptions. The actuarial assumptions that we use may differ materially from actual results due to changing market and economic conditions, higher or lower withdrawal rates, or longer or shorter life spans of participants. These differences may result in a significant impact to the amount of pension, postretirement or postemployment benefits expense we have recorded or may record. Postemployment expense impacts all of our segments, while postretirement expense impacts only the Americas segment, as these benefits are only offered to Americas employees. Pension expense is reported at the corporate level and is excluded from our segment results as it is not included in the evaluation of segment performance. See Note 13, “Segment Information and Concentrations” in the Notes to Consolidated Financial Statements in Item 8 of Part II of this Report for a reconciliation of our segment results to total income from operations.
The key assumptions used in developing our 2009 expense were discount rates of 6.3% for our U.S. pension plans and 6.3% for our postretirement plan. We used an expected return on assets assumption of 7.8% for our U.S. plans in 2009. The U.S. plans represent 63% and 100% of total pension and postretirement plan obligations as of December 31, 2009, respectively. Holding all other assumptions constant, a 0.25% change in the discount rate used for the U.S. plans would have changed 2009 expense by approximately $6 million in pension expense and an immaterial amount in postretirement expense. A 0.25% change in the expected rate of return on plan assets assumption for the U.S. pension plan would have increased or decreased 2009 pension expense by approximately $6 million. Our expected return on plan assets has historically been and will likely continue to be material to net income. While it is required that we review our actuarial assumptions each year at the measurement date, we generally do not change them between measurement dates. We use a measurement date of December 31 for all of our plans.
We intend to use a discount rates of 5.75% and 5.0% and an expected rate of return on assets assumption of 7.5% in determining the 2010 pension and postretirement expense for the U.S. plans. The most significant assumption used in developing our 2010 postemployment plan expense was the assumed rate of involuntary turnover of 5%. The involuntary turnover rate is based on historical trends and projections of involuntary turnover in the future. A 0.25% change in the rate of involuntary turnover would have increased or decreased 2009 expense by approximately $4 million. The sensitivity of the assumptions described above is specific to each individual plan and not to our pension, postretirement and postemployment plans in the aggregate.
Environmental and Legal Contingencies Each quarter, we review the status of each claim and legal proceeding and assess our potential financial exposure. If the potential loss from any claim or legal proceeding is considered probable and the amount can be reasonably estimated, we accrue a liability for the estimated loss. To the extent that the amount of a probable loss is estimable only by reference to a range of equally likely outcomes, and no amount within the range appears to be a better estimate than any other amount, we accrue for the low end of the range. Because of uncertainties related to these matters, the use of estimates, assumptions and judgments, and external factors beyond our control, accruals are based on the best information available at the time. As additional information becomes available, we reassess the potential liability related to our pending claims and litigation and may revise our estimates. Such revisions in the estimates of the potential liabilities could have a
34
Table of Contents
material impact on our results of operations and financial position. Except for the sharing agreement with Appleton Papers Inc. (API) described in Note 11 of Notes to Consolidated Financial Statements, “Commitments and Contingencies,” in Item 8 of Part II of this Report with respect to the Fox River matter, when insurance carriers or third parties have agreed to pay any amounts related to costs, and we believe that it is probable that we can collect such amounts, those amounts are reflected as receivables in our consolidated balance sheet.
The most significant legal contingency impacting our Company relates to the Fox River matter, which is further described in detail in Note 11. NCR has been identified as a potentially responsible party (PRP) at the Fox River site in Wisconsin because of polychlorinated biphenyl (PCB) discharges from two carbonless paper manufacturing facilities previously owned by NCR, located along the Fox River.
As described below and in Note 11, while substantial progress has been made in the engineering design of the Fox River clean-up, the extent of our potential liability continues to be subject to significant uncertainties. These uncertainties include the total clean-up costs for each of the segments of the river; the total natural resource damages for the site; the extent to which clean-up and other costs will be allocated to and paid by other PRPs; the solvency of other PRPs; and the extent of NCR’s eventual liability and the outcome of the Company’s appeal of the December 16, 2009 order described in Note 11.
Our reserve for the Fox River matter as of December 31, 2009 was approximately $202 million (after taking into consideration amounts expected to be recovered under an indemnity agreement, as further discussed in Note 11). The Company regularly re-evaluates the assumptions used in determining the appropriate reserve for the Fox River matter as additional information becomes available and, when warranted, makes appropriate adjustments.
In determining our reserve, we attempt to estimate a range of reasonably possible outcomes for relevant factors, although each range is itself highly uncertain. We use our best estimate within the range if that is possible. Where there is a range of equally likely outcomes, and there is no amount within that range that appears to be a better estimate than any other amount, we use the low end of the range. Our eventual liability for remediation, which we expect will be paid out over a period of at least 10 years (and perhaps as long as 20 years, and a still longer period for long-term monitoring), will depend on a number of factors, the most significant of which include:
| • | The total clean-up costs for the site (we use the best estimate within a range of reasonably possible outcomes—$933 million—which consists of the current estimate of the lower river clean-up and long-term monitoring costs developed in consultation with the engineering firms working on the design, the projected costs of the upper river clean-up, plus a 15% contingency for probable cost overruns and a contingency for future Government oversight costs); |
| • | The total natural resource damages for the site (we use a best estimate of $76 million, which is based on current information available to us); |
| • | The share NCR and API will jointly bear of the total clean-up costs (as a result of the December 2009 judicial order discussed in Note 11, we now assume NCR and API will be responsible for the full extent of the cleanup activities they are undertaking, which is a best estimate, and for a substantial portion of the counterclaims filed against them, as to which we use the low end of a range) and of natural resource damages (we use a best estimate); |
| • | The share NCR will bear of the joint NCR/API payments for clean-up costs and natural resource damages (based upon an agreement between NCR and API, and an arbitration award, we utilized a 45% share for NCR of the first $75 million—a threshold that was reached in the second quarter of 2008—and a 40% share for amounts in excess of $75 million); and |
| • | Our transaction costs to defend NCR in this matter, including participation in litigation to establish proper allocation shares (we have estimated the costs we are likely to incur through 2019, the end of the time period the Governments have projected it will take to design and implement the remedy for the Fox River). |
35
Table of Contents
AT&T Inc. (AT&T) and Alcatel-Lucent are each responsible for indemnifying NCR for a portion of amounts NCR incurs for the Fox River matter over a certain threshold. NCR’s estimate of what AT&T and Alcatel-Lucent will pay under the indemnity is recorded as a long-term asset of approximately $120 million as of December 31, 2009, and is deducted in determining the net reserve discussed above.
While it remains difficult to predict, there could be significant changes in the future to some of the above-described assumptions that could have a material effect on the amount of our reserve. Also, there are other estimates for some of these factors that are significantly higher than the estimates described above. It is the opinion of the Company that the effect of the Fox River matter will have a moderate, but manageable, impact on our liquidity and capital resources, assuming that such amounts discussed above are required to be paid over the time frame currently contemplated. However, if such an amount were required to be paid in a shorter time period, it could have a material impact on our liquidity and capital resources.
Income Taxes We recognize deferred tax assets and liabilities based on the differences between the financial statement carrying amounts and the tax basis of assets and liabilities. The deferred tax assets and liabilities are determined based on the enacted tax rates expected to apply in the periods in which the deferred tax assets or liabilities are anticipated to be settled or realized.
We regularly review our deferred tax assets for recoverability and establish a valuation allowance if it is more likely than not that some portion or all of a deferred tax asset will not be realized. The determination as to whether a deferred tax asset will be realized is made on a jurisdictional basis and is based on the evaluation of positive and negative evidence. This evidence includes historical taxable income, projected future taxable income, the expected timing of the reversal of existing temporary differences and the implementation of tax planning strategies. Projected future taxable income is based on our expected results and assumptions as to the jurisdiction in which the income will be earned. The expected timing of the reversals of existing temporary differences is based on current tax law and our tax methods of accounting.
If we are unable to generate sufficient future taxable income, or if there is a material change in the actual effective tax rates or the time period within which the underlying temporary differences become taxable or deductible, or if the tax laws change unfavorably, then we could be required to increase our valuation allowance against our deferred tax assets, resulting in an increase in our effective tax rate.
We had valuation allowances of $499 million as of December 31, 2009 and $478 million as of December 31, 2008, related to certain deferred income tax assets, primarily tax loss carryforwards, in jurisdictions where there is uncertainty as to the ultimate realization of a benefit from those tax assets. At December 31, 2009, our net deferred tax assets in the United States totaled approximately $605 million and realization of the related benefits was determined to be more likely than not.
The Company recognizes the tax benefit from an uncertain tax position only if it is more likely than not that the tax position will be sustained on examination by the taxing authorities, based on the technical merits of the position. The tax benefits recognized in the financial statements from such a position are measured based on the largest benefit that has a greater than fifty percent likelihood of being realized upon settlement. Interest and penalties related to uncertain tax positions are recognized as part of the provision for income taxes and are accrued beginning in the period that such interest and penalties would be applicable under relevant tax law until such time that the related tax benefits are recognized.
Stock-based Compensation We measure compensation cost for stock awards at fair value and recognize compensation expense over the service period for which awards are expected to vest. We utilize the Black-Scholes option pricing model to estimate the fair value of stock-based compensation at the date of grant, which requires the input of highly subjective assumptions, including expected volatility and expected holding period. We estimate forfeitures for options granted, which are not expected to vest. The estimation of stock awards that will ultimately vest requires judgment, and to the extent that actual results or updated estimates differ from our current estimates, such amounts will be recorded as a cumulative adjustment in the period in which estimates are revised. We consider many factors when estimating expected forfeitures, including types of awards and historical experience. Actual results and future changes in estimates may differ from our current estimates.
36
Table of Contents
In addition, we have performance-based awards that vest only if specific performance conditions are satisfied, typically at the end of a multi-year performance period. The number of shares that will be earned can vary based on actual performance. No shares will vest if the objectives are not met, and in the event the objectives are exceeded, additional shares will vest up to a maximum amount. The cost of these awards is expensed over the performance period based upon management’s estimates of achievement against the performance criteria. Because the actual number of shares to be awarded is not known until the end of the performance period, the actual compensation expense related to these awards could differ from our current expectations.
RECENTLY ISSUED ACCOUNTING PRONOUNCEMENTS
A discussion of recently issued accounting pronouncements is described in Note 1, “Description of Business and Significant Accounting Policies,” of the Notes to Consolidated Financial Statements in Item 8 of Part II of this Report, and we incorporate such discussion in this MD&A by reference and make it a part hereof.
37
Table of Contents
| Item 7A. | QUANTITATIVE AND QUALITATIVE DISCLOSURES ABOUT MARKET RISK |
We are exposed to market risk, including changes in foreign currency exchange rates and interest rates. We use a variety of measures to monitor and manage these risks, including derivative financial instruments. Since a substantial portion of our operations and revenue occurs outside the United States, and in currencies other than the U.S. Dollar, our results can be significantly impacted by changes in foreign currency exchange rates. To manage our exposures and mitigate the impact of currency fluctuations on the operations of our foreign subsidiaries, we hedge our main transactional exposures through the use of foreign exchange forward contracts. This is primarily done through the hedging of foreign currency denominated inter-company inventory purchases by the marketing units and of foreign currency denominated inventory sales by the manufacturing units. All of these transactions are firmly committed or forecasted. These foreign exchange contracts are designated as highly effective cash flow hedges. The gains or losses are deferred in other comprehensive income and recognized in the determination of income when the underlying hedged transaction impacts earnings. As we hedge inventory purchases, the ultimate gain or loss from the derivative contract is recorded in cost of products when the inventory is sold to an unrelated third party.
We have exposure to approximately 50 functional currencies. Due to our global operations, weaknesses in some of these currencies are sometimes offset by strengths in others. The U.S. Dollar was slightly stronger in 2009 as compared to 2008 based on comparable weighted averages for our functional currencies. This had an unfavorable impact of 1% on 2009 revenue versus 2008 revenue. This excludes the effects of our hedging activities and, therefore, does not reflect the actual impact of fluctuations in exchange rates on our operating income.
Our strategy is to hedge, on behalf of each subsidiary, a portion of our non-functional currency denominated cash flows for a period of up to 15 months. As a result, some of the impact of currency fluctuations on non-functional currency denominated transactions (and hence on subsidiary operating income, as stated in the functional currency) is mitigated in the near term. The amount we hedge and the length of time hedge contracts are entered into may vary significantly. In the longer term (longer than the hedging period of up to 15 months), the subsidiaries are still subject to the impacts of foreign currency fluctuations. In addition, the subsidiary results are still subject to any impact of translating the functional currency results to U.S. Dollars. When hedging certain foreign currency transactions of a long-term investment nature (net investments in foreign operations) the gains and losses are recorded in the currency translation adjustment component of stockholders’ equity. Gains and losses on other foreign exchange contracts are recognized in other income or expense as exchange rates change.
For purposes of potential risk analysis, we use sensitivity analysis to quantify potential impacts that market rate changes may have on the fair values of our hedge portfolio related to firmly committed or forecasted transactions. The sensitivity analysis represents the hypothetical changes in value of the hedge position and does not reflect the related gain or loss on the forecasted underlying transaction. A 10% appreciation or depreciation in the value of the U.S. Dollar against foreign currencies from the prevailing market rates would result in a corresponding increase or decrease of $4 million as of December 31, 2009 in the fair value of the hedge portfolio.
Our cash and cash equivalents are not subject to significant interest rate risk due to the short maturities of these instruments. As of December 31, 2009, the carrying value of our cash and cash equivalents approximated fair value. The interest rate risk associated with our borrowing and investing activities as of December 31, 2009 was not material in relation to our consolidated financial position, results of operations or cash flows.
We utilize non-exchange traded financial instruments, such as foreign exchange forward contracts that we purchase exclusively from highly rated financial institutions. We record these contracts on our balance sheet at fair market value based upon market price quotations from the financial institutions. We do not enter into non-exchange traded contracts that require the use of fair value estimation techniques, but if we did, they could have a material impact on our financial results. Also, we do not enter into hedges for speculative purposes.
We are potentially subject to concentrations of credit risk on accounts receivable and financial instruments, such as hedging instruments and cash and cash equivalents. Credit risk includes the risk of nonperformance by counterparties. The maximum potential loss may exceed the amount recognized on the balance sheet. Exposure
38
Table of Contents
to credit risk is managed through credit approvals, credit limits, selecting major international financial institutions (as counterparties to hedging transactions) and monitoring procedures. Our business often involves large transactions with customers for which we do not require collateral. If one or more of those customers were to default in its obligations under applicable contractual arrangements, we could be exposed to potentially significant losses. Moreover, a prolonged downturn in the global economy could have an adverse impact on the ability of our customers to pay their obligations on a timely basis. We believe that the reserves for potential losses are adequate. As of December 31, 2009, we did not have any major concentration of credit risk related to financial instruments.
39
Table of Contents
| Item 8. | FINANCIAL STATEMENTS AND SUPPLEMENTARY DATA |
Management’s Responsibility for Financial Statements
We are responsible for the preparation, integrity and objectivity of our consolidated financial statements and other financial information presented in our annual report. The accompanying consolidated financial statements were prepared in accordance with accounting principles generally accepted in the United States of America and include certain amounts based on currently available information and our judgment of current conditions and circumstances.
PricewaterhouseCoopers LLP, our independent registered public accounting firm, is engaged to perform audits of our consolidated financial statements. These audits are performed in accordance with the standards of the Public Company Accounting Oversight Board (United States). Our independent registered public accounting firm was given unrestricted access to all financial records and related data, including minutes of all meetings of stockholders, the Board of Directors, and committees of the Board.
The Audit Committee of the Board of Directors, consisting entirely of independent directors who are not employees of NCR, monitors our accounting, reporting, and internal control structure. Our independent registered public accounting firm, internal auditors, and management has complete and free access to the Audit Committee, which periodically meets directly with each group to ensure that their respective duties are being properly discharged.
| /S/ WILLIAM NUTI |
/S/ ROBERT FISHMAN | |||
| William Nuti | Robert Fishman | |||
| Chairman of the Board, Chief Executive Officer and President |
Vice President and Interim Chief Financial Officer |
40
Table of Contents
Report of Independent Registered Public Accounting Firm
To the Board of Directors and Stockholders of NCR Corporation:
In our opinion, the consolidated financial statements listed in the index appearing under Item 15(a)(1) present fairly, in all material respects, the financial position of NCR Corporation and its subsidiaries at December 31, 2009 and 2008, and the results of their operations and their cash flows for each of the three years in the period ended December 31, 2009 in conformity with accounting principles generally accepted in the United States of America. In addition, in our opinion, the financial statement schedule listed in the index appearing under Item 15(a)(2) presents fairly, in all material respects, the information set forth therein when read in conjunction with the related consolidated financial statements. Also in our opinion, the Company maintained, in all material respects, effective internal control over financial reporting as of December 31, 2009, based on criteria established in Internal Control—Integrated Framework issued by the Committee of Sponsoring Organizations of the Treadway Commission (COSO). The Company’s management is responsible for these financial statements and financial statement schedule, for maintaining effective internal control over financial reporting and for its assessment of the effectiveness of internal control over financial reporting, included in Management’s Report on Internal Control over Financial Reporting appearing under Item 9A. Our responsibility is to express opinions on these financial statements, on the financial statement schedule and on the Company’s internal control over financial reporting based on our integrated audits. We conducted our audits in accordance with the standards of the Public Company Accounting Oversight Board (United States). Those standards require that we plan and perform the audits to obtain reasonable assurance about whether the financial statements are free of material misstatement and whether effective internal control over financial reporting was maintained in all material respects. Our audits of the financial statements included examining, on a test basis, evidence supporting the amounts and disclosures in the financial statements, assessing the accounting principles used and significant estimates made by management, and evaluating the overall financial statement presentation. Our audit of internal control over financial reporting included obtaining an understanding of internal control over financial reporting, assessing the risk that a material weakness exists, and testing and evaluating the design and operating effectiveness of internal control based on the assessed risk. Our audits also included performing such other procedures as we considered necessary in the circumstances. We believe that our audits provide a reasonable basis for our opinions.
As discussed in Note 1 to the consolidated financial statements, effective January 1, 2007, the Company changed the manner in which it accounts for uncertain tax positions. Further, as discussed in Note 1 to the consolidated financial statements, effective January 1, 2009, the Company changed the manner in which it accounts for business combinations and for others’ noncontrolling interests in its subsidiaries.
A company’s internal control over financial reporting is a process designed to provide reasonable assurance regarding the reliability of financial reporting and the preparation of financial statements for external purposes in accordance with generally accepted accounting principles. A company’s internal control over financial reporting includes those policies and procedures that (i) pertain to the maintenance of records that, in reasonable detail, accurately and fairly reflect the transactions and dispositions of the assets of the company; (ii) provide reasonable assurance that transactions are recorded as necessary to permit preparation of financial statements in accordance with generally accepted accounting principles, and that receipts and expenditures of the company are being made only in accordance with authorizations of management and directors of the company; and (iii) provide reasonable assurance regarding prevention or timely detection of unauthorized acquisition, use, or disposition of the company’s assets that could have a material effect on the financial statements.
Because of its inherent limitations, internal control over financial reporting may not prevent or detect misstatements. Also, projections of any evaluation of effectiveness to future periods are subject to the risk that controls may become inadequate because of changes in conditions, or that the degree of compliance with the policies or procedures may deteriorate.
| /s/ PricewaterhouseCoopers LLP |
| Dayton, Ohio |
| February 25, 2010 |
41
Table of Contents
Consolidated Statements of Operations
In millions, except per share amounts
| For the years ended December 31 | 2009 | 2008 | 2007 | |||||||||
| Revenue |
||||||||||||
| Product revenue |
$ | 2,234 | $ | 2,861 | $ | 2,693 | ||||||
| Service revenue |
2,378 | 2,454 | 2,277 | |||||||||
| Total revenue |
4,612 | 5,315 | 4,970 | |||||||||
| Operating Expenses |
||||||||||||
| Cost of products |
1,811 | 2,113 | 2,035 | |||||||||
| Cost of services |
1,918 | 2,019 | 1,895 | |||||||||
| Selling, general and administrative expenses |
645 | 713 | 684 | |||||||||
| Research and development expenses |
141 | 148 | 137 | |||||||||
| Total operating expenses |
4,515 | 4,993 | 4,751 | |||||||||
| Income from operations |
97 | 322 | 219 | |||||||||
| Interest expense |
10 | 22 | 24 | |||||||||
| Other expense (income), net |
174 | 12 | (37 | ) | ||||||||
| (Loss) income from continuing operations before income taxes |
(87 | ) | 288 | 232 | ||||||||
| Income tax (benefit) expense |
(57 | ) | 58 | 61 | ||||||||
| (Loss) income from continuing operations |
(30 | ) | 230 | 171 | ||||||||
| (Loss) income from discontinued operations, net of tax |
— | (3 | ) | 103 | ||||||||
| Net (loss) income |
(30 | ) | 227 | 274 | ||||||||
| Net income (loss) attributable to noncontrolling interests |
3 | (1 | ) | — | ||||||||
| Net (loss) income attributable to NCR |
$ | (33 | ) | $ | 228 | $ | 274 | |||||
| Amounts attributable to NCR stockholders: |
||||||||||||
| (Loss) income from continuing operations |
$ | (33 | ) | $ | 231 | $ | 171 | |||||
| (Loss) income from discontinued operations, net of tax |
— | (3 | ) | 103 | ||||||||
| Net (loss) income |
$ | (33 | ) | $ | 228 | $ | 274 | |||||
| Net (loss) income per share attributable to NCR common stockholders: |
||||||||||||
| Net (loss) income per common share from continuing operations: |
||||||||||||
| Basic |
$ | (0.21 | ) | $ | 1.40 | $ | 0.95 | |||||
| Diluted |
$ | (0.21 | ) | $ | 1.38 | $ | 0.94 | |||||
| Net (loss) income per common share |
||||||||||||
| Basic |
$ | (0.21 | ) | $ | 1.38 | $ | 1.52 | |||||
| Diluted |
$ | (0.21 | ) | $ | 1.36 | $ | 1.50 | |||||
| Weighted average common shares outstanding |
||||||||||||
| Basic |
158.9 | 165.3 | 180.1 | |||||||||
| Diluted |
158.9 | 167.9 | 182.7 | |||||||||
The accompanying notes are an integral part of the Consolidated Financial Statements.
42
Table of Contents
In millions, except per share amounts
| As of December 31 | 2009 | 2008 | ||||||
| Assets |
||||||||
| Current assets |
||||||||
| Cash and cash equivalents |
$ | 451 | $ | 711 | ||||
| Accounts receivable, net |
896 | 913 | ||||||
| Inventories, net |
686 | 692 | ||||||
| Other current assets |
266 | 241 | ||||||
| Total current assets |
2,299 | 2,557 | ||||||
| Property, plant and equipment, net |
356 | 308 | ||||||
| Goodwill |
100 | 84 | ||||||
| Prepaid pension cost |
244 | 251 | ||||||
| Deferred income taxes |
617 | 645 | ||||||
| Other assets |
478 | 410 | ||||||
| Total assets |
$ | 4,094 | $ | 4,255 | ||||
| Liabilities and stockholders’ equity |
||||||||
| Current liabilities |
||||||||
| Short-term borrowings |
$ | 4 | $ | 301 | ||||
| Accounts payable |
557 | 492 | ||||||
| Payroll and benefits liabilities |
125 | 210 | ||||||
| Deferred service revenue and customer deposits |
329 | 317 | ||||||
| Other current liabilities |
367 | 373 | ||||||
| Total current liabilities |
1,382 | 1,693 | ||||||
| Long-term debt |
11 | 7 | ||||||
| Pension and indemnity plan liabilities |
1,268 | 1,424 | ||||||
| Postretirement and postemployment benefits liabilities |
355 | 359 | ||||||
| Income tax accruals |
165 | 155 | ||||||
| Environmental liabilities |
279 | 105 | ||||||
| Other liabilities |
42 | 47 | ||||||
| Total liabilities |
3,502 | 3,790 | ||||||
| Commitments and contingencies (Note 11) |
||||||||
| Stockholders’ equity |
||||||||
| NCR stockholders’ equity |
||||||||
| Preferred stock: par value $0.01 per share, 100.0 shares authorized, no shares issued and outstanding as of December 31, 2009 and December 31, 2008 |
— | — | ||||||
| Common stock: par value $0.01 per share, 500.0 shares authorized, 159.6 and 158.1 shares issued and outstanding as of December 31, 2009 and December 31, 2008 respectively |
2 | 2 | ||||||
| Paid-in capital |
270 | 248 | ||||||
| Retained earnings |
1,801 | 1,834 | ||||||
| Accumulated other comprehensive loss |
(1,509 | ) | (1,644 | ) | ||||
| Total NCR stockholders’ equity |
564 | 440 | ||||||
| Noncontrolling interests in subsidiaries |
28 | 25 | ||||||
| Total stockholders’ equity |
592 | 465 | ||||||
| Total liabilities and stockholders’ equity |
$ | 4,094 | $ | 4,255 | ||||
The accompanying notes are an integral part of the Consolidated Financial Statements.
43
Table of Contents
Consolidated Statements of Cash Flows
In millions
| For the years ended December 31 | 2009 | 2008 | 2007 | |||||||||
| Operating activities |
||||||||||||
| Net (loss) income |
$ | (30 | ) | $ | 227 | $ | 274 | |||||
| Adjustments to reconcile net income (loss) to net cash provided by operating activities: |
||||||||||||
| Loss (income) from discontinued operations |
— | 3 | (103 | ) | ||||||||
| Depreciation and amortization |
124 | 109 | 110 | |||||||||
| Stock-based compensation expense |
12 | 41 | 42 | |||||||||
| Excess tax benefit from stock-based compensation |
— | (2 | ) | (9 | ) | |||||||
| Deferred income taxes |
(132 | ) | — | (7 | ) | |||||||
| Gains on sale of property, plant, and equipment, net |
(9 | ) | (27 | ) | (2 | ) | ||||||
| Impairment of equity investments and related assets |
39 | — | — | |||||||||
| Changes in operating assets and liabilities: |
||||||||||||
| Receivables |
27 | 249 | (166 | ) | ||||||||
| Inventories |
5 | 25 | (76 | ) | ||||||||
| Current payables and accrued expenses |
(28 | ) | (56 | ) | 52 | |||||||
| Deferred service revenue and customer deposits |
18 | (42 | ) | 43 | ||||||||
| Employee severance and pension |
49 | (43 | ) | (31 | ) | |||||||
| Environmental liabilities |
109 | 1 | 9 | |||||||||
| Other assets and liabilities |
39 | (70 | ) | 15 | ||||||||
| Net cash provided by operating activities |
223 | 415 | 151 | |||||||||
| Investing activities |
||||||||||||
| Grant reimbursements from capital expenditures |
9 | — | — | |||||||||
| Expenditures for property, plant and equipment |
(121 | ) | (75 | ) | (64 | ) | ||||||
| Proceeds from sales of property, plant and equipment |
11 | 59 | 31 | |||||||||
| Additions to capitalized software |
(61 | ) | (63 | ) | (48 | ) | ||||||
| Other investing activities, business acquisitions and divestitures, net |
(41 | ) | (65 | ) | (12 | ) | ||||||
| Net cash used in investing activities |
(203 | ) | (144 | ) | (93 | ) | ||||||
| Financing activities |
||||||||||||
| Repurchases of Company common stock |
(1 | ) | (494 | ) | (83 | ) | ||||||
| Excess tax benefit from stock-based compensation |
— | 2 | 9 | |||||||||
| Short-term borrowings, net |
4 | — | — | |||||||||
| Repayment of senior unsecured notes |
(300 | ) | — | — | ||||||||
| Payments on revolving credit facility |
(30 | ) | — | — | ||||||||
| Borrowings on revolving credit facility |
30 | — | — | |||||||||
| Proceeds from employee stock plans |
9 | 17 | 48 | |||||||||
| Distribution to discontinued operations |
— | — | (200 | ) | ||||||||
| Other financing activities, net |
— | — | (1 | ) | ||||||||
| Net cash used in financing activities |
(288 | ) | (475 | ) | (227 | ) | ||||||
| Cash flows from discontinued operations |
||||||||||||
| Net cash (used in) provided by operating activities |
— | (19 | ) | 223 | ||||||||
| Net cash used in investing activities |
— | — | (74 | ) | ||||||||
| Net cash provided by financing activities |
— | — | 5 | |||||||||
| Net cash (used in) provided by discontinued operations |
— | (19 | ) | 154 | ||||||||
| Effect of exchange rate changes on cash and cash equivalents |
8 | (18 | ) | 20 | ||||||||
| (Decrease) increase in cash and cash equivalents |
(260 | ) | (241 | ) | 5 | |||||||
| Cash and cash equivalents at beginning of year |
711 | 952 | 947 | |||||||||
| Cash and cash equivalents at end of year |
$ | 451 | $ | 711 | $ | 952 | ||||||
| Supplemental data |
||||||||||||
| Cash paid during the year for: |
||||||||||||
| Income taxes |
$ | 49 | $ | 108 | $ | 123 | ||||||
| Interest |
$ | 10 | $ | 22 | $ | 24 | ||||||
The accompanying notes are an integral part of the Consolidated Financial Statements.
44
Table of Contents
Consolidated Statements of Changes in Stockholders’ Equity
In millions
| NCR Stockholders | NonControlling interests in Subsidiaries |
Total | ||||||||||||||||||||||||
| Common Stock | Paid-in Capital |
Retained Earnings |
Accumulated Other Comprehensive (Loss) Income |
|||||||||||||||||||||||
| Shares | Amount | |||||||||||||||||||||||||
| December 31, 2006 |
179 | $ | 2 | $ | 655 | $ | 1,900 | $ | (676) | $ | 20 | $ | 1,901 | |||||||||||||
| Comprehensive income (loss): |
||||||||||||||||||||||||||
| Net income |
— | — | — | 274 | — | — | 274 | |||||||||||||||||||
| Other comprehensive income (loss): |
||||||||||||||||||||||||||
| Foreign currency translation |
— | — | — | — | 15 | (1 | ) | 14 | ||||||||||||||||||
| Unrealized losses from securities, net of tax benefit of $1 |
— | — | — | — | (4 | ) | — | (4 | ) | |||||||||||||||||
| Cash flow hedging gains (losses), net of tax benefit of $1 |
— | — | — | — | (3 | ) | — | (3 | ) | |||||||||||||||||
| Changes to unrecognized losses and prior service cost related to pension, postretirement and postemployment benefits, net of tax expense of $60 |
— | — | — | — | 120 | — | 120 | |||||||||||||||||||
| Total other comprehensive income (loss) |
— | — | — | — | 128 | (1 | ) | 127 | ||||||||||||||||||
| Total comprehensive income (loss) |
— | — | — | 274 | 128 | (1 | ) | 401 | ||||||||||||||||||
| Spin-off of Teradata (Note 12) |
— | — | (4 | ) | (561 | ) | 12 | — | (553 | ) | ||||||||||||||||
| Employee stock purchase and stock compensation plans |
2 | — | 115 | — | — | — | 115 | |||||||||||||||||||
| Repurchase of Company common stock |
(3 | ) | — | (83 | ) | — | — | — | (83 | ) | ||||||||||||||||
| Adoption of accounting guidance for uncertain tax positions |
— | — | — | (5 | ) | — | — | (5 | ) | |||||||||||||||||
| December 31, 2007 |
178 | $ | 2 | $ | 683 | $ | 1,608 | $ | (536 | ) | $ | 19 | $ | 1,776 | ||||||||||||
| Comprehensive income (loss): |
||||||||||||||||||||||||||
| Net income (loss) |
— | — | — | 228 | — | (1 | ) | 227 | ||||||||||||||||||
| Other comprehensive income (loss): |
||||||||||||||||||||||||||
| Foreign currency translation |
— | — | — | — | (201 | ) | — | (201 | ) | |||||||||||||||||
| Unrealized losses from securities, net of tax benefit of $1 |
— | — | — | — | (7 | ) | — | (7 | ) | |||||||||||||||||
| Cash flow hedging gains (losses), net of tax benefit of $0 |
— | — | — | — | (7 | ) | — | (7 | ) | |||||||||||||||||
| Changes to unrecognized losses and prior service cost related to pension, postretirement and postemployment benefits, net of tax benefit of $477 |
— | — | — | — | (893 | ) | — | (893 | ) | |||||||||||||||||
| Total other comprehensive income (loss) |
— | — | — | — | (1,108 | ) | — | (1,108 | ) | |||||||||||||||||
| Total comprehensive income (loss) |
— | — | — | 228 | (1,108 | ) | (1 | ) | (881 | ) | ||||||||||||||||
| Spin-off of Teradata (Note 12) |
— | — | — | (2 | ) | — | — | (2 | ) | |||||||||||||||||
| Employee stock purchase and stock compensation plans |
2 | — | 59 | — | — | — | 59 | |||||||||||||||||||
| Repurchase of Company common stock |
(22 | ) | — | (494 | ) | — | — | — | (494 | ) | ||||||||||||||||
| Increase (decrease) in noncontrolling interests |
— | — | — | — | — | 7 | 7 | |||||||||||||||||||
| December 31, 2008 |
158 | $ | 2 | $ | 248 | $ | 1,834 | $ | (1,644 | ) | $ | 25 | $ | 465 | ||||||||||||
| Comprehensive income (loss): |
||||||||||||||||||||||||||
| Net (loss) income |
— | — | — | (33 | ) | — | 3 | (30 | ) | |||||||||||||||||
| Other comprehensive income (loss): |
||||||||||||||||||||||||||
| Foreign currency translation |
— | — | — | — | 28 | — | 28 | |||||||||||||||||||
| Unrealized gains from securities, net of tax expense of $0 |
— | — | — | — | 1 | — | 1 | |||||||||||||||||||
| Cash flow hedging gains (losses), net of tax expense of $0 |
— | — | — | — | 8 | — | 8 | |||||||||||||||||||
| Changes to unrecognized gains and prior service cost related to pension, postretirement and postemployment benefits, net of tax expense of $110 |
— | — | — | — | 98 | — | 98 | |||||||||||||||||||
| Total other comprehensive income (loss) |
— | — | — | — | 135 | — | 135 | |||||||||||||||||||
| Total comprehensive income (loss) |
— | — | — | (33 | ) | 135 | 3 | 105 | ||||||||||||||||||
| Employee stock purchase and stock compensation plans |
2 | — | 23 | — | — | — | 23 | |||||||||||||||||||
| Repurchase of Company common stock |
— | — | (1 | ) | — | — | — | (1 | ) | |||||||||||||||||
| December 31, 2009 |
160 | $ | 2 | $ | 270 | $ | 1,801 | $ | (1,509 | ) | $ | 28 | $ | 592 | ||||||||||||
The accompanying notes are an integral part of the Consolidated Financial Statements.
45
Table of Contents
NOTES TO CONSOLIDATED FINANCIAL STATEMENTS
Note 1 Description of Business and Significant Accounting Policies
Description of Business NCR Corporation (NCR or the Company, also referred to as “we,” “us” or “our”) and its subsidiaries provide technology and services that are designed specifically to enable NCR’s customers to connect, interact and transact with their customers.
NCR provides solutions for a range of industries including financial services, retail and hospitality, travel and gaming, healthcare, and entertainment. NCR’s solutions are built on a foundation of long-established industry knowledge and consulting expertise, value-added software and hardware technology, global customer support services, and a complete line of business consumables and specialty media products.
Classification of operations following Teradata Spin-off On September 30, 2007, NCR completed the spin-off of its Teradata Data Warehousing business through the distribution of a tax-free stock dividend to its stockholders. NCR distributed one share of common stock of Teradata Corporation (Teradata) for each share of NCR common stock to NCR stockholders of record as of the close of business on September 14, 2007. Upon the distribution of Teradata, NCR stockholders received 100% (approximately 181 million shares) of the common stock of Teradata, which is now an independent public company trading under the symbol “TDC” on the New York Stock Exchange.
The results of operations and cash flows of Teradata have been presented as a discontinued operation for all periods presented in this Form 10-K. See Note 12, “Discontinued Operations” for a further discussion of the spin-off of Teradata. Unless otherwise stated, these Notes to Consolidated Financial Statements exclude information related to the Teradata Data Warehousing business.
Evaluation of Subsequent Events The Company evaluated subsequent events through the date our Consolidated Financial Statements were issued. No matters were identified that would materially impact our Consolidated Financial Statements or require additional disclosure.
Out of Period Adjustments In the second quarter of 2007, the Company recorded an adjustment to increase income tax expense by $17 million relating to immaterial errors originating in prior years. The adjustment was composed of an increase to income tax expense of $25 million due to an understatement of income tax expense in the years 2001 through 2006 relating to the accounting for income taxes on intercompany profit. This adjustment was offset, in part, by an adjustment to reduce income tax expense by $8 million as a result of an overstatement of income tax expense (and the related liability) in 2006 due to an error in preparing that year’s income tax provision. Of the total $17 million adjustment, the amount recorded in the results from continuing operations was $10 million and the remaining $7 million was recorded in the results from discontinued operations. The Company determined that the impact of these corrections in all prior interim and annual periods and to 2007 results was immaterial to the results of operations.
During 2009, the Company recorded adjustments to decrease product revenue by $10 million and cost of products by $7 million, which resulted in a net decrease in gross margin and net income of $3 million. The adjustments related to revenue incorrectly recorded during 2008 by the Company’s Japanese subsidiary. Also during 2009, the Company recorded an adjustment to operating expenses to recognize additional employer benefits at its Italian subsidiary. These costs, which were incurred in 2007 and 2008, reduced 2009 net income by $3 million. The Company determined the impact of these errors was not material to the annual or interim financial statements of previous periods and the effect of correcting these errors in 2009 was not material to the 2009 annual or interim financial statements.
Basis of Consolidation The consolidated financial statements include the accounts of NCR and its majority-owned subsidiaries. Long-term investments in affiliated companies in which NCR owns between 20% and 50%, and therefore, exercises significant influence, but which it does not control, are accounted for using the equity method. Investments in which NCR does not exercise significant influence (generally, when NCR has an investment of less than 20% and no significant influence, such as representation on the investee’s board of directors) are accounted for using the cost method. All significant inter-company transactions and accounts have been eliminated. In addition, the Company is required to determine whether it is the primary beneficiary of
46
Table of Contents
economic income or losses that may be generated by variable interest entities in which the Company has such an interest. In circumstances where the Company determined it is the primary beneficiary, consolidation of that entity would be required.
Reclassifications Certain prior-period amounts have been reclassified in the accompanying Consolidated Financial Statements and Notes thereto in order to conform to the current period presentation. Except for the reclassification of noncontrolling interests described in the section, “Recently Issued Accounting Pronouncements,” below, none of the reclassifications affected previously reported net income.
Use of Estimates The preparation of financial statements in conformity with accounting principles generally accepted in the United States (otherwise referred to as GAAP) requires management to make estimates and judgments that affect the reported amounts of assets and liabilities, the disclosure of contingent assets and liabilities at the date of the financial statements, and revenues and expenses during the period reported. Actual results could differ from those estimates.
Revenue Recognition The Company records revenue, net of taxes, when it is realized, or realizable, and earned. The Company considers these criteria met when persuasive evidence of an arrangement exists, the products or services have been provided to the customer, the sales price is fixed or determinable, and collectability is reasonably assured. For product sales, delivery is deemed to have occured when the customer has assumed risk of loss of the goods sold and all performance obligations are complete. For service sales, revenue is recognized as the services are provided or ratably over the service period.
NCR frequently enters into multiple-element arrangements with its customers including hardware, software, professional consulting services and maintenance support services. For arrangements involving multiple deliverables, where the delivered items have stand-alone value, verifiable objective evidence of selling price exists for the undelivered items, and the customer has no general right of return, NCR separates the deliverables and allocates the total arrangement consideration among the units of accounting. Each unit of accounting is then accounted for under the applicable revenue recognition guidance.
In situations where NCR’s solutions contain software that is more than incidental to the hardware and services, revenue related to the software and software-related elements is supported by vendor-specific objective evidence (VSOE). VSOE of selling price is established by the price charged when each element is sold separately. In situations when there is appropriate evidence for all undelivered elements, but not for delivered elements, the residual method is used to allocate the arrangement’s consideration. Under the residual method, the selling price of undelivered elements is deferred and the remaining portion of the arrangement fee is allocated to the delivered elements and recognized as revenue.
NCR’s customers may request that delivery and passage of title and risk of loss occur on a bill and hold basis. For each of the three years ended December 31, 2009, the amount from bill and hold transactions approximated 1% or less of total revenue.
In addition to the standard product warranty, the Company periodically offers extended warranties to its customers in the form of product maintenance services. For contracts that are not separately priced but include product maintenance, the Company defers revenue at an amount equal to its objective and reliable fair value of the product maintenance and recognizes the deferred revenue over the service term. For separately priced product maintenance contracts, NCR defers the stated amount of the separately priced contract and recognizes the deferred revenue ratably over the service term.
Shipping and Handling Costs related to shipping and handling are included in cost of products in the Consolidated Statements of Operations.
Cash and Cash Equivalents All short-term, highly liquid investments having original maturities of three months or less are considered to be cash equivalents.
47
Table of Contents
Allowance for Doubtful Accounts NCR establishes provisions for doubtful accounts using percentages of accounts receivable balances to reflect historical average credit losses and specific provisions for known issues.
Inventories Inventories are stated at the lower of cost or market, using the average cost method. Cost includes materials, labor and manufacturing overhead related to the purchase and production of inventories. Service parts are included in inventories and include reworkable and non-reworkable service parts. The Company regularly reviews inventory quantities on hand, future purchase commitments with suppliers and the estimated utility of inventory. If the review indicates a reduction in utility below carrying value, inventory is reduced to a new cost basis. Excess and obsolete reserves are established based on forecasted usage, orders, technological obsolescence and inventory aging.
Long-Lived Assets
Capitalized Software Certain direct development costs associated with internal-use software are capitalized within other assets and amortized over the estimated useful lives of the resulting software. NCR typically amortizes capitalized internal-use software on a straight-line basis over four years beginning when the asset is substantially ready for use, as this is considered to approximate the usage pattern of the software.
Costs incurred for the development of software that will be sold, leased or otherwise marketed are capitalized when technological feasibility has been established. These costs are included within other assets and are amortized over the estimated useful lives of the resulting software. The Company amortizes capitalized software on a sum-of- the-years’ digits basis over three years beginning when the product is available for general release, as this is considered to approximate the sales pattern of the software. Costs capitalized include direct labor and related overhead costs. Costs incurred prior to technological feasibility or after general release are expensed as incurred. The following table identifies the activity relating to total capitalized software:
| In millions |
2009 | 2008 | 2007 | |||||||||
| Beginning balance as of January 1 |
$ | 92 | $ | 75 | $ | 69 | ||||||
| Capitalization |
61 | 63 | 48 | |||||||||
| Amortization |
(51 | ) | (46 | ) | (42 | ) | ||||||
| Ending balance as of December 31 |
$ | 102 | $ | 92 | $ | 75 | ||||||
Goodwill and Other Intangible Assets Goodwill represents the excess of purchase price over the value assigned to the net tangible and identifiable intangible assets of businesses acquired. Goodwill is not amortized; instead it is tested annually for impairment or more frequently if certain events occur indicating that the carrying value of goodwill may be impaired. A significant amount of judgment is involved in determining if an indicator of impairment has occurred. Such indicators may include a decline in expected cash flows, a significant adverse change in legal factors or in the business climate, unanticipated competition, or slower growth rates, among others.
Goodwill is allocated among and evaluated for impairment at the reporting unit level, which is defined as an operating segment or one level below an operating segment. NCR has three reporting units which are Americas, Europe, Middle East and Africa (EMEA) and Asia Pacific Japan (APJ). Total goodwill is allocated among the reporting units as follows: $47 million related to Americas, $28 million related to EMEA and $25 million related to APJ.
The evaluation of impairment involves comparing the current fair value of each reporting unit to its carrying value, including goodwill. NCR uses a discounted cash flow model (DCF model) to estimate the current fair value of its reporting units when testing for impairment. A number of significant assumptions and estimates are involved in the application of the DCF model to forecast operating cash flows, including markets and market shares, sales volumes and prices, costs to produce, tax rates, capital spending, discount rate and working capital changes. Most of these assumptions vary among reporting units. The cash flow forecasts are generally based on approved strategic operating plans.
48
Table of Contents
In the event the estimated fair value of a reporting unit based on the DCF model is less than the carrying value, an additional analysis would be required. The additional analysis would compare the carrying value of the reporting unit’s goodwill with the implied fair value of that goodwill. The implied fair value of goodwill is the excess of the fair value of the reporting unit over the fair value amounts assigned to all of the assets and liabilities of that unit as if the reporting unit was acquired in a business combination and the fair value of the reporting unit represented the purchase price. If the carrying value of goodwill exceeds its implied fair value, an impairment loss equal to such excess would be recognized.
Acquired intangible assets other than goodwill are amortized over their estimated useful lives unless the lives are determined to be indefinite. Acquired intangible assets are carried at cost, less accumulated amortization. For intangible assets purchased in a business combination, the estimated fair values of the assets received are used to establish the carrying value. The fair value of acquired intangible assets is determined using common techniques, and the Company employs assumptions developed using the perspective of a market participant.
Property, Plant and Equipment Property, plant and equipment, and leasehold improvements are stated at cost less accumulated depreciation. Depreciation is computed over the estimated useful lives of the related assets primarily on a straight-line basis. Machinery and other equipment are depreciated over 3 to 20 years and buildings over 25 to 45 years. Leasehold improvements are depreciated over the life of the lease or the asset, whichever is shorter. Assets classified as held for sale are not depreciated. Upon retirement or disposition of property, plant and equipment, the related cost and accumulated depreciation or amortization are removed from the Company’s accounts, and a gain or loss is recorded. Depreciation expense related to property, plant and equipment was $68 million, $58 million and $61 million for the year ended December 31, 2009, 2008 and 2007, respectively.
Valuation of Long-Lived Assets Long-lived assets such as property, plant and equipment, and software are reviewed for impairment when events or changes in circumstances indicate that the carrying amount of the assets may not be recoverable or in the period in which the held for sale criteria is met. This analysis consists of comparing the asset’s carrying value to the expected future cash flows to be generated from the asset on an undiscounted basis. If the carrying amount of the asset is determined not to be recoverable, a write-down to fair value is recorded. Fair values are determined based on quoted market values, discounted cash flows, or external appraisals, as applicable. Long-lived assets are reviewed for impairment at the individual asset or the asset group level for which the lowest level of independent cash flows can be identified.
Warranty and Sales Returns Provisions for product warranties and sales returns and allowances are recorded in the period in which NCR becomes obligated to honor the related right, which generally is the period in which the related product revenue is recognized. The Company accrues warranty reserves and sales returns and allowances using percentages of revenue to reflect the Company’s historical average warranty and sales return claims.
Research and Development Costs Research and development costs primarily include payroll and benefit-related costs, contractor fees, facilities costs, infrastructure costs, and administrative expenses directly related to research and development support and are expensed as incurred, except certain software development costs capitalized after technological feasibility of the software is established.
Leases The Company accounts for material escalation clauses, free or reduced rents and landlord incentives contained in operating type leases on a straight-line basis over the lease term, including any reasonably assured lease renewals. For leasehold improvements that are funded by the landlord, the Company records the incentive as deferred rent. The deferred rent is then amortized as reductions to lease expense over the lease term.
For capital leases where NCR is the lessee, it records an amortizable debt and a related fixed asset in the Consolidated Balance Sheet.
Pension, Postretirement and Postemployment Benefits NCR has significant pension, postretirement and postemployment benefit costs, which are developed from actuarial valuations. Actuarial assumptions are established to anticipate future events and are used in calculating the expense and liabilities relating to these
49
Table of Contents
plans. These factors include assumptions the Company makes about interest rates, expected investment return on plan assets, rate of increase in healthcare costs, total and involuntary turnover rates, and rates of future compensation increases. In addition, NCR also uses subjective factors, such as withdrawal rates and mortality rates to develop the Company’s valuations. NCR generally reviews and updates these assumptions on an annual basis. NCR is required to consider current market conditions, including changes in interest rates, in making these assumptions. The actuarial assumptions that NCR uses may differ materially from actual results due to changing market and economic conditions, higher or lower withdrawal rates, or longer or shorter life spans of participants. These differences may result in a significant impact to the amount of pension, postretirement or postemployment benefits expense, and the related assets and liabilities, the Company has recorded or may record.
Foreign Currency For many NCR international operations, the local currency is designated as the functional currency. Accordingly, assets and liabilities are translated into U.S. Dollars at year-end exchange rates, and revenues and expenses are translated at average exchange rates prevailing during the year. Currency translation adjustments from local functional currency countries resulting from fluctuations in exchange rates are recorded in other comprehensive income. Where the U.S. Dollar is the functional currency, translation adjustments are recorded in other income and expense.
Derivative Instruments In the normal course of business, NCR enters into various financial instruments, including derivative financial instruments. The Company accounts for derivatives as either assets or liabilities in the consolidated balance sheets at fair value and recognizes the resulting gains or losses as adjustments to earnings or other comprehensive income. The Company formally documents all relationships between hedging instruments and hedged items, as well as the risk management objective and strategy for undertaking various hedge transactions. Hedging activities are transacted only with highly rated institutions, reducing exposure to credit risk in the event of nonperformance. Additionally, the Company completes assessments related to the risk of counterparty nonperformance on a regular basis.
The accounting for changes in fair value of a derivative instrument depends on whether it has been designated and qualifies as part of a hedging relationship, and further, on the type of hedging relationship. For those derivative instruments that are designated and qualify as hedging instruments, the Company has designated the hedging instrument, based on the exposure being hedged, as a fair value hedge, a cash flow hedge or a hedge of a net investment in a foreign operation. For derivative instruments designated as fair value hedges, the effective portion of the hedge is recorded as an offset to the change in the fair value of the hedged item, and the ineffective portion of the hedge, if any, is recorded in the Statement of Operations. For derivative instruments designated as cash flow hedges and determined to be highly effective, the gains or losses are deferred in other comprehensive income and recognized in the determination of income as adjustments of carrying amounts when the underlying hedged transaction is realized, canceled or otherwise terminated. When hedging certain foreign currency transactions of a long-term investment nature (net investments in foreign operations) gains and losses are recorded in the currency translation adjustment component of accumulated other comprehensive income (loss). Gains and losses on foreign exchange contracts that are not used to hedge currency transactions of a long-term investment nature, or that are not designated as cash flow or fair value hedges, are recognized in other income or expense as exchange rates change.
Fair Value of Assets and Liabilities Fair value is defined as an exit price, representing an amount that would be received to sell an asset or the amount paid to transfer a liability in an orderly transaction between market participants at the measurement date. As such, fair value is a market-based measurement determined based on assumptions that market participants would use in pricing an asset or liability. As a basis for considering such assumptions, the guidance prioritizes the inputs used to measure fair value into the following three-tier fair value hierarchy:
| • | Level 1: Unadjusted quoted prices in active markets for identical assets or liabilities |
| • | Level 2: Unadjusted quoted prices in active markets for similar assets or liabilities, unadjusted quoted prices for identical or similar assets or liabilities in markets that are not active or inputs, other than quoted prices in active markets, that are observable either directly or indirectly |
| • | Level 3: Unobservable inputs for which there is little or no market data |
50
Table of Contents
Assets and liabilities are classified based on the lowest level of input that is significant to the fair value measurements. The Company reviews the fair value hierarchy classification on a quarterly basis. Changes to the observability of valuation inputs may result in a reclassification of levels for certain securities within the fair value hierarchy.
NCR measures its financial assets and financial liabilities at fair value based on one or more of the following three valuation techniques:
| • | Market approach: Prices and other relevant information generated by market transactions involving identical or comparable assets or liabilities. |
| • | Cost approach: Amount that would be required to replace the service capacity of an asset (replacement cost). |
| • | Income approach: Techniques to convert future amounts to a single present amount based upon market expectations (including present value techniques, option pricing and excess earnings models). |
We regularly review our investments to determine whether a decline in fair value, if any, below the cost basis is other than temporary. If the decline in the fair value is determined to be other than temporary, the cost basis of the security is written down to fair value and the amount of the write-down is included in the Consolidated Statement of Operations.
Environmental and Legal Contingencies In the normal course of business, NCR is subject to various regulations, proceedings, lawsuits, claims and other matters, including actions under laws and regulations related to the environment and health and safety, among others. NCR believes that the amounts provided in its consolidated financial statements are adequate in light of the probable and estimable liabilities. However, there can be no assurances that the actual amounts required to satisfy alleged liabilities from various lawsuits, claims, legal proceedings and other matters, including the Fox River environmental matter discussed in Note 11, “Commitments and Contingencies” and to comply with applicable laws and regulations, will not exceed the amounts reflected in NCR’s consolidated financial statements or will not have a material adverse effect on the consolidated results of operations, financial condition or cash flows. Any costs that may be incurred in excess of those amounts provided as of December 31, 2009 cannot currently be reasonably determined or are not currently considered probable.
Legal costs related to loss contingencies are typically expensed as incurred, except for certain costs associated with NCR’s environmental remediation obligations. Costs and fees associated with litigating the extent and type of required remedial actions and the allocation of remediation costs among potentially responsible parties are typically included in the measurement of the environmental remediation liabilities.
Advertising Advertising costs are recognized in selling, general, and administrative expenses when incurred.
Income Taxes Income tax expense is provided based on income before income taxes. Deferred income taxes reflect the impact of temporary differences between assets and liabilities recognized for financial reporting purposes and such amounts recognized for tax purposes. These deferred taxes are determined based on the enacted tax rates expected to apply in the periods in which the deferred assets or liabilities are expected to be settled or realized. NCR records valuation allowances related to its deferred income tax assets when it is more likely than not that some portion or all of the deferred income tax assets will not be realized.
Effective January 1, 2007, we adopted authoritative guidance for the accounting for uncertainty in income taxes which prescribes a comprehensive model to recognize, measure, present and disclose in financial statements uncertain tax positions taken or expected to be taken on a tax return. Our financial statements reflect expected future tax consequences of such uncertain positions assuming the taxing authorities’ full knowledge of the position and all relevant facts. Refer to Note 7, “Income Taxes,” for further information on NCR’s accounting for income taxes.
Earnings Per Share Basic earnings per share is calculated by dividing net income by the weighted average number of shares outstanding during the reported period. The calculation of diluted earnings per share is similar to basic earnings per share, except that the weighted average number of shares outstanding includes the dilution
51
Table of Contents
from potential shares resulting from stock options and restricted stock awards. When calculating diluted earnings per share, the Company includes the potential windfall or shortfall tax benefits as well as average unrecognized compensation expense as part of the assumed proceeds from exercises of stock options. The Company uses the tax law ordering approach to determine the potential utilization of windfall benefits. Refer to Note 8, “Employee Stock Compensation Plans,” for share information on NCR’s stock compensation plans.
The components of basic and diluted earnings per share attributable to NCR common stockholders are as follows (in millions, except earnings per share) for the years ended December 31:
| 2009 | 2008 | 2007 | |||||||||
| (Loss) income from continuing operations |
$ | (33 | ) | $ | 231 | $ | 171 | ||||
| (Loss) income from discontinued operations |
— | (3 | ) | 103 | |||||||
| Net (loss) income applicable to common shares |
$ | (33 | ) | $ | 228 | $ | 274 | ||||
| Weighted average outstanding shares of common stock |
158.9 | 165.3 | 180.1 | ||||||||
| Dilutive effect of employee stock options and restricted stock |
— | 2.6 | 2.6 | ||||||||
| Common stock and common stock equivalents |
158.9 | 167.9 | 182.7 | ||||||||
| Basic earnings per share: |
|||||||||||
| From continuing operations |
$ | (0.21 | ) | $ | 1.40 | $ | 0.95 | ||||
| From discontinued operations |
— | (0.02 | ) | 0.57 | |||||||
| Total earnings per share (Basic) |
$ | (0.21 | ) | $ | 1.38 | $ | 1.52 | ||||
| Diluted earnings per share: |
|||||||||||
| From continuing operations |
$ | (0.21 | ) | $ | 1.38 | $ | 0.94 | ||||
| From discontinued operations |
— | (0.02 | ) | 0.56 | |||||||
| Total earnings per share (Diluted) |
$ | (0.21 | ) | $ | 1.36 | $ | 1.50 | ||||
For 2009, due to the net loss from continuing operations, potential common shares that would cause dilution, such as stock options and restricted stock, have been excluded from the diluted share count because their effect would have been anti-dilutive. For the year ended December 31, 2009, the fully diluted shares would have been 160.1 million shares.
Options to purchase 7.0 million and 7.2 million shares of common stock for 2009 and 2008, respectively, and less than 0.1 million shares of common stock for 2007, were outstanding but were not included in the computation of diluted earnings per share because the options’ exercise prices were greater than the average market price of the common shares and, therefore, the effect would have been anti-dilutive.
Stock Compensation Stock-based compensation represents the costs related to share-based awards granted to employees and directors. For all periods presented, the Company’s outstanding stock-based compensation awards are classified as equity except for certain awards granted to non-employee directors. The Company measures stock-based compensation cost at grant date, based on the estimated fair value of the award and recognizes the cost on a straight-line basis (net of estimated forfeitures) over the employee requisite service period. Refer to Note 8, “Employee Stock Compensation Plans,” for more information on NCR’s stock-based compensation plans.
Recently Issued Accounting Pronouncements
In December 2007, the Financial Accounting Standards Board (FASB) issued authoritative guidance on the accounting for noncontrolling interests in consolidated financial statements. This guidance applies to all entities that have an outstanding noncontrolling interest (formerly known as minority interest) in one or more subsidiaries or deconsolidate a subsidiary. The adoption of the new guidance, effective January 1, 2009, did not have a material impact on the Company’s Consolidated Financial Statements. We have changed the presentation of our Consolidated Financial Statements, including the presentation of noncontrolling interests’ share of income or loss separately from net income or loss attributable to NCR’s common stockholders and the presentation of the noncontrolling interest within equity.
52
Table of Contents
In December 2007, the FASB issued a new accounting standard related to business combinations. The new standard expands the definition of a business and a business combination; requires recognition of assets acquired, liabilities assumed, and contingent consideration at their fair value on the acquisition date with subsequent changes recognized in earnings; requires acquisition-related expenses and restructuring costs to be recognized separately from the business combination and expensed as incurred; requires in-process research and development to be capitalized at fair value as an indefinite-lived intangible asset; and requires that changes in accounting for deferred tax asset valuation allowances and acquired income tax uncertainties after the measurement period be recognized as a component of provision for taxes. The new standard also establishes disclosure requirements to enable the evaluation of the nature and financial effects of the business combination. We adopted the guidance on its effective date, January 1, 2009, and applied the provisions of the new guidance to the acquisitions completed during 2009.
In December 2008, the FASB issued guidance on employers’ disclosures about postretirement benefit plan assets which requires additional disclosures by public companies regarding plan assets of defined benefit pension or other postretirement benefit plans. The guidance requires additional disclosures regarding the investment allocation decision making process, the fair value of each major category of plan assets, and the inputs and valuation techniques used to measure the fair value of the plan assets. The disclosures will not be required for earlier periods presented for comparative purposes. We adopted the guidance on its effective date and have provided the additional disclosures in Note 9, “Employee Benefit Plans”.
On June 30, 2009, NCR adopted changes issued by the FASB to the accounting for and disclosure of events that occur after the balance sheet date but before financial statements are issued or are available to be issued, otherwise known as “subsequent events.” Specifically, these changes set forth the period after the balance sheet date during which management of a reporting entity should evaluate events or transactions that may occur for potential recognition or disclosure in the financial statements, the circumstances under which an entity should recognize events or transactions occurring after the balance sheet date in its financial statements, and the disclosures that an entity should make about events or transactions that occurred after the balance sheet date. The adoption of these changes had no impact on the Consolidated Financial Statements as NCR’s management already followed a similar approach prior to the adoption of this new guidance. The additional disclosures are included in Note 1, “Description of the Business and Significant Accounting Policies”.
In September 2009, the FASB ratified the final consensus reached by the Emerging Issues Task Force (EITF) that revised the authoritative guidance for revenue arrangements with multiple deliverables. The guidance addresses how to determine whether an arrangement involving multiple deliverables contains more than one unit of accounting and how the arrangement consideration should be allocated among the separate units of accounting. The guidance will be effective for fiscal years beginning after June 15, 2010 with early adoption permitted. The guidance may be applied retrospectively or prospectively for new or materially modified arrangements. Under the consensus adopted by the EITF, use of the residual method, which the Company applies to many of its customer arrangements, will no longer be permitted. The new guidance will require the Company to use its best estimate of a deliverable’s selling price whenever it lacks objective evidence. The result of this change is that any discount in a customer arrangement which previously would have been allocated to delivered items, will instead be allocated on a relative fair value basis among all the deliverables. The Company is in the process of evaluating the effects, if any, the adoption of the guidance will have on its consolidated financial statements.
In September 2009, the FASB also ratified the final consensus reached by the EITF that modifies the scope of the software revenue recognition guidance to exclude (a) non-software components of tangible products and (b) software components of tangible products that are sold, licensed or leased with tangible products when the software components and non-software components of the tangible product function together to deliver the tangible product’s essential functionality. The guidance will be effective for fiscal years beginning after June 15, 2010 with early adoption permitted. The guidance may be applied retrospectively or prospectively for new or materially modified arrangements but must be adopted contemporaneously with guidance described in the preceding paragraph. The Company is in the process of evaluating the effects, if any, the adoption of the guidance will have on its consolidated financial statements.
53
Table of Contents
Note 2 Supplemental Financial Information (in millions)
| For the years ended December 31 | 2009 | 2008 | 2007 | |||||||||
| Other (income) expense, net |
||||||||||||
| Interest income |
$ | (6 | ) | $ | (23 | ) | $ | (55 | ) | |||
| Fox River provision, net of insurance recoveries (Note 11) |
142 | 28 | 14 | |||||||||
| Impairment of equity investments (Note 15) |
24 | — | — | |||||||||
| Other, net |
14 | 7 | 4 | |||||||||
| Total other expense (income), net |
$ | 174 | $ | 12 | $ | (37 | ) | |||||
| At December 31 |
2009 | 2008 | ||||||||||
| Accounts receivable |
||||||||||||
| Trade |
$ | 867 | $ | 889 | ||||||||
| Other |
53 | 39 | ||||||||||
| Accounts receivable, gross |
920 | 928 | ||||||||||
| Less: allowance for doubtful accounts |
(24 | ) | (15 | ) | ||||||||
| Total accounts receivable, net |
$ | 896 | $ | 913 | ||||||||
| Inventories |
||||||||||||
| Work in process and raw materials, net |
$ | 118 | $ | 137 | ||||||||
| Finished goods, net |
167 | 171 | ||||||||||
| Service parts, net |
401 | 384 | ||||||||||
| Total inventories, net |
$ | 686 | $ | 692 | ||||||||
| Other current assets |
||||||||||||
| Current deferred tax assets |
$ | 104 | $ | 68 | ||||||||
| Other |
162 | 173 | ||||||||||
| Total other current assets |
$ | 266 | $ | 241 | ||||||||
| Property, plant and equipment |
||||||||||||
| Land and improvements |
$ | 40 | $ | 38 | ||||||||
| Buildings and improvements |
275 | 310 | ||||||||||
| Machinery and other equipment |
695 | 677 | ||||||||||
| Property, plant and equipment, gross |
1,010 | 1,025 | ||||||||||
| Less: accumulated depreciation |
(654 | ) | (717 | ) | ||||||||
| Total property, plant and equipment, net |
$ | 356 | $ | 308 | ||||||||
| Accumulated other comprehensive loss, net of tax |
||||||||||||
| Currency translation adjustments |
$ | (84 | ) | $ | (112 | ) | ||||||
| Unrealized gain on securities |
3 | 2 | ||||||||||
| Unrealized loss on derivatives |
— | (8 | ) | |||||||||
| Actuarial losses and prior service costs on employee benefit plans |
(1,428 | ) | (1,526 | ) | ||||||||
| Total accumulated other comprehensive loss |
$ | (1,509 | ) | $ | (1,644 | ) | ||||||
Note 3 Restructuring and Real Estate Transactions
Organizational Realignment On January 1, 2008, NCR began management of its business on a geographic basis, changing from a previous model of global business units organized by product and service offering. As a result, in the second quarter of 2008, NCR commenced a global realignment initiative to reduce redundancies and process inefficiencies to become more customer-focused and market-driven. This initiative is addressing legacy process inefficiencies and unbalanced resource allocation by focusing on organizational design, process re-engineering and business process outsourcing. The initiative has resulted in reductions in employment and productivity improvements, while freeing up funds to invest in growth programs.
54
Table of Contents
As a result of this initiative, the Company recorded a total of $57 million in employee severance and other termination costs in 2008. Of these costs, $5 million was recorded as cost of products, $31 million was recorded as cost of services, $16 million was recorded as selling, general and administrative expense and the remaining $5 million was recorded as research and development expense. Of the $57 million total expense recognized in 2008, $40 million was recorded as a discrete postemployment benefit cost.
The realignment activities and the associated costs recognized during 2008 for approximately 900 employee terminations related to each of our reportable segments of Americas, EMEA and APJ.
The Company made $20 million in severance payments during 2009 based upon estimated remaining severance costs, the Company reversed $3 million of reserves in 2009. As of December 31, 2009, there is a remaining accrued liability balance of $1 million, including immaterial effects from foreign currency translation.
The actions taken to date generated annualized savings of approximately $40 million. The Company continues to identify additional opportunities focusing on organizational design, process re-engineering and business process outsourcing and therefore, expects additional realignment activities through 2010 as a result of this initiative. The costs related to these activities are not reasonably estimable at this time as we are in the process of defining the scope of the activities and quantifying the impact thereof.
Manufacturing Realignment In the first quarter of 2007, the Company initiated a manufacturing realignment initiative primarily related to its ATM products, which included shifting manufacturing activities from high cost to low cost geographies in the EMEA region as well as the APJ region. This realignment resulted in approximately 1,100 employee terminations and, as expected, improved productivity and freed capital to invest in revenue-generating programs such as sales, engineering and market development. During the second quarter of 2009, the Company released the remaining $1 million reserve related to the manufacturing realignment due to changes in estimates of remaining severance payments and recorded this amount as a reduction in cost of products in the Consolidated Statement of Operations.
Japan Realignment In the third quarter of 2007, NCR commenced a realignment program in Japan, which was primarily focused on its customer services. The realignment program, which resulted in approximately 130 employee terminations, included actions to improve operating efficiency and strengthen the Company’s competitive position in Japan. As a result of this realignment program, in 2007, the Company recorded $28 million as a discrete postemployment benefit cost for employee severance ($19 million in cost of services and $9 million in selling, general and administrative expense). The reserve for this initiative was fully utilized during the year ended December 31, 2008. The actions taken to date generated annualized savings of $10 to $12 million.
55
Table of Contents
The results by segment, as disclosed in Note 13, “Segment Information and Concentrations,” exclude the impact of these costs, which is consistent with the manner by which management assesses the performance and evaluates the results of each segment. The following table summarizes the costs recorded for these realignment activities and the remaining liabilities as of December 31, 2009 and 2008, which is included in the Consolidated Balance Sheets in other current liabilities:
| In millions |
2008 Organizational Realignment |
2007 Manufacturing Realignment |
2007 Japan Realignment |
Total | ||||||||||||
| Employee Severance and Other Benefits |
||||||||||||||||
| Balance as of January 1, 2008 |
$ | — | $ | 11 | $ | 7 | $ | 18 | ||||||||
| Costs recognized during the year ended December 31, 2008 |
57 | — | — | 57 | ||||||||||||
| Foreign currency translation adjustments during 2008 |
(1 | ) | — | — | (1 | ) | ||||||||||
| Payments made during the year ended December 31, 2008 |
(30 | ) | (10 | ) | (7 | ) | (47 | ) | ||||||||
| Ending balance as of December 31, 2008 |
$ | 26 | $ | 1 | $ | — | $ | 27 | ||||||||
| Balance as of January 1, 2009 |
$ | 26 | $ | 1 | $ | — | $ | 27 | ||||||||
| Costs recognized during the year ended December 31, 2009 |
— | — | — | — | ||||||||||||
| Foreign currency translation adjustments during 2009 |
(2 | ) | — | — | (2 | ) | ||||||||||
| Payments made during the year ended December 31, 2009 |
(20 | ) | — | — | (20 | ) | ||||||||||
| Reversals during the year ended December 31, 2009 |
(3 | ) | (1 | ) | — | (4 | ) | |||||||||
| Ending balance as of December 31, 2009 |
$ | 1 | $ | — | $ | — | $ | 1 | ||||||||
Real Estate Transactions During the year ended December 31, 2009, the Company recognized $9 million in gains from the sale of real estate in the Consolidated Statement of Operations which were recorded as a reduction to selling, general and administrative expenses. The net proceeds of $11 million from these sales were recorded in investing activities and the net gains are recorded in operating activities in the Consolidated Statement of Cash Flows.
During the year ended December 31, 2008, the Company recognized $30 million in gains from the sale of real estate in the Consolidated Statement of Operations. The net proceeds of $52 million from these sales were recorded in investing activities and the net gains are recorded in operating activities in the Consolidated Statement of Cash Flows. Of the total gains recognized, $16 million related to the sale of a manufacturing facility in Canada during the first quarter, while $7 million related to the sale of a separate Canadian property in the second quarter of 2008. Both gains were recorded as a reduction to selling, general, and administrative expenses in the Consolidated Statement of Operations.
During the fourth quarter of 2002, in connection with announced restructuring efforts, NCR’s management approved a real estate consolidation and restructuring plan designed to accelerate the Company’s re-engineering strategies. A pre-tax restructuring cost of $16 million was recorded in the fourth quarter of 2002 to provide for contractual lease termination costs. The remaining lease obligations will expire over various dates through 2015. The Company reviews this reserve on a quarterly basis to determine whether the reserve is adequate based on current market conditions. The balance of this liability at December 31, 2008 was $4 million. During 2009, the reserve decreased by $1 million primarily due to ongoing lease payments resulting in a remaining reserve balance of $3 million as of December 31, 2009.
Note 4 Business Combinations, Divestitures and Equity Investments
During 2009, the Company completed two acquisitions and acquired the remaining 80.4% interest in an equity investment, for total cash consideration of $41 million. In 2008, NCR completed several strategic investments and acquisitions and acquired the remaining 3% minority interest in one of our subsidiaries, for a total cost of approximately $65 million. In 2007, the Company completed one acquisition and minority investments in two companies, for a total cost of approximately $11 million. A description of each acquisition and investment, all of which were paid primarily in cash, is as follows:
2009 Acquisitions and Equity Investments
| • | Acquisition of the remaining 80.4% interest in TNR Holdings Corporation (TNR) on April 21, 2009 which has been recorded using the acquisition method as the assets acquired and liabilities assumed constituted a business. The acquisition of TNR provided the Company with access to additional markets for its DVD kiosks and enhanced kiosk technologies. |
56
Table of Contents
| • | Acquisition of Netkey, Inc. on October 31, 2009, to extend NCR’s self-service portfolio into the digital media merchandising market. |
| • | Acquisition of DVDPlay on December 8, 2009, to extend NCR’s self-service portfolio in the entertainment line of business by increasing our DVD kiosk installations and enabling expansion into new markets. |
2008 Acquisitions and Equity Investments
| • | Acquisition of Ambient Partners, LLC on April 18, 2008, to extend NCR’s self-service portfolio into the digital media merchandising market. |
| • | 10% minority investment and exclusive licensing agreement with e-Play, LLC on June 17, 2008 to add bare-disc technology to NCR’s existing global self-service technology portfolio. The Company recorded this transaction as a cost method investment. |
| • | 19.6% minority investment and exclusive supply and services agreements with TNR, an operator of movie rental kiosks, on July 28, 2008. The Company recorded this transaction as an equity method investment. |
| • | Acquisition of NCI Ltd. (NCI), a United Kingdom-based company on August 19, 2008. NCI is a leading provider of teller connectivity software used by financial institutions. |
| • | 8% minority investment in MOD Systems, Inc., a leading provider of digital media delivery systems on October 17, 2008. MOD Systems’ technology is designed to offer consumers one of the fastest, most convenient ways to access high-quality digital entertainment. The Company recorded this transaction as a cost method investment. |
2007 Acquisitions and Equity Investments
| • | Acquisition of Touch Automation, LLC on December 31, 2007 to extend NCR’s self-service portfolio into the digital media merchandising market. |
| • | 5% minority investment in mFoundry, Inc. on October 25, 2007 to complement NCR’s mobility technology solution. |
| • | 5% minority investment in ViVOtech, Inc. on June 29, 2007 to use their set of technologies to develop solutions that allow consumers to make contactless payments with Radio Frequency (RF)-enabled credit or debit cards and Near Field Communication (NFC)-related mobile phones. |
In 2009, goodwill recognized in these transactions amounted to $15 million, of which, $11 million is expected to be fully deductible for tax purposes. In 2008, goodwill recognized was $19 million, of which, $2 million is expected to be fully deductible for tax purposes.
In connection with business combinations in 2009, the Company recorded $16 million for identifiable intangible assets for intellectual property associated with software, customer contracts and trade names, which have a weighted-average amortization period of 3.8 years. As a result of the acquisitions in 2008, NCR recorded $3 million related to identifiable intangible assets consisting primarily of intellectual property associated with software and hardware as well as non-compete arrangements which have a weighted-average amortization period of approximately 3 years.
The operating results of these businesses have been included within NCR’s results as of the respective closing dates of the acquisitions. The pro forma disclosures are not being provided because the impact of the acquisitions, both individually and in the aggregate, are not considered material to the periods in which they occurred. The purchase prices of these businesses, reported in other investing activities, business acquisitions and divestitures, net in the Consolidated Statements of Cash Flows, have been allocated based on the estimated fair value of net tangible and intangible assets acquired, with any excess recorded as goodwill.
57
Table of Contents
Note 5 Goodwill and Other Identifiable Intangible Assets
The carrying amounts of goodwill by segment as of December 31, 2009 and 2008 are as follows:
| January 1, 2009 | Additions | Foreign Currency Translation Adjustment |
December 31, 2009 | |||||||||||||||||||||||
| In millions | Goodwill | Accumulated Impairment Losses |
Total | Goodwill | Accumulated Impairment Losses |
Total | ||||||||||||||||||||
| Americas |
$ | 35 | $ | (3 | ) | $ | 32 | $ | 15 | $ | — | $ | 50 | $ | (3 | ) | $ | 47 | ||||||||
| EMEA |
27 | — | 27 | — | 1 | 28 | — | 28 | ||||||||||||||||||
| APJ |
25 | — | 25 | — | — | 25 | — | 25 | ||||||||||||||||||
| Total |
$ | 87 | $ | (3 | ) | $ | 84 | $ | 15 | $ | 1 | $ | 103 | $ | (3 | ) | $ | 100 | ||||||||
| January 1, 2008 | Additions | Foreign Currency Translation Adjustment |
December 31, 2008 | ||||||||||||||||||||||||
| Goodwill | Accumulated Impairment Losses |
Total | Goodwill | Accumulated Impairment Losses |
Total | ||||||||||||||||||||||
| Americas |
$ | 31 | $ | (3 | ) | $ | 28 | $ | 4 | $ | — | $ | 35 | $ | (3 | ) | $ | 32 | |||||||||
| EMEA |
15 | — | 15 | 13 | (1 | ) | 27 | — | 27 | ||||||||||||||||||
| APJ |
21 | — | 21 | 2 | 2 | 25 | — | 25 | |||||||||||||||||||
| Total |
$ | 67 | $ | (3 | ) | $ | 64 | $ | 19 | $ | 1 | $ | 87 | $ | (3 | ) | $ | 84 | |||||||||
NCR’s identifiable intangible assets, reported in other assets in the Consolidated Balance Sheets, were specifically identified when acquired, and are deemed to have finite lives. The gross carrying amount and accumulated amortization for NCR’s identifiable intangible assets were as follows:
| Original Amortization Life (in Years) |
December 31, 2009 | December 31, 2008 | ||||||||||||||
| In millions | Gross Carrying Amount |
Accumulated Amortization |
Gross Carrying Amount |
Accumulated Amortization |
||||||||||||
| Identifiable intangible assets |
||||||||||||||||
| Non-compete arrangements |
3 - 5 | $ | 5 | $ | (5 | ) | $ | 5 | $ | (4 | ) | |||||
| Intellectual property |
2 - 5 | 65 | (43 | ) | 49 | (35 | ) | |||||||||
| Total identifiable intangible assets |
$ | 70 | $ | (48 | ) | $ | 54 | $ | (39 | ) | ||||||
The increase in the gross carrying amount is primarily due to the acquisitions detailed in Note 4, “Business Combinations, Divestitures, and Equity Investments.”
The aggregate amortization expense (actual and estimated) for identifiable intangible assets for the following periods is:
| Actual 2009 |
For the years ended (estimated) | |||||||||||||||||
| In millions | 2010 | 2011 | 2012 | 2013 | 2014 | |||||||||||||
| Amortization expense |
$ | 9 | $ | 8 | $ | 4 | $ | 4 | $ | 3 | $ | 2 | ||||||
Note 6 Debt Obligations
During the second quarter of 2009, at their maturity date, the Company repaid the $300 million of senior unsecured notes, which had previously been classified as short-term debt on the Consolidated Balance Sheet.
As of December 31, 2009, the Company’s long term debt was $11 million. The Company’s long-term debt mainly consists of $5 million in notes payable originating in the United States and a capital lease obligation entered into during the third quarter of 2009. The $5 million notes payable matures in 2020 and bears interest at a rate of 9.49% per annum.
58
Table of Contents
Industrial Revenue Bond – During the third quarter of 2009, NCR entered into a transaction with the Development Authority of Columbus, Georgia (the Development Authority). The transaction resulted in the issuance of approximately $5 million in taxable revenue bonds by the Development Authority. The Development Authority used the proceeds to purchase a manufacturing facility consisting of a building and fixtures. NCR and the Development Authority entered into a lease agreement, whose terms provide NCR with a ten year lease of the facility for manufacturing purposes. Under the terms of the lease agreement, the rental payments made by NCR will be utilized by the Development Authority to repay the principal and interest (at a rate of 5%) of the bonds and NCR will have the option of acquiring the facility for a nominal amount at the end of the lease term. Based on the terms of the lease agreement, the transaction was accounted for as a capital lease, which resulted in the capitalization of the purchase price of the facility as an asset and recording of the capital lease obligation as long-term debt on NCR’s Consolidated Balance Sheet.
Revolving Credit Facility – On August 6, 2007, the Company amended and renewed its $500 million, five-year unsecured revolving credit facility to update certain terms and conditions. This replacement facility contains certain representations and warranties; conditions; affirmative, negative and financial covenants; and events of default customary for such facilities. NCR was in compliance with these covenants as of December 31, 2009. The key financial covenants include a total debt to consolidated EBITDA requirement for the period of four consecutive fiscal quarters not to exceed 3.00 to 1.00 and a minimum cash interest coverage ratio for the period of four consecutive fiscal quarters of not less than 4.00 to 1.00. The credit facility provides a grid-based interest rate that determines the margin charged in addition to the London Interbank Offered Rate (LIBOR) on borrowings. The rate is based on several factors including the credit rating of the Company and the amount of the Company’s aggregate borrowings under the facility. As of December 31, 2009, LIBOR margin would have been 42.5 basis points. Additionally, the facility allows a portion of the availability to be used for outstanding letters of credit. As of December 31, 2009 and 2008, no amount was outstanding under the facility; however the maximum borrowing available was reduced by $21 million and $16 million, respectively, for NCR’s usage of letters of credit.
Fair Value of Debt – The fair value of debt is based on a discounted cash flow model that incorporates a market yield curve based on the Company’s credit rating with adjustments for duration. As of December 31, 2009 and 2008, the fair value of debt was $16 million and $314 million, respectively. The decrease in the fair value of debt was primarily due to the repayment of the $300 million senior unsecured notes.
Note 7 Income Taxes
For the years ended December 31, income from continuing operations before income taxes consisted of the following:
| In millions | 2009 | 2008 | 2007 | |||||||
| (Loss) income before income taxes |
||||||||||
| United States |
$ | (315 | ) | $ | 80 | $ | 141 | |||
| Foreign |
228 | 208 | 91 | |||||||
| Total (loss) income from continuing operations before income taxes |
$ | (87 | ) | $ | 288 | $ | 232 | |||
For the years ended December 31, income tax (benefit) expense consisted of the following:
| In millions | 2009 | 2008 | 2007 | |||||||||
| Income tax (benefit) expense |
||||||||||||
| Current |
||||||||||||
| Federal |
$ | 1 | $ | (15 | ) | $ | 8 | |||||
| State and local |
7 | (1 | ) | 2 | ||||||||
| Foreign |
67 | 74 | 58 | |||||||||
| Deferred |
||||||||||||
| Federal |
(101 | ) | 25 | 75 | ||||||||
| State and local |
(9 | ) | 1 | (4 | ) | |||||||
| Foreign |
(22 | ) | (26 | ) | (78 | ) | ||||||
| Total income tax (benefit) expense |
$ | (57 | ) | $ | 58 | $ | 61 | |||||
59
Table of Contents
The following table presents the principal components of the difference between the effective tax rate and the U.S. federal statutory income tax rate for the years ended December 31:
| In millions | 2009 | 2008 | 2007 | |||||||||
| Income tax (benefit) expense at the U.S. federal tax rate of 35% |
$ | (30 | ) | $ | 101 | $ | 81 | |||||
| Foreign income tax differential |
(33 | ) | (42 | ) | (68 | ) | ||||||
| U.S. permanent book/tax differences |
(1 | ) | 1 | (2 | ) | |||||||
| Tax audit settlements |
— | (19 | ) | — | ||||||||
| Change in liability for unrecognized tax benefits |
11 | 18 | 35 | |||||||||
| Prior period corrections—Note 1 |
— | — | 10 | |||||||||
| Other, net |
(4 | ) | (1 | ) | 5 | |||||||
| Total income tax (benefit) expense |
$ | (57 | ) | $ | 58 | $ | 61 | |||||
NCR’s tax provisions include a provision for income taxes in certain tax jurisdictions where its subsidiaries are profitable, but reflect only a portion of the tax benefits related to certain foreign subsidiaries’ tax losses due to the uncertainty of the ultimate realization of future benefits from these losses. The 2009 tax benefit was favorably impacted by the non-proportional benefit of the significant environmental and impairment charges incurred in the United States and by the mix of taxable profits and losses by country. During 2008, we favorably settled examinations with the Internal Revenue Service (IRS) for the tax years of 2000 through 2006 that resulted in a $19 million tax benefit. In addition, income tax expense was benefited in 2008 by $26 million from the repatriation of earnings from international subsidiaries at an effective tax rate lower than previously estimated.
Deferred income tax assets and liabilities included in the Consolidated Balance Sheets as of December 31 were as follows:
| In millions |
2009 | 2008 | ||||||
| Deferred income tax assets |
||||||||
| Employee pensions and other benefits |
$ | 550 | $ | 604 | ||||
| Other balance sheet reserves and allowances |
131 | 72 | ||||||
| Tax loss and credit carryforwards |
429 | 406 | ||||||
| Capitalized research and development |
59 | 50 | ||||||
| Property, plant and equipment |
23 | 21 | ||||||
| Other |
43 | 44 | ||||||
| Total deferred income tax assets |
1,235 | 1,197 | ||||||
| Valuation allowance |
(499 | ) | (478 | ) | ||||
| Net deferred income tax assets |
736 | 719 | ||||||
| Deferred income tax liabilities |
||||||||
| Property, plant and equipment |
8 | 10 | ||||||
| Other |
7 | 5 | ||||||
| Total deferred income tax liabilities |
15 | 15 | ||||||
| Total net deferred income tax assets |
$ | 721 | $ | 704 | ||||
NCR recorded valuation allowances related to certain deferred income tax assets due to the uncertainty of the ultimate realization of the future benefits from those assets. The valuation allowances cover deferred tax assets, primarily tax loss carryforwards, in tax jurisdictions where there is uncertainty as to the ultimate realization of a benefit from those tax losses. At December 31, 2009, our net deferred tax assets in the United States totaled approximately $605 million and realization of the related benefits was determined to be more likely than not. As of December 31, 2009, NCR had U.S. federal and foreign tax loss carryforwards of approximately $1.2 billion. The tax loss carryforwards, subject to expiration, expire in the years 2010 through 2028.
60
Table of Contents
The aggregate changes in the balance of our gross unrecognized tax benefits were as follows for the years ended December 31:
| In millions | 2009 | 2008 | ||||||
| Gross unrecognized tax benefits—January 1 |
$ | 287 | $ | 319 | ||||
| Increases related to tax positions from prior years |
17 | 76 | ||||||
| Decreases related to tax positions from prior years |
(49 | ) | (54 | ) | ||||
| Increases related to tax positions taken during current year |
55 | 56 | ||||||
| Settlements with tax authorities |
(2 | ) | (106 | ) | ||||
| Lapses of statutes of limitation |
(20 | ) | (4 | ) | ||||
| Total gross unrecognized tax benefits—December 31 |
$ | 288 | $ | 287 | ||||
Of the total amount of gross unrecognized tax benefits as of December 31, 2009 up to $93 million would affect NCR’s effective tax rate if realized. The Company’s liability arising from uncertain tax positions is recorded in income tax accruals in the Consolidated Balance Sheet.
We recognized interest and penalties associated with uncertain tax positions as part of the provision for income taxes in our Consolidated Statements of Operations of $6 million, $4 million and $19 million for the years ended December 31, 2009, 2008 and 2007, respectively. The gross amount of interest and penalties accrued as of December 31, 2009 and 2008 was $68 million and $57 million, respectively.
In the U.S., NCR files consolidated federal and state income tax returns where statutes of limitations generally range from three to five years. Although the Company resolved examinations for the tax years of 2000 through 2006 with the IRS in 2008, U.S. federal tax years are open from 2005 forward. In 2009, the IRS commenced an examination of our 2007 and 2008 income tax returns. NCR and its subsidiaries also file income tax returns in international jurisdictions where statutes of limitations generally range from three to five years. Years beginning after 1995 are still open to examination by certain foreign taxing authorities, including several major taxing jurisdictions. In Canada, we are open to examination from 1997 onward. In Japan, we are open to examination from 2001 onward. At this time, the Company does not expect any significant changes in unrecognized tax benefits in the next year.
NCR did not provide for U.S. federal income taxes or foreign withholding taxes in 2009 on approximately $875 million of undistributed earnings of its foreign subsidiaries as such earnings are intended to be reinvested indefinitely. Quantification of the deferred tax liability, if any, associated with these undistributed earnings is not practicable.
See the Consolidated Statements of Changes in Stockholders’ Equity for details of the tax effects on the components of other comprehensive income and Note 9, “Employee Benefit Plans”.
Note 8 Employee Stock Compensation Plans
The Company recognizes all share-based payments to employees, including grants of stock options, as compensation expense in the financial statements based on their fair value.
As of December 31, 2009, the Company’s primary types of share-based compensation were stock options and restricted stock. The Company recorded stock-based compensation expense, the components of which are further described below, for the years ended December 31 as follows:
| In millions | 2009 | 2008 | 2007 | |||||||||
| Stock options |
$ | 14 | $ | 17 | $ | 21 | ||||||
| Restricted stock |
(2 | ) | 24 | 21 | ||||||||
| Total stock-based compensation (pre-tax) |
12 | 41 | 42 | |||||||||
| Tax benefit |
(3 | ) | (12 | ) | (12 | ) | ||||||
| Total stock-based compensation, net of tax |
$ | 9 | $ | 29 | $ | 30 | ||||||
61
Table of Contents
Stock-based compensation expense for the years ended December 31, 2009, 2008 and 2007 was computed using the fair value of options as calculated using the Black-Scholes option-pricing model. The weighted average fair value of options granted was $4.78 per share in 2009, $7.11 per share in 2008 and $7.91 per share in 2007 and was estimated based on the following weighted average assumptions:
| 2009 | 2008 | 2007 | |||||||
| Dividend yield |
— | — | — | ||||||
| Risk-free interest rate |
1.98 | % | 2.49 | % | 4.48 | % | |||
| Expected volatility |
44.1 | % | 33.1 | % | 32.2 | % | |||
| Expected holding period (years) |
5.0 | 5.1 | 5.0 |
Expected volatility incorporates a blend of both historical volatility of the Company’s stock over a period equal to the expected term of the options and implied volatility from traded options on the Company’s stock, as management believes this is more representative of prospective trends. The Company uses historical data to estimate option exercise and employee termination within the valuation model. The expected holding period represents the period of time that options are expected to be outstanding. The risk-free interest rate for periods within the contractual life of the option is based on the five-year U.S. Treasury yield curve in effect at the time of grant.
Approximately 15 million shares are authorized to be issued under the 2006 Stock Incentive Plan (SIP). Details of the Company’s stock-based compensation plans are discussed below:
Stock Options
The SIP provides for the grant of several different forms of stock-based compensation, including stock options to purchase shares of NCR common stock. The Compensation and Human Resource Committee of the Board of Directors has discretion to determine the material terms and conditions of option awards under the SIP, provided that (i) the exercise price must be no less than the fair market value of NCR common stock (defined as the closing price) on the date of grant, (ii) the term must be no longer than ten years, and (iii) in no event shall the normal vesting schedule provide for vesting in less than one year. Other terms and conditions of an award of stock options will be determined by the Compensation and Human Resource Committee of the Board of Directors as set forth in the agreement relating to that award. The Compensation and Human Resource Committee has authority to administer the SIP, except that the Committee on Directors and Governance will administer the SIP with respect to non-employee members of the Board of Directors. New shares of the Company’s common stock are issued as a result of stock option exercises.
The following table summarizes the Company’s stock option activity for the year ended December 31, 2009:
| Shares in thousands | Shares Under Option |
Weighted- Average Exercise Price per Share |
Weighted- Average Remaining Contractual Term (in years) |
Aggregate Intrinsic Value (in millions) | |||||||
| Outstanding as of January 1, 2009 |
10,677 | $ | 16.37 | ||||||||
| Granted |
851 | $ | 11.75 | ||||||||
| Exercised |
(506 | ) | $ | 8.71 | |||||||
| Forfeited or expired |
(1,379 | ) | $ | 19.46 | |||||||
| Outstanding as of December 31, 2009 |
9,643 | $ | 15.94 | 4.66 | $ | 6 | |||||
| Fully vested and expected to vest as of December 31, 2009 |
9,522 | $ | 15.91 | 4.64 | $ | 6 | |||||
| Exercisable as of December 31, 2009 |
6,602 | $ | 14.82 | 3.84 | $ | 6 | |||||
62
Table of Contents
The total intrinsic value of all options exercised was $1 million in 2009, $12 million in 2008 and $47 million in 2007. Cash received from option exercises under all share-based payment arrangements was $4 million in 2009, $11 million in 2008 and $37 million in 2007. The tax benefit realized from these exercises was minimal in 2009, $3 million in 2008 and $14 million in 2007. As of December 31, 2009, there was $19 million of total unrecognized compensation cost related to unvested stock option grants. The cost is expected to be recognized over a weighted-average period of 2.03 years.
Restricted Stock and Restricted Stock Units
The SIP also provides for the issuance of restricted stock, as well as restricted stock units. These types of awards can have either service-based or performance-based vesting with performance goals being established by the Compensation and Human Resource Committee. Any grant of restricted stock or restricted stock units is subject to a vesting period of at least three years, except that a one-year term of service may be required if vesting is conditioned upon achievement of performance goals. Performance-based grants are subject to future performance measurements, which include NCR’s achievement of specific return on capital and cumulative net operating profit (as defined in the SIP) levels during the performance period. Performance-based grants must be earned, based on performance, before the actual number of shares to be awarded is known. The Company considers the likelihood of meeting the performance criteria based upon management’s estimates and analysis of achievement against the performance criteria. At the date of grant, a recipient of restricted stock has all the rights of a stockholder subject to certain restrictions on transferability and a risk of forfeiture. A recipient of restricted stock units does not have the rights of a stockholder and is subject to restrictions on transferability and risk of forfeiture. Other terms and conditions applicable to any award of restricted stock or restricted stock units will be determined by the Compensation and Human Resource Committee and set forth in the agreement relating to that award.
The following table reports restricted stock activity during the year ended December 31, 2009:
| Shares in thousands | Number of Shares |
Weighted- Average Grant- Date Fair Value per Share | ||||
| Unvested shares as of January 1, 2009 |
2,215 | $ | 21.62 | |||
| Shares granted |
3,150 | $ | 9.61 | |||
| Shares vested and distributed |
(556 | ) | $ | 22.50 | ||
| Shares forfeited |
(617 | ) | $ | 15.76 | ||
| Unvested shares as of December 31, 2009 |
4,192 | $ | 13.45 | |||
The total intrinsic value of shares vested and distributed was $5 million in 2009, $5 million in 2008 and $17 million in 2007. As of December 31, 2009, there was $7 million of unrecognized compensation cost related to unvested restricted stock grants. The unrecognized compensation cost is expected to be recognized over a remaining weighted-average period of 1.31 years.
The following table represents the composition of restricted stock grants to NCR employees in 2009:
| Shares in thousands | Number of Shares |
Weighted- Average Grant- Date Fair Value | |||
| Service-based shares |
292 | $ | 12.24 | ||
| Performance-based shares |
2,858 | $ | 9.34 | ||
| Total restricted stock grants |
3,150 | $ | 9.61 | ||
At December 31, 2009, certain of the performance-based shares granted in 2009 were not probable of vesting.
Other Share-based Plans
The Employee Stock Purchase Plan (ESPP) enables eligible employees to purchase NCR’s common stock at a discount to the average of the highest and lowest sale prices on the last trading day of each month. The ESPP
63
Table of Contents
discount is 5% of the average market price. Accordingly, this plan is considered non-compensatory. Employees may authorize payroll deductions of up to 10% of eligible compensation for common stock purchases. Employees purchased approximately 0.5 million shares in 2009, 0.3 million shares in 2008 and 0.3 million shares in 2007 for approximately $5 million in 2009, $6 million in 2008 and $11 million in 2007. A total of 4 million shares were originally authorized to be issued under the ESPP and approximately 2.5 million authorized shares remain unissued as of December 31, 2009.
Note 9 Employee Benefit Plans
Pension, Postretirement and Postemployment Plans NCR sponsors defined benefit plans for many of its U.S. and international employees. For salaried employees, the defined benefit plans are based primarily upon compensation and years of service. For certain hourly employees in the U.S., the benefits are based on a fixed dollar amount per years of service. NCR’s U.S. pension plans ceased the accrual of additional benefits after December 31, 2006 and are closed to new participants. Certain international plans are also closed to new participants. NCR’s funding policy is to contribute annually not less than the minimum required by applicable laws and regulations. Assets of NCR’s defined benefit plans are primarily invested in publicly traded common stocks, corporate and government debt securities, real estate investments, and cash or cash equivalents.
NCR recognizes the funded status of each applicable plan on the Consolidated Balance Sheet. Each overfunded plan is recognized as an asset and each underfunded plan is recognized as a liability. Changes to the funded status are recognized as a component of accumulated other comprehensive loss in stockholders’ equity.
Prior to September 1998, substantially all U.S. employees who reached retirement age while working for NCR were eligible to participate in a postretirement benefit plan. The plan provides medical care and life insurance benefits to retirees and their eligible dependents. In September 1998, the plan was amended whereby U.S. participants who had not reached a certain age and years of service with NCR were no longer eligible for such benefits. Non-U.S. employees are typically covered under government-sponsored programs, and NCR generally does not provide postretirement benefits other than pensions to non-U.S. retirees. NCR generally funds these benefits on a pay-as-you-go basis.
NCR offers various postemployment benefits to involuntarily terminated and certain inactive employees after employment but before retirement. These benefits are paid in accordance with NCR’s established postemployment benefit practices and policies. Postemployment benefits may include disability benefits, supplemental unemployment benefits, severance, workers’ compensation benefits, and continuation of healthcare benefits and life insurance coverage. NCR provides appropriate accruals for these postemployment benefits. These postemployment benefits are funded on a pay-as-you-go basis.
Amounts to be Recognized
The amounts in accumulated other comprehensive loss that are expected to be recognized as components of net periodic benefit cost (income) during 2010 are as follows:
| In millions | U.S. Pension Benefits |
International Pension Benefits |
Total Pension Benefits |
Postretirement Benefits |
Postemployment Benefits |
||||||||||||
| Prior service cost (income) |
$ | — | $ | — | $ | — | $ | (13 | ) | $ | (1 | ) | |||||
| Actuarial loss |
$ | 119 | $ | 68 | $ | 187 | $ | 4 | $ | 11 | |||||||
64
Table of Contents
Pension Plans
Reconciliation of the beginning and ending balances of the benefit obligations for NCR’s pension plans are as follows:
| U.S. Pension Benefits |
International Pension Benefits |
Total Pension Benefits |
||||||||||||||||||||||
| In millions | 2009 | 2008 | 2009 | 2008 | 2009 | 2008 | ||||||||||||||||||
| Change in benefit obligation |
||||||||||||||||||||||||
| Benefit obligation as of January 1 |
$ | 3,227 | $ | 3,199 | $ | 1,645 | $ | 2,020 | $ | 4,872 | $ | 5,219 | ||||||||||||
| Gross service cost |
— | — | 18 | 29 | 18 | 29 | ||||||||||||||||||
| Interest cost |
195 | 195 | 92 | 103 | 287 | 298 | ||||||||||||||||||
| Amendment |
— | — | (1 | ) | — | (1 | ) | — | ||||||||||||||||
| Actuarial loss (gain) |
178 | 26 | 211 | (117 | ) | 389 | (91 | ) | ||||||||||||||||
| Benefits paid |
(196 | ) | (193 | ) | (111 | ) | (120 | ) | (307 | ) | (313 | ) | ||||||||||||
| Currency translation adjustments |
— | — | 109 | (270 | ) | 109 | (270 | ) | ||||||||||||||||
| Benefit obligation as of December 31 |
$ | 3,404 | $ | 3,227 | $ | 1,963 | $ | 1,645 | $ | 5,367 | $ | 4,872 | ||||||||||||
| Accumulated benefit obligation as of December 31 |
$ | 3,404 | $ | 3,227 | $ | 1,886 | $ | 1,556 | $ | 5,290 | $ | 4,783 | ||||||||||||
A reconciliation of the beginning and ending balances of the fair value of the plan assets of NCR’s pension plans follows:
| U.S. Pension Benefits |
International Pension Benefits |
Total Pension Benefits |
||||||||||||||||||||||
| In millions | 2009 | 2008 | 2009 | 2008 | 2009 | 2008 | ||||||||||||||||||
| Change in plan assets |
||||||||||||||||||||||||
| Fair value of plan assets as of January 1 |
$ | 2,208 | $ | 3,423 | $ | 1,467 | $ | 2,114 | $ | 3,675 | $ | 5,537 | ||||||||||||
| Actual return on plan assets |
561 | (1,031 | ) | 190 | (278 | ) | 751 | (1,309 | ) | |||||||||||||||
| Company contributions |
9 | 9 | 74 | 74 | 83 | 83 | ||||||||||||||||||
| Benefits paid |
(196 | ) | (193 | ) | (111 | ) | (120 | ) | (307 | ) | (313 | ) | ||||||||||||
| Currency translation adjustments |
— | — | 115 | (325 | ) | 115 | (325 | ) | ||||||||||||||||
| Plan participant contributions |
— | — | 2 | 2 | 2 | 2 | ||||||||||||||||||
| Fair value of plan assets as of December 31 |
$ | 2,582 | $ | 2,208 | $ | 1,737 | $ | 1,467 | $ | 4,319 | $ | 3,675 | ||||||||||||
The following table presents the funded status and the reconciliation of the funded status to amounts recognized in the Consolidated Balance Sheets and in accumulated other comprehensive loss as of December 31:
| U.S. Pension Benefits |
International Pension Benefits |
Total Pension Benefits |
||||||||||||||||||||||
| In millions | 2009 | 2008 | 2009 | 2008 | 2009 | 2008 | ||||||||||||||||||
| Funded status |
$ | (822 | ) | $ | (1,019 | ) | $ | (226 | ) | $ | (178 | ) | $ | (1,048 | ) | $ | (1,197 | ) | ||||||
| Amounts recognized in the Consolidated Balance Sheets |
||||||||||||||||||||||||
| Noncurrent assets |
$ | — | $ | — | $ | 244 | $ | 251 | $ | 244 | $ | 251 | ||||||||||||
| Current liabilities |
(8 | ) | (8 | ) | (16 | ) | (16 | ) | (24 | ) | (24 | ) | ||||||||||||
| Noncurrent liabilities |
(814 | ) | (1,011 | ) | (454 | ) | (413 | ) | (1,268 | ) | (1,424 | ) | ||||||||||||
| Net amounts recognized |
$ | (822 | ) | $ | (1,019 | ) | $ | (226 | ) | $ | (178 | ) | $ | (1,048 | ) | $ | (1,197 | ) | ||||||
| Amounts recognized in accumulated other comprehensive loss |
||||||||||||||||||||||||
| Net actuarial loss |
$ | 1,074 | $ | 1,370 | $ | 883 | $ | 748 | $ | 1,957 | $ | 2,118 | ||||||||||||
| Prior service cost |
1 | 1 | (1 | ) | 1 | — | 2 | |||||||||||||||||
| Total |
$ | 1,075 | $ | 1,371 | $ | 882 | $ | 749 | $ | 1,957 | $ | 2,120 | ||||||||||||
65
Table of Contents
For pension plans with accumulated benefit obligations in excess of plan assets, the projected benefit obligation, accumulated benefit obligation and fair value of assets were $4,310 million, $4,254 million and $3,030 million, respectively, as of December 31, 2009, and $4,002 million, $3,954 million and $2,567 million, respectively, as of December 31, 2008.
The net periodic benefit (income) cost of the pension plans for years ended December 31 was as follows:
| U.S. Pension Benefits | International Pension Benefits |
Total Pension Benefits | ||||||||||||||||||||||||||||||||||
| In millions | 2009 | 2008 | 2007 | 2009 | 2008 | 2007 | 2009 | 2008 | 2007 | |||||||||||||||||||||||||||
| Net service cost |
$ | — | $ | — | $ | — | $ | 17 | $ | 27 | $ | 38 | $ | 17 | $ | 27 | $ | 38 | ||||||||||||||||||
| Interest cost |
195 | 195 | 184 | 92 | 103 | 96 | 287 | 298 | 280 | |||||||||||||||||||||||||||
| Expected return on plan assets |
(180 | ) | (248 | ) | (245 | ) | (110 | ) | (124 | ) | (131 | ) | (290 | ) | (372 | ) | (376 | ) | ||||||||||||||||||
| Settlement charge |
— | — | — | 3 | 4 | 8 | 3 | 4 | 8 | |||||||||||||||||||||||||||
| Amortization of: |
||||||||||||||||||||||||||||||||||||
| Prior service cost |
— | — | — | 1 | 7 | 12 | 1 | 7 | 12 | |||||||||||||||||||||||||||
| Actuarial loss |
94 | 1 | 3 | 47 | 60 | 79 | 141 | 61 | 82 | |||||||||||||||||||||||||||
| Net benefit (income) cost |
$ | 109 | $ | (52 | ) | $ | (58 | ) | $ | 50 | $ | 77 | $ | 102 | $ | 159 | $ | 25 | $ | 44 | ||||||||||||||||
There is no net service cost related to the U.S. pension plan due to the Company’s decision to freeze the plan effective January 1, 2007. Of the total expense presented in the tables above, the amounts allocated to discontinued operations totaled $6 million in 2007.
During 2009, NCR closed its United Kingdom-based manufacturing operation, resulting in a significant reduction in the number of employees enrolled in one of our defined benefit plans. The workforce reduction was accounted for as a curtailment and as such, the actuarial liability associated with the plan was re-measured as of July 1, 2009. As a result, the pension liability and accumulated other comprehensive loss were increased by $35 million. This curtailment did not have a material impact on net loss in 2009.
In May of 2009, NCR completed a consultation process with employee representatives, which was required to freeze the benefits in one of our United Kingdom defined benefit plans, effective July 1, 2009. This action was accounted for as a curtailment and as such, the actuarial liability associated with the plan was re-measured as of May 31, 2009. As a result, the prepaid pension asset and accumulated other comprehensive income were reduced by $85 million. This curtailment did not have a material impact on net loss in 2009.
The weighted average rates and assumptions used to determine benefit obligations as of December 31 were as follows:
| U.S. Pension Benefits |
International Pension Benefits |
Total Pension Benefits |
||||||||||||||||
| 2009 | 2008 | 2009 | 2008 | 2009 | 2008 | |||||||||||||
| Discount rate |
5.8 | % | 6.3 | % | 4.9 | % | 5.3 | % | 5.4 | % | 5.9 | % | ||||||
| Rate of compensation increase |
N/A | N/A | 2.6 | % | 3.9 | % | 2.6 | % | 3.9 | % | ||||||||
The weighted average rates and assumptions used to determine net periodic benefit cost for years ended December 31 were as follows:
| U.S. Pension Benefits | International Pension Benefits |
Total Pension Benefits | |||||||||||||||||||||||||
| 2009 | 2008 | 2007 | 2009 | 2008 | 2007 | 2009 | 2008 | 2007 | |||||||||||||||||||
| Discount rate |
6.3 | % | 6.3 | % | 5.8 | % | 5.3 | % | 5.4 | % | 4.9 | % | 5.9 | % | 5.9 | % | 5.4 | % | |||||||||
| Expected return on plan assets |
7.8 | % | 7.8 | % | 8.0 | % | 6.1 | % | 6.3 | % | 6.6 | % | 7.1 | % | 7.2 | % | 7.4 | % | |||||||||
| Rate of compensation increase |
N/A | N/A | N/A | 3.9 | % | 4.1 | % | 3.7 | % | 3.9 | % | 4.1 | % | 3.7 | % | ||||||||||||
66
Table of Contents
The discount rate used to determine year-end 2009 U.S. benefit obligations was derived by matching the plans’ expected future cash flows to the corresponding yields from the Citigroup Pension Discount Curve. This yield curve has been constructed to represent the available yields on high-quality, fixed-income investments across a broad range of future maturities. International discount rates were determined by examining interest rate levels and trends within each country, particularly yields on high-quality, long-term corporate bonds, relative to our future expected cash flows.
NCR employs a building block approach as its primary approach in determining the long-term expected rate of return assumption for plan assets. Historical market returns are studied and long-term relationships between equities and fixed income are preserved consistent with the widely accepted capital market principle that assets with higher volatilities generate higher returns over the long run. Current market factors, such as inflation and interest rates are evaluated before long-term capital market assumptions are determined. The expected long-term portfolio return is established for each plan via a building block approach with proper rebalancing consideration. The result is then adjusted to reflect additional expected return from active management net of plan expenses. Historical plan returns, the expectations of other capital market participants, and peer data are all used to review and assess the results for reasonableness and appropriateness.
The expected return on plan assets component of pension expense for our U.S. pension plan was determined using the expected rate of return and a calculated value of assets, referred to as the “market-related value.” The market-related value for this plan was $2,322 million and $2,427 million as of December 31, 2009 and 2008, respectively, which is less than the fair value of plan assets by $258 million and greater than the fair value of plan assets by $221 million, respectively. Differences between the assumed and actual returns are amortized to the market-related value on a straight-line basis over a five-year period. Differences in excess of 10% of the market value are recognized immediately. Similar approaches are employed in determining expense for NCR’s international plans.
Gains and losses have resulted from changes in actuarial assumptions and from differences between assumed and actual experience, including, among other items, changes in discount rates and differences between actual and assumed asset returns. These gains and losses (except those differences being amortized to the market-related value) are only amortized to the extent that they exceed 10% of the higher of the market-related value or the projected benefit obligation of each respective plan. As a result, for the U.S. pension plan, unrecognized net losses of $330 million are not expected to be amortized during fiscal 2010. The remaining unrecognized net losses in excess of the corridor are $980 million and are being amortized over the expected remaining service periods of active plan participants (approximately 8.3 years during fiscal 2010). Similar approaches are employed in amortizing gains and losses for NCR’s other U.S. and international plans.
Plan Assets The weighted average asset allocations as of December 31, 2009 and 2008 by asset category are as follows:
| U.S. Pension Fund | International Pension Funds | |||||||||||||||||
| Actual Allocation of Plan Assets as of December 31 |
Target Asset Allocation |
Actual Allocation of Plan Assets as of December 31 |
Target Asset Allocation |
|||||||||||||||
| 2009 | 2008 | 2009 | 2008 | |||||||||||||||
| Equity securities |
56 | % | 55 | % | 50-59 | % | 50 | % | 44 | % | 43-56 | % | ||||||
| Debt securities |
39 | % | 40 | % | 37-43 | % | 39 | % | 45 | % | 34-46 | % | ||||||
| Real estate |
5 | % | 5 | % | 4-6 | % | 6 | % | 6 | % | 4-7 | % | ||||||
| Other |
0 | % | 0 | % | 0-1 | % | 5 | % | 5 | % | 4-7 | % | ||||||
| Total |
100 | % | 100 | % | 100 | % | 100 | % | ||||||||||
67
Table of Contents
The fair value of plan assets as of December 31, 2009 by asset category is as follows:
| U.S Pension Plans In thousands |
Notes | Fair Value as of December 31, 2009 |
Fair Value Measurements at Reporting Date Using | |||||||||||
| Quoted Prices in Active Markets for Identical Assets (Level 1) |
Significant Other Observable Inputs (Level 2) |
Significant Unobservable Inputs (Level 3) | ||||||||||||
| Assets |
||||||||||||||
| Equity securities: |
||||||||||||||
| Preferred stock |
1 | $ | 6,868 | $ | 6,348 | $ | — | $ | 520 | |||||
| Common stock |
1 | 878,788 | 869,859 | 21 | 8,908 | |||||||||
| Fixed income securities: |
||||||||||||||
| Government securities |
2 | 30,589 | — | 30,589 | — | |||||||||
| Corporate debt |
3 | 229,989 | — | 220,166 | 9,823 | |||||||||
| Other types of investments: |
||||||||||||||
| Money market funds |
48,066 | — | 48,066 | — | ||||||||||
| Common and commingled trusts—Equities |
4 | 467,325 | — | 467,325 | — | |||||||||
| Common and commingled trusts—Fixed Income |
4 | 632,047 | — | 632,047 | — | |||||||||
| Common and commingled trusts—Short Term Investments |
4 | 19,133 | — | 19,133 | — | |||||||||
| Partnership / joint venture interests—Real estate |
5 | 27,756 | — | — | 27,756 | |||||||||
| Partnership / joint venture interests—Other |
5 | 72,925 | — | — | 72,925 | |||||||||
| Mutual funds |
4 | 95,891 | 95,891 | — | — | |||||||||
| Real estate and other |
5 | 72,455 | 67,975 | 501 | 3,979 | |||||||||
| Total |
$ | 2,581,832 | $ | 1,040,073 | $ | 1,417,848 | $ | 123,911 | ||||||
| International Pension Plans In thousands |
Notes | Fair Value as of December 31, 2009 |
Fair Value Measurements at Reporting Date Using | |||||||||||
| Quoted Prices in Active Markets for Identical Assets (Level 1) |
Significant Other Observable Inputs (Level 2) |
Significant Unobservable Inputs (Level 3) | ||||||||||||
| Assets |
||||||||||||||
| Equity securities: |
||||||||||||||
| Common stock |
1 | $ | 439,329 | $ | 439,329 | $ | — | $ | — | |||||
| Fixed income securities: |
||||||||||||||
| Corporate debt |
3 | 77,907 | — | 77,907 | — | |||||||||
| Other types of investments: |
||||||||||||||
| Money market funds |
22,441 | — | 22,441 | — | ||||||||||
| Common and commingled trusts—Equities |
4 | 407,056 | 32,458 | 374,598 | — | |||||||||
| Common and commingled trusts—Fixed Income |
4 | 538,104 | — | 538,104 | — | |||||||||
| Common and commingled trusts—Balanced |
4 | 32,869 | — | 32,869 | — | |||||||||
| Partnership / joint venture interests |
5 | 53,965 | — | — | 53,965 | |||||||||
| Insurance products |
4 | 49,911 | — | 49,911 | — | |||||||||
| Mutual funds |
4 | 9,368 | 9,368 | — | — | |||||||||
| Real estate and other |
5 | 105,903 | — | 16,709 | 89,194 | |||||||||
| Total |
$ | 1,736,853 | $ | 481,155 | $ | 1,112,539 | $ | 143,159 | ||||||
Notes:
| 1 - | Common and preferred stocks are valued based on quoted market prices at the closing price as reported on the active market on which the individual securities are traded. |
| 2 - | Government securities are valued based on yields currently available on comparable securities of issuers with similar credit ratings. When quoted prices are not available for identical or similar securities, the |
68
Table of Contents
| security is valued under a discounted cash flows approach that maximizes observable inputs, such as current yields on similar instruments but includes adjustments for certain risks that may not be observable, such as credit and liquidity risks. |
| 3 - | Corporate debt is valued primarily based on observable market quotations for similar bonds at the closing price reported on the active market on which the individual securities are traded. When such quoted prices are not available, the bonds are valued using a discounted cash flows approach using current yields on similar instruments of issuers with similar credit ratings. |
| 4 - | Common/collective trusts and registered investment companies (RICs) such as mutual funds are valued using a Net Asset Value (NAV) provided by the manager of each fund. The NAV is based on the underlying net assets owned by the fund, divided by the number of shares or units outstanding. The fair value of the underlying securities within the fund, which are generally traded on an active market, are valued at the closing price reported on the active market on which those individual securities are traded. For investments not traded on an active market, or for which a quoted price is not publicly available, a variety of unobservable valuation methodologies, including discounted cash flow, market multiple and cost valuation approaches, are employed by the fund manager to value investments. This valuation approach is often used in valuing insurance products with underlying investments in mutual funds, commingled funds and pooled separate accounts |
| 5 - | Partnership/joint ventures and hedge funds are valued based on the fair value of the underlying securities within the fund, which include investments both traded on an active market and not traded on an active market. For those investments that are traded on an active market, the values are based on the closing price reported on the active market on which those individual securities are traded and in the case of hedge funds they are valued using a Net Asset Value (NAV) provided by the manager of each fund. For investments not traded on an active market, or for which a quoted price is not publicly available, a variety of unobservable valuation methodologies, including discounted cash flow, market multiples and cost valuation approaches, are employed by the fund manager to value investments. |
The follow table presents the reconciliation of the beginning and ending balances of those plan assets classified within Level 3 of the valuation hierarchy. When the determination is made to classify the plan assets within Level 3, the determination is based upon the significance of the unobservable inputs to the overall fair value measurement.
| In thousands | US Pension Plans | International Pension Plans |
|||||
| Beginning balance of Level 3 plan assets |
$ | 90,445 | $ | 134,403 | |||
| Realized and unrealized gains and losses, net |
10,856 | 12,159 | |||||
| Purchases, sales and settlements |
20,247 | (3,403 | ) | ||||
| Transfers into Level 3 |
2,363 | — | |||||
| Ending balance of Level 3 plan assets |
$ | 123,911 | $ | 143,159 | |||
Investment Strategy NCR employs a total return investment approach, whereby a mix of equities, fixed-income and real estate investments are used to maximize the long-term return of plan assets subject to a prudent level of risk. The risk tolerance is established for each plan through a careful consideration of plan liabilities, plan funded status and corporate financial condition. The investment portfolios contain a diversified blend of equity and fixed-income investments. Furthermore, equity investments are diversified across U.S. and non-U.S. stocks, small and large capitalization stocks, and growth and value stocks. Fixed-income assets are also diversified across U.S. and non-U.S. issuers, type of fixed-income security (i.e., government bond, corporate bonds, mortgage-backed securities) and credit quality. Where applicable, real estate investments are made through real estate securities, partnership interests or direct investment and are diversified by property type and location. Other assets, such as cash or private equity are used judiciously to improve portfolio diversification and enhance risk-adjusted portfolio returns. Derivatives may be used to adjust market exposures in an efficient and timely manner. Due to the timing of security purchases and sales, cash held by fund managers is classified in the same asset category as the related investment. Rebalancing algorithms are applied to keep the asset mix of the plans from deviating excessively from their targets. Investment risk is measured and monitored on an ongoing
69
Table of Contents
basis through regular performance reporting, investment manager reviews, actuarial liability measurements and periodic investment strategy reviews.
Postretirement Plans
Reconciliation of the beginning and ending balances of the benefit obligation for NCR’s U.S. postretirement plan is as follows:
| Postretirement Benefits |
||||||||
| In millions | 2009 | 2008 | ||||||
| Change in benefit obligation |
||||||||
| Benefit obligation as of January 1 |
$ | 116 | $ | 134 | ||||
| Gross service cost |
— | — | ||||||
| Interest cost |
6 | 7 | ||||||
| Actuarial (gain) loss |
6 | (8 | ) | |||||
| Plan participant contributions |
6 | 8 | ||||||
| Benefits paid |
(23 | ) | (25 | ) | ||||
| Benefit obligation as of December 31 |
$ | 111 | $ | 116 | ||||
The following table presents the funded status and the reconciliation of the funded status to amounts recognized in the Consolidated Balance Sheets and in accumulated other comprehensive loss as of December 31:
| Postretirement Benefits |
||||||||
| In millions | 2009 | 2008 | ||||||
| Benefit obligation |
$ | (111 | ) | $ | (116 | ) | ||
| Amounts recognized in the Consolidated Balance Sheets |
||||||||
| Current liabilities |
$ | (15 | ) | $ | (17 | ) | ||
| Noncurrent liabilities |
(96 | ) | (99 | ) | ||||
| Net amounts recognized |
$ | (111 | ) | $ | (116 | ) | ||
| Amounts recognized in accumulated other comprehensive loss |
||||||||
| Net actuarial loss |
$ | 51 | $ | 48 | ||||
| Prior service credit |
(88 | ) | (101 | ) | ||||
| Total |
$ | (37 | ) | $ | (53 | ) | ||
The net periodic benefit (income) cost of the postretirement plan for the years ended December 31 was:
| Postretirement Benefits |
||||||||||||
| In millions | 2009 | 2008 | 2007 | |||||||||
| Interest cost |
$ | 7 | $ | 7 | $ | 7 | ||||||
| Net service cost |
— | — | — | |||||||||
| Amortization of: |
||||||||||||
| Prior service cost |
(13 | ) | (13 | ) | (13 | ) | ||||||
| Actuarial loss |
3 | 4 | 5 | |||||||||
| Net benefit income |
$ | (3 | ) | $ | (2 | ) | $ | (1 | ) | |||
The postretirement expense related to discontinued operations was immaterial in 2007.
70
Table of Contents
The assumptions utilized in accounting for postretirement benefit obligations as of December 31 and for postretirement benefit income for the years ended December 31 were:
| Postretirement Benefit Obligations |
Postretirement Benefit Costs |
||||||||||||||
| 2009 | 2008 | 2009 | 2008 | 2007 | |||||||||||
| Discount rate |
5.0 | % | 6.3 | % | 6.3 | % | 6.0 | % | 5.5 | % | |||||
Assumed healthcare cost trend rates as of December 31 were:
| 2009 | 2008 | |||||||||||
| Pre-65 Coverage |
Post-65 Coverage |
Pre-65 Coverage |
Post-65 Coverage |
|||||||||
| Healthcare cost trend rate assumed for next year |
9.0 | % | 7.0 | % | 10.0 | % | 7.0 | % | ||||
| Rate to which the cost trend rate is assumed to decline (the ultimate trend rate) |
5.0 | % | 5.0 | % | 5.0 | % | 5.0 | % | ||||
| Year that the rate reaches the ultimate rate |
2018 | 2018 | 2018 | 2018 | ||||||||
In addition, a one percentage point change in assumed healthcare cost trend rates would have the following effects on the postretirement benefit income and obligation:
| In millions | 1% Increase | 1% Decrease | |||||
| 2009 service cost and interest cost |
$ | — | $ | — | |||
| Postretirement benefit obligation as of December 31, 2009 |
$ | 7 | $ | (7 | ) | ||
Postemployment Benefits
Reconciliation of the beginning and ending balances of the benefit obligation for NCR’s postemployment plan was:
| Postemployment Benefits | ||||||||
| In millions | 2009 | 2008 | ||||||
| Change in benefit obligation |
||||||||
| Benefit obligation as of January 1 |
$ | 327 | $ | 302 | ||||
| Restructuring program cost |
— | 40 | ||||||
| Service cost |
25 | 23 | ||||||
| Interest cost |
13 | 15 | ||||||
| Benefits paid |
(56 | ) | (58 | ) | ||||
| Foreign currency exchange |
6 | (2 | ) | |||||
| Actuarial gain (loss) |
(8 | ) | 7 | |||||
| Benefit obligation as of December 31 |
$ | 307 | $ | 327 | ||||
71
Table of Contents
The following tables present the funded status and the reconciliation of the funded status to amounts recognized in the Consolidated Balance Sheets and in accumulated other comprehensive loss at December 31:
| Postemployment Benefits |
||||||||
| In millions | 2009 | 2008 | ||||||
| Benefit obligation |
$ | (307 | ) | $ | (327 | ) | ||
| Amounts recognized in the Consolidated Balance Sheets |
||||||||
| Current liabilities |
$ | (48 | ) | $ | (67 | ) | ||
| Noncurrent liabilities |
(259 | ) | (260 | ) | ||||
| Net amounts recognized |
$ | (307 | ) | $ | (327 | ) | ||
| Amounts recognized in accumulated other comprehensive loss |
||||||||
| Net actuarial loss |
$ | 112 | $ | 125 | ||||
| Prior service credit |
(2 | ) | (3 | ) | ||||
| Total |
$ | 110 | $ | 122 | ||||
The net periodic benefit cost of the postemployment plan for years ended December 31 was:
| Postemployment Benefits | ||||||||||
| In millions | 2009 | 2008 | 2007 | |||||||
| Service cost |
$ | 25 | $ | 23 | $ | 29 | ||||
| Interest cost |
13 | 15 | 15 | |||||||
| Amortization of prior service cost |
(1 | ) | — | — | ||||||
| Amortization of actuarial loss |
12 | 13 | 22 | |||||||
| Net benefit cost |
$ | 49 | $ | 51 | $ | 66 | ||||
| Restructuring severance cost |
— | 40 | 60 | |||||||
| Net benefit cost |
$ | 49 | $ | 91 | $ | 126 | ||||
Of the total expense presented in the table above, the amounts allocated to discontinued operations totaled $12 million in 2007.
The weighted average assumptions utilized in accounting for postemployment benefit obligations as of December 31 and for postemployment benefit costs for the years ended December 31 were:
| Postemployment Benefit Obligations |
Postemployment Benefit Costs |
||||||||||||||
| 2009 | 2008 | 2009 | 2008 | 2007 | |||||||||||
| Discount rate |
4.3 | % | 4.6 | % | 4.6 | % | 5.3 | % | 4.9 | % | |||||
| Salary increase rate |
3.6 | % | 3.6 | % | 3.6 | % | 4.1 | % | 3.7 | % | |||||
| Involuntary turnover rate |
5.0 | % | 5.0 | % | 5.0 | % | 5.0 | % | 5.0 | % | |||||
The below table presents each relevant component of other comprehensive income related to NCR’s benefit plans as of December 31, 2009, including the tax effects of each component:
| In millions | Before-Tax Amount |
Tax Benefit (Expense) |
Net-of-Tax Amount |
|||||||||
| Prior service cost during year |
$ | 1 | $ | — | $ | 1 | ||||||
| Amortization of prior service cost |
(12 | ) | 5 | (7 | ) | |||||||
| Net loss arising during year |
59 | (71 | ) | (12 | ) | |||||||
| Actuarial gain (loss) included in benefits expense |
160 | (44 | ) | 116 | ||||||||
| Total benefit plans |
$ | 208 | $ | (110 | ) | $ | 98 | |||||
72
Table of Contents
Cash Flows Related to Employee Benefit Plans
Cash Contributions NCR does not expect to be required to contribute to the U.S. qualified pension plan in 2010; however, the Company plans to contribute approximately $100 million to the international pension plans and $10 million to the executive pension plan in 2010. Due to the decline in the fair value of our pension plan assets in 2008, we continue to have a significant, underfunded pension obligation that may require material increases in cash contributions in future years. The Company also expects to make contributions of $15 million to the U.S. postretirement plan and $47 million to the postemployment plan in 2010.
Estimated Future Benefit Payments NCR expects to make the following benefit payments reflecting past and future service from its pension, postretirement and postemployment plans:
| In millions | U.S. Pension Benefits |
International Pension Benefits |
Total Pension Benefits |
Postretirement Benefits |
Postemployment Benefits | ||||||||||
| Year |
|||||||||||||||
| 2010 |
$ | 216 | $ | 114 | $ | 330 | $ | 15 | $ | 47 | |||||
| 2011 |
$ | 219 | $ | 98 | $ | 317 | $ | 14 | $ | 46 | |||||
| 2012 |
$ | 222 | $ | 99 | $ | 321 | $ | 13 | $ | 45 | |||||
| 2013 |
$ | 225 | $ | 100 | $ | 325 | $ | 12 | $ | 43 | |||||
| 2014 |
$ | 228 | $ | 102 | $ | 330 | $ | 11 | $ | 42 | |||||
| 2015-2019 |
$ | 1,194 | $ | 519 | $ | 1,713 | $ | 42 | $ | 185 | |||||
Savings Plans U.S. employees and many international employees participate in defined contribution savings plans. These plans generally provide either a specified percent of pay or a matching contribution on participating employees’ voluntary elections. NCR’s matching contributions typically are subject to a maximum percentage or level of compensation. Employee contributions can be made pre-tax, after-tax or a combination thereof. The expense under the U.S. plan was approximately $8 million in 2009, $19 million in 2008 and $28 million in 2007. Of these amounts, the expense allocated to discontinued operations was approximately $8 million in 2007. The expense under international and subsidiary savings plans was $15 million in 2009, $15 million in 2008 and $21 million in 2007. Of these, the expense allocated to discontinued operations was approximately $4 million in 2007.
Note 10 Derivatives and Hedging Instruments
NCR is exposed to risks associated with changes in foreign currency exchange rates and interest rates. NCR utilizes a variety of measures to monitor and manage these risks, including the use of derivative financial instruments. NCR has exposure to approximately 50 functional currencies. Due to our global operations, weakness in some of these currencies is sometimes offset by strengths in others. Since a substantial portion of our operations and revenues occur outside the United States (U.S.), and in currencies other than the U.S. Dollar, our results can be significantly impacted, both positively and negatively, by changes in foreign currency exchange rates.
Foreign Currency Exchange Risk Our risk management strategy includes hedging, on behalf of each subsidiary, a portion of our forecasted, non-functional currency denominated cash flows for a period of up to 15 months. As a result, some of the impact of currency fluctuations on non-functional currency denominated transactions (and hence on subsidiary operating income, as stated in the functional currency), is mitigated in the near term. The amount we hedge and the duration of hedge contracts may vary significantly. In the longer term (greater than 15 months), the subsidiaries are still subject to the effect of translating the functional currency results to U.S. Dollars. To manage our exposures and mitigate the impact of currency fluctuations on the operations of our foreign subsidiaries, we hedge our main transactional exposures through the use of foreign exchange forward contracts. This is primarily done through the hedging of foreign currency denominated inter-company inventory purchases by NCR’s marketing units and of foreign currency denominated sales by our manufacturing units. As these transactions are firmly committed and forecasted, the related foreign exchange contracts are designated as highly effective cash flow hedges. The gains or losses on these hedges are deferred in
73
Table of Contents
accumulated other comprehensive income (loss) (AOCI) and reclassified to income when the underlying hedged transaction has been completed and is recorded in earnings. The gains or losses from derivative contracts related to inventory purchases are recorded in cost of products when the inventory is sold to an unrelated third party.
We also utilize foreign exchange contracts to hedge our exposure of assets and liabilities denominated in non-functional currencies. We generally recognize the gains and losses on these types of hedges in earnings as exchange rates change. We do not enter into hedges for speculative purposes.
Interest Rate Risk Interest rate risk associated with our borrowing is not considered material to our consolidated financial position, results of operations or cash flows as of December 31, 2009 based on the level of current borrowings and maturity dates. As such, we held no derivative financial instruments related to interest rate risk as of December 31, 2009.
The following tables provide information on the location and amounts of derivative fair values in the Consolidated Balance Sheet and derivative gains and losses in the Consolidated Statement of Operations:
| In millions | Fair Values of Derivative Instruments | |||||||||||||||
| Asset Derivatives | Liability Derivatives | |||||||||||||||
| December 31, 2009 | December 31, 2009 | |||||||||||||||
| Balance Sheet Location |
Notional Amount |
Fair Value |
Balance Sheet Location |
Notional Amount |
Fair Value | |||||||||||
| Derivatives designated as hedging instruments |
||||||||||||||||
| Foreign exchange forward contracts |
Other assets | $ | — | $ | — | Other liabilities | $ | — | $ | — | ||||||
| Total derivatives designated as hedging instruments |
$ | — | $ | — | ||||||||||||
| Derivatives not designated as hedging instruments |
||||||||||||||||
| Foreign exchange forward contracts |
Other assets | $ | 56 | $ | 1 | Other liabilities | $ | 53 | $ | 1 | ||||||
| Total derivatives not designated as hedging instruments |
$ | 1 | $ | 1 | ||||||||||||
| Total derivatives |
$ | 1 | $ | 1 | ||||||||||||
The effect of derivative instruments on the Consolidated Statements of Operations for the years ended December 31, 2009 and December 31, 2008 are as follows:
| In millions | Amount of Gain (Loss) Recognized in AOCI on Derivative (Effective Portion) |
Amount of Gain (Loss) Reclassified from AOCI into Income (Effective Portion) |
Amount of Gain Recognized in Income on Derivative (Ineffective portion and Amount Excluded from Effectiveness Testing) | |||||||||||||||||||||
| Derivatives in |
For the Year Ended December 31, 2009 |
For the Year Ended December 31, 2008 |
Location
of |
For the Year Ended December 31, 2009 |
For the Year Ended December 31, 2008 |
Location of |
For the Year Ended December 31, 2009 |
For the Year Ended December 31, 2008 | ||||||||||||||||
| Foreign exchange forward contracts |
$ | 8 | $ | (7 | ) | Cost of products | $ | (9 | ) | $ | 3 | Other income (expense) | $ | 1 | $ | — | ||||||||
74
Table of Contents
| In millions | Amount of Gain (Loss) Recognized in the Consolidated Statement of Operations | ||||||||
| Derivatives not Designated as Hedging Instruments |
Location of Gain (Loss) |
For the Year Ended December 31, 2009 |
For the Year Ended December 31, 2008 | ||||||
| Foreign exchange forward contracts |
Other income (expense) | $ | (6 | ) | $ | 11 | |||
| Foreign exchange forward contracts |
Cost of products | $ | 6 | $ | 6 | ||||
Concentration of Credit Risk NCR is potentially subject to concentrations of credit risk on accounts receivable and financial instruments such as hedging instruments and cash and cash equivalents. Credit risk includes the risk of nonperformance by counterparties. The maximum potential loss may exceed the amount recognized on the Consolidated Balance Sheets. Exposure to credit risk is managed through credit approvals, credit limits, selecting major international financial institutions (as counterparties to hedging transactions) and monitoring procedures. NCR’s business often involves large transactions with customers, and if one or more of those customers were to default on its obligations under applicable contractual arrangements, the Company could be exposed to potentially significant losses. However, management believes that the reserves for potential losses are adequate. As of December 31, 2009 and 2008, NCR did not have any major concentration of credit risk related to financial instruments.
Note 11 Commitments and Contingencies
In the normal course of business, NCR is subject to various regulations, proceedings, lawsuits, claims and other matters, including actions under laws and regulations related to the environment and health and safety, among others. NCR believes the amounts provided in its Consolidated Financial Statements, as prescribed by GAAP, are adequate in light of the probable and estimable liabilities. The Company does not currently expect to incur material capital expenditures related to compliance with such laws and regulations. However, there can be no assurances that the actual amounts required to satisfy alleged liabilities from various lawsuits, claims, legal proceedings and other matters, including the Fox River environmental matter and other matters discussed below, and to comply with applicable laws and regulations, will not exceed the amounts reflected in NCR’s Consolidated Financial Statements or will not have a material adverse effect on its consolidated results of operations, capital expenditures, competitive position, financial condition or cash flows. Any costs that may be incurred in excess of those amounts provided as of December 31, 2009 cannot currently be reasonably determined.
The United States Department of Justice is conducting an investigation regarding the propriety of the Company’s former Teradata Data Warehousing business’s arrangements and understandings with others in connection with certain federal contracts. In connection with the spin-off of Teradata on September 30, 2007, the responsibility for this matter, together with the related reserve, was distributed to Teradata Corporation. While the Company may be subject to ostensible exposure inasmuch as it was the contracting party in the matter at issue, Teradata Corporation is generally obligated to indemnify the Company for any losses arising out of this matter.
A separate portion of the government’s investigation relates to the adequacy of pricing disclosures made to the government in connection with negotiation of the Company’s General Services Administration Federal Supply Schedule and to whether certain subsequent price reductions were properly passed on to the government. Both Teradata Corporation and the Company are participating in this aspect of the investigation, with respect to certain products and services of each, and each will assume financial responsibility for its own exposures, if any, without indemnification from the other. At this time, the Company is unable to determine whether it has probable liability with respect to this aspect of the investigation.
On October 7, 2008, NCR and its services subsidiary, First Level Technology LLC (First Level), were served with a Fair Labor Standards Act (FLSA) and state law complaint filed in federal court in Chicago, Illinois
75
Table of Contents
alleging that certain First Level employees were engaged in “off-the-clock” work for which they were not compensated, as well as working through unpaid meal and rest breaks in violation of law. On July 3, 2009, the Company reached agreement in principle to settle the case by stipulating to a so-called Rule 23 opt-out class and creating an associated settlement fund of $600,000. The opt-out period ended in the fourth quarter of 2009 and sufficiently few class members opted out, such that conditions required for the settlement were met. The members in the class will also be eligible to receive an FLSA award out of a prior California FLSA settlement. NCR recorded an accrual of $12 million as of December 31, 2008 to recognize the Company’s expected liability under the previously reported California settlement and the Illinois settlement as well as other expenses related to the lawsuits, including the payment of administrative costs, certain employee taxes, and other expenses. Payment of the Illinois settlement is expected to occur early in 2010.
In August 2009, a federal court in Ohio granted motions for summary judgment against NCR in two companion class actions brought on behalf of certain unionized retirees, who claimed that the Company’s 2003 decision to terminate certain benefits payable on death violated collective bargaining agreements and other rights. The Company has appealed the decision to the Sixth Circuit Court of Appeals. If affirmed on appeal, the decision will require the Company to restore the death benefit, at an approximate cost of $6 million, which NCR recognized as other expense during 2009.
Environmental Matters NCR’s facilities and operations are subject to a wide range of environmental protection laws, and NCR has investigatory and remedial activities underway at a number of facilities that it currently owns or operates, or formerly owned or operated, to comply, or to determine compliance, with such laws. Also, NCR has been identified, either by a government agency or by a private party seeking contribution to site clean-up costs, as a potentially responsible party (PRP) at a number of sites pursuant to various state and federal laws, including the Federal Water Pollution Control Act, the Comprehensive Environmental Response, Compensation and Liability Act (CERCLA) and comparable state statutes. Other than the matter detailed below, we currently do not anticipate material expenses and liabilities from these other environmental matters.
NCR is one of eight entities that have been formally notified by governmental and other entities (such as local Native American tribes) that they are PRPs for environmental claims under CERCLA and other statutes arising out of the presence of polychlorinated biphenyls (PCBs) in sediments in the lower Fox River and in the Bay of Green Bay in Wisconsin. NCR was identified as a PRP because of alleged PCB discharges from two carbonless copy paper manufacturing facilities it previously owned, which were located along the Fox River. Some parties contend that NCR is also responsible for PCB discharges from paper mills owned by other companies because carbonless paper manufactured by NCR was allegedly purchased by those mills as a raw material for their paper making processes. NCR sold the facilities in 1978 to Appleton Papers Inc. (API), which has also been identified as a PRP. The other Fox River PRPs that received notices are P.H. Glatfelter Company, Georgia-Pacific Consumer Products LP (GP, successor to Fort James Operating Company), WTM I Co. (formerly Wisconsin Tissue Mills, now owned by Chesapeake Corporation), CBC Corporation (formerly Riverside Paper Corporation), U.S. Paper Mills Corp. (owned by Sonoco Products Company), and Menasha Corporation.
During the past several years, the United States Environmental Protection Agency (USEPA) and Wisconsin Department of Natural Resources (WDNR) (together, the Governments) assessed and developed clean-up plans for the upper and lower parts of the Fox River and for portions of Green Bay, contained in various Records of Decisions (RODs) issued in January 2003, July 2003 and June 2007 (the last is referred to as the Amended ROD). In general, the clean-up plan or remedy calls for a combination of dredging and capping to remediate the sediments in the river, and for monitored natural attenuation in Green Bay. Since 2004, the Company has been involved in certain aspects of the clean-up project, including performance, with GP, of engineering design work for the clean-up under an Administrative Order on Consent (AOC) entered into with the Governments. In addition, the Company, with U.S. Paper Mills, performed specific remedial action involving an area of elevated PCB incidence downriver of the De Pere Dam (Phase 1 work), pursuant to a consent decree with the Governments that was approved in November 2006.
76
Table of Contents
On November 13, 2007, the Governments issued a unilateral administrative order (Order) under Section 106 of CERCLA to all eight of the PRPs identified above. The Order requires the PRPs to implement the remedial work in the lower river in accordance with the requirements of the Amended ROD. NCR and API are working with the Governments to implement certain provisions of the Order (one other PRP is making certain voluntary financial contributions toward the work being conducted under the Order), which among other things, required that full-scale remediation begin in 2009. In-water work began on schedule in April 2009, following construction of a facility to house the remediation operations in Green Bay, Wisconsin.
In its meeting on April 22, 2009, the NCR Board of Directors approved the terms of a contract with Tetra Tech, an environmental remediation contractor, to perform the remediation work at the Fox River consistent with the requirements of the Amended ROD. Prior to this, Tetra Tech had performed certain preparatory work pursuant to an interim contract with API. At the same meeting, the Board of Directors also approved the formation of a limited liability corporation (LLC), which NCR and API formed on April 27, 2009, for purposes of, among other things, entering into the Tetra Tech remediation contract. Other PRPs may join the LLC in the future, if and as they enter into settlements or otherwise agree to join in funding the remediation efforts. The LLC entered into the remediation contract with Tetra Tech on April 27, 2009, and in-water dredging and remediation by Tetra Tech commenced thereafter. The Company and API funded the LLC’s initial operations, with NCR contributing approximately $30 million in the second quarter of 2009 in addition to amounts contributed by API. Such funding will be subject to regular replenishment on an ongoing basis tied to the remediation schedule, consistent with the Company’s Fox River reserve, discussed below. The Tetra Tech contract also requires that the LLC members provide promissory notes to provide Tetra Tech financial assurance against the prospect that the LLC will terminate the contract before completion of the remediation for reasons other than “cause,” an event the likelihood of which the Company currently considers remote. The maximum obligation under the Company’s note is approximately $20 million; however, the amount will vary based on a formula tied to conditions set forth in the contract, and generally is expected to decrease over time.
NCR and API share their portion of the cost of the Fox River clean-up and natural resource damages based upon an agreement and an arbitration award, which result in a 45% share for NCR of the first $75 million of such costs—a threshold that was reached in the second quarter of 2008—and a 40% share for amounts in excess of $75 million.
On January 7, 2008, NCR and API filed a lawsuit in federal court in Green Bay, Wisconsin, seeking a judicial ruling determining each PRP’s allocable responsibility for the cost of performing the remedial work at the Fox River (the “allocation litigation”). As of December 31, 2009, there were a total of 28 PRP defendants in that case and a companion consolidated case. A number of counterclaims seeking contribution under CERCLA and under various state law theories have been filed and are pending against NCR and API. On September 23, 2008, the court issued a Case Management Decision and Scheduling Order setting a “Phase I trial” limited to the questions of (i) when each party knew or should have known that recycling NCR-brand carbonless copy paper would result in the discharge of PCBs to a waterbody, thereby risking environmental damage; and (ii) what, if any, actions each party took upon acquiring such knowledge to avoid the risk of further PCB contamination. The court’s order also limited initial discovery proceedings to the same questions.
On December 16, 2009, the court issued a ruling cancelling the Phase I trial and granting motions for summary judgment filed by certain of the defendants against NCR and API. The court held that NCR and API could not recover from these defendants any costs that NCR and API have incurred in the Fox River cleanup. The court based this ruling on a finding that NCR should have known, in the late 1960s, that the use of PCBs in carbonless copy paper presented an “appreciable risk of serious and long-lasting damage,” whereas, it concluded, defendants did not know of PCB risks until after the majority of PCBs were released to the river. The court’s ruling was also based on a finding that because NCR chose to use and introduce PCBs into the stream of commerce, it should bear the financial consequences of that decision. The Company intends to appeal the ruling to the United States Court of Appeals for the Seventh Circuit. In light of a subsequent February 2010 order by the district court denying a request to initiate an immediate appeal, the Company does not expect to be able to prosecute its appeal until the remaining claims in the litigation, including counterclaims brought by the
77
Table of Contents
defendants against NCR and API for reimbursement of previously incurred expenses and other matters, are resolved. This may take as much as a year or more.
The extent of NCR’s potential liability remains subject to many uncertainties. NCR’s eventual remediation liability—which is expected to be paid out over a period extending through at least approximately 2019, followed by long-term monitoring for several decades—will depend on a number of factors. In general, the most significant factors include: (1) the total clean-up costs for each of the segments of the river; (2) the total natural resource damages for the site; (3) the shares NCR and API will jointly bear of future clean-up costs and natural resource damages as former and current owners of paper manufacturing facilities located along the Fox River; (4) the share NCR will bear of the joint NCR/API payments for such clean-up costs and natural resource damages; and (5) NCR’s transaction and litigation costs to defend itself in this matter, including participation in the allocation litigation. In establishing the reserve, NCR attempts to estimate a range of reasonably possible outcomes for each of these factors, although each range is itself highly uncertain. NCR uses its best estimate within the range where that is possible. Where there is a range of equally possible outcomes, and there is no amount within that range that is considered to be a better estimate than any other amount, NCR uses the low end of the range. These factors are discussed below:
For the first factor described above, NCR utilizes a best estimate of $933 million as the total of the clean-up costs for each of the segments of the river. The estimated total cost amount of $933 million includes estimates for the Operable Unit (OU) 1 through OU 5 work, including the remaining amount of work to be performed under the April 2009 Tetra Tech remediation contract, the Phase 1 work and the remedial design work. It adds to these estimates a 15% contingency for probable cost overruns based on historical experience; an estimate for the Governments’ future oversight costs; an amount for the Governments’ past oversight costs; an estimate for long-term monitoring extending over several decades; and an estimate for value engineering savings (potential projects intended to reduce the cost of the remediation). There can be no assurances that this estimated total cost amount will not be significantly higher as remediation work progresses. A range of reasonably possible outcomes with respect to total costs is difficult to state, but if the portion of the cost estimate relating to the contingency for cost overruns and unexpected expenses were twice our estimate, the total cost would increase to approximately $998 million.
Second, for total natural resource damages (NRD), NCR uses a best estimate of $76 million. NCR believes the range of reasonably possible outcomes for NRD, if it were to be litigated, is between zero and $246 million. The federal government has recently indicated, in a filing in a PRP’s bankruptcy proceeding, that claims for NRD could be as high as $382 million.
Third, for the NCR/API shares of future clean-up costs, which are expected to be determined in the allocation litigation referenced above, NCR has modified the basis previously used for this component of the reserve (in the past, the company used the low end of a range of outcomes, based primarily on the proximity of areas to be remediated to the locations at which PCBs were released into the river). In light of the Wisconsin federal court’s December 16, 2009 ruling described above, NCR’s reserve at December 31, 2009 assumes that NCR and API will be responsible for the full extent of the cleanup activities they are undertaking, which the Company considers a best estimate, and for a substantial portion of the counterclaims filed against NCR and API, as to which the Company uses the low end of a range of equally possible outcomes. At this point the Company is unable to determine whether the defendants will pay portions of the Fox River liability, and if so in what amount; the Governments have indicated their intention to continue pressing claims and settlement demands against the defendants, but NCR’s reserve does not assume any such payments or settlements. As for the NCR/API share of NRD, which is discussed above, NCR uses a best estimate.
Fourth, for the NCR share of the joint NCR/API payments, as discussed above, NCR’s percentage share is set by an agreement between NCR and API and a subsequent arbitration award. NCR’s analysis of this factor assumes that API is able to pay its percentage share of the NCR/API joint share. Additionally, the API obligation to NCR is shared on a joint and several basis by a third party, B.A.T. Industries p.l.c., which is a co-party to the same agreement and arbitration award, and this analysis likewise assumes that B.A.T. Industries p.l.c. would be financially viable and able to pay the joint and several obligation if API is unable to do so. API itself is indemnified by another company, Arjo Wiggins Appleton Ltd., which has funded and managed API’s liability to date.
78
Table of Contents
Finally, NCR estimated the transaction costs it is likely to incur to defend this matter through 2019, the time period NCR’s engineering consultants believe it will take to implement the remedy for the river. This estimate is based on an analysis of NCR’s costs since this matter first arose in 1995 and on estimates of what NCR’s defense and transaction costs will be in the future. NCR expects that the bulk of these transaction costs have been and will be incurred in the 2008-2012 time period. The costs incurred and expected to be incurred during that period include, in particular, transaction costs and fees related to completion of the design work, equipment purchases, commencement and continuation of clean-up activities in the river, and prosecution of the allocation litigation and the appeal discussed above.
In light of several factors—among them, the remedial design work conducted by NCR and GP, ongoing settlement discussions (including the prospects not only of group settlements but also of individual settlements for certain corporate or municipal entities), the efforts to implement the Order for clean-up of the lower river, the pending allocation litigation and appeal referenced above, the extent to which the Governments may press claims against the defendants for NRD and past costs, change orders or cost overruns that may result from the ongoing remediation efforts, the continued viability and willingness to pay of NCR’s various indemnitors and co-obligors, and the subsequent value engineering efforts designed to make the cleanup more efficient and less costly—calculation of the Company’s Fox River reserve has become subject to added layers of complexities, and it is possible there could be additional changes to some elements of the reserve over upcoming periods, although we are unable to predict or estimate such changes at this time.
In addition, the current economic recession may affect the Fox River cleanup, in particular with respect to the ability of PRPs to meet any obligations that may be placed upon them with respect to the cleanup or to remain as viable concerns; one of the original eight PRPs, WTM I Company, filed for bankruptcy on December 29, 2008, but the impact, if any, of that filing on that PRP’s potential contributions to the clean-up cannot be determined at this time. Further, there can be no assurance that the clean-up and related expenditures will not have a material effect on NCR’s capital expenditures, earnings, financial condition, cash flows, or competitive position.
As of December 31, 2009, the net reserve for the Fox River matter was approximately $202 million, compared to $88 million as of December 31, 2008. This reflects a $243 million increase in NCR’s estimated liability due to an update for estimated total costs driven primarily by the December 16, 2009 court decision, offset by a $75 million increase in the indemnification asset from AT&T and Alcatel-Lucent, and payments of $54 million for clean-up activities and legal fees in 2009. NCR regularly re-evaluates the assumptions used in determining the appropriate reserve for the Fox River matter as additional information becomes available and, when warranted, makes appropriate adjustments. During 2009, NCR contributed approximately $39 million to the LLC in order to fund remediation activities and generally, by contract, funds three months’ worth of remediation activities in advance. As of December 31, 2009, approximately $3 million remained from this funding and was recorded in other current assets in the Consolidated Balance Sheet. NCR’s reserve for the Fox River matter is reduced as the LLC makes payments to Tetra Tech and other vendors with respect to remediation activities.
AT&T and Alcatel-Lucent are responsible severally (not jointly) for indemnifying NCR for certain portions of the amounts paid by NCR for the Fox River matter over a defined threshold. NCR’s estimate of what AT&T and Alcatel-Lucent will pay under the indemnity is recorded as a long-term asset of approximately $120 million as of December 31, 2009, and is deducted in determining the net reserve discussed above. This asset, which was approximately $45 million as of December 31, 2008, decreased due to the effect of insurance recoveries, but this decrease was more than offset by the increase driven by the revised estimate of NCR’s liability for the Fox River cleanup in light of the Wisconsin federal court’s December 16, 2009 ruling. The asset balance can fluctuate not only with respect to total clean-up and other costs, but also with respect to insurance recoveries and certain tax impacts as measured by a contractual formula using prior-year effective tax rates. Such insurance recoveries and tax impacts are netted against the asset in proportions specified under the indemnity agreement (i.e., they typically decrease its amount). Insurance recoveries, whether by judgment or settlement, are the subjects of ongoing litigation and thus difficult to predict. NCR’s insurance recoveries have the effect of reducing its receipts under the indemnity, and therefore insurance recoveries are not expected to materially reduce the Company’s aggregate expenditures for the Fox River matter. The tax impact within the indemnity calculation is
79
Table of Contents
subject to substantial volatility regarding the Company’s effective tax rate from year to year, rendering the future tax impacts highly uncertain. When actual payments, net of insurance recoveries and tax impacts, reach the indemnity threshold, the Company expects to commence collection of the related portions of the asset. In the absence of further insurance recoveries, the Company expects to achieve the threshold in 2010.
In connection with the Fox River matter, NCR has reached settlement agreements with certain of its principal insurance carriers in a combined total of approximately $67 million over the past several years, including $37 million received in 2009. Of the total amount collected to date, $9 million is subject to competing claims by another party, and NCR and the other party have agreed that these funds will be used for Fox River costs and will be shared on an agreed-upon basis (subject to reallocation at a later date). NCR’s agreed-upon share of the $9 million is estimated to be $4 million. The Company is also engaged in litigation against several other insurance carriers in connection with the Fox River matter; that case, previously scheduled to go to trial in a Wisconsin state court in April of 2009, was recently reset for trial, which is now scheduled for August 2010.
It is difficult to estimate the future financial impact of environmental laws, including potential liabilities. NCR records environmental provisions when it is probable that a liability has been incurred and the amount or range of the liability is reasonably estimable. Provisions for estimated losses from environmental restoration and remediation are, depending on the site, based primarily on internal and third-party environmental studies (except for the Fox River site, where the estimated costs and natural resource damages are estimated as described above), estimates as to the number and participation level of any other PRPs, the extent of the contamination, and the nature of required clean-up and restoration actions. Reserves are adjusted as further information develops or circumstances change. Management expects that the amounts reserved from time to time will be paid out over the period of investigation, negotiation, remediation, restoration, and monitoring for the applicable sites. The amounts provided for environmental matters in NCR’s Consolidated Financial Statements are the estimated gross undiscounted amounts of such liabilities, without deductions for insurance or third-party indemnity claims, except as qualified in the following sentences. Except for the sharing agreement with API described above with respect to the Fox River site, in those cases where insurance carriers or third-party indemnitors have agreed to pay any amounts and management believes that collectability of such amounts is probable, the amounts are recorded in the Consolidated Financial Statements. For the Fox River site, as described above, an asset relating to the AT&T and Alcatel-Lucent indemnity is recorded, because payment is considered probable and is supported by contractual agreements.
Guarantees and Product Warranties Guarantees associated with NCR’s business activities are reviewed for appropriateness and impact to the Company’s financial statements. NCR had no obligations related to such guarantees and therefore, its financial statements do not have any associated liability balance as of December 31, 2009 or 2008.
NCR provides its customers a standard manufacturer’s warranty and records, at the time of the sale, a corresponding estimated liability for potential warranty costs. Estimated future obligations due to warranty claims are based upon historical factors, such as labor rates, average repair time, travel time, number of service calls per machine and cost of replacement parts. Upon consummating a sale, we recognize the total customer revenue and record the associated warranty liability using pre-established warranty percentages for that product class. From time to time, product design or quality corrections are accomplished through modification programs. When identified, associated costs of labor and parts for such programs are estimated and accrued as part of the warranty reserve.
The following table identifies the activity relating to the warranty reserve for the following years:
| In millions | 2009 | 2008 | 2007 | |||||||||
| Warranty reserve liability |
||||||||||||
| Beginning balance as of January 1 |
$ | 24 | $ | 13 | $ | 13 | ||||||
| Accruals for warranties issued |
47 | 51 | 41 | |||||||||
| Settlements (in cash or in kind) |
(46 | ) | (40 | ) | (41 | ) | ||||||
| Ending balance as of December 31 |
$ | 25 | $ | 24 | $ | 13 | ||||||
80
Table of Contents
In addition, NCR provides its customers with certain indemnification rights. In general, NCR agrees to indemnify the customer if a third party asserts patent or other infringement on the part of the customer for its use of the Company’s products. From time to time, NCR also enters into agreements in connection with its acquisition and divesture activities that include indemnification obligations by the Company. The fair value of these indemnification obligations is not readily determinable due to the conditional nature of the Company’s potential obligations and the specific facts and circumstances involved with each particular agreement. The Company has not recorded a liability in connection with these indemnifications. Historically, payments made by the Company under these types of agreements have not had a material effect on the Company’s consolidated financial condition, results of operations or cash flows.
Purchase Commitments The Company has purchase commitments for materials, supplies, services, and property, plant and equipment as part of the normal course of business. This includes a long-term service agreement with Accenture under which many of NCR’s key transaction processing activities and functions are performed.
Leases NCR conducts certain of its sales and manufacturing operations using leased facilities, the initial lease terms of which vary in length. Many of the leases contain renewal options and escalation clauses that are not material to the overall lease portfolio. Future minimum lease payments, in millions, under non-cancelable operating leases as of December 31, 2009, for the following fiscal years were:
| In millions | 2010 | 2011 | 2012 | 2013 | 2014 | Thereafter | ||||||||||||
| Minimum lease obligations |
$ | 53 | $ | 44 | $ | 40 | $ | 34 | $ | 30 | $ | 42 | ||||||
Total rental expense for operating leases was $54 million in 2009, $58 million in 2008, and $62 million in 2007.
Note 12 Discontinued Operations
As discussed in Note 1, “Description of Business and Significant Accounting Policies,” on September 30, 2007, NCR completed the spin-off of its Teradata Data Warehousing business through the distribution of a tax-free dividend of Teradata common stock to its stockholders.
As a result of the spin-off transaction, the Teradata Data Warehousing business has been classified as a discontinued operation in the Company’s consolidated financial statements for all periods presented.
There were no revenues, operating expenses, or income tax benefits or expenses from the discontinued operation in 2009.
The following table and accompanying Notes present information related to the discontinued operation for the years ended December 31:
| In millions | 2008 | 2007 1 | |||||
| Total revenue |
$ | — | $ | 1,223 | |||
| Total operating expenses (a,b) |
4 | 1,046 | |||||
| Pretax (loss) income from discontinued operations |
(4 | ) | 177 | ||||
| Income tax (benefit) expense (c) |
(1 | ) | 74 | ||||
| (Loss) income from discontinued operations |
$ | (3 | ) | $ | 103 | ||
| (1) | NCR completed the spin-off of the Teradata Data Warehousing business on September 30, 2007. |
Notes:
| (a) | Certain corporate overhead expenses previously allocated to Teradata were excluded from discontinued operations as they were ongoing expenses of NCR. These corporate overhead expenses are included in |
81
Table of Contents
| income from continuing operations and related primarily to general management, tax, investor relations, and public relations. These costs totaled $4 million for the year ended December 31, 2007. |
| (b) | For the year ended December 31, 2008, the expense related to discontinued operations was primarily due to professional and consulting fees directly related to the spin-off of Teradata. In connection with the spin-off transaction, the Company incurred $55 million of costs in the year ended December 31, 2007, which were non-recurring and directly related to the spin-off and are therefore included in income from discontinued operations. These non-recurring costs were primarily for investment banking, legal, tax, accounting, and other professional and consulting fees. |
| (c) | Includes the income tax effects of the items described in Notes (a) and (b) above. |
During 2008, the Company made adjustments of $2 million to the net assets distributed. These adjustments resulted from the settlement of activity primarily related to accounts receivable, accounts payable, deferred revenue and property, plant and equipment. These adjustments were immaterial individually and in the aggregate. There were no such adjustments in 2009.
Note 13 Segment Information and Concentrations
Operating Segment Information Effective January 1, 2008, NCR reorganized its businesses and the management thereof to a functional geographic model, changing from the previous model of global business units organized by product and service offering. In order to align the Company’s external reporting of its financial results with this organizational change, the Company modified its segment reporting. The Company now manages and reports its business in the following three segments:
| • | Americas; |
| • | Europe, Middle East and Africa (EMEA); and |
| • | Asia Pacific and Japan (APJ). |
Each of these segments derives revenue by selling products and services to the financial services, retail and hospitality, travel and gaming, healthcare, entertainment and software and technology services industries. The Company’s products, services and solutions enable NCR’s customers to connect, interact and transact with their customers, and include: ATM hardware and software; traditional point-of-sale and self-checkout solutions; self-service kiosk solutions; business consumables; solutions that digitally capture, process and retain item-based transactions; maintenance of NCR solutions; consulting, installation and customer support services; as well as the maintenance and sale of third-party products and services. The Company’s chief operating decision maker regularly assesses information relating to these segments to make decisions, including the allocation of resources. Management evaluates the performance of the segments based on revenue and segment gross margin. Segment assets are not included in this assessment of segment performance. We have reclassified our 2007 segment information to conform to the current presentation. The accounting policies used to determine the results of the operating segments are the same as those utilized for the consolidated financial statements as a whole. Intersegment sales and transfers are not material.
In recognition of the volatility of the effects of pension expense on our segment results, and to maintain operating focus on business performance, pension expense, as well as other significant non-recurring items are excluded from the segment operating results utilized by our chief operating decision maker in evaluating segment performance and are separately delineated to reconcile back to total reported income from operations.
82
Table of Contents
The following table presents revenue and gross margin by segment:
| In millions | 2009 | 2008 | 2007 | ||||||
| Revenue by segment |
|||||||||
| Americas |
$ | 2,022 | $ | 2,269 | $ | 2,148 | |||
| EMEA |
1,649 | 2,066 | 1,906 | ||||||
| APJ |
941 | 980 | 916 | ||||||
| Total revenue |
4,612 | 5,315 | 4,970 | ||||||
| Gross margin by segment |
|||||||||
| Americas |
386 | 437 | 432 | ||||||
| EMEA |
401 | 556 | 485 | ||||||
| APJ |
207 | 237 | 216 | ||||||
| Total segment gross margin |
994 | 1,230 | 1,133 | ||||||
| Selling, general and administrative expenses |
586 | 696 | 651 | ||||||
| Research and development expenses |
124 | 134 | 133 | ||||||
| Pension expense |
159 | 25 | 38 | ||||||
| Other adjustments (1) |
28 | 53 | 92 | ||||||
| Income from operations |
$ | 97 | $ | 322 | $ | 219 | |||
| (1) | Other adjustments in 2009 include $22 million charge for the impairment of assets and accrual of purchase commitments related to an equity investment and $6 million of incremental costs directly related to the relocation of the worldwide headquarters. Other adjustments in 2008 include $57 million of organizational realignment costs, $12 million of legal costs, and a $16 million gain on the sale of a manufacturing facility in Canada. Other adjustments in 2007 include $48 million of manufacturing realignment costs and related expenses, $28 million related to the Japan restructuring costs, and $16 million of costs related to the spin off of Teradata. |
The following table presents revenue from products and services for NCR for the years ended December 31:
| In millions | 2009 | 2008 | 2007 | ||||||
| Product revenue |
$ | 2,234 | $ | 2,861 | $ | 2,693 | |||
| Professional and installation services revenue |
578 | 638 | 671 | ||||||
| Total solution revenue |
2,812 | 3,499 | 3,364 | ||||||
| Support services revenue |
1,800 | 1,816 | 1,606 | ||||||
| Total revenue |
$ | 4,612 | $ | 5,315 | $ | 4,970 | |||
NCR allocates assets to its operating segments based on the primary segment benefitting from the assets. The assets attributable to NCR’s operating segments consist primarily of accounts receivable, inventories, property, plant, and equipment, capitalized software and goodwill dedicated to a specific operating segment. Assets not attributable to operating segments because they are not dedicated to a specific segment consist primarily of deferred tax assets, prepaid pension costs, and cash and cash equivalents.
83
Table of Contents
Segment assets as of December 31 were:
| In millions | 2009 | 2008 | ||||
| Segment assets |
||||||
| Americas |
$ | 936 | $ | 904 | ||
| EMEA |
677 | 757 | ||||
| APJ |
486 | 412 | ||||
| Total segment assets |
2,099 | 2,073 | ||||
| Assets not allocated to the segments: |
||||||
| Cash and cash equivalents |
451 | 711 | ||||
| Prepaid pension cost |
244 | 251 | ||||
| Deferred income taxes |
617 | 713 | ||||
| Other assets not attributable to segments |
683 | 507 | ||||
| Consolidated total assets |
$ | 4,094 | $ | 4,255 | ||
Revenues are attributed to the geographic area/country to which the product is delivered or in which the service is provided. The following table presents revenue by geographic area for NCR for the years ended December 31:
| In millions | 2009 | % | 2008 | % | 2007 | % | ||||||||||||
| Revenue by Geographic Area |
||||||||||||||||||
| United States |
$ | 1,609 | 35 | % | $ | 1,787 | 33 | % | $ | 1,743 | 35 | % | ||||||
| Americas (excluding United States) |
413 | 9 | % | 482 | 9 | % | 405 | 8 | % | |||||||||
| Europe, Middle East, and Africa |
1,649 | 36 | % | 2,066 | 39 | % | 1,906 | 38 | % | |||||||||
| Japan |
328 | 7 | % | 352 | 7 | % | 323 | 7 | % | |||||||||
| Asia Pacific (excluding Japan) |
613 | 13 | % | 628 | 12 | % | 593 | 12 | % | |||||||||
| Consolidated revenue |
$ | 4,612 | 100 | % | $ | 5,315 | 100 | % | $ | 4,970 | 100 | % | ||||||
The following table presents property, plant and equipment by geographic area as of December 31:
| In millions | 2009 | 2008 | ||||
| Property, plant and equipment, net |
||||||
| United States |
$ | 181 | $ | 133 | ||
| Americas (excluding United States) |
21 | 17 | ||||
| Europe, Middle East, and Africa |
71 | 78 | ||||
| Japan |
55 | 60 | ||||
| Asia Pacific (excluding Japan) |
28 | 20 | ||||
| Consolidated property, plant and equipment, net |
$ | 356 | $ | 308 | ||
Concentrations No single customer accounts for more than 10% of NCR’s consolidated revenue. As of December 31, 2009, NCR is not aware of any significant concentration of business transacted with a particular customer that could, if suddenly eliminated, have a material adverse effect on NCR’s operations. NCR also lacks a concentration of available sources of labor, services, licenses or other rights that could, if suddenly eliminated, have a material adverse effect on its operations.
A number of NCR’s products, systems and solutions rely primarily on specific suppliers for microprocessors and other component products, manufactured assemblies, operating systems, commercial software and other central components. NCR also utilizes contract manufacturers in order to complete manufacturing activities. There can be no assurances that any sudden impact to the availability or cost of these technologies or services would not have a material adverse effect on NCR’s operations.
84
Table of Contents
Note 14 Quarterly Information (unaudited)
| In millions, except per share amounts | First | Second | Third | Fourth | ||||||||||||
| 2009 |
||||||||||||||||
| Total revenues |
$ | 1,008 | $ | 1,124 | $ | 1,135 | $ | 1,345 | ||||||||
| Gross margin |
$ | 184 | $ | 229 | $ | 224 | $ | 246 | ||||||||
| Operating (loss) income |
$ | (10 | ) | $ | 39 | $ | 29 | $ | 39 | |||||||
| (Loss) income from continuing operations, net of tax |
$ | (14 | ) | $ | 24 | $ | 17 | $ | (57 | ) | ||||||
| Net income (loss) attributable to noncontrolling interests |
1 | 1 | 2 | (1 | ) | |||||||||||
| Net (loss) income attributable to NCR |
$ | (15 | ) | $ | 23 | $ | 15 | $ | (56 | ) | ||||||
| Basic earnings (loss) per share attributable to NCR common stockholders: |
||||||||||||||||
| Continuing operations |
$ | (0.09 | ) | $ | 0.14 | $ | 0.09 | $ | (0.35 | ) | ||||||
| Discontinued operations |
— | — | — | — | ||||||||||||
| Total |
$ | (0.09 | ) | $ | 0.14 | $ | 0.09 | $ | (0.35 | ) | ||||||
| Diluted earnings (loss) per share attributable to NCR common stockholders: |
||||||||||||||||
| Continuing operations |
$ | (0.09 | ) | $ | 0.14 | $ | 0.09 | $ | (0.35 | ) | ||||||
| Discontinued operations |
— | — | — | — | ||||||||||||
| Total |
$ | (0.09 | ) | $ | 0.14 | $ | 0.09 | $ | (0.35 | ) | ||||||
| 2008 |
||||||||||||||||
| Total revenues |
$ | 1,183 | $ | 1,332 | $ | 1,379 | $ | 1,421 | ||||||||
| Gross margin |
$ | 259 | $ | 287 | $ | 310 | $ | 327 | ||||||||
| Operating income |
$ | 65 | $ | 62 | $ | 100 | $ | 95 | ||||||||
| Income from continuing operations, net of tax |
$ | 49 | $ | 44 | $ | 82 | $ | 55 | ||||||||
| (Loss) income from discontinued operations, net of tax |
(1 | ) | (1 | ) | (2 | ) | 1 | |||||||||
| Net loss attributable to noncontrolling interests |
— | 1 | — | — | ||||||||||||
| Net income attributable to NCR |
$ | 48 | $ | 44 | $ | 80 | $ | 56 | ||||||||
| Basic earnings (loss) per share attributable to NCR common stockholders: |
||||||||||||||||
| Continuing operations |
$ | 0.28 | $ | 0.27 | $ | 0.50 | $ | 0.35 | ||||||||
| Discontinued operations |
— | (0.01 | ) | (0.01 | ) | — | ||||||||||
| Total |
$ | 0.28 | $ | 0.26 | $ | 0.49 | $ | 0.35 | ||||||||
| Diluted earnings (loss) per share attributable to NCR common stockholders: |
||||||||||||||||
| Continuing operations |
$ | 0.28 | $ | 0.26 | $ | 0.49 | $ | 0.34 | ||||||||
| Discontinued operations |
(0.01 | ) | — | (0.01 | ) | 0.01 | ||||||||||
| Total |
$ | 0.27 | $ | 0.26 | $ | 0.48 | $ | 0.35 | ||||||||
Net income per share in each quarter is computed using the weighted-average number of shares outstanding during that quarter while net income per share for the full year is computed using the weighted-average number of shares outstanding during the year. Thus, the sum of the four quarters’ net income per share will not necessarily equal the full-year net income per share.
85
Table of Contents
Note 15 Fair Value of Assets and Liabilities
Assets and Liabilities Measured at Fair Value on a Recurring Basis
Assets and liabilities recorded at fair value on a recurring basis as of December 31, 2009 are set forth as follows:
| Fair Value Measurements at Reporting Date Using | ||||||||||||
| In millions | Quoted Prices in Active Markets for Identical Assets (Level 1) |
Significant Other Observable Inputs (Level 2) |
Significant Unobservable Inputs (Level 3) | |||||||||
| Fair Value as of December 31, 2009 |
||||||||||||
| Assets |
||||||||||||
| Deposits held in money market funds(1) |
$ | 134 | $ | 134 | $ | — | $ | — | ||||
| Time deposits(1) |
50 | 50 | — | — | ||||||||
| Available-for-sale securities(2) |
13 | 13 | — | — | ||||||||
| Foreign exchange forward contracts |
1 | — | 1 | — | ||||||||
| Total |
$ | 198 | $ | 197 | $ | 1 | $ | — | ||||
| Liabilities |
||||||||||||
| Foreign exchange forward contracts |
$ | 1 | $ | — | $ | 1 | $ | — | ||||
| Total |
$ | 1 | $ | — | $ | 1 | $ | — | ||||
| (1) | Included in Cash and cash equivalents in the Consolidated Balance Sheet. |
| (2) | Included in Other assets in the Consolidated Balance Sheet. |
Deposits Held in Money Market Funds A portion of the Company’s excess cash is held in money market funds which generate interest income based on prevailing market rates. Money market fund holdings are measured at fair value using quoted market prices and are classified within Level 1 of the valuation hierarchy.
Time Deposits A portion of the Company’s excess cash is invested as time deposits with financial institutions and banks that generate interest based on prevailing rates. These time deposits have maturities as short as one day, but no more than three months. Time deposits are classified within Level 1 of the valuation hierarchy as the fair value represents the actual amount of cash on deposit.
Available-For-Sale Securities The Company has investments in mutual funds and equity securities that are valued using the market approach with quotations from the NASDAQ stock exchange and two stock exchanges in Japan. As a result, available-for-sale securities are classified within Level 1 of the valuation hierarchy.
Foreign Exchange Forward Contracts As a result of our global operating activities, we are exposed to risks from changes in foreign currency exchange rates, which may adversely affect our financial condition. To manage our exposures and mitigate the impact of currency fluctuations on our financial results, we hedge our primary transactional exposures through the use of foreign exchange forward contracts. The foreign exchange forward contracts are valued using the market approach based on observable market transactions of forward rates and are classified within Level 2 of the valuation hierarchy.
86
Table of Contents
Assets Measured at Fair Value on a Non-recurring Basis
The following table presents the Company’s assets that were measured at fair value on a non-recurring basis:
| Fair Value Measurements at Reporting Date Using |
|||||||||||||||||||
| In millions | Total Losses | ||||||||||||||||||
| Description |
Fair Value Measurements During the Year Ended December 31, 2009 |
Quoted Prices in Active Markets for Identical Assets (Level 1) |
Significant Other Observable Inputs (Level 2) |
Significant Other Unobservable Inputs (Level 3) |
For the Year Ended December 31, 2009 |
For the Year Ended December 31, 2008 | |||||||||||||
| Intellectual property |
$ | 8 | $ | — | $ | — | $ | 8 | $ | — | $ | — | |||||||
| Customer contract and trade names |
$ | 8 | $ | — | $ | — | $ | 8 | $ | — | $ | — | |||||||
| TNR—nonmarketable equity investment |
$ | — | $ | — | $ | — | $ | — | $ | (5 | ) | $ | — | ||||||
| ePlay—nonmarketable cost investment |
$ | — | $ | — | $ | — | $ | — | $ | (19 | ) | $ | — | ||||||
| Total |
$ | 16 | $ | — | $ | — | $ | 16 | $ | (24 | ) | $ | — | ||||||
NCR measures certain assets including, intangible assets and cost and equity method investments at fair value on a nonrecurring basis. These assets are recognized at fair value when initially valued and when they are deemed to be other-than-temporarily impaired.
NCR reviews the carrying values of investments when events and circumstances warrant and considers all available evidence in evaluating when declines in fair value are other-than-temporary declines. NCR carries equity investments in privately-held companies at cost or at fair value when NCR recognizes an other-than-temporary impairment charge. We measured the fair value of our investment in TNR and ePlay utilizing the income approach based on the use of discounted cash flows. The discounted cash flows are based on unobservable inputs, including assumptions of projected revenues, expenses, earnings, capital spending, as well as a discount rate determined by management’s estimates of risk associated with each investment. During 2009, we recorded $24 million in other-than-temporary impairment charges in other income and expense in the Consolidated Statement of Operations.
In conjunction with 2009 acquisitions as described in Note 4, “Business Combinations, Divestitures and Equity Investments,” NCR recognized intangible assets for customer contracts, trade names and intellectual property of $16 million. We measured the fair value of the customer contracts and intellectual property through the use of discounted cash flows expected to be earned by the contracts, which required the use of unobservable inputs, including assumptions on projected revenue, expenses, and earnings, as well as a discount rate determined by management’s estimates of the risk profile associated with the contracts. We measured the fair value of trade names acquired in the transaction based on a relief from royalty approach, which required the use of unobservable inputs, including comparable royalty rates in the media and entertainment industry as well as expected revenues over the estimated life of the trade names.
87
Table of Contents
| Item 9. | CHANGES IN AND DISAGREEMENTS WITH ACCOUNTANTS ON ACCOUNTING AND FINANCIAL DISCLOSURE |
None.
| Item 9A. | CONTROLS AND PROCEDURES |
Evaluation of Disclosure Controls and Procedures
NCR has established disclosure controls and procedures (as defined in Rules 13a-15(e) and 15d-15(e) of the Securities Exchange Act of 1934 (the Exchange Act)) to ensure that information required to be disclosed by NCR in the reports that it files or submits under the Exchange Act is recorded, processed, summarized and reported, within the time periods specified in the SEC’s rules and forms. Disclosure controls and procedures include, without limitation, controls and procedures designed to ensure that information required to be disclosed by NCR in the reports that it files or submits under the Exchange Act is accumulated and communicated to NCR’s management, including its Chief Executive and Chief Financial Officers, as appropriate to allow timely decisions regarding required disclosure. Based on their evaluation as of the end of the period covered by this report, conducted under their supervision and with the participation of management, the Company’s Chief Executive and Chief Financial Officers have concluded that NCR’s disclosure controls and procedures are effective to meet such objective and that NCR’s disclosure controls and procedures adequately alert them on a timely basis to material information relating to the Company (including its consolidated subsidiaries) required to be included in NCR’s Exchange Act filings.
Changes in Internal Control over Financial Reporting
There have been no changes in our internal control over financial reporting that occurred during the last fiscal quarter that have materially affected, or are reasonably likely to materially affect, our internal control over financial reporting.
Management’s Report on Internal Control over Financial Reporting
Management is responsible for establishing and maintaining effective internal control over financial reporting as defined in Rules 13a-15(f) and 15d-15(f) under the Exchange Act. The Company’s internal control over financial reporting is a process designed to provide reasonable assurance regarding the reliability of financial reporting and the preparation of financial statements for external purposes in accordance with generally accepted accounting principles. A company’s internal control over financial reporting includes those policies and procedures that (i) pertain to the maintenance of records that, in reasonable detail, accurately and fairly reflect the transactions and dispositions of the assets of the company; (ii) provide reasonable assurance that transactions are recorded as necessary to permit preparation of financial statements in accordance with generally accepted accounting principles, and that receipts and expenditures of the company are being made only in accordance with authorizations of management and directors of the company; and (iii) provide reasonable assurance regarding prevention or timely detection of unauthorized acquisition, use, or disposition of the company’s assets that could have a material effect on the financial statements.
Because of its inherent limitations due to, for example, the potential for human error or circumvention of controls, internal control over financial reporting may not prevent or detect misstatements. Also, projections of any evaluation of effectiveness to future periods are subject to the risk that controls may become inadequate because of changes in conditions, or that the degree of compliance with the policies or procedures may deteriorate.
The Company’s management assessed the effectiveness of the Company’s internal control over financial reporting as of December 31, 2009. In making this assessment, we used the criteria set forth by the Committee of Sponsoring Organizations of the Treadway Commission (COSO) in Internal Control–Integrated Framework. Based on our assessment, we determined that, as of December 31, 2009, the Company’s internal control over financial reporting was effective based on those criteria.
88
Table of Contents
PricewaterhouseCoopers LLP, our independent registered public accounting firm, has audited the effectiveness of the Company’s internal control over financial reporting as of December 31, 2009 as stated in their report which appears in this Form 10-K.
| /s/ WILLIAM NUTI |
/s/ ROBERT FISHMAN | |||
| William Nuti | Robert Fishman | |||
| Chairman of the Board, Chief Executive Officer and President |
Vice President and Interim Chief Financial Officer |
| Item 9B. | OTHER INFORMATION |
None.
89
Table of Contents
| Item 10. | DIRECTORS, EXECUTIVE OFFICERS AND CORPORATE GOVERNANCE |
Information required by this Item 10 with respect to directors of NCR is included in NCR’s Definitive Proxy Statement for its 2010 Annual Meeting of Stockholders to be filed with the Securities and Exchange Commission within 120 days after the end of our fiscal 2009 year, and is incorporated herein by reference.
The Executive Officers of NCR (as of February 25, 2010) are as follows:
| Name |
Age | Position and Offices Held | ||
| William Nuti |
46 | Chairman of the Board, Chief Executive Officer and President | ||
| John Bruno |
45 | Executive Vice President, Industry Solutions Group | ||
| Daniel Bogan |
54 | Senior Vice President and General Manager, NCR Consumables | ||
| Peter Dorsman |
54 | Senior Vice President, Global Operations, and Chief Operations Officer | ||
| Peter Leav |
39 | Senior Vice President, Worldwide Sales | ||
| Andrea Ledford |
44 | Senior Vice President, Human Resources | ||
| Robert Fishman |
46 | Vice President and Interim Chief Financial Officer | ||
| Nelson Greene |
46 | Vice President, Interim General Counsel and Secretary |
NCR’s Executive Officers
William Nuti is NCR’s Chairman of the Board, Chief Executive Officer and President. Mr. Nuti joined NCR on August 7, 2005 as its Chief Executive Officer and President, in addition to being named as a director of the Company. Mr. Nuti became Chairman of the Board on October 1, 2007. Before joining NCR in August 2005, Mr. Nuti served as President and Chief Executive Officer of Symbol Technologies, Inc. (“Symbol Technologies”), an information technology company, from December 2003 to August 2005. Prior to that, he was Chief Operating Officer of Symbol Technologies from July 2002 to December 2003. Mr. Nuti joined Symbol Technologies in 2002 following a 10 plus year career at Cisco Systems, Inc. (“Cisco”) where he held positions of increasing responsibility, advancing to the dual role of Senior Vice President of the company’s Worldwide Service Provider Operations and U.S. Theater Operations. Mr. Nuti is also a director of Sprint Nextel Corporation, and a member of their Compensation Committee. Mr. Nuti became a director of NCR on August 7, 2005.
John Bruno became Executive Vice President on November 29, 2008. Prior to joining NCR, Mr. Bruno was a Managing Director at The Goldman Sachs Group, Inc. from August 2007 to November 2008. Prior to this position, he was Senior Vice President—General Manager, RFID Division, at Symbol Technologies from June 2005 through February 22, 2006. Mr. Bruno was Symbol Technologies’ Senior Vice President, Corporate Development, from May 2004 to June 2005, and was Symbol Technologies’ Senior Vice President, Business Development, and Chief Information Officer, from November 2002 to May 2004.
Daniel Bogan became Senior Vice President and General Manager, Systemedia Division, now known as NCR Consumables, on January 1, 2008. Prior to assuming this position, he was Senior Vice President, Retail Solutions Division, from January 1, 2007 to December 31, 2007, and he had been Interim Senior Vice President, Retail Solutions Division, since April 26, 2006. Prior to this position, Mr. Bogan was Vice President, Americas Sales and Service, Retail Solutions Division, from September 2002 to April 26, 2006. Mr. Bogan joined NCR in 1977.
Peter Dorsman became Senior Vice President, Global Operations, on January 1, 2008. Prior to assuming this position, he was Vice President and General Manager of NCR’s Systemedia Division from April 17, 2006 to December 31, 2007. Prior to joining NCR, Mr. Dorsman was Executive Vice President and Chief Operating Officer of Standard Register Co., a document services provider, from February 2000 to June 2004. Mr. Dorsman is a director of Applied Industrial Technologies Inc.
Peter Leav became Senior Vice President, Worldwide Sales, on January 29, 2009. Prior to joining NCR, he was Corporate Vice President and General Manager for Motorola, Inc., a provider of mobility products and
90
Table of Contents
solutions across broadband and wireless networks, from November 2008 to January 2009, and Vice President and General Manager for Motorola from December 2007 to November 2008. Prior to this position, Mr. Leav was Vice President of Sales for Motorola from December 2006 to December 2007. From November 2004 to December 2006, Mr. Leav was Director of Sales for Symbol Technologies. Prior to this position, Mr. Leav was Regional Sales Manager at Cisco, from July 2000 to November 2004.
Andrea Ledford became Senior Vice President, Human Resources, on June 25, 2007. Ms. Ledford served as Interim Senior Vice President, Human Resources, from February 26, 2007 to June 24, 2007. Prior to assuming this position, she was Vice President, Human Resources, Asia/Pacific, and Europe, Middle East and Africa, from February 2006 to February 2007. Before joining NCR in February 2006, Ms. Ledford was EMEA Leader, Human Resources, at Symbol Technologies, from 2002 to February 2006 and held a variety of leadership roles at Cisco in EMEA, Asia/Pacific and Latin America.
Robert Fishman became Vice President and Interim Chief Financial Officer on October 23, 2009. Prior to assuming this position, he was Vice President and Corporate Controller from January 2007 to October 2009. From September 2005 to January 2007, Mr. Fishman was Assistant Controller and from January 2005 to September 2005 he was Director, Corporate Planning. Mr. Fishman joined NCR in 1993.
Nelson F. Greene became Vice President, Interim General Counsel, and Secretary on July 15, 2009. Prior to assuming this position, Mr. Greene was Vice President, Deputy General Counsel, and Assistant Secretary from 2007 to July 2009. From July 2001 to 2007, he was Law Vice President of the Corporate Group of NCR’s Law Department and from 1999 to July 2001, he was Law Vice President of the Teradata Division. Mr. Greene joined NCR in 1992.
Information regarding Section 16(a) beneficial ownership reporting compliance of the Company’s executive officers and directors is included in the material captioned “Section 16(a) Beneficial Ownership Reporting Compliance” in NCR’s Definitive Proxy Statement for its 2010 Annual Meeting of Stockholders to be filed with the Securities and Exchange Commission within 120 days after the end of our fiscal 2009 year, and is incorporated herein by reference.
The information regarding the Company’s Audit Committee is included in the material captioned “Committees of the Board,” in NCR’s Definitive Proxy Statement for its 2010 Annual Meeting of Stockholders to be filed with the Securities and Exchange Commission within 120 days after the end of our fiscal 2009 year, and is incorporated herein by reference. Information regarding NCR’s determination of an “audit committee financial expert” is included in the material captioned “Committees of the Board” in NCR’s Definitive Proxy Statement for its 2010 Annual Meeting of Stockholders to be filed with the Securities and Exchange Commission within 120 days after the end of our fiscal 2009 year, and is incorporated herein by reference.
The Company has not materially changed the procedures by which stockholders may recommend nominees to the Company’s Board of Directors.
The Company has a Code of Conduct that sets the standard for ethics and compliance for all of its employees. NCR’s Code of Conduct is filed as Exhibit 14 of this Form 10-K. The Company intends to disclose any amendments to or waivers of the Code of Conduct on behalf of the Executive Officers on the Company’s investor relations website at http://investor.ncr.com under the heading “Corporate Governance,” and on NCR’s corporate governance website at www.ncr.com/corpgovernance/corpgov_code_conduct.htm, promptly following the date of such amendment or waiver.
91
Table of Contents
| Item 11. | EXECUTIVE COMPENSATION |
The information regarding the Company’s compensation of its named executive officers is included in the material captioned “Executive Compensation” included in NCR’s Definitive Proxy Statement for its 2010 Annual Meeting of Stockholders to be filed with the Securities and Exchange Commission within 120 days after the end of our fiscal 2009 year, and is incorporated herein by reference. The information regarding compensation committee interlocks and insider participation is included in the material captioned “Compensation and Human Resource Committee” included in NCR’s Definitive Proxy Statement for its 2010 Annual Meeting of Stockholders to be filed with the Securities and Exchange Commission within 120 days after the end of our fiscal 2009 year and is incorporated herein by reference. The information regarding the compensation committee report is included in the material captioned “Board Compensation and Human Resource Committee Report on Executive Compensation” of NCR’s Definitive Proxy Statement for its 2010 Annual Meeting of Stockholders to be filed with the Securities and Exchange Commission within 120 days after the end of our fiscal 2009 year, and is incorporated herein by reference.
| Item 12. | SECURITY OWNERSHIP OF CERTAIN BENEFICIAL OWNERS AND MANAGEMENT AND RELATED STOCKHOLDER MATTERS |
Information regarding security ownership of certain beneficial owners and management is included in the material captioned “Stock Ownership” in NCR’s Definitive Proxy Statement for its 2010 Annual Meeting of Stockholders to be filed with the Securities and Exchange Commission within 120 days after the end of our fiscal 2009 year, and is incorporated herein by reference.
Information regarding equity compensation plans is included in the material captioned “Equity Compensation Plan Information” in NCR’s Definitive Proxy Statement for its 2010 Annual Meeting of Stockholders to be filed with the Securities and Exchange Commission within 120 days after the end of our fiscal 2009 year, and is incorporated herein by reference.
| Item 13. | CERTAIN RELATIONSHIPS AND RELATED TRANSACTIONS, AND DIRECTOR INDEPENDENCE |
The information described under the caption “Related Person Transactions” in NCR’s Definitive Proxy Statement for its 2010 Annual Meeting of Stockholders to be filed with the Securities and Exchange Commission within 120 days after the end of our fiscal 2009 year, is incorporated herein by reference. The information regarding director independence is included in the material captioned “Corporate Governance” in NCR’s Definitive Proxy Statement for its 2010 Annual Meeting of Stockholders to be filed with the Securities and Exchange Commission within 120 days after the end of our fiscal 2009 year, and is incorporated herein by reference.
| Item 14. | PRINCIPAL ACCOUNTANT FEES AND SERVICES |
Information regarding fees paid to the Company’s independent registered public accounting firm is included in the material captioned “Fees Paid to Independent Registered Public Accounting Firm” in NCR’s Definitive Proxy Statement for its 2010 Annual Meeting of Stockholders to be filed with the Securities and Exchange Commission within 120 days after the end of our fiscal 2009 year, and is incorporated herein by reference.
92
Table of Contents
| Item 15. | EXHIBITS, FINANCIAL STATEMENT SCHEDULES |
(a) Index
1. Financial Statements: The consolidated financial statements of the Company and the Report of Independent Registered Public Accounting Firm as set forth in Part II, Item 8 of this Form 10-K report:
2. Financial Statement Schedule: Financial Statement Schedule II – Valuation and Qualifying Accounts is included in this Form 10-K report on page 98. All other schedules are not required under the related instructions or are not applicable.
3. Exhibits: See Index of Exhibits below for a listing of all exhibits to this Form 10-K report.
(b) Exhibits identified in parentheses below, on file with the SEC, are incorporated herein by reference as exhibits hereto.
| Exhibit No. |
Description | |
| 2.1 | Separation and Distribution Agreement, dated as of August 27, 2007 between NCR Corporation and Teradata Corporation (Exhibit 2.1 to the Form 10 of Teradata Corporation (the “Teradata Form 10”)). | |
| 3.1 | Articles of Amendment and Restatement of NCR Corporation, as amended May 14, 1999 (Exhibit 3.1 to the NCR Corporation Form 10-Q for the period ended June 30, 1999). | |
| 3.2 | Bylaws of NCR Corporation, as amended and restated on January 28, 2009 (Exhibit 3(ii) to the NCR Corporation Current Report on Form 8-K filed February 2, 2009). | |
| 4.1 | Common Stock Certificate of NCR Corporation (Exhibit 4.1 to the NCR Corporation Annual Report on Form 10-K for the year ended December 31, 1999 (the “1999 NCR Annual Report”)). | |
| 4.2 | NCR Corporation hereby agrees to furnish the Securities and Exchange Commission, upon its request, a copy of any instrument which defines the rights of holders of long-term debt of NCR Corporation and all of its subsidiaries for which consolidated or unconsolidated financial statements are required to be filed, and which does not exceed 10% of the total assets of NCR Corporation and its subsidiaries on a consolidated basis. | |
| 4.3 | Indenture, dated as of June 1, 2002, between NCR Corporation and The Bank of New York (Exhibit 3.2 to the NCR Corporation Quarterly Report on Form 10-Q for the period ended June 30, 2002 (the “June 30, 2002 Quarterly Report”)). | |
| 10.1 | Separation and Distribution Agreement, dated as of February 1, 1996 and amended and restated as of March 29, 1996 (Exhibit 10.1 to the Lucent Technologies Inc. Registration Statement on Form S-1 (No. 333-00703) (the “Lucent Registration Statement”)). | |
| 10.2 | Employee Benefits Agreement, dated as of November 20, 1996, by and between AT&T Corp. and NCR Corporation (Exhibit 10.2 to the 1996 NCR Annual Report). | |
93
Table of Contents
| Exhibit No. |
Description | |
| 10.3 | Patent License Agreement, effective as of March 29, 1996, by and among AT&T Corp., NCR Corporation, and Lucent Technologies Inc. (Exhibit 10.7 to the Lucent Registration Statement). | |
| 10.4 | Amended and Restated Technology License Agreement, effective as of March 29, 1996, by and among AT&T Corp., NCR Corporation, and Lucent Technologies Inc. (Exhibit 10.8 to the Lucent Registration Statement). | |
| 10.5 | Tax Sharing Agreement, dated as of February 1, 1996, and amended and restated as of March 29, 1996, by and among AT&T Corp., NCR Corporation, and Lucent Technologies Inc. (Exhibit 10.6 to the Lucent Registration Statement). | |
| 10.6 | Purchase and Manufacturing Services Agreement effective as of January 19, 2007, between NCR Corporation and Solectron Corporation (now Flextronics International Ltd.) (incorporated by reference to Exhibit 10.6 to the Form 10-K/A for the fiscal year ended December 31, 2006, filed June 4, 2008). Certain portions of this exhibit were granted confidential treatment by the Securities and Exchange Commission on October 2, 2008. | |
| 10.7 | Tax Sharing Agreement, dated as of September 21, 2007, between NCR Corporation and Teradata Corporation (Exhibit 10.1 to the Current Report on Form 8-K of NCR Corporation dated September 21, 2007 (the “September 21, 2007 Form 8-K”)). | |
| 10.8 | Form of Interim Services and Systems Replication Agreement between NCR Corporation and Teradata Corporation (Exhibit 10.2 to the Teradata Form 10). | |
| 10.9 | Employee Benefits Agreement, dated as of September 21, 2007, between NCR Corporation and Teradata Corporation (Exhibit 10.2 to the September 21, 2007 Form 8-K). | |
| 10.10 | Form of Exclusive Patent License Agreement between NCR Corporation and Teradata US, Inc. (Exhibit 10.4 to the Teradata Form 10). | |
| 10.11 | Form of Patent License Agreement between NCR Corporation and Teradata US, Inc. (Exhibit 10.5 to the Teradata Form 10). | |
| 10.12 | Form of Technology Agreement between NCR Corporation and Teradata US, Inc. (Exhibit 10.6 to the Teradata Form 10). | |
| 10.13 | Form of Master Agreement between NCR Corporation and Teradata Corporation for Enterprise Data Warehousing Sales and Support (Exhibit 10.16 to the Teradata Form 10). | |
| 10.14 | Form of Network Support Agreement between NCR Corporation and Teradata Corporation (Exhibit 10.17 to the Teradata Form 10). | |
| 10.15 | Form of Service Provider Agreement between NCR Corporation and Teradata Corporation (Exhibit 10.18 to the Teradata Form 10). | |
| 10.16 | Form of Master Reseller Agreement for Middle East and Africa between NCR Corporation and Teradata Corporation (Exhibit 10.19 to the Teradata Form 10). | |
| 10.17 | NCR Management Stock Plan (Exhibit 10.8 to the 1996 NCR Annual Report). * | |
| 10.17.1 | First Amendment to the NCR Management Stock Plan dated April 30, 2003 (Exhibit 10.4 to the NCR Corporation Quarterly Report on Form 10-Q for the quarter ended March 31, 2003). * | |
| 10.17.2 | Amendment to NCR Management Stock Plan effective as of December 31, 2008 (Exhibit 10.17.2 to the NCR Corporation Annual Report on Form 10-K for the year ended December 31, 2008 (the “2008 Annual Report”)). * | |
| 10.17.3 | Form of Stock Option Agreement under the NCR Management Stock Plan (Exhibit 10.6.3 to the NCR Corporation Annual Report on Form 10-K for the year ended December 31, 2005 (the “2005 Annual Report”)). * | |
| 10.17.4 | Form of Restricted Stock Agreement under the NCR Management Stock Plan (Exhibit 10.6.4 to the 2005 Annual Report). * | |
94
Table of Contents
| 10.18 | NCR Corporation 2006 Stock Incentive Plan, as amended and restated effective as of December 31, 2008 (Exhibit 10.18.3 to the 2008 Annual Report). * | |
| 10.18.1 | Form of 2009 Stock Option Agreement under the NCR 2006 Stock Incentive Plan, as amended and restated (the “2006 Stock Plan”) (Exhibit 10.5 to the Current Report on Form 8-K dated December 12, 2008). * | |
| 10.18.2 | Form of 2009 Restricted Stock Agreement under the 2006 Stock Plan (Exhibit 10.1 to the Current Report on Form 8-K dated December 12, 2008). * | |
| 10.18.3 | Form of 2009 Restricted Stock Unit Agreement under the 2006 Stock Plan (Exhibit 10.2 to the Current Report on Form 8-K dated December 12, 2008). | |
| 10.18.4 | Form of 2009 Performance Based Restricted Stock Agreement under the 2006 Stock Plan (Exhibit 10.1 to the Current Report on Form 8-K dated February 23, 2009). * | |
| 10.18.5 | Form of 2009 Performance based Restricted Stock Unit Agreement under the 2006 Stock Plan (Exhibit 10.2 to the Current Report on Form 8-K dated February 23, 2009). * | |
| 10.19 | NCR Management Incentive Program for Executive Officers (Exhibit 10.19 to the 1996 Annual Report). * | |
| 10.20 | NCR Management Incentive Plan (Exhibit A to the Company’s Proxy Statement filed on March 10, 2006). * | |
| 10.21 | NCR Director Compensation Program effective April 21, 2009 (Exhibit 10.7 to the Quarterly Report on Form 10-Q for the quarter ended March 31, 2009 (the “First Quarter 2009 Form 10-Q”)). * | |
| 10.21.1 | 2009 Director Option Grant Statement under the NCR Director Compensation Program (Exhibit 10.8 to the First Quarter 2009 Form 10-Q). * | |
| 10.21.2 | 2009 Director Restricted Stock Unit Grant Statement under the NCR Director Compensation Program (Exhibit 10.9 to the First Quarter 2009 Form 10-Q). * | |
| 10.22 | The Retirement Plan for Officers of NCR (Exhibit 10.11 to the NCR Corporation Registration Statement on Form 10 (No. 001-00395), dated November 25, 1996 (the “NCR Registration Statement”)). * | |
| 10.22.1 | Second Amendment to the Retirement Plan for Officers of NCR Corporation effective January 1, 2001 (Exhibit 10.1 to the NCR Corporation Quarterly Report on Form 10-Q for the quarter ended September 30, 2001). * | |
| 10.22.2 | Third Amendment to the Retirement Plan for Officers of NCR Corporation effective June 1, 2002 (Exhibit 10.8.3 to the NCR Corporation Annual Report on Form 10-K for the year ended December 31, 2002 (the “2002 Annual Report”)). * | |
| 10.22.3 | Fourth Amendment to the Retirement Plan for Officers of NCR effective January 1, 2006 (Exhibit 10.7.4 to the 2005 Annual Report). * | |
| 10.22.4 | Fifth Amendment to the Retirement Plan for Officers of NCR effective December 31, 2006 (Exhibit 10.13.4 to the NCR Corporation Annual Report on Form 10-K for the year ended December 31, 2006). * | |
| 10.22.5 | The Retirement Plan for Officers of NCR, Amended and Restated effective December 31, 2008 (Exhibit 10.22.5 to the 2008 Annual Report). * | |
| 10.23 | NCR Officer Plan effective June 1, 2002 (Exhibit 10.9 to the 2002 Annual Report). * | |
| 10.23.1 | First Amendment to the NCR Officer Plan, executed December 17, 2004 (Exhibit 10.1 to the Current Report on Form 8-K dated December 17, 2004). * | |
| 10.23.2 | Second Amendment to the NCR Officer Plan effective January 1, 2006 (Exhibit 10.8.2 to the 2005 Annual Report). * | |
95
Table of Contents
| 10.23.3 | Third Amendment to the NCR Officer Plan effective December 31, 2006 (Exhibit 10.14.3 to the NCR Corporation Annual Report on Form 10-K for the year ended December 31, 2006). * | |
| 10.23.4 | Fourth Amendment to the NCR Officer Plan effective January 1, 2008 (Exhibit 10.23.4 to the NCR Corporation Annual Report on Form 10-K for the year ended December 31, 2007). * | |
| 10.23.5 | NCR Officer Plan, Amended and Restated effective December 31, 2008 (Exhibit 10.23.5 to the 2008 Annual Report). * | |
| 10.24 | Amended and Restated NCR Change in Control Severance Plan effective December 31, 2008 (Exhibit 10.24.2 to the 2008 Annual Report). * | |
| 10.25 | NCR Supplemental Pension Plan for AT&T Transfers, restated effective January 1, 1997 (Exhibit 10.1 to the NCR Corporation Quarterly Report on Form 10-Q for the quarter ended March 31, 1998 (the “March 31, 1998 Quarterly Report”)). * | |
| 10.25.1 | First Amendment to the NCR Supplemental Pension Plan for AT&T Transfers effective January 1, 2006 (Exhibit 10.12.1 to the 2005 Annual Report). * | |
| 10.25.2 | Second Amendment to the NCR Supplemental Pension Plan for AT&T Transfers effective December 31, 2006 (Exhibit 10.16.2 to the NCR Corporation Annual Report on Form 10-K for the year ended December 31, 2006). * | |
| 10.25.3 | NCR Supplemental Pension Plan for AT&T Transfers, Amended and Restated effective December 31, 2008 (Exhibit 10.25.3 to the 2008 Annual Report). * | |
| 10.26 | NCR Mid-Career Hire Supplemental Pension Plan, restated effective January 1, 1997 (Exhibit 10.2 to the March 31, 1998 Quarterly Report). * | |
| 10.26.1 | Amendment to the Mid-Career Hire Supplemental Pension Plan effective June 1, 2002 (Exhibit 10.15.2 to the 2002 Annual Report). * | |
| 10.26.2 | Second Amendment to the NCR Mid-Career Hire Supplemental Pension Plan effective January 1, 2006 (Exhibit 10.13.3 to the 2005 Annual Report). * | |
| 10.26.3 | Third Amendment to the NCR Mid-Career Hire Supplemental Pension Plan effective December 31, 2006 (Exhibit 10.17.3 to the NCR Corporation Annual Report on Form 10-K for the year ended December 31, 2006). * | |
| 10.26.4 | NCR Mid-Career Hire Supplemental Pension Plan, Amended and Restated effective December 31, 2008 (Exhibit 10.26.4 to the 2008 Annual Report). * | |
| 10.27 | NCR Nonqualified Excess Plan, restated effective January 1, 1996 (Exhibit 10.3 to the March 31, 1998 Quarterly Report). * | |
| 10.27.1 | First Amendment to the NCR Nonqualified Excess Plan, executed December 17, 2004 (Exhibit 10.2 to the Current Report on Form 8-K dated December 17, 2004). * | |
| 10.27.2 | Second Amendment to the NCR Nonqualified Excess Plan effective January 1, 2006 (Exhibit 10.14.2 to the 2005 Annual Report). * | |
| 10.27.3 | Third Amendment to the NCR Nonqualified Excess Plan effective December 31, 2006 (Exhibit 10.18.3 to the NCR Corporation Annual Report on Form 10-K for the year ended December 31, 2006). * | |
| 10.27.4 | Fourth Amendment to the NCR Nonqualified Excess Plan (Exhibit 10.11 to the NCR Corporation Quarterly Report on Form 10-Q for the quarter ended March 31, 2007). * | |
| 10.27.5 | Fifth Amendment to the NCR Nonqualified Excess Plan (Exhibit 10.1 to the NCR Corporation Quarterly Report on Form 10-Q for the quarter ended June 30, 2007). * | |
| 10.27.6 | Amended and Restated NCR Nonqualified Excess Plan, effective December 31, 2008 (Exhibit 10.26.6 to the 2008 Annual Report). * | |
| 10.28 | NCR Change-In-Control Severance Plan for Key At-Risk Employees adopted effective January 1, 2003 (Exhibit 10.17 to the 2002 Annual Report). * | |
96
Table of Contents
| 10.29 | Employment Agreement with William Nuti, dated July 29, 2005 (Exhibit 10.1 to the NCR Corporation Current Report on Form 8-K filed August 2, 2005). * | |
| 10.29.1 | Letter agreement dated July 26, 2006 with William Nuti (Exhibit 10.4 to the NCR Corporation Current Report on Form 8-K filed July 27, 2006). * | |
| 10.29.2 | Second Amendment effective as of December 12, 2008 to Letter Agreement with William Nuti dated July 29, 2005, as amended July 26, 2006 (Exhibit 10.30.2 to the 2008 Annual Report). * | |
| 10.30 | Letter Agreement with Malcolm Collins dated February 5, 2006 (Exhibit 10.1 to the NCR Corporation Current Report on Form 8-K filed February 9, 2006). * | |
| 10.30.1 | Compromise Agreement between NCR Limited and Malcolm Collins dated January 27, 2009 (Exhibit 10.31.1 to the 2008 Annual Report). * | |
| 10.31 | Letter Agreement dated November 19, 2007 between NCR Corporation and Anthony J. Massetti (Exhibit 10.1 to the NCR Corporation Current Report on Form 8-K dated November 20, 2007). * | |
| 10.31.1 | First Amendment dated December 18, 2008 to Letter Agreement dated November 19, 2007 between NCR Corporation and Anthony Massetti (Exhibit 10.33.1 to the 2008 Annual Report). * | |
| 14 | Code of conduct for associates for NCR Corporation (Exhibit 14 to the NCR Corporation Annual Report on Form 10-K for the year ended December 31, 2007). | |
| 21 | Subsidiaries of NCR Corporation. | |
| 23.1 | Consent of Independent Registered Public Accounting Firm. | |
| 31.1 | Certification pursuant to 18 U.S.C. Section 1350 as adopted pursuant to Section 302 of the Sarbanes-Oxley Act of 2002 dated February 25, 2010. | |
| 31.2 | Certification pursuant to 18 U.S.C. Section 1350 as adopted pursuant to Section 302 of the Sarbanes-Oxley Act of 2002 dated February 25, 2010. | |
| 32 | Certification pursuant to 18 U.S.C. Section 1350 as adopted pursuant to Section 906 of the Sarbanes-Oxley Act of 2002 dated February 25, 2010. | |
| 99.1 | Tax Opinion of Wachtell, Lipton, Rosen & Katz in connection with the Spin off of Teradata, dated August 27, 2007 (Exhibit 99.2 to the Current Report on Form 8-K of NCR Corporation dated September 30, 2007). | |
| * | Management contracts or compensatory plans/arrangements |
97
Table of Contents
NCR Corporation
SCHEDULE II—VALUATION AND QUALIFYING ACCOUNTS
(In millions)
| Column A |
Column B | Column C | Column D | Column E | |||||||||||||
| Balance at Beginning of Period |
Additions | Deductions | Balance at End of Period | ||||||||||||||
| Description |
Charged to Costs & Expenses |
Charged to Other Accounts |
|||||||||||||||
| Year Ended December 31, 2009 |
|||||||||||||||||
| Allowance for doubtful accounts |
$ | 15 | $ | 10 | $ | — | $ | 1 | $ | 24 | |||||||
| Deferred tax asset valuation allowance |
$ | 478 | $ | 21 | $ | — | $ | — | $ | 499 | |||||||
| Inventory excess and obsolete reserves |
$ | 111 | $ | 97 | $ | — | $ | 108 | $ | 100 | |||||||
| Reserves related to business restructuring |
$ | 31 | $ | — | $ | — | $ | 27 | $ | 4 | |||||||
| Year Ended December 31, 2008 |
|||||||||||||||||
| Allowance for doubtful accounts |
$ | 19 | $ | 3 | $ | — | $ | 7 | $ | 15 | |||||||
| Deferred tax asset valuation allowance |
$ | 441 | $ | 37 | $ | — | $ | — | $ | 478 | |||||||
| Inventory excess and obsolete reserves |
$ | 147 | $ | 115 | $ | — | $ | 151 | $ | 111 | |||||||
| Reserves related to business restructuring |
$ | 25 | $ | 57 | $ | (2 | ) | $ | 49 | $ | 31 | ||||||
| Year Ended December 31, 2007 |
|||||||||||||||||
| Allowance for doubtful accounts |
$ | 18 | (a) | $ | 5 | $ | — | $ | 4 | $ | 19 | ||||||
| Deferred tax asset valuation allowance |
$ | 686 | (a) | $ | — | $ | — | $ | 245 | $ | 441 | ||||||
| Inventory excess and obsolete reserves |
$ | 206 | (a) | $ | 127 | $ | — | $ | 186 | $ | 147 | ||||||
| Reserves related to business restructuring |
$ | 6 | (a) | $ | 70 | $ | 1 | $ | 52 | $ | 25 | ||||||
| (a) | The beginning balance as of January 1, 2007 excludes the amounts allocated to the Teradata Data Warehousing business as it was spun-off on September 30, 2007. |
98
Table of Contents
SIGNATURES
Pursuant to the requirements of Section 13 or 15 (d) of the Securities Exchange Act of 1934, the registrant has duly caused this report to be signed on its behalf by the undersigned, thereunto duly authorized.
| NCR CORPORATION | ||||||
| Date: February 25, 2010 |
||||||
| By: | /s/ ROBERT FISHMAN | |||||
| Robert Fishman | ||||||
| Vice President and Interim Chief Financial Officer | ||||||
Pursuant to the requirements of the Securities Exchange Act of 1934, this report has been signed below by the following persons on behalf of the registrant and in the capacities and on the date indicated.
| Signature |
Title | |
| /s/ WILLIAM NUTI William Nuti |
Chairman of the Board of Directors, Chief Executive Officer and President | |
| /s/ ROBERT FISHMAN Robert Fishman |
Vice President and Interim Chief Financial Officer (Principal Financial and Accounting Officer) | |
| /s/ LINDA FAYNE LEVINSON Linda Fayne Levinson |
Director | |
| /s/ QUINCY ALLEN Quincy Allen |
Director | |
| /s/ EDWARD P. BOYKIN Edward P. Boykin |
Director | |
| /s/ RICHARD L. CLEMMER Richard L. Clemmer |
Director | |
| /s/ GARY DAICHENDT Gary Daichendt |
Director | |
| /s/ ROBERT P. DERODES Robert P. DeRodes |
Director | |
| /s/ C. K. PRAHALAD C. K. Prahalad |
Director | |
Date: February 25, 2010
99