UNITED STATES SECURITIES
AND EXCHANGE COMMISSION
Washington, D.C. 20549
FORM 1O-K
(Mark One)
| x |
Annual report pursuant to Section 13 or 15(d) of the Securities Exchange Act of 1934 |
For the fiscal year ended December 31, 2009
or
| ¨ |
Transition report pursuant to Section 13 or 15(d) of the Securities Act of 1934 |
For the transition period from to
Commission File Number 001-09781 (0-1052)
MILLIPORE CORPORATION
(Exact name of registrant as specified in its charter)
|
|
|
| Massachusetts |
|
04-2170233 |
| (State or Other Jurisdiction of Incorporation or Organization) |
|
(I.R.S. Employer Identification No.) |
|
|
| 290 Concord Road, Billerica, MA |
|
01821 |
| (Address of principal executive offices) |
|
(Zip Code) |
(978) 715-4321
(Registrant’s telephone number, including area code)
SECURITIES REGISTERED PURSUANT TO SECTION 12(B) OF THE ACT:
|
|
|
| Title of Class |
|
Name of Exchange on Which Registered |
| Common Stock, $1.00 Par Value |
|
New York Stock Exchange, Inc. |
SECURITIES
REGISTERED PURSUANT TO SECTION 12(G) OF THE ACT: NONE
Indicate by check mark if the registrant is a well-known seasoned issuer, as defined in Rule 405
of the Securities Act. x Yes ¨ No
Indicate by check mark if the registrant is not required to file reports pursuant to Section 13 or Section 15(d) of the Act. ¨ Yes x
No
Indicate by check mark whether the registrant: (1) has filed all reports
required to be filed by Section 13 or 15(d) of the Securities Exchange Act of 1934 during the preceding 12 months (or for such shorter period that the registrant was required to file such reports), and (2) has been subject to such filing
requirements for the past 90 days. x Yes ¨ No
Indicate by check mark whether the registrant has submitted electronically and posted on its corporate Web site, if any, every Interactive Data File required to be
submitted and posted pursuant to Rule 405 of Regulation S-T during the preceding 12 months (or for such shorter period that the registrant was required to submit and post such files). ¨ Yes ¨
No
Indicate by check mark if disclosure of delinquent filers pursuant to
Item 405 of Regulation S-K is not contained herein and will not be contained, to the best of registrant’s knowledge, in definitive proxy or information statements incorporated by reference in Part III of Form 10-K or any amendment to this
Form 10-K. ¨
Indicate by check mark whether the registrant is a large accelerated filer, an accelerated filer, or a non-accelerated filer, or a smaller reporting company. See definition of “large accelerated filer,”
“accelerated filer” and “smaller reporting company” in Rule 12b-2 of the Exchange Act. (Check one):
x Large accelerated filer ¨ Accelerated filer ¨ Non-accelerated filer ¨
Smaller reporting company
(Do not check if smaller reporting company)
Indicate by check mark whether the registrant is a shell company (as defined in Exchange Act Rule 12b-2 of the Act). ¨ Yes x No
The aggregate market value of Common
Stock held by non-affiliates of the registrant, based upon the closing sale price of the registrant’s Common Stock on July 2, 2009, the last business day of its most recently completed second fiscal quarter, as reported on the New York
Stock Exchange, was approximately $2,985,884,480. Shares of Common Stock held by each executive officer and director and by each person known to beneficially own more than 5 percent of the outstanding Common Stock have been excluded in that such
persons may be deemed to be affiliates. This determination of affiliate status is not necessarily a conclusive determination for other purposes.
As of
February 23, 2010, 56,029,332 shares of the registrant’s Common Stock were outstanding.
DOCUMENTS INCORPORATED BY REFERENCE
|
|
|
| Document Definitive Proxy Statement for the 2010 Annual Meeting |
|
Incorporated into Form 10-K
Part III |
|
|
|
| MILLIPORE FORM 10-K 2009 |
|
1 |
Table
of Contents
|
|
|
| 2 |
|
MILLIPORE FORM 10-K 2009
|
PART I
|
|
|
| MILLIPORE IS A GLOBAL LEADER IN THE LIFE SCIENCE TOOLS MARKET. TOGETHER WITH OUR CUSTOMERS, WE HELP TO ADVANCE THE RESEARCH, DEVELOPMENT AND PRODUCTION OF DRUGS. |
|
|
|
|
|
| MILLIPORE FORM 10-K 2009 |
|
3 |
PART I
Summary
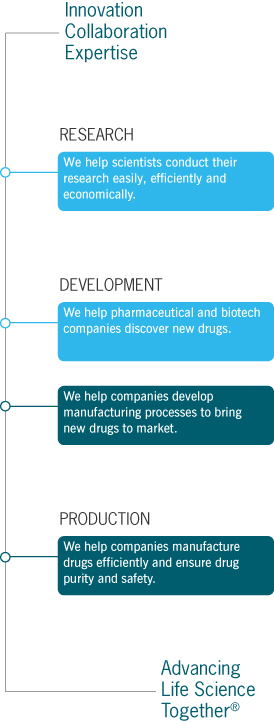
Millipore is a global leader in the life science tools market. Together with our customers, we help to advance the research, development, and production of drugs. Our innovative products and services are used to support life science
research, drug discovery, process development, drug manufacturing, and quality assurance. We help customers to improve laboratory productivity and workflows, prioritize potential drugs, optimize manufacturing productivity, and support commercial
scale manufacturing.
We manage our business globally and are organized in two operating divisions. Our Bioscience Division provides products and
technologies to support life science research and development activities. Our Bioprocess Division provides products and services to support pharmaceutical and biotechnology manufacturing.
The breadth of our product offering and our global scale make us a strategic supplier to the life science industry and provide us with access to many different segments of the market. Our products and services are
primarily used by a diverse, global customer base including biotechnology and
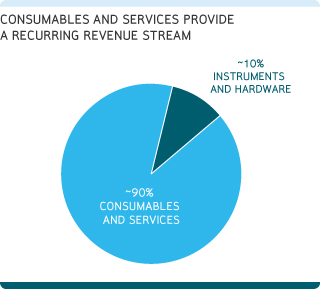
pharmaceutical companies, academic institutions and research laboratories. In addition, we derive most of our revenues from consumable products. These attributes allow us to target growth on a
number of dimensions and make our business less susceptible to economic downturns, which we experienced in 2009.
Our History
Millipore Corporation was formed as a Massachusetts corporation in 1954. During much of our history, we have developed and sold products based on our
proprietary filtration and other separations technologies to a variety of industries. In 2001, we made a strategic decision to focus primarily on the life science markets. Beginning in 2005, we began implementing a strategy that sharpened our focus
on the fast growing biopharmaceutical manufacturing and life science research markets. During this time, we have made acquisitions to transform Millipore into a larger and more innovative company. These acquisitions expanded the products and
services we offer and complemented our brand, sales force, and customer relationships.
|
|
|
| 4 |
|
MILLIPORE FORM 10-K 2009
|
PART I
Our Business
OVERVIEW
We compete in the life science tools market and focus on serving the needs of life science researchers and
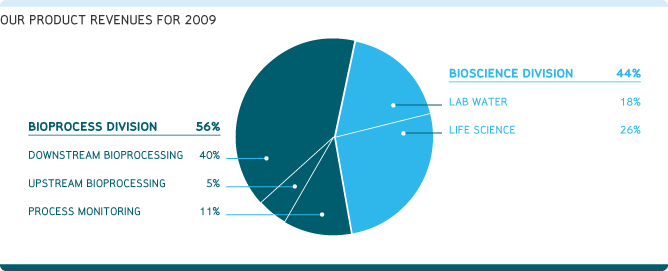
biopharmaceutical manufacturers. We are organized in two operating divisions: Bioscience and Bioprocess. Our Bioscience Division, which contributed approximately 44% of our 2009 revenues, improves laboratory productivity and work flows by providing
innovative products and technologies for life science research. Our Bioprocess Division, which contributed approximately 56% of our 2009 revenues, helps pharmaceutical and biotechnology companies develop their manufacturing processes, optimize their
manufacturing productivity, and ensure the quality of drugs.
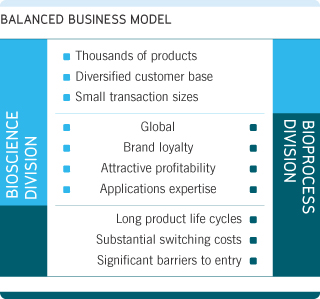
We believe both divisions have attractive business models and share a number of
characteristics in common, such as a premium brand, a global presence, a highly qualified sales force, and substantial technical expertise. They also possess a number of characteristics that are unique to the specific markets they serve, which we
list in the table on the right. The unique characteristics of our Bioprocess and Bioscience divisions provide us with a balanced and resilient business.
Our business is well-diversified across different life science end-markets, product lines and geographies. We sell
thousands of different products, and we are continually developing and/or acquiring new proprietary products and technologies to advance our businesses. Most of our products are consumables that are used, disposed, and replaced, such as reagent kits
or filtration cartridges.
|
|
|
| MILLIPORE FORM 10-K 2009 |
|
5 |
PART I

Because of the differing applications required by each of our target markets, we believe our business benefits from specialized
expertise and market focus. Accordingly, we have aligned our business to better address each of these markets. The following describes more specifically the principal markets in which we compete.

LABORATORY/LIFE SCIENCE RESEARCH MARKETS
Industry Background
As researchers seek to understand complex biological systems and identify and
characterize new therapeutic targets, the market demand for tools and services that improve productivity and efficiency in the laboratory has grown.
|
|
|
| 6 |
|
MILLIPORE FORM 10-K 2009
|
PART I
These researchers are conducting complex and expensive research to help them fundamentally understand the science of
biology — what occurs inside the human body. This research is required to feed the pipeline of biologics, cell-based vaccines, and other therapeutic and diagnostic products in development.
Researchers have come under increasing competitive and economic pressure to screen and identify new drugs with more speed and accuracy. In particular, the rapid growth
in the development of new biotechnology drugs has brought a heightened focus on protein research, including protein identification and characterization. Additionally, academic researchers are under pressure to increase the speed with which they
publish their research in scientific journals in order to compete for public and private funding of their research projects. Laboratory markets have also grown with the increase in concerns about new public health threats.
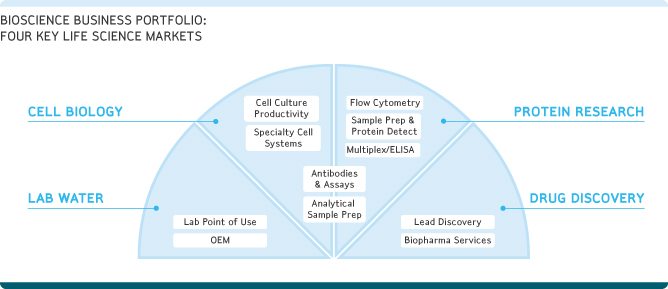
Our Bioscience Division focuses on four key life science markets: laboratory water, cell biology, protein research, and drug discovery. We target these markets because
we believe they are rapidly growing and we can provide competitively superior products, services, and work flow solutions.
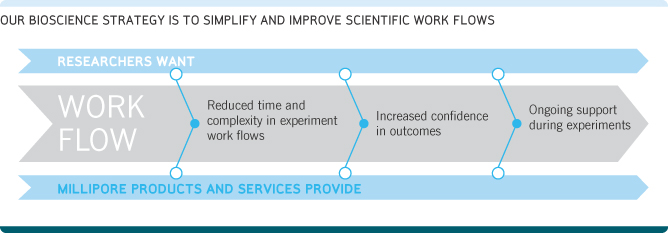
Researchers in these specific segments of the market want reduced complexity in their experimental work flows,
increased confidence in their scientific outcomes, and ongoing support during their experiments. Our Bioscience strategy is to create products and services that span the entire work flow by simplifying the work flow for researchers, offering
consolidated and validated solutions, and providing the necessary support along the way. Due to the complex nature of our four key markets and the diverse yet specialized needs of our customers, we offer products to advance life science research in
a wide variety of areas from neuroscience, infectious disease, oncology, and metabolic disorders to stem cells, cell signaling, nuclear function, and chromatin biology.
To address these markets, our Bioscience Division is organized as follows:
Life Science
26% of Company Revenues
We are focused on serving
the cell biology, protein research, and drug discovery markets with our life science product offerings. We sell thousands of products into these three markets, including instruments, consumable devices, reagents and services, to help customers
better understand diseases and biological functions.
|
|
|
| MILLIPORE FORM 10-K 2009 |
|
7 |
PART I
Their work typically involves conducting experiments on biological samples, such as cells, proteins, and nucleic
acids.
We also sell drug discovery products and services that help pharmaceutical and biotechnology companies discover, evaluate, and prioritize
potential drugs. Historically, we categorized drug discovery sales as a separate product application and reported that drug discovery revenues represented 5 percent of our total revenues in 2008. During 2009, we re-categorized our drug discovery
revenues into life science because of the synergy and customer overlap of our multiplex immunoassays with our existing life science product offerings in cell biology and protein research.
CELL BIOLOGY & PROTEIN RESEARCH
Most researchers follow a
work flow protocol that requires the use of a broad range of products, including consumable devices, reagents, kits, antibodies, and other molecular biology tools for purifying, preparing, or screening biological samples. We offer product and
service solutions designed around the entire protocol, so researchers can work faster, better, and easier than if they did not use our products and services. Many of our life science products span across both the protein research and cell biology
markets. These product categories are listed to the right.

|
Analytical Sample Preparation |
The
consistency and reproducibility of experimental results requires that samples used by researchers are pure and properly isolated. The varying physical and biochemical characteristics of biological samples make the processes of isolation extremely
complex. Research, clinical, and analytical laboratories use many sample preparation steps for a variety of laboratory procedures. Our filtration devices and specialty membranes are designed to accommodate the parameters of a wide variety of
experiments.
|
|
Antibodies & Reagents |
Our customized antibodies serve as biological markers that can be used to produce consistent and repeatable results, saving time, and reducing costs. Research scientists also outsource various services such as the development and production
of custom antibodies, which we provide. Life science researchers who study the structure and function of cells and proteins require innovative and high-quality biological reagents to conduct their experiments consistently. A reagent is a substance
used to detect, quantify, produce, modify or otherwise manipulate a biological target. Millipore offers a wide range of biological reagents. We also offer a wide variety of kits that improve research productivity and efficiency. Kits enhance
research productivity by combining in one box all the disposables, reagents, and protocols needed to reliably and reproducibly conduct a particular experiment.
|
|
|
| 8 |
|
MILLIPORE FORM 10-K 2009
|
PART I
Within the protein research market, we offer multiplex immunoassay and ELISA kits, protein detection products, and
flow cytometry instruments and kits. Researchers use our multiplex immunoassay kits to understand which proteins may be indicative of a disease state, measure how a drug affects protein biomarkers, and determine what side effects a drug creates. We
are a leader in developing multiplex kits, reagents, and assays for researchers studying immunology, inflammation, and metabolic diseases (diabetes, obesity, cardiovascular disorders).
We entered the flow cytometry market through our partnership and subsequent acquisition of Guava Technologies. Flow cytometry is a powerful research technique used by scientists to measure changes in protein
expression in individual cells. Today, many of these experiments are conducted in centralized, or core, laboratories. Millipore is integrating instrumentation, reagent kits, validated protocols, and technical support to bring the advantages of flow
cytometry to the bench tops of cell biologists. As a result, researchers who are growing or monitoring cells can benefit from this analytical platform by conducting cell analysis at the bench rather than running routine assays at a core laboratory.
Within the cell biology market, we offer products for cell culture productivity and specialty cell systems. These products include specialty cell lines,
such as stem cell lines that are used to study their role in disease. We also sell a variety of products that are used to prepare, grow, and genetically modify cells.
DRUG DISCOVERY SERVICES
A major challenge for our customers is to find promising drug candidates faster and then
ensure that they will not generate unwanted or unexpected side effects in clinical trials or when they are commercially on the market. To improve the efficiency and economy of this research, these customers outsource research work to Millipore
rather than conduct the work in-house. We provide services to identify disease targets and better understand how to improve the efficacy of drugs on targeted patient groups and prevent side effects.

Our services offering consists of lead optimization services to help pharmaceutical customers screen small molecule compounds against
drug targets of interest, particularly kinases, ion channels and G-Protein Coupling Receptors (“GPCR”), and biopharmaceutical services to help customers better understand the safety and efficacy of biologic drugs and vaccines.
As an increasing number of biologics enter the pipeline, companies are leveraging our expertise to help them evaluate the efficacy of biologics. We help our
customers by providing a broad range of services to assist with evaluating and advancing these therapeutics from the drug development pipeline to the market. This offering includes biomarker analytical services, assay transfer/development,
validation and sample analysis, pharmacokinetics,
toxicokinetics, immunogenicity, biological potency, and vaccine services.
Laboratory Water
18% of Company
Revenues
Most research starts with the use of purified water, which is a universal reagent in scientific experiments. Water purification systems are
present in nearly every laboratory. Daily demand for purified water can range from a few liters to several thousand liters. We offer a wide selection of sophisticated benchtop laboratory water instruments that ensure water purity for critical
laboratory analysis and clinical testing. These benchtop instruments provide the flexibility to produce the water quality needed for a variety of laboratory needs and applications.
|
|
|
| MILLIPORE FORM 10-K 2009 |
|
9 |
PART I
Water quality is a critical variable for researchers to control since contaminated water can adversely affect the
scientific outcome of a research project. The level of water purity needed depends on the complexity of the scientific experiment the researcher is conducting. More complicated experiments require extremely high levels of water purity. Millipore
offers a range of lab water instruments to meet the diverse water purification needs of our customers. These products remove micro-organisms, dissolved gasses, particulates, and organic and inorganic compounds from water.
Approximately 60 percent of our laboratory water revenues are derived from consumables and service, while approximately 40 percent is derived from lab water
instruments.

BIOPHARMACEUTICAL MANUFACTURING MARKETS
Industry Background
Our Bioprocess Division provides products, services, and integrated solutions to
help companies manufacture drugs efficiently and ensure drug purity and safety. Our products are primarily used in the production of biologic and synthetic drugs. Manufacturers of these products are under increasing competitive and economic pressure
to maintain safety and quality, shorten production times, and improve manufacturing productivity and yields.
Manufacturing of therapeutics generally
encompasses small molecule drugs and large molecule drugs. Small molecule therapeutics are primarily chemical compounds that are made through an organic or inorganic chemistry process. These are sometimes referred to as synthetic pharmaceuticals,
which are generally manufactured in bulk.

Large molecule therapeutics are primarily protein-based biologics, which are derived from living organisms, generated in a bioreactor
or fermentor. They include therapeutic products and vaccines based on recombinant proteins, such as monoclonal antibodies, and represent the fastest growing segment in the drug industry. About half of our Bioprocess business is related to the
production of biotechnology drugs.
In many instances, recombinant proteins replace or mimic naturally occurring human proteins and are produced by cells
containing modified DNA. One subset of recombinant protein-based drugs, monoclonal antibodies, has been shown to be extremely effective at treating otherwise intractable diseases such as cancer. This efficaciousness has led to a fast growing market
for monoclonal antibodies, which are difficult to produce and require a variety of complex technologies and processes to enable their development and production.
Industry sources predict that volumes of monoclonal antibodies and cell-based vaccines will continue to grow substantially over the next five years.
|
|
|
| 10 |
|
MILLIPORE FORM 10-K 2009
|
PART I

In addition, applications and approvals for biologic drug supplements, which address incremental indications for a
previously approved biologic, are also on the rise. In contrast, growth in sales of small molecule pharmaceuticals is expected to be lower because of intense generic competition as the patents expire on the chemical compounds comprising the drugs.
Synthetic pharmaceuticals, however, continue to constitute a significant percentage of all marketed therapeutic products and are manufactured in large volumes.
As the demand for marketed biologics and vaccines grows and new products and applications are approved, the market for products that facilitate and accelerate the identification, development, and production of biologics and cell-based
vaccines is expanding. Successfully bringing a biologic or a cell-based vaccine to the market is a complex and lengthy process. It begins with extensive laboratory research and discovery; continues with years of development, clinical trials and
scale-up of the manufacturing process; and culminates with satisfying regulatory requirements and commencement of commercial production.
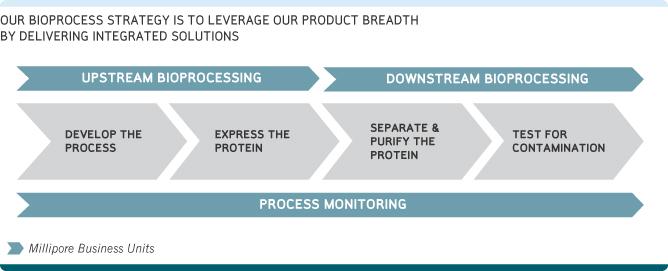
The value chain
of our Bioprocess customers includes:
|
|
Process development and scale up |
|
|
Upstream bioprocessing (the growth and expression of proteins in bioreactors) |
|
|
Downstream purification and filtration (the harvesting and refinement of therapeutic proteins) |
|
|
Monitoring and testing |
We believe we offer one of the
industry’s broadest product offerings for biopharmaceutical production. Additionally, we believe we are the only company to offer consumable products in both upstream and downstream bioprocessing. Our Bioprocess Division serves the breadth of
this development and production process by targeting the three principal applications described below. The development of a customer’s process involves aspects from each of these three product applications.
Upstream Bioprocessing
5% of Company
Revenues
Biologic products must be grown in living cells since they cannot be made chemically. We provide products and technologies that improve the
ability of cells to efficiently produce proteins that ultimately become therapeutic drugs and vaccines.
|
|
|
| MILLIPORE FORM 10-K 2009 |
|
11 |
PART I
The cells are grown in cell cultures held in large bioreactors or fermentation tanks of varying capacity. In order to
achieve high protein concentrations, cells in the bioreactor require nutrients and supplements. As the cells grow and metabolize, they secrete into the cell culture medium the therapeutic protein that is then harvested, purified, and further
processed.
To facilitate the manufacture of biologic drugs in mammalian cell cultures, we offer high-quality nutrients and supplements for these
cultures. Our products include the leading branded fatty acid supplements, recombinant insulin, bovine serum albumin, and other growth factors that improve the ability of cells to produce proteins efficiently. We also offer unique gene expression
technology which permits screening and isolation of highly productive cell lines much faster than conventional technologies. This technology enables our customers to more efficiently produce recombinant proteins in mammalian cells by generating
higher protein yields. Today, some of our upstream products are derived using materials from animals. Many customers are increasingly demanding products that do not use animal-derived products. We are actively expanding our portfolio of animal-free
cell culture supplements through our collaboration with Novozymes and have several animal free supplements currently on the market.
We also launched our first disposable bioreactor from our partnership with Applikon Biotechnology, the Mobius
CellReady™ 3L Bioreactor. Mobius CellReady™ can be used by customers during process development and eliminates the cleaning, sterilizing, and assembling required for traditional glass bioreactors. We believe that process development
represents an untapped market for the use of disposable technologies. In 2010, we expect to launch additional CellReady products, which will provide researchers with higher capacity bioreactors.
Downstream Bioprocessing
40% of
Company Revenues
FILTRATION & CHROMATOGRAPHY
The production of biologics requires the extraction of proteins from the fluids in which these proteins are grown. The process also requires the removal of impurities such as bacteria, viruses, cellular debris, and other contaminants.
Accordingly, manufacturing processes for biologics, particularly for monoclonal antibodies and vaccines, are separation-intensive, often requiring numerous filtration and chromatography steps for separation, clarification, concentration, and
sterilization.
|
|
|
| 12 |
|
MILLIPORE FORM 10-K 2009
|
PART I
A complex biologic, such as a monoclonal antibody, requires a significant number of steps to purify the drug, while a
typical synthetic drug requires far fewer purification steps.
We offer the broadest range of filtration, purification, and chromatography technologies
to clarify, concentrate and purify proteins, and remove viruses or other biological contaminants from biologics, vaccines, synthetic pharmaceuticals, and beverages. Approximately half of our business is related to biologic drug production, with the
remaining portion of our business primarily related to synthetic pharmaceutical manufacturing and beverage processing. Many of the same products used in the biotechnology industry are also used to remove contaminants in the production of
pharmaceuticals and beverages. We also sell membrane sheets and rolls and bulk chromatography media to original equipment manufacturers of medical devices, environmental testing equipment, or other products for use as a material or component in
these products.
DISPOSABLE MANUFACTURING
Until
recently, all biologic drugs were primarily produced with stainless steel equipment. This equipment includes large bioreactors, chromatography columns, and other systems used in the large-scale production of biologic drugs. The use of these
stainless steel systems requires a significant amount of cleaning and validation costs prior to running a manufacturing campaign.
Our strategic focus
has shifted away from selling and manufacturing stainless steel systems to selling and developing disposable manufacturing solutions. Although stainless steel systems are currently the prevalent processing tools, the industry has sought ways to
reduce the costs and delays associated with cleaning and sterilizing such equipment in between manufacturing runs. Contamination risks arise if the equipment is not thoroughly decontaminated of all residual materials from prior production runs.
Companies have begun to migrate to single use, disposable technologies that eliminate the need for cleaning and sterilization, thus shortening the time between processing runs.
Biopharmaceutical manufacturers are also seeking flexible manufacturing components and solutions that can be
configured and validated to meet customized biological manufacturing needs. Many of these companies have benefited from yield improvements in their processes and are seeking to manufacture drugs using smaller scale processes. This has been a
positive trend for our disposable manufacturing solutions as these products are better geared to smaller batch manufacturing than stainless steel equipment.
We are a leading innovator in the transition to disposable manufacturing, offering a broad range of integrated disposable manufacturing solutions. In the past few years, we have developed and/or acquired rights to products and technologies
that simplify and reduce the time and expense of steps in the downstream and final fill and finish processes of biotechnology and pharmaceutical drug production.
Process Monitoring
11% of Company Revenues
Regulatory agencies such as the U.S. Federal Drug Administration (FDA) require drug manufacturers to ensure the purity and sterility of products before they are
released to the public. This requires sampling and testing of therapeutics throughout the manufacturing process. During nearly all phases of drug development and production, companies take multiple steps to ensure their products are produced safely
and without contamination. Millipore provides a broad range of products and services that enable sampling and testing of drugs throughout the manufacturing process to ensure the safety and purity of drugs.
Companies that produce beverages (including wine, beer, and bottled juices and water) also benefit from using our process monitoring products to monitor for
microbiological contamination from bacteria and yeast.
Our process monitoring products are designed to test for microbiological, viral or other
contamination in biologics and synthetic pharmaceuticals as a quality control or assurance step in their manufacture or processing. We are also developing next-generation technologies that are faster and more sensitive so drug manufacturers can
identify
|
|
|
| MILLIPORE FORM 10-K 2009 |
|
13 |
PART I
contamination earlier in their processes. We currently offer and continue to develop new process monitoring tools capable of significantly reducing the time-to-result from days or weeks to hours.
We also offer outsourced testing for biological and viral contamination of biologics.
Our Customers
The majority of our revenues are related to customers engaged in life science research or biopharmaceutical production.
BIOSCIENCE CUSTOMERS
Our Bioscience Division serves
hundreds of thousands of customers engaged in life science research. They conduct academic research, drug discovery and laboratory analysis at universities, biotechnology firms, pharmaceutical companies, and other life science research laboratories
worldwide. As a result, we have a significant amount of customer diversification within the bioscience research markets.
While the overall bioscience
market is very broad, we do not seek to serve all segments of the market. We focus our
offering on specific market segments such as cell biology, protein research, and drug discovery, which have unique needs. Our laboratory water and some sample preparation products are sold into
many different types of research, analytical, and clinical laboratories worldwide and serve a more general, diverse customer base.
BIOPROCESS CUSTOMERS
Our Bioprocess Division primarily serves biotechnology and pharmaceutical companies that develop, manufacture, and
sell products for the diagnosis, prevention, and treatment of diseases.
These Bioprocess customers are engaged in the development, scale-up,
manufacturing, and testing of therapeutic, vaccine, and diagnostic products, as well as a variety of healthcare and other products.
We also sell
products to beverage companies to be used in their production process.
Although no single customer accounts for 10 percent or more of our sales, our
Bioprocess Division has significantly higher customer concentration than our Bioscience Division, particularly in the biotechnology market.

|
|
|
| 14 |
|
MILLIPORE FORM 10-K 2009
|
PART I
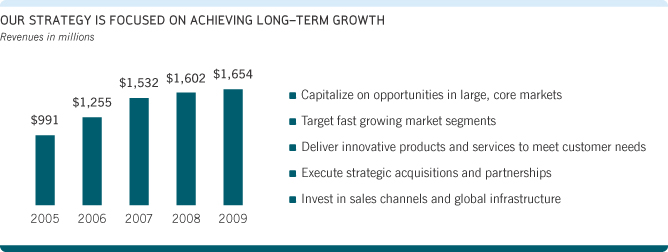
Our Strategy
Our strategy is to drive long-term growth in our business by:
|
|
Capitalizing on opportunities in large, core markets |
|
|
Targeting fast growing market segments |
|
|
Delivering innovative products and services to meet customer needs |
|
|
Executing strategic acquisitions and partnerships |
|
|
Investing in sales channels and global infrastructure |
We are
focused on expanding our leadership in attractive, growing, and important core product categories such as laboratory water, sample preparation, antibodies, filtration, and chromatography. We seek to leverage our industry leadership, global
footprint, applications expertise, and brand in these markets to deliver deep, innovative solutions that create superior performance and value for our customers.
We are also selectively focusing on the most attractive segments of the life science tools market where we can establish market leadership, generate the highest levels of growth, and drive competitive differentiation. Some of these fast
growing markets include disposable manufacturing, virus filtration, benchtop flow cytometry, stem cell research, multiplex immunoassays, and biopharmaceutical services. From a
geographic perspective, we are focusing on expanding our presence in Brazil, Russia, China, India, and Singapore because of the substantial growth of life science research and biopharmaceutical
production in these countries. By selectively pursuing high growth markets, we expect that we will be able to grow our revenues and profitability.
Our
ability to anticipate customer needs and deliver high-value differentiated products is a critical part of our strategy. We believe our markets are driven by innovation. A central part of our strategy is to develop new products and services that
address unmet customer needs in large markets. Our depth of customer relationships and applications expertise allows us to identify, understand, and address these needs. We are also focused on increasing our growth opportunities by executing
strategic acquisitions and partnerships. We can enhance our product portfolio and enter new markets by acquiring key technologies and partnering with leading companies in targeted areas. Finally, we are investing in our sales channels and global
infrastructure to support future growth. For example, we have opened new, state-of-the-art customer training and scale-up facilities in Singapore and in Billerica, Massachusetts; we have invested in our e-business platform; and we have expanded our
sales and marketing capabilities to drive growth in the future.
|
|
|
| MILLIPORE FORM 10-K 2009 |
|
15 |
PART I
Selected 2009 Milestones
STRATEGIC TRANSACTIONS
In 2009, we completed four strategic transactions, which we show in the chart
on the right:
|
|
Acquired Guava Technologies – Q1 2009 |
|
|
Acquired EpiTag™ technology from Epitome Biosystems – Q1 2009 |
|
|
Acquired BioAnaLab Limited – Q3 2009 |
|
|
Purchased remaining 60% ownership of our joint venture in India – Q4 2009 |
SUSTAINABILITY
We are committed to sustainable growth. In our view, sustainability means being able
to operate efficiently and productively while minimizing the impact of our operations and products on the environment. Accordingly, we formally announced in 2008 an ambitious multi-year environmental effort to reduce the environmental impacts of our
processes, products and facilities. Central to this initiative is our goal to reduce our global carbon footprint by 20 percent from 2006 to 2011. Our initiative encompasses a wide range of programs focused on dramatically reducing our consumption of
non-renewable resources, eliminating waste, and adopting other changes that support long-term environmental sustainability.
A key part of our strategy
to meet our carbon reduction goal is the implementation of a comprehensive energy management program that includes a combination of energy efficiency and renewable energy projects. We are also active in numerous organizations with similar goals.
The following are some of the milestones we achieved in 2009 in pursuit of this goal.
|
|
Completed a 310 Kilowatt onsite solar system installation at two of our Massachusetts facilities |
|
|
Completed our first comprehensive annual sustainability report |
|
|
Named “Corporate Citizen of the Year” by the New England Clean Energy Council |

|
|
Reduced our carbon emissions 14 percent below our 2006 baseline, mostly since May 2008 |
|
|
Reduced our use of electricity by 4.3 million kilowatt- hours through efficiency programs |
|
|
Joined the U.S. Environmental Protection Agency’s Green Power Partnership as part of its commitment to use power generated from environmentally preferable renewable
resources. |
We intend to continue our leadership in corporate environmental responsibility which we believe will benefit both the
environment and our business.
|
|
|
| 16 |
|
MILLIPORE FORM 10-K 2009
|
PART I
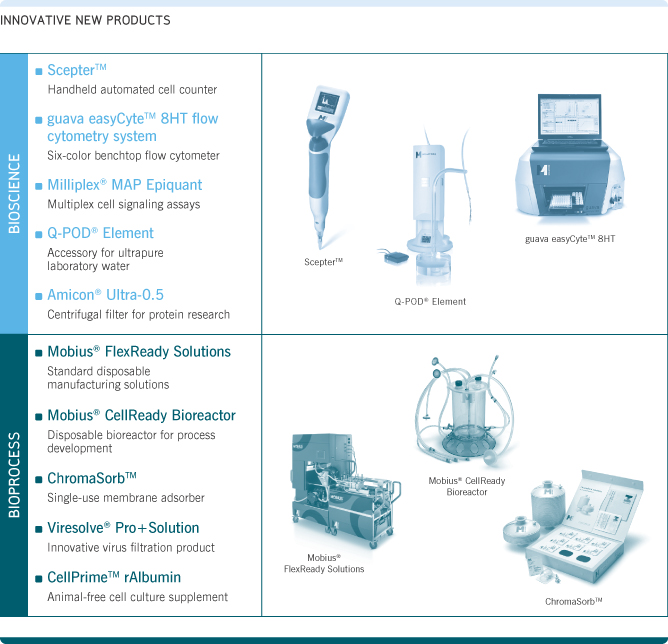
NEW PRODUCTS
In 2009, we introduced many
new innovative products resulting from our own internal development as well as through collaborations with companies such as Novozymes and Applikon Biotechnology. We believe our business is
driven by innovation and our ability to successfully launch new products through internal development, acquisitions, and collaborations is critical to our future success. We list some of the
products that we launched or introduced in the table below:
|
|
|
| MILLIPORE FORM 10-K 2009 |
|
17 |
PART I
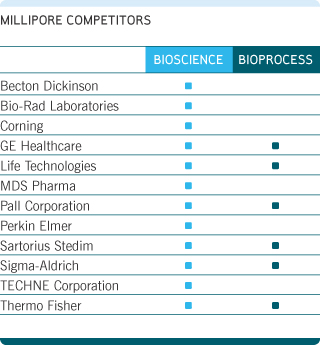
Competition
The markets for our products and services are intensely competitive and we compete with a variety of public and private companies. Given the breadth of our product and service offerings, our competition comes from a wide array of
competitors, ranging from specialized companies with strengths in niche segments of the life science markets to large manufacturers offering a broad portfolio of products, tools, and services. Many of these competitors have significant financial,
operational, sales, and marketing resources, and experience in research and development. In some cases, these and other competitors are also our customers, distributors, and suppliers, and in some circumstances we serve these roles for such
competitors as well.
We believe that a company’s competitive position in any of our markets is determined by a varying mix of product availability
and performance, quality, responsiveness, technical support, price, and breadth of product lines. Our customers are diverse and we believe they place varying degrees of importance on these competitive attributes.
We believe that we differentiate from our competitors by offering more innovative products, better technical support,
and higher levels of product quality. Our global presence, the strength of our brand, and our global sales and marketing capabilities also help us to win business over competitors.
Sales, Marketing, and Customer Support
Our direct sales organization is a critical competitive
differentiator for us. An important component of our strategy is to leverage our direct sales organization by expanding our product portfolio available for sale and increasing our penetration of our current customer base.
We sell our products to end users worldwide, primarily through our own direct global sales force. Augmenting our direct sales, we also sell our products through our
website and, in selected locations and markets, through independent distributors.
We market to our customers through advertising, trade shows,
conferences, and other techniques. Our marketing efforts focus on application development for existing products and on new and differentiated products for newly identified and proposed customer needs. We seek to educate customers about the variety
of problems that may be addressed by our products as well as to adapt our products and technologies to the problems identified by our customers. Our technical support services are important to our marketing efforts. These services include assisting
in defining a customer’s needs, evaluating alternative solutions, selecting or designing a specific system to perform the desired application, training users, and assisting the customer in compliance with relevant government regulations.
|
|
|
| 18 |
|
MILLIPORE FORM 10-K 2009
|
PART I
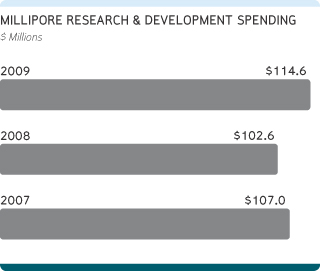
Research and Development
We believe that a strong research and product development effort is important to our future growth. We have added important scale and capabilities to our R&D organization over the past three years.
Our research and development activities are intended both to improve on our extensive core technologies and to create new applications and breakthroughs that
complement our business. Our core technologies include:
|
|
Assay development |
|
|
Separation and purification membranes |
|
|
Chromatography media |
|
|
Customized monoclonal antibodies |
|
|
Cell culture supplements |
|
|
Cell lines |
|
|
Immunodetection |
|
|
Disposable manufacturing |
|
|
Sterile sampling |
|
|
Sample preparation |
Some of these technologies are incorporated into
devices, cartridges, and modules of different configurations that span many of our markets while others are focused on a specific or customized application.

We conduct most of our own research and development. We have followed a practice of supplementing our internal research and
development efforts by acquiring or licensing new technologies from unaffiliated third parties, acquiring distribution rights for new technologies, and undertaking collaborative or sponsored research and development activities with unaffiliated
companies and academic or research institutions when we believe it is in our interests to do so. Additionally, we have greatly expanded our product development capabilities through acquisitions to include antibodies, enzymes, labeling and detection
reagents, molecular biology kits, multiplexed immunoassays, cell based assays, and drug profiling services.
For example, we purchased the EpiTag™
technology of Epitome Biosystems to expand our presence in the multiplex immunoassay market and to enable our future development of other novel profiling technologies. Our purchase of Guava Technologies provided a platform for benchtop flow
cytometry upon which we have developed an enhanced instrument and suite of customized reagents. We also completed 11 technology agreements in 2009. These agreements help us to bring new products to the market by enabling us to combine our device and
applications expertise with valuable technologies from third parties.
We continue to work closely with existing partners such as Novozymes, Applikon
Biotechnology, and Dow Chemical to bring new products to the markets.
|
|
|
| MILLIPORE FORM 10-K 2009 |
|
19 |
PART I
Global Operations
Supply
Chain—Manufacturing and Sourcing
We manufacture the majority of our products in our own manufacturing facilities, primarily at
those properties described and listed under Item 2 of this Form 10-K, although we have begun to outsource the manufacturing of select products to more cost competitive locations, primarily in China. Our global supply chain initiative, which
began in 2004, has resulted in a new manufacturing landscape through the consolidation of our sites, the implementation of new raw material procurement practices by consolidating our supplier base, and streamlining manufacturing processes through
improvements using Lean Six Sigma® methodologies. In September 2008, we announced the second phase of our global supply
chain program, which will result in the closure of five additional facilities and reduction of our customer service and distribution costs. We expect to complete this second phase by the end of 2010.
Environmental Health and Safety
We maintain an active
environmental, health and safety group charged with ensuring that our facilities and operations are safe and compliant with applicable laws. We promote a culture of safety and environmental responsibility throughout the company. This group also
administers our sustainability initiatives described under Selected 2009 Milestones.
Quality Assurance and Regulatory Compliance
To compete effectively in our markets, we maintain a global quality assurance system and program designed to assure compliance with the stringent
requirements of regulatory authorities, voluntary quality standards, industry trade associations, and our customers. Using our quality assurance compliance programs, we conduct periodic audits of each of our facilities. The audits, in combination
with performance metrics, are designed to ensure
adherence to regulations and our procedures and to assess the effectiveness of our quality system as a whole. The audits are one component of the key performance indicators that we collect,
review, and monitor to maintain our program of continuous improvement and compliance with our established systems and programs.
Most of our operating
facilities are registered to ISO 9001:2000 quality standards. The ISO 9001:2000 series of standards is a voluntary quality standard recognized throughout the world.
Our Employees
As of December 31, 2009, Millipore employed approximately 6,100 people worldwide,
of whom approximately 2,600 were employed in the United States.
Patents, Trademarks and Licenses
We obtain technology licenses to improve our ability to launch new products and to gain the right to re-sell certain products. We have been granted and have licensed
rights under a number of patents and have other patent applications pending both in the United States and abroad. While these patents and licenses in the aggregate are viewed as valuable assets, we believe that no individual patent is material to
our ongoing operations. We also own a number of trademarks, the most significant being “Millipore.”
Many of our research reagent products are
sold under licenses that have varying terms and conditions. We expect to continue to license new technologies from academic and government institutions, as well as biotechnology and pharmaceutical companies. We use licensed technologies to create
new products, including high-value kits and services, many of which address bottlenecks in research laboratories. No single license is material to our business.
|
|
|
| 20 |
|
MILLIPORE FORM 10-K 2009
|
PART I
Government and Industry Regulation
Many of our activities are subject to regulation by governmental authorities within the United States and similar bodies outside of the United States. The regulatory authorities may govern the collection, testing,
manufacturing, safety, efficacy, labeling, storage, record keeping, transportation, approval, advertising, and promotion of our products, as well as the training of our employees. Some of our products are subject to import and export regulations
specific to the country of import. Certain of our products are considered “medical devices” under the Food, Drug and Cosmetic Act. Accordingly, these products are subject to the law’s general control provisions that include
requirements for registration, listing of devices, quality regulations, labeling, and prohibitions against misbranding and adulteration. These products subject us to regulatory inspection and scrutiny. We believe that we are in substantial
compliance with all relevant laws and regulations.
Environmental Matters
We are subject to numerous federal, state, and foreign laws and regulations that impose strict requirements for the control and abatement of air, water, and soil pollutants and the manufacturing, storage, handling,
and disposal of hazardous substances and waste. We believe we are in substantial compliance with all applicable environmental requirements. We continue to invest in maintaining facilities that enable our compliance with these environmental laws.
These environmental related expenditures have not had a material effect on our financial results. Because regulatory standards under environmental laws and regulations have become increasingly stringent, there can be no assurance that future
developments will not cause us to incur material environmental liabilities or costs. See the applicable risk factor under Item 1A of this Form 10-K.
Raw Materials
Our products are made from a wide variety of raw materials that are generally available from alternate sources of supply. For certain critical raw materials, we have qualified only a single source. We periodically purchase quantities of
some of these critical raw materials in excess of current requirements in anticipation of future manufacturing needs. With sufficient lead time, we believe we would be able to validate alternate suppliers for each of these raw materials. As
described in the applicable risk factor under Item 1A of this Form 10-K, several of these critical raw materials are used in a significant portion of our products, and if we were unable to obtain supply of any one of them, our loss of revenues
would be material.
Seasonality
In
general, we do not believe our business is inherently seasonal.
Backlog
We do not have a material amount of firm commitments that serve as backlog orders.
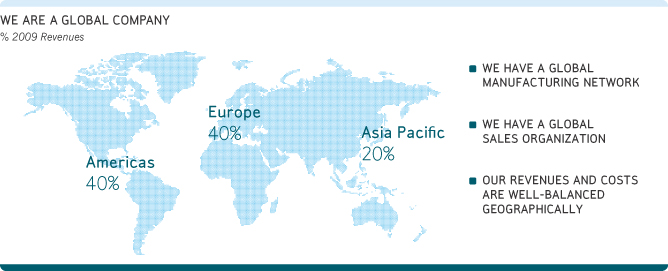
Geographic and
Segment Information
We are a multinational company with approximately 66 percent of our 2009 sales outside the United States and approximately 51
percent of our long-lived assets outside the United States at December 31, 2009. Geographic and segment information, including the identification of operating segments and their aggregation, is discussed in Note 18 to our consolidated financial
statements.
|
|
|
| MILLIPORE FORM 10-K 2009 |
|
21 |
PART I
Other Information
Millipore’s
corporate headquarters are at 290 Concord Road, Billerica, Massachusetts, and our telephone number at that location is 1-978-715-4321.
The U.S.
Securities and Exchange Commission (the “SEC”) maintains an internet website at http://www.sec.gov that contains our annual reports on Form 10-K, quarterly reports on Form 10-Q, current reports on Form 8-K and proxy statements, and all
amendments thereto. All reports that we file with the SEC may be read and copied at the SEC’s Public Reference Room at 100 F Street, N.E., Washington, DC 20549. Information about the operation of the Public Reference Room can be obtained by
calling the SEC at 1-800-SEC-0330.
Millipore’s internet website address is www.millipore.com. Our annual reports on Form 10-K, quarterly reports on
Form 10-Q, current reports on Form 8-K and proxy statements, and all amendments thereto, are available free of
charge on our website as soon as reasonably practicable after such reports are electronically filed with, or furnished to, the SEC. In addition, our corporate governance guidelines, the charters
of each of the committees of our Board of Directors, our code of ethics (consisting of our Corporate Compliance Policy, our Employee Code of Conduct and our Rules of Conduct) and our Director Code of Conduct are available on our website and are
available in print to any Millipore shareholder upon request in writing to “General Counsel, Millipore Corporation, 290 Concord Road, Billerica, MA 01821”.
The certifications of Millipore’s Chief Executive Officer and Chief Financial Officer, as required by the rules adopted pursuant to Section 302 of the Sarbanes-Oxley Act of 2002, are filed as exhibits to
this Form 10-K. Millipore’s Chief Executive Officer, Martin D. Madaus, provided an annual certification to the New York Stock Exchange dated June 8, 2009, that he was not aware of any violations by the Company of the New York Stock
Exchange corporate governance listing standards.
|
|
|
| 22 |
|
MILLIPORE FORM 10-K 2009
|
PART I
Lack of early success with our pharmaceutical and biotechnology customers can shut us out of future business with those customers.
Many of the products we sell to the pharmaceutical and biotechnology customers are incorporated into our customers’ drug manufacturing processes.
In some cases, once a customer chooses a particular product for use in a drug manufacturing process, it is unlikely that the customer will later switch to a competing alternative. In many cases, the regulatory license for the product will specify
the separation and cell culture supplement products qualified for use in the process. Obtaining the regulatory approvals needed for a change in the manufacturing process is time consuming, expensive, and uncertain. Accordingly, if we fail to
convince a pharmaceutical or biotechnology customer to choose our products early in its manufacturing design phase, we may lose permanently the opportunity to participate in the customer’s production of such product. Because we face vigorous
competition in this market from companies with substantial financial and technical resources, we run the risk that our competitors will win significant early business with a customer making it difficult for us to recover that opportunity.
The suspension or termination of production of a customer’s therapeutic product may result in the abrupt suspension or termination
of their purchases of our products, resulting in an unexpected reduction in our revenue.
Success in our Bioprocess Division substantially depends on the
incorporation of our products into a customer’s manufacturing process. If this “design in” is achieved, we will likely have the opportunity to sell consumable products to the customer during the life cycle of the customer’s
product, which could continue for many years. Our planning and growth projections are built in part on the volume assumptions deriving from these customer successes. If a customer stops production of its product, either temporarily or permanently,
our sales to the customer for the applicable product will drop or stop.
A customer may suspend or terminate production of a product, either voluntarily or involuntarily, and related sales and distribution for many reasons. These may include adverse regulatory,
competitive, legal or economic circumstances. We have had in the past, and expect to have in the future, situations in which a customer suspends its purchases of our products. A suspension or permanent cessation of a process in which we would
otherwise anticipate selling a significant volume of consumables will reduce our revenues and negatively impact our earnings.
Disruptions in the supply of raw materials and distributed products from our single source suppliers could result in a significant disruption in sales and profitability.
Our products are made from a wide variety of raw materials that are generally available from alternate sources of supply. However, certain critical raw materials and supplies required for the production of some of
our principal products are available only from a single supplier, as are some products that we distribute. Such raw materials and distributed products cannot be obtained from other sources without significant delay or at all. If such suppliers were
to limit or terminate production or otherwise fail to supply these materials for any reason, such failures could have a material adverse impact on our product sales and our business.
If our efforts to integrate acquired or licensed businesses or technologies into our business are not successful, our business could be harmed.
As part of our business strategy, we have grown our business through acquisitions of technologies or of companies that offer products, services and technologies that
we believe complement our products, technologies, and services. We expect to continue to grow our business through additional acquisitions if appropriate opportunities arise.
|
|
|
| MILLIPORE FORM 10-K 2009 |
|
23 |
PART I
Managing these recent acquisitions and any future acquisitions will entail numerous operational, legal, and financial risks, including:
| n
|
|
difficulties in assimilating new technologies, operations, sites, and personnel |
| n
|
|
inability to achieve anticipated revenue and cost synergies and other financial objectives |
| n
|
|
diversion of resources and management attention from our existing businesses and technologies |
| n
|
|
inability to maintain uniform quality standards, controls, and procedures |
| n
|
|
inability to retain key employees of any acquired businesses or hire enough qualified personnel to staff any new or expanded operations
|
| n
|
|
impairment or loss of relationships with key customers and suppliers of acquired businesses |
| n
|
|
issuance of dilutive equity securities |
| n
|
|
incurrence or assumption of debt |
| n
|
|
exposure to unknown or unanticipated liabilities |
| n
|
|
additional expenses associated with future amortization or impairment of acquired intangible assets |
| n
|
|
exposure to federal, state, local and foreign tax liabilities in connection with any acquisition or the integration of any acquired businesses
|
If our consolidated manufacturing operations were disrupted, we may be unable to supply products to our customers and
achieve expected revenues.
In an effort to better serve our customers and to attain efficiencies of scale and expertise, we have consolidated the
majority of our production facilities into fewer sites. Each of these remaining facilities serves as our primary production facility for specific product lines. This concentration of production, however, exposes us to a greater risk of disruption to
our ability to manufacture and supply our products. If operation at any of these facilities were disrupted, we may not be able to deliver products to our customers and achieve expected revenues or earnings. If we were unable to reestablish
production in a timely manner, we may lose customers and have difficulty regaining them.
It is uncertain whether the safety measures and contingency plans that we have implemented or may implement will successfully address the risks that may arise if production is disrupted. Also,
there can be no assurance that the insurance that we maintain to protect against business interruption loss will be adequate or that such insurance will continue to remain available on acceptable terms, if at all. The extent of the coverage of our
insurance could limit our ability to mitigate for lost sales and could result in such losses materially and adversely affecting our operating results.
If we fail to maintain adequate quality standards for our products and services, our business may be adversely affected and our reputation harmed.
Our customers are subject to rigorous quality standards in order to maintain their products and the manufacturing processes and testing methods that generate them. A failure to sustain the specified quality
requirements, including the processing and testing functions performed by our products, could result in the loss of the applicable regulatory license. Delays or quality lapses in our customer’s production line could result in substantial
economic losses to them and to us. For example, large production lots of biotherapeutics are very delicate and expensive and a failure of a separation membrane could result in the contamination of the entire lot, requiring its destruction. We also
perform services that may be considered an extension of our customers’ manufacturing and quality assurance processes, which also require the maintenance of prescribed levels of quality. Although we believe that our continued focus on quality
throughout the company adequately addresses these risks, there can be no assurance that we will not experience occasional or systemic quality lapses in our manufacturing and service operations. If we experience significant or prolonged quality
problems, our business and reputation may be harmed, which may result in the loss of customers, our inability to participate in future customer product opportunities, and reduced revenues and earnings.
|
|
|
| 24 |
|
MILLIPORE FORM 10-K 2009
|
PART I
Reduction in our customers’ research and development budgets and government funding may result
in reduced sales.
Our customers include researchers at pharmaceutical and biotechnology companies, academic institutions, and government and private
laboratories throughout the world. Their research and development budgets and activities have a large effect on the demand for our products and services. Fluctuations in our customers’ research and development budgets occur due to changes in
available resources, mergers of pharmaceutical and biotechnology companies, spending priorities and institutional budgetary policies. Our Bioscience business could be adversely impacted by any significant decrease in life science research and
development expenditures by pharmaceutical and biotechnology companies, academic institutions or government and private laboratories. In addition, short term changes in administrative, regulatory or purchasing-related procedures can create
uncertainties or other impediments which can contribute to lower sales.
A portion of our Bioscience sales have been to researchers, universities,
government laboratories, and private foundations whose funding may be dependent in part upon grants from government agencies such as the U.S. National Institute of Health (“NIH”) and similar domestic and international agencies. NIH funds
are subject to reallocation, reduction or discontinuation, which could impact research projects using our products. Government funding of research and development is subject to the political process, which is inherently fluid and unpredictable. Our
revenues may be adversely affected if our customers delay purchases as a result of uncertainties surrounding the approval of government or industrial budget proposals. If researchers were not able to obtain, for any extended period, government
funding necessary to purchase our products or if there is a decrease in overall research funding, it could reduce our Bioscience sales and damage our business.
We may be unable to establish and to maintain collaborative development and marketing relationships
with business partners, which could result in a decline in revenues or slower than anticipated growth rates.
As a part of our business strategy, we have
formed, and intend to continue to form, strategic alliances, license agreements and marketing and distribution arrangements with corporate partners relating to the development, commercialization, marketing and distribution of certain of our existing
and potential products to increase our revenues and to leverage our product and service offerings. Our success will depend, in part, on our ability to maintain these relationships and to cultivate additional corporate alliances with such companies.
We cannot ensure that our historical collaborative relationships will be commercially successful or yield the desired results, that we will be able to
negotiate additional collaborative relationships, that such additional collaborative relationships will be available to us on acceptable terms, or that any such relationships, if established, will be commercially successful. In addition, we cannot
ensure that parties with which we have established, or will establish, collaborative relationships will not, either directly or in collaboration with others, pursue alternative technologies or develop alternative products in addition to, or instead
of, our products. Such parties may also be acquired by our competitors to terminate our relationship. They may also experience financial or other difficulties that lessen their value to us and to our customers. Our results of operations and
opportunities for growth may be adversely affected by our failure to establish and maintain successful collaborative relationships.
|
|
|
| MILLIPORE FORM 10-K 2009 |
|
25 |
PART I
Demand for our Bioprocess products and services are subject to the commercial success of our customers’ products and our
customers’ purchasing patterns, which may vary for reasons outside our control.
Even if we are successful in securing participation for our
products in a customer’s manufacturing process, sales of many of our Bioprocess products and services remain dependent on the timing and volume of the customer’s production or purchasing patterns, over which we have no control. The
customer’s demand for our products will depend on the regulatory approval and commercial success of the supported product, as well as the customer’s manufacturing schedules and related purchasing power. The regulatory process is complex,
lengthy and expensive and can often take years to complete, if at all. Commercial success of a customer’s product, which would drive demand in production and commensurate demand for our products and services, is dependent on many factors, some
of which can change rapidly, despite early positive indications. Any delay or cancellation by a customer of volume manufacturing may harm our revenues and earnings.
If we experience a significant disruption in our information technology systems or if we fail to implement new systems and software successfully, our business could be adversely affected.
We rely on one centralized information system throughout our company to keep financial records, process orders, manage inventory, process shipments to
customers, and operate other critical functions. If we were to experience a prolonged system disruption in the information technology systems that involve our interactions with customers and suppliers, it could result in the loss of sales and
customers, which could adversely affect our business. In addition, in order to maximize our information technology efficiency, we have physically consolidated our primary corporate data and computer operations into two geographically proximate
facilities. This concentration, however, exposes us to a greater risk of disruption to our internal information
technology systems. If operations at either or both of these centers were disrupted, it would likely cause a material disruption in our business.
Technology innovations in the markets that we serve may create alternatives to our products and result in reduced sales.
Our customers constantly attempt to reduce their manufacturing costs and to improve product quality. Technology innovations to which our current and potential
customers would have access could reduce or eliminate their need for our membrane or chromatography products. For example, if a new membrane or chromatography technology of one of our competitors is accepted by the pharmaceutical or biotechnology
industry as a market standard, sales of our membrane or chromatography products would be negatively impacted. In addition, a disruptive technology that reduces or eliminates the use of our core technologies would negatively impact the sale of our
products. As an example, animal–free serum products are generally favored over bovine serum. We may be unable to respond on a timely basis to the changing needs of our customer base and the new technologies we design for our customers may prove
to be ineffective. Our failure to develop and to introduce or to enhance products able to compete with such new technologies in a timely manner could have a material adverse effect on our business, results of operations, and financial condition. We
may be unable to respond on a timely basis to the changing needs of our customer base and the new technologies we design for our customers may prove to be ineffective.
We may be unable to realize our growth strategy if we cannot identify suitable acquisition opportunities in the future.
As part of our business strategy, we expect to continue to grow our business through acquisitions of technologies or companies. We may not identify or complete complementary acquisitions in a timely manner, on a
cost-effective basis, or at all.
|
|
|
| 26 |
|
MILLIPORE FORM 10-K 2009
|
PART I
In addition, we compete with other companies, including large, well funded competitors, to acquire suitable targets, and may not be able to acquire certain targets that we seek. There can be no
assurance that we will be able to execute this component of our growth strategy, which may harm our business and hinder our future growth.
To achieve
desired growth rates as we become larger, we may seek larger or public companies as potential acquisition candidates. The acquisition of a public company may involve additional risks, including the potential for lack of recourse against public
shareholders for undisclosed material liabilities of the acquired business.
Our continued growth is dependent on our development and
successful commercialization of new products.
Our future success will depend in part on timely development and introduction of new products that address
changing market requirements. We believe that successful new product introductions provide a significant competitive advantage because customers make an investment of time in selecting and learning to use a new product. Customers are reluctant to
switch to a competing product after making their initial selection. To the extent that we fail to introduce new and innovative products, we may lose market share to our competitors, which will be difficult or impossible to regain. An inability, for
technological or other reasons, to successfully develop and introduce new products could reduce our growth rate or otherwise damage our business. In the past, we have experienced, and are likely to experience in the future, delays in the development
and introduction of products. We cannot assure that we will keep pace with the rapid rate of change in life science research, or that our new products will adequately meet the requirements of the marketplace or achieve market acceptance.
If we fail to attract, hire, develop and retain qualified personnel, we may not be able to design,
manufacture, market or sell our products or successfully grow our business.
As part of our global supply chain initiative to improve customer service
and to amplify our product expertise, we have concentrated our facilities in fewer geographical areas in which there is high demand for qualified staff. Competition for individuals with skills including sales, marketing, research, product
development, engineering and others is strong and we may not be able to secure the personnel we need. The loss of the services of any key personnel, or our inability to hire new personnel with the requisite skills, could restrict our ability to
develop new products and services or enhance existing products and services in a timely manner, sell products to our customers, or manage our business effectively.
Our level of indebtedness may harm our business and prevent our achievement of anticipated growth.
As
of December 31, 2009, our total long term debt was $890.2 million. Our level of indebtedness could have important consequences because:
| n
|
|
a substantial portion of our cash flows from operations will be dedicated to interest and principal payments and may not be available for operations, working
capital, capital expenditures, expansion, acquisitions or general corporate or other purposes; |
| n
|
|
it may impair our ability to obtain additional or replacement financing in the future; |
| n
|
|
it may limit our flexibility in planning for, or reacting to, changes in our business and industry; and |
| n
|
|
it may make us more vulnerable to downturns in our business, our industry or the economy in general. |
Our operations may not generate sufficient cash to enable us to service our debt. If we fail to make a payment on any of our debt obligations or comply with financial
covenants in our debt agreements, we could be in default on such debts, and this default could cause us to be in default on our other outstanding indebtedness.
|
|
|
| MILLIPORE FORM 10-K 2009 |
|
27 |
PART I
In each case of default, we may be required to repay all of our outstanding indebtedness or renegotiate the terms of our indebtedness on unfavorable terms.
Sales of several of our products are dependent on a small number of customers, the loss of which may harm our business and result in a reduction in
revenues and earnings.
No single customer represents more than 10 percent of our annual sales. However, sales of some of our products are dependent on a
limited number of customers, who account for a significant portion of such sales. Continuing consolidation in the biopharmaceutical industry will likely concentrate our customer base further. Some of these products are in areas in which we plan to
grow substantially. The loss of such key customers for such products, or a significant reduction in sales to those customers, could significantly reduce our revenues in these products and adversely affect our future growth in such markets.
We may become involved in disputes regarding our patents and other intellectual property rights, which could result in prohibition on
the use of certain technology in current or planned products, exposure of the business to significant liability and diversion of management’s focus.
We and our major competitors spend substantial time and resources developing and patenting new and improved products and technologies. Many of our products are based on complex, rapidly developing technologies. Although we try to identify
all relevant third party patents and intellectual property rights, these products could be developed by the business without knowledge of published or unpublished patent applications that cover or use some aspect of these technologies. We also
license products and technologies developed by other biotechnology companies or academic research laboratories for further resale. We have been and may in the future be sued by third parties alleging that we are infringing their intellectual
property rights. These lawsuits are expensive, take significant time, and divert management’s focus from other business concerns.
If we are found to be infringing the intellectual property of others, we could be required to stop the infringing activity, or we may be required to design around or license the intellectual
property in question. If we are unable to obtain a required license on acceptable terms, or are unable to design around any third party patent, we may be unable to sell some of our products and services, which could result in reduced revenue. In
addition, if we do not prevail, a court may find damages or award other remedies in favor of the opposing party in any of these suits, which may adversely affect our earnings.
Concerns about products that are derived from animal materials, such as bovine serum, will further reduce the demand for our animal-based cell culture products.
The demand for several of our cell culture products will continue to decline due to concerns about the use of animal-based materials in the process by which they are
manufactured. The concern arises from the risk that animal contaminants might be present in the raw materials used in the production process and that such contaminants might be introduced into a therapeutic substance manufactured by one of our
customers. For example, the regulatory authorities of certain countries, including Japan, have refused to approve pharmaceuticals that are manufactured using a product that was derived from bovine serum or that was manufactured by a process that
uses bovine material. The regulatory authorities of other countries could adopt similar restrictions.
Our operations must comply with
environmental statutes and regulations, and any failure to comply could result in extensive costs which would harm our business.
The manufacture of some
of our products involves the use, transportation, storage and disposal of hazardous, radioactive or toxic materials and is subject to various environmental protection and occupational health and safety laws and regulations in the countries in which
we operate.
|
|
|
| 28 |
|
MILLIPORE FORM 10-K 2009
|
PART I
This has exposed us in the past, and could expose us in the future, to risks of accidental contamination and events of non-compliance with environmental laws. Any such occurrences could result in
regulatory enforcement or personal injury and property damage claims or could lead to a shutdown of some of our operations, which could have an adverse effect on our business and results of operations. We currently incur costs to comply with
environmental laws and regulations and these costs may become more significant.
The environmental laws of many jurisdictions impose actual and potential
obligations on us to remediate contaminated sites. These obligations may relate to sites:
| n
|
|
that we currently own or operate; |
| n
|
|
that we formerly owned or operated; or |
| n
|
|
where waste from our operations was disposed. |
These environmental remediation obligations could reduce our operating results. In particular, our accruals for these obligations may be insufficient if the assumptions underlying the accruals prove incorrect or if we are held responsible
for additional, currently undiscovered contamination.
A substantial fine or penalty, the payment of significant environmental remediation costs or the
loss of a permit or other authorization to operate or engage in our ordinary course of business could result in material, unanticipated expenses and the possible inability to satisfy customer demand.
Our sales may be negatively affected by the implementation of second source programs by our customers.
For many customers, we are the single source supplier for one or more critical components used in their production lines. We are aware of customers that have begun to
implement second sourcing programs to reduce the potential risk of disruptions to their production due to a supply bottleneck. These can include diversifying purchases of one component among vendors or spreading the sources of components of a
process, such as purification, among different suppliers. If, as a result of these second sourcing
programs, existing customers were to choose another company to supply components that we currently supply, or if we lose future business opportunities for which we would otherwise be qualified,
our future revenues may be harmed.
Our use of third party manufacturers exposes us to increased risks that may affect our ability to
supply our customers.
As part of our efforts to consolidate our manufacturing operations and reduce cost, we have increased the outsourcing of certain
manufacturing operations. In addition, we often source products resulting from collaborative development relationships from such development partners. Our increased dependence on third party contract manufacturers exposes us to increased risks
associated with delivery schedules, manufacturing capability, quality control, quality assurance, and costs. If any of our third party manufacturers experiences delays, disruptions, capacity constraints or quality control problems in its
manufacturing operations or becomes insolvent, then product shipments to our customers could be delayed, which would decrease our revenues and harm our competitive position and reputation.
Because we compete directly with one of our significant distributors, our results of operations could be adversely affected if such party discontinues
or materially changes the terms of the agreement.
One of our competitors also serves as a significant distributor. If this distributor discontinued
selling our products or materially changed the terms, our sales and earnings could be adversely affected in the short term.
Violation
of government regulations or voluntary quality programs could result in loss of sales and customers and additional expense to attain compliance.
Several
of our facilities are subject to extensive regulation by the FDA and similar governmental bodies in other countries.
|
|
|
| MILLIPORE FORM 10-K 2009 |
|
29 |
PART I
These facilities are subject to periodic inspection by the FDA and other similar governmental bodies to ensure their compliance with applicable laws and regulations. New facilities, products and
operating procedures also may require approval by the FDA and/or similar governmental bodies in other countries. Failure to comply with these laws and regulations could lead to sanctions by the governmental bodies, such as written observations
of deficiencies made following inspections, warning letters, product recalls, fines, product seizures and consent decrees, which would be made available to the public. Such actions and publicity could affect our ability to sell products and to
provide our services.
Several of our operations are also subject to U.S. Department of Agriculture regulations and various foreign regulations for the
sourcing, manufacturing and distribution of animal based proteins. Our failure to comply with these requirements could negatively impact our business and potentially cause the loss of customers and sales. ISO 9001:2000 quality standards are an
internationally recognized set of voluntary quality standards that require compliance with a variety of quality requirements somewhat similar to the requirements of the FDA’s Quality System Regulations, which were formerly known as Good
Manufacturing Practices or GMP. Some of our facilities are registered under the ISO standards. Failure to comply with this voluntary standard can lead to observations of non-compliance or even suspension of ISO certification by the certifying unit.
Loss of ISO certification could cause some customers to purchase products from other suppliers.
We are subject to economic,
governmental, political, legal and other risks associated with our significant international sales and operations, which could adversely affect our business.
We conduct operations throughout the world through a variety of subsidiaries and distributors. Sales outside the
United States were
approximately 66 percent and 67 percent of total sales in 2009 and 2008, respectively. A significant portion of our 2009 revenues is generated in Europe and Asia/Pacific, approximately 40 percent and 20 percent, respectively. We anticipate that
revenue from
international operations will continue to represent a significant portion of our revenues. In addition, two of our primary manufacturing facilities, Molsheim, France and Cork, Ireland, and many
of our employees and suppliers, are located outside the United States. Our sales and earnings could be adversely affected from our international operations, including:
| n
|
|
changes in the political or economic conditions in a country or region, particularly in developing or emerging markets; |
| n
|
|
trade protection measures or our failure to comply with applicable import or export licensing requirements; |
| n
|
|
our failure or the failure of our commercial partners to comply with U.S. laws applicable to foreign operations or with applicable local laws, including import
and export laws and regulations; |
| n
|
|
differing tax laws and changes in those laws; |
| n
|
|
difficulty in staffing and managing widespread operations; and |
| n
|
|
differing regulatory requirements and changes in those requirements. |
Foreign exchange fluctuations may adversely affect our reported earnings, the value of our assets and the cash outflow for our debt repayment.
We prepare our consolidated financial statements in U.S. dollars, but a significant portion of our earnings and expenditures are in other currencies. In 2009, we
derived about 66 percent of our revenues from customers outside the United States. Our sales made in countries other than the United States are typically made in the local currencies of those countries. As a result, fluctuations in exchange rates
have caused and will continue to cause foreign currency gains and losses. Fluctuations in exchange rates between the U.S. dollar and other currencies may also affect the book value of our assets outside the United States. We have a significant
amount of our debt denominated in Euro. A significant appreciation of the Euro with respect to the U.S. dollar could expose us to additional interest and principle payments.
|
|
|
| 30 |
|
MILLIPORE FORM 10-K 2009
|
PART I
Due to the number of currencies involved, the variability of currency exposures and the potential volatility of currency exchange rates, we cannot predict the effects of exchange rate
fluctuations on future operating results. We seek to mitigate our currency exposure by coordinating our worldwide supply sourcing, actively managing cross-border currency flows, and engaging in foreign exchange hedging transactions. Despite these
steps, there can be no assurance that our foreign currency management strategy will adequately protect our operating results from the effects of future exchange rate fluctuations.
Our revenues may fluctuate, and this fluctuation could cause financial results to be below expectations.
Fluctuations in our operating results from period to period may occur for a number of reasons. In planning our operating expenses for the foreseeable future, we assume that revenues will continue to grow. Generally operating expenses cannot
be adjusted quickly in the short term because we have significant fixed costs. If our revenues decline or do not grow as anticipated, we may not be able to reduce our operating expenses accordingly. Failure to achieve anticipated levels of revenue
could therefore significantly harm our operating results for a particular period.
A revenue shortfall could arise from any number of factors, some of
which we cannot control. For example, factors that may cause our results to vary by period include:
|
|
the volume and timing of orders from customers for our products and services |
|
|
the level and timing of our customers’ research and commercialization efforts |
|
|
changes in the mix of our products and services |
|
|
the number, timing, and significance of new products and services introduced by our customers |
|
|
our ability to develop, market and introduce new and enhanced products and services on a timely basis |
|
|
changes in the cost, quality and availability of materials and components required to manufacture or use our products |
|
|
the timing and costs of any acquisitions of businesses or technologies |
|
|
the introduction of new products by us or our competitors |
|
|
exchange rate fluctuations |
|
|
general economic conditions. |
Increased exposure to
product liability claims could adversely affect our earnings.
Product liability is a major risk in testing and marketing biotechnology and
pharmaceutical products offered by our customers. Currently these risks are primarily borne by our customers. As our products and services are further integrated into our customers’ production processes, we may become increasingly exposed to
product liability and other claims in the event that the use of our products or services is alleged to have resulted in adverse effects. There can be no assurance that a future product liability claim or series of claims brought against us would not
have an adverse effect on our business or the results of operations. Our business may be materially and adversely affected by a successful product liability claim or claims in excess of any insurance coverage that we may have. In addition, product
liability claims, regardless of their merits, could be costly and divert management’s attention, and adversely affect our reputation and the demand for our products.
The stated value of long-lived and intangible assets, including goodwill, may become impaired and result in an impairment charge.
As of December 31, 2009, we had $1,951.0 million of long-lived and intangible assets, including goodwill. We continue to invest in the construction and upgrading of our manufacturing and research facilities,
which may have the effect of increasing the recorded value of our long-lived assets. If we are successful in acquiring additional complementary businesses and technologies, a substantial portion of the value of these may be recorded as goodwill, an
intangible asset.
|
|
|
| MILLIPORE FORM 10-K 2009 |
|
31 |
PART I
The carrying amounts of long-lived and intangible assets may be affected whenever events or changes in circumstances indicate that the carrying amount of any asset may not be recoverable. Such
events or changes might include, but are not limited to, the following: significant underperformance relative to expected historical or projected future operating results, significant negative industry or economic trends, or significant changes or
developments in strategy or operations that negatively affect the utilization of our long-lived assets. Adverse events or changes in circumstances may affect the estimated undiscounted future operating cash flows expected to be derived from
long-lived and intangible assets. If at any time we determine that an impairment has occurred, we will be required to recognize an impairment charge, resulting in a reduction in earnings in the quarter such impairment is identified and a
corresponding reduction to our assets. The potential recognition of impairment in the carrying value, if any, could have a material and adverse effect on our results of operations.
We may require substantial additional capital to pursue strategic acquisitions or alliances, which capital we may not be able to obtain on commercially reasonable terms, if at all.
We anticipate that our currently planned capital requirements will be satisfied by the future operating cash flows, current cash balances, borrowings under our
revolver, or
other existing financing sources. To the extent that we desire to pursue a strategic acquisition or alliance requiring substantial cash expenditures for which our existing resources and credit
facilities are insufficient, we may need to raise funds through public or private debt or equity financings. There is no assurance that such additional funds will be available or, if available, that we can obtain such funds on terms acceptable to
us. If adequate funds are not available, we may have to forgo desired acquisitions or alliances.
Future issuances of common stock may
depress the trading price of our common stock and our convertible notes.
Any issuance of equity securities, including the issuance of shares upon
conversion of our convertible notes, could dilute the interests of our existing stockholders, including holders who have received shares upon conversion of their notes, and could substantially decrease the trading price of our common stock and our
convertible notes. We may issue equity securities in the future for a number of reasons, including to finance our operations and business strategy (including in connection with acquisitions, strategic collaborations or other transactions), to adjust
our ratio of debt to equity, to satisfy our obligations upon the exercise of outstanding warrants or options or for other reasons.
|
|
|
| 32 |
|
MILLIPORE FORM 10-K 2009
|
PART I
| ITEM 1B |
UNRESOLVED STAFF COMMENTS. |
Not applicable
Our headquarters are located in leased facilities in Billerica, Massachusetts. We own or lease various other facilities worldwide for manufacturing, distribution,
warehousing, research and development, sales and demonstration, service, and administration. The following is a list of our principal and other materially important facilities. We use substantially all of the space in these facilities and we believe
these facilities are maintained in good working order and suitable for their present uses.
|
|
|
|
|
|
|
| Location |
|
Facility Use |
|
Owned
or Leased |
|
Approximate Floor Space Sq. Ft. (000s) |
| Molsheim, France |
|
Manufacturing, research, warehouse and office |
|
Both |
|
361 |
| Bedford, MA |
|
Manufacturing, research, warehouse and office |
|
Owned |
|
341 |
| Jaffrey, NH |
|
Manufacturing, warehouse and office |
|
Owned |
|
255 |
| Cork, Ireland |
|
Manufacturing, warehouse and office |
|
Both |
|
208 |
| Billerica, MA |
|
Office (headquarters) |
|
Leased |
|
143 |
| Burlington, MA |
|
Distribution |
|
Leased |
|
130 |
| Billerica, MA |
|
Research and office |
|
Both |
|
127 |
| Temecula, CA |
|
Manufacturing, research, warehouse and office |
|
Owned |
|
111 |
| Danvers, MA |
|
Manufacturing, research and office |
|
Owned |
|
108 |
| Kankakee, IL |
|
Manufacturing, research, warehouse |
|
Both |
|
83 |
| St. Charles, MO |
|
Manufacturing, research, warehouse and office |
|
Owned |
|
81 |
| Livingston, Scotland |
|
Manufacturing, research, warehouse and office |
|
Both |
|
60 |
| Hayward, CA |
|
Manufacturing, research and office |
|
Leased |
|
43 |
| Consett, England |
|
Manufacturing, research, warehouse and office |
|
Leased |
|
36 |
None of our owned facilities are subject to any material
encumbrances, except for a finance lease on a portion of the Molsheim, France property.
| ITEM 3 |
LEGAL PROCEEDINGS. |
We are not currently a party to any material legal proceeding.
| ITEM 4 |
SUBMISSION OF MATTERS TO A VOTE OF SECURITY HOLDERS.
|
This item is not applicable.
|
|
|
| MILLIPORE FORM 10-K 2009 |
|
33 |
PART I
| SUPPLEMENTARY ITEM |
EXECUTIVE OFFICERS OF THE REGISTRANT (PURSUANT TO INSTRUCTION 3 TO ITEM 401(b) OF REGULATION S-K). |
The following is a list, as of February 12, 2010, of the executive officers of Millipore Corporation.
|
|
|
|
|
|
|
|
|
| |
|
|
|
|
|
First Elected or
Appointed |
| Name |
|
Age |
|
Office |
|
An
Executive
Officer |
|
To
Present
Office |
| Martin D. Madaus |
|
50 |
|
Chairman of the Board, President and Chief Executive Officer |
|
2005 |
|
2005 |
| Bruce J. Bonnevier |
|
51 |
|
Vice President, Global Human Resources |
|
2006 |
|
2006 |
| Jonathan DiVincenzo |
|
44 |
|
Vice President, President of Bioscience Division |
|
2009 |
|
2009 |
| Dennis W. Harris |
|
53 |
|
Vice President and Chief Scientific Officer |
|
2006 |
|
2006 |
| Geoffrey F. Ide |
|
56 |
|
Vice President, Millipore International |
|
2006 |
|
2006 |
| Peter C. Kershaw |
|
56 |
|
Vice President, Global Operations |
|
2004 |
|
2008 |
| Jean-Paul Mangeolle |
|
48 |
|
Vice President, President of Bioprocess Division |
|
2005 |
|
2005 |
| Jeffrey Rudin |
|
58 |
|
Vice President, General Counsel and Secretary |
|
1996 |
|
1996 |
| Charles F. Wagner, Jr. |
|
41 |
|
Vice President and Chief Financial Officer |
|
2003 |
|
2007 |
Dr. Madaus joined Millipore Corporation as our President and Chief Executive Officer, and as a Director, on January 1, 2005, and was appointed Chairman of the Board effective March 1, 2005. From 2000 until December 2004, Dr. Madaus
served as President and Chief Executive Officer of Roche Diagnostics Corporation, heading the North American diagnostics business of Hoffmann-La Roche, a leading pharmaceutical and diagnostics company. Prior to that, Dr. Madaus held various
management positions from 1989 to 1999 with Hoffmann-La Roche and with Boehringer Mannheim (prior to its 1998 acquisition by Hoffmann-La Roche). Dr. Madaus also serves as a board member of Mettler-Toledo International, Inc. and the
Massachusetts High Technology Council.
Mr. Bonnevier joined Millipore Corporation as Vice President of Global Human Resources in January 2006. From 2004 to 2005, Mr. Bonnevier served as Vice President of Human Resources for Hillenbrand Industries, Inc., a
company that owned and operated businesses that provide products and services for the health care and funeral services industries. From 2000 to 2004, he was Vice President of Human Resources for Shipley Company, now the Electronic Materials Division
of the Rohm and Haas Company
(a wholly owned subsidiary of The Dow Chemical Company), a leading producer of specialty materials used in a wide variety of applications, including electronic materials, paints and personal care
products. From 1989 through 2000, Mr. Bonnevier held various senior management roles at Rohm and Haas, including Director of International Human Resources and Business Human Resources Manager.
Mr. DiVincenzo was elected Vice President of
Millipore Corporation in January 2009 and serves as President of our Bioscience Division. From July 2006 through December 2008, he served as Vice President, Worldwide Sales and Service for our Bioscience Division, and from January 2005 through June
2006, as the Bioscience Division’s Vice President of Marketing and R&D. From January 2001 through January 2005, Mr. DiVincenzo served as the Vice President of Marketing and R&D for our Lab Water Division, which combined with other
businesses to become our Bioscience Division. Prior to such roles, Mr. DiVincenzo held a wide variety of positions since joining us in 1994, including several senior marketing and product management positions within our Lab Water business.
|
|
|
| 34 |
|
MILLIPORE FORM 10-K 2009
|
PART I
Dr. Harris joined Millipore
Corporation as our Chief Scientific Officer following our acquisition of Serologicals in July 2006. From 2004 to 2006, Dr. Harris served as Vice President, Global Research & Development and business development and Chief Scientific
Officer at Serologicals. From 2002 to 2003, Dr. Harris served as Executive Vice President, Research & Development for Vitra Biosciences, Inc., a developer of cell-based drug screening array systems for drug discovery. From 2001 to
2003, Dr. Harris held senior Research & Development and business positions at ACLARA Biosciences, Inc., a developer of novel technologies in the areas of microfluidics and gene and protein analysis. For approximately twenty years prior
to joining ACLARA, Dr. Harris held positions of increasing responsibility at Amersham Pharmacia Biotech, Inc. and its affiliates, most recently as Vice President of Research and Development for North America and global genomics Research and
Development from 1997 to 2001. Amersham (acquired by General Electric Corporation in 2004) is a manufacturer of pharmaceutical products for the diagnosis and treatment of disease and of technologies for biotechnology research and drug discovery.
Mr. Ide joined Millipore
Corporation in 2005 as Vice President, Millipore International, with responsibility for market development opportunities in Japan, Asia, India, South America, Eastern Europe, the Middle East, and Africa. Prior to joining Millipore, Mr. Ide
was employed by Bausch & Lomb Incorporated, a world leader in the development, manufacture and marketing of eye health products, from 1988 to 2005. He served Bausch & Lomb in positions of increasing responsibility, most recently as
corporate Vice President and President of Japan Operations from 1999 to 2005.
Mr. Kershaw was elected Vice President, Worldwide Manufacturing Operations, of Millipore Corporation effective February 2004 and, in August 2005, was appointed head of our newly
created Global Supply Chain organization, a combination of the Company’s worldwide manufacturing, distribution, and customer service functions. In December 2008, he was appointed head of our newly created Global Operations organization, a
combina-
tion of the Company’s global supply chain and corporate quality functions. Prior to joining Millipore, Mr. Kershaw served Hologic, Inc., a manufacturer of medical imaging systems, as
Corporate Vice President, Manufacturing Operations (2003-2004) and Vice President and General Manager, LORAD Division (2001-2003). Prior to that, Mr. Kershaw served as President (1998-2001) and Vice President and General Manager (1996-1998) of
the Medical Device Division of Bespak plc, a manufacturer of plastic injection molded components and finished medical devices.
Mr. Mangeolle was elected Vice President of Millipore Corporation and President of the Bioprocess Division in October 2005. From 2002 to 2005, he
served as Vice President of the Division’s Worldwide Field Operations. From 2001 to 2002, Mr. Mangeolle was Vice President of Operations of Mykrolis Corporation, a spin-off of Millipore’s former Microelectronics Division. Prior to
2001, Mr. Mangeolle held a number of senior management positions in Millipore’s Microelectronics and Laboratory Water Divisions, as well as Millipore’s Asian Operations. Mr. Mangeolle joined Millipore SA, our wholly-owned
subsidiary in France, as a sales applications specialist in 1984.
Mr. Rudin was elected Vice President and General Counsel of Millipore Corporation in December 1996 and as Clerk (that office is now known as Secretary) of Millipore in 1999. Prior
to joining Millipore, Mr. Rudin served Ciba Corning Diagnostics Corp. as Senior Vice President and General Counsel (1993-1996) and as Vice President and General Counsel (1988-1993).
Mr. Wagner was elected Vice President and Chief Financial Officer of Millipore Corporation
effective in August 2007. Mr. Wagner joined Millipore Corporation in December 2002 as Director of Strategic Planning and Business Development and was elected Vice President, Strategic Planning and Business Development (now Strategy and
Corporate Development), in March 2003, serving in this role until his election as Chief Financial Officer. Prior to joining Millipore, Mr. Wagner served as a Manager (2001-2002) and Consultant (1998-2001) at Bain & Company.
|
|
|
| MILLIPORE FORM 10-K 2009 |
|
35 |
PART II
| ITEM 5 |
MARKET FOR REGISTRANT’S COMMON STOCK, RELATED STOCKHOLDER MATTERS AND ISSUER PURCHASES OF EQUITY
SECURITIES. |
Millipore’s Common Stock, $1.00 par value, is listed on the New York Stock Exchange and is traded under the
symbol “MIL.” The following table sets forth, for the indicated fiscal periods, (i) the high and low sales prices of Millipore’s Common Stock (as reported on the New York Stock Exchange Composite Tape). On February 1, 2010,
there were approximately 32,274 registered and beneficial shareholders of record.
We did not declare any cash dividends during 2009 or 2008. We do not currently have plans to make future cash dividend declarations or payments.
|
|
|
|
|
|
|
|
|
|
|
|
|
| |
|
Range of Stock Prices |
| |
|
2009 |
|
2008 |
| |
|
High |
|
Low |
|
High |
|
Low |
| First Quarter |
|
$ |
60.38 |
|
$ |
50.65 |
|
$ |
72.99 |
|
$ |
64.62 |
| Second Quarter |
|
$ |
71.71 |
|
$ |
56.05 |
|
$ |
74.19 |
|
$ |
64.77 |
| Third Quarter |
|
$ |
72.43 |
|
$ |
65.24 |
|
$ |
76.11 |
|
$ |
66.41 |
| Fourth Quarter |
|
$ |
72.81 |
|
$ |
67.01 |
|
$ |
68.80 |
|
$ |
44.61 |
|
|
|
| 36 |
|
MILLIPORE FORM 10-K 2009
|
PART II
| ITEM 6 |
SELECTED FINANCIAL DATA. |
The following selected consolidated financial data are derived from our Consolidated Financial Statements and notes
thereto and should be read in connection with and
are qualified in their entirety by our Consolidated Financial Statements and notes thereto and other financial information included elsewhere in this Form 10-K report.
Five Year Summary of Operations
|
|
|
|
|
|
|
|
|
|
|
|
|
|
|
|
|
|
|
|
|
|
|
|
|
| (In thousands, except per share data) |
|
|
|
2009 |
|
|
|
|
2008(1) (As Adjusted) |
|
|
2007(1) (As Adjusted) |
|
|
2006(1,4) (As Adjusted) |
|
|
2005 |
|
| Statement of Operations Data: |
|
|
|
|
|
|
|
|
|
|
|
|
|
|
|
|
|
|
|
|
|
|
|
|
| Revenues |
|
|
|
$ |
1,654,410 |
|
|
|
|
$ |
1,602,138 |
|
|
$ |
1,531,555 |
|
|
$ |
1,255,371 |
|
|
$ |
991,031 |
|
| Cost of revenues |
|
|
|
|
747,432 |
|
|
|
|
|
749,307 |
|
|
|
721,092 |
|
|
|
625,608 |
|
|
|
472,023 |
|
| Gross profit |
|
|
|
|
906,978 |
|
|
|
|
|
852,831 |
|
|
|
810,463 |
|
|
|
629,763 |
|
|
|
519,008 |
|
| Selling, general and administrative expenses |
|
|
|
|
523,765 |
|
|
|
|
|
516,729 |
|
|
|
486,737 |
|
|
|
398,842 |
(5)
|
|
|
309,029 |
|
| Research and development expenses |
|
|
|
|
114,566 |
|
|
|
|
|
102,605 |
|
|
|
106,999 |
|
|
|
86,617 |
|
|
|
66,052 |
|
| In-process research and development expenses |
|
|
|
|
– |
|
|
|
|
|
– |
|
|
|
– |
|
|
|
– |
|
|
|
3,149 |
(7) |
| Operating profit |
|
|
|
|
268,647 |
|
|
|
|
|
233,497 |
|
|
|
216,727 |
|
|
|
144,304 |
|
|
|
140,778 |
|
| Gain on business acquisition |
|
|
|
|
8,542 |
(2)
|
|
|
|
|
– |
|
|
|
– |
|
|
|
– |
|
|
|
– |
|
| Interest income |
|
|
|
|
741 |
|
|
|
|
|
948 |
|
|
|
1,453 |
|
|
|
21,415 |
|
|
|
3,466 |
|
| Interest expense |
|
|
|
|
(58,343 |
) |
|
|
|
|
(70,109 |
) |
|
|
(78,516 |
) |
|
|
(52,390 |
) |
|
|
(6,711 |
) |
| Income before provision for income taxes |
|
|
|
|
219,587 |
|
|
|
|
|
164,336 |
|
|
|
139,664 |
|
|
|
113,329 |
|
|
|
137,533 |
|
| Provision for income taxes |
|
|
|
|
40,397 |
|
|
|
|
|
23,169 |
|
|
|
7,974 |
(3) |
|
|
18,781 |
|
|
|
57,365 |
(8) |
| Net income |
|
|
|
|
179,190 |
|
|
|
|
|
141,167 |
|
|
|
131,690 |
|
|
|
94,548 |
|
|
|
80,168 |
|
| Less: Net income attributable to noncontrolling interest |
|
|
|
|
2,186 |
|
|
|
|
|
3,562 |
|
|
|
3,527 |
|
|
|
1,937 |
|
|
|
– |
|
| Net income attributable to Millipore |
|
|
|
$ |
177,004 |
|
|
|
|
$ |
137,605 |
|
|
$ |
128,163 |
|
|
$ |
92,611 |
|
|
$ |
80,168 |
|
|
|
|
|
|
|
|
|
| Earnings per share: |
|
|
|
|
|
|
|
|
|
|
|
|
|
|
|
|
|
|
|
|
|
|
|
|
| Basic earnings per share |
|
|
|
$ |
3.19 |
|
|
|
|
$ |
2.50 |
|
|
$ |
2.36 |
|
|
$ |
1.74 |
|
|
$ |
1.57 |
|
| Diluted earnings per share |
|
|
|
$ |
3.15 |
|
|
|
|
$ |
2.47 |
|
|
$ |
2.33 |
|
|
$ |
1.71 |
|
|
$ |
1.55 |
|
|
|
|
|
|
|
|
|
| Weighted average shares outstanding: |
|
|
|
|
|
|
|
|
|
|
|
|
|
|
|
|
|
|
|
|
|
|
|
|
| Basic |
|
|
|
|
55,509 |
|
|
|
|
|
55,128 |
|
|
|
54,263 |
|
|
|
53,160 |
|
|
|
50,953 |
|
| Diluted |
|
|
|
|
56,124 |
|
|
|
|
|
55,711 |
|
|
|
55,028 |
|
|
|
54,245 |
|
|
|
51,659 |
|
|
|
|
|
|
|
|
|
| Balance Sheet Data (at end of year): |
|
|
|
|
|
|
|
|
|
|
|
|
|
|
|
|
|
|
|
|
|
|
|
|
| Working capital |
|
|
|
$ |
482,561 |
|
|
|
|
$ |
505,080 |
|
|
$ |
407,848 |
|
|
$ |
307,525 |
|
|
$ |
824,502 |
|
| Total assets |
|
|
|
$ |
2,810,789 |
|
|
|
|
$ |
2,733,101 |
|
|
$ |
2,761,426 |
|
|
$ |
2,769,754 |
|
|
$ |
1,646,665 |
|
| Long-term debt |
|
|
|
$ |
890,242 |
|
|
|
|
$ |
1,082,058 |
|
|
$ |
1,199,162 |
|
|
$ |
1,242,263 |
(6)
|
|
$ |
552,285 |
|
| Total equity |
|
|
|
$ |
1,503,034 |
|
|
|
|
$ |
1,312,295 |
|
|
$ |
1,179,301 |
|
|
$ |
998,290 |
|
|
$ |
791,563 |
|
| (1) |
|
On January 1, 2009, we adopted new accounting standards concerning convertible debt and reporting and disclosure of noncontrolling interest in consolidated subsidiaries.
These new standards require adjustments to prior period financial statements to conform with current accounting treatment. |
| (2) |
|
In 2009, we recorded a bargain purchase gain on our acquisition of Guava Technologies, Inc. |
| (3) |
|
In 2007, we recorded $11,900 of previously unrecognized tax benefits in our statement of operations as a result of the completion of tax examinations and statute of limitations
closures. |
| (4) |
|
Our 2006 statement of operations and balance sheet data included the effect of our acquisition of Serologicals. The results of Serologicals’ operations have been included in
our consolidated statement of operations since July 14, 2006, the date of the acquisition. |
| (5) |
|
In 2006, we recorded a $8,664 curtailment loss as a result of amendments to our U.S. Retirement Plan. |
| (6) |
|
In 2006, we issued $565,000 of 3.75 percent convertible notes and €250,000, or $330,033, of 5.875 percent senior notes to fund the acquisition of Serologicals. |
| (7) |
|
In 2005, we expensed purchased in-process research and development related to the acquisition of NovAseptic A.B. because these costs had no alternative future uses and the
related projects had not reached technological feasibility at the acquisition date. |
| (8) |
|
Provision for income taxes for 2005 included $30,634 of tax obligations related to the repatriation of foreign earnings under the provisions of the American Jobs Creation Act of
2004 and $3,177 related to the release of tax valuation allowance. |
|
|
|
| MILLIPORE FORM 10-K 2009 |
|
37 |
PART II
| ITEM 7 |
MANAGEMENT’S DISCUSSION AND ANALYSIS OF FINANCIAL CONDITION AND RESULTS OF OPERATIONS |
Basis of Presentation
The following Management’s Discussion and Analysis (“MD&A”) will help you understand the financial condition and results of operations of Millipore Corporation. The MD&A is a supplement to,
and should be read in conjunction with, our consolidated financial statements and the accompanying notes to the consolidated financial statements. We will also be disclosing certain non-GAAP information in the MD&A. A reconciliation of our GAAP
financial measures to our non-GAAP financial measures and information about the use of non-GAAP measures begins on page 62 under the heading “Use of Non-GAAP Financial Measures.”
Effective January 1, 2009, we adopted two new accounting standards: (1) for noncontrolling interests and (2) for convertible debt that may be settled in
cash upon conversion. These standards required retrospective adjustments to prior period financial statements to conform to current accounting treatment.
General Overview
Millipore is a global leader in the life science tools market. Together with our customers, we help to advance
the research, development, and production of drugs. Our innovative products and services are used to support life science research, drug discovery, process development, drug manufacturing, and quality assurance. We help customers to improve
laboratory productivity and work flows, prioritize potential drugs, optimize manufacturing productivity, and support commercial scale manufacturing.
We
manage our business globally and are organized in two operating divisions. Our Bioscience Division provides products and technologies to support life science research and development activities. Our Bioprocess Division provides products and services
to support pharmaceutical and biotechnology manufacturing.
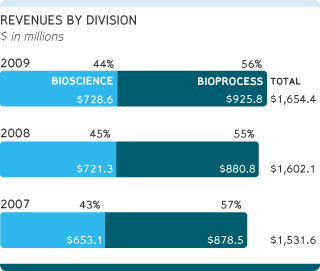
The breadth of our product offering and our global scale make us a strategic supplier to the life science industry and provide us
with access to many different segments of the market. Our products and services are primarily used by a diverse, global customer base including biotechnology and pharmaceutical companies, academic institutions, and research laboratories. In
addition, we derive most of our revenues from consumable products. These attributes allow us to target growth on a number of dimensions and make our business less susceptible to economic downturns, which we experienced in 2009.
BUSINESS DRIVERS
Bioscience Division
The primary business driver of our Bioscience Division is the research activities of pharmaceutical and biotechnology companies, academic institutions,
governments, and other organizations. Demand for our products increases with the amount of research being conducted worldwide. Key market trends affecting the business include the investments in life science laboratories, particularly in Asia,
growth in protein research and cell biology, and higher demand for products that improve research work flows.
|
|
|
| 38 |
|
MILLIPORE FORM 10-K 2009
|
PART II

For example, pressure on pharmaceutical and biotechnology companies to identify new drug candidates has increased demand for our
products that help to improve research productivity. Pre-validated, optimized products, especially those combined in kits, increase efficiency and save researchers time. As a result, we have expanded the number of kits we offer to improve research
protocols.
Other business drivers of the Bioscience Division include:
|
|
Academic and government spending on life science research |
|
|
Increase in outsourced drug discovery research activities by pharmaceutical and biotechnology companies |
|
|
New products and customer work flow solutions. For example, work flow solutions that include devices, consumable products, and technical service and expertise
|
|
|
The emergence of the Internet as a key sales channel |
|
|
An ability to license, commercialize, and acquire technologies |
The
global economic recession and the continued pharmaceutical industry consolidation reduced our Bioscience Division revenue growth in 2009.
Bioprocess Division
The business drivers of our Bioprocess Division include the demand for, and the corresponding production of, commercial therapeutics such as biologic drugs and vaccines. Over the past decade, several biologics have
been approved as therapeutics, including monoclonal antibodies, cell culture-based vaccines, and other recombinant protein-based therapeutics. As pharmaceutical companies shift more of their drug pipeline from synthetic-based drugs to biologic
drugs, our business will grow if a greater number of these molecules are commercially approved and if we win production process steps for these biologics.
Monoclonal antibodies are among the fastest growing classes of biologic drugs because of their ability to treat diseases for which there are few therapies. They are separation-intensive, complex to produce, and require significant use of
our Bioprocess products. The growth in biologics also creates increased demand for our consumable products.
Our expertise in purifying monoclonal
antibodies positions us strategically to gain customer access and increase our applications knowledge. These intimate customer relationships help us identify new technologies and customer needs. They also help our customers optimize their
productivity. Therefore, we typically see our revenues increase as a molecule moves from early to late stage clinical development and ultimately receives approval. We generate the highest level of revenues during Phase III clinical trials and during
commercial production.
Other business drivers of the Bioprocess Division include:
|
|
Commercialization of innovative products that increase production speed and productivity and reduce risk. For example, new biologic drug manufacturing platforms that employ
disposable manufacturing solutions |
|
|
Biopharmaceutical manufacturing capacity expansion, particularly in growth markets in Asia |
|
|
|
| MILLIPORE FORM 10-K 2009 |
|
39 |
PART II
|
|
Increasing customer manufacturing quality standards resulting in the need for more sophisticated process monitoring and quality control |
|
|
Growth in global demand for novel, seasonal, and pandemic flu vaccines |
|
|
Market acceptance of cell culture-based vaccines, which require more purification technologies |
OUR STRATEGY
Our strategy is to drive long-term growth in our business by:
|
|
Capitalizing on opportunities in large, core markets |
|
|
Targeting fast growing market segments |
|
|
Delivering innovative products and services to meet customer needs |
|
|
Executing strategic acquisitions and partnerships |
|
|
Investing in sales channels and global infrastructure |
We are
focused on expanding our leadership in attractive, growing, and important core product categories such as laboratory water, sample preparation, antibodies, filtration, and chromatography. We seek to leverage our industry leadership, global
footprint, applications expertise, and brand in these areas to deliver deep, innovative solutions that create superior performance and value for our
customers.
We are also selectively focusing on attractive segments of the life science tools market where we can establish market leadership,
generate higher levels of growth, and drive competitive differentiation. Some of these fast growing markets include disposable manufacturing, virus filtration, benchtop flow cytometry, stem cell research, multiplex immunoassays, and
biopharmaceutical services. From a geographic perspective, we are focusing on expanding our presence in Brazil, Russia, China, India, and Singapore because of the substantial growth of life science research and biopharmaceutical production in these
countries. By selectively pursuing high growth markets, we expect that we will be able to grow our revenues and profitability.
Our ability to anticipate
customer needs and deliver high-value differentiated products is a critical part of our strategy. We believe our markets are driven by innovation.

A central part of our strategy is to develop new products and services that address unmet customer needs in large markets. Our depth
of customer relationships and applications expertise allows us to identify, understand, and address these needs. We are also focused on increasing our growth opportunities by executing strategic acquisitions and partnerships. We can enhance our
product portfolio and enter new markets by acquiring key technologies and partnering with leading companies in targeted areas. Finally, we are investing in our sales channels and global infrastructure to support future growth. For example, we have
opened new, state-of-the-art customer training and scale-up facilities in Singapore and in Billerica, Massachusetts; we have invested in our e-business platform; and we have expanded our sales and marketing capabilities to drive growth in the
future.
2009 HIGHLIGHTS
Consolidated
revenues of $1,654.4 million for 2009 increased $52.3 million, or 3 percent, compared to 2008. Adjusting for a 3 percentage point adverse effect from foreign currency translation and a 1 percentage point favorable effect from the Guava acquisition,
our consolidated revenues for 2009 grew 5 percent.
Our year-over-year revenue growth during the current economic environment reflects the resiliency of
our business model. Approximately 90 percent of our revenues are derived from consumable products and services, which are less affected by the contraction of our customers’ capital spending. Our business is well diversified across end- markets,
product lines, and geographies. This diversity provides us important balance and flexibility in managing our business, especially during these challenging economic times.
|
|
|
| 40 |
|
MILLIPORE FORM 10-K 2009
|
PART II
In 2009, Bioprocess currency adjusted revenues grew 8 percent because of increased spending levels by our large
biotechnology customers, sales of products used in vaccine production, new product sales, and increased demand in Asian markets. Bioscience currency adjusted revenues grew 3 percent, which was driven by academic research spending and sales of
acquired and new products. The effect of the global economic recession that led to lower demand for our laboratory instrumentation products and weak spending by our large pharmaceutical customers partly offset this revenue growth.
Operating profit increased to $268.6 million in 2009 from $233.5 million in 2008. Higher revenues, favorable impact from changes in foreign currency, and operational
efficiencies were the primary drivers of the increase. This profit expansion enabled us to increase our investment in research and development in accordance with our innovation strategy and absorb the effects of an unfavorable product mix which
negatively impacted gross margin and higher incentive compensation costs. Our operating profit margin increased to 16.2 percent in 2009 from 14.6 percent in 2008.
Diluted GAAP and non-GAAP earnings per share (“EPS”) were $3.15 and $4.00, respectively, in 2009 and increased by $0.68 and $0.41, respectively, compared to 2008. (Please see our non-GAAP reconciliation
which begins on page 62.) Higher operating profit, the gain resulting from our Guava business acquisition, and lower interest expense contributed to higher GAAP EPS. A higher tax rate attributable to pre-tax income mix shift to higher tax rate
jurisdictions offset the increase. Excluding the gain resulting from our Guava business acquisition, non-GAAP and GAAP growth drivers were similar for the year.
Free cash flow is an important operating metric that we define as net cash provided by operating activities less additions to property, plant and equipment. We generated $298.1 million of free cash flow in 2009, a 54 percent increase over
2008. This growth was attributable to our increased profitability and better working capital management as a result of implementing our working capital initiative. We made net repayments of $173.3 million on our

debt during the year. As of December 31, 2009, we had no borrowings outstanding under our primary revolving credit facility.
This cash flow generation enabled us to fund three strategic acquisitions, to purchase the remaining interest of our joint venture in India, and to fund our innovation strategy.
In 2004, we announced the first phase of our global supply chain initiatives to consolidate manufacturing operations and reduce our fixed costs. In 2008, we announced the
second phase of this program, aimed at further reducing our manufacturing and distribution costs, partly in response to lower demand and revenue declines in our
Bioprocess Division. As of December 31, 2009, we have substantially completed both phases of our global supply chain initiative and closed ten of the twelve manufacturing facilities included in our plans. One more facility will be closed in
2010, and we have decided not to close the remaining facility. We expect to incur approximately $2 million in 2010 in connection with finalizing the program and do not anticipate significant additional charges relating to this program going
forward.
Results of Operations
REVENUES
Bioprocess Division
2009 VERSUS 2008
Bioprocess revenues of $925.8 million in 2009 increased $45.0 million, or 5 percent, compared to 2008. Foreign currency
translation had a 3 percentage point adverse effect. Adjusting for this item, Bioprocess revenues increased 8 percent in 2009.
|
|
|
| MILLIPORE FORM 10-K 2009 |
|
41 |
PART II
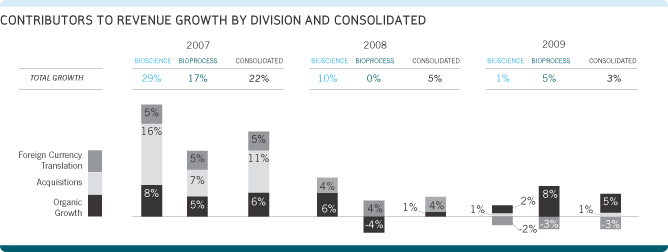
Revenue growth was primarily attributable to higher sales of our downstream bioprocessing products used in biopharmaceutical manufacturing. This was the result of higher spending levels by our
large biotechnology customers in North America. These customers’ spending levels were adversely affected in 2008 by a reduction in their rate of monoclonal antibody production as a result of their evaluation of market demand for their products,
and their efforts to lower their costs and to improve their working capital positions. In 2009, the level of manufacturing activities associated with monoclonal antibodies recovered, partially attributable to some customers ramping up manufacturing
for new products in anticipation of new biologic drug approvals. Additionally, Bioprocess revenues increased from sales of products used in the H1N1 flu vaccine production, particularly in Europe and in the second half of 2009. We expect products
used in vaccine production will continue to be an important driver for our revenue growth, although the high demand for our products created from H1N1 flu vaccine production will not repeat in 2010.
In addition to the biotechnology market sector, our Bioprocess Division’s core purification products sold into the plasma market grew by double digits, which was
attributable to increased demand for plasma fractionation. To a lesser extent, the Bioprocess revenue increase was the
result of continued growth in process monitoring tools products. Demand for our on-site testing products is increasing, particularly our disposable Novaseptum® product, as drug companies are adopting disposable sampling technology to monitor contamination earlier in the drug manufacturing process. Partially
offsetting these increases was a decline in our upstream bioprocessing products resulting from lower end-market demand for certain drugs.
2008 VERSUS
2007
Bioprocess revenues of $880.8 million in 2008 increased $2.3 million, compared to 2007. Foreign currency translation had a 4 percentage point
favorable effect. Adjusting for this item, Bioprocess revenues declined 4 percent in 2008. This decline was primarily attributable to lower sales of certain upstream and downstream bioprocessing products used in biopharmaceutical manufacturing,
which was partially offset by increased sales of our process monitoring tools products. Lower sales of our upstream and downstream bioprocessing products were caused by lower spending by some of our largest biotechnology customers and weakening
global economic conditions. We experienced significantly lower sales to these customers because of their reduced rate of monoclonal antibody production and the reduction of their inventory levels since the third quarter of 2007.
|
|
|
| 42 |
|
MILLIPORE FORM 10-K 2009
|
PART II
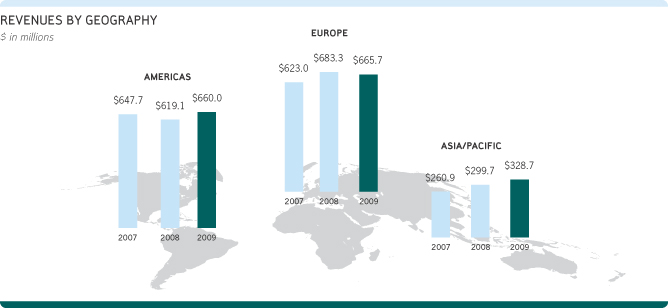
After experiencing a significant decline in the first half of the year, our Bioprocess Division
stabilized in the second half of 2008 as some of our large key accounts increased their purchases. Sales of our disposable systems and components experienced strong growth year-over-year. Our process monitoring tools, which are used to test for
biopharmaceutical contaminants, performed well in 2008. These products are sold to a diverse customer base, some of which were not adversely affected by the sales softness we experienced with our large biotechnology customers. In particular, we
experienced increased demand for our Novaseptum® products, a product line we acquired in our 2005 acquisition of
Novaseptic.
Bioscience Division
2009
VERSUS 2008
Bioscience revenues of $728.6 million for 2009 increased $7.3 million, or 1 percent, compared to 2008. Foreign currency translation had a 2
percentage point adverse effect and our Guava acquisition had a 1 percentage point favorable effect on this revenue growth. Adjusting for these items, Bioscience revenues grew 2 percent in 2009. Revenue growth was primarily attributable to strong
growth in protein research products, immunoassay products, and
laboratory water consumable products and services. Despite weak global economic conditions, government and private funding of academic research continued to be strong in 2009, which drove revenue
growth. We completed our acquisition of Guava Technologies on February 20, 2009 and successfully expanded sales of our flow cytometry systems and newly developed reagents through our established distribution network.
Weakness in the global economy lowered demand for our laboratory instrumentation products and was the largest offset to Bioscience revenue growth in 2009. Revenue
growth was also adversely affected by weak spending resulting from cost reductions in research functions of our large pharmaceutical customers. These customers have rationalized their drug pipelines, reassessed their research priorities, and focused
on integrating acquisitions.
2008 VERSUS 2007
Bioscience revenues of $721.3 million for 2008 increased $68.2 million, or 10 percent, compared to 2007. Foreign currency had a 4 percent favorable effect on this revenue growth. Adjusting for this item, Bioscience revenues grew 6 percent,
which was primarily driven by strong demand for our laboratory water products and services.
|
|
|
| MILLIPORE FORM 10-K 2009 |
|
43 |
PART II
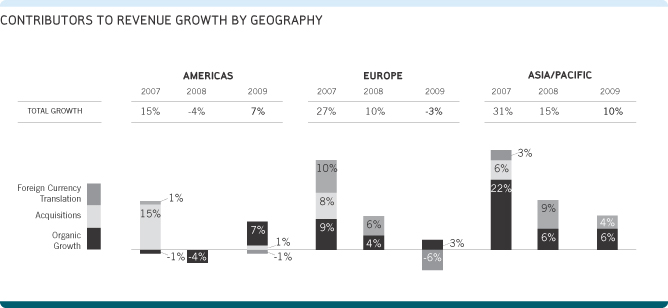
Bioscience revenue growth was reduced by 1 percent due to the elimination of a small product
line. Successful new product introductions, execution of our sales and marketing initiatives, and continued expansion of our new e-commerce business platform all contributed to the revenue growth. The successful launch of new products such as the
Milli-Q® Integral and Milli-Q® Advantage by our laboratory water business unit and strong growth in consumables and services contributed to the strong performance. Our biomarker and immunoassay
products produced strong year-over-year growth as a result of new product introductions. Sales of our life science business unit’s biotools products also contributed to the revenue growth resulting from higher sales of analytical sample
preparation, cell biology, and molecular biology products. This was a reflection of a healthy level of life science research activities in the protein research and cell biology markets.
REVENUES BY GEOGRAPHY
2009 VERSUS 2008
Revenues for 2009 in the Americas, Europe, and Asia/ Pacific were $660.0 million, $665.7 million, and $328.7 million, respectively. Excluding the effects of foreign
currency translation and acquisitions, revenues increased 7 percent in the Americas, 3 percent in Europe, and 6 percent in Asia/Pacific. The increase in the Americas was primarily the result of
higher spending this year by our large biotechnology customers in North America. The increase in Europe was primarily driven by sales of our downstream bioprocessing and process monitoring products attributable to higher levels of H1N1 flu vaccine
production and the higher demand for our on-site testing products. Protein research products, immunoassay products, and laboratory water consumable products and services also contributed to the year-over-year growth. The increase in Asia/Pacific was
primarily driven by sales of our downstream bioprocessing products and process monitoring tools, especially in China and Singapore. Historically, our business in Asia/Pacific has been primarily driven by our Bioscience Division, but our Bioprocess
Division has gained strong growth in the region as new biopharmaceutical production capacity increases. We continued to see investments into the biotechnology industry in the region by multi-national companies, governments, and contract
manufacturing organizations. These positive trends in Asia/Pacific were offset by weak economic conditions in Japan and India during 2009.
|
|
|
| 44 |
|
MILLIPORE FORM 10-K 2009
|
PART II
2008 VERSUS 2007
Revenues for 2008 in the Americas, Europe, and Asia/ Pacific were $619.2 million, $683.3 million, and $299.7 million, respectively. Excluding the favorable foreign currency translation effect, revenues in the Americas, Europe and
Asia/Pacific decreased 4 percent, increased 4 percent,
and increased 6 percent, respectively. The decrease in the Americas was primarily attributable to
the lower sales to a handful of our largest biotechnology customers in the first half of 2008, which was offset by the strength of our laboratory water and drug discovery products. The increase in Europe was primarily driven by sales of our process
monitoring tools products and laboratory water products and services, which was somewhat offset by a decline in sales of both upstream and downstream bioprocessing products in the 2008 second half. The increase in Asia/Pacific was primarily the
result of strong sales of our laboratory water products and services, life science products, downstream bioprocessing products in Japan and China, and higher purchases from a large customer for a new manufacturing plant in Singapore.
GROSS PROFIT MARGIN
2009 VERSUS 2008
Gross profit increased $54.1 million, or 6 percent, compared to 2008. Gross profit margin improved from 53 percent of revenues to 55 percent of revenues this year. The
primary drivers of the gross profit increase were lower costs associated with our global supply chain initiatives, favorable foreign currency translation, productivity improvements, and a favorable price impact. We incurred charges associated with
our global supply chain initiative (primarily employee separation costs, facility closure costs, and accelerated depreciation) amounting to $11.7 million and $16.5 million in 2009 and 2008, respectively. The year-over-year decrease in these charges
were primarily attributable to lower employee separation and related expenses in 2009. In 2010, we expect to complete our global supply chain initiative and to incur approximately $2 million of planned additional costs. The favorable foreign
currency impact was primarily the result of a weaker Euro and a stronger Japanese Yen in 2009, compared to

2008. When translated into U.S. dollars, our Irish and French manufacturing operations represented a lower proportion of our total
manufacturing costs in 2009 as a result of the weaker Euro. Generally, when the Japanese Yen strengthens against the U.S. dollar and/or the Euro, our gross margin is favorably impacted because substantially all of our manufacturing activities are in
the United States, Ireland, and France. Full year amortization of purchased intangibles affecting gross profit was $8.1 million, compared to $9.4 million in 2008.
These favorable effects were offset by an unfavorable product mix, higher incentive compensation costs, lower manufacturing volumes, inventory write-downs, and acquisition inventory fair value adjustments. The
lower manufacturing volumes were the result of inventory reductions in connection with our working capital initiative improvements implemented during the year. As part of our working capital initiative, we also wrote off inventory items that were
related to certain low volume and unprofitable product lines.
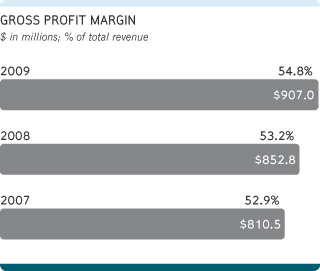
|
|
|
| MILLIPORE FORM 10-K 2009 |
|
45 |
PART II
The higher incentive compensation costs reflect improved year-over-year operating results. The unfavorable product mix reflected increased sales of lower margin chromatography media and hardware
products and reduced sales of higher margin cell culture supplement products.
2008 VERSUS 2007
Gross profit increased $42.3 million, or 5 percent, compared to 2007. The primary drivers of the increase were higher revenues, improved business and product mix, and
productivity improvements. Bioscience revenues, which have higher gross profit margins, represented a larger percentage of our revenues, while sales of large Bioprocess systems, chromatography media and insulin products with lower gross profit
margins represented less of our sales mix. Additionally, the absence of Serologicals business acquisition inventory fair value adjustments amounting to $11.1 million and acquisition integration costs amounting to $2.7 million contributed to the
increase in 2008. Somewhat offsetting increased gross profit margin was the adverse effect of a stronger Euro and costs associated with our global supply chain initiatives. When translated into U.S. dollars, our Irish and French manufacturing
operations represented a higher proportion of our total manufacturing costs in 2008. We incurred charges associated with our global supply chain initiative (primarily employee separation costs, facility closure costs, and accelerated depreciation)
amounting to $16.5 million and $11.3 million in 2008 and 2007, respectively. The year-over-year increase in these charges were primarily attributable to higher employee separation and related expenses that we were required to accrue for certain
foreign employees when we announced the facility closure plans in September 2008.
Full year amortization of purchased intangibles affecting gross profit was $9.4 million, compared to $9.5 million in 2007. Gross profit margin for 2008 remained relatively flat at 53 percent
compared to 2007.
SELLING, GENERAL AND ADMINISTRATIVE EXPENSES
2009 VERSUS 2008
Selling, general and administrative (“SG&A”) expenses increased $7.0 million, or 1
percent, compared to 2008. Excluding the favorable effect of foreign currency translation, SG&A expenses increased $18.7 million, or 4 percent. The increase was primarily attributable to increased employee-related costs driven by: higher
incentive compensation costs; salary increases; higher stock market prices associated with our unfunded Supplement Savings and Retirement Plan; higher stock-based compensation expenses associated with changes made to equity compensation plans in
prior years; and the absence of a curtailment gain in 2008 related to our postretirement benefits plan. Additionally, we completed the acquisitions of Guava Technologies, BioAnaLab and the remaining 60 percent ownership of our India joint venture in
2009, which resulted in acquisition and integration costs. We did not complete any business acquisitions in 2008. These increases were offset by the absence this year of employee separation charges incurred as a result of market conditions that
caused revenue declines in our Bioprocess Division and a fixed asset impairment loss related to an idle facility. Amortization expense was also lower in 2009 as the economic benefit of purchased intangibles decreases with the passage of time. Full
year amortization of purchased intangibles affecting SG&A was $49.2 million, compared to $53.7 million in 2008.
|
|
|
| 46 |
|
MILLIPORE FORM 10-K 2009
|
PART II
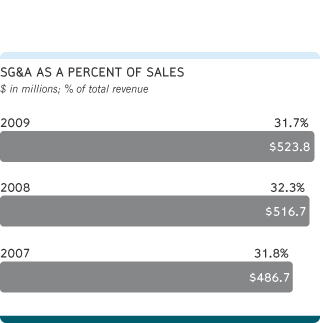
2008 VERSUS 2007
SG&A expenses
increased $30.0 million, or 6 percent, compared to 2007. Foreign currency translation accounted for a 3 percentage point year-over-year increase. Other primary drivers of the increase were higher employee compensation, separation expenses associated
with our ongoing efforts to streamline operations, increased stock-based compensation expense, a fixed asset impairment loss, and higher amortization of intangible assets. Stock-based compensation expense of $17.3 million in 2008 increased $5.5
million, or 46 percent, over 2007 as a result of changes we made to our equity compensation plans in 2004. The fixed asset impairment loss amounted to $5.8 million and was related to an idle facility. These costs were partially offset by a
curtailment gain of $2.7 million related to amendments to our U.S. postretirement benefits plan. Full year amortization of purchased intangibles affecting SG&A was $53.7 million, compared to $48.9 million in 2007.
RESEARCH AND DEVELOPMENT EXPENSES
2009 VERSUS 2008
R&D increased $12.0 million, or 12 percent, compared to 2008. Excluding the effect of favorable
foreign currency translation, R&D expenses increased $13.4 million, or 13 percent. The increase was primarily the result of increased employee related costs, higher investments in R&D projects, strategic investments and payments to
third-party technology partners to support innovation, and the inclusion this year of Guava R&D expenses. A component of our innovation strategy is to enhance our internal R&D capabilities through investments in technology collaborations and
license arrangements that will help us to develop innovative new products and capture greater value for our customers. The strength of our business provided us the flexibility to continue to make strategic investments during the economic downturn
which will benefit future growth.
2008 VERSUS 2007
R&D expenses decreased $4.4 million, or 4 percent, compared to 2007. The decreases were primarily the result of the timing of project spending. Our 2008 R&D expenses also decreased $1.4 million because of higher R&D credits
resulting from a change in legislation.
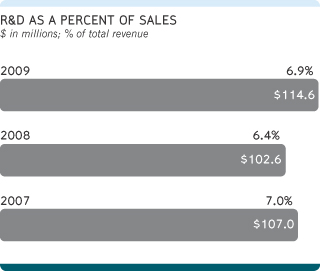
|
|
|
| MILLIPORE FORM 10-K 2009 |
|
47 |
PART II
INTEREST INCOME/EXPENSE
INTEREST INCOME/EXPENSE
$ in millions
|
|
|
|
|
|
|
|
|
|
| |
|
2009 |
|
2008
(As Adjusted) |
|
2007
(As Adjusted) |
| Interest income |
|
$ |
0.7 |
|
$ |
0.9 |
|
$ |
1.5 |
| Interest expense |
|
$ |
58.3 |
|
$ |
70.1 |
|
$ |
78.5 |
| Average interest rate during the year |
|
|
5.8% |
|
|
6.0% |
|
|
5.9% |
2009 VERSUS 2008
Interest expense decreased $11.8 million, or 17 percent, compared to 2008. Excluding the effect of foreign currency translation, interest expense
decreased $12.7 million, or 18 percent. The decrease was primarily the result of lower overall debt balances as we continued to repay our debt and, to a lesser extent, lower base rates under our revolver borrowings. Our adoption of the new
accounting standard for convertible debt that may be settled in cash upon conversion added a non-cash interest expense of $14.7 million and $13.7 million for 2009 and 2008, respectively. Our revolving credit facilities are comprised of floating rate
borrowings. Increases or decreases to these rates would cause increases or decreases to our interest expense, respectively.
2008 VERSUS 2007
Interest expense decreased $8.4 million, or 11 percent, compared to 2007. The decrease was primarily the result of lower debt balances year over year.
This was somewhat offset by the effect of a stronger Euro on our Euro-denominated debt. Our adoption of the new accounting standard for convertible debt that may be settled in cash upon conversion added a non-cash interest expense of $13.7 million
and $12.7 million for 2008 and 2007, respectively.
PROVISION FOR INCOME TAXES
We provide for U.S. income taxes on the earnings of foreign subsidiaries unless they are considered indefinitely invested outside the U.S. We elected to treat the earnings of our Ireland, the United Kingdom
(“UK”), and Sweden subsidiaries as indefinitely invested outside the U.S. These elections were made based on our operating plans and foreign debt service requirements. Our effective income tax rates for 2009, 2008, and 2007 reflected the
tax benefit associated with lower tax rates on earnings from these three subsidiaries.
EFFECTIVE INCOME TAX RATE
|
|
|
|
|
|
|
|
|
|
| |
|
2009 |
|
|
2008
(As Adjusted) |
|
|
2007
(As Adjusted) |
|
| U.S. statutory federal income tax rate |
|
35.0 |
% |
|
35.0 |
% |
|
35.0 |
% |
| Ireland, Sweden and UK tax rate benefit |
|
(14.4 |
) |
|
(17.2 |
) |
|
(22.7 |
) |
| State income tax, net of federal income tax benefit |
|
(0.3 |
) |
|
(0.7 |
) |
|
(0.3 |
) |
| Change in valuation allowance |
|
(0.4 |
) |
|
0.6 |
|
|
0.7 |
|
| Net decrease in tax reserves |
|
(0.5 |
) |
|
(0.3 |
) |
|
(7.9 |
) |
| Other |
|
(1.0 |
) |
|
(3.3 |
) |
|
0.9 |
|
| Effective tax rate |
|
18.4% |
|
|
14.1% |
|
|
5.7% |
|
2009 VERSUS 2008
The increase in the effective tax rate in 2009 compared to 2008 was primarily attributable to the fact that profits in our lower tax rate jurisdictions constituted a
lower percentage of total consolidated profit before income taxes.
|
|
|
| 48 |
|
MILLIPORE FORM 10-K 2009
|
PART II
The lower income tax rates from our operations in Ireland, Sweden, and the UK resulted in 14.4 percentage point reduction in our effective tax rate, compared to 17.2 percentage point reduction in
2008. During 2009, three significant items provided a discrete tax benefit to the effective tax rate. We recorded $2.8 million of previously unrecognized tax benefits as a result of statute of limitations closures. We recognized a $2.0 million tax
benefit associated with realization of R&D tax credits. Our effective income tax rate also benefited from the $8.5 million non-taxable gain on the Guava acquisition.
Over the next 12 months, we may need to record up to $3.3 million of previously unrecognized tax benefits in the event of statute of limitations closures.
2008 VERSUS 2007
The higher effective tax rate in 2008 compared to
2007 was caused by a shift in the jurisdictional mix of our profits to higher tax rate jurisdictions and less previously unrecognized tax benefits. Lower income tax rates from our Ireland, the UK and Sweden subsidiaries resulted in a 17.2 percentage
point reduction in our effective tax rate, compared to 22.7 percentage point reduction in 2007. During 2008, we recorded $1.6 million of previously unrecognized tax benefits as a result of statute of limitations closures. We also released
valuation allowances on certain R&D tax credits amounting to $1.1 million as a result of a tax law change in the United States.
Another main reason
for our lower effective tax rate in 2007 was the recognition of $11.9 million of previously unrecognized tax benefits as a result of statute of limitations closures and a pretax income mix favoring lower tax rate jurisdictions.
In the normal course of business, we are examined by various tax authorities, including the Internal Revenue Service (the “IRS”). In 2008, the IRS concluded
its examination of years 2004 and 2005, without any significant adjustments.
OPERATING PROFIT, NET INCOME AND DILUTED EARNINGS PER SHARE
OPERATING PROFIT, NET INCOME AND DILUTED EARNINGS PER SHARE
$ in millions, except per share data
|
|
|
|
|
|
|
|
|
|
| |
|
2009 |
|
2008
(As Adjusted) |
|
2007
(As Adjusted) |
| Operating profit |
|
$ |
268.6 |
|
$ |
233.5 |
|
$ |
216.7 |
| Operating profit margin |
|
|
16.2% |
|
|
14.6% |
|
|
14.2% |
| Net income attributable to Millipore |
|
$ |
177.0 |
|
$ |
137.6 |
|
$ |
128.2 |
| Diluted earnings per share |
|
$ |
3.15 |
|
$ |
2.47 |
|
$ |
2.33 |
| Non-GAAP net income attributable to Millipore* |
|
$ |
224.7 |
|
$ |
200.1 |
|
$ |
184.8 |
| Non-GAAP earnings per share* |
|
$ |
4.00 |
|
$ |
3.59 |
|
$ |
3.36 |
* See non-GAAP
reconciliation on page 63 for more information.
2009 VERSUS 2008
Operating profit increased $35.1 million, or 15 percent, compared to 2008 primarily as a result of higher revenues, operational efficiencies and favorable effect of foreign currency translation. These increases
were partially offset by higher employee-related costs and higher investments in research and development. On a GAAP basis, the 29 percent increase in net income attributable to Millipore was the result of higher operating profit, the $8.5 million
gain on the Guava acquisition, and lower interest expense. The favorable effects were partially offset by a higher tax rate in 2009. On a non-GAAP basis, the 12 percent increase in net income attributable to Millipore was the result of higher
operating profit and lower interest expense. The favorable effects were partially offset by a higher tax rate in 2009.
|
|
|
| MILLIPORE FORM 10-K 2009 |
|
49 |
PART II
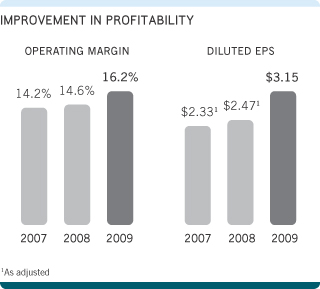
2008 VERSUS 2007
Operating profit
increased $16.8 million, or 8 percent, compared to 2007 primarily as a result of higher gross profit and lower R&D expenses, offset by higher SG&A expenses and unfavorable effect of foreign currency translation. On a GAAP basis, the 7
percent increase in net income attributable to Millipore and 6 percent increase in diluted earnings per share were attributable to higher operating profit and lower interest expense, partially offset by a higher tax rate in 2008. On a non-GAAP
basis, the 8 percent increase in net income attributable to Millipore and 7 percent increase in diluted earnings per share were attributable to higher operating profit and lower interest expense.
Capital Resources and Liquidity
The following table shows information about our capitalization as of the dates indicated:
NET DEBT*
$ in millions
|
|
|
|
|
|
|
|
|
|
| |
|
2009 |
|
2008
(As Adjusted) |
|
2007
(As Adjusted) |
| Total debt |
|
$ |
933.1 |
|
$ |
1,086.4 |
|
$ |
1,204.4 |
| Cash and cash equivalents |
|
$ |
168.3 |
|
$ |
115.5 |
|
$ |
36.2 |
| Net debt* |
|
$ |
764.8 |
|
$ |
970.9 |
|
$ |
1,168.2 |
* Non-GAAP. See page 62 for more information.
We assess our liquidity in terms of our ability to generate cash to fund our operating, investing, and financing activities. Our primary ongoing cash
requirements will be to fund operations, capital expenditures, investments in businesses, debt service, and share repurchase. Our primary sources of liquidity are internally generated cash flows and borrowings under our revolving credit facility.
Significant factors affecting the management of our ongoing cash requirements are the adequacy of available bank lines of credit and our ability to attract long-term capital with satisfactory terms. The sources of our liquidity are subject to all of
the risks of our business and could be adversely affected by, among other factors, a decrease in demand for our products, our ability to integrate acquisitions, deterioration in certain financial ratios, and market changes in general.
The global economic recession had an adverse impact on financial market activities including, among other things, volatility in security prices, diminished liquidity
and credit availability, and declining valuations of certain investments. Except for slower growth in revenues from certain products, there has not been any significant negative impact to our financial position, results of operations, or liquidity
to date. There can be no assurance, however, that changing circumstances will not affect our future financial position, results of operations, or liquidity.
|
|
|
| 50 |
|
MILLIPORE FORM 10-K 2009
|
PART II

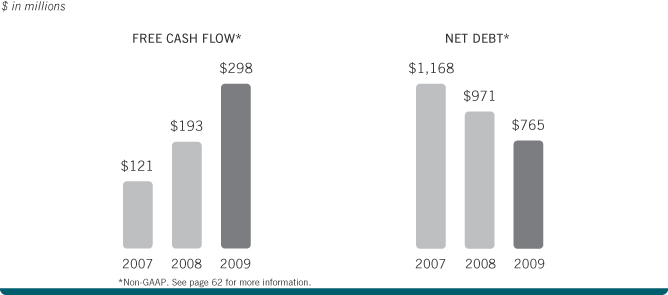
The cost of additional or replacement financing is partly a function of our debt to capitalization levels, credit
standing, and financial market conditions. Our credit ratings are reviewed regularly by major debt rating agencies such as Standard & Poor’s and Moody’s Investors Service. The chart below summarizes our current ratings.
|
|
|
|
|
| |
|
Moody’s |
|
Standard & Poor’s |
| Primary revolving credit facility |
|
Baa2 |
|
BBB |
| 5.875% senior notes |
|
Ba2 |
|
BBB |
| 3.75% convertible senior notes |
|
— |
|
BB- |
| Millipore corporate rating |
|
Ba1 |
|
BB+ |
We believe our
future operating cash flows will be sufficient to meet our future operating and investing cash needs. The availability of borrowings under our primary revolving credit
facility and our ability to obtain equity financing provide additional potential sources of liquidity should they be required. We intend to utilize excess cash generated from our operations to
fund future acquisitions while preserving an appropriate level of cash needed for our operations. We may from time to time seek to retire or purchase our outstanding obligations. We may also seek to repurchase shares of our common stock. Such
repurchases or exchanges, if any, will depend on prevailing market conditions, our liquidity requirements, contractual restrictions, and other factors. The amounts involved may be material.
The repatriation of cash balances from certain of our subsidiaries could have adverse tax consequences. However, these cash balances are generally available without
legal restrictions to fund ordinary business operations. We have transferred, and will continue to transfer, cash from our subsidiaries to us and to other international subsidiaries when it is necessary and cost effective to do so.
|
|
|
| MILLIPORE FORM 10-K 2009 |
|
51 |
PART II
We anticipate the need to obtain fixed-rate debt on or before December 1, 2011 as a result of certain put provisions of our convertible notes. In
August 2009, we entered into forward starting interest rate swap agreements with a total notional amount of $300 million. The objective of these interest rate swaps is to hedge the variability of the forecasted interest payments on this anticipated
fixed-rate debt. The fixed rate on these interest rate swap agreements is 4.6225 percent. At December 31, 2009, the fair value of these interest rate swap agreements was a gain of $4.9 million, which was recognized in accumulated other
comprehensive income. The net gain or loss from these cash flow hedges will fluctuate as interest rates change.
CASH FLOWS
The following table summarizes our sources and uses of cash over the periods indicated:
SOURCES AND USES OF CASH
$ in millions
|
|
|
|
|
|
|
|
|
|
|
|
|
| |
|
2009 |
|
|
2008 |
|
|
2007 |
|
| Net cash provided by operating activities |
|
$ |
370.2 |
|
|
$ |
269.6 |
|
|
$ |
222.2 |
|
| Less: additions to property, plant and equipment |
|
|
(72.1 |
) |
|
|
(76.5 |
) |
|
|
(101.7 |
) |
| Free cash flow* |
|
$ |
298.1 |
|
|
$ |
193.1 |
|
|
$ |
120.5 |
|
| Net cash used in investing activities |
|
$ |
(107.3 |
) |
|
$ |
(113.7 |
) |
|
$ |
(113.5 |
) |
| Net cash used in financing activities |
|
$ |
(220.8 |
) |
|
$ |
(70.0 |
) |
|
$ |
(153.4 |
) |
| Increase (decrease) in cash and cash equivalents |
|
$ |
52.9 |
|
|
$ |
79.3 |
|
|
$ |
(41.3 |
) |
* Non-GAAP. See page 62
for more information.
OPERATING CASH FLOWS
Cash provided by operating activities was $370.2 million for 2009 and was primarily attributable to our net income
of $179.2 million, non-cash items totaling $163.4 million (primarily depreciation and amortization expenses, stock-based compensation expense, and debt discount amortization), and a working
capital decrease of $27.6 million. Our working capital decrease was primarily the result of improvements in our cash collection and inventory management processes and change in income taxes payable. Compared to the prior year, we achieved a 7 day
improvement in days sales outstanding to 59 days. We implemented a new collections software and streamlined our working practices using Lean Six Sigma® methodologies in 2009. These resulted in better customer communication and faster cash collection. Additionally, we achieved an 11 day improvement in our days supply
in ending inventory to 118 days resulting from our global supply chain initiatives that contributed to reductions in lead and cycle times, manufacturing lot sizes, and safety stock levels. Lastly, our income taxes payable balance increased, which
was attributable to a significant prepaid income tax balance in 2008 resulting from a change in R&D tax credit regulations and jurisdictional profit mix. Partially offsetting these working capital decreases was a $10.5 million discretionary
pension funding contribution to our U.S pension plan, a self insurance funding prepayment of $5.0 million, and accelerated supplier payments to take advantage of early vendor payment discounts.
INVESTING CASH FLOWS
Cash used in investing
activities was $107.3 million for 2009. We paid $72.1 million for capital expenditures and $29.9 million for the acquisitions of Guava and BioAnaLab, net of cash acquired. We expect our 2010 capital expenditures will be approximately $80
million.
FINANCING CASH FLOWS
Cash
used for financing activities was $220.8 million for 2009. We acquired the remaining 60 percent ownership of our joint venture in India for $58.1 million. Net repayments of our borrowings under our primary revolving credit facility amounted to
$208.2 million and net borrowings of short-term debt amounted to $34.9 million.
|
|
|
| 52 |
|
MILLIPORE FORM 10-K 2009
|
PART II
In 2009, we fully repaid all borrowings under our primary revolver. Additionally, we received proceeds of $13.2 million from the exercises of employee stock options and paid dividends of $2.6
million to our joint venture partner.
FINANCING COMMITMENTS
Short-term debt
Short-term debt consisted of borrowings under our operating bank facilities and two
short-term revolving credit facilities in Japan. These credit facilities provide for cumulative borrowings of ¥7.0 billion, or $75.3 million, with an interest rate of TIBOR plus an applicable margin. Interest is payable at the end of an interest
period based upon the term of the borrowing. These credit facilities expire in December 2010 and are subject to annual renewal at terms consistent with the initial agreements. As of December 31, 2009, we had ¥3.1 billion, or $33.5 million,
available for borrowing under these credit facilities. We are not required to comply with any debt covenants under these agreements.
Primary revolving credit facility
We have a five-year unsecured revolving credit facility (the “Revolver”) that expires in
June 2011.
The Revolver provides for a maximum borrowing of €465.0 million, or $665.8 million. We may elect to increase the credit facility by an amount not in excess of €130.0 million, or $186.1 million. We may prepay any outstanding borrowings in whole or in part without premium or penalty. We are required to pay an unused commitment fee ranging between 0.0675 percent
and 0.60 percent annually based on the Revolver’s debt rating.
We are required to maintain certain leverage and interest coverage ratios as set
forth in the Revolver agreement. In general, the leverage ratio is calculated by dividing our total outstanding indebtedness at December 31, 2009 by our cumulative cash earnings for the twelve months ended December 31, 2009. The
interest coverage ratio is calculated by dividing our cumulative cash earnings for the twelve months ended December 31, 2009 by our
cumulative gross interest expense for the twelve months ended December 31, 2009.
The
following table summarizes the financial covenant requirements as of December 31, 2009 and thereafter and our compliance with these covenants as of December 31, 2009:
REVOLVER AGREEMENT COVENANTS
|
|
|
|
|
| |
|
Requirement |
|
Actual at
December 31, 2009 |
| Maximum leverage ratio |
|
3.50:1 |
|
2.19:1 |
| Minimum interest coverage ratio |
|
3.50:1 |
|
9.74:1 |
Our ability to
continue to comply with these covenants will depend primarily on the success in growing our business and generating strong operating cash flows. Future compliance with the covenants may be adversely affected by various economic, financial, and
industry factors. Noncompliance with the covenants would constitute an event of default under the Revolver, allowing the lenders to accelerate repayment of any outstanding borrowings at this time.
As of December 31, 2009, we had no borrowings outstanding under the Revolver. The borrowing capacity allowed by our debt covenants under the Revolver was $665.8
million at December 31, 2009.
3.75% convertible senior notes due 2026
In June 2006, we issued $565.0 million in aggregate principal amount of convertible senior notes (the “Convertible Notes”) in a private placement offering.
The Convertible Notes will mature on June 1, 2026. We used the net proceeds from this offering to complete the acquisition of Serologicals on July 14, 2006. The Convertible Notes bear interest at 3.75 percent per annum, payable
semi-annually in arrears on June 1 and December 1 of each year. Commencing with the six-month period beginning on December 1, 2011, if the average trading price of the Convertible Notes for the five consecutive trading days preceding
such six-month periods equals 120 percent or more of the principal amount, contingent interest will
|
|
|
| MILLIPORE FORM 10-K 2009 |
|
53 |
PART II
accrue at the rate of 0.175 percent of the average trading price of the Convertible Notes.
The
Convertible Notes are our senior unsecured obligations and rank equally with all of our existing and future senior unsecured indebtedness. The Convertible Notes are effectively subordinated to all of our existing and future secured indebtedness and
all existing and future liabilities of our subsidiaries, including trade payables.
Holders of the Convertible Notes may convert their notes into cash
and, if applicable, shares of our common stock prior to June 1, 2026 under certain conditions. The Convertible Notes will be convertible at any time from November 1, 2011 through December 1, 2011 and any time on or after June 1,
2024. Upon conversion, the Convertible Notes will be converted into cash for the principal amount and shares of our common stock for the conversion premium, if any, based on an initial conversion rate of 11.0485 shares per $1,000 principal amount
(which represents an initial conversion price of approximately $90.51 per share), subject to adjustments.
On or after December 1, 2011, we have the
option to redeem the Convertible Notes at a redemption price equal to 100 percent of the principal amount of the notes, plus accrued but unpaid interest. On each of December 1, 2011, June 1, 2016 and June 1, 2021, holders of the
Convertible Notes have the option to require us to purchase all or a portion of their notes at a purchase price in cash equal to 100 percent of the principal amount of the notes, plus accrued but unpaid interest.
Although we are not required to maintain any specified financial ratios under the Convertible Notes agreement, we will be considered in default if we fail to fulfill
our conversion or redemption obligations, make required interest payments, provide notice to holders of the Convertible Notes in certain specified circumstances, or cure our default on any of our indebtedness or that of our subsidiaries in the
aggregate principal amount of $50 million or more. If an event of default has occurred and is continuing, the principal amount of the Convertible Notes plus interest thereon may become immediately due and payable. We are currently in compliance with
the covenant restrictions.
5.875% senior notes due 2016
In June 2006, we issued €250.0 million in aggregate principal amount of 5.875 percent senior notes
(the “Euro Notes”) due 2016. Interest is payable semi-annually in arrears on June 30 and December 30 of each year. The Euro Notes were issued at 99.611 percent of the principal amount, which resulted in an original issue discount
of €1.0 million. The Euro Notes are our senior unsecured obligations and rank equally with all of our existing and future senior unsecured
indebtedness.
Upon the occurrence of any change in control, holders of the Euro Notes may require us to repurchase all of their Euro Notes for a cash
price equal to 101 percent of the principal amount, plus accrued and unpaid interest thereon. Before June 30, 2016, we may, at our option, redeem the Euro Notes, in whole or in part, for cash, at a redemption price equal to 100 percent of the
principal amount of the Euro Notes we redeem, plus an applicable “make-whole” premium. In addition, upon the occurrence of certain tax events in the United States, we may redeem, at our option, in whole but not in part, at a redemption
price equal to the principal amount, plus accrued and unpaid interest.
The indenture for the Euro Notes places certain restrictions on our ability to
create, incur, assume or suffer liens on our manufacturing plants and other principal facilities in the United States and ability to enter into certain sale leaseback transactions. We would also be considered in default if we fail to fulfill our
redemption obligations, make required interest payments, provide notice to holders of the Euro Notes in certain specified circumstances, or cure our default on any of our indebtedness or that of our subsidiaries in the aggregate principal amount of
$50 million or more. If an event of default has occurred and is continuing, the principal amounts of the Euro Notes plus any accrued interest thereon may become immediately due and payable. We are currently in compliance with the covenant
restrictions.
|
|
|
| 54 |
|
MILLIPORE FORM 10-K 2009
|
PART II
CONTRACTUAL OBLIGATIONS AND COMMERCIAL COMMITMENTS
The following table summarizes our minimum future payments under our contractual obligations at December 31, 2009:
OBLIGATIONS AND COMMITMENTS OUTSTANDING
In millions, at December 31, 2009
|
|
|
|
|
|
|
|
|
|
|
|
|
|
|
|
| |
|
Total |
|
Less than
1 year |
|
1–3 years |
|
3–5 years |
|
More than
5 years |
| Long-term debt obligations |
|
$ |
1,409.3 |
|
$ |
42.3 |
|
$ |
84.4 |
|
$ |
84.4 |
|
$ |
1,198.2 |
| Non-cancellable operating leases |
|
|
94.2 |
|
|
31.4 |
|
|
33.6 |
|
|
13.6 |
|
|
15.6 |
| Employee pension and postretirement medical plans |
|
|
69.7 |
|
|
5.0 |
|
|
10.8 |
|
|
13.2 |
|
|
40.7 |
| Non-cancellable purchase obligations |
|
|
100.5 |
|
|
80.0 |
|
|
9.9 |
|
|
4.4 |
|
|
6.2 |
| Total |
|
$ |
1,673.7 |
|
$ |
158.7 |
|
$ |
138.7 |
|
$ |
115.6 |
|
$ |
1,260.7 |
Long-term debt obligations include estimated interest payments on our 3.75 percent Convertible Notes and our 5.875
percent Euro Notes for the respective periods presented above.
We maintain various defined benefit pension and postretirement plans for the benefit of
our employees. At December 31, 2009, our U.S. pension plan and postretirement benefit plans were under-funded by $8.3 million and $3.0 million, respectively. At December 31, 2009, our foreign retirement plans were under-funded by $18.7
million. We anticipate minimum funding for these plans will be approximately $2.0 million in 2010. Amounts included in the table above for employee pension and postretirement medical plans reflect projected benefit payments. Our future pension
expense and pension liabilities will be affected by fluctuations in future discount rates as well as the fair market value of assets used to fund these plans. Additionally, we intend to terminate our U.S. pension plan when it is cost effective to do
so. Upon settlement, we will be required to make a final cash payment which may be significant. We cannot reasonably estimate the cash outflow requirements as the amounts will not be determinable until the actual settlement occurs.
Our non-cancellable purchase obligations include obligations related to the future purchase of goods and services, capital lease obligations, and other long-term
liabilities reflected on our balance sheet.
The above table does not reflect unrecognized tax benefits of $26.1 million, the timing of which is uncertain. We
cannot make reasonably reliable estimates of the period of cash settlement with tax authorities.
Critical Accounting Estimates
Preparation of our financial statements requires management to make estimates, judgments, and assumptions that affect the reported amounts of assets,
liabilities, revenues, and expenses. Note 2 to the consolidated financial statements describes the significant accounting policies used in the preparation of our consolidated financial statements. Management believes the most complex and sensitive
judgments result primarily from the need to make estimates about the effects of matters that are inherently uncertain and are significant to the consolidated financial statements. The most significant areas involving management estimates, judgments,
and assumptions are described below. Actual results in these areas could differ from management’s estimates.
|
|
|
| MILLIPORE FORM 10-K 2009 |
|
55 |
PART II
REVENUE RECOGNITION
Revenue from the sale of products is recognized when we meet all of the criteria for revenue recognition in financial statements. These criteria include:
|
|
evidence of an arrangement is in place; |
|
|
related prices are fixed or determinable; |
|
|
delivery or performance has occurred; and |
|
|
collection of the resulting receivable is reasonably assured. |
Customer purchase orders or sales agreements evidence our sales arrangements. These purchase orders and sales agreements specify both selling prices and quantities, which are the basis for recording sales revenue. Trade terms for the
majority of our sales contracts indicate that title and risk of loss pass from us to our customers when we ship products from our facilities, which is when revenue is recognized. Revenue is deferred until our products arrive at customers’
facilities in situations where trade terms indicate that title and risk of loss pass from us to the customers upon their receipt of our products. We perform ongoing credit evaluations of our customers and ship products only to customers that satisfy
our credit evaluation. We also maintain allowances for doubtful accounts for estimated losses resulting from our customers’ inability to make required payments. We have not experienced any significant deterioration in the credit quality of our
customers or the age of our customer receivables as a result of the global economic recession.
Consumable and hardware products account for over 90
percent of our total consolidated revenues and are typically sold with standard terms and conditions. Revenues for these products are generally recognized upon shipment or delivery to the customers. In instances where we sell filtration systems and
laboratory instrumentation products with a related installation obligation, we generally recognize revenue related to these products when title passes and recognize revenue related to the installation when installation is complete. The allocation of
revenue between the product and the installation service is based on relative fair value at the time of sale.
In limited cases, our customers may require site acceptance testing for certain customized products built to
customers’ specifications. Revenues on these products are deferred upon shipment and are recognized when site acceptance testing is completed.
Revenue from service arrangements is recognized when the services are provided or over the contractual period. Installation and maintenance service revenues are recognized when the site service visit is completed. Validation testing
services revenue is recognized when the contracted
study is completed and accepted by the customer. Sample analysis services revenue is recognized as
each sample analysis is completed. Assay development and assay validation service revenue is recognized proportionally as contractually defined deliverables are provided to the customer. Revenue related to maintenance and warranty service contracts
is recognized ratably over the contractual period or as the services are performed, based on the terms of the arrangement.
License and royalty revenue
is recognized when the amounts are determinable and we have fulfilled our obligations under the applicable agreement. This generally occurs when cash payments are received or licensed sales are reported to us.
INVENTORY VALUATION
Significant judgment is required
to estimate the net realizable value of our inventory. Our product life cycle is generally a minimum of 2 years and may be in excess of 20 years. Therefore, we generally rely on recent historic usage, expiration dates, and estimated future demand in
estimating the realizable value of our inventory. Finished goods and components that are determined to be obsolete are written off when such determination is made. In certain cases, such as for newly introduced products and overstocked products,
estimated future demand is considered in establishing inventory write-downs. Raw material and work-in-process inventories are also reviewed for obsolescence and alternative or future use based on reviewing manufacturing plans, estimated future
demand, and market conditions.
|
|
|
| 56 |
|
MILLIPORE FORM 10-K 2009
|
PART II
In situations where it is determined that work-in-process inventories cannot be converted into finished goods, the inventories are written down to net realizable value. Inventory at
December 31, 2009 reflected cumulative net realizable value write-downs of $35.6 million. Should it be determined that write-downs are insufficient, we would be required to record additional inventory write-downs, which would have a negative
impact on gross profit margin. Once recorded, inventory valuation provisions are not subsequently reversed unless the related inventory items are sold to third parties.
VALUATION OF LONG-LIVED ASSETS
Valuation of certain long-lived assets including property, plant and
equipment, intangible assets, and goodwill requires significant judgment. Assumptions and estimates are used in determining the fair value of assets acquired and liabilities assumed in a business acquisition. A significant portion of the purchase
price in our acquisitions is assigned to intangible assets and goodwill. Assigning value to intangible assets requires that we use significant judgment in determining the fair value and whether such intangibles assets are amortizable. For intangible
assets, we exercise judgment in determining the period and the method by which the intangible assets will be amortized. We utilize commonly accepted valuation techniques, such as the income approach and the cost approach, as appropriate, in
establishing the fair value of long-lived assets. Typically, key assumptions include projected revenue and expense levels used in establishing the fair value of business acquisitions as well as discount rates based on an analysis of our weighted
average cost of capital, which is adjusted for specific risks associated with the assets. Changes in the initial assumptions may lead to changes in amortization expense recorded in our future financial statements.
We assess the carrying value of intangible assets and property, plant and equipment whenever events or changes in circumstances indicate that the carrying value may
not be recoverable. Factors we consider important which could
trigger an impairment review include, but are not limited to, the following:
|
|
significant underperformance relative to expected historical or projected future operating results; |
|
|
significant negative industry or economic trends; or |
|
|
significant changes or developments in strategy or operations that negatively affect the utilization of our long lived-assets. |
Should we determine that the carrying value of long-lived tangible and intangible assets may not be recoverable, we will measure any impairment based on a projected
discounted cash flow method using a discount rate determined by management to be commensurate with the risk inherent in our current business model. We may also estimate fair value based on market prices for similar assets, as appropriate.
Significant judgments are required to estimate future cash flows and to select the appropriate discount rates and other assumptions. Changes in these estimates and assumptions could materially affect the determination of fair value for these assets.
We perform annual reviews in our second quarter for impairment of goodwill and whenever events or changes in circumstances would more likely than not
reduce the fair value of a reporting unit below its carrying value. Goodwill may be considered to be impaired if we determine that the carrying value of a reporting unit, including goodwill, exceeds the reporting unit’s fair value. Our
reporting units are our Bioprocess and Bioscience operating segments. Assessing the impairment of goodwill requires us to make assumptions and judgments regarding the fair value of the net assets of our reporting units. We estimate the fair value of
our reporting units using a combination of valuation techniques, including discounted cash flows and cash earnings multiples, and compare the values to our estimated enterprise value. Our annual impairment test did not indicate any impairment on our
goodwill. Terminal growth rate and weighted average cost of capital are significant assumptions in our analysis. Adjusting those assumptions by 10% would not have had an impact on the results of our impairment analysis.
|
|
|
| MILLIPORE FORM 10-K 2009 |
|
57 |
PART II
STOCK-BASED COMPENSATION
Stock-based
compensation expense is estimated as of the grant date based on the fair value of the stock-based compensation awards, which include stock options and restricted stock units. We estimate the fair value of our stock options using the Black-Scholes
option-pricing model and the fair value of our restricted stock units based on the quoted market price of our common stock at the date of grant. Estimating the fair value of stock options requires judgment including the expected term of our stock
options, volatility of our stock, expected dividends, and risk-free interest rates over the expected term of the options. The expected term represents the average time that options are expected to be outstanding and is estimated based on the
historical exercise, post-vesting cancellation and expiration patterns of our stock-based awards. The expected volatility rates are estimated based on historical volatilities of our common stock over a period of time that approximates the expected
term of the options. Expected dividends are estimated based on our dividend history as well as our current projections. The risk-free interest rate for periods approximating the expected terms of the options is based on the U.S. Treasury yield curve
in effect at the date of grant.
We recognize stock-based compensation expense in our consolidated statement of operations over the requisite service
period of the awards, which generally represents the vesting period, net of estimated forfeitures. Forfeiture rates are estimated based on historical pre-vesting forfeiture history and are updated on a quarterly basis to reflect actual forfeitures
of unvested awards and other known events. For stock-based compensation awards that vest over time based on employment, we recognize the associated compensation expense on a straight line basis over the requisite service period. For
performance-based restricted stock units, we recognize the related compensation expense ratably over the vesting period when it is probable that the performance targets are expected to be achieved based on management’s projections. We evaluate,
on a quarterly basis, the probability that the target performance goals will be achieved, if at all, and the anticipated level of achievement.
In 2009, we recognized stock-based compensation expense on restricted stock units, stock options, and performance-based restricted stock units of $17.3 million, $7.3 million, and $2.2 million,
respectively.
INCOME TAXES
We prepare
and file tax returns based on our interpretation of tax laws and regulations and record estimates based on these judgments and interpretations. In the normal course of business, our tax returns are subject to examination by various taxing
authorities, which may result in future tax, interest, and penalty assessments by these authorities. Inherent uncertainties exist in estimates of many tax positions because of changes in tax law resulting from legislation, regulation, and tax court
rulings in various tax jurisdictions. Because significant judgment is required in determining our worldwide provision for income taxes, we periodically assess our income tax positions and record tax benefits for all years subject to examination
based on our evaluation of the facts, circumstances, and information available at the reporting date. For those tax positions with a greater than 50 percent likelihood of being realized upon ultimate settlement with a taxing authority that has all
relevant information, we record a tax benefit. For those income tax positions that are not likely to be sustained, no tax benefit is recognized in the consolidated financial statements. We believe that our estimates for uncertain tax positions are
appropriate and sufficient to pay assessments that may result from examinations of our tax returns. Any reduction of these contingent liabilities or additional assessment would increase or decrease income, respectively, in the period such
determination is made. As of December 31, 2009, we had $26.1 million unrecognized tax benefits. In 2009, we reduced our uncertain tax positions by $2.8 million as a result of completion of tax examinations and statute of limitations closures.
We recognize both accrued interest and penalties related to unrecognized tax benefits in income tax expense. Over the next 12 months, we may need to record up to $3.3 million of previously unrecognized tax benefits in the event of statute of
limitations closures.
|
|
|
| 58 |
|
MILLIPORE FORM 10-K 2009
|
PART II
We are a worldwide business operating in numerous countries under many legal forms and, as a result, are subject to the jurisdiction of numerous domestic
and non-U.S. tax authorities as well as tax agreements and treaties among these governments. Determination of taxable income in any jurisdiction requires the interpretation of the related tax laws and regulations and the use of estimates and
assumptions regarding significant future events, such as the amount, timing and character of deductions, permissible revenue recognition methods under the tax law, and the sources and character of income and tax credits. Changes
in tax laws, regulations, agreements and treaties, currency exchange restrictions, or our profitability in each taxing jurisdiction could have an impact upon the
amount of our provision for income taxes and our net income. We provide for U.S. income taxes on the earnings of foreign subsidiaries unless they are considered indefinitely invested outside the U.S. We elected to treat the earnings of our Ireland,
the United Kingdom, and Sweden subsidiaries as indefinitely invested outside the U.S. These elections were made based on our operating plans.
We have
recorded valuation allowances against certain of our deferred tax assets. These primarily relate to federal tax research credits, state tax credits, and net operating loss carryforwards in certain jurisdictions. We do not consider unidentified tax
planning strategies in evaluating whether we would be able to more likely than not benefit from our deferred tax assets. Therefore, we may need to reverse valuation allowances in the future if these jurisdictions become profitable or we execute tax
planning strategies. This would result in a reduction to our provision for income taxes. At December 31, 2009, we had valuation allowances of $1.3 million related to federal research credits and $27.0 million related to state tax credits and
net operating loss carryforwards.
EMPLOYEE RETIREMENT PLANS
In the U.S., we sponsor a pension plan covering substantially all employees who had joined Millipore prior to January 1, 2006 and met certain eligibility requirements.
The pension plan was frozen as of December 31, 2006, after which no benefits accrued. All participants’ accrued benefits under the pension plan became fully vested as of that date.
Several key assumptions are used in calculating the expense and liability of the pension plan, typically on an annual basis. The most significant assumptions include the discount rate and the expected return on plan assets. In selecting the expected
return on plan assets, we considered the average rate of earnings expected on the funds invested or to be invested to provide for the benefits under the pension plan. This included considering the asset allocations and the expected returns likely to
be earned on
similar investments over the life of this plan. The assumed discount rate is intended to approximate the actual rate at which benefits
could effectively be settled. We used the Citigroup Pension Discount Curve as the benchmark rate for estimating our discount rate for pension expense. In addition, we update, as needed, other assumptions used in determining the expense and
liabilities of the plan, such as withdrawal and mortality assumptions based on the average age grouping of our plan participants and updated mortality tables published by the Society of Actuaries. The actuarial assumptions used by us may differ
materially from actual results due to changing market and economic conditions, higher or lower withdrawal rates, or longer or shorter life spans of the participants. These differences may have a significant effect on the amount of pension expense
recorded by us in future years. During 2009, we recognized our pension expense using a discount rate of 6.0 percent and an expected return on plan assets of 7.5 percent. Although they were the most sensitive assumptions, a 0.5 percentage point
change in either assumption would be immaterial to our results of operations and financial position.
We intend to terminate our U.S. pension plan when
it is cost effective to do so. Upon settlement of the pension liabilities at the time of plan termination, we expect to recognize settlement losses in our consolidated statement of operations and report cash payments as cash outflows from operating
activities in our consolidated statement of cash flows, which may be significant.
|
|
|
| MILLIPORE FORM 10-K 2009 |
|
59 |
PART II
We can not reasonably estimate the size of such losses and cash outflows because such amounts will be determined using market interest rates and funded status of our pension plan at the time of
actual plan termination.
In certain foreign subsidiaries, we also sponsor defined benefit pension plans for our employees. Accounting and reporting for
these plans requires the use of country specific assumptions for discount rates, expected returns on plan assets, and rates of compensation increases. We apply a consistent methodology to determine the key assumptions. Our discount rates are based
on high quality bond indices for durations that approximate the average remaining service periods of our plan participants in each country. We select expected long-term rates of return on plan assets based on the average rate of earnings expected on
funds invested or to be invested to provide for the benefits under these plans. Although the most sensitive assumptions used in calculating the expense and liability of our foreign pension plans are the discount rate and the expected rate of return
on plan assets, a 0.5 percentage point change in either assumption would be immaterial to our results of operations and financial position.
Market Risk
We are exposed to market risks, which include foreign currency exchange rate risk, interest rate risk, and credit risk. We
manage these market risks through our normal financing and operating activities and, when appropriate, through the use of derivative financial instruments.
FOREIGN CURRENCY EXCHANGE RATE RISK
We are exposed to foreign currency exchange rate risk inherent in revenues, net income, and
assets and liabilities denominated in currencies other than the U.S. dollar. The potential change in foreign currency exchange rates represents a substantial risk to us because approximately 66 percent of our business was conducted outside of the
United States for 2009, generally in foreign currencies. Our primary risk management strategy is to use forward exchange contracts to hedge certain foreign currency
exposures. The intent of this strategy is to offset gains and losses that occur on the underlying exposures with gains and losses resulting from the forward exchange contracts that hedge these
exposures. Principal hedged currencies include the Japanese Yen, Euro, Australian Dollar, and Canadian Dollar. Gains and losses resulting from changes in the value of the derivatives are either recognized currently in earnings or reported in other
comprehensive income, a separate component of equity, depending on whether the derivative has been designated and qualifies as an effective hedge.
As of
December 31, 2009, we had open forward exchange contracts designated as cash flow hedges of forecasted intercompany sales with total U.S. dollar equivalent notional amounts of approximately $174.0 million. These forward exchange contracts are
generally short-term in nature and mature through January 2011. Based on our analysis, a hypothetical adverse foreign exchange rate movement of 10 percent against our forward exchange contracts would have resulted in a net loss in fair value of
these contracts of approximately $18.4 million. In addition, we also hold forward exchange contracts to mitigate the impact of foreign exchange risk related to certain foreign currency denominated receivable and payable balances. Changes in fair
value of these forward exchange contracts are recorded through current earnings because these instruments do not qualify for hedge accounting. As of December 31, 2009, the U.S. dollar equivalent notional amounts of the forward exchange
contracts related to foreign currency denominated receivable and payable balances totaled $209.1 million. The periods of these forward exchange contracts typically is less than three months. The fair value of these forward exchange contracts was a
net gain of $1.1 million at December 31, 2009.
Our risk management policy allows for hedging our net investments in foreign subsidiaries, using
both derivative and non-derivative instruments. In June 2006, we issued €250.0 million of Euro-denominated senior notes, which gives
rise to foreign exchange risk when the debt is remeasured into U.S. dollars at the end of each period. The remeasurement gains and losses are recorded in other
|
|
|
| 60 |
|
MILLIPORE FORM 10-K 2009
|
PART II
comprehensive income because we designated this debt as an economic hedge of our net investments in a European subsidiary. Upon maturity, however, we could be exposed to significant exchange rate
risk because we will be required to repay the debt at the then current market exchange rates, which could be higher than the rates at which we borrowed the debt in June 2006. As of December 31, 2009, we have recorded a cumulative loss of $44.2
million in accumulated other comprehensive income attributable to the change in value of the U.S. dollar versus the Euro since the issuance of the notes. A further 10 percent strengthening or weakening of the Euro against the U.S. dollar will cause
this cumulative loss to increase or decrease by $35.8 million.
We do not enter into derivatives for trading or other speculative purposes.
INTEREST RATE RISK
We are exposed to changes in
interest rates in the normal course of our business operations as a result of our ongoing investing and financing activities, which affect our debt as well as cash and cash equivalents. As of December 31, 2009, our debt portfolio was comprised
of a combination of fixed and floating rate borrowings. Our exposure to interest rate risk primarily relates to our revolving credit facilities, under which the interest rates on our borrowings float with LIBOR or TIBOR rates and our anticipated
fixed-rate debt financing in December 2011. There were no borrowings under our primary revolving credit facility at December 31, 2009.
In August
2009, we entered into forward starting interest rate swap agreements with an aggregate notional amount of $300 million. The purpose of these swaps is to hedge interest rate exposures related to an anticipated fixed-rate debt financing in December
2011 with a term of at least 10 years. The net gain or loss from these cash flow hedges reported in accumulated other comprehensive income will be recognized in earnings as an adjustment to interest expense in our consolidated statement of
operations in the same period when the hedged interest payments are recorded in our statement of operations.
At December 31, 2009, the fair value of these interest rate swap agreements was a gain of $4.9 million, which was recognized in accumulated other comprehensive income. A hypothetical
decrease in market interest rate by of 1 percentage point against our interest rate swap agreements would have resulted in a net loss in fair value of these contracts of approximately $20.6 million.
The fair market value of our long-term fixed interest rate debt is subject to interest rate risk. Generally, the fair market value of fixed interest rate debt will
increase as interest rates fall and decrease as interest rates rise. In addition, the fair value of our Convertible Notes is affected by our stock price. The total estimated fair value of our fixed rate debt at December 31, 2009 was $928.8
million. Fair values were determined from available market prices using current interest rates, non-performance risk, and terms to maturity. If interest rates were to increase or decrease by 1 percentage point, the fair value of our long-term debt
would decrease or increase by approximately $25.7 million.
CREDIT RISK
We are exposed to concentrations of credit risk in cash and cash equivalents, trade receivables, and forward exchange contracts. Cash and cash equivalents are placed with major financial institutions with high
quality credit ratings. The amount placed with any one institution is limited by policy. Trade receivables credit risk exposure is limited because of our large number of established customers and their dispersion across different geographies. No
single customer accounted for 10 percent or more of our consolidated trade receivables as of December 31, 2009.
We are exposed to credit risk on
our hedging instruments in the event of nonperformance by counterparties. The fair value of gains on derivative instruments reflects adjustments for nonperformance risks of the counterparties. However, we do not anticipate nonperformance by any of
these counterparties because our hedging activities are transacted only with financial institutions with high credit ratings.
|
|
|
| MILLIPORE FORM 10-K 2009 |
|
61 |
PART II
Related Party Agreements
Rolf A. Classon, a Director of Millipore since December 2005, retired as Chairman and President of Bayer Healthcare LLC in July 2004. He is currently a member of the Supervisory Board of Bayer Healthcare AG. During
2009, Bayer AG (including Bayer Healthcare LLC), purchased a total of $6.3 million of products from Millipore. The relationship between Millipore and Bayer predates Mr. Classon’s election as a Director.
Dividends
We did not declare any cash dividends in
2009 or 2008. We do not currently have plans to make future cash dividend declarations or payments.
Legal Proceedings
We currently are not a party to any material legal proceeding.
New Accounting Pronouncements
For a description of recent accounting pronouncements, see Note 2 “Summary of Significant Accounting
Policies” in the Notes to Consolidated Financial Statements in this Form 10-K.
Use of Non-GAAP Financial Measures
Millipore provides non-GAAP supplemental information to its financial results. Non-GAAP net income attributable to Millipore and diluted earnings per share exclude costs related to global supply chain initiatives,
acquisition and related integration expenses, amortization of purchased intangible assets, inventory fair value adjustments related to business acquisitions, curtailment gain related to modifications to our postretirement benefit plan, impairment of
fixed assets, gain on business acquisition, certain changes in our tax accruals, and non-cash interest expense on our Convertible Notes. We define free cash flow as net cash provided by operating activities less additions to property, plant, and
equipment. We define net debt as our debt less cash and cash equivalents.
We believe that the non-GAAP financial measures provide useful and
supplementary information to investors regarding our operating performance, although they may not be directly comparable to measures used by other companies. It is our belief that these non-GAAP financial measures have been particularly useful to
investors over the last few years because of the significant changes that have occurred outside of our day-to-day business in accordance with the execution of our strategy. Non-GAAP information should not be construed as an alternative to GAAP
information as the items excluded from the non-GAAP measures often have a material impact on our financial results. Management uses, and investors should use, non-GAAP measures in conjunction with our GAAP results.
|
|
|
| 62 |
|
MILLIPORE FORM 10-K 2009
|
PART II
Reconciliation of GAAP to Non GAAP Financial Measures
Operating Results—2009
|
|
|
|
|
|
|
|
|
| (dollars in thousands, except EPS data) |
|
Net income Attributable to Millipore |
|
|
Diluted EPS |
|
| GAAP results, twelve months ended December 31, 2009 |
|
$ |
177,004 |
|
|
$ |
3.15 |
|
| Non-GAAP adjustments: |
|
|
|
|
|
|
|
|
| Costs related to global supply chain initiatives1 |
|
|
7,988 |
|
|
|
0.14 |
|
| Business acquisition inventory fair value adjustment2 |
|
|
679 |
|
|
|
0.01 |
|
| Acquisition and related integration expenses3 |
|
|
1,140 |
|
|
|
0.02 |
|
| Purchased intangibles amortization2 |
|
|
36,974 |
|
|
|
0.66 |
|
| Gain on business acquisition2 |
|
|
(8,542 |
) |
|
|
(0.15 |
) |
| Non-cash interest expense on convertible debt4 |
|
|
9,464 |
|
|
|
0.17 |
|
| Total non-GAAP adjustments |
|
|
47,703 |
|
|
|
0.85 |
|
| Non-GAAP results, twelve months ended December 31, 2009 |
|
$ |
224,707 |
|
|
$ |
4.00 |
|
|
|
|
| Operating Results—2008 (As adjusted) |
|
|
|
|
|
|
|
|
| (dollars in thousands, except EPS data) |
|
Net Income Attributable To Millipore |
|
|
Diluted EPS |
|
| GAAP results, twelve months ended December 31, 2008 |
|
$ |
137,605 |
|
|
$ |
2.47 |
|
| Non-GAAP adjustments: |
|
|
|
|
|
|
|
|
| Costs related to global supply chain initiatives1 |
|
|
11,313 |
|
|
|
0.20 |
|
| Purchased intangibles amortization2 |
|
|
40,228 |
|
|
|
0.72 |
|
| Impairment of fixed assets5 |
|
|
3,892 |
|
|
|
0.07 |
|
| Curtailment of postretirement plan5 |
|
|
(1,699 |
) |
|
|
(0.03 |
) |
| Non-cash interest expense on convertible debt4 |
|
|
8,726 |
|
|
|
0.16 |
|
| Total non-GAAP adjustments |
|
|
62,460 |
|
|
|
1.12 |
|
| Non-GAAP results, twelve months ended December 31, 2008 |
|
$ |
200,065 |
|
|
$ |
3.59 |
|
|
|
|
| Operating Results—2007 (As adjusted) |
|
|
|
|
|
|
|
|
| (dollars in thousands, except EPS data) |
|
Net income Attributable to Millipore |
|
|
Diluted EPS |
|
| GAAP results, twelve months ended December 31, 2007 |
|
$ |
128,163 |
|
|
$ |
2.33 |
|
| Non-GAAP adjustments: |
|
|
|
|
|
|
|
|
| Costs related to global supply chain initiatives1 |
|
|
7,257 |
|
|
|
0.13 |
|
| Business acquisition inventory fair value adjustment2 |
|
|
7,133 |
|
|
|
0.13 |
|
| Acquisition and related integration expenses3 |
|
|
8,510 |
|
|
|
0.16 |
|
| Purchased intangibles amortization2 |
|
|
37,423 |
|
|
|
0.68 |
|
| Non-cash interest expense on convertible debt4 |
|
|
8,184 |
|
|
|
0.15 |
|
| Change in tax accrual6 |
|
|
(11,900 |
) |
|
|
(0.22 |
) |
| Total non-GAAP adjustments |
|
|
56,607 |
|
|
|
1.03 |
|
| Non-GAAP results, twelve months ended December 31, 2007 |
|
$ |
184,770 |
|
|
$ |
3.36 |
|
|
|
|
| MILLIPORE FORM 10-K 2009 |
|
63 |
PART II
(1) We exclude severance and relocation costs, facility closure costs, and accelerated depreciation associated with
our global supply chain initiatives because they are material expenses in excess of our normal operating costs. We undertook these initiatives to significantly reduce our cost structure and improve operational efficiency primarily through the
consolidation of manufacturing locations.
(2) We exclude the amortization of purchased intangible assets, gain on business acquisition and inventory
fair value adjustments from business acquisitions because (i) the amounts are non-cash, (ii) we can not influence the timing and amount of future expense recognition, and (iii) excluding such expenses provides investors and management
better visibility into the components of operating expenses.
(3) We exclude acquisition and related integration expenses to make year-over-year
comparisons because these are incremental costs to our day-to-day business and can be material.
(4) Non-cash interest expense on our Convertible Notes
is the incremental interest expense as a result of a change in accounting principles. This interest expense is non-cash and we can not control the amount of this expense without modifying our capital structure.
(5) We exclude the impairment loss related to an idle facility and the curtailment gain related to modifications to our postretirement benefit plan for comparability
of our year-over-year financial results.
(6) We exclude changes in tax accruals because this is a significant item affecting the income tax provision.
Forward-Looking Statements
The matters discussed in this Form 10-K Annual Report, as well as in future oral and written statements by our management, that are forward-looking statements are based on our current management expectations. These
expectations involve substantial risks and uncertainties that could cause actual results to differ materially from the results expressed in, or implied by, these forward-looking statements. Potential risks and uncertainties that could affect our
future operating results include, without limitation, the risk factors and uncertainties set forth in Item 1A and elsewhere in this Form 10-K Annual Report.
| ITEM 7A |
QUANTITATIVE AND QUALITATIVE DISCLOSURES ABOUT MARKET RISK
|
The information called for by this item is set forth under the heading “Market Risk” in Management’s Discussion and
Analysis of Financial Condition and Results of Operations contained in Item 7 above which information is hereby incorporated by reference.
|
|
|
| 64 |
|
MILLIPORE FORM 10-K 2009
|
| ITEM 8 |
FINANCIAL STATEMENTS AND SUPPLEMENTARY DATA.
|
Index to Consolidated Financial Statements
|
|
|
|
|
| Management’s Annual Report on Internal Control over Financial Reporting |
|
65 |
| Report of Independent Registered Public Accounting Firm |
|
66 |
| Consolidated Statements of Operations for the years ended December 31, 2009, 2008, and 2007 |
|
67 |
| Consolidated Balance Sheets at December 31, 2009 and 2008 |
|
68 |
| Consolidated Statements of Equity for the years ended December 31, 2009, 2008, and 2007 |
|
69 |
| Consolidated Statements of Cash Flows for the years ended December 31, 2009, 2008, and 2007 |
|
70 |
| Notes to Consolidated Financial Statements |
|
71 |
| Quarterly Results (Unaudited) |
|
108 |
Management’s
Annual Report on Internal Control over Financial Reporting
Our management is responsible for establishing and maintaining adequate internal control over
financial reporting (as defined in Rules 13a-15(f) and 15d-15(f) under the Securities Exchange Act of 1934). Our internal control over financial reporting is a process designed to provide reasonable assurance regarding the reliability of financial
reporting and the preparation of financial statements for external purposes in accordance with generally accepted accounting principles. Because of its inherent limitations, internal control over financial reporting may not prevent or detect
misstatements. Also, projections of any evaluation of effectiveness to future periods are subject to the risk that controls may become inadequate because of changes in conditions, or that the degree of compliance with the policies or procedures may
deteriorate.
Under the supervision and with the participation of our management, including our CEO and CFO, we conducted an evaluation of the
effectiveness of our internal control over financial reporting based on the framework in Internal Control – Integrated Framework issued by the Committee of Sponsoring Organizations of the Treadway Commission. Based on this assessment our
management concluded that, as of December 31, 2009, our internal control over financial reporting was effective based on those criteria.
The
effectiveness of our internal control over financial reporting as of December 31, 2009 has been audited by PricewaterhouseCoopers LLP, an Independent Registered Public Accounting Firm, as stated in their report which is included herein.
|
|
|
| MILLIPORE FORM 10-K 2009 |
|
65 |
Report of Independent Registered Public Accounting Firm
To the Shareholders and Directors of Millipore
Corporation:
In our opinion, the consolidated financial statements listed in the accompanying index present fairly, in all material respects, the
financial position of Millipore Corporation and its subsidiaries at December 31, 2009 and 2008, and the results of their operations and their cash flows for each of the three years in the period ended December 31, 2009 in conformity with
accounting principles generally accepted in the United States of America. Also in our opinion, the Company maintained, in all material respects, effective internal control over financial reporting as of December 31, 2009, based on criteria
established in Internal Control – Integrated Framework issued by the Committee of Sponsoring Organizations of the Treadway Commission (COSO). The Company’s management is responsible for these financial statements, for maintaining
effective internal control over financial reporting and for its assessment of the effectiveness of internal control over financial reporting, included in “Management’s Annual Report on Internal Control over Financial Reporting”
appearing under Item 8. Our responsibility is to express opinions on these financial statements and on the Company’s internal control over financial reporting based on our integrated audits. We conducted our audits in accordance with the
standards of the Public Company Accounting Oversight Board (United States). Those standards require that we plan and perform the audits to obtain reasonable assurance about whether the financial statements are free of material misstatement and
whether effective internal control over financial reporting was maintained in all material respects. Our audits of the financial statements included examining, on a test basis, evidence supporting the amounts and disclosures in the financial
statements, assessing the accounting principles used and significant estimates made by management, and evaluating the overall financial statement presentation. Our audit of internal control over financial reporting included obtaining an
understanding of internal control over financial reporting, assessing the risk that a material weakness exists, and testing and evaluating the design and operating effectiveness of internal control based on the assessed risk. Our audits also
included performing such other procedures as we considered necessary in the circumstances. We believe that our audits provide a reasonable basis for our opinions.
As discussed in Notes 1, 3, and 10 to the consolidated financial statements, effective January 1, 2009 the Company changed the manner in which it accounts for its Convertible Notes, business combinations, and
noncontrolling interests.
A company’s internal control over financial reporting is a process designed to provide reasonable assurance regarding the
reliability of financial reporting and the preparation of financial statements for external purposes in accordance with generally accepted accounting principles. A company’s internal control over financial reporting includes those policies and
procedures that (i) pertain to the maintenance of records that, in reasonable detail, accurately and fairly reflect the transactions and dispositions of the assets of the company; (ii) provide reasonable assurance that transactions are
recorded as necessary to permit preparation of financial statements in accordance with generally accepted accounting principles, and that receipts and expenditures of the company are being made only in accordance with authorizations of management
and directors of the company; and (iii) provide reasonable assurance regarding prevention or timely detection of unauthorized acquisition, use, or disposition of the company’s assets that could have a material effect on the financial
statements.
Because of its inherent limitations, internal control over financial reporting may not prevent or detect misstatements. Also, projections of
any evaluation of effectiveness to future periods are subject to the risk that controls may become inadequate because of changes in conditions, or that the degree of compliance with the policies or procedures may deteriorate.
/s/ PricewaterhouseCoopers LLP
Boston, Massachusetts
February 26, 2010
|
|
|
| 66 |
|
MILLIPORE FORM 10-K 2009
|
Consolidated Statements of Operations
|
|
|
|
|
|
|
|
|
|
|
|
|
|
|
|
|
| |
|
|
|
Year ended December 31, |
|
| |
|
|
|
|
|
|
|
|
|
|
|
|
|
| (In thousands, except per share data) |
|
|
|
2009 |
|
|
|
|
2008 (As Adjusted) |
|
|
2007 (As Adjusted) |
|
| Revenues |
|
|
|
$ |
1,654,410 |
|
|
|
|
$ |
1,602,138 |
|
|
$ |
1,531,555 |
|
| Cost of revenues |
|
|
|
|
747,432 |
|
|
|
|
|
749,307 |
|
|
|
721,092 |
|
| Gross profit |
|
|
|
|
906,978 |
|
|
|
|
|
852,831 |
|
|
|
810,463 |
|
| Selling, general and administrative expenses |
|
|
|
|
523,765 |
|
|
|
|
|
516,729 |
|
|
|
486,737 |
|
| Research and development expenses |
|
|
|
|
114,566 |
|
|
|
|
|
102,605 |
|
|
|
106,999 |
|
| Operating profit |
|
|
|
|
268,647 |
|
|
|
|
|
233,497 |
|
|
|
216,727 |
|
| Gain on business acquisition |
|
|
|
|
8,542 |
|
|
|
|
|
– |
|
|
|
– |
|
| Interest income |
|
|
|
|
741 |
|
|
|
|
|
948 |
|
|
|
1,453 |
|
| Interest expense |
|
|
|
|
(58,343 |
) |
|
|
|
|
(70,109 |
) |
|
|
(78,516 |
) |
| Income before provision for income taxes |
|
|
|
|
219,587 |
|
|
|
|
|
164,336 |
|
|
|
139,664 |
|
| Provision for income taxes |
|
|
|
|
40,397 |
|
|
|
|
|
23,169 |
|
|
|
7,974 |
|
| Net income |
|
|
|
|
179,190 |
|
|
|
|
|
141,167 |
|
|
|
131,690 |
|
| Less: Net income attributable to noncontrolling interest |
|
|
|
|
2,186 |
|
|
|
|
|
3,562 |
|
|
|
3,527 |
|
| Net income attributable to Millipore |
|
|
|
$ |
177,004 |
|
|
|
|
$ |
137,605 |
|
|
$ |
128,163 |
|
| Earnings per share: |
|
|
|
|
|
|
|
|
|
|
|
|
|
|
|
|
| Basic |
|
|
|
$ |
3.19 |
|
|
|
|
$ |
2.50 |
|
|
$ |
2.36 |
|
| Diluted |
|
|
|
$ |
3.15 |
|
|
|
|
$ |
2.47 |
|
|
$ |
2.33 |
|
| Weighted average shares outstanding: |
|
|
|
|
|
|
|
|
|
|
|
|
|
|
|
|
| Basic |
|
|
|
|
55,509 |
|
|
|
|
|
55,128 |
|
|
|
54,263 |
|
| Diluted |
|
|
|
|
56,124 |
|
|
|
|
|
55,711 |
|
|
|
55,028 |
|
The accompanying notes are an integral part of the
consolidated financial statements.
|
|
|
| MILLIPORE FORM 10-K 2009 |
|
67 |
Consolidated Balance Sheets
|
|
|
|
|
|
|
|
|
|
|
|
|
| |
|
December 31, |
|
| |
|
|
|
|
|
|
|
|
|
|
| (In thousands, except per share data) |
|
|
|
2009 |
|
|
|
|
2008 (As Adjusted) |
|
| Assets |
|
|
|
|
|
|
|
|
|
|
|
|
| Current assets: |
|
|
|
|
|
|
|
|
|
|
|
|
| Cash and cash equivalents |
|
|
|
$ |
168,333 |
|
|
|
|
$ |
115,462 |
|
| Accounts receivable (less allowance for doubtful accounts of $3,495 and $2,930 at December 31, 2009 and 2008,
respectively) |
|
|
|
|
280,930 |
|
|
|
|
|
274,529 |
|
| Inventories |
|
|
|
|
257,809 |
|
|
|
|
|
259,360 |
|
| Deferred income taxes |
|
|
|
|
61,211 |
|
|
|
|
|
70,305 |
|
| Other current assets |
|
|
|
|
33,985 |
|
|
|
|
|
32,787 |
|
| Total current assets |
|
|
|
|
802,268 |
|
|
|
|
|
752,443 |
|
| Property, plant and equipment, net |
|
|
|
|
595,611 |
|
|
|
|
|
577,410 |
|
| Deferred income taxes |
|
|
|
|
40,175 |
|
|
|
|
|
10,926 |
|
| Intangible assets, net |
|
|
|
|
337,696 |
|
|
|
|
|
369,473 |
|
| Goodwill |
|
|
|
|
1,017,683 |
|
|
|
|
|
1,004,694 |
|
| Other assets |
|
|
|
|
17,356 |
|
|
|
|
|
18,155 |
|
| Total assets |
|
|
|
$ |
2,810,789 |
|
|
|
|
$ |
2,733,101 |
|
| Liabilities and Equity |
|
|
|
|
|
|
|
|
|
|
|
|
| Current liabilities: |
|
|
|
|
|
|
|
|
|
|
|
|
| Short-term debt |
|
|
|
$ |
42,851 |
|
|
|
|
$ |
4,391 |
|
| Accounts payable |
|
|
|
|
75,056 |
|
|
|
|
|
70,037 |
|
| Income taxes payable |
|
|
|
|
16,739 |
|
|
|
|
|
9,966 |
|
| Accrued expenses |
|
|
|
|
184,967 |
|
|
|
|
|
162,681 |
|
| Deferred income taxes |
|
|
|
|
94 |
|
|
|
|
|
288 |
|
| Total current liabilities |
|
|
|
|
319,707 |
|
|
|
|
|
247,363 |
|
| Deferred income taxes |
|
|
|
|
17,681 |
|
|
|
|
|
7,263 |
|
| Long-term debt |
|
|
|
|
890,242 |
|
|
|
|
|
1,082,058 |
|
| Other liabilities |
|
|
|
|
80,125 |
|
|
|
|
|
84,122 |
|
| Total liabilities |
|
|
|
|
1,307,755 |
|
|
|
|
|
1,420,806 |
|
| Commitments and contingencies (Note 17) |
|
|
|
|
|
|
|
|
|
|
|
|
| Shareholders’ equity: |
|
|
|
|
|
|
|
|
|
|
|
|
| Common stock, par value $1.00 per share, 120,000 shares authorized;
55,688 shares issued and outstanding as of December 31,
2009;
55,260 shares issued and outstanding as of December 31, 2008 |
|
|
|
|
55,688 |
|
|
|
|
|
55,260 |
|
| Additional paid-in capital |
|
|
|
|
330,380 |
|
|
|
|
|
346,429 |
|
| Retained earnings |
|
|
|
|
1,144,361 |
|
|
|
|
|
967,357 |
|
| Accumulated other comprehensive loss |
|
|
|
|
(27,395 |
) |
|
|
|
|
(63,077 |
) |
| Total Millipore shareholders’ equity |
|
|
|
|
1,503,034 |
|
|
|
|
|
1,305,969 |
|
| Noncontrolling interest |
|
|
|
|
– |
|
|
|
|
|
6,326 |
|
| Total equity |
|
|
|
|
1,503,034 |
|
|
|
|
|
1,312,295 |
|
| Total liabilities and equity |
|
|
|
$ |
2,810,789 |
|
|
|
|
$ |
2,733,101 |
|
The accompanying notes are an integral part of the
consolidated financial statements.
|
|
|
| 68 |
|
MILLIPORE FORM 10-K 2009
|
Consolidated Statements of Equity
Years Ended December 31, 2009, 2008 and 2007
|
|
|
|
|
|
|
|
|
|
|
|
|
|
|
|
|
|
|
|
|
|
|
|
|
|
|
|
|
|
|
|
|
|
|
|
|
|
|
|
|
|
| |
|
|
|
|
Parent Company Shareholders |
|
|
|
|
| |
|
|
|
|
Common Stock |
|
Additional Paid-In Capital (As adjusted) |
|
|
Retained Earnings (As adjusted) |
|
|
Accumulated Other Comprehensive Income (Loss) |
|
|
Total
Millipore
Shareholders’
Equity
(As Adjusted) |
|
|
Noncontrolling
interest |
|
| (In thousands) |
|
Total Equity (As adjusted) |
|
|
Shares |
|
Par Value |
|
|
|
Gain (Loss) on
Cash Flow
Hedges |
|
|
Translation Adjustments |
|
|
Unfunded Pension Liabilities |
|
|
Total |
|
|
|
| Balance at December 31, 2006 (Adjusted see footnote 1 and 10) |
|
$ |
998,290 |
|
|
53,524 |
|
$ |
53,524 |
|
$ |
245,946 |
|
|
$ |
702,313 |
|
|
|
– |
|
|
$ |
3,268 |
|
|
$ |
(11,841 |
) |
|
$ |
(8,573 |
) |
|
$ |
993,210 |
|
|
$ |
5,080 |
|
| Comprehensive income: |
|
|
|
|
|
|
|
|
|
|
|
|
|
|
|
|
|
|
|
|
|
|
|
|
|
|
|
|
|
|
|
|
|
|
|
|
|
|
|
|
|
| Net income |
|
|
131,690 |
|
|
|
|
|
|
|
|
|
|
|
|
128,163 |
|
|
|
|
|
|
|
|
|
|
|
|
|
|
|
|
|
|
|
128,163 |
|
|
|
3,527 |
|
| Net realized loss on cash flow hedges, net of tax of $49 |
|
|
(73 |
) |
|
|
|
|
|
|
|
|
|
|
|
|
|
|
|
(73 |
) |
|
|
|
|
|
|
|
|
|
|
(73 |
) |
|
|
(73 |
) |
|
|
|
|
| Net unrealized loss on cash flow hedges, net of tax of $254 |
|
|
(340 |
) |
|
|
|
|
|
|
|
|
|
|
|
|
|
|
|
(340 |
) |
|
|
|
|
|
|
|
|
|
|
(340 |
) |
|
|
(340 |
) |
|
|
|
|
| Change in additional pension liability, net of tax of $1,065 |
|
|
3,753 |
|
|
|
|
|
|
|
|
|
|
|
|
|
|
|
|
|
|
|
|
|
|
|
|
3,753 |
|
|
|
3,753 |
|
|
|
3,753 |
|
|
|
|
|
| Translation adjustments, net of tax of $0 |
|
|
(15,214 |
) |
|
|
|
|
|
|
|
|
|
|
|
|
|
|
|
|
|
|
|
(15,863 |
) |
|
|
|
|
|
|
(15,863 |
) |
|
|
(15,863 |
) |
|
|
649 |
|
| Total comprehensive income |
|
|
119,816 |
|
|
|
|
|
|
|
|
|
|
|
|
|
|
|
|
|
|
|
|
|
|
|
|
|
|
|
|
|
|
|
|
115,640 |
|
|
|
4,176 |
|
| Stock issued under stock plans |
|
|
48,848 |
|
|
1,248 |
|
|
1,248 |
|
|
47,600 |
|
|
|
|
|
|
|
|
|
|
|
|
|
|
|
|
|
|
|
|
|
|
|
48,848 |
|
|
|
|
|
| FIN 48 adoption adjustment |
|
|
(600 |
) |
|
|
|
|
|
|
|
|
|
|
|
(600 |
) |
|
|
|
|
|
|
|
|
|
|
|
|
|
|
|
|
|
|
(600 |
) |
|
|
|
|
| Stock-based compensation expense |
|
|
15,960 |
|
|
|
|
|
|
|
|
15,960 |
|
|
|
|
|
|
|
|
|
|
|
|
|
|
|
|
|
|
|
|
|
|
|
15,960 |
|
|
|
|
|
| Dividends paid to noncontrolling interest |
|
|
(3,013 |
) |
|
|
|
|
|
|
|
|
|
|
|
|
|
|
|
|
|
|
|
|
|
|
|
|
|
|
|
|
|
|
|
|
|
|
|
(3,013 |
) |
| Balance at December 31, 2007 |
|
|
1,179,301 |
|
|
54,772 |
|
|
54,772 |
|
|
309,506 |
|
|
|
829,876 |
|
|
|
(413 |
) |
|
|
(12,595 |
) |
|
|
(8,088 |
) |
|
|
(21,096 |
) |
|
|
1,173,058 |
|
|
|
6,243 |
|
| Comprehensive income: |
|
|
|
|
|
|
|
|
|
|
|
|
|
|
|
|
|
|
|
|
|
|
|
|
|
|
|
|
|
|
|
|
|
|
|
|
|
|
|
|
|
| Net income |
|
|
141,167 |
|
|
|
|
|
|
|
|
|
|
|
|
137,605 |
|
|
|
|
|
|
|
|
|
|
|
|
|
|
|
|
|
|
|
137,605 |
|
|
|
3,562 |
|
| Net realized loss on cash flow hedges, net of tax of $12 |
|
|
(87 |
) |
|
|
|
|
|
|
|
|
|
|
|
|
|
|
|
(87 |
) |
|
|
|
|
|
|
|
|
|
|
(87 |
) |
|
|
(87 |
) |
|
|
|
|
| Net unrealized loss on cash flow hedges, net of tax of $823 |
|
|
(2,138 |
) |
|
|
|
|
|
|
|
|
|
|
|
|
|
|
|
(2,138 |
) |
|
|
|
|
|
|
|
|
|
|
(2,138 |
) |
|
|
(2,138 |
) |
|
|
|
|
| Change in additional pension liability, net of tax of $6,841 |
|
|
(12,802 |
) |
|
|
|
|
|
|
|
|
|
|
|
|
|
|
|
|
|
|
|
|
|
|
|
(12,802 |
) |
|
|
(12,802 |
) |
|
|
(12,802 |
) |
|
|
|
|
| Translation adjustments, net of tax of $528 |
|
|
(28,323 |
) |
|
|
|
|
|
|
|
|
|
|
|
|
|
|
|
|
|
|
|
(26,954 |
) |
|
|
|
|
|
|
(26,954 |
) |
|
|
(26,954 |
) |
|
|
(1,369 |
) |
| Total comprehensive income |
|
|
97,817 |
|
|
|
|
|
|
|
|
|
|
|
|
|
|
|
|
|
|
|
|
|
|
|
|
|
|
|
|
|
|
|
|
95,624 |
|
|
|
2,193 |
|
| Stock issued under stock plans |
|
|
14,398 |
|
|
488 |
|
|
488 |
|
|
13,910 |
|
|
|
|
|
|
|
|
|
|
|
|
|
|
|
|
|
|
|
|
|
|
|
14,398 |
|
|
|
|
|
| Adoption of SFAS No. 158 measurement date provision |
|
|
(124 |
) |
|
|
|
|
|
|
|
|
|
|
|
(124 |
) |
|
|
|
|
|
|
|
|
|
|
|
|
|
|
|
|
|
|
(124 |
) |
|
|
|
|
| Stock-based compensation expense |
|
|
23,013 |
|
|
|
|
|
|
|
|
23,013 |
|
|
|
|
|
|
|
|
|
|
|
|
|
|
|
|
|
|
|
|
|
|
|
23,013 |
|
|
|
|
|
| Dividends paid to noncontrolling interest |
|
|
(2,110 |
) |
|
|
|
|
|
|
|
|
|
|
|
|
|
|
|
|
|
|
|
|
|
|
|
|
|
|
|
|
|
|
|
|
|
|
|
(2,110 |
) |
| Balance at December 31, 2008 |
|
|
1,312,295 |
|
|
55,260 |
|
|
55,260 |
|
|
346,429 |
|
|
|
967,357 |
|
|
|
(2,638 |
) |
|
|
(39,549 |
) |
|
|
(20,890 |
) |
|
|
(63,077 |
) |
|
|
1,305,969 |
|
|
|
6,326 |
|
| Comprehensive income: |
|
|
|
|
|
|
|
|
|
|
|
|
|
|
|
|
|
|
|
|
|
|
|
|
|
|
|
|
|
|
|
|
|
|
|
|
|
|
|
|
|
| Net income |
|
|
179,190 |
|
|
|
|
|
|
|
|
|
|
|
|
177,004 |
|
|
|
|
|
|
|
|
|
|
|
|
|
|
|
|
|
|
|
177,004 |
|
|
|
2,186 |
|
| Net realized loss on cash flow hedges, net of tax of $74 |
|
|
(45 |
) |
|
|
|
|
|
|
|
|
|
|
|
|
|
|
|
(45 |
) |
|
|
|
|
|
|
|
|
|
|
(45 |
) |
|
|
(45 |
) |
|
|
|
|
| Net unrealized gain on cash flow hedges, net of tax of $437 |
|
|
1,564 |
|
|
|
|
|
|
|
|
|
|
|
|
|
|
|
|
1,564 |
|
|
|
|
|
|
|
|
|
|
|
1,564 |
|
|
|
1,564 |
|
|
|
|
|
| Net unrealized gain on interest rate swap, net of tax of $1,899 |
|
|
3,041 |
|
|
|
|
|
|
|
|
|
|
|
|
|
|
|
|
3,041 |
|
|
|
|
|
|
|
|
|
|
|
3,041 |
|
|
|
3,041 |
|
|
|
|
|
| Change in additional pension liability, net of tax of $1,699 |
|
|
4,577 |
|
|
|
|
|
|
|
|
|
|
|
|
|
|
|
|
|
|
|
|
|
|
|
|
4,577 |
|
|
|
4,577 |
|
|
|
4,577 |
|
|
|
|
|
| Translation adjustments, net of tax of $1,974 |
|
|
26,880 |
|
|
|
|
|
|
|
|
|
|
|
|
|
|
|
|
|
|
|
|
26,545 |
|
|
|
|
|
|
|
26,545 |
|
|
|
26,545 |
|
|
|
335 |
|
| Total comprehensive income |
|
|
215,207 |
|
|
|
|
|
|
|
|
|
|
|
|
|
|
|
|
|
|
|
|
|
|
|
|
|
|
|
|
|
|
|
|
212,686 |
|
|
|
2,521 |
|
| Stock issued under stock plans |
|
|
9,412 |
|
|
428 |
|
|
428 |
|
|
8,984 |
|
|
|
|
|
|
|
|
|
|
|
|
|
|
|
|
|
|
|
|
|
|
|
9,412 |
|
|
|
|
|
| Stock-based compensation expense |
|
|
26,831 |
|
|
|
|
|
|
|
|
26,831 |
|
|
|
|
|
|
|
|
|
|
|
|
|
|
|
|
|
|
|
|
|
|
|
26,831 |
|
|
|
|
|
| Dividends paid to noncontrolling interest |
|
|
(2,629 |
) |
|
|
|
|
|
|
|
|
|
|
|
|
|
|
|
|
|
|
|
|
|
|
|
|
|
|
|
|
|
|
|
|
|
|
|
(2,629 |
) |
| Purchase of shares from noncontrolling interest |
|
|
(58,082 |
) |
|
|
|
|
|
|
|
(51,864 |
) |
|
|
|
|
|
|
|
|
|
|
|
|
|
|
|
|
|
|
|
|
|
|
(51,864 |
) |
|
|
(6,218 |
) |
| Balance at December 31, 2009 |
|
$ |
1,503,034 |
|
|
55,688 |
|
$ |
55,688 |
|
$ |
330,380 |
|
|
$ |
1,144,361 |
|
|
$ |
1,922 |
|
|
$ |
(13,004 |
) |
|
$ |
(16,313 |
) |
|
$ |
(27,395 |
) |
|
$ |
1,503,034 |
|
|
$ |
– |
|
The accompanying notes are an integral part
of the consolidated financial statements.
|
|
|
| MILLIPORE FORM 10-K 2009 |
|
69 |
Consolidated Statements of Cash Flows
|
|
|
|
|
|
|
|
|
|
|
|
|
|
|
|
|
| |
|
|
|
Year ended December 31, |
|
| |
|
|
|
|
|
|
|
|
|
|
|
|
|
| (In thousands) |
|
|
|
2009 |
|
|
|
|
2008
(As Adjusted) |
|
|
2007
(As Adjusted) |
|
| Cash flows from operating activities: |
|
|
|
|
|
|
|
|
|
|
|
|
|
|
|
|
| Net income |
|
|
|
$ |
179,190 |
|
|
|
|
$ |
141,167 |
|
|
$ |
131,690 |
|
| Adjustments to reconcile net income to net cash provided by operating activities: |
|
|
|
|
|
|
|
|
|
|
|
|
|
|
|
|
| Depreciation and amortization |
|
|
|
|
126,278 |
|
|
|
|
|
132,285 |
|
|
|
123,747 |
|
| Amortization of deferred financing costs |
|
|
|
|
3,400 |
|
|
|
|
|
3,441 |
|
|
|
3,438 |
|
| Amortization of debt discount |
|
|
|
|
15,164 |
|
|
|
|
|
14,181 |
|
|
|
13,245 |
|
| Deferred income tax benefit |
|
|
|
|
(10,722 |
) |
|
|
|
|
(17,722 |
) |
|
|
(25,005 |
) |
| Stock-based compensation |
|
|
|
|
26,831 |
|
|
|
|
|
23,013 |
|
|
|
15,960 |
|
| Curtailment gain |
|
|
|
|
– |
|
|
|
|
|
(2,733 |
) |
|
|
– |
|
| Gain on business acquisition |
|
|
|
|
(8,542 |
) |
|
|
|
|
– |
|
|
|
– |
|
| Business acquisition inventory fair value adjustments |
|
|
|
|
1,057 |
|
|
|
|
|
– |
|
|
|
11,121 |
|
| Other |
|
|
|
|
9,886 |
|
|
|
|
|
3,691 |
|
|
|
(7,637 |
) |
| Changes in operating assets and liabilities, net of effects of business acquisitions: |
|
|
|
|
|
|
|
|
|
|
|
|
|
|
|
|
| Accounts receivable |
|
|
|
|
1,957 |
|
|
|
|
|
15,320 |
|
|
|
3,196 |
|
| Inventories |
|
|
|
|
10,425 |
|
|
|
|
|
3,945 |
|
|
|
(15,553 |
) |
| Other current assets |
|
|
|
|
6,166 |
|
|
|
|
|
(9,112 |
) |
|
|
8,577 |
|
| Other assets |
|
|
|
|
(1,002 |
) |
|
|
|
|
398 |
|
|
|
(1,786 |
) |
| Accounts payable |
|
|
|
|
1,807 |
|
|
|
|
|
(25,408 |
) |
|
|
2,176 |
|
| Accrued expenses |
|
|
|
|
5,835 |
|
|
|
|
|
(1,265 |
) |
|
|
(37,120 |
) |
| Income taxes payable |
|
|
|
|
10,580 |
|
|
|
|
|
187 |
|
|
|
(7,779 |
) |
| Other liabilities |
|
|
|
|
(8,133 |
) |
|
|
|
|
(11,762 |
) |
|
|
3,900 |
|
| Net cash provided by operating activities |
|
|
|
|
370,177 |
|
|
|
|
|
269,626 |
|
|
|
222,170 |
|
| Cash flows from investing activities: |
|
|
|
|
|
|
|
|
|
|
|
|
|
|
|
|
| Additions to property, plant and equipment |
|
|
|
|
(72,079 |
) |
|
|
|
|
(76,487 |
) |
|
|
(101,662 |
) |
| Proceeds from sale of property, plant and equipment |
|
|
|
|
– |
|
|
|
|
|
162 |
|
|
|
6,049 |
|
| Acquisition of businesses, net of cash acquired |
|
|
|
|
(29,940 |
) |
|
|
|
|
– |
|
|
|
– |
|
| Settlement of derivative transactions |
|
|
|
|
– |
|
|
|
|
|
(32,332 |
) |
|
|
(17,926 |
) |
| Other |
|
|
|
|
(5,261 |
) |
|
|
|
|
(5,000 |
) |
|
|
– |
|
| Net cash used in investing activities |
|
|
|
|
(107,280 |
) |
|
|
|
|
(113,657 |
) |
|
|
(113,539 |
) |
| Cash flows from financing activities: |
|
|
|
|
|
|
|
|
|
|
|
|
|
|
|
|
| Proceeds from issuance of common stock under stock plans |
|
|
|
|
13,205 |
|
|
|
|
|
16,907 |
|
|
|
49,897 |
|
| Repayment of 7.5% ten-year unsecured notes |
|
|
|
|
– |
|
|
|
|
|
– |
|
|
|
(100,000 |
) |
| Repayments of revolver borrowings, net |
|
|
|
|
(208,174 |
) |
|
|
|
|
(85,075 |
) |
|
|
(105,610 |
) |
| Net borrowings of short-term debt |
|
|
|
|
34,880 |
|
|
|
|
|
302 |
|
|
|
5,285 |
|
| Dividends paid to noncontrolling interest |
|
|
|
|
(2,629 |
) |
|
|
|
|
(2,110 |
) |
|
|
(3,013 |
) |
| Purchase of shares from noncontrolling interest in a subsidiary |
|
|
|
|
(58,082 |
) |
|
|
|
|
– |
|
|
|
– |
|
| Net cash used in financing activities |
|
|
|
|
(220,800 |
) |
|
|
|
|
(69,976 |
) |
|
|
(153,441 |
) |
| Effect of foreign exchange rates on cash and cash equivalents |
|
|
|
|
10,774 |
|
|
|
|
|
(6,708 |
) |
|
|
3,506 |
|
| Net increase (decrease) in cash and cash equivalents |
|
|
|
|
52,871 |
|
|
|
|
|
79,285 |
|
|
|
(41,304 |
) |
| Cash and cash equivalents at beginning of year |
|
|
|
|
115,462 |
|
|
|
|
|
36,177 |
|
|
|
77,481 |
|
| Cash and cash equivalents at end of year |
|
|
|
$ |
168,333 |
|
|
|
|
$ |
115,462 |
|
|
$ |
36,177 |
|
| Supplemental Disclosure of Cash Flow Information: |
|
|
|
|
|
|
|
|
|
|
|
|
|
|
|
|
| Interest paid, net of amounts capitalized |
|
|
|
$ |
39,928 |
|
|
|
|
$ |
53,447 |
|
|
$ |
72,989 |
|
| Income taxes paid, net of refunds |
|
|
|
$ |
20,930 |
|
|
|
|
$ |
42,695 |
|
|
$ |
37,361 |
|
The accompanying notes are an integral part of the consolidated financial statements.
|
|
|
| 70 |
|
MILLIPORE FORM 10-K 2009
|
Notes to Consolidated Financial Statements
(In thousands, except per share data)
1. DESCRIPTION OF OPERATIONS AND BASIS OF PRESENTATION
Description of Operations
Millipore is a global leader in the life science tools market. Together
with our customers, we help to advance the research, development, and production of drugs. Our innovative products and services are used to support life science research, drug discovery, process development, drug manufacturing, and quality
assurance. We help customers to improve laboratory productivity and work flows, prioritize potential drugs, optimize manufacturing productivity, and support commercial scale manufacturing.
Millipore is organized around two operating divisions. Our Bioscience Division provides products and technologies to support life science research and development
activities. Our Bioprocess Division provides products and services to support pharmaceutical and biotechnology manufacturing.
Basis of
Presentation
The consolidated financial statements include the accounts of Millipore Corporation and our subsidiaries. We also consolidate variable
interest entities for which we are considered the primary beneficiary. All intercompany accounts and transactions have been eliminated in consolidation.
Certain reclassifications and adjustments have been made to the prior years’ financial statements to conform with the 2009 presentation.
Effective January 1, 2009, we adopted new accounting standards for noncontrolling interests and convertible debt that may be settled in cash upon conversion. These standards required retrospective adjustments to prior period financial
statements to conform with current accounting treatment.
The new accounting standard for convertible debt instruments that may be settled in cash,
including partial cash settlements, requires that these instruments be separated into a debt component and an equity component. The value assigned to the debt component as of the issuance date is the estimated fair value of a similar debt instrument
without the conversion feature. The difference between the proceeds obtained for the instruments and the estimated fair value assigned to the debt component represents the equity component. See Note 10 of this Form 10-K for additional information on
the adoption of this accounting standard.
The new accounting standard for noncontrolling interests changed the accounting for, and reporting of, a
noncontrolling interest (previously referred to as “minority interest”) in our consolidated financial statements. In accordance with the new standard, we now report the noncontrolling interest as a separate component of equity in the
consolidated balance sheets (previously presented between liabilities and shareholders’ equity) and statements of equity, and show both net income attributable to the noncontrolling interest and net income attributable to Millipore on the face
of the consolidated statements of operations.
|
|
|
| MILLIPORE FORM 10-K 2009 |
|
71 |
NOTES TO CONSOLIDATED FINANCIAL STATEMENTS—(Continued)
(In thousands, except per share data)
2. SUMMARY OF SIGNIFICANT ACCOUNTING POLICIES
Translation of Foreign Currencies
Local currencies are generally the functional currencies of our subsidiaries outside of the
United States. The financial statements of these subsidiaries are translated into U.S. dollars for presentation in these consolidated financial statements. Assets and liabilities of foreign subsidiaries are translated at prevailing exchange rates on
the balance sheet date. Revenues and expenses are translated at average exchange rates during the period. Elements of equity are translated at historical rates. The resulting translation adjustments are reported as a separate component of other
comprehensive income (“OCI”) in equity. Exchange gains and losses on foreign currency transactions and forward exchange contracts not designated as cash flow hedges are included in selling, general and administrative expenses in the
consolidated statements of operations.
Use of Estimates in the Preparation of Financial Statements
The preparation of financial statements in conformity with generally accepted accounting principles requires management to make estimates and assumptions that affect
the reported amounts of assets and liabilities at the date of the financial statements and the reported amounts of revenues and expenses during the reporting period. We base our estimates on historical experience, current conditions, and various
other assumptions that we believe are reasonable under the circumstances. Estimates and assumptions are reviewed on an on-going basis and the effects of revisions are reflected in the consolidated financial statements in the period in which they are
determined to be necessary. Actual results could differ from those estimates.
Cash Equivalents
Cash equivalents, consisting primarily of investments in money market mutual funds, are carried at cost plus accrued interest, which represents fair market value. All
cash equivalents are highly liquid investments with original maturities of three months or less.
Concentration of Credit Risk
Financial instruments that potentially subject us to concentrations of credit risk consist principally of cash and cash equivalents and accounts
receivable. We place our cash and cash equivalents in various financial institutions with high credit ratings and, by policy, limit the amount of credit exposure to any one financial institution.
Concentration of credit risk with respect to accounts receivable is limited because of the large number of customers comprising our customer base and the dispersion of
those customers across different geographies. No single customer accounted for 10 percent or more of the consolidated accounts receivable as of December 31, 2009 and 2008. We perform ongoing credit evaluations of our customers and generally do
not require collateral. We maintain allowances for doubtful accounts based on our analysis of historical losses from uncollectible accounts and risks identified for specific customers who may not be able to make required payments. If the financial
condition of our customers were to deteriorate, resulting in an impairment of their ability to make payments, additional allowances may be required.
|
|
|
| 72 |
|
MILLIPORE FORM 10-K 2009
|
NOTES TO CONSOLIDATED FINANCIAL STATEMENTS—(Continued)
(In thousands, except per share data)
The following table presents changes in our allowance for doubtful accounts:
|
|
|
|
|
|
|
|
|
|
|
|
|
| |
|
Year ended December 31, |
|
| |
|
2009 |
|
|
2008 |
|
|
2007 |
|
| Balance at beginning of the year |
|
$ |
2,930 |
|
|
$ |
3,613 |
|
|
$ |
3,700 |
|
| Provisions |
|
|
1,882 |
|
|
|
1,884 |
|
|
|
1,361 |
|
| Write-offs |
|
|
(1,487 |
) |
|
|
(2,274 |
) |
|
|
(1,438 |
) |
| Recoveries |
|
|
(36 |
) |
|
|
(89 |
) |
|
|
(262 |
) |
| Foreign exchange |
|
|
206 |
|
|
|
(204 |
) |
|
|
252 |
|
| Balance at end of year |
|
$ |
3,495 |
|
|
$ |
2,930 |
|
|
$ |
3,613 |
|
Inventories
We value our inventories at the lower of market value or actual cost, determined on a first-in, first-out (“FIFO”) basis. We generally rely on recent usage
history, expected future demand, and product expiration dates in estimating the realizable value of our inventories. Finished goods and components determined to be obsolete are written off when such determination is made. In certain cases, such as
newly introduced products and overstocked products, expected future demand is considered in establishing inventory write-downs. Raw material and work-in-process inventories are also reviewed for obsolescence based on evaluation of manufacturing
plans, expected future demand, alternative use, and market conditions. In situations where we determine that work-in-process inventories cannot be converted into finished goods, the inventories are written down to net realizable value. Inventory
valuation provisions are not subsequently reversed after they are recorded unless the inventory items are sold.
Our products are made from a wide
variety of raw materials that are generally available from alternate sources of supply. However, certain critical raw materials and supplies required for the production of certain principal products are available only from a single supplier as are
some products that we distribute. Such raw materials and distributed products cannot be obtained from other sources without significant delay or at all. If such suppliers were to limit or terminate production or otherwise fail to supply these
materials for any reason, such failure could have a significant adverse impact on our results of operations. To mitigate such risks, we periodically purchase quantities of some of these critical raw materials in excess of current requirements in
anticipation of future manufacturing needs. With sufficient lead time, we would also be able to validate alternate suppliers for each of these critical raw materials.
Property, Plant and Equipment
Property, plant and equipment are recorded at cost. Expenditures for
maintenance and repairs are charged to expense and the costs of significant improvements that extend the life of underlying assets are capitalized. Assets are generally depreciated using the straight-line method. Upon retirement or sale, the cost of
assets disposed of and the related accumulated depreciation are eliminated and the related gains or losses are recorded in the consolidated statement of operations.
We capitalize internal use software development costs. These costs are included in property, plant and equipment as production and other equipment and are amortized on a straight-line basis over the estimated
useful lives of the related software, which is generally three years. We capitalize interest costs associated with the construction of certain capital assets.
|
|
|
| MILLIPORE FORM 10-K 2009 |
|
73 |
NOTES TO CONSOLIDATED FINANCIAL STATEMENTS—(Continued)
(In thousands, except per share data)
The estimated useful lives of our depreciable assets are as follows:
|
|
|
| Leasehold improvements |
|
Shorter of the life of the improvement or the initial term of the lease |
| Buildings and improvements |
|
4 to 40 years |
| Production and other equipment |
|
2 to 20 years |
Intangible Assets and Goodwill
Intangible assets with finite useful lives, including patented and unpatented technology, trade names and trademarks, customer related intangibles, and licenses are
amortized over periods ranging from 1.5 to 20 years either on a straight-line basis, or in proportion to the projected economic benefits from the intangible assets. Goodwill represents the difference between the purchase price and the fair value of
the identifiable assets acquired and liabilities assumed in a business combination. Goodwill is not amortized, but is subject to impairment review.
Valuation of Long-Lived Assets
Valuation of certain long-lived assets including property, plant and equipment, intangible assets, and
goodwill requires significant judgment. Assumptions and estimates are used in determining the fair value of assets acquired and liabilities assumed in a business acquisition. We utilize commonly accepted valuation techniques, such as the income
approach and the cost approach, as appropriate, in establishing the fair value of long-lived assets.
We evaluate the value of our property, plant and
equipment and other intangible assets for impairment whenever events or changes in circumstances indicate that the carrying value of a group of assets may not be fully recoverable. Recoverability of assets to be held and used is measured by
comparing the carrying amount of a group of assets to the future undiscounted net cash flows expected to be generated by the asset group. If the sum of the estimated future undiscounted cash flows is less than the carrying amount, we record an
impairment charge based on the difference between the carrying value of the group of assets and its fair value, which we estimate based on discounted expected future cash flows. Assets to be disposed of are reported at the lower of the carrying
amount or fair value less costs to sell.
Goodwill is tested annually for impairment, or more frequently if events or changes in circumstances indicate
that an impairment may exist. Goodwill is considered impaired when the carrying value of a reporting unit exceeds its estimated fair value. We perform our annual impairment test as of the end of the second fiscal quarter. Our reporting units are our
Bioprocess and Bioscience operating segments. The application of the impairment test is a two-step process. The first step compares the carrying value of our reporting units to their estimated fair values as of the test date. We estimate the fair
value of our reporting units using a combination of the discounted cash flow method and the cash earnings multiple method. Such fair value estimates are then validated by comparison to our enterprise value. If fair value is less than carrying value,
a second step must be performed to quantify the amount of the impairment, if any. The second step compares carrying value to the fair value of our assets and liabilities, including goodwill. The amount of any impairment is measured by the excess of
the carrying value of goodwill over its implied fair value.
Derivatives and Financial Instruments
Our earnings and cash flows are subject to fluctuations caused by changes in foreign currency exchange rates and changes in interest rates. We enter into foreign
currency forward exchange contracts, when available on a cost-effective basis, to hedge our underlying foreign currency exchange rate exposures. These foreign currency forward instruments are managed on a consolidated basis to take advantage of
natural offsets and to minimize our net foreign currency exposures.
|
|
|
| 74 |
|
MILLIPORE FORM 10-K 2009
|
NOTES TO CONSOLIDATED FINANCIAL STATEMENTS—(Continued)
(In thousands, except per share data)
We entered into forward starting interest rate swap agreements to hedge interest rate exposures related to an anticipated fixed-rate debt refinancing. Derivative forward instruments are not used
for speculative purposes.
All derivatives are recognized on the consolidated balance sheet at their fair value. Changes in the fair value of derivatives
are recognized in earnings or other comprehensive income depending on whether the derivative instrument qualifies for hedge accounting. Changes in the fair value of derivatives that are designated and highly effective as cash flow hedges are
recorded in other comprehensive income until earnings are affected by the hedged items. Changes in the fair value of derivatives and financial instruments that are used to hedge our net investments in foreign operations are included as translation
adjustments in other comprehensive income. Changes in the fair value of derivatives that do not qualifying for hedge accounting, and the ineffective portion of derivative instruments designated as cash flow hedges, are recorded in selling, general
and administrative expenses in the consolidated statement of operations. We formally assess, both at the inception of the hedge and on an ongoing basis, whether the transaction being hedged is probable of occurring, and whether the derivatives are
highly effective in offsetting changes in the cash flows of the hedged items.
When it is determined that a derivative is not highly effective as a hedge
or that it has ceased to be a highly effective hedge, we discontinue hedge accounting prospectively. Cash flows from derivative financial instruments that are designated as hedges are classified within the same category as the item being hedged on
the consolidated statement of cash flows. Cash flows from derivatives that are not designated as hedges and settle in different fiscal periods from the hedged transactions are included in cash flows from investing activities.
Stock-based Compensation
Stock-based compensation
expense is estimated as of the grant date based on the fair value of the award. We estimate the fair value of our stock options using the Black-Scholes option-pricing model and the fair value of our restricted stock awards and restricted stock units
based on the quoted market price of our common stock. Estimating the fair value for stock options for each grant requires judgment, including estimating stock-price volatility, expected term, expected dividends, and risk-free interest rates. The
expected volatility rates are estimated based on historical volatilities of our common stock over a period of time that approximates the expected term of the options. The expected term represents the average time that options are expected to be
outstanding and is estimated based on the historical exercise, post-vesting cancellation, and expiration patterns of our stock options. Expected dividends are estimated based on our current projections. The risk-free interest rate for periods
approximating the expected terms of the options is based on the U.S. Treasury yield curve in effect at the time of grant.
We recognize stock-based
compensation expense in our consolidated statement of operations over the requisite service period of the awards, which generally represents the vesting period, net of estimated forfeitures. Forfeiture rates are estimated based on historical
pre-vesting forfeiture history and are updated on a quarterly basis to reflect actual forfeitures of unvested awards and other known events. For stock-based compensation awards that vest over time based on employment, we recognize the associated
compensation expense on a straight line basis over the requisite service period. For performance-based restricted stock units, we recognize the related compensation expense ratably over the vesting period when it is probable that the performance
targets are expected to be achieved based on management’s projections. We evaluate, on a quarterly basis, the probability that the target performance goals will be achieved, if at all, and the anticipated level of achievement.
|
|
|
| MILLIPORE FORM 10-K 2009 |
|
75 |
NOTES TO CONSOLIDATED FINANCIAL STATEMENTS—(Continued)
(In thousands, except per share data)
Employee Retirement Plans
We sponsor domestic and
foreign defined benefit pension and postretirement benefit plans covering employees who meet certain eligibility requirements. We recognize the overfunded or underfunded status of our defined benefit pension and postretirement benefit plans as an
asset or liability in our consolidated balance sheet. Net periodic benefit cost is recorded in the consolidated statement of operations while other changes in the funded status is recognized in the year in which the changes occur through other
comprehensive income. In 2008, we changed the measurement date for one of our foreign pension plans from September 30 to December 31 and recorded a reduction to beginning retained earnings amounting to $124. We now use a December 31
measurement date for all of our defined benefit pension and postretirement benefit plans.
Income Taxes
Our income tax expense includes U.S. and international income taxes. Certain items of income and expense are not reported in tax returns and financial statements in
the same year. The tax effects of these differences are reported as deferred tax assets and liabilities. Deferred taxes are recognized for the estimated future tax effects of deductible temporary differences and tax operating loss and credit
carryforwards. Deferred tax assets and liabilities are measured using enacted tax rates for the years in which those temporary differences are expected to be recovered or settled. With respect to the unremitted earnings of our foreign subsidiaries,
deferred taxes are provided on amounts expected to be repatriated. Changes in deferred tax assets and liabilities are recorded in the provision for income taxes either in the statement of operations or in other comprehensive income.
We assess the likelihood that our deferred tax assets will be recovered from future taxable income and, to the extent we believe that it is more likely than not that
all or a portion of deferred tax assets will not be realized, we establish a valuation allowance. To the extent we establish a valuation allowance or increase this allowance in a period, we include an expense in our provision for income taxes in the
consolidated statement of operations.
We assess our income tax positions and record tax benefits for all years subject to examination based on our
evaluation of the facts, circumstances, and information available at each reporting date. For those tax positions with a greater than 50 percent likelihood of being realized upon ultimate settlement with a taxing authority that has full knowledge of
all relevant information, we record a tax benefit. For those income tax positions that are not likely to be sustained, no tax benefit is recognized in the consolidated financial statements. We recognize interest and penalties related to uncertain
tax positions as part of our provision for income taxes.
Earnings per Share
Basic earnings per share is calculated by dividing the net income attributable to Millipore for the period by the weighted average number of shares outstanding for the
period. Diluted earnings per share is calculated by considering the dilutive effect of common stock equivalents (i.e., outstanding stock options and unvested restricted stock units) under the treasury stock method as if they were converted into
common stock as of the beginning of the period or as of the date of grant, if later. Performance-based restricted stock units will be included in the diluted earnings per share calculation when the performance targets are achieved.
Contingently issuable shares under our convertible debt agreements will be included in the diluted earnings per share calculation using the treasury stock method when
our stock price exceeds the conversion price.
|
|
|
| 76 |
|
MILLIPORE FORM 10-K 2009
|
NOTES TO CONSOLIDATED FINANCIAL STATEMENTS—(Continued)
(In thousands, except per share data)
Revenue Recognition
Revenue from the sale of products
is recognized when:
| n
|
evidence of an arrangement is in place; |
| n
|
related prices are fixed or determinable; |
| n
|
delivery or performance has occurred; and |
| n
|
collection of the resulting receivable is reasonably assured. |
Customer purchase orders or sales agreements evidence our sales arrangements. These purchase orders and sales agreements specify both selling prices and quantities, which are the basis for recording sales revenue. Any deviation from this
policy requires management review and approval. Trade terms for the majority of our sales contracts indicate that title and risk of loss pass from us to the customer when we ship products from our facilities, which is when revenue is recognized.
Revenue is deferred until our products arrive at customers’ facilities in situations where trade terms indicate that title and risk of loss pass from us to the customers upon their receipt of the products. We perform ongoing credit evaluations
of our customers and ship products only to customers that satisfy our credit evaluation.
Standard consumable and hardware products account for over 90
percent of our total consolidated revenues and are typically sold with standard terms and conditions. Revenues for these products are generally recognized upon shipment or delivery to the customers. In instances where installation is required for
the sale of hardware products, we generally recognize revenue related to the hardware products when title passes and recognize revenue related to the installation when installation is complete. The allocation of revenue between product and the
installation is based on relative fair value at the time of sale. In limited cases, our customers may require site acceptance testing for certain customized products built to the customers’ specifications. Revenues on these products are
deferred upon shipment and are recognized when site acceptance testing is completed.
Revenue for certain fixed price contracts associated with our
Bioprocess Division equipment business is recognized under the percentage of completion method (“POC”). Approximately 2 percent of our revenue was derived from POC sales in 2009. Revenue is recognized based on the ratio of hours expended
to the total estimated hours to complete the construction of the equipment. The cumulative impact of any revisions in estimates of the percentage of completion is reflected in the period in which the changes become known. Losses are accrued when
known.
Revenue from service arrangements is recognized when the services are provided, or over the contractual period. For laboratory water
instrumentation products, installation and maintenance service revenues are recognized when the site service visit is completed. For validation testing services, revenue is recognized when the contracted study is completed and accepted by the
customer. For sample analysis services, revenue is recognized as each sample analysis is completed. For assay development and assay validation services, revenue is recognized proportionally as contractually defined deliverables are provided to the
customer. Revenue related to maintenance and extended warranty service contracts is recognized ratably over the contractual period or as the services are performed, based on the terms of the arrangement.
We recognize license and royalty revenue when the amounts are determinable and we have fulfilled our obligations under the applicable agreement. This generally occurs
when cash payments are received or licensed sales are reported to us.
|
|
|
| MILLIPORE FORM 10-K 2009 |
|
77 |
NOTES TO CONSOLIDATED FINANCIAL STATEMENTS—(Continued)
(In thousands, except per share data)
Warranty Costs
We accrue for estimated warranty costs
for products at the time of sale. Warranty liabilities are based on estimated future repair costs using historical statistical models and were not material as of December 31, 2009 and 2008.
Research and Development
Research and development
costs are expensed as incurred.
Recent Accounting Pronouncements
In June 2009, the Financial Accounting Standards Board (the “FASB”) issued an amendment to the accounting and disclosure requirements for the consolidation of variable interest entities (“VIE”)
and the evaluation of when consolidation of a VIE is required. This amends the guidance for determining whether an entity is a VIE and establishes an additional reconsideration event for assessing whether an entity is, or continues to be, a VIE. The
amendment modifies the requirements for determining whether an entity is the primary beneficiary of a VIE and requires ongoing reassessments of whether an entity is the primary beneficiary. This amendment also enhances the disclosure requirements
about an entity’s involvement with a VIE. This amendment is effective for financial statements issued for fiscal years beginning after November 15, 2009 and interim periods within those years. We do not believe that this amendment will
have a material effect on our consolidated financial statements.
In October 2009, the Emerging Issues Task Force (“the EITF”) reached
consensus on an amendment to the accounting and disclosure requirements for revenue arrangements with multiple deliverables. The amendment eliminates the use of the residual method of allocation and requires, instead, that arrangement consideration
be allocated, at the inception of the arrangement, to all deliverables based on their relative selling price. When applying the relative selling price allocation method, the selling price for each of the deliverables shall be determined using
vendor-specific objective evidence (“VSOE”), if it exists, otherwise third-party evidence (“TPE”). If neither VSOE nor TPE exists, the amendment allows a vendor to use its best estimate of selling price. This amendment is
effective prospectively for revenue arrangements entered into or materially modified in fiscal years beginning on or after June 15, 2010. Alternatively, this amendment may be applied retrospectively to all periods presented. Earlier application
is permitted as of the beginning of an entity’s fiscal year. We plan to adopt this amendment as of January 1, 2010 and do not believe this amendment will have a material effect on our consolidated financial statements.
3. BUSINESS ACQUISITIONS
BioAnaLab Limited
On August 7, 2009, we acquired BioAnaLab Limited (“BioAnaLab”), a European-based services provider that
specializes in the analysis of biologic drugs and vaccines. The acquisition enables us to expand our biopharmaceutical services business into Europe. The total purchase price was $13,009, which was paid for with available cash on hand. The purchase
price was allocated to net assets acquired of $2,669, identifiable intangible assets of $4,552, net deferred tax liabilities of $1,187, and goodwill of $6,975. Acquisition related costs of $263 are included in selling, general and administrative
expenses in our consolidated statements of operations. The goodwill is not deductible for tax purposes.
|
|
|
| 78 |
|
MILLIPORE FORM 10-K 2009
|
NOTES TO CONSOLIDATED FINANCIAL STATEMENTS—(Continued)
(In thousands, except per share data)
Guava Technologies, Inc.
On February 20, 2009, we
acquired Guava Technologies, Inc. (“Guava”), a provider of easy-to-use, benchtop cell analysis systems. With the Guava acquisition, we expanded our flow cytometry platform to additional markets. The total purchase price was $18,870, which
was paid for with available cash on hand. The purchase price was allocated to net assets acquired of $811, identifiable intangible assets of $16,600, and net deferred tax assets of $10,001. Acquisition related costs of $620 are included in selling,
general and administrative expenses in our consolidated statements of operations.
We recorded a bargain purchase gain on acquisition of $8,542 after
allocating the purchase price to the identifiable assets acquired and liabilities assumed. Under the new accounting standards for business combinations, which were effective as of January 1, 2009, the acquisition resulted in a gain because the
fair value of net assets acquired exceeded the purchase price. This was primarily attributable to the net operating loss carryforwards that we recognized as deferred tax assets based on our ability to use them in the future. These deferred tax
assets could not be utilized by Guava as a result of their operating losses.
We had a pre-existing relationship with Guava concerning distribution and
service rights related to their products. The acquisition settled this pre-existing relationship. The net book value related to these distribution and service rights was determined to be at fair value and no gain or loss was recognized for the
effective settlement of these agreements.
For both of these acquisitions, the purchase price was allocated to net assets acquired and identifiable
intangible assets based on their estimated fair values. These fair values were based on management’s estimates and assumptions. Intangible assets recorded as a result of these acquisitions are not deductible for tax purposes.
The results of the acquired operations (Guava and BioAnaLab) have been included in our consolidated statements of operations since the acquisition dates, respectively.
Pro forma results of operations have not been presented because such information is not material to our consolidated financial statements.
Serologicals Corporation
We committed to a plan of integration of certain Serologicals Corporation (“Serologicals”) activities
when we acquired the company on July 14, 2006. The plan included closure of facilities, the abandonment or redeployment of equipment, and employee terminations and relocations. We recorded severance and relocation cost liabilities amounting to
$6,675 and facility closure cost liabilities amounting to $5,877 with corresponding adjustments to goodwill. Amounts accrued for severance and relocation costs were paid in 2006, 2007, and 2008. At December 31, 2009, only accruals for
facility closure costs amounting to $1,587 remained and are expected to be paid over the remaining lease term for certain idle facilities.
4. GOODWILL
The following table presents changes in the carrying amounts of goodwill:
|
|
|
|
|
|
|
|
| |
|
2009 |
|
2008 |
|
| Balance at beginning of year |
|
$ |
1,004,694 |
|
$ |
1,019,581 |
|
| Addition from BioAnaLab acquisition |
|
|
6,975 |
|
|
– |
|
| Adjustments for prior year acquisitions |
|
|
– |
|
|
(712 |
) |
| Effect of foreign exchange rate changes |
|
|
6,014 |
|
|
(14,175 |
) |
| Balance at end of year |
|
$ |
1,017,683 |
|
$ |
1,004,694 |
|
|
|
|
| MILLIPORE FORM 10-K 2009 |
|
79 |
NOTES TO CONSOLIDATED FINANCIAL STATEMENTS—(Continued)
(In thousands, except per share data)
We completed our annual impairment review as of July 4, 2009 and concluded that no impairment charge was required as of that date. Through December 31, 2009,
there have been no events or changes in circumstances that would change our conclusion. We had no accumulated impairment losses through December 31, 2009.
5. INTANGIBLE ASSETS
Identifiable intangible assets consisted of the following:
|
|
|
|
|
|
|
|
|
|
|
|
|
| December 31, 2009 |
|
Gross Intangible
Assets |
|
Accumulated
Amortization |
|
|
Net Intangible
Assets |
|
Estimated
Useful Life |
| Patented and unpatented technologies |
|
$ |
93,621 |
|
$ |
(47,323 |
) |
|
$ |
46,298 |
|
5 – 20 years |
| Trademarks and trade names |
|
|
42,797 |
|
|
(21,955 |
) |
|
|
20,842 |
|
5 – 20 years |
| Customer relationships |
|
|
412,554 |
|
|
(148,807 |
) |
|
|
263,747 |
|
15 – 18 years |
| Licenses and other |
|
|
16,062 |
|
|
(9,253 |
) |
|
|
6,809 |
|
1.5 – 20 years |
| Total |
|
$ |
565,034 |
|
$ |
(227,338 |
) |
|
$ |
337,696 |
|
|
|
|
|
|
|
|
|
|
|
|
|
|
|
| December 31, 2008 |
|
Gross Intangible
Assets |
|
Accumulated
Amortization |
|
|
Net Intangible
Assets |
|
Estimated
Useful Life |
| Patented and unpatented technologies |
|
$ |
79,029 |
|
$ |
(38,743 |
) |
|
$ |
40,286 |
|
5 – 20 years |
| Trademarks and trade names |
|
|
41,749 |
|
|
(18,919 |
) |
|
|
22,830 |
|
5 – 20 years |
| Customer relationships |
|
|
402,596 |
|
|
(102,171 |
) |
|
|
300,425 |
|
15 – 18 years |
| Licenses and other |
|
|
13,065 |
|
|
(7,133 |
) |
|
|
5,932 |
|
1.5 – 20 years |
| Total |
|
$ |
536,439 |
|
$ |
(166,966 |
) |
|
$ |
369,473 |
|
|
Amortization expense for 2009, 2008, and 2007 was $59,038, $64,480, and $59,448, respectively.
The estimated aggregate amortization expense for intangible assets owned as of December 31, 2009 for each of the five succeeding years and thereafter is as
follows:
|
|
|
|
| 2010 |
|
$ |
55,288 |
| 2011 |
|
|
49,658 |
| 2012 |
|
|
43,761 |
| 2013 |
|
|
38,049 |
| 2014 |
|
|
32,326 |
| Thereafter |
|
|
118,614 |
| Total |
|
$ |
337,696 |
|
|
|
| 80 |
|
MILLIPORE FORM 10-K 2009
|
NOTES TO CONSOLIDATED FINANCIAL STATEMENTS—(Continued)
(In thousands, except per share data)
6. BASIC AND DILUTED EARNINGS PER SHARE
The
following table sets forth the computation of basic and diluted earnings per share (“EPS”):
|
|
|
|
|
|
|
|
|
|
| |
|
Year ended December 31, |
| |
|
2009 |
|
2008 (As Adjusted) |
|
2007 (As Adjusted) |
| Numerator: |
|
|
|
|
|
|
|
|
|
| Net income attributable to Millipore |
|
$ |
177,004 |
|
$ |
137,605 |
|
$ |
128,163 |
| Denominator: |
|
|
|
|
|
|
|
|
|
| Weighted average common shares outstanding for basic EPS |
|
|
55,509 |
|
|
55,128 |
|
|
54,263 |
| Dilutive effect of stock-based compensation awards |
|
|
615 |
|
|
583 |
|
|
765 |
| Weighted average common shares outstanding for diluted EPS |
|
|
56,124 |
|
|
55,711 |
|
|
55,028 |
| Earnings per share: |
|
|
|
|
|
|
|
|
|
| Basic |
|
$ |
3.19 |
|
$ |
2.50 |
|
$ |
2.36 |
| Diluted |
|
$ |
3.15 |
|
$ |
2.47 |
|
$ |
2.33 |
Net income attributable to Millipore and earnings per share amounts for the years ended 2008 and 2007 have been
adjusted for changes in accounting described in Notes 1 and 10 of this Form 10-K.
For the years ended December 31, 2009, 2008, and 2007,
outstanding stock options amounting to 1,291 shares, 911 shares, and 497 shares, respectively, had exercise prices and assumed proceeds in excess of the average fair market value of our common stock for the related years. These shares were excluded
from the calculation of diluted earnings per share because of their antidilutive effect. Antidilutive options could become dilutive in the future. Performance-based restricted stock units were excluded from the calculation of diluted earnings per
share because they are considered contingently issuable shares and were excluded because targeted financial metrics have not been achieved. In addition, shares issuable for the conversion premium upon conversion of the 3.75 percent convertible
senior notes were excluded from the calculation of diluted earnings per share for 2009, 2008, and 2007, respectively, because our stock price had not exceeded the conversion price.
7. INVENTORIES
Inventories, stated at the lower of FIFO cost or market, consisted of the
following:
|
|
|
|
|
|
|
| |
|
December 31, |
| |
|
2009 |
|
2008 |
| Raw materials |
|
$ |
46,339 |
|
$ |
46,699 |
| Work in process |
|
|
85,740 |
|
|
77,638 |
| Finished goods |
|
|
125,730 |
|
|
135,023 |
| Total inventories |
|
$ |
257,809 |
|
$ |
259,360 |
|
|
|
| MILLIPORE FORM 10-K 2009 |
|
81 |
NOTES TO CONSOLIDATED FINANCIAL STATEMENTS—(Continued)
(In thousands, except per share data)
8. PROPERTY, PLANT AND EQUIPMENT
Property,
plant and equipment consisted of the following:
|
|
|
|
|
|
|
|
|
| |
|
December 31, |
|
| |
|
2009 |
|
|
2008 |
|
| Land |
|
$ |
21,098 |
|
|
$ |
20,914 |
|
| Leasehold improvements |
|
|
25,680 |
|
|
|
24,046 |
|
| Buildings and improvements |
|
|
381,591 |
|
|
|
339,932 |
|
| Production and other equipment |
|
|
452,640 |
|
|
|
412,263 |
|
| Construction in progress |
|
|
114,509 |
|
|
|
125,766 |
|
|
|
|
995,518 |
|
|
|
922,921 |
|
| Less: accumulated depreciation |
|
|
(399,907 |
) |
|
|
(345,511 |
) |
| Property, plant and equipment, net |
|
$ |
595,611 |
|
|
$ |
577,410 |
|
We capitalize interest costs associated with the
construction of certain capital assets. Amounts capitalized in 2009, 2008, and 2007 were $4,799, $4,340, and $3,232, respectively.
Depreciation expense
for the years ended December 31, 2009, 2008, and 2007 was $67,240, $67,805, and $64,299, respectively.
In November 2008, we changed our marketing
strategy for an idle facility because of continued weakness in the United States real estate market, excess production capacity in the North American biopharmaceutical industry, and the global economic recession. We analyzed the expected cash flows
from different sales scenarios and determined that the net carrying value of the assets was not recoverable. We recorded an impairment loss of $5,793 to adjust the carrying value to the estimated fair value, which is included in selling, general and
administrative expenses in the consolidated statement of operations. The fair value was determined based on selling price of comparable assets and discounted over the period of time which we expect it will take to sell the facility and related
equipment.
During 2009, 2008, and 2007, there was $1,977, $4,104, and $1,182, respectively, of non-cash investing activities related to property, plant
and equipment that had not yet been paid as of the end of each year. Additionally, there was $7,534 of non-cash investing activities in 2009 related to a capital lease.
9. ACCRUED EXPENSES
Accrued expenses consisted of the following:
|
|
|
|
|
|
|
| |
|
December 31, |
| |
|
2009 |
|
2008 |
| Deferred revenue |
|
$ |
21,550 |
|
$ |
17,608 |
| Accrued compensation |
|
|
102,087 |
|
|
85,872 |
| Other |
|
|
61,330 |
|
|
59,201 |
| Total |
|
$ |
184,967 |
|
$ |
162,681 |
|
|
|
| 82 |
|
MILLIPORE FORM 10-K 2009
|
NOTES TO CONSOLIDATED FINANCIAL STATEMENTS—(Continued)
(In thousands, except per share data)
10. DEBT
Short-term debt
Our short-term debt consisted of the following:
|
|
|
|
|
|
|
| |
|
December 31, |
| |
|
2009 |
|
2008 |
| Revolving credit facilities |
|
$ |
41,846 |
|
$ |
– |
| Operating bank facilities |
|
|
1,005 |
|
|
4,391 |
| Total |
|
$ |
42,851 |
|
$ |
4,391 |
We have revolving credit facilities with two Japanese
banks. These credit facilities provide for cumulative borrowings of ¥7,000,000, or $75,301, with an interest rate of TIBOR plus an applicable margin. Interest is payable at the end of an interest period based upon the term of the borrowing.
These credit facilities expire in December 2010 and are subject to annual renewal at terms consistent with the initial agreements. As of December 31, 2009, we had ¥3,110,000, or $33,455, available for borrowing under these credit
facilities. We are not required to comply with any debt covenants under these agreements.
Operating bank facilities consisted of bank overdrafts as of
the end of the year.
Long-term debt
Our long-term debt consisted of the following:
|
|
|
|
|
|
|
| |
|
December 31, |
| |
|
2009 |
|
2008 (As Adjusted) |
| Revolving credit facility |
|
$ |
– |
|
$ |
215,271 |
| 3.75% convertible senior notes due 2026, net of discount |
|
|
533,186 |
|
|
518,157 |
| 5.875% senior notes due 2016, net of discount |
|
|
357,056 |
|
|
348,630 |
| Total long-term debt |
|
$ |
890,242 |
|
$ |
1,082,058 |
REVOLVING CREDIT FACILITY
We have an unsecured revolving credit facility (the “Revolver”) that expires in June 2011. The Revolver agreement provides for a domestic revolving credit
facility and a foreign credit facility each with a maximum borrowing of €465,000, or $665,808. The combined borrowings at any one time
under both revolving credit facilities may not exceed €465,000 in the aggregate. The domestic revolving credit facility includes a €65,000 letter of credit subfacility and a €17,500 swing line subfacility. We may elect to increase the credit facilities by an amount not in excess of €130,000, or
$186,139. We may prepay any outstanding borrowings in whole or in part without premium or penalty. As of December 31, 2009 and 2008, outstanding letters of credit were $2,591 and $1,874, respectively.
We recorded $4,489 of deferred financing costs associated with the Revolver agreement and have been and will continue to amortize the costs over the term of the
agreement, or five years.
We may choose an interest rate equal to either LIBOR plus an applicable margin or a base rate defined as the higher of the
annual rate of the lead bank’s prime rate or the federal funds rate plus 0.50 percentage points for borrowings under the Revolver. Interest is payable quarterly or, if earlier, at the end of an interest period.
|
|
|
| MILLIPORE FORM 10-K 2009 |
|
83 |
NOTES TO CONSOLIDATED FINANCIAL STATEMENTS—(Continued)
(In thousands, except per share data)
We are required to pay a commitment fee on unused commitments ranging between 0.0675 percent and 0.60 percent annually, based on the Revolver’s debt rating. As of December 31, 2009, we
had €465,000, or $665,808, available for borrowing on the Revolver.
We are required to maintain certain leverage and interest coverage ratios set forth in the Revolver agreement. As of December 31, 2009, we were compliant with all financial covenants. The agreement also
includes limitations on our ability to incur additional indebtedness; to merge, consolidate, or sell assets; to create liens; and to make payments in respect of capital stock or subordinated debt, as well as other customary covenants and
representations.
The following table summarizes the financial covenant requirements as of December 31, 2009 and thereafter, and our compliance with
these covenants as of December 31, 2009:
|
|
|
|
|
| Covenant |
|
Requirement |
|
Actual at
December 31, 2009 |
| Maximum leverage ratio |
|
3.50:1 |
|
2.19:1 |
| Minimum interest coverage ratio |
|
3.50:1 |
|
9.74:1 |
As of December 31, 2009, we had no borrowings
outstanding under the Revolver. Borrowings under the revolver were classified as long-term debt because our Revolver agreement expires in June 2011. For 2009, 2008, and 2007, the weighted average interest rate for the Revolver was 1.2 percent,
4.5 percent, and 4.8 percent, respectively.
3.75% CONVERTIBLE SENIOR NOTES DUE 2026
In June 2006, we issued $565,000 in aggregate principal amount of convertible senior notes (the “Convertible Notes”) due on June 1, 2026. The
Convertible Notes bear interest at 3.75 percent per annum and are payable semi-annually in arrears on June 1 and December 1 of each year. Commencing with the six-month period beginning on December 1, 2011, we will accrue
contingent interest on the Convertible Notes at the rate of 0.175 percent of the average trading price of the Convertible Notes (“the Contingent Interest feature”), if the average trading price of the Convertible Notes for the five
consecutive trading days preceding such six-month periods equals 120 percent or more of the principal amount. The Convertible Notes are senior unsecured obligations and rank equally with all of our existing and future senior unsecured indebtedness.
We incurred $13,361 of deferred financing costs associated with the issuance of the Convertible Notes.
Holders of the Convertible Notes may convert
their notes into cash and, if applicable, shares of our common stock prior to June 1, 2026 under certain conditions. The Convertible Notes may be converted if the closing sale price of our common stock for each of the 20 or more trading days in
a period of 30 consecutive trading days ending on the last trading day of the immediately preceding calendar quarter exceeds 120 percent of the conversion price in effect on the last trading day of the immediately preceding calendar quarter. The
Convertible Notes may also be converted during the five consecutive business days immediately after any five consecutive trading day period in which the average trading price per $1 principal amount of the Convertible Notes was equal to or less than
97 percent of the average conversion value of the notes during this period. The Convertible Notes will also be convertible if we make certain distributions on our common stock or engage in certain transactions; if we call the Convertible Notes for
redemption; at any time from November 1, 2011 through December 1, 2011; and on or after June 1, 2024. Upon conversion, the Convertible Notes will be convertible into cash for the principal amount and shares of our common stock for the
conversion premium, if any, based on an initial conversion rate of 11.0485 shares per $1.00 principal amount (which represents an initial conversion price of approximately $90.51 per share), subject to adjustments.
|
|
|
| 84 |
|
MILLIPORE FORM 10-K 2009
|
NOTES TO CONSOLIDATED FINANCIAL STATEMENTS—(Continued)
(In thousands, except per share data)
On or after December 1, 2011, we have the option to redeem the Convertible Notes at a redemption price equal to 100 percent of the principal amount of the notes,
plus accrued but unpaid interest (the “Call Option”). On each of December 1, 2011, June 1, 2016 and June 1, 2021, holders of the Convertible Notes have the option to require us to purchase all or a portion of their
notes at a purchase price in cash equal to 100 percent of the principal amount of the notes, plus accrued but unpaid interest (the “Put Option”). Holders may also require us to repurchase all or a portion of their notes upon a fundamental
change at a repurchase price in cash equal to 100 percent of the principal amount of the notes to be repurchased, plus accrued but unpaid interest.
A
holder that surrenders the Convertible Notes for conversion in connection with a “make-whole fundamental change” that occurs before December 1, 2011 may in certain circumstances be entitled to an increased conversion rate (the
“Make-whole Payment”). However, in lieu of increasing the conversion rate applicable to those Convertible Notes, we may in certain circumstances elect to adjust the conversion rate and the related conversion obligation so that the
Convertible Notes will be convertible into shares of the acquiring company’s common stock, except that the principal return due upon conversion will continue to be payable in cash.
Although we are not required to maintain any specified financial ratios under the Convertible Notes agreement, we will be considered in default if we fail to fulfill our conversion or redemption obligations, make
required interest payments, provide notice to holders of the Convertible Notes in certain specified circumstances, or cure our default on any indebtedness in the aggregate principal amount of $50,000 or more. If an event of default has occurred and
is continuing, the principal amount of the Convertible Notes plus interest thereon may become immediately due and payable. We are currently in compliance with the covenant restrictions.
As of December 31, 2009, the Convertible Notes had a fair market value of $583,362, which was determined from available market prices using current interest rates, non-performance risk and term to maturity.
The new accounting standard for convertible debt that may be settled in cash upon conversion changed the accounting for our Convertible Notes and the
related deferred financing costs. Prior to the issuance of this accounting standard, we reported the Convertible Notes at their principal amount of $565,000 in long-term debt and capitalized deferred financing costs amounting to $13,361. Upon
adoption of the new accounting standard as of January 1, 2009, we adjusted the accounting for the Convertible Notes and the related deferred financing costs for all prior periods since the initial issuance of the debt, as described in Note 1.
We determined that the estimated fair value of a similar debt instrument without the conversion feature was $483,747 at the time of issuance. The equity component, recorded as additional paid-in capital, was $50,377 as of the date of issuance, which
represents the difference between the proceeds from issuance of the Convertible Notes and the fair value of the debt as of the date of issuance, net of deferred taxes of $30,876. The resulting $81,253 discount on the debt has been and will continue
to be amortized as interest expense over the period from June 2006 through December 2011, which represents the expected life of the debt. Additionally, we reclassified $1,205 of the deferred financing costs to equity, net of deferred taxes of $738,
as equity issuance costs, which will not be amortized to the statement of operations. The cumulative effect of the change reduced December 31, 2006 retained earnings by $4,373.
|
|
|
| MILLIPORE FORM 10-K 2009 |
|
85 |
NOTES TO CONSOLIDATED FINANCIAL STATEMENTS—(Continued)
(In thousands, except per share data)
The consolidated balance sheet as of December 31, 2008 and the consolidated statement of operations for 2008 and 2007 have been adjusted for the change in
accounting principle as follows:
|
|
|
|
|
|
|
|
|
|
|
|
|
| |
|
As Previously
Reported |
|
|
Adjustments |
|
|
As Adjusted |
|
| Consolidated Balance Sheet: |
|
|
|
|
|
|
|
|
|
|
|
|
| December 31, 2008 |
|
|
|
|
|
|
|
|
|
|
|
|
| Deferred tax assets – non-current |
|
$ |
28,445 |
|
|
$ |
(17,519 |
) |
|
$ |
10,926 |
|
| Other assets – non-current |
|
$ |
19,185 |
|
|
$ |
(1,030 |
) |
|
$ |
18,155 |
|
| Long-term debt |
|
$ |
1,128,901 |
|
|
$ |
(46,843 |
) |
|
$ |
1,082,058 |
|
| Additional paid-in capital |
|
$ |
297,257 |
|
|
$ |
49,172 |
|
|
$ |
346,429 |
|
| Retained earnings |
|
$ |
988,235 |
|
|
$ |
(20,878 |
) |
|
$ |
967,357 |
|
| Consolidated Statement of Operations: |
|
|
|
|
|
|
|
|
|
|
|
|
| Year ended December 31, 2008 |
|
|
|
|
|
|
|
|
|
|
|
|
| Interest expense |
|
$ |
(56,425 |
) |
|
$ |
(13,684 |
) |
|
$ |
(70,109 |
) |
| Provision for income taxes |
|
$ |
28,657 |
|
|
$ |
(5,488 |
) |
|
$ |
23,169 |
|
| Net income attributable to Millipore |
|
$ |
145,801 |
|
|
$ |
(8,196 |
) |
|
$ |
137,605 |
|
| Earnings per share: |
|
|
|
|
|
|
|
|
|
|
|
|
| Basic |
|
$ |
2.64 |
|
|
$ |
(0.14 |
) |
|
$ |
2.50 |
|
| Diluted |
|
$ |
2.62 |
|
|
$ |
(0.15 |
) |
|
$ |
2.47 |
|
| Year ended December 31, 2007 |
|
|
|
|
|
|
|
|
|
|
|
|
| Interest expense |
|
$ |
(65,757 |
) |
|
$ |
(12,759 |
) |
|
$ |
(78,516 |
) |
| Provision for income taxes |
|
$ |
12,424 |
|
|
$ |
(4,450 |
) |
|
$ |
7,974 |
|
| Net income attributable to Millipore |
|
$ |
136,472 |
|
|
$ |
(8,309 |
) |
|
$ |
128,163 |
|
| Earnings per share: |
|
|
|
|
|
|
|
|
|
|
|
|
| Basic |
|
$ |
2.52 |
|
|
$ |
(0.16 |
) |
|
$ |
2.36 |
|
| Diluted |
|
$ |
2.48 |
|
|
$ |
(0.15 |
) |
|
$ |
2.33 |
|
Upon conversion, the Convertible Notes will be converted
into cash for the principal amount and shares of our common stock for the conversion premium, if any, based on initial conversion rate of 11.0485 shares per $1 principal amount (which represents an initial conversion price of approximately $90.51
per share), subject to adjustments.
The following table sets forth balance sheet information regarding the Convertible Notes:
|
|
|
|
|
|
|
| |
|
Year ended December 31, |
| |
|
2009 |
|
2008 (As Adjusted) |
| Principal value of the liability component |
|
$ |
565,000 |
|
$ |
565,000 |
| Unamortized value of the liability component |
|
|
31,814 |
|
|
46,843 |
| Net carrying value of the liability component |
|
$ |
533,186 |
|
$ |
518,157 |
Interest expense on the Convertible Notes is recognized
based on an effective interest rate of 6.94 percent. This rate represents the contractual coupon interest and the discount amortization as shown below:
|
|
|
|
|
|
|
|
|
|
| |
|
Year ended December 31, |
| |
|
2009 |
|
2008 (As Adjusted) |
|
2007 (As Adjusted) |
| Interest expense – coupon |
|
$ |
21,188 |
|
$ |
21,188 |
|
$ |
21,188 |
| Interest expense – debt discount amortization |
|
$ |
15,029 |
|
$ |
14,038 |
|
$ |
13,112 |
|
|
|
| 86 |
|
MILLIPORE FORM 10-K 2009
|
NOTES TO CONSOLIDATED FINANCIAL STATEMENTS—(Continued)
(In thousands, except per share data)
5.875% SENIOR NOTES DUE 2016
In June 2006, we issued €250,000 in aggregate principal amount of 5.875 percent senior notes (the “Euro Notes”) due in 2016. Interest is payable semi-annually
in arrears on June 30 and December 30 of each year. The Euro Notes were issued at 99.611 percent of the principal amount, which resulted in an original issue discount of €973. The Euro Notes are senior unsecured obligations and rank equally with all of our existing and future senior unsecured indebtedness. We recorded $3,321 of deferred financing costs associated with the
issuance of the Euro Notes, which we are amortizing over 10 years.
Upon the occurrence of any change in control, holders of the Euro Notes may require
us to repurchase all of their Euro Notes for a cash price equal to 101 percent of the principal amount, plus accrued and unpaid interest thereon (the holder’s “Put Option”). Before June 30, 2016, we may, at our option, redeem the
Euro Notes, in whole or in part, for cash, at a redemption price equal to 100 percent of the principal amount of the Euro Notes we redeem, plus applicable “make-whole” premium (“call options”). In addition, we may redeem our
option in whole, but not in part, at a redemption price equal to 100 percent of the principal amount, plus accrued and unpaid interest, upon the occurrence of certain tax events in the United States (“call options”).
The indenture for the Euro Notes places certain restrictions on our ability to create, incur, assume or suffer liens on our manufacturing plants and other principal
facilities in the United States and to enter into certain sale-leaseback transactions. We would also be considered in default if we fail to fulfill our redemption obligations, make required interest payments, provide notice to holders of the Euro
Notes in certain specified circumstances, or cure our default on any of our indebtedness in the aggregate principal amount of $50,000 or more. If an event of default has occurred and is continuing, the principal amounts of the Euro Notes plus any
accrued interest thereon may become immediately due and payable. We are currently in compliance with the covenant restrictions.
As of December 31,
2009, the Euro Notes had a carrying value of $357,056, net of $905 of unamortized original issue discount, and a fair market value of $345,432. This fair market value was determined from available market prices using current interest rates,
non-performance risk, and term to maturity.
11. INCOME TAXES
Our provisions for income taxes are summarized as follows:
|
|
|
|
|
|
|
|
|
|
|
|
|
| |
|
Year ended December 31, |
|
| |
|
2009 |
|
|
2008 (As Adjusted) |
|
|
2007 (As Adjusted) |
|
| U.S. and foreign income (loss) before income taxes: |
|
|
|
|
|
|
|
|
|
|
|
|
| U.S. |
|
$ |
1,927 |
|
|
$ |
(33,427 |
) |
|
$ |
(43,380 |
) |
| Foreign |
|
|
217,660 |
|
|
|
197,763 |
|
|
|
183,044 |
|
| Income before income taxes |
|
$ |
219,587 |
|
|
$ |
164,336 |
|
|
$ |
139,664 |
|
| U.S. and foreign provision for (benefit from) income taxes: |
|
|
|
|
|
|
|
|
|
|
|
|
| U.S. Federal |
|
$ |
(2,219 |
) |
|
$ |
(19,772 |
) |
|
$ |
(27,185 |
) |
| Foreign |
|
|
42,266 |
|
|
|
42,952 |
|
|
|
35,536 |
|
| U.S. State |
|
|
350 |
|
|
|
(11 |
) |
|
|
(377 |
) |
| Total |
|
$ |
40,397 |
|
|
$ |
23,169 |
|
|
$ |
7,974 |
|
| Current and deferred provision for (benefit from) income taxes: |
|
|
|
|
|
|
|
|
|
|
|
|
| Current |
|
$ |
51,119 |
|
|
$ |
40,891 |
|
|
$ |
32,979 |
|
| Deferred |
|
|
(10,722 |
) |
|
|
(17,722 |
) |
|
|
(25,005 |
) |
| Total |
|
$ |
40,397 |
|
|
$ |
23,169 |
|
|
$ |
7,974 |
|
|
|
|
| MILLIPORE FORM 10-K 2009 |
|
87 |
NOTES TO CONSOLIDATED FINANCIAL STATEMENTS—(Continued)
(In thousands, except per share data)
Deferred income taxes represent the tax effects of transactions that are reported in different periods for tax and financial reporting purposes. These amounts consist
of the tax effects of temporary differences between the tax and financial reporting balances and tax carryforwards. Current and non-current deferred income tax assets and liabilities within the same tax jurisdiction are generally offset for
presentation in the consolidated balance sheets.
Significant components of our net deferred tax assets and liabilities are as follows:
|
|
|
|
|
|
|
|
|
| |
|
December 31, |
|
| |
|
2009 |
|
|
2008 (As Adjusted) |
|
| Deferred tax assets: |
|
|
|
|
|
|
|
|
| Inventory related transactions |
|
$ |
35,382 |
|
|
$ |
44,943 |
|
| Retirement plans and postretirement benefits |
|
|
12,126 |
|
|
|
23,701 |
|
| Tax credits |
|
|
57,404 |
|
|
|
55,721 |
|
| Net operating loss carryforwards |
|
|
36,981 |
|
|
|
27,983 |
|
| Capitalized research and development costs |
|
|
7,326 |
|
|
|
10,019 |
|
| Intangible assets and goodwill |
|
|
36,743 |
|
|
|
41,451 |
|
| Deferred state tax assets |
|
|
33,798 |
|
|
|
29,999 |
|
| Accrued expenses |
|
|
31,568 |
|
|
|
16,310 |
|
| Stock-based compensation |
|
|
16,578 |
|
|
|
10,381 |
|
| Other |
|
|
21,727 |
|
|
|
29,749 |
|
| Total deferred tax assets |
|
|
289,633 |
|
|
|
290,257 |
|
| Valuation allowance |
|
|
(28,313 |
) |
|
|
(27,963 |
) |
| Total deferred tax assets, net of valuation allowance |
|
|
261,320 |
|
|
|
262,294 |
|
| Deferred tax liabilities: |
|
|
|
|
|
|
|
|
| Purchased intangible assets |
|
|
125,979 |
|
|
|
134,582 |
|
| Contingent interest |
|
|
39,291 |
|
|
|
36,341 |
|
| Other |
|
|
12,439 |
|
|
|
17,691 |
|
| Total deferred tax liabilities |
|
|
177,709 |
|
|
|
188,614 |
|
| Net deferred tax assets |
|
$ |
83,611 |
|
|
$ |
73,680 |
|
At December 31, 2009, we had gross federal net
operating loss carryforwards of $84,376 that will begin to expire in 2025 through 2028. Included in this amount are gross federal net operating losses of $31,108 attributable to the Guava acquisition, which is subject to limitation on the
carryforwards following the ownership change of $3,116 per year. We also have foreign net operating loss carryforwards of approximately $27,367, of which $8,555 will begin to expire in 2011 and the remainder can be carried forward indefinitely.
These amounts do not include tax benefits associated with tax deductions of $25,221 attributable to our stock plan activities. These tax deductions represent an “excess tax benefit” which will be recognized as a reduction to accrued income
taxes and an addition to additional paid-in capital when realized in the tax return. The amount is measured by calculating our tax benefit both “with” and “without” the excess tax deduction.
|
|
|
| 88 |
|
MILLIPORE FORM 10-K 2009
|
NOTES TO CONSOLIDATED FINANCIAL STATEMENTS—(Continued)
(In thousands, except per share data)
Valuation allowances were established for the expiration of federal and state research credits, state investment credit carryforwards, some foreign and state net
operating loss carryforwards, and a capital loss carryforward. Although realization is not assured, we believe it is more likely than not that the remainder of deferred tax assets, net of valuation allowances, will be realized. The amount of
deferred tax assets considered realizable, however, could be reduced in the near term if estimates of future taxable income are reduced. The following table summarizes changes in our valuation allowances:
|
|
|
|
|
|
|
|
|
|
|
|
|
| |
|
Year ended December 31, |
|
| |
|
2009 |
|
|
2008 |
|
|
2007 |
|
| Balance at beginning of year |
|
$ |
27,963 |
|
|
$ |
30,753 |
|
|
$ |
29,146 |
|
| Additions |
|
|
4,073 |
|
|
|
2,961 |
|
|
|
2,203 |
|
| Utilization |
|
|
(2,587 |
) |
|
|
(4,413 |
) |
|
|
(596 |
) |
| Releases |
|
|
(1,136 |
) |
|
|
(1,338 |
) |
|
|
– |
|
| Balance at end of year |
|
$ |
28,313 |
|
|
$ |
27,963 |
|
|
$ |
30,753 |
|
We provide for U.S. income taxes on the earnings of
foreign subsidiaries unless they are considered indefinitely invested outside the U.S. We elected to treat the earnings from Ireland, Sweden, and the United Kingdom as indefinitely invested outside of the U.S. and we have not recorded deferred
income taxes applicable to the undistributed earnings of our subsidiaries in these countries. At December 31, 2009, we had $489,212 cumulative earnings outside the U.S. on which U.S. income taxes were not provided. If earnings of such foreign
subsidiaries were not indefinitely invested, a deferred tax liability of $126,308 would have been required at December 31, 2009.
A summary of the
differences between the worldwide effective tax rate and the United States statutory federal income tax rate is as follows:
|
|
|
|
|
|
|
|
|
|
| |
|
Year ended December 31, |
|
| |
|
2009 |
|
|
2008 (As Adjusted) |
|
|
2007 (As Adjusted) |
|
| U.S. statutory federal income tax rate |
|
35.0 |
% |
|
35.0 |
% |
|
35.0 |
% |
| Ireland, Sweden, and UK tax rate benefit |
|
(14.4 |
) |
|
(17.2 |
) |
|
(22.7 |
) |
| State income tax, net of federal income tax benefit |
|
(0.3 |
) |
|
(0.7 |
) |
|
(0.3 |
) |
| Change in valuation allowance |
|
(0.4 |
) |
|
0.6 |
|
|
0.7 |
|
| Net decrease in tax reserves |
|
(0.5 |
) |
|
(0.3 |
) |
|
(7.9 |
) |
| Other |
|
(1.0 |
) |
|
(3.3 |
) |
|
0.9 |
|
| Effective tax rate |
|
18.4 |
% |
|
14.1 |
% |
|
5.7 |
% |
Tax exemptions relating to our operations in
Ireland are effective through 2010. Currently, our Ireland manufacturing operations are subject to a statutory tax rate of 10 percent. After 2010, the Ireland operations will be subject to a statutory tax rate of 12.5 percent.
We are a worldwide business and are subject to tax audits on a regular basis. Significant judgment is required in determining our worldwide provision for income taxes.
We periodically assess our income tax positions and record tax benefits for all years subject to examination based upon our evaluation of the facts, circumstances and information available at the reporting date. For those tax positions with a
greater than 50 percent likelihood of being realized upon ultimate settlement with a taxing authority that has full knowledge of all relevant information, we record a tax benefit. For income tax positions with a 50 percent or less likelihood of
being sustained, no tax benefit is recognized in the financial statements.
|
|
|
| MILLIPORE FORM 10-K 2009 |
|
89 |
NOTES TO CONSOLIDATED FINANCIAL STATEMENTS—(Continued)
(In thousands, except per share data)
A reconciliation of the beginning and ending amount of unrecognized tax benefits is as follows:
|
|
|
|
|
|
|
|
|
|
|
|
|
| |
|
Year ended December 31, |
|
| |
|
2009 |
|
|
2008 |
|
|
2007 |
|
| Balance at the beginning of year |
|
$ |
24,358 |
|
|
$ |
20,200 |
|
|
$ |
29,200 |
|
| Additions based on tax positions related to current year |
|
|
4,528 |
|
|
|
6,858 |
|
|
|
5,200 |
|
| Settlements |
|
|
– |
|
|
|
(1,080 |
) |
|
|
(600 |
) |
| Lapse of statute of limitations |
|
|
(2,780 |
) |
|
|
(1,620 |
) |
|
|
(13,600 |
) |
| Balance at the end of year |
|
$ |
26,106 |
|
|
$ |
24,358 |
|
|
$ |
20,200 |
|
At December 31, 2009 and 2008, we had approximately
$843 and $400, respectively, in accrued interest related to uncertain tax positions.
We file income tax returns in the United States and multiple
foreign jurisdictions. In the normal course of business, we are subject to examination by taxing authorities throughout the world, including such major jurisdictions as France, Ireland, Japan, Sweden, the United Kingdom, and the United States. In
2009, the French tax authority commenced its examination of years 2006, 2007, and 2008. The major taxing jurisdictions in which we operate and the tax years that remain subject to examination are as follows:
|
|
|
| France |
|
2006 – 2009 |
| Ireland |
|
2002 – 2009 |
| Japan |
|
2009 |
| Sweden |
|
1999 – 2009 |
| United Kingdom |
|
2007 – 2009 |
| United States |
|
2006 – 2009 |
In 2009, 2008, and 2007, we recorded $2,780,
$1,620, and $13,600, respectively, of previously unrecognized tax benefits as a result of completion of tax examinations and statute of limitations closures. Of these amounts, $2,780, $1,620, and $11,900, respectively, were recorded as a reduction
to our 2009, 2008, and 2007 provision for income taxes. The remaining $1,700 in 2007 was recorded as a reduction to goodwill related to our past acquisitions. At December 31, 2009, we had $26,106 of unrecognized tax benefits, which will affect
our effective tax rate when they are recognized. Over the next twelve months, we may need to record up to approximately $3,300 of previously unrecognized tax benefits in the event of favorable resolution of tax audits and statute of limitations
closures.
12. STOCK PLANS AND STOCK-BASED COMPENSATION
Stock Incentive Plan
In 2008, our shareholders approved the Millipore Corporation 2008 Stock
Incentive Plan (the “2008 Plan”) that governs equity awards to both employees and non-employee directors. The 2008 Plan replaced and superseded the 1999 Plan. The 2008 Plan increased the total common stock shares available for grant by
4,000 to 8,404 shares. As of December 31, 2009, there were 3,834 shares available for future grants under our plans.
The types of awards permitted
under the 2008 Plan include stock options, restricted stock, stock appreciation rights and stock units (including restricted stock units). The exercise price of the stock options may not be less than the fair market value of our common stock at the
date of grant. Stock options generally vest ratably over a four-year period, although in some cases all at once at the end of the period, and expire no later than ten years from the date of grant.
|
|
|
| 90 |
|
MILLIPORE FORM 10-K 2009
|
NOTES TO CONSOLIDATED FINANCIAL STATEMENTS—(Continued)
(In thousands, except per share data)
Restricted stock awards represent shares of common stock issued to employees subject to forfeiture if the vesting conditions are not satisfied. Restricted stock units represent the right to
receive shares of common stock upon meeting specified vesting requirements. The vesting conditions for our restricted stock awards and restricted stock units are determined by the Board of Directors at the time of grant and may be based on the
satisfaction of performance conditions and/or the passage of time. Restricted stock and restricted stock units, which are awarded at no cost to employees, cannot be sold, assigned, transferred or pledged during the restriction period. During the
restriction period, restricted stock unit holders have no dividend or voting rights. Restricted stock generally vests ratably over a two to five year period, although in some cases all at once at the end of the period. In most instances, shares are
subject to forfeiture should employment terminate during the restriction period.
A summary of stock option activities is as follows:
|
|
|
|
|
|
|
|
|
| |
|
Shares
(in thousands) |
|
|
Weighted Average
Exercise Price |
|
Weighted
Average
Remaining
Contractual
Life (in
years) |
| Outstanding at December 31, 2008 |
|
2,515 |
|
|
$ |
55.66 |
|
|
| Granted |
|
476 |
|
|
$ |
59.26 |
|
|
| Exercised |
|
(294 |
) |
|
$ |
44.73 |
|
|
| Canceled or expired |
|
(56 |
) |
|
$ |
68.32 |
|
|
| Outstanding at December 31, 2009 |
|
2,641 |
|
|
$ |
57.26 |
|
5.8 |
|
|
|
|
| Exercisable at December 31, 2008 |
|
1,725 |
|
|
$ |
49.81 |
|
|
| Exercisable at December 31, 2009 |
|
1,676 |
|
|
$ |
52.99 |
|
4.4 |
| Vested and expected to vest at December 31, 2009 |
|
2,580 |
|
|
$ |
57.14 |
|
5.8 |
The following table summarizes information about stock
options at December 31, 2009:
|
|
|
|
|
|
|
|
|
|
|
|
|
| |
|
Options Outstanding |
|
Options Exercisable |
| Range of Exercise Price |
|
Outstanding |
|
Weighted Average
Remaining
Contractual
Life (in
years) |
|
Weighted
Average
Exercise
Price |
|
Exercisable |
|
Weighted
Average Exercise
Price |
| $31.94–$48.72 |
|
557 |
|
3.7 |
|
$ |
42.06 |
|
557 |
|
$ |
42.06 |
| $49.78–$53.90 |
|
689 |
|
3.5 |
|
$ |
52.17 |
|
689 |
|
$ |
52.17 |
| $54.66–$66.40 |
|
555 |
|
8.5 |
|
$ |
59.39 |
|
86 |
|
$ |
60.61 |
| $66.79–$68.48 |
|
529 |
|
7.5 |
|
$ |
67.70 |
|
199 |
|
$ |
67.39 |
| $68.50–$76.76 |
|
311 |
|
7.3 |
|
$ |
74.14 |
|
145 |
|
$ |
74.48 |
| $31.94–$76.76 |
|
2,641 |
|
5.8 |
|
$ |
57.26 |
|
1,676 |
|
$ |
52.99 |
Intrinsic value for stock options is defined as the
difference between the current market value of our common stock and the exercise price of the option. At December 31, 2009, the total aggregate intrinsic value for options currently exercisable and options outstanding was $32,788 and $40,509,
respectively. These values represent the total pre-tax intrinsic value based on our closing common stock price of $72.35 as of December 31, 2009. This intrinsic value represents the value that would have been received by the option holders had
option holders exercised all of their options as of that date. The total intrinsic value of options exercised in 2009, 2008, and 2007 was $6,418, $8,483, and $42,290, respectively.
|
|
|
| MILLIPORE FORM 10-K 2009 |
|
91 |
NOTES TO CONSOLIDATED FINANCIAL STATEMENTS—(Continued)
(In thousands, except per share data)
The following table summarizes the status of unvested restricted stock awards and restricted stock units.
|
|
|
|
|
|
|
| |
|
Shares |
|
|
Weighted Average
Grant-date Fair
Value |
| Unvested at December 31, 2008 |
|
714 |
|
|
$ |
69.80 |
| Granted |
|
439 |
(a) |
|
$ |
61.05 |
| Vested |
|
(201 |
) |
|
$ |
69.14 |
| Forfeited |
|
(35 |
) |
|
$ |
66.93 |
| Unvested at December 31, 2009 |
|
917 |
|
|
$ |
65.89 |
| Outstanding and expected to vest at December 31, 2009 |
|
848 |
|
|
$ |
65.89 |
| (a) |
Of the 439 shares granted, 112 shares were performance-based restricted stock units.
|
The number of performance-based restricted stock units that will ultimately vest, if any, is determined based on company performance
against predetermined target financial metrics over a three-year period. The fair value of these performance-based restricted stock units is determined based on the quoted market price of our common stock at the date of grant. Stock-based
compensation expense is recognized on a straight-line basis over the three-year performance period, net of estimated forfeitures. Stock-based compensation each period is determined based on the number of shares that are expected to vest, which takes
into consideration the probability of achieving the predetermined target financial metrics. Cumulative adjustments would be recorded to reflect changes in the number of shares expected to vest. At December 31, 2009, no performance-based
restricted stock units have been earned.
The weighted average grant-date fair value of restricted stock units awarded in 2009, 2008, and 2007 was
$61.05, $68.04, and $74.17 per unit, respectively. The total fair value of shares of restricted stock and restricted stock units vested in 2009, 2008, and 2007 was $11,742, $8,830, and $3,865, respectively.
Stock-based Compensation Expense
The following table
presents stock-based compensation expense included in our consolidated statements of operations:
|
|
|
|
|
|
|
|
|
|
|
|
|
| |
|
Year Ended December 31, |
|
| |
|
2009 |
|
|
2008 |
|
|
2007 |
|
| Stock-based compensation expense in: |
|
|
|
|
|
|
|
|
|
|
|
|
| Cost of revenues |
|
$ |
3,495 |
|
|
$ |
3,070 |
|
|
$ |
2,432 |
|
| Selling, general and administrative expenses |
|
|
20,368 |
|
|
|
17,264 |
|
|
|
11,798 |
|
| Research and development expenses |
|
|
2,968 |
|
|
|
2,679 |
|
|
|
1,730 |
|
| Income before income taxes |
|
|
26,831 |
|
|
|
23,013 |
|
|
|
15,960 |
|
| Provision for income taxes |
|
|
(9,206 |
) |
|
|
(7,988 |
) |
|
|
(5,025 |
) |
| Net income |
|
$ |
17,625 |
|
|
$ |
15,025 |
|
|
$ |
10,935 |
|
The weighted average grant-date fair value of options
granted in 2009, 2008, and 2007 was $15.24, $18.04, and $25.93 per option, respectively. The fair value of our option grants was estimated using the Black-Scholes option-pricing model with the following weighted average assumptions:
|
|
|
|
|
|
|
|
|
|
| |
|
Year ended December 31, |
|
| |
|
2009 |
|
|
2008 |
|
|
2007 |
|
| Risk-free interest rate |
|
1.8 |
% |
|
2.8 |
% |
|
4.7 |
% |
| Volatility factor |
|
26.2 |
% |
|
25.0 |
% |
|
29.5 |
% |
| Weighted average expected life (in years) |
|
5 |
|
|
5 |
|
|
5 |
|
| Dividend rate |
|
0.0 |
% |
|
0.0 |
% |
|
0.0 |
% |
|
|
|
| 92 |
|
MILLIPORE FORM 10-K 2009
|
NOTES TO CONSOLIDATED FINANCIAL STATEMENTS—(Continued)
(In thousands, except per share data)
We did not capitalize any stock-based compensation related costs because such capitalizable costs were not material in 2009, 2008, and 2007. Unrecognized stock-based
compensation expense was $44,498 at December 31, 2009 and is expected to be recognized over an estimated weighted average amortization period of 2.1 years.
Non-Employee Director Deferred Compensation Agreements
Through 2001, deferred compensation agreements for non-employee
directors allowed for the deferral of directors’ fees by converting them to deferred compensation phantom stock units based on 100 percent of the fair market value of our common stock on periodic conversion dates. In June 2002, such conversion
to phantom stock units was discontinued. Upon retirement or earlier termination of service from the Board of Directors, the cash equivalent of the phantom stock units will be distributed in annual installments over ten years. We record a
compensation adjustment related to the change in the fair market value of stock at the grant date as compared to the current fair market value of the stock. We recorded compensation expense (benefit) related to the change in fair value of phantom
stock units of $657, $(620), and $260 in 2009, 2008, and 2007, respectively.
13. EMPLOYEE BENEFIT PLANS
We sponsor numerous domestic and foreign employee retirement and benefit plans. The following is a discussion of our significant plans.
U.S. Employee Savings Plans. The Millipore Corporation
Employees’ Participation and Savings Plan (as amended) (the “Participation and Savings Plan”) is maintained for the benefit of all U.S. employees, and prior to January 1, 2007, was comprised of both a defined contribution plan
(the “Participation Plan”) and an employee §401(K) savings plan (the “Savings Plan”). The Participation Plan consisted of company discretionary contributions allocated among eligible U.S. employees on the basis of the
compensation they received during the year for which the contribution was made. Prior to January 1, 2007, the Savings Plan allowed employees to make certain tax-deferred voluntary contributions after completion of the applicable waiting period,
on which we made a 25 percent matching contribution after one year of service or a 50 percent matching contribution after ten years of service for up to 6 percent of the employees’ eligible compensation. In October 2006, our Board of Directors
approved amendments to the Participation and Savings Plan, effective January 1, 2007, to discontinue annual employer contributions to eligible employees’ Participation Plan accounts; to allow eligible employees to begin to participate in
the Savings Plan without any waiting period; and to increase our 401(k) matching contribution rates, dollar for dollar, up to the first 6 percent of compensation deferred by the employee each pay period. Total expense under the Participation and
Savings Plan was $9,895, $9,581, and $9,460 in 2009, 2008, and 2007, respectively.
We also offer a Supplemental Savings and Retirement Plan for Key
Salaried Employees (as amended) (the “Supplemental Plan”) to certain senior executives. This unfunded plan allows certain salary deferral benefits that would otherwise be lost by reason of restrictions imposed by the Internal Revenue Code
that limits the amount of compensation that may be deferred under tax-qualified plans. Amounts deferred are converted into phantom shares of mutual funds selected by the employees and are valued at the closing market prices of those mutual funds.
During periods when the market values of the investments increase or decrease, our obligations increase or decrease and we recognize compensation expense or income, respectively. Total expense/(income) recorded under the Supplemental Plan was
$1,986, $(718), and $223 in 2009, 2008, and 2007, respectively.
|
|
|
| MILLIPORE FORM 10-K 2009 |
|
93 |
NOTES TO CONSOLIDATED FINANCIAL STATEMENTS—(Continued)
(In thousands, except per share data)
The Millipore Corporation 2000 Deferred Compensation Plan for Senior Management (as amended) (the “Deferred Compensation Plan”) provides that certain senior
executives may elect to defer a portion of their salary and bonus payments until retirement, termination of employment, or the passage of a period of time (not less than three years). The amounts deferred are invested in certain publicly traded
mutual funds. Plan participants are fully vested in their respective account balances at all times. We recognize compensation expense related to our obligations to pay the employee’s deferred compensation in the year such compensation is
earned. In subsequent periods, we recognize increases or decreases to compensation expense based on the performance of the underlying investments in the Deferred Compensation Plan. This is offset by corresponding gains and losses in the underlying
asset balances, which results in no net impact to the consolidated statements of operations.
U.S. Pension Plans. Our Retirement Plan for Employees of Millipore Corporation (as amended) (the “U.S. Retirement Plan”) is a frozen defined benefit offset pension plan for
all eligible U.S. employees. The U.S. Retirement Plan provided benefits to the extent that assets of the Participation Plan, described above, did not provide guaranteed retirement income levels set forth under the terms of the U.S. Retirement Plan.
Guaranteed retirement income levels are determined based on years of service and salary level as integrated with Social Security benefits. Prior to January 1, 2007, employees became eligible under the U.S. Retirement Plan after one year of
continuous service and vested after five years of service. Effective December 31, 2006, the benefits under the U.S. Retirement Plan were frozen.
We
intend to terminate our U.S. Retirement Plan when it is cost effective to do so. Upon settlement of the pension liabilities at the time of plan termination, we expect to recognize settlement losses in our consolidated statement of operations and
report cash payments as cash outflows from operating activities in our consolidated statement of cash flows, which may be significant. We can not reasonably estimate the size of such losses and cash outflows because such amounts will be determined
using market interest rates and funded status of the U.S. Retirement Plan at the time of actual plan termination.
U.S. Postretirement Benefit Plans. We sponsor unfunded postretirement benefit plans covering all U.S. employees. The plans provide medical and life insurance benefits and are,
depending on the plan, either contributory or non-contributory. The accounting for the postretirement benefit plans anticipates future cost-sharing changes that are at our discretion. The postretirement benefit plans include a limitation on our
share of costs for recent and future retirees.
In August 2008, we made a number of amendments to our U.S. postretirement benefit plans effective
January 1, 2009. These amendments included the elimination of dental and life insurance benefits, medical benefit cost sharing changes for pre-65 retirees, and the elimination of medical coverage for employees who retire after December 31,
2010. We recorded a curtailment gain of $2,733 in the statement of operations in the 2008 third quarter as a result of these amendments.
Foreign Pension Plans. Various foreign subsidiaries sponsor defined benefit retirement plans. We recognize the periodic pension expense in the
statements of operations and the associated assets or liabilities in the balance sheets of these foreign subsidiaries.
The following tables summarize
the funded status of the U.S. Retirement Plan, U.S. postretirement benefit plans, and significant foreign employee pension plans and amounts reflected in our consolidated balance sheets. As of December 31, 2009, we used a December 31
measurement date for all of our retirement and postretirement benefit plans.
|
|
|
| 94 |
|
MILLIPORE FORM 10-K 2009
|
NOTES TO CONSOLIDATED FINANCIAL STATEMENTS—(Continued)
(In thousands, except per share data)
Obligations and Funded Status
|
|
|
|
|
|
|
|
|
|
|
|
|
|
|
|
|
|
|
|
|
|
|
|
|
| |
|
U.S. Pension Benefits |
|
|
U.S Postretirement Benefits |
|
|
Foreign Pension Benefits |
|
| |
|
December 31, |
|
|
December 31, |
|
|
December 31, |
|
| |
|
2009 |
|
|
2008 |
|
|
2009 |
|
|
2008 |
|
|
2009 |
|
|
2008 |
|
| Change in benefit obligations: |
|
|
|
|
|
|
|
|
|
|
|
|
|
|
|
|
|
|
|
|
|
|
|
|
| Benefit obligations at beginning of year |
|
$ |
75,010 |
|
|
$ |
65,666 |
|
|
$ |
3,126 |
|
|
$ |
8,653 |
|
|
$ |
37,666 |
|
|
$ |
40,727 |
|
| Service cost |
|
|
155 |
|
|
|
50 |
|
|
|
5 |
|
|
|
388 |
|
|
|
2,717 |
|
|
|
2,938 |
|
| Interest cost |
|
|
4,435 |
|
|
|
4,329 |
|
|
|
158 |
|
|
|
380 |
|
|
|
1,844 |
|
|
|
1,923 |
|
| Participants’ contributions |
|
|
– |
|
|
|
– |
|
|
|
148 |
|
|
|
280 |
|
|
|
– |
|
|
|
– |
|
| Foreign exchange effect |
|
|
– |
|
|
|
– |
|
|
|
– |
|
|
|
– |
|
|
|
1,123 |
|
|
|
(1,635 |
) |
| Actuarial loss/(gain) |
|
|
3,140 |
|
|
|
7,683 |
|
|
|
(110 |
) |
|
|
(182 |
) |
|
|
96 |
|
|
|
(4,097 |
) |
| Benefits paid |
|
|
(3,005 |
) |
|
|
(2,718 |
) |
|
|
(638 |
) |
|
|
(708 |
) |
|
|
(472 |
) |
|
|
(1,099 |
) |
| Plan changes |
|
|
– |
|
|
|
– |
|
|
|
298 |
|
|
|
(5,685 |
) |
|
|
– |
|
|
|
(1,091 |
) |
| Benefit obligations at end of year |
|
|
79,735 |
|
|
|
75,010 |
|
|
|
2,987 |
|
|
|
3,126 |
|
|
|
42,974 |
|
|
|
37,666 |
|
| Change in plan assets: |
|
|
|
|
|
|
|
|
|
|
|
|
|
|
|
|
|
|
|
|
|
|
|
|
| Fair value of plan assets at beginning of year |
|
|
45,579 |
|
|
|
46,289 |
|
|
|
– |
|
|
|
– |
|
|
|
19,059 |
|
|
|
24,657 |
|
| Actual return on plan assets |
|
|
11,638 |
|
|
|
(11,726 |
) |
|
|
– |
|
|
|
– |
|
|
|
2,870 |
|
|
|
(3,412 |
) |
| Company contributions |
|
|
17,240 |
|
|
|
13,734 |
|
|
|
490 |
|
|
|
428 |
|
|
|
1,632 |
|
|
|
1,924 |
|
| Participants’ contributions |
|
|
– |
|
|
|
– |
|
|
|
148 |
|
|
|
280 |
|
|
|
– |
|
|
|
– |
|
| Foreign exchange effect |
|
|
– |
|
|
|
– |
|
|
|
– |
|
|
|
– |
|
|
|
1,164 |
|
|
|
(3,011 |
) |
| Benefits paid |
|
|
(3,005 |
) |
|
|
(2,718 |
) |
|
|
(638 |
) |
|
|
(708 |
) |
|
|
(472 |
) |
|
|
(1,099 |
) |
| Fair value of plan assets at end of year |
|
|
71,452 |
|
|
|
45,579 |
|
|
|
– |
|
|
|
– |
|
|
|
24,253 |
|
|
|
19,059 |
|
| Funded status at end of year |
|
$ |
(8,283 |
) |
|
$ |
(29,431 |
) |
|
$ |
(2,987 |
) |
|
$ |
(3,126 |
) |
|
$ |
(18,721 |
) |
|
$ |
(18,607 |
) |
Amounts recognized in the statement of financial position
consisted of:
|
|
|
|
|
|
|
|
|
|
|
|
|
|
|
|
|
|
|
|
|
|
|
|
|
| |
|
U.S. Pension Benefits |
|
|
U.S Postretirement Benefits |
|
|
Foreign Pension Benefits |
|
| |
|
December 31, |
|
|
December 31, |
|
|
December 31, |
|
| |
|
2009 |
|
|
2008 |
|
|
2009 |
|
|
2008 |
|
|
2009 |
|
|
2008 |
|
| Non-current assets |
|
$ |
– |
|
|
$ |
– |
|
|
$ |
– |
|
|
$ |
– |
|
|
$ |
2,379 |
|
|
$ |
2,060 |
|
| Current liabilities |
|
|
– |
|
|
|
– |
|
|
|
(441 |
) |
|
|
(412 |
) |
|
|
(257 |
) |
|
|
(177 |
) |
| Non-current liabilities |
|
|
(8,283 |
) |
|
|
(29,431 |
) |
|
|
(2,546 |
) |
|
|
(2,714 |
) |
|
|
(20,843 |
) |
|
|
(20,490 |
) |
| Net |
|
$ |
(8,283 |
) |
|
$ |
(29,431 |
) |
|
$ |
(2,987 |
) |
|
$ |
(3,126 |
) |
|
$ |
(18,721 |
) |
|
$ |
(18,607 |
) |
Amounts recognized in accumulated other comprehensive income
consisted of:
|
|
|
|
|
|
|
|
|
|
|
|
|
|
|
|
|
|
|
|
|
|
|
| |
|
U.S. Pension Benefits |
|
U.S. Postretirement Benefits |
|
|
Foreign Pension Benefits |
|
| |
|
December 31, |
|
December 31, |
|
|
December 31, |
|
| |
|
2009 |
|
2008 |
|
2009 |
|
|
2008 |
|
|
2009 |
|
|
2008 |
|
| Net loss/(gain) |
|
$ |
32,801 |
|
$ |
38,687 |
|
$ |
(2,243 |
) |
|
$ |
(2,277 |
) |
|
$ |
955 |
|
|
$ |
2,698 |
|
| Prior service benefit |
|
|
– |
|
|
– |
|
|
(4,739 |
) |
|
|
(5,494 |
) |
|
|
(948 |
) |
|
|
(1,121 |
) |
| Total |
|
$ |
32,801 |
|
$ |
38,687 |
|
$ |
(6,982 |
) |
|
$ |
(7,771 |
) |
|
$ |
7 |
|
|
$ |
1,577 |
|
The projected benefit obligations are equal to the
accumulated benefit obligations under the U.S. Retirement Plan because the plan was frozen effective December 31, 2006 and no additional benefits will accrue.
|
|
|
| MILLIPORE FORM 10-K 2009 |
|
95 |
NOTES TO CONSOLIDATED FINANCIAL STATEMENTS—(Continued)
(In thousands, except per share data)
The accumulated benefit obligations for foreign retirement plans were $36,496 and $30,432 at December 31, 2009 and 2008, respectively. Information for certain
foreign retirement plans with an accumulated benefit obligation in excess of plan assets is as follows:
|
|
|
|
|
|
|
| |
|
Foreign Pension Benefits |
| |
|
December 31, |
| |
|
2009 |
|
2008 |
| Projected benefit obligations |
|
$ |
25,481 |
|
$ |
22,586 |
| Accumulated benefit obligations |
|
$ |
20,594 |
|
$ |
18,297 |
| Fair value of plan assets |
|
$ |
4,379 |
|
$ |
4,270 |
Components of net periodic benefit cost and other amounts
recognized in other comprehensive income consisted of:
|
|
|
|
|
|
|
|
|
|
|
|
|
|
|
|
|
|
|
|
|
|
|
|
|
|
|
|
|
|
|
|
|
|
|
|
|
| |
|
U.S. Pension Benefits |
|
|
U.S. Postretirement Benefits |
|
|
Foreign Pension Benefits |
|
| |
|
Year ended December 31, |
|
|
Year ended December 31, |
|
|
Year ended December 31, |
|
| |
|
2009 |
|
|
2008 |
|
|
2007 |
|
|
2009 |
|
|
2008 |
|
|
2007 |
|
|
2009 |
|
|
2008 |
|
|
2007 |
|
| Net Periodic Benefit Cost: |
|
|
|
|
|
|
|
|
|
|
|
|
|
|
|
|
|
|
|
|
|
|
|
|
|
|
|
|
|
|
|
|
|
|
|
|
| Service cost |
|
$ |
155 |
|
|
$ |
50 |
|
|
$ |
50 |
|
|
$ |
5 |
|
|
$ |
388 |
|
|
$ |
604 |
|
|
$ |
2,717 |
|
|
$ |
2,748 |
|
|
$ |
2,805 |
|
| Interest cost |
|
|
4,435 |
|
|
|
4,329 |
|
|
|
2,336 |
|
|
|
158 |
|
|
|
380 |
|
|
|
602 |
|
|
|
1,844 |
|
|
|
1,882 |
|
|
|
1,699 |
|
| Expected return on plan assets |
|
|
(3,684 |
) |
|
|
(3,991 |
) |
|
|
(2,017 |
) |
|
|
– |
|
|
|
– |
|
|
|
– |
|
|
|
(1,232 |
) |
|
|
(1,680 |
) |
|
|
(1,435 |
) |
| Amortization of loss/(gain) |
|
|
1,072 |
|
|
|
1,060 |
|
|
|
689 |
|
|
|
(144 |
) |
|
|
(129 |
) |
|
|
(77 |
) |
|
|
94 |
|
|
|
12 |
|
|
|
153 |
|
| Amortization of prior service benefit |
|
|
– |
|
|
|
– |
|
|
|
– |
|
|
|
(457 |
) |
|
|
(305 |
) |
|
|
– |
|
|
|
(149 |
) |
|
|
(111 |
) |
|
|
– |
|
| Curtailments |
|
|
– |
|
|
|
– |
|
|
|
– |
|
|
|
– |
|
|
|
(2,733 |
) |
|
|
– |
|
|
|
– |
|
|
|
– |
|
|
|
– |
|
| Other |
|
|
– |
|
|
|
– |
|
|
|
– |
|
|
|
– |
|
|
|
– |
|
|
|
– |
|
|
|
– |
|
|
|
– |
|
|
|
36 |
|
| Net periodic benefit cost/(income) |
|
|
1,978 |
|
|
|
1,448 |
|
|
|
1,058 |
|
|
|
(438 |
) |
|
|
(2,399 |
) |
|
|
1,129 |
|
|
|
3,274 |
|
|
|
2,851 |
|
|
|
3,258 |
|
| Other Changes in Plan Assets and Benefit Obligations Recognized in OCI: |
|
|
|
|
|
|
|
|
|
|
|
|
|
|
|
|
|
|
|
|
|
|
|
|
|
|
|
|
|
|
|
|
|
|
|
|
| Net (gain)/loss |
|
|
(4,814 |
) |
|
|
23,400 |
|
|
|
2,498 |
|
|
|
(110 |
) |
|
|
(182 |
) |
|
|
523 |
|
|
|
(1,542 |
) |
|
|
1,001 |
|
|
|
(4,521 |
) |
| Prior service cost/(benefit) |
|
|
– |
|
|
|
– |
|
|
|
– |
|
|
|
298 |
|
|
|
(5,685 |
) |
|
|
(2,848 |
) |
|
|
– |
|
|
|
(1,091 |
) |
|
|
– |
|
| Amortization of net (loss)/gain |
|
|
(1,072 |
) |
|
|
(1,060 |
) |
|
|
(689 |
) |
|
|
144 |
|
|
|
129 |
|
|
|
77 |
|
|
|
(94 |
) |
|
|
(12 |
) |
|
|
(153 |
) |
| Amortization of prior service benefit |
|
|
– |
|
|
|
– |
|
|
|
– |
|
|
|
457 |
|
|
|
305 |
|
|
|
– |
|
|
|
149 |
|
|
|
111 |
|
|
|
– |
|
| Curtailments |
|
|
– |
|
|
|
– |
|
|
|
– |
|
|
|
– |
|
|
|
2,733 |
|
|
|
– |
|
|
|
– |
|
|
|
– |
|
|
|
– |
|
| Other |
|
|
– |
|
|
|
– |
|
|
|
– |
|
|
|
– |
|
|
|
– |
|
|
|
– |
|
|
|
(83 |
) |
|
|
253 |
|
|
|
323 |
|
| Total recognized in other comprehensive income |
|
|
(5,886 |
) |
|
|
22,340 |
|
|
|
1,809 |
|
|
|
789 |
|
|
|
(2,700 |
) |
|
|
(2,248 |
) |
|
|
(1,570 |
) |
|
|
262 |
|
|
|
(4,351 |
) |
| Total recognized in net periodic benefit cost and OCI |
|
$ |
(3,908 |
) |
|
$ |
23,788 |
|
|
$ |
2,867 |
|
|
$ |
351 |
|
|
$ |
(5,099 |
) |
|
$ |
(1,119 |
) |
|
$ |
1,704 |
|
|
$ |
3,113 |
|
|
$ |
(1,093 |
) |
The estimated net loss for the U.S. Retirement Plan that will
be amortized from accumulated other comprehensive income into net periodic benefit cost in 2010 is $859. The estimated net gain and prior service benefit for the U.S. postretirement benefit plans that will be amortized from accumulated other
comprehensive income into net periodic benefit income in 2010 is $(430) and $(121), respectively. The estimated net loss and prior service benefit for the foreign pension plans that will be amortized from accumulated other comprehensive income into
net periodic benefit cost in 2010 is $28 and $(149), respectively.
|
|
|
| 96 |
|
MILLIPORE FORM 10-K 2009
|
NOTES TO CONSOLIDATED FINANCIAL STATEMENTS—(Continued)
(In thousands, except per share data)
Assumptions
Weighted-average assumptions used to
determine benefit obligations are as follows:
|
|
|
|
|
|
|
|
|
|
|
|
|
|
|
|
|
|
|
| |
|
U.S. Pension Benefits |
|
|
U.S. Postretirement Benefits |
|
|
Foreign Pension Benefits |
|
| |
|
December 31, |
|
|
December 31, |
|
|
December 31, |
|
| |
|
2009 |
|
|
2008 |
|
|
2009 |
|
|
2008 |
|
|
2009 |
|
|
2008 |
|
| Discount rate |
|
5.75 |
% |
|
6.00 |
% |
|
5.25 |
% |
|
6.25 |
% |
|
4.94 |
% |
|
4.91 |
% |
| Rate of compensation increase |
|
N/A |
|
|
N/A |
|
|
N/A |
|
|
N/A |
|
|
3.51 |
% |
|
3.51 |
% |
Weighted-average assumptions used to determine net
periodic benefit cost are as follows:
|
|
|
|
|
|
|
|
|
|
|
|
|
|
|
|
|
|
|
|
|
|
|
|
|
|
|
| |
|
U.S. Pension Benefits |
|
|
U.S. Postretirement Benefits |
|
|
Foreign Pension Benefits |
|
| |
|
Year ended December 31, |
|
|
Year ended December 31, |
|
|
Year ended December 31, |
|
| |
|
2009 |
|
|
2008 |
|
|
2007 |
|
|
2009 |
|
|
2008 |
|
2007 |
|
|
2009 |
|
|
2008 |
|
|
2007 |
|
| Discount rate |
|
6.00 |
% |
|
6.50 |
% |
|
5.75 |
% |
|
6.25 |
% |
|
6.25% / 6.75% |
|
5.75 |
% |
|
4.91 |
% |
|
4.74 |
% |
|
4.16 |
% |
| Expected return on plan assets |
|
7.50 |
% |
|
8.00 |
% |
|
8.00 |
% |
|
N/A |
|
|
N/A |
|
N/A |
|
|
6.37 |
% |
|
6.95 |
% |
|
6.41 |
% |
| Rate of compensation increase |
|
N/A |
|
|
N/A |
|
|
N/A |
|
|
N/A |
|
|
N/A |
|
N/A |
|
|
3.51 |
% |
|
3.00 |
% |
|
3.01 |
% |
Net periodic benefit cost for the U.S.
postretirement benefit plans for 2008 was calculated utilizing a discount rate of 6.25 percent for 7 months and 6.75 percent for 5 months because the amendments to the plans in August 2008 triggered a new measurement date.
In selecting the expected return on plan assets, we considered the average rate of earnings expected on the funds invested or to be invested to provide for the
benefits when they become due. This included consideration of the asset allocations and the expected returns likely to be earned on these assets over the life of these plans. Our method is consistent with last year.
The discount rates reflect the rates at which amounts that are invested in a portfolio of high-quality debt instruments would provide the future cash flows necessary
to pay benefits when they become due.
The rate of compensation increase reflected the expected annual salary increases for the plan participants. Since
the U.S. Retirement Plan was frozen at December 31, 2006, our benefit obligations will not be affected by further compensation increases. The rate for our foreign retirement plans was estimated based on historical experience and our current
employee compensation strategy.
Plan assets
Plan assets are invested using a total return investment approach whereby a mix of equity securities, debt securities, and other investments are used to preserve asset values, diversify risk, and achieve our target investment return
benchmark. Investment strategies and asset allocations are based on careful consideration of plan liabilities and the plans’ funded status. Investment performance and asset allocation are measured and monitored on an ongoing
basis.
Plan assets for our U.S. Retirement Plan are managed in a balanced portfolio with two major components: an equity portion and a fixed income
portion. Plan assets for our foreign retirement plans are managed in a balanced portfolio with three major components: an equity portion, a fixed income portion, and other investment portion. The current asset allocation target for our U.S.
Retirement Plan is 65 percent equity securities and 35 percent fixed income securities.
|
|
|
| MILLIPORE FORM 10-K 2009 |
|
97 |
NOTES TO CONSOLIDATED FINANCIAL STATEMENTS—(Continued)
(In thousands, except per share data)
The current weighted average asset allocation target for our foreign retirement plans is 65 percent equity securities, 12 percent fixed income securities, and 23 percent other investments.
U.S. and foreign plan equity investments and foreign plan other investments are expected to maximize the long-term real growth of the Plan assets. Fixed
income investments are expected to generate current income, provide for more stable periodic returns, and provide some protection against a prolonged decline in the market value of equity investments. Cash and cash equivalents include cash,
interest bearing cash, and money market investments. Equity securities include U.S. and foreign equity mutual funds. Fixed income securities include U.S. and foreign long-duration and high-yield bond funds and emerging market debt funds. Other
investments include investments in foreign property funds and general funds at certain insurance companies.
Our valuation techniques are based on both
observable and unobservable inputs. Observable inputs reflect market data obtained from independent sources. Unobservable inputs reflect our market assumptions. These two types of inputs create the following fair value hierarchy:
| |
Level 1: |
Quoted prices for identical instruments in active markets. |
| |
Level 2: |
Quoted prices for similar instruments in active markets; quoted prices for identical or similar instruments in markets that are not active; and model-derived valuations whose
inputs are observable or whose significant value drivers are observable. |
| |
Level 3: |
Instruments whose significant value drivers are unobservable. |
The
fair values of our retirement plan assets at December 31, 2009 by asset category are as follows:
|
|
|
|
|
|
|
|
|
|
|
|
|
| |
|
December 31, 2009 |
| |
|
Balance |
|
Level 1 |
|
Level 2 |
|
Level 3 |
| U.S. Retirement Plan |
|
|
|
|
|
|
|
|
|
|
|
|
| Cash and cash equivalents |
|
$ |
888 |
|
$ |
888 |
|
$ |
– |
|
$ |
– |
| Equity securities |
|
$ |
45,987 |
|
$ |
45,987 |
|
$ |
– |
|
$ |
– |
| Fixed income securities |
|
$ |
24,577 |
|
$ |
24,577 |
|
$ |
– |
|
$ |
– |
| Fair value of plan assets at end of year |
|
$ |
71,452 |
|
$ |
71,452 |
|
$ |
– |
|
$ |
– |
|
|
|
|
|
| Foreign Pension Plans |
|
|
|
|
|
|
|
|
|
|
|
|
| Cash equivalents |
|
$ |
1,695 |
|
$ |
824 |
|
$ |
871 |
|
$ |
– |
| Equity securities |
|
$ |
5 |
|
$ |
5 |
|
$ |
– |
|
$ |
– |
| Unit Trusts |
|
$ |
19,582 |
|
$ |
– |
|
$ |
19,582 |
|
$ |
– |
| Other |
|
$ |
2,971 |
|
$ |
– |
|
$ |
2,971 |
|
$ |
– |
| Fair value of plan assets at end of year |
|
$ |
24,253 |
|
$ |
829 |
|
$ |
23,424 |
|
$ |
– |
Assumed healthcare cost trend rates
As a result of the amendments made to our U.S. postretirement benefit plans in August 2008, a
one-percentage point change in assumed healthcare cost trend rates would not have a significant impact on our service and interest costs or our postretirement benefit obligations.
|
|
|
| 98 |
|
MILLIPORE FORM 10-K 2009
|
NOTES TO CONSOLIDATED FINANCIAL STATEMENTS—(Continued)
(In thousands, except per share data)
Cash flows
In 2010, we do not expect to make a
contribution for our U.S. Retirement Plan. In 2010, we expect to contribute approximately $441 to our postretirement benefit plans and approximately $1,500 to our foreign retirement plans.
Estimated future benefit payments
The following
benefit payments, which reflect expected future service, as appropriate, are expected to be paid:
|
|
|
|
|
|
|
|
|
|
| |
|
U.S.
Pension
Benefits |
|
U.S.
Postretirement
Benefits |
|
Foreign
Pension Benefits |
| 2010 |
|
$ |
3,301 |
|
$ |
441 |
|
$ |
1,216 |
| 2011 |
|
$ |
3,562 |
|
$ |
380 |
|
$ |
1,117 |
| 2012 |
|
$ |
3,804 |
|
$ |
324 |
|
$ |
1,597 |
| 2013 |
|
$ |
4,091 |
|
$ |
266 |
|
$ |
1,532 |
| 2014 |
|
$ |
4,326 |
|
$ |
248 |
|
$ |
2,713 |
| 2015 – 2019 |
|
$ |
25,257 |
|
$ |
1,058 |
|
$ |
14,377 |
14. DERIVATIVE INSTRUMENTS
AND HEDGING
The purpose of our hedging activities is to mitigate the impact of volatility associated with foreign currency transactions and interest
rate exposures related to an anticipated debt refinancing. We do not hold derivative instruments for trading or speculative purposes.
Cash Flow Hedges
We utilize foreign currency forward exchange contracts to hedge anticipated intercompany sales transactions in certain
foreign currencies and designate these derivative instruments as cash flow hedges when appropriate. We enter into forward exchange contracts that match the currency, timing, and notional amounts of the underlying forecasted transactions. Therefore,
no ineffectiveness resulted, or was recorded, through the consolidated statement of operations in any of the periods presented. Our forward exchange contracts are primarily short term in nature with maximum contract durations of thirteen months. At
December 31, 2009 and 2008, these forward exchange contracts had aggregate U.S. dollar equivalent notional amounts of $174,018 and $136,468, respectively, and aggregate U.S. dollar equivalent fair values amounting to net losses of $1,554, and
$3,555, respectively. The net gain or loss from these cash flow hedges reported in accumulated other comprehensive income will be reclassified to earnings and recorded in revenues in our consolidated statement of operations when the related
inventory is sold to third-party customers. The amounts ultimately recognized will vary based on fluctuations of the hedged currencies through the contract maturity dates. At December 31, 2009, we had $341 net realized losses in other
comprehensive income which will be recognized as a reduction to revenues in the 2010 first quarter.
In August 2009, we entered into forward starting
interest rate swap agreements with an aggregate notional amount of $300 million. The purpose of these swaps is to hedge interest rate exposures related to an anticipated fixed-rate debt financing in December 2011 with a term of at least 10 years.
The net gain or loss from these cash flow hedges reported in accumulated other comprehensive income will be recognized in earnings as an adjustment to interest expense in our consolidated statement of operations in the same period when the hedged
interest payments are recorded in our statement of operations. At maturity, cash flows related to these interest rate swap agreements will be classified as cash flows from operating activities in our consolidated statement of cash flows.
|
|
|
| MILLIPORE FORM 10-K 2009 |
|
99 |
NOTES TO CONSOLIDATED FINANCIAL STATEMENTS—(Continued)
(In thousands, except per share data)
At December 31, 2009, the fair value of these interest rate swap agreements was a gain of $4,940, which was recognized in accumulated other comprehensive income.
Net Investment Hedge
We designated our 5.875 percent
senior notes, which are denominated in Euro, as a hedge of the foreign currency exposures of our net investment in a European subsidiary. Foreign exchange gains or losses on the hedge, which are caused by the remeasurement of the Euro debt to U.S.
dollars, are recorded in other comprehensive income as a component of cumulative translation adjustment. At December 31, 2009 and 2008, the cumulative net loss on these senior notes included in accumulated other comprehensive income was $44,181
and $35,870, respectively.
Embedded Derivatives
The contingent interest feature of the Convertible Notes represents an embedded derivative that requires separate recognition at fair value apart from the Convertible Notes. As a result, we are required to separate the value of this feature
from the Convertible Notes and record a liability on the consolidated balance sheet. At December 31, 2009 and 2008, the contingent interest feature had no value.
Other Derivatives
In addition to cash flow hedges and the net investment hedge, we also enter into
foreign currency forward exchange contracts to mitigate the impact of foreign exchange risk related to foreign currency denominated intercompany and external debt and foreign currency denominated receivable and payable balances. Both realized and
unrealized gains and losses resulting from changes in the fair value of these derivative instruments are recorded through current earnings as selling, general and administrative expenses because we do not designate these forward exchange contracts
as hedges.
The aggregate U.S. dollar equivalent notional amount of these forward exchange contracts was $209,129 and $303,516 at December 31, 2009
and 2008, respectively. The fair values of these forward exchange contracts were a $1,112 and a $4,367 net gain at December 31, 2009 and 2008, respectively. Cash paid or received upon settlement of these forward exchange contracts is included
in operating activities in the consolidated statements of cash flows.
In 2008, forward exchange contracts related to our intercompany and external debt
matured. We recorded realized losses of $32,332 in 2008 related to the maturity of these forward exchange contracts. These derivative losses offset foreign exchange gains on the underlying intercompany and external debt in the consolidated statement
of operations. Cash paid upon settlement of these forward exchange contracts are included in investing activities in the consolidated statement of cash flows.
|
|
|
| 100 |
|
MILLIPORE FORM 10-K 2009
|
NOTES TO CONSOLIDATED FINANCIAL STATEMENTS—(Continued)
(In thousands, except per share data)
Fair values of derivative instruments at December 31, 2009 are summarized in the following table:
|
|
|
|
|
|
|
|
|
|
|
| |
|
Asset Derivatives |
|
Liability Derivatives |
| |
|
Balance Sheet Location |
|
Fair value |
|
Balance Sheet
Location |
|
Fair Value |
| Cash flow hedges – foreign exchange contracts |
|
Other current
assets |
|
$ |
2,638 |
|
Accrued
expenses |
|
$ |
4,192 |
| Cash flow hedges – interest rate swap |
|
Other current
assets |
|
|
4,940 |
|
Accrued
expenses |
|
|
– |
| Foreign exchange contracts not designated as hedges |
|
Other current
assets |
|
|
2,136 |
|
Accrued
expenses |
|
|
1,024 |
| Total derivatives |
|
|
|
$ |
9,714 |
|
|
|
$ |
5,216 |
Amounts in the table above represent gross unrealized
gains and losses and do not reflect the actual recorded values because gains and losses offset in certain cases. Actual unrealized gains included in other current assets were $1,015 for foreign exchange contracts designated as cash flow hedges and
$1,619 for foreign exchange contracts not qualifying for hedge accounting. Actual unrealized losses included in accrued expenses were $2,569 for foreign exchange contracts designated as cash flow hedges and $507 for foreign exchange contracts not
qualifying for hedge accounting.
Fair values of derivative instruments at December 31, 2008 are summarized in the following table:
|
|
|
|
|
|
|
|
|
|
|
| |
|
Asset Derivatives |
|
Liability Derivatives |
| |
|
Balance Sheet Location |
|
Fair value |
|
Balance Sheet
Location |
|
Fair Value |
| Cash flow hedges – foreign exchange contracts |
|
Other current
assets |
|
$ |
4,744 |
|
Accrued
expenses |
|
$ |
8,299 |
| Foreign exchange contracts not designated as hedges |
|
Other current
assets |
|
|
7,807 |
|
Accrued
expenses |
|
|
3,440 |
| Total derivatives |
|
|
|
$ |
12,551 |
|
|
|
$ |
11,739 |
Amounts in the table above represent gross unrealized
gains and losses and do not reflect the actual recorded values because gains and losses offset in certain cases. Actual unrealized gains included in other current assets were $138 for cash flow hedges and $5,429 for derivatives not qualifying for
hedge accounting. Actual unrealized losses included in accrued expenses were $3,693 for foreign exchange contracts designated as cash flow hedges and $1,062 for foreign exchange contracts not qualifying for hedge accounting.
|
|
|
| MILLIPORE FORM 10-K 2009 |
|
101 |
NOTES TO CONSOLIDATED FINANCIAL STATEMENTS—(Continued)
(In thousands, except per share data)
The effect of derivative instruments that were designated as hedges on our consolidated financial statements for December 31, 2009 and 2008 are summarized below:
|
|
|
|
|
|
|
|
|
|
|
|
|
|
|
|
| |
|
Amount of
Gain (Loss)
Recognized
in OCI
(Effective
Portion) |
|
|
Statement of
Operations
Location
(Effective
Portion) |
|
Amount of Gain
(Loss) Reclassified from Accumulated OCI into Income
(Effective Portion) |
|
|
Statement of
Operations Location (Ineffective
Portion) |
|
Amount of Gain
(Loss)
Recorded
(Ineffective
Portion) |
| Year ended December 31, 2009 |
|
|
|
|
|
|
|
|
|
|
|
|
|
|
|
| Cash flow hedges: |
|
|
|
|
|
|
|
|
|
|
|
|
|
|
|
| Foreign exchange contracts |
|
$ |
(1,853 |
) |
|
Revenues |
|
$ |
(3,735 |
) |
|
Selling, general and
administrative
expenses |
|
$ |
– |
| Interest rate swaps |
|
|
4,940 |
|
|
Interest
expense |
|
|
– |
|
|
Selling, general and
administrative
expenses |
|
|
– |
| Net investment hedge |
|
|
(8,311 |
) |
|
– |
|
|
– |
|
|
– |
|
|
– |
| Total |
|
$ |
(5,224 |
) |
|
|
|
$ |
(3,735 |
) |
|
|
|
$ |
– |
|
|
|
|
|
|
| Year ended December 31, 2008 |
|
|
|
|
|
|
|
|
|
|
|
|
|
|
|
| Cash flow hedges: |
|
|
|
|
|
|
|
|
|
|
|
|
|
|
|
| Foreign exchange contracts |
|
$ |
(4,504 |
) |
|
Revenues |
|
$ |
(1,444 |
) |
|
Selling, general and
administrative
expenses |
|
$ |
– |
| Net investment hedge |
|
|
15,048 |
|
|
– |
|
|
– |
|
|
– |
|
|
– |
| Total |
|
$ |
10,544 |
|
|
|
|
$ |
(1,444 |
) |
|
|
|
$ |
– |
The effect of derivative instruments not designated as
hedges on our consolidated financial statements for 2009 and 2008 is as follows:
|
|
|
|
|
|
|
| |
|
Statement of Operations
Location |
|
Amount of Gain (Loss) Recorded |
|
|
|
|
| Year ended December 31, 2009 |
|
|
|
|
|
|
| Foreign exchange contracts |
|
Selling, general and
administrative expenses |
|
$ |
3,689 |
|
|
|
|
| Year ended December 31, 2008 |
|
|
|
|
|
|
| Foreign exchange contracts |
|
Selling, general and
administrative expenses |
|
$ |
(7,154 |
) |
15. FAIR VALUE MEASUREMENTS
We hold cash equivalents, derivatives, certain other assets, and certain other liabilities that
are carried at fair value. We generally determine fair value using a market approach based on quoted prices of identical instruments, when available. When market quotes of identical instruments are not readily accessible or available, we determine
fair value based on quoted market prices of similar instruments. Nonperformance risk of counter-parties is considered in determining the fair value of derivative instruments in an asset position and the impact of our own credit standing is
considered in determining the fair value of our obligations. Refer to footnote 13 for an explanation of our valuation techniques in the fair value hierarchy.
|
|
|
| 102 |
|
MILLIPORE FORM 10-K 2009
|
NOTES TO CONSOLIDATED FINANCIAL STATEMENTS—(Continued)
(In thousands, except per share data)
Financial assets and liabilities measured at fair value on a recurring basis are summarized below:
|
|
|
|
|
|
|
|
|
|
|
|
|
| |
|
December 31, 2009 |
| |
|
Level 1 |
|
Level 2 |
|
Level 3 |
|
Balance |
| Assets |
|
|
|
|
|
|
|
|
|
|
|
|
| Cash equivalents |
|
$ |
– |
|
$ |
115,165 |
|
$ |
– |
|
$ |
115,165 |
| Derivatives |
|
$ |
– |
|
$ |
7,574 |
|
$ |
– |
|
$ |
7,574 |
| Marketable securities1 |
|
$ |
1,128 |
|
$ |
– |
|
$ |
– |
|
$ |
1,128 |
| Liabilities |
|
|
|
|
|
|
|
|
|
|
|
|
| Derivatives |
|
$ |
– |
|
$ |
3,076 |
|
$ |
– |
|
$ |
3,076 |
| Deferred compensation2 |
|
$ |
8,794 |
|
$ |
– |
|
$ |
– |
|
$ |
8,794 |
|
|
| |
|
December 31, 2008 |
| |
|
Level 1 |
|
Level 2 |
|
Level 3 |
|
Balance |
| Assets |
|
|
|
|
|
|
|
|
|
|
|
|
| Cash equivalents |
|
$ |
– |
|
$ |
99,438 |
|
$ |
– |
|
$ |
99,438 |
| Derivatives |
|
$ |
– |
|
$ |
5,566 |
|
$ |
– |
|
$ |
5,566 |
| Marketable securities¹ |
|
$ |
912 |
|
$ |
– |
|
$ |
– |
|
$ |
912 |
| Liabilities |
|
|
|
|
|
|
|
|
|
|
|
|
| Derivatives |
|
$ |
– |
|
$ |
4,754 |
|
$ |
– |
|
$ |
4,754 |
| Deferred compensation² |
|
$ |
6,092 |
|
$ |
– |
|
$ |
– |
|
$ |
6,092 |
| 1 |
Relates to investments in marketable securities associated with certain of our non-qualified deferred compensation plans, which are included in Other assets.
|
| 2 |
Relates to our obligations to pay benefits under certain of our non-qualified deferred compensation plans and supplemental savings plan for senior executives, which are included
in Other liabilities. |
The following table provides information by level for assets and liabilities that were measured at fair value on a
nonrecurring basis during 2009:
|
|
|
|
|
|
|
|
|
|
|
| |
|
December 31, 2009 |
|
| |
|
Level 1 |
|
Level 2 |
|
Level 3 |
|
| Acquisition assets, net |
|
$ |
– |
|
$ |
– |
|
$ |
24,632 |
|
| Lease termination closure accruals |
|
$ |
– |
|
$ |
– |
|
$ |
(1,342 |
) |
Disclosures for assets and liabilities that are measured at
fair value but are not recognized and disclosed at fair value on a recurring basis, were required prospectively beginning January 1, 2009. During the year ended December 31, 2009, such measurements of fair value primarily related to the
assets and liabilities acquired in connection with the acquisition of Guava and BioAnaLab and accrued expenses related to the closure of certain facilities. Acquisition assets and liabilities were valued using the income and market valuation
approaches. Inputs to the valuations included management’s cash flow projections and observable inputs such as interest rates, cost of capital, and market comparable royalty rates. Lease termination accruals were valued using the income
valuation approach. Inputs to the valuations included management’s assumptions regarding sublease income as well as observable inputs such as rent obligations and interest rates.
|
|
|
| MILLIPORE FORM 10-K 2009 |
|
103 |
NOTES TO CONSOLIDATED FINANCIAL STATEMENTS—(Continued)
(In thousands, except per share data)
16. COSTS ASSOCIATED WITH EXIT ACTIVITIES
On September 10, 2008, we took actions to optimize the performance of our global supply chain and reduce our cost structure to improve operational efficiency. These actions were partly in response to the market conditions that caused
revenue declines in our Bioprocess Division in 2008. These actions were also part of our long term strategy to further improve the efficiency of our global supply chain, primarily through consolidation of our manufacturing locations. Ten facilities
have been closed as of December 31, 2009. One more facility will be closed in 2010. We expect to complete this program in 2010 and do not anticipate significant additional charges relating to this program going forward.
The following table summarizes expected, incurred, and remaining costs associated with these actions at December 31, 2009:
|
|
|
|
|
|
|
|
|
|
|
|
|
|
|
|
|
|
|
|
|
| |
|
Severance
and
Retention
Costs |
|
|
Facility Exit
and Lease
Termination
Costs |
|
|
Accelerated
Depreciation |
|
|
Other
Costs |
|
|
Total |
|
| Expected costs |
|
$ |
7,789 |
|
|
$ |
1,865 |
|
|
$ |
2,876 |
|
|
$ |
9,565 |
|
|
$ |
22,095 |
|
| Costs incurred in 2008 |
|
|
(5,656 |
) |
|
|
– |
|
|
|
(911 |
) |
|
|
(2,372 |
) |
|
|
(8,939 |
) |
| Costs incurred in 2009 |
|
|
(1,188 |
) |
|
|
(1,506 |
) |
|
|
(1,965 |
) |
|
|
(6,862 |
) |
|
|
(11,521 |
) |
| Remaining costs at December 31, 2009 |
|
$ |
945 |
|
|
$ |
359 |
|
|
$ |
– |
|
|
$ |
331 |
|
|
$ |
1,635 |
|
The following table summarizes the accrual balances and
utilization by cost type associated with these actions:
|
|
|
|
|
|
|
|
|
|
|
|
|
|
|
|
|
|
|
|
|
| |
|
Severance
and
Retention
Costs |
|
|
Facility Exit
and Lease
Termination
Costs |
|
|
Accelerated
Depreciation |
|
|
Other
Costs |
|
|
Total |
|
| Expense |
|
$ |
5,656 |
|
|
$ |
– |
|
|
$ |
911 |
|
|
$ |
2,372 |
|
|
$ |
8,939 |
|
| Payments/utilization |
|
|
(911 |
) |
|
|
– |
|
|
|
(911 |
) |
|
|
(2,372 |
) |
|
|
(4,194 |
) |
| Foreign currency translation |
|
|
(73 |
) |
|
|
– |
|
|
|
– |
|
|
|
– |
|
|
|
(73 |
) |
| Balance at December 31, 2008 |
|
|
4,672 |
|
|
|
– |
|
|
|
– |
|
|
|
– |
|
|
|
4,672 |
|
| Expense |
|
|
1,188 |
|
|
|
1,506 |
|
|
|
1,965 |
|
|
|
6,862 |
|
|
|
11,521 |
|
| Payments/utilization |
|
|
(4,555 |
) |
|
|
(472 |
) |
|
|
(1,965 |
) |
|
|
(6,862 |
) |
|
|
(13,854 |
) |
| Foreign currency translation |
|
|
192 |
|
|
|
42 |
|
|
|
– |
|
|
|
– |
|
|
|
234 |
|
| Balance at December 31, 2009 |
|
$ |
1,497 |
|
|
$ |
1,076 |
|
|
$ |
– |
|
|
$ |
– |
|
|
$ |
2,573 |
|
During 2009, we recorded costs associated with these exit
activities in our statement of operations of $10,834, $599, and $88 in cost of revenues, selling, general and administrative expenses, and research and development expenses, respectively. During 2008, we recorded costs associated with these exit
activities in our statement of operations of $7,871, $819, and $249 in cost of revenues, selling, general and administrative expenses, and research and development expenses, respectively.
|
|
|
| 104 |
|
MILLIPORE FORM 10-K 2009
|
NOTES TO CONSOLIDATED FINANCIAL STATEMENTS—(Continued)
(In thousands, except per share data)
17. COMMITMENTS AND CONTINGENCIES
Leases. We occupy space and use certain equipment under lease arrangements. At December 31, 2009, future minimum rental
payments under non-cancelable operating leases with initial terms exceeding one year were as follows:
|
|
|
|
| 2010 |
|
$ |
31,392 |
| 2011 |
|
|
20,438 |
| 2012 |
|
|
13,173 |
| 2013 |
|
|
6,963 |
| 2014 |
|
|
6,654 |
| Thereafter |
|
|
15,575 |
| Total minimum future rental payments |
|
|
94,195 |
| Less: amounts due from subleases |
|
|
1,036 |
| Total minimum future rental payments less sublease income |
|
$ |
93,159 |
Rental expense under these lease arrangements was
$31,008, $30,239, and $28,283, in 2009, 2008, and 2007 respectively.
Environmental. Our operations are subject to environmental regulation by federal, state, and local authorities in the United States and regulatory authorities with jurisdiction over our
foreign operations. We have accrued for the costs of environmental remediation activities and periodically reassess these amounts. We believe that the likelihood of incurring losses materially in excess of amounts accrued is remote.
Other. We have purchase commitments totaling $92,670 at
December 31, 2009. In addition, future minimum lease payments under capital leases were $7,810.
We currently are not a party to any material legal
proceeding and have no knowledge of any material legal proceeding contemplated by any governmental authority or third party. We are subject to a number of claims and legal proceedings which, in the opinion of our management, are incidental to our
normal business operations. In our opinion, although final settlement of these suits and claims may impact our financial statements in a particular period, they will not, in the aggregate, have a material adverse effect on our financial position,
cash flows or results of operations.
As permitted under Massachusetts law and required by our corporate by-laws, we indemnify our officers and directors
for certain events or occurrences while the director or officer is or was serving in such capacity. The maximum potential amount of future payments that could be required under these indemnification obligations is unlimited; however, we have a
Directors and Officers liability insurance policy that enables us to recover a portion of any future amounts paid. As there were no known or pending claims, we have not accrued a liability for these agreements as of December 31, 2009.
In the ordinary course of business, we warrant to customers that our products will conform to published or agreed specifications. Generally, the
applicable product warranty period is one year from the date of delivery of the product to the customer or of site acceptance, if required. Additionally, we typically provide limited warranties with respect to our
services. From time to time, we also make other warranties to customers, including warranties that our products are manufactured in accordance with applicable laws and
not in violation of third party rights. We provide for estimated warranty costs at the time of the product sale. We believe our warranty accrual as of December 31, 2009 appropriately reflected the estimated cost of such warranty obligations.
|
|
|
| MILLIPORE FORM 10-K 2009 |
|
105 |
NOTES TO CONSOLIDATED FINANCIAL STATEMENTS—(Continued)
(In thousands, except per share data)
In the ordinary course of business, we agree from time to time to indemnify certain customers against certain third party claims for property damage, bodily injury,
personal injury or intellectual property infringement arising from the operation or use of our products. Also, from time to time in agreements with suppliers, licensors, and other business partners, we agree to indemnify these partners against
certain liabilities arising out of the sale or use of our products. The maximum potential amount of future payments we could be required to make under these indemnification obligations is unlimited; however, we have general and umbrella insurance
policies that enable us to recover a portion of any amounts paid. Based on our experience with such indemnification claims, we believe the estimated fair value of these obligations is minimal. Accordingly, we have no liabilities recorded for these
agreements as of December 31, 2009.
As part of past acquisitions and divestitures of businesses or assets, we have provided a variety of warranties
and indemnifications to the sellers and purchasers that are typical for such transactions. Typically certain of the warranties and the indemnifications expire after a defined period of time following the transaction, but certain warranties and
indemnifications may survive indefinitely. As of December 31, 2009, no material claims under these warranties or indemnifications are outstanding, and we do not know of any such claims being contemplated.
18. BUSINESS SEGMENT AND GEOGRAPHIC INFORMATION
We evaluated our business activities that are regularly reviewed by the chief operating decision-maker for which separate discrete financial information is available. As a result of this evaluation, we determined that we have two operating
segments as of December 31, 2009, Bioprocess and Bioscience, which are aggregated into one reportable segment.
Our Bioscience Division improves
laboratory productivity and work flows by providing innovative products and technologies for life science research. Our Bioprocess Division helps pharmaceutical and biotechnology companies develop their manufacturing processes, optimize their
manufacturing productivity, and ensure the quality of drugs. For both operating segments, economic characteristics, production processes, products and services, types and classes of customers, methods of distribution, and regulatory environments are
similar.
Revenues and long-lived assets information by geographic area is as follows:
|
|
|
|
|
|
|
|
|
|
| |
|
Year ended December 31, |
| |
|
2009 |
|
2008 |
|
2007 |
| Revenues(1) |
|
|
|
|
|
|
|
|
|
| United States |
|
$ |
563,421 |
|
$ |
528,255 |
|
$ |
560,257 |
| Other Americas |
|
|
96,598 |
|
|
90,909 |
|
|
87,372 |
| Americas |
|
|
660,019 |
|
|
619,164 |
|
|
647,629 |
| Europe |
|
|
665,663 |
|
|
683,284 |
|
|
623,032 |
| Japan |
|
|
171,928 |
|
|
160,117 |
|
|
133,017 |
| Other Asia/Pacific |
|
|
156,800 |
|
|
139,573 |
|
|
127,877 |
| Asia/Pacific |
|
|
328,728 |
|
|
299,690 |
|
|
260,894 |
| Total |
|
$ |
1,654,410 |
|
$ |
1,602,138 |
|
$ |
1,531,555 |
| (1) |
We attribute revenues to geographic areas on the basis of the location of the customer. |
|
|
|
| 106 |
|
MILLIPORE FORM 10-K 2009
|
NOTES TO CONSOLIDATED FINANCIAL STATEMENTS—(Continued)
(In thousands, except per share data)
|
|
|
|
|
|
|
| |
|
December 31, |
| |
|
2009 |
|
2008 |
| Long-Lived Assets(2) |
|
|
|
|
|
|
| United States |
|
$ |
289,055 |
|
$ |
289,149 |
| Other Americas |
|
|
6,495 |
|
|
6,801 |
| Americas |
|
|
295,550 |
|
|
295,950 |
| France |
|
|
77,236 |
|
|
74,337 |
| Ireland |
|
|
197,497 |
|
|
178,324 |
| Other Europe |
|
|
16,679 |
|
|
20,267 |
| Europe |
|
|
291,412 |
|
|
272,928 |
| Asia/Pacific |
|
|
8,649 |
|
|
8,532 |
| Total |
|
$ |
595,611 |
|
$ |
577,410 |
| (2) |
Long-lived assets are net property, plant and equipment attributed to the specific
geographic regions. |
19. INVESTMENTS IN AFFILIATED COMPANIES
We have an equity investment in a South African company that is accounted for using the equity method. During 2009, 2008, and 2007, we recorded $355, $521, and $724 of
income, respectively. During 2009, 2008, and 2007, we received dividends totaling $310, $210, and $448, respectively.
On November 20, 2009, we
acquired the remaining 60% ownership of our joint venture in India (the “India JV”) for $58,082 in cash. Prior to November 20, 2009, we owned a 40% equity interest in our India JV. The India JV is the channel for our products into the
Indian market and is engaged in the manufacture and sale of certain types of filtration systems, laboratory water purification systems, accessories, consumables, and services. The results of the India JV have been consolidated in our financial
statements since 2006 when we determined that substantially all of the activities of the India JV involve us or are conducted on our behalf.
The effects
of changes in our ownership interest in the India JV on our equity were as follows:
|
|
|
|
|
| |
|
Year ended
December 31, 2009 |
|
| Net Income attributable to Millipore |
|
$ |
177,004 |
|
| Transfers to the noncontrolling interest |
|
|
|
|
| Decrease in equity for the purchase of remaining noncontrolling interest |
|
|
(51,864 |
) |
| Change in equity attributable to Millipore from net income attributable to Millipore and transfers to noncontrolling
interest |
|
$ |
125,140 |
|
|
|
|
| MILLIPORE FORM 10-K 2009 |
|
107 |
PART II
Quarterly Results (Unaudited)
Our quarterly unaudited results are summarized below:
|
|
|
|
|
|
|
|
|
|
|
|
|
|
|
|
|
|
|
|
|
| (In thousands, except per share data) |
|
First
Quarter |
|
|
Second
Quarter |
|
|
Third
Quarter |
|
|
Fourth
Quarter |
|
|
Full Year |
|
| 2009 |
|
|
|
|
|
|
|
|
|
|
|
|
|
|
|
|
|
|
|
|
| Revenues |
|
$ |
407,940 |
|
|
$ |
408,591 |
|
|
$ |
411,865 |
|
|
$ |
426,014 |
|
|
$ |
1,654,410 |
|
| Cost of revenues |
|
|
184,621 |
|
|
|
179,693 |
|
|
|
188,223 |
|
|
|
194,895 |
|
|
|
747,432 |
|
| Gross profit |
|
|
223,319 |
|
|
|
228,898 |
|
|
|
223,642 |
|
|
|
231,119 |
|
|
|
906,978 |
|
| Selling, general and administrative expenses |
|
|
126,788 |
|
|
|
130,749 |
|
|
|
131,153 |
|
|
|
135,075 |
|
|
|
523,765 |
|
| Research and development expenses |
|
|
25,203 |
|
|
|
29,123 |
|
|
|
29,349 |
|
|
|
30,891 |
|
|
|
114,566 |
|
| Operating profit |
|
|
71,328 |
|
|
|
69,026 |
|
|
|
63,140 |
|
|
|
65,153 |
|
|
|
268,647 |
|
| Gain on business acquisition |
|
|
8,542 |
|
|
|
– |
|
|
|
– |
|
|
|
– |
|
|
|
8,542 |
|
| Interest income |
|
|
242 |
|
|
|
176 |
|
|
|
171 |
|
|
|
152 |
|
|
|
741 |
|
| Interest expense |
|
|
(14,609 |
) |
|
|
(14,477 |
) |
|
|
(14,549 |
) |
|
|
(14,708 |
) |
|
|
(58,343 |
) |
| Income before provision for income taxes |
|
|
65,503 |
|
|
|
54,725 |
|
|
|
48,762 |
|
|
|
50,597 |
|
|
|
219,587 |
|
| Provision for income taxes |
|
|
11,949 |
|
|
|
13,119 |
|
|
|
8,562 |
|
|
|
6,767 |
|
|
|
40,397 |
|
| Net income |
|
|
53,554 |
|
|
|
41,606 |
|
|
|
40,200 |
|
|
|
43,830 |
|
|
|
179,190 |
|
| Less: Net income attributable to noncontrolling interest |
|
|
529 |
|
|
|
1,212 |
|
|
|
538 |
|
|
|
(93 |
) |
|
|
2,186 |
|
| Net income attributable to Millipore |
|
$ |
53,025 |
|
|
$ |
40,394 |
|
|
$ |
39,662 |
|
|
$ |
43,923 |
|
|
$ |
177,004 |
|
| Earnings per share: |
|
|
|
|
|
|
|
|
|
|
|
|
|
|
|
|
|
|
|
|
| Basic |
|
$ |
0.96 |
|
|
$ |
0.73 |
|
|
$ |
0.71 |
|
|
$ |
0.79 |
|
|
$ |
3.19 |
|
| Diluted |
|
$ |
0.95 |
|
|
$ |
0.72 |
|
|
$ |
0.71 |
|
|
$ |
0.78 |
|
|
$ |
3.15 |
|
| Weighted average shares outstanding: |
|
|
|
|
|
|
|
|
|
|
|
|
|
|
|
|
|
|
|
|
| Basic |
|
|
55,352 |
|
|
|
55,481 |
|
|
|
55,572 |
|
|
|
55,642 |
|
|
|
55,509 |
|
| Diluted |
|
|
55,779 |
|
|
|
55,980 |
|
|
|
55,197 |
|
|
|
56,342 |
|
|
|
56,124 |
|
|
|
|
|
|
|
| 2008 (As Adjusted) |
|
|
|
|
|
|
|
|
|
|
|
|
|
|
|
|
|
|
|
|
| Revenues |
|
$ |
396,204 |
|
|
$ |
414,176 |
|
|
$ |
395,005 |
|
|
$ |
396,753 |
|
|
$ |
1,602,138 |
|
| Cost of revenues |
|
|
188,067 |
|
|
|
184,013 |
|
|
|
185,835 |
|
|
|
191,392 |
|
|
|
749,307 |
|
| Gross profit |
|
|
208,137 |
|
|
|
230,163 |
|
|
|
209,170 |
|
|
|
205,361 |
|
|
|
852,831 |
|
| Selling, general and administrative expenses |
|
|
125,502 |
|
|
|
134,484 |
|
|
|
123,974 |
|
|
|
132,769 |
|
|
|
516,729 |
|
| Research and development expenses |
|
|
25,009 |
|
|
|
26,172 |
|
|
|
25,421 |
|
|
|
26,003 |
|
|
|
102,605 |
|
| Operating profit |
|
|
57,626 |
|
|
|
69,507 |
|
|
|
59,775 |
|
|
|
46,589 |
|
|
|
233,497 |
|
| Interest income |
|
|
111 |
|
|
|
270 |
|
|
|
213 |
|
|
|
354 |
|
|
|
948 |
|
| Interest expense |
|
|
(18,137 |
) |
|
|
(18,329 |
) |
|
|
(17,359 |
) |
|
|
(16,284 |
) |
|
|
(70,109 |
) |
| Income before provision for income taxes |
|
|
39,600 |
|
|
|
51,448 |
|
|
|
42,629 |
|
|
|
30,659 |
|
|
|
164,336 |
|
| Provision for income taxes |
|
|
8,324 |
|
|
|
11,897 |
|
|
|
4,123 |
|
|
|
(1,175 |
) |
|
|
23,169 |
|
| Net income |
|
|
31,276 |
|
|
|
39,551 |
|
|
|
38,506 |
|
|
|
31,834 |
|
|
|
141,167 |
|
| Less: Net income attributable to noncontrolling interest |
|
|
781 |
|
|
|
1,349 |
|
|
|
706 |
|
|
|
726 |
|
|
|
3,562 |
|
| Net income attributable to Millipore |
|
$ |
30,495 |
|
|
$ |
38,202 |
|
|
$ |
37,800 |
|
|
$ |
31,108 |
|
|
$ |
137,605 |
|
| Earnings per share: |
|
|
|
|
|
|
|
|
|
|
|
|
|
|
|
|
|
|
|
|
| Basic |
|
$ |
0.56 |
|
|
$ |
0.69 |
|
|
$ |
0.68 |
|
|
$ |
0.56 |
|
|
$ |
2.50 |
|
| Diluted |
|
$ |
0.55 |
|
|
$ |
0.69 |
|
|
$ |
0.68 |
|
|
$ |
0.56 |
|
|
$ |
2.47 |
|
| Weighted average shares outstanding: |
|
|
|
|
|
|
|
|
|
|
|
|
|
|
|
|
|
|
|
|
| Basic |
|
|
54,910 |
|
|
|
55,123 |
|
|
|
55,205 |
|
|
|
55,244 |
|
|
|
55,128 |
|
| Diluted |
|
|
55,506 |
|
|
|
55,693 |
|
|
|
55,844 |
|
|
|
55,624 |
|
|
|
55,711 |
|
Quarterly amounts for basic and diluted earnings per share
included in the above table will not necessarily sum to the annual earnings per share amounts because of rounding.
|
|
|
| 108 |
|
MILLIPORE FORM 10-K 2009
|
PART II
| ITEM 9 |
CHANGES IN AND DISAGREEMENTS WITH ACCOUNTANTS ON ACCOUNTING AND FINANCIAL DISCLOSURE. |
This item is not applicable.
| ITEM 9A |
CONTROLS AND PROCEDURES. |
Evaluation of Disclosure Controls and Procedures
An
evaluation was carried out under the supervision and with the participation of our management, including our Chief Executive Officer (“CEO”) and Chief Financial Officer (“CFO”), of the effectiveness of our disclosure controls and
procedures (as defined in Rules 13a-15(e) and 15d-15(e) under the Securities Exchange Act of 1934 (the “Exchange Act”)) as of the end of the fiscal year covered by this report. Based upon that evaluation, our CEO and CFO have concluded
that our disclosure controls and procedures are effective to ensure that information required to be disclosed by us in reports that we file or submit under the Exchange Act is recorded, processed, summarized and reported in accordance with and
within the time periods specified in Securities and Exchange Commission rules and forms.
Management’s Annual Report on Internal
Control over Financial Reporting
Management’s annual report on internal control over financial reporting can be found on page 65 of this Form 10-K.
The Independent Registered Public Accounting Firm’s report on the effectiveness of our internal control over financial reporting can be found on page 66 of this Form 10-K.
Changes in Internal Control over Financial Reporting
There have been no changes in our internal
control over financial reporting identified during the three months ended December 31, 2009 that have materially affected, or are reasonably likely to materially affect, our internal control over financial reporting.
| ITEM 9B |
OTHER INFORMATION. |
This item is not applicable.
|
|
|
| MILLIPORE FORM 10-K 2009 |
|
109 |
PART III
| ITEM 10 |
DIRECTORS, EXECUTIVE OFFICERS AND CORPORATE GOVERNANCE.
|
The information required by this item with respect to our directors is incorporated by reference to our definitive Proxy Statement for
Millipore’s Annual Meeting of Stockholders scheduled to be held on May 11, 2010 (the “Proxy Statement”) under the caption “NOMINATION AND ELECTION OF DIRECTORS”. The Proxy Statement will be filed with the Securities and
Exchange Commission not later than March 26, 2010.
The information required by this item with respect to compliance with Section 16(a) of the
Securities Exchange Act of 1934, and our Audit and Finance Committee and our Audit Committee Financial Expert(s) is incorporated by reference to the Proxy Statement under the captions “OWNERSHIP OF MILLIPORE COMMON STOCK –
Section 16(a) Beneficial Ownership Reporting Compliance”, and “Committees, Meetings and Compensation of Directors; Shareholder Communications with Directors – Audit and Finance Committee”, respectively.
Information required by this item with respect to our executive officers is set forth in Part I of this Form 10-K report under the heading “Supplementary Item.
Executive Officers of the Registrant (pursuant to Instruction 3 to Item 401(b) of Regulation S-K)”.
We have adopted a code of ethics that
applies to our principal executive officer, our principal financial officer, and our principal accounting officer, as well as to our other employees. This code of ethics consists of our Corporate Compliance Policy, our Employee Code of Conduct and
our Rules of Conduct. We have made this code of ethics available on our website, as described under “Other Information” in Item 1 of this Form 10-K report. We also intend to provide disclosure on our website regarding any amendments
to our code of ethics, or waivers from our code of ethics as relate to our principal executive officer, principal financial officer or principal accounting officer, or persons performing similar functions, within four days following any such
amendments or waivers.
| ITEM 11 |
EXECUTIVE COMPENSATION. |
The information required by this item with respect to executive compensation, compensation committee interlocks, and compensation committee report (as furnished
information and not filed information) is incorporated by reference to the Proxy Statement under the caption “Executive Compensation” and “Compensation Discussion and Analysis of Executive Compensation”, “Committees,
Meetings and Compensation of Directors; Shareholder Communications with Directors – Management Development and Compensation Committee – Compensation Committee Interlocks and Insider Participation” and “Report of the Management
Development and Compensation Committee”, respectively.
| ITEM 12 |
SECURITY OWNERSHIP OF CERTAIN BENEFICIAL OWNERS AND MANAGEMENT AND RELATED STOCKHOLDER MATTERS. |
The information required by this item with respect to Securities Authorized for Issuance under Equity Compensation Plans is incorporated by reference to the Proxy
Statement to the extent required therein.
The information required by this item with respect to security ownership of certain beneficial owners and
management of the Company is incorporated by reference to the Proxy Statement under the captions “Ownership of Millipore Common Stock – Other Principal Holders of Millipore Common Stock” and “Ownership of Millipore Common Stock
– Management Ownership of Millipore Common Stock”.
|
|
|
| 110 |
|
MILLIPORE FORM 10-K 2009
|
PART III
| ITEM 13 |
CERTAIN RELATIONSHIPS AND RELATED TRANSACTIONS, AND DIRECTOR INDEPENDENCE. |
The information required by this item with respect to certain relationships and related transactions
is incorporated by reference to the Proxy Statement under the caption “Certain Relationships and Related Transactions”. The information required by this item with respect to director independence is incorporated by reference to the Proxy
Statement under the caption “Corporate Governance – Committees, Meetings and Compensation of Directors; Shareholder Communications with Directors”.
| ITEM 14 |
PRINCIPAL ACCOUNTANT FEES AND SERVICES.
|
The information required by this item is incorporated by reference to the Proxy Statement under the caption “Report of the Audit and
Finance Committee”.
|
|
|
| MILLIPORE FORM 10-K 2009 |
|
111 |
PART IV
| ITEM 15 |
EXHIBITS AND FINANCIAL STATEMENT SCHEDULES.
|
The following documents are filed or furnished, or incorporated by reference, as a part of this Report:
1. FINANCIAL STATEMENTS.
The following
Financial Statements are filed as part of this report
|
|
|
| Report of Independent Registered Public Accounting Firm |
|
66 |
| Consolidated Statements of Operations for the years ended December 31, 2009, 2008, and 2007 |
|
67 |
| Consolidated Balance Sheets at December 31, 2009 and 2008 |
|
68 |
| Consolidated Statements of Equity for the years ended December 31, 2009, 2008, and 2007 |
|
69 |
| Consolidated Statements of Cash Flows for the years ended December 31, 2009, 2008, and 2007 |
|
70 |
| Notes to Consolidated Financial Statements |
|
71 |
| Quarterly Results (Unaudited) |
|
108 |
2. FINANCIAL STATEMENT
SCHEDULES.
No financial statement schedules have been included because they are not applicable or not required under Regulation S-X, or the required
information is included in the Company’s Financial Statements.
3. LIST OF EXHIBITS.
A. The following exhibits are incorporated herein by reference. All referenced Forms 10-K, 10-Q, and 8-K are those of Millipore Corporation [Commission File
No. 001-09781]:
|
|
|
|
|
| Reg. S-K Item 601(b) Reference |
|
Document Incorporated |
|
Referenced Document on file with the Commission |
|
|
|
| 2.1 |
|
Form of Master Separation and Distribution Agreement between Millipore and Mykrolis Corporation+ |
|
Form 10-Q for the quarter ended June 30, 2001 |
|
|
|
| 2.2 |
|
Form of General Assignment and Assumption Agreement between Millipore and Mykrolis Corporation+ |
|
Form 10-Q for the quarter ended June 30, 2001 |
|
|
|
| 3(i) |
|
Restated Articles of Organization, as amended May 6, 1996 |
|
Form 10-K for year ended December 31, 1996 |
|
|
|
| 3(ii) |
|
By Laws, as amended |
|
Form 8-K filed February 14, 2005 |
|
|
|
| 4.1 |
|
Specimen Stock Certificate |
|
Registration Statement on Form S-3 ASR (No. 333-136451) |
|
|
|
| 4.2 |
|
Indenture dated as of June 13, 2006 among Millipore, Wilmington Trust Company and Citibank, N.A. |
|
Form 8-K filed June 16, 2006 |
|
|
|
| 4.3 |
|
Indenture dated as of June 30, 2006 among Millipore, Citibank, N.A., and Citibank International plc |
|
Form 8-K filed July 6, 2006 |
|
|
|
| 10.1.1 |
|
Form of letter agreement with directors relating to the deferral of directors fees and conversion into phantom stock units* |
|
Form 10-K for the year ended December 31, 1998 |
|
|
|
| 10.1.2 |
|
Form of letter agreement with directors relating to the deferral of directors’ cash compensation* |
|
Form 10-K for the year ended December 31, 2002 |
|
|
|
| 112 |
|
MILLIPORE FORM 10-K 2009
|
PART IV
|
|
|
|
|
| Reg. S-K Item 601(b) Reference |
|
Document Incorporated |
|
Referenced Document on file with the Commission |
|
|
|
| 10.1.3 |
|
Form of Amendment dated August 12, 2004 to Deferral Letter Agreement with Directors of Millipore Corporation* |
|
Form 10-K for the year ended December 31, 2004 |
|
|
|
| 10.1.4 |
|
Form of letter agreement with directors relating to the deferral of directors’ cash compensation* |
|
Form 10-Q for the quarter ended September 27, 2008 |
|
|
|
| 10.2.1 |
|
2008 Stock Incentive Plan* |
|
Form 10-K for the year ended December 31, 2008 |
|
|
|
| 10.2.2 |
|
Form of Nonqualified Stock Option Grant to Executive Officers under 2008 Stock Incentive Plan* |
|
Form 8-K filed February 13, 2009 |
|
|
|
| 10.2.3 |
|
Form of Performance Restricted Stock Unit Award Agreement for Executive Officers under 2008 Stock Incentive Plan* |
|
Form 8-K filed February 13, 2009 |
|
|
|
| 10.2.4 |
|
Form of Nonqualified Stock Option Grant for Nonemployee Directors under 2008 Stock Incentive Plan* |
|
Form 10-Q for the quarter ended September 27, 2008 |
|
|
|
| 10.2.5 |
|
Form of Restricted Stock Unit Award Document for Nonemployee Directors under 2008 Stock Incentive Plan* |
|
Form 10-Q for the quarter ended September 27, 2008 |
|
|
|
| 10.2.6 |
|
Form of Stock Option Grant to Directors issued under 1999 Stock Option Plan for Non-Employee Directors*± |
|
Form 10-K for the year ended December 31, 2004 |
|
|
|
| 10.2.7 |
|
Form of Stock Option Grant to Executive Officers and other employees issued under 1999 Stock Incentive Plan*± |
|
Form 10-K for the year ended December 31, 2004 |
|
|
|
| 10.2.8 |
|
Form of Restricted Stock Unit Grant to Executive Officers and other employees issued under 1999 Stock Incentive Plan*± |
|
Form 8-K filed February 21, 2006 |
|
|
|
| 10.2.9 |
|
Form of Nonqualified Stock Option Grant for Nonemployee Directors issued under 1999 Stock Incentive Plan*± |
|
Form 10-Q for the quarter ended September 30, 2006 |
|
|
|
| 10.2.10 |
|
Form of Restricted Stock Unit Award Document for Nonemployee Directors issued under 1999 Stock Incentive Plan*± |
|
Form 10-Q for the quarter ended September 30, 2006 |
|
|
|
| 10.3.1 |
|
Amended and Restated 2000 Deferred Compensation Plan for Senior Management as of January 1, 2008* |
|
Form 8-K filed May 13, 2008 |
|
|
|
| 10.3.2 |
|
Amendment dated December 4, 2008 to Amended and Restated 2000 Deferred Compensation Plan for Senior Management* |
|
Form 10-K for the year ended December 31, 2008 |
|
|
|
| 10.4.1 |
|
Millipore Incentive Plan (f/k/a 2000 Management Incentive Plan)* |
|
Form 10-K for the year ended December 31, 2000 |
|
|
|
| 10.4.2 |
|
Amendment dated October 22, 2008 to Millipore Incentive Plan* |
|
Form 10-K for the year ended December 31, 2008 |
|
|
|
| 10.5 |
|
Amended and Restated Supplemental Savings and Retirement Plan for Key Salaried Employees of Millipore Corporation as of January 1, 2009* |
|
Form 10-K for the year ended December 31, 2008 |
|
|
|
| 10.6.1 |
|
Offer Letter to Martin D. Madaus dated October 11, 2004* |
|
Form 10-K for the year ended December 31, 2004 |
|
|
|
| 10.6.2 |
|
Executive Termination Agreement dated August 8, 2007 between Millipore and Martin D. Madaus* |
|
Form 8-K filed August 18, 2007 |
|
|
|
| MILLIPORE FORM 10-K 2009 |
|
113 |
PART IV
|
|
|
|
|
| Reg. S-K Item 601(b) Reference |
|
Document Incorporated |
|
Referenced Document on file with the Commission |
|
|
|
| 10.6.3 |
|
Officer Severance Agreement dated August 8, 2007 between Millipore and Martin D. Madaus* |
|
Form 8-K filed August 18, 2007 |
|
|
|
| 10.6.4 |
|
Restricted Stock Agreement dated January 1, 2005 between Millipore and Martin D. Madaus* |
|
Form 10-Q for the quarter ended October 1, 2005 |
|
|
|
| 10.7.1 |
|
Form of Executive Termination Agreement between Millipore and executive officer* |
|
Form 10-K for the year ended December 31, 2008 |
|
|
|
| 10.7.2 |
|
Form of Officer Severance Agreement between Millipore and executive officer* |
|
Form 10-K for the year ended December 31, 2008 |
|
|
|
| 10.8 |
|
Management Compensation Changes, Equity Grants, Approval of Payments under the Millipore Incentive Plan and description of 2010 Metrics under the Millipore Incentive Plan* |
|
Form 8-K filed February 12, 2010 |
|
|
|
| 10.9.1 |
|
Master Patent License Agreement dated as of March 31, 2001 between Millipore and Mykrolis Corporation |
|
Form 10-Q for the quarter ended June 30, 2001 |
|
|
|
| 10.9.2 |
|
Master Patent Grantback License Agreement dated as of March 31, 2001 between Millipore and Mykrolis Corporation |
|
Form 10-Q for the quarter ended June 30, 2001 |
|
|
|
| 10.9.3 |
|
Master Trade Secret and Know-How Agreement dated as of March 31, 2001 between Millipore and Mykrolis Corporation |
|
Form 10-Q for the quarter ended June 30, 2001 |
|
|
|
| 10.9.4 |
|
Tax Sharing Agreement dated as of March 31, 2001 between Millipore and Mykrolis Corporation |
|
Form 10-Q for the quarter ended June 30, 2001 |
|
|
|
| 10.10 |
|
Net Lease dated August 12, 2002 between Millipore and Getronics Wang Co., LLC, with respect to the Company’s headquarters in Billerica, Massachusetts |
|
Form 10-K for the year ended December 31, 2002 |
|
|
|
| 10.11.1 |
|
Credit Agreement dated as of December 15, 2005 among Millipore and certain of its subsidiaries, Bank of America, N.A., and certain other lenders and arrangers |
|
Form 8-K filed December 20, 2005 |
|
|
|
| 10.11.2 |
|
Amendment No. 1 and Consent dated as of June 6, 2006 among Millipore and certain of its subsidiaries, Bank of America, N.A., and certain other lenders and arrangers |
|
Form 8-K filed June 9, 2006 |
|
|
|
| 10.11.3 |
|
Amendment No. 2 dated as of July 13, 2006 among Millipore and certain of its subsidiaries, Bank of America, N.A., and certain other lenders and arrangers |
|
Form 8-K filed July 18, 2006 |
+ Millipore Corporation agrees to furnish to the
Commission a copy of any omitted schedule or exhibit to such agreement upon request by the Commission
* A “management contract or compensatory
plan”
| ± |
|
Now pursuant to the 2008 Stock Incentive Plan |
|
|
|
| 114 |
|
MILLIPORE FORM 10-K 2009
|
PART IV
B. The following exhibits are filed or furnished herewith:
|
|
|
Reg. S-K
Item 601(b)
Reference |
|
Documents Filed Herewith |
|
|
| (10) |
|
Restricted Stock Agreement dated December 15, 2009 between Millipore and Martin D. Madaus* |
|
|
| (21) |
|
Subsidiaries of Millipore |
|
|
| (23) |
|
Consent of Independent Registered Public Accounting Firm |
|
|
| (24) |
|
Power of Attorney |
|
|
| (31) |
|
Certification of Chief Executive Officer Pursuant to Rule 13a-14(a) / Rule 15d-14(a) |
|
|
|
|
Certification of Chief Financial Officer Pursuant to Rule 13a-14(a) / Rule 15d-14(a) |
|
|
| |
|
Documents Furnished Herewith |
|
|
| (32) |
|
Certification of Chief Executive Officer and Chief Financial Officer Pursuant to 18 U.S.C. Section 1350 |
| * |
|
A “management contract or compensatory plan” |
|
|
|
| MILLIPORE FORM 10-K 2009 |
|
115 |
Signatures
Pursuant to the requirements of Section 13 or 15(d) of the Securities Exchange Act of 1934,
the Registrant has duly caused this report to be signed on its behalf by the undersigned thereunto duly authorized.
|
|
|
|
|
|
|
|
|
|
|
|
|
MILLIPORE CORPORATION |
|
|
|
|
| Dated: February 26, 2010 |
|
|
|
By: |
|
/S/ CHARLES F. WAGNER,
JR. |
|
|
|
|
|
|
|
|
Charles F. Wagner, Jr., Vice President and Chief Financial Officer |
Pursuant to the requirements of the Securities
Exchange Act of 1934, this report has been signed below by the following persons on behalf of the Registrant and in the capacity and on the dates indicated.
|
|
|
|
|
| Signature |
|
Title |
|
Date |
|
|
|
| /S/ MARTIN D.
MADAUS Martin D. Madaus |
|
Chairman of the Board of Directors, President and Chief Executive Officer |
|
February 26, 2010 |
|
|
|
| /S/ CHARLES F. WAGNER,
JR. Charles F. Wagner, Jr. |
|
Vice President, Chief Financial Officer (Principal Financial Officer) |
|
February 26, 2010 |
|
|
|
| /S/ ANTHONY L.
MATTACCHIONE Anthony L. Mattacchione |
|
Vice President, Corporate Controller and Chief Accounting Officer (Principal Accounting Officer) |
|
February 26, 2010 |
|
|
|
| /S/ DANIEL
BELLUS* Daniel Bellus |
|
Director |
|
February 26, 2010 |
|
|
|
| /S/ ROBERT C.
BISHOP* Robert C. Bishop |
|
Director |
|
February 26, 2010 |
|
|
|
| /S/ MELVIN D.
BOOTH* Melvin D. Booth |
|
Director |
|
February 26, 2010 |
|
|
|
| /S/ ROLF
CLASSON* Rolf Classon |
|
Director |
|
February 26, 2010 |
|
|
|
| /S/ MAUREEN A.
HENDRICKS* Maureen A. Hendricks |
|
Director |
|
February 26, 2010 |
|
|
|
| /S/ MARK
HOFFMAN* Mark Hoffman |
|
Director |
|
February 26, 2010 |
|
|
|
| /S/ ROBERT S.
LANGER* Robert S. Langer |
|
Director |
|
February 26, 2010 |
|
|
|
| /S/ JOHN F.
RENO* John F. Reno |
|
Director |
|
February 26, 2010 |
|
|
|
| /S/ EDWARD M.
SCOLNICK* Edward M. Scolnick |
|
Director |
|
February 26, 2010 |
|
|
|
| /S/ KAREN E.
WELKE* Karen E. Welke |
|
Director |
|
February 26, 2010 |
|
|
|
|
|
| *By: |
|
/S/ JEFFREY RUDIN
|
|
|
Jeffrey Rudin, Attorney-in-Fact |
|
|
|
| 116 |
|
MILLIPORE FORM 10-K 2009
|
Index to Exhibits
|
|
|
| Exhibit No. |
|
Description |
|
|
| 10.1 |
|
Restricted Stock Agreement dated December 15, 2009 between Millipore and Martin D. Madaus* |
|
|
| 21.1 |
|
Subsidiaries of Millipore |
|
|
| 23.1 |
|
Consent of Independent Registered Public Accounting Firm |
|
|
| 24.1 |
|
Power of Attorney |
|
|
| 31.1 |
|
Certification of Chief Executive Officer Pursuant to Rule 13a-14(a) / Rule 15d-14(a) |
|
|
| 31.2 |
|
Certification of Chief Financial Officer Pursuant to Rule 13a-14(a) / Rule 15d-14(a) |
|
|
| 32.1 |
|
Certification of Chief Executive Officer and Chief Financial Officer Pursuant to 18 U.S.C. Section 1350 |
| * |
|
A “management contract or compensatory plan” |
|
|
|
| MILLIPORE FORM 10-K 2009 |
|
117 |