Attached files
UNITED STATES
SECURITIES AND EXCHANGE COMMISSION
Washington, D.C. 20549
FORM 10-K
(Mark one)
| x | ANNUAL REPORT PURSUANT TO SECTION 13 OR 15(d) OF THE SECURITIES EXCHANGE ACT OF 1934 |
| For the fiscal year ended December 31, 2009. |
OR
| ¨ | TRANSITION REPORT PURSUANT TO SECTION 13 OR 15(d) OF THE SECURITIES EXCHANGE ACT OF 1934 |
| For the transition period from to |
Commission file number: 0-21918
FLIR Systems, Inc.
(Exact name of registrant as specified in its charter)
| Oregon | 93-0708501 | |
| (State or other jurisdiction of incorporation or organization) | (I.R.S. Employer Identification No.) | |
| 27700 SW Parkway Avenue, Wilsonville, Oregon | 97070 | |
| (Address of principal executive offices) | (Zip code) | |
Registrant’s telephone number, including area code: (503) 498-3547
Securities registered pursuant to Section 12(b) of the Act:
| Title of Each Class |
Name of Each Exchange on Which Registered | |
| Common Stock, $0.01 par value |
NASDAQ Global Select Market |
Securities registered pursuant to Section 12(g) of the Act: None
Indicate by check mark if the registrant is a well-known seasoned issuer, as defined in Rule 405 of the Securities Act. Yes x No ¨
Indicate by check mark if the registrant is not required to file reports pursuant to Section 13 or Section 15(d) of the Act. Yes ¨ No x
Indicate by check mark whether the registrant (1) has filed all reports required to be filed by Section 13 or 15(d) of the Securities Exchange Act of 1934 during the preceding 12 months (or for such shorter period that the registrant was required to file such reports), and (2) has been subject to such filing requirements for the past 90 days. Yes x No ¨
Indicate by check mark whether the registrant has submitted electronically and posted on its corporate Web site, if any, every Interactive Data File required to be submitted and posted pursuant to Rule 405 of Regulation S-T (§229.405 of this chapter) during the preceding 12 months (or for such shorter period that the registrant was required to submit and post such files). Yes x No ¨
Indicate by check mark if disclosure of delinquent filers pursuant to Item 405 of Regulation S-K is not contained herein, and will not be contained, to the best of registrant’s knowledge, in definitive proxy or information statements incorporated by reference in Part III of this Form 10-K or amendment to this Form 10-K. ¨
Indicate by checkmark whether the registrant is a large accelerated filer, an accelerated filer, a non-accelerated filer or a smaller reporting company. See the definitions of “large accelerated filer,” “accelerated filer” and “smaller reporting company” in Rule 12b-2 of the Exchange Act. (Check one)
Large accelerated filer x Accelerated filer ¨
Non-accelerated filer ¨ Smaller reporting company ¨
Indicate by check mark whether the registrant is a shell company (as defined in Rule 12b-2 of the Act). Yes ¨ No x
As of June 30, 2009, the aggregate market value of the shares of voting and non-voting stock of the registrant held by non-affiliates was $3,346,287,508.
As of February 12, 2010, there were 152,875,172 shares of the registrant’s common stock, $0.01 par value, outstanding.
DOCUMENTS INCORPORATED BY REFERENCE:
The registrant has incorporated by reference into Part III of this Form 10-K, portions of its Proxy Statement for its 2010 Annual Meeting of Shareholders.
FLIR Systems, Inc.
FORM 10-K
ANNUAL REPORT
TABLE OF CONTENTS
i
Forward-Looking Statements
This Annual Report on Form 10-K (the “Report”), including “Management’s Discussion and Analysis of Financial Condition and Results of Operations” in Item 7 contains forward-looking statements within the meaning of the Private Securities Litigation Reform Act of 1995 regarding future events and the future results of FLIR Systems, Inc. and its consolidated subsidiaries (“FLIR” or the “Company”) that are based on management’s current expectations, estimates, projections and assumptions about the Company’s business. Words such as “expects,” “anticipates,” “intends,” “plans,” “believes,” “sees,” “estimates” and variations of such words and similar expressions are intended to identify such forward-looking statements. These statements are not guarantees of future performance and involve risks, uncertainties and assumptions that are difficult to predict. Therefore, actual outcomes and results may differ materially from what is expressed or forecasted in such forward-looking statements due to numerous factors including, but not limited to, those discussed in “Risk Factors” in Item 1A, “Management’s Discussion and Analysis of Financial Condition and Results of Operations” in Item 7, and elsewhere in this Report as well as those discussed from time to time in the Company’s other Securities and Exchange Commission filings and reports. In addition, such statements could be affected by general industry, economic and market conditions. Such forward-looking statements speak only as of the date of this Report or, in the case of any document incorporated by reference, the date of that document, and we do not undertake any obligation to update any forward-looking statement to reflect events or circumstances after the date of this Report, or for changes made to this document by wire services or Internet service providers. If we update or correct one or more forward-looking statements, investors and others should not conclude that we will make additional updates or corrections with respect to other forward-looking statements.
PART I
| ITEM 1. | BUSINESS |
General
We are a world leader in the design, manufacture and marketing of thermal imaging systems. Our products are used in a wide variety of applications in commercial, industrial and government markets worldwide. We offer a variety of system configurations to suit specific customer requirements. In 2009, our business was organized into three divisions: Thermography, Commercial Vision Systems and Government Systems.
Thermography products are generally sold for commercial and industrial applications, typically where imaging and temperature measurement together are required. Products range from highly sensitive cameras with extensive analytic capabilities and sophisticated image processing to less expensive cameras offering excellent performance and value for less demanding applications. Our Thermography products range in price from $2,000 for an inexpensive hand-held camera to over $150,000 for our most sophisticated science cameras. Our strategies in this business are to continue to develop products for high-end applications while introducing new products at lower price points, and to capitalize on highly price-elastic demand in numerous emerging markets. Revenue from Thermography has grown at a compound annual rate of 15 percent since 2001 and was $285.5 million or 25 percent of consolidated revenue in 2009.
Commercial Vision Systems (“CVS”) is focused on emerging commercial markets for infrared imaging technology where the primary need is to see at night or in adverse conditions, such as through smoke or light fog. As the cost of infrared technology has declined, demand in large untapped markets such as commercial security, automotive, marine, airborne and first responder markets has grown rapidly. CVS has focused its efforts on expanding distribution, accelerating design cycles, reducing manufacturing costs and providing excellent customer service in these markets. Our infrared sensor business, which sells focal plane arrays and camera cores internally as well as to third parties on an original equipment manufacturer (“OEM”) basis, is also a part of CVS. CVS products range in price from under $1,000 for an OEM imaging core to more than $300,000 for a high definition airborne system. Since 2005, CVS revenue has grown at a compound annual rate of 25 percent. CVS revenue was $206.3 million or 18 percent of our consolidated revenue in 2009.
1
Government Systems (“GS”) is focused on government customers and markets where very high performance is required. Typical applications include surveillance, force protection, drug interdiction, search and rescue, special operations and target designation. We address these markets through either a commercial, off-the-shelf (“COTS”) model or a commercially developed, military qualified (“CDMQ”™) model. Products developed under the COTS model are applicable to a range of government customers and markets, including military applications. CDMQ products are specifically designed to meet military specifications. In both the COTS and CDMQ product development models, we use internally generated funds for research and development, and generally own all rights to the products and their design. We have continued to increase our emphasis on CDMQ as a development strategy, and it is a growing part of our GS business. We also periodically accept government funded design and development contracts. GS products are often customized for specific applications and frequently incorporate additional sensors, including visible light cameras, low light cameras, laser rangefinders, laser illuminators and laser designators. GS products range in price from under $10,000 for certain hand-held and weapon-mounted systems to over $1 million for our most advanced stabilized laser designation systems. Since 2005, GS revenue has grown at a compound annual rate of 28 percent. GS is our largest division with 2009 revenue of $655.3 million, or 57 percent of consolidated revenue in 2009.
On December 10, 2009, we announced that the Company would consolidate its Commercial Vision Systems and Thermography divisions into one unit, the Commercial Systems division, effective January 1, 2010. The new division will continue to focus on the large potential for growth in commercial and industrial markets, and will create value from commonality in distribution, customers and strategic product development focused on uncooled infrared technology. For 2010, however, we will continue to report the financial results of the former Commercial Vision Systems division and Thermography division as we undergo the transition of consolidating these two segments. As we expect Thermography and Commercial Vision Systems to be substantially consolidated by the end of 2010, we expect to report the financial results for Commercial Systems as a single segment in 2011.
For additional information concerning the Company’s three divisions, including revenues from external customers, earnings from operations and total assets by segment, see Note 17 to the Consolidated Financial Statements in Item 8.
FLIR Systems, Inc. is an Oregon corporation and was incorporated in 1978. The Company’s headquarters are located at 27700 SW Parkway Avenue, Wilsonville, Oregon 97070-8238, and the telephone number at this location is (503) 498-3547. Information about the Company is available on our website at www.flir.com.
Infrared Technology Overview
Infrared is a portion of the electro-magnetic spectrum that is adjacent to the visible spectrum, but is invisible to the human eye due to its longer wavelengths. Unlike visible light, infrared radiation (or heat) is emitted directly by all objects above absolute zero in temperature. Thermal imaging systems detect this infrared radiation and convert it into an electronic signal, which is then processed into a video signal and displayed on a video screen. Thermal imaging systems are different than other types of “low light” vision systems, such as visible light intensification used in night vision goggles. Infrared imaging systems are not adversely affected by the presence of visible light, so they can be used day or night, and are not susceptible to rapid changes in visible light levels. Since infrared systems are detecting emitted infrared radiation, they are passive and thus more covert than certain “illuminated” systems. Additionally, thermal imaging systems can measure very small temperature differences, a critical feature for a variety of commercial, industrial and scientific applications.
An infrared detector, which collects or absorbs infrared radiation and converts it into an electronic signal, is the primary component of thermal imaging systems. The two types of infrared detectors we manufacture and use in our systems are often referred to as “cooled” and “uncooled.” Cooled detectors utilize a mechanical micro-cooler to reduce the operating temperature of the infrared sensor to -200° C, and offer high sensitivity and resolution for long-range applications or those requiring high measurement precision. These systems, while more
2
sensitive and thus able to see farther, result in a product that is more expensive, heavier, more complex and uses more power than those using uncooled detectors. Uncooled detectors operate at room temperature and thus do not require a micro-cooler, resulting in products that are lighter, use less power and are less expensive to produce than cooled systems. While the performance of uncooled detectors is improving, uncooled detectors are still less sensitive than cooled detectors. The cost of both types of detectors is declining and we expect to continue reducing costs as volumes rise and the technology improves in the future. We currently expect demand for both types of systems to increase.
Products and Markets
Thermography. The Thermography market has traditionally addressed thermal imaging applications where both imaging and temperature measurement are required. This market has grown in size and breadth as prices have declined, volumes have increased and new applications have emerged. Over the past several years, markets have grown rapidly and expanded beyond the traditional industrial predictive and preventive maintenance segments. We expect new markets to continue to develop in the future. Key end-user markets include:
| Predictive Maintenance |
Thermal imaging systems are used for monitoring the condition of mechanical and electrical equipment. Such monitoring assists our customers in identifying equipment faults (manifested as hot spots) so they can be repaired before they fail. This increases equipment productivity and avoids catastrophic failures or major damage, which reduces operating expenses by lowering repair costs and reducing downtime. Improved functionality of image analysis software, smaller size and weight, and simplicity of system operation are critical factors for this well established market segment. |
| Research & Development |
Infrared’s unique ability to detect very small differences in temperature while detailing complex thermal dynamics and patterns makes Thermography systems a useful tool in a wide variety of research and development applications. Our systems provide the ability to view thermal distribution in real time for products ranging in size from small hybrid integrated circuits to jet engines. Common applications include product development of microelectronics, cell phones, laptop computers, telecommunications equipment, consumer appliances, automotive components and aircraft engines. Systems used in research and development applications typically require very high imaging performance and measurement precision, coupled with extensive analysis and reporting software. We have a complete line of both cooled and uncooled infrared imagers specifically designed for high-end research and development applications. |
| Manufacturing Process Control |
Thermal imaging applications for manufacturing process control include applications where temperature consistency is critical, including monitoring the quality of metal, plastic and glass cast parts, which are highly dependent upon the temperature distribution in the mold; monitoring the quality of paper, which is dependent upon proper and even moisture distribution during the drying process; and monitoring the quality of products such as rubber gloves, which can be thermally examined to locate abnormally warm or cool spots, indicating non-uniform thickness that may result in a quality defect. |
| Building Inspection |
Infrared imagers can detect missing insulation, electrical faults, water intrusion, pest infiltration, gauge energy efficiency, and help detect |
3
| the presence of moisture. Market segments include building diagnostics, energy auditing and home inspection, property and facility management, HVAC and plumbing, and moisture and restoration. This market has grown rapidly as costs have declined and new uses for thermal imaging systems have emerged. Building inspection represents the largest single Thermography market for us in 2009. |
| Gas Detection |
Specially designed infrared systems can detect and image hydrocarbon gas emissions or leaks. Using this technology, we have established a market focused on leak detection at gas production, transmission and storage locations, as well as compliance monitoring by environmental and other regulatory agencies. New applications are emerging for this technology. For example, we now have a system that detects sulfur hexafluoride, a dangerous pollutant and potential fire hazard used as an insulator in electrical transformers. During 2008, the United States Environmental Protection Agency (“EPA”) modified its rules to allow optical gas imaging systems such as ours to be used in place of toxic vapor analyzers for the detection of gas leaks under leak detection programs required by the EPA. |
| Emerging Markets |
Over the past seven years, we have successfully introduced progressively lower priced thermal imaging systems that have enabled us to expand traditional Thermography markets and open new markets for our products. These products, the latest of which is the i-family, have met with strong market acceptance in the lower-end building and electrical inspection markets, and we expect additional market segments for thermal imaging to develop as prices continue to decline. These market segments may include healthcare and screening, food service and distribution, veterinary science, automotive care, aircraft inspection, and maritime vessel inspections. |
| Training |
We offer fee-based training on the principles of thermography and the use of our products through ITC®, our Infrared Training Center, which provides comprehensive instruction, training, certification and applications engineering from several FLIR locations or at the customer’s site. We also license Infrared Training Centers to qualified third parties in certain countries. In 2009, nearly 11,000 people received training at our Infrared Training Centers worldwide. |
Commercial Vision Systems. Commercial Vision Systems is focused on commercial markets where the primary need is to see at night and in adverse conditions. While these markets are broad and growing rapidly, they exhibit low penetration of infrared technology and require distinct distribution channels. As in Thermography, price elasticity of demand is high, and as prices fall further, we expect sales volumes to continue to increase. CVS is focused on expanding its product line and building distribution channels. Significant markets for CVS products today include:
| Security and Surveillance |
Thermal imaging systems have been used for surveillance and perimeter security of government, military and industrial facilities for many years. Over the past few years, we have introduced a series of lower priced, purpose built systems targeted at the commercial security market and are actively expanding distribution in this market. |
4
| Our security products are now being used to protect critical infrastructure, ports, borders, commercial sites, and residential homes. Demand for security systems utilizing thermal imaging technology is growing rapidly across all segments. |
| Automotive Night Vision |
Since 2001, we have worked with Autoliv Electronics, a major supplier of safety equipment to the automotive industry, to offer a night vision system for passenger automobiles. Since late 2005, BMW has offered a night vision system utilizing our camera as an option in their 5-, 6-, and 7-Series automobiles. The system provides drivers with the ability to see at night and through obscurants, such as fog, at distances much further than can be seen with traditional headlights. In late 2008, the second generation of the BMW night vision system, which incorporates significant improvements, including a pedestrian warning system, was introduced on the 7-Series automobiles. In late 2009, both Audi and Rolls Royce introduced night vision systems utilizing this technology. Together with Autoliv, we expect to continue to expand the technology into new makes and models over the next several years. |
| Other Transportation Night Vision |
We are actively promoting our products in other transportation markets, such as trucks, trains, recreational vehicles and first responder vehicles, as well as aftermarket sales in the automotive market. These markets are in the early stages of adoption of infrared technology but we believe they offer significant future growth opportunities. |
| Marine |
In 2006, we introduced the first cost-effective infrared device specifically designed for recreational boating, cruise lines, commercial fishing and merchant marine vessels, ferries, and other maritime markets. Since then we have aggressively expanded distribution through a combination of direct sales and a network of dealers. In 2009, we launched a new line of maritime products that enhances the breadth of our product line. |
| Law Enforcement |
We are a leader in the supply of stabilized airborne thermal imaging systems for federal, state and local law enforcement agencies. Agencies with this type of equipment have the ability to track suspects, locate lost persons and provide situational awareness to officers on the ground. We also offer low cost, hand-held systems to the law enforcement market. These cameras provide a light weight, cost-effective, high performance tool for police officers and other law enforcement professionals to conduct search and rescue, surveillance, or pursuit missions. |
| OEM Markets |
We supply cooled and uncooled camera cores, sensors and readout integrated circuits on an OEM basis for a broad range of applications where customers require a product at a lower level of integration than a fully developed thermal imaging system. Examples of major customers in this segment are Mine Safety Appliances, Inc. (firefighting); Bullard (firefighting); Aerovironment, Inc. (unmanned aerial vehicles); Northrop Grumman Corporation (cooled cores for |
5
| military applications); Hologic (readout integrated circuits for digital X-ray); and various makers of security systems worldwide. |
Government Systems. Government Systems focuses on providing enhanced vision capabilities to a wide variety of military, paramilitary, law enforcement, public safety and other government customers. Our systems typically provide the capability to see over long distances, day or night, through adverse weather conditions and from a wide variety of vehicle, man portable and fixed installation platforms. Currently, the majority of our infrared imaging systems use cooled technology to identify objects from long distances; however, uncooled thermal imaging systems are growing rapidly in certain markets such as weapon sights, hand-held monoculars/binoculars, military vehicles and unmanned aerial vehicles. Many of our markets require systems that operate in demanding environments such as extreme climatic conditions, battlefield and military environments or maritime conditions. Systems are often installed onto larger platforms and must be able to integrate with such other systems as aircraft avionics, radars, laser systems and large, broad-based security networks.
Government Systems offers a very wide array of products across multiple markets. For airborne applications, we have developed highly stabilized platforms, known as gimbals, which typically contain multiple payloads in addition to the infrared imaging system, as well as sophisticated software and analytic capabilities. For land applications, we manufacture three types of products: hand-held products, platform mounted products and targeting products. Platform mounted units are typically housed in a weather-tight enclosure and feature remote control capabilities and multi-sensor integration capability (e.g., closed circuit TV, laser rangefinder, compass or global positioning system). Hand-held ground products are ruggedized and have optional lenses and target location capabilities. Ground-based targeting products are designed to attach to existing daylight sights to provide bore-sighted, nighttime capabilities. For maritime applications, we manufacture shipborne products which are similar to our airborne gimbals, but are inverted and customized for the marine environment.
The Government Systems market primarily consists of the following end-user market segments:
| Search and Rescue |
Thermal imaging systems are used in airborne and shipborne search and rescue missions to rescue individuals in danger or distress on boats or vehicles, or lost in adverse conditions. Such systems are in use today by organizations such as the United States Coast Guard, the United States Marine Corps, the United States Air National Guard and the United Kingdom Ministry of Defense. |
| Force Protection |
In instances where military or other personnel are deployed in hostile areas, thermal imaging systems mounted on towers or other platforms are deployed to identify and defeat potential threats at an early stage. Our systems are deployed for this purpose by the United States Army, United States Marine Corps and others worldwide. |
| Border and Maritime Patrol |
Thermal imaging systems are used in airborne, shipborne, hand-held and fixed installation applications for border and maritime surveillance, particularly at night, to enforce borders and coastal waters, to monitor national fishing boundaries and to prevent smuggling. Our cameras are currently deployed along numerous borders worldwide, including in the United States, Europe and the Middle East. |
| Surveillance and Reconnaissance |
Thermal imaging systems are used in surveillance and reconnaissance applications for the precise positioning of objects or people from substantial distances and for enhanced situational awareness, particularly at night or in conditions of reduced or obscured visibility. |
6
| These systems are installed on fixed platforms, manned mobile platforms, and unmanned aerial vehicles. |
| Targeting |
We offer several products that provide precise target location and designation capabilities in this application ranging from a clip-on rifle scope device to high-precision, stabilized, airborne laser designator systems. |
| Federal Drug Interdiction |
Thermal imaging systems enable government agencies to expand their drug interdiction and support activities by allowing greater surveillance and detection capabilities. Our systems are in use by the United States Customs Service, the United States Drug Enforcement Agency and the United States Federal Bureau of Investigation, as well as by international government agencies. |
Our Government Systems contracts and subcontracts are subject to certain risks related to doing business with the United States government and may be subject to termination, reduction and/or amendment at the election of the United States government. For a discussion of these risks, see sections “We depend on the United States government for a material portion of our business and changes in government spending could adversely affect our business” and “As a United States government contractor, we are subject to a number of procurement rules and regulations” in Item 1A “Risk Factors.”
Mergers and Acquisitions
Since 2003, we have made a total of eleven acquisitions. Most recently, we acquired Salvador Imaging, Inc. (“Salvador”) in June 2009, OmniTech Partners, Inc. (“OmniTech”) in October 2009, and Directed Perception, Inc. (“Directed Perception”) in December 2009. The Salvador acquisition expands our capabilities to include low-light electron multiplying charge coupled device cameras which can be integrated into many of our multi-sensor systems for government applications, and has significant potential for stand-alone applications. The OmniTech acquisition adds image intensified capability to our product line, and creates the opportunity to leverage our capabilities to expand in the growing market for fused image intensified/thermal imagers. The Directed Perception acquisition enhances and differentiates our pan-tilt-zoom camera systems for both commercial and military markets through lower cost, improved functionality, and ease-of-use.
We are selective in our acquisition strategy, seeking to make acquisitions that are strategically important and generally add to our technology, distribution network or product portfolio. We are continuously evaluating opportunities for additional acquisitions, but cannot predict the timing, size or nature of any future activity.
Technology and Core Competencies
We use our expertise in product design, infrared imagers, optics, lasers, image processing, systems integration and other technologies, to develop and produce sophisticated thermal and multi-sensor imaging systems. We integrate the following capabilities and disciplines into our manufacturing processes:
| System Design and Integration |
We have developed extensive competencies in the design and integration of numerous capabilities and payloads into integrated systems or sub-systems. Competencies such as stabilization, packaging and systems integration allow us to effectively combine a wide variety of technologies and payloads to design and manufacture complex systems to suit our customers’ needs. |
7
| Radiometry |
Our ability to produce thermal imaging systems that can accurately measure temperature is critical in many of our Thermography markets. We have demonstrated know-how in designing and producing systems that can measure temperature to within very precise tolerances while maintaining accuracy and stability over time and over a wide range of ambient temperatures. We believe our skills in this area, known as radiometry, offer an important competitive advantage over many of our competitors. |
| Mechanical Engineering |
Our design and production of thermal imaging systems involves highly sophisticated mechanical engineering techniques, particularly in the design and assembly of the supporting structures for system components such as detector arrays, coolers, scanners and optics. We also have expertise in designing stabilized assemblies used in our gimbal mounted products utilizing electro-mechanical control, gyroscopes and electronic stabilization, and specialized control mechanisms. |
| Infrared Detector Design and Manufacturing |
We design and manufacture both cooled and uncooled infrared detector arrays, in high volumes and at low cost. We believe our uncooled vanadium oxide microbolometers and cooled detectors using indium antimonide and indium gallium arsenide are among the highest performing infrared detectors of their type available in the world. Internal design and manufacturing of detectors provides significant cost and engineering advantages compared with the use of third-party detectors. |
| Integrated Circuits and Electronic Design |
We have significant electronic design capabilities across several specialized areas, including readout integrated circuit design, signal processing, image processing and electronics integration. Our design expertise lies in the areas of reliability, low power consumption and extreme environmental survivability. |
| Software Development |
Software is an increasingly important aspect of our overall engineering and design activity. We offer networking capability, video analytics and other software and middleware inside many of our camera systems, and such applications are growing in importance. Our systems are also able to interface with many standard external software protocols. |
| Motion Control Systems |
Our recent acquisition of Directed Perception added significantly to our motion control system design and manufacturing capabilities. In addition to highly accurate stabilized gimbaled systems for airborne and other applications, we also offer a line of high precision, repeatable pan and tilt systems for use with a wide variety of payloads. |
| Optical Design, Fabrication and Coating |
We design and manufacture sophisticated infrared optics using materials such as silicon and germanium that are required to produce a thermal imaging system. This capability allows us to rapidly develop optics optimized for use with our cameras and avoid costs and delays associated with reliance on third-party optics suppliers. |
8
| We also have the ability to apply custom vapor deposited coatings to improve the transmission of the unique lens materials that are used in infrared systems. |
| Micro-Coolers |
We manufacture the industry’s smallest, lightest and lowest power micro-coolers for use in cooling infrared detectors. Our coolers are especially effective in hand-held applications, where light weight and long battery life are essential. |
| Lasers and Laser Components |
Many of our more sophisticated systems are increasingly being offered with various types of laser payloads, including pointers, illuminators, rangefinders and designators. We design and manufacture purpose-built laser rangefinders and designators for inclusion in some of our gimbaled systems. We also manufacture certain laser-related components for customers. |
Internally funded research and development expenses were $91.3 million in 2009, $90.0 million in 2008 and $72.5 million in 2007. We anticipate that we will continue to have significant internal research and development expenses in the future to provide a continuing flow of innovative and high quality products to maintain and enhance our competitive position in each of our business segments.
Proprietary Rights
We have numerous patents, trademarks, trade secrets and other intellectual property that are important for our success. We rely on a combination of patent, trademark and trade secret laws, confidentiality agreements and contractual provisions to protect our proprietary rights. Our intellectual property provides important competitive advantages, and we are increasing our efforts to document and protect our intellectual property from misappropriation. We cannot, however, be certain or give any assurance that we can maintain our competitive advantage in the thermal imaging industry or that competitors will not develop similar or superior capabilities.
Customers
The primary customers for our products vary substantially by division. Typical Thermography customers include research and development facilities, universities, industrial companies, utility companies, building inspectors, electrical contractors, thermography consultants, damage restoration contractors and numerous commercial enterprises. Commercial Vision Systems serves customers such as OEMs, automotive suppliers, aircraft manufacturers and dealers, marine electronics dealers, major integrators of security systems and news gathering agencies. Government Systems customers generally consist of United States and international government agencies, including military, paramilitary and police forces, as well as defense contractors and aircraft manufacturers. Our customers in each segment are located around the world and are serviced by a global distribution and service organization.
A substantial portion of our revenue is derived from sales to United States and international government agencies and our business will continue to be substantially dependent upon such sales. Aggregate sales to United States government agencies accounted for 43 percent of our revenue in 2009, 41 percent in 2008 and 39 percent in 2007.
Sales to customers outside the United States accounted for 41 percent of our revenue in 2009, 38 percent in 2008 and 39 percent in 2007. We expect revenue outside the United States to continue to account for a significant portion of our total revenue. Further information about geographic operations and customers appears in Note 17 to the Consolidated Financial Statements in Item 8.
9
Sales and Distribution
We believe our sales and distribution organization is among the largest in the industry and effectively covers the world with a combination of direct sales, independent representatives and distributors, dealers, application engineers, and service and training centers. Our sales personnel, including third-party distributors, undergo a comprehensive training program on each product’s technical specifications, functions and applications. We also continuously update our training programs to incorporate technological and competitive shifts and changes. We sell in many distinct markets and have established specific sales channels for each market.
We sell our Thermography products worldwide through a direct sales staff and a network of distributors and representatives. Our Thermography business continues to expand distribution, particularly in Asia and Latin America. At the end of 2009, our Thermography division employed over 190 direct sales personnel and utilized approximately 500 distributors. In November 2007, we acquired Extech Instruments Corporation, a distributor of hand-held test equipment. We are utilizing its distribution channels, particularly into catalogs and retailers to expand our distribution in the United States. In January 2008, we acquired Cedip Infrared Systems (“Cedip”) which has provided additional distribution capability, particularly in international markets.
Commercial Vision Systems is also actively expanding its distribution network by hiring additional direct sales personnel and expanding third-party distribution networks in specific markets. At the end of 2009, our Commercial Vision Systems sales organization employed approximately 70 direct sales personnel as well as a worldwide network of dealers across many distinct markets. In certain markets, CVS has chosen to supply camera cores on an OEM basis to companies with well established distribution networks. Examples include firefighting, where we supply cores to Mine Safety Appliances, Inc. and Bullard, and automotive, where we are partnered with Autoliv Electronics.
Our Government Systems business has a direct sales staff of approximately 80 individuals and a network of independent representatives and distributors covering major government markets worldwide. Included in this total are technical and customer support staff in the United States and Europe who provide application development, technical training and operational assistance to direct and indirect sales personnel as well as to customers.
Marketing
With our further expansion into the low cost segment of the commercial markets, we have developed greater competencies in market research, electronic marketing, marketing communications and business development. Our ability to identify new markets, adapt our product solutions to meet unique market needs, quickly develop marketing communications that highlight these unique features, and leverage existing and new distribution channels to develop incremental business are important aspects of our marketing and communications efforts.
We focus our product marketing activities on internet promotion, advertising, direct mail, press tours, technical articles for publications and participation in most major trade shows in our industry. These activities give us the opportunity to educate potential customers about the key features and attributes of our products and how they may be used to address specific customer needs.
Customer Service
We maintain service facilities at most of our facilities worldwide. Each of our service facilities has the capability to perform the complex calibrations required to service thermal imaging systems. We also maintain field service capabilities under the direction of our independent representatives or distributors in five locations outside the United States.
10
Manufacturing
We manufacture many of the critical components for our products, including infrared detectors, gimbals, pan-tilts, optics and coatings, laser sub-systems and micro-coolers, and develop much of the necessary software and middleware for our systems. This vertical integration minimizes lead times, facilitates prompt delivery of our products, controls costs and ensures that these components satisfy our quality standards. We purchase other parts pre-assembled, including certain detectors, certain coolers and optics, circuit boards, cables and wire harnesses. These purchased and manufactured components are then assembled into finished systems and tested at one of our primary production facilities located in Wilsonville, Oregon; North Billerica, Massachusetts; Goleta, California; Danderyd, Sweden; Croissy-Beaubourg, France; Tallinn, Estonia; Bozeman, Montana; Colorado Springs, Colorado; Freeport, Pennsylvania; and Burlingame, California.
Our manufacturing operations are, from time to time, audited by certain OEM customers, which include several major aircraft manufacturers, and have been certified as meeting their quality standards. Our facilities in Wilsonville, North Billerica, Goleta, Danderyd, Croissy-Beaubourg, Tallinn, Bozeman and West Malling, UK are ISO 9001:2000 certified. Our facilities in Colorado Springs and Freeport are ISO 9001:2008 certified.
Backlog
At December 31, 2009 and 2008, we had a total order backlog of $563 million and $663 million, respectively. Government Systems typically has the highest backlog of our divisions relative to revenue and in absolute terms. At December 31, 2009, Government Systems backlog totaled $433 million, compared with $552 million at December 31, 2008. The decline in Government Systems backlog is primarily due to significant deliveries in 2009 on the United States Army and Marine Corps BETTS-C program. Commercial Vision Systems carries backlog in certain markets, but is less backlog dependent than Government Systems. Commercial Vision Systems backlog at year end 2009 was $103 million, compared with $91 million a year earlier. Thermography is our least backlog intensive business, and typically ships products within a few weeks of receipt of orders. At December 31, 2009, Thermography backlog was $27 million, compared with $20 million a year earlier. Backlog is defined as orders received for products or services for which a sales agreement is in place and delivery is expected within twelve months.
Competition
Competition in the market for thermal imaging equipment is significant. We believe that the principal competitive factors in our market are product performance, price, customer service and training, product reputation, and effective marketing and sales efforts. Our competitors are different in each market segment. In the Thermography market, principal competitors include Fluke (a division of Danaher Corporation) and NEC San-Ei. Competitors in Commercial Vision Systems vary market by market, but include L-3 Communications, ULIS, Axsys Technologies (a General Dynamics company) and numerous smaller companies. In the Government Systems market, our competitors include Raytheon Corporation, BAE Systems, L-3 Communications, DRS Corporation (a Finmecanica Company), Lockheed Martin Corporation, El-Op, Sagem, Tamam and Thales. Many of these competitors have substantially greater financial, technical and marketing resources than we do.
Employees
As of December 31, 2009, we had 2,079 employees of which 1,360 were located in the United States and 719 were located outside of the United States. We have generally been successful in attracting highly skilled technical, marketing and management personnel. None of our employees in the United States is represented by a union or other bargaining group. Certain employees in Sweden are represented by unions whose contracts are subject to periodic renegotiations. We believe our relationships with our employees and unions are good.
11
Available Information
Our internet website address is www.flir.com. This Report, Quarterly Reports on Form 10-Q, Current Reports on Form 8-K and amendments to those reports filed or furnished pursuant to Section 13 or 15(d) of the Securities Exchange Act of 1934 and other required filings are available through our internet website as soon as reasonably practicable after we electronically file such material with, or furnish it to, the Securities and Exchange Commission. Our internet website and the information contained therein or connected thereto are not intended to be incorporated into this Report.
| ITEM 1A. | RISK FACTORS |
The following are important factors that could cause actual results or events to differ materially from those contained in any forward-looking statements made by or on behalf of the Company. In addition, the risks and uncertainties described below are not the only ones we face. Unforeseen risks could arise and problems or issues that we now view as minor could become more significant. If we are unable to adequately respond to these risks and uncertainties, our business, financial condition and results of operations could be materially adversely affected. Additionally, we cannot be certain or give any assurance that any actions taken to reduce known risks and uncertainties will be effective.
General economic conditions may adversely affect our business, operating results and financial condition
Our operations and performance depend significantly on worldwide economic conditions and their impact on levels of capital investment and consumer spending and the recent worldwide recession has negatively impacted demand in many of our markets. These markets may remain weak, or be subject to further deterioration. Economic factors that could adversely influence demand for the Company’s products include continued uncertainty about current global economic conditions leading to reduced levels of investment, changes in government spending priorities, the size and availability of government budgets, customers’ and suppliers’ access to credit, consumer confidence and other macroeconomic factors affecting government, industrial or consumer spending behavior.
Our primary markets are volatile and unpredictable
Our business depends on the demand for our thermal imaging systems in a variety of commercial, industrial and government markets. In the past, the demand for our products in these markets has fluctuated due to a variety of factors, some of which are beyond our control, including:
| • | the timing, number and size of orders from, and shipments to, our customers, as well as the relative mix of those orders; |
| • | variations in the volume of orders for a particular product or product line in a particular quarter; |
| • | the size and timing of new contract awards; |
| • | the timing of the release of government funds for procurement of our products; and |
| • | the timing of orders and shipments within a given fiscal quarter. |
Seasonal fluctuations in our operating results, particularly the increase in sales we generally experience in the fourth quarter, result from:
| • | the seasonal pattern of contracting by the United States government and certain foreign governments; |
| • | the frequent requirement of international customers to take delivery of equipment prior to January due to funding considerations; and |
| • | the tendency of commercial enterprises to fully utilize annual capital budgets prior to expiration. |
12
We depend on the United States government for a material portion of our business and changes in government spending could adversely affect our business
We derive significant revenue from contracts or subcontracts with United States government agencies. A significant reduction in the purchase of our products by these agencies would have an adverse effect on our business. For the fiscal years ended December 31, 2009, 2008 and 2007, approximately 43 percent, 41 percent and 39 percent, respectively, of our revenues were derived directly or indirectly from contracts with the United States government and its agencies. Recently, a higher percentage of our contracts have been larger Indefinite Delivery, Indefinite Quantity (“IDIQ”) contracts. The funding of contracts awarded to us depends on the overall United States government budget and appropriation process, which is beyond our control. In addition, at its discretion, the United States government may change its spending priorities and/or terminate, reduce or modify contracts.
As a United States government contractor, we are subject to a number of procurement rules and regulations
Government contractors must comply with specific procurement regulations and other requirements and are subject to routine audits and investigations by United States government agencies. If we fail to comply with these rules and regulations, the results could include: reductions in the value of contracts; contract modifications or termination; the assessment of penalties and fines; and/or suspension or debarment from government contracting or subcontracting for a period of time or permanently.
Our future success will depend on our ability to respond to the rapid technological change in the markets in which we compete, our ability to introduce new or enhanced products and enter into new markets
The markets in which we compete, including the thermal imaging industry, are characterized by rapid technological developments and frequent new product introductions, enhancements and modifications. Our ability to develop new products and technologies that anticipate changing customer requirements, reduce costs and otherwise retain or enhance our competitive position in existing and new markets will be an important factor in our future results from operations. We will continue to make substantial capital expenditures and incur significant research and development costs to improve our manufacturing capability, reduce costs, and develop and introduce new products and enhancements. If we fail to develop and introduce new products and technologies in a timely manner, our business, financial condition and results of operations would be adversely affected. In addition, we cannot be certain that our new products and technologies will be successful or that customers will accept any of our new products.
We must successfully manage an increasingly complex global organization
As the Company has grown, the size and scope of the Company’s worldwide operations have also increased substantially. Worldwide operations have grown to accommodate the design, manufacture and marketing of numerous product lines across all of our divisions in a vertically integrated manufacturing environment. Significant management time and effort is required to effectively manage the increased complexity of the business. In December 2009, we announced a reorganization whereby we would consolidate the Thermography Division and the Commercial Systems Division into one division, called Commercial Systems, effective January 1, 2010. Our failure to successfully manage the global operations and integration of the two divisions could have a material adverse effect on our business, financial condition and results of operations. In addition, we manufacture our products at various facilities as described in Item 2. Our inability to continue to manufacture our products at one or more of our facilities as a result of, for example, a prolonged power outage, earthquake, fire or other natural disaster, or labor or political unrest, could prevent us from supplying products to our customers and could have a material adverse effect on our business, financial condition and results of operations.
We face risks from international sales and business activities
We market and sell our products worldwide and international sales have accounted for, and are expected to continue to account for, a significant portion of our revenue. For the years ended December 31, 2009, 2008 and
13
2007, international sales accounted for 41 percent, 38 percent and 39 percent, respectively, of our total revenue. We also manufacture certain products and subassemblies in Europe. Our international business activities are subject to a number of risks, including:
| • | the imposition of and changes to governmental controls; |
| • | restrictions on the export of critical technology; |
| • | trade restrictions; |
| • | difficulty in collecting receivables; |
| • | inadequate protection of intellectual property; |
| • | labor union activities; |
| • | changes in tariffs and taxes; |
| • | restriction on the importation and exportation of goods and services; |
| • | compliance with anti-bribery and anti-corruption laws; |
| • | difficulties in staffing and managing international operations; and |
| • | political and economic instability. |
No assurance can be given that these factors will not have a material adverse effect on our future international sales and operations and, consequently, on our business, financial condition and results of operations.
Operating margins may be negatively impacted by a downturn in sales
Our expense levels are based, in part, on our expectations regarding future sales and these expenses are largely fixed in the short term. Some expenses, such as those related to research and development activities, would likely be maintained in the event of a sales downturn in order to maintain and enhance the long-term competitiveness of the Company. In addition, to enable us to promptly fill orders, we maintain inventories of finished goods, components and raw materials. As a result, we commit to considerable costs in advance of anticipated sales. Accordingly, we may not be able to reduce our costs in a timely manner to compensate for any unexpected shortfall between forecasted and actual sales. Any significant shortfall of sales may result in us carrying higher levels of inventories of finished goods, components and raw materials thereby increasing our risk of inventory obsolescence and corresponding inventory write-downs and write-offs.
Competition in our markets is intense and our failure to compete effectively could adversely affect our business
Competition in the markets for our products is intense. The speed with which companies can identify new applications for thermal imaging, develop products to meet those needs and supply commercial quantities at low prices to the market are important competitive factors. We believe the principal competitive factors in our markets are product performance, price, customer service and training, product reputation, and effective marketing and sales efforts. Many of our competitors have greater financial, technical, research and development, and marketing resources than we do. All of these factors, as well as the potential for increased competition from new competitors, require us to continue to invest in, and focus on, research and development and new product innovation. No assurance can be given that we will be able to compete effectively in the future and a failure to do so could have a material adverse effect on our business, financial condition and results of operations.
14
Dependence on sole source and limited source suppliers of components for our products exposes us to risks that could result in delays in satisfying customer demand, increased costs and loss of revenue
We currently rely on a number of sole source and limited source suppliers to provide certain key components for our products. We have increased our internal sources of supply for certain critical components, in particular, cooled and uncooled infrared detectors, optics and optical coatings, and laser components, but we rely on sole or limited source third-party suppliers for other key components including laser rangefinders, certain machined parts, optics, motors and electronic components. Many of these suppliers are small and we are often one of their most important customers. Our business, financial condition and results of operations could be materially and adversely affected in the event that we are unable to source certain of these components on a timely basis or if such components are defective or they do not otherwise meet our performance standards.
Based on past experience, we expect to occasionally receive late deliveries or to experience inadequate supplies of certain components. If critical components provided by any significant supplier become unavailable, our manufacturing operations could be disrupted. Unless we have sufficient lead-time and are otherwise able to identify and qualify acceptable replacement components or redesign our products with different components, we might not be able to obtain necessary components on a timely basis or at acceptable prices. Any extended interruption in the supply of sole or limited source components could have a material adverse effect on our business, financial condition and results of operations.
Our future success depends in part on attracting and retaining key senior management and qualified technical, sales and other personnel
Our future success depends in part on the efforts and continued services of our key executives and our ability to attract and retain qualified technical, sales and other personnel. Significant competition exists for such personnel and we cannot assure the retention of our key executives, technical and sales personnel or our ability to attract, integrate and retain other such personnel that may be required in the future. We cannot assure that employees will not leave and subsequently compete against us. If we are unable to attract and retain key personnel, our business, financial condition and results of operations could be adversely affected.
We may be unable to successfully integrate recent or future acquisitions into our operations, thereby disrupting our business and harming our financial condition and results of operations
We have made several acquisitions of various sizes during our history, including eleven in the past seven years. Our most recent acquisitions include Salvador, OmniTech, and Directed Perception in 2009. The integration of businesses, personnel, product lines and technologies can be difficult, time consuming and subject to significant risks. For example, we could lose key personnel from companies that we acquire, incur unanticipated costs, lose major sources of revenue, fail to integrate critical technologies, suffer business disruptions, fail to capture anticipated synergies, fail to establish satisfactory internal controls, or incur unanticipated liabilities. Any of these difficulties could disrupt our ongoing business, distract our management and employees, increase our expenses and decrease our revenue.
We frequently evaluate strategic opportunities available to us and it is likely that we will make additional acquisitions in the future. Such acquisitions may vary in size and complexity. Any future acquisitions are subject to the risks described above. Furthermore, we might assume or incur additional debt or issue additional equity securities to pay for future acquisitions. Additional debt may negatively impact our results and increase our financial risk, and the issuance of any additional equity securities could dilute our then existing shareholders’ ownership. No assurance can be given that we will realize anticipated benefits of any future acquisitions, or that any such acquisition or investment will not have a material adverse effect on our business, financial condition and results of operations.
15
We may experience impairment in the value of our tangible and intangible assets
Our industry is subject to rapid changes in technology, which may result in unexpected obsolescence or impairment of our assets. As of December 31, 2009, our intangible assets, including goodwill, totaled $321.5 million and represented 22 percent of our total assets. Most of these intangibles are the result of acquisitions in which the purchase price exceeded the value of the tangible assets acquired. We amortize certain of these intangibles over their anticipated useful life and review goodwill for impairment annually or more frequently if warranted by events. To date we have not experienced any impairment of our intangible assets, but there can be no assurance that we will not experience such impairment in the future. In addition, certain of our tangible assets such as inventory and machinery and equipment may experience impairment in their value as a result of such events as the introduction of new products, changes in technology or changes in customer demand patterns. We depreciate our machinery and equipment at levels we believe are adequate; however, there can be no assurance that there will not be a future impairment that may have a material impact on our business, financial condition and results of operations.
We are exposed to worldwide financial markets
Financial markets are volatile. Changes in the availability of credit and the perceived and actual market risk of financial instruments can have numerous potential adverse effects, including the inability of customers to obtain credit to finance purchases of our products, the insolvency of customers resulting in reduced sales and bad debts, and the insolvency of key suppliers resulting in product development and production delays. We invest our cash and cash equivalents in instruments that may be exposed to credit and market risk, including default, the failure of financial institutions and market illiquidity.
We face risks from currency fluctuations
Historically, currency fluctuations have affected our operating results. Changes in the value of foreign currencies in which our sales or costs incurred are denominated have in the past caused, and could in the future cause, fluctuations in our operating results. We seek to reduce our exposure to currency fluctuations by denominating, where possible, our international sales in United States dollars, and by undertaking limited hedging of forecasted currency exposures. With respect to international sales denominated in United States dollars, a decrease in the value of foreign currencies relative to the United States dollar could make our products less price competitive.
Our inability to protect our intellectual property and proprietary rights and avoid infringing the rights of others could harm our competitive position and our business
Our ability to compete successfully and achieve future revenue growth depends, in part, on our ability to protect our proprietary technology and operate without infringing the rights of others. To accomplish this, we rely on a combination of patent, trademark, copyright and trade secret laws, confidentiality agreements and contractual provisions to protect our proprietary rights. Many of our proprietary rights are held in confidence as trade secrets and are not covered by patents, making them more difficult to protect. Although we currently hold United States patents covering certain aspects of our technologies and products, and we are actively pursuing additional patents, we cannot be certain that we will obtain additional patents or trademarks on our technology, products and trade names. Furthermore, we cannot be certain that our patents or trademarks will not be challenged or circumvented by our competitors or that measures taken by us to protect our proprietary rights will adequately deter their misappropriation or disclosure. Any failure by us to meaningfully protect our intellectual property could have a material adverse effect on our business, financial condition and results of operations. Moreover, because intellectual property does not necessarily prevent our competitors from entering the thermal imaging industry, there can be no assurance that we will be able to maintain our competitive advantage or that our competitors will not develop capabilities equal or superior to ours.
16
Litigation over patents and other intellectual property is common in our industry. We have been the subject of patent and other intellectual property litigation in the past and cannot be sure that we will not be subject to such litigation in the future. Similarly, there exists the possibility we will assert claims in litigation to protect our intellectual property. Lawsuits defending or prosecuting intellectual property claims and related legal and administrative proceedings could result in substantial expense to us and significant diversion of effort of our personnel. An adverse determination in a patent suit or in any other proceeding in which we are a party could subject us to significant liabilities, result in the loss of intellectual property rights we claim or impact our competitive position. Additionally, an adverse determination could require us to seek licenses from third parties. If such licenses are not available on commercially reasonable terms or at all, our business, financial condition and results of operations could be adversely affected.
We may not be successful in obtaining the necessary export licenses to conduct operations abroad and the United States government may prevent proposed sales to foreign governments
Export licenses are required from United States government agencies under the Export Administration Act, the Trading with the Enemy Act of 1917 and the Arms Export Control Act of 1976 for export of many of our products. We can give no assurance that we will be successful in obtaining these licenses. Recently, heightened government scrutiny of export licenses for products in our markets has resulted in lengthened review periods for our license applications. Failure to obtain or delays in obtaining these licenses would prevent or delay us from selling our products outside the United States and could have a material adverse effect on our business, financial condition and results of operations.
Our products may suffer from defects or errors leading to substantial damage or warranty claims
We include complex system designs and components in our products that may contain errors or defects, particularly when we incorporate new technology into our products or release new versions. If any of our products are defective, we might be required to redesign or recall those products or pay substantial damages or warranty claims. Such an event could result in significant expenses including expenses arising from product liability and warranty claims, disrupt sales and affect our reputation and that of our products, which could have a material adverse effect on our business, financial condition and results of operations. We maintain product liability insurance but cannot be certain that it is adequate or will remain available on acceptable terms.
We have indebtedness as a result of the sale of our convertible notes and are subject to certain restrictive covenants under our credit facility which may limit our operational and financial flexibility
In June 2003, we issued $210 million of 3.0 percent senior convertible notes due in 2023 in a private offering pursuant to Rule 144A under the Securities Act of 1933, as amended, of which as of December 31, 2009, approximately $58.8 million aggregate principal amount of convertible notes were outstanding.
Additionally, we have a $300 million revolving credit agreement. The credit agreement contains financial covenants that require the maintenance of certain leverage ratios, in addition to minimum levels of EBITDA and consolidated net worth, a maximum level of capital expenditures and, commencing December 31, 2009, a minimum level of liquidity comprised of cash and undrawn/unutilized availability under the credit agreement. The credit agreement is collateralized by substantially all assets of the Company. As of December 31, 2009, there were no amounts borrowed and outstanding under the credit agreement. The credit agreement expires on October 6, 2011.
Our ability to meet our debt service obligations and comply with the financial covenants under our credit facility will be dependent upon our future performance, which will be subject to financial, business and other factors affecting our operations, many of which are beyond our control. Our inability to comply with the required financial covenants could result in a default under the credit agreement. In the event of any such default, the lenders under our credit facility could elect to declare all outstanding debt, accrued interest and fees under the
17
facility to be due and immediately payable. If we are unable to repay any of this debt when due, the lenders under our credit facility could foreclose on our assets pledged to them as security.
Changes in our effective income tax rate may have an adverse effect on our results of operations
Our future effective tax rate may be adversely affected by a number of factors including:
| • | the jurisdictions in which profits are determined to be earned and taxed; |
| • | the resolution of issues arising from tax audits with various tax authorities; |
| • | changes in the valuation of our deferred tax assets and liabilities; |
| • | adjustments to estimated taxes upon finalization of various tax returns; |
| • | increases in expenses not deductible for tax purposes; |
| • | changes in available tax credits; |
| • | changes in share-based compensation expense; |
| • | changes in tax laws or the interpretation of such tax laws and changes in generally accepted accounting principles; and/or |
| • | the repatriation of earnings from outside the United States for which we have not previously provided for United States taxes. |
Any significant increase in our future effective tax rates could adversely impact net income for future periods. In addition, the United States Internal Revenue Service (“IRS”) and other tax authorities regularly examine our income tax returns. Our financial condition and results of operations could be adversely impacted if any assessments resulting from the examination of our income tax returns by the IRS or other taxing authorities are not resolved in our favor.
Oregon law and our charter documents contain provisions that could discourage or prevent a potential takeover, even if the transaction would benefit our shareholders
Other companies may seek to acquire or merge with us. An acquisition or merger of our Company could result in benefits to our shareholders, including an increase in the value of our common stock. Some provisions of our Articles of Incorporation and Bylaws, including our ability to issue preferred stock without further action by our shareholders, as well as provisions of Oregon law, may discourage, delay or prevent a merger or acquisition that a shareholder may consider favorable.
| ITEM 1B. | UNRESOLVED STAFF COMMENTS |
None.
18
| ITEM 2. | PROPERTIES |
We maintain our corporate headquarters in Wilsonville, Oregon. The location, approximate size and type of facility of our principal properties are as follows:
| Location |
Square Feet |
Type of Facility | ||
| Wilsonville (Portland), Oregon(1) |
154,000 | Corporate headquarters, manufacturing, sales and service | ||
| Danderyd (Stockholm), Sweden(2) |
165,000 | Manufacturing, sales and service | ||
| North Billerica (Boston), Massachusetts(1) |
133,000 | Manufacturing, sales and service | ||
| Goleta (Santa Barbara), California(2) |
137,000 | Manufacturing, sales and service | ||
| Orlando, Florida (1) |
82,000 | Research and development | ||
| Bozeman, Montana(2) |
32,000 | Manufacturing and sales | ||
| Waltham (Boston), Massachusetts(2) |
26,000 | Sales and distribution | ||
| Freeport, Pennsylvania(2) |
16,000 | Manufacturing, sales and service | ||
| West Malling (London), United Kingdom(2) |
15,000 | Sales and service | ||
| Tallinn, Estonia(2) |
15,000 | Manufacturing | ||
| Croissy-Beaubourg (Paris), France(2) |
14,000 | Manufacturing, sales and service | ||
| Colorado Springs, Colorado(2) |
14,000 | Manufacturing, sales and service |
| (1) | Owned property |
| (2) | Leased property |
The owned properties in Wilsonville and Orlando, and the leased facilities in Bozeman are used by the Government Systems business. The leased facilities in Waltham, Tallinn and Croissy-Beaubourg are locations for the Thermography business. The leased facilities in Goleta are used by the Commercial Vision Systems business. The leased facilities in Danderyd and West Malling and the owned property in North Billerica are used jointly by both the Thermography and Government Systems businesses.
Additionally, the Thermography business has leased sales and service facilities in Antwerp, Belgium; Frankfurt, Germany; Toronto, Canada; Paris, France; Milan, Italy; Hong Kong; Shanghai, China; Tokyo, Japan; Seoul, South Korea; and Melbourne, Australia; and owns a sales and service facility in Sao Paulo, Brazil. The Government Systems business has a leased sales and service office in Dubai, United Arab Emirates. The Commercial Vision Systems business owns a sales office in Breda, Netherlands, and leases an engineering office in Madrid, Spain, and a manufacturing, sales and service facility in Burlingame, California.
We believe our properties are suitable for their intended use, adequate for our business needs and in good condition.
19
| ITEM 3. | LEGAL PROCEEDINGS |
The Company and its subsidiary, Indigo Systems Corporation (now known as FLIR Commercial Systems, Inc.) (together, the “FLIR Parties”), were named in a lawsuit filed by Raytheon Company on March 2, 2007, in the United States District Court for the Eastern District of Texas. On August 11, 2008, Raytheon Company was granted leave to file a second amended complaint. The complaint, as amended, asserted claims for tortious interference, patent infringement, trade secret misappropriation, unfair competition, breach of contract and fraudulent concealment. The FLIR Parties filed an answer to the second amended complaint and counterclaims on September 2, 2008, in which they denied all material allegations. On August 31, 2009, the court entered an order granting the FLIR Parties’ motion for summary judgment on Raytheon’s trade secret misappropriation claim based on the FLIR Parties’ statute of limitations defense. Raytheon has abandoned all of its other claims except its patent claims which are currently set for trial to commence on April 19, 2010. The Company intends to vigorously defend itself in this matter and is unable to estimate the amount or range of potential loss, if any, which might result if the outcome in this matter is unfavorable.
We are also subject to other legal proceedings, claims and litigation arising in the ordinary course of business. We make a provision for a liability when it is both probable that a liability has been incurred and the amount of loss can be reasonably estimated. We believe we have recorded adequate provisions for any probable and estimable losses. While the outcome of such matters is currently not determinable, we do not expect that the ultimate costs to resolve these matters will have a material adverse effect on our financial position, results of operations or cash flows.
| ITEM 4. | SUBMISSION OF MATTERS TO A VOTE OF SECURITY HOLDERS |
No matters were submitted to a vote of security holders during the quarter ended December 31, 2009.
20
PART II
| ITEM 5. | MARKET FOR REGISTRANT’S COMMON EQUITY, RELATED STOCKHOLDER MATTERS AND ISSUER PURCHASES OF EQUITY SECURITIES |
The common stock of the Company has been traded on the NASDAQ Global Market since June 22, 1993, under the symbol “FLIR.” The following table sets forth, for the quarters indicated, the high and low closing sales price for our common stock as reported on the NASDAQ Global Select Market, a segment of the NASDAQ Global Market.
| 2009 | 2008 | |||||||||||
| High | Low | High | Low | |||||||||
| First Quarter |
$ | 31.76 | $ | 18.87 | $ | 33.15 | $ | 23.69 | ||||
| Second Quarter |
26.55 | 20.70 | 41.38 | 28.72 | ||||||||
| Third Quarter |
28.64 | 20.71 | 45.10 | 33.29 | ||||||||
| Fourth Quarter |
33.19 | 26.73 | 39.21 | 24.63 | ||||||||
At December 31, 2009, there were approximately 135 holders of record of our common stock and 152,826,045 shares outstanding. We have never paid cash dividends on our common stock. We intend to retain earnings for use in our business and, therefore, do not anticipate paying cash dividends in the foreseeable future.
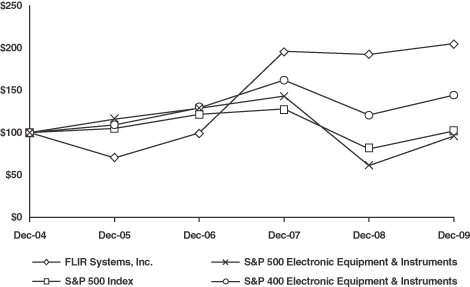
The graph below shows a comparison of the five-year cumulative total shareholder return for the Company’s common stock with the cumulative total returns on the Standard & Poor’s (“S&P”) 500 Index, the S&P 400 Electronic Equipment & Instruments Index and the S&P 500 Electronic Equipment & Instruments Index for the same five-year period. The data used for this graph assumes that $100 was invested in the Company and in each index on December 31, 2004, and that all dividends were reinvested.
21
The stock performance graph was plotted using the following data:
| Dec 04 | Dec 05 | Dec 06 | Dec 07 | Dec 08 | Dec 09 | |||||||||||||
| FLIR Systems, Inc. |
$ | 100.00 | $ | 70.01 | $ | 99.80 | $ | 196.27 | $ | 192.38 | $ | 205.24 | ||||||
| S&P 500 Index |
100.00 | 104.91 | 121.48 | 128.16 | 80.74 | 102.11 | ||||||||||||
| S&P 400 Electronic Equipment & Instruments Index |
100.00 | 109.24 | 129.20 | 162.26 | 120.83 | 144.39 | ||||||||||||
| S&P 500 Electronic Equipment & Instruments Index |
100.00 | 116.03 | 128.75 | 143.38 | 61.00 | 96.09 | ||||||||||||
During 2009, the Company was moved from the S&P 400 Electronic Equipment & Instruments Index to the S&P 500 Electronic Equipment & Instruments Index. In accordance with Securities and Exchange Commission rules, the Company is showing in the above graph the performance of both these indices.
The Company has also been included in the NASDAQ-100 Index since 2008.
The following table summarizes our 2009 common stock repurchases:
| Period |
Total Number of Shares Purchased(1) |
Average Price Paid per Share |
Total Number of Shares Purchased as Part of Publicly Announced Plans or Programs |
Maximum Number of Shares that May Yet Be Purchased at December 31, 2009 Under the Plans or Programs | |||||
| March 1 to March 31, 2009 |
1,000,000 | $ | 21.16 | 1,000,000 | |||||
| May 1 to May 31, 2009 |
1,000,000 | 25.55 | 1,000,000 | ||||||
| June 1 to June 30, 2009 |
111,700 | 22.41 | 111,700 | ||||||
| September 1 to September 30, 2009 |
1,120,000 | 21.40 | 1,120,000 | ||||||
| Total |
3,231,700 | $ | 22.64 | 3,231,700 | 16,768,300 | ||||
| (1) | All shares were purchased in open market transactions. |
All share repurchases are subject to applicable securities laws, and are at times and in amounts as management deems appropriate. All shares of our common stock repurchased in 2009 were repurchased under authorization by our Board of Directors, granted on February 4, 2009, pursuant to which we were authorized to repurchase up to 20.0 million shares of our outstanding common stock in the open market. This authorization will expire on February 4, 2011.
22
| ITEM 6. | SELECTED FINANCIAL DATA |
The following selected financial data should be read in conjunction with Item 7 “Management’s Discussion and Analysis of Financial Condition and Results of Operations” and Item 8 “Financial Statements and Supplementary Data.”
On January 1, 2009, the Company adopted the provisions of the Financial Accounting Standards Board Accounting Standards Codification Subtopic 470-20, “Debt with Conversion and Other Options” (“ASC Subtopic 470-20”) which required retrospective application. Accordingly, the Company has retrospectively applied the provisions of ASC Subtopic 470-20 to its financial statements (See Note 2, “Accounting for Convertible Debt,” of the Notes to the Consolidated Financial Statements).
| Year Ended December 31, | ||||||||||||||||||||
| 2009 | 2008 | 2007 | 2006 | 2005 | ||||||||||||||||
| (in thousands, except per share amounts) | ||||||||||||||||||||
| (As Adjusted) | (As Adjusted) | (As Adjusted) | (As Adjusted) | |||||||||||||||||
| Statement of Income Data: |
||||||||||||||||||||
| Revenue |
$ | 1,147,087 | $ | 1,076,974 | $ | 779,397 | $ | 575,000 | $ | 508,561 | ||||||||||
| Cost of goods sold |
488,558 | 470,832 | 346,167 | 260,087 | 231,867 | |||||||||||||||
| Gross profit |
658,529 | 606,142 | 433,230 | 314,913 | 276,694 | |||||||||||||||
| Operating expenses: |
||||||||||||||||||||
| Research and development |
91,301 | 89,964 | 72,458 | 60,584 | 51,514 | |||||||||||||||
| Selling, general and administrative |
219,941 | 231,687 | 168,940 | 117,374 | 99,227 | |||||||||||||||
| Total operating expenses |
311,242 | 321,651 | 241,398 | 177,958 | 150,741 | |||||||||||||||
| Earnings from operations |
347,287 | 284,491 | 191,832 | 136,955 | 125,953 | |||||||||||||||
| Interest expense |
6,882 | 14,336 | 15,309 | 13,735 | 12,418 | |||||||||||||||
| Interest income |
(1,749 | ) | (7,397 | ) | (5,619 | ) | (3,352 | ) | (2,644 | ) | ||||||||||
| Other (income) expense, net |
1,761 | (12,766 | ) | (3,932 | ) | (1,260 | ) | (1,549 | ) | |||||||||||
| Earnings before income taxes |
340,393 | 290,318 | 186,074 | 127,832 | 117,728 | |||||||||||||||
| Income tax provision |
110,180 | 89,418 | 52,502 | 29,879 | 29,721 | |||||||||||||||
| Net earnings |
$ | 230,213 | $ | 200,900 | $ | 133,572 | $ | 97,953 | $ | 88,007 | ||||||||||
| Net earnings per share: |
||||||||||||||||||||
| Basic |
$ | 1.54 | $ | 1.45 | $ | 0.99 | $ | 0.72 | $ | 0.63 | ||||||||||
| Diluted |
$ | 1.45 | $ | 1.28 | $ | 0.89 | $ | 0.66 | $ | 0.58 | ||||||||||
| December 31, | ||||||||||||||||||||
| 2009 | 2008 | 2007 | 2006 | 2005 | ||||||||||||||||
| (in thousands) | ||||||||||||||||||||
| (As Adjusted) | (As Adjusted) | (As Adjusted) | (As Adjusted) | |||||||||||||||||
| Balance Sheet Data: |
||||||||||||||||||||
| Working capital |
$ | 793,142 | $ | 640,227 | $ | 494,606 | $ | 316,097 | $ | 316,335 | ||||||||||
| Total assets |
1,485,249 | 1,241,077 | 1,019,161 | 791,053 | 689,423 | |||||||||||||||
| Short-term debt |
19 | 21 | 19,007 | 45,507 | 56 | |||||||||||||||
| Long-term debt, excluding current portion |
58,022 | 182,825 | 194,270 | 188,326 | 182,678 | |||||||||||||||
| Total shareholders’ equity |
1,203,749 | 844,725 | 631,736 | 410,352 | 371,527 | |||||||||||||||
23
| ITEM 7. | MANAGEMENT’S DISCUSSION AND ANALYSIS OF FINANCIAL CONDITION AND RESULTS OF OPERATIONS |
Overview
FLIR was founded in 1978 and has since grown substantially due to increasing demand for infrared products across a growing number of markets combined with the execution of a series of acquisitions. Today we are one of the world leaders in the design, manufacture and marketing of thermal imaging and stabilized camera systems for a wide variety of applications in the commercial, industrial and government markets worldwide.
Our Thermography business primarily consists of the design and manufacture of hand-held thermal imaging systems that can detect and measure very small temperature differences, which is useful for a wide variety of industrial and commercial applications. Uses for our Thermography products include high-end predictive and preventative maintenance, research and development, test and measurement, leak detection and scientific analysis. A growing distribution network has enabled us to penetrate existing and emerging markets and applications worldwide.
Our Commercial Vision Systems business is focused on the development, manufacture and sale of generally lower cost uncooled products to emerging commercial markets where the primary requirement is to see at night or in adverse conditions. These markets are developing rapidly and include such uses as automotive night vision, recreational marine, firefighting, airborne law enforcement and commercial security. Commercial Vision Systems also sells camera cores, readout integrated circuits and other sub-components to OEMs in certain markets. Our infrared sensor business, which supplies both internal and external customers, is also part of Commercial Vision Systems. Vertical integration into infrared sensors provides us with the ability to design and produce infrared detectors, allowing us to reduce our costs and open new markets.
Effective January 1, 2010, the Company began the consolidation of its Commercial Vision Systems and Thermography divisions into one unit, the Commercial Systems division. The new division will continue to focus on the large potential for growth in commercial and industrial markets, and will create value from commonality in distribution, customers and strategic product development focused on uncooled infrared technology. For 2010, however, we will continue to report the financial results of the former Commercial Vision Systems division and Thermography division as we undergo the transition of consolidating these two segments. As we expect Thermography and Commercial Vision Systems to be substantially consolidated by the end of 2010, we expect to report the financial results for Commercial Systems as a single segment in 2011.
Our Government Systems business is focused primarily on markets where very high performance is required. The primary market for these products is government customers, who use our hand-held and fixed mounted products for such applications as force protection, counter terrorism, search and rescue, perimeter security, navigation safety, law enforcement, narcotics detection, maritime and border patrol, and anti-piracy. A substantial portion of our revenue in the Government Systems business is derived from sales to government agencies and we are continuing to expand our military program business, both in the United States and internationally.
International revenue accounted for approximately 41 percent, 38 percent and 39 percent of our revenue in 2009, 2008 and 2007, respectively. We anticipate that international sales will continue to account for a significant percentage of revenue in the future. We have exposure to foreign exchange fluctuations and changing dynamics of foreign competitiveness based on variations in the value of the United States dollar relative to other currencies. Factors contributing to this variability include significant manufacturing activity in Europe, significant sales denominated in currencies other than the United States dollar, and cross currency fluctuations between such currencies as the United States dollar, euro, Swedish kroner and British pound sterling. The impact of those fluctuations is reflected throughout our consolidated financial statements, but in the aggregate, did not have a material impact on our results of operations.
24
We experience fluctuations in orders and sales due to seasonal variations and customer sales cycles, such as the seasonal pattern of contracting by the United States and certain foreign governments, the frequent requirement by certain customers to take delivery of equipment prior to the end of December due to funding considerations, and the tendency of commercial enterprises to fully utilize annual capital budgets prior to expiration. Such events have resulted and could continue to result in fluctuations in quarterly results in the future. As a result of such quarterly fluctuations in operating results, we believe that quarter-to-quarter comparisons of our results of operations are not necessarily meaningful and should not be relied upon as indicators of future performance.
Critical Accounting Policies and Estimates
This discussion and analysis of our financial condition and results of operations is based upon our consolidated financial statements, which have been prepared in accordance with accounting principles generally accepted in the United States. The preparation of these financial statements requires us to make estimates and judgments that affect the reported amounts of assets, liabilities, revenues and expenses, and related disclosure of contingent assets and liabilities. We evaluate our estimates, including those related to revenue recognition, bad debts, inventories, goodwill, warranty obligations, contingencies and income taxes on an on-going basis. We base our estimates on historical experience and on various other assumptions that are believed to be reasonable under the circumstances, the results of which form the basis for making judgments about the carrying value of assets and liabilities that are not readily apparent from other sources. Actual results may differ from these estimates under different assumptions or conditions. Senior management has discussed the development, selection and disclosure of these estimates with the Audit Committee of our Board of Directors. We believe the following critical accounting policies and the related judgments and estimates affect the preparation of our consolidated financial statements.
Revenue recognition. The majority of our revenue is recognized upon shipment of the product to the customer at a fixed or determinable price and with a reasonable assurance of collection, passage of title to the customer as indicated by the shipping terms and fulfillment of all significant obligations.
We design, market and sell our products primarily as commercial, off-the-shelf products. Many of our Government Systems and Commercial Vision Systems customers, particularly those who use our airborne systems, request different system configurations, based on standard options or accessories that we offer. In general, our revenue arrangements do not involve acceptance provisions based upon customer specified acceptance criteria. In those limited circumstances when customer specified acceptance criteria exist, revenue is deferred until customer acceptance if we cannot demonstrate that the system meets those specifications prior to shipment. For any contracts with multiple elements (i.e., training, installation, additional parts, etc.) undelivered at the end of a reporting period, we recognize revenue on the delivered elements only after we have determined that the delivered elements have stand alone value and any undelivered elements have objective and reliable evidence of fair value. In addition, judgments are required in evaluating the credit worthiness of our customers. Credit is not extended to customers and revenue is not recognized until we have determined that collectability is reasonably assured.
Allowance for doubtful accounts. Our policy is to maintain allowances for estimated losses resulting from the inability of our customers to make required payments. Credit limits are established through a process of reviewing the financial history and stability of each customer. Where appropriate, we obtain credit rating reports and financial statements of the customer when determining or modifying their credit limits. We regularly evaluate the collectability of our trade receivable balances based on a combination of factors. When a customer’s account balance becomes past due, we initiate dialogue with the customer to determine the cause. If it is determined that the customer will be unable to meet its financial obligation to us, such as in the case of a bankruptcy filing, deterioration in the customer’s operating results or financial position or other material events impacting their business, we record a specific allowance to reduce the related receivable to the amount we expect to recover given all information presently available. Actual write-offs during the past three years have not been material to our results of operations.
25
We also record an allowance for all other customers based on certain other factors including the length of time the receivables are past due and historical collection experience with individual customers. As of December 31, 2009, our accounts receivable balance of $235.0 million is reported net of allowances for doubtful accounts of $2.0 million. We believe our reported allowances at December 31, 2009, are adequate. If the financial conditions of those customers were to deteriorate, however, resulting in their inability to make payments, we may need to record additional allowances that would result in additional selling, general and administrative expenses being recorded for the period in which such determination is made.
Inventory. Our policy is to record inventory write-downs when conditions exist that indicate that our inventories are likely to be in excess of anticipated demand or are obsolete based upon our assumptions about future demand for our products and market conditions. We regularly evaluate the ability to realize the value of our inventories based on a combination of factors including the following: historical usage rates, forecasted sales or usage, product end of life dates, estimated current and future market values and new product introductions. Purchasing requirements and alternative usage avenues are explored within these processes to mitigate inventory exposure. When recorded, our write-downs are intended to reduce the carrying value of our inventories to their net realizable value and establish a new cost basis. As of December 31, 2009, our inventories of $216.5 million are stated net of inventory write-downs of $18.6 million. If actual demand for our products deteriorates or market conditions are less favorable than those that we project, additional inventory write-downs may be required in the future.
Goodwill. We have recorded goodwill in connection with our business acquisitions. We review goodwill in June of each year, or on an interim basis if required, for impairment to determine if events or changes in business conditions indicate that the carrying value of the goodwill may not be recoverable. Such reviews assess the fair value of the assets based upon our estimates of the future cash flows we expect the assets to generate within the boundaries of the applicable business divisions of the Company. Our current review indicates that no adjustments are necessary for the goodwill assets, which have a carrying value of $262.3 million as of December 31, 2009.
Product warranties. Our products are sold with warranty provisions that require us to remedy deficiencies in quality or performance of our products over a specified period of time, generally twelve months, at no cost to our customers. Our policy is to establish warranty reserves at levels that represent our estimate of the costs that will be incurred to fulfill those warranty requirements at the time that revenue is recognized. We believe that our recorded liability of $8.7 million at December 31, 2009 is adequate to cover our future cost of materials, labor and overhead for the servicing of our products sold through that date. If actual product failures or material or service delivery costs differ from our estimates, our warranty liability would need to be revised accordingly.
Contingencies. We are subject to the possibility of loss contingencies arising in the normal course of business. We consider the likelihood of loss or impairment of an asset or the incurrence of a liability, as well as our ability to reasonably estimate the amount of loss in determining loss contingencies. An estimated loss is accrued when it is probable that an asset has been impaired or a liability has been incurred and the amount can be reasonably estimated. We regularly evaluate current information available to us to determine whether such accruals should be adjusted.
Income taxes. We record our deferred tax assets when the benefits are more likely than not to be recognized. Valuation allowances against deferred tax assets are recorded when a determination is made that the deferred tax assets are not more likely than not to be realized in the future. In making that determination, on a jurisdiction by jurisdiction basis, we estimate our future taxable income based upon historical operating results and external market data. Future levels of taxable income are dependent upon, but not limited to, general economic conditions, competitive pressures and other factors beyond our control. As of December 31, 2009, we have determined that no valuation allowance against our net deferred tax assets of $18.6 million is required. If we should determine that we may be unable to realize our deferred tax assets to the extent reported, an adjustment to the deferred tax assets would be recorded in the period such determination is made.
26
Results of Operations
The following table sets forth for the indicated periods certain items as a percentage of revenue:
| Year Ended December 31, | |||||||||
| 2009 | 2008 | 2007 | |||||||
| (As Adjusted) | (As Adjusted) | ||||||||
| Revenue |
100.0 | % | 100.0 | % | 100.0 | % | |||
| Cost of goods sold |
42.6 | 43.7 | 44.4 | ||||||
| Gross profit |
57.4 | 56.3 | 55.6 | ||||||
| Operating expenses: |
|||||||||
| Research and development |
8.0 | 8.4 | 9.3 | ||||||
| Selling, general and administrative |
19.1 | 21.5 | 21.7 | ||||||
| Total operating expenses |
27.1 | 29.9 | 31.0 | ||||||
| Earnings from operations |
30.3 | 26.4 | 24.6 | ||||||
| Interest expense |
0.6 | 1.3 | 2.0 | ||||||
| Interest income |
(0.2 | ) | (0.7 | ) | (0.7 | ) | |||
| Other income, net |
0.2 | (1.2 | ) | (0.5 | ) | ||||
| Earnings before income taxes |
29.7 | 27.0 | 23.8 | ||||||
| Income tax provision |
9.6 | 8.3 | 6.7 | ||||||
| Net earnings |
20.1 | % | 18.7 | % | 17.1 | % | |||
Years ended December 31, 2009, 2008 and 2007
Revenue. Revenue for 2009 totaled $1,147.1 million, an increase of 6.5 percent over 2008 revenue of $1,077.0 million. Revenue from the Government Systems business segment increased 15.2 percent from $569.0 million in 2008 to $655.3 million in 2009. The increase was primarily due to an increase in unit sales of our large-gimbaled systems. The effects of exchange rates decreased Government Systems revenue by 2.9 percent over 2008. Thermography revenue decreased 12.8 percent from $327.3 million in 2008 to $285.5 million in 2009. The decrease in Thermography revenue was primarily due to worldwide economic conditions in 2009, lower demand for high-value products and currency translation. The effects of exchange rates decreased Thermography revenue in 2009 by 3.6 percent over 2008. Commercial Vision Systems revenue increased 14.2 percent from $180.6 million in 2008 to $206.3 million in 2009. The increase in Commercial Vision Systems revenue was primarily due to increases in unit sales across most of the product lines. The effects of exchange rates decreased Commercial Vision Systems revenue by 2.1 percent over 2008.
The impacts on revenue (and expenses) arising from business acquisitions during 2009 are not significant to our 2009 results of operations.
Revenue for 2008 totaled $1,077.0 million, an increase of 38.2 percent over the $779.4 million revenue in 2007. Revenue from the Government Systems business segment increased 48.8 percent from $382.3 million in 2007 to $569.0 million in 2008. The increase was primarily due to an increase in unit sales across most of our product lines and an increase in the long-term program business. Thermography revenue increased $65.5 million, or 25.0 percent, from $261.8 million in 2007 to $327.3 million in 2008. Excluding revenue from Extech Instruments Corporation (“Extech”), acquired in the fourth quarter of 2007 and Cedip Infrared Systems (“Cedip”), acquired during the first quarter of 2008, Thermography revenue increased 5.1 percent in 2008 over 2007. The increase in 2008 was primarily due to increased unit sales in our T-Series™, i-Series™ and SC-Series™ product lines, offset by decreased unit sales in our P-Series™ and E-Series™ product lines. In addition, 2008 Thermography revenue was negatively impacted by the decline of the Swedish kroner against the United States dollar during the fourth quarter of 2008. Revenue from the Commercial Vision Systems business
27
segment increased 33.6 percent from $135.2 million in 2007 to $180.6 million in 2008. The increase in Commercial Vision Systems revenue was primarily due to an increase in unit sales across all major product lines of the segment.
International revenue in 2009 totaled $474.8 million, representing 41.4 percent of revenue. This compares with international revenue in 2008 which totaled $407.8 million, representing 37.9 percent of revenue and $301.9 million in 2007, representing 38.7 percent of revenue. While the sales mix between United States and international sales may fluctuate from year to year, we expect revenue from customers outside the United States to account for a significant portion of our total revenue on a long-term basis.
Gross profit. Gross profit in 2009 was 57.4 percent of revenue compared to 56.3 percent of revenue in 2008. The increase in gross profit as a percentage of revenue was primarily due to cost and production efficiencies related to increased volume, product mix and lower production costs in our Sweden and Estonia facilities.
Gross profit in 2008 was 56.3 percent of revenue, compared to 55.6 percent in 2007. The increase in gross profit as a percentage of revenue was primarily due to cost efficiencies realized by increased volumes in our Government Systems and Commercial Vision Systems manufacturing facilities, slightly offset by the lower gross profit percentage recognized at Extech and Cedip.
Cost of goods sold includes materials, labor and overhead costs incurred in the manufacturing of products and services sold in the period as well as warranty costs. Material costs include raw materials, purchased components and sub-assemblies, outside processing and inbound freight costs. Labor and overhead costs consist of direct and indirect manufacturing costs, including wages and fringe benefits, operating supplies, depreciation and amortization, occupancy costs, and purchasing, receiving and inspection costs.
Research and development. Research and development expenses were $91.3 million, or 8.0 percent of revenue in 2009, compared to $90.0 million, or 8.4 percent of revenue, in 2008, and $72.5 million, or 9.3 percent of revenue, in 2007. The decrease in research and development expenses as a percentage of revenue during the three year period was primarily due to cost containment efforts, such as salary freezes and reduction of consultant expenses, in response to weak economic conditions and due to currency translation.
We believe that spending levels are sufficient to support the development of new products and the continued growth of the business. We expect research and development expenses to be approximately 8 to 10 percent of revenue on a long-term basis.
We have also incurred expenses associated with customer funded design and development contracts. Such expenses were $5.4 million in 2009, $6.0 million in 2008 and $8.9 million in 2007. These expenses are reported as cost of goods sold since the related funding is reported as revenue.
Selling, general and administrative expenses. Selling, general and administrative expenses were $219.9 million, or 19.2 percent of revenue in 2009 compared to $231.7 million, or 21.5 percent of revenue, in 2008 and $168.9 million, or 21.7 percent of revenue, in 2007. The decrease in selling, general and administrative expenses from 2008 to 2009 was primarily due to cost containment efforts in response to economic conditions, currency translation and lower annual incentive compensation costs. During 2009 and 2008 we incurred significant legal costs related to the legal matter described in Note 13, “Contingencies,” of the Notes to the Consolidated Financial Statements. The increase in selling, general and administrative expenses from 2007 to 2008 was due to the continued growth in the business, including costs associated with new product launches and increased performance incentive and stock-based compensation costs. We anticipate selling, general and administrative expenses in the future to increase at a slower rate than revenue.
Interest expense. Interest expense totaled $6.9 million, $14.3 million and $15.3 million for the years ended December 31, 2009, 2008 and 2007, respectively. Interest expense is primarily attributable to interest on the
28
convertible notes that were issued in June 2003, the amortization of the discounts recorded on the notes and the costs related to the issuance of the notes. The decrease in interest expense in 2009 is primarily due to the conversion of some of our outstanding convertible notes in the fourth quarter of 2008, the third and fourth quarters of 2009 and the exchange of a portion of the convertible notes pursuant to the Company’s exchange offer in the first quarter of 2009.
Interest income. Interest income was $ 1.7 million, $7.4 million and $5.6 million for the years ended December 31, 2009, 2008 and 2007, respectively. The decrease in interest income in 2009 compared to 2008 was primarily due to lower interest rates in 2009. The increase in interest income in 2008 over 2007 was primarily due to an increase in invested cash.
Other income, net. We reported other expense of $1.8 million in 2009 and other income of $12.8 million and $3.9 million in 2008 and 2007, respectively. The other expense in 2009 is primarily currency losses offset by investment gains. The other income in 2008 and 2007 is primarily currency gains on transactions denominated in currencies other than the functional currency in our European operations.
Income taxes. Our income tax provision was $110.2 million, $89.4 million and $52.5 million in 2009, 2008 and 2007, respectively. The effective tax rates for 2009, 2008 and 2007 were 32.4 percent, 30.8 percent and 28.2 percent, respectively. The mix in taxable income between our United States and international operations impacted the income tax provisions in each of these years. Our effective tax rate is lower than the United States federal tax rate of 35 percent because of lower foreign tax rates, the effect of foreign tax credits and other federal and state tax credits.
At December 31, 2009, we had United States tax net operating loss carry-forwards totaling approximately $5.8 million which expire in 2029. In addition, the Company has Colorado state net operating loss carry-forwards totaling approximately $3.9 million which expire in 2029.
Tax benefits as described above are recorded as assets when the benefits are more likely than not to be recognized. To the extent that we assess the realization of such assets to not be more likely than not, a valuation allowance is required to be recorded. We believe that the net deferred tax assets of $18.6 million reflected on the December 31, 2009 Consolidated Balance Sheet are realizable based on future forecasts of taxable income over a relatively short time horizon and therefore, we have not recorded a valuation allowance.
Liquidity and Capital Resources
At December 31, 2009, we had $422.0 million in cash and cash equivalents compared to $289.4 million at December 31, 2008. The increase in cash and cash equivalents was primarily due to cash provided from operations and the cash proceeds and tax benefits generated from our stock-based compensation programs, offset by business acquisitions, capital expenditures, and the repurchase of our common stock.
Cash provided by operating activities in 2009 totaled $271.8 million compared to $218.3 million in 2008. The increase in cash provided from operating activities was primarily due to an increase in net earnings and a lower level of net cash used in 2009 compared to 2008 for operating assets and liabilities, principally accounts receivable, inventories and accrued payroll.
Cash used for investing activities for the year ended December 31, 2009 totaled $107.7 million, primarily consisting of the acquisitions of Salvador, OmniTech, and Directed Perception and capital expenditures. Cash used for investing activities for the year ended December 31, 2008 totaled $114.0 million, primarily consisting of the acquisitions of Cedip and Ifara Tecnologias, S. L. and capital expenditures.
Cash used for financing activities for the year ended December 31, 2009 totaled $43.5 million, primarily consisting of the repurchase of approximately 3.2 million shares of our common stock, offset by proceeds from
29
shares issued for and tax benefits recognized from our stock-based compensation plans. Cash provided from financing activities for the year ended December 31, 2008 totaled $2.6 million, primarily consisting of proceeds from shares issued for and tax benefits recognized from our stock-based compensation plans, offset by the repurchase of approximately 1.2 million shares of our common stock and repayments of short-term debt.
On October 6, 2006, we signed a Credit Agreement (“Credit Agreement”) with Bank of America, N.A., Union Bank of California, N.A., U.S. Bank National Association and other Lenders. The Credit Agreement provides for a $300 million, five-year revolving line of credit. We have the right, subject to certain conditions including approval of additional commitments by qualified lenders, to increase the line of credit by an additional $150 million until October 6, 2011. The Credit Agreement includes a $100 million sublimit multicurrency option, permitting us and certain of our designated subsidiaries to borrow in euro, kroner, pound sterling and other agreed upon currencies. Under the Credit Agreement, borrowings will bear interest based upon the prime lending rate of the Bank of America or Eurodollar rates with a provision for a spread over Eurodollar rates based upon our leverage ratio. The Eurodollar interest rate was 1.001 percent and the prime lending rate was 3.25 percent at December 31, 2009. These rates were 2.175 percent and 3.25 percent, respectively, at December 31, 2008. The Credit Agreement requires us to pay a commitment fee on the amount of unused credit at a rate, based on our leverage ratio, which ranges from 0.175 percent to 0.325 percent. At December 31, 2009 and 2008, the commitment fee rate was 0.175 percent. The Credit Agreement contains five financial covenants that require the maintenance of certain leverage ratios, in addition to minimum levels of EBITDA and consolidated net worth, a maximum level of capital expenditures and, commencing December 31, 2009, a minimum level of liquidity comprised of cash and undrawn/unutilized availability under the Credit Agreement. The Credit Agreement is collateralized by substantially all assets of the Company. At December 31, 2009 and 2008, we had no amounts outstanding under the Credit Agreement. We had $7.8 million and $15.8 million of letters of credit outstanding under the Credit Agreement at December 31, 2009 and 2008, respectively, which reduces the total available credit.
Our Sweden subsidiary has a 30 million Swedish kroner (approximately $4.2 million) line of credit with an interest rate at 0.95 percent at December 31, 2009. At December 31, 2009, we had no amounts outstanding on this line of credit. The 30 million Swedish kroner line of credit is secured primarily by accounts receivable and inventories of the Sweden subsidiary and is subject to automatic renewal on an annual basis.
In June 2003, we issued $210 million of 3.0 percent senior convertible notes due in 2023 in a private offering pursuant to Rule 144A under the Securities Act of 1933, as amended. The net proceeds from the issuance were approximately $203.9 million. Issuance costs are being amortized over a period of seven years. Interest is payable semiannually on June 1 and December 1 of each year. The holders of the notes may convert all or some of their notes into shares of our common stock at a conversion rate of 90.1224 shares per $1,000 principal amount of notes prior to the maturity date in certain circumstances. We may redeem for cash all or part of the notes on or after June 8, 2010. The convertible notes are eligible for conversion at the option of the note holders.
On February 5, 2009, we commenced an exchange offer for any and all of the outstanding convertible notes. The offer was made pursuant to an Offer to Exchange and related documents, each dated February 5, 2009. Holders who elected to exchange their notes in this offer and whose notes were accepted for exchange by us received 90.1224 shares of our common stock and a cash payment of $20 per $1,000 principal amount of notes. The offer expired on March 9, 2009. Notes with an aggregate principal amount of $99.9 million were exchanged pursuant to the exchange offer for approximately 9.0 million shares of the Company’s common stock and approximately $2.0 million in cash.
In addition, in July 2009, convertible notes with an aggregate principal amount of $30.1 million were converted into approximately 2.7 million shares of the Company’s common stock, and in December 2009, convertible notes with an aggregate principal amount of $2.7 million were converted into 244,000 shares of the Company’s common stock.
30
As of December 31, 2009, notes with an aggregate principal amount of $151.2 million have been exchanged or converted into approximately 13.6 million shares of the Company’s common stock. We anticipate that all remaining note holders will exercise their option to convert the remaining notes in June 2010.
We believe that our existing cash combined with the cash we anticipate to generate from operating activities, and our available credit facilities and financing available from other sources will be sufficient to meet our cash requirements for the foreseeable future. We do not have any significant commitments nor are we aware of any significant events or conditions that are likely to have a material impact on our liquidity or capital resources.
Off-Balance Sheet Arrangements
As of December 31, 2009, we leased our non-owned facilities under operating lease agreements. We also leased certain operating machinery and equipment and office equipment under operating lease agreements. Except for these operating lease agreements, we do not have any off-balance sheet arrangements that have or are likely to have a material current or future effect on our financial condition, revenues or expenses, results of operations, liquidity, capital expenditures or capital resources.
Contractual Obligations
As of December 31, 2009, our contractual obligations were as follows (in thousands):
| Payments Due by Period | |||||||||||||||
| Contractual Obligations |
Total | Less than 1 Year |
1 – 3 Years |
3 – 5 Years |
More than 5 Years | ||||||||||
| Long-term debt |
$ | 58,833 | $ | 22 | $ | 29 | $ | — | $ | 58,782 | |||||
| Interest on long-term debt |
23,660 | 1,763 | 3,527 | 3,527 | 14,843 | ||||||||||
| Operating leases |
34,138 | 10,388 | 15,142 | 7,060 | 1,548 | ||||||||||
| Licensing rights |
4,125 | 550 | 1,100 | 1,100 | 1,375 | ||||||||||
| Post-retirement obligations |
24,064 | 504 | 15,907 | 975 | 6,678 | ||||||||||
| $ | 144,820 | $ | 13,227 | $ | 35,705 | $ | 12,662 | $ | 83,226 | ||||||
Principal and interest obligations on our long-term debt are based upon contractual maturities; however, we believe based upon the conversion and redemption features of our convertible notes that all of these notes will be extinguished by June 2010. Operating leases and licensing rights obligations are based upon contractual terms. Actual payments may differ in terms of both timing and amounts.
We did not include $8.3 million of unrecognized tax benefits due to the uncertainty with respect to the timing of future cash flows as of December 31, 2009. We are unable to make reasonably reliable estimates of the period of cash settlement with the respective taxing authorities and the total amounts of income tax payable and the timing of such tax payments may depend on the resolution of current and future tax examinations which cannot be estimated.
We did not include approximately $12.3 million of standby letters of credit and performance bonds due to the unlikely event of payment, if any, of amounts under those arrangements.
Recent Accounting Pronouncements
See Note 1 to the Consolidated Financial Statements in Item 8 for a discussion of recent accounting pronouncements.
31
| ITEM 7A. | QUANTITATIVE AND QUALITATIVE DISCLOSURES ABOUT MARKET RISK |
Our exposure to market risk for changes in interest rates relates primarily to our credit agreements. The credit agreements are at variable rates. A change in interest rates under the credit agreements impacts the interest that we incur and our cash flows. At December 31, 2009, no amounts were outstanding under our credit agreements; consequently, no sensitivity analysis is presented.
Our convertible notes carry interest at a fixed rate of 3.0 percent. For fixed rate debt, interest rate changes impact the fair value of the notes but do not impact earnings or cash flows. The fair value of the notes at December 31, 2009, was approximately $173.4 million compared to a carrying value of $58.0 million. The potential loss in fair value resulting from a hypothetical 10 percent adverse change in the fair value would be approximately $17.3 million.
We have assets and liabilities outside the United States that are subject to fluctuations in foreign currency exchange rates. Similarly, certain revenues from products sold in countries outside the United States are denominated in foreign currencies. For more information on our foreign currency translation, see Note 1 to the Consolidated Financial Statements in Item 8. Assets and liabilities located outside the United States are primarily located in Europe. Our investments in subsidiaries outside the United States with functional currencies other than the United States dollar are considered long-term. We currently engage in limited forward currency exchange contracts and other similar hedging activities to reduce our economic exposure to changes in exchange rates. At December 31, 2009, exchange contracts with a notional amount of approximately $23.6 million were outstanding. Because we market, sell and license our products throughout the world, we could be adversely affected by weak economic conditions in international markets that could reduce demand for our products.
Our net investment in subsidiaries outside the United States, translated into United States dollars using the period-end exchange rates at December 31, was approximately $398.6 million and $326.0 million at December 31, 2009 and 2008, respectively. The potential loss in fair value resulting from a hypothetical 10 percent adverse change in foreign exchange rates would be approximately $39.9 million and $32.6 million at December 31, 2009 and 2008, respectively. The increase in the potential loss in fair value is primarily due to the increase in the net investment of subsidiaries outside the United States. We have no plans to liquidate any of our subsidiaries outside the United States, and therefore, foreign exchange rate gains or losses on our international investments are reflected as a cumulative translation adjustment and do not reduce our reported net earnings.
| ITEM 8. | FINANCIAL STATEMENTS AND SUPPLEMENTARY DATA |
This item includes the following financial information:
32
REPORT OF INDEPENDENT REGISTERED PUBLIC ACCOUNTING FIRM
The Board of Directors and
Shareholders of FLIR Systems, Inc.:
We have audited the accompanying consolidated balance sheets of FLIR Systems, Inc. (an Oregon corporation) and subsidiaries as of December 31, 2009 and 2008, and the related consolidated statements of income, shareholders’ equity and comprehensive earnings, and cash flows for each of the years in the three-year period ended December 31, 2009. These consolidated financial statements are the responsibility of the Company’s management. Our responsibility is to express an opinion on these consolidated financial statements based on our audits.
We conducted our audits in accordance with the standards of the Public Company Accounting Oversight Board (United States). Those standards require that we plan and perform the audit to obtain reasonable assurance about whether the financial statements are free of material misstatement. An audit includes examining, on a test basis, evidence supporting the amounts and disclosures in the financial statements. An audit also includes assessing the accounting principles used and significant estimates made by management, as well as evaluating the overall financial statement presentation. We believe that our audits provide a reasonable basis for our opinion.
In our opinion, the consolidated financial statements referred to above present fairly, in all material respects, the financial position of FLIR Systems, Inc. and subsidiaries as of December 31, 2009 and 2008, and the results of their operations and their cash flows for each of the years in the three-year period ended December 31, 2009, in conformity with U.S. generally accepted accounting principles.
As discussed in Note 2 to the consolidated financial statements, the Company changed its accounting for convertible debt due to the adoption of Financial Accounting Standards Board (FASB) Staff Position No. APB 14-1, Accounting for Convertible Debt Instruments That May be Settled in Cash upon Conversion (Including Partial Cash Settlement), (included in FASB Accounting Standards Codification Subtopic 470-20, Debt with Conversion and Other Options), as of January 1, 2009.
We also have audited, in accordance with the standards of the Public Company Accounting Oversight Board (United States), FLIR Systems Inc.’s internal control over financial reporting as of December 31, 2009, based on criteria established in Internal Control—Integrated Framework issued by the Committee of Sponsoring Organizations of the Treadway Commission (COSO), and our report dated February 26, 2010 expressed an unqualified opinion on the effectiveness of the Company’s internal control over financial reporting.
/s/ KPMG LLP
Portland, Oregon
February 26, 2010
33
FLIR SYSTEMS, INC.
CONSOLIDATED STATEMENTS OF INCOME
(in thousands, except per share amounts)
| Year Ended December 31, | ||||||||||||
| 2009 | 2008 | 2007 | ||||||||||
| (As Adjusted) | (As Adjusted) | |||||||||||
| Revenue |
$ | 1,147,087 | $ | 1,076,974 | $ | 779,397 | ||||||
| Cost of goods sold |
488,558 | 470,832 | 346,167 | |||||||||
| Gross profit |
658,529 | 606,142 | 433,230 | |||||||||
| Operating expenses: |
||||||||||||
| Research and development |
91,301 | 89,964 | 72,458 | |||||||||
| Selling, general and administrative |
219,941 | 231,687 | 168,940 | |||||||||
| Total operating expenses |
311,242 | 321,651 | 241,398 | |||||||||
| Earnings from operations |
347,287 | 284,491 | 191,832 | |||||||||
| Interest expense |
6,882 | 14,336 | 15,309 | |||||||||
| Interest income |
(1,749 | ) | (7,397 | ) | (5,619 | ) | ||||||
| Other expense (income), net |
1,761 | (12,766 | ) | (3,932 | ) | |||||||
| Earnings before income taxes |
340,393 | 290,318 | 186,074 | |||||||||
| Income tax provision |
110,180 | 89,418 | 52,502 | |||||||||
| Net earnings |
$ | 230,213 | $ | 200,900 | $ | 133,572 | ||||||
| Net earnings per share: |
||||||||||||
| Basic |
$ | 1.54 | $ | 1.45 | $ | 0.99 | ||||||
| Diluted |
$ | 1.45 | $ | 1.28 | $ | 0.89 | ||||||
The accompanying notes are an integral part of these consolidated financial statements.
34
FLIR SYSTEMS, INC.
(in thousands, except for par value)
| December 31, | |||||||
| 2009 | 2008 | ||||||
| (As Adjusted) | |||||||
| ASSETS | |||||||
| Current assets: |
|||||||
| Cash and cash equivalents |
$ | 422,047 | $ | 289,442 | |||
| Accounts receivable, net |
234,974 | 239,183 | |||||
| Inventories |
216,500 | 207,487 | |||||
| Prepaid expenses and other current assets |
83,981 | 59,824 | |||||
| Deferred income taxes, net |
13,231 | 16,566 | |||||
| Total current assets |
970,733 | 812,502 | |||||
| Property and equipment, net |
139,112 | 122,304 | |||||
| Deferred income taxes, net |
5,322 | 2,217 | |||||
| Goodwill |
262,331 | 225,685 | |||||
| Intangible assets, net |
59,180 | 56,174 | |||||
| Other assets |
48,571 | 22,195 | |||||
| $ | 1,485,249 | $ | 1,241,077 | ||||
| LIABILITIES AND SHAREHOLDERS’ EQUITY | |||||||
| Current liabilities: |
|||||||
| Accounts payable |
$ | 53,319 | $ | 47,823 | |||
| Deferred revenue |
21,757 | 27,554 | |||||
| Accrued payroll and related liabilities |
39,809 | 43,337 | |||||
| Accrued product warranties |
8,667 | 7,826 | |||||
| Advance payments from customers |
8,616 | 19,183 | |||||
| Accrued expenses |
25,941 | 21,978 | |||||
| Accrued income taxes |
15,504 | — | |||||
| Other current liabilities |
3,978 | 4,574 | |||||
| Total current liabilities |
177,591 | 172,275 | |||||
| Long-term debt |
58,022 | 182,825 | |||||
| Deferred income taxes |
2,222 | 5,983 | |||||
| Accrued income taxes |
4,550 | 5,697 | |||||
| Pension and other long-term liabilities |
39,115 | 29,572 | |||||
| Commitments and contingencies (Notes 11 and 12) |
|||||||
| Shareholders’ equity: |
|||||||
| Preferred stock, $0.01 par value, 10,000 shares authorized; no shares issued at December 31, 2009 or 2008 |
— | — | |||||
| Common stock, $0.01 par value, 500,000 shares authorized, 152,826 and 141,387 shares issued at December 31, 2009 and 2008, respectively, and additional paid-in capital |
389,316 | 282,849 | |||||
| Retained earnings |
807,303 | 577,090 | |||||
| Accumulated other comprehensive earnings (loss) |
7,130 | (15,214 | ) | ||||
| Total shareholders’ equity |
1,203,749 | 844,725 | |||||
| $ | 1,485,249 | $ | 1,241,077 | ||||
The accompanying notes are an integral part of these consolidated financial statements.
35
FLIR SYSTEMS, INC.
CONSOLIDATED STATEMENTS OF SHAREHOLDERS’ EQUITY AND COMPREHENSIVE EARNINGS
(in thousands)
| Common Stock and Additional Paid-in Capital |
Retained Earnings |
Accumulated Other Comprehensive Earnings (Loss) |
Total Shareholder’s Equity |
Annual Comprehensive Earnings |
||||||||||||||||||
| Shares | Amount | |||||||||||||||||||||
| (As Adjusted) | (As Adjusted) | (As Adjusted) | (As Adjusted) | |||||||||||||||||||
| Balance, December 31, 2006 |
131,671 | $ | 147,395 | $ | 242,618 | $ | 20,339 | $ | 410,352 | |||||||||||||
| Net earnings for the year |
— | — | 133,572 | — | 133,572 | $ | 133,572 | |||||||||||||||
| Income tax benefit of common stock options exercised |
— | 18,085 | — | — | 18,085 | — | ||||||||||||||||
| Repurchase of common stock |
(177 | ) | (3,737 | ) | — | — | (3,737 | ) | — | |||||||||||||
| Common stock issued pursuant to stock-based compensation plans, net |
5,276 | 41,576 | — | — | 41,576 | — | ||||||||||||||||
| Stock-based compensation expense |
— | 15,490 | — | — | 15,490 | — | ||||||||||||||||
| Conversion of convertible debt |
— | 4 | — | — | 4 | — | ||||||||||||||||
| Change in minimum liability for pension plans, net of tax effects of $255 |
— | — | — | (456 | ) | (456 | ) | (456 | ) | |||||||||||||
| Translation adjustment |
— | — | — | 16,850 | 16,850 | 16,850 | ||||||||||||||||
| Balance, December 31, 2007 |
136,770 | 218,813 | 376,190 | 36,733 | 631,736 | |||||||||||||||||
| Comprehensive earnings, year ended December 31, 2007 |
$ | 149,966 | ||||||||||||||||||||
| Net earnings for the year |
— | — | 200,900 | — | 200,900 | $ | 200,900 | |||||||||||||||
| Income tax benefit of common stock options exercised |
— | 27,350 | — | — | 27,350 | — | ||||||||||||||||
| Repurchase of common stock |
(1,381 | ) | (40,739 | ) | — | — | (40,739 | ) | — | |||||||||||||
| Common stock issued pursuant to stock-based compensation plans, net |
4,324 | 38,764 | — | — | 38,764 | — | ||||||||||||||||
| Stock-based compensation expense |
— | 21,151 | — | — | 21,151 | — | ||||||||||||||||
| Conversion of convertible debt |
1,674 | 17,510 | — | — | 17,510 | — | ||||||||||||||||
| Change in minimum liability for pension plans, net of tax effects of $1,954 |
— | — | — | (3,369 | ) | (3,369 | ) | (3,369 | ) | |||||||||||||
| Translation adjustment |
— | — | — | (48,578 | ) | (48,578 | ) | (48,578 | ) | |||||||||||||
| Balance, December 31, 2008 |
141,387 | 282,849 | 577,090 | (15,214 | ) | 844,725 | ||||||||||||||||
| Comprehensive earnings, year ended December 31, 2008 |
$ | 148,953 | ||||||||||||||||||||
| Net earnings for the year |
— | — | 230,213 | — | 230,213 | $ | 230,213 | |||||||||||||||
| Income tax benefit of common stock options exercised |
— | 9,245 | — | — | 9,245 | — | ||||||||||||||||
| Repurchase of common stock |
(3,232 | ) | (73,169 | ) | — | — | (73,169 | ) | — | |||||||||||||
| Common stock issued pursuant to stock-based compensation plans, net |
2,717 | 17,581 | — | — | 17,581 | — | ||||||||||||||||
| Stock-based compensation expense |
— | 23,888 | — | — | 23,888 | — | ||||||||||||||||
| Conversion of convertible debt |
11,954 | 128,427 | — | — | 128,427 | — | ||||||||||||||||
| Capital contribution |
— | 495 | — | 495 | ||||||||||||||||||
| Change in minimum liability for pension plans, net of tax effects of $402 |
— | — | — | 781 | 781 | 781 | ||||||||||||||||
| Translation adjustment |
— | — | — | 21,563 | 21,563 | 21,563 | ||||||||||||||||
| Balance, December 31, 2009 |
152,826 | $ | 389,316 | $ | 807,303 | $ | 7,130 | $ | 1,203,749 | |||||||||||||
| Comprehensive earnings, year ended December 31, 2009 |
$ | 252,557 | ||||||||||||||||||||
The accompanying notes are an integral part of these consolidated financial statements.
36
FLIR SYSTEMS, INC.
CONSOLIDATED STATEMENTS OF CASH FLOWS
(in thousands)
| Year Ended December 31, | ||||||||||||
| 2009 | 2008 | 2007 | ||||||||||
| (As Adjusted) | (As Adjusted) | |||||||||||
| CASH PROVIDED BY OPERATING ACTIVITIES: |
||||||||||||
| Net earnings |
$ | 230,213 | $ | 200,900 | $ | 133,572 | ||||||
| Income items not affecting cash: |
||||||||||||
| Depreciation and amortization |
42,426 | 45,323 | 30,987 | |||||||||
| Deferred income taxes |
(608 | ) | (8,756 | ) | (205 | ) | ||||||
| Stock-based compensation arrangements |
23,955 | 20,974 | 15,316 | |||||||||
| Inducement loss on exchange offer for convertible notes |
1,997 | — | — | |||||||||
| Other non-cash items |
(1,749 | ) | (450 | ) | 98 | |||||||
| Changes in operating assets and liabilities, net of acquisitions: |
||||||||||||
| Decrease (increase) in accounts receivable |
9,981 | (40,640 | ) | (27,303 | ) | |||||||
| Increase in inventories |
(301 | ) | (30,178 | ) | (34,411 | ) | ||||||
| Increase in prepaid expenses and other current assets |
(22,946 | ) | (3,750 | ) | (24,324 | ) | ||||||
| (Increase) decrease in other assets |
(10,906 | ) | 3,904 | (829 | ) | |||||||
| Increase (decrease) in accounts payable |
3,293 | (7,324 | ) | 9,879 | ||||||||
| (Decrease) increase in deferred revenue |
(6,214 | ) | 10,842 | 446 | ||||||||
| (Decrease) increase in accrued payroll and other liabilities |
(20,327 | ) | 28,176 | 12,297 | ||||||||
| Increase (decrease) in accrued income taxes |
13,887 | 1,246 | (5,155 | ) | ||||||||
| Increase (decrease) in pension and other long-term liabilities |
9,059 | (1,951 | ) | 5,735 | ||||||||
| Cash provided by operating activities |
271,760 | 218,316 | 116,103 | |||||||||
| CASH USED BY INVESTING ACTIVITIES: |
||||||||||||
| Additions to property and equipment |
(41,874 | ) | (27,641 | ) | (44,048 | ) | ||||||
| Proceeds on sale of property and equipment |
2,892 | 2 | 93 | |||||||||
| Business acquisitions, net of cash acquired |
(73,565 | ) | (78,762 | ) | (41,981 | ) | ||||||
| Other investments |
4,850 | (7,553 | ) | (1,521 | ) | |||||||
| Cash used by investing activities |
(107,697 | ) | (113,954 | ) | (87,457 | ) | ||||||
| CASH (USED) PROVIDED BY FINANCING ACTIVITIES: |
||||||||||||
| Repayments of credit agreement |
— | (19,000 | ) | (26,500 | ) | |||||||
| Repayments of long-term debt, including current portion |
(30 | ) | (3,387 | ) | (7 | ) | ||||||
| Cash inducement on exchange offer for convertible notes |
(1,997 | ) | — | — | ||||||||
| Repurchase of common stock |
(73,169 | ) | (40,739 | ) | (3,737 | ) | ||||||
| Proceeds from shares issued pursuant to stock-based compensation plans |
22,325 | 42,063 | 42,795 | |||||||||
| Excess tax benefit of stock options exercised |
8,834 | 23,676 | 14,594 | |||||||||
| Capital contribution |
495 | — | — | |||||||||
| Cash (used) provided by financing activities |
(43,542 | ) | 2,613 | 27,145 | ||||||||
| Effect of exchange rate changes on cash |
12,084 | (21,214 | ) | 9,267 | ||||||||
| Net increase in cash and cash equivalents |
132,605 | 85,761 | 65,058 | |||||||||
| Cash and cash equivalents, beginning of year |
289,442 | 203,681 | 138,623 | |||||||||
| Cash and cash equivalents, end of year |
$ | 422,047 | $ | 289,442 | $ | 203,681 | ||||||
The accompanying notes are an integral part of these consolidated financial statements.
37
FLIR SYSTEMS, INC.
NOTES TO THE CONSOLIDATED FINANCIAL STATEMENTS
| Note 1. | Nature of Business and Significant Accounting Policies |
FLIR Systems, Inc. designs, manufactures and markets thermal imaging and stabilized camera systems for a wide variety of applications in commercial, industrial and government markets worldwide. The Company’s products are produced in a variety of configurations to suit specific customer needs. These include compact hand-held systems for such applications as surveillance, search and rescue, and industrial analysis and monitoring; sealed, autonomous systems for fixed security monitoring installations; and stabilized gimbaled systems for airborne and shipborne use. The Company’s thermal imaging systems use advanced infrared technology that detects infrared radiation, or heat, enabling the operator to measure very small temperature differences and to see objects in total darkness and in many types of adverse conditions including through smoke, haze and most types of fog. Many of the Company’s products also incorporate visible light cameras, laser rangefinders, laser illuminators, image analysis software and gyro-stabilized gimbal technology.
Principles of consolidation
The accompanying consolidated financial statements include the accounts of the Company and its wholly owned subsidiaries. All intercompany accounts and transactions were eliminated.
Foreign currency translation
The assets and liabilities of the Company’s subsidiaries outside the United States are translated into United States dollars at current exchange rates in effect at the balance sheet date while revenues and expenses are translated at average exchange rates for the year. Resulting translation adjustments are reflected in accumulated other comprehensive earnings within shareholders’ equity. Transaction gains and losses that arise from exchange rate fluctuations on transactions denominated in currencies other than the functional currency are reflected as other income, net, in the Consolidated Statements of Income as incurred.
The cumulative translation adjustment included in accumulated other comprehensive earnings (loss) is a gain of $12.6 million and a loss of $9.0 million at December 31, 2009 and 2008, respectively. Transaction gains and losses included in other income, net, are a net loss of $3.9 million, and net gains of $12.9 million and $2.9 million for the years ended December 31, 2009, 2008 and 2007, respectively.
Revenue recognition
Revenue is primarily recognized when persuasive evidence of an arrangement exists, upon delivery of the product to the customer at a fixed or determinable price with a reasonable assurance of collection, passage of title and risk of loss to the customer as indicated by the shipping terms and fulfillment of all significant obligations.
The Company designs, markets and sells products primarily as commercial, off-the-shelf products. Many of the Company’s Government Systems and Commercial Vision Systems customers, particularly those who use its airborne systems, request different system configurations, based on standard options or accessories that the Company offers. In general, revenue arrangements do not involve acceptance provisions based upon customer specified acceptance criteria. In those limited circumstances when customer specified acceptance criteria exist, revenue is deferred until customer acceptance if the Company cannot demonstrate the system meets those specifications prior to shipment. For any contracts with multiple elements (i.e., training, installation, additional parts, etc.) undelivered at the end of a reporting period, the Company recognizes revenue for the delivered elements only after it has determined that the delivered elements have stand alone value and any undelivered elements have objective and reliable evidence of fair value. Credit is not extended to customers and revenue is not recognized until the Company has determined that the risk of uncollectability is minimal.
38
FLIR SYSTEMS, INC.
NOTES TO THE CONSOLIDATED FINANCIAL STATEMENTS—(Continued)
| Note 1. | Nature of Business and Significant Accounting Policies—(Continued) |
Revenue recognition—(Continued)
The Company’s products are sold with warranty provisions that require it to remedy deficiencies in quality or performance of the Company’s products over a specified period of time, generally twelve months, at no cost to its customers. Warranty reserves are established at the time that revenue is recognized at levels that represent the Company’s estimate of the costs that will be incurred to fulfill those warranty requirements.
Provisions for estimated losses on sales or related receivables are recorded when identified. Revenue is stated net of representative commissions. Service revenue is deferred and recognized over the contract period, as is the case for extended warranty contracts, or recognized as services are provided.
Cost of goods sold
Cost of goods sold includes materials, labor and overhead costs incurred in the manufacturing of products and services sold in the period as well as warranty costs. Material costs include raw materials, purchased components and sub-assemblies, outside processing and inbound freight costs. Labor and overhead costs consist of direct and indirect manufacturing costs, including wages and fringe benefits, operating supplies, depreciation, occupancy costs, and purchasing, receiving and inspection costs.
Research and development
Expenditures for research and development activities are expensed as incurred.
Cash equivalents
The Company considers short-term investments that are highly liquid, readily convertible into cash and have maturities of less than three months when purchased to be cash equivalents. Cash equivalents at December 31, 2009, 2008 and 2007 were $313.6 million, $205.7 million and $27.9 million, respectively.
Accounts receivable and allowance for doubtful accounts
Accounts receivable are stated at the amounts the Company expects to collect. Credit limits are established through a process of reviewing the financial history and stability of each customer. The Company regularly evaluates the collectability of its trade receivables balances based on a combination of factors. If it is determined that a customer will be unable to fully meet its financial obligation, the Company records a specific allowance to reduce the related receivable to the amount expected to be recovered.
Inventories
Inventories are generally stated at the lower of cost or market and include materials, labor, and manufacturing overhead. Cost is determined based on a currently adjusted standard cost basis that approximates actual manufacturing cost on a first-in, first-out basis.
Inventory write-downs are recorded when conditions exist to indicate that inventories are likely to be in excess of anticipated demand or are obsolete based upon the Company’s assumptions about future demand for its products and market conditions. The Company regularly evaluates its ability to realize the value of inventories based on a combination of factors including the following: historical usage rates, forecasted sales or usage, product end of life dates, estimated current and future market values and new product introductions. When
39
FLIR SYSTEMS, INC.
NOTES TO THE CONSOLIDATED FINANCIAL STATEMENTS—(Continued)
| Note 1. | Nature of Business and Significant Accounting Policies—(Continued) |
Inventories—(Continued)
recorded, write-downs reduce the carrying value of the Company’s inventories to their net realizable value and create a new cost-basis in the inventories. Write-downs are reflected in cost of goods sold in the Consolidated Statements of Income.
Demonstration units
The Company’s products which are being used as demonstration units are stated at the lower of cost or market and are included in prepaid expenses and other current assets in the Consolidated Balance Sheets. Demonstration units are available for sale and the Company periodically evaluates them as to marketability and realizable values. The carrying value of demonstration units was $23.6 million and $20.4 million at December 31, 2009 and 2008, respectively.
Property and equipment
Property and equipment are stated at cost and are depreciated using a straight-line methodology over their estimated useful lives. Repairs and maintenance are charged to expense as incurred.
Goodwill
Goodwill is reviewed in June of each year, or more frequently if required, for impairment to determine if events or changes in business conditions indicate that the carrying value of the assets may not be recoverable.
Intangible assets
Intangible assets, other than goodwill, are amortized using a straight-line methodology over their estimated useful lives.
Long-lived assets
Long-lived assets are reviewed for impairment when circumstances indicate that the carrying amounts may not be recoverable. Impairment exists when the carrying value is greater than the expected undiscounted future cash flows expected to be provided by the asset. If impairment exists, the asset is written down to its fair value.
Advertising costs
Advertising costs, which are included in selling, general and administrative expenses, are expensed as incurred. Advertising costs for the years ended December 31, 2009, 2008 and 2007 were $8.2 million, $7.3 million and $5.7 million, respectively.
Cost-basis investments
The Company has three private company investments, which consist of investments for which the Company does not have the ability to exercise significant influence, and are accounted for under the cost method. The investments are carried at cost and adjusted only when the Company believes that events have occurred that are likely to have a significant other-than-temporary adverse effect on the estimated fair value of the investments. If
40
FLIR SYSTEMS, INC.
NOTES TO THE CONSOLIDATED FINANCIAL STATEMENTS—(Continued)
| Note 1. | Nature of Business and Significant Accounting Policies—(Continued) |
Cost-basis investments—(Continued)
no such events have occurred, the fair value of the investments are not calculated as it is not practicable to do so. The carrying value of those investments at December 31, 2009 and 2008 was $9.2 million and $8.9 million, respectively. The investments are included in other assets in the Consolidated Balance Sheets.
Contigencies
The Company is subject to the possibility of loss contingencies arising in the normal course of business. An estimated loss is accrued when the Company determines that it is probable that an asset has been impaired or a liability has been incurred and the amount can be reasonably estimated. The Company regularly evaluates current available information to determine whether such accruals should be adjusted.
Earnings per share
Basic earnings per share is based on the weighted average number of shares of common stock outstanding during the period. Diluted earnings per share is computed similar to basic earnings per share except that the weighted shares outstanding are increased to include additional shares from the assumed exercise of stock options, if dilutive, assumed issuance of unvested restricted stock awards and from the assumed conversion of the convertible notes.
The number of additional shares from the assumed exercise of stock options is calculated by assuming that outstanding stock options were exercised and that the proceeds from such exercises and unrecognized compensation expense of unvested options were considered to be proceeds used to acquire shares of common stock at the average market price during the reporting period.
The number of additional shares from the assumed vesting of unvested restricted stock awards is calculated by assuming that all unvested restricted stock awards have vested and that the unrecognized compensation expense of these awards is considered to be proceeds used to acquire shares of common stock at the average market price during the reporting period.
The conversion of the convertible notes is assumed to have taken place as of the date that the convertible notes were issued. In addition, net earnings used for purposes of computing diluted earnings per share is net earnings adjusted for interest costs of the convertible notes, net of statutory tax, as if the conversion had taken place as of the date that the convertible notes were issued.
41
FLIR SYSTEMS, INC.
NOTES TO THE CONSOLIDATED FINANCIAL STATEMENTS—(Continued)
| Note 1. | Nature of Business and Significant Accounting Policies—(Continued) |
Earnings per share—(Continued)
The following table sets forth the reconciliation of the numerator and denominator utilized in the computation of basic and diluted earnings per share (in thousands):
| Year Ended December 31, | |||||||||
| 2009 | 2008 | 2007 | |||||||
| (As Adjusted) | (As Adjusted) | ||||||||
| Numerator for earnings per share: |
|||||||||
| Net earnings, as reported |
$ | 230,213 | $ | 200,900 | $ | 133,572 | |||
| Interest associated with convertible notes, net of tax |
3,585 | 7,250 | 7,565 | ||||||
| Net earnings available to common shareholders— diluted |
$ | 233,798 | $ | 208,150 | $ | 141,137 | |||
| Denominator for earnings per share: |
|||||||||
| Weighted average number of common shares outstanding |
149,405 | 138,490 | 134,244 | ||||||
| Assumed exercise of stock options and vesting of restricted stock awards, net of shares assumed reacquired under the treasury stock method |
3,518 | 5,591 | 6,071 | ||||||
| Assumed conversion of convertible notes |
8,646 | 18,820 | 18,926 | ||||||
| Diluted shares outstanding |
161,569 | 162,901 | 159,241 | ||||||
The effect of stock options for the years ended December 31, 2009 and 2008 that aggregated 515,000 and 9,000 have been excluded for purposes of diluted earnings per share since the effect would have been anti-dilutive. For the year ended December 31, 2007, there were no stock options excluded.
Supplemental cash flow disclosure (in thousands)
| Year Ended December 31, | |||||||||
| 2009 | 2008 | 2007 | |||||||
| Cash paid for: |
|||||||||
| Interest |
$ | 2,972 | $ | 7,108 | $ | 8,236 | |||
| Taxes |
$ | 116,733 | $ | 83,644 | $ | 58,401 | |||
| Non-cash transactions: |
|||||||||
| Conversion of convertible notes to common stock |
$ | 132,637 | $ | 18,577 | $ | 4 | |||
Stock-based compensation
The Company uses the Black-Scholes option pricing model to estimate the fair value of all stock-based compensation awards on the date of grant, except for restricted stock unit awards which are valued at the fair market value of the Company’s common stock on the date of grant. The Company recognizes the compensation expense for time-based options and restricted stock unit awards on a straight-line basis over the requisite service period of each award. The compensation expense for each tranche of performance-based options is recognized over the vesting period of the applicable tranche because each tranche is independent of the others and if the performance criteria in a particular year are not met, the related tranche does not vest.
42
FLIR SYSTEMS, INC.
NOTES TO THE CONSOLIDATED FINANCIAL STATEMENTS—(Continued)
| Note 1. | Nature of Business and Significant Accounting Policies—(Continued) |
Stock-based compensation—(Continued)
The following table sets forth the stock-based compensation expense and related tax benefit recognized in the Consolidated Statements of Income for the years ended December 31, 2009, 2008 and 2007 (in thousands):
| Year Ended December 31, | ||||||||||||
| 2009 | 2008 | 2007 | ||||||||||
| Cost of goods sold |
$ | 3,297 | $ | 2,721 | $ | 2,124 | ||||||
| Research and development |
4,943 | 4,882 | 4,033 | |||||||||
| Selling, general and administrative |
15,715 | 13,371 | 9,159 | |||||||||
| Stock-based compensation expense before income taxes |
23,955 | 20,974 | 15,316 | |||||||||
| Income tax benefit |
(7,011 | ) | (5,589 | ) | (3,286 | ) | ||||||
| Total stock-based compensation expense after income taxes |
$ | 16,944 | $ | 15,385 | $ | 12,030 | ||||||
Stock-based compensation expense capitalized in the Consolidated Balance Sheets as of December 31, 2009, 2008 and 2007 is as follows (in thousands):
| December 31, | |||||||||
| 2009 | 2008 | 2007 | |||||||
| Capitalized in inventory |
$ | 896 | $ | 963 | $ | 786 | |||
As of December 31, 2009, the Company had approximately $32.7 million of total unrecognized stock-based compensation costs, net of estimated forfeitures, to be recognized over a weighted average period of 1.8 years.
The fair value of the stock-based awards, as determined under the Black-Scholes model, granted in the years ended December 31, 2009, 2008 and 2007 reported above was estimated with the following weighted-average assumptions:
| 2009 | 2008 | 2007 | |||||||
| Stock option awards: |
|||||||||
| Risk-free interest rate |
1.5 | % | 2.8 | % | 4.6 | % | |||
| Expected dividend yield |
0.0 | % | 0.0 | % | 0.0 | % | |||
| Expected term |
4.3 years | 4.1 years | 3.6 years | ||||||
| Expected volatility |
46.9 | % | 40.8 | % | 39.0 | % | |||
| Employee stock purchase plan: |
|||||||||
| Risk-free interest rate |
0.25 | % | 1.4 | % | 4.6 | % | |||
| Expected dividend yield |
0.0 | % | 0.0 | % | 0.0 | % | |||
| Expected term |
6 months | 6 months | 6 months | ||||||
| Expected volatility |
49.5 | % | 56.0 | % | 36.2 | % |
The Company uses the United States Treasury (constant maturity) interest rate on the date of grant as the risk-free interest rate and uses historical volatility as the expected volatility. The Company’s determination of expected term is based on an analysis of historical and expected exercise patterns. In 2009, approximately 30 percent of stock options granted were performance-based options and approximately 70 percent were time-based options. In 2008, all stock options granted were performance-based options and in 2007, approximately 80 percent of stock options granted were performance-based options and approximately 20 percent were time-based options. The difference in the nature of these awards has been taken into consideration in determining the expected term. The Company uses an estimated forfeiture rate of 5 percent of the stock-compensation expense of non-executive employees based on an analysis of historical and expected forfeitures.
43
FLIR SYSTEMS, INC.
NOTES TO THE CONSOLIDATED FINANCIAL STATEMENTS—(Continued)
| Note 1. | Nature of Business and Significant Accounting Policies—(Continued) |
Stock-based compensation—(Continued)
The weighted-average fair value of stock-based compensation awards granted and vested, and the intrinsic value of options exercised during the period were (in thousands, except per share amounts):
| Years Ended December 31, | |||||||||
| 2009 | 2008 | 2007 | |||||||
| Stock option awards: |
|||||||||
| Weighted average grant date fair value per share |
$ | 9.96 | $ | 12.25 | $ | 7.23 | |||
| Total fair value of awards granted |
$ | 10,534 | $ | 7,175 | $ | 5,738 | |||
| Total fair value of awards vested |
$ | 6,964 | $ | 8,243 | $ | 7,040 | |||
| Total intrinsic value of options exercised |
$ | 34,648 | $ | 93,023 | $ | 76,447 | |||
| Restricted stock unit awards: |
|||||||||
| Weighted average grant date fair value per share |
$ | 25.38 | $ | 34.31 | $ | 21.17 | |||
| Total fair value of awards granted |
$ | 16,793 | $ | 18,981 | $ | 14,178 | |||
| Employee stock purchase plan: |
|||||||||
| Weighted average grant date fair value per share |
$ | 8.37 | $ | 10.48 | $ | 7.12 | |||
| Total fair value of shares estimated to be issued |
$ | 1,073 | $ | 2,073 | $ | 1,467 | |||
The total amount of cash received from the exercise of stock options in the years ended December 31, 2009, 2008 and 2007 was $17.0 million, $36.7 million and $38.9 million, respectively, and the related tax benefit realized from the exercise of the stock options was $9.2 million, $27.4 million and $18.1 million, respectively.
The Company elected to adopt the “long-haul” method to calculate the historical pool of windfall tax benefits, which calculates on a grant by grant basis, the windfall or excess tax benefit that arose upon the exercise of each stock option, based on a comparison to the total tax deduction to the “as-if” deferred tax asset that would have been recorded had the Company followed the recognition provisions of Financial Accounting Standards Board Accounting Standards Codification (“FASB ASC”) Topic 718, “Compensation-Stock Compensation,” since its effective date of January 1, 2006. Additionally, the Company elected to adopt the “tax-law ordering” method of measuring the timing in which tax deductions on stock option exercises should be recognized in the consolidated financial statements.
Concentration of risk
Financial instruments that potentially subject the Company to concentration of credit risk consist primarily of trade receivables. Concentration of credit risk with respect to trade receivables is limited because a relatively large number of geographically diverse customers make up the Company’s customer base, thus diversifying the trade credit risk. The Company controls credit risk through credit approvals, credit limits and monitoring procedures. The Company performs credit evaluations for all new customers and requires letters of credit, bank guarantees and advanced payments, if deemed necessary.
A substantial portion of the Company’s revenue is derived from sales to United States and foreign government agencies (see Note 17). The Company also purchases certain key components from sole or limited source suppliers.
The Company maintains cash deposits with major banks that from time to time may exceed federally insured limits. The Company periodically assesses the financial condition of the institutions and instruments in which it invests, and adjusts its investment balances to mitigate the risk of principal loss.
44
FLIR SYSTEMS, INC.
NOTES TO THE CONSOLIDATED FINANCIAL STATEMENTS—(Continued)
| Note 1. | Nature of Business and Significant Accounting Policies—(Continued) |
Use of estimates
The preparation of financial statements in conformity with United States generally accepted accounting principles requires management to make estimates and judgments that affect the reported amounts of assets and liabilities and disclosure of contingent assets and liabilities at the date of the financial statements, and the reported amounts of revenue and expenses during the reporting period. Significant estimates and judgments made by management of the Company include matters such as collectability of accounts receivable, realizability of inventories, recoverability of deferred tax assets, impairment of goodwill and other long-lived assets, loss contingencies and adequacy of warranty accruals. Actual results could differ from those estimates. The Company believes that the estimates used are reasonable.
Accumulated other comprehensive earnings (loss)
Accumulated other comprehensive earnings (loss) includes cumulative translation adjustments and changes in minimum liability for pension plans. Foreign currency translation adjustments included in comprehensive income were not tax affected as investments in international affiliates are deemed to be indefinite in duration.
Subsequent Events
The Company has performed a review for subsequent events through the date of the filing of these financial statements with the Securities and Exchange Commission on February 26, 2010.
Recent accounting pronouncements
In December 2007, the Financial Accounting Standards Board (the “FASB”) issued Accounting Standards Codification Topic 805, “Business Combinations” (“ASC Topic 805”), which revised the principles and requirements for how an acquirer in a business combination recognizes and measures in its financial statements the identifiable assets acquired, the liabilities assumed, and any controlling interest; recognizes and measures the goodwill acquired in the business combination or a gain from a bargain purchase; and determines what information to disclose to enable users of the financial statements to evaluate the nature and financial effects of the business combination. The Company has adopted ASC Topic 805 which is effective for business acquisitions for fiscal years beginning after December 31, 2008.
In June 2009, the FASB issued Accounting Standards Codification Topic 105, “Generally Accepted Accounting Principles” (“ASC Topic 105”), which establishes the FASB Accounting Standards CodificationTM (the “Codification”) as the source of authoritative U.S. generally accepted accounting principles (“GAAP”) recognized by the FASB to be applied by nongovernmental entities. Rules and interpretive releases of the Securities and Exchange Commission (“SEC”) under authority of federal securities laws are also sources of authoritative GAAP for SEC registrants. On the effective date, the Codification superseded all then-existing non-SEC accounting and reporting standards. All other non-grandfathered non-SEC accounting literature not included in the Codification became nonauthoritative. The Company has adopted ASC Topic 105, which is effective for financial statements issued for interim and annual periods ending after September 15, 2009.
In October 2009, the FASB issued Accounting Standards Update No. 2009-13, “Revenue Recognition (Topic 605): Multiple-Deliverable Revenue Arrangements—a consensus of the FASB Emerging Issues Task Force” (“ASU 2009-13”), which provides amendments to the criteria in Subtopic 605-25, “Revenue Recognition—Multiple-Element Arrangements,” for separating consideration in multiple-deliverable
45
FLIR SYSTEMS, INC.
NOTES TO THE CONSOLIDATED FINANCIAL STATEMENTS—(Continued)
| Note 1. | Nature of Business and Significant Accounting Policies—(Continued) |
Recent accounting pronouncements—(Continued)
arrangements and expands the disclosures related to multiple-deliverable revenue arrangements. ASU 2009-13 is effective prospectively for revenue arrangements entered into or materially modified in fiscal years beginning on or after June 15, 2010. Accordingly, the Company will adopt ASU 2009-13 on January 1, 2010. The Company’s adoption of ASU 2009-13 is not expected to have a material impact on its consolidated financial statements.
In October 2009, the FASB issued Accounting Standards Update No. 2009-14, “Software (Topic 985): Certain Revenue Arrangements That Include Software Elements—a consensus of the FASB Emerging Issues Task Force” (“ASU 2009-14”), which changes the accounting model for revenue arrangements that include both tangible products and software elements. ASU 2009-14 is effective prospectively for revenue arrangements entered into or materially modified in fiscal years beginning on or after June 15, 2010. Accordingly, the Company will adopt ASU 2009-14 on January 1, 2011. The Company’s adoption of ASU 2009-14 is not expected to have a material impact on its consolidated financial statements.
| Note 2. | Accounting for Convertible Debt |
On January 1, 2009, the Company adopted the provisions of the Financial Accounting Standards Board Accounting Standards Codification Subtopic 470-20, “Debt with Conversion and Other Options” (“ASC Subtopic 470-20”). ASC Subtopic 470-20 requires that issuers of convertible debt instruments that may be settled in cash should separately account for the liability and equity components in a manner that reflects the entity’s nonconvertible debt borrowing rate when interest cost is recognized in subsequent periods. ASC Subtopic 470-20 was effective for financial statements issued for fiscal years beginning after December 15, 2008 with retrospective application required.
In June 2003, the Company issued $210 million of 3.0 percent senior convertible notes due in 2023. The net proceeds from the issuance were approximately $203.9 million. The Company has determined that the expected life of the notes should be seven years since the notes are first redeemable in June 2010. The Company estimates that its nonconvertible borrowing rate for debt with a seven year maturity issued in June 2003 was 6.0 percent. Accordingly, the value of the liability component of the notes at the time of issuance was $174.4 million and the value of the equity component was $35.6 million.
The Company has retrospectively applied the provisions of ASC Subtopic 470-20 to its financial statements beginning in 2003 when the notes were issued. The retrospective application includes the separation of the liability and equity components of the convertible notes, the reallocation of the $6.1 million of issuance costs between the liability and equity components, an increase in interest expense for periods subsequent to issuance to reflect the estimated nonconvertible borrowing rate, and the related tax effects.
ASC Subtopic 470-20 also requires that when debt is extinguished, a gain or loss is recognized for the difference between the fair value of the liability component and its carrying value. The Company’s retrospective application, therefore, also includes the impact of conversions of notes with an aggregate principal amount of $18.6 million prior to January 1, 2009.
46
FLIR SYSTEMS, INC.
NOTES TO THE CONSOLIDATED FINANCIAL STATEMENTS—(Continued)
| Note 2. | Accounting for Convertible Debt—(Continued) |
The carrying amounts of the convertible notes are as follows (in thousands):
| December 31, 2009 |
December 31, 2008 |
|||||||
| Liability component: |
||||||||
| Principal amount |
$ | 58,782 | $ | 191,419 | ||||
| Unamortized discount |
(706 | ) | (7,682 | ) | ||||
| Unamortized issuance costs |
(85 | ) | (942 | ) | ||||
| $ | 57,991 | $ | 182,795 | |||||
| Equity component |
$ | (119,724 | ) | $ | 222 | |||
The unamortized discount and issuance costs will be amortized through June 2010. The unamortized balance of such costs is shown as a reduction to the carrying amount of the convertible notes. As of December 31, 2009, 5.3 million shares of the Company’s common stock were issuable upon conversion of the remaining notes, valued at $173.4 million as of the closing market price on that day. The $173.4 million is in excess of the principal amount by $114.6 million.
The effective interest rate of the convertible notes is 6.0 percent. Interest and amortization expense of the convertible notes recognized in the Consolidated Statements of Income are as follows (in thousands):
| Year Ended December 31, | |||||||||
| 2009 | 2008 | 2007 | |||||||
| Cash interest (3% coupon) |
$ | 2,558 | $ | 6,284 | $ | 6,300 | |||
| Amortization of discount |
2,594 | 5,502 | 5,225 | ||||||
| Amortization of issuance costs |
324 | 724 | 729 | ||||||
| $ | 5,476 | $ | 12,510 | $ | 12,254 | ||||
The following table presents the effect of the retrospective application of ASC Subtopic 470-20 and related tax effects made to the Company’s previously reported Consolidated Statements of Income for the years ended December 31, 2008 and 2007 (in thousands):
| Year Ended December 31, | ||||||||||||||||
| 2008 | 2007 | |||||||||||||||
| As Reported | As Adjusted | As Reported | As Adjusted | |||||||||||||
| Earnings from operations |
$ | 284,491 | $ | 284,491 | $ | 191,832 | $ | 191,832 | ||||||||
| Interest expense |
8,987 | 14,336 | 10,230 | 15,309 | ||||||||||||
| Interest income and other income, net |
(19,383 | ) | (20,163 | ) | (9,551 | ) | (9,551 | ) | ||||||||
| Earnings before income taxes |
294,887 | 290,318 | 191,153 | 186,074 | ||||||||||||
| Income tax provision |
91,154 | 89,418 | 54,442 | 52,502 | ||||||||||||
| Net earnings |
$ | 203,733 | $ | 200,900 | $ | 136,711 | $ | 133,572 | ||||||||
| Net earnings per share: |
||||||||||||||||
| Basic |
$ | 1.47 | $ | 1.45 | $ | 1.02 | $ | 0.99 | ||||||||
| Diluted |
$ | 1.28 | $ | 1.28 | $ | 0.89 | $ | 0.89 | ||||||||
47
FLIR SYSTEMS, INC.
NOTES TO THE CONSOLIDATED FINANCIAL STATEMENTS—(Continued)
| Note 2. | Accounting for Convertible Debt—(Continued) |
The following table presents the effect of the retrospective application of ASC Subtopic 470-20 and related tax effects made to the Company’s previously reported Consolidated Balance Sheet as of December 31, 2008 (in thousands):
| December 31, 2008 | ||||||
| As Reported | As Adjusted | |||||
| Long-term deferred income taxes, net |
$ | 5,047 | $ | 2,217 | ||
| Total assets |
1,243,907 | 1,241,077 | ||||
| Long-term debt |
190,318 | 182,825 | ||||
| Common stock and additional paid-in capital |
262,509 | 282,849 | ||||
| Retained earnings |
592,766 | 577,090 | ||||
| Total shareholders’ equity |
840,062 | 844,725 | ||||
| Total liabilities and shareholders’ equity |
1,243,907 | 1,241,077 | ||||
The following table presents the effect of the retrospective application of ASC Subtopic 470-20 and related tax effects made to the Company’s previously reported Consolidated Statements of Shareholders’ Equity and Comprehensive Earnings as of December 31, 2006 (in thousands):
| December 31, 2006 | ||||||
| As Reported | As Adjusted | |||||
| Common stock and additional paid-in capital |
$ | 126,090 | $ | 147,395 | ||
| Retained earnings |
252,322 | 242,618 | ||||
| Total shareholders’ equity |
398,752 | 410,352 | ||||
The following table presents the effect of the retrospective application of ASC Subtopic 470-20 and related tax effects made to the Company’s previously reported Consolidated Statement of Cash Flows for the years ended December 31, 2008 and 2007 (in thousands):
| Year Ended December 31, | |||||||||||||||
| 2008 | 2007 | ||||||||||||||
| As Reported | As Adjusted | As Reported | As Adjusted | ||||||||||||
| Net earnings |
$ | 203,733 | $ | 200,900 | $ | 136,711 | $ | 133,572 | |||||||
| Depreciation and amortization |
39,974 | 45,323 | 25,908 | 30,987 | |||||||||||
| Deferred taxes |
(6,721 | ) | (8,756 | ) | 1,735 | (205 | ) | ||||||||
| Other non-cash items |
(104 | ) | (450 | ) | — | 98 | |||||||||
| Cash provided from operating activities |
218,316 | 218,316 | 116,103 | 116,103 | |||||||||||
| Note 3. | Fair Value of Financial Instruments |
Cash equivalents at December 31, 2009 and 2008 were $313.6 million and $205.7, respectively. The Company has categorized its cash and cash equivalents as a Level 1 financial asset, measured at fair value based on quoted prices in active markets of identical assets, in accordance with FASB ASC Topic 820, “Fair Value Measurements and Disclosures.” All cash equivalents are in instruments that are convertible to cash daily. The Company does not have any other material financial assets or liabilities that are measured at fair value.
The carrying amount of accounts receivable, accounts payable and accrued payroll and related liabilities approximates the fair value of those instruments due to their short-term nature. The fair value of the foreign
48
FLIR SYSTEMS, INC.
NOTES TO THE CONSOLIDATED FINANCIAL STATEMENTS—(Continued)
| Note 3. | Fair Value of Financial Instruments—(Continued) |
currency exchange contracts as of December 31, 2009 are not significant. The fair value of the convertible notes included in long-term debt is estimated based on quoted market prices of the convertible notes. At December 31, 2009, the fair value of the convertible notes was approximately $173.4 million.
| Note 4. | Accounts Receivable |
Accounts receivable are net of an allowance for doubtful accounts. The following table summarizes the Company’s allowance for doubtful accounts and the activity for 2009, 2008 and 2007 (in thousands):
| Year Ended December 31, | ||||||||||||
| 2009 | 2008 | 2007 | ||||||||||
| Allowance for doubtful accounts, beginning of year |
$ | 1,294 | $ | 1,327 | $ | 1,602 | ||||||
| Charges to costs and expenses |
1,056 | 678 | 7 | |||||||||
| Write-offs of uncollectible accounts, net of recoveries |
(485 | ) | (527 | ) | (375 | ) | ||||||
| Currency translation adjustments |
92 | (184 | ) | 93 | ||||||||
| Allowance for doubtful accounts, end of year |
$ | 1,957 | $ | 1,294 | $ | 1,327 | ||||||
Note 5. Inventories
Inventories consist of the following (in thousands):
| December 31, | ||||||
| 2009 | 2008 | |||||
| Raw material and subassemblies |
$ | 144,555 | $ | 129,108 | ||
| Work-in-progress |
37,732 | 40,325 | ||||
| Finished goods |
34,213 | 38,054 | ||||
| $ | 216,500 | $ | 207,487 | |||
| Note 6. | Property and Equipment |
Property and equipment are summarized as follows (in thousands):
| Estimated Useful Life |
December 31, | |||||||||
| 2009 | 2008 | |||||||||
| Land |
— | $ | 6,942 | $ | 7,060 | |||||
| Buildings |
30 years | 39,208 | 33,585 | |||||||
| Machinery and equipment |
3 to 7 years | 116,458 | 102,651 | |||||||
| Office equipment and other |
3 to 7 years | 79,424 | 65,554 | |||||||
| 242,032 | 208,850 | |||||||||
| Less accumulated depreciation |
(102,920 | ) | (86,546 | ) | ||||||
| $ | 139,112 | $ | 122,304 | |||||||
Depreciation expense for the years ended December 31, 2009, 2008 and 2007 was $26.1 million, $23.1 million, $17.3 million, respectively.
49
FLIR SYSTEMS, INC.
NOTES TO THE CONSOLIDATED FINANCIAL STATEMENTS—(Continued)
| Note 7. | Goodwill |
During the year ended December 31, 2009, the Company recorded goodwill in connection with its acquisitions of Salvador Imaging, Inc., OmniTech Partners, Inc. and Infrared Korea, Ltd (see Note 18). The Company reviews its goodwill for impairment annually, or more frequently, if there is a triggering event. A two-step test is performed to assess goodwill for impairment. First, the fair value of the reporting unit is compared to its carrying value. If the fair value exceeds the carrying value, goodwill is not impaired and no further testing is required. The second step is performed if the carrying value exceeds the fair value. The implied fair value of the reporting unit’s goodwill must be determined and compared to the carrying value of the goodwill. If the carrying value of a reporting unit’s goodwill exceeds its implied fair value, an impairment loss equal to the difference will be recorded. In determining the fair value of the reporting units, the Company relied upon the Income Approach and the Market Approach. Under the Income Approach, the fair value of a business is based on the cash flows it can be expected to generate over its remaining life. The estimated cash flows are converted to their present value equivalent using an appropriate rate of return and are analyzed within the boundary of the overall market capitalization of the Company. Under the Market Approach, the fair value of the business is based on forecasted earnings multiplied by an average earnings multiplier of a group of the Company’s peers and compared to the carrying value of the goodwill.
As of June 30, 2009, the Company has determined that there is no impairment of its recorded goodwill and as of December 31, 2009, there have been no triggering events that would require an updated impairment review.
The carrying value of goodwill by reporting segment and the activity for the two year period ending December 31, 2009 is as follows (in thousands):
| Government Systems |
Thermography | Commercial Vision Systems |
Total | |||||||||||||
| Balance, December 31, 2007 |
$ | 8,295 | $ | 64,198 | $ | 103,737 | $ | 176,230 | ||||||||
| Goodwill from acquisitions |
5,548 | 44,911 | 7,593 | 58,052 | ||||||||||||
| Currency translation adjustments |
(1,041 | ) | (6,138 | ) | (716 | ) | (7,895 | ) | ||||||||
| Other activity |
— | (658 | ) | (44 | ) | (702 | ) | |||||||||
| Balance, December 31, 2008 |
12,802 | 102,313 | 110,570 | 225,685 | ||||||||||||
| Goodwill from acquisitions |
24,476 | 1,323 | 8,585 | 34,384 | ||||||||||||
| Currency translation adjustments |
306 | 2,448 | 107 | 2,861 | ||||||||||||
| Other activity |
— | (583 | ) | (16 | ) | (599 | ) | |||||||||
| Balance, December 31, 2009 |
$ | 37,584 | $ | 105,501 | $ | 119,246 | $ | 262,331 | ||||||||
50
FLIR SYSTEMS, INC.
NOTES TO THE CONSOLIDATED FINANCIAL STATEMENTS—(Continued)
| Note 8. | Intangible Assets |
Intangible assets are summarized as follows (in thousands):
| Weighted Average Estimated Useful Life |
December 31, | |||||||||
| 2009 | 2008 | |||||||||
| Product technology |
9 years | $ | 43,959 | $ | 38,375 | |||||
| Customer relationships |
7 years | 50,151 | 42,602 | |||||||
| Trademarks and tradename portfolios |
14 years | 7,947 | 8,431 | |||||||
| Other |
2 year | 2,580 | 2,827 | |||||||
| Acquired identifiable intangibles |
104,637 | 92,235 | ||||||||
| Less accumulated amortization |
(47,495 | ) | (38,604 | ) | ||||||
| Net acquired identifiable intangibles |
57,142 | 53,631 | ||||||||
| Patents |
17 years | 3,981 | 3,728 | |||||||
| Less accumulated amortization |
(2,850 | ) | (2,449 | ) | ||||||
| Net patents |
1,131 | 1,279 | ||||||||
| Cooperation agreement and other |
10 years | 3,554 | 3,678 | |||||||
| Less accumulated amortization |
(2,647 | ) | (2,414 | ) | ||||||
| Net cooperation agreement and other |
907 | 1,264 | ||||||||
| $ | 59,180 | $ | 56,174 | |||||||
During the year ended December 31, 2009, identifiable intangible assets acquired as part of acquisitions were (in thousands):
| Salvador Imaging, Inc. |
$ | 2,940 | |
| OmniTech Partners, Inc. |
13,470 | ||
| Infrared Korea, Ltd |
724 | ||
| $ | 17,134 | ||
The aggregate amortization expense recorded in 2009, 2008 and 2007 was $16.4 million, $16.8 million and $8.6 million, respectively. For intangible assets recorded at December 31, 2009, the estimated future aggregate amortization expense for the years ending December 31, 2010 through 2014 is approximately (in thousands):
| 2010 |
$ | 15,853 | |
| 2011 |
10,919 | ||
| 2012 |
9,607 | ||
| 2013 |
8,693 | ||
| 2014 |
5,135 |
The Company continually monitors for events and changes in circumstances that could indicate that the carrying amounts of the Company’s intangible assets may not be recoverable. When such events or changes in circumstances occur, the Company will assess the recoverability of intangible assets by determining whether the carrying value of such assets will be recovered through their expected future cash flows. If the future undiscounted cash flows are determined to be less than the carrying amount of the intangible assets, the Company will recognize an impairment loss based on the excess of the carrying amount over the fair value of the assets. The Company did not recognize any intangible asset impairment charges in the years ended December 31, 2009, 2008 and 2007.
51
FLIR SYSTEMS, INC.
NOTES TO THE CONSOLIDATED FINANCIAL STATEMENTS—(Continued)
| Note 9. | Credit Agreements |
On October 6, 2006, the Company signed a Credit Agreement (“Credit Agreement”) with Bank of America, N.A., Union Bank of California, N.A., U.S. Bank National Association and other Lenders. The Credit Agreement provides for a $300 million, five-year revolving line of credit. The Company has the right, subject to certain conditions including approval of additional commitments by qualified lenders, to increase the line of credit by an additional $150 million until October 6, 2011. The Credit Agreement includes a $100 million sublimit multicurrency option, permitting the Company and certain designated subsidiaries to borrow in euro, kroner, pound sterling and other agreed upon currencies. Under the Credit Agreement, borrowings will bear interest based upon the prime lending rate of the Bank of America or Eurodollar rates with a provision for a spread over Eurodollar rates based upon the Company’s leverage ratio. The Eurodollar interest rate was 1.001 percent and the prime lending rate was 3.25 percent at December 31, 2009. These rates were 2.175 percent and 3.25 percent, respectively, at December 31, 2008. The Credit Agreement requires the Company to pay a commitment fee on the amount of unused credit at a rate, based on the Company’s leverage ratio, which ranges from 0.175 percent to 0.325 percent. At December 31, 2009 and 2008, the commitment fee rate was 0.175 percent. The Credit Agreement contains five financial covenants that require the maintenance of certain leverage ratios, in addition to minimum levels of EBITDA and consolidated net worth, a maximum level of capital expenditures and, commencing December 31, 2009, a minimum level of liquidity comprised of cash and undrawn/unutilized availability under the Credit Agreement. The Credit Agreement is collateralized by substantially all assets of the Company. At December 31, 2009 and 2008, the Company had no amounts outstanding under the Credit Agreement. The Company had $7.8 million and $15.8 million of letters of credit outstanding under the Credit Agreement at December 31, 2009 and 2008, respectively, which reduces the total available credit.
The Company, through its Sweden subsidiary, has a 30 million Swedish kroner (approximately $4.2 million) line of credit with an interest rate at 0.95 percent at December 31, 2009. At December 31, 2009, the Company had no amounts outstanding on this line of credit. The 30 million Swedish kroner line of credit is secured primarily by accounts receivable and inventories of the Company’s Swedish subsidiary and is subject to automatic renewal on an annual basis.
| Note 10. | Accrued Product Warranties |
The Company generally provides a twelve month warranty on its products. A provision for the estimated future costs of warranty, based upon historical cost and product performance experience, is recorded when revenue is recognized. The following table summarizes the Company’s warranty liability and activity for 2009, 2008 and 2007 (in thousands):
| Year Ended December 31, | ||||||||||||
| 2009 | 2008 | 2007 | ||||||||||
| Accrued product warranties, beginning of year |
$ | 7,826 | $ | 6,594 | $ | 5,174 | ||||||
| Amounts paid for warranty services |
(8,426 | ) | (9,016 | ) | (7,573 | ) | ||||||
| Warranty provisions for products sold |
9,267 | 10,248 | 8,993 | |||||||||
| Accrued product warranties, end of year |
$ | 8,667 | $ | 7,826 | $ | 6,594 | ||||||
52
FLIR SYSTEMS, INC.
NOTES TO THE CONSOLIDATED FINANCIAL STATEMENTS—(Continued)
| Note 11. | Long-Term Debt |
Long-term debt consists of the following (in thousands):
| December 31, | ||||||||
| 2009 | 2008 | |||||||
| (As Adjusted) | ||||||||
| Convertible notes |
$ | 58,782 | $ | 191,419 | ||||
| Issuance cost and discount of the convertible notes |
(791 | ) | (8,624 | ) | ||||
| Other long-term debt |
31 | 30 | ||||||
| $ | 58,022 | $ | 182,825 | |||||
In June 2003, the Company issued $210 million of 3.0 percent senior convertible notes due in 2023 in a private offering pursuant to Rule 144A under the Securities Act of 1933, as amended. The net proceeds from the issuance were approximately $203.9 million. Interest is payable semiannually on June 1 and December 1 of each year. The holders of the notes may convert all or some of their notes into shares of the Company’s common stock at a conversion rate of 90.1224 shares per $1,000 principal amount of notes prior to the maturity date in certain circumstances. The Company may redeem for cash all or part of the notes on or after June 8, 2010. The Company’s convertible notes are eligible for conversion at the option of the note holders.
On February 5, 2009, the Company commenced an exchange offer for any and all of its outstanding convertible notes. Holders who elected to exchange their notes in this offer and whose notes were accepted for exchange by the Company received 90.1224 shares of the Company’s common stock and a cash payment of $20 per $1,000 principal amount of notes. The offer expired on March 9, 2009. Notes with an aggregate principal amount of $99.9 million were exchanged pursuant to the exchange offer and were converted into approximately 9.0 million shares of the Company’s common stock. The Company recognized a gain of $2.2 million from the extinguishment of the notes; the gain and the $2.0 million expense associated with the cash inducement are reported in other income, net in the Consolidated Statements of Income.
In addition, in July 2009, convertible notes with an aggregate principal amount of $30.1 million were converted into approximately 2.7 million shares of the Company’s common stock, and in December 2009, convertible notes with an aggregate principal amount of $2.7 million were converted into 244,000 shares of the Company’s common stock. As of December 31, 2009, notes with an aggregate principal amount of $151.2 million have been converted into approximately 13.6 million shares of the Company’s common stock.
The convertible notes are classified as a long-term liability in the Consolidated Balance Sheet because the stated contractual maturity is in 2023; however, the Company anticipates that all remaining note holders will exercise their option to convert in June 2010.
| Note 12. | Commitments |
The Company leases some of its primary facilities under various operating leases that expire in 2010 through 2018. The Company also leases certain operating machinery and equipment and office equipment under operating lease agreements. Total net rent expense for the years ended December 31, 2009, 2008 and 2007 amounted to $10.1 million, $10.5 million and $8.5 million, respectively.
53
FLIR SYSTEMS, INC.
NOTES TO THE CONSOLIDATED FINANCIAL STATEMENTS—(Continued)
| Note 12. | Commitments—(Continued) |
The future minimum obligations under all non-cancelable leases, net of expected sublease income, and other contractual obligations are as follows (in thousands):
| Net Operating Leases |
Other Contractual Obligations | |||||
| 2010 |
$ | 10,149 | $ | 569 | ||
| 2011 |
7,527 | 579 | ||||
| 2012 |
7,090 | 550 | ||||
| 2013 |
3,738 | 550 | ||||
| 2014 |
2,821 | 550 | ||||
| Thereafter |
1,548 | 1,375 | ||||
| Total minimum payments |
$ | 32,873 | $ | 4,173 | ||
| Note 13. | Contingencies |
The Company and its subsidiary, Indigo Systems Corporation (now known as FLIR Commercial Systems, Inc.) (together, the “FLIR Parties”), were named in a lawsuit filed by Raytheon Company on March 2, 2007, in the United States District Court for the Eastern District of Texas. On August 11, 2008, Raytheon Company was granted leave to file a second amended complaint. The complaint, as amended, asserted claims for tortious interference, patent infringement, trade secret misappropriation, unfair competition, breach of contract and fraudulent concealment. The FLIR Parties filed an answer to the second amended complaint and counterclaims on September 2, 2008, in which they denied all material allegations. On August 31, 2009, the court entered an order granting the FLIR Parties’ motion for summary judgment on Raytheon’s trade secret misappropriation claim based on the FLIR Parties’ statute of limitations defense. Raytheon has abandoned all of its other claims except its patent claims which are currently set for trial to commence on April 19, 2010. The Company intends to vigorously defend itself in this matter and is unable to estimate the amount or range of potential loss, if any, which might result if the outcome in this matter is unfavorable.
The Company is also subject to other legal proceedings, claims and litigation arising in the ordinary course of business. The Company makes a provision for a liability when it is both probable that a liability has been incurred and the amount of loss can be reasonably estimated. The Company believes it has recorded adequate provisions for any probable and estimable losses. While the outcome of these matters is currently not determinable, the Company does not expect that the ultimate costs to resolve such matters will have a material adverse effect on the Company’s financial position, results of operations or cash flows.
| Note 14. | Income Taxes |
The Company recognizes deferred tax assets and liabilities for the expected future tax consequences of events and basis differences that have been recognized in the Company’s financial statements and tax returns. Under this method, deferred tax assets and liabilities are determined based on the difference between the financial statement carrying amount and the tax basis of assets and liabilities using the enacted tax rates in effect in the years in which the differences are expected to reverse.
54
FLIR SYSTEMS, INC.
NOTES TO THE CONSOLIDATED FINANCIAL STATEMENTS—(Continued)
| Note 14. | Income Taxes—(Continued) |
Pre-tax earnings by significant geographical locations are as follows (in thousands):
| Year Ended December 31, | |||||||||
| 2009 | 2008 | 2007 | |||||||
| (As Adjusted) | (As Adjusted) | ||||||||
| United States |
$ | 241,470 | $ | 195,356 | $ | 113,019 | |||
| Foreign |
98,923 | 94,962 | 73,055 | ||||||
| $ | 340,393 | $ | 290,318 | $ | 186,074 | ||||
The provisions for income taxes are as follows (in thousands):
| Year Ended December 31, | ||||||||||||
| 2009 | 2008 | 2007 | ||||||||||
| (As Adjusted) | (As Adjusted) | |||||||||||
| Current tax expense: |
||||||||||||
| Federal |
$ | 75,698 | $ | 73,039 | $ | 37,604 | ||||||
| State |
10,621 | 7,171 | 884 | |||||||||
| Foreign |
24,931 | 17,298 | 14,536 | |||||||||
| 111,250 | 97,508 | 53,024 | ||||||||||
| Deferred tax expense (benefit): |
||||||||||||
| Federal |
1,744 | (7,824 | ) | (2,113 | ) | |||||||
| State |
92 | (67 | ) | 1,522 | ||||||||
| Foreign |
(2,906 | ) | (199 | ) | 69 | |||||||
| (1,070 | ) | (8,090 | ) | (522 | ) | |||||||
| Total provision |
$ | 110,180 | $ | 89,418 | $ | 52,502 | ||||||
55
FLIR SYSTEMS, INC.
NOTES TO THE CONSOLIDATED FINANCIAL STATEMENTS—(Continued)
| Note 14. | Income Taxes—(Continued) |
Deferred tax assets (liabilities) are composed of the following components (in thousands):
| December 31, | ||||||||
| 2009 | 2008 | |||||||
| Allowance for doubtful accounts |
$ | 364 | $ | 326 | ||||
| Accrued product warranties |
2,412 | 1,972 | ||||||
| Inventory basis differences |
5,399 | 7,586 | ||||||
| Accrued liabilities |
4,056 | 5,175 | ||||||
| Deferred revenue |
2,407 | 2,156 | ||||||
| Other |
(1,407 | ) | (649 | ) | ||||
| Net current deferred tax assets |
$ | 13,231 | $ | 16,566 | ||||
| Foreign accrued liabilities |
$ | 310 | — | |||||
| Foreign intangibles |
(919 | ) | — | |||||
| Foreign other |
90 | — | ||||||
| Net current deferred tax liabilities |
$ | (519 | ) | — | ||||
| (As Adjusted) | ||||||||
| Net operating loss carry-forwards |
$ | 2,164 | $ | 905 | ||||
| Credit carry-forwards |
— | 538 | ||||||
| Domestic depreciation |
(10,745 | ) | (6,030 | ) | ||||
| Supplemental Executive Retirement Plan |
6,942 | 6,489 | ||||||
| Stock-based compensation |
7,233 | 6,370 | ||||||
| Intangibles |
(7,042 | ) | (8,134 | ) | ||||
| Deferred revenue |
4,077 | 3,617 | ||||||
| Other |
2,693 | (1,538 | ) | |||||
| Net long-term deferred tax assets |
$ | 5,322 | $ | 2,217 | ||||
| Foreign net operating loss recapture |
$ | (499 | ) | $ | (550 | ) | ||
| Foreign depreciation |
(574 | ) | (738 | ) | ||||
| Foreign stock-based compensation |
1,007 | 874 | ||||||
| Foreign social costs |
(1,285 | ) | (1,425 | ) | ||||
| Foreign statutory reserves |
— | (2,594 | ) | |||||
| Foreign intangibles |
(2,539 | ) | (3,307 | ) | ||||
| Foreign pension |
146 | 214 | ||||||
| Foreign net operating loss carry-forwards |
682 | 969 | ||||||
| Foreign other |
840 | 574 | ||||||
| Long-term deferred tax liabilities |
$ | (2,222 | ) | $ | (5,983 | ) | ||
56
FLIR SYSTEMS, INC.
NOTES TO THE CONSOLIDATED FINANCIAL STATEMENTS—(Continued)
| Note 14. | Income Taxes—(Continued) |
The provision for income taxes differs from the amount of tax determined by applying the applicable United States statutory federal income tax rate to pretax income as a result of the following differences:
| Year Ended December 31, | |||||||||
| 2009 | 2008 | 2007 | |||||||
| (As Adjusted) |
(As Adjusted) |
||||||||
| Statutory federal tax rate |
35.0 | % | 35.0 | % | 35.0 | % | |||
| Increase (decrease) in rates resulting from: |
|||||||||
| Foreign rate differential |
(4.0 | ) | (6.6 | ) | (7.7 | ) | |||
| Federal and state income tax credits |
(4.7 | ) | (1.2 | ) | (1.5 | ) | |||
| State taxes |
2.6 | 1.9 | 1.5 | ||||||
| Non-deductible expenses |
3.0 | 1.6 | 1.6 | ||||||
| Other |
0.5 | 0.1 | (0.7 | ) | |||||
| Effective tax rate |
32.4 | % | 30.8 | % | 28.2 | % | |||
At December 31, 2009, the Company had United States tax net operating loss carry-forwards totaling approximately $5.8 million which expire in 2029. In addition, the Company has Colorado state net operating loss carry-forwards totaling approximately $3.9 million which expire in 2029.
The tax benefits described above are recorded as an asset when the benefits are more likely than not to be recognized. To the extent that management assesses the realization of such assets to not be more likely than not, a valuation allowance is required to be recorded. The Company believes that the net deferred tax assets of $18.6 million reflected on the December 31, 2009 Consolidated Balance Sheet, are realizable based on future forecasts of taxable income over a relatively short time horizon and has not recorded a valuation allowance. The Company may be required to record a valuation allowance against the deferred tax assets in future periods if its future forecasts of taxable income are not achieved.
United States income taxes have not been provided on accumulated undistributed earnings of certain subsidiaries outside the United States, as the Company currently intends to reinvest the earnings in operations outside the United States indefinitely. As of December 31, 2009, the cumulative amount of earnings upon which United States income taxes have not been provided is approximately $320.3 million. Determination of the amount of unrecognized deferred tax liability related to these earnings is not practicable.
The following table summarizes the activity related to unrecognized tax benefits (in thousands):
| Year Ended December 31, | ||||||||||||
| 2009 | 2008 | 2007 | ||||||||||
| Balance, beginning of year |
$ | 5,697 | $ | 4,276 | $ | 5,995 | ||||||
| Increases related to current year tax positions |
2,528 | 1,333 | 2,971 | |||||||||
| Increases related to prior year tax positions |
227 | 19 | 871 | |||||||||
| Decreases related to prior year tax positions |
(29 | ) | (112 | ) | (4,253 | ) | ||||||
| Settlements |
(126 | ) | — | — | ||||||||
| Reclassification to income tax receivable |
— | 181 | (1,308 | ) | ||||||||
| Balance, end of year |
$ | 8,297 | $ | 5,697 | $ | 4,276 | ||||||
The unrecognized tax benefits at December 31, 2009 relate to the United States jurisdiction.
57
FLIR SYSTEMS, INC.
NOTES TO THE CONSOLIDATED FINANCIAL STATEMENTS—(Continued)
| Note 14. | Income Taxes—(Continued) |
Approximately $3.7 million of the above tax positions are expected to reverse during the next 12 month period due to the expiration of the statute of limitations and are recorded as current accrued income taxes on the Consolidated Balance Sheet as of December 31, 2009.
As of December 31, 2009, the Company had approximately $8.3 million of unrecognized tax benefits, all of which would affect the Company’s effective tax rate if recognized. Over the next twelve months, the Company expects to have increases to its unrecognized tax benefits consistent with prior year increases, including increases for interest and penalties.
The Company classifies interest and penalties related to uncertain tax positions in income tax expense. As of December 31, 2009, the Company had $786,000 of accrued interest ($510,000 net of federal and state benefits) related to uncertain tax positions that is recorded as current and non-current accrued income taxes on the Consolidated Balance Sheet.
The Company files United States, state and foreign income tax returns in jurisdictions with varying statutes of limitations. The Company currently has the following tax years open to examination by major taxing jurisdictions:
| Tax Years: | ||
| United States Federal |
1999 – 2008 | |
| State of Oregon |
1999 – 2008 | |
| State of Massachusetts |
2005 – 2008 | |
| State of California |
2004 – 2008 | |
| Sweden |
2003 – 2008 | |
| United Kingdom |
2007 – 2008 | |
| Germany |
2004 – 2008 |
| Note 15. | Stock-based Compensation |
Stock Incentive Plans
The Company has a stock-based compensation program that provides equity incentives for employees, consultants and directors. This program includes incentive and non-statutory stock options and nonvested stock awards (referred to as restricted stock unit awards) granted under three plans: the FLIR Systems, Inc. 1992 Stock Incentive Plan (the “1992 Plan”), the FLIR Systems, Inc. 1993 Stock Option Plan for Non-Employee Directors (the “1993 Plan”) and the FLIR Systems, Inc. 2002 Stock Incentive Plan (the “2002 Plan”). Prior to January 1, 2006, all stock options granted were time-based with vesting schedules ranging from immediate vesting to vesting over three years and generally expired ten years from the grant date. The Company has discontinued issuing option awards out of the 1992 Plan and the 1993 Plan, but previously granted options under those plans remain outstanding until their expiration.
During 2006, the Company also began granting performance-based options and time-based restricted stock unit awards. The vesting of performance-based options is contingent upon meeting certain diluted earnings per share growth targets primarily in three independent tranches over a three year period and the options expire ten years from the grant date. The vesting of each tranche is not dependent on the other tranches. Restricted stock unit awards generally vest over a three year period. Shares issued as a result of stock option exercises and the distribution of vested restricted stock units are new shares.
58
FLIR SYSTEMS, INC.
NOTES TO THE CONSOLIDATED FINANCIAL STATEMENTS—(Continued)
| Note 15. | Stock-based Compensation—(Continued) |
Stock Incentive Plans—(Continued)
The Company also has stock options that it issued as replacement options in connection with the acquisition of Indigo Systems Corporation in 2004.
Information with respect to stock option activity for 2009 is as follows:
| Shares (in thousands) |
Weighted Average Exercise Price |
Weighted Average Remaining Contractual Term |
Aggregate Intrinsic Value (in thousands) | ||||||||
| Outstanding at December 31, 2008 |
9,218 | $ | 13.34 | 5.7 | |||||||
| Granted |
1,057 | 25.57 | |||||||||
| Exercised |
(1,873 | ) | 9.08 | ||||||||
| Forfeited |
(15 | ) | 25.07 | ||||||||
| Outstanding at December 31, 2009 |
8,387 | $ | 15.81 | 5.6 | $ | 142,786 | |||||
| Exercisable at December 31, 2009 |
6,866 | $ | 13.37 | 4.9 | $ | 133,318 | |||||
| Vested and expected to vest at December 31, 2009 |
8,311 | $ | 15.71 | 5.6 | $ | 142,313 | |||||
Information with respect to restricted stock unit activity for 2009 is as follows:
| Shares (in thousands) |
Weighted Average Grant Date Fair Value | |||||
| Outstanding at December 31, 2008 |
1,356 | $ | 23.98 | |||
| Granted |
661 | 25.38 | ||||
| Vested |
(758 | ) | 19.55 | |||
| Forfeited |
(33 | ) | 26.43 | |||
| Outstanding at December 31, 2009 |
1,226 | $ | 27.41 | |||
As of December 31, 2009, there are 11,563,000 shares of common stock reserved for future issuance under all of the stock incentive plans.
Employee Stock Purchase Plan
Additionally, the Company adopted an Employee Stock Purchase Plan in January 1999 (the “1999 ESPP”) which allowed employees to purchase shares of the Company’s common stock at 85 percent of the fair market value at the lower of either the date of enrollment or the purchase date. The 1999 ESPP expired for new offerings in January 2009. On May 1, 2009, the Company’s shareholders approved the FLIR Systems, Inc. 2009 Employee Stock Purchase Plan (the “2009 ESPP”), which incorporates substantially the same terms and conditions as the 1999 ESPP. The first offering period under the 2009 ESPP commenced on May 4, 2009. The Company has reserved 5,000,000 shares of common stock for issuance under the 2009 ESPP.
59
FLIR SYSTEMS, INC.
NOTES TO THE CONSOLIDATED FINANCIAL STATEMENTS—(Continued)
| Note 15. | Stock-based Compensation—(Continued) |
Employee Stock Purchase Plan—(Continued)
There were 135,000 shares issued under the 1999 ESPP and 127,000 shares issued under the 2009 ESPP during 2009 and 4,873,000 shares remain available under the 2009 ESPP at December 31, 2009 for future issuance. Shares issued for ESPP purchases are new shares.
| Note 16. | Other Employee Benefit Plans |
Employee 401(k) Plans
The Company has a 401(k) Savings and Retirement Plan (the “Plan”) to provide for voluntary salary deferral contributions on a pre-tax basis for employees within the United States in accordance with Section 401(k) of the Internal Revenue Code of 1986, as amended. The Plan allows for contributions by the Company. The Company made and expensed matching contributions of $4.4 million, $4.0 million and $3.6 million for the years ended December 31, 2009, 2008 and 2007, respectively.
Pension Plans
The Company previously offered most of the employees outside the United States participation in a defined benefit pension plan that has been curtailed. In addition, the Company provides a Supplemental Executive Retirement Plan (the “SERP”) for certain officers of the Company based in the United States.
The Company has recorded the minimum pension liability to other comprehensive earnings (loss) and the estimated benefit to be paid in 2010 has been reported in other current liabilities. The measurement date used for the pension plans is December 31.
Amounts recognized in other comprehensive earnings (loss) during the years ended December 31, 2009, 2008 and 2007, net of tax, are as follows (in thousands):
| Year Ended December 31, | ||||||||||||
| 2009 | 2008 | 2007 | ||||||||||
| Net earnings (loss) |
$ | 493 | $ | (2,340 | ) | $ | (574 | ) | ||||
| Prior service cost |
313 | (989 | ) | 141 | ||||||||
| Transition obligation |
(25 | ) | (40 | ) | (23 | ) | ||||||
| $ | 781 | $ | (3,369 | ) | $ | (456 | ) | |||||
Components of accumulated other comprehensive earnings (loss) related to the Company’s pension plans as of December 31, 2009 and 2008 are as follows (in thousands):
| December 31, | ||||||||
| 2009 | 2008 | |||||||
| Net loss |
$ | (3,935 | ) | $ | (4,427 | ) | ||
| Prior service cost |
(1,517 | ) | (1,830 | ) | ||||
| Transition obligation |
29 | 53 | ||||||
| $ | (5,423 | ) | $ | (6,204 | ) | |||
The amortization of the transition obligation recognized in net periodic benefit costs for the years ended December 31, 2009, 2008 and 2007 are $37,000, $43,000 and $42,000, respectively.
60
FLIR SYSTEMS, INC.
NOTES TO THE CONSOLIDATED FINANCIAL STATEMENTS—(Continued)
| Note 16. | Other Employee Benefit Plans—(Continued) |
Pension Plans—(Continued)
A summary of the components of the net periodic pension expense for the benefit obligation and fund assets of the plans is as follows (in thousands):
| Year Ended December 31, | ||||||||
| 2009 | 2008 | |||||||
| Change in benefit obligation: |
||||||||
| Benefit obligation at January 1 |
$ | 21,237 | $ | 15,718 | ||||
| Service costs |
125 | 153 | ||||||
| Interest costs |
1,085 | 820 | ||||||
| Actuarial loss |
(219 | ) | 4,122 | |||||
| Benefits paid |
(353 | ) | (357 | ) | ||||
| Plan amendments to SERP |
— | 1,832 | ||||||
| Foreign currency exchange changes |
345 | (1,051 | ) | |||||
| Benefit obligation at December 31 |
$ | 22,220 | $ | 21,237 | ||||
| Fair value of plan assets at December 31 |
$ | — | $ | — | ||||
| Unfunded status at December 31 |
$ | 22,220 | $ | 21,237 | ||||
| Amounts recognized in the Consolidated Balance Sheets: |
||||||||
| Current liabilities |
$ | 372 | $ | 309 | ||||
| Non-current liabilities |
21,848 | 20,928 | ||||||
The weighted average assumptions used are as follows:
| Year Ended December 31, | ||||||
| 2009 | 2008 | |||||
| Net periodic benefit cost: |
||||||
| SERP: |
||||||
| Discount rate |
5.50 | % | 5.75 | % | ||
| Rate of increase in compensation levels |
5.00 | % | 5.00 | % | ||
| Defined benefit pension plan for employees outside the |
||||||
| Discount rate |
3.85 | % | 3.20 | % | ||
| Funded status and projected benefit obligation: |
||||||
| SERP: |
||||||
| Discount rate |
5.50 | % | 5.75 | % | ||
| Rate of increase in compensation levels |
5.00 | % | 5.00 | % | ||
| Defined benefit pension plan for employees outside the |
||||||
| Discount rate |
3.85 | % | 3.20 | % | ||
The discount rates used are based upon publicly listed indices for instruments with average maturities estimated to be consistent with the respective obligations.
A pension liability of $8.6 million and $9.8 million as of December 31, 2009 and 2008, respectively, have been recognized for the pension plans representing the excess of the unfunded accumulated benefit obligation over the accrued pension costs.
61
FLIR SYSTEMS, INC.
NOTES TO THE CONSOLIDATED FINANCIAL STATEMENTS—(Continued)
| Note 16. | Other Employee Benefit Plans—(Continued) |
Pension Plans—(Continued)
Benefits expected to be paid under the plans are approximately (in thousands):
| 2010 |
$ | 504 | |
| 2011 |
4,126 | ||
| 2012 |
11,781 | ||
| 2013 |
495 | ||
| 2014 |
480 | ||
| Five years thereafter |
2,529 | ||
| $ | 19,915 | ||
Components of net periodic benefit cost are as follows (in thousands):
| Year Ended December 31, | |||||||||
| 2009 | 2008 | 2007 | |||||||
| Service costs |
$ | 125 | $ | 153 | $ | 221 | |||
| Interest costs |
1,085 | 820 | 747 | ||||||
| Net amortization and deferral |
1,045 | 366 | 268 | ||||||
| Net periodic pension costs |
$ | 2,255 | $ | 1,339 | $ | 1,236 | |||
Components of net periodic benefit cost expected to be recognized from amounts in accumulated other comprehensive earnings (loss) during the year ending December 31, 2010 are as follows (in thousands):
| Year Ending December 31, 2010 |
||||
| Net loss |
$ | 340 | ||
| Net prior service cost |
313 | |||
| Net transition amount |
(29 | ) | ||
| $ | 624 | |||
| Note 17. | Operating Segments and Related Information |
Operating Segments
The Company has determined its operating segments to be the Thermography, Government Systems and Commercial Vision Systems market segments.
The Thermography segment addresses a broad range of commercial and industrial applications utilizing infrared cameras to provide precise temperature measurement or other analytic information. Examples of markets served include predictive and preventive maintenance, process control, building inspection, electrical inspection, research and development, scientific analysis and gas detection.
The Government Systems and Commercial Vision Systems markets are both comprised of applications focused on providing enhanced vision capabilities utilizing infrared energy and in the case of many Government System products, additional sensor technologies such as visible cameras, low light cameras and lasers.
62
FLIR SYSTEMS, INC.
NOTES TO THE CONSOLIDATED FINANCIAL STATEMENTS—(Continued)
| Note 17. | Operating Segments and Related Information—(Continued) |
Operating Segments—(Continued)
The Government Systems segment addresses mainly government markets such as military, paramilitary, homeland security and other program driven markets both within the United States and internationally. Most products contain multiple sensors and are deployed on airborne, maritime, land-based and man-portable platforms. Applications include search and rescue, force protection, surveillance, drug interdiction, maritime patrol and targeting.
The Commercial Vision Systems segment addresses mainly commercial markets including OEM camera modules, perimeter security, firefighting, marine, automotive, airborne and other transportation. These markets are characterized by rapidly growing volumes driven by declining costs for uncooled infrared technology.
The accounting policies of each of the segments are the same. The Company’s President and Chief Executive Officer evaluates the performance of each segment based upon its revenue and earnings from operations. On a consolidated basis, these amounts represent revenue and earnings from operations as represented in the Consolidated Statements of Income. Other consists of corporate expenses and certain other operating expenses not allocated to the operating segments for management reporting purposes. Intersegment revenues are recorded at an estimated arms length basis and are eliminated in consolidation.
Accounts receivable and inventories for operating segments are regularly reviewed by management and are reported below as segment assets. All remaining assets, liabilities, capital expenditures and depreciation are managed on a Company-wide basis.
Operating segment information is as follows (in thousands):
| Year Ended December 31, | ||||||||||||
| 2009 | 2008 | 2007 | ||||||||||
| Revenue—External Customers: |
||||||||||||
| Government Systems |
$ | 655,282 | $ | 569,028 | $ | 382,347 | ||||||
| Thermography |
285,482 | 327,324 | 261,831 | |||||||||
| Commercial Vision Systems |
206,323 | 180,622 | 135,219 | |||||||||
| $ | 1,147,087 | $ | 1,076,974 | $ | 779,397 | |||||||
| Revenue—Intersegments: |
||||||||||||
| Government Systems |
$ | 28,412 | $ | 30,170 | $ | 26,362 | ||||||
| Thermography |
10,104 | 8,698 | — | |||||||||
| Commercial Vision Systems |
18,374 | 22,433 | 25,524 | |||||||||
| Eliminations |
(56,890 | ) | (61,301 | ) | (51,886 | ) | ||||||
| $ | — | $ | — | $ | — | |||||||
| Earnings (loss) from operations: |
||||||||||||
| Government Systems |
$ | 286,361 | $ | 233,803 | $ | 132,815 | ||||||
| Thermography |
72,897 | 70,471 | 73,187 | |||||||||
| Commercial Vision Systems |
49,322 | 37,493 | 26,761 | |||||||||
| Other |
(61,293 | ) | (57,276 | ) | (40,931 | ) | ||||||
| $ | 347,287 | $ | 284,491 | $ | 191,832 | |||||||
63
FLIR SYSTEMS, INC.
NOTES TO THE CONSOLIDATED FINANCIAL STATEMENTS—(Continued)
| Note 17. | Operating Segments and Related Information—(Continued) |
Operating Segments—(Continued)
| December 31, | ||||||
| 2009 | 2008 | |||||
| Segment assets (accounts receivable, net and inventories): |
||||||
| Government Systems |
$ | 283,683 | $ | 273,821 | ||
| Thermography |
105,156 | 112,728 | ||||
| Commercial Vision Systems |
62,635 | 60,121 | ||||
| $ | 451,474 | $ | 446,670 | |||
Revenue and Long-Lived Assets by Geographic Area
Information related to revenue by significant geographical location, determined by the end customer, is as follows (in thousands):
| Year Ended December 31, | |||||||||
| 2009 | 2008 | 2007 | |||||||
| United States |
$ | 672,270 | $ | 669,215 | $ | 477,502 | |||
| Europe |
242,498 | 239,438 | 173,706 | ||||||
| Other foreign |
232,319 | 168,321 | 128,189 | ||||||
| $ | 1,147,087 | $ | 1,076,974 | $ | 779,397 | ||||
Long-lived assets are comprised of net property and equipment, net identifiable intangible assets, goodwill and other long-term assets. Long-lived assets by significant geographic locations are as follows (in thousands):
| December 31, | ||||||
| 2009 | 2008 | |||||
| United States |
$ | 387,169 | $ | 318,183 | ||
| Europe |
116,850 | 105,813 | ||||
| Other |
5,175 | 2,362 | ||||
| $ | 509,194 | $ | 426,358 | |||
Major Customers
Revenue derived from major customers is as follows (in thousands):
| Year ended December 31, | |||||||||
| 2009 | 2008 | 2007 | |||||||
| United States government |
$ | 494,641 | $ | 441,818 | $ | 304,909 | |||
64
FLIR SYSTEMS, INC.
NOTES TO THE CONSOLIDATED FINANCIAL STATEMENTS—(Continued)
| Note 18. | Business Acquisitions |
In 2009, the Company acquired all of the outstanding stock of Salvador Imaging, Inc. and OmniTech Partners, Inc. and certain assets of Infrared Korea, Ltd. for approximately $57.1 million in cash. Purchase accounting allocations recorded in 2009 in relation to these acquisitions included recording identifiable intangible assets of approximately $17.1 million, goodwill of approximately $34.4 million, and contingent consideration of approximately $1.9 million.
Additionally, in December 2009, the Company acquired all of the outstanding stock of Directed Perception, Inc. for approximately $20.2 million in cash. The allocation of the purchase price to identifiable intangible assets and goodwill is subject to the final determination on the valuation of assets acquired and liabilities assumed. The excess purchase price of approximately $18.5 million has been reported in other assets as of December 31, 2009.
In 2008, the Company acquired 99.9 percent and all of the outstanding stock of Cedip Infrared Systems and Ifara Tecnologias, S.L., respectively, for approximately $106.9 million in cash, including costs directly associated with the acquisitions. The Company has recorded identifiable intangible assets of approximately $20.1 million and goodwill of approximately $58.1 million in relation to these acquisitions.
The operating results of these acquisitions are included in the Company’s results of operations since their respective dates of acquisition.
These acquisitions are not significant, either individually or in the aggregate, as defined in Regulation S-X of the Securities and Exchange Commission, compared to the Company’s overall financial position. Accordingly, pro forma financial statements of the combined entities are not presented.
| Note 19. | Repurchase of Company Stock |
In February 2007 and February 2009, the Company’s Board of Directors authorized the repurchase of up to 12.0 million shares and 20.0 million shares, respectively, of the Company’s outstanding shares of common stock in the open market. The February 2007 authorization expired in February 2009 and the February 2009 authorization expires in February 2011. Under these authorizations, the Company has repurchased 3,232,000 shares for a total of $73.2 million, 1,381,000 shares for a total of $40.7 million and 177,000 shares for a total of $3.7 million during the years ended December 31, 2009, 2008, and 2007, respectively.
65
QUARTERLY FINANCIAL DATA (UNAUDITED)
FLIR SYSTEMS, INC.
(In thousands, except per share data)
| Q1 | Q2 | Q3 | Q4 | |||||||||
| 2009 |
||||||||||||
| Revenue |
$ | 271,996 | $ | 277,978 | $ | 285,553 | $ | 311,560 | ||||
| Gross profit |
157,715 | 161,948 | 162,817 | 176,049 | ||||||||
| Net earnings |
54,272 | 55,653 | 60,035 | 60,253 | ||||||||
| Net earnings per share: |
||||||||||||
| Basic |
$ | 0.38 | $ | 0.37 | $ | 0.40 | $ | 0.40 | ||||
| Diluted |
$ | 0.35 | $ | 0.35 | $ | 0.38 | $ | 0.38 | ||||
| 2008 (As Adjusted) |
||||||||||||
| Revenue |
$ | 236,906 | $ | 260,978 | $ | 276,740 | $ | 302,350 | ||||
| Gross profit |
130,795 | 146,614 | 155,262 | 173,471 | ||||||||
| Net earnings (As Adjusted) |
36,521 | 44,617 | 54,779 | 64,983 | ||||||||
| Net earnings per share: |
||||||||||||
| Basic (As Adjusted) |
$ | 0.27 | $ | 0.32 | $ | 0.39 | $ | 0.47 | ||||
| Diluted |
$ | 0.24 | $ | 0.29 | $ | 0.35 | $ | 0.41 | ||||
The sum of the quarterly earnings per share does not always equal the annual earnings per share as a result of the computation of quarterly versus annual average shares outstanding.
66
| ITEM 9. | CHANGES IN AND DISAGREEMENTS WITH ACCOUNTANTS ON ACCOUNTING AND FINANCIAL DISCLOSURE |
None.
| ITEM 9A. | CONTROLS AND PROCEDURES |
Evaluation of Disclosure Controls and Procedures
As of December 31, 2009, the Company completed its annual evaluation, under the supervision and with the participation of the Company’s management, including the Company’s Chief Executive Officer and the Company’s Chief Financial Officer, of the effectiveness of the design and operation of the Company’s disclosure controls and procedures. Based on the evaluation, the Company’s Chief Executive Officer and Chief Financial Officer have concluded that the Company’s disclosure controls and procedures are effective to ensure that information required to be disclosed by the Company in the reports it files or submits under the Securities Exchange Act of 1934, as amended, is recorded, processed, summarized and reported within the time periods specified in Securities and Exchange Commission rules and forms. There were no changes in the Company’s internal control over financial reporting that occurred during the Company’s fourth fiscal quarter that have materially affected, or are reasonably likely to materially affect, the Company’s internal control over financial reporting.
Management’s Report on Internal Control over Financial Reporting
Our management is responsible for establishing and maintaining adequate internal control over financial reporting, as such term is defined in Exchange Act Rule 13a-15(f). Our internal control over financial reporting is designed to provide reasonable assurance to our management and Board of Directors regarding the preparation and fair presentation of published financial statements.
Because of its inherent limitations, internal control over financial reporting may not prevent or detect misstatements. Therefore, even those systems determined to be effective can provide only reasonable assurance with respect to financial statement preparation and presentation.
Under the supervision and with the participation of our management, including our Chief Executive Officer and Chief Financial Officer, we conducted an evaluation of the effectiveness of our internal control over financial reporting based on the framework in the Internal Control—Integrated Framework issued by the Committee of Sponsoring Organizations of the Treadway Commission (“COSO”).
Based on our evaluation using the Internal Control—Integrated Framework, our management concluded that our internal control over financial reporting was effective as of December 31, 2009.
KPMG LLP, an independent registered public accounting firm, has issued an attestation report on the Company’s internal control over financial reporting as of December 31, 2009, which is included elsewhere in this Form 10-K.
67
REPORT OF INDEPENDENT REGISTERED PUBLIC ACCOUNTING FIRM
The Board of Directors and
Shareholders of FLIR Systems, Inc.:
We have audited FLIR System, Inc.’s internal control over financial reporting as of December 31, 2009, based on criteria established in Internal Control—Integrated Framework issued by the Committee of Sponsoring Organizations of the Treadway Commission (COSO). FLIR Systems, Inc.’s management is responsible for maintaining effective internal control over financial reporting and for its assessment of the effectiveness of internal control over financial reporting, included in the accompanying Management’s Report on Internal Control Over Financial Reporting. Our responsibility is to express an opinion on the Company’s internal control over financial reporting based on our audit.
We conducted our audit in accordance with the standards of the Public Company Accounting Oversight Board (United States). Those standards require that we plan and perform the audit to obtain reasonable assurance about whether effective internal control over financial reporting was maintained in all material respects. Our audit included obtaining an understanding of internal control over financial reporting, assessing the risk that a material weakness exists, and testing and evaluating the design and operating effectiveness of internal control based on the assessed risk. Our audit also included performing such other procedures as we considered necessary in the circumstances. We believe that our audit provides a reasonable basis for our opinion.
A company’s internal control over financial reporting is a process designed to provide reasonable assurance regarding the reliability of financial reporting and the preparation of financial statements for external purposes in accordance with generally accepted accounting principles. A company’s internal control over financial reporting includes those policies and procedures that (1) pertain to the maintenance of records that, in reasonable detail, accurately and fairly reflect the transactions and dispositions of the assets of the company; (2) provide reasonable assurance that transactions are recorded as necessary to permit preparation of financial statements in accordance with generally accepted accounting principles, and that receipts and expenditures of the company are being made only in accordance with authorizations of management and directors of the company; and (3) provide reasonable assurance regarding prevention or timely detection of unauthorized acquisition, use, or disposition of the company’s assets that could have a material effect on the financial statements.
Because of its inherent limitations, internal control over financial reporting may not prevent or detect misstatements. Also, projections of any evaluation of effectiveness to future periods are subject to the risk that controls may become inadequate because of changes in conditions, or that the degree of compliance with the policies or procedures may deteriorate.
In our opinion, FLIR Systems, Inc. maintained, in all material respects, effective internal control over financial reporting as of December 31, 2009, based on criteria established in Internal Control—Integrated Framework issued by the Committee of Sponsoring Organizations of the Treadway Commission.
We also have audited, in accordance with the standards of the Public Company Accounting Oversight Board (United States), the consolidated balance sheets of FLIR Systems, Inc. and subsidiaries as of December 31, 2009 and 2008, and the related consolidated statements of income, shareholders’ equity and comprehensive earnings, and cash flows for each of the years in the three-year period ended December 31, 2009, and our report dated February 26, 2010 expressed an unqualified opinion on those consolidated financial statements.
/s/ KPMG LLP
Portland, Oregon
February 26, 2010
68
| ITEM 9B. | OTHER INFORMATION |
None.
69
PART III
| ITEM 10. | DIRECTORS, EXECUTIVE OFFICERS AND CORPORATE GOVERNANCE |
Information with respect to directors and executive officers of the Company is included under “Election of Directors,” “Management,” “Section 16(a) Beneficial Ownership Reporting Compliance,” “Corporate Governance and Related Matters” and “Information Concerning the Independent Registered Public Accounting Firm—Audit Committee Report” in the Company’s definitive proxy statement for its 2010 Annual Meeting of Shareholders and is incorporated herein by reference.
The Company has adopted a Code of Ethics for Senior Financial Officers (the “Code of Ethics”) that applies to the Company’s Chief Executive Officer, Chief Financial Officer, Controller and persons performing similar duties. The Code of Ethics is publicly available on the Company’s website (www.flir.com) in the Governance area of the Investor Relations segment of the website. None of the material on the Company’s website is part of this Annual Report. If there is any waiver from any provision of the Code of Ethics for the Company’s Chief Executive Officer, Chief Financial Officer, Controller and persons performing similar duties, the Company will disclose the nature of such waiver on its website.
| ITEM 11. | EXECUTIVE COMPENSATION |
Information with respect to executive compensation is included under “Compensation Discussion and Analysis,” “Compensation Committee Report,” “Compensation of Executive Officers,” and “Director Compensation” in the Company’s definitive proxy statement for its 2010 Annual Meeting of Shareholders and is incorporated herein by reference.
| ITEM 12. | SECURITY OWNERSHIP OF CERTAIN BENEFICIAL OWNERS AND MANAGEMENT AND RELATED STOCKHOLDER MATTERS |
Information with respect to security ownership of certain beneficial owners and management is included under “Stock Owned by Management and Principal Shareholders” in the Company’s definitive proxy statement for its 2010 Annual Meeting of Shareholders and is incorporated herein by reference. Information with respect to equity compensation plans is included under “Equity Compensation Plan Information” in the Company’s definitive proxy statement for its 2010 Annual Meeting of Shareholders and is incorporated herein by reference.
| ITEM 13. | CERTAIN RELATIONSHIPS AND RELATED TRANSACTIONS, AND DIRECTOR INDEPENDENCE |
Information with respect to certain relationships and related transactions is included under “Certain Relationships and Related Transactions” in the Company’s definitive proxy statement for its 2010 Annual Meeting of Shareholders and is incorporated herein by reference. Information with respect to Director independence is included under “Corporate Governance and Related Matters—Board of Directors Committees” in the Company’s definitive proxy statement for its 2010 Annual Meeting of Shareholders and is incorporated herein by reference.
| ITEM 14. | PRINCIPAL ACCOUNTANT FEES AND SERVICES |
Information with respect to principal accountant fees and services is included under “Information Concerning the Independent Registered Public Accounting Firm—Fees Paid to KPMG LLP” in the Company’s definitive proxy statement for its 2010 Annual Meeting of Shareholders and is incorporated herein by reference.
70
PART IV
| ITEM 15. | EXHIBITS AND FINANCIAL STATEMENT SCHEDULES |
(a)(1) Financial Statements
The financial statements are included in Item 8 above.
(a)(2) Financial Statement Schedules
No schedules are included because the required information is inapplicable, not required or are presented in the financial statements or the related notes thereto.
(a)(3) Exhibits
| Number |
Description | |
| 3.1 | Second Restated Articles of Incorporation of FLIR Systems, Inc., as amended through May 12, 2008 (incorporated by reference to Exhibit 3.1 to the Annual Report on Form 10-K filed on February 27, 2009). | |
| 3.2 | Second Restated Bylaws of FLIR Systems, Inc., as amended through August 6, 2009 (incorporated by reference to Exhibit 3.1 to the Quarterly Report on Form 10-Q filed on August 10, 2009). | |
| 4.1 | Indenture between FLIR Systems, Inc. and J.P. Morgan Trust Company N.A. dated June 11, 2003 (incorporated by reference to Exhibit 4.1 to the Quarterly Report filed on August 8, 2003). | |
| 4.2 | Form of $175,000,000 3% Senior Convertible Notes Due 2023 dated June 11, 2003 (incorporated by reference to Exhibit 4.3 to the Quarterly Report filed on August 8, 2003). | |
| 4.3 | Form of $35,000,000 3% Senior Convertible Notes Due 2023 dated June 17, 2003 (incorporated by reference to Exhibit 4.4 to the Quarterly Report filed on August 8, 2003). | |
| 4.4 | Resale Registration Rights Agreement among FLIR Systems, Inc., J.P. Morgan Securities Inc., and Banc of America Securities LLC dated June 11, 2003 (incorporated by reference to Exhibit 4.5 to the Quarterly Report filed on August 8, 2003). | |
| 10.1 | 1992 Stock Incentive Plan (incorporated by reference to Exhibit 10.3 to Registration Statement on Form S-1 (File No. 33-62582)).(1) | |
| 10.2 | 1993 Stock Option Plan for Non-employee Directors (incorporated by reference to Exhibit 10.4 to Registration Statement on Form S-1 (File No. 33-62582)).(1) | |
| 10.3 | Purchase Agreement among FLIR Systems, Inc. and J.P. Morgan Securities Inc. and Banc of America Securities LLC dated June 6, 2003 (incorporated by reference to Exhibit 10.1 to the Quarterly Report on Form 10-Q filed on August 8, 2003). | |
| 10.4 | FLIR Systems, Inc. 2002 Stock Incentive Plan, amended April 21, 2004 (incorporated by reference to Exhibit 10.13 to the Annual Report on Form 10-K filed on March 4, 2005).(1) | |
| 10.5 | FLIR Systems, Inc. 2002 Stock Incentive Plan Stock Option Agreement (incorporated by reference to Exhibit 10.1 to the Current Report on Form 8-K filed on February 10, 2005). (1) | |
| 10.6 | Credit Agreement by and among FLIR Systems, Inc. and certain subsidiaries of FLIR Systems, Inc., as borrowers, certain subsidiaries of FLIR Systems, Inc as subsidiary guarantors, Bank of America, N.A., Union Bank of California, N.A., U.S. Bank National Association and the Other Lenders identified therein dated as of October 6, 2006 (incorporated by reference to Exhibit 10.1 to the Current Report on Form 8-K filed on October 12, 2006). | |
71
| Number |
Description | |
| 10.7 | First amendment to Credit Agreement by and among FLIR Systems, Inc. and certain subsidiaries of FLIR Systems, Inc., as borrowers, certain subsidiaries of FLIR Systems, Inc as subsidiary guarantors, Bank of America, N.A., Union Bank of California, N.A., U.S. Bank National Association and the Other Lenders identified therein dated as of March 9, 2007 (incorporated by reference to Exhibit 10.12 to the Annual Report on Form 10-K filed on February 27, 2009). | |
| 10.8 | Second amendment to Credit Agreement by and among FLIR Systems, Inc. and certain subsidiaries of FLIR Systems, Inc., as borrowers, certain subsidiaries of FLIR Systems, Inc as subsidiary guarantors, Bank of America, N.A., Union Bank of California, N.A., U.S. Bank National Association and the Other Lenders identified therein dated as of October 27, 2008 (incorporated by reference to Exhibit 10.1 to the Quarterly Report on Form 10-Q filed on November 7, 2008). | |
| 10.9 | FLIR Systems, Inc. 2007 Executive Bonus Plan (incorporated by reference to Exhibit 10.16 to the Annual Report on Form 10-K filed on March 16, 2007).(1) | |
| 10.10 | Form of 2007 Executive Bonus Plan Performance Award Agreement dated as of March 14, 2007 (incorporated by reference to Exhibit 10.18 to the Annual Report on Form 10-K filed on March 16, 2007).(1) | |
| 10.11 | Form of Stock Option Agreement for 2002 Stock Incentive Plan (incorporated by reference to Exhibit 10.1 on the Current Report on Form 8-K filed on May 4, 2007). (1) | |
| 10.12 | Form of Deferred Stock Agreement for 2002 Stock Incentive Plan (incorporated by reference to Exhibit 10.2 on the Current Report on Form 8-K filed on May 4, 2007). (1) | |
| 10.13 | Executive Employment Agreement between FLIR Systems, Inc. and Earl R. Lewis dated as of May 6, 2009 (incorporated by reference to Exhibit 10.2 to the Quarterly Report on Form 10-Q filed on May 8, 2009). (1) | |
| 10.14 | Executive Employment Agreement between FLIR Systems, Inc. and Stephen M. Bailey dated as of May 6, 2009 (incorporated by reference to Exhibit 10.2 to the Quarterly Report on Form 10-Q filed on May 8, 2009). (1) | |
| 10.15 | Form of Change in Control Agreement dated as of May 6, 2009 (incorporated by reference to Exhibit 10.2 to the Quarterly Report on Form 10-Q filed on May 8, 2009).(1) | |
| 10.16 | Amended and Restated FLIR Systems, Inc. Supplemental Executive Retirement Plan, as amended and restated on October 22, 2009.(1) | |
| 21.0 | Subsidiaries of FLIR Systems, Inc. | |
| 23.0 | Consent of KPMG LLP. | |
| 31.1 | Principal Executive Officer Certification Pursuant to Sarbanes-Oxley Act of 2002, Section 302. | |
| 31.2 | Principal Financial Officer Certification Pursuant to Sarbanes-Oxley Act of 2002, Section 302. | |
| 32.1 | Certification by the Chief Executive Officer pursuant to 18 U.S.C. Section 1350, as adopted pursuant to Section 906 of the Sarbanes-Oxley Act of 2002. | |
| 32.2 | Certification by the Chief Financial Officer pursuant to 18 U.S.C. Section 1350, as adopted pursuant to Section 906 of the Sarbanes-Oxley Act of 2002. | |
| 101.INS | XBRL Instance Document | |
| 101.SCH | XBRL Taxonomy Extension Schema Document | |
| 101.CAL | XBRL Taxonomy Extension Calculation Linkbase Document | |
| 101.DEF | XBRL Taxonomy Extension Definition Linkbase Document | |
72
| Number |
Description | |
| 101.LAB | XBRL Taxonomy Extension Label Linkbase Document | |
| 101.PRE | XBRL Taxonomy Extension Presentation Linkbase Document | |
| (1) | This exhibit constitutes a management contract or compensatory plan or arrangement. |
73
Pursuant to the requirements of Section 13 or 15(d) of the Securities Exchange Act of 1934, the Registrant has duly caused this report to be signed on its behalf by the undersigned, thereunto duly authorized on the 26th day of February 2010.
| FLIR SYSTEMS, INC. | ||
| (Registrant) | ||
| By: |
/S/ STEPHEN M. BAILEY
| |
| Stephen M. Bailey Sr. Vice President, Finance and Chief Financial Officer | ||
Pursuant to the requirements of the Securities Exchange Act of 1934, this report has been signed below by the following persons on behalf of the Registrant and in the capacities indicated on February 26, 2010.
| Signature |
Title | |
| /S/ EARL R. LEWIS Earl R. Lewis |
Chairman of the Board of Directors, President and Chief Executive Officer | |
| /S/ STEPHEN M. BAILEY Stephen M. Bailey |
Sr. Vice President, Finance and Chief Financial Officer (Principal Accounting and Financial Officer) | |
| /S/ JOHN D. CARTER John D. Carter |
Director | |
| /S/ WILLIAM W. CROUCH William W. Crouch |
Director | |
| /S/ JOHN C. HART John C. Hart |
Director | |
| /S/ ANGUS L. MACDONALD Angus L. Macdonald |
Director | |
| /S/ MICHAEL T. SMITH Michael T. Smith |
Director | |
| /S/ JOHN W. WOOD, JR. John W. Wood, Jr. |
Director | |
| /S/ STEVEN E. WYNNE Steven E. Wynne |
Director | |
74