Attached files
Table of Contents
UNITED STATES
SECURITIES AND EXCHANGE COMMISSION
WASHINGTON, DC 20549
FORM 10-K
| þ | ANNUAL REPORT PURSUANT TO SECTION 13 OR 15(d) OF THE SECURITIES EXCHANGE ACT OF 1934 |
For the fiscal year ended: December 31, 2009
OR
| ¨ | TRANSITION REPORT PURSUANT TO SECTION 13 OR 15(d) OF THE SECURITIES EXCHANGE ACT OF 1934 |
For the transition period from to
Commission file number: 0-14948
Fiserv, Inc.
(Exact Name of Registrant as Specified in Its Charter)
| Wisconsin | 39-1506125 | |
| (State or Other Jurisdiction of Incorporation or Organization) |
(I.R.S. Employer Identification No.) |
255 Fiserv Dr., Brookfield, WI 53045
(Address of Principal Executive Offices, Including Zip Code)
Registrant’s telephone number, including area code: (262) 879-5000
Securities registered pursuant to Section 12(b) of the Act:
| Title of Each Class |
Name of Each Exchange on Which Registered | |
| Common Stock, par value $0.01 per share | The NASDAQ Stock Market LLC |
Securities registered pursuant to Section 12(g) of the Act: None
Indicate by check mark if the registrant is a well-known seasoned issuer, as defined in Rule 405 of the Securities Act. Yes þ No ¨
Indicate by check mark if the registrant is not required to file reports pursuant to Section 13 or 15(d) of the Act. Yes ¨ No þ
Indicate by check mark whether the registrant: (1) has filed all reports required to be filed by Section 13 or 15(d) of the Securities Exchange Act of 1934 during the preceding 12 months (or for such shorter period that the registrant was required to file such reports), and (2) has been subject to such filing requirements for the past 90 days. Yes þ No ¨
Indicate by check mark whether the registrant has submitted electronically and posted on its corporate Web site, if any, every Interactive Data File required to be submitted and posted pursuant to Rule 405 of Regulation S-T during the preceding 12 months (or for such shorter period that the registrant was required to submit and post such files). Yes þ No ¨
Indicate by check mark if disclosure of delinquent filers pursuant to Item 405 of Regulation S-K is not contained herein, and will not be contained, to the best of registrant’s knowledge, in definitive proxy or information statements incorporated by reference in Part III of this Form 10-K or any amendment to this Form 10-K. ¨
Indicate by check mark whether the registrant is a large accelerated filer, an accelerated filer, a non-accelerated filer, or a smaller reporting company. See definitions of “large accelerated filer,” “accelerated filer,” and “smaller reporting company” in Rule 12b-2 of the Exchange Act.
Large Accelerated Filer þ Accelerated Filer ¨ Non-Accelerated Filer ¨ Smaller Reporting Company ¨
Indicate by check mark whether the registrant is a shell company (as defined in Rule 12b-2 of the Exchange Act). Yes ¨ No þ
The aggregate market value of the common stock of the registrant held by non-affiliates as of June 30, 2009 (the last trading day of the second fiscal quarter) was $6,916,142,865 based on a closing price of $45.71 on the Nasdaq stock market on that date. The number of shares of the registrant’s common stock, $0.01 par value per share, outstanding at February 24, 2010 was 152,320,404.
DOCUMENTS INCORPORATED BY REFERENCE
Part III of this report incorporates information by reference to the registrant’s proxy statement for its 2010 annual meeting of shareholders, which proxy statement will be filed with the Securities and Exchange Commission no later than 120 days after the close of the fiscal year ended December 31, 2009.
Table of Contents
i
Table of Contents
FORWARD-LOOKING STATEMENTS
This Annual Report on Form 10-K contains “forward-looking statements” intended to qualify for the safe harbor from liability established by the Private Securities Litigation Reform Act of 1995. Forward-looking statements include those that express a plan, belief, expectation, estimation, anticipation, intent, contingency, future development or similar expression, and can generally be identified as forward-looking because they include words such as “believes,” “anticipates,” “expects,” “could,” “should” or words of similar meaning. Statements that describe our objectives or goals are also forward-looking statements. The forward-looking statements in this report involve significant risks and uncertainties, and a number of factors, both foreseen and unforeseen, that could cause actual results to differ materially from our current expectations. The factors that may affect our results include, among others: the impact on our business of the current state of the economy, including the risk of reduction in revenue resulting from the elimination of existing or potential clients due to consolidation or financial failures in the financial services industry or from decreased spending on the products and services we offer; changes in client demand for our products or services; pricing or other actions by competitors; the potential impact of our Fiserv 2.0 initiatives; our ability to comply with government regulations, including privacy regulations; and other factors discussed in this report under the heading “Risk Factors.” We urge you to consider these factors carefully in evaluating forward-looking statements and caution you not to place undue reliance upon forward-looking statements, which speak only as of the date of this report. We undertake no obligation to update forward-looking statements to reflect events or circumstances occurring after the date of this report.
PART I
In this report, all references to “we,” “us,” and “our” refer to Fiserv, Inc., a Wisconsin corporation, and, unless the context otherwise requires, its consolidated subsidiaries.
Overview
Fiserv, Inc. is a Fortune 500 company that is publicly traded on the NASDAQ Global Select Market. We provide integrated information management and electronic commerce systems and services, including transaction processing, electronic bill payment and presentment, business process outsourcing, document distribution services, and software and systems solutions. We serve approximately 16,000 clients worldwide, including banks and thrifts, credit unions, savings institutions, retailers and merchants, leasing companies, lenders, government agencies, and publicly and privately owned companies, and operate centers in the United States for full-service financial data processing, software system development, item processing and check imaging, technology support and related businesses. Our operations are principally located in the United States. In 2009, we had $4.1 billion in total revenues and $850 million in net cash provided by operating activities from continuing operations. Processing and services revenues, which in 2009 represented approximately 80% of our consolidated revenues, are primarily generated from account and transaction-based fees under contracts that generally have terms of three to five years. In each of 2009, 2008 and 2007, our international operations contributed approximately 5% of total revenues from Argentina, Australia, Canada, China, Colombia, Costa Rica, France, India, Indonesia, Luxembourg, Malaysia, Mexico, the Netherlands, the Philippines, Puerto Rico, Poland, Singapore and the United Kingdom.
We were formed through the combination of two major regional data processing firms that began as the data processing operations of their parent financial institutions. Since we began, we have grown by developing highly specialized services and product enhancements, adding new clients, and acquiring businesses that complement ours. In 2007, we acquired CheckFree Corporation (“CheckFree”), a leading provider of electronic commerce services and products, including electronic bill payment and Internet banking. The acquisition was the largest in our history and has enabled us to deliver a wide range of integrated products and services and created new
1
Table of Contents
opportunities for growth. We originally incorporated in Delaware in 1984, and reincorporated as a Wisconsin corporation in 1992. Our headquarters are located at 255 Fiserv Drive, Brookfield, Wisconsin 53045, and our telephone number is (262) 879-5000.
The Markets We Serve
General
The market for products and services offered by financial institutions is experiencing continuous change. The financial industry regularly introduces and implements new payment, deposit, lending, investment and risk management products, and the distinctions among financial services traditionally offered by banking, thrift and credit union organizations continue to narrow as different types of entities seek to serve the same ultimate customers.
The growing volume and types of transactions and payment mechanisms have increased the data processing and other service needs of financial institutions. We believe that financial institutions will be required to continue to invest significant capital and human resources to process transactions and manage information in this rapidly evolving environment. In addition, we believe that economies of scale in developing and maintaining the necessary products and services and in conducting data processing operations are essential to justify the necessary levels of expenditures and commitment of human resources.
The number of financial institutions in the United States continues to decline as a result of the current state of the economy as well as other market and regulatory pressures. Consolidation has not, however, resulted in a material reduction in the number of customers or financial accounts serviced by the financial industry as a whole. Our focus on long-term client relationships and recurring, transaction-oriented products and services has reduced the impact that consolidation has on us and our revenue is diversified. Our 50 largest financial institution clients represent less than one quarter of our annual revenue, and our remaining revenue is spread across the balance of our client base. Finally, we have clients that span the entire range of financial institutions in terms of asset size, and we typically enter into multi-year agreements.
We anticipate that demand for products that facilitate electronic transactions will continue to increase, which should translate to revenue opportunities for us. As a result, we believe that our sizable and diverse client base combined with our position as a leading provider of non-discretionary, recurring revenue-based products and services gives us a solid foundation for growth. Our ongoing operations are reported in the Financial Institution Services (“Financial”) and Payments and Industry Products (“Payments”) business segments.
Financial
The businesses in our Financial segment provide financial institutions with the products and services they need to run their banking operations. Many financial institutions that previously developed their own software systems and maintained their own data processing operations have outsourced their data processing requirements by licensing software from third-parties or by contracting with third-party processors. This has allowed them to reduce costs and enhance their products and services. Outsourcing can involve the licensing of software, which reduces the need for costly technical expertise within a financial institution, or the utilization of service bureaus, facilities management or resource management capabilities, which can enhance capacity and capabilities. Within the Financial segment, we provide banks, thrifts and credit unions with account processing services, item processing services, loan origination and servicing products, cash management and consulting services, and other products and services that support numerous types of financial transactions.
Payments
The businesses in our Payments segment primarily provide electronic bill payment and settlement, electronic funds transfer, and debit processing products and services to meet the electronic transaction processing
2
Table of Contents
needs of the financial services industry. Our businesses in this segment also provide card and print personalization services, Internet banking, investment account processing services for separately managed accounts, and fraud and risk management products and services. We believe that the integration of our products and services creates a compelling value proposition for our clients.
Corporate Transactions
In 2009, we completed the sale of our Loan Fulfillment Services business (“Fiserv LFS”) and the sale of the balance of our investment support services business (“Fiserv ISS”). In 2008, we completed the sale of a majority of our health businesses (“Fiserv Health”) to UnitedHealthcare Services, Inc. for approximately $480 million, net of income taxes and transaction costs, as well as the first of the two transactions to dispose of Fiserv ISS by selling Fiserv Trust Company and the accounts of our institutional retirement plan and advisor services operations to TD AMERITRADE Online Holdings, Inc. for approximately $200 million, net of income taxes and transaction costs. We also completed the sale of a 51% interest in substantially all of the businesses in our Insurance segment (“Fiserv Insurance”) to Trident IV, LP.
Our Strategy
Our vision is to be a global leader in transaction-based technology solutions. Our mission is to provide integrated technology and services solutions which enable best-in-class results for our clients. To meet these goals, we continue to implement a series of strategic initiatives that we refer to as “Fiserv 2.0.” We are focused on operating businesses where we have: deep industry expertise that enables us to serve the market with high effectiveness; a strong competitive position, currently or via a clear path in the foreseeable future; long-term, trusted, ongoing client relationships which are not based on one-time transactions; differentiated solutions that deliver higher-than-normal value to our clients through integration and innovation; and strong management to execute strategies in a disciplined manner. Consistent with this focus, we have implemented and continue to execute the following strategic platforms:
Enhanced Client Relationship Value. We plan to increase the number and breadth of our client relationships by, among other matters, continuing to integrate our product and services groups, bundling products and services to deliver improved value propositions, and streamlining our service and support processes.
Acquisitions. We expect to acquire businesses when we identify: a compelling strategic need, such as a product, service or technology that helps fill a specific market requirement; an opportunity to change market dynamics; a way to achieve business scale; or some similar consideration.
Innovation. We seek to be an innovation leader in all of our key markets, leveraging our assets and capabilities to be at the forefront of our markets.
Operational Excellence. We believe we can improve our performance by using the opportunities created by our size and scale. For example, we are using our consolidated buying power and shared utility structures to provide savings.
Capital Discipline. Finally, we intend to make capital allocation decisions that offer the best prospects for our long-term growth and profitability, which may include, among other matters, internal investment, repayment of debt, repurchases of our own shares, capital improvements or acquisitions.
Principal Solutions and Services
Financial information regarding our business segments is included in Note 9 to the consolidated financial statements on page 51.
3
Table of Contents
Financial
We provide products and services to meet the financial technology needs of banks, credit unions, thrift and savings institutions, and leasing and finance companies. Many of the products and services that we provide are sold as an integrated solution to our clients and include account, lending, and payments processing.
Account Processing
We provide integrated account servicing and management information functions for our bank, thrift and credit union clients, as well as ancillary value-added products and services that complement the account processing solutions. Account processing solutions are the principal systems that enable a bank to operate and include systems that process customer deposit and loan accounts, an institution’s general ledgers, central information files and other financial information. These solutions also include extensive security, report generation and other features that financial institutions need to process transactions for their depositors and other customers, as well as to meet their regulatory compliance requirements and their own management information needs. Account processing solutions are offered through online data transmission connections to our data processing centers, often called “service bureaus,” or as stand-alone, in-house licensed software for installation on client-owned computer systems. Third party data processing centers also license our software for use in providing services to their clients.
While many of our clients contract to obtain all or a majority of their data processing requirements from us, the modular design of many of our service bureau and software solutions allows clients to start with one application and, as needed, add applications and features developed by us or by third parties. We support a broad range of terminals and other client-owned peripheral devices manufactured by a variety of vendors. This support capability reduces our clients’ initial conversion expenses, enhances existing clients’ ability to change equipment and broadens our market.
| • | Bank and Thrift Account Processing Solutions. The principal service bureau solutions used by banks, thrifts and savings institutions are: Premier, Signature, Cleartouch, Source One and Precision. We also offer in-house licensed software solutions to our banking clients, including Premier, Signature and Precision. The Signature system is available both domestically and internationally. |
| • | Credit Union Account Processing Solutions. The principal account processing solutions primarily used by credit unions are: Acumen, Advantage, Charlotte, CUBE, CubicsPlus, CUSA, DataSafe, Galaxy, OnCU, Portico, Reliance, Spectrum, and XP2. These solutions are offered in a service bureau environment, as an in-house licensed software system or in both delivery modes. |
Item Processing
We offer item processing solutions to financial institutions and other financial intermediaries. We provide item processing and imaging systems via in-house solutions or in a service bureau environment to account processing clients as well as to those who do not utilize our account processing systems. Our item processing services include source capture solutions via a web-based platform for check image capture at branch, merchant, consumer, and ATM locations. Through the Fiserv Clearing Network, we provide complete check clearing and image exchange services. We provide image archive services with online retrieval and full disaster backup, and a number of check imaging products that enable financial institutions to leverage the processes provided for in the Check Clearing Act of the 21st Century. Our ACH software, PEP+®, enables payments to be originated and received through the ACH system, and, together with our PEP+reACHTM product, allows returned checks, checks at the point-of-sale, and checks sent to a lockbox to be converted to electronic payments. Our account reconciliation software, ARP/SMSTM, is an online, real-time positive pay and reconcilement system that enables clients to monitor deposits and identify duplicate items, which reduces their exposure to check fraud and helps them manage electronic check conversion. Our compliance solutions enable financial institutions, corporations and government agencies to maintain compliance with state and federal regulations applicable to them. We also
4
Table of Contents
provide consulting services, business operations services and software products that facilitate the transformation of our clients’ payments environment. We enhance a client’s ability to achieve its goals by enabling it to identify, select and implement the most effective and cost-efficient strategies. Finally, we offer traditional item processing services, including image capture, proof of deposit, in-clearings, statements, exception and return processing and fraud detection.
Lending Solutions
Our lending business offers a variety of products and services to financial institutions and other financial intermediaries, including: loan origination systems, consumer and commercial lease and loan servicing products, and default mitigation and business process outsourcing services; a mortgage loan servicing platform and loan origination and tracking systems; and portfolio analytical services.
Payments
E-Banking
Our e-banking business is comprised of our online bill payment products and our online banking and cash management products. Financial institutions can offer our bill payment services to consumers either through a hosted application or through various protocols that link online banking applications to our internal billing and payment system. These systems allow our clients’ customers to: manage household bills via an easy-to-use, online tool; view relevant billing and payment information; pay and manage all of their bills at one location; experience the same speed of payment they would normally have at a biller’s site; and conveniently make next-day payments to many of the companies with which they do business. We use our platform to process the vast majority of the payment transactions that we process, which enables us to improve our economies of scale. Once a consumer has accessed the system through a financial institution, he or she can elect to pay an electronic bill delivered by us or can instruct the system to pay any individual or company within the United States. In 2009, we processed more than 1.3 billion online bill payment transactions.
Our principal online consumer and business banking product is VoyagerTM, a software platform upon which we have built a number of software applications to support multiple lines of banking businesses. Using universal standards, Voyager has been designed to be highly scalable to meet the evolving needs of our clients. This structure enables our clients to deploy new Internet-based financial services by adding applications to our platform at any time and by integrating future applications to any Internet connected point-of-presence. We also provide a series of treasury management solutions, including online business banking, commercial cash management, remote deposit, and corporate data exchange, under our BANKLINK® brand.
Our Mobile Money product provides a variety of mobile banking and payments services, including balance inquiry, transaction history, bill payment and transfers, through a mobile device to our clients and their customers. It enables financial institutions to reach more consumers via the mobile channel than any other single technology solution because it supports all three mobile access modes: browser, text banking, and mobile application.
Output Solutions
Our output solutions business provides clients with: electronic document management through our electronic document delivery products and services; card manufacturing, personalization and mailing; statement production and mailing; design and fulfillment of direct mail solutions; forms distribution; laser printing and mailing; and office supplies.
Biller Business
We believe that consumers will continue to shift their financial transactions from traditional paper-based methods to electronic methods if they have easy-to-access, easy-to-use, secure and cost-effective methods of
5
Table of Contents
receiving and paying their bills electronically. In 2009, through our electronic biller services business, we delivered over 320 million electronic bills to consumers through our various distribution channels. Consumers access our electronic billing and payment solutions via numerous hosted channels, including through a financial institution’s Internet portal, through the billers’ Internet sites, and through our biller services internet portal, www.mycheckfree.com. Additionally, consumers can make bill payments, including emergency or expedited payments, through our agent-assisted, Internet or interactive voice response phone tools and at our nationwide walk-in bill payment locations. These diverse services allow the customers of our clients to pay bills wherever and however they feel most comfortable. Furthermore, because our biller clients are able to receive all these services from Fiserv, we can eliminate the operational complexity and expense of supporting multiple vendor solutions or in-house developed solutions. Our electronic biller services business also offers a host of club management and electronic financial transaction services within the health and fitness industry.
Card Services
Fiserv EFT, a leader in the electronic funds transfer marketplace, provides a total payments solution through a variety of products and services. We offer ATM and point of sale PIN-based debit transaction processing, signature debit processing, ATM driving and monitoring, electronic benefits transfer switching and national and regional network access. We own the ACCEL/Exchange Network and operate approximately 20,000 ATMs. Comprehensive integration with our account processing products and services allows us to drive down costs and leverage efficiencies for our clients through enterprise offerings in areas such as risk management and loyalty rewards. Fiserv EFT’s clients include more than 2,900 banks and credit unions of all asset sizes, resellers (via both business alliance and remarketer agreements), independent sales organizations and merchant acquirers across the United States. In 2009, we processed over seven billion ATM and debit transactions, making us one of the largest financial transaction processors in the nation.
Our feature-rich credit products and services fulfill a wide range of bank card, retail, commercial and consumer credit processing requirements through an integrated, full-service credit management solution that utilizes a globally recognized processing platform. Our credit processing system provides credit decisioning, authorization processing, online cardholder account management, customer service case management, letters, card production, statements, targeted marketing programs, collections, and recovery management.
Investment Services
We provide a range of technology platforms and software solutions which assist over 325 firms, including broker dealers, global asset managers, investment advisors, banks and insurance companies, to deliver portfolio management, enhanced trading solutions, performance measurement, reporting services, corporate actions, billing, and trading automation to their clients. Our fee-based investment management clients are typically sponsors or managers in the managed accounts and wealth management market that offer separately managed accounts, unified managed accounts, mutual fund advisory accounts, and investment management products; or global institutional money managers, managing investments of institutions and high net worth individuals. Our primary product is a real-time portfolio management and trading system used by nine of the top ten largest brokerage firms, based on assets under management, and eight of the top ten largest asset managers offering managed accounts. The number of accounts using our market leading platform topped three million for the first time in 2009.
Risk Management
Our risk management business provides a suite of products and services, including financial crime, compliance, anti-money laundering, fraud prevention, market surveillance and employee fraud detection solutions. Our offerings in this market include Fiserv KRM, Fraud Manager, Fraud Detection System, Fraudlink, and Fraudguard.
6
Table of Contents
Servicing the Market
Our mission is to provide integrated technology and services solutions that enable best-in-class results for our clients. The markets for our account and transaction processing services have specific needs and requirements, with strong emphasis placed by clients on flexibility, quality, comprehensiveness and integration of product lines, service reliability, timely introduction of new products and features, cost effectiveness, and service excellence. We believe that our financial strength and primary focus on the financial services industry enhances our ability to meet these needs and service our clients. In addition, we believe that our dedication to providing excellent client service and support no matter the size of the client and our commitment of substantial resources to training and technical support helps us to retain clients. For example, we conduct client training in technology centers, where we maintain fully equipped demonstration and training facilities that contain equipment used in the delivery of our services. We also provide on-site training services and online education to clients.
Product Development
To meet the changing technology needs of our clients, we continually develop, maintain and enhance our products and systems. In 2009, 2008 and 2007, product development expenditures represented approximately 9%, 8% and 7%, respectively, of our total revenues. Our network of development and financial information technology centers apply the expertise of multiple teams to design, develop and maintain specialized processing systems around our multiple technology platforms. The applications of our account processing systems meet the preferences and diverse requirements of the international, national, regional or local market-specific financial service environments of our clients. In developing our products, we stress interaction with and responsiveness to the needs of our clients, including customization of software to meet client needs. We have adopted web services and service-oriented architecture principles in our software development practices so that we and our clients can benefit from the efficient development of technology. We provide dedicated solutions that are designed, developed, maintained and enhanced according to each client’s goals for service quality, business development, asset and liability mix, and local market positioning as well as other user-defined parameters.
Intellectual Property
We regard our transaction processing services and related products and our software as proprietary, and utilize a combination of patent, copyright, trademark and trade secret laws, internal security practices and employee and third party non-disclosure agreements for protection. We believe that legal protection of our software, while important, is less significant than the knowledge and experience of our management and personnel and their ability to develop, enhance and market new products and services. The majority of our patents cover various electronic billing and payment innovations, other financial software products or services, or aspects of our separately managed accounts services. We believe that we possess all proprietary rights necessary to conduct our business.
Competition
Financial
The market for information technology products and services within the financial industry is highly competitive. Our principal competitors include internal data processing departments, data processing affiliates of large companies and large computer hardware manufacturers, independent computer service firms, and processing centers owned and operated as user cooperatives. Some of these competitors possess substantially greater financial, sales and marketing resources than we do. Competition for in-house data processing and software departments is intensified by the efforts of computer hardware vendors which encourage the growth of internal data centers and consulting service providers who assist these departments with the design and implementation of customized software solutions. Our software products compete in several different market segments and geographies, including with large diversified computer software and service companies and independent suppliers of software products.
7
Table of Contents
Competitive factors for account processing services include product quality, service reliability, product line comprehensiveness and integration, timely introduction of new products and features, and price. We believe that we compete favorably in each of these categories. In addition, we believe that our position as an independent vendor, rather than as a cooperative, an affiliate of a larger corporation or a hardware vendor, is a competitive advantage. We compete with vendors that offer similar transaction processing products and services to financial institutions, including Fidelity National Information Services, Inc., Jack Henry and Associates, Inc., and Open Solutions, Inc. There has been significant consolidation among providers of information technology products and services to financial institutions, and we believe this consolidation will continue in the future.
Payments
Fidelity National Information Services, Inc. and Online Resources Corporation compete with us most directly as full service banking, billing and bill payment competitors. A number of other companies compete with us in the electronic transaction processing business, including MasterCard Incorporated, Visa, Inc. and First Data Corporation. In addition, the possibility of billers and financial institutions continuing to use or deciding to create in-house systems to handle their own electronic billing and payment transactions, and their own Internet banking solutions in the case of financial institutions, remains a competitive threat. In-house solutions have been, and will continue to be, an option for our clients and a competitive factor facing our business. We expect competition to continue to increase as new companies enter our markets and existing competitors expand their product lines and services. In addition, many companies that provide outsourced Internet finance solutions are consolidating, creating larger competitors with greater resources and broader product lines. Our investment services business competes primarily with providers of portfolio accounting software and outsourced services and with in-house solutions developed by large financial institutions.
Government Regulation
Our data processing and electronic commerce subsidiaries are generally not directly subject to federal or state regulations specifically applicable to financial institutions such as banks, thrifts and credit unions. However, as a provider of services to these financial institutions, our data processing and electronic commerce operations are examined on a regular basis by the FDIC, the Federal Reserve Bank, the National Credit Union Association, the Office of Thrift Supervision, the Office of the Comptroller of the Currency and various state regulatory authorities. Because we use the Federal Reserve’s ACH network to process many of our transactions, we are subject to the Federal Reserve Board’s rules with respect to its ACH network. In addition, independent auditors annually review many of our operations to provide internal control evaluations for our clients’ auditors and regulators.
In conducting our electronic commerce business, we are subject to various laws and regulations relating to the electronic movement of money. In 2001, the USA Patriot Act amended the Bank Secrecy Act to expand the definition of Money Services Businesses (“MSBs”) so that it may include businesses operated by us. To this end, in 2002, CheckFree submitted a request for an administrative ruling from the Financial Crimes Enforcement Network (“FinCEN”) with respect to whether FinCEN views CheckFree as an MSB. To date, we have not received a ruling from FinCEN. If this part of our business is determined to be an MSB, then it will have to register with FinCEN as an MSB and be regulated as such. Also, nearly all states and the District of Columbia have enacted statutes that require entities engaged in money transmission to register with that jurisdiction’s banking department. We have registered with the relevant banking departments. In addition, our electronic commerce business is subject to the regulations of the Office of Foreign Assets Control, the electronic funds transfer rules embodied in Regulation E promulgated by the Federal Reserve Board and, when conducting certain transactions, the Gramm-Leach-Bliley Act. Our walk-in bill payment service provided by CheckFreePay Corporation and its subsidiaries (“CheckFreePay”) is registered as an MSB with FinCEN. In addition, CheckFreePay currently maintains 44 licenses to comply with the various statutes that regulate money transmission mentioned above, and we are subject to annual examinations by such jurisdictions.
8
Table of Contents
From time to time, in order to comply with our obligations under federal and state laws, we may be required to comply with annual reporting or licensing requirements or to implement operating policies and procedures to protect, among other matters, the privacy and security of our clients’ information.
Employees
We have approximately 20,000 employees, many of whom are specialists in our information management centers and related product and service businesses. This service support network includes employees with backgrounds in computer science and the financial and insurance industries, often complemented by management and other employees with direct experience in banks, thrifts, credit unions, savings institutions, and other financial services environments. Our employees provide expertise in: programming, software development, modification and maintenance; computer operations, network control and technical support; client services and training; business process outsourcing; item and mortgage processing; system conversions; sales and marketing; and account management.
None of our employees in the United States are represented by a union, and there have been no work stoppages, strikes or, to our knowledge, attempts to organize. The service nature of our business makes our employees an important corporate asset. Although the market for qualified personnel is competitive, we have not experienced significant difficulty with hiring or retaining our staff of top industry professionals. In assessing potential acquisition candidates, the quality and stability of the prospective company’s staff are emphasized.
Available Information
Our website address is www.fiserv.com. We are not including the information provided on our website as a part of, or incorporating it by reference into, this Annual Report on Form 10-K. We make available free of charge (other than an investor’s own Internet access charges) through our website our annual reports on Form 10-K, quarterly reports on Form 10-Q, current reports on Form 8-K, and amendments to these reports, as soon as reasonably practicable after we electronically file such material with, or furnish such material to, the Securities and Exchange Commission.
You should carefully consider each of the risks described below, together with all of the other information contained in this Annual Report on Form 10-K, before making an investment decision with respect to our securities. If any of the following risks develop into actual events, our business, financial condition or results of operations could be materially and adversely affected and you may lose all or part of your investment.
Our business may be adversely impacted by U.S. and global market and economic conditions.
For the foreseeable future, we expect to continue to derive most of our revenue from products and services we provide to the financial services industry. Given this concentration, we are exposed to the current global economic conditions in the financial services industry. A prolonged poor economic environment could result in significant decreases in demand by current and potential clients for our products and services, which could have a material adverse effect on our business, results of operations and financial condition.
Consolidations and failures in the banking and financial services industry could adversely affect our revenues by eliminating existing or potential clients and making us more dependent on a more limited number of clients.
Many financial institutions are experiencing operating losses, including many of our clients. In some cases, these operating losses have resulted in the failure and/or consolidation of banks and other financial institutions. Failures, mergers and consolidations of financial institutions reduce the number of our clients and potential clients, which could adversely affect our revenues. Further, if our clients fail or merge with or are acquired by
9
Table of Contents
other entities that are not our clients, or that use fewer of our services, they may discontinue or reduce their use of our services. It is also possible that the larger banks or financial institutions resulting from mergers or consolidations would have greater leverage in negotiating terms with us or could decide to perform in-house some or all of the services which we currently provide or could provide. Any of these developments could have a material adverse effect on our business, results of operations and financial condition.
We operate in a competitive business environment, and if we are unable to compete effectively, our results of operations and financial condition may be adversely affected.
The market for our services is competitive. Our competitors vary in size and in the scope and breadth of the services they offer. Some of our competitors have substantial resources. Since many of our larger potential clients have historically developed their key applications in-house, we often compete against our potential clients’ in-house capabilities. Our existing large clients may also explore the possibility of internally performing portions of the outsourced services that we provide to them. In addition, we expect that the markets in which we compete will continue to attract new competitors and new technologies, including international providers of similar products and services to ours, having a lower cost structure. We cannot provide any assurance that we will be able to compete successfully against current or future competitors or that competitive pressures faced by us in the markets in which we operate will not materially and adversely affect our business, financial condition and results of operations.
If we fail to adapt our products and services to changes in technology or in the marketplace, or if our ongoing efforts to upgrade our technology are not successful, we could lose clients.
The markets for our products and services are characterized by constant technological changes, frequent introductions of new products and services and evolving industry standards. Our ability to enhance our current products and services and to develop and introduce innovative products and services that address the increasingly sophisticated needs of our clients and their customers will significantly affect our future success. We may not be successful in developing, marketing or selling new products and services that meet these changing demands. In addition, we may experience difficulties that could delay or prevent the successful development, introduction or marketing of these services, or our new services and their enhancements may not adequately meet the demands of the marketplace or achieve market acceptance. We continually engage in significant efforts to upgrade our products and services. If we are unsuccessful in completing or gaining market acceptance of new technology, it would likely have a material adverse effect on our ability to retain existing clients or attract new ones.
If we are unable to renew client contracts at favorable terms, we could lose clients and our results of operations and financial condition may be adversely affected.
Failure to achieve favorable renewals of client contracts could negatively impact our business. Our contracts with our clients for account processing services generally run for a period of three to five years in our Financial segment and provide for termination fees upon early termination. Our contracts with financial services organizations for electronic commerce services generally provide for terms of two to five years. At the end of the contract term, clients have the opportunity to renegotiate their contracts with us and to consider whether to engage one of our competitors to provide products and services. In addition, it is possible that clients could seek to renegotiate terms with us. If we are not successful in achieving high renewal rates and favorable contract terms, our results of operations and financial condition may be adversely affected.
The market for our electronic transaction services is evolving and may not continue to develop or grow rapidly enough to sustain profitability.
If the number of electronic transactions does not continue to grow or if consumers or businesses do not continue to adopt our services, it could have a material adverse effect on our business, financial condition and results of operations. We believe future growth in the electronic transactions market will be driven by the cost, ease-of-use, and quality of products and services offered to consumers and businesses. In order to consistently
10
Table of Contents
increase and maintain our profitability, consumers and businesses must continue to adopt our services. In addition, if we are unable to continue to decrease the cost of processing transactions, our margins could decrease, which could have a material adverse effect on our business, financial condition and results of operations. Our electronic commerce business also relies on contracts with financial services organizations, businesses, billers, Internet portals and other third parties to provide branding for our electronic commerce services and to market our services to their customers. These contracts are an important source of the growth in demand for our electronic commerce products. If any of these third parties abandons, curtails or insufficiently increases its marketing efforts, it could have a material adverse effect on our business, financial condition and results of operations.
Our balance sheet includes significant amounts of goodwill and intangible assets. The impairment of a significant portion of these assets would negatively affect our financial results.
Our balance sheet includes goodwill and intangible assets that represent approximately 75% of our total assets at December 31, 2009. These assets consist primarily of goodwill and identified intangible assets associated with our acquisitions, including significant goodwill and intangible assets associated with our acquisition of CheckFree. On at least an annual basis, we assess whether there have been impairments in the carrying value of goodwill and intangible assets. If the carrying value of the asset is determined to be impaired, then it is written down to fair value by a charge to operating earnings. An impairment of a significant portion of goodwill or intangible assets could materially negatively affect our results of operations.
We may be obligated to indemnify the purchasers of businesses pursuant to the terms of the relevant purchase and sale agreements.
In the past several years, we have sold several businesses, including Fiserv Health, Fiserv ISS, Fiserv Insurance, and Fiserv LFS. In connection with these sales, we made representations and warranties about the businesses and their financial affairs and agreed to retain certain liabilities associated with our operation of the businesses prior to their sale. In particular, in connection with the sale of Fiserv ISS, we agreed to retain, or to indemnify the buyers from, certain liabilities associated with our operation of the business prior its sale, including liabilities that relate to legal actions, including class action lawsuits, individual lawsuits and arbitration proceedings, in which plaintiffs, who are owners of self-directed individual retirement accounts for which Fiserv ISS acted as a custodian, allege that we are responsible for the losses caused by Ponzi schemes in which such plaintiffs were involved. Our obligation to indemnify the purchasers and agreement to retain liabilities could have a material adverse effect on our business, results of operations and financial condition.
We may be sued for infringing the intellectual property rights of others.
Third parties may claim that we are infringing their intellectual property rights. We may violate the rights of others without our knowledge. We may expose ourselves to additional liability if we agree to indemnify our clients against third party infringement claims. If the owner of intellectual property establishes that we are infringing its intellectual property rights, or that our intellectual property rights are invalid, we may be forced to change our products or services, and such changes may be expensive or impractical. We may then be forced to seek royalty or license agreements from the owner of such rights. If we are unable to agree on acceptable terms, we may be required to discontinue the sale of key products or halt other aspects of our operations. In addition, we may also be liable for significant financial damages for a violation of intellectual property rights, and we may incur significant expense in connection with indemnifying our clients against losses suffered by them. Any adverse result related to violation of third party intellectual property rights could materially and adversely harm our business, financial condition and results of operations. Even if intellectual property claims brought against us are without merit, they may result in costly and time consuming litigation, and may divert our management and key personnel from operating our business.
11
Table of Contents
Security breaches or computer viruses could harm our business by disrupting our delivery of services and damaging our reputation.
We receive, process, store and transmit our clients’ and their customers’ sensitive information electronically. Unauthorized access to our computer systems could result in the theft or publication of confidential information or the deletion or modification of records or could otherwise cause interruptions in our operations. These concerns about security are increased when we transmit information over the Internet. Computer viruses can be distributed and rapidly spread over the Internet. Computer viruses could infiltrate our systems, disrupting our delivery of services and making our applications unavailable. Any inability to prevent security breaches or computer viruses could have a negative impact on our reputation, could expose us to liability, could decrease market acceptance of electronic transactions and could cause our present and potential clients to choose another service provider. Any of these developments could have a material adverse effect on our business, results of operations and financial condition.
Increased leverage may harm our financial condition and results of operations.
As of December 31, 2009, we had approximately $3.6 billion of total long-term debt, including current maturities. We and our subsidiaries may incur additional indebtedness in the future. Our current level of indebtedness and any future increase in our level of indebtedness could: decrease our ability to obtain additional financing for working capital, capital expenditures, general corporate or other purposes; limit our flexibility to make acquisitions; increase our cash requirements to support the payment of interest; limit our flexibility in planning for, or reacting to, changes in our business and our industry; and increase our vulnerability to adverse changes in general economic and industry conditions. Our ability to make payments of principal and interest on our indebtedness depends upon our future performance, which will be subject to general economic conditions and financial, business and other factors affecting our consolidated operations, many of which are beyond our control. If we are unable to generate sufficient cash flow from operations in the future to service our debt and meet our other cash requirements, we may be required, among other things: to seek additional financing in the debt or equity markets; to refinance or restructure all or a portion of our indebtedness; or to reduce or delay planned capital or operating expenditures. Such measures might not be sufficient to enable us to service our debt and meet our other cash requirements. In addition, any such financing, refinancing or sale of assets might not be available at all or on economically favorable terms, particularly given current and anticipated economic and credit market conditions.
Our acquisition strategy subjects us to risks, including increased debt, assumption of unforeseen liabilities and difficulties in integrating operations.
A major contributor to our growth in revenues and earnings since our inception has been our ability to identify, acquire and integrate complementary businesses. We anticipate that we will continue to seek to acquire complementary businesses, products and services. We may not be able to identify suitable acquisition candidates in the future, which could adversely affect our future growth. Businesses we acquire may not perform as well as expected or be more difficult to integrate and manage than expected, which could adversely affect our business and financial results. We may not be able to fully integrate all aspects of acquired businesses successfully or fully realize the potential benefits of bringing them together. In addition, the process of integrating these acquisitions may disrupt our business and divert our resources.
These risks may arise for a number of reasons: we may not be able to find suitable businesses to acquire at affordable valuations or on other acceptable terms; we face competition for acquisitions from other potential acquirers; we may need to borrow more money from lenders or sell equity or debt securities to the public to finance future acquisitions and the terms of these financings may be adverse to us; changes in accounting, tax, securities or other regulations could increase the difficulty or cost for us to complete acquisitions; we may incur unforeseen obligations or liabilities in connection with acquisitions; we may need to devote unanticipated financial and management resources to an acquired business; we may not realize expected operating efficiencies or product integration benefits from an acquisition; we could enter markets where we have minimal prior experience; and we may experience decreases in earnings as a result of non-cash impairment charges.
12
Table of Contents
Operational failures in our outsourcing or transaction processing facilities could harm our business and reputation.
An operational failure in our outsourcing or transaction processing facilities could cause us to lose clients. Damage or destruction that interrupts our provision of services could damage our relationship with clients and may cause us to incur substantial additional expense to repair or replace damaged equipment. In addition, we may also be liable to third parties or owe service credits to our clients. A prolonged interruption of our services or network that extends for more than several hours could cause us to experience data loss or a reduction in revenues as a result of such interruption. In addition, a significant interruption of service could have a negative impact on our reputation and could cause our present and potential clients to choose another service provider.
We may experience software defects, development delays or installation difficulties, which would harm our business and reputation and expose us to potential liability.
Our services are based on sophisticated software and computing systems, and we may encounter delays when developing new applications and services. Further, the software underlying our services has occasionally contained and may in the future contain undetected errors or defects when first introduced or when new versions are released. In addition, we may experience difficulties in installing or integrating our technologies on platforms used by our clients. Defects in our software, errors or delays in the processing of electronic transactions or other difficulties could result in interruption of business operations, delay in market acceptance, additional development and remediation costs, diversion of technical and other resources, loss of clients, negative publicity or exposure to liability claims. Although we attempt to limit our potential liability through disclaimers and limitation of liability provisions in our license and client agreements, we cannot be certain that these measures will successfully limit our liability.
Misappropriation of our intellectual property and proprietary rights could impair our competitive position.
Our ability to compete depends upon proprietary systems and technology. We actively seek to protect our proprietary rights. Nevertheless, unauthorized parties may attempt to copy aspects of our services or to obtain and use information that we regard as proprietary. The steps we have taken may not prevent misappropriation of technology. Agreements entered into for that purpose may not be enforceable or provide us with an adequate remedy. Effective patent, trademark, service mark, copyright and trade secret protection may not be available in every country in which our applications and services are made available. Misappropriation of our intellectual property or potential litigation concerning such matters could have a material adverse effect on our results of operations or financial condition.
If we fail to comply with applicable regulations our businesses could be harmed.
Our financial services data processing subsidiaries are not directly subject to federal or state regulations specifically applicable to financial institutions such as banks, thrifts and credit unions. However, as a provider of services to these financial institutions, our data processing operations are examined on a regular basis by various federal and state regulatory authorities. If we fail to comply with any applicable regulations, we could be exposed to suits for breach of contract or to governmental proceedings, our client relationships and reputation could be harmed and we could be inhibited in our ability to obtain new clients. In addition, the future enactment of more restrictive laws or rules on the federal or state level, or, with respect to our international operations, in foreign jurisdictions on the national, provincial, state or other level, could have an adverse impact on our results of operations or financial condition.
Our failure to comply with a series of complex regulations in our walk-in payment business could subject us to liability.
CheckFreePay is licensed as a money transmitter in those states where such licensure is required. These licenses require us to demonstrate and maintain certain levels of net worth and liquidity and also require us to file
13
Table of Contents
periodic reports. In addition, this business is subject to regulation in the United States by FinCEN, including anti-money laundering regulations and certain restrictions on transactions to or from certain individuals or entities. The complexity of these regulations will continue to increase our cost of doing business. In addition, any violations of law may result in civil or criminal penalties against us and our officers or the prohibition against us providing money transmitter services in particular jurisdictions.
Item 1B. Unresolved Staff Comments
Not applicable.
We currently operate full-service data centers, software system development centers and item processing and back office support centers in 134 cities. We own 11 buildings, and the remaining 169 locations where we operate our businesses are subject to leases expiring through 2010 and beyond. In addition, we maintain our own national data communication network consisting of communications processors and leased lines. We believe our facilities and equipment are generally well maintained and are in good operating condition. We believe that the computer equipment that we own and our various facilities are adequate for our present and foreseeable business needs. We periodically upgrade our mainframe capability. We maintain our own, and contract with multiple service providers to provide, processing back-up in the event of a disaster. We also maintain copies of data and software used in our business in locations that are separate from our facilities.
In the normal course of business, we and our subsidiaries are named as defendants in lawsuits in which claims are asserted against us. In the opinion of management, the liabilities, if any, which may ultimately result from such lawsuits are not expected to have a material adverse effect on our consolidated financial statements.
Item 4. Submission of Matters to a Vote of Security Holders
During the fourth quarter of the fiscal year covered by this report, no matter was submitted to a vote of our security holders.
14
Table of Contents
EXECUTIVE OFFICERS OF THE REGISTRANT
The names of our executive officers as of February 26, 2010, together with their ages, positions and business experience are described below:
| Name |
Age | Title | ||
| Jeffery W. Yabuki |
49 | President, Chief Executive Officer and Director | ||
| James W. Cox |
46 | Executive Vice President, Corporate Development | ||
| Michael P. Gianoni |
49 | Executive Vice President and Group President, Financial Institutions | ||
| Thomas J. Hirsch |
46 | Executive Vice President, Chief Financial Officer, Treasurer and Assistant Secretary | ||
| Peter J. Kight |
53 | Vice Chairman and Director | ||
| Stephen E. Olsen |
49 | Executive Vice President and Group President, Digital Payments | ||
| Charles W. Sprague |
60 | Executive Vice President, General Counsel and Secretary | ||
| Steven Tait |
50 | Executive Vice President and Group President, Depository Institution Services | ||
| Thomas W. Warsop III |
43 | Executive Vice President and Group President, Global Sales | ||
Mr. Yabuki has been a director and our President and Chief Executive Officer since 2005. Before joining Fiserv, Mr. Yabuki served as Executive Vice President and Chief Operating Officer for H&R Block, Inc., a financial services firm, from 2002 to 2005. From 2001 to 2002, he served as Executive Vice President of H&R Block and from 1999 to 2001, he served as the President of H&R Block International. From 1987 to 1999, Mr. Yabuki held various executive positions with American Express Company, a financial services firm, including President and Chief Executive Officer of American Express Tax and Business Services, Inc.
Mr. Cox has served as Executive Vice President, Corporate Development since 2006. From 2003 to 2006, he served as President of our Health Solutions Group, and joined us in 2001 with the acquisition of Trewit, Inc., where he was President. Prior to that, Mr. Cox was a partner in Virchow Krause & Company, LLP, a public accounting and consulting firm.
Mr. Gianoni has served as Executive Vice President and Group President, Financial Institutions since January 2010. Mr. Gianoni joined Fiserv in 2007 as president of our investment services business. Prior to that, from 2006 to 2007, he served as Executive Vice President of CheckFree Corporation and General Manager, CheckFree Investment Services Division; and, from 1994 to 2005, he was senior vice president of DST Systems, Inc.
Mr. Hirsch has served as Executive Vice President, Chief Financial Officer and Treasurer since 2006. Mr. Hirsch joined Fiserv in 1994 as a Divisional Assistant Controller, became Corporate Assistant Controller in 1996, Corporate Vice President in 1997, Corporate Controller in 1999 and Senior Vice President and Controller in 2002. Prior to joining us, Mr. Hirsch was an audit manager with Deloitte & Touche LLP.
Mr. Kight has been a director and Vice Chairman since 2007. Mr. Kight is the founder of CheckFree Corporation and served as its Chairman and Chief Executive Officer from 1981 until it was acquired by Fiserv in 2007. Mr. Kight has announced that he will resign as Vice Chairman on March 31, 2010, but will remain a director.
Mr. Olsen has served as Executive Vice President and Group President, Digital Payments since early 2010. Prior to that, he served as President of our Internet Banking and Electronic Payments Group from 2007 to 2008 and President of our Depository Institution Services Group from 2008 to 2009. Prior to joining Fiserv, from 1997 to 2007, Mr. Olsen held a variety of positions at CheckFree, most recently as CheckFree’s Chief Operating
15
Table of Contents
Officer. From 1996 to 1997, he served as Vice President, Chief Information Officer of Geac Computer Corporation. And, from 1990 to 1996, Mr. Olsen served as Vice President, Chief Information Officer of Dun & Bradstreet Software.
Mr. Sprague has served as Executive Vice President, General Counsel and Secretary since 1994. He has been involved with our corporate and legal concerns since we were formed in 1984.
Mr. Tait has served as Executive Vice President and Group President, Depository Institution Services since January 2010. Prior to that, Mr. Tait served as President of RSM McGladrey Employer Services, Inc., a subsidiary of H&R Block Inc., from 2003 to 2009, and Executive Vice President, Sales & Client Operations of Gartner, Inc., from 2001 to 2003.
Mr. Warsop has served as Executive Vice President and Group President, Global Sales since early 2010. Prior to that, he served as President of our Financial Institution Services Group from 2007 to 2009. Prior to joining Fiserv in 2007, Mr. Warsop served for 17 years in various capacities, including Vice President, US Financial Services, at Electronic Data Systems Corp. (“EDS”), a publicly-traded global technology services company. He also served as a Vice President with EDS in the United Kingdom and as president of EDS’s Business Process Outsourcing unit in Asia Pacific.
16
Table of Contents
PART II
Item 5. Market for Registrant’s Common Equity, Related Stockholder Matters and Issuer Purchases of Equity Securities
Market Price Information
Our common stock is traded on the Nasdaq Global Select Market under the symbol “FISV.” Set forth below is the high and low sales price of our common stock during the periods presented.
| 2009 | 2008 | |||||||||||
| Quarter Ended |
High | Low | High | Low | ||||||||
| March 31 |
$ | 39.03 | $ | 29.46 | $ | 56.80 | $ | 46.64 | ||||
| June 30 |
47.14 | 35.21 | 54.37 | 45.30 | ||||||||
| September 30 |
50.91 | 43.14 | 54.67 | 43.05 | ||||||||
| December 31 |
50.00 | 45.05 | 46.88 | 27.75 | ||||||||
At December 31, 2009, our common stock was held by 2,901 shareholders of record and by a significantly greater number of shareholders who hold shares in nominee or street name accounts with brokers. The closing sale price of our common stock on February 24, 2010 was $47.69 per share. We have never paid dividends on our common stock, and we do not anticipate paying dividends in the foreseeable future. For additional information regarding our expected use of capital, refer to the discussion in this report under the heading “Management’s Discussion and Analysis of Financial Condition and Results of Operations – Liquidity and Capital Resources.”
Issuer Purchases of Equity Securities
The table below sets forth information with respect to purchases made by or on behalf of us or any “affiliated purchaser” (as defined in Rule 10b-18(a)(3) under the Securities Exchange Act of 1934) of shares of our common stock during the three months ended December 31, 2009:
| Period |
Total Number of Shares Purchased |
Average Price Paid per Share |
Total Number of Shares Purchased as Part of Publicly Announced Plans or Programs(1) |
Maximum Number of Shares that May Yet Be Purchased Under the Plans or Programs(1) | |||||
| October 1-31, 2009 |
— | — | — | 3,216,312 | |||||
| November 1-30, 2009 |
500,000 | $ | 47.48 | 500,000 | 2,716,312 | ||||
| December 1-31, 2009 |
550,000 | $ | 47.72 | 550,000 | 2,166,312 | ||||
| Total |
1,050,000 | 1,050,000 | |||||||
| (1) | The purchases shown in the table above were made pursuant to a May 20, 2009 authorization of our board of directors to purchase up to 5 million shares of our common stock. On February 24, 2010, our board of directors authorized the repurchase of up to 5 million additional shares of our common stock. These repurchase authorizations do not expire. |
17
Table of Contents
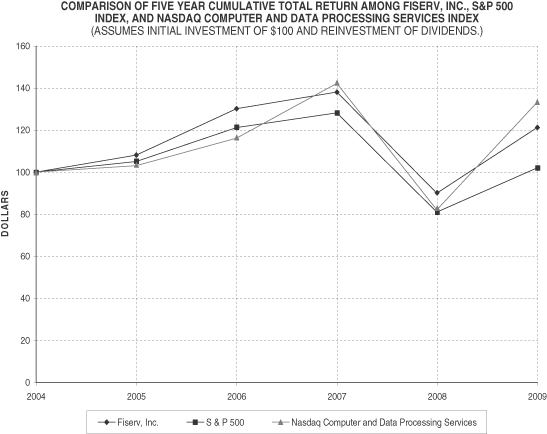
Stock Performance Graph
The stock performance graph and related information presented below is not deemed to be “soliciting material” or to be “filed” with the Securities and Exchange Commission or subject to Regulation 14A or 14C under the Securities Exchange Act of 1934 or to the liabilities of Section 18 of the Securities Exchange Act of 1934, and will not be deemed to be incorporated by reference into any filing under the Securities Act of 1933 or the Securities Exchange Act of 1934, except to the extent we specifically incorporate it by reference into such a filing.
The following graph compares the cumulative total shareholder return on our common stock for the five years ended December 31, 2009 with the S&P 500 Index and the NASDAQ Computer and Data Processing Services Index. The graph assumes that $100 was invested on December 31, 2004 in our common stock and each index and that all dividends were reinvested. No cash dividends have been declared on our common stock. The comparisons in the graph are required by the Securities and Exchange Commission and are not intended to forecast or be indicative of possible future performance of our common stock.
| December 31, | ||||||||||||||||||
| 2004 | 2005 | 2006 | 2007 | 2008 | 2009 | |||||||||||||
| Fiserv, Inc. |
$ | 100 | $ | 108 | $ | 130 | $ | 138 | $ | 90 | $ | 121 | ||||||
| S&P 500 |
100 | 105 | 121 | 128 | 81 | 102 | ||||||||||||
| Nasdaq Computer and Data Processing Services |
100 | 103 | 116 | 142 | 82 | 133 | ||||||||||||
18
Table of Contents
Item 6. Selected Financial Data
The following data, which has been affected by acquisitions and dispositions, should be read in conjunction with the consolidated financial statements and accompanying notes included elsewhere in this Annual Report on Form 10-K.
| (In millions, except per share data) |
2009 | 2008 | 2007 | 2006 | 2005 | ||||||||||
| Total revenues |
$ | 4,077 | $ | 4,587 | $ | 3,677 | $ | 3,301 | $ | 3,009 | |||||
| Income from continuing operations |
$ | 473 | $ | 358 | $ | 412 | $ | 377 | $ | 435 | |||||
| Income from discontinued operations |
3 | 211 | 27 | 73 | 81 | ||||||||||
| Net income |
$ | 476 | $ | 569 | $ | 439 | $ | 450 | $ | 516 | |||||
| Net income per share—basic: |
|||||||||||||||
| Continuing operations |
$ | 3.06 | $ | 2.21 | $ | 2.47 | $ | 2.15 | $ | 2.31 | |||||
| Discontinued operations |
0.02 | 1.30 | 0.16 | 0.42 | 0.43 | ||||||||||
| Total |
$ | 3.08 | $ | 3.51 | $ | 2.64 | $ | 2.57 | $ | 2.74 | |||||
| Net income per share—diluted: |
|||||||||||||||
| Continuing operations |
$ | 3.04 | $ | 2.20 | $ | 2.44 | $ | 2.12 | $ | 2.28 | |||||
| Discontinued operations |
0.02 | 1.29 | 0.16 | 0.41 | 0.42 | ||||||||||
| Total |
$ | 3.06 | $ | 3.49 | $ | 2.60 | $ | 2.53 | $ | 2.70 | |||||
| Total assets |
$ | 8,378 | $ | 9,331 | $ | 11,846 | $ | 6,252 | $ | 6,092 | |||||
| Long-term debt (including current maturities) |
3,641 | 4,105 | 5,405 | 745 | 595 | ||||||||||
| Shareholders’ equity |
3,026 | 2,594 | 2,467 | 2,426 | 2,466 | ||||||||||
Item 7. Management’s Discussion and Analysis of Financial Condition and Results of Operations
Overview
Management’s discussion and analysis of financial condition and results of operations is provided as a supplement to our consolidated financial statements and accompanying notes to help provide an understanding of our financial condition, the changes in our financial condition and our results of operations. Our discussion is organized as follows:
| • | Critical accounting policies. This section contains a discussion of the accounting policies that we believe are important to our financial condition and results of operations and that require judgment and estimates on the part of management in their application. In addition, all of our significant accounting policies, including critical accounting policies, are summarized in Note 1 to the accompanying consolidated financial statements. |
| • | Results of operations. This section contains an analysis of our results of operations by comparing the results for the year ended December 31, 2009 to the results for the year ended December 31, 2008, and comparing the results for the year ended December 31, 2008 to the results for the year ended December 31, 2007. |
| • | Liquidity and capital resources. This section provides an analysis of our cash flows and a discussion of our outstanding debt and commitments at December 31, 2009. |
Critical Accounting Policies
General
Our consolidated financial statements and accompanying notes have been prepared in accordance with accounting principles generally accepted in the United States of America. The preparation of these financial
19
Table of Contents
statements requires our management to make estimates, judgments and assumptions that affect the reported amount of assets, liabilities, revenues and expenses. We continually evaluate the accounting policies and estimates that we use to prepare our consolidated financial statements. We base our estimates on historical experience and assumptions that we believe are reasonable in light of current circumstances. Actual amounts and results could differ materially from these estimates.
Valuation of Goodwill and Acquired Intangible Assets
We are required to allocate the purchase price of acquired businesses to the assets acquired and liabilities assumed in the transaction at their estimated fair values. The estimates used to determine the fair value of long-lived assets, such as intangible assets, can be complex and require significant judgments. We use information available to us to make fair value determinations and engage independent valuation specialists, when necessary, to assist in the fair value determination of significant acquired long-lived assets. We are also required to estimate the useful lives of intangible assets to determine the amount of acquisition-related intangible asset amortization expense to record in future periods. We periodically review the estimated useful lives assigned to our intangible assets to determine whether such estimated useful lives continue to be appropriate.
We review the carrying value of goodwill for impairment annually and whenever events or changes in circumstances indicate the carrying value may not be recoverable. Accounting guidance requires us to perform a two-step impairment test on goodwill. First, we compare the fair value of each reporting unit to its carrying value. We determine the fair value of our reporting units based on the present value of estimated future cash flows and we compare the aggregate fair values to our market capitalization as an assessment of the appropriateness of our fair value measurements. If the fair value of a reporting unit exceeds the carrying value of the unit’s net assets, goodwill is not impaired and further testing is not required. If the carrying value of the reporting unit’s net assets exceeds the fair value of the unit, then we perform the second step of the impairment test to determine the implied fair value of the reporting unit’s goodwill and any impairment charge. Determining the fair value of a reporting unit involves judgment and the use of significant estimates and assumptions, which include assumptions regarding the revenue growth rates and operating margins used to calculate estimated future cash flows, risk-adjusted discount rates and future economic and market conditions. Our most recent impairment assessment in the fourth quarter of 2009 determined that our goodwill was not impaired.
We review acquired intangible assets for impairment whenever events or changes in circumstances indicate the carrying amount of the asset may not be recoverable. Recoverability is assessed by comparing the carrying amount of the asset to the undiscounted future cash flows expected to be generated by the asset. Measurement of any impairment loss is based on estimated fair value. Based on our impairment assessments in 2009, we determined that our acquired intangible assets were not impaired.
Given the significance of our goodwill and intangible asset balances, an adverse change in fair value could result in an impairment charge, which could be material to our consolidated financial statements.
Revenue Recognition
The majority of our revenues are generated from monthly account and transaction-based fees. Deferred revenues consist primarily of advance billings for services. Revenue is recognized as services are provided. Revenues are primarily recognized under service agreements that are long-term in nature, generally three to five years, and that do not require management to make significant judgments or assumptions. Given the nature of our business and the rules governing revenue recognition, our revenue recognition practices do not involve significant estimates that materially affect our results of operations. Additional information about our revenue recognition policies is included in Note 1 to the consolidated financial statements.
Other
We do not participate in, nor have we created, any off-balance sheet variable interest entities or other off-balance sheet financing, other than operating leases. We use derivative financial instruments for managing
20
Table of Contents
our exposure to changes in interest rates, managing our ratio of fixed to floating-rate debt and foreign exchange rate risks. We do not enter into any derivative financial instruments for speculative purposes.
Results of Operations
Business Segments
Our ongoing operations are comprised of the Financial Institution Services (“Financial”) segment, Payments and Industry Products (“Payments”) segment and Corporate and Other segment. The Financial segment provides banks, thrifts and credit unions with account processing services, item processing services, loan origination and servicing products, cash management and consulting services, and other products and services that support numerous types of financial transactions. The Payments segment primarily provides electronic bill payment and settlement, electronic funds transfer, and debit processing products and services to meet the electronic transaction processing needs of the financial services industry. Our businesses in this segment also provide card and print personalization services, Internet banking, investment account processing services for separately managed accounts, and fraud and risk management products and services. The Corporate and Other segment primarily consists of unallocated corporate overhead expenses, amortization of acquisition-related intangible assets and intercompany eliminations. In July 2008, we completed the sale of a 51% interest in substantially all of the businesses in the Insurance Services (“Insurance”) segment.
Components of Revenues and Expenses
The following summary describes the components of revenues and expenses as presented in our consolidated statements of income. A description of our revenue recognition policies is included in Note 1 to the consolidated financial statements.
Processing and Services
Processing and services revenues, which in 2009 represented approximately 80% of our consolidated revenues, are primarily generated from account and transaction-based fees under contracts that generally have terms of three to five years. Revenue is recognized when the related transactions are processed and services have been performed. Processing and services revenues are most reflective of our business performance because a significant amount of our total operating profit is generated by these services. Cost of processing and services includes costs directly associated with providing services to clients and includes the following: personnel; equipment and data communication; infrastructure costs, including costs to maintain applications; client support; depreciation and amortization; and other operating expenses.
Product
Product revenues, which in 2009 represented approximately 20% of our consolidated revenues, are primarily derived from integrated print and card production (15%) and software licenses (5%). Cost of product includes costs directly associated with the products sold and includes the following: costs of materials; personnel; infrastructure costs; depreciation and amortization; and other costs directly associated with product revenue. Prior to our sale of a 51% interest in substantially all of the businesses in our Insurance segment (“Fiserv Insurance”) on July 14, 2008, product revenues and cost of product also included prescription related items which were recognized on a gross basis.
Selling, General and Administrative Expenses
Selling, general and administrative expenses primarily consist of: salaries, wages and related expenses paid to sales personnel, administrative employees and management; advertising and promotional costs; depreciation and amortization; and other selling and administrative expenses.
21
Table of Contents
Results of Operations
The following table presents certain amounts included in our consolidated statements of income, the relative percentage that those amounts represent to revenues and the change in those amounts from year to year. This information should be read together with the consolidated financial statements and accompanying notes.
| Years Ended December 31, | |||||||||||||||||||||||||||||||||||
| (In millions) |
Percentage of Revenue(1) | Increase (Decrease) | |||||||||||||||||||||||||||||||||
| 2009 | 2008 | 2007 | 2009 | 2008 | 2007 | 2009 vs. 2008 | 2008 vs. 2007 | ||||||||||||||||||||||||||||
| Revenues: |
|||||||||||||||||||||||||||||||||||
| Processing and services |
$ | 3,329 | $ | 3,464 | $ | 2,448 | 81.7 | % | 75.5 | % | 66.6 | % | $ | (135 | ) | (4 | %) | $ | 1,016 | 42 | % | ||||||||||||||
| Product |
748 | 1,123 | 1,229 | 18.3 | % | 24.5 | % | 33.4 | % | (375 | ) | (33 | %) | (106 | ) | (9 | %) | ||||||||||||||||||
| Total revenues |
4,077 | 4,587 | 3,677 | 100 | % | 100 | % | 100 | % | (510 | ) | (11 | %) | 910 | 25 | % | |||||||||||||||||||
| Expenses: |
|||||||||||||||||||||||||||||||||||
| Cost of processing and services |
1,844 | 1,949 | 1,449 | 55.4 | % | 56.3 | % | 59.2 | % | (105 | ) | (5 | %) | 500 | 35 | % | |||||||||||||||||||
| Cost of product |
536 | 917 | 979 | 71.7 | % | 81.7 | % | 79.7 | % | (381 | ) | (42 | %) | (62 | ) | (6 | %) | ||||||||||||||||||
| Sub-total |
2,380 | 2,866 | 2,428 | 58.4 | % | 62.5 | % | 66.0 | % | (486 | ) | (17 | %) | 438 | 18 | % | |||||||||||||||||||
| Selling, general and administrative |
751 | 813 | 513 | 18.4 | % | 17.7 | % | 14.0 | % | (62 | ) | (8 | %) | 300 | 58 | % | |||||||||||||||||||
| Total expenses |
3,131 | 3,679 | 2,941 | 76.8 | % | 80.2 | % | 80.0 | % | (548 | ) | (15 | %) | 738 | 25 | % | |||||||||||||||||||
| Operating income |
946 | 908 | 736 | 23.2 | % | 19.8 | % | 20.0 | % | 38 | 4 | % | 172 | 23 | % | ||||||||||||||||||||
| Interest expense |
(220 | ) | (260 | ) | (76 | ) | (5.4 | %) | (5.7 | %) | (2.1 | %) | (40 | ) | (15 | %) | 184 | 242 | % | ||||||||||||||||
| Interest income |
8 | 13 | 7 | 0.2 | % | 0.3 | % | 0.2 | % | (5 | ) | (38 | %) | 6 | 86 | % | |||||||||||||||||||
| Loss on sale of businesses |
— | (21 | ) | — | — | (0.5 | %) | — | (21 | ) | (100 | %) | 21 | — | |||||||||||||||||||||
| Income from continuing operations before income taxes and income from investment in unconsolidated affiliate |
$ | 734 | $ | 640 | $ | 667 | 18.0 | % | 14.0 | % | 18.1 | % | $ | 94 | 15 | % | $ | (27 | ) | (4 | %) | ||||||||||||||
| (1) | Each percentage of revenue is calculated as the relevant revenue, expense, income or loss amount divided by total revenues, except for cost of processing and services and cost of product amounts which are divided by the related component of revenues. |
Total Revenues
| Years Ended December 31, | ||||||||||||||||||||
| (In millions) |
Financial | Payments | Insurance | Corporate and Other |
Total | |||||||||||||||
| Total revenues: |
||||||||||||||||||||
| 2009 |
$ | 1,942 | $ | 2,160 | $ | — | $ | (25 | ) | $ | 4,077 | |||||||||
| 2008 |
1,992 | 2,131 | 513 | (49 | ) | 4,587 | ||||||||||||||
| 2007 |
1,830 | 1,070 | 804 | (27 | ) | 3,677 | ||||||||||||||
| 2009 Revenue growth (decline) |
$ | (50 | ) | $ | 29 | $ | (513 | ) | $ | 24 | $ | (510 | ) | |||||||
| 2009 Revenue growth (decline) percentage |
(3 | %) | 1 | % | (100 | %) | (11 | %) | ||||||||||||
| 2008 Revenue growth (decline) |
$ | 162 | $ | 1,061 | $ | (291 | ) | $ | (22 | ) | $ | 910 | ||||||||
| 2008 Revenue growth (decline) percentage |
9 | % | 99 | % | (36 | %) | 25 | % | ||||||||||||
Total revenues decreased $510 million, or 11%, in 2009 compared to 2008, and increased $910 million, or 25%, in 2008 compared to 2007. The decrease in total revenues in 2009 compared to 2008 was primarily due to
22
Table of Contents
our sale of a 51% interest in Fiserv Insurance in July 2008, which resulted in a decrease of $513 million, or 11%. As a result of this transaction, the revenues of Fiserv Insurance are no longer included in our consolidated revenues beginning July 15, 2008. In addition, 2009 revenues were impacted by a 1% increase in revenues in our Payments segment and a 3% decline in revenues in our Financial segment. Incremental revenue from acquired companies totaled $27 million, or approximately 1%, in 2009. The increase in total revenues in 2008 compared to 2007 was primarily the result of increased processing and services revenues from our acquisition of CheckFree Corporation (“CheckFree”) in December 2007, partially offset by decreased revenues in our Insurance segment as a result of the sale of a 51% interest in Fiserv Insurance.
Revenues in our Financial segment decreased $50 million, or 3%, in 2009 and increased $162 million, or 9%, in 2008 compared to the prior year periods. Financial segment revenues in 2009 were negatively impacted by 2 percentage points, or $35 million, due to lower contract termination fee revenues, which declined from $42 million in 2008 to $7 million in 2009. The businesses in our Financial segment generally enter into three to five year contracts with clients that contain early contract termination fees. These fees are primarily generated when an existing client is acquired by another financial institution and can vary significantly from period to period based on the number and size of clients that are acquired and how early in the contract term a contract is terminated. In addition, revenues in our Financial segment were negatively impacted by lower discretionary spending by our financial institution clients and a decline in item processing revenues. The increase in Financial segment revenues in 2008 compared to 2007 was primarily due to incremental processing and services revenues from our acquisition of CheckFree.
Revenues in our Payments segment increased $29 million, or 1%, in 2009 and increased $1.06 billion, or 99%, in 2008 compared to the prior year periods. The revenue growth in our Payments segment during 2009 was primarily driven by new clients and increased transaction volumes from existing clients in our bill payment and electronic funds transfer businesses, partially offset by revenue declines in our investment services business from a reduction in the number of accounts processed as a result of the volatility in the U.S. equity markets and a decline in product revenues due primarily to lower software license revenues. Revenue increases in our Payments segment during 2008 were primarily due to incremental processing and services revenue from our acquisition of CheckFree.
Total Expenses
Total expenses decreased $548 million, or 15%, in 2009 and increased $738 million, or 25%, in 2008 compared to the prior year periods. The decrease in total expenses in 2009 compared to 2008 was primarily due to our sale of a 51% interest in Fiserv Insurance in July 2008, which resulted in a decrease in total expenses of $469 million, or 13%. The increase in total expenses in 2008 compared to 2007 was primarily the result of our acquisition of CheckFree, partially offset by decreased expenses due to the sale of a 51% interest in Fiserv Insurance.
Cost of processing and services as a percentage of processing and services revenue decreased to 55.4% in 2009 from 56.3% in 2008 and 59.2% in 2007. The decreases in both 2009 and 2008 compared to the prior years were favorably impacted by overall improvements in operating efficiencies as a result of improved business mix and the implementation of strategic initiatives that lowered our overall cost structure. The decrease in 2008 as compared to 2007 was primarily due to higher-margin processing revenues associated with our acquisition of CheckFree.
Cost of product as a percentage of product revenue was 71.7% in 2009 compared to 81.7% in 2008 and 79.7% in 2007. The lower percentage of revenue in 2009 compared to 2008 and 2007 was primarily due to our sale of a 51% interest in Fiserv Insurance, which generated historical overall operating margins of less than 10 percent primarily due to the inclusion of prescription product costs in both product revenues and cost of product. Prescription product costs totaled $312 million and $449 million in 2008 and 2007, respectively, compared to no such costs in 2009.
23
Table of Contents
Selling, general and administrative expenses decreased $62 million, or 8%, in 2009 and increased $300 million, or 58%, in 2008 compared to the prior year periods. The decrease in 2009 compared to 2008 was impacted by a decrease of $36 million, or 4%, from our sale of a 51% interest in Fiserv Insurance. In addition, the decline in selling, general and administrative expenses in 2009 was due to a $36 million positive impact resulting from lower merger related expenses and the reversal of a pre-acquisition liability associated with our acquisition of CheckFree, partially offset by a $20 million increase in employee severance and related expenses. The increase in 2008 compared to 2007 was primarily due to our acquisition of CheckFree, including increases in amortization expense for acquired intangible assets and merger related expenses, partially offset by a decrease in expenses from our sale of a 51% interest in Fiserv Insurance.
Operating Income and Operating Margin
| Years Ended December 31, (In millions) |
Financial | Payments | Insurance | Corporate and Other |
Total | |||||||||||||||
| Operating income: |
||||||||||||||||||||
| 2009 |
$ | 569 | $ | 617 | $ | — | $ | (240 | ) | $ | 946 | |||||||||
| 2008 |
545 | 579 | 44 | (260 | ) | 908 | ||||||||||||||
| 2007 |
506 | 253 | 78 | (101 | ) | 736 | ||||||||||||||
| Operating income growth (decline): |
||||||||||||||||||||
| 2009 |
$ | 24 | $ | 38 | $ | (44 | ) | $ | 20 | $ | 38 | |||||||||
| 2009 percentage |
4 | % | 7 | % | (100 | %) | 4 | % | ||||||||||||
| 2008 |
$ | 39 | $ | 326 | $ | (34 | ) | $ | (159 | ) | $ | 172 | ||||||||
| 2008 percentage |
8 | % | 129 | % | (44 | %) | 23 | % | ||||||||||||
| Operating margin: |
||||||||||||||||||||
| 2009 |
29.3 | % | 28.6 | % | — | 23.2 | % | |||||||||||||
| 2008 |
27.4 | % | 27.2 | % | 8.7 | % | 19.8 | % | ||||||||||||
| 2007 |
27.6 | % | 23.6 | % | 9.7 | % | 20.0 | % | ||||||||||||
| Operating margin growth (decline):(1) |
||||||||||||||||||||
| 2009 |
1.9 | % | 1.4 | % | — | 3.4 | % | |||||||||||||
| 2008 |
(0.2 | %) | 3.6 | % | (1.0 | %) | (0.2 | %) | ||||||||||||
| (1) | Represents the percentage point improvement or decline in operating margin. |
Total operating income increased $38 million, or 4%, in 2009 compared to 2008. Operating margin increased to 23.2% in 2009 from 19.8% in 2008. Operating margins improved by 340 basis points in 2009 due primarily to strong operating margin expansion in both the Financial and Payments segments, the implementation of strategic initiatives that lowered our overall cost structure, lower merger and integration costs associated with our acquisition of CheckFree, and the sale of a 51% interest in Fiserv Insurance, which historically generated lower operating margins. These positive factors were partially offset by decreases in higher-margin contract termination fees.
Total operating income increased $172 million, or 23%, in 2008 compared to 2007. Operating margin decreased to 19.8% in 2008 from 20.0% in 2007. The overall increase in operating income during 2008 was primarily due to our acquisition of CheckFree in December 2007. Our operating margin in 2008 of 19.8% was negatively impacted by an increase in amortization expense for acquired intangible assets and merger and integration costs associated with our acquisition of CheckFree, and by declining operating margins in the Insurance segment, partially offset by strong results in our Payments segment.
Operating income in our Financial segment increased $24 million, or 4%, in 2009 and $39 million, or 8%, in 2008 compared to the prior year periods. Operating margins were 29.3%, 27.4% and 27.6% in 2009, 2008 and 2007, respectively, and increased 190 basis points in 2009 and declined 20 basis points in 2008. The improvements in operating income and operating margin in 2009 were primarily due to overall improvements in operating efficiencies, cost reductions, improved business mix, and scale efficiencies in our bank and credit
24
Table of Contents
union account processing businesses. These positive factors were partially offset by the negative impact of a $35 million decrease in higher-margin contract termination fee revenues. The increase in operating income during 2008 was primarily due to our acquisition of CheckFree in December 2007.
Operating income in our Payments segment increased $38 million, or 7%, in 2009 and $326 million, or 129%, in 2008 compared to the prior year periods. Operating margins were 28.6%, 27.2% and 23.6% in 2009, 2008 and 2007, respectively, and increased 140 basis points in 2009 and 360 basis points in 2008. The Payments segment operating income and margin in 2009 and 2008 were positively impacted by cost savings associated with the integration of CheckFree and growth in higher-margin revenues resulting in improved operating leverage and scale efficiencies in our transaction processing electronic payments businesses, partially offset by a decline in software license revenues in 2009. In addition, the increases in operating income and margin in 2008 compared to 2007 were impacted by higher-margin revenues associated with our acquisition of CheckFree.
The operating loss in our Corporate and Other segment decreased $20 million in 2009 and increased $159 million in 2008 compared to the prior year periods. The operating loss decrease in 2009 compared to 2008 was primarily due to a $36 million positive impact resulting from lower merger related expenses and the reversal of a pre-acquisition liability associated with our acquisition of CheckFree, partially offset by a $20 million increase in employee severance and related expenses and increased spending for several company-wide initiatives in 2009. The operating loss increase in 2008 compared to 2007 was primarily due to our acquisition of CheckFree resulting in increases in amortization expense for acquired intangible assets of $117 million and merger related expenses of $29 million.
Interest Expense
Interest expense was $220 million, $260 million and $76 million in 2009, 2008 and 2007, respectively. The $40 million decrease in interest expense in 2009 was primarily due to decreases in total outstanding borrowings and interest rates during 2009 compared to 2008. The $184 million increase in interest expense in 2008 was primarily due to new senior term loan and senior notes borrowings in the fourth quarter of 2007 to finance our $4.4 billion acquisition of CheckFree.
Interest Income
Interest income was $8 million, $13 million and $7 million in 2009, 2008 and 2007, respectively. Interest income in 2008 was higher than 2009 and 2007 due primarily to interest income earned from investing the proceeds of several business dispositions.
Loss on Sale of Businesses
In 2008, we recognized a $21 million pre-tax loss due to our sale of a 51% interest in Fiserv Insurance.
Income Tax Provision
Our effective income tax rate for continuing operations was 37.2% in 2009, 44.9% in 2008, and 38.2% in 2007. The higher effective income tax rate in 2008 was due primarily to income taxes associated with our sale of a 51% interest in Fiserv Insurance. In addition, our effective income tax rate in 2009 includes the positive impact of a tax settlement. The significant items impacting our effective income tax rates for continuing operations were as follows:
25
Table of Contents
| Years Ended December 31, | |||||||||
| 2009 | 2008 | 2007 | |||||||
| Statutory federal, state and foreign income tax provisions, net |
38.1 | % | 38.3 | % | 38.2 | % | |||
| Sale of Fiserv Insurance(1) |
— | 6.6 | % | — | |||||
| Tax settlement(2) |
(0.9 | %) | — | — | |||||
| Effective income tax rate |
37.2 | % | 44.9 | % | 38.2 | % | |||
| (1) | Represents a $34 million income tax provision related to our sale of a 51% interest in Fiserv Insurance. |
| (2) | Represents a $7 million income tax benefit recognized in conjunction with the final settlement of a CheckFree purchase accounting income tax reserve. |
Income from Investment in Unconsolidated Affiliate
Beginning in July 2008, we record our 49% share of Fiserv Insurance’s net income, $12 million in 2009 and $6 million in 2008, as income from investment in unconsolidated affiliate.
Income from Discontinued Operations
Income from discontinued operations totaled $3 million, $211 million and $27 million in 2009, 2008 and 2007, respectively. Income from discontinued operations includes after-tax gains from the sale of businesses of $25 million and $229 million in 2009 and 2008, respectively.
Net Income Per Share—Diluted from Continuing Operations
Net income per share-diluted from continuing operations was $3.04 in 2009 compared to $2.20 in 2008 and $2.44 in 2007. Net income per share-diluted from continuing operations in 2009 compared to 2008 was positively impacted by operating income growth in 2009, a $0.34 per share after-tax loss on the sale of a 51% interest in Fiserv Insurance recognized in 2008, and a $0.14 per share decrease in merger related expenses in 2009 associated with our acquisition of CheckFree. Net income per share-diluted from continuing operations in 2008 compared to 2007 was negatively impacted by a $0.45 per share increase in amortization expense related to acquired intangible assets, the loss on the sale of a 51% interest in Fiserv Insurance, and a $0.11 per share increase in merger related expenses. The amortization of acquisition-related intangible assets reduced net income per share-diluted from continuing operations by $0.58, $0.57 and $0.12 in 2009, 2008 and 2007, respectively.
Liquidity and Capital Resources
Our primary liquidity needs are: (i) to fund normal operating expenses; (ii) to meet the principal and interest requirements of our outstanding indebtedness; and (iii) to fund capital expenditures and operating lease payments. We believe these needs will be satisfied using cash flows generated by operations, our cash and cash equivalents at December 31, 2009 of $363 million and available borrowings under our revolving credit facility of $870 million at December 31, 2009.
| Years Ended December 31, |
Increase (Decrease) |
||||||||||||
| (In millions) |
2009 | 2008 | $ | % | |||||||||
| Income from continuing operations |
$ | 473 | $ | 358 | $ | 115 | |||||||
| Depreciation and other amortization |
188 | 200 | (12 | ) | |||||||||
| Amortization of acquisition-related intangible assets |
145 | 150 | (5 | ) | |||||||||
| Share-based compensation |
36 | 34 | 2 | ||||||||||
| Loss on sale of businesses |
— | 21 | (21 | ) | |||||||||
| Net changes in working capital and other |
8 | 3 | 5 | ||||||||||
| Operating cash flow |
$ | 850 | $ | 766 | $ | 84 | 11 | % | |||||
| Capital expenditures |
$ | 198 | $ | 198 | $ | — | — | ||||||
26
Table of Contents
Our net cash provided by operating activities from continuing operations, or operating cash flow, increased $84 million, or 11%, to $850 million in 2009 from $766 million in 2008. Our current policy is to use our operating cash flow primarily to repay debt and fund capital expenditures, acquisitions and share repurchases, rather than to pay dividends. Our capital expenditures were $198 million, less than 5% of our total revenues, in 2009 and 2008.
In 2009, we received net cash of $132 million related to discontinued operations, including proceeds from the sale of businesses and contingent purchase price related to our 2008 sale of a portion of Fiserv ISS. In the third quarter of 2009, Fiserv Insurance, of which we own 49%, refinanced its outstanding debt. In conjunction with the refinancing, we loaned Fiserv Insurance $67 million, with interest payable quarterly and the principal due in 2013. In December 2009, Fiserv Insurance repaid $10 million of this loan.
Share Repurchases
We purchased $175 million, $441 million and $469 million of our common stock in 2009, 2008 and 2007, respectively. On May 20, 2009, our board of directors authorized the repurchase of up to 5 million shares of our common stock. Shares repurchased are generally held for issuance in connection with our equity plans. As of December 31, 2009, we had 2.2 million shares remaining under this authorization. On February 24, 2010, our board of directors authorized the repurchase of up to 5 million additional shares of our common stock.
Indebtedness
| December 31, | ||||||
| (In millions) |
2009 | 2008 | ||||
| Long-term debt (including current maturities) |
$ | 3,641 | $ | 4,105 | ||
In 2009, we used a portion of our operating cash flow to repay $475 million of debt, which reduced our total outstanding debt, including current maturities, to $3.64 billion at December 31, 2009. Our long-term debt currently consists primarily of $1.88 billion under our unsecured senior term loan facility and $1.75 billion under senior notes borrowings. We were in compliance with all financial debt covenants in 2009.
Senior Term Loan
In December 2007, we entered into an unsecured senior term loan facility with a syndicate of banks. Our term loan borrowings under this facility bear interest at a variable rate based on LIBOR plus a specified margin or the bank’s base rate and mature in November 2012. Principal payments of $255 million and $375 million are due in December 2010 and 2011, respectively, and the remaining principal of $1.25 billion is due in November 2012. The weighted-average variable interest rate on the term loan borrowings was 0.9% at December 31, 2009. The term loan facility contains various restrictions and covenants substantially similar to those contained in the revolving credit facility described below.
Revolving Credit Facility
We maintain a $900 million unsecured revolving credit facility with a syndicate of banks. The facility bears interest at a variable rate based on LIBOR plus a specified margin or the bank’s base rate. There are no significant commitment fees or compensating balance requirements. The revolving credit facility, as amended, contains various restrictions and covenants that require us, among other things, to limit our consolidated indebtedness to no more than three and one-half times consolidated net earnings before interest, taxes, depreciation and amortization and certain other adjustments, and to maintain consolidated net earnings before interest, taxes, depreciation and amortization and certain other adjustments of at least three times consolidated interest expense. The facility expires on March 24, 2011. As of December 31, 2009, we issued letters of credit totaling $30 million under this facility and our available borrowings were $870 million.
27
Table of Contents
Senior Notes
In November 2007, we issued $1.25 billion of 6.125% senior notes due in November 2012 and $500 million of 6.8% senior notes due in November 2017, which pay interest at the stated rate on May 20 and November 20 of each year. The interest rates applicable to these notes are subject to an increase of up to two percent in the event that our credit rating is downgraded below investment grade. The indenture governing the senior notes contains covenants that, among other matters, limit: our ability to consolidate or merge into, or convey, transfer or lease all or substantially all of our properties and assets to, another person; our ability to create or assume liens; and our ability to engage in sale and leaseback transactions.
Interest Rate Hedge Contracts
To manage exposure to fluctuations in interest rates, we maintain a series of interest rate swap agreements (“Swaps”) with total notional values of $1.2 billion at December 31, 2009. The Swaps effectively fix interest rates on floating rate term loan borrowings at a weighted-average rate of approximately 4.8%, prior to financing spreads and related fees, and have expiration dates through September 2012.
Shelf Registration Statement
In 2007, we filed a “shelf” registration statement with the Securities and Exchange Commission. Under the registration statement, we may sell common stock, preferred stock and debt securities, or a combination thereof. Each time we sell securities pursuant to the shelf registration statement, we will provide a prospectus supplement that will contain specific information about the terms of the securities being offered and of the offering. We may offer and sell the securities pursuant to this prospectus from time to time in one or more of the following ways: through underwriters or dealers, through agents, directly to purchasers or through a combination of any of these methods of sales. Proceeds from the sale of these securities may be used to repay debt or for working capital, acquisitions or general corporate purposes.
Other
Access to capital markets impacts our cost of capital, our ability to refinance maturing debt and our ability to fund future acquisitions. Our ability to access capital on favorable terms depends on a number of factors, including general market conditions, interest rates, credit ratings on our debt securities, perception of our potential future earnings and the market price of our common stock. As of December 31, 2009, we had a credit rating of Baa2 with a stable outlook from Moody’s Investors Service, Inc. (“Moody’s”) and BBB with a negative outlook from Standard & Poor’s Ratings Services (“S&P”) on our senior unsecured debt securities.
The interest rate payable on our senior notes is subject to adjustment from time to time if Moody’s or S&P downgrades (or subsequently upgrades) the debt rating applicable to the notes. If the ratings from Moody’s or S&P decrease below investment grade, the per annum interest rate on the notes is subject to increase by up to 2.0%. In no event will the per annum interest rate be reduced below the original interest rate applicable to the senior notes or will the total increase in the per annum interest rate exceed 2.0% above the original interest rate. The interest rates on any series of notes will permanently cease to be subject to any adjustment if the notes becomes rated A3 (or its equivalent) or higher by Moody’s and A- (or its equivalent) or higher by S&P, in each case with a stable or positive outlook.
28
Table of Contents
Off-Balance Sheet Arrangements and Contractual Obligations
We do not have any material off-balance sheet arrangements. The following table details our contractual cash obligations at December 31, 2009:
| (In millions) |
Total | Less than 1 year |
1-3 years | 3-5 years | More than 5 years | ||||||||||
| Long-term debt including interest(1) |
$ | 4,292 | $ | 433 | $ | 3,191 | $ | 70 | $ | 598 | |||||
| Minimum operating lease payments(1) |
346 | 93 | 132 | 69 | 52 | ||||||||||
| Purchase obligations |
75 | 32 | 37 | 5 | 1 | ||||||||||
| Income tax obligations |
47 | 10 | 24 | 12 | 1 | ||||||||||
| Total |
$ | 4,760 | $ | 568 | $ | 3,384 | $ | 156 | $ | 652 | |||||
| (1) | Interest and operating lease payments are reported on a pre-tax basis. |
Item 7A. Quantitative and Qualitative Disclosures About Market Risk
Market risk refers to the risk that a change in the level of one or more market prices, interest rates, currency exchange rates, indices, correlations or other market factors, such as liquidity, will result in losses for a certain financial instrument or group of financial instruments. We are exposed primarily to interest rate risk and market price risk on outstanding debt, investments of subscriber funds and foreign currency risk. We actively monitor these risks through a variety of control procedures involving senior management.
In connection with processing electronic payments transactions, the funds we receive from subscribers are invested from the time we collect the funds until payments are made to the applicable merchants. These subscriber funds are generally invested in short-term instruments that are guaranteed by the United States government. Subscriber funds, which are not included in our consolidated balance sheets, can fluctuate significantly based on consumer bill payment activity, and totaled approximately $1.4 billion as of December 31, 2009. Based on interest rates and subscriber funds balances at December 31, 2009, a 1% increase in applicable interest rates would increase our annual income from continuing operations by approximately $15 million, and if applicable interest rates decreased to zero, our annual income from continuing operations would decrease by less than $2 million.
We manage our debt structure and interest rate risk through the use of fixed and floating-rate debt and through the use of interest rate hedge contracts. We currently use interest rate swaps, with total notional values of $1.2 billion at December 31, 2009, to partially hedge our exposure to interest rate changes and to control financing costs. Generally, under these swaps, we agree with a counter-party to exchange the difference between fixed-rate and floating-rate interest amounts based on an agreed notional amount. Based on our outstanding debt with variable interest rates as of December 31, 2009, a 1% increase in our borrowing rate would increase annual interest expense in 2010 by less than $10 million.
We conduct business in the U.S. and in foreign countries and are exposed to foreign currency risk from changes in the value of underlying assets and liabilities of our non-U.S. dollar denominated foreign investments and foreign currency transactions. Risk can be estimated by measuring the impact of a near-term adverse movement of 10% in foreign currency rates against the U.S. dollar. If these rates were 10% higher or lower at December 31, 2009, there would not have been a material adverse impact on our results of operations or financial position.
29
Table of Contents
Item 8. Financial Statements and Supplementary Data
Index to Consolidated Financial Statements
| Page | ||
| 31 | ||
| 32 | ||
| 33 | ||
| 34 | ||
| 35 | ||
| 62 | ||
30
Table of Contents
CONSOLIDATED STATEMENTS OF INCOME
| In millions, except per share data Years ended December 31, |
2009 | 2008 | 2007 | |||||||||
| Revenues: |
||||||||||||
| Processing and services |
$ | 3,329 | $ | 3,464 | $ | 2,448 | ||||||
| Product |
748 | 1,123 | 1,229 | |||||||||
| Total revenues |
4,077 | 4,587 | 3,677 | |||||||||
| Expenses: |
||||||||||||
| Cost of processing and services |
1,844 | 1,949 | 1,449 | |||||||||
| Cost of product |
536 | 917 | 979 | |||||||||
| Selling, general and administrative |
751 | 813 | 513 | |||||||||
| Total expenses |
3,131 | 3,679 | 2,941 | |||||||||
| Operating income |
946 | 908 | 736 | |||||||||
| Interest expense |
(220 | ) | (260 | ) | (76 | ) | ||||||
| Interest income |
8 | 13 | 7 | |||||||||
| Loss on sale of businesses |
— | (21 | ) | — | ||||||||
| Income from continuing operations before income taxes and income from investment in unconsolidated affiliate |
734 | 640 | 667 | |||||||||
| Income tax provision |
(273 | ) | (288 | ) | (255 | ) | ||||||
| Income from investment in unconsolidated affiliate, net of income taxes |
12 | 6 | — | |||||||||
| Income from continuing operations |
473 | 358 | 412 | |||||||||
| Income from discontinued operations, net of income taxes |
3 | 211 | 27 | |||||||||
| Net income |
$ | 476 | $ | 569 | $ | 439 | ||||||
| Net income per share—basic: |
||||||||||||
| Continuing operations |
$ | 3.06 | $ | 2.21 | $ | 2.47 | ||||||
| Discontinued operations |
0.02 | 1.30 | 0.16 | |||||||||
| Total |
$ | 3.08 | $ | 3.51 | $ | 2.64 | ||||||
| Net income per share—diluted: |
||||||||||||
| Continuing operations |
$ | 3.04 | $ | 2.20 | $ | 2.44 | ||||||
| Discontinued operations |
0.02 | 1.29 | 0.16 | |||||||||
| Total |
$ | 3.06 | $ | 3.49 | $ | 2.60 | ||||||
| Shares used in computing net income per share: |
||||||||||||
| Basic |
154.5 | 162.0 | 166.6 | |||||||||
| Diluted |
155.4 | 163.1 | 168.8 | |||||||||
See accompanying notes.
31
Table of Contents
CONSOLIDATED BALANCE SHEETS
| Dollars in millions December 31, |
2009 | 2008 | ||||||
| ASSETS | ||||||||
| Cash and cash equivalents |
$ | 363 | $ | 230 | ||||
| Trade accounts receivable, less allowance for doubtful accounts |
554 | 591 | ||||||
| Deferred income taxes |
46 | 71 | ||||||
| Prepaid expenses and other current assets |
314 | 294 | ||||||
| Assets of discontinued operations held for sale |
— | 1,016 | ||||||
| Total current assets |
1,277 | 2,202 | ||||||
| Property and equipment, net |
293 | 298 | ||||||
| Intangible assets, net |
2,006 | 2,091 | ||||||
| Goodwill |
4,371 | 4,387 | ||||||
| Other long-term assets |
431 | 353 | ||||||
| Total assets |
$ | 8,378 | $ | 9,331 | ||||
| LIABILITIES AND SHAREHOLDERS’ EQUITY |
||||||||
| Accounts payable and accrued expenses |
$ | 565 | $ | 606 | ||||
| Deferred revenues |
337 | 338 | ||||||
| Current maturities of long-term debt |
259 | 255 | ||||||
| Liabilities of discontinued operations held for sale |
— | 841 | ||||||
| Total current liabilities |
1,161 | 2,040 | ||||||
| Long-term debt |
3,382 | 3,850 | ||||||
| Deferred income taxes |
580 | 537 | ||||||
| Other long-term liabilities |
229 | 310 | ||||||
| Total liabilities |
5,352 | 6,737 | ||||||
| COMMITMENTS AND CONTINGENCIES |
||||||||
| SHAREHOLDERS’ EQUITY |
||||||||
| Preferred stock, no par value: 25.0 million shares authorized; none issued |
— | — | ||||||
| Common stock, $0.01 par value: 450.0 million shares authorized; 197.9 million shares issued |
2 | 2 | ||||||
| Additional paid-in capital |
727 | 706 | ||||||
| Accumulated other comprehensive loss |
(69 | ) | (120 | ) | ||||
| Accumulated earnings |
4,371 | 3,895 | ||||||
| Treasury stock, at cost, 44.7 million and 42.0 million shares |
(2,005 | ) | (1,889 | ) | ||||
| Total shareholders’ equity |
3,026 | 2,594 | ||||||
| Total liabilities and shareholders’ equity |
$ | 8,378 | $ | 9,331 | ||||
See accompanying notes.
32
Table of Contents
CONSOLIDATED STATEMENTS OF SHAREHOLDERS’ EQUITY
| Common Stock | Additional Paid-In Capital |
Comprehensive Income |
Accumulated Other Comprehensive Loss |
Accumulated Earnings |
Treasury Stock | ||||||||||||||||||||||
| In millions |
Shares | Amount | Shares | Amount | |||||||||||||||||||||||
| Balance at December 31, 2006 |
198 | $ | 2 | $ | 700 | $ | — | $ | 2,887 | 27 | $ | (1,163 | ) | ||||||||||||||
| Net income |
$ | 439 | 439 | ||||||||||||||||||||||||
| Foreign currency translation and other |
5 | 5 | |||||||||||||||||||||||||
| Fair market value adjustment on cash flow hedges, net of tax |
(46 | ) | (46 | ) | |||||||||||||||||||||||
| Comprehensive income |
$ | 398 | |||||||||||||||||||||||||
| Share-based compensation |
26 | ||||||||||||||||||||||||||
| Shares issued under stock plans including income tax benefits |
(26 | ) | (2 | ) | 103 | ||||||||||||||||||||||
| Purchase of treasury stock |
8 | (460 | ) | ||||||||||||||||||||||||
| Balance at December 31, 2007 |
198 | 2 | 700 | (41 | ) | 3,326 | 33 | (1,520 | ) | ||||||||||||||||||
| Net income |
$ | 569 | 569 | ||||||||||||||||||||||||
| Foreign currency translation and other |
(14 | ) | (14 | ) | |||||||||||||||||||||||
| Unrealized loss on investments, net of tax |
(5 | ) | (5 | ) | |||||||||||||||||||||||
| Fair market value adjustment on cash flow hedges, net of tax |
(71 | ) | (71 | ) | |||||||||||||||||||||||
| Reclassification adjustment for net realized losses on cash flow hedges included in interest expense, net of tax |
11 | 11 | |||||||||||||||||||||||||
| Comprehensive income |
$ | 490 | |||||||||||||||||||||||||
| Share-based compensation |
34 | ||||||||||||||||||||||||||
| Shares issued under stock plans including income tax benefits |
(28 | ) | (2 | ) | 72 | ||||||||||||||||||||||
| Purchase of treasury stock |
11 | (441 | ) | ||||||||||||||||||||||||
| Balance at December 31, 2008 |
198 | 2 | 706 | (120 | ) | 3,895 | 42 | (1,889 | ) | ||||||||||||||||||
| Net income |
$ | 476 | 476 | ||||||||||||||||||||||||
| Foreign currency translation |
10 | 10 | |||||||||||||||||||||||||
| Reclassification adjustment for net realized losses on investments included in income, net of tax |
3 | 3 | |||||||||||||||||||||||||
| Fair market value adjustment on cash flow hedges, net of tax |
(2 | ) | (2 | ) | |||||||||||||||||||||||
| Reclassification adjustment for net realized losses on cash flow hedges included in interest expense, net of tax |
40 | 40 | |||||||||||||||||||||||||
| Comprehensive income |
$ | 527 | |||||||||||||||||||||||||
| Share-based compensation |
36 | ||||||||||||||||||||||||||
| Shares issued under stock plans including income tax benefits |
(15 | ) | (1 | ) | 62 | ||||||||||||||||||||||
| Purchase of treasury stock |
4 | (178 | ) | ||||||||||||||||||||||||
| Balance at December 31, 2009 |
198 | $ | 2 | $ | 727 | $ | (69 | ) | $ | 4,371 | 45 | $ | (2,005 | ) | |||||||||||||
See accompanying notes.
33
Table of Contents
CONSOLIDATED STATEMENTS OF CASH FLOWS
| In millions | ||||||||||||
| Years ended December 31, |
2009 | 2008 | 2007 | |||||||||
| Cash flows from operating activities: |
||||||||||||
| Net income |
$ | 476 | $ | 569 | $ | 439 | ||||||
| Adjustment for discontinued operations |
(3 | ) | (211 | ) | (27 | ) | ||||||
| Adjustments to reconcile net income to net cash provided by operating activities from continuing operations: |
||||||||||||
| Depreciation and other amortization |
188 | 200 | 143 | |||||||||
| Amortization of acquisition-related intangible assets |
145 | 150 | 33 | |||||||||
| Share-based compensation |
36 | 34 | 23 | |||||||||
| Deferred income taxes |
64 | (1 | ) | 21 | ||||||||
| Loss on sale of businesses |
— | 21 | — | |||||||||
| Settlement of interest rate hedge contracts |
— | — | (30 | ) | ||||||||
| Other non-cash items |
(13 | ) | (8 | ) | (12 | ) | ||||||
| Changes in assets and liabilities, net of effects from acquisitions and dispositions: |
||||||||||||
| Trade accounts receivable |
44 | (39 | ) | (41 | ) | |||||||
| Prepaid expenses and other assets |
(9 | ) | (4 | ) | (32 | ) | ||||||
| Accounts payable and other liabilities |
(71 | ) | 44 | 22 | ||||||||
| Deferred revenues |
(7 | ) | 11 | 8 | ||||||||
| Net cash provided by operating activities from continuing operations |
850 | 766 | 547 | |||||||||
| Cash flows from investing activities: |
||||||||||||
| Capital expenditures, including capitalization of software costs |
(198 | ) | (198 | ) | (152 | ) | ||||||
| Advances to unconsolidated affiliate |
(57 | ) | — | — | ||||||||
| Payment for acquisitions of businesses, net of cash acquired |
— | (85 | ) | (4,333 | ) | |||||||
| Proceeds from sale of businesses, net of cash sold and expenses paid |
— | 497 | — | |||||||||
| Other investing activities |
7 | (9 | ) | 19 | ||||||||
| Net cash (used in) provided by investing activities from continuing operations |
(248 | ) | 205 | (4,466 | ) | |||||||
| Cash flows from financing activities: |
||||||||||||
| (Repayments of) proceeds from revolving credit facility, net |
(100 | ) | (740 | ) | 285 | |||||||
| Repayments of long-term debt |
(375 | ) | (563 | ) | (71 | ) | ||||||
| Proceeds from long-term debt |
— | — | 4,248 | |||||||||
| Issuance of common stock and treasury stock |
45 | 37 | 50 | |||||||||
| Purchases of treasury stock |
(175 | ) | (441 | ) | (469 | ) | ||||||
| Other financing activities |
4 | 2 | (9 | ) | ||||||||
| Net cash (used in) provided by financing activities from continuing operations |
(601 | ) | (1,705 | ) | 4,034 | |||||||
| Net change in cash and cash equivalents from continuing operations |
1 | (734 | ) | 115 | ||||||||
| Net cash transactions transferred from discontinued operations |
132 | 669 | 65 | |||||||||
| Beginning balance |
230 | 295 | 115 | |||||||||
| Ending balance |
$ | 363 | $ | 230 | $ | 295 | ||||||
| Discontinued operations cash flow information: |
||||||||||||
| Net cash (used in) provided by operating activities |
$ | (6 | ) | $ | (312 | ) | $ | 116 | ||||
| Net cash provided by investing activities |
921 | 833 | 111 | |||||||||
| Net cash (used in) provided by financing activities |
(821 | ) | 35 | (68 | ) | |||||||
| Net change in cash and cash equivalents from discontinued operations |
94 | 556 | 159 | |||||||||
| Net cash transactions transferred to continuing operations |
(132 | ) | (669 | ) | (65 | ) | ||||||
| Beginning balance—discontinued operations |
38 | 151 | 57 | |||||||||
| Ending balance—discontinued operations |
$ | — | $ | 38 | $ | 151 | ||||||
See accompanying notes.
34
Table of Contents
Notes to Consolidated Financial Statements
For the years ended December 31, 2009, 2008 and 2007
1. Summary of Significant Accounting Policies
Description of the Business
Fiserv, Inc. and its subsidiaries (collectively, the “Company”) provide integrated information management and electronic commerce systems and services, including transaction processing, electronic bill payment and presentment, business process outsourcing, document distribution services, and software and systems solutions. The Company’s operations are primarily in the United States and are comprised of the Financial Institution Services (“Financial”) segment, Payments and Industry Products (“Payments”) segment and Corporate and Other segment. The Financial segment provides banks, thrifts and credit unions with account processing services, item processing services, loan origination and servicing products, cash management and consulting services, and other products and services that support numerous types of financial transactions. The Payments segment primarily provides electronic bill payment and settlement, electronic funds transfer, and debit processing products and services to meet the electronic transaction processing needs of the financial services industry. The businesses in this segment also provide card and print personalization services, Internet banking, investment account processing services for separately managed accounts, and fraud and risk management products and services. The Corporate and Other segment primarily consists of unallocated corporate overhead expenses, amortization of acquisition-related intangible assets and intercompany eliminations. As discussed in Note 3, in 2009, the Company disposed of several businesses, and the financial results of these dispositions are reported as discontinued operations for all periods presented. As discussed in Note 4, in 2008, the Company completed the sale of a 51% interest in substantially all of the businesses in the Insurance Services segment.
Principles of Consolidation
The consolidated financial statements include the accounts of Fiserv, Inc. and all 100% owned subsidiaries. Investments in less than 50% owned affiliates in which the Company has significant influence are accounted for using the equity method of accounting. All intercompany transactions and balances have been eliminated in consolidation.
Use of Estimates
The preparation of financial statements in conformity with accounting principles generally accepted in the United States of America requires management to make estimates and assumptions that affect the reported amounts of assets and liabilities and disclosure of contingent assets and liabilities at the date of the financial statements and the reported amounts of revenues and expenses during the reporting period. Actual results could differ materially from those estimates.
New Accounting Pronouncements
In May 2009, the Financial Accounting Standards Board (“FASB”) issued new accounting guidance on subsequent events effective for interim and annual periods ending after June 15, 2009. The new guidance establishes general standards of accounting for and disclosure of events that occur after the balance sheet date but before financial statements are issued. The adoption of this new guidance did not have a material impact on the Company’s financial statements.
In June 2009, the FASB issued new accounting guidance on transfers of financial assets effective for interim and annual periods beginning after November 15, 2009. This new guidance amends previously existing guidance by removing the concept of a qualifying special-purpose entity and eliminating the exception from applying certain consolidation rules to variable interest entities that are qualifying special-purpose entities. It also changes the requirements for derecognition of financial assets and requires additional disclosures. The Company does not
35
Table of Contents
Notes to Consolidated Financial Statements—Continued
For the years ended December 31, 2009, 2008 and 2007
expect that the adoption of this new guidance will have a material impact on its financial statements, although it is still assessing what impact it may have.
In June 2009, the FASB issued new accounting guidance on consolidation of variable interest entities effective for interim and annual periods beginning after November 15, 2009. This new guidance requires an analysis to determine whether a variable interest gives an entity a controlling financial interest in the variable interest entity, requires ongoing qualitative assessments of whether an entity is the primary beneficiary of a variable interest entity and expands required disclosures. The Company does not expect that the adoption of this new guidance will have a material impact on its financial statements, although it is still assessing what impact it may have.
In June 2009, the FASB issued the FASB Accounting Standards Codification and the Hierarchy of Generally Accepted Accounting Principles (the “Codification”), effective for interim and annual periods ending after September 15, 2009. On July 1, 2009, the Codification became the single source of authoritative United States accounting and reporting standards by combining existing authoritative standards into a comprehensive, topically organized database. Because the Codification did not change or alter existing accounting standards, the Company’s adoption of the Codification did not impact its financial statements.
Fair Value Measurements
The Company applies fair value accounting for all assets and liabilities that are recognized or disclosed at fair value in its financial statements on a recurring basis. Fair value represents the amount that would be received from selling an asset or paid to transfer a liability in an orderly transaction between market participants at the measurement date. When determining the fair value measurements for assets and liabilities, which are required to be recorded at fair value, the Company considers the principal or most advantageous market and the market-based risk measurements or assumptions that market participants would use in pricing the asset or liability.
The fair values of cash equivalents, trade accounts receivable, settlement assets and obligations, accounts payable and accrued expenses approximate the carrying values due to the short period of time to maturity. The fair value of interest rate hedge contracts is described in Note 5 and was based on valuation models for which pricing inputs were either directly or indirectly observable as of the reporting date. The fair value of long-term debt is also described in Note 5 and was estimated using discounted cash flows based on the Company’s current incremental borrowing rates or quoted prices in active markets. The fair values of investments were as follows:
Level 1—At December 31, 2009 and 2008, the fair values of available-for-sale investments in asset-backed securities of $11 million and $15 million, respectively, were based on quoted prices in active markets for identical instruments as of the reporting date.
Level 2—At December 31, 2009 and 2008, the fair values of available-for-sale investments in asset-backed securities of $6 million and $10 million, respectively, were based on valuation models for which pricing inputs were either directly or indirectly observable as of the reporting date.
Level 3—At December 31, 2009 and 2008, the fair values of available-for-sale investments of $23 million and $24 million, respectively, were based on valuation models with unobservable pricing inputs and management estimates. Unrealized losses of $2 million and $3 million were recorded in accumulated other comprehensive loss at December 31, 2009 and 2008, respectively.
Derivative Instruments
Derivative instruments are recorded on the balance sheet as either an asset or liability measured at fair value. If the derivative is designated as a fair value hedge, the changes in the fair value of the derivative are recognized
36
Table of Contents
Notes to Consolidated Financial Statements—Continued
For the years ended December 31, 2009, 2008 and 2007
in earnings. To the extent the hedge is effective, there is an offsetting adjustment to the basis of the item being hedged. If the derivative is designated as a cash flow hedge, the effective portions of the changes in the fair value of the derivative are recorded as a component of accumulated other comprehensive loss and recognized in the consolidated statements of income when the hedged item affects earnings. Ineffective portions of changes in the fair value of hedges are recognized in earnings. The Company’s policy is to enter into derivative financial instruments with creditworthy institutions and not to enter into such instruments for speculative purposes.
Foreign Currency
Foreign currency denominated assets and liabilities, where the functional currency is the local currency, are translated into U.S. dollars at the exchange rates in effect at the balance sheet date. Revenues and expenses are translated at the average exchange rates during the period. Gains and losses from foreign currency translation are recorded as a separate component of accumulated other comprehensive loss.
Revenue Recognition
Processing and services revenues are primarily derived from account and transaction-based fees for data processing, transaction processing, electronic billing and payment services, electronic funds transfer and debit processing services, consulting services and software maintenance fees, and are recognized as services are provided. Software maintenance fee revenues for ongoing client support are recognized ratably over the term of the applicable support period, which is generally 12 months. Deferred revenues consist primarily of advance billings for services and are recognized as revenue when the services are provided.
Product revenues are primarily derived from integrated print and card production sales and software licenses. The Company recognizes product revenues, such as software license sales, which represent less than 5% of total revenues, when written contracts are signed, delivery of the product has occurred, the fee is fixed or determinable, and collection is reasonably assured. Prior to the Company’s sale of a 51% interest in Fiserv Insurance on July 14, 2008, product revenues also included prescription product revenues which were recognized on a gross basis to include the prescription price.
The Company includes reimbursements from clients, such as postage and telecommunication costs, in processing and services revenue, product revenue, cost of processing and services, and cost of product.
Selling, General and Administrative Expenses
Selling, general and administrative expenses primarily consist of: salaries, wages and related expenses paid to sales personnel, administrative employees and management; advertising and promotional costs; amortization of certain intangible assets; and other selling and administrative expenses.
Cash and Cash Equivalents
Cash and cash equivalents consist of cash and investments with original maturities of 90 days or less.
Allowance for Doubtful Accounts
The Company analyzes trade accounts receivable by considering historical bad debts, client creditworthiness, current economic trends, changes in client payment terms and collection trends when evaluating the adequacy of the allowance for doubtful accounts. Any change in the assumptions used in
37
Table of Contents
Notes to Consolidated Financial Statements—Continued
For the years ended December 31, 2009, 2008 and 2007
analyzing a specific account receivable may result in an additional allowance for doubtful accounts being recognized in the period in which the change occurs. The allowance for doubtful accounts was $11 million and $12 million at December 31, 2009 and 2008, respectively.
Settlement Assets and Obligations
Settlement assets of $137 million were included in prepaid expenses and other current assets at December 31, 2009 and 2008, and settlement obligations of $143 million and $134 million were included in accrued expenses at December 31, 2009 and 2008, respectively. Settlement assets and obligations represent amounts receivable from the Company’s agents and clients and amounts payable to agents and clients primarily associated with the Company’s walk-in and expedited bill payment service businesses. The majority of these assets and obligations result from timing differences between collecting funds from consumers who are making payments and depositing the funds collected into the Company’s bank accounts. These timing differences are typically less than seven days. Settlement assets and obligations arise due to the reporting of transactions to clients prior to fulfilling the payment obligation.
Property and Equipment
Property and equipment are reported at cost. Depreciation of property and equipment is computed primarily using the straight-line method over the shorter of the estimated useful life of the asset or the leasehold period, if applicable. Property and equipment consisted of the following at December 31:
| Estimated | ||||||||||
| (In millions) |
Useful Lives | 2009 | 2008 | |||||||
| Land |
— | $ | 23 | $ | 23 | |||||
| Data processing equipment |
3 to 7 years | 456 | 424 | |||||||
| Buildings and leasehold improvements |
5 to 40 years | 183 | 162 | |||||||
| Furniture and equipment |
3 to 10 years | 156 | 150 | |||||||
| 818 | 759 | |||||||||
| Less: accumulated depreciation and amortization |
(525 | ) | (461 | ) | ||||||
| Total |
$ | 293 | $ | 298 | ||||||
Depreciation expense for all property and equipment totaled $91 million, $103 million and $75 million in 2009, 2008 and 2007, respectively.
38
Table of Contents
Notes to Consolidated Financial Statements—Continued
For the years ended December 31, 2009, 2008 and 2007
Intangible Assets
Intangible assets consisted of the following at December 31:
| 2009 (In millions) |
Gross Carrying Amount |
Accumulated Amortization |
Net Book Value | ||||||
| Customer related intangible assets |
$ | 1,638 | $ | 250 | $ | 1,388 | |||
| Acquired software and technology |
338 | 104 | 234 | ||||||
| Trade names |
114 | 7 | 107 | ||||||
| Capitalized software development costs |
644 | 454 | 190 | ||||||
| Purchased software |
344 | 257 | 87 | ||||||
| Total |
$ | 3,078 | $ | 1,072 | $ | 2,006 | |||
| 2008 (In millions) |
Gross Carrying Amount |
Accumulated Amortization |
Net Book Value | ||||||
| Customer related intangible assets |
$ | 1,623 | $ | 158 | $ | 1,465 | |||
| Acquired software and technology |
338 | 58 | 280 | ||||||
| Trade names |
114 | — | 114 | ||||||
| Capitalized software development costs |
590 | 437 | 153 | ||||||
| Purchased software |
301 | 222 | 79 | ||||||
| Total |
$ | 2,966 | $ | 875 | $ | 2,091 | |||
Customer related intangible assets represent customer contracts and relationships obtained as part of acquired businesses and are amortized over their estimated useful lives, generally 10 to 20 years. Acquired software and technology represents software and technology intangible assets obtained as part of acquired businesses and is amortized over their estimated useful lives, generally four to eight years. Trade names are amortized over their estimated remaining useful lives, generally 10 to 20 years. Amortization expense for acquired intangible assets, which include customer related intangible assets, acquired software and technology, and trade names, totaled $145 million, $150 million and $33 million in 2009, 2008 and 2007, respectively. The Company estimates that annual amortization expense with respect to acquired intangible assets will be approximately $145 million in each of 2010 and 2011, $140 million in each of 2012 and 2013, and $130 million in 2014.
Capitalized software development costs represent the capitalization of certain costs incurred to develop new software or to enhance existing software which is marketed externally or utilized by the Company to process client transactions. Costs are capitalized commencing when the technological feasibility of the software has been established. Routine maintenance of software products, design costs and development costs incurred prior to establishment of a product’s technological feasibility are expensed as incurred. Capitalized software development costs are amortized over their estimated useful lives which is generally five years. Gross software development costs capitalized for new products and enhancements to existing products totaled $81 million, $74 million and $53 million in 2009, 2008 and 2007, respectively. Amortization of previously capitalized development costs was $45 million, $43 million and $37 million in 2009, 2008 and 2007, respectively.
Purchased software represents software licenses purchased from third parties and is amortized over the estimated useful lives, generally three to five years. Amortization of purchased software totaled $43 million, $43 million and $31 million in 2009, 2008 and 2007, respectively.
39
Table of Contents
Notes to Consolidated Financial Statements—Continued
For the years ended December 31, 2009, 2008 and 2007
Goodwill
Goodwill represents the excess of the purchase price over the fair value of identifiable net assets acquired and liabilities assumed in a business combination. The Company reviews, on an annual basis, or more frequently if circumstances indicate possible impairment, the carrying value of goodwill by comparing reporting unit carrying values to estimated fair values. No impairment was identified in the Company’s annual impairment assessment in the fourth quarter of 2009. The changes in goodwill during 2009 and 2008 were as follows:
| (In millions) |
Financial | Payments | Insurance | Total | |||||||||||
| Goodwill balance—December 31, 2007 |
$ | 1,247 | $ | 3,089 | $ | 450 | $ | 4,786 | |||||||
| Acquisitions |
32 | 19 | — | 51 | |||||||||||
| Sale of businesses |
— | — | (450 | ) | (450 | ) | |||||||||
| Goodwill balance—December 31, 2008 |
1,279 | 3,108 | — | 4,387 | |||||||||||
| Purchase accounting adjustments |
(16 | ) | — | — | (16 | ) | |||||||||
| Goodwill balance—December 31, 2009 |
$ | 1,263 | $ | 3,108 | $ | — | $ | 4,371 | |||||||
Asset Impairment
The Company reviews property and equipment, intangible assets and its investment in unconsolidated affiliate for impairment whenever events or changes in circumstances indicate the carrying amount of the asset may not be recoverable. Recoverability of property and equipment and intangible assets is assessed by comparing the carrying amount of the asset to the undiscounted future cash flows expected to be generated by the asset. The investment in unconsolidated affiliate is assessed by comparing the carrying amount of the investment to its estimated fair value and is impaired if the decline in fair value is determined to be other than temporary. Measurement of any impairment loss is based on estimated fair value.
Deferred Financing Costs
The Company has recorded deferred financing costs totaling $25 million related to its senior term loan and senior notes borrowings at December 31, 2009 and 2008. Accumulated amortization was $12 million and $7 million at December 31, 2009 and 2008, respectively. Deferred financing costs are reported in other long-term assets and are amortized over the term of the underlying debt using the interest method.
Accounts Payable and Accrued Expenses
Accounts payable and accrued expenses consisted of the following at December 31:
| (In millions) |
2009 | 2008 | ||||
| Trade accounts payable |
$ | 104 | $ | 97 | ||
| Accrued compensation and benefits |
148 | 154 | ||||
| Settlement obligations |
143 | 134 | ||||
| Other accrued expenses |
170 | 221 | ||||
| Total |
$ | 565 | $ | 606 | ||
Income Taxes
Deferred tax assets and liabilities are recognized for the expected future tax consequences attributable to differences between financial statement carrying amounts of existing assets and liabilities and their respective tax
40
Table of Contents
Notes to Consolidated Financial Statements—Continued
For the years ended December 31, 2009, 2008 and 2007
basis and net operating loss and tax credit carry-forwards. Deferred tax assets and liabilities are measured using enacted tax rates expected to apply to taxable income in the years in which those temporary differences are expected to be recovered or settled. A valuation allowance, if necessary, is recorded against deferred tax assets for which utilization of the asset is not likely.
Accumulated Other Comprehensive Loss
Accumulated other comprehensive loss, net of income taxes, consisted of the following at December 31:
| (In millions) |
2009 | 2008 | ||||||
| Fair market value adjustment on cash flow hedges |
$ | (67 | ) | $ | (105 | ) | ||
| Foreign currency translation |
2 | (8 | ) | |||||
| Unrealized loss on investments |
(2 | ) | (5 | ) | ||||
| Unrecognized pension losses |
(2 | ) | (2 | ) | ||||
| Total |
$ | (69 | ) | $ | (120 | ) | ||
Net Income Per Share
Basic net income per share is computed using the weighted-average number of common shares outstanding during the periods. Diluted net income per share is computed using the weighted-average number of common shares and common stock equivalents outstanding during the periods. Common stock equivalents consist of stock options and restricted stock awards and are computed using the treasury stock method. In 2009, 2008 and 2007, the Company excluded 2.9 million, 2.4 million and 1.1 million weighted-average shares, respectively, from the calculations of common stock equivalents for anti-dilutive stock options.
The computation of shares used in calculating basic and diluted net income per common share is as follows:
| (In millions) |
2009 | 2008 | 2007 | |||
| Weighted-average common shares outstanding used for the calculation of net income per share—basic |
154.5 | 162.0 | 166.6 | |||
| Common stock equivalents |
0.9 | 1.1 | 2.2 | |||
| Total shares used for the calculation of net income per share—diluted |
155.4 | 163.1 | 168.8 | |||
Supplemental Cash Flow Information
| (In millions) |
2009 | 2008 | 2007 | ||||||
| Interest paid |
$ | 211 | $ | 252 | $ | 62 | |||
| Income taxes paid (including discontinued operations) |
242 | 474 | 236 | ||||||
| Liabilities assumed in acquisitions of businesses |
— | 21 | 979 | ||||||
| Note received in sale of businesses |
10 | 30 | — | ||||||
2. Acquisitions
The Company did not complete an acquisition in 2009 after completing three and four acquisitions in 2008 and 2007, respectively, which were not material except for the December 3, 2007 acquisition of CheckFree Corporation (“CheckFree”), a leading provider of electronic commerce services and products, including
41
Table of Contents
Notes to Consolidated Financial Statements—Continued
For the years ended December 31, 2009, 2008 and 2007
electronic bill payment and Internet banking. The $4.4 billion cash acquisition of CheckFree has enabled the Company to expand its client relationships with a leading platform in the growing electronic bill payment sector. The combination has enabled the Company to deliver a wider range of integrated product offerings, created new opportunities for growth, enhanced efficiency, and brought new products and services to market. The results of operations of all acquired businesses have been included in the accompanying consolidated statements of income from the dates of acquisition.
3. Dispositions
Summarized financial information for discontinued operations was as follows for the years ended December 31:
| (In millions) |
2009 | 2008 | 2007 | |||||||||
| Total revenues |
$ | 147 | $ | 286 | $ | 1,344 | ||||||
| (Loss) income before income taxes |
(35 | ) | (29 | ) | 44 | |||||||
| Income tax benefit (provision) |
13 | 11 | (17 | ) | ||||||||
| Gain on sale, net of income taxes |
25 | 229 | — | |||||||||
| Income from discontinued operations |
$ | 3 | $ | 211 | $ | 27 | ||||||
Assets and liabilities of discontinued operations held for sale were as follows at December 31, 2008 (in millions):
| Cash and cash equivalents |
$ | 38 | |
| Trade accounts receivable, net |
20 | ||
| Mortgage-backed securities and other investments |
891 | ||
| Intangible assets, net |
54 | ||
| Other assets |
13 | ||
| Assets of discontinued operations held for sale |
$ | 1,016 | |
| Accounts payable and other liabilities |
$ | 12 | |
| Retirement account deposits |
829 | ||
| Liabilities of discontinued operations held for sale |
$ | 841 | |
Fiserv Health
On January 10, 2008, the Company completed the sale of a majority of its health businesses to UnitedHealthcare Services, Inc. for total cash proceeds of $735 million. In 2008, the Company recognized an after-tax gain on sale of $100 million, including income taxes of $220 million, for this transaction.
Fiserv ISS
On February 4, 2008, the Company completed the sale of Fiserv Trust Company and the accounts of the Company’s institutional retirement plan and advisor services operations to TD AMERITRADE Online Holdings, Inc. (“TD”) for $273 million in cash at closing. In 2008, the Company recognized an after-tax gain on sale of $130 million, including income taxes of $70 million, for this transaction. In 2009, the Company recognized an additional after-tax gain of $25 million, including income taxes of $15 million, with respect to the final
42
Table of Contents
Notes to Consolidated Financial Statements—Continued
For the years ended December 31, 2009, 2008 and 2007
contingent purchase price payment it received from TD. After obtaining the necessary regulatory approval in 2009, the Company completed the sale of the remaining operating assets of its investment support services business to Robert Beriault Holdings, Inc., an entity controlled by the president of that business, for net book value.
Other
In 2009, 2008 and 2007, the Company completed the sale of three lending services businesses in its Financial segment and two insurance businesses which did not result in a significant net gain or loss.
4. Investment in and Advances to Unconsolidated Affiliate
On July 14, 2008, the Company completed the sale of a 51% interest in substantially all of the businesses in its Insurance segment (“Fiserv Insurance”) to Trident IV, LP. The Company recognized an after-tax loss of $0.34 per share on the sale. This loss on sale was comprised of a pre-tax loss of $21 million and income tax expense of $34 million which was incurred on sale due to a significantly lower tax basis in the stock compared to the book basis of the net assets sold (see Note 6). The Company received net cash proceeds of $497 million, net of cash sold and transaction expenses, and a $30 million note due in 2018. The Company’s share of the net income of Fiserv Insurance (n/k/a StoneRiver, Inc. or “StoneRiver”) is reported as income from investment in unconsolidated affiliate, and the revenues and expenses of StoneRiver after July 14, 2008 are not included in the Company’s consolidated statements of income. The Company’s consolidated financial statements for all periods prior to July 14, 2008 include the revenues, expenses and cash flows of Fiserv Insurance. In July 2009, the Company loaned StoneRiver $67 million, with interest payable quarterly and the principal due in 2013. In December 2009, StoneRiver repaid $10 million of this loan. The Company’s investment in and advances to StoneRiver, totaling $281 million and $211 million at December 31, 2009 and 2008, respectively, are reported within other long-term assets in the consolidated balance sheets.
5. Long-Term Debt
The Company’s outstanding long-term debt was as follows at December 31:
| (In millions) |
2009 | 2008 | ||||||
| Senior term loan |
$ | 1,880 | $ | 2,250 | ||||
| Senior notes |
1,748 | 1,748 | ||||||
| Revolving credit facility |
— | 100 | ||||||
| Other borrowings |
13 | 7 | ||||||
| Total debt |
3,641 | 4,105 | ||||||
| Less: current maturities |
(259 | ) | (255 | ) | ||||
| Long-term debt |
$ | 3,382 | $ | 3,850 | ||||
43
Table of Contents
Notes to Consolidated Financial Statements—Continued
For the years ended December 31, 2009, 2008 and 2007
The estimated fair value of total debt was $3.8 billion and $3.9 billion at December 31, 2009 and 2008, respectively. Annual principal payments required under the terms of the long-term debt agreements were as follows at December 31, 2009 (in millions):
| Years ending December 31, |
|||
| 2010 |
$ | 259 | |
| 2011 |
378 | ||
| 2012 |
2,502 | ||
| 2013 |
2 | ||
| 2014 |
— | ||
| Thereafter |
500 | ||
| Total |
$ | 3,641 | |
Senior Term Loan
In December 2007, the Company entered into an unsecured senior term loan facility with a syndicate of banks. Term loan borrowings under this facility bear interest at a variable rate based on LIBOR plus a specified margin or the bank’s base rate and mature in November 2012. Principal payments of $255 million and $375 million are due in December 2010 and 2011, respectively, and the remaining principal of $1.25 billion is due in November 2012. The weighted-average variable interest rate on the term loan borrowings was 0.9% at December 31, 2009. The term loan facility contains various restrictions and covenants substantially similar to those contained in the revolving credit facility described below.
Senior Notes
In November 2007, the Company issued $1.25 billion of 6.125% senior notes due in November 2012 and $500 million of 6.8% senior notes due in November 2017, which pay interest at the stated rate on May 20 and November 20 of each year. The interest rates applicable to these notes are subject to an increase of up to two percent in the event that the Company’s credit rating is downgraded below investment grade. The indenture governing the senior notes contains covenants that, among other matters, limit: the Company’s ability to consolidate or merge into, or convey, transfer or lease all or substantially all of its properties and assets to, another person; the Company’s and certain of its subsidiaries’ ability to create or assume liens; and the Company’s and certain of its subsidiaries’ ability to engage in sale and leaseback transactions.
Revolving Credit Facility
The Company maintains a $900 million unsecured revolving credit facility with a syndicate of banks. The facility bears interest at a variable rate based on LIBOR plus a specified margin or the bank’s base rate. There are no significant commitment fees or compensating balance requirements. The revolving credit facility, as amended, contains various restrictions and covenants that require the Company, among other things, to limit its consolidated indebtedness to no more than three and one-half times consolidated net earnings before interest, taxes, depreciation and amortization and certain other adjustments, and to maintain consolidated net earnings before interest, taxes, depreciation and amortization and certain other adjustments of at least three times consolidated interest expense. The facility expires on March 24, 2011. The Company was in compliance with all financial debt covenants in 2009. As of December 31, 2009, the Company issued letters of credit totaling $30 million under this facility and available borrowings were $870 million.
44
Table of Contents
Notes to Consolidated Financial Statements—Continued
For the years ended December 31, 2009, 2008 and 2007
Interest Rate Hedge Contracts
To manage exposure to fluctuations in interest rates, the Company maintains a series of interest rate swap agreements (“Swaps”) with total notional values of $1.2 billion and $1.75 billion at December 31, 2009 and 2008, respectively. The Swaps have been designated by the Company as cash flow hedges, effectively fix interest rates on floating rate term loan borrowings at a weighted-average rate of approximately 4.8% as of December 31, 2009, prior to financing spreads and related fees, and have expiration dates through September 2012. The fair values of the Swaps, which totaled $92 million and $138 million at December 31, 2009 and 2008, respectively, were recorded as liabilities and in accumulated other comprehensive loss, net of income taxes, in the consolidated balance sheets. The components of comprehensive income pertaining to interest rate hedge contracts are reported within the consolidated statements of shareholders’ equity. In 2009, 2008 and 2007, interest expense recognized due to hedge ineffectiveness was not significant and no amounts were excluded from the assessments of hedge effectiveness. Based on the amounts recorded in shareholders’ equity as accumulated other comprehensive loss at December 31, 2009, the Company estimates that it will recognize approximately $40 million in interest expense during 2010 related to interest rate hedge contracts.
6. Income Taxes
A reconciliation of the statutory federal income tax rate to the Company’s effective income tax rate for continuing operations is as follows for the years ended December 31:
| 2009 | 2008 | 2007 | |||||||
| Statutory federal income tax rate |
35.0 | % | 35.0 | % | 35.0 | % | |||
| State income taxes, net of federal effect |
2.9 | % | 3.8 | % | 3.1 | % | |||
| Basis difference on sale of businesses |
— | 6.6 | % | — | |||||
| Other, net |
(0.7 | %) | (0.5 | %) | 0.1 | % | |||
| Effective income tax rate |
37.2 | % | 44.9 | % | 38.2 | % | |||
The income tax provision for continuing operations was as follows:
| (In millions) |
2009 | 2008 | 2007 | ||||||||
| Current: |
|||||||||||
| Federal |
$ | 176 | $ | 243 | $ | 198 | |||||
| State |
29 | 43 | 31 | ||||||||
| Foreign |
4 | 3 | 5 | ||||||||
| 209 | 289 | 234 | |||||||||
| Deferred: |
|||||||||||
| Federal |
57 | (2 | ) | 25 | |||||||
| State |
7 | 2 | 2 | ||||||||
| Foreign |
— | (1 | ) | (6 | ) | ||||||
| 64 | (1 | ) | 21 | ||||||||
| Income tax provision |
$ | 273 | $ | 288 | $ | 255 | |||||
45
Table of Contents
Notes to Consolidated Financial Statements—Continued
For the years ended December 31, 2009, 2008 and 2007
Significant components of deferred tax assets and liabilities consisted of the following at December 31:
| (In millions) |
2009 | 2008 | ||||||
| Accrued expenses |
$ | 71 | $ | 69 | ||||
| Interest rate hedge contracts |
45 | 59 | ||||||
| Share-based compensation |
30 | 21 | ||||||
| Net operating loss and credit carry-forwards |
33 | 49 | ||||||
| Other |
21 | 44 | ||||||
| Total deferred tax assets |
200 | 242 | ||||||
| Software development costs |
(67 | ) | (54 | ) | ||||
| Intangible assets |
(623 | ) | (631 | ) | ||||
| Property and equipment |
(27 | ) | (10 | ) | ||||
| Other |
(17 | ) | (13 | ) | ||||
| Total deferred tax liabilities |
(734 | ) | (708 | ) | ||||
| Total |
$ | (534 | ) | $ | (466 | ) | ||
Deferred tax assets and liabilities are reported in the consolidated balance sheets as follows at December 31:
| (In millions) |
2009 | 2008 | ||||||
| Current assets |
$ | 46 | $ | 71 | ||||
| Noncurrent liabilities |
(580 | ) | (537 | ) | ||||
| Total |
$ | (534 | ) | $ | (466 | ) | ||
Unrecognized tax benefits were as follows:
| (In millions) |
2009 | 2008 | 2007 | |||||||||
| Unrecognized tax benefits—Beginning of year |
$ | 77 | $ | 60 | $ | 23 | ||||||
| Increases for tax positions taken during the current year |
4 | 11 | 4 | |||||||||
| Increases for tax positions taken in prior years |
1 | 1 | 4 | |||||||||
| Assumed in acquisitions |
— | 9 | 32 | |||||||||
| Decreases for settlements |
(34 | ) | (1 | ) | (1 | ) | ||||||
| Lapse of the statute of limitations |
(1 | ) | (3 | ) | (2 | ) | ||||||
| Unrecognized tax benefits—End of year |
$ | 47 | $ | 77 | $ | 60 | ||||||
At December 31, 2009, unrecognized tax benefits, net of federal and state benefits, of $29 million and $4 million would affect the effective tax rate from continuing operations and discontinued operations, respectively, if recognized. In 2010, reductions to unrecognized tax benefits due to settlements and the lapse of statutes of limitations are expected to total approximately $10 million.
The Company classifies interest and penalties related to income taxes as components of its income tax provision. The income tax provision from continuing operations included interest and penalties on unrecognized tax benefits of $2 million in 2009 and 2008 and less than $1 million in 2007. Accrued interest and penalties related to unrecognized tax benefits totaled $9 million and $18 million at December 31, 2009 and 2008, respectively.
46
Table of Contents
Notes to Consolidated Financial Statements—Continued
For the years ended December 31, 2009, 2008 and 2007
The Company’s federal tax returns for 2006 through 2009 and tax returns in certain states and foreign jurisdictions for 2002 through 2009 remain subject to examination by taxing authorities.
At December 31, 2009, the Company had federal net operating loss carry-forwards of $33 million, which expire in 2014 through 2027, state net operating loss carry-forwards of $165 million, which expire in 2010 through 2029, and foreign net operating loss carry-forwards of $70 million, $11 million of which expire in 2016 through 2029 and the remainder of which do not expire.
7. Employee Stock and Savings Plans
Stock Plans
The Company recognizes the fair value of share-based compensation expense for stock options, restricted stock awards, shares received by employees under the Company’s employee stock purchase plan and similar awards in cost of processing and services, cost of product and selling, general and administrative expense in its consolidated statements of income on a straight-line basis over the vesting period of the underlying awards.
The Company’s share-based compensation primarily consists of the following:
Stock Options—The Company generally grants stock options to employees and non-employee directors at exercise prices equal to the fair market value of the Company’s stock on the dates of grant, which are typically in the first quarter of the year. Stock options generally vest over a three year period beginning on the first anniversary of the grant. All stock options expire ten years from the date of the award. The Company recognizes compensation expense for the fair value of the stock options over the requisite service period of the stock option award.
Restricted Stock Units—The Company awards restricted stock units to employees and non-employee directors. The Company recognizes compensation expense for restricted stock units based on the market price on the date of award over the period during which the awards vest.
Employee Stock Purchase Plan—The Company maintains an employee stock purchase plan that allows eligible employees to purchase a limited number of shares of common stock each quarter through payroll deductions at 85% of the closing price of the Company’s common stock on the last business day of each calendar quarter. The Company recognizes compensation expense related to the 15% discount on the purchase date.
Share-based compensation expense recorded for continuing operations was $36 million, $34 million and $23 million during 2009, 2008 and 2007, respectively. The income tax benefits in income from continuing operations related to share-based compensation totaled $12 million, $12 million and $8 million in 2009, 2008 and 2007, respectively. At December 31, 2009, the total remaining unrecognized compensation cost related to continuing operations for unvested stock options and restricted stock awards, net of estimated forfeitures, of $48 million is expected to be recognized over a weighted-average period of 2.3 years.
47
Table of Contents
Notes to Consolidated Financial Statements—Continued
For the years ended December 31, 2009, 2008 and 2007
The weighted-average estimated fair value of stock options granted during 2009, 2008 and 2007 was $12.76, $20.56 and $21.07 per share, respectively. The fair values of stock options granted were estimated on the date of grant using a binomial option-pricing model with the following assumptions:
| 2009 | 2008 | 2007 | |||||||
| Expected life (in years) |
6.5 | 6.4 | 6.0 | ||||||
| Average risk-free interest rate |
2.3 | % | 3.2 | % | 4.6 | % | |||
| Expected volatility |
33.7 | % | 31.1 | % | 30.7 | % | |||
| Expected dividend yield |
0 | % | 0 | % | 0 | % |
The Company determined the expected life of stock options using historical data adjusted for known factors that would alter historical exercise behavior. The risk-free interest rate is based on the U.S. treasury yield curve in effect as of the grant date. Expected volatility is determined using weighted-average implied market volatility combined with historical volatility. The Company believes that a blend of historical volatility and implied volatility better reflects future market conditions and better indicates expected volatility than purely historical volatility.
A summary of stock option activity is as follows:
| Shares (In thousands) |
Weighted- Average Price |
Weighted- Average Remaining Contractual Term (Years) |
Aggregate Intrinsic Value (In millions) | ||||||||
| Outstanding—December 31, 2008 |
6,925 | $ | 42.67 | ||||||||
| Granted |
1,578 | 33.46 | |||||||||
| Forfeited |
(461 | ) | 49.38 | ||||||||
| Exercised |
(789 | ) | 30.96 | ||||||||
| Outstanding—December 31, 2009 |
7,253 | $ | 41.51 | 6.1 | $ | 62 | |||||
| Exercisable—December 31, 2009 |
4,226 | $ | 40.46 | 4.4 | $ | 38 | |||||
A summary of restricted stock award activity is as follows:
| Shares (In thousands) |
Weighted- Average Grant Date Fair Value | |||||
| Restricted stock balance, December 31, 2008 |
688 | $ | 48.79 | |||
| Granted |
529 | 34.28 | ||||
| Forfeited |
(78 | ) | 44.82 | |||
| Vested |
(114 | ) | 42.29 | |||
| Restricted stock balance, December 31, 2009 |
1,025 | $ | 42.19 | |||
48
Table of Contents
Notes to Consolidated Financial Statements—Continued
For the years ended December 31, 2009, 2008 and 2007
The table below presents additional information related to stock option and restricted stock award activity:
| (In millions) |
2009 | 2008 | 2007 | ||||||
| Total intrinsic value of stock options exercised |
$ | 10 | $ | 30 | $ | 71 | |||
| Cash received from stock option exercises |
24 | 23 | 40 | ||||||
| Gross income tax benefit from stock option exercises |
4 | 11 | 26 | ||||||
| Fair value of restricted stock upon vesting |
4 | 8 | 1 | ||||||
As of December 31, 2009, 6.2 million share-based awards were available for grant under the Fiserv, Inc. 2007 Omnibus Incentive Plan. Under its employee stock purchase plan, the Company issued 0.6 million, 0.7 million and 0.6 million shares in 2009, 2008 and 2007, respectively. As of January 1, 2010, there were 1.2 million shares available for issuance under the employee stock purchase plan.
Employee Savings Plans
The Company and its subsidiaries have defined contribution savings plans covering substantially all employees. Under the plans, eligible participants may elect to contribute a specified percentage of their salaries, subject to certain limitations. The Company makes matching contributions, subject to certain limitations, and makes discretionary contributions based upon the attainment of specified financial results. Beginning in 2009, Company contributions vest after two years of employee service. Company contributions charged to continuing operations under these plans were $37 million, $33 million and $45 million in 2009, 2008 and 2007, respectively.
8. Leases, Commitments and Contingencies
Leases
The Company leases certain facilities and equipment under operating leases. Most leases contain renewal options for varying periods. Future minimum rental payments on operating leases with initial non-cancellable lease terms in excess of one year were due as follows at December 31, 2009 (in millions):
| Years Ending December 31, |
|||
| 2010 |
$ | 93 | |
| 2011 |
76 | ||
| 2012 |
56 | ||
| 2013 |
40 | ||
| 2014 |
29 | ||
| Thereafter |
52 | ||
| Total |
$ | 346 | |
Rent expense charged to continuing operations for all operating leases was $115 million, $124 million and $95 million during 2009, 2008 and 2007, respectively.
Commitments and Contingencies
Litigation
In the normal course of business, the Company and its subsidiaries are named as defendants in various lawsuits in which claims are asserted against the Company. In the opinion of management, the liabilities, if any, which may ultimately result from such lawsuits are not expected to have a material adverse effect on the consolidated financial statements of the Company.
49
Table of Contents
Notes to Consolidated Financial Statements—Continued
For the years ended December 31, 2009, 2008 and 2007
Electronic Payments Transactions
In connection with the Company’s processing of electronic payments transactions, funds received from subscribers are invested from the time the Company collects the funds until payments are made to the applicable merchants. These subscriber funds are generally invested in short-term instruments that are guaranteed by the United States government. Subscriber funds, which are not included in the Company’s consolidated balance sheets, can fluctuate significantly based on consumer bill payment activity, and totaled approximately $1.4 billion as of December 31, 2009.
Indemnifications and Warranties
Subject to limitations and exclusions, the Company generally indemnifies its clients from certain costs resulting from claims of patent, copyright or trademark infringement associated with such clients’ use of its products or services. The Company may also warrant to clients that its products and services will operate substantially in accordance with identified specifications. From time to time, in connection with sales of businesses, the Company agrees to indemnify the buyers for liabilities associated with the businesses that are sold. Historically, payments under such indemnification or warranty provisions have not been significant.
50
Table of Contents
Notes to Consolidated Financial Statements—Continued
For the years ended December 31, 2009, 2008 and 2007
9. Business Segment Information
The Company’s ongoing operations are comprised of its Financial, Payments and Corporate and Other segments. The Financial segment provides banks, thrifts and credit unions with account processing services, item processing services, loan origination and servicing products, cash management and consulting services, and other products and services that support numerous types of financial transactions. The Payments segment primarily provides electronic bill payment and settlement, electronic funds transfer, and debit processing products and services to meet the electronic transaction processing needs of the financial services industry. The businesses in this segment also provide card and print personalization services, Internet banking, investment account processing services for separately managed accounts, and fraud and risk management products and services. The Corporate and Other segment primarily consists of unallocated corporate overhead expenses, amortization of acquisition-related intangible assets and intercompany eliminations. In July 2008, the Company completed the sale of a 51% interest in substantially all of the businesses in its Insurance Services (“Insurance”) segment.
| (In millions) |
Financial | Payments | Insurance | Corporate and Other |
Total | |||||||||||
| 2009 |
||||||||||||||||
| Processing and services revenue |
$ | 1,747 | $ | 1,579 | $ | 3 | $ | 3,329 | ||||||||
| Product revenue |
195 | 581 | (28 | ) | 748 | |||||||||||
| Total revenues |
1,942 | 2,160 | (25 | ) | 4,077 | |||||||||||
| Operating income |
569 | 617 | (240 | ) | 946 | |||||||||||
| Identifiable assets |
2,145 | 5,762 | 471 | 8,378 | ||||||||||||
| Capital expenditures |
89 | 103 | 6 | 198 | ||||||||||||
| Depreciation and amortization expense |
86 | 87 | 160 | 333 | ||||||||||||
| 2008 |
||||||||||||||||
| Processing and services revenue |
$ | 1,808 | $ | 1,542 | $ | 121 | $ | (7 | ) | $ | 3,464 | |||||
| Product revenue |
184 | 589 | 392 | (42 | ) | 1,123 | ||||||||||
| Total revenues |
1,992 | 2,131 | 513 | (49 | ) | 4,587 | ||||||||||
| Operating income |
545 | 579 | 44 | (260 | ) | 908 | ||||||||||
| Identifiable assets |
2,242 | 5,712 | — | 361 | 8,315 | |||||||||||
| Capital expenditures |
95 | 94 | 7 | 2 | 198 | |||||||||||
| Depreciation and amortization expense |
92 | 88 | 6 | 164 | 350 | |||||||||||
| 2007 |
||||||||||||||||
| Processing and services revenue |
$ | 1,628 | $ | 594 | $ | 227 | $ | (1 | ) | $ | 2,448 | |||||
| Product revenue |
202 | 476 | 577 | (26 | ) | 1,229 | ||||||||||
| Total revenues |
1,830 | 1,070 | 804 | (27 | ) | 3,677 | ||||||||||
| Operating income |
506 | 253 | 78 | (101 | ) | 736 | ||||||||||
| Identifiable assets |
2,201 | 5,888 | 795 | 183 | 9,067 | |||||||||||
| Capital expenditures |
79 | 55 | 10 | 8 | 152 | |||||||||||
| Depreciation and amortization expense |
86 | 45 | 9 | 36 | 176 | |||||||||||
A reconciliation of business segment identifiable assets to the consolidated balance sheets is as follows:
| (In millions) |
2009 | 2008 | ||||
| Business segments |
$ | 8,378 | $ | 8,315 | ||
| Assets of discontinued operations held for sale |
— | 1,016 | ||||
| Total assets |
$ | 8,378 | $ | 9,331 | ||
51
Table of Contents
Notes to Consolidated Financial Statements—Continued
For the years ended December 31, 2009, 2008 and 2007
Revenues to clients outside the United States comprised approximately 5% of total revenues in 2009, 2008 and 2007. No single client accounted for more than 6% of total revenues in 2009, 2008 or 2007.
10. Subsidiary Guarantors of Long-Term Debt
Certain of the Company’s 100% owned domestic subsidiaries (“Guarantor Subsidiaries”) jointly and severally, and fully and unconditionally guarantee the Company’s indebtedness under its revolving credit facility, senior term loan, and senior notes. The following condensed consolidating financial information is presented on the equity method and reflects the summarized financial information for: (a) the Company; (b) the Guarantor Subsidiaries on a combined basis; and (c) the Company’s non-guarantor subsidiaries on a combined basis.
52
Table of Contents
Notes to Consolidated Financial Statements—Continued
For the years ended December 31, 2009, 2008 and 2007
FISERV, INC.
CONDENSED CONSOLIDATING STATEMENT OF INCOME
YEAR ENDED DECEMBER 31, 2009
| (In millions) |
Parent Company |
Guarantor Subsidiaries |
Non-Guarantor Subsidiaries |
Eliminations | Consolidated | |||||||||||||||
| Revenues: |
||||||||||||||||||||
| Processing and services |
$ | — | $ | 2,346 | $ | 1,061 | $ | (78 | ) | $ | 3,329 | |||||||||
| Product |
— | 631 | 146 | (29 | ) | 748 | ||||||||||||||
| Total revenues |
— | 2,977 | 1,207 | (107 | ) | 4,077 | ||||||||||||||
| Expenses: |
||||||||||||||||||||
| Cost of processing and services |
2 | 1,277 | 643 | (78 | ) | 1,844 | ||||||||||||||
| Cost of product |
1 | 472 | 89 | (26 | ) | 536 | ||||||||||||||
| Selling, general and administrative |
100 | 427 | 224 | — | 751 | |||||||||||||||
| Total expenses |
103 | 2,176 | 956 | (104 | ) | 3,131 | ||||||||||||||
| Operating income (loss) |
(103 | ) | 801 | 251 | (3 | ) | 946 | |||||||||||||
| Interest (expense) income, net |
46 | (252 | ) | (6 | ) | — | (212 | ) | ||||||||||||
| Income (loss) from continuing operations before income taxes and income from investment in unconsolidated affiliate |
(57 | ) | 549 | 245 | (3 | ) | 734 | |||||||||||||
| Income tax (provision) benefit |
28 | (209 | ) | (93 | ) | 1 | (273 | ) | ||||||||||||
| Income from investment in unconsolidated affiliate, net of income taxes |
— | — | 12 | — | 12 | |||||||||||||||
| Income (loss) from continuing operations |
(29 | ) | 340 | 164 | (2 | ) | 473 | |||||||||||||
| Equity in earnings of consolidated affiliates |
505 | — | — | (505 | ) | — | ||||||||||||||
| Income (loss) from discontinued operations, net of income taxes |
— | (15 | ) | 18 | — | 3 | ||||||||||||||
| Net income |
$ | 476 | $ | 325 | $ | 182 | $ | (507 | ) | $ | 476 | |||||||||
53
Table of Contents
Notes to Consolidated Financial Statements—Continued
For the years ended December 31, 2009, 2008 and 2007
FISERV, INC.
CONDENSED CONSOLIDATING STATEMENT OF INCOME
YEAR ENDED DECEMBER 31, 2008
| (In millions) |
Parent Company |
Guarantor Subsidiaries |
Non-Guarantor Subsidiaries |
Eliminations | Consolidated | |||||||||||||||
| Revenues: |
||||||||||||||||||||
| Processing and services |
$ | 1 | $ | 2,304 | $ | 1,232 | $ | (73 | ) | $ | 3,464 | |||||||||
| Product |
— | 623 | 525 | (25 | ) | 1,123 | ||||||||||||||
| Total revenues |
1 | 2,927 | 1,757 | (98 | ) | 4,587 | ||||||||||||||
| Expenses: |
||||||||||||||||||||
| Cost of processing and services |
1 | 1,276 | 757 | (85 | ) | 1,949 | ||||||||||||||
| Cost of product |
2 | 479 | 457 | (21 | ) | 917 | ||||||||||||||
| Selling, general and administrative |
107 | 437 | 269 | — | 813 | |||||||||||||||
| Total expenses |
110 | 2,192 | 1,483 | (106 | ) | 3,679 | ||||||||||||||
| Operating income (loss) |
(109 | ) | 735 | 274 | 8 | 908 | ||||||||||||||
| Interest expense, net |
(118 | ) | (116 | ) | (13 | ) | — | (247 | ) | |||||||||||
| Loss on sale of businesses |
— | — | (21 | ) | — | (21 | ) | |||||||||||||
| Income (loss) from continuing operations before income taxes and income from investment in unconsolidated affiliate |
(227 | ) | 619 | 240 | 8 | 640 | ||||||||||||||
| Income tax (provision) benefit |
87 | (238 | ) | (134 | ) | (3 | ) | (288 | ) | |||||||||||
| Income from investment in unconsolidated affiliate, net of income taxes |
— | — | 6 | — | 6 | |||||||||||||||
| Income (loss) from continuing operations |
(140 | ) | 381 | 112 | 5 | 358 | ||||||||||||||
| Equity in earnings of consolidated affiliates |
709 | — | — | (709 | ) | — | ||||||||||||||
| Income (loss) from discontinued operations, net of income taxes |
— | (12 | ) | 223 | — | 211 | ||||||||||||||
| Net income |
$ | 569 | $ | 369 | $ | 335 | $ | (704 | ) | $ | 569 | |||||||||
54
Table of Contents
Notes to Consolidated Financial Statements—Continued
For the years ended December 31, 2009, 2008 and 2007
FISERV, INC.
CONDENSED CONSOLIDATING STATEMENT OF INCOME
YEAR ENDED DECEMBER 31, 2007
| (In millions) |
Parent Company |
Guarantor Subsidiaries |
Non-Guarantor Subsidiaries |
Eliminations | Consolidated | |||||||||||||||
| Revenues: |
||||||||||||||||||||
| Processing and services |
$ | 2 | $ | 1,473 | $ | 1,013 | $ | (40 | ) | $ | 2,448 | |||||||||
| Product |
1 | 559 | 692 | (23 | ) | 1,229 | ||||||||||||||
| Total revenues |
3 | 2,032 | 1,705 | (63 | ) | 3,677 | ||||||||||||||
| Expenses: |
||||||||||||||||||||
| Cost of processing and services |
(7 | ) | 849 | 650 | (43 | ) | 1,449 | |||||||||||||
| Cost of product |
1 | 409 | 595 | (26 | ) | 979 | ||||||||||||||
| Selling, general and administrative |
85 | 217 | 211 | — | 513 | |||||||||||||||
| Total expenses |
79 | 1,475 | 1,456 | (69 | ) | 2,941 | ||||||||||||||
| Operating income (loss) |
(76 | ) | 557 | 249 | 6 | 736 | ||||||||||||||
| Interest (expense) income, net |
(43 | ) | 3 | (29 | ) | — | (69 | ) | ||||||||||||
| Income (loss) from continuing operations before income taxes |
(119 | ) | 560 | 220 | 6 | 667 | ||||||||||||||
| Income tax (provision) benefit |
46 | (217 | ) | (82 | ) | (2 | ) | (255 | ) | |||||||||||
| Income (loss) from continuing operations |
(73 | ) | 343 | 138 | 4 | 412 | ||||||||||||||
| Equity in earnings of consolidated affiliates |
512 | — | — | (512 | ) | — | ||||||||||||||
| Income from discontinued operations, net of income taxes |
— | 2 | 25 | — | 27 | |||||||||||||||
| Net income |
$ | 439 | $ | 345 | $ | 163 | $ | (508 | ) | $ | 439 | |||||||||
55
Table of Contents
Notes to Consolidated Financial Statements—Continued
For the years ended December 31, 2009, 2008 and 2007
FISERV, INC.
CONDENSED CONSOLIDATING BALANCE SHEET
DECEMBER 31, 2009
| (In millions) |
Parent Company |
Guarantor Subsidiaries |
Non-Guarantor Subsidiaries |
Eliminations | Consolidated | ||||||||||||
| ASSETS | |||||||||||||||||
| Cash and cash equivalents |
$ | 55 | $ | 169 | $ | 139 | $ | — | $ | 363 | |||||||
| Trade accounts receivable, net |
(2 | ) | 361 | 195 | — | 554 | |||||||||||
| Prepaid expenses and other current assets |
91 | 135 | 134 | — | 360 | ||||||||||||
| Total current assets |
144 | 665 | 468 | — | 1,277 | ||||||||||||
| Investments in consolidated affiliates |
3,154 | — | — | (3,154 | ) | — | |||||||||||
| Goodwill and intangible assets, net |
2 | 5,447 | 928 | — | 6,377 | ||||||||||||
| Other long-term assets |
114 | 305 | 305 | — | 724 | ||||||||||||
| Total assets |
$ | 3,414 | $ | 6,417 | $ | 1,701 | $ | (3,154 | ) | $ | 8,378 | ||||||
| LIABILITIES AND SHAREHOLDERS’ EQUITY | |||||||||||||||||
| Total current liabilities |
$ | 337 | $ | 488 | $ | 336 | $ | — | $ | 1,161 | |||||||
| Long-term debt |
3,373 | 9 | — | — | 3,382 | ||||||||||||
| Due to (from) consolidated affiliates |
(4,094 | ) | 3,973 | 121 | — | — | |||||||||||
| Other long-term liabilities |
772 | 34 | 3 | — | 809 | ||||||||||||
| Total liabilities |
388 | 4,504 | 460 | — | 5,352 | ||||||||||||
| Total shareholders’ equity |
3,026 | 1,913 | 1,241 | (3,154 | ) | 3,026 | |||||||||||
| Total liabilities and shareholders’ equity |
$ | 3,414 | $ | 6,417 | $ | 1,701 | $ | (3,154 | ) | $ | 8,378 | ||||||
56
Table of Contents
Notes to Consolidated Financial Statements—Continued
For the years ended December 31, 2009, 2008 and 2007
FISERV, INC.
CONDENSED CONSOLIDATING BALANCE SHEET
DECEMBER 31, 2008
| (In millions) |
Parent Company |
Guarantor Subsidiaries |
Non-Guarantor Subsidiaries |
Eliminations | Consolidated | |||||||||||||
| ASSETS | ||||||||||||||||||
| Cash and cash equivalents |
$ | 32 | $ | 104 | $ | 94 | $ | — | $ | 230 | ||||||||
| Trade accounts receivable, net |
(1 | ) | 379 | 213 | — | 591 | ||||||||||||
| Prepaid expenses and other current assets |
76 | 144 | 145 | — | 365 | |||||||||||||
| Assets of discontinued operations held for sale |
— | 70 | 946 | — | 1,016 | |||||||||||||
| Total current assets |
107 | 697 | 1,398 | — | 2,202 | |||||||||||||
| Investments in consolidated affiliates |
2,736 | — | — | (2,736 | ) | — | ||||||||||||
| Goodwill and intangible assets, net |
— | 5,523 | 955 | — | 6,478 | |||||||||||||
| Other long-term assets |
59 | 297 | 295 | — | 651 | |||||||||||||
| Total assets |
$ | 2,902 | $ | 6,517 | $ | 2,648 | $ | (2,736 | ) | $ | 9,331 | |||||||
| LIABILITIES AND SHAREHOLDERS’ EQUITY | ||||||||||||||||||
| Accounts payable and other current liabilities |
$ | 360 | $ | 514 | $ | 325 | $ | — | $ | 1,199 | ||||||||
| Liabilities of discontinued operations held for sale |
— | 10 | 831 | — | 841 | |||||||||||||
| Total current liabilities |
360 | 524 | 1,156 | — | 2,040 | |||||||||||||
| Long-term debt |
3,849 | 1 | — | — | 3,850 | |||||||||||||
| Due to (from) consolidated affiliates |
(4,264 | ) | 3,880 | 384 | — | — | ||||||||||||
| Other long-term liabilities |
363 | 530 | (46 | ) | — | 847 | ||||||||||||
| Total liabilities |
308 | 4,935 | 1,494 | — | 6,737 | |||||||||||||
| Total shareholders’ equity |
2,594 | 1,582 | 1,154 | (2,736 | ) | 2,594 | ||||||||||||
| Total liabilities and shareholders’ equity |
$ | 2,902 | $ | 6,517 | $ | 2,648 | $ | (2,736 | ) | $ | 9,331 | |||||||
57
Table of Contents
Notes to Consolidated Financial Statements—Continued
For the years ended December 31, 2009, 2008 and 2007
FISERV, INC.
CONDENSED CONSOLIDATING STATEMENT OF CASH FLOWS
YEAR ENDED DECEMBER 31, 2009
| (In millions) |
Parent Company |
Guarantor Subsidiaries |
Non-Guarantor Subsidiaries |
Eliminations | Consolidated | |||||||||||||||
| Cash flows from operating activities: |
||||||||||||||||||||
| Net cash provided by operating activities from continuing operations |
$ | 44 | $ | 540 | $ | 270 | $ | (4 | ) | $ | 850 | |||||||||
| Cash flows from investing activities: |
||||||||||||||||||||
| Capital expenditures, including capitalization of software costs |
(3 | ) | (153 | ) | (43 | ) | 1 | (198 | ) | |||||||||||
| Other investing activities |
(58 | ) | (322 | ) | (181 | ) | 511 | (50 | ) | |||||||||||
| Net cash used in investing activities from continuing operations |
(61 | ) | (475 | ) | (224 | ) | 512 | (248 | ) | |||||||||||
| Cash flows from financing activities: |
||||||||||||||||||||
| Repayments of long-term debt |
(471 | ) | — | (4 | ) | — | (475 | ) | ||||||||||||
| Purchases of treasury stock |
(175 | ) | — | — | — | (175 | ) | |||||||||||||
| Other financing activities |
554 | — | 3 | (508 | ) | 49 | ||||||||||||||
| Net cash used in financing activities from continuing operations |
(92 | ) | — | (1 | ) | (508 | ) | (601 | ) | |||||||||||
| Net change in cash and cash equivalents from continuing operations |
(109 | ) | 65 | 45 | — | 1 | ||||||||||||||
| Net cash transactions transferred from discontinued operations |
132 | — | — | — | 132 | |||||||||||||||
| Beginning balance |
32 | 104 | 94 | — | 230 | |||||||||||||||
| Ending balance |
$ | 55 | $ | 169 | $ | 139 | $ | — | $ | 363 | ||||||||||
58
Table of Contents
Notes to Consolidated Financial Statements—Continued
For the years ended December 31, 2009, 2008 and 2007
FISERV, INC.
CONDENSED CONSOLIDATING STATEMENT OF CASH FLOWS
YEAR ENDED DECEMBER 31, 2008
| (In millions) |
Parent Company |
Guarantor Subsidiaries |
Non-Guarantor Subsidiaries |
Eliminations | Consolidated | |||||||||||||||
| Cash flows from operating activities: |
||||||||||||||||||||
| Net cash provided by (used in) operating activities from continuing operations |
$ | (3 | ) | $ | 589 | $ | 180 | $ | — | $ | 766 | |||||||||
| Cash flows from investing activities: |
||||||||||||||||||||
| Capital expenditures, including capitalization of software costs |
(2 | ) | (143 | ) | (55 | ) | 2 | (198 | ) | |||||||||||
| Payment for acquisitions of businesses, net of cash acquired |
(14 | ) | (30 | ) | (41 | ) | — | (85 | ) | |||||||||||
| Proceeds from sale of businesses, net of cash sold and expenses paid |
— | — | 497 | — | 497 | |||||||||||||||
| Other investing activities |
1 | (440 | ) | (557 | ) | 987 | (9 | ) | ||||||||||||
| Net cash provided by (used in) investing activities from continuing operations |
(15 | ) | (613 | ) | (156 | ) | 989 | 205 | ||||||||||||
| Cash flows from financing activities: |
||||||||||||||||||||
| Repayments of long-term debt, net |
(1,240 | ) | (8 | ) | (55 | ) | — | (1,303 | ) | |||||||||||
| Purchases of treasury stock |
(441 | ) | — | — | — | (441 | ) | |||||||||||||
| Other financing activities |
1,027 | — | 1 | (989 | ) | 39 | ||||||||||||||
| Net cash used in financing activities from continuing operations |
(654 | ) | (8 | ) | (54 | ) | (989 | ) | (1,705 | ) | ||||||||||
| Net change in cash and cash equivalents from continuing operations |
(672 | ) | (32 | ) | (30 | ) | — | (734 | ) | |||||||||||
| Net cash transactions transferred from discontinued operations |
663 | 6 | — | — | 669 | |||||||||||||||
| Beginning balance |
41 | 130 | 124 | — | 295 | |||||||||||||||
| Ending balance |
$ | 32 | $ | 104 | $ | 94 | $ | — | $ | 230 | ||||||||||
59
Table of Contents
Notes to Consolidated Financial Statements—Continued
For the years ended December 31, 2009, 2008 and 2007
FISERV, INC.
CONDENSED CONSOLIDATING STATEMENT OF CASH FLOWS
YEAR ENDED DECEMBER 31, 2007
| (In millions) |
Parent Company |
Guarantor Subsidiaries |
Non-Guarantor Subsidiaries |
Eliminations | Consolidated | |||||||||||||||
| Cash flows from operating activities: |
||||||||||||||||||||
| Net cash provided by (used in) operating activities from continuing operations |
$ | (40 | ) | $ | 447 | $ | 135 | $ | 5 | $ | 547 | |||||||||
| Cash flows from investing activities: |
||||||||||||||||||||
| Capital expenditures, including capitalization of software costs |
(2 | ) | (90 | ) | (60 | ) | — | (152 | ) | |||||||||||
| Payment for acquisitions of businesses, net of cash acquired |
(4,296 | ) | (88 | ) | 51 | — | (4,333 | ) | ||||||||||||
| Other investing activities |
— | (51 | ) | (12 | ) | 82 | 19 | |||||||||||||
| Net cash used in investing activities from continuing operations |
(4,298 | ) | (229 | ) | (21 | ) | 82 | (4,466 | ) | |||||||||||
| Cash flows from financing activities: |
||||||||||||||||||||
| Proceeds from (repayments of) long-term debt, net |
4,634 | (169 | ) | (3 | ) | — | 4,462 | |||||||||||||
| Purchases of treasury stock |
(469 | ) | — | — | — | (469 | ) | |||||||||||||
| Other financing activities |
134 | — | (6 | ) | (87 | ) | 41 | |||||||||||||
| Net cash provided by (used in) financing activities from continuing operations |
4,299 | (169 | ) | (9 | ) | (87 | ) | 4,034 | ||||||||||||
| Net change in cash and cash equivalents from continuing operations |
(39 | ) | 49 | 105 | — | 115 | ||||||||||||||
| Net cash transactions transferred from discontinued operations |
56 | 9 | — | — | 65 | |||||||||||||||
| Beginning balance |
24 | 72 | 19 | — | 115 | |||||||||||||||
| Ending balance |
$ | 41 | $ | 130 | $ | 124 | $ | — | $ | 295 | ||||||||||
60
Table of Contents
Notes to Consolidated Financial Statements—Continued
For the years ended December 31, 2009, 2008 and 2007
11. Quarterly Financial Data (unaudited)
Quarterly financial data for 2009 and 2008 was as follows:
| Quarters | ||||||||||||
| (In millions, except per share data) |
First | Second | Third | Fourth | ||||||||
| 2009 |
||||||||||||
| Total revenues |
$ | 1,023 | $ | 1,000 | $ | 992 | $ | 1,062 | ||||
| Operating income |
225 | 234 | 231 | 256 | ||||||||
| Income from continuing operations |
106 | 115 | 124 | 128 | ||||||||
| Net income |
103 | 140 | 115 | 118 | ||||||||
| Net income per share—continuing operations |
||||||||||||
| Basic |
$ | 0.68 | $ | 0.74 | $ | 0.80 | $ | 0.84 | ||||
| Diluted |
$ | 0.68 | $ | 0.74 | $ | 0.79 | $ | 0.83 | ||||
| 2008 |
||||||||||||
| Total revenues |
$ | 1,265 | $ | 1,244 | $ | 1,038 | $ | 1,040 | ||||
| Operating income |
235 | 226 | 217 | 230 | ||||||||
| Income from continuing operations |
102 | 101 | 75 | 80 | ||||||||
| Net income |
329 | 100 | 78 | 62 | ||||||||
| Net income per share—continuing operations |
||||||||||||
| Basic |
$ | 0.62 | $ | 0.62 | $ | 0.46 | $ | 0.50 | ||||
| Diluted |
$ | 0.62 | $ | 0.62 | $ | 0.46 | $ | 0.50 | ||||
61
Table of Contents
Report of Independent Registered Public Accounting Firm
To the Board of Directors and Shareholders of Fiserv, Inc.:
We have audited the accompanying consolidated balance sheets of Fiserv, Inc. and subsidiaries (the “Company”) as of December 31, 2009 and 2008, and the related consolidated statements of income, shareholders’ equity, and cash flows for each of the three years in the period ended December 31, 2009. Our audits also included the consolidated financial statement schedule of the Company listed in the Index at Item 15. These financial statements and financial statement schedule are the responsibility of the Company’s management. Our responsibility is to express an opinion on the financial statements and financial statement schedule based on our audits.
We conducted our audits in accordance with the standards of the Public Company Accounting Oversight Board (United States). Those standards require that we plan and perform the audit to obtain reasonable assurance about whether the financial statements are free of material misstatement. An audit includes examining, on a test basis, evidence supporting the amounts and disclosures in the financial statements. An audit also includes assessing the accounting principles used and significant estimates made by management, as well as evaluating the overall financial statement presentation. We believe that our audits provide a reasonable basis for our opinion.
In our opinion, such consolidated financial statements present fairly, in all material respects, the financial position of Fiserv, Inc. and subsidiaries as of December 31, 2009 and 2008, and the results of their operations and their cash flows for each of the three years in the period ended December 31, 2009, in conformity with accounting principles generally accepted in the United States of America. Also, in our opinion, such consolidated financial statement schedule, when considered in relation to the basic consolidated financial statements taken as a whole, presents fairly, in all material respects, the information set forth therein.
We have also audited, in accordance with the standards of the Public Company Accounting Oversight Board (United States), the Company’s internal control over financial reporting as of December 31, 2009, based on the criteria established in Internal Control—Integrated Framework issued by the Committee of Sponsoring Organizations of the Treadway Commission and our report dated February 26, 2010 expressed an unqualified opinion on the Company’s internal control over financial reporting.
/s/ Deloitte & Touche LLP
Milwaukee, WI
February 26, 2010
62
Table of Contents
Item 9. Changes in and Disagreements with Accountants on Accounting and Financial Disclosure
Not applicable.
Item 9A. Controls and Procedures
| (a) | Disclosure Controls and Procedures |
Our management, with the participation of our chief executive officer and chief financial officer, evaluated the design and operation of our disclosure controls and procedures (as defined in Rules 13a-15(e) and 15d-15(e) under the Securities Exchange Act of 1934). Based on this evaluation, our chief executive officer and chief financial officer concluded that our disclosure controls and procedures were effective as of December 31, 2009.
| (b) | Management Report On Internal Control Over Financial Reporting |
Management’s Annual Report on Internal Control Over Financial Reporting
Our management is responsible for establishing and maintaining adequate internal control over financial reporting, as such term is defined in Rule 13a-15(f) under the Securities Exchange Act of 1934. Our internal control over financial reporting is designed to provide reasonable assurance regarding the reliability of financial reporting and the preparation of financial statements for external purposes in accordance with generally accepted accounting principles.
Because of its inherent limitations, internal control over financial reporting may not prevent or detect misstatements. Also, projections of any evaluation of effectiveness to future periods are subject to risk that controls may become inadequate because of changes in conditions.
Our management assessed the effectiveness of our internal control over financial reporting as of December 31, 2009. In making this assessment, management used the criteria set forth by the Committee of Sponsoring Organizations of the Treadway Commission (COSO) in Internal Control – Integrated Framework. Based on management’s assessment, our management believes that, as of December 31, 2009, our internal control over financial reporting was effective based on those criteria.
Our independent registered public accounting firm has issued their attestation report on our internal control over financial reporting. The report is included below under the heading “Report of Independent Registered Public Accounting Firm On Internal Control Over Financial Reporting.”
| (c) | Changes in Internal Control Over Financial Reporting |
There were no changes in internal control over financial reporting that occurred during the quarter ended December 31, 2009 that have materially affected, or are reasonably likely to materially affect, our internal control over financial reporting.
| (d) | Report of Independent Registered Public Accounting Firm On Internal Control Over Financial Reporting |
Our independent registered public accounting firm, Deloitte & Touche LLP, assessed the effectiveness of our internal control over financial reporting and has issued their report as set forth below.
63
Table of Contents
Report of Independent Registered Public Accounting Firm
To the Board of Directors and Shareholders of Fiserv, Inc.:
We have audited the internal control over financial reporting of Fiserv, Inc. and subsidiaries (the “Company”) as of December 31, 2009, based on criteria established in Internal Control—Integrated Framework issued by the Committee of Sponsoring Organizations of the Treadway Commission. The Company’s management is responsible for maintaining effective internal control over financial reporting and for its assessment of the effectiveness of internal control over financial reporting, included in the accompanying Management’s Annual Report on Internal Control Over Financial Reporting. Our responsibility is to express an opinion on the Company’s internal control over financial reporting based on our audit.
We conducted our audit in accordance with the standards of the Public Company Accounting Oversight Board (United States). Those standards require that we plan and perform the audit to obtain reasonable assurance about whether effective internal control over financial reporting was maintained in all material respects. Our audit included obtaining an understanding of internal control over financial reporting, assessing the risk that a material weakness exists, testing and evaluating the design and operating effectiveness of internal control based on the assessed risk, and performing such other procedures as we considered necessary in the circumstances. We believe that our audit provides a reasonable basis for our opinion.
A company’s internal control over financial reporting is a process designed by, or under the supervision of, the company’s principal executive and principal financial officers, or persons performing similar functions, and effected by the company’s board of directors, management, and other personnel to provide reasonable assurance regarding the reliability of financial reporting and the preparation of financial statements for external purposes in accordance with generally accepted accounting principles. A company’s internal control over financial reporting includes those policies and procedures that (1) pertain to the maintenance of records that, in reasonable detail, accurately and fairly reflect the transactions and disposition of the assets of the company; (2) provide reasonable assurance that transactions are recorded as necessary to permit preparation of financial statements in accordance with generally accepted accounting principles, and that receipts and expenditures of the company are being made only in accordance with authorizations of management and directors of the company; and (3) provide reasonable assurance regarding prevention or timely detection of unauthorized acquisition, use, or disposition of the company’s assets that could have a material effect on the consolidated financial statements.
Because of the inherent limitations of internal control over financial reporting, including the possibility of collusion or improper management override of controls, material misstatements due to error or fraud may not be prevented or detected on a timely basis. Also, projections of any evaluation of the effectiveness of the internal control over financial reporting to future periods are subject to the risk that the controls may become inadequate because of changes in conditions, or that the degree of compliance with the policies or procedures may deteriorate.
In our opinion, the Company maintained, in all material respects, effective internal control over financial reporting as of December 31, 2009, based on the criteria established in Internal Control—Integrated Framework issued by the Committee of Sponsoring Organizations of the Treadway Commission.
We have also audited, in accordance with the standards of the Public Company Accounting Oversight Board (United States), the consolidated financial statements and financial statement schedule as of and for the year ended December 31, 2009 of the Company and our report dated February 26, 2010 expressed an unqualified opinion on those consolidated financial statements and consolidated financial statement schedule.
/s/ Deloitte & Touche LLP
Milwaukee, WI
February 26, 2010
64
Table of Contents
Not applicable
PART III
Item 10. Directors, Executive Officers and Corporate Governance
Except for information concerning our executive officers included in this report under the caption “Executive Officers of the Registrant” beginning on page 15, which is incorporated by reference herein, and the information regarding our Code of Conduct below, the information required by Item 10 is incorporated by reference to the information set forth under the captions “Our Board of Directors,” “Nominees for Election,” “Continuing Directors,” “Nominating and Corporate Governance Committee – Nominations of Directors,” “Shareholder Proposals for the 2011 Annual Meeting,” “Audit Committee – Membership and Responsibilities,” and “Section 16(a) Beneficial Ownership Reporting Compliance” in our definitive proxy statement for our 2010 annual meeting of shareholders, which will be filed with the Securities and Exchange Commission no later than 120 days after the close of the fiscal year ended December 31, 2009.
Our board of directors has adopted a Code of Conduct that applies to all of our directors and employees, including our chief executive officer, chief financial officer, corporate controller and other persons performing similar functions. We have posted a copy of our Code of Conduct on the “Investors – Corporate Governance” section of our website at www.fiserv.com. We intend to satisfy the disclosure requirements under Item 5.05 of Form 8-K regarding amendments to, or waivers from, the Code of Conduct by posting such information on the “Corporate Governance” section of our website at www.fiserv.com. We are not including the information contained on our website as part of, or incorporating it by reference into, this report.
Item 11. Executive Compensation
The information required by Item 11 is incorporated by reference to the information set forth under the captions “Compensation Discussion and Analysis,” “Compensation Committee Interlocks and Insider Participation,” “Compensation Committee Report,” “Summary Compensation Table,” “Grants of Plan-Based Awards in 2009,” “Outstanding Equity Awards at December 31, 2009,” “Option Exercises and Stock Vested During 2009,” “Potential Payments Upon Termination or Change in Control,” and “Compensation of Directors” in our definitive proxy statement for our 2010 annual meeting of shareholders, which will be filed with the Securities and Exchange Commission no later than 120 days after the close of the fiscal year ended December 31, 2009.
Item 12. Security Ownership of Certain Beneficial Owners and Management and Related Stockholder Matters
The information set forth under the caption “Security Ownership by Certain Beneficial Owners and Management” in our definitive proxy statement for our 2010 annual meeting of shareholders, which will be filed with the Securities and Exchange Commission no later than 120 days after the close of the fiscal year ended December 31, 2009 is incorporated by reference herein.
65
Table of Contents
Equity Compensation Plan Information
The table below sets forth information with respect to compensation plans under which equity securities are authorized for issuance as of December 31, 2009.
| (a) | (b) | (c) | ||||||||
| Plan Category | Number of shares to be issued upon exercise of outstanding options(1) |
Weighted-average exercise price of |
Number of shares remaining available for future issuance under equity compensation plans (excluding securities reflected in column (a))(2) |
|||||||
| Equity compensation plans approved by our shareholders(3) |
7,252,540 | $ | 41.51 | 6,217,390 | ||||||
| Equity compensation plans not approved by our shareholders |
N/A | N/A | N/A | |||||||
| Total |
7,252,540 | $ | 41.51 | 6,217,390 | ||||||
| (1) | Consists of options outstanding under the Fiserv, Inc. 2007 Omnibus Incentive Plan, the Fiserv, Inc. Stock Option and Restricted Stock Plan, and the CheckFree Corporation Amended and Restated 2002 Stock Incentive Plan, which we assumed in connection with our acquisition of CheckFree Corporation. |
| (2) | Reflects number of shares available for future issuance under the Fiserv, Inc. 2007 Omnibus Incentive Plan. No additional awards may be granted under the Fiserv, Inc. Stock Option and Restricted Stock Plan or the CheckFree Corporation Amended and Restated 2002 Stock Incentive Plan. |
| (3) | Columns (a) and (c) of the table above do not include: (i) 1,025,029 shares of unvested restricted stock and restricted stock units outstanding under the Fiserv, Inc. 2007 Omnibus Incentive Plan or the Fiserv, Inc. Stock Option and Restricted Stock Plan; (ii) 1,200,000 shares authorized for issuance under the Fiserv, Inc. Amended and Restated Employee Stock Purchase Plan, which became effective on January 1, 2010; or (iii) 500,922 shares available for issuance under the Fiserv, Inc. Employee Stock Purchase Plan, which expired on December 31, 2009. The number of shares remaining available for future issuance under the Amended and Restated Employee Stock Purchase Plan is subject to an annual increase on the first day of each fiscal year equal to the lesser of (A) 1,000,000 shares, (B) 1% of the shares of our common stock outstanding on such date, or (C) a lesser amount determined by our board of directors. |
Item 13. Certain Relationships and Related Transactions, and Director Independence
The information required by Item 13 is incorporated by reference to the information set forth under the captions “Corporate Governance – Director Independence,” “Corporate Governance – Review, Approval or Ratification of Transactions with Related Persons,” and “Corporate Governance – Certain Relationships and Related Transactions” in our definitive proxy statement for our 2010 annual meeting of shareholders, which will be filed with the Securities and Exchange Commission no later than 120 days after the close of the fiscal year ended December 31, 2009.
Item 14. Principal Accountant Fees and Services
The information required by Item 14 is incorporated by reference to the information set forth under the caption “Audit Fees” in our definitive proxy statement for our 2010 annual meeting of shareholders, which will be filed with the Securities and Exchange Commission no later than 120 days after the close of the fiscal year ended December 31, 2009.
66
Table of Contents
PART IV
Item 15. Exhibits and Financial Statement Schedules
Financial Statement Schedule
The following financial statement schedule is included in this Annual Report on Form 10-K:
| Page | ||
| 69 |
All other schedules are omitted because they are not applicable or the required information is shown in the consolidated financial statements or notes thereto.
Exhibits
The exhibits listed in the accompanying exhibit index are filed as part of this Annual Report on Form 10-K.
67
Table of Contents
Pursuant to the requirements of Section 13 or 15(d) of the Securities Exchange Act of 1934, the registrant has duly caused this report to be signed on its behalf by the undersigned, thereunto duly authorized on February 26, 2010.
| FISERV, INC. | ||
| By: | /S/ JEFFERY W. YABUKI | |
| Jeffery W. Yabuki | ||
| President and Chief Executive Officer | ||
Pursuant to the requirements of the Securities Exchange Act of 1934, this report has been signed below by the following persons on behalf of the registrant and in the capacities indicated on February 26, 2010.
| Name |
Capacity | |
| /S/ DONALD F. DILLON Donald F. Dillon |
Chairman of the Board | |
| /S/ JEFFERY W. YABUKI Jeffery W. Yabuki |
Director, President and Chief Executive Officer (Principal Executive Officer) | |
| /S/ THOMAS J. HIRSCH Thomas J. Hirsch |
Executive Vice President, Chief Financial Officer | |
| /S/ DANIEL P. KEARNEY Daniel P. Kearney |
Director | |
| /S/ PETER J. KIGHT Peter J. Kight |
Director | |
| /S/ GERALD J. LEVY Gerald J. Levy |
Director | |
| /S/ DENIS J. O’LEARY Denis J. O’Leary |
Director | |
| /S/ GLENN M. RENWICK Glenn M. Renwick |
Director | |
| /S/ KIM M. ROBAK Kim M. Robak |
Director | |
| /S/ DOYLE R. SIMONS Doyle R. Simons |
Director | |
| /S/ THOMAS C. WERTHEIMER Thomas C. Wertheimer |
Director | |
68
Table of Contents
Valuation and Qualifying Accounts
Allowance for Doubtful Accounts
(In millions)
| Beginning Balance |
Charged to Expense |
Write-offs | Acquisitions | Sale of Businesses |
Ending Balance | |||||||||||||||
| 2009 |
$ | 12 | $ | 2 | $ | (3 | ) | $ | — | $ | — | $ | 11 | |||||||
| 2008 |
62 | 23 | (26 | ) | — | (47 | ) | 12 | ||||||||||||
| 2007 |
32 | 32 | (29 | ) | 27 | — | 62 | |||||||||||||
69
Table of Contents
EXHIBIT INDEX
| Exhibit Number |
Exhibit Description | |
| 2.1 | Stock Subscription and Purchase Agreement by and among Trident FIS Holdings, LLL, Trident FIS PF Holdings, LLC, Insurance Solutions Holdings, Inc., Insurance Solutions Group, Inc., Fiserv, Inc. and Fiserv Insurance Holdings, Inc., dated as of July 1, 2008 (1) | |
| 2.2 | Second Amended and Restated Stock Purchase Agreement, dated as of April 15, 2009, by and between Fiserv, Inc. and Robert Beriault Holdings, Inc. (2) | |
| 2.3 | Asset Purchase Agreement, dated April 15, 2009, by and among Fiserv, Inc., Lincoln Trust Company, and Robert Beriault Holdings, Inc. (2) | |
| 3.1 | Restated Articles of Incorporation (3) | |
| 3.2 | Amended and Restated Bylaws (4) | |
| 4.1 | Credit Agreement, dated as of March 24, 2006, among Fiserv, Inc., certain foreign subsidiaries thereof from time to time parties thereto and the financial institutions parties thereto (5) | |
| 4.2 | Amendment No. 1 to Credit Agreement, dated as of November 9, 2007, among Fiserv, Inc. and the financial institutions parties thereto (6) | |
| 4.3 | Loan Agreement, dated as of November 9, 2007, among Fiserv, Inc. and the financial institutions parties thereto (6) | |
| 4.4 | Indenture, dated as of November 20, 2007, by and among Fiserv, Inc., the guarantors named therein and U.S. Bank National Association (7) | |
| 4.5 | First Supplemental Indenture, dated as of November 20, 2007, among Fiserv, Inc., the guarantors named therein and U.S. Bank National Association (8) | |
| 4.6 | Second Supplemental Indenture, dated as of November 20, 2007, among Fiserv, Inc., the guarantors named therein and U.S. Bank National Association (8) | |
| Pursuant to Item 601(b)(4)(iii) of Regulation S-K, the Company agrees to furnish to the Securities and Exchange Commission, upon request, any instrument defining the rights of holders of long-term debt that is not filed as an exhibit to this Form 10-K. | ||
| 10.1 | Fiserv, Inc. Stock Option and Restricted Stock Plan, as amended and restated (9)* | |
| 10.2 | Amendment to Fiserv, Inc. Stock Option and Restricted Stock Plan (10)* | |
| 10.3 | Fiserv, Inc. 2007 Omnibus Incentive Plan (3)* | |
| 10.4 | CheckFree Corporation Amended and Restated 2002 Stock Incentive Plan (11)* | |
| Fiserv, Inc. Stock Option and Restricted Stock Plan Forms of Award Agreements | ||
| 10.5 | – Form of Amendment to Stock Option Agreement (10)* | |
| 10.6 | – Form of Director Restricted Stock Agreement (12)* | |
| 10.7 | – Form of Employee Restricted Stock Agreement (13)* | |
| 10.8 | – Form of Non-Qualified Stock Option Agreement for Outside Directors (12)* | |
| 10.9 | – Form of Employee Non-Qualified Stock Option Agreement for Employee Directors (12)* | |
70
Table of Contents
| Exhibit Number |
Exhibit Description | |
| 10.10 | – Form of Employee Non-Qualified Stock Option Agreement for Senior Management (13)* | |
| Fiserv, Inc. 2007 Omnibus Incentive Plan Forms of Award Agreements | ||
| 10.11 | – Form of Restricted Stock Agreement (Non-Employee Director) (3)* | |
| 10.12 | – Form of Restricted Stock Agreement (Employee) (3)* | |
| 10.13 | – Form of Restricted Stock Unit Agreement (Non-Employee Director)(14)* | |
| 10.14 | – Form of Restricted Stock Unit Agreement (Senior Management)(14) * | |
| 10.15 | – Form of Non-Qualified Stock Option Agreement (Non-Employee Director)(14)* | |
| 10.16 | – Form of Non-Qualified Stock Option Agreement (Senior Management)(14)* | |
| 10.17 | – Form of Non-Qualified Stock Option Agreement (Special Equity Award 2008) (22)* | |
| CheckFree Corporation Amended and Restated 2002 Stock Incentive Plan Forms of Award Agreements | ||
| 10.18 | – Form of Nonstatutory Stock Option Agreement (11)* | |
| 10.19 | – Form of Incentive Stock Option Agreement (11)* | |
| 10.20 | Amended and Restated Employment Agreement, dated December 22, 2008, between Fiserv, Inc. and Jeffery W. Yabuki (16)* | |
| 10.21 | Amendment No. 1 to Amended and Restated Employment Agreement, dated February 26, 2009, between Fiserv, Inc. and Jeffery W. Yabuki (14)* | |
| 10.22 | Amendment No. 2 to Amended and Restated Employment Agreement, dated December 30, 2009, between Fiserv, Inc. and Jeffery W. Yabuki (17)* | |
| 10.23 | Amended and Restated Key Executive Employment and Severance Agreement, dated December 22, 2008, between Fiserv, Inc. and Jeffery W. Yabuki (16)* | |
| 10.24 | Employee Non-Qualified Stock Option Agreement, dated November 7, 2005, between Fiserv, Inc. and Jeffery W. Yabuki (18)* | |
| 10.25 | Employee Non-Qualified Stock Option Agreement, dated November 7, 2005, between Fiserv, Inc. and Jeffery W. Yabuki (18)* | |
| 10.26 | Employee Restricted Stock Agreement, dated November 7, 2005, between Fiserv, Inc. and Jeffery W. Yabuki (18)* | |
| 10.27 | Amendment to Employee Restricted Stock Agreement, dated March 30, 2006, between Fiserv, Inc. and Jeffery W. Yabuki (19)* | |
| 10.28 | Amended and Restated Executive Employment Agreement between CheckFree Corporation and Peter J. Kight (14)* | |
| 10.29 | Retention Agreement, dated as of July 27, 2007, between CheckFree Corporation and Peter J. Kight (20)* | |
| 10.30 | Amendment No. 1 to Retention Agreement, dated as of August 2, 2007, between CheckFree Corporation and Peter J. Kight (21)* | |
| 10.31 | Amendment No. 2 to Retention Agreement, dated as of December 22, 2008, between CheckFree Corporation and Peter J. Kight (14)* | |
71
Table of Contents
| Exhibit Number |
Exhibit Description | |
| 10.32 | Form of Amended and Restated Key Executive Employment and Severance Agreement, between Fiserv, Inc. and each of James Cox, Thomas Hirsch, Steve Olsen, Charles Sprague, Steven Tait and Thomas Warsop (16)* | |
| 10.33 | Amended and Restated Employment Agreement, dated December 22, 2008, between Fiserv, Inc. and Thomas Warsop (16)* | |
| 10.34 | Amended and Restated Employment Agreement, dated December 22, 2008, between Fiserv, Inc. and Steve Olsen (14)* | |
| 10.35 | Amendment No. 1 to Amended and Restated Employment Agreement, dated December 18, 2009, between Fiserv, Inc. and Steve Olsen* | |
| 10.36 | Employment Agreement, dated October 27, 2009, between Fiserv, Inc. and Steven Tait* | |
| 10.37 | Amendment to Employment Agreement, dated December 11, 2009, between Fiserv, Inc. and Steven Tait* | |
| 10.38 | Retention Agreement, dated July 27, 2007, between CheckFree Corporation and Michael P. Gianoni* | |
| 10.39 | Amendment to Retention Agreement, dated August 2, 2007, between CheckFree Corporation and Michael P. Gianoni* | |
| 10.40 | Amendment No. 2 to Retention Agreement, dated December 22, 2008, between CheckFree Corporation and Michael P. Gianoni* | |
| 10.41 | Form of Non-Employee Director Indemnity Agreement (22) | |
| 10.42 | Fiserv, Inc. Non-Employee Director Deferred Compensation Plan (22)* | |
| 10.43 | Non-Employee Director Compensation Schedule* | |
| 21.1 | Subsidiaries of Fiserv, Inc. | |
| 23.1 | Consent of Independent Registered Public Accounting Firm | |
| 31.1 | Certification of the Chief Executive Officer pursuant to Section 302 of the Sarbanes-Oxley Act of 2002 | |
| 31.2 | Certification of the Chief Financial Officer pursuant to Section 302 of the Sarbanes-Oxley Act of 2002 | |
| 32.1 | Certification of the Chief Executive Officer and the Chief Financial Officer pursuant to Section 906 of the Sarbanes-Oxley Act of 2002 | |
| 101.INS** | XBRL Instance Document | |
| 101.SCH** | XBRL Taxonomy Extension Schema Document | |
| 101.CAL** | XBRL Taxonomy Extension Calculation Linkbase Document | |
| 101.LAB** | XBRL Taxonomy Extension Label Linkbase Document | |
| 101.PRE** | XBRL Taxonomy Extension Presentation Linkbase Document | |
| * | This exhibit is a management contract or compensatory plan or arrangement. |
72
Table of Contents
| ** | Furnished with this Annual Report on Form 10-K are the following documents formatted in XBRL (Extensible Business Reporting Language): (i) the Consolidated Statements of Income for the three years ended December 31, 2009, 2008 and 2007, (ii) the Consolidated Balance Sheets at December 31, 2009 and 2008, (iii) the Consolidated Statements of Shareholders’ Equity for the three years ended December 31, 2009, 2008 and 2007, (iv) the Consolidated Statements of Cash Flows for the three years ended December 31, 2009, 2008 and 2007, and (v) Notes to Consolidated Financial Statements. |
| (1) | Previously filed as an exhibit to the Company’s Current Report on Form 8-K filed on July 8, 2008, and incorporated herein by reference. |
| (2) | Previously filed as an exhibit to the Company’s Current Report on Form 8-K filed on April 21, 2009, and incorporated herein by reference. |
| (3) | Previously filed as an exhibit to the Company’s Current Report on Form 8-K filed on May 23, 2007, and incorporated herein by reference. |
| (4) | Previously filed as an exhibit to the Company’s Current Report on Form 8-K filed on December 3, 2008, and incorporated herein by reference. |
| (5) | Previously filed as an exhibit to the Company’s Current Report on Form 8-K filed on March 29, 2006, and incorporated herein by reference. |
| (6) | Previously filed as an exhibit to the Company’s Current Report on Form 8-K filed on November 13, 2007, and incorporated herein by reference. |
| (7) | Previously filed as an exhibit to the Company’s Registration Statement on Form S-3 (File No. 333-147309) filed on November 13, 2007, and incorporated herein by reference. |
| (8) | Previously filed as an exhibit to the Company’s Current Report on Form 8-K filed on November 20, 2007, and incorporated herein by reference. |
| (9) | Previously filed as an exhibit to the Company’s Proxy Statement on Schedule 14A filed on February 25, 2005, and incorporated herein by reference. |
| (10) | Previously filed as an exhibit to the Company’s Current Report on Form 8-K filed on November 24, 2008, and incorporated herein by reference. |
| (11) | Previously filed as an exhibit to the Company’s Current Report on Form 8-K filed on December 7, 2007, and incorporated herein by reference. |
| (12) | Previously filed as an exhibit to the Company’s Quarterly Report on Form 10-Q filed on October 22, 2004, and incorporated herein by reference. |
| (13) | Previously filed as an exhibit to the Company’s Annual Report on Form 10-K filed on March 15, 2006, and incorporated herein by reference. |
| (14) | Previously filed as an exhibit to the Company’s Annual Report on Form 10-K filed on February 27, 2009, and incorporated herein by reference. |
| (15) | Previously filed as an exhibit to the Company’s Quarterly Report on Form 10-Q filed on May 9, 2008, and incorporated herein by reference. |
| (16) | Previously filed as an exhibit to the Company’s Current Report on Form 8-K filed on December 23, 2008, and incorporated herein by reference. |
| (17) | Previously filed as an exhibit to the Company’s Current Report on Form 8-K filed on December 30, 2009, and incorporated herein by reference. |
| (18) | Previously filed as an exhibit to the Company’s Current Report on Form 8-K filed on November 7, 2005, and incorporated herein by reference. |
| (19) | Previously filed as an exhibit to the Company’s Quarterly Report on Form 10-Q filed on April 28, 2006, and incorporated herein by reference. |
| (20) | Previously filed as an exhibit to CheckFree Corporation’s Current Report on Form 8-K filed on July 31, 2007, and incorporated herein by reference. |
| (21) | Previously filed as an exhibit to CheckFree Corporation’s Current Report on Form 8-K filed on August 7, 2007, and incorporated herein by reference. |
| (22) | Previously filed as an exhibit to the Company’s Annual Report on Form 10-K filed on February 28, 2008, and incorporated herein by reference. |
73