Attached files
Table of Contents
UNITED STATES
SECURITIES AND EXCHANGE COMMISSION
Washington, D.C. 20549
Form 10-K
(Mark one)
[X] ANNUAL REPORT PURSUANT TO SECTION 13 OR 15(d) OF THE SECURITIES
EXCHANGE ACT OF 1934
For the fiscal year ended December 31, 2009
OR
[ ] TRANSITION REPORT PURSUANT TO SECTION 13 OR 15(d) OF THE SECURITIES
EXCHANGE ACT OF 1934
For the transition period from to
Commission File Number 001-33201
DCT INDUSTRIAL TRUST INC.
(Exact name of registrant as specified in its charter)
| Maryland | 82-0538520 | |
| (State or other jurisdiction of | (I.R.S. Employer | |
| incorporation or organization) | Identification No.) | |
| 518 17th Street, Suite 800 | ||
| Denver, Colorado | 80202 | |
| (Address of principal executive offices) | (Zip Code) | |
Registrant’s Telephone Number, Including Area Code: (303) 597-2400
Securities Registered Pursuant to Section 12(b) of the Act:
| Title of Each Class |
Name of Each Exchange on Which Registered | |
| Common Stock | New York Stock Exchange |
Securities Registered Pursuant to Section 12(g) of the Act: none
Indicate by check mark if the registrant is a well-known seasoned issuer, as defined by Rule 405 of the Securities Act. Yes [X] No [ ]
Indicate by check mark if the registrant is not required to file reports pursuant to Section 13 or Section 15(d) of the Act. Yes [ ] No [X]
Indicate by check mark whether the registrant (1) has filed all reports required to be filed by Section 13 or 15(d) of the Securities Exchange Act of 1934 during the preceding 12 months (or for such shorter period that the registrant was required to file such reports), and (2) has been subject to such filing requirements for the past 90 days. Yes [X] No [ ]
Indicate by check mark whether the registrant has submitted electronically and posted on its corporate Web site, if any, every Interactive Data File required to be submitted and posted pursuant to Rule 405 of Regulation S-T (§ 232.405 of this chapter) during the preceding 12 months (or for such shorter period that the registrant was required to submit and post such files). Yes [ ] No [ ]
Indicate by check mark if disclosure of delinquent filers pursuant to Item 405 of Regulation S-K is not contained herein, and will not be contained, to the best of registrant’s knowledge, in definitive proxy or information statements incorporated by reference in Part III of this Form 10-K or any amendment to this Form 10-K. [ ]
Indicate by check mark whether the registrant is a large accelerated filer, an accelerated filer, a non-accelerated filer, or a smaller reporting company. See the definitions of “large accelerated filer,” “accelerated filer” and “smaller reporting company” in Rule 12b-2 of the Exchange Act. (Check one):
| Large accelerated filer [X] |
Accelerated filer [ ] | |||
| Non-accelerated filer [ ] (do not check if smaller reporting company) |
Smaller reporting company [ ] | |||
Indicate by check mark whether the registrant is a shell company (as defined in Rule 12b-2 of the Act). Yes [ ] No [X]
As of June 30, 2009, the aggregate market value of the 203.8 million shares of voting and non-voting common stock held by non-affiliates of the registrant was $0.8 billion based on the closing sale price of $4.08 as reported on the New York Stock Exchange on June 30, 2009. (For this computation, the registrant has excluded the market value of all shares of Common Stock reported as beneficially owned by executive officers and directors of the registrant; such exclusion shall not be deemed to constitute an admission that any such person is an affiliate of the registrant.) As of February 17, 2010 there were 208,338,376 shares of Common Stock outstanding.
Documents Incorporated by Reference
Portions of the registrant’s definitive proxy statement to be issued in conjunction with the registrant’s annual meeting of stockholders to be held May 6, 2010 are incorporated by reference into Part III of this Annual Report.
Table of Contents
TABLE OF CONTENTS
ANNUAL REPORT ON FORM 10-K
For the Fiscal Year Ended December 31, 2009
| Page | ||||
| PART I | ||||
| Item 1. |
2 | |||
| Item 1A. |
6 | |||
| Item 1B. |
27 | |||
| Item 2. |
28 | |||
| Item 3. |
32 | |||
| Item 4. |
32 | |||
| PART II | ||||
| Item 5. |
33 | |||
| Item 6. |
36 | |||
| Item 7. |
Management’s Discussion and Analysis of Financial Condition and Results of Operations |
40 | ||
| Item 7A. |
63 | |||
| Item 8. |
64 | |||
| Item 9. |
Changes in and Disagreements with Accountants on Accounting and Financial Disclosure |
64 | ||
| Item 9A. |
64 | |||
| Item 9B. |
66 | |||
| PART III | ||||
| Item 10. |
67 | |||
| Item 11. |
67 | |||
| Item 12. |
Security Ownership of Certain Beneficial Owners and Management and Related Stockholder Matters |
67 | ||
| Item 13. |
Certain Relationships and Related Transactions, and Director Independence |
67 | ||
| Item 14. |
67 | |||
| PART IV | ||||
| Item 15. |
68 | |||
Table of Contents
FORWARD-LOOKING STATEMENTS
We make statements in this Annual Report on Form 10-K (“Annual Report”) that are considered “forward-looking statements” within the meaning of Section 27A of the Securities Act of 1933, as amended, or the Securities Act, and Section 21E of the Securities Exchange Act of 1934, as amended, or the Exchange Act, which are usually identified by the use of words such as “anticipates,” “believes,” “estimates,” “expects,” “intends,” “may,” “plans,” “projects,” “seeks,” “should,” “will,” and variations of such words or similar expressions. We intend these forward-looking statements to be covered by the safe harbor provisions for forward-looking statements contained in the Private Securities Litigation Reform Act of 1995 and are including this statement for purposes of complying with those safe harbor provisions. These forward-looking statements reflect our current views about our plans, intentions, expectations, strategies and prospects, which are based on the information currently available to us and on assumptions we have made. Although we believe that our plans, intentions, expectations, strategies and prospects as reflected in or suggested by those forward-looking statements are reasonable, we can give no assurance that the plans, intentions, expectations or strategies will be attained or achieved. Furthermore, actual results may differ materially from those described in the forward-looking statements and will be affected by a variety of risks and factors that are beyond our control including, without limitation:
| • | national, international, regional and local economic conditions, including, in particular, the current economic slow-down in the U.S. and internationally; |
| • | the general level of interest rates and the availability of capital, particularly in light of the recent disruption in the credit markets; |
| • | the competitive environment in which we operate; |
| • | real estate risks, including fluctuations in real estate values and the general economic climate in local markets and competition for tenants in such markets, particularly in light of the current economic slow-down in the U.S. and internationally; |
| • | decreased rental rates or increasing vacancy rates; |
| • | defaults on or non-renewal of leases by tenants; |
| • | acquisition and development risks, including failure of such acquisitions and development projects to perform in accordance with projections; |
| • | the timing of acquisitions and dispositions; |
| • | natural disasters such as fires, hurricanes and earthquakes; |
| • | energy costs; |
| • | the terms of governmental regulations that affect us and interpretations of those regulations, including changes in real estate and zoning laws and increases in real property tax rates; |
| • | financing risks, including the risk that our cash flows from operations may be insufficient to meet required payments of principal, interest and other commitments; |
| • | lack of or insufficient amounts of insurance; |
| • | litigation, including costs associated with prosecuting or defending claims and any adverse outcomes; |
| • | the consequences of future terrorist attacks; |
| • | possible environmental liabilities, including costs, fines or penalties that may be incurred due to necessary remediation of contamination of properties presently owned or previously owned by us; and |
| • | other risks and uncertainties detailed in the section entitled “Risk Factors”. |
In addition, our current and continuing qualification as a real estate investment trust, or REIT, involves the application of highly technical and complex provisions of the Internal Revenue Code of 1986, or the Code, and depends on our ability to meet the various requirements imposed by the Code through actual operating results, distribution levels and diversity of stock ownership. We assume no obligation to update publicly any forward-looking statements, whether as a result of new information, future events or otherwise. The reader should carefully review our financial statements and the notes thereto, as well as the section entitled “Risk Factors” in this Annual Report.
1
Table of Contents
| ITEM 1. | BUSINESS |
The Company
DCT Industrial Trust Inc. and subsidiaries (collectively, “DCT Industrial Trust,” “DCT,” “the Company,” “we,” “our” or “us”) is a leading industrial real estate company that owns, operates and develops high-quality bulk distribution and light industrial properties in high-volume distribution markets in the U.S. and Mexico. We were formed as a Maryland corporation in April 2002 and have elected to be treated as a real estate investment trust (“REIT”) for United States (“U.S.”) federal income tax purposes commencing with our taxable year ended December 31, 2003. We are structured as an umbrella partnership REIT under which substantially all of our current and future business is, and will be, conducted through a majority owned and controlled subsidiary, DCT Industrial Operating Partnership LP (our “operating partnership”), a Delaware limited partnership, for which DCT Industrial Trust Inc. is the sole general partner. The Company owns interests in or manages approximately 75.4 million square feet of assets leased to approximately 810 customers, including 14.6 million square feet managed on behalf of three institutional joint venture partners, and has 6.6 million square feet under development.
Available Information
Our Annual Report on Form 10-K, our Quarterly Reports on Form 10-Q, our Current Reports on Form 8-K and any amendments to any of those reports that we file with the Securities and Exchange Commission are available free of charge as soon as reasonably practicable through our website at www.dctindustrial.com. The information contained on our website is not incorporated into this Annual Report. Our Common Stock is listed on the New York Stock Exchange under the symbol “DCT”.
Business Overview
Our portfolio primarily consists of high-quality, generic bulk distribution warehouses and light industrial properties. The properties we target for acquisition or development are generally characterized by convenient access to major transportation arteries, proximity to densely populated markets and quality design standards that allow for reconfiguration of space. In the future, we intend to continue to focus on properties that exhibit these characteristics in U.S. markets as well as Mexico, where we believe we can achieve favorable returns and leverage our expertise. We seek long-term earnings growth primarily through increasing rents and operating income at existing properties and acquiring and developing high-quality properties located in major distribution markets, although we expect near term business results to be negatively impacted by the decreased economic activity. In addition, we may recycle our capital by selling assets, contributing assets to joint ventures, funds or other commingled investment vehicles with institutional partners, and reinvesting the capital in select markets.
As of December 31, 2009, we owned interests in, managed, or had under development 450 industrial real estate buildings comprised of approximately 75.4 million square feet. Our portfolio of consolidated operating properties consisted of 375 industrial real estate buildings, including 220 bulk distribution properties, 113 light industrial properties and 42 service center properties. In total, it was comprised of approximately 52.9 million square feet in total and was 87.6% occupied as of December 31, 2009. We also consolidated 15 development properties and four redevelopment properties as of December 31, 2009. In addition, as of December 31, 2009, we had ownership interests ranging from 4% to 20% in unconsolidated institutional capital management joint ventures, or funds, that owned 45 properties comprised of approximately 14.1 million square feet, and investments in other joint ventures owning two unconsolidated operating properties and eight unconsolidated development properties.
During the year ended December 31, 2009, we acquired three development properties comprised of 0.4 million square feet located in Monterrey, Mexico, and two parcels of land comprised of 12.3 acres for a total cost of approximately $13.6 million including acquisition costs.
2
Table of Contents
During the year ended December 31, 2009, we also acquired the third-party equity interests of three of our previously unconsolidated joint ventures such that as of December 31, 2009, we wholly owned each venture with an aggregate gross book value of $60.8 million in real estate assets. In conjunction with these acquisitions, we recorded $10.3 million in losses from business combinations and $60.7 million in consolidated debt which was subsequently repaid in full as of December 31, 2009.
During the year ended December 31, 2009, we sold three operating properties comprised of approximately 0.9 million square feet and two land parcels comprised of approximately 4.3 acres to unrelated third parties for total gross proceeds of approximately $30.7 million, which resulted in a gain of approximately $0.9 million.
As of December 31, 2009, our consolidated portfolio included seven consolidated development projects comprised of 3.2 million square feet and 15 buildings, of which 13 were bulk distribution properties and two were light industrial, located in Dulles, VA, Cincinnati, OH, Memphis, TN, Orlando, FL, Riverside, CA and Monterrey, Mexico. Our unconsolidated portfolio included two unconsolidated development projects, one comprised of 1.9 million square feet and 4 bulk distribution buildings, located in Nashville, TN, Chicago, IL, Stockton, CA, and Savannah, GA and our SCLA joint venture discussed below. As of December 31, 2009, all buildings associated with our consolidated and unconsolidated development projects were shell-complete. For information related to our unconsolidated development joint ventures, see “Notes to Consolidated Financial Statements, Note 4—Investments in and Advances to Unconsolidated Joint Ventures.”
As of December 31, 2009, our consolidated and unconsolidated portfolios included approximately 366 acres of land which we believe can support the development of approximately six million square feet. Not included in the 366 acres is the land associated with the master development rights held by our unconsolidated joint venture, referred to as the SCLA joint venture, of over 4,000 acres. This land is entitled for industrial development, surrounding the Southern California Logistics Airport (“SCLA”) located in the Inland Empire submarket of Southern California. Phase I of this project, representing approximately 356 acres acquired in 2006, is expected to support up to 6.3 million square feet of development. During the year ended December 31, 2009, the SCLA joint venture sold 53.4 acres of land. As of December 31, 2009, the SCLA joint venture had four buildings that were shell-complete comprised of 1.5 million square feet of which 0.3 million square feet were leased, and two operating buildings comprised of 0.5 million square feet which were fully leased. As of December 31, 2009, the SCLA joint venture owned $83.8 million in real estate assets with $58.8 million in debt.
We have a stable, broadly diversified tenant base. As of December 31, 2009, our consolidated operating properties had leases with approximately 720 customers with no single customer accounting for more than 1.9% of the total annualized base rents for these properties. Our 10 largest customers occupy 15.2% of the leased consolidated and unconsolidated operating properties based on occupied square feet and account for 12.6% of the annualized base rent for these properties. We intend to maintain a well-diversified mix of tenants to limit our exposure to any single tenant or industry. We believe that our broad national presence in the top U.S. distribution markets provides geographic diversity and is attractive to users of distribution space which allows us to build strong relationships with our tenants. Furthermore, we are actively engaged in meeting our tenants’ expansion, consolidation and relocation requirements.
Our primary business objectives are to maximize long-term growth in earnings and Funds From Operations, or FFO (see definition in “Selected Financial Data”), and to maximize the value of our portfolio and the total return to our stockholders.
Our principal executive office is located at 518 Seventeenth Street, Suite 800, Denver, Colorado 80202; our telephone number is (303) 597-2400. We also maintain regional offices in Atlanta, Georgia; Cincinnati, Ohio; northern New Jersey; Dallas, Texas; and Orlando, Florida. Our website address is www.dctindustrial.com.
3
Table of Contents
Business Strategy
Our primary business objectives are to maximize long-term growth in earnings and FFO, and to maximize the value of our portfolio and the total return to our stockholders. The strategies we intend to execute to achieve these objectives include:
| • | Maximizing Cash Flows From Existing Properties. We intend to maximize the cash flows from our existing properties by active leasing and management, maintaining strong customer relationships, controlling operating expenses and physically maintaining the quality of our properties. Reflecting the decline in economic conditions and real estate markets, operating results for the year ended December 31, 2009, included year end occupancy of 87.6%, tenant retention of 71.5% related to expiring leases and a 1.2% decline in rents on signed leases. Further, cash provided by operating activities decreased to $109.7 million in 2009 from $128.3 million in 2008. Renewing tenants, leasing space and effectively managing expenses are critical in the current market environment and are the day to day focus of our operations team. In response to market conditions, we have increased the number of leasing personnel in our market offices to make sure we are responding to each and every opportunity quickly and successfully while cultivating deeper tenant relationships. |
| • | Effectively Deploying Capital. We will seek to acquire properties that meet our asset, location and financial criteria at prices and potential returns which we believe are attractive. |
| • | Managing Our Development Pipeline. In anticipation of the deteriorating market for industrial space, we ceased entering into new development commitments early in 2008, and have remained focused on leasing the existing pipeline of properties under development. During the year, we signed 1.3 million square feet of leases in our development pipeline. |
As markets permit, we will consider developing new buildings where we believe the risk-adjusted returns represent an attractive investment in order to capitalize upon our customer and market relationships. However, given current market conditions, we do not anticipate starting any speculative developments for the foreseeable future.
We continued to make progress at SCLA, our development joint venture located in the Inland Empire market of Southern California, where our joint venture controls the master development rights to more than 4,000 acres of land. During the year ended December 31, 2009, the SCLA joint venture sold 53.4 acres of land. As of December 31, 2009, the venture had four buildings that were shell-complete comprised of 1.5 million square feet of which 0.3 million square feet were leased. As of December 31, 2009, the venture also had two operating buildings comprised of 0.5 million square feet which were fully leased, and owned $83.8 million in total real estate assets with $58.8 million in debt.
| • | Recycling Capital. We intend to selectively dispose of assets in order to maximize total return to our stockholders by redeploying proceeds from asset sales into new acquisition and development opportunities. Important to managing our balance sheet as well as increasing our overall return on assets is the on-going effort to sell non-strategic assets for redeployment into new, higher growth opportunities. During 2009, we sold $30.7 million of assets in five transactions for a gain of $0.9 million. Given our solid balance sheet, strong team of real estate professionals and excellent relationships with investors and brokers, we believe we are well positioned to identify and take advantage of those opportunities. |
| • | Conservatively Managing Our Balance Sheet. We plan to maintain financial metrics including leverage and coverage ratios to be consistent with our investment grade peers. This strategy has provided protection from turmoil in the capital markets during the economic downturn and should keep us well positioned to finance acquisition opportunities which may arise. In addition, we believe that a conservatively managed balance sheet provides a competitive long-term cost of capital by lowering borrowing costs over time. |
4
Table of Contents
Our Competitive Strengths
We believe that we distinguish ourselves from other owners, operators, acquirers and developers of industrial properties. Although our business strategy reflects current market conditions, we believe our long-term success is supported through the following competitive strengths:
| • | High-Quality Industrial Property Portfolio. Our portfolio of industrial properties primarily consists of high-quality bulk distribution facilities specifically designed to meet the needs of distribution and supply companies. As of December 31, 2009, approximately 89% of our consolidated operating portfolio based on square footage was comprised of bulk distribution properties while approximately 9% of our portfolio was comprised of light industrial properties. The majority of our properties are specifically designed for use by major distribution users and are readily divisible to meet re-tenanting opportunities. We believe that our concentration of high-quality bulk distribution properties provides us with a competitive advantage in attracting and retaining distribution users and tenants across the markets in which we operate. |
| • | Experienced and Committed Management Team. Our executive management team collectively has an average of nearly 19 years commercial real estate experience and an average of over 10 years focused on the industrial real estate sector. Additionally, our executive management team has extensive public company operating experience with all of our senior executives having held senior positions at publicly-traded REITs for an average of over 10 years. |
| • | Strong Operating Platform. We have a team of 46 experienced transaction and property management professionals working in seven market offices to effectively maximize market opportunities through leveraging local expertise, presence and relationships. We believe successfully meeting the needs of our customers and anticipating and responding to market opportunities will result in achieving superior returns from our properties. |
| • | Proven Acquisition and Disposition Capabilities. Beginning with our first acquisition in June 2003, we have completed approximately $3.4 billion in industrial real estate acquisitions as of December 31, 2009. Excluding our three major portfolio acquisitions that were each in excess of $200 million, our average acquisition transaction cost was approximately $21.2 million demonstrating our ability to access a pipeline of smaller acquisitions. Further, consistent with our capital recycling strategy, we have disposed of a cumulative $811.9 million of real estate investments since inception. Our ability to source and sell real estate is driven by the experience of our transaction personnel and our extensive network of industry relationships within the brokerage, development and investor communities. |
| • | Access to Institutional Co-Investment Capital. DCT has established five joint ventures with three institutional capital partners and our senior management team has broad long-term relationships within the institutional investor community that provide access to capital for both traditional joint ventures and funds or other commingled investment vehicles. These institutions include domestic pension plans, insurance companies, private trusts and international investors. We believe these relationships allow us to identify sources of institutional demand and appropriately match institutional capital with investment opportunities in our target markets to maximize returns for our stockholders. |
| • | Strong Industry Relationships. We believe that our extensive network of industry relationships with the brokerage, development and investor communities will allow us to execute successfully our acquisition and development growth strategies and our institutional capital management strategy. These relationships augment our ability to source acquisitions in off-market transactions outside of competitive marketing processes, capitalize on development opportunities and capture repeat business and transaction activity. Our strong relationships with the tenant and leasing brokerage communities aids in attracting and retaining tenants. |
| • | Capital Structure. Our capital structure and business plan provides us with sufficient financial capacity to fund future growth. As of December 31, 2009 we had $300.0 million available under our senior unsecured revolving credit facility and 236 of our operating properties with a gross book value of $1.7 billion were unencumbered. |
5
Table of Contents
Operating Segments
We consider each operating property to be an individual operating segment that has similar economic characteristics with all of our other operating properties. Our operating segments are aggregated into reportable segments based upon the property type: bulk distribution; and light industrial and other. See additional information in Item 2. Properties and in Item 7. Management’s Discussion and Analysis of Financial Condition and Results of Operations and “Notes to Consolidated Financial Statements, Note 15—Segment Information.”
Competition
We believe the current market for industrial real estate acquisitions to be extremely competitive. We compete for real property investments with pension funds and their advisors, bank and insurance company investment accounts, other real estate investment companies, real estate limited partnerships, individuals and other entities engaged in real estate investment activities, some of which have greater financial resources than we do. In addition, we believe the leasing of real estate to be highly competitive. We experience competition for customers from owners and managers of competing properties. As a result, we may have to provide free rental periods, incur charges for tenant improvements or offer other inducements, all of which may have an adverse impact on our results of operations.
Employees
As of December 31, 2009, we had 87 full-time employees.
| ITEM 1A. | RISK FACTORS |
RISKS RELATED TO RECENT ECONOMIC CONDITIONS
Adverse economic conditions will negatively affect our returns and profitability.
Our operating results may be affected by market and economic challenges, including the current global economic credit environment, which may result from a continued or exacerbated general economic slow down experienced by the nation as a whole or by the local economies where our properties are located, or by the real estate industry, including the following:
| • | poor economic conditions may result in tenant defaults under leases; |
| • | re-leasing may require concessions or reduced rental rates under the new leases due to reduced demand; |
| • | adverse capital and credit market conditions may restrict our development and redevelopment activities; and |
| • | constricted access to credit may result in tenant defaults, non-renewals under leases or inability of potential buyers to acquire our properties held for sale, including properties held through joint ventures. |
Also, to the extent we purchase real estate in an unstable market, we are subject to the risk that if the real estate market ceases to attract the same level of capital investment in the future that it attracts at the time of our purchases, or the number of companies seeking to acquire properties decreases, the value of our investments may not appreciate or may decrease significantly below the amount we pay for these investments. The length and severity of any economic slow down or downturn cannot be predicted. Our operations could be negatively affected to the extent that an economic slow down or downturn is prolonged or becomes more severe.
Dislocations in the credit markets and real estate markets could have a material adverse effect on our results of operations, financial condition and ability to pay distributions to you.
Domestic and international financial markets continue to experience significant dislocations. These dislocations have impacted the availability of credit and have contributed to rising costs associated with obtaining credit. If debt financing is not available on terms and conditions we find acceptable, we may not be able to obtain financing for investments. If this dislocation in the credit markets persists, our ability to borrow monies to
6
Table of Contents
finance the purchase of, or other activities related to, real estate assets will be negatively impacted. If we are unable to borrow monies on terms and conditions that we find acceptable, we likely will have to reduce the number of properties we can purchase, and the return on the properties we do purchase may be lower. If interest rates are higher when the properties are refinanced, we may not be able to finance the properties and our income could be reduced. In addition, if we pay fees to lock-in a favorable interest rate, falling interest rates or other factors could require us to forfeit these fees. Also, if the value of our properties decline we may we may be unable to refinance all of our debt as it matures. All of these events would have a material adverse effect on our results of operations, financial condition and ability to pay distributions.
The failure of any banking institution in which we deposit our funds, any lender under any of our lines of credit or any counterparty to our derivative financial instruments could have a material adverse effect on our results of operations, financial condition and ability to pay distributions to you.
Currently, the Federal Deposit Insurance Corporation, or FDIC, generally, only insures amounts up to $250,000 per depositor per insured bank, which amount is scheduled to be reduced to $100,000 after December 31, 2013. The FDIC does provide full deposit insurance coverage for non-interest bearing transaction accounts with participating institutions, regardless of dollar amount, through June 30, 2010, but we generally do not hold our cash and cash equivalents in such accounts. We currently have and expect to continue to have cash and cash equivalents deposited in certain banking institutions in excess of federally insured levels. Currently, our cash and cash equivalents are deposited primarily with US Bank and AAA-rated money market accounts, and we may deposit funds in other banking institutions in the future. If any of the banking institutions in which we have deposited funds ultimately fails, we may lose the amount of our deposits over the then current FDIC insurance limit. The loss of our deposits could reduce the amount of cash we have available to distribute or invest and could result in a decline in the value of your investment.
There are currently twelve lenders under our $300.0 million line of credit. If any of the lenders under any of our lines of credit fail, we may be unable to obtain or replace on favorable terms, or at all, the financing commitment of the failed lender. This could adversely affect our liquidity and, as a result, negatively impact our company in a number of ways. Additionally, we use various derivative financial instruments to hedge our exposure to movements in market interest rates. Our counterparties to these instruments are typically commercial or investment banks or their affiliates or the financial services subsidiaries of large insurance companies. If any of our counterparties fail or are unable to perform under these instruments, we may not realize the benefits of these instruments and the risk to us of fluctuations in future interest rates may increase. We may be unable to recover any amounts owed to us by these counterparties.
RISKS RELATED TO OUR BUSINESS AND OPERATIONS
Our investments are concentrated in the industrial real estate sector, and our business would be adversely affected by an economic downturn in that sector.
Our investments in real estate assets are primarily concentrated in the industrial real estate sector. This concentration may expose us to the risk of economic downturns in this sector to a greater extent than if our business activities included a more significant portion of other sectors of the real estate industry.
We depend on key personnel.
Our success depends to a significant degree upon the continued contributions of certain key personnel including, but not limited to, our management group, each of whom would be difficult to replace. If any of our key personnel were to cease employment with us, our operating results could suffer. Our ability to retain our management group or to attract suitable replacements should any member of the management group leave is dependent on the competitive nature of the employment market. The loss of services from key members of the management group or a limitation in their availability could adversely impact our financial condition and cash flows. Further, such a loss could be negatively perceived in the capital markets. We have not obtained and do not expect to obtain key man life insurance on any of our key personnel.
7
Table of Contents
We also believe that, as we expand, our future success depends, in large part, upon our ability to hire and retain highly skilled managerial, investment, financing, operational and marketing personnel. Competition for such personnel is intense, and we cannot assure our stockholders that we will be successful in attracting and retaining such skilled personnel.
Our operating results and financial condition could be adversely affected if we do not continue to have access to capital on favorable terms.
As a REIT, we must meet certain annual distribution requirements. Consequently, we are largely dependent on external capital to fund our development and acquisition activities. Further, in order to maintain our REIT status and avoid the payment of income and excise taxes, we may need to borrow funds on a short-term basis to meet the REIT distribution requirements even if the then-prevailing market conditions are not favorable for these borrowings. These short-term borrowing needs could result from differences in timing between the actual receipt of cash and inclusion of income for U.S. federal income tax purposes or the effect of non-deductible capital expenditures, the creation of reserves or required debt or amortization payments. Alternatively, under recent IRS guidance that is effective through 2011, we may elect to distribute taxable dividends that are up to 90% payable in the form of our commons stock (with the remainder payable in cash). In this event, shareholders will be required to include the full amount of the dividends in income, and shareholder’s tax liability could exceed the cash portion of their dividend. Additionally, our ability to access capital is dependent upon a number of factors, including general market conditions and competition from other real estate companies. To the extent that capital is not available to acquire or develop properties, profits may not be realized or their realization may be delayed, which could result in an earnings stream that is less predictable than some of our competitors and result in us not meeting our projected earnings and distributable cash flow levels in a particular reporting period. Failure to meet our projected earnings and distributable cash flow levels in a particular reporting period could have an adverse effect on our financial condition and on the market price of our common stock.
Our long-term growth will partially depend upon future acquisitions of properties, and we may be unable to consummate acquisitions on advantageous terms or acquisitions may not perform as we expect.
We acquire and intend to continue to acquire primarily high-quality generic bulk distribution warehouses and light industrial properties. The acquisition of properties entails various risks, including the risks that our investments may not perform as we expect, that we may be unable to quickly and efficiently integrate our new acquisitions into our existing operations and that our cost estimates for bringing an acquired property up to market standards may prove inaccurate. Further, we face significant competition for attractive investment opportunities from other well-capitalized real estate investors, including both publicly-traded REITs and private institutional investment funds, and these competitors may have greater financial resources than us and a greater ability to borrow funds to acquire properties. This competition increases as investments in real estate become increasingly attractive relative to other forms of investment. As a result of competition, we may be unable to acquire additional properties as we desire or the purchase price may be significantly elevated. In addition, we expect to finance future acquisitions through a combination of borrowings under our senior unsecured credit facility, proceeds from equity or debt offerings by us or our operating partnership or its subsidiaries and proceeds from property contributions and divestitures which may not be available and which could adversely affect our cash flows. Any of the above risks could adversely affect our financial condition, results of operations, cash flows and ability to pay distributions on, and the market price of, our common stock.
We may be unable to source off-market deal flow in the future.
A key component of our growth strategy is to continue to acquire additional industrial real estate assets. Properties that are acquired off-market are typically more attractive to us as a purchaser because of the absence of a formal sales process, which could lead to higher prices. If we cannot obtain off-market deal flow in the future, our ability to locate and acquire additional properties at attractive prices could be adversely affected.
8
Table of Contents
Our real estate development strategies may not be successful.
We are involved in the construction and expansion of distribution facilities and we intend to continue to pursue development and renovation activities as opportunities arise. In addition, we have entered into joint ventures to develop, or will self-develop, additional warehouse/distribution buildings on land we already own or control, and we have rights under master development agreements to acquire additional acres of land for future development activities. We will be subject to risks associated with our development and renovation activities that could adversely affect our financial condition, results of operations, cash flows and ability to pay distributions on, and the market price of, our common stock, including, but not limited to:
| • | the risk that development projects in which we have invested may be abandoned and the related investment will be impaired; |
| • | the risk that we may not be able to obtain, or may experience delays in obtaining, all necessary zoning, land-use, building, occupancy and other governmental permits and authorizations; |
| • | the risk that we may not be able to obtain additional land on which to develop; |
| • | the risk that we may not be able to obtain financing for development projects on favorable terms; |
| • | the risk that construction costs of a project may exceed the original estimates or that construction may not be concluded on schedule, making the project less profitable than originally estimated or not profitable at all (including the possibility of contract default, the effects of local weather conditions, the possibility of local or national strikes and the possibility of shortages in materials, building supplies or energy and fuel for equipment); |
| • | the risk that, upon completion of construction, we may not be able to obtain, or obtain on advantageous terms, permanent financing for activities that we have financed through construction loans; and |
| • | the risk that occupancy levels and the rents that can be charged for a completed project will not be met, making the project unprofitable. |
Our institutional capital management strategy of contributing properties to joint ventures we manage may not allow us to expand our business and operations as quickly or as profitably as we desire.
In general, our ability to contribute properties to joint ventures that are part of our institutional capital management program on advantageous terms will be dependent upon competition from other managers of similar joint ventures, current capital market conditions, including the yield expectations for industrial properties, and other factors beyond our control. Our ability to develop and timely lease properties will impact our ability to contribute these properties. Continued access to private and public debt and equity capital by these joint ventures is necessary in order for us to pursue our strategy of contributing properties to the joint ventures. Should we not have sufficient properties available that meet the investment criteria of current or future joint ventures, or should the joint ventures have limited or no access to capital on favorable terms, then these contributions could be delayed resulting in adverse effects on our liquidity and on our ability to meet projected earnings levels in a particular reporting period. Failure to meet our projected earnings levels in a particular reporting period could have an adverse effect on our results of operations, distributable cash flows and on the value of our common stock. Further, our inability to redeploy the proceeds from our divestitures in accordance with our investment strategy could have an adverse effect on our results of operations, distributable cash flows, and our ability to meet our debt obligations in a timely manner and the value of our common stock in subsequent periods.
9
Table of Contents
Actions of our joint venture partners could negatively impact our performance.
Our organizational documents do not limit the amount of available funds that we may invest in partnerships, limited liability companies or joint ventures, and we intend to continue to develop and acquire properties through joint ventures, limited liability companies and partnerships with other persons or entities when warranted by the circumstances. Such partners may share certain approval rights over major decisions. Such investments may involve risks not otherwise present with other methods of investment in real estate, including, but not limited to:
| • | that our co-member, co-venturer or partner in an investment might become bankrupt, which would mean that we and any other remaining general partners, members or co-venturers would generally remain liable for the partnership’s, limited liability company’s or joint venture’s liabilities; |
| • | that such co-member, co-venturer or partner may at any time have economic or business interests or goals which are or which become inconsistent with our business interests or goals; |
| • | that such co-member, co-venturer or partner may be in a position to take action contrary to our instructions or requests or contrary to our policies or objectives, including our current policy with respect to maintaining our qualification as a REIT; |
| • | that, if our partners fail to fund their share of any required capital contributions, we may be required to contribute such capital; |
| • | that joint venture, limited liability company and partnership agreements often restrict the transfer of a co-venturer’s, member’s or partner’s interest or may otherwise restrict our ability to sell the interest when we desire or on advantageous terms; |
| • | that our relationships with our partners, co-members or co-venturers are contractual in nature and may be terminated or dissolved under the terms of the agreements and, in such event, we may not continue to own or operate the interests or assets underlying such relationship or may need to purchase such interests or assets at an above-market price to continue ownership; |
| • | that disputes between us and our partners, co-members or co-venturers may result in litigation or arbitration that would increase our expenses and prevent our officers and directors from focusing their time and effort on our business and result in subjecting the properties owned by the applicable partnership, limited liability company or joint venture to additional risk; and |
| • | that we may in certain circumstances be liable for the actions of our partners, co-members or co-venturers. |
We generally seek to maintain sufficient control of our partnerships, limited liability companies and joint ventures to permit us to achieve our business objectives; however, we may not be able to do so, and the occurrence of one or more of the events described above could adversely affect our financial condition, results of operations, cash flows and ability to pay distributions on, and the market price of, our common stock.
If we invest in a limited partnership as a general partner we could be responsible for all liabilities of such partnership.
In some joint ventures or other investments we may make, if the entity in which we invest is a limited partnership, we may acquire all or a portion of our interest in such partnership as a general partner. As a general partner, we could be liable for all the liabilities of such partnership. Additionally, we may be required to take our interests in other investments as a non-managing general partner. Consequently, we would be potentially liable for all such liabilities without having the same rights of management or control over the operation of the partnership as the managing general partner or partners may have. Therefore, we may be held responsible for all of the liabilities of an entity in which we do not have full management rights or control, and our liability may far exceed the amount or value of the investment we initially made or then had in the partnership.
10
Table of Contents
Investment in us may be subject to additional risks relating to our international investments.
We have expanded our operations into markets in Mexico and may expand our operations into additional selected international markets in the future. Our foreign operations could be affected by factors peculiar to the laws and business practices of the jurisdictions in which the properties are located. These laws may expose us to risks that are different from and in addition to those commonly found in the United States. Foreign operations could be subject to the following risks:
| • | changing governmental rules and policies, including changes in land use and zoning laws; |
| • | enactment of laws relating to the foreign ownership of real property or mortgages and laws restricting the ability of foreign persons or companies to remove profits earned from activities within the country to the person’s or company’s country of origin; |
| • | variations in currency exchange rates; |
| • | adverse market conditions caused by terrorism, civil unrest and changes in national or local governmental or economic conditions; |
| • | the willingness of domestic or foreign lenders to make mortgage loans in certain countries and changes in the availability, cost and terms of mortgage funds resulting from varying national economic policies; |
| • | the imposition of income and other taxes in those jurisdictions and changes in real estate and other tax rates and other operating expenses in particular countries; |
| • | general political and economic instability; |
| • | our limited experience and expertise in foreign countries relative to our experience and expertise in the United States; and |
| • | more stringent environmental laws or changes in such laws, or environmental consequences of less stringent environmental management practices in foreign countries relative to the United States. |
The availability and timing of cash distributions is uncertain.
We expect to continue to pay quarterly distributions to our stockholders. However, we bear all expenses incurred by our operations, and our funds generated by operations, after deducting these expenses, may not be sufficient to cover desired levels of distributions to our stockholders. In addition, our board of directors, in its discretion, may retain any portion of such cash for working capital. We cannot assure our stockholders that sufficient funds will be available to pay distributions.
We may have difficulty funding our distributions with our available cash flows.
To date we have funded our quarterly distributions to investors with available cash flows and, to a lesser extent, with borrowings under our senior credit facility and other borrowings. Our corporate strategy is to fund the payment of quarterly distributions to our stockholders entirely from available cash flows. However, we may continue to fund our quarterly distributions to investors from a combination of available cash flows and proceeds from borrowings. In the event we are unable to consistently fund future quarterly distributions to investors entirely from available cash flows, net of recurring capital expenditures, the value of our shares may be negatively impacted.
Adverse economic and geopolitical conditions could negatively affect our returns and profitability.
Among others, the following market and economic challenges may adversely affect our operating results:
| • | poor economic times may result in tenant defaults under our leases and reduced demand for industrial space; |
| • | overbuilding may increase vacancies; and |
| • | maintaining occupancy levels may require increased concessions, tenant improvement expenditures or reduced rental rates. |
11
Table of Contents
Our operations could be negatively affected to the extent that an economic downturn is prolonged or becomes more severe.
Events or occurrences that affect areas in which our properties are geographically concentrated may impact financial results.
In addition to general, regional, national and international economic conditions, our operating performance is impacted by the economic conditions of the specific markets in which we have concentrations of properties. We have significant holdings in the following markets of our consolidated portfolio: Atlanta, Cincinnati, Columbus, Dallas and Memphis. Our operating performance could be adversely affected if conditions become less favorable in any of the markets in which we have a concentration of properties.
Our business could be adversely impacted if we have deficiencies in our disclosure controls and procedures or internal control over financial reporting.
The design and effectiveness of our disclosure controls and procedures and internal control over financial reporting may not prevent all errors, misstatements or misrepresentations. While management will continue to review the effectiveness of our disclosure controls and procedures and internal control over financial reporting, there can be no guarantee that our internal control over financial reporting will be effective in accomplishing all control objectives all of the time. Deficiencies, including any material weakness, in our internal control over financial reporting which may occur in the future could result in misstatements of our results of operations, restatements of our financial statements, a decline in our stock price, or otherwise materially adversely affect our business, reputation, results of operations, financial condition or liquidity.
RISKS RELATED TO CONFLICTS OF INTEREST
Our UPREIT structure may result in potential conflicts of interest.
As of December 31, 2009, we owned 88% of the units of limited partnership interest in our operating partnership, or OP Units, certain unaffiliated limited partners owned 9% of the OP Units and certain of our officers and directors, owned the remaining 3% of the OP Units. Persons holding OP Units in our operating partnership have the right to vote on certain amendments to the limited partnership agreement of our operating partnership, as well as on certain other matters. Persons holding such voting rights may exercise them in a manner that conflicts with the interests of our stockholders. Furthermore, circumstances may arise in the future when the interest of limited partners in our operating partnership may conflict with the interests of our stockholders. For example, the timing and terms of dispositions of properties held by our operating partnership may result in tax consequences to certain limited partners and not to our stockholders.
GENERAL REAL ESTATE RISKS
Our performance and value are subject to general economic conditions and risks associated with our real estate assets.
The investment returns available from equity investments in real estate depend on the amount of income earned and capital appreciation generated by the properties, as well as the expenses incurred in connection with the properties. If our properties do not generate income sufficient to meet operating expenses, including debt service and capital expenditures, then our ability to pay distributions to our stockholders could be adversely affected. In addition, there are significant expenditures associated with an investment in real estate (such as mortgage payments, real estate taxes and maintenance costs) that generally do not decline when circumstances reduce the income from the property. Income from and the value of our properties may be adversely affected by:
| • | changes in general or local economic climate; |
| • | the attractiveness of our properties to potential tenants; |
| • | changes in supply of or demand for similar or competing properties in an area; |
12
Table of Contents
| • | bankruptcies, financial difficulties or lease defaults by our tenants; |
| • | changes in interest rates and availability of permanent mortgage funds that may render the sale of a property difficult or unattractive or otherwise reduce returns to stockholders; |
| • | changes in operating costs and expenses and our ability to control rents; |
| • | changes in or increased costs of compliance with governmental rules, regulations and fiscal policies, including changes in tax, real estate, environmental and zoning laws, and our potential liability thereunder; |
| • | our ability to provide adequate maintenance and insurance; |
| • | changes in the cost or availability of insurance, including coverage for mold or asbestos; |
| • | unanticipated changes in costs associated with known adverse environmental conditions or retained liabilities for such conditions; |
| • | periods of high interest rates and tight money supply; |
| • | tenant turnover; |
| • | general overbuilding or excess supply in the market area; and |
| • | disruptions in the global supply chain caused by political, regulatory or other factors including terrorism. |
In addition, periods of economic slowdown or recession, rising interest rates or declining demand for real estate, or public perception that any of these events may occur, would result in a general decrease in rents or an increased occurrence of defaults under existing leases, which would adversely affect our financial condition and results of operations. Future terrorist attacks may result in declining economic activity, which could reduce the demand for, and the value of, our properties. To the extent that future attacks impact our tenants, their businesses similarly could be adversely affected, including their ability to continue to honor their existing leases.
For these and other reasons, we cannot assure our stockholders that we will be profitable or that we will realize growth in the value of our real estate properties.
Actions by our competitors may decrease or prevent increases in the occupancy and rental rates of our properties.
We compete with other developers, owners and operators of real estate, some of which own properties similar to ours in the same markets and submarkets in which our properties are located. If our competitors offer space at rental rates below current market rates or below the rental rates we currently charge our tenants, we may lose potential tenants, and we may be pressured to reduce our rental rates below those we currently charge in order to retain tenants when our tenants’ leases expire. As a result, our financial condition, cash flows, cash available for distribution, trading price of our common stock and ability to satisfy our debt service obligations could be materially adversely affected.
We are dependent on tenants for our revenues.
Our operating results and distributable cash flows would be adversely affected if a significant number of our tenants were unable to meet their lease obligations. In addition, certain of our properties are occupied by a single tenant. As a result, the success of those properties will depend on the financial stability of a single tenant. Lease payment defaults by tenants could cause us to reduce the amount of distributions to stockholders. A default by a tenant on its lease payments could force us to find an alternative source of revenues to pay any mortgage loan on the property. In the event of a tenant default, we may experience delays in enforcing our rights as landlord and may incur substantial costs, including litigation and related expenses, in protecting our investment and re-leasing our property. If a lease is terminated, we may be unable to lease the property for the rent previously received or sell the property without incurring a loss.
13
Table of Contents
Our ability to renew leases or re-lease space on favorable terms as leases expire significantly affects our business.
Our results of operations, distributable cash flows and the value of our common stock would be adversely affected if we are unable to lease, on economically favorable terms, a significant amount of space in our operating properties. The number of vacant or partially vacant industrial properties in a market or submarket could adversely affect both our ability to re-lease the space and the rental rates that can be obtained.
A property that incurs a vacancy could be difficult to sell or re-lease.
A property may incur a vacancy either by the continued default of a tenant under its lease or the expiration of one of our leases. In addition, certain of the properties we acquire may have some level of vacancy at the time of closing. Certain of our properties may be specifically suited to the particular needs of a tenant. We may have difficulty obtaining a new tenant for any vacant space we have in our properties. If the vacancy continues for a long period of time, we may suffer reduced revenues resulting in less cash available to be distributed to stockholders. In addition, the resale value of a property could be diminished because the market value of a particular property will depend principally upon the value of the leases of such property.
We may not have funding for future tenant improvements.
When a tenant at one of our properties does not renew its lease or otherwise vacates its space in one of our buildings, it is likely that, in order to attract one or more new tenants, we will be required to expend funds to construct new tenant improvements in the vacated space. Although we intend to manage our cash position or financing availability to pay for any improvements required for re-leasing, we cannot assure our stockholders that we will have adequate sources of funding available to us for such purposes in the future.
If our tenants are highly leveraged, they may have a higher possibility of filing for bankruptcy or insolvency.
Of our tenants that experience downturns in their operating results due to adverse changes to their business or economic conditions, those that are highly leveraged may have a higher possibility of filing for bankruptcy or insolvency. In bankruptcy or insolvency, a tenant may have the option of vacating a property instead of paying rent. Until such a property is released from bankruptcy, our revenues would be reduced and could cause us to reduce distributions to stockholders. We may have highly leveraged tenants in the future.
The fact that real estate investments are not as liquid as other types of assets may reduce economic returns to investors.
Real estate investments are not as liquid as other types of investments, and this lack of liquidity may limit our ability to react promptly to changes in economic or other conditions. In addition, significant expenditures associated with real estate investments, such as mortgage payments, real estate taxes and maintenance costs, are generally not reduced when circumstances cause a reduction in income from the investments. In addition, our ability at any time to sell assets or contribute assets to property funds or other entities in which we have an ownership interest may be restricted by the potential for the imposition of the 100% “prohibited transactions” tax on gains from certain dispositions of property by REIT’s, unless a safe harbor exception applies. This lack of liquidity may limit our ability to vary our portfolio promptly in response to changes in economic or other conditions and, as a result, could adversely affect our financial condition, results of operations, cash flows and our ability to pay distributions on, and the market price of, our common stock.
Delays in acquisition and development of properties may have adverse effects.
Delays we encounter in the selection, acquisition and development of properties could adversely affect our returns. Where properties are acquired prior to the start of construction, it will typically take 12 to 18 months to complete construction and lease available space. Therefore, there could be delays in the payment of cash distributions attributable to those particular properties.
14
Table of Contents
Development and construction of properties may incur delays and increased costs and risks.
In connection with our development strategy, we may acquire raw land upon which we will develop and construct improvements at a fixed contract price. In any such projects we will be subject to risks relating to the builder’s ability to control construction costs or to build in conformity with plans, specifications and timetables. The builder’s failure to perform may result in legal action by us to rescind the purchase or construction contract or to enforce the builder’s obligations. Performance may also be affected or delayed by conditions beyond the builder’s control. Delays in completion of construction could also give tenants the right to terminate preconstruction leases for space at a newly developed project. We may incur additional risks when we make periodic progress payments or other advances to such builders prior to completion of construction. Each of these factors could result in increased costs of a project or loss of our investment. In addition, we will be subject to normal lease-up risks relating to newly constructed projects if they are not fully leased prior to the commencement of construction. Furthermore, the price we agree to for the land will be based on projections of rental income and expenses and estimates of construction costs as well as the fair market value of the property upon completion of construction. If our projections are inaccurate, we may pay too much for the land and fail to achieve our forecast of returns due to the factors discussed above.
Acquired properties may be located in new markets where we may face risks associated with investing in an unfamiliar market.
We have acquired, and may continue to acquire, properties in markets that are new to us. When we acquire properties located in these markets, we may face risks associated with a lack of market knowledge or understanding of the local economy, forging new business relationships in the area and unfamiliarity with local government and permitting procedures. We work to mitigate such risks through extensive diligence and research and associations with experienced partners; however, there can be no guarantee that all such risks will be eliminated.
Uninsured losses relating to real property may adversely affect our returns.
We attempt to ensure that all of our properties are adequately insured to cover casualty losses. However, there are certain losses, including losses from floods, earthquakes, acts of war, acts of terrorism or riots, that are not generally insured against or that are not generally fully insured against because it is not deemed economically feasible or prudent to do so. In addition, changes in the cost or availability of insurance could expose us to uninsured casualty losses. In the event that any of our properties incurs a casualty loss that is not fully covered by insurance, the value of our assets will be reduced by the amount of any such uninsured loss, and we could experience a significant loss of capital invested and potential revenues in these properties and could potentially remain obligated under any recourse debt associated with the property. Moreover, as the general partner of our operating partnership, we generally will be liable for all of our operating partnership’s unsatisfied recourse obligations, including any obligations incurred by our operating partnership as the general partner of joint ventures. Any such losses could adversely affect our financial condition, results of operations, cash flows and ability to pay distributions on, and the market price of, our common stock. In addition, we may have no source of funding to repair or reconstruct the damaged property, and we cannot assure that any such sources of funding will be available to us for such purposes in the future.
A number of our consolidated operating properties are located in areas that are known to be subject to earthquake activity. Properties located in active seismic areas include properties in Northern California, Southern California, Memphis, Seattle and Mexico. We carry replacement-cost earthquake insurance on all of our properties located in areas historically subject to seismic activity, subject to coverage limitations and deductibles that we believe are commercially reasonable. We evaluate our earthquake insurance coverage annually in light of current industry practice through an analysis prepared by outside consultants.
A number of our properties are located in Miami and Orlando, which are areas that are known to be subject to hurricane and/or flood risk. We carry replacement-cost hurricane and flood hazard insurance on all of our properties located in areas historically subject to such activity, subject to coverage limitations and deductibles
15
Table of Contents
that we believe are commercially reasonable. We evaluate our insurance coverage annually in light of current industry practice through an analysis prepared by outside consultants.
Contingent or unknown liabilities could adversely affect our financial condition.
We have acquired, and may in the future acquire, properties, or may have previously owned properties, subject to liabilities and without any recourse, or with only limited recourse, with respect to unknown liabilities. As a result, if a liability were asserted against us based upon ownership of any of these entities or properties, then we might have to pay substantial sums to settle it, which could adversely affect our cash flows. Unknown liabilities with respect to entities or properties acquired might include:
| • | liabilities for clean-up or remediation of adverse environmental conditions; |
| • | accrued but unpaid liabilities incurred in the ordinary course of business; |
| • | tax liabilities; and |
| • | claims for indemnification by the general partners, officers and directors and others indemnified by the former owners of the properties. |
Environmentally hazardous conditions may adversely affect our operating results.
Under various federal, state and local environmental laws, a current or previous owner or operator of real property may be liable for the cost of removing or remediating hazardous or toxic substances on such property. Such laws often impose liability whether or not the owner or operator knew of, or was responsible for, the presence of such hazardous or toxic substances. Even if more than one person may have been responsible for the contamination, each person covered by the environmental laws may be held responsible for all of the clean-up costs incurred. In addition, third parties may sue the owner or operator of a site for damages based on personal injury, natural resources or property damage or other costs, including investigation and clean-up costs, resulting from the environmental contamination. The presence of hazardous or toxic substances on one of our properties, or the failure to properly remediate a contaminated property, could give rise to a lien in favor of the government for costs it may incur to address the contamination, or otherwise adversely affect our ability to sell or lease the property or borrow using the property as collateral. Environmental laws also may impose restrictions on the manner in which property may be used or businesses may be operated. A property owner who violates environmental laws may be subject to sanctions which may be enforced by governmental agencies or, in certain circumstances, private parties. In connection with the acquisition and ownership of our properties, we may be exposed to such costs. The cost of defending against environmental claims, of compliance with environmental regulatory requirements or of remediating any contaminated property could materially adversely affect our business, assets or results of operations and, consequently, amounts available for distribution to our stockholders.
Environmental laws in the U.S. also require that owners or operators of buildings containing asbestos properly manage and maintain the asbestos, adequately inform or train those who may come into contact with asbestos and undertake special precautions, including removal or other abatement, in the event that asbestos is disturbed during building renovation or demolition. These laws may impose fines and penalties on building owners or operators who fail to comply with these requirements and may allow third parties to seek recovery from owners or operators for personal injury associated with exposure to asbestos. Some of our properties may contain asbestos-containing building materials.
We invest in properties historically used for industrial, manufacturing and commercial purposes. Some of these properties contain, or may have contained, underground storage tanks for the storage of petroleum products and other hazardous or toxic substances. All of these operations create a potential for the release of petroleum products or other hazardous or toxic substances. Some of our properties are adjacent to or near other properties that have contained or currently contain underground storage tanks used to store petroleum products or other hazardous or toxic substances. In addition, certain of our properties are on or are adjacent to or near other properties upon which others, including former owners or tenants of our properties, have engaged, or may in the future engage, in activities that may release petroleum products or other hazardous or toxic substances.
16
Table of Contents
We maintain a portfolio environmental insurance policy that provides coverage for potential environmental liabilities, subject to the policy’s coverage conditions and limitations, for most of our properties. From time to time, we may acquire properties, or interests in properties, with known adverse environmental conditions where we believe that the environmental liabilities associated with these conditions are quantifiable and that the acquisition will yield a superior risk-adjusted return. In such an instance, we underwrite the costs of environmental investigation, clean-up and monitoring into the cost. Further, in connection with property dispositions, we may agree to remain responsible for, and to bear the cost of, remediating or monitoring certain environmental conditions on the properties.
All of our properties were subject to a Phase I or similar environmental assessment by independent environmental consultants at the time of acquisition. Phase I assessments are intended to discover and evaluate information regarding the environmental condition of the surveyed property and surrounding properties. Phase I assessments generally include a historical review, a public records review, an investigation of the surveyed site and surrounding properties, and preparation and issuance of a written report, but do not include soil sampling or subsurface investigations and typically do not include an asbestos survey. While some of these assessments have led to further investigation and sampling, none of our environmental assessments of our properties have revealed an environmental liability that we believe would have a material adverse effect on our business, financial condition or results of operations taken as a whole. However, we cannot give any assurance that such conditions do not exist or may not arise in the future. Material environmental conditions, liabilities or compliance concerns may arise after the environmental assessment has been completed. Moreover, there can be no assurance that (i) future laws, ordinances or regulations will not impose any material environmental liability or (ii) the current environmental condition of our properties will not be affected by tenants, by the condition of land or operations in the vicinity of our properties (such as releases from underground storage tanks), or by third parties unrelated to us.
Costs of complying with governmental laws and regulations may adversely affect our income and the cash available for any distributions.
All real property and the operations conducted on real property are subject to federal, state and local laws and regulations relating to environmental protection and human health and safety. Tenants’ ability to operate and to generate income to pay their lease obligations may be affected by permitting and compliance obligations arising under such laws and regulations. Some of these laws and regulations may impose joint and several liability on tenants, owners or operators for the costs to investigate or remediate contaminated properties, regardless of fault or whether the acts causing the contamination were legal. Leasing properties to tenants that engage in industrial, manufacturing, and commercial activities will cause us to be subject to the risk of liabilities under environmental laws and regulations. In addition, the presence of hazardous or toxic substances, or the failure to properly remediate these substances, may adversely affect our ability to sell, rent or pledge such property as collateral for future borrowings.
Some of these laws and regulations have been amended so as to require compliance with new or more stringent standards as of future dates. Compliance with new or more stringent laws or regulations or stricter interpretation of existing laws may require us to incur material expenditures. Future laws, ordinances or regulations may impose material environmental liability. Additionally, our tenants’ operations, the existing condition of land when we buy it, operations in the vicinity of our properties, such as the presence of underground storage tanks, or activities of unrelated third parties may affect our properties. In addition, there are various local, state and federal fire, health, life-safety and similar regulations with which we may be required to comply and which may subject us to liability in the form of fines or damages for noncompliance. Any material expenditures, fines or damages we must pay will reduce our ability to make distributions and may reduce the value of our common stock.
In addition, changes in these laws and governmental regulations, or their interpretation by agencies or the courts, could occur.
17
Table of Contents
Compliance or failure to comply with the Americans with Disabilities Act and other similar regulations could result in substantial costs.
Under the Americans with Disabilities Act, places of public accommodation must meet certain federal requirements related to access and use by disabled persons. Noncompliance could result in the imposition of fines by the federal government or the award of damages to private litigants. If we are required to make unanticipated expenditures to comply with the Americans with Disabilities Act, including removing access barriers, then our cash flows and the amounts available for distributions to our stockholders may be adversely affected. While we believe that our properties are currently in material compliance with these regulatory requirements, the requirements may change or new requirements may be imposed that could require significant unanticipated expenditures by us that will affect our cash flows and results of operations.
We own several of our properties subject to ground leases that expose us to the loss of such properties upon breach or termination of the ground leases and may limit our ability to sell these properties.
We own several of our properties through leasehold interests in the land underlying the buildings and we may acquire additional buildings in the future that are subject to similar ground leases. As lessee under a ground lease, we are exposed to the possibility of losing the property upon termination, or an earlier breach by us, of the ground lease, which may have a material adverse effect on our business, financial condition and results of operations, our ability to make distributions to our stockholders and the trading price of our common stock.
Our ground leases contain certain provisions that may limit our ability to sell certain of our properties. In order to assign or transfer our rights and obligations under certain of our ground leases, we generally must obtain the consent of the landlord which, in turn, could adversely impact the price realized from any such sale.
We may be unable to sell a property if or when we decide to do so, including as a result of uncertain market conditions, which could adversely affect the return on an investment in our common stock.
We expect to hold the various real properties in which we invest until such time as we decide that a sale or other disposition is appropriate given our investment objectives. Our ability to dispose of properties on advantageous terms depends on factors beyond our control, including competition from other sellers and the availability of attractive financing for potential buyers of our properties. We cannot predict the various market conditions affecting real estate investments which will exist at any particular time in the future. Due to the uncertainty of market conditions which may affect the future disposition of our properties, we cannot assure our stockholders that we will be able to sell our properties at a profit in the future. Accordingly, the extent to which our stockholders will receive cash distributions and realize potential appreciation on our real estate investments will be dependent upon fluctuating market conditions.
Furthermore, we may be required to expend funds to correct defects or to make improvements before a property can be sold. We cannot assure our stockholders that we will have funds available to correct such defects or to make such improvements.
In acquiring a property, we may agree to restrictions that prohibit the sale of that property for a period of time or impose other restrictions, such as a limitation on the amount of debt that can be placed or repaid on that property. These provisions would restrict our ability to sell a property.
If we sell properties and provide financing to purchasers, defaults by the purchasers would adversely affect our cash flows.
If we decide to sell any of our properties, we presently intend to use our best efforts to sell them for cash. However, in some instances we may sell our properties by providing financing to purchasers. If we provide financing to purchasers, we will bear the risk that the purchaser may default, which could negatively impact our cash distributions to stockholders and result in litigation and related expenses. Even in the absence of a purchaser
18
Table of Contents
default, the distribution of the proceeds of sales to our stockholders, or their reinvestment in other assets, will be delayed until the promissory notes or other property we may accept upon a sale are actually paid, sold, refinanced or otherwise disposed of.
We may acquire properties with “lock-out” provisions which may affect our ability to dispose of the properties.
We may acquire properties through contracts that could restrict our ability to dispose of the property for a period of time. These “lock-out” provisions could affect our ability to turn our investments into cash and could affect cash available for distributions to our stockholders. Lock-out provisions could also impair our ability to take actions during the lock-out period that would otherwise be in the best interest of our stockholders and, therefore, may have an adverse impact on the value of our common stock relative to the value that would result if the lock-out provisions did not exist.
RISKS RELATED TO OUR DEBT FINANCINGS
Our operating results and financial condition could be adversely affected if we are unable to make required payments on our debt.
Our charter and bylaws do not limit the amount or percentage of indebtedness that we may incur, and we are subject to risks normally associated with debt financing, including the risk that our cash flows will be insufficient to meet required payments of principal and interest. There can be no assurance that we will be able to refinance any maturing indebtedness, that such refinancing would be on terms as favorable as the terms of the maturing indebtedness or that we will be able to otherwise obtain funds by selling assets or raising equity to make required payments on maturing indebtedness.
In particular, loans obtained to fund property acquisitions may be secured by first mortgages on such properties. If we are unable to make our debt service payments as required, a lender could foreclose on the property or properties securing its debt. This could cause us to lose part or all of our investment, which in turn could cause the value of our common stock and distributions payable to stockholders to be reduced. Certain of our existing and future indebtedness is and may be cross-collateralized and, consequently, a default on this indebtedness could cause us to lose part or all of our investment in multiple properties.
Increases in interest rates could increase the amount of our debt payments and adversely affect our ability to make distributions to our stockholders.
We have incurred and may continue to incur variable rate debt whereby increases in interest rates raise our interest costs, which reduces our cash flows and our ability to make distributions to our stockholders. If we are unable to refinance our indebtedness at maturity or meet our payment obligations, the amount of our distributable cash flows and our financial condition would be adversely affected, and we may lose the property securing such indebtedness. In addition, if we need to repay existing debt during periods of rising interest rates, we could be required to liquidate one or more of our investments in properties at times which may not permit realization of the maximum return on such investments.
Covenants in our credit agreements could limit our flexibility and adversely affect our financial condition.
The terms of our senior credit facility and other indebtedness require us to comply with a number of customary financial and other covenants, such as covenants with respect to consolidated leverage, net worth and unencumbered assets. These covenants may limit our flexibility in our operations, and breaches of these covenants could result in defaults under the instruments governing the applicable indebtedness even if we have satisfied our payment obligations. As of December 31, 2009, we had certain non-recourse, secured loans which are cross-collateralized by multiple properties. If we default on any of these loans we may then be required to repay such indebtedness, together with applicable prepayment charges, to avoid foreclosure on all cross-collateralized properties within the applicable pool. In addition, our senior credit facility contains certain cross-default provisions which are triggered in the event that our other material indebtedness is in default. These cross-default provisions may require us to repay or restructure the senior credit facility in addition to any mortgage or
19
Table of Contents
other debt that is in default. If our properties were foreclosed upon, or if we are unable to refinance our indebtedness at maturity or meet our payment obligations, the amount of our distributable cash flows and our financial condition would be adversely affected.
If we enter into financing arrangements involving balloon payment obligations, it may adversely affect our ability to make distributions.
Some of our financing arrangements require us to make a lump-sum or “balloon” payment at maturity. Our ability to make a balloon payment at maturity is uncertain and may depend upon our ability to obtain additional financing or our ability to sell the property. At the time the balloon payment is due, we may or may not be able to refinance the existing financing on terms as favorable as the original loan or sell the property at a price sufficient to make the balloon payment. The effect of a refinancing or sale could affect the rate of return to stockholders and the projected time of disposition of our assets. In addition, payments of principal and interest made to service our debts may leave us with insufficient cash to pay the distributions that we are required to pay to maintain our qualification as a REIT.
High interest rates may make it difficult for us to finance or refinance properties, which could reduce the number of properties we can acquire and the amount of cash distributions we can make.
If debt is unavailable at reasonable rates, we may not be able to finance the purchase of properties. If we place mortgage debt on properties, we run the risk of being unable to refinance such debt when the loans come due or of being unable to refinance such debt on favorable terms. If interest rates are higher when we refinance such debt, our income could be reduced. We may be unable to refinance such debt at appropriate times, which may require us to sell properties on terms that are not advantageous to us or could result in the foreclosure of such properties. If any of these events occur, our cash flows would be reduced. This, in turn, would reduce cash available for distribution to our stockholders and may hinder our ability to raise more capital by issuing more stock or by borrowing more money.
Our hedging strategies may not be successful in mitigating our risks associated with interest rates and could reduce the overall returns on investment in our common stock.
We use various derivative financial instruments to provide a level of protection against interest rate risks, but no hedging strategy can protect us completely. These instruments involve risks, such as the risk that the counterparties may fail to honor their obligations under these arrangements, that these arrangements may not be effective in reducing our exposure to interest rate changes and that a court could rule that such agreements are not legally enforceable. These instruments may also generate income that may not be treated as qualifying REIT income for purposes of the 75% or 95% REIT income tests. In addition, the nature and timing of hedging transactions may influence the effectiveness of our hedging strategies. Poorly designed strategies or improperly executed transactions could actually increase our risk and losses. Moreover, hedging strategies involve transaction and other costs. We cannot assure our stockholders that our hedging strategy and the derivatives that we use will adequately offset the risk of interest rate volatility or that our hedging transactions will not result in losses that may reduce the overall return on investment in our common stock.
RISKS RELATED TO OUR CORPORATE STRUCTURE
Our charter and Maryland law contain provisions that may delay, defer or prevent a change of control transaction.
Our charter contains a 9.8% ownership limit.
Our charter, subject to certain exceptions, authorizes our directors to take such actions as are necessary and desirable to preserve our qualification as a REIT and to limit any person to actual or constructive ownership of no more than 9.8% by value or number of shares, whichever is more restrictive, of any class or series of our outstanding shares of our capital stock. Our board of directors, in its sole discretion, may exempt, subject to the satisfaction of certain conditions, any person from the ownership limit. However, our board of directors may not
20
Table of Contents
grant an exemption from the ownership limit to any person whose ownership, direct or indirect, in excess of 9.8% by value or number of shares of any class or series of our outstanding shares of our capital stock could jeopardize our status as a REIT. These restrictions on transferability and ownership will not apply if our board of directors determines that it is no longer in our best interests to attempt to qualify, or to continue to qualify, as a REIT. The ownership limit may delay or impede a transaction or a change of control that might involve a premium price for our common stock or otherwise be in the best interest of our stockholders.
We could authorize and issue stock without stockholder approval.
Our board of directors could, without stockholder approval, issue authorized but unissued shares of our common stock or preferred stock and amend our charter to increase or decrease the aggregate number of shares of stock or the number of shares of stock of any class or series that we have authority to issue. In addition, our board of directors could, without stockholder approval, classify or reclassify any unissued shares of our common stock or preferred stock and set the preferences, rights and other terms of such classified or reclassified shares. Our board of directors could establish a series of stock that could, depending on the terms of such series, delay, defer or prevent a transaction or change of control that might involve a premium price for our common stock or otherwise be in the best interest of our stockholders.
Majority stockholder vote may discourage changes of control.
If declared advisable by our board of directors, our stockholders may take some actions, including approving amendments to our charter, by a vote of a majority or, in certain circumstances, two thirds of the shares outstanding and entitled to vote. If approved by the holders of the appropriate number of shares, all actions taken would be binding on all of our stockholders. Some of these provisions may discourage or make it more difficult for another party to acquire control of us or to effect a change in our operations.
Provisions of Maryland law may limit the ability of a third party to acquire control of our company.
Certain provisions of Maryland law may have the effect of inhibiting a third party from making a proposal to acquire us or of impeding a change of control under certain circumstances that otherwise could provide the holders of shares of our common stock with the opportunity to realize a premium over the then prevailing market price of such shares, including:
| • | “business combination” provisions that, subject to limitations, prohibit certain business combinations between us and an “interested stockholder” (defined generally as any person who beneficially owns 10% or more of the voting power of our shares or an affiliate thereof) for five years after the most recent date on which the stockholder becomes an interested stockholder and thereafter would require the recommendation of our board of directors and impose special appraisal rights and special stockholder voting requirements on these combinations; and |
| • | “control share” provisions that provide that “control shares” of our company (defined as shares which, when aggregated with other shares controlled by the stockholder, entitle the stockholder to exercise one of three increasing ranges of voting power in electing directors) acquired in a “control share acquisition” (defined as the direct or indirect acquisition of ownership or control of “control shares”) have no voting rights except to the extent approved by our stockholders by the affirmative vote of at least two-thirds of all the votes entitled to be cast on the matter, excluding all interested shares. |
We have opted out of these provisions of Maryland law with respect to any person, provided, in the case of business combinations, that the business combination is first approved by our board of directors. However, our board of directors may opt in to the business combination provisions and the control share provisions of Maryland law in the future.
Additionally, Title 8, Subtitle 3 of the Maryland General Corporation Law, or MGCL, permits our board of directors, without stockholder approval and regardless of what is currently provided in our charter or our bylaws, to implement takeover defenses, some of which (for example, a classified board) we do not currently have. These
21
Table of Contents
provisions may have the effect of inhibiting a third party from making an acquisition proposal for our company or of delaying, deferring or preventing a change in control of our company under circumstances that otherwise could provide the holders of our common stock with the opportunity to realize a premium over the then-current market price.
Our charter, our bylaws, the limited partnership agreement of our operating partnership and Maryland law also contain other provisions that may delay, defer or prevent a transaction or a change of control that might involve a premium price for our common stock or otherwise be in the best interest of our stockholders.
Our board of directors can take many actions without stockholder approval.
Our board of directors has overall authority to oversee our operations and determine our major corporate policies. This authority includes significant flexibility. For example, our board of directors can do the following:
| • | within the limits provided in our charter, prevent the ownership, transfer and/or accumulation of shares in order to protect our status as a REIT or for any other reason deemed to be in the best interests of us and our stockholders; |
| • | issue additional shares without obtaining stockholder approval, which could dilute the ownership of our then-current stockholders; |
| • | amend our charter to increase or decrease the aggregate number of shares of stock or the number of shares of stock of any class or series, without obtaining stockholder approval; |
| • | classify or reclassify any unissued shares of our common stock or preferred stock and set the preferences, rights and other terms of such classified or reclassified shares, without obtaining stockholder approval; |
| • | employ and compensate affiliates; |
| • | direct our resources toward investments that do not ultimately appreciate over time; |
| • | change creditworthiness standards with respect to third-party tenants; and |
| • | determine that it is no longer in our best interests to attempt to qualify, or to continue to qualify, as a REIT. |
Any of these actions could increase our operating expenses, impact our ability to make distributions or reduce the value of our assets without giving our stockholders the right to vote.
We may change our investment and financing strategies and enter into new lines of business without stockholder consent, which may result in riskier investments than our current investments.
We may change our investment and financing strategies and enter into new lines of business at any time without the consent of our stockholders, which could result in our making investments and engaging in business activities that are different from, and possibly riskier than, the investments and businesses described in this prospectus. A change in our investment strategy or our entry into new lines of business may increase our exposure to interest rate and other risks of real estate market fluctuations.
Our rights and the rights of our stockholders to take action against our directors and officers are limited.
Maryland law provides that a director or officer has no liability in that capacity if he or she performs his or her duties in good faith, in a manner he or she reasonably believes to be in our best interests and with the care that an ordinarily prudent person in a like position would use under similar circumstances. In addition, our charter eliminates our directors’ and officers’ liability to us and our stockholders for money damages except for liability resulting from actual receipt of an improper benefit or profit in money, property or services or active and deliberate dishonesty established by a final judgment and which is material to the cause of action. Our bylaws require us to indemnify our directors and officers to the maximum extent permitted by Maryland law for liability
22
Table of Contents
actually incurred in connection with any proceeding to which they may be made, or threatened to be made, a party, except to the extent that the act or omission of the director or officer was material to the matter giving rise to the proceeding and was either committed in bad faith or was the result of active and deliberate dishonesty, the director or officer actually received an improper personal benefit in money, property or services, or, in the case of any criminal proceeding, the director or officer had reasonable cause to believe that the act or omission was unlawful. As a result, we and our stockholders may have more limited rights against our directors and officers than might otherwise exist under common law. In addition, we may be obligated to fund the defense costs incurred by our directors and officers.
RISKS RELATED TO OUR COMMON STOCK
Our distributions to stockholders may change.
Distributions will be authorized and determined by our board of directors in its sole discretion from time to time and will depend upon a number of factors, including:
| • | cash available for distribution; |
| • | our results of operations; |
| • | our financial condition, especially in relation to our anticipated future capital needs of our properties; |
| • | the distribution requirements for REITs under the Code; |
| • | our operating expenses; and |
| • | other factors our board of directors deems relevant. |
Consequently, we may not continue our current level of distributions to stockholders, and our distribution levels may fluctuate.
Future offerings of debt securities, which would be senior to our common stock upon liquidation, or equity securities, which would dilute our existing stockholders and may be senior to our common stock for the purposes of distributions, may adversely affect the market price of our common stock.
In the future, we may attempt to increase our capital resources by making additional offerings of debt or equity securities, including commercial paper, medium-term notes, senior or subordinated notes and classes of preferred or common stock. Upon liquidation, holders of our debt securities and shares of preferred stock and lenders with respect to other borrowings will receive a distribution of our available assets prior to the holders of our common stock. Additional equity offerings may dilute the holdings of our existing stockholders or reduce the market price of our common stock or both. Because our decision to issue securities in any future offering will depend on market conditions and other factors beyond our control, we cannot predict or estimate the amount, timing or nature of our future offerings. Thus, our stockholders bear the risk of our future offerings reducing the market price of our common stock and diluting their proportionate ownership.
FEDERAL INCOME TAX RISKS
Failure to qualify as a REIT could adversely affect our operations and our ability to make distributions.
We operate in a manner so as to qualify as a REIT for U.S. federal income tax purposes. Our qualification as a REIT will depend on our satisfaction of numerous requirements (some on an annual and quarterly basis) established under highly technical and complex provisions of the Code for which there are only limited judicial or administrative interpretations, and involves the determination of various factual matters and circumstances not entirely within our control. The fact that we hold substantially all of our assets through our operating partnership and its subsidiaries further complicates the application of the REIT requirements for us. No assurance can be given that we will qualify as a REIT for any particular year. If we were to fail to qualify as a REIT in any taxable
23
Table of Contents
year for which a REIT election has been made, we would not be allowed a deduction for dividends paid to our stockholders in computing our taxable income and would be subject to federal income tax (including any applicable alternative minimum tax) on our taxable income at corporate rates unless certain relief provision apply. As a consequence, we would not be compelled to make distributions under the Code. Moreover, unless we were to obtain relief under certain statutory provisions, we would also be disqualified from treatment as a REIT for the four taxable years following the year during which qualification is lost. This treatment would reduce our net earnings available for investment or distribution to our stockholders because of the additional tax liability to us for the years involved. As a result of the additional tax liability, we might need to borrow funds or liquidate certain investments on terms that may be disadvantageous to us in order to pay the applicable tax. If we fail to qualify as a REIT but are eligible for certain relief provisions, then we may retain our status as a REIT but may be required to pay a penalty tax, which could be substantial.
To qualify as a REIT, we must meet annual distribution requirements.
To obtain the favorable tax treatment accorded to REITs, among other requirements, we normally will be required each year to distribute to our stockholders at least 90% of our REIT taxable income, determined without regard to the deduction for dividends paid and by excluding net capital gains. We may distribute taxable dividends that are payable in our stock. Under the Internal Revenue Service, or IRS, Revenue Procedure 2009-12, up to 90% of any such taxable dividend for taxable years ending on or before December 31, 2011 could be payable in shares of our common stock. Taxable stockholders receiving such dividends will be required to include the full amount of the dividend as ordinary income to the extent of our current and accumulated earnings and profits for United States federal income tax purposes. As a result, a U.S. stockholder may be required to pay tax with respect to such dividends in excess of the cash received. If a U.S. stockholder sells the shares of common stock it receives as a dividend in order to pay this tax, the sales proceeds may be less than the amount included in income with respect to the dividend, depending on the market price of our common stock at the time of the sale. Furthermore, with respect to non-U.S. stockholders, we may be required to withhold U.S. tax with respect to such dividends, including in respect of all or a portion of such dividend that is payable in shares of our common stock. In addition, if a significant number of our stockholders determine to sell shares of our stock in order to pay taxes owed on dividends, it may put downward pressure on the trading price of our stock. We will be subject to federal income tax on our undistributed taxable income and net capital gain. In addition, if we fail to distribute during each calendar year at least the sum of (a) 85% of our ordinary income for such year, (b) 95% of our capital gain net income for such year, and (c) any undistributed taxable income from prior periods, we will be subject to a 4% excise tax on the excess of the required distribution over the sum of (i) the amounts actually distributed by us, plus (ii) retained amounts on which we pay income tax at the corporate level. We intend to make distributions to our stockholders to comply with the requirements of the Code for REITs and to minimize or eliminate our corporate income tax obligation. However, differences between the recognition of taxable income and the actual receipt of cash could require us to sell assets or borrow funds on a short-term or long-term basis or partially pay dividends in shares of our commons stock to meet the distribution requirements of the Code. Certain types of assets generate substantial mismatches between taxable income and available cash. Such assets include rental real estate that has been financed through financing structures which require some or all of available cash flows to be used to service borrowings. As a result, the requirement to distribute a substantial portion of our taxable income could cause us to: (1) sell assets in adverse market conditions, (2) borrow on unfavorable terms or (3) distribute amounts that would otherwise be invested in future acquisitions, capital expenditures or repayment of debt, in order to comply with REIT requirements. Further, amounts distributed will not be available to fund our operations.
Legislative or regulatory action could adversely affect our stockholders.
In recent years, numerous legislative, judicial and administrative changes have been made to the federal income tax laws applicable to investments in REITs and similar entities. Additional changes to tax laws are likely to continue to occur in the future, and we cannot assure our stockholders that any such changes will not adversely affect the taxation of a stockholder. Any such changes could have an adverse effect on an investment in our common stock. All stockholders are urged to consult with their tax advisor with respect to the status of
24
Table of Contents
legislative, regulatory or administrative developments and proposals and their potential effect on an investment in common stock.
Distributions payable by REITs do not qualify for the reduced tax rates that apply to certain other corporate distributions.
Tax legislation enacted in 2003 and 2006 generally reduces the maximum tax rate for distributions payable by corporations to individuals to 15% through 2010. Distributions payable by REITs, however, generally continue to be taxed at the normal rate applicable to the individual recipient rather than the 15% preferential rate. Although this legislation does not adversely affect the taxation of REITs or dividends paid by REITs, the more favorable rates applicable to regular corporate distributions could cause investors who are individuals to perceive investments in REITs to be relatively less attractive than investments in the stocks of non-REIT corporations that pay distributions, which could adversely affect the value of the stock of REITs, including our common stock. It is not yet clear whether the reduced rate will be extended beyond 2010 and if so, at what rate.
Recharacterization of transactions under our operating partnership’s private placement may result in a 100% tax on income from prohibited transactions, which would diminish our cash distributions to our stockholders.
The IRS could recharacterize transactions under our operating partnership’s private placement such that our operating partnership is treated as the bona fide owner, for tax purposes, of properties acquired and resold by the entity established to facilitate the transaction. Such recharacterization could result in the income realized on these transactions by our operating partnership being treated as gain on the sale of property that is held as inventory or otherwise held primarily for the sale to customers in the ordinary course of business. In such event, such gain would constitute income from a prohibited transaction and would be subject to a 100% tax. If this occurs, our ability to pay cash distributions to our stockholders will be adversely affected.
In certain circumstances, we may be subject to federal and state income taxes, which would reduce our cash available for distribution to our stockholders.
Even if we qualify and maintain our status as a REIT, we may be subject to federal income taxes or state taxes in various circumstances. For example, net income from a “prohibited transaction” will be subject to a 100% tax. In addition, we may not be able to distribute all of our income in any given year, which would result in corporate level taxes, and we may not make sufficient distributions to avoid excise taxes. We may also decide to retain certain gains from the sale or other disposition of our property and pay income tax directly on such gains. In that event, our stockholders would be required to include such gains in income and would receive a corresponding credit for their share of taxes paid by us. We may also be subject to U.S. state and local and non-U.S. taxes on our income or property, either directly or at the level of our operating partnership or at the level of the other companies through which we indirectly own our assets. In addition, any net taxable income earned directly by any of our taxable REIT subsidiaries, which we refer to as TRS’s, will be subject to federal and state corporate income tax. In addition, we may be subject to federal or state taxes in other various circumstances. Any federal or state taxes we pay will reduce our cash available for distribution to our stockholders.
If our operating partnership was classified as a “publicly traded partnership” under the Code, our status as a REIT and our ability to pay distributions to our stockholders could be adversely affected.
Our operating partnership is organized as a partnership for U.S. federal income tax purposes. Even though our operating partnership will not elect to be treated as an association taxable as a corporation, it may be taxed as a corporation if it is deemed to be a “publicly traded partnership.” A publicly traded partnership is a partnership whose interests are traded on an established securities market or are considered readily tradable on a secondary market or the substantial equivalent thereof. We believe and currently intend to take the position that our operating partnership should not be classified as a publicly traded partnership because interests in our operating partnership are not traded on an established securities market, and our operating partnership should satisfy certain safe harbors which prevent a partnership’s interests from being treated as readily tradable on an established securities market or substantial equivalent thereof. No assurance can be given, however, that the IRS would not
25
Table of Contents
assert that our operating partnership constitutes a publicly traded partnership or that facts and circumstances will not develop which could result in our operating partnership being treated as a publicly traded partnership. If the IRS were to assert successfully that our operating partnership is a publicly traded partnership, and substantially all of our operating partnership’s gross income did not consist of the specified types of passive income, our operating partnership would be treated as an association taxable as a corporation and would be subject to corporate tax at the entity level. In such event, the character of our assets and items of gross income would change and would result in a termination of our status as a REIT. In addition, the imposition of a corporate tax on our operating partnership would reduce the amount of cash available for distribution to our stockholders.
Certain property transfers may generate prohibited transaction income, resulting in a penalty tax on gain attributable to the transaction.
From time to time, we may transfer or otherwise dispose of some of our properties, including the contribution of properties to our joint venture funds or other commingled investment vehicles. Under the Code, any gain resulting from transfers of properties that we hold as inventory or primarily for sale to customers in the ordinary course of business would be treated as income from a prohibited transaction subject to a 100% penalty tax, unless a safe harbor exception applies. Since we acquire properties for investment purposes, we do not believe that our occasional transfers or disposals of property or our contributions of properties into our joint venture funds, or commingled investment vehicles, are properly treated as prohibited transactions. However, whether property is held for investment purposes is a question of fact that depends on all the facts and circumstances surrounding the particular transaction. The IRS may contend that certain transfers or disposals of properties by us or contributions of properties into our joint venture funds are prohibited transactions if they do not meet the safe harbor requirements. While we believe that the IRS would not prevail in any such dispute, if the IRS were to argue successfully that a transfer or disposition or contribution of property constituted a prohibited transaction, we would be required to pay a 100% penalty tax on any gain allocable to us from the prohibited transaction. In addition, income from a prohibited transaction might adversely affect our ability to satisfy the income tests for qualification as a real estate investment trust for federal income tax purposes.
Foreign investors may be subject to Foreign Investment Real Property Tax Act, or FIRPTA, tax on certain distributions and on sale of common stock if we are unable to qualify as a “domestically controlled” REIT or if our stock is not considered to be regularly traded on an established securities market.
A foreign person disposing of a U.S. real property interest, including shares of a U.S. corporation whose assets consist principally of U.S. real property interests or USRPIs, is generally subject to a tax, known as FIRPTA tax, on the gain recognized on the disposition. Such FIRPTA tax does not apply, however, to the disposition of stock in a REIT if the REIT is a “domestically controlled qualified investment entity.” A domestically controlled qualified investment entity includes a REIT in which, at all times during a specified testing period, less than 50% in value of its shares is held directly or indirectly by non-U.S. holders. In the event that we do not constitute a domestically controlled qualified investment entity, a person’s sale of stock nonetheless will generally not be subject to tax under FIRPTA as a sale of a USRPI, provided that (1) the stock owned is of a class that is “regularly traded,” as defined by applicable Treasury regulations, on an established securities market, and (2) the selling non-U.S. holder held 5% or less of our outstanding stock of that class at all times during a specified testing period. If we were to fail to so qualify as a domestically controlled qualified investment entity, and our common stock were to fail to be “regularly traded,” gain realized by a foreign investor on a sale of our common stock would be subject to FIRPTA tax and applicable withholding. No assurance can be given that we will be a domestically controlled qualified investment entity. Additionally, any distributions we make to our non-U.S. shareholders that are attributable to gain from the sale of any USRPI will also generally be subject to FIRPTA tax and applicable withholdings, unless the recipient non-U.S. shareholder has not owned more than 5% of our common stock at any time during the year preceding the distribution.
26
Table of Contents
Congress has introduced legislation that, if enacted, could cause our operating partnership to be taxable as a corporation for U.S. federal income tax purposes under the publicly traded partnership rules.
Congress is considering legislative proposals to treat all or part of certain income allocated to a partner by a partnership in respect of certain services provided to or for the benefit of the partnership (“carried interest revenue”) as ordinary income for U.S. federal income tax purposes. While the current legislative proposal would not adversely affect the character of the income for purposes of the REIT qualification tests, it is not clear what form any such final legislation would take. While the current proposed legislation purports to treat carried interest revenue as qualifying income of certain operating partnerships of publicly-traded REITs for purposes of the “qualifying income” exception to the publicly-traded partnership rules, our operating partnership may not qualify under this exception in the proposed legislation. As a result, the proposed legislation, if enacted, could cause our operating partnership to be taxable as a corporation for U.S. federal income tax purposes if it is a publicly-traded partnership and the amount of any such carried interest revenue plus any other non-qualifying income earned by our operating partnership exceeds 10% of its gross income in any taxable year.
| ITEM 1B. | UNRESOLVED STAFF COMMENTS |
None.
27
Table of Contents
| ITEM 2. | PROPERTIES |
Geographic Distribution
The following table describes the geographic diversification of our consolidated properties as of December 31, 2009.
| Markets |
Number of Buildings |
Percentage Owned (1) |
Square Feet | Occupancy Percentage (2) |
Annualized Base Rent (3) |
Percentage of Total Annualized Base Rent |
||||||||||
| (in thousands) | (in thousands) | |||||||||||||||
| Operating Properties: |
||||||||||||||||
| Atlanta |
52 | 100.0 | % | 6,710 | 81.1 | % | $ | 18,432 | 10.0 | % | ||||||
| Baltimore/ Washington D.C. |
12 | 100.0 | % | 1,446 | 89.0 | % | 6,811 | 3.7 | % | |||||||
| Central Pennsylvania |
8 | 100.0 | % | 1,453 | 78.4 | % | 4,574 | 2.5 | % | |||||||
| Charlotte |
10 | 100.0 | % | 1,006 | 82.4 | % | 3,182 | 1.7 | % | |||||||
| Chicago |
15 | 100.0 | % | 2,867 | 77.4 | % | 7,856 | 4.3 | % | |||||||
| Cincinnati |
34 | 100.0 | % | 3,729 | 84.4 | % | 11,598 | 6.3 | % | |||||||
| Columbus |
14 | 100.0 | % | 4,301 | 85.7 | % | 11,428 | 6.2 | % | |||||||
| Dallas (4) |
46 | 100.0 | % | 4,288 | 88.7 | % | 14,442 | 7.8 | % | |||||||
| Denver |
1 | 100.0 | % | 160 | 90.3 | % | 831 | 0.5 | % | |||||||
| Houston |
40 | 100.0 | % | 2,911 | 91.6 | % | 13,831 | 7.5 | % | |||||||
| Indianapolis |
7 | 100.0 | % | 2,299 | 93.1 | % | 6,000 | 3.3 | % | |||||||
| Kansas City |
1 | 100.0 | % | 225 | 100.0 | % | 1,009 | 0.5 | % | |||||||
| Louisville |
4 | 100.0 | % | 1,330 | 100.0 | % | 4,426 | 2.4 | % | |||||||
| Memphis |
10 | 100.0 | % | 4,333 | 99.6 | % | 12,287 | 6.7 | % | |||||||
| Mexico |
11 | 100.0 | % | 1,163 | 86.7 | % | 4,816 | 2.6 | % | |||||||
| Miami |
6 | 100.0 | % | 727 | 69.0 | % | 4,977 | 2.7 | % | |||||||
| Minneapolis |
3 | 100.0 | % | 356 | 100.0 | % | 1,741 | 0.9 | % | |||||||
| Nashville |
5 | 100.0 | % | 2,826 | 95.6 | % | 7,723 | 4.2 | % | |||||||
| New Jersey |
9 | 100.0 | % | 1,051 | 69.9 | % | 4,410 | 2.4 | % | |||||||
| Northern California |
25 | 100.0 | % | 2,563 | 87.2 | % | 13,483 | 7.3 | % | |||||||
| Orlando |
12 | 100.0 | % | 1,064 | 89.3 | % | 4,554 | 2.5 | % | |||||||
| Phoenix |
14 | 100.0 | % | 1,632 | 79.4 | % | 5,875 | 3.2 | % | |||||||
| San Antonio |
15 | 100.0 | % | 1,349 | 91.0 | % | 4,414 | 2.4 | % | |||||||
| Seattle |
7 | 100.0 | % | 1,115 | 94.7 | % | 5,281 | 2.9 | % | |||||||
| Southern California |
14 | 100.0 | % | 2,006 | 94.1 | % | 10,064 | 5.5 | % | |||||||
| Total/Weighted Average—Operating Properties (5) |
375 | 100.0 | % | 52,910 | 87.6 | % | 184,045 | 100.0 | % | |||||||
| Consolidated Redevelopment Properties |
4 | 100.0 | % | 781 | 13.9 | % | 502 | N/A | ||||||||
| Consolidated Development Properties |
15 | 99.2 | % | 3,156 | 18.3 | % | 2,522 | N/A | ||||||||
| Total/Weighted Average—Consolidated Properties |
394 | 100.0 | % | 56,847 | 82.7 | % | $ | 187,069 | N/A | |||||||
| (1) | Weighted average ownership is based on square feet. |
| (2) | Based on leases commenced as of December 31, 2009. |
| (3) | Annualized Base Rent is calculated as monthly contractual base rent (cash basis) per the terms of the lease, as of December 31, 2009, multiplied by 12. |
| (4) | Three of our buildings in this market totaling approximately 1.6 million square feet are subject to ground leases. |
(footnotes continue on following page)
28
Table of Contents
(footnotes to previous page)
| (5) | Occasionally our leases contain provisions giving the tenant rights to purchase the property, which can take the form of a fixed price purchase option, a fair market value option, a right of first refusal option or a right of first offer option. The following chart summarizes such rights related to our consolidated operating properties as of December 31, 2009. |
| Number of Leases |
Square Feet | Annualized Base Rent | |||||
| (in thousands) | (in thousands) | ||||||
| Fixed Price Purchase Options |
2 | 1,210 | $ | 3,759 | |||
| Fair Market Value Options |
7 | 637 | $ | 3,324 | |||
| Right of First Refusal Options |
4 | 396 | $ | 1,204 | |||
The following table describes the geographic diversification of our investments in unconsolidated properties as of December 31, 2009.
| Markets |
Number of Buildings |
Percentage Owned (1) |
Square Feet | Occupancy Percentage |
Annualized Base Rent |
Percentage of Total Annualized Base Rent |
||||||||||
| (in thousands) | (in thousands) | |||||||||||||||
| Operating Properties: |
||||||||||||||||
| Southern California—SCLA (2) |
2 | 50.0 | % | 463 | 100.0 | % | $ | 1,576 | 100.0 | % | ||||||
| Total/Weighted Average |
2 | 50.0 | % | 463 | 100.0 | % | $ | 1,576 | 100.0 | % | ||||||
| Operating Properties in Funds: |
||||||||||||||||
| Atlanta |
2 | 17.2 | % | 703 | 100.0 | % | $ | 1,970 | 4.1 | % | ||||||
| Central Pennsylvania |
4 | 8.6 | % | 1,210 | 96.7 | % | 4,827 | 10.1 | % | |||||||
| Charlotte |
1 | 4.4 | % | 472 | 100.0 | % | 1,509 | 3.1 | % | |||||||
| Chicago |
4 | 18.1 | % | 1,525 | 95.9 | % | 5,725 | 12.0 | % | |||||||
| Cincinnati |
5 | 11.9 | % | 1,847 | 100.0 | % | 6,157 | 12.9 | % | |||||||
| Columbus |
2 | 6.3 | % | 451 | 100.0 | % | 1,560 | 3.3 | % | |||||||
| Dallas |
4 | 16.8 | % | 1,726 | 77.7 | % | 4,365 | 9.1 | % | |||||||
| Denver |
5 | 20.0 | % | 773 | 91.8 | % | 3,301 | 6.9 | % | |||||||
| Indianapolis |
1 | 11.4 | % | 475 | 100.0 | % | 1,808 | 3.8 | % | |||||||
| Kansas City |
1 | 11.4 | % | 180 | 100.0 | % | 728 | 1.5 | % | |||||||
| Louisville |
5 | 10.0 | % | 900 | 85.2 | % | 2,473 | 5.2 | % | |||||||
| Memphis |
1 | 20.0 | % | 1,039 | 74.1 | % | 2,241 | 4.7 | % | |||||||
| Minneapolis |
3 | 4.4 | % | 472 | 100.0 | % | 2,290 | 4.8 | % | |||||||
| Nashville |
2 | 20.0 | % | 1,020 | 100.0 | % | 3,757 | 7.8 | % | |||||||
| New Jersey |
2 | 10.7 | % | 216 | 86.7 | % | 835 | 1.7 | % | |||||||
| Northern California |
1 | 4.4 | % | 396 | 100.0 | % | 1,711 | 3.6 | % | |||||||
| Orlando |
2 | 20.0 | % | 696 | 82.7 | % | 2,573 | 5.4 | % | |||||||
| Total/Weighted Average—Fund Operating Properties |
45 | 14.1 | % | 14,101 | 92.2 | % | $ | 47,830 | 100.0 | % | ||||||
| Unconsolidated Development Properties: |
||||||||||||||||
| Total/Weighted Average |
8 | 50.0 | % | 3,452 | N/A | N/A | N/A | |||||||||
| Total/Weighted Average—Unconsolidated Properties |
55 | 21.9 | % | 18,016 | N/A | N/A | N/A | |||||||||
| (1) | Percentage owned is based on equity ownership weighted by square feet, if applicable. |
| (2) | Although we contributed 100% of the initial cash equity capital required by the SCLA joint venture, our partners retain certain participation rights in the venture’s available cash flows. |
29
Table of Contents
Property Types
The following table reflects our consolidated portfolio by property type, in terms of square footage, as of December 31, 2009 (square feet in thousands).
| Bulk Distribution | Light Industrial | Service Center | Total Portfolio | |||||||||||||||||||||||||
| Number of Buildings |
Square Feet |
Occ. % (1) |
Number of Buildings |
Square Feet |
Occ. % (1) |
Number of Buildings |
Square Feet |
Occ. % (1) |
Number of Buildings |
Square Feet |
Occ. % (1) |
|||||||||||||||||
| Total/Weighted Average—Operating Properties |
220 | 45,048 | 88.1 | % | 113 | 6,377 | 85.9 | % | 42 | 1,485 | 79.4 | % | 375 | 52,910 | 87.6 | % | ||||||||||||
| Properties Under Redevelopment |
2 | 578 | 11.2 | % | 2 | 203 | 21.3 | % | N/A | N/A | N/A | 4 | 781 | 13.9 | % | |||||||||||||
| Properties Under Development |
13 | 3,030 | 19.1 | % | 2 | 126 | 0.0 | % | N/A | N/A | N/A | 15 | 3,156 | 18.3 | % | |||||||||||||
| Total/Weighted Average |
235 | 48,656 | 82.9 | % | 117 | 6,706 | 82.3 | % | 42 | 1,485 | 79.4 | % | 394 | 56,847 | 82.7 | % | ||||||||||||
| (1) | Occupancy percentage is based on leases commenced as of December 31, 2009. |
Lease Expirations
Our industrial properties are typically leased to tenants for terms ranging from three to 10 years with a weighted average remaining term of approximately 3.2 years as of December 31, 2009. Following is a schedule of expiring leases for our consolidated operating properties by square feet and by annual minimum rents as of December 31, 2009 and assuming no exercise of lease renewal options.
| Square Feet Related to Expiring Leases (in thousands) |
Annualized Minimum Rents of Expiring Leases (1) (in thousands) |
Percentage of Total Annualized Base Rent |
||||||
| 2010 (2) |
11,197 | $ | 45,284 | 22.5 | % | |||
| 2011 |
7,777 | 33,201 | 16.6 | % | ||||
| 2012 |
6,765 | 30,233 | 15.1 | % | ||||
| 2013 |
6,472 | 29,049 | 14.5 | % | ||||
| 2014 |
6,233 | 26,491 | 13.2 | % | ||||
| Thereafter |
7,884 | 36,263 | 18.1 | % | ||||
| 46,328 | $ | 200,521 | 100.0 | % | ||||
| Vacant |
6,582 | |||||||
| Total consolidated operating properties |
52,910 | |||||||
| (1) | Includes contractual rent increases. |
| (2) | Includes leases that are on month-to-month terms. |
30
Table of Contents
Customer Diversification
As of December 31, 2009, there were no customers that occupied more that 1.9% of our consolidated operating properties and development properties based on annualized base rent or gross leased square feet. The following table reflects our 10 largest customers, based on annualized base rent as of December 31, 2009, that occupy a combined 7.1 million square feet of our consolidated operating and development properties.
| Customer |
Percentage of Annualized Base Rent |
||
| CEVA Logistics |
1.9 | % | |
| Bridgestone/Firestone |
1.4 | % | |
| Technicolor |
1.4 | % | |
| United Parcel Service (UPS) |
1.3 | % | |
| Deutsche Post World Net (DHL & Exel) |
1.3 | % | |
| United Stationers Supply Company |
1.2 | % | |
| Crayola, LLC |
1.1 | % | |
| The Glidden Company |
1.1 | % | |
| Pitney Bowes, Inc. |
1.0 | % | |
| Toys “R” Us, Inc. |
0.9 | % |
Industry Diversification
The table below illustrates the diversification of our consolidated operating portfolio by the industry classifications of our tenants as of December 31, 2009, (dollar amounts in thousands).
| Number of Leases |
Annualized Base Rent (1) |
Percentage of Total Annualized Base Rent |
Occupied Square Feet (in thousands) |
Percentage of Total Occupied Square Feet |
|||||||||
| Manufacturing |
224 | $ | 57,581 | 31.3 | % | 14,843 | 32.0 | % | |||||
| Wholesale Trade |
236 | 44,592 | 24.2 | % | 11,309 | 24.4 | % | ||||||
| Transportation and Warehousing |
104 | 24,013 | 13.1 | % | 6,828 | 14.7 | % | ||||||
| Retail Trade |
87 | 21,102 | 11.5 | % | 5,461 | 11.8 | % | ||||||
| Administrative Support and Waste Management Services |
42 | 7,918 | 4.3 | % | 1,604 | 3.5 | % | ||||||
| Professional, Scientific and Technical Services |
41 | 7,386 | 4.0 | % | 1,227 | 2.7 | % | ||||||
| Media and Information |
18 | 6,435 | 3.5 | % | 1,571 | 3.4 | % | ||||||
| Construction |
35 | 3,020 | 1.6 | % | 746 | 1.6 | % | ||||||
| Rental Companies |
15 | 2,015 | 1.1 | % | 564 | 1.2 | % | ||||||
| Public Administration |
11 | 2,012 | 1.1 | % | 314 | 0.7 | % | ||||||
| Other |
77 | 7,971 | 4.3 | % | 1,861 | 4.0 | % | ||||||
| Total |
890 | $ | 184,045 | 100.0 | % | 46,328 | 100.0 | % | |||||
| (1) | Annualized Base Rent is calculated as monthly contractual base rent (cash basis) per the terms of the lease, as of December 31, 2009, multiplied by 12. |
31
Table of Contents
Indebtedness
As of December 31, 2009, 139 of our 375 consolidated operating properties and two redevelopment properties, with a combined gross book value of $1.1 billion were encumbered by mortgage indebtedness totaling $508.6 million (excluding net premiums), having a weighted average interest rate of 5.15%. See “Notes to Consolidated Financial Statements, Note 5—Outstanding Indebtedness” and the accompanying Schedule III beginning on page F-23 for additional information.
| ITEM 3. | LEGAL PROCEEDINGS |
See the information under the caption “Legal Matters” in “Notes to Consolidated Financial Statements, Note 7—Commitments and Contingencies.” for information regarding legal proceedings, which information is incorporated by reference in this Item 3.
| ITEM 4. | SUBMISSION OF MATTERS TO A VOTE OF SECURITY HOLDERS |
None.
32
Table of Contents
| ITEM 5. | MARKET FOR REGISTRANT’S COMMON EQUITY, RELATED STOCKHOLDER MATTERS AND ISSUER PURCHASES OF EQUITY SECURITIES |
Our Common Stock is listed the New York Stock Exchange, or the NYSE, under the symbol “DCT”. The following table illustrates the high and low sales prices during periods presented.
| Quarter ended in 2009: |
High | Low | ||||
| December 31, |
$ | 5.60 | $ | 3.95 | ||
| September 30, |
$ | 5.80 | $ | 3.58 | ||
| June 30, |
$ | 5.10 | $ | 3.00 | ||
| March 31, |
$ | 5.01 | $ | 2.42 | ||
| Quarter ended in 2008: |
High | Low | ||||
| December 31, |
$ | 7.66 | $ | 2.49 | ||
| September 30, |
$ | 9.00 | $ | 6.35 | ||
| June 30, |
$ | 10.55 | $ | 8.25 | ||
| March 31, |
$ | 10.20 | $ | 7.99 | ||
On February 17, 2010 the closing price of our Common Stock was $4.78 share, as reported on the NYSE and there were 208,338,376 shares of Common Stock outstanding, held by approximately 2,966 stockholders of record. The number of holders does not include individuals or entities who beneficially own shares but whose shares are held of record by a broker or clearing agency, but does include each such broker or clearing agency as one recordholder.
Distribution Policy
We intend to continue to elect and qualify to be taxed as a REIT for U.S. federal income tax purposes. U.S. federal income tax law requires that a REIT distribute with respect to each year at least 90% of its annual REIT taxable income, determined without regard to the deduction for dividends paid and excluding any net capital gain. We will not be required to make distributions with respect to income derived from the activities conducted through our taxable REIT subsidiaries that is not distributed to us. To the extent our taxable REIT subsidiaries’ income is not distributed and is instead reinvested in the operations of these entities, the value of our equity interest in our taxable REIT subsidiaries will increase. The aggregate value of the securities that we hold in our taxable REIT subsidiaries may not exceed 25% (20% for taxable years beginning before July 30, 2008) of the total value of our gross assets. Distributions from our taxable REIT subsidiaries to us will qualify for the 95% gross income test but will not qualify for the 75% gross income test.
To satisfy the requirements to qualify as a REIT and generally not be subject to U.S. federal income and excise tax, we intend to make regular quarterly distributions of all or substantially all of our taxable net income to holders of our Common Stock out of assets legally available therefore. Any future distributions we make will be at the discretion of our board of directors and will depend upon our earnings and financial condition, maintenance of REIT qualification, applicable provisions of the MGCL and such other factors as our board of directors deems relevant.
We anticipate that, for U.S. federal income tax purposes, distributions (including certain part cash, part stock distributions) generally will be taxable to our stockholders as ordinary income, although some portion of our distributions may constitute qualified dividend income, capital gains or a return of capital.
33
Table of Contents
The following table sets forth the distributions that have been declared by our board of directors on our Common Stock during the fiscal years ended December 31, 2009 and 2008.
| Amount Declared During Quarter Ended in 2009: |
Per Share | Date Paid | |||
| December 31, |
$ | 0.07 | January 15, 2010 | ||
| September 30, |
0.07 | October 16, 2009 | |||
| June 30, |
0.08 | July 17, 2009 | |||
| March 31, |
0.08 | April 17, 2009 | |||
| Total 2009 |
$ | 0.30 | |||
| Amount Declared During Quarter Ended in 2008: |
Per Share | Date Paid | |||
| December 31, |
$ | 0.08 | January 16, 2009 | ||
| September 30, |
0.16 | October 17, 2008 | |||
| June 30, |
0.16 | July 18, 2008 | |||
| March 31, |
0.16 | April 18, 2008 | |||
| Total 2008 |
$ | 0.56 | |||
34
Table of Contents
Performance Graph
The graph below shows a comparison of cumulative total stockholder returns for DCT Industrial Trust Inc. Common Stock with the cumulative total return on the Standard and Poor’s 500 Index, the MSCI US REIT Index and the FTSE NAREIT Equity Industrial Index. The MSCI US REIT Index represents performance of publicly traded REITS while the FTSE NAREIT Equity Industrial Index represents only the performance of our peers, publicly traded industrial REITS. Stockholders’ returns over the indicated period are based on historical data and should not be considered indicative of future stockholder returns.
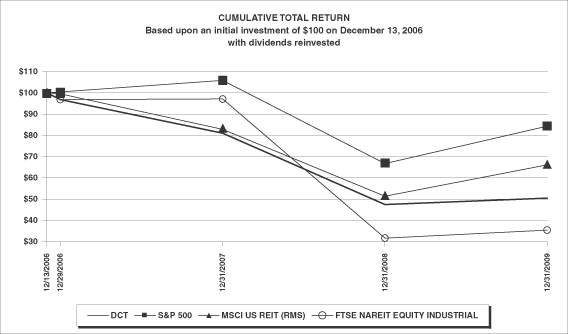
| December 13, | December 29, | December 31, | December 31, | December 31, | ||||||
| 2006 |
2006 |
2007 |
2008 |
2009 | ||||||
| DCT |
$100.00 | $96.86 | $81.09 | $47.48 | 50.43 | |||||
| FTSE NAREIT EQUITY INDUSTRIAL |
$100.00 | $96.90 | $97.27 | $31.64 | 35.49 | |||||
| S&P 500 |
$100.00 | $100.44 | $105.96 | $66.76 | 84.42 | |||||
| MSCI US REIT (RMS) |
$100.00 | $99.58 | $82.84 | $51.38 | 66.08 |
| Note: | The graph covers the period from December 13, 2006 to December 31, 2009 and assumes that $100 was invested in DCT Industrial Trust Common Stock and in each index on December 13, 2006 and that all dividends were reinvested. |
35
Table of Contents
| ITEM 6. | SELECTED FINANCIAL DATA |
The following table sets forth selected financial data relating to our historical financial condition and results of operations for the years ended December 31, 2009, 2008, 2007, 2006, and 2005. Certain amounts presented for the periods ended December 31, 2008, 2007, 2006 and 2005 have been reclassified to conform to the 2009 presentation which includes the required retrospective impact of new accounting standards adopted as of January 1, 2009. The financial data in the table should be read in conjunction with, “Item 6. Management’s Discussion and Analysis of Financial Condition and Results of Operations” and our Consolidated Financial Statements and related notes in “Item 7. Financial Statements and Supplementary Data.”
| For the Years Ended December 31, | ||||||||||||||||||||
| 2009 | 2008 | 2007 | 2006 | 2005 | ||||||||||||||||
| (amounts in thousands, except per share data) | ||||||||||||||||||||
| Operating Data: |
||||||||||||||||||||
| Rental revenues |
$ | 241,305 | $ | 245,618 | $ | 242,945 | $ | 207,019 | $ | 113,297 | ||||||||||
| Total revenues |
$ | 244,006 | $ | 248,542 | $ | 245,816 | $ | 208,275 | $ | 113,297 | ||||||||||
| Rental expenses and real estate taxes |
$ | (67,625 | ) | $ | (64,224 | ) | $ | (59,970 | ) | $ | (47,690 | ) | $ | (25,813 | ) | |||||
| Total operating expenses |
$ | (207,290 | ) | $ | (206,076 | ) | $ | (188,661 | ) | $ | (171,185 | ) | $ | (102,959 | ) | |||||
| Loss on contract termination and related Internalization (1) expenses |
$ | — | $ | — | $ | — | $ | (173,248 | ) | $ | — | |||||||||
| Income (loss) from continuing operations |
$ | (23,931 | ) | $ | (12,564 | ) | $ | 454 | $ | (175,699 | ) | $ | (14,423 | ) | ||||||
| Income from discontinued operations |
$ | 2,217 | $ | 23,501 | $ | 16,126 | $ | 8,565 | $ | 1,937 | ||||||||||
| Gain on dispositions of real estate interests |
$ | 5 | $ | 504 | $ | 30,748 | $ | 9,409 | $ | — | ||||||||||
| Net income (loss) attributable to DCT common stockholders |
$ | (18,585 | ) | $ | 9,486 | $ | 40,112 | $ | (158,973 | ) | $ | (11,960 | ) | |||||||
| Per Share Data: |
||||||||||||||||||||
| Basic earnings (loss) per common share: |
||||||||||||||||||||
| Income (loss) from continuing operations |
$ | (0.11 | ) | $ | (0.06 | ) | $ | 0.00 | $ | (1.17 | ) | $ | (0.14 | ) | ||||||
| Income from discontinued operations |
0.01 | 0.11 | 0.08 | 0.05 | 0.02 | |||||||||||||||
| Gain on dispositions of real estate interests |
0.00 | 0.00 | 0.16 | 0.06 | — | |||||||||||||||
| Net income (loss) attributable to DCT common stockholders |
$ | (0.10 | ) | $ | 0.05 | $ | 0.24 | $ | (1.06 | ) | $ | (0.12 | ) | |||||||
| Diluted earnings (loss) per common share: |
||||||||||||||||||||
| Income (loss) from continuing operations |
$ | (0.11 | ) | $ | (0.06 | ) | $ | 0.00 | $ | (1.17 | ) | $ | (0.14 | ) | ||||||
| Income from discontinued operations |
0.01 | 0.11 | 0.08 | 0.05 | 0.02 | |||||||||||||||
| Gain on dispositions of real estate interests |
0.00 | 0.00 | 0.16 | 0.06 | — | |||||||||||||||
| Net income (loss) attributable to DCT common stockholders |
$ | (0.10 | ) | $ | 0.05 | $ | 0.24 | $ | (1.06 | ) | $ | (0.12 | ) | |||||||
| Weighted average shares outstanding, basic (in thousands) |
192,900 | 171,695 | 168,358 | 150,320 | 97,333 | |||||||||||||||
| Weighted average shares outstanding, diluted (in thousands) |
192,900 | 171,695 | 168,359 | 150,320 | 97,333 | |||||||||||||||
| Amounts Attributable to DCT Common Stockholders: |
||||||||||||||||||||
| Income (loss) from continuing operations attributable to DCT common stockholders |
$ | (20,502 | ) | $ | (10,340 | ) | $ | 577 | $ | (175,699 | ) | $ | (13,926 | ) | ||||||
| Income (loss) from continuing operations attributable to DCT common stockholders |
1,913 | 19,415 | 13,597 | 7,665 | 1,966 | |||||||||||||||
| Gain on dispositions of real estate interests attributable to DCT common stockholders |
4 | 411 | 25,938 | 9,061 | — | |||||||||||||||
| Net income (loss) attributable to DCT common stockholders |
$ | (18,585 | ) | $ | 9,486 | $ | 40,112 | $ | (158,973 | ) | $ | (11,960 | ) | |||||||
| Common Share Distributions: |
||||||||||||||||||||
| Common share cash distributions, declared |
$ | 59,364 | $ | 96,223 | $ | 107,618 | $ | 98,145 | $ | 62,292 | ||||||||||
| Common share cash distributions, declared per share |
$ | 0.300 | $ | 0.560 | $ | 0.640 | $ | 0.639 | $ | 0.640 | ||||||||||
(footnotes on page 38)
36
Table of Contents
| As of, and For the Years Ended December 31, | ||||||||||||||||||||
| 2009 | 2008 | 2007 | 2006 | 2005 | ||||||||||||||||
| (dollar amounts in thousands) | ||||||||||||||||||||
| Balance Sheet Data: |
||||||||||||||||||||
| Net investment in real estate |
$ | 2,576,410 | $ | 2,605,909 | $ | 2,674,965 | $ | 2,707,650 | $ | 1,904,411 | ||||||||||
| Total assets |
$ | 2,664,292 | $ | 2,703,843 | $ | 2,778,992 | $ | 2,848,224 | $ | 2,057,695 | ||||||||||
| Mortgage notes |
$ | 511,715 | $ | 574,634 | $ | 649,568 | $ | 641,081 | $ | 642,242 | ||||||||||
| Total liabilities |
$ | 1,220,659 | $ | 1,302,343 | $ | 1,266,538 | $ | 1,394,407 | $ | 869,307 | ||||||||||
| Cash Flow Data: |
||||||||||||||||||||
| Net cash provided by operating activities |
$ | 109,749 | $ | 128,349 | $ | 116,949 | $ | 91,714 | $ | 66,295 | ||||||||||
| Net cash used in investing activities |
$ | (17,673 | ) | $ | (42,317 | ) | $ | (3,670 | ) | $ | (968,761 | ) | $ | (750,877 | ) | |||||
| Net cash provided by (used in) financing activities |
$ | (92,637 | ) | $ | (96,832 | ) | $ | (106,108 | ) | $ | 805,439 | $ | 755,980 | |||||||
| Funds From Operations (2): |
||||||||||||||||||||
| Net income (loss) attributable to DCT Common Stockholders |
$ | (18,585 | ) | $ | 9,486 | $ | 40,112 | $ | (158,973 | ) | $ | (11,960 | ) | |||||||
| Adjustments: |
||||||||||||||||||||
| Real estate related depreciation and amortization |
111,250 | 119,604 | 115,465 | 111,792 | 72,206 | |||||||||||||||
| Equity in (income) losses of unconsolidated joint ventures, net |
(2,698 | ) | (2,267 | ) | (433 | ) | 289 | — | ||||||||||||
| Equity in FFO of unconsolidated joint ventures |
11,807 | 6,806 | 2,742 | 545 | — | |||||||||||||||
| (Gain) on dispositions of real estate interests |
(1,354 | ) | (21,991 | ) | (42,873 | ) | (14,596 | ) | — | |||||||||||
| Gain on dispositions of non-depreciable assets |
783 | 219 | 15,135 | 4,244 | — | |||||||||||||||
| Loss on business combinations |
10,325 | — | — | — | — | |||||||||||||||
| Noncontrolling interest in the operating partnership’s share of the above adjustments |
(17,907 | ) | (17,664 | ) | (14,711 | ) | (5,561 | ) | (1,939 | ) | ||||||||||
| FFO attributable to unitholders |
14,881 | 19,795 | 22,180 | — | 262 | |||||||||||||||
| Funds from operations attributable to common stockholders and unitholders—basic and diluted |
$ | 108,502 | $ | 113,988 | $ | 137,617 | $ | (62,260 | ) | $ | 58,569 | |||||||||
| FFO per common share and unit, basic and diluted |
$ | 0.48 | $ | 0.55 | $ | 0.68 | $ | (0.39 | ) | $ | 0.60 | |||||||||
| Adjustments for impairment, severance and Internalization expenses: |
||||||||||||||||||||
| Impairment losses |
$ | 981 | $ | 10,746 | $ | — | $ | — | $ | — | ||||||||||
| Severance costs |
2,966 | — | — | — | — | |||||||||||||||
| Loss on contract termination and related Internalization expenses |
— | — | — | 173,248 | — | |||||||||||||||
| FFO excluding impairment, severance and Internalization expenses (3):: |
$ | 112,449 | $ | 124,734 | $ | 137,617 | $ | 110,988 | $ | 58,569 | ||||||||||
| FFO as adjusted, per common share and unit, basic and diluted (3):: |
$ | 0.50 | $ | 0.60 | $ | 0.68 | $ | 0.70 | $ | 0.60 | ||||||||||
| FFO weighted average common shares and units outstanding: |
||||||||||||||||||||
| Common shares |
192,900 | 171,695 | 168,358 | 150,320 | 37,908 | |||||||||||||||
| Participating securities |
1,535 | 1,106 | 688 | 94 | — | |||||||||||||||
| Units |
30,660 | 35,868 | 32,496 | 7,777 | 20 | |||||||||||||||
| FFO weighted average common shares and units outstanding—basic: |
225,095 | 208,669 | 201,542 | 158,191 | 37,928 | |||||||||||||||
| Dilutive common stock equivalents |
189 | 3 | 1 | — | — | |||||||||||||||
| FFO weighted average common shares and units outstanding—diluted: |
225,284 | 208,672 | 201,543 | 158,191 | 37,928 | |||||||||||||||
| Consolidated, operating square feet (in thousands) |
52,910 | 51,209 | 50,364 | 52,885 | 37,503 | |||||||||||||||
| Consolidated operating buildings |
375 | 370 | 364 | 358 | 246 | |||||||||||||||
(footnotes on page 38)
37
Table of Contents
The following table is a reconciliation of our property net operating income, or NOI, to our reported “Income (Loss) From Continuing Operations” for the years ended December 31, 2009, 2008, 2007, 2006 and 2005 (in thousands):
| For the Years Ended December 31, | ||||||||||||||||||||
| 2009 | 2008 | 2007 | 2006 | 2005 | ||||||||||||||||
| Property NOI (4) |
$ | 173,680 | $ | 181,394 | $ | 182,975 | $ | 159,329 | $ | 87,484 | ||||||||||
| Institutional capital management and other fees |
2,701 | 2,924 | 2,871 | 1,256 | — | |||||||||||||||
| Real estate related depreciation and amortization |
(110,441 | ) | (115,739 | ) | (109,144 | ) | (102,208 | ) | (65,451 | ) | ||||||||||
| General and administrative expenses |
(29,224 | ) | (21,799 | ) | (19,547 | ) | (7,861 | ) | (2,794 | ) | ||||||||||
| Asset management fees, related party |
— | — | — | (13,426 | ) | (8,901 | ) | |||||||||||||
| Equity in income (losses) of unconsolidated joint ventures, net |
2,698 | 2,267 | 433 | (289 | ) | — | ||||||||||||||
| Loss on business combinations |
(10,325 | ) | — | — | — | — | ||||||||||||||
| Impairment losses |
(300 | ) | (9,047 | ) | — | — | — | |||||||||||||
| Loss on contract termination and other Internalization expenses |
— | — | — | (173,248 | ) | — | ||||||||||||||
| Interest expense |
(52,792 | ) | (52,997 | ) | (60,341 | ) | (65,868 | ) | (27,744 | ) | ||||||||||
| Interest income and other |
1,918 | 1,257 | 4,666 | 5,361 | 3,193 | |||||||||||||||
| Income and other taxes |
(1,846 | ) | (824 | ) | (1,459 | ) | (1,392 | ) | (210 | ) | ||||||||||
| Income (loss) from continuing operations |
$ | (23,931 | ) | $ | (12,564 | ) | $ | 454 | $ | (198,346 | ) | $ | (14,423 | ) | ||||||
| (1) | Prior to October 10, 2006, our day-to-day operations were managed by Dividend Capital Advisors LLC, or our Former Advisor, under the supervision of our board of directors pursuant to the terms and conditions of an advisory agreement with our Former Advisor. On October 10, 2006, our operating partnership acquired our Former Advisor in the transaction we refer to as the Internalization. As a result of the Internalization, we became a self-administered and self-advised REIT, as our Former Advisor is now our wholly-owned subsidiary, and we no longer incur the cost of the advisory fees and other amounts payable under the advisory agreement. |
| (2) | We believe that net income, as defined by GAAP, is the most appropriate earnings measure. However, we consider FFO as defined by the National Association of Real Estate Investment Trusts, or NAREIT, to be a useful supplemental, non-GAAP measure of our operating performance. NAREIT developed FFO as a relative measure of performance of an equity REIT in order to recognize that the value of income-producing real estate historically has not depreciated on the basis determined under GAAP. FFO is generally defined as net income attributable to common stockholders, calculated in accordance with GAAP, plus real estate-related depreciation and amortization, less gain (or loss) from dispositions of operating real estate held for investment purposes and adjustments to derive our pro rata share of FFO of unconsolidated joint ventures. We exclude gains and losses on business combinations and include the gains or losses from dispositions of properties which were acquired or developed with the intention to sell or contribute to an investment fund in our definition of FFO. Although the NAREIT definition of FFO predates the GAAP guidance for accounting for gains and losses on business combinations, we believe that excluding such gains and losses is consistent with the key objective of FFO as a performance measure. Readers should note that FFO captures neither the changes in the value of our properties that result from use or market conditions, nor the level of capital expenditures and leasing commissions necessary to maintain the operating performance of our properties, all of which have real economic effect and could materially impact our results from operations. NAREIT’s definition of FFO is subject to interpretation and modifications to the NAREIT definition of FFO are common. Accordingly, our FFO may not be comparable to such other REITs’ FFO and, FFO should be considered only as a supplement to net income as a measure of our performance. |
| (3) | We believe that FFO excluding severance and impairment losses is useful supplemental information regarding our operating performance as it provides a more meaningful and consistent comparison of our operating performance and allows investors to more easily compare our operating results without taking into account the non-routine and unrelated severance charges and impairment losses relating to the decrease in value of certain real estate assets and investments in unconsolidated joint ventures that we incurred during 2009 and 2008 primarily in connection with the current economic slow-down in the United States. Additionally, we believe that FFO excluding the loss on contract termination and related Internalization expenses is useful supplemental information regarding our operating performance as it allows investors to more easily compare our operating results without taking into account the significant charge that we incurred in the fourth quarter of 2006 in connection with the Internalization of our management. |
38
Table of Contents
| (4) | Property net operating income, or property NOI, is defined as rental revenues, including reimbursements, less rental expenses and real estate taxes, which excludes depreciation, amortization, general and administrative expenses and interest expense. We consider property NOI to be an appropriate supplemental performance measure because property NOI reflects the operating performance of our properties and excludes certain items that are not considered to be controllable in connection with the management of the property such as depreciation, amortization, general and administrative expenses and interest expense. However, property NOI should not be viewed as an alternative measure of our financial performance since it excludes expenses which could materially impact our results of operations. Further, our property NOI may not be comparable to that of other real estate companies, as they may use different methodologies for calculating property NOI. Therefore, we believe net income, as defined by GAAP, to be the most appropriate measure to evaluate our overall financial performance. |
39
Table of Contents
| ITEM 7. | MANAGEMENT’S DISCUSSION AND ANALYSIS OF FINANCIAL CONDITION AND RESULTS OF OPERATIONS |
Overview
DCT Industrial Trust Inc. is a leading industrial real estate company that owns, operates and develops high-quality bulk distribution and light industrial properties in high-volume distribution markets in the U.S. and Mexico. As of December 31, 2009, the Company owned interests in, managed or had under development approximately 75.4 million square feet of assets leased to approximately 810 customers, including 14.6 million square feet managed on behalf of three institutional capital management joint venture partners, and had 6.6 million square feet in the development pipeline. Our portfolio primarily consists of high-quality, generic bulk distribution warehouses and light industrial properties. We own our properties through our operating partnership and its subsidiaries. DCT Industrial Trust Inc. is the sole general partner and owned approximately 88% of the outstanding equity interests of our operating partnership as of December 31, 2009. We acquired our first property in June 2003 and our portfolio consists of 375 consolidated operating properties as of December 31, 2009.
Our primary business objectives are to maximize long-term growth in earnings and Funds From Operations, or FFO, as defined on page 38, and to maximize the value of our portfolio and the total return to our stockholders. In our pursuit of these long-term objectives, we seek to:
| • | maximize cash flows from existing operating and development properties; |
| • | deploy capital into high quality acquisitions which meet our asset, location and financial critera; and |
| • | recycle capital by selling assets that no longer fit our investment criteria and reinvesting in higher return opportunities. |
Outlook
The primary source of our operating revenues and earnings is rents received from tenants under operating leases at our properties, including reimbursements from tenants for certain operating costs. We seek long-term earnings growth primarily through increasing rents and operating income at existing properties, acquiring and developing high-quality properties in major distribution markets, and increasing fee revenues from our institutional capital management program.
We believe near-term operating income from our existing properties will continue to decrease as the decline in demand for warehouse space together with historically high levels of available competitive space result in lower rents and higher vacancy levels. The slowing economy has impacted or may impact our performance in several ways including: negative rent growth on signed leases, fewer lease renewals, decreased leasing of existing vacancies, and an increase in early terminations, bankruptcies and requests for rent relief from our customers. The weak economic conditions have caused a higher level of bankruptcies nationally, reducing the demand for warehouse space and resulting in decreased occupancy and lower rental rates. Further, the decline in market values of real estate assets could result in additional impairment losses compared to prior years and less attractive pricing for any assets that we do sell.
The stabilization of the U.S. economy, including positive growth in Gross Domestic Product in each of the last two quarters of 2009, is expected to contribute to an improvement in industrial real estate fundamentals by mid-2010. While rental rates and occupancy rates are at historic lows, we believe that market fundamentals will begin to recover in 2010 from the rapid deterioration that occurred in 2008 and 2009 though the recovery is likely to be slow and modest.
Although the credit markets for the real estate sector continue to be constrained due to the impact of declining property values over the past two years, the availability of equity and debt capital for well capitalized real estate companies has dramatically improved from the depths of the liquidity crisis in late 2008 and early 2009. We believe that our sources of capital are adequate to meet our liquidity requirements. We have no major debt
40
Table of Contents
maturities until June 2010 when a $300.0 million senior unsecured term loan comes due which can be extended at our option for one year so that we would not have any significant debt maturities until 2011. Additionally, as of December 31, 2009, we had $300.0 million available under our unsecured credit facility, which matures in December 2010. These capital resources may be utilized in part to finance costs of leasing and maintaining our properties as discussed in “Liquidity and Capital Resources” as well as to pay down existing debt, fund equityholder distributions, and finance acquisitions. While we maintain hedges to manage a portion of our interest rate risk (for further discussion on our hedges, see “Notes to Consolidated Financial Statements, Note 6 – Financial Instruments and Hedging Activities”), future debt refinancing will likely be at higher interest rates than existing rates on our borrowings due to the current market conditions.
The principal risks to our business plan include:
| • | the challenges that we may face as a result of the current economic slow-down, including decreased demand for warehouse space, tenant bankruptcies, declining real estate values and other challenges; |
| • | our ability to lease space to customers at rates which provide acceptable returns and credit risks; |
| • | our ability to sell assets at prices we find acceptable which generates funding for our business plan; |
| • | our ability to finance our on-going capital needs, refinance future maturities and the related costs; |
| • | our ability to acquire properties that meet our quantitative and qualitative investment criteria; and |
| • | our ability to retain and attract talented people. |
We believe our investment focus on the largest and most active distribution markets in the United States and Mexico and our monitoring of market and submarket demand and supply imbalances helps mitigate some of these risks.
We also expect the following key trends, once economic conditions improve, to affect our industry positively:
| • | the rebuilding of inventory levels by manufacturers and distributors; |
| • | the continued restructuring of corporate supply chains which may impact local demand for distribution space as companies relocate their operations consistent with their particular requirements or needs; |
| • | the continued long-term growth in international trade which necessitates the increased import and export of products in the U.S. and Mexico; and |
| • | the growth or continuing importance of industrial markets located near major transportation hubs including seaports, airports and major intermodal facilities. |
Inflation
Although the U.S. economy has been experiencing relatively flat inflation rates, and a wide variety of industries and sectors are affected differently by changing commodity prices, inflation has not had a significant impact on us in our markets of operation. Most of our leases require the tenants to pay their share of operating expenses, including common area maintenance, real estate taxes and insurance, thereby reducing our exposure to increases in costs and operating expenses resulting from inflation. In addition, many of the outstanding leases expire within five years which enables us to replace existing leases with new leases at the then-existing market rate.
41
Table of Contents
Significant Transactions During 2009
Summary of the year ended December 31, 2009
The following further describes certain significant transactions that occurred during the year ended December 31, 2009.
| • | Public Offering |
In June 2009, we issued 27.6 million shares of common stock in a public offering at a public offering price of $4.25 per share. The total net proceeds of this public offering were $111.4 million.
| • | Debt Repayment |
In September 2009, we repaid approximately $52.1 million of fixed rate mortgage notes scheduled to mature on January 1, 2010. In January 2010, we repaid $42.0 million of $112.0 million of debt previously scheduled to mature in 2012. The remaining balance of $70.0 million was refinanced at a fixed rate of 6.11% and a new maturity of 2020 and a release of mortgages on 5 properties. In February 2010, we repaid $49.9 million of $102.9 million of debt previously scheduled to mature in 2011. The remaining balance of $53.0 million was refinanced at a fixed rate of 6.17% and a new maturity of 2019 and a release of mortgages on 11 properties. The debt repayments were funded using cash provided from our public offering in June 2009, borrowings under our credit facility and cash provided from operations.
| • | Major Activities with Development Joint Ventures |
In February 2009, the SCLA venture sold 53.4 acres of land. We entered into the SCLA venture with Stirling Airports International, LLC, to be the master developer of over 4,000 acres in Victorville, California in 2006. The development project is located at the former George Air Force Base which closed in 1992 and is now known as Southern California Logistics Airport, or SCLA. For further discussion on the SCLA joint venture, see “Notes to Consolidated Financial Statements, Note 4 – Investments in and Advances to Unconsolidated Joint Ventures.”
During the year ended 2009, we acquired the third-party equity interests of three of our previously unconsolidated joint ventures, such that as of December 31, 2009, we wholly owned each venture. Two of these acquisitions were treated as business combinations and the net assets of each venture were recorded on our Consolidated Balance Sheets at their acquisition date fair values. As a result of this accounting we recorded an aggregate loss of $10.3 million on these transactions. For further discussion on these transactions, see “Notes to Consolidated Financial Statements, Note 4 – Investments in and Advances to Unconsolidated Joint Ventures.” In conjunction with these transactions, we funded the repayment of approximately $60.7 million of indebtedness associated with these ventures.
| • | Acquisition Activity |
During the year ended December 31, 2009, we acquired three development properties located in Monterrey, Mexico, comprised of approximately 0.4 million square feet for a total cost of approximately $13.0 million, which includes acquisition costs. In addition, we acquired two parcels of land comprised of approximately 12.3 acres for an aggregate cost of approximately $0.6 million, also including acquisitions costs which represent land available for expansion adjacent to existing properties. All of these properties were acquisitions of assets from unrelated third parties using existing cash balances.
| • | Disposition Activity |
During the year ended December 31, 2009, we sold three operating properties comprised of approximately 0.9 million square feet and two land parcels comprised of approximately 4.3 acres to unrelated third parties for total gross proceeds of approximately $30.7 million, which resulted in a gain of approximately $0.9 million.
42
Table of Contents
Critical Accounting Policies
General
Our discussion and analysis of financial condition and results of operations is based on our Consolidated Financial Statements which have been prepared in accordance with United States generally accepted accounting principles, or GAAP. The preparation of these financial statements requires us to make estimates and judgments that affect the reported amounts of assets, liabilities and contingencies as of the date of the financial statements and the reported amounts of revenues and expenses during the reporting periods. We evaluate our assumptions and estimates on an on-going basis. We base our estimates on historical experience and on various other assumptions that we believe to be reasonable under the circumstances, the results of which form the basis for making judgments about the carrying values of assets and liabilities that are not readily apparent from other sources. Actual results may differ from these estimates under different assumptions or conditions. Because of adverse conditions that exist in the real estate markets, as well as the credit and financial markets, it is possible that the estimates and assumptions that have been utilized in the preparation of the Consolidated Financial Statements could change materially during the time span associated with the continued weakened state of these markets. The following discussion pertains to accounting policies management believes are most critical to the portrayal of our financial condition and results of operations that require management’s most difficult, subjective or complex judgments.
Principles of Consolidation
We hold interests in both consolidated and unconsolidated joint ventures. All joint ventures over which we have financial and operating control and variable interest entities, or VIE’s, in which we have determined that we are the primary beneficiary are included in our Consolidated Financial Statements. All intercompany balances and transactions have been eliminated in consolidation. We use the equity method of accounting for all other joint ventures and include our share of earnings of these joint ventures in our consolidated net income.
Our judgment with respect to our level of influence or control over an entity and whether we are the primary beneficiary of a variable interest entity involve consideration of various factors including the form of our ownership interest, our representation on the entity’s board of directors, the size of our investment (including loans) and our ability to participate in policy making decisions. Our ability to correctly assess our influence or control over an entity affects the presentation of these investments in our Consolidated Financial Statements and, consequently, our financial position and specific items in our results of operations that are used by our stockholders, lenders and others in their evaluation of us.
Capitalization of Costs
We capitalize costs directly related to the development, predevelopment, redevelopment or improvement of our investments in properties. Costs associated with our development projects are capitalized as incurred. If the project is abandoned, these costs are expensed during the period in which the project is abandoned. Costs considered for capitalization include, but are not limited to, construction costs, interest, real estate taxes, insurance and leasing costs if appropriate. We capitalize indirect costs such as personnel, office, and administrative expenses that are directly related to our development projects based on time spent on the development activities. Interest is capitalized based on actual capital expenditures from the period when development or redevelopment commences until the asset is substantially complete based on our current weighted average borrowing rates. Costs incurred for maintaining and repairing our properties, which do not extend their useful lives, are expensed as incurred.
We also capitalize interest on our investments in unconsolidated joint ventures. Interest is capitalized based on the average capital invested in a venture during the period when development or predevelopment begins until planned principle operations commence at our current weighted average borrowing rates.
43
Table of Contents
Fair Value
In September 2006, the Financial Accounting Standards Board, or FASB, issued guidance related to accounting for fair value measurements which defines fair value, establishes a framework for measuring fair value and expands disclosures about fair value measurements. Fair value is defined as the exit price or price at which an asset (in its highest and best use) would be sold or liability assumed by an informed market participant in a transaction that is not distressed and is executed in the most advantageous market.
While this guidance does not impose any new fair value requirements, it provides guidance on how to determine such measurements on reported balances which are required or permitted to be measured at fair value under existing accounting pronouncements and emphasizes that fair value is a market-based rather than an entity-specific measurement. Therefore, our fair value measurement is determined based on the assumptions that market participants would use in pricing the asset or liability. As a basis for considering market participant assumptions in fair value measurements, this guidance establishes a fair value hierarchy that distinguishes between market participant assumptions based on market data obtained from sources independent of the reporting entity (observable inputs that are classified within Levels 1 and 2 of the hierarchy) and the reporting entity’s own assumptions about market participant assumptions based on the best information available in the circumstances (unobservable inputs classified within Level 3 of the hierarchy).
Level 1 inputs utilize quoted prices (unadjusted) in active markets for identical assets or liabilities. Level 2 inputs are inputs other than quoted prices included in Level 1 that are observable for the asset or liability, either directly or indirectly. Level 2 inputs may include quoted prices for similar assets and liabilities in active markets, as well as inputs that are observable for the asset or liability (other than quoted prices), such as interest rates, foreign exchange rates and yield curves that are observable at commonly quoted intervals. Level 3 inputs are unobservable inputs for the asset or liability, that are typically based on an entity’s own assumptions, as there is little, if any, related market activity. In instances where the determination of the fair value measurement is based on inputs from different levels of the fair value hierarchy, the level in the fair value hierarchy within which the entire fair value measurement falls is based on the lowest level input that is significant to the fair value measurement in its entirety. Our assessment of the significance of a particular input to the fair value measurement in its entirety requires judgment, and considers factors specific to the asset or liability.
Currently, we use interest rate swaps to manage certain interest rate risk. The valuation of these instruments is determined using widely accepted valuation techniques including discounted cash flow analysis on the expected cash flows of each derivative. This analysis reflects the contractual terms of the derivatives, including the period to maturity, and uses observable market-based inputs, including interest rate curves. The fair values of interest rate swaps are determined using the market standard methodology of netting the discounted future fixed cash receipts (or payments) and the discounted expected variable cash payments (or receipts). The variable cash payments (or receipts) are based on an expectation of future interest rates (forward curves) derived from observable market interest rate curves. We incorporate credit valuation adjustments to appropriately reflect both our own nonperformance risk and the respective counterparty’s nonperformance risk in the fair value measurements. In adjusting the fair value of our derivative contracts for the effect of nonperformance risk, we have considered the impact of netting and any applicable credit enhancements, such as collateral postings, thresholds, mutual puts and guarantees.
Although we have determined that the majority of the inputs used to value our derivatives fall within Level 2 of the fair value hierarchy, the credit valuation adjustments associated with our derivatives utilize Level 3 inputs, such as estimates of current credit spreads to evaluate the likelihood of default by us and our counterparties. Prior to January 1, 2009, we classified all derivatives in Level 2 of the fair value hierarchy. During the period beginning January 1, 2009 and ending December 31, 2009, credit spreads used in the calculation of the credit valuation adjustment increased such that the credit valuation adjustment was determined to be significant to the overall fair value of its derivative positions thereby changing the classification from Level 2 to Level 3.
44
Table of Contents
Effective January 1, 2008, we adopted this guidance with respect to our financial assets and liabilities without a material impact on our Consolidated Financial Statements. As of January 1, 2009, nonfinancial assets and nonfinancial liabilities recognized on a nonrecurring basis were also subject to this guidance related to accounting for fair value measurements. We adopted these additional provisions without a material impact on our Consolidated Financial Statements.
Investment in Properties
We record the assets, liabilities and noncontrolling interests associated with property acquisitions which qualify as business combinations at their respective acquisition-date fair values. Acquisition-related costs associated with business combinations are expensed as incurred. As defined by GAAP, a business is an integrated set of activities and assets that is capable of being conducted and managed for the purpose of providing a return in the form of dividends, lower costs, or other economic benefits directly to investors or other owners, members, or participants. We do not consider acquisitions of land or unoccupied development buildings to be business combinations, and as such, these transactions are treated as asset acquisitions and recorded at cost.
The fair value of identifiable tangible assets such as land, building, building and land improvements and tenant improvements is determined on an “as-if-vacant” basis. Management considers Level 3 inputs such as the replacement cost of such assets, appraisals, property condition reports, market data and other related information in determining the fair value of the tangible assets. The difference between the fair value and the face value of debt assumed in connection with an acquisition is recorded as a premium or discount and amortized to “Interest expense” over the life of the debt assumed. The valuation of assumed liabilities is based on the current market rate for similar liabilities. The recorded fair value of intangible lease assets includes Level 3 inputs and represents the value associated with in-place leases which may include leasing commissions, legal and other costs, as well as an intangible asset or liability resulting from in-place leases being above or below the market rental rates on the date of the acquisition. Intangible lease assets or liabilities are amortized over the life of the remaining in-place leases as an adjustment to “Rental revenues” or “Real estate related depreciation and amortization” depending on the nature of the intangible.
We have certain properties which we have acquired or removed from service with the intention to redevelop the property. Buildings under redevelopment require significant construction activities prior to being placed back into service. Additionally, we may acquire, develop, or redevelop certain properties with the intention to contribute the property to an institutional capital management joint venture, in which we may retain ownership in or manage the assets of the joint venture. We refer to these properties as held for contribution. We generally do not depreciate properties classified as redevelopment or held for contribution until the date that the redevelopment properties are ready for their intended use or the property held for contribution no longer meets GAAP held for sale criteria.
Real estate, including land, building, building and land improvements, tenant improvements and leasing costs and intangible lease assets and liabilities are stated at historical cost less accumulated depreciation and amortization, unless circumstances indicate that cost cannot be recovered, in which case, the carrying value of the property is reduced to estimated fair value.
Depreciation and Useful Lives of Real Estate Assets
Depreciation and amortization are computed on a straight-line basis over the estimated useful lives of the related assets or liabilities. Our ability to assess the useful lives of our real estate assets accurately is critical to the determination of the appropriate amount of depreciation expense recorded and the carrying values of the underlying assets. Any change to the estimated depreciable lives of these assets would have an impact on the depreciation expense we recognize.
The following table reflects the standard depreciable lives typically used to compute depreciation and amortization. However, such depreciable lives may be different based on the estimated useful life of such assets or liabilities. The carrying value of assets sold or retired and the related accumulated depreciation and/or
45
Table of Contents
amortization is derecognized and the resulting gain or loss, if any, is reflected in our Consolidated Statements of Operations during the period in which such sale or retirement occurs. If the useful life estimate was reduced by one year for all buildings and building and land improvements in continuing operations, depreciation expense would have increased $2.4 million on an annual basis.
| Description |
Standard Depreciable Life | |
| Land |
Not depreciated | |
| Building |
20 – 40 years | |
| Building and land improvements |
5 – 20 years | |
| Tenant improvements |
Shorter of lease term or useful life | |
| Leasehold improvements |
5 – 20 years | |
| Leasing costs |
Lease term | |
| Other intangible lease assets |
Average term of leases for property | |
| Above/below market rent assets/liabilities |
Lease term |
Depreciation is not recorded on real estate assets currently held for sale or contribution, in pre-development, or being developed or redeveloped until the building is substantially completed and ready for its intended use, normally not later than one year from cessation of major construction activity.
Impairment of Long-Lived Assets
Long-lived assets to be held and used are carried at cost and evaluated for impairment when events or changes in circumstances indicate that the carrying amounts of these assets may not be fully recoverable and at least annually. Examples of such changes in circumstances include the point at which we deem the long-lived asset to be held for sale or a building remains vacant significantly longer than expected. For long-lived assets that we intend to hold long-term, the recoverability is based on the estimated future undiscounted cash flows. If the asset is not supported on an undiscounted cash flow basis, the amount of impairment is measured as the difference between the carrying value and the fair value of the asset. Long lived assets classified as held for sale are measured at the lower of their carrying amount or fair value less costs to sell.
The determination of fair value involves a number of management assumptions relating to future economic events that could materially affect the determination of the ultimate value, and therefore, the carrying amounts of our real estate. Such assumptions are Level 3 inputs and include, but are not limited to, projected vacancy rates, rental rates, property operating expenses and capital expenditures. The capitalization rate is also a significant driving factor in determining the property valuation and requires management’s judgment of factors such as market knowledge, historical experience, lease terms, tenant financial strength, economy, demographics, environment, property location, visibility, age, physical condition and investor return requirements, among other things. The aforementioned factors are taken as a whole by management in determining the valuation of investment property. The valuation is sensitive to the actual results of any of these uncertain factors, either individually or taken as a whole. Should the actual results differ from management’s estimates, the valuation could be negatively affected and may result in additional impairments recorded in our Consolidated Financial Statements.
Investments in Unconsolidated Joint Ventures
We account for our investments in unconsolidated joint ventures under the equity method because we exercise significant influence over, but do not control, these entities. Under the equity method, these investments (including advances to joint ventures) are initially recorded at cost and are subsequently adjusted to reflect our proportionate share of net earnings or losses of each of the joint ventures, distributions received, contributions made and certain other adjustments, as appropriate. Such investments are included in “Investments in and advances to unconsolidated joint ventures” in our Consolidated Balance Sheets. Distributions from these investments that are related to earnings from operations are included as operating activities and distributions that are related to capital transactions are included as investing activities in our Consolidated Statements of Cash Flows.
46
Table of Contents
Investment properties that are contributed to unconsolidated joint ventures are not considered discontinued operations due to our continuing involvement through maintaining an ownership interest in these investment properties and continuing to act as manager of the assets. We recognize any gains from the contribution of investment properties into an unconsolidated joint venture if the recognition criteria have been met. Such gains are recognized to the extent of the outside ownership interest in the joint venture in our Consolidated Statements of Operations under the heading of “Gain on dispositions of real estate interests.” Any gain related to the remaining proceeds reduces our basis in the investment in the unconsolidated joint venture, and is recognized into earnings over the weighted average life of the related property’s real estate assets. We recognize our proportionate share of the ongoing earnings or losses of each unconsolidated joint venture in “Equity in income of unconsolidated joint ventures, net” in our Consolidated Statements of Operations.
We evaluate our investments in unconsolidated entities for impairment whenever events or changes in circumstances indicate that there may be an other-than-temporary decline in value. The amount of impairment recognized is the excess of the investment’s carrying amount over its estimated fair value. We consider various factors to determine if a decrease in the value of the investment is other-than-temporary. These factors are Level 2 and 3 inputs and include but are not limited to, age of the venture, our intent and ability to retain our investment in the entity, the financial condition and long-term prospects of the entity, and the relationships with the other joint venture partners and its lenders. If we believe that the decline in the fair value is temporary, no impairment is recorded. The aforementioned factors are taken as a whole by management in determining the valuation of our investment property. Should the actual results differ from management’s estimates, the valuation could be negatively affected and may result in a negative impact on our Consolidated Financial Statements.
Revenue Recognition
We record rental revenues on a straight-line basis under which contractual rent increases are recognized evenly over the full lease term. Certain properties have leases that provide for tenant occupancy during periods where no rent is due or where minimum rent payments change during the term of the lease. Accordingly, we record receivables from tenants that we expect to collect over the remaining lease term rather than currently, which are recorded as straight-line rent receivable. When we acquire a property, the terms of existing leases are considered to commence as of the acquisition date for the purposes of this calculation.
Tenant recovery income includes payments and amounts due from tenants pursuant to their leases for real estate taxes, insurance and other recoverable property operating expenses and is recognized as “Rental revenues” during the same period the related expenses are incurred.
In connection with property acquisitions qualifying as business combinations, we may acquire leases with rental rates above or below the market rental rates. Such differences are recorded as an intangible lease asset or liability and amortized to “Rental revenues” over the life of the related leases. The unamortized balances of these assets and liabilities associated with the early termination of leases are fully amortized to their respective revenue line items in our Consolidated Statements of Operations over the expected life of such assets and liabilities.
We maintain an allowance for estimated losses that may result from the inability of our tenants to make required payments. If a tenant fails to make contractual payments beyond any allowance, we may recognize additional bad debt expense in future periods equal to the net outstanding balances.
New Accounting Standards
In June 2009, FASB approved the FASB Accounting Standards Codification, or the Codification, as the single source of authoritative nongovernmental GAAP. All existing accounting standard documents, such as FASB, American Institute of Certified Public Accountants, Emerging Issues Task Force and other related literature, excluding guidance from the Securities and Exchange Commission (“SEC”), have been superseded by the Codification. All other non-grandfathered, non-SEC accounting literature not included in the Codification has become nonauthoritative. The Codification did not change GAAP, but instead introduced a new structure that
47
Table of Contents
combines all authoritative standards into a comprehensive, topically organized online database. The Codification is effective for interim or annual periods ending after September 15, 2009, and impacts our Consolidated Financial Statements as all references to authoritative accounting literature are now referenced in accordance with the Codification. There have been no changes to the content of our Consolidated Financial Statements or disclosures as a result of implementing the Codification during the year ended December 31, 2009.
In February 2007, the FASB issued guidance which expands the use of the fair value measurement to improve financial reporting by providing entities with the opportunity to mitigate volatility in reported earnings caused by measuring related assets and liabilities differently without having to apply complex hedge accounting provisions. Upon adoption of this guidance, we did not elect the fair value option for our existing financial assets and liabilities and therefore the guidance adoption did not have an impact on our Consolidated Financial Statements.
In December 2007, the FASB issued guidance which requires the acquiring entity in a business combination to record all assets acquired, liabilities assumed and any noncontrolling interest in the acquired entity at their respective acquisition-date fair values, changes the recognition of assets acquired and liabilities assumed arising from contingencies, changes the recognition and measurement of contingent consideration and requires the expensing of acquisition-related costs as incurred. This guidance also requires additional disclosure of information surrounding a business combination, such that users of the entity’s financial statements can fully understand the nature and financial impact of the business combination. Additionally, the FASB also issued guidance in April 2009, which amended previously issued guidance related to contingent assets and contingent liabilities. These amendments are required to be applied prospectively to business combinations for which the acquisition date is on or after the beginning of the first annual reporting period beginning on or after December 15, 2008. We adopted these amendments as of January 1, 2009 with no material impact on our Consolidated Financial Statements.
In December 2007, the FASB issued guidance which establishes new accounting and reporting standards for the noncontrolling interest in a subsidiary and requires recognition of gains or losses resulting from a change of control. Ownership changes not resulting in a change of control are treated as equity transactions. We adopted this guidance beginning January 1, 2009, prospectively, with no material impact on our Consolidated Financial Statements. However, the presentation and disclosure requirements were applied retrospectively for all periods presented which resulted in a reclassification of noncontrolling interests (formerly known as minority interests) to a separate component of total equity and a change in the treatment of net income attributable to noncontrolling interest as a reduction from net income in calculating net income available to common stockholders. The impact of this guidance implementation is presented in our Consolidated Statements of Stockholders’ Equity, Comprehensive Income (Loss) and Noncontrolling Interests.
In March 2008, the FASB issued guidance to require companies with derivative instruments to disclose information that would enable financial statement users to understand how and why a company uses derivative instruments, how derivative instruments and related hedged items are accounted for and how derivative instruments and related hedged items affect a company’s financial position, financial performance and cash flows. The new requirements apply to derivative instruments and nonderivative instruments that are designated and qualify as hedging instruments and related hedged items. This guidance is effective for financial statements issued for fiscal years and interim periods beginning after November 15, 2008 and was adopted as of January 1, 2009 with no impact on our Consolidated Financial Statements.
In June 2008, the FASB issued guidance which requires that unvested share-based payment awards that contain non-forfeitable rights to dividends or dividend equivalents are participating securities and therefore, should be included in computing earnings per share using the two-class method. This guidance also requires retrospective application for all periods presented. We implemented these requirements beginning January 1, 2009. As a result, Net Income (Loss) Attributable to DCT Common Stockholders and earnings per share (basic and diluted) are adjusted for an allocation of net income to unvested restricted stock awards and LTIP Units, including a retrospective application to prior periods. For the years ended December 31, 2009, 2008 and 2007, approximately $0.4 million, $0.7 million and $0.4 million was attributable to unvested restricted stock awards and LTIP Units.
48
Table of Contents
In April 2009, the FASB issued guidance regarding interim disclosures about fair value of financial instruments which requires that publicly traded companies include certain fair value disclosures required annually, in their interim financial statements and is effective for interim and annual periods ending after June 15, 2009, with early adoption permitted for periods ending after March 15, 2009, and must be applied prospectively. We adopted this guidance for the interim period beginning January 1, 2009 with no impact on our Consolidated Financial Statements.
In April 2009, the FASB issued guidance regarding the determination of fair value when the volume and level of activity for an asset or liability have significantly decreased and identification of transactions that are not orderly. This guidance sets forth provisions for how to determine if there has been a significant decrease in the volume and level of activity for the asset or liability when compared with normal market activity for the asset or liability. In such situations, an entity may conclude that transactions or quoted prices may not be determinative of fair value, and may adjust the transactions or quoted prices to arrive at the fair value of the asset or liability. The guidance is effective for interim and annual reporting periods ending after September 15, 2009, with early adoption permitted for periods ending after March 15, 2009, and must be applied prospectively. We adopted this guidance beginning January 1, 2009 with no material impact on our Consolidated Financial Statements.
In May 2009, the FASB issued guidance which establishes general standards of accounting for, and requires disclosure of, events that occur after the balance sheet date but before financial statements are issued or are available to be issued. This guidance is effective for interim or fiscal periods ending after June 15, 2009. Accordingly, we adopted the provisions of this guidance for the quarter ended June 30, 2009 with no material effect on our Consolidated Financial Statements. See Note 18—Subsequent Events for our subsequent event evaluation results.
In August 2009, the FASB issued Accounting Standards Update, or ASU, No. 2009-5 regarding fair value measurement of liabilities. ASU No. 2009-5 provides clarification that in circumstances in which a quoted price in an active market for the identical liability is not available, an entity is required to measure fair value utilizing one or more of the following techniques: (1) a valuation technique that uses the quoted market price of an identical liability or similar liabilities when traded as assets; or (2) another valuation technique that is consistent with previously issued fair value principles, such as a present value technique. ASU No. 2009-5 is effective for the first reporting period after the issuance, which for us was the third quarter of 2009. Accordingly, we adopted ASU No. 2009-5 for the quarter ended September, 30, 2009 with no material impact on our Consolidated Financial Statements.
Future Adoption of Accounting Standards
In June 2009, the FASB issued Statement of Financial Accounting Standards, or SFAS No. 167, Amendments to FASB Interpretation No. 46(R), or SFAS No. 167. SFAS No. 167 amends the consolidation guidance applicable to variable interest entities and the definition of a variable interest entity, and requires enhanced disclosures to provide more information about an enterprise’s involvement in a variable interest entity. This statement also requires ongoing assessments of whether an enterprise is the primary beneficiary of a variable interest entity. SFAS No. 167 is effective beginning January 1, 2010. We are currently evaluating the application of SFAS No. 167 and its effect on our Consolidated Financial Statements.
Results of Operations
Summary of the year ended December 31, 2009 compared to the year ended December 31, 2008
DCT Industrial Trust Inc. is a leading industrial real estate company that owns, operates and develops high-quality bulk distribution and light industrial properties in high-volume distribution markets in the U.S. and Mexico. The Company owns or manages more than 75.4 million square feet of assets leased to approximately 810 corporate customers, including 14.6 million square feet managed on behalf of three institutional joint venture partners. As of December 31, 2009, we consolidated 375 operating properties, 15 development properties and
49
Table of Contents
four redevelopment properties. As of December 31, 2008, we consolidated 373 operating properties (three of which were excluded from continuing operations as they were disposed of as of December 31, 2009), 12 development properties and six redevelopment properties.
The following table illustrates the changes in our consolidated operating properties in continuing operations by segment as of, and for the years ended, December 31, 2009 compared to December 31, 2008, respectively (dollar amounts in thousands).
| 2009 | 2008 | |||||||||||||||
| Bulk Distribution |
Light Industrial and Other |
Bulk Distribution |
Light Industrial and Other |
|||||||||||||
| Operating properties in continuing operations: |
||||||||||||||||
| Number of buildings |
220 | 155 | 217 | 153 | ||||||||||||
| Square feet (in thousands) |
45,048 | 7,862 | 43,526 | 7,683 | ||||||||||||
| Occupancy at end of period |
88.1 | % | 84.6 | % | 93.6 | % | 90.0 | % | ||||||||
| Segment net assets |
$ | 1,769,118 | $ | 536,888 | $ | 1,793,277 | $ | 515,094 | ||||||||
| Rental revenues |
$ | 183,525 | $ | 54,075 | $ | 187,708 | $ | 54,177 | ||||||||
| Property net operating income (1) |
$ | 133,966 | $ | 37,990 | $ | 141,967 | $ | 38,099 | ||||||||
| (1) | Property net operating income, or property NOI, is defined as rental revenues, including reimbursements, less rental expenses and real estate taxes, which excludes depreciation, amortization, general and administrative expenses and interest expense. We consider property NOI to be an appropriate supplemental performance measure because property NOI reflects the operating performance of our properties and excludes certain items that are not considered to be controllable in connection with the management of the property such as depreciation, amortization, general and administrative expenses and interest expense. However, property NOI should not be viewed as an alternative measure of our financial performance since it excludes expenses which could materially impact our results of operations. Further, our property NOI may not be comparable to that of other real estate companies, as they may use different methodologies for calculating property NOI. Therefore, we believe net income, as defined by GAAP, to be the most appropriate measure to evaluate our overall financial performance. For a reconciliation of our property net operating income to our reported “Income (Loss) From Continuing Operations”, see “Notes to Consolidated Financial Statements, Note 15—Segment Information.” |
The following table reflects our total assets, net of accumulated depreciation and amortization, by property segment (in thousands).
| December 31, 2009 |
December 31, 2008 (1) | |||||
| Property segments: |
||||||
| Bulk distribution |
$ | 1,769,118 | $ | 1,793,277 | ||
| Light industrial and other |
536,888 | 515,094 | ||||
| Total segment net assets |
2,306,006 | 2,308,371 | ||||
| Development and redevelopment assets |
178,462 | 163,160 | ||||
| Assets held for sale or disposed assets |
40,402 | |||||
| Non-segment assets: |
||||||
| Properties in pre-development including land held |
23,377 | 21,074 | ||||
| Non-segment cash and cash equivalents |
22,941 | 13,967 | ||||
| Other non-segment assets (2) |
133,506 | 156,869 | ||||
| Total Assets |
$ | 2,664,292 | $ | 2,703,843 | ||
50
Table of Contents
| (1) | Reflects reclassifications for properties classified as discontinued operations at December 31, 2009. |
| (2) | Other non-segment assets primarily consists of corporate assets including investments in unconsolidated joint ventures, notes receivable, certain loan costs, including loan costs associated with our financing obligations, and deferred acquisition costs. |
Comparison of the year ended December 31, 2009 compared to the year ended December 31, 2008
The following table illustrates the changes in rental revenues, rental expenses and real estate taxes, property net operating income, other income and other expenses for the year ended December 31, 2009 compared to the year ended December 31, 2008. Our same store portfolio includes all operating properties that we owned for the entirety of both the current and prior year reporting periods for which the operations had been stabilized. Non-same store operating properties include properties not meeting the same-store criteria and by definition exclude development and redevelopment properties. The same store portfolio for the periods presented totaled 362 operating properties and was comprised of 49.9 million square feet. A discussion of these changes follows the table (in thousands).
| Year Ended December 31, |
||||||||||||
| 2009 | 2008 | $ Change | ||||||||||
| Rental Revenues |
||||||||||||
| Same store, excluding revenues related to early lease |
$ | 227,135 | $ | 238,240 | $ | (11,105 | ) | |||||
| Non-same store operating properties |
8,447 | 2,703 | 5,744 | |||||||||
| Development and redevelopment |
3,646 | 3,733 | (87 | ) | ||||||||
| Revenues related to early lease terminations |
2,077 | 942 | 1,135 | |||||||||
| Total rental revenues |
241,305 | 245,618 | (4,313 | ) | ||||||||
| Rental Expenses and Real Estate Taxes |
||||||||||||
| Same store |
63,661 | 61,015 | 2,646 | |||||||||
| Non-same store operating properties |
1,983 | 804 | 1,179 | |||||||||
| Development and redevelopment |
1,981 | 2,405 | (424 | ) | ||||||||
| Total rental expenses and real estate taxes |
67,625 | 64,224 | 3,401 | |||||||||
| Property Net Operating Income (1) |
||||||||||||
| Same store |
163,474 | 177,225 | (13,751 | ) | ||||||||
| Non-same store operating properties |
6,464 | 1,899 | 4,565 | |||||||||
| Development and redevelopment |
1,665 | 1,328 | 337 | |||||||||
| Revenues related to early lease terminations, net |
2,077 | 942 | 1,135 | |||||||||
| Total property net operating income |
173,680 | 181,394 | (7,714 | ) | ||||||||
| Other Revenue and Other Income |
||||||||||||
| Institutional capital management and other fees |
2,701 | 2,924 | (223 | ) | ||||||||
| Gain on dispositions of real estate assets |
5 | 504 | (499 | ) | ||||||||
| Equity in income of unconsolidated joint ventures, net |
2,698 | 2,267 | 431 | |||||||||
| Interest income and other |
1,918 | 1,257 | 661 | |||||||||
| Total other revenue and other income |
7,322 | 6,952 | 370 | |||||||||
| Other Expenses |
||||||||||||
| Real estate related depreciation and amortization |
110,441 | 115,739 | (5,298 | ) | ||||||||
| Loss on business combinations |
10,325 | — | 10,325 | |||||||||
| Impairment losses |
300 | 9,047 | (8,747 | ) | ||||||||
| General and administrative expenses |
29,224 | 21,799 | 7,425 | |||||||||
| Income and other taxes |
1,846 | 824 | 1,022 | |||||||||
| Interest expense |
52,792 | 52,997 | (205 | ) | ||||||||
| Total other expenses |
204,928 | 200,406 | 4,522 | |||||||||
| Income from discontinued operations |
2,217 | 23,501 | (21,284 | ) | ||||||||
| Net (income) loss attributable to noncontrolling interests |
3,124 | (1,955 | ) | 5,079 | ||||||||
| Net Income (Loss) Attributable to DCT Common Stockholders |
$ | (18,585 | ) | $ | 9,486 | $ | (28,071 | ) | ||||
| (1) | For a discussion as to why we view property net operating income to be an appropriate supplemental performance measure see page 50, above. For a reconciliation of our property net operating income to our reported “Income (Loss) From Continuing Operations”, see “Notes to Consolidated Financial Statements, Note 15—Segment Information.” |
51
Table of Contents
Rental Revenues
Rental revenues which are comprised of base rent, straight-line rent, amortization of above and below market rent intangibles, tenant recovery income, early termination fees and other rental revenues, decreased $4.3 million or 1.8% for the year ended December 31, 2009 compared to the same period in 2008, primarily due to the following:
| • | a decrease of $2.9 million in the base rent caused by: |
| • | a $7.3 million decrease in base rent revenues from our same store properties due to a lower average occupancy rate of 88.7% during the year ended December 31, 2009 as compared to 92.6% for the same period in 2008, as well as lower rental rates on new leases; which was partially offset by |
| • | a $4.2 million increase in base rent revenues from our non-same store properties due to an additional five properties in the property classification during the year ended December 31, 2009 as compared to the same period in 2008; and |
| • | a decrease of $1.9 million in revenues from straight-line rent and amortization of above and below market rent intangibles due to lower straight-line rent revenue associated with tenants who terminated early and a decrease in free rent periods on new leases; which were partially offset by |
| • | an increase of $1.1 million in fees from tenants that terminated leases early. |
The following table illustrates the various components of our rental revenues for the years ended December 31, 2009 and 2008 (in thousands).
| For the Years Ended December 31, |
||||||||||
| 2009 | 2008 | $ Change | ||||||||
| Base rent |
$ | 188,202 | $ | 191,093 | $ | (2,891 | ) | |||
| Straight-line rent and amortization of above and below market rent intangibles |
839 | 2,728 | (1,889 | ) | ||||||
| Tenant recovery income |
47,503 | 48,491 | (988 | ) | ||||||
| Other |
2,684 | 2,364 | 320 | |||||||
| Revenues related to early lease terminations |
2,077 | 942 | 1,135 | |||||||
| Total rental revenues |
$ | 241,305 | $ | 245,618 | $ | (4,313 | ) | |||
Rental Expenses and Real Estate Taxes
Rental expenses and real estate taxes increased by approximately $3.4 million or 5.3% for the year ended December 31, 2009 compared to the same period in 2008, primarily due to $2.0 million increase in bad debt expense related to increased concerns of rent collectability and a $1.7 million increase in real estate taxes.
Other Revenue and Other Income
Other revenue and other income increased by approximately $0.4 million for the year ended December 31, 2009 as compared to the same period in 2008, primarily due the following:
| • | a $0.7 million increase in interest income and other resulting from increased foreign exchange gains; which was partially offset by |
| • | a $0.5 million decrease in the recognition of gains earned on real estate assets contributed into unconsolidated joint ventures; and a |
| • | a $0.4 million increase in equity in earnings on unconsolidated joint ventures resulting from the SCLA land sale gain (see “Notes to Consolidated Financial Statements, Note 4—Investments in and Advances to Unconsolidated Joint Ventures” for additional information) which was largely offset by a decrease in equity in earnings from our development joint ventures due to the cessation of capitalization and recognition of depreciation as development activities were completed. |
52
Table of Contents
Other Expenses
Total other expenses increased by approximately $4.5 million for the year ended December 31, 2009 as compared to the same period in 2008, primarily due to the following:
| • | a $10.3 million loss resulting from the consolidation of previously unconsolidated development joint ventures; |
| • | a $8.7 million decrease in impairment losses recognized on our long-lived assets and investments in unconsolidated joint ventures; |
| • | a $7.4 million increase in general and administrative expenses related to $3.0 million in severance costs, increased stock compensation costs due to increased amortization of $2.4 million primarily related to the termination of our 2006 Outperformance Program (see “Notes to Consolidated Financial Statements, Note 12. Equity Based Compensation and Warrant Purchase Agreements” for additional information) and a change in estimated forfeiture rates, higher employee related costs and lower capitalized overhead; |
| • | a $5.3 million decrease in depreciation related mainly to the full amortization of certain intangibles lease assets; and |
| • | a $1.0 million increase in income and other taxes related to activity in our taxable REIT subsidiary due to SCLA joint venture land sale. |
Income from Discontinued Operations
Income from discontinued operations decreased $21.3 million during the year ended December 31, 2009 as compared to the same period in 2008 which is primarily due to fewer properties sold and lower gains on those sold during the current period.
Noncontrolling Interests
Loss attributable to noncontrolling interests increased approximately $5.1 million due to a decrease in earnings, period over period which was partially offset by an increase of 4% in our ownership of the operating partnership. We owned approximately 88% of our operating partnership as of December 31, 2009 which increased when compared to approximately 84% as of December 31, 2008 primarily due to the effect of our public offering in June 2009 (see “Notes to Consolidated Financial Statements, Note 10—Stockholders Equity” for additional information) and the redemption of OP Units (see “Notes to Consolidated Financial Statements, Note 9—Noncontrolling Interests” for additional information).
Summary of the year ended December 31, 2008 compared to the year ended December 31, 2007
As of December 31, 2008, we consolidated 373 operating properties (3 of which are excluded from continuing operations as they were disposed of as of December 31, 2009), 12 development properties and six redevelopment properties. As of December 31, 2007, we consolidated 382 operating properties (18 of which are excluded from continuing operations as they were disposed of as of December 31, 2009), 10 development properties and five redevelopment properties.
53
Table of Contents
The following table illustrates the changes in our consolidated operating properties in continuing operations by segment as of, and for the years ended, December 31, 2008 compared to December 31, 2007, respectively (dollar amounts in thousands).
| 2008 | 2007 | |||||||||||||||
| Bulk Distribution |
Light Industrial and Other |
Bulk Distribution |
Light Industrial and Other |
|||||||||||||
| Operating properties in continuing operations (1): |
||||||||||||||||
| Number of buildings |
217 | 153 | 210 | 154 | ||||||||||||
| Square feet (in thousands) |
43,526 | 7,683 | 42,629 | 7,735 | ||||||||||||
| Occupancy at end of period |
93.6 | % | 90.0 | % | 94.3 | % | 90.3 | % | ||||||||
| Segment net assets |
$ | 1,793,277 | $ | 515,094 | $ | 1,816,297 | $ | 536,201 | ||||||||
| Rental revenues |
$ | 187,708 | $ | 54,177 | $ | 190,000 | $ | 51,145 | ||||||||
| Property net operating income (2) |
$ | 141,967 | $ | 38,099 | $ | 146,003 | $ | 35,930 | ||||||||
| (1) | Includes 19 operating properties held for contribution as of December 31, 2007, which are included in continuing operations as they do not meet the criteria to be classified as held for sale. As of December 31, 2008, no properties were classified as held for contribution. |
| (2) | For a discussion as to why we view property net operating income to be an appropriate supplemental performance measure see page 50, above. For a reconciliation of our property net operating income to our reported “Income (Loss) From Continuing Operations”, see “Notes to Consolidated Financial Statements, Note 15—Segment Information.” |
The following table reflects our total assets, net of accumulated depreciation and amortization, by property segment (in thousands).
| December 31, 2008 (1) |
December 31, 2007 (1) | |||||
| Property segments: |
||||||
| Bulk distribution |
$ | 1,793,277 | $ | 1,816,297 | ||
| Light industrial and other |
515,094 | 536,201 | ||||
| Total segment net assets |
2,308,371 | 2,352,498 | ||||
| Development and redevelopment assets |
163,160 | 112,847 | ||||
| Assets held for sale or disposed assets |
40,402 | 143,702 | ||||
| Non-segment assets: |
||||||
| Properties in pre-development including land held |
21,074 | 25,025 | ||||
| Non-segment cash and cash equivalents |
13,967 | 3,316 | ||||
| Other non-segment assets (2) |
156,869 | 141,604 | ||||
| Total Assets |
$ | 2,703,843 | $ | 2,778,992 | ||
| (1) | Reflects reclassifications for properties classified as discontinued operations at December 31, 2009. |
| (2) | Other non-segment assets primarily consists of corporate assets including investments in unconsolidated joint ventures, notes receivable, certain loan costs, including loan costs associated with our financing obligations, and deferred acquisition costs |
54
Table of Contents
Comparison of the year ended December 31, 2008 compared to the year ended December 31, 2007
The following table illustrates the changes in rental revenues, rental expenses and real estate taxes, property net operating income, other income and other expenses for the year ended December 31, 2008 compared to the year ended December 31, 2007. Our same store portfolio includes all operating properties that we owned for the entirety of both the current and prior year reporting periods. The same store portfolio for the periods presented totaled 334 buildings comprised of approximately 45.7 million square feet. A discussion of these changes follows the table (in thousands).
| Year Ended December 31, |
||||||||||||
| 2008 | 2007 | $ Change | ||||||||||
| Rental Revenues |
||||||||||||
| Same store, excluding revenues related to early lease |
$ | 219,271 | $ | 218,133 | $ | 1,138 | ||||||
| Non-same store operating properties |
21,672 | 22,812 | (1,140 | ) | ||||||||
| Development and redevelopment |
3,733 | 1,800 | 1,933 | |||||||||
| Revenues related to early lease terminations |
942 | 200 | 742 | |||||||||
| Total rental revenues |
245,618 | 242,945 | 2,673 | |||||||||
| Rental Expenses and Real Estate Taxes |
||||||||||||
| Same store |
56,897 | 53,870 | 3,027 | |||||||||
| Non-same store operating properties |
4,922 | 5,342 | (420 | ) | ||||||||
| Development and redevelopment |
2,405 | 758 | 1,647 | |||||||||
| Total rental expenses and real estate taxes |
64,224 | 59,970 | 4,254 | |||||||||
| Property Net Operating Income (1) |
||||||||||||
| Same store |
162,374 | 164,263 | (1,889 | ) | ||||||||
| Non-same store operating properties |
16,750 | 17,470 | (720 | ) | ||||||||
| Development and redevelopment |
1,328 | 1,042 | 286 | |||||||||
| Revenues related to early lease terminations, net |
942 | 200 | 742 | |||||||||
| Total property net operating income |
181,394 | 182,975 | (1,581 | ) | ||||||||
| Other Revenue and Other Income |
||||||||||||
| Institutional capital management and other fees |
2,924 | 2,871 | 53 | |||||||||
| Gain on dispositions of real estate assets |
504 | 30,748 | (30,244 | ) | ||||||||
| Equity in income of unconsolidated joint ventures, net |
2,267 | 433 | 1,834 | |||||||||
| Interest income and other |
1,257 | 4,666 | (3,409 | ) | ||||||||
| Total other revenue and other income |
6,952 | 38,718 | (31,766 | ) | ||||||||
| Other Expenses |
||||||||||||
| Real estate related depreciation and amortization |
115,739 | 109,144 | 6,595 | |||||||||
| Impairment losses |
9,047 | — | 9,047 | |||||||||
| General and administrative expenses |
21,799 | 19,547 | 2,252 | |||||||||
| Income and other taxes |
824 | 1,459 | (635 | ) | ||||||||
| Interest expense |
52,997 | 60,341 | (7,344 | ) | ||||||||
| Total other expenses |
200,406 | 190,491 | 9,915 | |||||||||
| Income from discontinued operations |
23,501 | 16,126 | 7,375 | |||||||||
| Net (income) attributable to noncontrolling interests |
(1,955 | ) | (7,216 | ) | 5,261 | |||||||
| Net Income Attributable to DCT Common Stockholders |
$ | 9,486 | $ | 40,112 | $ | (30,626 | ) | |||||
| (1) | For a discussion as to why we view property net operating income to be an appropriate supplemental performance measure see page 50, above. For a reconciliation of our property net operating income to our reported “Income (Loss) From Continuing Operations”, see “Notes to Consolidated Financial Statements, Note 15—Segment Information.” |
55
Table of Contents
Rental Revenues
Rental revenues which are comprised of base rent, straight-line rent, amortization of above and below market rent intangibles, tenant recovery income, early termination fees and other rental revenues, increased $2.7 million or 1.1% for the year ended December 31, 2008 compared to the same period in 2007, primarily due to the following:
| • | an increase of $3.6 million in the base rent caused by: |
| • | a $2.4 million increase in base rent revenues from our same store properties primarily due to higher rental rates on new leases, |
| • | a $1.4 million increase in base rent revenues from our development and redevelopment properties due to an additional three properties in the property classification, |
| • | a decrease of $3.8 million in revenues from straight-line rent, amortization of above and below market rent intangibles primarily due to $2.1 million of net revenue from a lease buyout transaction in 2007 where the contracted lease was significantly below market rate, |
| • | an increase of $1.6 million in tenant recovery income due to an increase in recoverable expenses, and |
| • | an increase of $0.7 million in revenues related to early terminations. |
The following table illustrates the various components of our rental revenues for the years ended December 31, 2008 and 2007 (in thousands):
| For the Years Ended December 31, |
$ Change | |||||||||
| 2008 | 2007 | |||||||||
| Base rent |
$ | 191,093 | $ | 187,527 | $ | 3,566 | ||||
| Straight-line rent and amortization of above and below market rent intangibles |
2,728 | 6,486 | (3,758 | ) | ||||||
| Tenant recovery income |
48,491 | 46,860 | 1,631 | |||||||
| Other |
2,364 | 1,872 | 492 | |||||||
| Revenues related to early lease terminations |
942 | 200 | 742 | |||||||
| Total rental revenues |
$ | 245,618 | $ | 242,945 | $ | 2,673 | ||||
Rental Expenses and Real Estate Taxes
Rental expenses and real estate taxes increased by approximately $4.3 million or 7.1% for the year ended December 31, 2008 compared to the same period in 2007, primarily due to higher property taxes, maintenance costs and legal fees which were partially offset by lower insurance costs.
Other Revenue and Other Income
Other revenue and other income decreased by approximately $31.8 million for the year ended December 31, 2008 as compared to the same period in 2007, primarily due to a $30.2 million decrease in gains related to properties contributed into unconsolidated joint ventures and a $3.4 million decrease in interest income due to realized gains recorded during 2007 on the settlement of a forward-starting interest rate swap.
Other Expenses
Total other expenses increased by approximately $9.9 million for the year ended December 31, 2008 as compared to the same period in 2007, primarily due to the following:
| • | a $9.0 million increase in impairment losses recognized on our long-lived assets and investments in unconsolidated joint ventures; |
56
Table of Contents
| • | a $7.3 million decrease in interest expense primarily due to the lower outstanding balance of our financing obligations and lower average interest rates during the year ended December 31, 2008 compared to the same period in 2007; |
| • | a $6.6 million increase in depreciation due to the re-classification of non-depreciated assets held for contribution to depreciated operating assets; and |
| • | a $2.3 million increase in general and administrative expenses due to higher compensation costs caused by increased headcount and share-based compensation expenses, partially offset by increased capitalization of overhead to various development and leasing activities. |
Income from Discontinued Operations
Income from discontinued operations increased $7.4 million during the year ended December 31, 2008 as compared to the same period in 2007 which is primarily due an increase in volume and gains properties during the 2008.
Noncontrolling Interests
Income attributable to noncontrolling interests decreased approximately $5.3 million due to a decrease in earnings, period over period which was partially offset by an increase of 2% in our ownership of the operating partnership. We owned approximately 84% of our operating partnership as of December 31, 2008 which increased when compared to approximately 82% as of December 31, 2007 primarily due to the effect of the redemption of OP Units (see “Notes to Consolidated Financial Statements, Note 9—Noncontrolling Interests” for additional information).
Liquidity and Capital Resources
Overview
We currently expect that our principal sources of working capital and funding for potential capital requirements for expansions and renovation of properties, developments, acquisitions, distributions to investors and debt service will include:
| • | Cash flows from operations; |
| • | Proceeds from capital recycling, including dispositions and asset contributions; |
| • | Borrowings under our senior unsecured credit facility; |
| • | Other forms of secured or unsecured financings; |
| • | Future offerings of common stock or other securities; |
| • | Current cash balances; and |
| • | Distributions from our institutional capital management program and other joint ventures. |
Our sources of capital will be used to meet our liquidity requirements and capital commitments, including operating activities, debt service obligations, equityholder distributions, capital expenditures at our properties, development funding requirements, and future acquisitions. We expect to utilize the same sources of capital to meet our short-term and long-term liquidity requirements.
Although the credit markets for the real estate sector continue to be constrained due to the impact of declining property values over the past two years, the availability of equity and debt capital for well capitalized real estate companies has dramatically improved from the depths of the liquidity crisis in late 2008 and early 2009. We believe that our sources of capital are adequate to meet our liquidity requirements. We expect these resources will be adequate to fund our operating activities, debt service obligations and equityholder distributions and will be sufficient to fund our ongoing development.
57
Table of Contents
Cash Flows
Year ended December 31, 2009 compared to year ended December 31, 2008
“Cash and cash equivalents” were $19.1 million as of December 31, 2009, which was a decrease of $0.6 million from our “Cash and cash equivalents” balance as of December 31, 2008. Net cash provided by operating activities decreased $18.6 million to $109.7 million during the year ended December 31, 2009 from $128.3 million during the same period in 2008 primarily due to a decrease in earnings before gains on real estate dispositions and losses from business combinations, as well as changes in our operating assets and liabilities.
Net cash used in investing activities decreased $24.6 million to $17.7 million during the year ended December 31, 2009 when compared to $42.3 million during the same period in 2008. This change was primarily due to a $55.0 million decrease in capital expenditures, a $45.2 million decrease in expenditures on acquisitions of real estate, a $26.5 million decrease in investments in unconsolidated joint ventures, and a $4.9 million increase in repayments received on our notes receivable which were partially offset by a decrease of $106.9 million in proceeds from real estate dispositions
Net cash used by financing activities decreased $4.2 million to $92.6 million during the year ended December 31, 2009 when compared to $96.8 million of cash used in financing activities during the same period in 2008. This change was primarily due to $111.4 million in proceeds from the sale of common stock through our public offering in June 2009, net of offering costs, as well as a decrease of $64.4 million in distributions to our common stockholders and unitholders which were largely offset by a $200.0 million decrease in unsecured debt proceeds.
Year ended December 31, 2008 compared to year ended December 31, 2007
“Cash and cash equivalents” were $19.7 million as of December 31, 2008, which was a decrease of $10.8 million from our “Cash and cash equivalents” balance as of December 31, 2007. Net cash provided by operating activities increased $11.4 million to $128.3 million during the year ended December 31, 2008 from $116.9 million during the same period in 2007 primarily due to lower interest payments and higher operating cash distributions from our institutional capital joint ventures which were partially offset by changes in our operating assets and liabilities.
Net cash used in investing activities was $42.3 million during the year ended December 31, 2008 compared to $3.7 million during the same period in 2007. This change was primarily due to a $218.1 million decrease in proceeds from the real estate dispositions, an increase of $45.3 million in capital expenditures and a decrease of $33.9 million in distributions from our investments in our unconsolidated joint ventures which were partially offset by a decrease of $163.6 million in real estate acquisitions and a decrease of $78.1 million in investments in unconsolidated joint ventures during the year ended December 31, 2008.
Net cash used by financing activities decreased $9.3 million to $96.8 million during the year ended December 31, 2008 compared to $106.1 million of cash used in financing activities during the same period in 2007. This change was primarily due to net increased debt borrowings of $16.2 million and a decrease of $4.7 million in cash payments associated with OP Unit redemptions which were partially offset by an increase of $6.4 million in distributions paid to our equityholders and an increase of $6.1 million hedge settlements.
Common Stock
As of December 31, 2009, approximately 208.0 million shares of common stock were issued and outstanding. In June 2009, we issued 27.6 million shares of common stock in a public offering at a public offering price of $4.25 per share.
The net proceeds from the sales of our securities were transferred to our operating partnership for a number of OP Units equal to the shares of common stock sold in our public and private offerings, including our public offering noted above. We used the net proceeds of $111.4 million for general and corporate purposes including the repayment of debt.
58
Table of Contents
Dividend Reinvestment and Stock Purchase Plan
In April 2007, we began offering shares of our common stock through our Dividend Reinvestment and Stock Purchase Plan (the “Plan”). The Plan permits stockholders to acquire additional shares with quarterly dividends and to make additional cash investments to buy shares directly. Shares of common stock may be purchased in the open market, through privately negotiated transactions, or directly from us as newly issued shares of common stock. All shares issued under the Plan were acquired in the open market.
Distributions
During the years ended December 31, 2009 and 2008, our board of directors declared distributions to stockholders totaling approximately $68.9 million and $117.0 million, respectively, including distributions to OP unitholders. Existing cash balances, cash provided from operations and borrowings under our credit facility were used for distributions paid during 2009 and 2008.
The payment of quarterly distributions is determined by our board of directors and may be adjusted at its discretion at any time. During February 2010, our board of directors declared a quarterly cash dividend of approximately $16.6 million, payable on April 15, 2010 to stockholders of record as of April 8, 2010.
Outstanding Indebtedness
As of December 31, 2009, our outstanding indebtedness of $1.1 billion consisted of mortgage notes and senior unsecured notes and an unsecured revolving credit facility, excluding $90.5 million representing our proportionate share of debt associated with unconsolidated joint ventures. As of December 31, 2008, our outstanding indebtedness consisted of mortgage debt, unsecured notes and an unsecured revolving credit facility and totaled approximately $1.2 billion, excluding $141.5 million representing our proportionate share of debt associated with unconsolidated joint ventures. As of December 31, 2009, the gross book value of our consolidated properties was approximately $2.9 billion and the gross book value of all properties securing our mortgage debt was approximately $1.1 billion. As of December 31, 2008, the gross book value of our consolidated properties was approximately $2.9 billion and the gross book value of all properties securing our fixed rate mortgage debt was approximately $1.2 billion. Our debt has various covenants with which we were in compliance as of December 31, 2009 and 2008.
Our debt instruments require monthly or quarterly payments of interest and many require, or will ultimately require, monthly or quarterly repayments of principal. Currently, cash flows from our operations are sufficient to satisfy these monthly and quarterly debt service requirements and we anticipate that cash flows from operations will continue to be sufficient to satisfy our regular monthly and quarterly debt service excluding principal maturities.
During the years ended December 31, 2009 and 2008, our debt service, including principal and interest, totaled $117.9 million and $233.0 million, respectively. During the third quarter of 2009, we prepaid $52.1 million of mortgage notes scheduled to mature in January 2010. During the second half of 2009, we funded the repayment of approximately $66.0 million of indebtedness associated with our unconsolidated joint ventures. In January 2010, we repaid $42.0 million of $112.0 million of debt previously scheduled to mature in 2012. The remaining balance of $70.0 million was refinanced at a fixed rate of 6.11% and a new maturity of 2020 and a release of mortgages on 5 properties. In February 2010, we repaid $49.9 million of $102.9 million of debt previously scheduled to mature in 2011. The remaining balance of $53.0 million was refinanced at a fixed rate of 6.17% and a new maturity of 2019 and a release of mortgages on 11 properties. The debt repayments were funded using cash provided from our public offering in June 2009, borrowings under our credit facility and cash provided from operations.
59
Table of Contents
To manage the interest rate risk associated with forecasted refinancing of our fixed-rate debt, we have primarily used forward-starting swaps as part of our cash flow hedging strategy. These derivatives are designed to mitigate the risk of future interest rate fluctuations by providing a future fixed interest rate for a limited, pre-determined period of time. As of December 31, 2009, such derivatives as described in the following table were in place to hedge the variability of cash flows associated with forecasted issuances of debt and $100 million of variable rate debt (dollar amounts in thousands).
| Notional Amount |
Swap Strike Rate (1) |
Effective Date |
Maturity Date | |||||||
| Swap (2) |
$ | 100,000 | 3.233 | % | June 2008 | June 2010 | ||||
| Forward-starting swap (3) |
$ | 90,000 | 5.430 | % | June 2012 | September 2012 | ||||
| (1) | The referenced swap index for each of our swaps was LIBOR. |
| (2) | The counterparty is Wells Fargo Bank, NA |
| (3) | The counterparty is PNC Bank, NA |
Line of Credit
Our senior unsecured revolving credit facility is with a syndicated group of banks and has a total capacity of $300.0 million and matures December 2010. The facility has provisions, which under certain circumstances, may allow us to increase its total capacity to $500.0 million. At our election, the facility bears interest either at LIBOR plus between 0.55% and 1.1%, depending upon our consolidated leverage, or at prime and is subject to an annual facility fee. As of December 31, 2009 and 2008, this facility was undrawn.
Debt Assumption
During the year ended December 31, 2009, we assumed secured, non-recourse notes with an outstanding balance of approximately $66.0 million in connection with the consolidation of previously unconsolidated joint ventures, (see “Notes to Consolidated Financial Statements, Note 4—Investments in and Advances to Unconsolidated Joint Ventures” for additional information) with 2009 and 2010 maturities and LIBOR based variable interest rates. These notes were repaid in full shortly after the consolidation of each venture. During the year ended December 31, 2008, we had no debt assumptions.
Debt Maturities
The following table sets forth the scheduled maturities of our debt, excluding unamortized premiums, as of December 31, 2009 (amounts in thousands).
| Year |
Senior Unsecured Notes |
Mortgage Notes |
Unsecured Credit Facility |
Total | |||||||||
| 2010 |
$ | 300,000 | (1) | 6,759 | — | 306,759 | |||||||
| 2011 |
50,000 | 230,235 | — | 280,235 | |||||||||
| 2012 |
— | 167,354 | — | 167,354 | |||||||||
| 2013 |
175,000 | 41,147 | — | 216,147 | |||||||||
| 2014 |
50,000 | 3,443 | — | 53,443 | |||||||||
| Thereafter |
50,000 | 59,660 | — | 109,660 | |||||||||
| Total |
$ | 625,000 | $ | 508,598 | $ | — | $ | 1,133,598 | |||||
| (1) | This $300 million senior unsecured term loan can be extended for one year at the Company’s option. |
60
Table of Contents
Financing Strategy
We do not have a formal policy limiting the amount of debt we incur, although we currently intend to operate so that our financial metrics are generally consistent with investment grade peers in the real estate industry. Among the metrics we consider most relevant are secured and unsecured leverage as well as fixed charge coverage. Our charter and our bylaws do not limit the indebtedness that we may incur. We are, however, subject to certain leverage limitations pursuant to covenants on our outstanding indebtedness.
Contractual Obligations
The following table reflects our contractual obligations as of December 31, 2009, specifically our obligations under long-term debt agreements, operating and ground lease agreements and purchase obligations (amounts in thousands):
| Payments due by Period | |||||||||||||||
| Contractual Obligations (1) |
Total | Less than 1 Year |
1-3 Years |
4-5 Years |
More Than 5 Years | ||||||||||
| Scheduled long-term debt maturities, including interest (2) |
$ | 1,275,479 | $ | 354,084 | $ | 511,879 | $ | 291,329 | $ | 118,187 | |||||
| Operating lease commitments |
1,027 | 489 | 531 | 7 | — | ||||||||||
| Ground lease commitments (3) |
14,721 | 474 | 948 | 963 | 12,336 | ||||||||||
| Purchase obligations (4) |
5,240 | 5,240 | — | — | — | ||||||||||
| Total |
$ | 1,296,467 | $ | 360,287 | $ | 513,358 | $ | 292,299 | $ | 130,523 | |||||
| (1) | From time to time in the normal course of our business, we enter into various contracts with third parties that may obligate us to make payments, such as maintenance agreements at our properties. Such contracts, in the aggregate, do not represent material obligations, are typically short-term, are cancellable within 90 days and are not included in the table above. |
| (2) | In June 2008, DCT closed a two-year $300 million senior unsecured term loan that can be extended for one year at the Company’s option. |
| (3) | Three of our buildings totaling approximately 1.6 million square feet are subject to ground leases. |
| (4) | In total, our estimated construction costs to complete current development projects is approximately $37.8 million none of which is legally committed, and $20.2 million is expected to be funded with existing construction loans. As of December 31, 2009, our pro rata share of our unconsolidated development joint ventures’ total construction loans, including undrawn amounts, was $70.5 million, of which $34.1 million is scheduled to mature by the end of 2010, $29.7 million is scheduled to mature by the end of 2011 and $6.7 million is scheduled to mature by the end of 2013. |
Off-Balance Sheet Arrangements
As of December 31, 2009 and 2008, respectively, we had no off-balance sheet arrangements that have or are reasonably likely to have a current or future effect on our financial condition, changes in financial condition, revenues or expenses, results of operations, liquidity, capital expenditures or capital resources that is material to investors, other than items discussed herein.
Investments in Unconsolidated Joint Ventures
Guarantees
Based on the provisions of certain joint venture agreements we have, indirectly through partner level guarantees, guaranteed our proportionate share of $29.3 million in construction financing as of December 31, 2009. In the event the guarantor partner is required to satisfy the guarantee, DCT has indemnified its venture partner for our proportionate share of the guarantee. These guarantees remain outstanding until the construction financing is satisfied.
61
Table of Contents
Indebtedness and Other Off-Balance Sheet Arrangements
There are no lines of credit, side agreements, or any other derivative financial instruments related to, or between, our unconsolidated joint ventures and us, and we believe we have no material exposure to financial guarantees, except as discussed above.
As of December 31, 2009, our proportionate share of non-recourse debt associated with unconsolidated joint ventures is $90.5 million, which includes the $29.3 million related to construction financing discussed above. During the second half of 2009, DCT funded the repayment of approximately $66.0 million of indebtedness associated with our unconsolidated joint ventures.
62
Table of Contents
| ITEM 7A. | QUANTITATIVE AND QUALITATIVE DISCLOSURES ABOUT MARKET RISK |
Market risk is the exposure to losses resulting from changes in market prices such as interest rates, foreign currency exchange rates and rental rates. Our future earnings and cash flows are dependent upon prevailing market rates. Accordingly, we manage our market risk by matching projected cash inflows from operating, investing and financing activities with projected cash outflows for debt service, acquisitions, capital expenditures, distributions to stockholders and OP unitholders, and other cash requirements. The majority of our outstanding debt has fixed interest rates, which minimizes the risk of fluctuating interest rates.
Interest Rate Risk
Our exposure to market risk includes interest rate fluctuations in connection with our credit facility and other variable rate borrowings and forecasted fixed rate debt issuances, including refinancing of existing fixed rate debt. Interest rate risk may result from many factors, including governmental monetary and tax policies, domestic and international economic and political considerations and other factors that are beyond our control. To manage interest rate risk for variable rate debt and issuances of fixed rate debt, we primarily use treasury locks and forward-starting swaps as part of our cash flow hedging strategy. These derivatives are designed to mitigate the risk of future interest rate increases by providing a fixed interest rate for a limited, pre-determined period of time. During the years ended December 31, 2008 and 2007, such derivatives were in place to hedge some of the variable cash flows associated with forecasted issuances of debt that are expected to occur during the period from 2009 through 2012, and to mitigate fluctuations in certain variable rate borrowings. We do not use derivatives for trading or speculative purposes and only enter into contracts with major financial institutions based on their credit rating and other factors. As of December 31, 2009, such derivatives as described in the following table were in place to hedge the variability of cash flows associated with forecasted issuances of debt and $100 million of variable rate debt (dollar amounts in thousands):
| Notional Amount |
Swap Strike Rate (1) |
Effective Date |
Maturity Date | |||||||
| Swap (2) |
$ | 100,000 | 3.233 | % | June 2008 | June 2010 | ||||
| Forward-starting swap (3) |
$ | 90,000 | 5.430 | % | June 2012 | September 2012 | ||||
| (1) | The referenced swap index for each of our swaps was LIBOR. |
| (2) | The counterparty is Wells Fargo Bank, NA |
| (3) | The counterparty is PNC Bank, NA |
As of December 31, 2009, derivatives with a negative fair value of $4.1 million were included in “Other liabilities” in our Consolidated Balance Sheet. As of December 31, 2008, derivatives with a negative fair value of $21.5 million were included in “Other liabilities” in our Consolidated Balance Sheets. For the year ended December 31, 2008, a loss of $0.2 million was recorded as a result of ineffectiveness due to the change in estimated timing of the anticipated debt issuances. No ineffectiveness was recorded during was recorded during the year ended December 31, 2009.
The net liabilities associated with these derivatives would increase approximately $0.8 million if the market interest rate of the referenced swap index were to decrease 10 basis points based upon the prevailing market rate as of December 31, 2009.
Similarly, our variable rate debt is subject to risk based upon prevailing market interest rates. As of December 31, 2009, we had approximately $225.2 million of variable rate debt outstanding indexed to LIBOR rates. If the prevailing market interest rates relevant to our remaining variable rate debt were to have increased 10%, our interest expense during the year ended December 31, 2009 would have increased by approximately $1.2 million. Additionally, if weighted average interest rates on our fixed rate debt were to have changed by 1% due to refinancing, interest expense would have changed by approximately $10.1 million during the year ended December 31, 2009.
63
Table of Contents
As of December 31, 2009, the estimated fair value of our debt was approximately $1.1 billion based on our estimate of the then-current market interest rates.
Foreign Currency Risk
We have exposure to foreign currency exchange rate risk related to our properties located in Mexico. Gains or losses resulting from the translation of Peso denominated balance sheet and income statement items associated with our Mexican properties are included in “Interest income and other” in our Consolidated Statements of Operations. Based on our current Peso denomination activity, we estimate that a 10% change in foreign currency rates relative to the United States dollar would change our future annual earnings by approximately $0.3 million.
| ITEM 8. | FINANCIAL STATEMENTS AND SUPPLEMENTARTY DATA |
See “Index to Financial Statements” on Page 70 of this Form 10-K.
| ITEM 9. | CHANGES IN AND DISAGREEMENTS WITH ACCOUNTANTS ON ACCOUNTING AND FINANCIAL DISCLOSURE |
None.
| ITEM 9A. | CONTROLS AND PROCEDURES |
Conclusion Regarding the Effectiveness of Disclosure Controls and Procedures
Under the supervision and with the participation of our management, including our principal executive officer and principal financial officer, we conducted an evaluation of the effectiveness of our disclosure controls and procedures, as such term is defined under Rule 13a-15(e) under the Exchange Act, as of December 31, 2009, the end of the period covered by this annual report. Based on this evaluation, our management, including our principal executive officer and our principal financial officer, concluded that our disclosure controls and procedures were effective as of December 31, 2009 to provide reasonable assurance that information required to be disclosed by us in the reports filed or submitted by us under the Exchange Act is recorded, processed, summarized and reported within the time periods specified in the SEC’s rules and forms. There was no change in our internal controls during the fiscal year ended December 31, 2009 that materially affected, or is reasonably likely to materially affect, our internal control over financial reporting.
Management’s Report on Internal Control over Financial Reporting
We are responsible for establishing and maintaining adequate internal control over financial reporting, as such term is defined in Exchange Act Rules 13a-15(f) and 15d-15(f). In addition, management is required to report their assessment, including their evaluation criteria, on the design and operating effectiveness of our internal control over financial reporting in this Form 10-K.
Our internal control over financial reporting is a process designed under the supervision of our principal executive officer and principal financial officer. During 2009, management conducted an assessment of the internal control over financial reporting reflected in the financial statements, based upon criteria established in the “Internal Control—Integrated Framework” issued by the Committee of Sponsoring Organizations of the Treadway Commission (COSO). Based on management’s assessment, which included a comprehensive review of the design and operating effectiveness of our internal control over financial reporting, management has concluded that our internal control over financial reporting is effective as of December 31, 2009.
The effectiveness of our internal control over financial reporting as of December 31, 2009 has been audited by Ernst & Young LLP, an independent registered public accounting firm. Their report appears below.
64
Table of Contents
Report of Independent Registered Public Accounting Firm
The Board of Directors and Stockholders of
DCT Industrial Trust Inc. and subsidiaries:
We have audited DCT Industrial Trust Inc. and subsidiaries (the “Company”) internal control over financial reporting as of December 31, 2009, based on, criteria established in Internal Control—Integrated Framework issued by the Committee of Sponsoring Organizations of the Treadway Commission (the COSO criteria). The Company’s management is responsible for maintaining effective internal control over financial reporting, and for its assessment of the effectiveness of internal control over financial reporting included in the accompanying Management’s Report on Internal Control over Financial Reporting. Our responsibility is to express an opinion on the Company’s internal control over financial reporting based on our audit.
We conducted our audit in accordance with the standards of the Public Company Accounting Oversight Board (United States). Those standards require that we plan and perform the audit to obtain reasonable assurance about whether effective internal control over financial reporting was maintained in all material respects. Our audit included obtaining an understanding of internal control over financial reporting, assessing the risk that a material weakness exists, testing and evaluating the design and operating effectiveness of internal control based on the assessed risk, and performing such other procedures as we considered necessary in the circumstances. We believe that our audit provides a reasonable basis for our opinion.
A company’s internal control over financial reporting is a process designed to provide reasonable assurance regarding the reliability of financial reporting and the preparation of financial statements for external purposes in accordance with generally accepted accounting principles. A company’s internal control over financial reporting includes those policies and procedures that (1) pertain to the maintenance of records that, in reasonable detail, accurately and fairly reflect the transactions and dispositions of the assets of the company; (2) provide reasonable assurance that transactions are recorded as necessary to permit preparation of financial statements in accordance with generally accepted accounting principles, and that receipts and expenditures of the company are being made only in accordance with authorizations of management and directors of the company; and (3) provide reasonable assurance regarding prevention or timely detection of unauthorized acquisition, use, or disposition of the company’s assets that could have a material effect on the financial statements.
Because of its inherent limitations, internal control over financial reporting may not prevent or detect misstatements. Also, projections of any evaluation of effectiveness to future periods are subject to the risk that controls may become inadequate because of changes in conditions, or that the degree of compliance with the policies or procedures may deteriorate.
In our opinion, the Company maintained, in all material respects, effective internal control over financial reporting as of December 31, 2009, based on the COSO criteria.
We also have audited, in accordance with the standards of the Public Company Accounting Oversight Board (United States), the accompanying consolidated balance sheets of the Company as of December 31, 2009 and 2008, and the related consolidated statements of operations, stockholders’ equity, comprehensive income (loss) and noncontrolling interest, and cash flows for each of the two years in the period ended December 31, 2009, and our report dated February 26, 2010, expressed an unqualified opinion thereon.
/s/ Ernst & Young LLP
Denver, Colorado
February 26, 2010
65
Table of Contents
| ITEM 9B. | OTHER INFORMATION |
None.
66
Table of Contents
| ITEM 10. | DIRECTORS, EXECUTIVE OFFICERS AND CORPORATE GOVERNANCE |
The information required for this Item is incorporated by reference from our definitive Proxy Statement to be filed in connection with our 2010 annual meeting of stockholders.
| ITEM 11. | EXECUTIVE COMPENSATION |
The information required for this Item is incorporated by reference from our definitive Proxy Statement to be filed in connection with our 2010 annual meeting of stockholders.
| ITEM 12. | SECURITY OWNERSHIP OF CERTAIN BENEFICIAL OWNERS AND MANAGEMENT AND RELATED SHAREHOLDER MATTERS |
The information required for this Item is incorporated by reference from our definitive Proxy Statement to be filed in connection with our 2010 annual meeting of stockholders.
| ITEM 13. | CERTAIN RELATIONSHIPS AND RELATED TRANSACTIONS |
The information required for this Item is incorporated by reference from our definitive Proxy Statement to be filed in connection with our 2010 annual meeting of stockholders.
| ITEM 14. | PRINCIPAL ACCOUNTING FEES AND SERVICES |
The information required for this Item is incorporated by reference from our definitive Proxy Statement to be filed in connection with our 2010 annual meeting of stockholders.
67
Table of Contents
| ITEM 15. | EXHIBITS, FINANCIAL STATEMENT SCHEDULES |
A. Financial Statements and Financial Statement Schedules.
1. Financial Statements.
The Consolidated Financial Statements listed in the accompanying Index to Financial Statements on Page 70 are filed as a part of this report.
2. Financial Statement Schedules.
The financial statement schedule required by this Item is filed with this report and is listed in the accompanying Index to Financial Statements on Page 70. All other financial statement schedules are not applicable.
B. Exhibits.
The Exhibits required by Item 601 of Regulation S-K are listed in the Index to Exhibits on page E-1 to E-3 of this report, which is incorporated herein by reference.
68
Table of Contents
SIGNATURES
Pursuant to the requirements of Section 13 or 15(d) of the Exchange Act, the registrant has duly caused this report to be signed on its behalf by the undersigned, thereunto duly authorized.
| DCT INDUSTRIAL TRUST INC. | ||
| By: | /s/ Philip L. Hawkins | |
| Philip L. Hawkins, Chief Executive Officer, President and Director | ||
Date: February 26, 2010
Pursuant to the requirements of the Exchange Act, this report has been signed below by the following persons on behalf of the registrant and in the capacities and on the dates indicated.
| Signature |
Title |
Date | ||
| /s/ THOMAS G. WATTLES Thomas G. Wattles |
Executive Chairman and Director | February 26, 2010 | ||
| /s/ PHILIP L. HAWKINS Philip L. Hawkins |
Chief Executive Officer, President and Director (Principal Executive Officer) | February 26, 2010 | ||
| /s/ STUART B. BROWN Stuart B. Brown |
Chief Financial Officer (Principal Financial Officer and Principal Accounting Officer) |
February 26, 2010 | ||
| /s/ PHILLIP R. ALTINGER Phillip R. Altinger |
Director | February 26, 2010 | ||
| /s/ THOMAS F. AUGUST Thomas F. August |
Director | February 26, 2010 | ||
| /s/ JOHN S. GATES, JR. John S. Gates, Jr. |
Director | February 26, 2010 | ||
| /s/ TRIPP H. HARDIN Tripp H. Hardin |
Director | February 26, 2010 | ||
| /s/ JOHN C. O’KEEFFE John C. O’Keeffe |
Director | February 26, 2010 | ||
| /s/ BRUCE L. WARWICK Bruce L. Warwick |
Director | February 26, 2010 | ||
69
Table of Contents
| Financial Statements: |
||
| F-1 | ||
| F-2 | ||
| Consolidated Balance Sheets as of December 31, 2009 and 2008 |
F-3 | |
| Consolidated Statements of Operations for the Years Ended December 31, 2009, 2008 and 2007 |
F-4 | |
| F-5 | ||
| Consolidated Statements of Cash Flows for the Years Ended December 31, 2009, 2008 and 2007 |
F-7 | |
| F-8 | ||
| Financial Statement Schedule: |
||
| F-47 |
70
Table of Contents
Report of Independent Registered Public Accounting Firm
The Board of Directors and Stockholders of
DCT Industrial Trust Inc. and subsidiaries:
We have audited the accompanying consolidated balance sheets of DCT Industrial Trust Inc. and subsidiaries (the “Company”) as of December 31, 2009 and 2008, and the related consolidated statements of operations, stockholders’ equity, comprehensive income (loss) and noncontrolling interest, and cash flows for each of the two years in the period ended December 31, 2009. Our audits also included the financial statement schedule listed in the accompanying Index to Financial Statements. These financial statements and schedule are the responsibility of the Company’s management. Our responsibility is to express an opinion on these financial statements based on our audits.
We conducted our audits in accordance with the standards of the Public Company Accounting Oversight Board (United States). Those standards require that we plan and perform the audit to obtain reasonable assurance about whether the financial statements are free of material misstatement. An audit includes examining, on a test basis, evidence supporting the amounts and disclosures in the financial statements. An audit also includes assessing the accounting principles used and significant estimates made by management, as well as evaluating the overall financial statement presentation. We believe that our audits provide a reasonable basis for our opinion.
In our opinion, the financial statements referred to above present fairly, in all material respects, the consolidated financial position of the Company as of December 31, 2009 and 2008, and the consolidated results of its operations and its cash flows for each of the two years in the period ended December 31, 2009, in conformity with U.S. generally accepted accounting principles. Also, in our opinion, the related financial statement schedule, when considered in relation to the basic financial statements taken as whole, presents fairly in all material respects the information set forth therein.
As discussed in Note 2 to the consolidated financial statements, effective January 1, 2009 the Company adopted Statement of Financial Accounting Standards No. 160, Noncontrolling Interests in Consolidated Financial Statements, an amendment to ARB 51, codified in FASB ASC 810, Consolidations, and FASB Staff Position No. EITF 03-6-1, Determining Whether Instruments Granted in Share-Based Payment Transactions Are Participating Securities, codified in FASB ASC 260, Earnings Per Share.
We also have audited, in accordance with the standards of the Public Company Accounting Oversight Board (United States), the Company’s internal control over financial reporting as of December 31, 2009, based on criteria established in Internal Control—Integrated Framework issued by the Committee of Sponsoring Organizations of the Treadway Commission, and our report dated February 26, 2010, expressed an unqualified opinion thereon.
/s/ Ernst & Young LLP
Denver, Colorado
February 26, 2010
F-1
Table of Contents
Report of Independent Registered Public Accounting Firm
The Board of Directors and Stockholders
DCT Industrial Trust Inc.:
We have audited the accompanying consolidated statements of operations, stockholders’ equity, comprehensive income (loss) and noncontrolling interests, and cash flows of DCT Industrial Trust Inc. and subsidiaries (the Company) for the year ended December 31, 2007. These consolidated financial statements are the responsibility of the Company’s management. Our responsibility is to express an opinion on these consolidated financial statements based on our audit.
We conducted our audit in accordance with the standards of the Public Company Accounting Oversight Board (United States). Those standards require that we plan and perform the audit to obtain reasonable assurance about whether the financial statements are free of material misstatement. An audit includes examining, on a test basis, evidence supporting the amounts and disclosures in the financial statements. An audit also includes assessing the accounting principles used and significant estimates made by management, as well as evaluating the overall financial statement presentation. We believe that our audit provides a reasonable basis for our opinion.
In our opinion, the consolidated financial statements referred to above present fairly, in all material respects, the results of operations and the cash flows of DCT Industrial Trust Inc. and subsidiaries for the year ended December 31, 2007, in conformity with U.S. generally accepted accounting principles.
/s/ KPMG LLP
Denver, Colorado
February 29, 2008, except as to the 2007 information
in paragraph 59 of note 2, paragraph 9 of note 3,
paragraph 3 of note 7, paragraph 7 of note 9, note 11,
paragraphs 3, 5, 9, and 10 of note 12, paragraph 1 of note 14,
note 15, and note 16, which are as of February 26, 2010
F-2
Table of Contents
DCT INDUSTRIAL TRUST INC. AND SUBSIDIARIES
Consolidated Balance Sheets
(in thousands, except share and per share information)
| December 31, 2009 |
December 31, 2008 |
|||||||
| ASSETS |
||||||||
| Land |
$ | 519,485 | $ | 511,730 | ||||
| Buildings and improvements |
2,219,826 | 2,107,756 | ||||||
| Intangible lease assets |
116,243 | 187,605 | ||||||
| Construction in progress |
60,860 | 90,770 | ||||||
| Total Investment in Properties |
2,916,414 | 2,897,861 | ||||||
| Less accumulated depreciation and amortization |
(451,242 | ) | (417,404 | ) | ||||
| Net Investment in Properties |
2,465,172 | 2,480,457 | ||||||
| Investments in and advances to unconsolidated joint ventures |
111,238 | 125,452 | ||||||
| Net Investment in Real Estate |
2,576,410 | 2,605,909 | ||||||
| Cash and cash equivalents |
19,120 | 19,681 | ||||||
| Notes receivable |
19,084 | 30,387 | ||||||
| Deferred loan costs, net |
4,919 | 5,098 | ||||||
| Straight-line rent and other receivables, net of allowance for doubtful accounts of $2,226 and $843, respectively |
31,607 | 31,747 | ||||||
| Other assets, net |
13,152 | 11,021 | ||||||
| Total Assets |
$ | 2,664,292 | $ | 2,703,843 | ||||
| LIABILITIES AND STOCKHOLDERS’ EQUITY |
||||||||
| Liabilities: |
||||||||
| Accounts payable and accrued expenses |
$ | 36,261 | $ | 35,193 | ||||
| Distributions payable |
16,527 | 16,630 | ||||||
| Tenant prepaids and security deposits |
19,451 | 17,601 | ||||||
| Other liabilities |
5,759 | 26,472 | ||||||
| Intangible lease liability, net |
5,946 | 6,813 | ||||||
| Line of credit |
— | — | ||||||
| Senior unsecured notes |
625,000 | 625,000 | ||||||
| Mortgage notes |
511,715 | 574,634 | ||||||
| Total Liabilities |
1,220,659 | 1,302,343 | ||||||
| Equity: |
||||||||
| Preferred stock, $0.01 par value, 50,000,000 shares authorized, none outstanding |
— | — | ||||||
| Shares-in-trust, $0.01 par value, 100,000,000 shares authorized, none outstanding |
— | — | ||||||
| Common stock, $0.01 par value, 350,000,000 shares authorized, 208,046,167 and 175,141,387 shares issued and outstanding as of December 31, 2009 and December 31, 2008, respectively |
2,080 | 1,751 | ||||||
| Additional paid-in capital |
1,817,654 | 1,657,923 | ||||||
| Distributions in excess of earnings |
(591,087 | ) | (513,040 | ) | ||||
| Accumulated other comprehensive loss |
(11,012 | ) | (22,463 | ) | ||||
| Total Stockholders’ Equity |
1,217,635 | 1,124,171 | ||||||
| Noncontrolling interests |
225,998 | 277,329 | ||||||
| Total Equity |
1,443,633 | 1,401,500 | ||||||
| Total Liabilities and Equity |
$ | 2,664,292 | $ | 2,703,843 | ||||
The accompanying notes are an integral part of these Consolidated Financial Statements.
F-3
Table of Contents
DCT INDUSTRIAL TRUST INC. AND SUBSIDIARIES
Consolidated Statements of Operations
For the Years Ended December 31, 2009, 2008 and 2007
(in thousands, except per share information)
| 2009 | 2008 | 2007 | ||||||||||
| REVENUES: |
||||||||||||
| Rental revenues |
$ | 241,305 | $ | 245,618 | $ | 242,945 | ||||||
| Institutional capital management and other fees |
2,701 | 2,924 | 2,871 | |||||||||
| Total Revenues |
244,006 | 248,542 | 245,816 | |||||||||
| OPERATING EXPENSES: |
||||||||||||
| Rental expenses |
32,807 | 31,096 | 29,093 | |||||||||
| Real estate taxes |
34,818 | 33,128 | 30,877 | |||||||||
| Real estate related depreciation and amortization |
110,441 | 115,739 | 109,144 | |||||||||
| General and administrative |
29,224 | 21,799 | 19,547 | |||||||||
| Impairment losses |
— | 4,314 | — | |||||||||
| Total Operating Expenses |
207,290 | 206,076 | 188,661 | |||||||||
| Operating Income |
36,716 | 42,466 | 57,155 | |||||||||
| OTHER INCOME AND EXPENSE: |
||||||||||||
| Equity in income of unconsolidated joint ventures, net |
2,698 | 2,267 | 433 | |||||||||
| Impairment losses on investments in unconsolidated joint ventures |
(300 | ) | (4,733 | ) | — | |||||||
| Loss on business combinations |
(10,325 | ) | — | — | ||||||||
| Interest expense |
(52,792 | ) | (52,997 | ) | (60,341 | ) | ||||||
| Interest income and other |
1,918 | 1,257 | 4,666 | |||||||||
| Income and other taxes |
(1,846 | ) | (824 | ) | (1,459 | ) | ||||||
| Income (Loss) From Continuing Operations |
(23,931 | ) | (12,564 | ) | 454 | |||||||
| Income from discontinued operations |
2,217 | 23,501 | 16,126 | |||||||||
| Income (Loss) Before Gain On Dispositions Of Real Estate Interests |
(21,714 | ) | 10,937 | 16,580 | ||||||||
| Gain on dispositions of real estate interests |
5 | 504 | 30,748 | |||||||||
| Consolidated Net Income (Loss) |
(21,709 | ) | 11,441 | 47,328 | ||||||||
| Net (income) loss attributable to noncontrolling interests |
3,124 | (1,955 | ) | (7,216 | ) | |||||||
| Net Income (Loss) Attributable to DCT Common Stockholders |
$ | (18,585 | ) | $ | 9,486 | $ | 40,112 | |||||
| EARNINGS PER COMMON SHARE—BASIC: |
||||||||||||
| Income (Loss) From Continuing Operations |
$ | (0.11 | ) | $ | (0.06 | ) | $ | 0.00 | ||||
| Income from discontinued operations |
0.01 | 0.11 | 0.08 | |||||||||
| Gain on dispositions of real estate interests |
0.00 | 0.00 | 0.16 | |||||||||
| Net Income (Loss) Attributable to DCT Common Stockholders |
$ | (0.10 | ) | $ | 0.05 | $ | 0.24 | |||||
| EARNINGS PER COMMON SHARE—DILUTED: |
||||||||||||
| Income (Loss) From Continuing Operations |
$ | (0.11 | ) | $ | (0.06 | ) | $ | 0.00 | ||||
| Income from discontinued operations |
0.01 | 0.11 | 0.08 | |||||||||
| Gain on dispositions of real estate interests |
0.00 | 0.00 | 0.16 | |||||||||
| Net Income (Loss) Attributable to DCT Common Stockholders |
$ | (0.10 | ) | $ | 0.05 | $ | 0.24 | |||||
| WEIGHTED AVERAGE COMMON SHARES OUTSTANDING: |
||||||||||||
| Basic |
192,900 | 171,695 | 168,358 | |||||||||
| Diluted |
192,900 | 171,695 | 168,359 | |||||||||
| AMOUNTS ATTRIBUTABLE TO DCT COMMON STOCKHOLDERS: |
||||||||||||
| Income (Loss) From Continuing Operations |
$ | (20,502 | ) | $ | (10,340 | ) | $ | 577 | ||||
| Income from discontinued operations |
1,913 | 19,415 | 13,597 | |||||||||
| Gain on dispositions of real estate interests |
4 | 411 | 25,938 | |||||||||
| Net Income (Loss) Attributable to DCT Common Stockholders |
$ | (18,585 | ) | $ | 9,486 | $ | 40,112 | |||||
| Distributions declared per common share |
$ | 0.30 | $ | 0.56 | $ | 0.64 | ||||||
The accompanying notes are an integral part of these Consolidated Financial Statements.
F-4
Table of Contents
DCT INDUSTRIAL TRUST INC. AND SUBSIDIARIES
Consolidated Statements of Stockholders’ Equity,
Comprehensive Income (Loss) and Noncontrolling Interests
For the Years Ended December 31, 2009, 2008 and 2007 (in thousands)
| Total Equity |
DCT Industrial Trust Inc. and Subsidiaries | ||||||||||||||||||||||||
| Common Stock | Additional Paid-in Capital |
Distributions In Excess of Earnings |
Accumulated Other Comprehensive Loss |
Non- controlling Interests |
|||||||||||||||||||||
| Shares | Amount | ||||||||||||||||||||||||
| Balance at December 31, 2006, as previously reported |
$ | 1,453,817 | 168,355 | $ | 1,684 | $ | 1,595,808 | $ | (358,006 | ) | $ | (11,459 | ) | $ | 225,790 | ||||||||||
| Effect of adoption of accounting principles, see Note 2 |
— | — | — | — | — | 1,416 | (1,416 | ) | |||||||||||||||||
| Balance at December 31, 2006 |
1,453,817 | 168,355 | 1,684 | 1,595,808 | (358,006 | ) | (10,043 | ) | 224,374 | ||||||||||||||||
| Cumulative impact of change in accounting for uncertainty in income taxes |
(500 | ) | — | — | — | (500 | ) | — | — | ||||||||||||||||
| Comprehensive income: |
|||||||||||||||||||||||||
| Net income |
47,328 | — | — | — | 40,112 | — | 7,216 | ||||||||||||||||||
| Net unrealized gains on cash flow hedging derivatives |
4,558 | — | — | — | — | 3,863 | 695 | ||||||||||||||||||
| Settled hedges |
327 | — | — | — | — | 277 | 50 | ||||||||||||||||||
| Amortization of cash flow hedging derivatives |
607 | — | — | — | — | 514 | 93 | ||||||||||||||||||
| Allocation of interests |
— | — | — | — | — | 515 | (515 | ) | |||||||||||||||||
| Comprehensive income |
52,820 | 40,112 | 5,169 | 7,539 | |||||||||||||||||||||
| Issuance of common stock, net of offering costs |
(1,437 | ) | — | — | (1,437 | ) | — | — | — | ||||||||||||||||
| Issuance of common stock, stock based compensation plans |
— | 25 | — | — | — | — | — | ||||||||||||||||||
| Amortization of stock-based compensation |
2,405 | — | — | 675 | — | — | 1,730 | ||||||||||||||||||
| Distributions to common stockholders and noncontrolling interests |
(129,445 | ) | — | — | — | (107,816 | ) | — | (21,629 | ) | |||||||||||||||
| Partner contributions to noncontrolling interests |
140,984 | — | — | — | — | — | 140,984 | ||||||||||||||||||
| Redemptions of noncontrolling interests |
(6,190 | ) | — | — | (1,881 | ) | — | — | (4,309 | ) | |||||||||||||||
| Balance at December 31, 2007 |
1,512,454 | 168,380 | 1,684 | 1,593,165 | (426,210 | ) | (4,874 | ) | 348,689 | ||||||||||||||||
| Comprehensive income (loss): |
|||||||||||||||||||||||||
| Net income |
11,441 | — | — | — | 9,486 | — | 1,955 | ||||||||||||||||||
| Net unrealized gains on cash flow hedging derivatives |
(21,117 | ) | — | — | — | — | (17,508 | ) | (3,609 | ) | |||||||||||||||
| Realized losses related to hedging activities |
(385 | ) | — | — | — | — | (319 | ) | (66 | ) | |||||||||||||||
| Amortization of cash flow hedging derivatives |
847 | — | — | — | — | 702 | 145 | ||||||||||||||||||
| Allocation of interests |
— | — | — | — | — | (464 | ) | 464 | |||||||||||||||||
| Comprehensive income (loss) |
(9,214 | ) | 9,486 | (17,589 | ) | (1,111 | ) | ||||||||||||||||||
| Issuance of common stock, net of offering costs |
(121 | ) | — | — | (121 | ) | — | — | — | ||||||||||||||||
| Issuance of common stock, stock based compensation plans |
— | 25 | — | — | — | — | — | ||||||||||||||||||
| Amortization of stock-based compensation |
3,427 | — | — | 1,203 | — | — | 2,224 | ||||||||||||||||||
| Distributions to common stockholders and noncontrolling interests |
(117,044 | ) | — | — | — | (96,316 | ) | — | (20,728 | ) | |||||||||||||||
| Partner contributions to noncontrolling interests |
13,505 | — | — | — | — | — | 13,505 | ||||||||||||||||||
| Redemptions of noncontrolling interests |
(1,507 | ) | 6,736 | 67 | 63,676 | — | — | (65,250 | ) | ||||||||||||||||
| Balance at December 31, 2008 |
$ | 1,401,500 | 175,141 | $ | 1,751 | $ | 1,657,923 | $ | (513,040 | ) | $ | (22,463 | ) | $ | 277,329 | ||||||||||
(table continued on next page)
The accompanying notes are an integral part of these Consolidated Financial Statements.
F-5
Table of Contents
DCT INDUSTRIAL TRUST INC. AND SUBSIDIARIES
Consolidated Statements of Stockholders’ Equity,
Comprehensive Income (Loss) and Noncontrolling Interests
For the Years Ended December 31, 2009, 2008 and 2007 (in thousands)
continued
| Total Equity |
DCT Industrial Trust Inc. and Subsidiaries | |||||||||||||||||||||||
| Common Stock | Additional Paid-in Capital |
Distributions In Excess of Earnings |
Accumulated Other Comprehensive Loss |
Non- controlling Interests |
||||||||||||||||||||
| Shares | Amount | |||||||||||||||||||||||
| Balance at December 31, 2008 |
$ | 1,401,500 | 175,141 | $ | 1,751 | $ | 1,657,923 | $ | (513,040 | ) | $ | (22,463 | ) | $ | 277,329 | |||||||||
| Comprehensive income (loss): |
||||||||||||||||||||||||
| Net loss |
(21,709 | ) | — | — | — | (18,585 | ) | — | (3,124 | ) | ||||||||||||||
| Net unrealized gains on cash flow hedging derivatives |
15,980 | — | — | — | — | 14,117 | 1,863 | |||||||||||||||||
| Realized losses related to hedging activities |
(2,894 | ) | — | — | — | — | (2,557 | ) | (337 | ) | ||||||||||||||
| Amortization of cash flow hedging derivatives |
1,072 | — | — | — | — | 947 | 125 | |||||||||||||||||
| Allocation of interests |
— | — | — | — | — | (1,056 | ) | 1,056 | ||||||||||||||||
| Comprehensive income (loss) |
(7,551 | ) | (18,585 | ) | 11,451 | (417 | ) | |||||||||||||||||
| Issuance of common stock, net of offering costs |
111,388 | 27,600 | 276 | 111,112 | — | — | — | |||||||||||||||||
| Issuance of common stock, stock based compensation plans |
479 | 222 | 2 | 477 | — | — | — | |||||||||||||||||
| Amortization of stock-based compensation |
8,602 | — | — | 1,926 | — | — | 6,676 | |||||||||||||||||
| Distributions to common stockholders and noncontrolling interests |
(68,839 | ) | — | — | — | (59,462 | ) | — | (9,377 | ) | ||||||||||||||
| Partner contributions to noncontrolling interests |
158 | — | — | — | — | — | 158 | |||||||||||||||||
| Purchase of subsidiary shares from noncontrolling interests |
(155 | ) | — | — | 48 | — | — | (203 | ) | |||||||||||||||
| Redemptions of noncontrolling interests |
(1,949 | ) | 5,083 | 51 | 46,168 | — | — | (48,168 | ) | |||||||||||||||
| Balance at December 31, 2009 |
$ | 1,443,633 | 208,046 | $ | 2,080 | $ | 1,817,654 | $ | (591,087 | ) | $ | (11,012 | ) | $ | 225,998 | |||||||||
The accompanying notes are an integral part of these Consolidated Financial Statements.
F-6
Table of Contents
DCT INDUSTRIAL TRUST INC. AND SUBSIDIARIES
Consolidated Statements of Cash Flows
For the Years Ended December 31, 2009, 2008, and 2007 (in thousands)
| 2009 | 2008 | 2007 | ||||||||||
| OPERATING ACTIVITIES: |
||||||||||||
| Consolidated net income (loss) |
$ | (21,709 | ) | $ | 11,441 | $ | 47,328 | |||||
| Adjustments to reconcile net income (loss) to net cash provided by operating: |
||||||||||||
| Real estate related depreciation and amortization |
111,250 | 119,604 | 115,465 | |||||||||
| Gain on dispositions of real estate interests |
(571 | ) | (21,771 | ) | (27,738 | ) | ||||||
| Gain on dispositions of non-depreciated real estate |
(783 | ) | (219 | ) | (15,135 | ) | ||||||
| Loss on business combinations |
10,325 | — | — | |||||||||
| (Gain) loss on hedging activities |
— | 157 | (1,458 | ) | ||||||||
| Impairment losses |
630 | 10,746 | — | |||||||||
| Distributions of earnings from unconsolidated joint ventures |
3,915 | 3,820 | 1,432 | |||||||||
| Equity in income of unconsolidated joint ventures, net |
(2,698 | ) | (2,267 | ) | (433 | ) | ||||||
| Stock-based compensation and other |
13,646 | 4,866 | (6,447 | ) | ||||||||
| Changes in operating assets and liabilities: |
||||||||||||
| Other receivables and other assets |
(4,261 | ) | (3,693 | ) | (1,111 | ) | ||||||
| Accounts payable, accrued expenses and other liabilities |
5 | 5,665 | 5,046 | |||||||||
| Net cash provided by operating activities |
109,749 | 128,349 | 116,949 | |||||||||
| INVESTING ACTIVITIES: |
||||||||||||
| Real estate acquisitions |
(14,023 | ) | (59,206 | ) | (222,811 | ) | ||||||
| Capital expenditures and development activities |
(46,914 | ) | (101,910 | ) | (56,634 | ) | ||||||
| Decrease in deferred acquisition costs and deposits |
143 | 66 | 11,776 | |||||||||
| Proceeds from dispositions of real estate investments, net |
29,008 | 135,932 | 354,065 | |||||||||
| Investments in unconsolidated joint ventures |
(6,425 | ) | (32,973 | ) | (111,062 | ) | ||||||
| Distributions from investments in unconsolidated joint ventures |
7,161 | 5,586 | 39,477 | |||||||||
| Origination of notes receivable |
— | (500 | ) | (18,256 | ) | |||||||
| Repayment of notes receivable |
12,353 | 7,461 | 62 | |||||||||
| Other investing activities |
1,024 | 3,227 | (287 | ) | ||||||||
| Net cash used in investing activities |
(17,673 | ) | (42,317 | ) | (3,670 | ) | ||||||
| FINANCING ACTIVITIES: |
||||||||||||
| Net proceeds from lines of credit |
— | (82,000 | ) | 47,722 | ||||||||
| Proceeds from unsecured debt |
— | 200,000 | — | |||||||||
| Principal payments on mortgage notes |
(127,925 | ) | (73,394 | ) | (13,331 | ) | ||||||
| Principal payments on financing obligations |
— | (5 | ) | (6,005 | ) | |||||||
| Increase in deferred loan costs |
(2,188 | ) | (1,986 | ) | (141 | ) | ||||||
| Issuance of common stock |
117,777 | — | — | |||||||||
| Offering costs for issuance of common stock and OP Units |
(5,910 | ) | (125 | ) | (3,061 | ) | ||||||
| Redemption of OP Units |
(1,949 | ) | (1,507 | ) | (6,190 | ) | ||||||
| Settlement of cash flow hedge |
(3,630 | ) | (4,584 | ) | 1,544 | |||||||
| Distributions to common stockholders |
(58,901 | ) | (109,248 | ) | (107,540 | ) | ||||||
| Distributions to noncontrolling interests |
(10,069 | ) | (24,159 | ) | (19,431 | ) | ||||||
| Contributions from noncontrolling interests |
158 | 176 | 325 | |||||||||
| Net cash used in financing activities |
(92,637 | ) | (96,832 | ) | (106,108 | ) | ||||||
| NET DECREASE IN CASH AND CASH EQUIVALENTS |
(561 | ) | (10,800 | ) | 7,171 | |||||||
| CASH AND CASH EQUIVALENTS, beginning of period |
19,681 | 30,481 | 23,310 | |||||||||
| CASH AND CASH EQUIVALENTS, end of period |
$ | 19,120 | $ | 19,681 | $ | 30,481 | ||||||
| Supplemental Disclosures of Cash Flow Information |
||||||||||||
| Cash paid for interest, net of capitalized interest |
$ | 50,366 | $ | 53,581 | $ | 61,770 | ||||||
| Supplemental Disclosures of Non-Cash Activities |
||||||||||||
| Assumption of secured debt in connection with real estate acquired |
$ | 65,979 | $ | — | $ | 15,172 | ||||||
| Redemptions of OP Units settled in shares of common stock |
$ | 46,218 | $ | 63,674 | $ | — | ||||||
| Issuance of notes receivable in connection with real estate acquisitions |
$ | 1,050 | $ | 9,950 | $ | — | ||||||
| Reduction of financing obligation and issuance of OP Units in connection with purchase of TIC Interests (see Note 8) |
$ | — | $ | 14,669 | $ | 156,222 | ||||||
| Assumption of debt in connection with purchase of TIC Interests (see Note 8) |
$ | — | $ | — | $ | 14,886 | ||||||
The accompanying notes are an integral part of these Consolidated Financial Statements.
F-7
Table of Contents
DCT INDUSTRIAL TRUST INC. AND SUBSIDIARIES
Notes to Consolidated Financial Statements
Note 1. Organization
DCT Industrial Trust Inc. is a leading industrial real estate company that owns, operates and develops high-quality bulk distribution and light industrial properties in high-volume distribution markets in the U.S. and Mexico. We were formed as a Maryland corporation in April 2002 and have elected to be treated as a real estate investment trust (“REIT”) for United States (“U.S.”) federal income tax purposes commencing with our taxable year ended December 31, 2003. We are structured as an umbrella partnership REIT under which substantially all of our current and future business is, and will be, conducted through a majority owned and controlled subsidiary, DCT Industrial Operating Partnership LP (our “operating partnership”), a Delaware limited partnership, for which DCT Industrial Trust Inc. is the sole general partner. As used herein, “DCT Industrial Trust,” “DCT,” “the Company,” “we,” “our” and “us” refer to DCT Industrial Trust Inc. and its consolidated subsidiaries and partnerships except where the context otherwise requires.
As of December 31, 2009, we owned interests in, managed, or had under development 450 industrial real estate buildings comprised of approximately 75.4 million square feet. Our portfolio of consolidated operating properties consisted of 375 industrial real estate buildings, including 220 bulk distribution properties, 113 light industrial properties and 42 service center properties. In total, it was comprised of approximately 52.9 million square feet in total and was 87.6% occupied as of December 31, 2009. We also consolidated 15 development properties and four redevelopment properties as of December 31, 2009. In addition, as of December 31, 2009, we had ownership interests ranging from 4% to 20% in unconsolidated institutional capital management joint ventures, or funds, that owned 45 properties comprised of approximately 14.1 million square feet, and investments in other joint ventures owning two unconsolidated operating properties and eight unconsolidated development properties.
Note 2. Summary of Significant Accounting Policies
Basis of Presentation
The accompanying Consolidated Financial Statements include the financial position, results of operations and cash flows of the Company, its wholly-owned qualified REIT and taxable REIT subsidiaries, our operating partnership and our consolidated joint ventures, in which we have a controlling interest. Third-party equity interests in our operating partnership and consolidated joint ventures are reflected as noncontrolling interests in our Consolidated Financial Statements. We also have noncontrolling partnership interests in unconsolidated institutional capital management and other joint ventures, which are accounted for under the equity method. All significant intercompany amounts have been eliminated.
All square feet amounts disclosed in the following notes to the Consolidated Financial Statements are unaudited.
Principles of Consolidation
We hold interests in both consolidated and unconsolidated joint ventures. All joint ventures over which we have financial and operating control and variable interest entities (“VIE’s”) in which we have determined that we are the primary beneficiary are included in our Consolidated Financial Statements. All intercompany balances and transactions have been eliminated in consolidation. We use the equity method of accounting for all other joint ventures and include our share of earnings of these joint ventures in our consolidated net income.
Our judgment with respect to our level of influence or control over an entity and whether we are the primary beneficiary of a variable interest entity involve consideration of various factors including the form of our ownership interest, our representation on the entity’s board of directors, the size of our investment (including loans) and our ability to participate in policy making decisions. Our ability to correctly assess our influence or control over an entity affects the presentation of these investments in our Consolidated Financial Statements and, consequently, our financial position and specific items in our results of operations that are used by our stockholders, lenders and others in their evaluation of us.
F-8
Table of Contents
Reclassifications
Certain items in our Consolidated Financial Statements for 2008 and 2007 have been reclassified to conform to the 2009 presentation.
Use of Estimates
The preparation of our Consolidated Financial Statements in accordance with Generally Accepted Accounting Principles (“GAAP”) requires management to make estimates and assumptions that affect the reported amounts of assets and liabilities, the disclosure of contingent assets and liabilities at the date of our Consolidated Financial Statements, and the reported amounts of revenues and expenses during the reporting period. Actual results could differ from those estimates. Because of adverse conditions that exist in the real estate markets, as well as the credit and financial markets, it is possible that the estimates and assumptions that have been utilized in the preparation of our Consolidated Financial Statements could change materially during the time span associated with the continuing weakened state of these markets.
Capitalization of Costs
We capitalize costs directly related to the development, predevelopment, redevelopment or improvement of our investments in properties. Costs associated with our development projects are capitalized as incurred. If the project is abandoned, these costs are expensed during the period in which the project is abandoned. Costs considered for capitalization include, but are not limited to, construction costs, interest, real estate taxes, insurance and leasing costs if appropriate. We capitalize indirect costs such as personnel, office, and administrative expenses that are directly related to our development projects based on time spent on the development activities. Interest is capitalized based on actual capital expenditures from the period when development or redevelopment commences until the asset is substantially complete based on our current weighted average borrowing rates. Costs incurred for maintaining and repairing our properties, which do not extend their useful lives, are expensed as incurred.
We also capitalize interest on our investments in unconsolidated joint ventures. Interest is capitalized based on the average capital invested in a venture during the period when development or predevelopment begins until planned principle operations commence at our current weighted average borrowing rates.
Discontinued Operations
We classify certain properties and related assets and liabilities as held for sale when certain criteria are met (see Note 16—Discontinued Operations and Assets Held for Sale for additional information). At such time, the respective assets and liabilities are presented separately on our Consolidated Balance Sheets. Assets held for sale are reported at the lower of carrying value or estimated fair value less estimated costs to sell. The operating results of such properties are presented in “Income from discontinued operations” in current periods and all comparable periods presented. Depreciation is not recorded on properties held for sale; however, depreciation expense recorded prior to classification as held for sale is included in “Income from discontinued operations.” Gains on sales of real estate assets are recognized if the specific transaction terms and any continuing involvement in the form of management or financial assistance meet the various sale recognition criteria as defined by GAAP. If the criteria are not met, we defer the gain. Net gains on sales and any impairment losses associated with assets held for sale are presented in “Income from discontinued operations” when recognized.
Fair Value
In September 2006, the Financial Accounting Standards Board (“FASB”) issued guidance related to accounting for fair value measurements which defines fair value, establishes a framework for measuring fair value and expands disclosures about fair value measurements. Fair value is defined as the exit price or price at which an asset (in its highest and best use) would be sold or liability assumed by an informed market participant in a transaction that is not distressed and is executed in the most advantageous market.
F-9
Table of Contents
While this guidance does not impose any new fair value requirements, it provides guidance on how to determine such measurements on reported balances which are required or permitted to be measured at fair value under existing accounting pronouncements and emphasizes that fair value is a market-based rather than an entity-specific measurement. Therefore, our fair value measurement is determined based on the assumptions that market participants would use in pricing the asset or liability. As a basis for considering market participant assumptions in fair value measurements, this guidance establishes a fair value hierarchy that distinguishes between market participant assumptions based on market data obtained from sources independent of the reporting entity (observable inputs that are classified within Levels 1 and 2 of the hierarchy) and the reporting entity’s own assumptions about market participant assumptions based on the best information available in the circumstances (unobservable inputs classified within Level 3 of the hierarchy).
Level 1 inputs utilize quoted prices (unadjusted) in active markets for identical assets or liabilities. Level 2 inputs are inputs other than quoted prices included in Level 1 that are observable for the asset or liability, either directly or indirectly. Level 2 inputs may include quoted prices for similar assets and liabilities in active markets, as well as inputs that are observable for the asset or liability (other than quoted prices), such as interest rates, foreign exchange rates and yield curves that are observable at commonly quoted intervals. Level 3 inputs are unobservable inputs for the asset or liability, that are typically based on an entity’s own assumptions, as there is little, if any, related market activity. In instances where the determination of the fair value measurement is based on inputs from different levels of the fair value hierarchy, the level in the fair value hierarchy within which the entire fair value measurement falls is based on the lowest level input that is significant to the fair value measurement in its entirety. Our assessment of the significance of a particular input to the fair value measurement in its entirety requires judgment, and considers factors specific to the asset or liability.
Effective January 1, 2008, we adopted this guidance with respect to our financial assets and liabilities without a material impact on our Consolidated Financial Statements. As of January 1, 2009, nonfinancial assets and nonfinancial liabilities recognized on a nonrecurring basis were also subject to this guidance related to accounting for fair value measurements. We adopted these additional provisions without a material impact on our Consolidated Financial Statements.
Investment in Properties
We record the assets, liabilities and noncontrolling interests associated with property acquisitions which qualify as business combinations at their respective acquisition-date fair values. Acquisition-related costs associated with business combinations are expensed as incurred. As defined by GAAP, a business is an integrated set of activities and assets that is capable of being conducted and managed for the purpose of providing a return in the form of dividends, lower costs, or other economic benefits directly to investors or other owners, members, or participants. We do not consider acquisitions of land or unoccupied development buildings to be business combinations, and as such, these transactions are treated as asset acquisitions and recorded at cost.
The fair value of identifiable tangible assets such as land, building, building and land improvements and tenant improvements is determined on an “as-if-vacant” basis. Management considers Level 3 inputs such as the replacement cost of such assets, appraisals, property condition reports, market data and other related information in determining the fair value of the tangible assets. The difference between the fair value and the face value of debt assumed in connection with an acquisition is recorded as a premium or discount and amortized to “Interest expense” over the life of the debt assumed. The valuation of assumed liabilities is based on the current market rate for similar liabilities. The recorded fair value of intangible lease assets includes Level 3 inputs and represents the value associated with in-place leases which may include leasing commissions, legal and other costs, as well as an intangible asset or liability resulting from in-place leases being above or below the market rental rates on the date of the acquisition. Intangible lease assets or liabilities are amortized over the life of the remaining in-place leases as an adjustment to “Rental revenues” or “Real estate related depreciation and amortization” depending on the nature of the intangible.
F-10
Table of Contents
We have certain properties which we have acquired or removed from service with the intention to redevelop the property. Buildings under redevelopment require significant construction activities prior to being placed back into service. Additionally, we may acquire, develop, or redevelop certain properties with the intention to contribute the property to an institutional capital management joint venture, in which we may retain ownership in or manage the assets of the joint venture. We refer to these properties as held for contribution. We generally do not depreciate properties classified as redevelopment or held for contribution until the date that the redevelopment properties are ready for their intended use or the property held for contribution no longer meets GAAP held for sale criteria.
Real estate, including land, building, building and land improvements, tenant improvements and leasing costs and intangible lease assets and liabilities are stated at historical cost less accumulated depreciation and amortization, unless circumstances indicate that cost cannot be recovered, in which case, the carrying value of the property is reduced to estimated fair value.
Depreciation and Useful Lives of Real Estate Assets
Depreciation and amortization are computed on a straight-line basis over the estimated useful lives of the related assets or liabilities. Our ability to assess the useful lives of our real estate assets accurately is critical to the determination of the appropriate amount of depreciation expense recorded and the carrying values of the underlying assets. Any change to the estimated depreciable lives of these assets would have an impact on the depreciation expense we recognize.
The following table reflects the standard depreciable lives typically used to compute depreciation and amortization. However, such depreciable lives may be different based on the estimated useful life of such assets or liabilities. The carrying value of assets sold or retired and the related accumulated depreciation and/or amortization is derecognized and the resulting gain or loss, if any, is reflected in our Consolidated Statements of Operations during the period in which such sale or retirement occurs.
| Description |
Standard Depreciable Life | |
| Land |
Not depreciated | |
| Building |
20 – 40 years | |
| Building and land improvements |
5 – 20 years | |
| Tenant improvements |
Shorter of lease term or useful life | |
| Leasehold improvements |
5 – 20 years | |
| Leasing costs |
Lease term | |
| Other intangible lease assets |
Average term of leases for property | |
| Above/below market rent assets/liabilities |
Lease term |
Depreciation is not recorded on real estate assets currently held for sale or contribution, in pre-development, or being developed or redeveloped until the building is substantially completed and ready for its intended use, normally not later than one year from cessation of major construction activity.
Impairment of Long-Lived Assets
Long-lived assets to be held and used are carried at cost and evaluated for impairment when events or changes in circumstances indicate that the carrying amounts of these assets may not be fully recoverable and at least annually. Examples of such changes in circumstances include the point at which we deem the long-lived asset to be held for sale or a building remains vacant significantly longer than expected. For long-lived assets that we intend to hold long-term, the recoverability is based on the estimated future undiscounted cash flows. If the asset is not supported on an undiscounted cash flow basis, the amount of impairment is measured as the difference between the carrying value and the fair value of the asset. Long lived assets classified as held for sale are measured at the lower of their carrying amount or fair value less costs to sell.
F-11
Table of Contents
The determination of fair value involves a number of management assumptions relating to future economic events that could materially affect the determination of the ultimate value, and therefore, the carrying amounts of our real estate. Such assumptions are Level 3 inputs and include, but are not limited to, projected vacancy rates, rental rates, property operating expenses and capital expenditures. The capitalization rate is also a significant driving factor in determining the property valuation and requires management’s judgment of factors such as market knowledge, historical experience, lease terms, tenant financial strength, economy, demographics, environment, property location, visibility, age, physical condition and investor return requirements, among other things. The aforementioned factors are taken as a whole by management in determining the valuation of investment property. The valuation is sensitive to the actual results of any of these uncertain factors, either individually or taken as a whole. Should the actual results differ from management’s estimates, the valuation could be negatively affected and may result in additional impairments recorded in our Consolidated Financial Statements.
Investments in Unconsolidated Joint Ventures
We account for our investments in unconsolidated joint ventures under the equity method because we exercise significant influence over, but do not control, these entities. Under the equity method, these investments (including advances to joint ventures) are initially recorded at cost and are subsequently adjusted to reflect our proportionate share of net earnings or losses of each of the joint ventures, distributions received, contributions made and certain other adjustments, as appropriate. Such investments are included in “Investments in and advances to unconsolidated joint ventures” in our Consolidated Balance Sheets. Distributions from these investments that are related to earnings from operations are included as operating activities and distributions that are related to capital transactions are included as investing activities in our Consolidated Statements of Cash Flows.
Investment properties that are contributed to unconsolidated joint ventures are not considered discontinued operations due to our continuing involvement through maintaining an ownership interest in these investment properties and continuing to act as manager of the assets. We recognize any gains from the contribution of investment properties into an unconsolidated joint venture if the recognition criteria have been met. Such gains are recognized to the extent of the outside ownership interest in the joint venture in our Consolidated Statements of Operations under the heading of “Gain on dispositions of real estate interests.” Any gain related to the remaining proceeds reduces our basis in the investment in the unconsolidated joint venture, and is recognized into earnings over the weighted average life of the related property’s real estate assets. We recognize our proportionate share of the ongoing earnings or losses of each unconsolidated joint venture in “Equity in income of unconsolidated joint ventures, net” in our Consolidated Statements of Operations.
We evaluate our investments in unconsolidated entities for impairment whenever events or changes in circumstances indicate that there may be an other-than-temporary decline in value. The amount of impairment recognized is the excess of the investment’s carrying amount over its estimated fair value. We consider various factors to determine if a decrease in the value of the investment is other-than-temporary. These factors are Level 2 and 3 inputs and include but are not limited to, age of the venture, our intent and ability to retain our investment in the entity, the financial condition and long-term prospects of the entity, and the relationships with the other joint venture partners and its lenders. If we believe that the decline in the fair value is temporary, no impairment is recorded. The aforementioned factors are taken as a whole by management in determining the valuation of our investment property. Should the actual results differ from management’s estimates, the valuation could be negatively affected and may result in a negative impact on our Consolidated Financial Statements.
Cash and Cash Equivalents
Cash and cash equivalents include cash held in financial institutions and other highly liquid short-term investments with original maturities of three months or less. We have not realized any losses in our cash and cash equivalents and believe that we are not exposed to any significant credit risk.
F-12
Table of Contents
Notes Receivable
As of December 31, 2009 and 2008, we had approximately $19.1 million and $30.4 million in notes receivable outstanding, respectively, of which $3.1 million and $14.4 million were with non-affiliates, respectively. The interest rates on notes receivable range from approximately 6% to 12%, and the notes mature on dates ranging from January 2010 to July 2014. For the years ended December 31, 2009, 2008 and 2007, we recognized interest income from notes receivable with non-affiliates of approximately $1.1 million, $0.5 million and $0.9 million, respectively (see Note 13—Related Party Transactions for discussion on notes receivable with affiliates). All costs associated with executing notes receivable have been capitalized as deferred loan costs and are included in “Deferred loan costs, net” in our Consolidated Balance Sheets. Such costs are amortized as a reduction in interest income over the term of the applicable outstanding notes receivable.
Deferred Loan Costs
Deferred loan costs include fees and costs incurred to obtain long-term financing. These fees and costs are amortized to “Interest expense” over the terms of the related loans. Accumulated amortization of deferred loan costs was approximately $8.4 million and $6.7 million as of December 31, 2009 and 2008, respectively. Unamortized deferred loan costs are written off if debt is retired before the maturity date. Prior to October 10, 2006, our operating partnership offered undivided tenancy-in-common interests in certain of our properties to accredited investors in a private placement. During the year ended December 31, 2006, our partnership incurred upfront costs of approximately $12.0 million, payable to Dividend Capital Advisors LLC (our “Former Advisor”) and other affiliates for affecting transactions pursuant to our partnership’s private placement, which are accounted for as deferred loan costs (see Note 8 – Our Partnership’s Private Placement for additional information).
Straight-line Rent and Other Receivables
Straight-line rent and other receivables includes all current accounts receivable, net of allowances, and other accruals. We maintain an allowance for estimated losses that may result from the inability of our tenants to make required payments. If a tenant fails to make contractual payments beyond any allowance, we may recognize additional bad debt expense in future periods equal to the net outstanding balances. As of December 31, 2009 and December 31, 2008, our allowance for doubtful accounts was $2.2 million and $0.8 million, respectively.
Debt
Debt consists of fixed and variable rate secured mortgage debt, senior unsecured notes, and a senior unsecured revolving credit facility. Fixed rate secured mortgage debt assumed in connection with business combinations includes a premium or discount for the difference between the fair value and face value of assumed notes at the date of acquisition, and is amortized to interest expense over the remaining life of the underlying notes. The aggregated premium balances, net of accumulated amortization, were approximately $3.1 million and $4.1 million as of December 31, 2009 and 2008, respectively.
Derivative Instruments and Hedging Activities
We record derivatives at fair value which are presented on a gross basis in “Other Assets” or “Other Liabilities” in our Consolidated Balance Sheets. Accounting for changes in the fair value of derivatives depends on the intended use of the derivative and the designation of the derivative, whether we have elected to designate a derivative in a hedging relationship and apply hedge accounting and whether the hedging relationship has satisfied the criteria necessary to apply hedge accounting. Derivatives designated and qualifying as a hedge of the exposure to changes in the fair value of an asset, liability, or firm commitment attributable to a particular risk, such as interest rate risk, are considered fair value hedges. Derivatives designated and qualifying as a hedge of the exposure to variability in expected future cash flows, or other types of forecasted transactions, are considered cash flow hedges. Derivatives may also be designated as hedges of the foreign currency exposure of a net investment in a foreign operation. Hedge accounting generally provides for the matching of the timing of gain or
F-13
Table of Contents
loss recognition on the hedging instrument with the recognition of the changes in the fair value of the hedged asset or liability that are attributable to the hedged risk in a fair value hedge or the earnings effect of the hedged forecasted transactions in a cash flow hedge.
Currently, we use interest rate swaps to manage certain interest rate risk. The valuation of these instruments is determined using widely accepted valuation techniques including discounted cash flow analysis on the expected cash flows of each derivative. This analysis reflects the contractual terms of the derivatives, including the period to maturity, and uses observable market-based inputs, including interest rate curves. The fair values of interest rate swaps are determined using the market standard methodology of netting the discounted future fixed cash receipts (or payments) and the discounted expected variable cash payments (or receipts). The variable cash payments (or receipts) are based on an expectation of future interest rates (forward curves) derived from observable market interest rate curves. We incorporate credit valuation adjustments to appropriately reflect both our own nonperformance risk and the respective counterparty’s nonperformance risk in the fair value measurements. In adjusting the fair value of its derivative contracts for the effect of nonperformance risk, we have considered the impact of netting and any applicable credit enhancements, such as collateral postings, thresholds, mutual puts and guarantees.
Although we have determined that the majority of the inputs used to value our derivatives fall within Level 2 of the fair value hierarchy, the credit valuation adjustments associated with our derivatives utilize Level 3 inputs, such as estimates of current credit spreads to evaluate the likelihood of default by us and our counterparties. Prior to January 1, 2009, we classified all derivatives in Level 2 of the fair value hierarchy. During the period beginning January 1, 2009 and ending December 31, 2009, credit spreads used in the calculation of the credit valuation adjustment increased such that the credit valuation adjustment was determined to be significant to the overall fair value of our derivative positions thereby changing the classification from Level 2 to Level 3.
As of December 31, 2009, all of the hedges entered into by us had been designated as cash flow hedges. For derivatives designated as “cash flow” hedges, the effective portion of the changes in the fair value of the derivative is initially reported in “Accumulated other comprehensive loss” in our Consolidated Statements of Equity, Other Comprehensive Loss and Noncontrolling Interests (i.e., not included in earnings) and subsequently reclassified into earnings when the hedged transaction affects earnings or the hedging relationship is no longer effective at which time the ineffective portion of the derivative’s changes in fair value is recognized directly into earnings. We assess the effectiveness of each hedging relationship whenever financial statements are issued or earnings are reported and at least every three months. We do not use derivatives for trading or speculative purposes.
Our objective in using derivatives is to manage our exposure to interest rate volatility associated with our forecasted debt issuances including refinancing of our fixed-rate debt and certain variable rate borrowings. To accomplish this objective, we primarily use treasury locks, forward-starting swaps and interest rate swaps as part of our cash flow hedging strategy. These derivatives are designed to mitigate the risk of future interest rate fluctuations by providing a future fixed interest rate for a limited, pre-determined period of time.
Our agreements with each of our derivative counterparties contain provisions where if we default on the underlying indebtedness, including defaults where repayment of the indebtedness has not been accelerated by the lender, then we could also be declared in default on our derivative obligations. We also have agreements with our derivative counterparties that incorporate the loan covenant provisions of our indebtedness with lender affiliates of the derivative counterparties. Failure to comply with the loan covenant provisions would cause us to be in default on any derivative instrument obligations covered by the agreement.
Costs of Raising Capital
Costs incurred in connection with the issuance of equity securities are deducted from stockholders’ equity.
F-14
Table of Contents
Comprehensive Income (Loss)
We report comprehensive income or loss in our Consolidated Statements of Stockholders’ Equity, Comprehensive Income (Loss) and Noncontrolling Interests. Amounts reported in “Accumulated Other Comprehensive Loss” related to settled hedging transactions will be amortized to “Interest expense” as the hedged forecasted transactions occur. Any ineffectiveness related to our hedging transactions is reported in our Consolidated Statements of Operations. See Note 6—Financial Instruments and Hedging Activities for additional information.
Foreign Operations
The U.S. dollar is the functional currency for our consolidated subsidiaries and unconsolidated investees operating in the United States and Mexico. Gains or losses are included in our results of operations when transactions denominated in a currency other than our functional currency are settled, or otherwise remeasured, and are based upon the exchange rate in effect when the transactions were initiated. During the year ended December 31, 2009 and 2008, we recorded foreign currency gains of $0.3 million and foreign currency losses of $1.3 million, respectively, as “Interest income and other” in our Consolidated Statements of Operations. Our foreign currency gains or losses for the years ended December 31, 2007 were immaterial.
Revenue Recognition
We record rental revenues on a straight-line basis under which contractual rent increases are recognized evenly over the full lease term. Certain properties have leases that provide for tenant occupancy during periods where no rent is due or where minimum rent payments change during the term of the lease. Accordingly, we record receivables from tenants that we expect to collect over the remaining lease term rather than currently, which are recorded as straight-line rent receivable. When we acquire a property, the terms of existing leases are considered to commence as of the acquisition date for the purposes of this calculation. For the years ended December 31, 2009, 2008 and 2007, the total increase to “Rental revenues” due to straight-line rent adjustments, including amounts reported from discontinued operations, was approximately $1.9 million, $3.4 million and $5.7 million, respectively.
Tenant recovery income includes payments and amounts due from tenants pursuant to their leases for real estate taxes, insurance and other recoverable property operating expenses and is recognized as “Rental revenues” during the same period the related expenses are incurred. Tenant recovery income recognized as “Rental revenues” for the years ended December 31, 2009, 2008 and 2007, including amounts from discontinued operations, was $47.6 million, $50.0 million and $49.4 million, respectively.
In connection with property acquisitions qualifying as business combinations, we may acquire leases with rental rates above or below the market rental rates. Such differences are recorded as an intangible lease asset or liability and amortized to “Rental revenues” over the life of the related leases. The unamortized balances of these assets and liabilities associated with the early termination of leases are fully amortized to their respective revenue line items in our Consolidated Statements of Operations over the expected life of such assets and liabilities. The total net impact to “Rental revenues” due to the amortization of above and below market rents, including amounts reported from discontinued operations and accelerated amortization due to early terminations, was a decrease of $1.1 million for the year ended December 31, 2009, a decrease of approximately $0.6 million for the year ended December 31, 2008, and an increase of approximately $1.3 million for the year ended December 31, 2007.
F-15
Table of Contents
Future minimum base rental payments, i.e, cash basis monthly contractual rent, due to us from our tenants under the terms of non-cancelable operating leases in effect as of December 31, 2009 were as follows (in thousands):
| Year Ended December 31, |
Amount | ||
| 2010 |
$ | 163,879 | |
| 2011 |
124,452 | ||
| 2012 |
93,812 | ||
| 2013 |
65,415 | ||
| 2014 |
41,341 | ||
| Thereafter |
68,386 | ||
| Total |
$ | 557,285 | |
The schedule does not reflect future rental revenues from the potential renewal or replacement of existing and future leases and excludes tenant recovery income. Additionally, leases where the tenant can terminate the lease with short-term notice are not included.
Early lease termination fees are recorded in “Rental revenues” on a straight-line basis over the remaining contractual lease term or upon collection if collection is not assured. During the years ended December 31, 2009, 2008 and 2007, early termination fees increased revenues by $2.1 million, $0.9 million and $0.2 million, respectively.
We earn revenues from asset management fees, acquisition fees and fees for other services pursuant to joint venture and other agreements. These may include acquisition fees based on the sale or contribution of assets and are included in our Consolidated Statements of Operations in “Institutional capital management and other fees.” We recognize revenues from asset management fees, acquisition fees and fees for other services when the related fees are earned and are realized or realizable.
Stock-Based Compensation
On October 10, 2006, we established the Long-Term Incentive Plan to grant restricted stock, stock options and other awards to our personnel. Awards granted under this plan are fair valued and amortized to compensation expense on a straight-line basis over the service period during which the awards fully vest. Such expense is included in “General and administrative” expense in our Consolidated Statements of Operations. We previously granted equity awards under an employee stock option plan (the “Employee Option Plan”) and an independent director stock option plan (the “Independent Director Option Plan”). With the adoption of the Long-Term Incentive Plan we do not plan to make any further grants under the Employee Option Plan or the Independent Director Option Plan.
Income and Other Taxes
We have elected to be taxed as a REIT, as defined under the Internal Revenue Code of 1986, as amended. As a REIT, we generally will not be subject to U.S. federal income taxes on our net income that is distributed to our stockholders if we distribute at least 90% of our REIT taxable income to our stockholders. REITs are also subject to a number of other organizational and operational requirements. If we fail to qualify as a REIT in any taxable year, our taxable income will be subject to U.S. federal income tax at regular corporate rates (including any applicable alternative minimum tax). Even if we qualify as a REIT, we may be subject to certain U.S. federal, state and local and non-U.S. income taxes. We also will be required to pay a 100% tax on non-arms length transactions between us and a taxable REIT subsidiary and on any net income from gain of property that was property held for sale to customers in the ordinary course of business.
Certain of our operations (property management, asset ownership or management, sales of certain assets, etc.) may be conducted through taxable REIT subsidiaries, which are subsidiaries of the operating partnership and each of which we refer to as a TRS. A TRS is a C-corporation that has not elected REIT status and as such is subject to U.S. federal corporate income tax.
F-16
Table of Contents
For our taxable REIT subsidiaries, deferred income taxes result from temporary differences between the carrying amounts of assets and liabilities for financial reporting purposes and the amounts used for U.S federal income tax purposes, and are measured using current enacted tax rates and laws that are expected to be in effect when the differences reverse. We reduce deferred tax assets by recording a valuation allowance when we determine based on available evidence that it is more likely than not that the assets will not be realized.
In June 2006, the FASB issued guidance which provides that the tax benefit of uncertain tax positions is recognized only if it is “more likely than not” that the tax position will be sustained, based solely on its technical merits, with the taxing authority having full knowledge of all relevant information. The measurement of a tax benefit for an uncertain tax position that meets the “more likely than not” threshold is based on a cumulative probability model under which the largest amount of tax benefit recognized is the amount with a greater than 50% likelihood of being realized upon ultimate settlement with the taxing authority having full knowledge of all the relevant information. The Company was subject to the provisions of this guidance as of January 1, 2007, and has analyzed its various federal and state filing positions, including the assertion that the Company is not taxable. The Company believes that its income tax filing positions are well documented and supported. As a result of the implementation of this guidance, the Company recognized a $0.5 million liability for unrecognized tax benefits, which was accounted for as an increase to the January 1, 2007 balance of “Distributions in excess of earnings”. As of December 31, 2009 and 2008, there were no unrecognized tax benefits. We do not anticipate a significant change to the total amount of unrecognized tax benefits within the next 12 months.
The Company recognizes penalties and interest accrued related to unrecognized tax benefits, if any, as income tax expense. To the extent interest and penalties are not assessed with respect to uncertain tax positions, amounts accrued will be reduced and reflected as a reduction of the overall income tax expense. Our tax related interest expense or penalties for the year ended December 31, 2009 was immaterial. For the years ended December 31, 2008 and 2007, $0.1 million and $28,000 was recognized as income tax expense related to the liability for unrecognized tax benefits, respectively. Our tax returns are subject to examination in various jurisdictions for the calendar years 2006 through 2009.
New Accounting Standards
In June 2009, FASB approved the FASB Accounting Standards Codification, or the Codification, as the single source of authoritative nongovernmental GAAP. All existing accounting standard documents, such as FASB, American Institute of Certified Public Accountants, Emerging Issues Task Force and other related literature, excluding guidance from the Securities and Exchange Commission (“SEC”), have been superseded by the Codification. All other non-grandfathered, non-SEC accounting literature not included in the Codification has become nonauthoritative. The Codification did not change GAAP, but instead introduced a new structure that combines all authoritative standards into a comprehensive, topically organized online database. The Codification is effective for interim or annual periods ending after September 15, 2009, and impacts our Consolidated Financial Statements as all references to authoritative accounting literature are now referenced in accordance with the Codification. There have been no changes to the content of our Consolidated Financial Statements or disclosures as a result of implementing the Codification during the year ended December 31, 2009.
In February 2007, the FASB issued guidance which expands the use of the fair value measurement to improve financial reporting by providing entities with the opportunity to mitigate volatility in reported earnings caused by measuring related assets and liabilities differently without having to apply complex hedge accounting provisions. Upon adoption of this guidance, we did not elect the fair value option for our existing financial assets and liabilities and therefore the guidance adoption did not have an impact on our Consolidated Financial Statements.
In December 2007, the FASB issued guidance which requires the acquiring entity in a business combination to record all assets acquired, liabilities assumed and any noncontrolling interest in the acquired entity at their respective acquisition-date fair values, changes the recognition of assets acquired and liabilities assumed arising from contingencies, changes the recognition and measurement of contingent consideration and requires the expensing of acquisition-related costs as incurred. This guidance also requires additional disclosure of
F-17
Table of Contents
information surrounding a business combination, such that users of the entity’s financial statements can fully understand the nature and financial impact of the business combination. Additionally, the FASB also issued guidance in April 2009, which amended previously issued guidance related to contingent assets and contingent liabilities. These amendments are required to be applied prospectively to business combinations for which the acquisition date is on or after the beginning of the first annual reporting period beginning on or after December 15, 2008. We adopted these amendments as of January 1, 2009 with no material impact on our Consolidated Financial Statements.
In December 2007, the FASB issued guidance which establishes new accounting and reporting standards for the noncontrolling interest in a subsidiary and requires recognition of gains or losses resulting from a change of control. Ownership changes not resulting in a change of control are treated as equity transactions. We adopted this guidance beginning January 1, 2009, prospectively, with no material impact on our Consolidated Financial Statements. However, the presentation and disclosure requirements were applied retrospectively for all periods presented which resulted in a reclassification of noncontrolling interests (formerly known as minority interests) to a separate component of total equity and a change in the treatment of net income attributable to noncontrolling interest as a reduction from net income in calculating net income available to common stockholders. The impact of this guidance implementation is presented in our Consolidated Statements of Stockholders’ Equity, Comprehensive Income (Loss) and Noncontrolling Interests.
In March 2008, the FASB issued guidance to require companies with derivative instruments to disclose information that would enable financial statement users to understand how and why a company uses derivative instruments, how derivative instruments and related hedged items are accounted for and how derivative instruments and related hedged items affect a company’s financial position, financial performance and cash flows. The new requirements apply to derivative instruments and nonderivative instruments that are designated and qualify as hedging instruments and related hedged items. This guidance is effective for financial statements issued for fiscal years and interim periods beginning after November 15, 2008 and was adopted as of January 1, 2009 with no impact on our Consolidated Financial Statements.
In June 2008, the FASB issued guidance which requires that unvested share-based payment awards that contain non-forfeitable rights to dividends or dividend equivalents are participating securities and therefore, should be included in computing earnings per share using the two-class method. This guidance also requires retrospective application for all periods presented. We implemented these requirements beginning January 1, 2009. As a result, Net Income (Loss) Attributable to DCT Common Stockholders and earnings per share (basic and diluted) are adjusted for an allocation of net income to unvested restricted stock awards and LTIP Units, including a retrospective application to prior periods. For the years ended December 31, 2009, 2008 and 2007, approximately $0.4 million, $0.7 million and $0.4 million was attributable to unvested restricted stock awards and LTIP Units.
In April 2009, the FASB issued guidance regarding interim disclosures about fair value of financial instruments which requires that publicly traded companies include certain fair value disclosures required annually, in their interim financial statements and is effective for interim and annual periods ending after June 15, 2009, with early adoption permitted for periods ending after March 15, 2009, and must be applied prospectively. We adopted this guidance for the interim period beginning January 1, 2009 with no impact on our Consolidated Financial Statements.
In April 2009, the FASB issued guidance regarding the determination of fair value when the volume and level of activity for an asset or liability have significantly decreased and identification of transactions that are not orderly. This guidance sets forth provisions for how to determine if there has been a significant decrease in the volume and level of activity for the asset or liability when compared with normal market activity for the asset or liability. In such situations, an entity may conclude that transactions or quoted prices may not be determinative of fair value, and may adjust the transactions or quoted prices to arrive at the fair value of the asset or liability. The guidance is effective for interim and annual reporting periods ending after September 15, 2009, with early adoption permitted for periods ending after March 15, 2009, and must be applied prospectively. We adopted this guidance beginning January 1, 2009 with no material impact on our Consolidated Financial Statements.
F-18
Table of Contents
In May 2009, the FASB issued guidance which establishes general standards of accounting for, and requires disclosure of, events that occur after the balance sheet date but before financial statements are issued or are available to be issued. This guidance is effective for interim or fiscal periods ending after June 15, 2009. Accordingly, we adopted the provisions of this guidance for the quarter ended June 30, 2009 with no material effect on our Consolidated Financial Statements. See Note 18—Subsequent Events for our subsequent event evaluation results.
In August 2009, the FASB issued Accounting Standards Update, (“ASU”), No. 2009-5 regarding fair value measurement of liabilities. ASU No. 2009-5 provides clarification that in circumstances in which a quoted price in an active market for the identical liability is not available, an entity is required to measure fair value utilizing one or more of the following techniques: (1) a valuation technique that uses the quoted market price of an identical liability or similar liabilities when traded as assets; or (2) another valuation technique that is consistent with previously issued fair value principles, such as a present value technique. ASU No. 2009-5 is effective for the first reporting period after the issuance, which for us was the third quarter of 2009. Accordingly, we adopted ASU No. 2009-5 for the quarter ended September, 30, 2009 with no material impact on our Consolidated Financial Statements.
Future Adoption of Accounting Standards
In June 2009, the FASB issued Statement of Financial Accounting Standards (“SFAS”) No. 167, Amendments to FASB Interpretation No. 46(R), or SFAS No. 167. SFAS No. 167 amends the consolidation guidance applicable to variable interest entities and the definition of a variable interest entity, and requires enhanced disclosures to provide more information about an enterprise’s involvement in a variable interest entity. This statement also requires ongoing assessments of whether an enterprise is the primary beneficiary of a variable interest entity. SFAS No. 167 is effective beginning January 1, 2010. We are currently evaluating the application of SFAS No. 167 and its effect on our Consolidated Financial Statements.
Note 3. Real Estate
Our consolidated real estate assets consist of operating properties, redevelopment properties, properties under development and properties in pre-development including land held for future development or other purposes.
Our real estate assets, presented at historical cost, include the following as of December 31, 2009 and 2008 (in thousands):
| December 31, 2009 |
December 31, 2008 |
|||||||
| Operating properties |
$ | 2,712,291 | $ | 2,702,162 | ||||
| Properties under redevelopment |
42,048 | 54,299 | ||||||
| Properties under development |
138,698 | 120,326 | ||||||
| Properties in pre-development including land held |
23,377 | 21,074 | ||||||
| Total Investment in Properties |
2,916,414 | 2,897,861 | ||||||
| Less accumulated depreciation and amortization |
(451,242 | ) | (417,404 | ) | ||||
| Net Investment in Properties |
$ | 2,465,172 | $ | 2,480,457 | ||||
Acquisition Activity
During the year ended December 31, 2009, we acquired three development properties located in Monterrey, Mexico, comprised of approximately 0.4 million square feet for a total cost of approximately $13.0 million, which includes acquisition costs. In addition, we acquired two parcels of land comprised of approximately 12.3 acres for an aggregate cost of approximately $0.6 million, also including acquisitions costs which represent land available for expansion adjacent to existing properties. All of these properties were acquisitions of assets from unrelated third parties using existing cash balances.
F-19
Table of Contents
Also during the year ended December 31, 2009, we acquired the third-party equity interests of three of our previously unconsolidated joint ventures, such that as of December 31, 2009, we wholly owned each venture. Two of these acquisitions were treated as business combinations and the assets and liabilities of each venture were recorded at their acquisition date fair values. As a result of this accounting, we recorded an aggregate loss of $10.3 million in earnings in “Loss on business combinations” in our Consolidated Statement of Operations, which represents the difference between our investment carrying value and fair value of the net assets acquired. (See Note 4—Investments in and Advances to Unconsolidated Joint Ventures for further details regarding these acquisitions.)
During the year ended December 31, 2008, we acquired three operating properties located in two markets within the United States and one market within Mexico, comprised of approximately 0.4 million square feet for a total cost of approximately $23.8 million, which includes acquisitions costs. We also acquired four newly developed properties located in Monterrey and Queretaro, Mexico, comprised of approximately 0.7 million square feet for a total cost of approximately $28.1 million, which includes acquisition costs. These properties were acquired from unrelated third parties using existing cash balances and borrowings under our credit facility.
Disposition Activity
During the year ended December 31, 2009, we sold three operating properties comprised of approximately 0.9 million square feet and two land parcels comprised of approximately 4.3 acres to unrelated third parties for total gross proceeds of approximately $30.7 million, which resulted in a gain of approximately $0.9 million.
During the year ended December 31, 2008, we sold 16 operating properties comprised of approximately 2.6 million square feet to unrelated third parties for gross proceeds of approximately $143.3 million, which resulted in gains of approximately $19.8 million, net of a $1.7 million impairment loss. Additionally, we contributed approximately 47 acres of land in Atlanta to the IDI/DCT Buford, LLC joint venture (see Note 4 – Investments in and Advances to Unconsolidated Joint Ventures for further discussion).
2009 Development Projects—Consolidated
As of December 31, 2009, we had seven consolidated development projects comprised of 3.2 million square feet and 15 buildings, of which 13 were bulk distribution properties and two were light industrial, located in Dulles, VA, Cincinnati, OH, Memphis, TN, Orlando, FL, Riverside, CA and Monterrey, Mexico. As of December 31, 2009, all of these buildings were shell-complete. For information related to our unconsolidated development joint ventures, see Note 4—Investments in and Advances to Unconsolidated Joint Ventures.
Intangible Assets
Aggregate amortization expense for intangible lease assets recognized in connection with property acquisitions (excluding assets and liabilities related to above and below market rents; see Note 2—Summary of Significant Accounting Policies for additional information) was approximately $18.0 million $25.9 million and $29.4 million for the years ended December 31, 2009, 2008 and 2007, respectively.
Our intangible lease assets and liabilities included the following as of December 31, 2009 and 2008 (in thousands):
| December 31, 2009 | December 31, 2008 | |||||||||||||||||||||||
| Gross | Accumulated Amortization |
Net | Gross | Accumulated Amortization |
Net | |||||||||||||||||||
| Other intangible lease assets |
$ | 100,236 | $ | (57,704 | ) | $ | 42,532 | $ | 161,663 | $ | (107,659 | ) | $ | 54,004 | ||||||||||
| Above market rent |
16,007 | (10,703 | ) | 5,304 | 25,942 | (18,841 | ) | 7,101 | ||||||||||||||||
| Below market rent |
(12,788 | ) | 6,842 | (5,946 | ) | (17,964 | ) | 11,151 | (6,813 | ) | ||||||||||||||
F-20
Table of Contents
The following table describes the estimated net amortization of such intangible assets and liabilities for the next five years. In addition, the table describes the net impact on rental revenues due to the amortization of above and below market rents for the next five years and thereafter (in thousands):
| For the Period Ended December 31, |
Estimated Net Amortization of Lease Intangible Assets |
Estimated Net Increase (Decrease) to Rental Revenues Related to Above and Below Market Rents |
|||||
| 2010 |
11,927 | (325 | ) | ||||
| 2011 |
8,370 | 404 | |||||
| 2012 |
5,958 | 290 | |||||
| 2013 |
3,922 | 448 | |||||
| 2014 |
2,770 | 219 | |||||
| Thereafter |
9,585 | (394 | ) | ||||
| Total |
$ | 42,532 | $ | 642 | |||
Note 4. Investments in and Advances to Unconsolidated Joint Ventures
We enter into joint ventures primarily for purposes of developing industrial real estate and to establish funds or other commingled investment vehicles with institutional partners. Our investments in these joint ventures are included in “Investments in and advances to unconsolidated joint ventures” in our Consolidated Balance Sheets. The following describes our unconsolidated joint ventures as of December 31, 2009 and 2008.
| Unconsolidated Joint Ventures |
DCT Ownership Percentage as of December 31, 2009 |
Number of Buildings |
Unconsolidated Net Equity Investment as of | ||||||||
| December 31, 2009 |
December 31, 2008 | ||||||||||
| (in thousands) | |||||||||||
| Institutional Funds: |
|||||||||||
| DCT/SPF Industrial Operating LLC |
20 | % | 14 | $ | 48,618 | $ | 50,530 | ||||
| TRT-DCT Venture I |
4.4 | % | 14 | 928 | 1,207 | ||||||
| TRT-DCT Venture II |
11.4 | % | 6 | 2,685 | 2,947 | ||||||
| TRT-DCT Venture III |
10 | % | 5 | 1,719 | 3,054 | ||||||
| DCT Fund I LLC |
20 | % | 6 | 1,124 | 1,901 | ||||||
| Total Institutional Funds |
45 | 55,074 | 59,639 | ||||||||
| Other: |
|||||||||||
| Stirling Capital Investments (SCLA) (1) |
50 | % | 6 | 44,456 | 40,164 | ||||||
| IDI/DCT |
50 | % | 4 | 8,499 | 8,892 | ||||||
| Sycamore Canyon (2) |
100 | % | — | — | 8,603 | ||||||
| Logistics Way (2) |
100 | % | — | — | 4,039 | ||||||
| DCT/IDI Buford (land only) (3) |
75 | % | — | 3,209 | 3,214 | ||||||
| Other joint venture investments in land (2)(3) |
100 | % | — | — | 901 | ||||||
| Total Other |
10 | 56,164 | 65,813 | ||||||||
| Total |
55 | $ | 111,238 | $ | 125,452 | ||||||
| (1) | Although we contributed 100% of the initial cash equity capital required by the venture, our partners retain certain participation rights in the venture’s available cash flows. |
| (2) | Balances as of December 31, 2008 include balances associated with joint ventures that were consolidated as of December 31, 2009. |
| (3) | Net equity investment balances at December 31, 2008 include total impairment losses of $4.7 million. |
F-21
Table of Contents
Institutional Capital Management Joint Ventures
DCT/SPF Industrial Operating LLC
On August 30, 2007, we entered into a joint venture agreement with Industrial Acquisition LLC (“JP Morgan”), an entity advised by JPMorgan Asset Management, to form DCT/SPF Industrial Operating LLC (“JP Morgan Venture”). As of December 31, 2009, this joint venture owned approximately $287.8 million of real estate assets. This joint venture was funded with an equity contribution from JP Morgan to the joint venture (approximately 80% of the joint venture’s equity capitalization) and an equity contribution from us to the joint venture (approximately 20% of the joint venture’s equity capitalization). Our actual ownership percentage may vary depending on amounts of capital contributed and the timing of contributions and distributions.
During the year ended December 31, 2008, the JP Morgan Venture acquired one property comprised of approximately 0.3 million square feet from an unrelated third party. During the year ended December 31, 2007, we contributed six properties to the JP Morgan Venture comprised of approximately 2.8 million square feet with a combined gross contribution value of approximately $138.7 million. The contribution of the six properties into JP Morgan Venture resulted in a total gain of approximately $17.1 million, of which approximately $13.6 million was recognized in our earnings during the year ended December 31, 2007. The remaining gain of approximately $3.5 million reduces our basis in the investment and is recognized into earnings over the weighted average life of the related property’s real estate assets. As of December 31, 2009, the remaining deferred gain to be recognized into earnings was $3.3 million.
TRT-DCT Industrial Joint Ventures I, II & III
We entered into our first joint venture agreement with Dividend Capital Total Realty Trust Inc. (“DCTRT”) TRT-DCT Venture I on September 1, 2006. TRT-DCT Venture I has been funded as follows: (i) an equity contribution from DCTRT to the joint venture (which we estimate to be not less than approximately 95.6% of the joint venture’s required equity capitalization); (ii) an equity contribution from us to the joint venture (which we estimate to be approximately 4.4% of the joint venture’s required equity capitalization); and (iii) secured debt financing. In June 2007, we issued a secured $16.0 million, 6.0% interest note, maturing on July 1, 2014 to TRT-DCT Venture I. Our actual ownership percentage may vary depending on amounts of capital contributed and the timing of contributions and distributions. As of December 31, 2009, TRT-DCT Venture I owned real estate assets with a gross book value of approximately $213.6 million and had $117.9 million of debt. No further assets are planned to be acquired by the joint venture.
During 2008, DCTRT contributed six properties to TRT-DCT Venture I comprised of approximately 1.1 million square feet with combined contribution values of approximately $65.3 million into the venture. During the year ended December 31, 2008, we contributed cash of $0.7 million which represented one percent of the fair value of these contributed assets. During the year ended December, 2007, we contributed four properties to TRT-DCT Venture I comprised of approximately 1.4 million square feet with a combined gross contribution value of approximately $84.2 million. The contribution of the four properties into TRT-DCT Venture I during 2007 resulted in a gain of approximately $12.1 million, of which approximately $10.9 million was recognized in our earnings during the year ended December 31, 2007. The remaining gain of approximately $1.2 million reduces our basis in the investment and is recognized into earnings over the weighted average life of the related properties real estate assets. As of December 31, 2009, the remaining deferred gain to be recognized into earnings was $1.2 million.
We formed our second joint venture agreement with DCTRT, TRT-DCT Industrial Joint Venture II G.P. (“TRT-DCT Venture II”), on March 27, 2007. TRT-DCT Venture II is structured and funded in a manner similar to TRT-DCT Venture I. As of December 31, 2009, TRT-DCT Venture II owned real estate assets with a gross book value of approximately $95.1 million and had $55.5 million of debt. During the year ended December 31, 2007, we contributed five properties to TRT-DCT Venture II comprised of approximately 1.4 million square feet with a combined gross contribution value of approximately $67.2 million. The contribution of the five properties into TRT-DCT Venture II resulted in a total gain of approximately $6.7 million, of which approximately
F-22
Table of Contents
$6.0 million was recognized in our earnings during the year ended December 31, 2007. The remaining gain of approximately $0.7 million reduced our basis in the investment and is recognized into earnings over the weighted average life of the related properties real estate assets. As of December 31, 2009, the remaining deferred gain to be recognized into earnings was $0.7 million.
We formed our third joint venture agreement with DCTRT, TRT-DCT Industrial Joint Venture III, G.P. (“TRT-DCT Venture III”), on September 9, 2008. TRT-DCT Venture III is also structured and funded in a manner similar to TRT-DCT Venture I. On September 29, 2008, five properties were acquired from an unrelated third party by the venture comprised of approximately 0.9 million square feet. During the year ended December 31, 2008, we contributed cash of $3.0 million which represented 10% of the fair value of these acquired assets. On March 27, 2009, the venture borrowed $12.4 million of secured debt which bears interest at 7.4% and requires monthly interest and principal payments until the debt matures on March 1, 2016. As of December 31, 2009, TRT-DCT Venture III owned real estate assets with a gross book value of approximately $31.1 million.
DCT Fund I
On February 21, 2006, we entered into a joint venture with affiliates of Boubyan Bank of Kuwait (“BBK”), an unrelated third party, to create an institutional fund, DCT Fund I LLC (“Fund I”), that owns and operates industrial properties located in the United States. We contributed six industrial properties to Fund I, totaling approximately 2.6 million square feet after completion of a 0.3 million square foot expansion project. The contribution value of the six buildings upon completion of the expansion was approximately $122.8 million. Contemporaneously with our contribution, Fund I issued $84.4 million of secured non-recourse debt to a third party and BBK contributed $19.7 million of equity to Fund I. Our ownership of Fund I is 20% and BBK’s ownership of Fund I is 80%.
The contribution of the six properties into Fund I (including of the expansion project) resulted in a total gain of approximately $9.4 million of which approximately $7.6 million was recognized in our earnings during the year ended December 31, 2006. The remaining gain of approximately $1.8 million reduces our basis in the investment and is recognized into earnings over the weighted average life of the related property’s real estate assets. As of December 31, 2009, the remaining deferred gain to be recognized into earnings was $1.7 million. Also of December 31, 2009, Fund I owned real estate assets with a gross book value of approximately $125.3 million and had $95.5 million of debt.
Development Projects in Unconsolidated Joint Ventures
SCLA
During 2006, we entered into a joint venture agreement with Stirling Airports International, LLC, or Stirling, an unrelated third party, to be the master developer of up to 4,350 acres in Victorville, California, part of the Inland Empire submarket in Southern California. The development project is located at the former George Air Force Base which closed in 1992 and is now known as Southern California Logistics Airport (“SCLA”). We refer to this joint venture as the SCLA joint venture. Stirling entered into two master development agreements which gave it certain rights to be the exclusive developer of the SCLA development project through 2019 (including extensions) and assigned these rights to the SCLA joint venture upon the closing of the venture. While our exact share of the equity interests in the SCLA joint venture will depend on the amount of capital we contribute and the timing of contributions and distributions, the SCLA joint venture contemplates an equal sharing between us and Stirling of residual profits and cash flows after all priority distributions.
During 2009, the SCLA joint venture sold 53.4 acres of land. As of December 31, 2009, the SCLA joint venture had four buildings that were shell-complete comprised of 1.5 million square feet of which 0.3 million square feet were leased, and two operating buildings comprised of 0.5 million square feet which were fully leased. As of December 31, 2009, the SCLA joint venture owned real estate assets with a gross book value of approximately $83.8 million and had $58.8 million of debt.
F-23
Table of Contents
IDI/DCT, LLC
On November 20, 2007, we entered into a joint venture agreement with Industrial Developments International, Inc. (“IDI”), an unrelated third-party developer, to acquire approximately 113 acres of land to develop four distribution buildings comprising approximately 1.9 million square feet in the Savannah, GA, Nashville, TN, Chicago, IL, and Stockton, CA markets. Pursuant to the joint venture agreement, we will provide 50% of the venture’s equity capital, which as of December 31, 2009, was approximately $8.3 million. Both parties will receive a preferred return on their respective capital contributions. DCT has the right of first offer to buy each of the projects and the buildings were shell-complete in 2008. As of December 31, 2009, the joint venture owned real estate assets with a gross book value of approximately $74.3 million and had $58.6 million of debt.
Sycamore Canyon
On April 20, 2006, we entered into a joint venture agreement with SycCanyonS JP/PI, LLC (“SCS”), an unrelated third-party developer, to acquire approximately 35 acres of land and to develop two distribution buildings comprising approximately 0.9 million square feet in the City of Riverside, California (“Sycamore Canyon”). Pursuant to the joint venture agreement, SCS and DCT provided approximately 10% and 90%, respectively, of the required equity capital. On September 4, 2009, SCS assigned its equity interest in the venture to us. The transaction was treated as a business combination and the net assets acquired were recorded at fair value on our Consolidated Financial Statements. We recorded $42.4 million in net real estate assets and $42.4 million in debt. A loss of $6.2 million was recorded as “Loss on business combinations” in our Consolidated Statements of Operations. Following the assumption of SCS’ interest and obtaining control over the venture, we repaid the associated debt which had been previously extended. The assets of the venture are comprised primarily of two buildings referred to as Sycamore A and Sycamore B. As of December 31, 2009, Sycamore B was 100% leased and Sycamore A was shell-complete.
Logistics Way
On September 12, 2006, we entered into a joint venture agreement with Logistics Way Investors Joint Venture (“LWI”), an unrelated third-party developer, to form Logistics Way DCT/LWI LLC, (“Logistics Way”), to acquire approximately 36 acres of land and to develop a 0.6 million square foot distribution facility in the city of Nashville, Tennessee. Pursuant to the joint venture agreement, LWI and DCT provided approximately 5% and 95%, respectively, of the required equity capital to fund the development project. Also, pursuant to the joint venture agreement, LWI had the right to put their interest to DCT 18 months after shell completion at cost. The building was shell-complete in May 2007. In the third quarter of 2009, LWI exercised its put option. Consequently, we paid LWI $0.2 million for its equity interest in the venture and repaid the venture’s debt in the amount of $18.3 million. The transaction was treated as a business combination and the net assets acquired were recorded at fair value on our Consolidated Financial Statements which included $17.2 million in net real estate assets. A loss of $4.1 million was recorded as “Loss on business combinations” in our Consolidated Statements of Operations.
IDI/DCT Buford, LLC
On March 11, 2008, we entered into a joint venture agreement with Industrial Developments International, Inc., an unrelated third-party developer, to form IDI/DCT Buford, LLC. This joint venture was funded for the purpose of developing four distribution buildings comprised of approximately 0.6 million square feet in Atlanta, Georgia on approximately 47 acres contributed to the joint venture by DCT. We received cash proceeds of approximately $1.5 million, equity in the venture and recognized a gain on the contribution of the land of approximately $0.3 million and a deferred gain of approximately $0.8 million which reduces our basis in the investment and is recognized into earnings over the weighted average life of the related property’s real estate assets. As of December 31, 2009, the remaining deferred gain to be recognized into earnings was $0.8 million. Also of December 31, 2009, the joint venture owned real estate assets with a gross book value of approximately $6.3 million.
F-24
Table of Contents
Stonefield Industrial, LLC
On May 22, 2008, we entered into a joint venture agreement with Panattoni Development Company, an unrelated third-party developer, to form Stonefield Industrial, LLC and develop approximately 49 acres in Reno, Nevada. In conjunction with the joint venture’s debt maturity in October 2009, the venture was determined to be a variable interest entity and we consolidated the venture’s net assets at fair value. Subsequent to this consolidation, we paid off the venture’s existing construction loans in the amount of $5.3 million.
Whitestown DCT/PDC, LLC
On December 11, 2007, we entered into a joint venture agreement with Panattoni Development Company, an unrelated third-party developer, to form Whitestown DCT/PDC, LLC for the purpose of acquiring land, developing, managing, maintaining, and leasing a 0.6 million square foot building on approximately 28.4 acres in Whitestown, Indiana. The assets of the venture were comprised primarily of land. On September 4, 2009, our venture partner assigned their equity interest in the venture to us and we recorded the venture net assets at cost.
The following table provides unaudited selected combined financial information for unconsolidated joint ventures as of and for the years ended December 31, 2009, 2008 and 2007 (in thousands).
| 2009 | 2008 | 2007 | ||||||||
| Real estate, net of accumulated depreciation |
$ | 828,452 | $ | 925,835 | $ | 692,093 | ||||
| Total assets |
849,645 | 946,027 | 703,177 | |||||||
| Secured notes payable |
355,840 | 403,962 | 315,162 | |||||||
| Total liabilities |
431,879 | 475,593 | 338,284 | |||||||
| Partners’ capital |
417,766 | 470,434 | 364,893 | |||||||
| Rental revenues |
68,180 | 62,106 | 32,135 | |||||||
| Operating expenses |
17,662 | 13,684 | 7,671 | |||||||
| Depreciation expense |
37,370 | 28,416 | 14,606 | |||||||
| Interest expense |
19,706 | 16,828 | 10,583 | |||||||
| Net income (loss) |
1,317 | 3,151 | (746 | ) | ||||||
Our aggregate investment in these partnerships at December 31, 2009 and 2008 of $111.2 million and $125.5 million, respectively, exceeds our share of the underlying equity in net assets of our joint ventures by approximately $14.3 million and $14.0 million, respectively, primarily due to capitalized interest and other costs incurred in connection with the ventures.
Guarantees
Based on the provisions of certain joint venture agreements we have, indirectly through partner level guarantees, guaranteed our proportionate share of $29.3 million in construction financing as of December 31, 2009. In the event the guarantor partner is required to satisfy the guarantee, DCT has indemnified its venture partner for our proportionate share of the guarantee. These guarantees remain outstanding until the construction financing is satisfied.
There are no lines of credit, side agreements, or any other derivative financial instruments related to, or between, our unconsolidated joint ventures and us, and we believe we have no material exposure to financial guarantees, except as discussed above. As of December 31, 2009, our proportionate share of non-recourse debt associated with unconsolidated joint ventures was $90.5 million.
Note 5. Outstanding Indebtedness
As of December 31, 2009, our outstanding indebtedness of $1.1 billion consisted of mortgage notes and senior unsecured notes and an unsecured revolving credit facility, excluding $90.5 million representing our proportionate share of debt associated with unconsolidated joint ventures. As of December 31, 2008, our
F-25
Table of Contents
outstanding indebtedness consisted of mortgage debt, unsecured notes and an unsecured revolving credit facility and totaled approximately $1.2 billion, excluding $141.5 million representing our proportionate share of debt associated with unconsolidated joint ventures. As of December 31, 2009, the gross book value of our consolidated properties was approximately $2.9 billion and the gross book value of all properties securing our mortgage debt was approximately $1.1 billion. As of December 31, 2008, the total gross book value of our consolidated properties was approximately $2.9 billion and the gross book value of all properties securing our mortgage debt was approximately $1.2 billion. Our debt has various covenants with which we were in compliance as of December 31, 2009 and 2008.
Our outstanding indebtedness as of December 31, 2009 is summarized in the table below (dollars in thousands).
| Interest Rate (1) |
Maturity Date | Outstanding Balance as of December 31, | |||||||||
| 2009 | 2008 | ||||||||||
| Senior Unsecured Notes: |
|||||||||||
| 2 year, variable rate (3) |
1.75 | % | June 2010 | 200,000 | 200,000 | ||||||
| 2 year, fixed rate (2) (3) (4) |
1.73 | % | June 2010 | 100,000 | 100,000 | ||||||
| 5 year, fixed rate (2) |
5.53 | % | April 2011 | 50,000 | 50,000 | ||||||
| 5 year, fixed rate |
6.11 | % | June 2013 | 175,000 | 175,000 | ||||||
| 8 year, fixed rate (2) |
5.68 | % | January 2014 | 50,000 | 50,000 | ||||||
| 10 year, fixed rate (2) |
5.77 | % | April 2016 | 50,000 | 50,000 | ||||||
| Mortgage Notes: |
|||||||||||
| Variable: |
|||||||||||
| Cabot |
1.43 | % | October 2011 | 25,237 | 25,237 | ||||||
| Fixed: |
|||||||||||
| 7 year, fixed rate |
5.00 | % | March 2011 | 36,489 | 37,253 | ||||||
| 10 year, fixed rate (2) |
5.31 | % | January 2015 | 50,291 | 51,562 | ||||||
| 5 year, fixed rate (2) |
4.40 | % | January 2010 | — | 52,980 | ||||||
| 8 year, fixed rate |
4.97 | % | October 2013 | 17,728 | 18,151 | ||||||
| Mid South Logistics Center |
6.40 | % | November 2012 | 12,046 | 12,223 | ||||||
| Shelby 4 |
7.40 | % | December 2017 | 1,082 | 1,178 | ||||||
| Shelby 5 |
5.69 | % | December 2013 | 6,797 | 7,137 | ||||||
| Shelby 19 |
6.72 | % | November 2022 | 10,599 | 11,099 | ||||||
| Miami Commerce Center |
6.91 | % | October 2018 | 4,815 | 5,198 | ||||||
| Memphis Distriplex |
6.79 | % | July 2011 | 4,376 | 4,462 | ||||||
| Binney & Smith Distribution Center |
6.97 | % | June 2013 | 8,751 | 9,480 | ||||||
| Roosevelt Distribution Center. |
7.11 | % | December 2011 | 2,068 | 2,169 | ||||||
| 111 Lake Drive. |
5.79 | % | April 2013 | 5,159 | 5,240 | ||||||
| Baltimore-Washington |
6.25 | % | September 2012 | 25,485 | 25,942 | ||||||
| Greens Crossing |
6.44 | % | October 2012 | 6,657 | 6,800 | ||||||
| Willowbrook |
6.84 | % | September 2012 | 7,861 | 7,986 | ||||||
| Cabot |
5.06 | % | January 2011 | 53,878 | 53,877 | ||||||
| Cabot |
4.72 | % | April 2011 | 48,980 | 48,980 | ||||||
| Cabot |
5.16 | % | July 2012 | 62,740 | 62,740 | ||||||
| Cabot |
4.91 | % | March 2012 | 49,269 | 51,764 | ||||||
| Cabot |
4.79 | % | October 2011 | 13,507 | 13,507 | ||||||
| Cabot |
4.92 | % | October 2011 | 37,043 | 37,042 | ||||||
| 452 Business Center |
7.48 | % | August 2011 | 3,881 | 4,085 | ||||||
| Mohawk |
5.75 | % | August 2025 | 8,096 | 8,408 | ||||||
| Louisville Logistics Center |
6.04 | % | January 2013 | 5,763 | 6,044 | ||||||
| Weighted Avg./Totals (5) |
4.47 | % | N/A | 1,133,598 | 1,195,544 | ||||||
| Premiums, Net of Amortization (6) |
N/A | N/A | 3,117 | 4,090 | |||||||
| Total Senior Unsecured Notes and Mortgage Notes |
N/A | N/A | 1,136,715 | 1,199,634 | |||||||
| Senior Unsecured Revolving Credit Facility |
1.04 | % | December 2010 | — | — | ||||||
| Total Carrying Value of Debt |
N/A | N/A | $ | 1,136,715 | $ | 1,199,634 | |||||
| Fixed Rate Debt |
5.15 | % | N/A | $ | 908,361 | $ | 970,307 | ||||
| Premiums, Net of Amortization |
N/A | N/A | 3,117 | 4,090 | |||||||
| Variable Rate Debt |
1.71 | % | N/A | 225,237 | 225,237 | ||||||
| Total Carrying Value of Debt |
N/A | N/A | $ | 1,136,715 | $ | 1,199,634 | |||||
(footnotes on following page)
F-26
Table of Contents
(footnotes to previous page)
| (1) | Interest rates for fixed rate debt is are stated rates. Interest rates for variable rate debt are the interest rate charged as of the last payment in 2009. |
| (2) | We assigned certain derivative instruments to these notes and the fair value of these derivative instruments will be amortized to interest expense over the life of the assigned notes. |
| (3) | At the Company’s option the maturity on these loans can be extended for one year to June 6, 2011. |
| (4) | During June 2008, we entered into a $300 million term loan agreement under which we drew a $100.0 million in LIBOR-based variable rate debt. In conjunction with this transaction, we also entered into an interest rate swap to fix the LIBOR for two years at 3.23% per annum resulting in an effective interest rate of 4.73% per annum, based on the Company’s current leverage ratio. |
| (5) | Weighted average interest rates are based upon outstanding balances as of December 31, 2009. |
| (6) | Certain mortgages were assumed in conjunction with the acquisition of properties and the difference between the fair value and the face value of these notes at the date of acquisition is reflected as a premium or discount which will be amortized to interest expense over the remaining life of the underlying note. |
Debt Issuances
During the year ended 2009, we had no new debt issuances. During the year ended December 31, 2008, we refinanced maturing debt through a combination of extending existing maturities and new borrowings. We entered into an agreement, which was effective June 9, 2008, to extend the maturity date of $175.0 million of the then outstanding $275.0 million senior unsecured note from June 9, 2008 to June 9, 2013, bearing interest at a fixed rate of 6.11%. The remaining $100 million was repaid with the proceeds of our Initial Loan, as described below.
On June 6, 2008, we entered into a term loan agreement (the “Agreement”) with a syndicate of 10 banks pursuant to which the Company could borrow up to $300 million in senior unsecured term loans. Loans under the Agreement have a variable interest rate based on either the base rate under the Agreement or LIBOR, at the Company’s option, plus a margin that is based on the Company’s leverage ratio, as defined by the Agreement. The margins on base rate loans may range from 0% to 0.90%, and the margins on LIBOR-based loans may range from 1.25% to 1.85%. The base rate under the Agreement is defined as the higher of the overnight Federal funds rate plus 0.50% or Bank of America’s prime rate. All loans under the Agreement are scheduled to mature on June 6, 2010, but they can be extended at the Company’s option for an additional year. The Company may prepay loans under the Agreement, in whole or in part, subject to the payment of a prepayment penalty of 0.50% on the prepaid amount, if such prepayment is made prior to March 6, 2009. Additionally, the Company must pay a fee of 0.15% quarterly in arrears on the average daily unused portion of the loan during such period.
Loans under the Agreement were funded in two tranches. The first $100 million was drawn by the Company on June 9, 2008 (the “Initial Loan”) and used to repay maturing unsecured notes. The remaining $200 million was drawn on October 3, 2008 (the “Second Tranche”) and used to repay borrowings under our credit facility. The Initial Loan has an interest rate based on LIBOR, and the Company has entered into an interest rate swap to fix the LIBOR on the Initial Loan for two years at 3.23% per annum resulting in an effective interest rate of 4.73% per annum based on the Company’s current leverage ratio. (See Note 6—Financial Instruments for additional information regarding our hedging transactions.) The Second Tranche has an interest rate based on LIBOR plus 1.25% to 1.80% or at prime, at our election, which for the year ended December 31, 2008 had an effective interest rate of 2.58%. The Company is required to pay interest monthly until maturity, at which time the outstanding balance is due.
The Agreement contains various customary covenants (including, among others, financial covenants with respect to tangible net worth, debt service coverage and unsecured and secured consolidated leverage and covenants relating to dividends and other restricted payments, liens, certain investments and transaction with affiliates) and if the Company breaches any of these covenants, or fails to pay interest or principal on the loans when due, the
F-27
Table of Contents
holders of the loans could accelerate the due date of the entire amount borrowed. The Agreement also contains other customary events of default, which would entitle the holders of the loans to accelerate the due date of the entire amount borrowed, including, among others, change of control events, defaults under certain other obligations of the Company and insolvency or bankruptcy events.
Debt Assumptions
During the year ended December 31, 2009, we assumed secured, non-recourse notes with an outstanding balance of approximately $66.0 million in connection with the consolidation of previously unconsolidated joint ventures, see Note 4—Investments in and Advances to Unconsolidated Joint Ventures for details. Each of these notes was re-paid in full during the second half of 2009. The fair value of these notes were evaluated and recorded at par. During the year ended December 31, 2008, we had no debt assumptions.
For the years ended December 31, 2009, 2008 and 2007, the amortization of all premiums resulted in a reduction of interest expense of approximately $1.0 million, $1.5 million and $2.2 million, respectively.
Line of Credit
Our senior unsecured revolving credit facility is with a syndicated group of banks and has a total capacity of $300.0 million and matures December 2010. The facility has provisions to increase its total capacity to $500.0 million. At our election, the facility bears interest either at LIBOR plus between 0.55% and 1.1%, depending upon our consolidated leverage, or at prime and is subject to an annual facility fee. The facility contains various covenants, including financial covenants with respect to consolidated leverage, tangible net worth, fixed charge coverage, unsecured indebtedness, and secured indebtedness. As of December 31, 2009 and 2008, we were in compliance with all of these covenants. At December 31, 2009 and 2008, there was no outstanding balance under this facility.
Capitalized interest
During the years ended December 31, 2009, 2008 and 2007, we incurred interest expense of approximately $52.9 million, $52.4 million and $61.2 million, respectively, including amounts from discontinued operations. Included in these amounts were $0.1 million and $4.3 million for the years ended December 31, 2008 and 2007, respectively, of interest expense related to the financing obligation (see Note 8—Our Partnership’s Private Placement for additional information). We capitalized approximately $6.1 million, $7.9 million and $7.0 million of interest in 2009, 2008 and 2007 associated with certain development and redevelopment, and other construction activities.
Loan cost amortization
Our interest expense for the years ended December 31, 2009, 2008 and 2007 includes $2.3 million, $1.7 million and $1.8 million for the amortization of loan costs, respectively. Additionally, interest expense for the years ended December 31, 2007 included $0.5 million for the amortization of loan costs related to the financing obligation. Our interest expense for the years ended December 31, 2009 and 2008 does not include any amortization of loan costs related to the financing obligation.
F-28
Table of Contents
Debt Maturities
The following table sets forth the scheduled maturities of our debt, excluding unamortized premiums, as of December 31, 2009 (amounts in thousands).
| Year |
Senior Unsecured Notes |
Mortgage Notes |
Unsecured Credit Facility |
Total | |||||||||
| 2010 |
$ | 300,000 | (1) | 6,759 | — | 306,759 | |||||||
| 2011 |
50,000 | 230,235 | — | 280,235 | |||||||||
| 2012 |
— | 167,354 | — | 167,354 | |||||||||
| 2013 |
175,000 | 41,147 | — | 216,147 | |||||||||
| 2014 |
50,000 | 3,443 | — | 53,443 | |||||||||
| Thereafter |
50,000 | 59,660 | — | 109,660 | |||||||||
| Total |
$ | 625,000 | $ | 508,598 | $ | — | $ | 1,133,598 | |||||
| (1) | This $300 million senior unsecured term loan can be extended for one year at the Company’s option. |
Note 6. Financial Instruments and Hedging Activities
Fair Value of Financial Instruments
As of December 31, 2009 and 2008, the fair values of cash and cash equivalents, restricted cash held in escrow, accounts receivable and accounts payable approximated their carrying values because of the short-term nature of these instruments. The estimated fair values of other financial instruments subject to fair value disclosures were determined based on available market information and valuation methodologies believed to be appropriate for these purposes. Considerable judgment and a high degree of subjectivity are involved in developing these estimates. These estimates are our best estimates, however, they may differ from the actual amounts that we could realize upon disposition. The following table summarizes these financial instruments (in thousands).
| Balances as of December 31, 2009 |
Balances as of December 31, 2008 |
|||||||||||||||
| Carrying Amounts |
Estimated Fair Value |
Carrying Amounts |
Estimated Fair Value |
|||||||||||||
| Notes receivable (1) |
$ | 19,084 | $ | 19,121 | $ | 30,387 | $ | 29,741 | ||||||||
| Borrowings (1): |
||||||||||||||||
| Senior, unsecured revolving credit facility |
$ | — | $ | — | $ | — | $ | — | ||||||||
| Fixed rate debt (2) |
$ | 911,478 | $ | 908,509 | $ | 974,397 | $ | 872,698 | ||||||||
| Variable rate debt |
$ | 225,237 | $ | 221,844 | $ | 225,237 | $ | 219,499 | ||||||||
| Interest rate contracts: |
||||||||||||||||
| Interest rate swaps (3) |
$ | (4,070 | ) | $ | (4,070 | ) | $ | (21,503 | ) | $ | (21,503 | ) | ||||
| (1) | The fair values of our notes receivable and borrowings were estimated using a discounted cash flow methodology. Credit spreads relating to the underlying instruments are based on unobservable Level 3 inputs which management has determined to be its best estimate of current market spreads of similar instruments. |
| (2) | The carrying amount of our fixed rate debt includes premiums and discounts as a result of the difference between the fair value and face value of debt assumed in connection with our acquisition activities. |
| (3) | The fair values of our interest rate swaps are determined using the market standard methodology of netting the discounted future fixed cash flows and the discounted expected variable cash flows based on an expectation of future interest rates derived from observable market interest rate curves. We incorporate credit valuation adjustments to appropriately reflect both our nonperformance risk and the respective counterparty’s nonperformance risk in the fair value measurements. For further discussion on the fair value of our interest rate swaps, see Note 2—Significant Accounting Policies. |
F-29
Table of Contents
Hedging Activities
To manage interest rate risk for variable rate debt and issuances of fixed rate debt, we primarily use treasury locks, forward-starting swaps and interest rate swaps as part of our cash flow hedging strategy. These derivatives are designed to mitigate the risk of future interest rate increases by providing a fixed interest rate for a limited, pre-determined period of time. During 2009, such derivatives have been used to hedge the variability in existing and future interest expense associated with existing variable rate borrowings and forecasted issuances of debt, which may include the issuances of new debt, as well as refinancings of existing debt upon maturity.
On September 2, 2009, we paid $3.6 million to settle a LIBOR-based forward starting swap with a notional value of $26.0 million which was previously entered into to mitigate the effect on cash outflows attributable the refinancing of fixed rate debt scheduled to occur in January 2010. Based on the expected date of the debt refinancing, this swap qualified for hedge accounting and the effective portion of $3.6 million was recorded in “Accumulated other comprehensive income” as of December 31, 2009.
As of December 31, 2009, such derivatives as described in the following table were in place to hedge the variability of cash flows associated with forecasted issuances of debt and $100 million of outstanding variable rate debt (dollar amounts in thousands).
| Notional Amount |
Swap Strike Rate (1) |
Effective Date |
Maturity Date | |||||||
| Swap (2) |
$ | 100,000 | 3.233 | % | June 2008 | June 2010 | ||||
| Forward-starting swap (3) |
$ | 90,000 | 5.430 | % | June 2012 | September 2012 | ||||
| (1) | The referenced swap index for each of our swaps was LIBOR. |
| (2) | The counterparty is Wells Fargo Bank, NA. |
| (3) | The counterparty is PNC Bank, NA. |
On a recurring basis, we measure our derivatives at fair value, which was a gross liability of $4.1 million and $21.5 million as of December 31, 2009 and 2008, respectively, included in “Other Liabilities” in our Consolidated Balance Sheets. The fair value of these derivatives was determined using Level 2 and 3 inputs. The effective portion of changes in the fair value of derivatives designated and that qualify as cash flow hedges is recorded in “Accumulated other comprehensive loss” and is subsequently reclassified into earnings in the period that the hedged forecasted transaction affects earnings. The ineffective portion of the change in fair value of the derivatives is recognized directly in earnings and is recorded as “Interest income and other” in our Consolidated Statements of Operations. During the year ended December 31, 2009, we recorded no ineffectiveness. During the year ended December 31, 2008, we recorded a loss of approximately $0.2 million related to the ineffectiveness due to the change in estimated timing of anticipated debt issuances. During the year ended December 31, 2007, we recorded a realized gain of approximately $1.8 million, offset by approximately $0.3 million of loss related to the ineffectiveness due to the change in estimated timing of the anticipated debt issuance of the $275.0 million forward-starting swap.
During the years ended December 31, 2009 and 2008, we recorded approximately $16.0 million of net unrealized gains and $21.1 million of unrealized losses, respectively, including the noncontrolling interests’ portion, in “Accumulated other comprehensive loss” as a result of the change in fair value of our outstanding hedges. As of December 31, 2009 and 2008, the “Accumulated other comprehensive loss” balance pertaining to the hedges were losses of approximately $12.5 million and $26.6 million, respectively, including the noncontrolling interests’ portion.
Amounts reported in “Accumulated other comprehensive loss” related to derivatives will be amortized to “Interest expense” as interest payments are made on our current debt and anticipated debt issuances. During the year ended December 31, 2009, we recognized $0.2 million in accelerated amortization on a discontinued hedge
F-30
Table of Contents
due to the prepayment of the underlying debt. During the next 12 months, we estimate that approximately $0.9 million will be reclassified from “Accumulated other comprehensive loss” to “Interest expense” resulting in an increase in such expense.
Note 7. Commitments and Contingencies
Legal Matters
We are a party to various legal actions and administrative proceedings arising in the ordinary course of business, some of which may be covered by liability insurance, and none of which we expect to have a material adverse effect on our consolidated financial condition or results of operations.
Operating Leases
We are obligated under non-cancelable office space and equipment operating leases. Approximate minimum annual rentals under operating leases are as follows (in thousands):
| Year Ended December 31: |
Operating Leases |
Ground Leases | ||||
| 2010 |
$ | 489 | $ | 474 | ||
| 2011 |
370 | 474 | ||||
| 2012 |
161 | 474 | ||||
| 2013 |
5 | 474 | ||||
| 2014 |
2 | 489 | ||||
| Thereafter |
— | 12,336 | ||||
| Total |
$ | 1,027 | $ | 14,721 | ||
Substantially all of the office space and equipment subject to the operating leases described above are for the use at our corporate and regional offices. Rent expense recognized was approximately $0.9 million, $0.9 million and $0.8 million during the years ended December 31, 2009, 2008 and 2007, respectively.
Note 8. Our Partnership’s Private Placement
Prior to October 10, 2006, our operating partnership offered undivided tenancy-in-common interests (“TIC Interests”) in certain of our properties to accredited investors in a private placement exempt from registration under the Securities Act of 1933, as amended. The TIC Interests were 100% leased by our operating partnership pursuant to master leases and such leases contained purchase options whereby our operating partnership had the right, but not the obligation, to acquire the TIC Interests from the investors at a point in time in exchange for units of limited partnership interest in our operating partnership (“OP Units”) under Section 721 of the Internal Revenue Code. In October 2006, we discontinued our operating partnership’s private placement of TIC Interests. In January 2008, our operating partnership purchased all remaining TIC Interests in the one remaining property included in our operating partnerships private placement for an aggregate of 1.6 million OP Units valued at approximately $14.8 million.
The amount of gross proceeds associated with the sales of TIC Interests was recorded in “Financing obligations” in our Consolidated Balance Sheets. In cases where we leased back a portion of a building sold to the unrelated third-party investors, rental payments made to such investors under these lease agreements were recognized as “Interest expense” using the interest method. As of December 31, 2009 and 2008, there was no remaining balance related to the financing obligation. Approximately $0.1 million and $4.3 million of interest expense related to the financing obligation was included in “Interest expense” for the years ended December 31, 2008 and 2007, respectively. A portion of these rental payments was accounted for as a reduction of the outstanding principal balance of the financing obligations and a portion was accounted for as “Interest expense” in our Consolidated Statements of Operations. No rental payments were incurred during the year ended December 31, 2009. During the years ended December 31, 2008 and 2007, we incurred approximately $0.1 million and $4.9 million, respectively, of rental payments under various lease agreements with certain of the third-party investors.
F-31
Table of Contents
Prior to October 10, 2006, our operating partnership paid certain up-front fees and reimbursed certain related expenses Former Advisor, Dividend Capital Securities LLC (our “Former Dealer Manager”) and Dividend Capital Exchange Facilitators LLC (our “Former Facilitator”) for raising capital through our operating partnership’s private placement. Our Former Advisor was obligated to pay all of the offering and marketing related costs associated with the private placement. However, our operating partnership was obligated to pay our Former Advisor a non-accountable expense allowance, which equaled 2% of the gross equity proceeds raised through the private placement. In addition, our operating partnership was obligated to pay our Former Dealer Manager a dealer manager fee of up to 1.5% of gross equity proceeds raised and a commission of up to 5% of the gross equity proceeds raised through the private placement. Our operating partnership was also obligated to pay a transaction facilitation fee to our Former Facilitator of up to 1.5% of the gross equity proceeds raised through the private placement. These up-front costs were accounted for as deferred loan costs and were included in “Deferred loan costs—financing obligation, net” in our Consolidated Balance Sheets and amortized to “Interest expense” over the life of the financing obligation. In addition, whenever our operating partnership elected to exercise any purchase option as described above and issue OP Units, the unamortized portion of up-front fees and expense reimbursements paid to affiliates was recorded against noncontrolling interests as a selling cost of the OP Units. We terminated these arrangements with our Former Dealer Manager and our Former Facilitator on October 10, 2006. During the year ended December 31, 2009, no interest expense was recorded related to the amortization of these up-front fees. During the years December 31, 2008 and 2007, $4,000 and $0.5 million of related interest expense was recorded.
Note 9. Noncontrolling Interests
Noncontrolling interests, formerly called minority interests, are the portion of equity, or net assets, in a subsidiary not attributable, directly or indirectly, to a parent. Our noncontrolling interests primarily represent limited partnership interests in our operating partnership and equity interests held by third party partners in our consolidated real estate joint ventures. Our noncontrolling interests held by third party partners in our consolidated joint ventures was insignificant during the years ended December 31, 2009, 2008 and 2007.
Noncontrolling interests representing interests in our operating partnership include OP Units and LTIP units which are classified as permanent equity in accordance with GAAP and are included in “Noncontrolling interests” in our Consolidated Balance Sheets.
OP Units
As of December 31, 2009 and December 31, 2008, we owned approximately 88% and 84%, respectively, of the outstanding equity interests of our operating partnership. The remaining equity interest in our operating partnership was owned by third-party investors and also, as of December 31, 2008, Dividend Capital Advisors Group LLC (“DCAG”) either directly or indirectly by certain of our officers and directors, through their membership interests in and/or rights to receive a portion of the net cash flows, or cash flow interests of DCAG. As of November 10, 2009, DCAG redeemed the last of its limited partnership interest, which was in the form of OP units. As of December 31, 2008, DCAG owned approximately 5% of our operating partnership. Subject to certain agreements, OP Units are redeemable at the option of the unitholder after a fixed period. We have the option of redeeming the OP Units with cash or with shares of our common stock on a one-for-one basis, subject to adjustment.
During the year ended December 31, 2009, 5.5 million OP Units were redeemed for approximately $1.9 million in cash and 5.1 million shares of common stock. As of December 31, 2009, there was a total of 27.2 million OP Units outstanding with a redemption value of approximately $136.4 million based on the closing price of our common stock on December 31, 2009, all of which were redeemable.
During the year ended December 31, 2008, approximately 6.9 million OP Units were redeemed for approximately $1.5 million in cash and 6.7 million shares of common stock. Additionally, during the year ended December 31, 2008, our operating partnership purchased all remaining TIC Interests in the one remaining property for an aggregate of 1.6 million OP Units valued at approximately $14.8 million. As of December 31,
F-32
Table of Contents
2008, there was a total of 32.4 million OP Units outstanding with a redemption value of approximately $164.1 million based on the closing price of our common stock on December 31, 2008.
LTIP Units
We may grant limited partnership interests in our operating partnership called LTIP Units. LTIP Units, which we grant either as free-standing awards or together with other awards under our Long-Term Incentive Plan, are valued by reference to the value of our common stock, and are subject to such conditions and restrictions as our compensation committee may determine, including continued employment or service, computation of financial metrics and/or achievement of pre-established performance goals and objectives. During the years ended December 31, 2009 and 2008, 0.4 million LTIP Units, were granted to certain officers and senior executives, and the total fair value of these LTIP Units on the date of grant was $1.5 million and $3.2 million, respectively. Also during the year ended December 31, 2009, 0.2 million vested LTIP Units, as further described below, were converted on a one-for-one basis into OP Units. As of December 31, 2009, 1.3 million LTIP Units were outstanding of which 0.3 million were vested. Our LTIP unit grants are further discussed in Note 12—Equity Based Compensation and Warrant Purchase Agreements.
The following table illustrates the noncontrolling interests’ share of our consolidated net income (loss) during the years ended December 31, 2009, 2008 and 2007 (in thousands).
| For the Years Ended December 31, |
||||||||||||
| 2009 | 2008 | 2007 | ||||||||||
| Noncontrolling interests’ share of (Income) Loss From Continuing Operations |
$ | 3,429 | $ | 2,224 | $ | 123 | ||||||
| Noncontrolling interests’ share of Income (Loss) from discontinued operations |
(304 | ) | (4,086 | ) | (2,529 | ) | ||||||
| Noncontrolling interests’ share of Gain on dispositions of real estate interests |
(1 | ) | (93 | ) | (4,810 | ) | ||||||
| Net income (loss) attributable to noncontrolling interests |
$ | 3,124 | $ | (1,955 | ) | $ | (7,216 | ) | ||||
Note 10. Stockholders’ Equity
Common Stock
As of December 31, 2009, 2008 and 2007, approximately 208.0 million, 175.1 million and 168.4 million shares of common stock issued and outstanding, respectively.
On June 5, 2009, we issued 24.0 million shares of common stock in a public offering at a price of $4.25 per share. On June 10, 2009, we issued an additional 3.6 million upon the exercise the underwriters’ over-allotment option which was granted in conjunction with the public offering at the same price per share.
During the year ended December 31, 2009, we issued approximately 5.1 million shares of common stock in connection with redemptions of our OP Units (see Note 9—Noncontrolling Interests). In December 2006, we completed a listing on the NYSE issuing 16.3 million shares for net proceeds of approximately $185.3 million, before expenses of $3.7 million. During 2006, we also raised approximately $137.3 million of net proceeds from the sale of our common stock in connection with our prior continuous public offering, which we closed on January 23, 2006. Additionally we sold 88,889 shares in October 2006. Although we closed the primary offering component of this public offering, we continued to offer shares through our former distribution reinvestment plan through our 2006 third quarter distribution, which resulted in the issuance of 5.2 million shares or $51.7 million of dividends reinvested during the year ended December 31, 2006. Our former distribution reinvestment plan was terminated on December 23, 2006.
The net proceeds from the sales of our securities were transferred to our operating partnership for a number of OP Units equal to the shares of common stock sold in our public and private offerings, including the offerings noted above.
F-33
Table of Contents
The holders of shares of our common stock are entitled to one vote per share on all matters voted on by stockholders, including election of our directors. Our articles of incorporation do not provide for cumulative voting in the election of our directors. Therefore, the holders of the majority of the outstanding shares of common stock can elect the entire board of directors. Subject to any preferential rights of any outstanding series of our preferred stock and to the distribution of specified amounts upon liquidation with respect to shares-in-trust, the holders of our common stock are entitled to such distributions as may be declared from time to time by our board of directors out of legally available funds and, upon liquidation, are entitled to receive all assets available for distribution to stockholders. All shares issued in our public offerings are fully paid and non-assessable shares of common stock. Holders of our common stock will not have preemptive rights.
Dividend Reinvestment and Stock Purchase Plan
In April 2007, we began offering shares of our common stock through our Dividend Reinvestment and Stock Purchase Plan (the “Plan”). The Plan permits stockholders to acquire additional shares with quarterly dividends and to make additional cash investments to buy shares directly. Shares of common stock may be purchased in the open market, through privately negotiated transactions, or directly from us as newly issued shares of common stock. All shares issued under the Plan were acquired in the open market.
Preferred Shares
Our board of directors, through the articles of incorporation, has the authority to authorize the issuance of 50,000,000 preferred shares of any class or series. The rights and terms of such preferred shares will be determined by our board of directors. However, the voting rights of preferred stockholders shall never exceed the voting rights of common stockholders. As of December 31, 2009 and 2008, we had no outstanding shares of preferred stock.
Shares-in-Trust
Our board of directors, through the articles of incorporation, has the authority to authorize the issuance of shares-in-trust which are shares that are automatically exchanged for common or preferred shares as a result of an event that would cause an investor to own, beneficially or constructively, a number of shares in excess of certain limitations. As of December 31, 2009 and 2008, we had no outstanding shares-in-trust.
Distributions
Our distributions are calculated based upon the total number of shares of our common stock or limited partnership units of our operating partnership outstanding on the distribution record date as declared by our board of directors. We accrue and pay distributions on a quarterly basis. The following table sets forth the distributions that have been paid and/or declared to date by our board of directors.
| Amount Declared During Quarter Ended in 2009: |
Per Share | Date Paid | |||
| December 31, |
$ | 0.0700 | January 15, 2010 | ||
| September 30, |
0.0700 | October 16, 2009 | |||
| June 30, |
0.0800 | July 17, 2009 | |||
| March 31, |
0.0800 | April 17, 2009 | |||
| Total 2009 |
$ | 0.3000 | |||
| Amount Declared During Quarter Ended in 2008: |
Per Share | Date Paid | |||
| December 31, |
$ | 0.0800 | January 16, 2009 | ||
| September 30, |
0.1600 | October 17, 2008 | |||
| June 30, |
0.1600 | July 18, 2008 | |||
| March 31, |
0.1600 | April 18, 2008 | |||
| Total 2008 |
$ | 0.5600 | |||
F-34
Table of Contents
| Amount Declared During Quarter Ended in 2007: |
Per Share | Date Paid | |||
| December 31, |
$ | 0.1600 | January 17, 2008 | ||
| September 30, |
0.1600 | October 19, 2007 | |||
| June 30, |
0.1600 | July 20, 2007 | |||
| March 31, |
0.1600 | April 19, 2007 | |||
| Total 2007 |
$ | 0.6400 | |||
Note 11—Earnings per Share
We use the two-class method of computing earnings per common share which is an earnings allocation formula that determines earnings per share for common stock and any participating securities according to dividends declared (whether paid or unpaid) and participation rights in undistributed earnings. Under the two-class method, earnings per common share are computed by dividing the sum of distributed earnings to common stockholders and undistributed earnings allocated to common stockholders by the weighted average number of common shares outstanding for the period.
A participating security is defined by GAAP as an unvested share-based payment award containing non-forfeitable rights to dividends and must be included in the computation of earnings per share pursuant to the two-class method. Our nonvested restricted stock and LTIP units are considered participating securities as these share-based awards contain non-forfeitable rights to dividends irrespective of whether the awards ultimately vest or expire.
The following table sets forth the computation of our basic and diluted earnings per common share (in thousands except per share information):
| For the Years Ended December 31, |
||||||||||||
| 2009 | 2008 | 2007 | ||||||||||
| Earnings per share—Basic and Diluted |
||||||||||||
| Numerator |
||||||||||||
| Income (Loss) From Continuing Operations attributable to DCT common stockholders |
$ | (20,502 | ) | $ | (10,340 | ) | $ | 577 | ||||
| Less: Distributed and undistributed earnings allocated to participating securities |
(436 | ) | (651 | ) | (447 | ) | ||||||
| Numerator for adjusted income (loss) from continuing operations attributable to DCT common stockholders |
(20,938 | ) | (10,991 | ) | 130 | |||||||
| Numerator for income from discontinued operations attributable to DCT common stockholders |
1,913 | 19,415 | 13,597 | |||||||||
| Numerator for gain on dispositions of real estate interests attributable to common stockholders |
4 | 411 | 25,938 | |||||||||
| Adjusted net income (loss) attributable to DCT common stockholders |
$ | (19,021 | ) | $ | 8,835 | $ | 39,665 | |||||
| Denominator |
||||||||||||
| Weighted average common shares outstanding—basic |
192,900 | 171,695 | 168,358 | |||||||||
| Potentially dilutive common shares |
— | — | 1 | |||||||||
| Weighted average common shares outstanding—dilutive |
192,900 | 171,695 | 168,359 | |||||||||
| Earnings per Common Share—Basic and Diluted |
||||||||||||
| Income (Loss) From Continuing Operations |
$ | (0.11 | ) | $ | (0.06 | ) | $ | 0.00 | ||||
| Income from discontinued operations |
0.01 | 0.11 | 0.08 | |||||||||
| Gain on dispositions of real estate interests |
0.00 | 0.00 | 0.16 | |||||||||
| Net Income (Loss) Attributable to DCT Common Stockholders |
$ | (0.10 | ) | $ | 0.05 | $ | 0.24 | |||||
F-35
Table of Contents
Potentially Dilutive Shares
We have excluded from diluted earnings per share the weighted average common share equivalents related to approximately 4.1 million, 3.6 million and 2.2 million stock options, phantom stock and warrants for the years ended December 31, 2009, 2008, and 2007 respectively, because their effect would be anti-dilutive.
Note 12. Equity Based Compensation and Warrant Purchase Agreements
Long Term Incentive Plan
On October 10, 2006, we adopted, and our stockholders approved, our Long-Term Incentive Plan. We use our Long-Term Incentive Plan to grant restricted stock, stock options and other equity awards to our eligible employees. Subject to adjustment upon certain corporate transactions or events, the total number of shares of our common stock subject to such awards may not exceed 8.0 million shares and in no event may any optionee receive options for more than 2.0 million shares on an annual basis.
Phantom Shares
Pursuant to the Long-Term Incentive Plan, we may grant phantom shares to our non-employee directors. Our phantom shares typically vest upon the first anniversary of the grant date, depending on the grant. Once vested and at the discretion of the grantee, the phantom stock can be converted into either cash or common stock at the option of the Company. Phantom shares are recorded at their fair value on the date of grant and are amortized on a straight-line basis over the service period during which term the shares fully vest. For the years ended December 31, 2009, 2008 and 2007, we incurred approximately $0.3 million, $0.2 million, $0.3 million, respectively, of such expense which is included in “General and administrative” in our Consolidated Statements of Operations. As of December 31, 2009, approximately $0.1 million of such expense remained unrecognized which reflects the unamortized portion of the value of such shares issued pursuant to the Long-Term Incentive Plan. We expect to recognize such expense over a remaining period of 5.2 months.
During the years ended December 31, 2009, 2008 and 2007, we issued 15,970, 12,592 and 21,777 shares of common stock for vested phantom stock, respectively. Based on the share’s fair value at grant date for each grant, the total fair value of phantom stock vested in 2009, 2008 and 2007 was $0.3 million, $0.2 million and $0.2 million, respectively. As of December 31, 2009, 2008 and 2007 we had 75,562, 39,362 and 22,036 phantom shares outstanding.
Restricted Stock
Our restricted stock is recorded at fair value on the date of grant and amortized on a straight-line basis over the service period during which term the stock fully vests. Our restricted stock typically vests ratably over a period of four to five years, depending on the grant. For the years ended December 31, 2009, 2008 and 2007, we incurred approximately $0.7 million, $0.4 million and $0.1 million, respectively, of such expense which is included in “General and administrative” in our Consolidated Statements of Operations. As of December 31, 2009, approximately $1.3 million of such expense remained unrecognized which reflects the unamortized portion of the value of such shares issued pursuant to the Long-Term Incentive Plan. We expect to recognize such expense over a weighted average remaining period of 2.6 years.
During the years ended December 31, 2009, 2008 and 2007, we issued 65,490, 15,282 and 3,490 shares of common stock for vested restricted stock. No restricted stock shares were granted prior to 2007. Based on the share’s fair value at grant date for each grant, the total fair value of restricted stock vested in 2009, 2008 and 2007 was $0.6 million, $0.2 million and $41,000, respectively.
LTIP Units
Pursuant to our Long-Term Incentive Plan, we may grant newly established limited partnership interests in our operating partnership called LTIP Units (“LTIP Units”). LTIP Units, which we grant either as free-standing
F-36
Table of Contents
awards or together with other awards under our Long-Term Incentive Plan, are valued by reference to the value of our common stock, and are subject to such conditions and restrictions as our compensation committee may determine, including continued employment or service, computation of financial metrics and/or achievement of pre-established performance goals and objectives. Our LTIP Units typically vest ratably over a period of four to five years depending on the grant. Vested LTIP Units can be redeemed for OP Units on a one-for-one basis.
Effective February 10, 2009, we granted 0.4 million LTIP Units in total to certain senior executives which vest 25% annually over four years and which had a total fair value of $1.5 million at the date of grant as determined by a lattice-binomial option-pricing model based on a Monte Carlo simulations using a volatility factor of 48% and a risk-free interest rate of 1.79%. Effective February 11, 2008, we granted 0.4 million LTIP Units in total to certain senior executives, of which 0.3 million that vest 25% annually over four years and 0.1 million that vest over five years (25% in year three, 25% in year four and 50% in year five), with a total fair value of $3.2 million at the date of grant as determined by a lattice-binomial option-pricing model based on a Monte Carlo simulations using a volatility factor of 23% and a risk-free interest rate of 2.67%. Effective February 13, 2007, we granted 0.2 million LTIP Units in total to certain senior executives. The total fair value of these LTIP Units on the date of grant was $1.7 million and vest 20% annually over five years beginning on October 10, 2007.
Our LTIP Units are recorded at their fair value on the date of grant and are amortized on a straight-line basis over the service period during which term the units fully vest. We incurred approximately $4.6 million, which includes $0.9 million due to a change in our estimated forfeiture rate, $2.2 million and $1.1 million of such expense for the years ended December 31, 2009, 2008 and 2007, respectively, which is included in “General and administrative” in our Consolidated Statements of Operations. As of December 31, 2009, approximately $4.2 million of such expense remained unrecognized which reflects the unamortized portion of the value of such LTIP Units which we expect to recognize over a remaining weighted average period of 2.0 years.
During the year ended December 31, 2009, 0.2 million vested LTIP Units were redeemed for 0.2 million OP Units. No LTIP Units were redeemed prior to 2009. Based on the LTIP Unit’s fair value at grant date for each grant, the fair value of LTIP Units vested in 2009, 2008 and 2007 was $3.8 million $0.3 million and $0.3 million, respectively. As of December 31, 2009, 2008 and 2007, we had 1.3 million, 1.1 million and 0.7 million LTIP Units outstanding, respectively.
The following table summarizes additional information concerning our unvested phantom shares, restricted stock and LTIP Units (shares in thousands).
| Phantom Shares | Restricted Stock | LTIP Units | ||||||||||||||||
| Shares | Weighted Average Grant Date Fair Value |
Shares | Weighted Average Grant Date Fair Value |
Shares | Weighted Average Grant Date Fair Value | |||||||||||||
| Unvested at December 31, 2006 |
22 | $ | 11.25 | — | $ | — | 502 | $ | 10.78 | |||||||||
| Granted |
22 | 11.12 | 75 | 11.39 | 160 | 10.78 | ||||||||||||
| Vested |
(22 | ) | 11.25 | (3 | ) | 11.86 | (32 | ) | 10.78 | |||||||||
| Forfeited |
— | — | (2 | ) | 11.46 | — | — | |||||||||||
| Unvested at December 31, 2007 |
22 | $ | 11.12 | 70 | $ | 11.37 | 630 | $ | 10.78 | |||||||||
| Granted |
30 | 9.36 | 125 | 8.46 | 396 | 8.07 | ||||||||||||
| Vested |
(22 | ) | 11.12 | (15 | ) | 11.36 | (32 | ) | 10.78 | |||||||||
| Forfeited |
— | — | (7 | ) | 10.60 | — | — | |||||||||||
| Unvested at December 31, 2008 |
30 | $ | 9.36 | 173 | $ | 9.30 | 994 | $ | 9.70 | |||||||||
| Granted |
61 | 4.60 | 252 | 3.49 | 473 | 3.22 | ||||||||||||
| Vested |
(30 | ) | 9.36 | (66 | ) | 9.17 | (464 | ) | 8.21 | |||||||||
| Forfeited |
(9 | ) | 4.60 | (39 | ) | 6.07 | — | — | ||||||||||
| Unvested at December 31, 2009 |
52 | $ | 4.60 | 320 | $ | 5.14 | 1,003 | $ | 7.33 | |||||||||
F-37
Table of Contents
Stock Options
We may grant stock options to certain employees pursuant to our Long-Term Incentive Plan. The term of such options is 10 years from the date of grant unless forfeited earlier and the period during which the right to exercise such options fully vests ranges from four to five years from the date of grant. No stock options were granted under our Long-Term Incentive Plan prior to 2007. During the year ended December 31, 2009, we issued 0.1 million shares of common stock upon the exercise of options to purchase our common stock by certain employees.
During the years ended December 31, 2009, 2008 and 2007, options issued under the Long-Term Incentive Plan were valued using the Black-Scholes option pricing model. The table below sets forth the assumptions used in valuing such options.
| 2009 | 2008 | 2007 | ||||
| Expected term of options (1) |
5.5-6.25 years | 6-7 years | 6-7 years | |||
| Expected volatility-range used |
42.96%-51.55% | 21.62%-29.98% | 19.21%-21.51% | |||
| Expected volatility-weighted average |
43.71% | 22.79% | 19.43% | |||
| Expected dividend yield-range used |
5.73%-10.60% | 6.49%-7.86% | 5.31%-6.52% | |||
| Expected dividend yield-weighted average |
9.36% | 7.42% | 5.59% | |||
| Risk-free interest rate |
1.90%-2.80% | 2.90%-3.55% | 3.40%-5.14% |
| (1) | We use the simplified method to determine the estimated life of our option awards as sufficient historical exercise data is unavailable. Under the simplified method the expected term is calculated as the midpoint between the vesting and the end of the contractual term of the option. |
2006 Outperformance Program
On December 13, 2006, we adopted an outperformance program which provided for certain grants to be made under (and subject to) our Long-Term Incentive Plan, under which LTIP Units (as described above) are earned by selected senior executives if certain pre-established performance targets related to our compound annual stockholder return are met. Pursuant to the outperformance program, participating executives could share in a “performance pool” if our total stockholder return for the three year performance period, beginning December 13, 2006, exceeded the greater of an absolute compound annual total stockholder return of 10% or 110% of the compound annual return of the MSCI US REIT Index. The size of the pool for the initial program was 10% of the outperformance amount in excess of the performance hurdle, subject to a maximum amount of $40 million. Each executive’s award under the program was designated as a specified percentage of the aggregate performance pool and such awards were to be made in the form of LTIP Units. These LTIP Units were not entitled to distributions until and unless the performance pool is established. Half of the LTIP Units earned awards under the program (i.e. the number of LTIP Units earned) were scheduled to vest at the end of the three-year performance period, if the performance pool was established, after which the other half would vest ratably over the following two-year period. As of December 31, 2008, the performance pool was not established as the performance goals were not reached. In October 2009, the outperformance program was canceled.
The LTIP Units associated with the program were originally recorded at their fair value of $2.9 million on the date of grant as determined by a lattice-binomial option-pricing model based on a Monte Carlo simulation using a volatility factor of 16.31% and a risk-free interest rate of 4.62%, and amortized on a straight-line basis over the period during which the grant of such units fully vest. During the year ended December 2009, we incurred approximately $2.1 million expense, which includes $1.4 million in accelerated amortization resulting from the program’s cancellation, and approximately $0.6 million expense for both years ended December 31, 2008 and 2007, which is included in “General and administrative” in our Consolidated Statements of Operations.
F-38
Table of Contents
Employee Option Plan
Prior to October 6, 2006, we issued stock options under the Employee Option Plan, which was designed to enable us, our Former Advisor and its affiliates to obtain or retain the services of employees (not to include our directors) of our Former Advisor and its affiliates considered essential to our long-term success and the success of our Former Advisor and its affiliates by offering such employees an opportunity to participate in our growth through ownership of our shares. The Employee Option Plan was administered by our compensation committee, which was authorized to grant “non-qualified” stock options (the “Employee Options”) to certain employees of our Former Advisor and its affiliates. The compensation committee set the exercise price for the Employee Options in its discretion, which could not be less than the greater of (1) $11.00 per share or (2) the fair market value of the shares on the date the Employee Option was granted. A total of 1.0 million shares were authorized and reserved for issuance under the Employee Option Plan. The compensation committee set the term of Employee Options in its discretion, which could not exceed the later of five years from the date of grant or five years from the date of a listing of our common stock. Our compensation committee set the period during which the right to exercise an Employee Option fully vests at three years from the date of grant. Since the adoption of the Long-Term Incentive Plan on October 6, 2006, no further grants were made pursuant to the Employee Option Plan.
During the year ended December 31, 2006, options issued under the Employee Option Plan were valued using the Black-Scholes option pricing model. No employee options granted under this plan subsequent to 2006.
Independent Director Option Plan
Prior to October 6, 2006, we granted stock options under the Independent Director Option Plan, which we used in an effort to attract and retain qualified independent directors. We granted non-qualified stock options to purchase 10,000 shares to each independent director pursuant to the Independent Director Option Plan effective upon the later of (1) the sale of 0.2 million shares in our first continuous public offering, and (2) the independent director becoming a member of our board of directors. These options vest 20% upon grant date and 20% each year for the following four years and have an exercise price of $12.00 per share. In addition, we issued options to purchase 5,000 shares to each independent director then in office on the date of each annual stockholder’s meeting and these options vest 100% upon the second anniversary from the grant date and have an exercise price equal to the greater of (1) $12.00 per share or (2) the fair market value of the shares on the date they are granted. Options granted under the Independent Director Option Plan shall lapse on the first to occur of (1) the tenth anniversary of the date we grant them, (2) the removal the independent director for cause, or (3) three months following the date the independent director ceases to be a director for any reason, other than death or disability. Since the adoption of the Long-Term Incentive Plan, no further grants were made pursuant to the Independent Director Option Plan. During the years ended December 31, 2006 and 2005, options issued under the Independent Director Option Plan were valued using the Black-Scholes option pricing model. No options were issued under this plan subsequent to 2006.
Stock Options Summary Table
Stock options granted under the Long-Term Incentive Plan, the Employee Option Plan and the Independent Director Option Plan are amortized on a straight-line basis over the service period during which the right to exercise such options fully vests. For the years ended December 31, 2009, 2008 and 2007 we incurred approximately $1.0 million, $0.6 million, and $0.2 million, respectively, of such expense which is included in “General and administrative” in our Consolidated Statements of Operations. As of December 31, 2009, approximately $1.1 million of such expense remained unrecognized which reflects the unamortized portion of the value of such options issued pursuant to the aforementioned plans. We expect to recognize such expense over a remaining weighted average period of 2.4 years.
F-39
Table of Contents
The following table describes the total options outstanding, granted, exercised, expired and forfeited as of and during the years ended December 31, 2009, 2008, 2007, as well as the total options exercisable as of December 31, 2009.
| Independent Director Option Plan |
Employee Option Plan |
Long-Term Incentive Plan |
Weighted Average Option Price Per Share |
Weighted Average Fair Value of Options Granted During the Year |
Weighted Average Remaining Contractual Life (Years) |
Intrinsic Value | |||||||||||||
| (options in thousands) | (in thousands) | ||||||||||||||||||
| Issued and Outstanding as of December 31, 2006 |
80 | 341 | — | $ | 11.19 | ||||||||||||||
| Granted |
— | — | 574 | 11.44 | $ | 1.41 | |||||||||||||
| Forfeited |
— | (47 | ) | (4 | ) | 11.04 | |||||||||||||
| Issued and Outstanding as of December 31, 2007 |
80 | 294 | 570 | $ | 11.35 | ||||||||||||||
| Granted |
— | — | 1,615 | 8.61 | $ | 0.70 | |||||||||||||
| Forfeited |
— | (5 | ) | (20 | ) | 10.51 | |||||||||||||
| Issued and Outstanding as of December 31, 2008 |
80 | 289 | 2,165 | $ | 9.61 | ||||||||||||||
| Granted |
— | — | 1,553 | 3.42 | $ | 0.55 | |||||||||||||
| Exercised |
— | — | (140 | ) | 3.41 | $ | 297 | ||||||||||||
| Forfeited and/or expired |
— | (100 | ) | (404 | ) | 9.29 | |||||||||||||
| Issued and Outstanding as of December 31, 2009 |
80 | 189 | 3,174 | $ | 7.11 | 7.04 | $ | 2,200 | |||||||||||
| Exercisable as of December 31, 2009 |
78 | 189 | 1,106 | $ | 8.49 | 7.04 | $ | 500 | |||||||||||
Warrant Purchase Agreements
Pursuant to our first and second continuous public offerings, our Former Dealer Manager earned one soliciting dealer warrant for every 25 shares of common stock sold (see Note 10 – Stockholders’ Equity for additional information). These warrants, as well as the shares issuable upon their exercise, were registered in connection with our first and second continuous public offerings. In September 2005, our board of directors approved and we issued approximately 2.2 million soliciting dealer warrants to our Former Dealer Manager representing all of the warrants our Former Dealer Manager earned in connection with both of the aforementioned offerings. We valued these warrants using the Black-Scholes option-pricing model, and based on our historical volatility, these warrants had a nominal value. Approximately 1.0 million of the outstanding soliciting dealer warrants expired in July 2007 and the remaining 1.2 million soliciting dealer warrants expired in April 2009.
Note 13. Related Party Transactions
Note Receivable with TRT-DCT Venture I
In June 2007, we issued a secured $16.0 million, 6.0% interest note, maturing with one balloon payment in July 2014 to our unconsolidated joint venture, TRT-DCT Industrial Joint Venture I (“TRT-DCT Venture I”). Interest is due monthly on the unpaid balance. For the years ended December 31, 2009, 2008 and 2007, we recognized interest income from this note receivable of approximately $0.9 million, $0.9 million and $0.4 million, respectively.
F-40
Table of Contents
DCAG
During 2008, we renewed our transitional services agreement with Overhead Services, Inc., formerly DC Services, LLC, (“Overhead Services”), an affiliate of DCAG, for one year, whereby we received enumerated services, including IT services, human resources, payroll and accounts payable services for a monthly fee of approximately $72,000. Overhead Services has continued to provide us shared services in 2009 for a monthly fee of approximately $50,000.
During the years ended December 31 2009 and 2008, DCAG, and indirectly, certain of our officers and directors, through their membership interests in and/or rights to receive a portion of the net cash flows, or cash flow interests of DCAG, owned a portion of limited partnership interest in our operating partnership. As of November 10, 2009, DCAG redeemed the last of its limited partnership interest. As of December 31, 2008, DCAG owned approximately 5% of our operating partnership.
Our Former Dealer Manager
Our prior continuous public offerings of shares of common stock and our operating partnership’s private placement were managed by our Former Dealer Manager pursuant to the terms of certain dealer manager agreements. Our Former Facilitator was considered a related party as it was indirectly majority owned and/or controlled by Tom Wattles and James Mulvihill and their affiliates during the periods presented. We terminated these dealer manager agreements on October 10, 2006.
Prior to October 10, 2006, we incurred dealer manager fees and sales commissions payable to our Former Dealer Manager. Also prior to October 10, 2006, we incurred up-front fees payable to our Former Dealer Manager for dealer manager fees and sales commissions (see Note 8—Our Partnership’s Private Placement for additional information). As of December 31, 2006, all sales commissions had been re-allowed to participating broker-dealers. Such amounts were considered a cost of raising capital and as such were included as a reduction of “Additional paid-in capital” in our Consolidated Balance Sheets. Pursuant to our first and second continuous public offerings, our Former Dealer Manager earned one soliciting dealer warrant for every 25 shares sold (see Note 12—Equity Based Compensation and Warrant Purchase Agreements for additional information). No warrants were offered in our third or fourth continuous public offerings.
Our Former Facilitator
Our Former Facilitator was responsible for the facilitation of transactions associated with our operating partnership’s private placement. Prior to October 10, 2006, we paid our Former Facilitator up to 1.5% of the gross equity proceeds raised through our operating partnership’s private placement for transaction facilitation (see Note 8—Our Partnership’s Private Placement for additional information). We terminated our arrangements with our Former Facilitator on October 10, 2006. Our Former Facilitator was considered a related party as it was indirectly majority owned and/or controlled by Tom Wattles and James Mulvihill and their affiliates during the periods presented.
Note 14. Income and Other Taxes
We operate and expect to continue to operate in a manner to meet all the requirements to qualify for REIT status. We have made our REIT election under Internal Revenue Code Section 856 for the taxable year ended December 31, 2003 and all subsequent years. In order for a former C corporation to elect to be a REIT, it must distribute 100% of its C corporation earnings and profits and agree to be subject to federal tax at the corporate level to the extent of any subsequently recognized built-in gains within a 10 year period. We did not have any built-in gains at the time of our conversion to REIT status. As a REIT, we generally will not be subject to federal income taxation at the corporate level to the extent we distribute 100% of our REIT taxable income annually, as defined in the Internal Revenue Code, to our stockholders and satisfy other requirements. To continue to qualify as a REIT for federal tax purposes, we must distribute at least 90% of our REIT taxable income annually. As of December 31, 2009, we recorded $0.7 million in provisions for federal income taxes in our Consolidated
F-41
Table of Contents
Financial Statements. No such provision was recorded as of December 31, 2008. We are also subject to state and local taxes and recorded $1.0 million, $0.6 million and $1.5 million of such taxes during the years ended December 31, 2009, 2008 and 2007, respectively.
In 2007, we started operations in Mexico. Foreign income taxes are accrued for foreign countries in which DCT operates in accordance with the applicable local laws and regulations, taking into account provisions of applicable double tax treaties. During the years ended December 31, 2009 and 2008, we incurred $0.1 million and $0.2 million of foreign income taxes, respectively. No foreign income taxes were incurred in 2007.
Note 15. Segment Information
We consider each operating property to be an individual operating segment that has similar economic characteristics to all our other operating properties, which excludes the results from discontinued operations and includes results from properties held for contribution. Our management considers rental revenues and property net operating income aggregated by property type to be the appropriate way to analyze performance. Certain reclassifications have been made to prior year results to conform to the current presentation, primarily related to discontinued operations (see Note 16—Discontinued Operations and Assets Held for Sale for additional information).
The following table sets forth the rental revenues and property net operating income of our property segments in continuing operations for the years ended December 31, 2009, 2008 and 2007 (in thousands).
| Rental Revenues | Property NOI (1) | |||||||||||||||||
| 2009 | 2008 | 2007 | 2009 | 2008 | 2007 | |||||||||||||
| Operating properties in continuing operations: |
||||||||||||||||||
| Bulk distribution |
$ | 183,525 | $ | 187,708 | $ | 190,000 | $ | 133,966 | $ | 141,967 | $ | 146,003 | ||||||
| Light industrial and other |
54,075 | 54,177 | 51,145 | 37,990 | 38,099 | 35,930 | ||||||||||||
| Total |
$ | 237,600 | $ | 241,885 | $ | 241,145 | $ | 171,956 | $ | 180,066 | $ | 181,933 | ||||||
| (1) | Property net operating income, or property NOI, is defined as rental revenues, including reimbursements, less rental expenses and real estate taxes, which excludes depreciation, amortization, impairment, general and administrative expenses and interest expense. We consider property NOI to be an appropriate supplemental performance measure because property NOI reflects the operating performance of our properties and excludes certain items that are not considered to be controllable in connection with the management of the property such as depreciation, amortization, general and administrative expenses and interest expense. However, property NOI should not be viewed as an alternative measure of our financial performance since it excludes expenses which could materially impact our results of operations. Further, our property NOI may not be comparable to that of other real estate companies, as they may use different methodologies for calculating property NOI. Therefore, we believe net income, as defined by GAAP, to be the most appropriate measure to evaluate our overall financial performance. |
F-42
Table of Contents
The following table is a reconciliation of our property NOI to our reported Income (Loss) From Continuing Operations for the years ended December 31, 2009, 2008 and 2007 (in thousands).
| 2009 | 2008 | 2007 | ||||||||||
| Property NOI |
$ | 171,956 | $ | 180,066 | $ | 181,933 | ||||||
| NOI from development and redevelopment properties |
1,724 | 1,328 | 1,042 | |||||||||
| Institutional capital management and other fees |
2,701 | 2,924 | 2,871 | |||||||||
| Real estate related depreciation and amortization |
(110,441 | ) | (115,739 | ) | (109,144 | ) | ||||||
| Impairment losses |
— | (4,314 | ) | — | ||||||||
| General and administrative expense |
(29,224 | ) | (21,799 | ) | (19,547 | ) | ||||||
| Equity in income of unconsolidated joint ventures, net |
2,698 | 2,267 | 433 | |||||||||
| Impairment losses investments in unconsolidated joint ventures |
(300 | ) | (4,733 | ) | — | |||||||
| Loss on business combinations |
(10,325 | ) | — | — | ||||||||
| Interest expense |
(52,792 | ) | (52,997 | ) | (60,341 | ) | ||||||
| Interest income and other |
1,918 | 1,257 | 4,666 | |||||||||
| Income and other taxes |
(1,846 | ) | (824 | ) | (1,459 | ) | ||||||
| Income (Loss) from Continuing Operations |
$ | (23,931 | ) | $ | (12,564 | ) | $ | 454 | ||||
The following table is a reconciliation of our segment rental revenues to our reported consolidated total revenue for the years ended December 31, 2009, 2008 and 2007 (in thousands).
| 2009 | 2008 | 2007 | |||||||
| Total revenue from Operating properties in continuing operations |
$ | 237,600 | $ | 241,885 | $ | 241,145 | |||
| Revenues from development and redevelopment properties |
3,705 | 3,733 | 1,800 | ||||||
| Rental revenues |
241,305 | 245,618 | 242,945 | ||||||
| Institutional capital management and other fees |
2,701 | 2,924 | 2,871 | ||||||
| Total Revenues |
$ | 244,006 | $ | 248,542 | $ | 245,816 | |||
The following table reflects our total assets, net of accumulated depreciation and amortization, by property segment (in thousands).
| December 31, 2009 |
December 31, 2008 | |||||
| Property segments: |
||||||
| Bulk distribution |
$ | 1,769,118 | $ | 1,819,504 | ||
| Light industrial and other |
536,888 | 518,347 | ||||
| Total segment net assets |
2,306,006 | 2,337,851 | ||||
| Development and redevelopment assets |
178,462 | 174,082 | ||||
| Non-segment assets: |
||||||
| Properties in pre-development including land held |
23,377 | 21,074 | ||||
| Non-segment cash and cash equivalents |
22,941 | 13,967 | ||||
| Other non-segment assets (1) |
133,506 | 156,869 | ||||
| Total Assets |
$ | 2,664,292 | $ | 2,703,843 | ||
| (1) | Other non-segment assets primarily consists of corporate assets including investments in unconsolidated joint ventures, notes receivable, certain loan costs and deferred acquisition costs. |
Our operations in Mexico commenced in 2007. Included in rental revenues for the years ended December 31, 2009 and 2008 was approximately $4.8 million and $4.0 million, respectively, attributable to these operations.
F-43
Table of Contents
Included in bulk segment net assets as of December 31, 2009 and 2008 was approximately $35.6 million and $38.2 million, respectively, and included in light industrial and other segment net assets as of December 31, 2009 and 2008 was approximately $21.9 million and $22.0 million, respectively, attributable to these operations.
Note 16. Discontinued Operations and Assets Held for Sale
We report results of operations from real estate assets that meet the definition of a component of an entity and have been sold, or meet the criteria to be classified as held for sale, as discontinued operations. During the year ended December 31, 2009, we sold three operating properties, one in our bulk distribution segment comprised of 0.8 million square feet and two in our light industrial and other segment comprised of approximately 0.1 million square feet. During the year ended December 31, 2008, we sold one development property in our bulk distribution segment comprised of approximately 0.3 million square feet and 15 operating properties, 11 in our bulk distribution segment and four in our light industrial segment, comprised of approximately 2.3 million square feet to third parties. For the years ended December 31, 2009, 2008 and 2007 income from discontinued operations includes the results of operations of these properties prior to the date of sale. We included all results of these discontinued operations in a separate component of income in our Consolidated Statements of Operations under the heading “Income from discontinued operations.” This treatment resulted in certain reclassifications of financial statement amounts for the years ended December 31, 2009, 2008 and 2007.
The following is a summary of the components of income from discontinued operations for the years ended December 31, 2009, 2008 and 2007 (in thousands).
| 2009 | 2008 | 2007 | ||||||||||
| Rental revenues |
$ | 2,118 | $ | 9,846 | $ | 14,662 | ||||||
| Rental expenses and real estate taxes |
(193 | ) | (1,827 | ) | (3,400 | ) | ||||||
| Real estate related depreciation and amortization |
(809 | ) | (3,865 | ) | (6,321 | ) | ||||||
| General and administrative |
(220 | ) | — | — | ||||||||
| Operating income |
896 | 4,154 | 4,941 | |||||||||
| Interest expense, net |
(59 | ) | (222 | ) | (868 | ) | ||||||
| Other income (expense) |
721 | (193 | ) | — | ||||||||
| Income and other taxes |
(9 | ) | (26 | ) | (72 | ) | ||||||
| Income before gain on dispositions of real estate |
1,549 | 3,713 | 4,001 | |||||||||
| Gain on dispositions of real estate interests |
1,349 | 21,487 | 12,125 | |||||||||
| Impairment losses on real estate assets held for sale |
(681 | ) | (1,699 | ) | — | |||||||
| Income from discontinued operations |
$ | 2,217 | $ | 23,501 | $ | 16,126 | ||||||
F-44
Table of Contents
Note 17. Quarterly Results (Unaudited)
The following table presents selected unaudited quarterly financial data for each quarter during the year ended December 31, 2009 (in thousands except per share information).
| For the Quarter Ended | For the Year Ended December 31, 2009 |
||||||||||||||||||
| March 31, 2009 |
June 30, 2009 |
September 30, 2009 |
December 31, 2009 |
||||||||||||||||
| Total revenues |
$ | 62,900 | $ | 59,311 | $ | 61,339 | $ | 60,456 | $ | 244,006 | |||||||||
| Total operating expenses |
$ | 48,965 | $ | 50,132 | $ | 55,426 | $ | 52,767 | $ | 207,290 | |||||||||
| Operating income |
$ | 13,935 | $ | 9,179 | $ | 5,913 | $ | 7,689 | $ | 36,716 | |||||||||
| Income (loss) from continuing operations |
$ | 4,017 | $ | (5,657 | ) | $ | (18,279 | ) | $ | (4,012 | ) | $ | (23,931 | ) | |||||
| Income (loss) from discontinued operations |
$ | 432 | $ | 903 | $ | 1,199 | $ | (317 | ) | $ | 2,217 | ||||||||
| Gain (loss) on dispositions of real estate interests |
$ | 37 | $ | — | $ | 24 | $ | (56 | ) | $ | 5 | ||||||||
| Net income (loss) attributable to DCT Common Stockholders |
$ | 3,827 | $ | (3,994 | ) | $ | (14,583 | ) | $ | (3,835 | ) | $ | (18,585 | ) | |||||
| Earnings per common share, basic and diluted |
|||||||||||||||||||
| Income (loss) from continuing operations |
$ | 0.02 | $ | (0.03 | ) | $ | (0.08 | ) | $ | (0.02 | ) | $ | (0.11 | ) | |||||
| Income (loss) from discontinued operations |
0.00 | 0.00 | 0.01 | 0.00 | 0.01 | ||||||||||||||
| Gain (loss) on dispositions of real estate interests |
0.00 | 0.00 | 0.00 | 0.00 | 0.00 | ||||||||||||||
| Net income (loss) attributable to DCT Common Stockholders |
$ | 0.02 | $ | (0.03 | ) | $ | (0.07 | ) | $ | (0.02 | ) | $ | (0.10 | ) | |||||
| Basic and diluted common shares outstanding |
175,661 | 183,783 | 204,433 | 207,291 | 192,900 | ||||||||||||||
F-45
Table of Contents
The following table presents selected unaudited quarterly financial data for each quarter during the year ended December 31, 2008 (in thousands except per share information).
| For the Quarter Ended | For the Year Ended December 31, 2008 |
||||||||||||||||||
| March 31, 2008 |
June 30, 2008 |
September 30, 2008 |
December 31, 2008 |
||||||||||||||||
| Total revenues |
$ | 62,532 | $ | 61,155 | $ | 61,437 | $ | 63,418 | $ | 248,542 | |||||||||
| Total operating expenses |
$ | 50,004 | $ | 48,752 | $ | 46,719 | $ | 60,601 | $ | 206,076 | |||||||||
| Operating income |
$ | 12,528 | $ | 12,403 | $ | 14,718 | $ | 2,817 | $ | 42,466 | |||||||||
| Income (loss) from continuing operations |
$ | (1,685 | ) | $ | 1,949 | $ | 1,971 | $ | (14,799 | ) | $ | (12,564 | ) | ||||||
| Income (loss) from discontinued operations |
$ | 1,665 | $ | 16,813 | $ | 5,389 | $ | (366 | ) | $ | 23,501 | ||||||||
| Gain (loss) on dispositions of real estate interests |
$ | 446 | $ | (39 | ) | $ | 118 | $ | (21 | ) | $ | 504 | |||||||
| Net income (loss) attributable to DCT Common Stockholders |
$ | 384 | $ | 15,496 | $ | 6,240 | $ | (12,634 | ) | $ | 9,486 | ||||||||
| Earnings per common share, basic and diluted |
|||||||||||||||||||
| Income (loss) from continuing operations |
$ | (0.01 | ) | $ | 0.01 | $ | 0.01 | $ | (0.07 | ) | $ | (0.06 | ) | ||||||
| Income (loss) from discontinued operations |
0.01 | 0.08 | 0.03 | 0.00 | 0.11 | ||||||||||||||
| Gain (loss) on dispositions of real estate interests |
0.00 | 0.00 | 0.00 | 0.00 | 0.00 | ||||||||||||||
| Net income (loss) attributable to DCT Common Stockholders |
$ | 0.00 | $ | 0.09 | $ | 0.04 | $ | (0.07 | ) | $ | 0.05 | ||||||||
| Basic common shares outstanding |
168,386 | 171,429 | 172,685 | 174,241 | 171,695 | ||||||||||||||
| Diluted common shares outstanding |
168,386 | 171,481 | 172,696 | 174,241 | 171,695 | ||||||||||||||
Note 18—Subsequent Events
Beginning in the second quarter 2009, GAAP requires an entity to disclose events that occur after the balance sheet date but before financial statements are issued or are available to be issued (“subsequent events”) as well as the date through which an entity has evaluated subsequent events. There are two types of subsequent events. The first type consists of events or transactions that provide additional evidence about conditions that existed at the date of the balance sheet, including the estimates inherent in the process of preparing financial statements, (“recognized subsequent events”). The second type consists of events that provide evidence about conditions that did not exist at the date of the balance sheet but arose subsequent to that date (“nonrecognized subsequent events”).
We have evaluated subsequent events for the period from December 31, 2009, the date of these financial statements, through February 26, 2010, which represents the date these financial statements are being filed with the SEC. No significant recognized or non-recognized subsequent events were noted.
F-46
Table of Contents
SCHEDULE III—REAL ESTATE AND ACCUMULATED DEPRECIATION
December 31, 2009
| Number of Buildings |
Encum- brances (4) |
Initial Cost to Company | Costs Capitalized Subsequent to Acquisition |
Gross Amount Carried at 12/31/2009 |
Accumulated Depreciation (5) |
Acquisition Date |
Year Built | |||||||||||||||||||||||||||
| Property |
Land | Building & Improvements (1) |
Total Costs | Land | Building & Improvements (1) |
Total Costs (3)(5) |
||||||||||||||||||||||||||||
| Newpoint I |
1 | — | $ | 2,143 | $ | 12,908 | $ | 15,051 | $ | (1,038 | )(2) | $ | 2,088 | $ | 11,925 | $ | 14,013 | $ | (2,278 | ) | 03/31/04 | 1997 | ||||||||||||
| Southcreek |
4 | — | 7,843 | 45,385 | 53,228 | 7,218 | 8,324 | 52,122 | 60,446 | (9,317 | ) | 06/08/04/ 09/21/04 |
1999-2004 | |||||||||||||||||||||
| Eagles Landing |
1 | — | 2,595 | 13,475 | 16,070 | 1,275 | 2,595 | 14,750 | 17,345 | (4,598 | ) | 06/08/04 | 2003 | |||||||||||||||||||||
| Greenwood Parkway |
1 | — | 1,326 | 3,977 | 5,303 | 580 | 1,461 | 4,422 | 5,883 | (420 | ) | 01/00/00 | 1995 | |||||||||||||||||||||
| Breckinridge Industrial |
2 | — | 1,950 | 10,159 | 12,109 | (187 | )(2) | 1,950 | 9,972 | 11,922 | (3,094 | ) | 10/01/04 | 2000 | ||||||||||||||||||||
| Westgate Industrial |
1 | — | 2,140 | 4,801 | 6,941 | 296 | 2,140 | 5,097 | 7,237 | (1,111 | ) | 10/01/04 | 1988 | |||||||||||||||||||||
| Westpark Industrial |
2 | — | 2,176 | 6,719 | 8,895 | 1,113 | 2,176 | 7,832 | 10,008 | (2,069 | ) | 10/01/04 | 1981 | |||||||||||||||||||||
| Cobb Industrial |
2 | — | 1,120 | 5,249 | 6,369 | 154 | 1,120 | 5,403 | 6,523 | (1,517 | ) | 10/01/04 | 1996 | |||||||||||||||||||||
| Cabot Parkway Industrial |
1 | — | 1,102 | 6,617 | 7,719 | 5 | 1,103 | 6,621 | 7,724 | (2,092 | ) | 10/01/04 | 2000 | |||||||||||||||||||||
| Atlanta NE Portolio |
2 | — | 2,817 | 14,892 | 17,709 | 17 | 2,817 | 14,909 | 17,726 | (3,795 | ) | 11/05/04 | 1978/1987 | |||||||||||||||||||||
| Lotus Cars USA |
1 | — | 1,029 | 2,103 | 3,132 | 25 | 1,029 | 2,128 | 3,157 | (754 | ) | 12/03/04 | 2003 | |||||||||||||||||||||
| Fulton Industrial Boulevard |
3 | 7,451 | 1,850 | 13,480 | 15,330 | 680 | 1,850 | 14,160 | 16,010 | (3,199 | ) | 07/21/05 | 1973-1996 | |||||||||||||||||||||
| Penney Road |
1 | 2,018 | 401 | 4,145 | 4,546 | 57 | 401 | 4,202 | 4,603 | (619 | ) | 07/21/05 | 2001 | |||||||||||||||||||||
| Southfield Parkway |
1 | 2,561 | 523 | 3,808 | 4,331 | (126 | )(2) | 523 | 3,682 | 4,205 | (542 | ) | 07/21/05 | 1994 | ||||||||||||||||||||
| Livingston Court |
2 | 4,240 | 919 | 6,878 | 7,797 | 339 | 919 | 7,217 | 8,136 | (2,138 | ) | 07/21/05 | 1985 | |||||||||||||||||||||
| Peterson Place |
4 | 3,387 | 596 | 6,900 | 7,496 | 304 | 596 | 7,204 | 7,800 | (1,675 | ) | 07/21/05 | 1984 | |||||||||||||||||||||
| Oakbrook Parkway |
5 | 9,607 | 1,823 | 17,185 | 19,008 | 1,416 | 1,823 | 18,601 | 20,424 | (3,705 | ) | 07/21/05 | 1982 | |||||||||||||||||||||
| Regency Parkway |
7 | 9,339 | 1,521 | 16,084 | 17,605 | 953 | 1,521 | 17,037 | 18,558 | (3,470 | ) | 07/21/05 | 1984/1989 | |||||||||||||||||||||
| Jimmy Carter Boulevard |
2 | 3,151 | 488 | 5,159 | 5,647 | 863 | 488 | 6,022 | 6,510 | (1,270 | ) | 07/21/05 | 1984 | |||||||||||||||||||||
| McGinnis Ferry |
1 | 4,165 | 700 | 6,855 | 7,555 | 1,563 | 691 | 8,427 | 9,118 | (729 | ) | 07/21/05 | 1993 | |||||||||||||||||||||
| Northmont Parkway |
4 | — | 3,528 | 20,622 | 24,150 | 1,148 | 3,528 | 21,770 | 25,298 | (2,852 | ) | 06/09/06 | 1998-2000 | |||||||||||||||||||||
| South Royal Atlanta Drive |
1 | 992 | 174 | 1,896 | 2,070 | 80 | 174 | 1,976 | 2,150 | (284 | ) | 07/21/05 | 1986 | |||||||||||||||||||||
| Evergreen Boulevard |
2 | — | 3,123 | 14,265 | 17,388 | 283 | 3,123 | 14,548 | 17,671 | (2,792 | ) | 06/09/06 | 1999 | |||||||||||||||||||||
| Buford Development |
1 | — | 1,370 | 7,151 | 8,521 | 1,232 | 1,370 | 8,383 | 9,753 | (638 | ) | 03/31/06 | 2006 | |||||||||||||||||||||
| TOTAL ATLANTA |
52 | 46,911 | 43,257 | 250,713 | 293,970 | 18,250 | 43,810 | 268,410 | 312,220 | (54,958 | ) | |||||||||||||||||||||||
| Delta Portfolio |
7 | 25,485 | 8,762 | 36,806 | 45,568 | 2,307 | 8,699 | 39,176 | 47,875 | (7,329 | ) | 04/12/05 | 1986-1993 | |||||||||||||||||||||
| Charwood Road |
1 | 5,296 | 1,960 | 10,261 | 12,221 | 356 | 1,960 | 10,617 | 12,577 | (1,688 | ) | 07/21/05 | 1986 | |||||||||||||||||||||
| Greenwood Place |
2 | 5,260 | 2,566 | 12,918 | 15,484 | 545 | 2,566 | 13,463 | 16,029 | (2,062 | ) | 07/21/05/ 06/09/06 |
1978/1984 | |||||||||||||||||||||
| Guilford Road |
1 | — | 1,879 | 6,650 | 8,529 | 1,085 | 1,879 | 7,735 | 9,614 | (1,097 | ) | 06/09/06 | 1989 | |||||||||||||||||||||
| Bollman Place |
1 | — | 1,654 | 6,202 | 7,856 | 146 | 1,654 | 6,348 | 8,002 | (832 | ) | 06/09/06 | 1986 | |||||||||||||||||||||
| TOTAL BALTIMORE |
12 | 36,041 | 16,821 | 72,837 | 89,658 | 4,439 | 16,758 | 77,339 | 94,097 | (13,008 | ) | |||||||||||||||||||||||
F-47
Table of Contents
SCHEDULE III—REAL ESTATE AND ACCUMULATED DEPRECIATION—(Continued)
December 31, 2009
| Number of Buildings |
Encum- brances (4) |
Initial Cost to Company | Costs Capitalized Subsequent to Acquisition |
Gross Amount Carried at 12/31/2009 |
Accumulated Depreciation (5) |
Acquisition Date |
Year Built | |||||||||||||||||||
| Property |
Land | Building & Improvements (1) |
Total Costs | Land | Building & Improvements (1) |
Total Costs (3)(5) |
||||||||||||||||||||
| Binney & Smith |
1 | 8,750 | 5,183 | 20,100 | 25,283 | (117 | )(2) | 5,183 | 19,983 | 25,166 | (4,703 | ) | 07/20/05 | 2003 | ||||||||||||
| High Street Portfolio |
3 | — | 4,853 | 10,334 | 15,187 | 1,026 | 4,853 | 11,360 | 16,213 | (2,507 | ) | 10/26/05 | 1975/1988 | |||||||||||||
| Independence Avenue |
1 | — | 3,133 | 17,542 | 20,675 | (209 | )(2) | 3,133 | 17,333 | 20,466 | (1,741 | ) | 12/26/06 | 1999 | ||||||||||||
| Bobali Drive (6) |
3 | — | 4,107 | 9,288 | 13,395 | 226 | 4,107 | 9,514 | 13,621 | (1,471 | ) | 02/09/07 | 1998/1999 | |||||||||||||
| TOTAL CENTRAL |
8 | 8,750 | 17,276 | 57,264 | 74,540 | 926 | 17,276 | 58,190 | 75,466 | (10,422 | ) | |||||||||||||||
| Nevada Boulevard |
1 | 3,023 | 1,360 | 4,840 | 6,200 | 110 | 1,360 | 4,950 | 6,310 | (722 | ) | 07/21/05 | 1990 | |||||||||||||
| Barringer Drive |
1 | 1,760 | 507 | 4,549 | 5,056 | 162 | 507 | 4,711 | 5,218 | (937 | ) | 07/21/05 | 1974 | |||||||||||||
| Nations Ford Road |
2 | 2,840 | 3,129 | 14,638 | 17,767 | 1,534 | 3,258 | 16,043 | 19,301 | (2,260 | ) | 07/21/05 | 2001 | |||||||||||||
| Empire Distribution Center |
1 | — | 622 | 3,655 | 4,277 | (32 | )(2) | 622 | 3,623 | 4,245 | (926 | ) | 11/02/05 | 1997 | ||||||||||||
| Reames Road |
1 | — | 611 | 4,026 | 4,637 | 98 | 611 | 4,124 | 4,735 | (510 | ) | 06/09/06 | 1994 | |||||||||||||
| Carrier Drive |
1 | — | 319 | 1,475 | 1,794 | 446 | 319 | 1,921 | 2,240 | (323 | ) | 06/09/06 | 1988 | |||||||||||||
| Woodpark Drive |
3 | — | 1,010 | 6,757 | 7,767 | 82 | 1,010 | 6,839 | 7,849 | (872 | ) | 06/09/06 | 1985-1987 | |||||||||||||
| TOTAL CHARLOTTE |
10 | 7,623 | 7,558 | 39,940 | 47,498 | 2,400 | 7,687 | 42,211 | 49,898 | (6,550 | ) | |||||||||||||||
| Mallard Lake (6) |
1 | — | 2,561 | 8,809 | 11,370 | 14 | 2,561 | 8,823 | 11,384 | (2,231 | ) | 10/29/03 | 2000 | |||||||||||||
| Mission Street |
1 | — | 1,765 | 2,377 | 4,142 | 214 | 1,765 | 2,591 | 4,356 | (386 | ) | 01/00/00 | 1991 | |||||||||||||
| Veterans Parkway |
1 | — | 2,108 | — | 2,108 | 7,697 | 2,108 | 7,697 | 9,805 | (1,221 | ) | 01/00/00 | 2005 | |||||||||||||
| Blackhawk Portfolio |
5 | — | 6,671 | 40,877 | 47,548 | 1,261 | 6,667 | 42,142 | 48,809 | (9,918 | ) | 06/13/05 | 1974/1987 | |||||||||||||
| East Fabyan Parkway |
1 | 5,230 | 1,790 | 10,929 | 12,719 | 742 | 1,790 | 11,671 | 13,461 | (2,112 | ) | 07/21/05 | 1975 | |||||||||||||
| Frontenac Road |
1 | 3,920 | 1,647 | 5,849 | 7,496 | (1,093 | )(2) | 1,647 | 4,756 | 6,403 | (1,049 | ) | 07/21/05 | 1995 | ||||||||||||
| South Wolf Road |
1 | 9,084 | 4,836 | 18,794 | 23,630 | 422 | 4,836 | 19,216 | 24,052 | (4,815 | ) | 07/21/05 | 1982 | |||||||||||||
| Laramie Avenue (6) |
1 | 4,870 | 1,442 | 7,985 | 9,427 | 555 | 1,412 | 8,570 | 9,982 | (1,597 | ) | 07/21/05 | 1972 | |||||||||||||
| West 123rd Place |
1 | 2,847 | 644 | 5,935 | 6,579 | 5 | 644 | 5,940 | 6,584 | (1,176 | ) | 07/21/05 | 1975 | |||||||||||||
| Lunt Avenue |
1 | — | 1,620 | 1,988 | 3,608 | 250 | 1,620 | 2,238 | 3,858 | (413 | ) | 03/17/06 | 2005 | |||||||||||||
| Mitchell Court |
1 | 5,240 | 5,036 | 8,578 | 13,614 | 525 | 5,036 | 9,103 | 14,139 | (1,289 | ) | 05/01/07 | 1985 | |||||||||||||
| TOTAL CHICAGO |
15 | 31,191 | 30,120 | 112,121 | 142,241 | 10,592 | 30,086 | 122,747 | 152,833 | (26,207 | ) | |||||||||||||||
F-48
Table of Contents
SCHEDULE III—REAL ESTATE AND ACCUMULATED DEPRECIATION—(Continued)
December 31, 2009
| Number of Buildings |
Encum- brances (4) |
Initial Cost to Company | Costs Capitalized Subsequent to Acquisition |
Gross Amount Carried at 12/31/2009 |
Accumulated Depreciation (5) |
Acquisition Date |
Year Built | |||||||||||||||||||
| Property |
Land | Building & Improvements (1) |
Total Costs | Land | Building & Improvements (1) |
Total Costs (3)(5) |
||||||||||||||||||||
| Park West |
6 | 14,262 | 10,441 | 63,682 | 74,123 | (3,158 | )(2) | 10,319 | 60,646 | 70,965 | (14,015 | ) | 12/15/03/ 06/08/04 |
1997-2003 | ||||||||||||
| Northwest Business Center |
1 | — | 299 | 4,486 | 4,785 | 394 | 299 | 4,880 | 5,179 | (2,965 | ) | 05/03/04 | 1995 | |||||||||||||
| New Buffington Road |
2 | 4,059 | 1,618 | 8,500 | 10,118 | 3,697 | 1,618 | 12,197 | 13,815 | (2,041 | ) | 07/21/05 | 1981 | |||||||||||||
| Olympic Boulevard |
3 | 7,350 | 2,096 | 11,788 | 13,884 | 1,575 | 2,096 | 13,363 | 15,459 | (2,866 | ) | 07/21/05 | 1989 | |||||||||||||
| Mineola Pike |
1 | 2,653 | 625 | 4,642 | 5,267 | 115 | 625 | 4,757 | 5,382 | (863 | ) | 07/21/05 | 1983 | |||||||||||||
| Industrial Road |
2 | 2,740 | 629 | 3,344 | 3,973 | 834 | 628 | 4,179 | 4,807 | (842 | ) | 07/21/05 | 1987 | |||||||||||||
| Dolwick Drive |
1 | 2,857 | 579 | 4,670 | 5,249 | 267 | 579 | 4,937 | 5,516 | (1,080 | ) | 07/21/05 | 1979 | |||||||||||||
| Best Place |
1 | 3,540 | 1,131 | 5,516 | 6,647 | 1,906 | 1,131 | 7,422 | 8,553 | (1,256 | ) | 07/21/05 | 1996 | |||||||||||||
| Distribution Circle |
1 | 3,200 | 688 | 6,838 | 7,526 | 915 | 688 | 7,753 | 8,441 | (1,199 | ) | 07/21/05 | 1981 | |||||||||||||
| Creek Road |
1 | — | 377 | 4,925 | 5,302 | (119 | )(2) | 377 | 4,806 | 5,183 | (931 | ) | 06/09/06 | 1983 | ||||||||||||
| Power Line Drive |
1 | — | 70 | 261 | 331 | (9 | )(2) | 70 | 252 | 322 | (28 | ) | 06/09/06 | 1984 | ||||||||||||
| Foundation Drive |
7 | — | 1,087 | 5,435 | 6,522 | 22 | 1,087 | 5,457 | 6,544 | (866 | ) | 06/09/06 | 1984-1987 | |||||||||||||
| Jamilke Drive |
7 | — | 1,417 | 9,524 | 10,941 | 301 | 1,417 | 9,825 | 11,242 | (1,506 | ) | 06/09/06 | 1984-1987 | |||||||||||||
| TOTAL CINCINNATI |
34 | 40,661 | 21,057 | 133,611 | 154,668 | 6,740 | 20,934 | 140,474 | 161,408 | (30,458 | ) | |||||||||||||||
| Commodity Boulevard |
2 | 20,849 | 3,891 | 36,799 | 40,690 | 857 | 3,891 | 37,656 | 41,547 | (7,882 | ) | 07/21/05 | 2000/2005 | |||||||||||||
| Industrial Drive |
1 | 4,350 | 683 | 7,136 | 7,819 | (480 | )(2) | 683 | 6,656 | 7,339 | (974 | ) | 07/21/05 | 1995 | ||||||||||||
| Zane Trace Drive |
1 | — | 288 | 3,091 | 3,379 | 136 | 288 | 3,227 | 3,515 | (659 | ) | 03/14/06 | 1980 | |||||||||||||
| Rickenbacker |
2 | 10,131 | 3,532 | 34,172 | 37,704 | (198 | )(2) | 3,532 | 33,974 | 37,506 | (5,121 | ) | 04/13/06 | 1998/2000 | ||||||||||||
| Creekside |
4 | — | 5,210 | 52,437 | 57,647 | 1,245 | 5,210 | 53,682 | 58,892 | (9,077 | ) | 05/19/06 | 1999-2002 | |||||||||||||
| SouthPark |
3 | — | 1,628 | 13,504 | 15,132 | (22 | )(2) | 1,628 | 13,482 | 15,110 | (1,936 | ) | 05/19/06 | 1990-1999 | ||||||||||||
| Mohawk |
1 | 8,096 | 1,839 | 12,391 | 14,230 | 534 | 2,304 | 12,460 | 14,764 | (1,484 | ) | 08/08/07 | 2004 | |||||||||||||
| TOTAL COLUMBUS |
14 | 43,426 | 17,071 | 159,530 | 176,601 | 2,072 | 17,536 | 161,137 | 178,673 | (27,133 | ) | |||||||||||||||
| DFW H |
1 | 6,190 | 981 | 10,392 | 11,373 | (348 | )(2) | 981 | 10,044 | 11,025 | (3,053 | ) | 12/15/03 | 1999 | ||||||||||||
| Pinnacle (6) |
1 | 5,555 | 521 | 9,683 | 10,204 | 332 | 521 | 10,015 | 10,536 | (2,227 | ) | 12/15/03 | 2001 | |||||||||||||
| Market Industrial |
5 | — | 1,481 | 15,507 | 16,988 | 41 | 1,481 | 15,548 | 17,029 | (3,501 | ) | 10/01/04 | 1981/1985 | |||||||||||||
| Shiloh Industrial |
1 | — | 459 | 4,173 | 4,632 | 368 | 459 | 4,541 | 5,000 | (1,441 | ) | 10/01/04 | 1973/1984 | |||||||||||||
| Perimeter Industrial |
2 | — | 261 | 2,901 | 3,162 | (88 | )(2) | 261 | 2,813 | 3,074 | (742 | ) | 10/01/04 | 1979 | ||||||||||||
| Avenue R Industrial I |
1 | — | 189 | 2,231 | 2,420 | 15 | 189 | 2,246 | 2,435 | (568 | ) | 10/01/04 | 1980 | |||||||||||||
| Avenue R Industrial II |
1 | — | 271 | 1,139 | 1,410 | 284 | 271 | 1,423 | 1,694 | (361 | ) | 10/01/04 | 1980 | |||||||||||||
| Westfork Center Industrial |
3 | — | 503 | 5,977 | 6,480 | 628 | 503 | 6,605 | 7,108 | (1,676 | ) | 10/01/04 | 1980 | |||||||||||||
| Coasters Distribution Center |
1 | — | 1,380 | 14,504 | 15,884 | 962 | 1,380 | 15,466 | 16,846 | (5,499 | ) | 12/03/04 | 2004 | |||||||||||||
| Diplomat Drive |
1 | — | 532 | 3,136 | 3,668 | 2,130 | 532 | 5,266 | 5,798 | (1,084 | ) | 05/26/05 | 1986 | |||||||||||||
| North 28th Street |
1 | 3,254 | — | 6,145 | 6,145 | (83 | )(2) | — | 6,062 | 6,062 | (1,714 | ) | 07/21/05 | 2000 | ||||||||||||
| Esters Boulevard |
5 | 27,393 | 2,428 | 50,618 | 53,046 | 1,562 | 2,870 | 51,738 | 54,608 | (12,327 | ) | 07/21/05 | 1984-1999 | |||||||||||||
| Royal Lane |
1 | 1,918 | — | 3,200 | 3,200 | 2 | — | 3,202 | 3,202 | (632 | ) | 07/21/05 | 1986 | |||||||||||||
| West Story Drive |
1 | 2,700 | 777 | 4,646 | 5,423 | 354 | 777 | 5,000 | 5,777 | (1,116 | ) | 07/21/05 | 1997 | |||||||||||||
| Meridian Drive |
1 | 2,535 | 410 | 4,135 | 4,545 | 1,238 | 410 | 5,373 | 5,783 | (1,439 | ) | 07/21/05 | 1975 | |||||||||||||
F-49
Table of Contents
SCHEDULE III—REAL ESTATE AND ACCUMULATED DEPRECIATION—(Continued)
December 31, 2009
| Number of Buildings |
Encum- brances (4) |
Initial Cost to Company | Costs Capitalized Subsequent to Acquisition |
Gross Amount Carried at 12/31/2009 |
Accumulated Depreciation (5) |
Acquisition Date |
Year Built | |||||||||||||||||||
| Property |
Land | Building & Improvements (1) |
Total Costs | Land | Building & Improvements (1) |
Total Costs (3)(5) |
||||||||||||||||||||
| Gateway Drive |
1 | 1,472 | 463 | 2,152 | 2,615 | 481 | 463 | 2,633 | 3,096 | (386 | ) | 07/21/05 | 1988 | |||||||||||||
| Valwood Parkway |
3 | 8,875 | 2,271 | 15,351 | 17,622 | 782 | 2,271 | 16,133 | 18,404 | (3,755 | ) | 07/21/05 | 1984/1996 | |||||||||||||
| 108th Street |
1 | 460 | 83 | 899 | 982 | (54 | )(2) | 83 | 845 | 928 | (179 | ) | 07/21/05 | 1972 | ||||||||||||
| Sanden Drive |
1 | 1,138 | 207 | 2,258 | 2,465 | 10 | 207 | 2,268 | 2,475 | (583 | ) | 07/21/05 | 1994 | |||||||||||||
| North Great Southwest Parkway |
2 | 2,896 | 1,384 | 3,727 | 5,111 | 1,664 | 1,904 | 4,871 | 6,775 | (1,141 | ) | 07/21/05 | 1963/1964 | |||||||||||||
| Webb Chapel Road |
1 | 514 | 110 | 732 | 842 | (569 | )(2) | 110 | 163 | 273 | (59 | ) | 07/21/05 | 1978 | ||||||||||||
| Belt Line Road |
6 | 4,766 | 1,167 | 7,811 | 8,978 | 899 | 1,167 | 8,710 | 9,877 | (2,107 | ) | 07/21/05 | 1978 | |||||||||||||
| Springlake Road |
2 | 2,720 | 534 | 4,457 | 4,991 | 215 | 534 | 4,672 | 5,206 | (1,287 | ) | 07/21/05 | 1984 | |||||||||||||
| Hurd Drive (6) |
1 | 1,760 | 420 | 2,332 | 2,752 | 20 | 420 | 2,352 | 2,772 | (337 | ) | 07/21/05 | 1982 | |||||||||||||
| Champion Drive |
1 | 1,660 | 672 | 2,598 | 3,270 | 331 | 672 | 2,929 | 3,601 | (448 | ) | 07/21/05 | 1984 | |||||||||||||
| GSW Gateway Three |
1 | 5,240 | 1,669 | 11,622 | 13,291 | 1 | 1,669 | 11,623 | 13,292 | (2,345 | ) | 01/13/06 | 2001 | |||||||||||||
| TOTAL DALLAS |
46 | 81,046 | 19,173 | 192,326 | 211,499 | 11,177 | 20,135 | 202,541 | 222,676 | (50,007 | ) | |||||||||||||||
| Interpark 70 |
1 | 4,901 | 1,383 | 7,566 | 8,949 | 165 | 1,383 | 7,731 | 9,114 | (2,434 | ) | 09/30/04 | 1998 | |||||||||||||
| TOTAL DENVER |
1 | 4,901 | 1,383 | 7,566 | 8,949 | 165 | 1,383 | 7,731 | 9,114 | (2,434 | ) | |||||||||||||||
| Sanmina Building |
1 | — | 2,246 | 3,172 | 5,418 | 131 | 2,246 | 3,303 | 5,549 | (261 | ) | 09/28/07 | 2006 | |||||||||||||
| BDT Building |
1 | — | 1,111 | 1,983 | 3,094 | 72 | 1,189 | 1,977 | 3,166 | (174 | ) | 10/18/07 | 1999 | |||||||||||||
| Ryder Building |
1 | — | 1,326 | 3,210 | 4,536 | (1 | )(2) | 1,326 | 3,209 | 4,535 | (227 | ) | 10/18/07 | 2007 | ||||||||||||
| TOTAL GUADALAJARA |
3 | — | 4,683 | 8,365 | 13,048 | 202 | 4,761 | 8,489 | 13,250 | (662 | ) | |||||||||||||||
| West by Northwest |
1 | — | 1,033 | 7,564 | 8,597 | (786 | )(2) | 1,033 | 6,778 | 7,811 | (1,505 | ) | 10/30/03 | 1997 | ||||||||||||
| Bondesen Business. Park |
7 | — | 1,007 | 23,370 | 24,377 | 120 | 1,007 | 23,490 | 24,497 | (7,197 | ) | 06/03/04 | 2001/2002 | |||||||||||||
| Beltway 8 Business Park |
7 | — | 1,679 | 25,565 | 27,244 | (30 | )(2) | 1,679 | 25,535 | 27,214 | (7,525 | ) | 06/03/04/ 07/01/05 |
2001/2003 | ||||||||||||
| Corporate Industrial |
2 | — | 613 | 3,989 | 4,602 | 225 | 613 | 4,214 | 4,827 | (1,054 | ) | 10/01/04 | 1981 | |||||||||||||
| Reed Industrial |
1 | — | 568 | 6,331 | 6,899 | 249 | 568 | 6,580 | 7,148 | (2,977 | ) | 10/01/04 | 1973 | |||||||||||||
| Julie Rivers Industrial |
2 | — | 272 | 3,123 | 3,395 | 309 | 272 | 3,432 | 3,704 | (1,197 | ) | 10/01/04 | 1982 | |||||||||||||
| Wynwood Industrial |
1 | — | 180 | 1,634 | 1,814 | 7 | 180 | 1,641 | 1,821 | (399 | ) | 10/01/04 | 1980 | |||||||||||||
| Wynpark Industrial |
1 | — | 154 | 1,404 | 1,558 | 34 | 154 | 1,438 | 1,592 | (428 | ) | 10/01/04 | 1966 | |||||||||||||
| Siber Industrial |
1 | — | 742 | 4,644 | 5,386 | (475 | )(2) | 742 | 4,169 | 4,911 | (1,284 | ) | 10/01/04 | 1966 | ||||||||||||
| Greenbriar Industrial |
1 | — | 1,200 | 7,998 | 9,198 | 1,902 | 1,200 | 9,900 | 11,100 | (2,753 | ) | 10/01/04 | 1981 | |||||||||||||
| Greens Crossing |
3 | 6,657 | 1,225 | 10,202 | 11,427 | 161 | 1,225 | 10,363 | 11,588 | (1,801 | ) | 07/01/05 | 1998-2000 | |||||||||||||
F-50
Table of Contents
SCHEDULE III—REAL ESTATE AND ACCUMULATED DEPRECIATION—(Continued)
December 31, 2009
| Number of Buildings |
Encum- brances (4) |
Initial Cost to Company | Costs Capitalized Subsequent to Acquisition |
Gross Amount Carried at 12/31/2009 |
Accumulated Depreciation (5) |
Acquisition Date |
Year Built | |||||||||||||||||||
| Property |
Land | Building & Improvements (1) |
Total Costs | Land | Building & Improvements (1) |
Total Costs (3)(5) |
||||||||||||||||||||
| Willowbrook |
4 | 7,860 | 1,274 | 12,842 | 14,116 | 738 | 1,274 | 13,580 | 14,854 | (2,687 | ) | 07/01/05 | 1998/2000 | |||||||||||||
| Gateway at Central Green |
2 | — | 1,079 | 9,929 | 11,008 | 415 | 1,079 | 10,344 | 11,423 | (1,791 | ) | 09/20/05 | 2001 | |||||||||||||
| Fairbanks Center |
1 | — | 707 | 5,205 | 5,912 | 195 | 707 | 5,400 | 6,107 | (802 | ) | 03/27/06 | 1999 | |||||||||||||
| Bondesen North |
4 | — | 3,345 | 11,030 | 14,375 | 61 | 3,345 | 11,091 | 14,436 | (1,523 | ) | 06/08/07 | 2006 | |||||||||||||
| Northwest Place |
1 | — | 1,821 | 11,406 | 13,227 | 1,161 | 1,821 | 12,567 | 14,388 | (1,740 | ) | 06/14/07 | 1997 | |||||||||||||
| 8701 Warehouse Center Drive |
1 | — | 1,296 | 6,782 | 8,078 | 6 | 1,296 | 6,788 | 8,084 | (741 | ) | 12/03/07 | 2006 | |||||||||||||
| TOTAL HOUSTON |
40 | 14,517 | 18,195 | 153,018 | 171,213 | 4,292 | 18,195 | 157,310 | 175,505 | (37,404 | ) | |||||||||||||||
| Plainfield |
2 | — | 3,095 | 31,369 | 34,464 | (221 | )(2) | 3,095 | 31,148 | 34,243 | (6,123 | ) | 12/22/03 | 1997/2000 | ||||||||||||
| Handleman Building |
1 | — | 2,200 | 11,239 | 13,439 | 304 | 2,200 | 11,543 | 13,743 | (2,712 | ) | 12/15/05 | 1995 | |||||||||||||
| Franklin Road |
3 | — | 2,292 | 11,949 | 14,241 | 2,556 | 2,292 | 14,505 | 16,797 | (2,687 | ) | 02/27/06 | 1973 | |||||||||||||
| Perry Road |
1 | — | 1,106 | 7,268 | 8,374 | 38 | 1,106 | 7,306 | 8,412 | (857 | ) | 10/10/07 | 1995 | |||||||||||||
| TOTAL INDIANAPOLIS |
7 | — | 8,693 | 61,825 | 70,518 | 2,677 | 8,693 | 64,502 | 73,195 | (12,379 | ) | |||||||||||||||
| Midpoint Drive |
1 | — | 1,235 | 11,690 | 12,925 | 414 | 1,435 | 11,904 | 13,339 | (1,360 | ) | 07/03/07 | 2006 | |||||||||||||
| TOTAL KANSAS CITY |
1 | — | 1,235 | 11,690 | 12,925 | 414 | 1,435 | 11,904 | 13,339 | (1,360 | ) | |||||||||||||||
| Trade Pointe III |
1 | 5,075 | 1,020 | 7,240 | 8,260 | (916 | )(2) | 1,020 | 6,324 | 7,344 | (1,331 | ) | 09/28/04 | 2001 | ||||||||||||
| Riverport |
1 | — | 1,279 | 8,812 | 10,091 | 204 | 1,279 | 9,016 | 10,295 | (2,573 | ) | 05/03/04 | 1996 | |||||||||||||
| Freeport |
1 | — | 2,523 | 18,693 | 21,216 | 336 | 2,523 | 19,029 | 21,552 | (2,929 | ) | 03/14/07 | 1999 | |||||||||||||
| Louisville Logistics Center |
1 | 5,763 | 2,177 | 11,932 | 14,109 | (14 | )(2) | 2,177 | 11,918 | 14,095 | (1,529 | ) | 10/12/07 | 2002 | ||||||||||||
| TOTAL LOUISVILLE |
4 | 10,838 | 6,999 | 46,677 | 53,676 | (390 | )(2) | 6,999 | 46,287 | 53,286 | (8,362 | ) | ||||||||||||||
| Chickasaw |
2 | — | 1,141 | 13,837 | 14,978 | (520 | )(2) | 1,141 | 13,317 | 14,458 | (3,229 | ) | 07/22/03 | 2000/2002 | ||||||||||||
| Panattoni Memphis Portfolio |
7 | 36,206 | 18,088 | 114,739 | 132,827 | 4,843 | 18,088 | 119,582 | 137,670 | (29,002 | ) | 02/05/05- 05/13/05 |
1997-2003 | |||||||||||||
| Memphis Distriplex |
1 | 4,376 | 1,525 | 10,444 | 11,969 | (84 | )(2) | 1,525 | 10,360 | 11,885 | (2,470 | ) | 06/13/05 | 2000 | ||||||||||||
| TOTAL MEMPHIS |
10 | 40,582 | 20,754 | 139,020 | 159,774 | 4,239 | 20,754 | 143,259 | 164,013 | (34,701 | ) | |||||||||||||||
F-51
Table of Contents
SCHEDULE III—REAL ESTATE AND ACCUMULATED DEPRECIATION—(Continued)
December 31, 2009
| Number of Buildings |
Encum- brances (4) |
Initial Cost to Company | Costs Capitalized Subsequent to Acquisition |
Gross Amount Carried at 12/31/2009 |
Accumulated Depreciation (5) |
Acquisition Date |
Year Built | |||||||||||||||||||
| Property |
Land | Building & Improvements (1) |
Total Costs | Land | Building & Improvements (1) |
Total Costs (3)(5) |
||||||||||||||||||||
| Miami Service Center |
1 | — | 1,110 | 3,811 | 4,921 | 659 | 1,110 | 4,470 | 5,580 | (1,237 | ) | 04/07/05 | 1987 | |||||||||||||
| Miami Commerce Center |
1 | 4,816 | 3,050 | 10,769 | 13,819 | (901 | )(2) | 3,050 | 9,868 | 12,918 | (1,322 | ) | 04/13/05 | 1991 | ||||||||||||
| Northeast 12 Terrace |
1 | 2,475 | 1,169 | 6,088 | 7,257 | 36 | 1,169 | 6,124 | 7,293 | (2,287 | ) | 07/21/05 | 1974 | |||||||||||||
| Northwest 70th Avenue |
2 | — | 10,025 | 16,936 | 26,961 | 4,285 | 10,025 | 21,221 | 31,246 | (3,828 | ) | 06/09/06 | 1972/1976 | |||||||||||||
| North Andrews Avenue |
1 | — | 6,552 | 6,101 | 12,653 | 244 | 6,552 | 6,345 | 12,897 | (955 | ) | 06/09/06 | 1999 | |||||||||||||
| TOTAL MIAMI |
6 | 7,291 | 21,906 | 43,705 | 65,611 | 4,323 | 21,906 | 48,028 | 69,934 | (9,629 | ) | |||||||||||||||
| Minnesota Valley |
3 | — | 3,764 | 22,039 | 25,803 | 692 | 3,764 | 22,731 | 26,495 | (3,143 | ) | 04/13/06 | 1998-2000 | |||||||||||||
| TOTAL MINNEAPOLIS |
3 | — | 3,764 | 22,039 | 25,803 | 692 | 3,764 | 22,731 | 26,495 | (3,143 | ) | |||||||||||||||
| Nexxus (6) |
4 | — | 6,341 | 17,446 | 23,787 | 6,615 | 7,301 | 23,101 | 30,402 | (1,645 | ) | 11/16/07 | 2007 | |||||||||||||
| TOTAL MONTERREY |
4 | — | 6,341 | 17,446 | 23,787 | 6,615 | 7,301 | 23,101 | 30,402 | (1,645 | ) | |||||||||||||||
| Bridgestone/Firestone (6) |
1 | — | 2,545 | 21,939 | 24,484 | 5,425 | 2,545 | 27,364 | 29,909 | (6,063 | ) | 06/09/03 | 2005 | |||||||||||||
| Mid South Logistics Center |
1 | 12,045 | 1,772 | 18,288 | 20,060 | 148 | 1,772 | 18,436 | 20,208 | (5,410 | ) | 06/29/04 | 2001 | |||||||||||||
| Eastgate |
1 | — | 1,445 | 13,352 | 14,797 | (1,595 | )(2) | 1,445 | 11,757 | 13,202 | (2,381 | ) | 03/19/04 | 2002 | ||||||||||||
| Logistics Way |
1 | — | 621 | 17,763 | 18,384 | 3 | 621 | 17,766 | 18,387 | (386 | ) | 09/28/09 | 2007 | |||||||||||||
| Rockdale Distribution Center |
1 | — | 2,940 | 12,188 | 15,128 | (703 | )(2) | 2,940 | 11,485 | 14,425 | (1,497 | ) | 12/28/05 | 2005 | ||||||||||||
| TOTAL NASHVILLE |
5 | 12,045 | 9,323 | 83,530 | 92,853 | 3,278 | 9,323 | 86,808 | 96,131 | (15,737 | ) | |||||||||||||||
| Brunswick Avenue |
1 | 9,931 | 3,665 | 16,380 | 20,045 | 126 | 3,665 | 16,506 | 20,171 | (2,106 | ) | 07/21/05 | 1986 | |||||||||||||
| Campus Drive |
1 | 2,714 | 1,366 | 4,841 | 6,207 | 1,103 | 1,366 | 5,944 | 7,310 | (988 | ) | 07/21/05 | 1975 | |||||||||||||
| Dendreon Building |
1 | — | 4,940 | 8,026 | 12,966 | (6 | )(2) | 4,940 | 8,020 | 12,960 | (1,642 | ) | 12/28/05 | 1988 | ||||||||||||
| Rockaway |
3 | — | 5,881 | 12,521 | 18,402 | 835 | 5,881 | 13,356 | 19,237 | (2,648 | ) | 12/29/05 | 1974 | |||||||||||||
| Lake Drive |
1 | 5,159 | 1,699 | 6,898 | 8,597 | 437 | 1,699 | 7,335 | 9,034 | (1,166 | ) | 05/25/06 | 1988 | |||||||||||||
| 452 Business Center |
2 | 3,880 | 2,298 | 7,311 | 9,609 | (90 | )(2) | 2,298 | 7,221 | 9,519 | (1,585 | ) | 06/06/06 | 1990 | ||||||||||||
| TOTAL NEW JERSEY |
9 | 21,684 | 19,849 | 55,977 | 75,826 | 2,405 | 19,849 | 58,382 | 78,231 | (10,135 | ) | |||||||||||||||
F-52
Table of Contents
SCHEDULE III—REAL ESTATE AND ACCUMULATED DEPRECIATION—(Continued)
December 31, 2009
| Number of Buildings |
Encum- brances (4) |
Initial Cost to Company | Costs Capitalized Subsequent to Acquisition |
Gross Amount Carried at 12/31/2009 |
Accumulated Depreciation (5) |
Acquisition Date |
Year Built | |||||||||||||||||||
| Property |
Land | Building & Improvements (1) |
Total Costs | Land | Building & Improvements (1) |
Total Costs (3)(5) |
||||||||||||||||||||
| Eden Rock Industrial |
2 | — | 1,943 | 4,746 | 6,689 | 297 | 1,943 | 5,043 | 6,986 | (1,251 | ) | 10/01/04 | 1973 | |||||||||||||
| Bayside Distribution Center |
2 | 10,753 | 6,875 | 15,254 | 22,129 | (438 | )(2) | 6,875 | 14,816 | 21,691 | (4,178 | ) | 11/03/04 | 1998/2000 | ||||||||||||
| California Logistics Centre |
1 | — | 5,672 | 20,499 | 26,171 | 347 | 5,672 | 20,846 | 26,518 | (4,186 | ) | 04/21/06 | 2001 | |||||||||||||
| Cherry Street |
3 | — | 12,584 | 24,582 | 37,166 | 669 | 12,584 | 25,251 | 37,835 | (4,285 | ) | 06/09/06 | 1960/1990 | |||||||||||||
| Pike Lane (6) |
3 | — | 2,880 | 8,328 | 11,208 | 71 | 2,880 | 8,399 | 11,279 | (1,349 | ) | 06/09/06 | 1982 | |||||||||||||
| South Vasco Road |
1 | — | 2,572 | 14,809 | 17,381 | 218 | 2,572 | 15,027 | 17,599 | (2,587 | ) | 06/09/06 | 1999 | |||||||||||||
| McLaughlin Avenue |
1 | — | 3,424 | 5,507 | 8,931 | 31 | 3,424 | 5,538 | 8,962 | (856 | ) | 06/09/06 | 1975 | |||||||||||||
| Park Lane |
5 | — | 10,977 | 17,216 | 28,193 | (47 | )(2) | 10,977 | 17,169 | 28,146 | (3,419 | ) | 06/09/06 | 1960/1966 | ||||||||||||
| Valley Drive |
4 | — | 11,238 | 14,244 | 25,482 | 459 | 11,238 | 14,703 | 25,941 | (2,727 | ) | 06/09/06 | 1960/1971 | |||||||||||||
| Old Country Road |
1 | — | 1,557 | 1,503 | 3,060 | (54 | )(2) | 1,557 | 1,449 | 3,006 | (286 | ) | 06/09/06 | 1969 | ||||||||||||
| Cypress Lane |
1 | — | 2,211 | 2,196 | 4,407 | 415 | 2,211 | 2,611 | 4,822 | (565 | ) | 06/09/06 | 1970 | |||||||||||||
| Mira Loma |
1 | — | 7,919 | 6,668 | 14,587 | 32 | 7,919 | 6,700 | 14,619 | (241 | ) | 01/00/00 | 1997 | |||||||||||||
| Fite Court |
1 | — | 5,316 | 15,499 | 20,815 | 61 | 5,316 | 15,560 | 20,876 | (2,393 | ) | 12/28/06 | 2003 | |||||||||||||
| TOTAL NORTHERN |
26 | 10,753 | 75,168 | 151,051 | 226,219 | 2,061 | 75,168 | 153,112 | 228,280 | (28,323 | ) | |||||||||||||||
| Cypress Park East |
2 | 9,725 | 2,627 | 13,055 | 15,682 | (87 | )(2) | 2,627 | 12,968 | 15,595 | (2,674 | ) | 10/22/04 | 2000 | ||||||||||||
| East Landstreet Road |
3 | — | 2,251 | 11,979 | 14,230 | (245 | )(2) | 2,251 | 11,734 | 13,985 | (1,469 | ) | 06/09/06 | 1997/2000 | ||||||||||||
| Boggy Creek Road |
6 | — | 6,982 | 22,646 | 29,628 | 443 | 6,982 | 23,089 | 30,071 | (3,117 | ) | 06/09/06 | 1993-2002 | |||||||||||||
| American Way |
1 | — | 3,603 | 8,667 | 12,270 | 1 | 3,603 | 8,668 | 12,271 | (1,099 | ) | 08/16/07 | 1997 | |||||||||||||
| TOTAL ORLANDO |
12 | 9,725 | 15,463 | 56,347 | 71,810 | 112 | 15,463 | 56,459 | 71,922 | (8,359 | ) | |||||||||||||||
| North Industrial |
2 | 5,291 | 4,566 | 15,899 | 20,465 | 2,382 | 4,566 | 18,281 | 22,847 | (4,987 | ) | 10/01/04 | 1995/1999 | |||||||||||||
| South Industrial I |
2 | 4,415 | 2,876 | 14,120 | 16,996 | 347 | 2,829 | 14,514 | 17,343 | (4,258 | ) | 10/01/04 | 1987/1989 | |||||||||||||
| South Industrial II |
1 | — | 1,235 | 4,902 | 6,137 | (375 | )(2) | 1,235 | 4,527 | 5,762 | (1,694 | ) | 10/01/04 | 1990 | ||||||||||||
| West Southern Industrial |
1 | — | 555 | 3,376 | 3,931 | (116 | )(2) | 555 | 3,260 | 3,815 | (834 | ) | 10/01/04 | 1984 | ||||||||||||
| West Geneva Industrial |
3 | — | 413 | 2,667 | 3,080 | 359 | 413 | 3,026 | 3,439 | (655 | ) | 10/01/04 | 1981 | |||||||||||||
| West 24th Industrial |
2 | — | 870 | 4,575 | 5,445 | 679 | 870 | 5,254 | 6,124 | (1,317 | ) | 10/01/04 | 1979/1980 | |||||||||||||
| Sky Harbor Transit Center |
1 | — | 2,534 | 7,597 | 10,131 | (156 | )(2) | 2,534 | 7,441 | 9,975 | (2,144 | ) | 11/24/04 | 2002 | ||||||||||||
| States Logistics Center |
1 | — | 1,690 | 5,643 | 7,333 | (15 | )(2) | 1,690 | 5,628 | 7,318 | (643 | ) | 12/05/05 | 1988 | ||||||||||||
| Roosevelt Distribution Center |
1 | 2,068 | 1,154 | 6,441 | 7,595 | (248 | )(2) | 1,154 | 6,193 | 7,347 | (890 | ) | 05/19/06 | 1988 | ||||||||||||
| TOTAL PHOENIX |
14 | 11,774 | 15,893 | 65,220 | 81,113 | 2,857 | 15,846 | 68,124 | 83,970 | (17,422 | ) | |||||||||||||||
F-53
Table of Contents
SCHEDULE III—REAL ESTATE AND ACCUMULATED DEPRECIATION—(Continued)
December 31, 2009
| Number of Buildings |
Encum- brances (4) |
Initial Cost to Company | Costs Capitalized Subsequent to Acquisition |
Gross Amount Carried at 12/31/2009 |
Accumulated Depreciation (5) |
Acquisition Date | Year Built | |||||||||||||||||||
| Property |
Land | Building & Improvements (1) |
Total Costs | Land | Building & Improvements (1) |
Total Costs (3)(5) |
||||||||||||||||||||
| Rittiman Business Park |
15 | — | 6,737 | 40,935 | 47,672 | 4,007 | 6,823 | 44,856 | 51,679 | (8,397 | ) | 06/03/04/12/07/06 | 1976-2000 | |||||||||||||
| TOTAL |
15 | — | 6,737 | 40,935 | 47,672 | 4,007 | 6,823 | 44,856 | 51,679 | (8,397 | ) | |||||||||||||||
| Garo Logistics Building |
1 | — | 565 | 2,638 | 3,203 | (17 | )(2) | 565 | 2,621 | 3,186 | (227 | ) | 08/15/07 | 2006 | ||||||||||||
| TOTAL SAN LUIS |
1 | — | 565 | 2,638 | 3,203 | (17 | ) | 565 | 2,621 | 3,186 | (227 | ) | ||||||||||||||
| Industry Drive North |
2 | 9,868 | 5,753 | 16,039 | 21,792 | 1 | 5,753 | 16,040 | 21,793 | (2,933 | ) | 07/21/05 | 1996 | |||||||||||||
| South 228th Street (6) |
1 | 8,031 | 3,025 | 13,694 | 16,719 | (2 | )(2) | 3,025 | 13,692 | 16,717 | (1,978 | ) | 07/21/05 | 1996/1997 | ||||||||||||
| 64th Avenue South |
1 | 6,474 | 3,345 | 9,335 | 12,680 | 1,253 | 3,345 | 10,588 | 13,933 | (2,383 | ) | 07/21/05 | 1996 | |||||||||||||
| South 192nd Street |
1 | 2,288 | 1,286 | 3,433 | 4,719 | (36 | )(2) | 1,286 | 3,397 | 4,683 | (500 | ) | 07/21/05 | 1986 | ||||||||||||
| South 212th Street |
1 | — | 3,095 | 10,253 | 13,348 | (552 | )(2) | 3,095 | 9,701 | 12,796 | (1,355 | ) | 08/01/05 | 1996 | ||||||||||||
| Southwest 27th Street |
1 | 7,570 | 4,583 | 8,353 | 12,936 | 27 | 4,583 | 8,380 | 12,963 | (2,299 | ) | 07/21/05 | 1995 | |||||||||||||
| TOTAL |
7 | 34,231 | 21,087 | 61,107 | 82,194 | 691 | 21,087 | 61,798 | 82,885 | (11,448 | ) | |||||||||||||||
| Foothill Business Center |
3 | — | 13,315 | 9,112 | 22,427 | 31 | 13,315 | 9,143 | 22,458 | (2,434 | ) | 12/09/04 | 2000 | |||||||||||||
| Rancho Technology Park |
1 | — | 2,790 | 7,048 | 9,838 | 137 | 2,790 | 7,185 | 9,975 | (1,941 | ) | 10/16/03 | 2002 | |||||||||||||
| East Slauson Avenue |
3 | 12,010 | 5,499 | 14,775 | 20,274 | 1,920 | 5,499 | 16,695 | 22,194 | (3,120 | ) | 07/21/05 | 1962/1976 | |||||||||||||
| Airport Circle |
1 | 5,490 | 3,098 | 8,368 | 11,466 | 1,159 | 3,098 | 9,527 | 12,625 | (1,180 | ) | 07/21/05 | 1992 | |||||||||||||
| Cota Street |
1 | 4,453 | 2,802 | 7,624 | 10,426 | 808 | 2,802 | 8,432 | 11,234 | (1,831 | ) | 07/21/05 | 1987 | |||||||||||||
| Sycamore Canyon |
1 | — | 1,888 | 22,177 | 24,065 | — | 3,232 | 20,833 | 24,065 | (407 | ) | 09/09/09 | 2007 | |||||||||||||
| Twin Oaks Valley Road |
2 | 3,998 | 1,815 | 7,855 | 9,670 | 56 | 1,815 | 7,911 | 9,726 | (1,450 | ) | 07/21/05 | 1978/1988 | |||||||||||||
| Meyer Canyon |
1 | — | 5,314 | 9,929 | 15,243 | 1,813 | 5,609 | 11,447 | 17,056 | (999 | ) | 06/30/06 | 2001 | |||||||||||||
| TOTAL SOUTHERN CALIFORNIA MARKET |
13 | 25,951 | 36,521 | 86,888 | 123,409 | 5,924 | 38,160 | 91,173 | 129,333 | (13,362 | ) | |||||||||||||||
| Tijuana Portfolio (6) |
3 | — | 2,746 | 7,977 | 10,723 | 147 | 2,746 | 8,124 | 10,870 | (733 | ) | 12/06/07 | 1989/1992 | |||||||||||||
| TOTAL TIJUANA MARKET |
3 | — | 2,746 | 7,977 | 10,723 | 147 | 2,746 | 8,124 | 10,870 | (733 | ) | |||||||||||||||
| SUB TOTAL CONSOLIDATED OPERATING PROPERTIES |
375 | 499,941 | 469,638 | 2,141,363 | 2,611,001 | 101,290 | 474,443 | 2,237,848 | 2,712,291 | (444,605 | ) | |||||||||||||||
F-54
Table of Contents
SCHEDULE III—REAL ESTATE AND ACCUMULATED DEPRECIATION—(Continued)
December 31, 2009
| Number of Buildings |
Encum- brances (4) |
Initial Cost to Company | Costs Capitalized Subsequent to Acquisition |
Gross Amount Carried at 12/31/2009 | Accumulated Depreciation (5) |
Acquisition Date |
Year Built | |||||||||||||||||||||||
| Property |
Land | Building & Improvements (1) |
Total Costs | Land | Building & Improvements (1) |
Total Costs (3)(5) |
||||||||||||||||||||||||
| Properties under redevelopment |
4 | 8,656 | 6,503 | 35,545 | 42,048 | (3,739 | ) | |||||||||||||||||||||||
| Properties under development |
16 | — | 22,289 | 116,409 | 138,698 | (2,898 | ) | |||||||||||||||||||||||
| Properties in pre-development including land held |
0 | — | 16,250 | 7,127 | 23,377 | — | ||||||||||||||||||||||||
| GRAND TOTAL |
395 | $ | 508,597 | $ | 519,485 | $ | 2,396,929 | $ | 2,916,414 | $ | (451,242 | ) | ||||||||||||||||||
| (1) | Included in Building & Improvements are intangible lease assets. |
| (2) | Generally these reductions in basis include one or more of the following: i) payments received under master lease agreements and pursuant to GAAP, rental and expense recovery payments under master lease agreements are reflected as a reduction of the basis of the underlying property rather than revenues; ii) writeoffs of fixed asset balances due to early lease terminations by contracted customers; and iii) other miscellaneous basis adjustments. |
F-55
Table of Contents
SCHEDULE III—REAL ESTATE AND ACCUMULATED DEPRECIATION—(Continued)
December 31, 2009
| (3) | As of December 31, 2009, the aggregate cost for federal income tax purposes of investments in real estate was approximately $2.5 billion. |
| (4) | Reconciliation of total debt to consolidated balance sheet caption as of December 31, 2009: |
| Total per Schedule III |
$ | 508,597 | |
| Premiums, net of amortization |
3,118 | ||
| Total mortgage notes |
$ | 511,715 | |
| (5) | A summary of activity for real estate and accumulated depreciation for the year ended December 31, 2009 is as follows: |
| Investments in properties: |
||||
| Balance at beginning of year |
$ | 2,897,861 | ||
| Acquisition of properties |
82,049 | |||
| Improvements, including development properties |
46,914 | |||
| Divestiture of properties |
(33,311 | ) | ||
| Intangible write offs |
(74,294 | ) | ||
| Impairments |
(330 | ) | ||
| Other adjustments |
(2,475 | ) | ||
| Balance at end of year |
$ | 2,916,414 | ||
| Accumulated depreciation: |
||||
| Balance at beginning of year |
$ | 417,404 | ||
| Depreciation and amortization expense, including discontinued operations |
113,618 | |||
| Divestiture of properties |
(5,486 | ) | ||
| Intangible write offs |
(74,294 | ) | ||
| Balance at end of year |
$ | 451,242 | ||
| (6) | Occasionally our leases contain certain provisions giving the tenant rights to purchase the property, which can take the form of a fixed price purchase option, a fair market value option, a right of first refusal option or a right of first offer option. These buildings, or a building included in the business park are subject to such an agreement. |
F-56
Table of Contents
EXHIBIT INDEX
| Exhibit Number |
Description | |
| *2.1 | Contribution Agreement by and among Dividend Capital Trust Inc., Dividend Capital Operating Partnership LP and Dividend Capital Advisors Group LLC, dated as of July 21, 2006 (incorporated by reference to Exhibit 2.1 to Form 8-K filed on July 27, 2006) | |
| *3.1 | DCT Industrial Trust Inc. Third Articles of Amendment and Restatement (incorporated by reference to Exhibit 3.1 to Form 8-K filed on December 19, 2006) | |
| *3.2 | DCT Industrial Trust Inc. Amended and Restated Bylaws (incorporated by reference to Exhibit 3.2 to Form 8-K filed on December 19, 2006) | |
| *10.1 | Form of Indemnification Agreement (incorporated by reference to Exhibit 10.1 to Form 10-Q filed on May 9, 2007) | |
| *10.2 | Amended and Restated Limited Partnership Agreement of DCT Industrial Operating Partnership LP, dated October 10, 2006 (incorporated by reference to Exhibit 10.5 to Form 8-K filed on October 13, 2006) | |
| *10.3 | Third Amendment to the Amended and Restated Limited Partnership Agreement of DCT Industrial Operating Partnership LP, dated May 3, 2007 (incorporated by reference to Exhibit 99.2 to Form S-3ASR Registration Statement, Commission File No. 333-145253) | |
| *10.4 | Fourth Amendment to the Amended and Restated Limited Partnership Agreement of DCT Industrial Operating Partnership LP, dated December 1, 2008 | |
| *10.5 | DCT Industrial Trust Inc. Amended and Restated 2006 Long-Term Incentive Plan (incorporated by reference to Exhibit 10.1 to Form 10-Q filed on August 14, 2007) | |
| *10.6 | DCT Industrial Trust Inc. 2006 Incentive Compensation Plan (incorporated by reference to Exhibit 10.2 to Form 8-K filed on October 13, 2006) | |
| *10.7 | Amended and Restated Unsecured Revolving Credit Agreement, dated as of December 15, 2006, among DCT Industrial Trust Inc. and the banks identified therein and JP Morgan Chase Bank, N.A. as administrative agent, U.S. Bank National Association as syndication agent, and LaSalle Bank National Association, PNC Bank, National Association and Wells Fargo Bank, National Association, as documentation agents and J.P. Morgan Securities Inc. as sole bookrunner and sole lead arranger (incorporated by reference to Exhibit 10.1 to Form 10-Q filed on November 11, 2008) | |
| *10.8 | Employment Agreement, dated as of October 9, 2009, between DCT Industrial Trust Inc. and Philip L. Hawkins (incorporated by reference to Exhibit 10.1 to Form 8-K filed on October 13, 2009) | |
| *10.9 | Employment Agreement, dated as of October 9, 2009, between DCT Industrial Trust Inc. and Stuart B. Brown (incorporated by reference to Exhibit 10.2 to Form 8-K filed on October 13, 2009) | |
| *10.10 | Employment Agreement, dated as of October 9, 2009, between DCT Industrial Trust Inc. and Daryl H. Mechem (incorporated by reference to Exhibit 10.3 to Form 8-K filed on October 13, 2009) | |
| *10.11 | Employment Agreement, dated as of October 9, 2009, between DCT Industrial Trust Inc. and Michael J. Ruen (incorporated by reference to Exhibit 10.4 to Form 8-K filed on October 13, 2009) | |
| *10.12 | Separation Agreement, dated as of September 8, 2009, by and between the Company and James D. Cochran (incorporated by reference to Exhibit 10.1 of the Company’s 8-K filed on September 8, 2009) | |
E-1
Table of Contents
| Exhibit Number |
Description | |
| +10.13 | Change of Control Agreement, dated as of October 9, 2009, between DCT Industrial Trust Inc. and Stephen K. Schutte | |
| +10.14 | Change of Control Agreement, dated as of October 9, 2009, between DCT Industrial Trust Inc. and Matthew T. Murphy | |
| *10.15 | DCT Industrial Trust Inc. Multi-Year Outperformance Program (incorporated by reference to Exhibit 10.1 to Form 8-K filed on January 12, 2010) | |
| +21.1 | List of Subsidiaries | |
| +23.1 | Consent of Ernst & Young LLP, Independent Registered Public Accounting Firm, dated February 26, 2010 | |
| +23.2 | Consent of KPMG LLP, Independent Registered Public Accounting Firm, dated February 26, 2010 | |
| +31.1 | Rule 13a-14(a) Certification of Principal Executive Officer | |
| +31.2 | Rule 13a-14(a) Certification of Principal Financial Officer | |
| ++32.1 | Section 1350 Certification of Principal Executive Officer | |
| ++32.2 | Section 1350 Certification of Principal Financial Officer | |
| + | Filed herewith. |
| ++ | Furnished herewith |
| * | Previously filed. |
E-2