Attached files
Table of Contents
UNITED STATES
SECURITIES AND EXCHANGE COMMISSION
Washington, D.C. 20549
FORM 10-K
ANNUAL REPORT PURSUANT TO SECTION 13 OR 15(d) OF THE
SECURITIES EXCHANGE ACT OF 1934
For the fiscal year ended December 31, 2009
Commissions file number 1-14379
CONVERGYS CORPORATION
| An Ohio | I.R.S. Employer | |
| Corporation | No. 31-1598292 |
201 East Fourth Street, Cincinnati, Ohio 45202
Telephone Number (513) 723-7000
Securities registered pursuant to Section 12(b) of the Act:
| Title of each class | Name of each exchange on which registered | |||
| Common Shares (no par value) | New York Stock Exchange |
Securities registered pursuant to Section 12(g) of the Act: None
Indicate by check mark if the registrant is a well-known seasoned issuer, as defined in Rule 405 of the Securities Act.
Yes X No
Indicate by check mark if the registrant is not required to file reports pursuant to Section 13 or Section 15(d) of the Act.
Yes No X
Indicate by check mark whether the registrant (1) has filed all reports required to be filed by Section 13 or 15(d) of the Securities Exchange Act of 1934 during the preceding 12 months (or for such shorter period that the registrant was required to file such reports), and (2) has been subject to such filing requirements for the past 90 days. Yes X No
Indicate by check mark whether the registrant has submitted electronically and posted on its corporate Website, if any, every Interactive Data File required to be submitted and posted pursuant to Rule 405 of Regulation S-T (Section 232.405 of this chapter) during the preceding 12 months (or for such shorter period that the registrant was required to submit and post such files). Yes No
Indicate by check mark if disclosure of delinquent filers pursuant to Item 405 of Regulation S-K (Section 229.405 of this chapter) is not contained herein, and will not be contained, to the best of registrant’s knowledge, in definitive proxy or information statements incorporated by reference in Part III of this Form 10-K or any amendment to this Form 10-K.
Indicate by check mark whether the registrant is a large accelerated filer, an accelerated filer, a non-accelerated filer or a smaller reporting company. See definitions of “large accelerated filer,” “accelerated filer” and “smaller reporting company” in Rule 12b-2 of the Exchange Act.
Large accelerated filer X Accelerated filer Non-accelerated filer Smaller reporting company
Indicate by check mark whether the registrant is a shell company (as defined in Rule 12b-2 of the Exchange Act).
Yes No X
The aggregate market value of the voting shares held by non-affiliates of the registrant was $1,139,860,863, computed by reference to the closing sale price of the stock on the New York Stock Exchange on June 30, 2009, the last business day of the registrant’s most recently completed second fiscal quarter.
At January 31, 2010, there were 123,170,011 common shares outstanding, excluding amounts held in treasury of 60,163,838.
DOCUMENTS INCORPORATED BY REFERENCE
Portions of the registrant’s definitive proxy statement for the 2010 Annual Meeting of Shareholders to be held on April 20, 2010 are incorporated by reference into Part III of this report.
Table of Contents
Convergys Corporation 2009 Annual Report 1
Table of Contents
Safe Harbor Statement and Part I, Item 1. Business
Private Securities
Litigation Reform Act of 1995
Safe Harbor Cautionary Statement
This report and the documents incorporated by reference contain “forward-looking” statements, as defined in the Private Securities Litigation Reform Act of 1995, that are based on current expectations, estimates and projections. Statements that are not historical facts, including statements about the beliefs and expectations of Convergys Corporation (Company), are forward-looking statements and will contain words such as “believes,” “expects,” “intends,” “could,” “should,” “will,” “plans,” “anticipates” and other similar words. These statements discuss potential risks and uncertainties; and, therefore, actual results may differ materially. You are cautioned not to place undue reliance on these forward-looking statements, which speak only as of the date on which they were made. The Company has no current intention to update any forward-looking statements, whether as a result of new information, future events or otherwise.
Important factors that may affect these projections or expectations include, but are not limited to: the behavior of financial markets including fluctuations in interest or exchange rates; continued volatility and further deterioration of the capital markets; the impact of regulation and regulatory, investigative, and legal actions; strategic actions, including acquisitions and dispositions; future integration of acquired businesses; future financial performance of major industries which we serve; the loss of a significant client or significant business from a client; difficulties in completing a contract or implementing its provisions; and numerous other matters of national, regional, and global scale including those of the political, economic, business, and competitive nature. These uncertainties may cause our actual future results to be materially different than those expressed in our forward-looking statements. The “Risk Factors” set forth in Part I, Item 1A of this report could also cause actual results to differ materially from the forward-looking statements.
Part I
Overview
Convergys Corporation (the Company or Convergys) is a global leader in relationship management. We provide solutions that drive more value from the relationships our clients have with their customers and employees. Convergys turns these everyday interactions into a source of profit and strategic advantage for our clients. Our unique combination of domain expertise, operational excellence and innovative technologies has delivered process improvement and actionable business insight to clients to enhance their relationships with customers and employees.
The Company maintains an internet website at www.convergys.com. Information about the Company is available on the website, free of charge, including the annual report filed on Form 10-K, quarterly reports on Form 10-Q, current reports on Form 8-K, and amendments to those reports filed or furnished pursuant to Section 13(a) or 15(d) of the Securities Exchange Act of 1934, as soon as reasonably practicable after we electronically file such material with, or furnish it to, the Securities and Exchange Commission. The Company’s website and the information contained therein are not considered as being incorporated into this Annual Report.
The Company has a Code of Business Conduct that applies to all employees as well as our Board of Directors; a Financial Code of Ethics that applies to our principal executive officer, principal financial and accounting officer and certain other management and senior employees; and Governance Principles for our Board of Directors. The Code of Business Conduct, Financial Code of Ethics and Governance Principles, as well as the charters for the following committees of our Board of Directors; Audit Committee, Finance Committee, Compensation and Benefits Committee and the Governance and Nominating Committee, are posted on our website at www.convergys.com. The Company will post on our website any amendments to, or waivers of, the Code of
2 Convergys Corporation 2009 Annual Report
Table of Contents
Business Conduct and Financial Code of Ethics. Copies of these documents will be provided free of charge upon written request directed to Investor Relations, Convergys Corporation, 201 East Fourth Street, Cincinnati, Ohio 45202.
Business Segments
The Company has three segments: Customer Management, which provides agent-assisted, self-service and intelligent technology care solutions; Information Management, which provides business support system (BSS) solutions; and Human Resources (HR) Management, which provides human resource business process outsourcing (HR BPO) solutions. These segments are consistent with the Company’s management of the business and reflect its internal financial reporting structure and operating focus. The Board of Directors continually monitors the Company’s business and, as appropriate, evaluates various strategies to enhance shareholder value, including by means of strategic transactions involving one or more of its businesses. Any such transactions could occur in the future and could be material, although there can be no assurance that such transactions will occur.
Pursuant to Rule 12b-23 under the Securities Exchange Act of 1934, as amended, the industry segment and geographic information included in Item 8, Note 18 of the Notes to Consolidated Financial Statements, are incorporated by reference in partial response to this Item 1.
Customer Management
Our Customer Management segment partners with clients to deliver customer care solutions that enhance the value of their customer relationships, turning the customer experience into a strategic differentiator. As an end-to-end single-source provider of self-service, agent-assisted and proactive care solutions we combine consulting, innovative technology and agent-assisted services to optimize the customer experience and strengthen customer relationships. Whether contact center operations are on-premises, fully outsourced or blended, we customize our solutions to meet our clients’ needs.
Customer Management solutions are organized into two areas: 1) agent-assisted services, and 2) intelligent technology solutions.
Agent-Assisted Services
Every day our approximately 60,000 contact center employees handle millions of customer service interactions such as account service, billing inquiries and technical support and service in contact centers worldwide. We provide multi-channel customer care using a global service delivery infrastructure that operates 24 hours a day, 365 days a year. Our global delivery model means our clients’ businesses can benefit from workforce advantages around the world including the U.S., Canada, Latin America, Europe, India and the Philippines. We utilize center-based agents as well as work-at-home agents. Our agent-assisted solutions include:
Customer Acquisition Solutions
Customer Acquisition Solutions provide comprehensive sales and order support to identify and secure high-value consumer and business customers, maximize sales conversion rates and increase revenue per customer. In addition, we offer Direct Response Solutions to address the customer support needs of direct response marketers.
Customer Service Solutions
Customer Service Solutions include comprehensive customer care tailored to meet our clients’ specific business needs and designed to provide customers with an optimal service experience. Our agents in this solution commonly handle inquiries on products, account service, billing inquiries and dispute resolution.
Customer Retention Solutions
Customer Retention Solutions leverage analytics to optimize the level of customer satisfaction, build customer loyalty and address customer churn. Our programs are designed to help our clients retain their customers and increase their lifetime value.
Convergys Corporation 2009 Annual Report 3
Table of Contents
Item 1. Business (continued)
Technical Support
Technical Support includes tier-one, tier-two and tier-three advanced services. Either online or by phone, our programs focus on first contact resolution. Our services span from simple “how-to” inquiries from new users to sophisticated trouble-shooting and technical support.
Back Office Solutions
Back Office Solutions combine integrated document management, data entry and transaction processing capabilities with process expertise and workflow management to help meet our clients’ back office needs in customer care, accounts receivable management for early-stage collections, finance and accounting and accounts payable.
Convergys Business-to-Business Solutions
Business-to-Business Solutions include inside sales and account management, marketing campaigns, customer service and self-service programs. Focused on supporting the needs of the business-to-business market, Convergys offers a way to expand the reach of our clients’ sales force and to improve the effectiveness of their channel partnerships. Whether working with current business customers or tapping new and traditionally under-served markets, we become an extension of our clients’ sales force to drive sales and profits higher.
Agent-assisted services are deployed via multi-shore delivery capabilities that have grown to approximately 80 contact centers worldwide with an infrastructure designed to cost-effectively support customer care requirements. Our seamless and integrated network of on-shore and off-shore centers, as well as home agents, provides a high degree of availability and redundancy. Our services include multilingual program support.
Intelligent Technology Solutions
Our portfolio of Intelligent Interaction Solutions includes technologies such as voice portals and speech automation, real-time decisioning, web-based service channels, identity verification, mobile services and enhanced analytics.
In September 2008, Convergys purchased Intervoice, Inc. (Intervoice). The purchase was made to augment the Company’s relationship management solutions and to provide a complementary growth platform. Convergys and Intervoice clients understand the importance of driving greater value from customer relationships. Now both have the opportunity to benefit from a wider array of industry-leading, premises-based and hosted technology solutions.
Our intelligent technology-based solutions span the entire interaction lifecycle from proactive service to self-service to assisted service.
Self-Service Solutions deliver an intuitive, intelligent and cost-effective self-service experience. Our solutions support multi-channel formats and include:
Intelligent Self Service
The Convergys Intelligent Self-Service Solution is an integration of Intervoice Voice Portal (IVP) and Convergys Dynamic Decisioning Solution. This solution takes advantage of the power of speech and web-based standards, along with enterprise-wide policy management to enable contact centers to provide a more personalized and relevant experience for their customers, while also reducing costs and increasing revenue opportunities.
Next Generation Messaging
The Convergys Next Generation Messaging is an Internet Protocol (IP) based multimedia messaging solution that provides a suite of text, voice and web-based messaging capabilities. Its features include traditional voicemail, e-mail and facsimile, as well as text-to-speech reading and integrated multimedia messaging.
Proactive Service Solutions deliver personalized outbound notifications via the customer’s preferred method of contact. Another form of proactive service is identity verification that preempts potentially fraudulent transactions or activity. Our specific solutions are:
Intelligent Notification
The Convergys Intelligent Notification Solution is an integration of Advanced Notification Gateway and
4 Convergys Corporation 2009 Annual Report
Table of Contents
Convergys Dynamic Decisioning Solution technologies. This solution turns service strategy from reactive to proactive by delivering real-time notifications to customers via the channel of their choice. The result is greater customer satisfaction, increased revenue and lower operational costs.
On-Demand Voice Authentication
The Convergys On-Demand Voice Authentication Solution is a platform-independent solution that allows companies to easily enroll voice signatures of their customers and employees. Upon enrollment, companies can authenticate transactions more securely than with a traditional ID + PIN authentication. This solution enhances the level of security and protection of personal and confidential information for agent-assisted and self-service interactions and within the phone, interactive voice response (IVR), web and mobile device channels.
Assisted-Service Solutions provide intelligent contact routing and a multi-channel knowledge base to improve the efficiency of live-agent support.
eServices
Convergys eService Solution is an on-demand, web self-service and multi-channel knowledge management solution that complements company websites and agent desktops. eService contains robust web self-service capabilities as well as e-mail, chat and co-browse, all linked with a self-learning knowledge foundation to consistently provide the most relevant information. Live agent phone interactions are supported by the same knowledge foundation thus providing a seamless bridge between the self-service and agent-assisted experience.
Information Management
Information Management provides billing and business support system (BSS) solutions that help our clients configure and deploy mission-critical cost-effective technologies to better understand, sell to and serve their customers. These solutions comprise software, partner products, integration and business consulting services and a strong telecommunication heritage and operational expertise to enable service providers to meet their business goals.
The Information Management Smart Solution portfolio is organized into three functional areas: revenue management, product and order management, and customer care management.
Revenue Management Solutions
Smart Solutions for Revenue Management enable the creation of compelling service bundles to differentiate offers in the marketplace and provide real-time capabilities that enable revenue generation from all customer segments, regardless of payment type. Our Revenue Management solutions and software applications include:
Rating and Billing Manager
Rating and Billing Manager is a highly scalable, reliable and fully convergent real-time charging, rating and billing management system. It supports existing and next-generation services across multiple vertical markets. For the telecommunication market, the solution can be delivered with pre-integrated network control, real-time rating and charging, balance management, payment management, customer self-service and customer service representative (CSR) care. This solution allows service providers to offer and bill consistent product and service bundles, regardless of payment method (pre-/post-paid), from a single database.
Collections Manager
Collections Manager is an automated, in-house collections system that enables service providers to be the sole owners of all collected revenue. It provides out-of-the-box automation that reduces capital expenditures by eliminating custom development and enables faster time-to-market for new treatment schedules.
Convergys Corporation 2009 Annual Report 5
Table of Contents
Item 1. Business (continued)
Active Mediation
Active Mediation seamlessly bridges many protocols and/or data formats to meet convergent mediation business requirements. It is equally suitable for deployment in traditional batch environments and in next-generation networks that require a real-time, bi-directional dialog for end-to-end service delivery.
Infinys/ICOMS
The Infinys Integrated Communications Operations Management System (ICOMS) is designed specifically for the broadband convergent video, high-speed data and telephony markets. It provides an end-to-end billing and subscriber management solution tailored specifically to the demands of today’s converged cable television and broadband telephony service providers.
Product and Order Management Solutions
Smart Solutions for Product and Order Management enable service providers to better manage the increasing complexity associated with managing a growing product and service portfolio. These solutions help clients quickly respond to new market demands, allowing them to launch new segment-specific offers in alignment with their own pre-defined business and service rules. Our Product and Order Management solutions and software applications include:
Product Control Manager
Product Control Manager automates manual and disjointed product management practices, as well as multiple product catalogs, throughout an enterprise. It can coexist with existing product repositories, centralizing and normalizing data and processes.
Shopping and Ordering Solution
Shopping and Ordering Solution enables service providers to manage the complexities of the shopping and order capture process for convergent services.
Service Fulfillment Manager
Service Fulfillment Manager orchestrates and manages order-handling activities for all services. Highly flexible, it accepts product orders from a variety of sources – CSR graphical user interfaces, upstream customer relationship management (CRM) applications, enterprise application integration (EAI) interfaces or self-care portals – then tracks them through to order completion.
Service Activation Manager
Service Activation Manager provides fast, reliable services activation. It is an adaptor platform that activates any service on any network, for any underlying technology. It ensures a smooth hand-off from Service Fulfillment Manager or from any third-party system.
Customer Care Management Solutions
Smart Solutions for Customer Care Management enables service providers to deliver a superior customer experience. These solutions provide significant flexibility for service providers to deliver products and services through any channel the customer chooses and to find the optimal balance of CSR and self-service care to increase customer satisfaction, loyalty and profits. Our Customer Care Management solutions and software applications include:
Customer Service Manager
Customer Service Manager provides automated end-to-end order orchestration and sophisticated human factors engineering to meet and exceed subscriber, order and customer care needs.
Inventory Manager
Inventory Manager provides enterprise-wide functionality to ensure comprehensive, centralized insight into widespread logical and physical inventory items throughout the inventory lifecycle.
Field Service Manager
Field Service Manager enables service providers to predict service demand, then plan, schedule and execute service delivery in a way that maximizes value across their extended enterprise.
6 Convergys Corporation 2009 Annual Report
Table of Contents
Dynamic Decisioning and Customer Intelligence Solution
The Dynamic Decisioning and Customer Intelligence Solution enables service providers to add more personalization to each customer contact, and empower CSRs with real-time decision-making tools. Dynamic Decisioning software includes both a set of tools and a policy engine in order to enable the execution of real-time customer service policies and proactive upsell offers that increase customer retention.
HR Management
Our HR Management segment partners with global HR clients to drive more value from employee relationships, fostering greater organizational effectiveness and lowering costs.
Convergys utilizes best business practices rooted in outsourced HR solutions to help clients automate HR processes and improve service delivery. The result is a greater level of workforce insight that enables our clients to make better decisions and better manage global talent as a strategic asset.
Convergys HR Solutions include the following:
Benefits Administration Solutions
Benefits Administration Solutions manages the complexities of benefits administration, which enables us to predict benefit expenses and provide clients the business intelligence they need to improve benefit-related processes, services and costs. Our service delivery model combines self-service tools and multilingual service centers to provide services to employees, including health and welfare administration services, retirement services and pension administration, absence management, flexible spending account administration, carrier administration and tuition reimbursement.
Compensation Solutions
Compensation Solutions help companies improve the clarity and parity of their global compensation plans while assuming global administration to lower overall costs and deliver key analytics. By aligning global compensation with other key HR processes, Convergys can help improve employee understanding of compensation strategies resulting in increased employee engagement.
Human Resource Administration Solutions
Human Resource Administration Solutions help organizations transform the task of managing global employee paperwork and data into a harmonized, automated and highly efficient process. Our solution incorporates process improvements and technology innovations to streamline global HR Administration.
Learning Solutions
Learning Solutions help companies manage the employee life cycle to get more from the talent that they have and develop the talent that they need. By outsourcing select learning functions such as administration, operations and content development and sourcing to us, companies gain better return on investment.
Performance Management Solutions
Convergys Performance Management Solution aligns employee performance with corporate objectives, getting everyone focused on the work that is most critical to an organization’s success. The solutions also drive business results by closing performance gaps and measuring behavior against goals.
Payroll Administration Solution
Payroll Administration Solutions range from end-to-end payroll outsourcing to targeted process management for each point between employee time entry and payroll check production. We can manage the complexities of global payroll, including controls for accuracy and compliance to local regulations.
Recruiting and Resourcing Solution
The global Recruiting and Resourcing Solution can free HR departments from the administrative aspects of finding, hiring and on-boarding employees so that they
Convergys Corporation 2009 Annual Report 7
Table of Contents
Item 1. Business (continued)
can focus on higher-value activities such as staffing strategies and hiring decisions.
Workforce Intelligence Solution
Workforce Intelligence Solutions turn HR information into business insight. Our solutions give our clients the business intelligence it needs to make better decisions and better manage the global workforce.
Strategy
Our strategy is to enable our clients to gain more value from their relationships with their customers and employees. We do this by providing clients comprehensive relationship management solutions (including software, hardware, services and consulting). The value we create drives improved business performance and a sustainable competitive advantage for our clients. Key elements of our strategy include:
Deliver a Differentiated Value Proposition to Clients. As a global leader in relationship management, Convergys provides solutions that drive more value from the relationships our clients have with both their customers and their employees. Convergys turns these everyday interactions into a source of profit and strategic advantage for our clients. Our differentiated solution set includes Customer Solutions, BSS Solutions, HR Solutions and industry-specific solutions. Our Customer Solutions deliver support using live-agents staffed around the world, self-service technology (speech, IVR, web and e-mail) that intelligently automates the handling of interactions, analytics for real-time decisioning and deep customer management process expertise. In addition, we offer a variety of delivery models for our Customer Solutions including outsourced (on-shore, off-shore or home agent) and hosted (on-premise or off-premise). Our BSS solutions address the critical customer care, billing (including real-time rating and charging) and product-related issues that face the communications industry specific to managing customer relationships, revenue management and enterprise product management. Our HR Solutions deliver greater organizational effectiveness through comprehensive HR BPO and integrated talent management strategies. We serve a host of industries with concentration in the telecommunications, technology, financial services, healthcare, government and retail verticals.
Invest in Our Business to Expand our Addressable Markets and Strengthen our Solutions: Our growth strategy is to continue to broaden and deepen our offer portfolio to provide our clients with comprehensive solutions. We will invest in the business as required (e.g., to acquire new capabilities, to expand into new global locations and to employ new personnel with desired talent) to expand our addressable markets. We continue to identify and operate in attractive markets where we can effectively provide differentiated value and deliver superior returns. We intend to expand our capabilities, technology, partners, workforce and operations globally to continually strengthen our ability to successfully serve and satisfy the demands of our multinational clients. We will invest in research and development to deliver unique and innovative solutions.
Expand Our Relationships with Existing Clients. We focus on client satisfaction to maintain and grow our base business. Our intent is to grow by cross-selling new solutions and expanding our relationship management footprint within our client’s organization. Our client renewal rates are very high, reflecting a high degree of satisfaction and stability in our client base.
Aggressively Grow Our Client Base. We believe that the global market for relationship management solutions is large and underserved, and we intend to aggressively pursue this market opportunity. We emphasize a consultative selling approach leveraging our expertise in four critical areas, (1) business and customer strategy development, (2) business and customer analytics, (3) technology enablement, and (4) operational excellence to deliver superior operating performance and further strengthen our leadership by cross-selling other services.
Sustain Our High-Performance Culture to Drive Business Results. We believe that people drive performance and we
8 Convergys Corporation 2009 Annual Report
Table of Contents
are committed to hiring and retaining the best performers worldwide and ensuring that they are committed to the success of our clients. Our competencies include our proven strength in recruiting, training, equipping, deploying and effectively managing very large groups of people with diverse skills on a global basis (people), expertise in operations and cost-effective service delivery (process), and design, development and delivery of innovative, scalable transactions and interaction applications (technology). We adhere to the principles of strategic HR, including emphasizing collaboration, goal alignment, pay for performance, continuous improvement and focus on accountability and results. We believe this approach drives superior execution, enabling us to consistently deliver significant value to our customers.
Clients
Both our Customer Management and Information Management segments derive significant revenues from AT&T Inc. (AT&T), our largest client. Revenues from AT&T were 19.8%, 18.2% and 16.3% of our consolidated revenues for 2009, 2008 and 2007, respectively.
Customer Management
Our Customer Management segment principally focuses on developing long-term strategic outsourcing relationships with large companies in customer-intensive industries and governmental agencies. We focus on these types of clients because of the complexity of services required, the anticipated growth of their market segments and their increasing need for more cost-effective customer management services. In terms of Convergys’ revenues, our largest Customer Management clients during 2009 were AT&T, Comcast Corporation (Comcast), the DirecTV Group, Inc. (DirecTV), General Motors Corporation and Sprint Nextel Corporation (Sprint Nextel). We provide customer management services to Sprint Nextel as a subcontractor to International Business Machines (IBM).
Information Management
Our Information Management segment serves clients principally by providing and managing complex BSS services that address all segments of the communications industry. In terms of Convergys’ revenues, our largest Information Management clients during 2009 were AT&T, Cincinnati Bell, Inc., MetroPCS Communications, Inc., PT Telkomunikasi Seluar (Telkomsel) and Time Warner, Inc.
HR Management
Our HR Management segment primarily focuses on providing HR outsourcing solutions for large companies and governmental agencies. In terms of Convergys’ revenues, our largest HR Management clients during 2009 were Boston Scientific Corporation, E.I. du Pont de Nemours & Co. (DuPont), the State of Florida, Johnson & Johnson and the State of Texas.
Operations
We operate over 80 contact centers averaging approximately 65,000 square feet per center, with approximately 45,000 production workstations with 24 hours a day, 365 days a year availability. Our contact centers are located in various parts of the world including the United States, the Philippines, India, Canada, the U.K. and Costa Rica. New contact centers are established to accommodate anticipated growth in business or in response to a specific customer need. We continue to add contact center capacity in the Philippines and Latin America to accommodate client needs.
Our contact centers employ a broad range of technology including digital switching, intelligent call routing and tracking, proprietary workforce management systems, case management tools, proprietary software systems, computer telephony integration, interactive voice response, advanced speech recognition, web-based tools and relational database management systems. This technology enables us to improve our call, web and e-mail handling and personnel scheduling, thereby increasing our efficiency and enhancing the quality of the services we deliver to our clients and their customers and employees. With this technology, we are able to respond to changes in client call volumes and move call volume traffic based on agent availability. Additionally, we use this technology to collect information concerning the contacts, including number, response time, duration and results of the
Convergys Corporation 2009 Annual Report 9
Table of Contents
Item 1. Business (continued)
contact. This information is reported to the client on a periodic basis for purposes of monitoring quality of service and accuracy of the related billing.
We operate two primary data centers, one in Orlando, Florida, and the other in Cincinnati, Ohio, comprising, in total, approximately 170,000 square feet of space. Our technologically advanced data centers provide 24 hours a day, 365 days a year availability (with redundant power and communication feeds and emergency power back-up) and are designed to withstand most natural disasters.
The capacity of our data center and contact center operations, coupled with the scalability of our BSS and customer management solutions, enable us to meet initial and ongoing needs of large-scale and rapidly growing companies and government entities. By employing the scale and efficiencies of common application platforms, we are able to provide client-specific enhancements and modifications without incurring many of the costs of a full custom application. This allows us to be in a position to be a value-added provider of billing, customer and employee support products and services.
Technology, Research and Development
We intend to continue to emphasize the design, development and deployment of scalable billing and customer management systems to increase our market share, both domestically and internationally. During 2009, 2008 and 2007, we spent $74.2 million, $54.9 million and $73.4 million, respectively, for research and development to advance the functionality, flexibility and scalability of our products and services. The majority of this spending has been incurred in Information Management and reflects our commitment to further develop our solutions. We are being selective in our approach to research and development spending, focusing our efforts on only what we consider the highest impact areas. The success of our Customer Management segment depends, in part, on our advanced technology used in the delivery of services to clients. As a result, we continue to invest in the enhancement and development of our contact center technology.
Our intellectual property consists primarily of business methods and software systems. To protect our proprietary rights, we rely primarily on a combination of U.S. and foreign copyright, trade secret and trademark laws, confidentiality agreements with employees and third parties and protective contractual provisions such as those contained in licenses and other agreements with consultants, suppliers, strategic partners and clients.
We own 179 patents, 161 of which relate to Customer Management and HR Management and 18 of which relate to Information Management. Patents protect our technology and business methods that we use both to manage our internal systems and processes effectively and give us competitive advantages in developing innovative technologies to provide customer management, HR management and billing services to our clients. The first of these patents was issued in January 1993, while the most recent patent was granted in November 2009. These patents generally have a life of 17 years, although the life for some patents issued before June 8, 1995 can extend to approximately 20 years in certain instances. Additional applications for U.S. and foreign patents currently are pending.
Our name and logo and the names of our primary software products are protected by their historic use and by trademarks and service marks that are registered or pending in the U.S. Patent and Trademark Office and under the laws of more than 50 foreign countries.
Employees
As of December 31, 2009, we employed approximately 70,000 people, approximately 63,000 of whom work for Customer Management, approximately 3,000 of whom work for Information Management, approximately 3,000 of whom work for HR Management, with the remainder working in various corporate functions.
10 Convergys Corporation 2009 Annual Report
Table of Contents
Items 1. (continued), 1A., 1B. and 2.
Competition
The industries in which we operate are extremely competitive. Our competitors include: (i) other customer management companies, such as Accenture Ltd. (Accenture), APAC Customer Services Inc., IBM, SITEL Corp., Sykes Enterprises Inc., Teleperformance, TeleTech Holdings Inc., West Corporation and Wipro Ltd.; (ii) other HR management companies, such as Accenture, Affiliated Computer Services Inc., ExcellerateHRO, Hewitt Associates Inc., IBM and Tata Consultancy Services; and (iii) other BSS services companies such as Amdocs Ltd., Comverse Technology Inc., CSG Systems International Inc. and Intec Telecom Systems. In addition, niche providers or new entrants could capture a segment of the market by developing new systems or services that could impact our market potential.
Interests in Cellular Partnerships
The Company owns a 33.8% limited partnership interest in the Cincinnati SMSA Limited Partnership, a provider of wireless communications in central and southwestern Ohio and northern Kentucky, and a 45.0% interest in the Cincinnati SMSA Tower Holdings LLC, an operator of cellular tower space (the Cellular Partnerships). We account for our interests in the Cellular Partnerships under the equity method of accounting. Refer to Note 2 of the Notes to Consolidated Financial Statements for more details related to these partnerships.
The information required by Item 1A is included in Item 7 of this Form 10-K.
Item 1B. Unresolved Staff Comments
None.
Our principal executive offices are located at 201 East Fourth Street, Cincinnati, Ohio 45202, and the telephone number at that address is (513) 723-7000. We own our corporate headquarters facility in Cincinnati, Ohio, which is used by the three segments, an office complex in Jacksonville, Florida, which is used predominantly by Customer Management and HR Management, and an office facility in Dallas, Texas, which is used by Customer Management.
We lease space for offices, data centers and contact centers on commercially reasonable terms. Domestic facilities are located in Arizona, California, Colorado, Florida, Georgia, Idaho, Kansas, Kentucky, Louisiana, Missouri, Nebraska, New Mexico, North Carolina, Ohio, Oklahoma, Tennessee, Texas, Utah, Virginia and Wisconsin. International facilities are located in Australia, Brazil, Canada, China, Colombia, Costa Rica, Egypt, England, France, Germany, Hong Kong, Hungary, India, Indonesia, Israel, Malaysia, Mexico, Netherlands, the Philippines, Scotland, Singapore, Spain, Sri Lanka, Taiwan, Thailand and the United Arab Emirates. Customer Management and HR Management use the majority of these facilities. Upon the expiration or termination of any such leases, we believe we could obtain comparable office space. As discussed more fully in Note 12 of Notes to Consolidated Financial Statements, we lease an office complex in Orlando, Florida under an agreement that expires June 2010. Upon termination or expiration, we must either purchase the property from the lessor for $65.0 million or arrange to have the office complex sold to a third party. We are in the process of evaluating whether to purchase or refinance this property.
We also lease some of the computer hardware, computer software and office equipment necessary to conduct our business. In addition, we own computer, communications equipment, software and leasehold improvements. We depreciate these assets using the straight-line method over the estimated useful lives of the assets. Leasehold improvements are depreciated over the shorter of their estimated useful life or the term of the associated lease.
We believe that our facilities and equipment are adequate and have sufficient productive capacity to meet our current needs.
Convergys Corporation 2009 Annual Report 11
Table of Contents
Item 3. and 4.
The information required by Item 3 is included in Note 12 of the Notes to Consolidated Financial Statements of this Form 10-K.
Item 4. Submission of Matters to a Vote of the Security Holders
There were no matters submitted to a vote of security holders during the fourth quarter of 2009.
12 Convergys Corporation 2009 Annual Report
Table of Contents
Executive Officers of the Registrant
The following information responds to the provisions of Part III, Item 10.
As of February 26, 2010, our Executive Officers were:
| Name | Age | Title | ||
| Jeffrey H. Fox (a) | 47 | President and Chief Executive Officer | ||
| Earl C. Shanks | 53 | Chief Financial Officer | ||
| Karen R. Bowman | 46 | Senior Vice President, General Counsel and Corporate Secretary | ||
| Clark D. Handy | 53 | Senior Vice President, Human Resources | ||
| Andre S. Valentine | 46 | Senior Vice President, Finance and Controller | ||
| Andrea J. Ayers | 46 | President, Customer Management | ||
| Michael J. Betzer | 48 | Senior Vice President, Relationship Technology Management | ||
| James P. Boyce | 52 | President, Global Sales and Services | ||
| John B. Gibson | 43 | President, HR Management | ||
| Robert A. Lento | 48 | President, Global Information Management | ||
| (a)Member of the Board of Directors.
| ||||
Officers are appointed annually, but are removable at the discretion of the Board of Directors.
JEFFREY H. FOX, President and Chief Executive Officer since February 9, 2010; Principal, The Circumference Group, LLC, since 2009; Chief Executive Officer, The Circumference Group, LLC, 2009-2010; Chief Operating Officer, Alltel Corporation, 2007–2008; Group President – Shared Service, Alltel Corporation, 2003–2007.
EARL C. SHANKS, Chief Financial Officer since November 13, 2003.
KAREN R. BOWMAN, Senior Vice President, General Counsel and Corporate Secretary since September 1, 2007; President, HR Management, 1999–2007.
CLARK D. HANDY, Senior Vice President, Human Resources since December 11, 2006; Executive Vice President, Human Resources of Teleflex, Inc., 2003–2006.
ANDRE S. VALENTINE, Senior Vice President, Finance and Controller since December 7, 2009; Senior Vice President Group Finance, Customer Management, 2002–2009.
ANDREA J. AYERS, President, Customer Management since April 1, 2008; President, Relationship Technology Management, 2007–2008; President, Government and New Markets, 2005–2007.
MICHAEL J. BETZER, Senior Vice President, Relationship Technology Management since May 1, 2008; Vice President, CRM Siebel/Oracle, 2004–2008.
JAMES P. BOYCE, President, Global Sales and Services since January 1, 2009; President, North America Business Units, 2008; President, Communications, Technology, Media, Entertainment and Canada Groups, 2007; President, AT&T Group, 2005–2006.
JOHN B. GIBSON, President, HR Management since September 1, 2007; Senior Vice President, HR Management Client Services, 2007; Senior Vice President, HR Management Global Operations, 2005–2007.
ROBERT A. LENTO, President, Global Information Management since January 1, 2009; President, Information Management, 2007–2008; President, Communications, Technology, Automotive Group, 2003–2007.
Convergys Corporation 2009 Annual Report 13
Table of Contents
PART II
Item 5. Market for the Registrant’s Common Equity, Related
Stockholder Matters and Issuer Purchases of Equity Securities
Convergys Corporation’s shares of common stock, no par value, are listed on the New York Stock Exchange under the symbol “CVG.” As of January 31, 2010, there were 10,315 holders of record of the 123,170,011 common shares of Convergys, excluding amounts held in Treasury (183,333,849 outstanding common shares of Convergys, of which 60,163,838 were held in Treasury).
The high, low and closing prices of our common shares for each quarter in 2009 and 2008 are listed below:
| Quarter | 1st | 2nd | 3rd | 4th | ||||||||
| 2009 | ||||||||||||
| High | $ | 9.05 | $ | 10.66 | $ | 11.51 | $ | 11.97 | ||||
| Low | $ | 5.49 | $ | 7.91 | $ | 8.26 | $ | 9.35 | ||||
| Close | $ | 8.08 | $ | 9.28 | $ | 9.94 | $ | 10.75 | ||||
| 2008 | ||||||||||||
| High | $ | 16.60 | $ | 16.75 | $ | 16.99 | $ | 14.93 | ||||
| Low | $ | 13.66 | $ | 14.62 | $ | 11.77 | $ | 4.02 | ||||
| Close | $ | 15.06 | $ | 14.86 | $ | 14.78 | $ | 6.41 | ||||
We have not paid any cash dividends on our common stock. Our Board of Directors re-evaluates this policy periodically. There is no current anticipation of paying cash dividends in the future.
We did not repurchase any shares of Convergys common stock during 2009 and purchased 7.7 million shares for $116.6 during 2008. At December 31, 2009, the Company has the authority to purchase an additional 7.1 million common shares. The timing and terms of any future transactions depend on a number of considerations including market conditions and our liquidity.
14 Convergys Corporation 2009 Annual Report
Table of Contents
Performance Graph
The following Performance Graph compares, for the period from December 31, 2004 through December 31, 2009, the percentage change of the cumulative total shareholder return on the Company’s shares of common stock with the cumulative total return of the S&P 500 Stock Index and the Peer Group Index, based on an initial investment of $100 on December 31, 2004, with dividends reinvested.
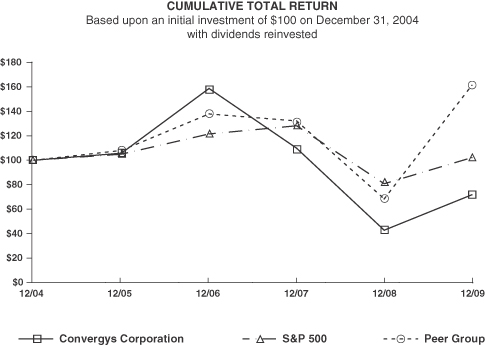
| Dec-04 | Dec-05 | Dec-06 | Dec-07 | Dec-08 | Dec-09 | |||||||
| Convergys Corp. | 100.00 | 105.74 | 158.64 | 109.81 | 42.76 | 71.71 | ||||||
| S&P 500® | 100.00 | 104.91 | 121.48 | 128.16 | 80.74 | 102.11 | ||||||
| Peer Group Index | 100.00 | 107.97 | 137.85 | 132.11 | 68.39 | 161.21 | ||||||
The Peer Group Index consists of Affiliated Computer Services Inc, Amdocs Limited, APAC Customer Services Inc, Comverse Technology Inc, CSG Systems International Inc, Hewitt Associates Inc, ICT Group Inc, Intec Telecom Systems PLC, Sykes Enterprises Inc, Tata Consultancy Services Limited, Teleperformance, Teletech Holdings Inc and Wipro Limited.
Copyright© 2010 Standard & Poor’s, a division of The McGraw-Hill Companies Inc. All rights reserved.
Convergys Corporation 2009 Annual Report 15
Table of Contents
Item 6. Selected Financial Data
| (Amounts in Millions Except Per Share Amounts) | 2009 | 2008 | 2007 | 2006 | 2005 | |||||||||||||||
| Results of Operations | ||||||||||||||||||||
| Revenues (1) | $ | 2,827.2 | $ | 2,785.8 | $ | 2,844.3 | $ | 2,789.8 | $ | 2,582.1 | ||||||||||
| Costs and expenses (2) (3) | 2,940.0 | 2,977.1 | 2,599.5 | 2,536.9 | 2,358.5 | |||||||||||||||
| Operating (loss) income | (112.8 | ) | (191.3 | ) | 244.8 | 252.9 | 223.6 | |||||||||||||
| Equity in earnings of Cellular Partnerships | 41.0 | 35.7 | 14.3 | 11.8 | 12.4 | |||||||||||||||
| Other income (expense), net | (16.9 | ) | 14.3 | 4.0 | 2.7 | (1.4 | ) | |||||||||||||
| Interest expense | (28.9 | ) | (22.6 | ) | (17.5 | ) | (22.8 | ) | (21.2 | ) | ||||||||||
| (Loss) income before income taxes | (117.6 | ) | (163.9 | ) | 245.6 | 244.6 | 213.4 | |||||||||||||
| Income tax (benefit) expense | (40.3 | ) | (71.0 | ) | 76.1 | 78.4 | 90.8 | |||||||||||||
| Net (loss) income | $ | (77.3 | ) | $ | (92.9 | ) | $ | 169.5 | $ | 166.2 | $ | 122.6 | ||||||||
| (Loss) earnings per share: | ||||||||||||||||||||
| Basic |
$ | (0.63 | ) | $ | (0.75 | ) | $ | 1.26 | $ | 1.20 | $ | 0.88 | ||||||||
| Diluted |
$ | (0.63 | ) | $ | (0.75 | ) | $ | 1.23 | $ | 1.17 | $ | 0.86 | ||||||||
| Weighted average common shares outstanding: | ||||||||||||||||||||
| Basic (4) |
122.8 | 123.5 | 134.1 | 138.4 | 140.0 | |||||||||||||||
| Diluted (4) |
122.8 | 123.5 | 137.7 | 141.7 | 142.9 | |||||||||||||||
| Financial Position | ||||||||||||||||||||
| Total assets | $ | 2,613.6 | $ | 2,841.4 | $ | 2,564.2 | $ | 2,540.3 | $ | 2,411.4 | ||||||||||
| Total debt | 469.6 | 665.9 | 259.9 | 343.5 | 432.2 | |||||||||||||||
| Shareholders’ equity | 1,206.4 | 1,150.1 | 1,521.7 | 1,455.1 | 1,355.1 | |||||||||||||||
| Other Data | ||||||||||||||||||||
| Cash provided (used) by: | ||||||||||||||||||||
| Operating activities |
$ | 264.7 | $ | 192.3 | $ | 209.9 | $ | 353.4 | $ | 232.7 | ||||||||||
| Investing activities |
(38.0 | ) | (365.1 | ) | (74.8 | ) | (127.5 | ) | (138.3 | ) | ||||||||||
| Financing activities |
(135.0 | ) | 292.5 | (250.7 | ) | (186.0 | ) | 43.2 | ||||||||||||
| Free cash flow (5) | 189.8 | 100.2 | 108.6 | 256.9 | 206.8 | |||||||||||||||
| (1) | In 2009, we recognized $122.3 of previously deferred implementation revenue resulting from the agreements reached to eliminate future implementation obligations and liabilities for services not yet operational for two large HR Management contracts. See Note 7 of the Notes to Consolidated Financial Statements in this Form 10-K for additional details. |
| (2) | This includes restructuring charges of $47.0, $34.4, $3.4, $12.5 and $21.2 recorded during 2009, 2008, 2007, 2006 and 2005, respectively. |
| (3) | In 2009 and 2008, we incurred $369.2 and $334.0 of implementation-related, settlement and impairment charges, respectively. The 2009 charge of $369.2 includes (a) $255.6 recorded within the cost of providing services and products sold caption representing the expensing of implementation and settlement costs related to two HR Management contracts and (b) $113.6 for impairment of certain long-lived assets. The 2008 charge of $334.0 consists of (a) $65.4 recorded within the cost of providing services and products sold caption, related to excess implementation costs that were expensed rather than capitalized related to two HR Management contracts in accordance with the Company’s accounting policy and (b) $268.6 for impairment of certain long-lived assets including goodwill related to HR Management. |
| (4) | Basic and diluted common shares outstanding at December 31, 2009 were 123.1. |
| (5) | Free cash flow is not defined under accounting principles generally accepted in United States and is calculated as cash flows from operations excluding the impact of the accounts receivable securitization less capital expenditures (net of proceeds from disposal). The Company uses free cash flow to assess the financial performance of the Company. Convergys’ Management believes that free cash flow is useful to investors because it relates the operating cash flow of the Company to the capital that is spent to continue and improve business operations, such as investment in the Company’s existing businesses. Further, free cash flow facilitates Management’s ability to strengthen the Company’s balance sheet, to repay the Company’s debt obligations and to repurchase the Company’s common shares. Limitations associated with the use of free cash flow include that it does not represent the residual cash flow available for discretionary expenditures as it does not incorporate certain cash payments including payments made on capital lease obligations or cash payments for business acquisitions. Management compensates for these limitations by using both the non-GAAP measure, free cash flow, and the GAAP measure, cash from operating activities, in its evaluation of performance. There are no material purposes for which we use this non-GAAP measure beyond the purposes described above. For more detail and a reconciliation of cash flows from operations to free cash flows, see the “Financial Condition, Liquidity and Capital Resources” section in Part 1, Item 7 of this report. |
16 Convergys Corporation 2009 Annual Report
Table of Contents
Item 7. Management’s Discussion and Analysis
of Financial Condition and Results of Operations
(Amounts in Millions Except Per Share Amounts)
The following information should be read in conjunction with our Consolidated Financial Statements and related notes, included elsewhere in this Annual Report on Form 10-K. In addition to historical information, this discussion and analysis may contain forward-looking statements that involve risks, uncertainties and assumptions, which could cause actual results to differ materially from management’s expectations. Please see additional risks and uncertainties described above in the “Safe Harbor Cautionary Statement,” which appears at the beginning of this report and in Part 1, Item 1A. “Risk Factors.”
Overview
Customer Management
Our Customer Management segment, which accounted for approximately 70% of our consolidated revenues in 2009, partners with clients to deliver customer care solutions that enhance the value of their customer relationships, turning the customer experience into a strategic differentiator. As an end-to-end single-source provider of self-service, agent-assisted and proactive care solutions, we combine consulting, innovative technology and agent-assisted services to optimize the customer experience and strengthen customer relationships. Whether contact center operations are on-premises, fully outsourced or blended, we customize our solutions to meet our clients’ needs.
On September 3, 2008, we acquired 100 percent of the outstanding common shares of Intervoice, Inc. (Intervoice), a developer of automated voice response systems, for cash consideration of $338.8. Intervoice is a market leader in the delivery of personalized, multi-channel automated information solutions that connect people with information, empowering them to control the way they interact with a business. Integration of Intervoice’s speech automation and mobile applications with the Company’s agent-assisted services has enabled us to build upon our leadership position in relationship management solutions. Our solutions result in improved operational efficiencies, new revenue streams and, most importantly, enhanced differentiation in the large and growing automated services market. The operating results of Intervoice have been included within the Customer Management segment from the date of the acquisition.
As more fully described under the heading, “Customer Management,” Customer Management revenue increased 2% from the prior year to $1,986.7. Intervoice revenues were $166.3 and $63.3 for 2009 and 2008, respectively. Customer Management 2009 operating income and operating margin were $133.9 and 6.7%, respectively, compared to $92.6 and 4.7% in 2008. The positive gross margin impact from the Intervoice acquisition and operating efficiency improvements within the live-agent business was partially offset by investments in sales and relationship technology resources. Results for 2009 and 2008 also include restructuring charges of $7.9 and $14.0, respectively, to streamline operations.
Information Management
Our Information Management segment serves clients principally by providing and managing complex business support system (BSS) solutions.
In 2009, Information Management accounted for 15% of our consolidated revenues. License and related support and maintenance fees, which accounted for 37% of Information Management revenues for 2009, are earned under perpetual and term license arrangements. Professional and consulting services for installation, implementation, customization, migration, training and managed services accounted for 37% and data processing services accounted for 26% of Information Management revenues in 2009. As more fully described below under the heading “Information Management,” during 2009, Information Management revenue was $434.3, a 24% decline compared to the same period last year due to the negative impact of North American client migrations as well as international project completions partially offset by revenues from new clients. Information Management operating income and operating margin for 2009 were $21.9 and 5.0%, respectively, compared with $96.4 and 16.9%, respectively, in the prior year period. The decline in operating income during 2009 was due to the decline in
Convergys Corporation 2009 Annual Report 17
Table of Contents
Item 7. Management’s Discussion and Analysis
of Financial Condition and Results of Operations (continued)
(Amounts in Millions Except Per Share Amounts)
revenues as well as restructuring charges of $30.4 compared to $9.7 in 2008.
Information Management continues to face competition as well as consolidation within the communications industry. AT&T, our largest client, has substantially migrated its subscribers from the legacy wireless billing system that we supported through a managed services agreement onto AT&T’s other wireless billing system. In addition, AT&T acquired several other Convergys clients that also migrated to this other billing system. The loss of revenue resulting from the AT&T related migrations was approximately $30 in 2009 compared to our 2008 Information Management revenues. This migration was substantially completed by December 31, 2009. We expect revenue loss resulting from the AT&T related migrations to be approximately $40 in 2010 compared to our 2009 Information Management revenues.
In September 2005, Sprint PCS, a large data processing outsourcing client, completed its acquisition of Nextel Communications. In 2006, Sprint Nextel informed us that it intended to consolidate its billing systems onto a competitor’s system. The migration began in 2006 and was fully completed by December 31, 2009. Revenues from Sprint Nextel were down approximately $50 in 2009 compared to the prior year. We expect revenue from Sprint Nextel to be down by approximately $10 in 2010 compared to our 2009 Information Management revenues.
The impact of these client migrations is included in our 2010 guidance detailed in the “Business Outlook” section.
HR Management
Our HR Management segment provides a full range of HR outsourcing solutions including benefits administration, compensation, HR administration, learning, payroll administration, performance management, recruiting and sourcing services to large companies and governmental entities. We standardize HR processes across departments, business lines, language differences and national borders.
HR Management accounted for 15% of our consolidated revenues in 2009 and increased 57% to $406.2 from the prior year. This increase includes accelerated recognition of deferred implementation revenue of $122.3 in 2009 related to two large HR Management contracts. HR Management operating loss for 2009 was $246.1 compared to a loss of $358.8 in the prior year. In addition to the $122.3 of implementation revenue described above, operating results include implementation-related, settlement and impairment charges of $366.1 and $334.0 in 2009 and 2008, respectively. These charges were primarily driven by two large HR Management contracts. The Company restructured both of those large HR Management contracts during 2009 to eliminate future implementation obligations related to services not operational to continue providing services already operational. As a result, all of the capitalized implementation costs related to these contracts were written-off and a portion of implementation revenue, as referenced above, was recognized. Completing the contract restructurings has stabilized the HR Management business and has eliminated the future implementation risk on services not yet operational.
We have undertaken a series of actions intended to improve the future earnings in HR Management. Actions include not signing any new HR Management outsourcing business with significant implementation risk, streamlining existing operations by continuing to use additional automation, standardization and leveraging of off-shore labor, and using partners to implement projects.
18 Convergys Corporation 2009 Annual Report
Table of Contents
Results of Operations
Consolidated Results
| 2009 | 2008 | % Change 09 vs. 08 |
2007 | % Change 08 vs. 07 |
||||||||||||||
| Revenues | $ | 2,827.2 | $ | 2,785.8 | 1 | $ | 2,844.3 | (2 | ) | |||||||||
| Costs and Expenses: | ||||||||||||||||||
| Cost of providing services and products sold (1) | 1,925.8 | 1,892.9 | 2 | 1,837.9 | 3 | |||||||||||||
| Selling, general and administrative expenses | 648.8 | 593.8 | 9 | 554.9 | 7 | |||||||||||||
| Research and development costs |
74.2 | 54.9 | 35 | 73.4 | (25 | ) | ||||||||||||
| Depreciation | 118.9 | 119.0 | — | 115.4 | 3 | |||||||||||||
| Amortization | 11.7 | 13.5 | (13 | ) | 9.0 | 50 | ||||||||||||
| Restructuring charges | 47.0 | 34.4 | 37 | 3.4 | — | |||||||||||||
| Asset impairment | 113.6 | 268.6 | (58 | ) | 5.5 | — | ||||||||||||
| Total costs and expenses |
2,940.0 | 2,977.1 | (1 | ) | 2,599.5 | 15 | ||||||||||||
| Operating (Loss) Income | (112.8 | ) | (191.3 | ) | (41 | ) | 244.8 | — | ||||||||||
| Equity in earnings of Cellular Partnerships | 41.0 | 35.7 | 15 | 14.3 | — | |||||||||||||
| Other income (expense), net | (16.9 | ) | 14.3 | — | 4.0 | — | ||||||||||||
| Interest expense | (28.9 | ) | (22.6 | ) | 28 | (17.5 | ) | 29 | ||||||||||
| (Loss) Income Before Income Taxes | (117.6 | ) | (163.9 | ) | (28 | ) | 245.6 | — | ||||||||||
| Income tax (benefit) expense | (40.3 | ) | (71.0 | ) | (43 | ) | 76.1 | — | ||||||||||
| Net (Loss) Income | $ | (77.3 | ) | $ | (92.9 | ) | (17 | ) | $ | 169.5 | — | |||||||
| Diluted (Loss) Earnings Per Common Share | $ | (0.63 | ) | $ | (0.75 | ) | (16 | ) | $ | 1.23 | — | |||||||
| (1) | Exclusive of depreciation and amortization, with the exception of amortization of deferred charges as disclosed in Note 7 of Notes to Consolidated Financial Statements. |
2009 vs. 2008
Consolidated revenues for 2009 were $2,827.2, up 1% compared to $2,785.8 in the prior year. Growth in revenues from HR Management and Customer Management was partially offset by revenue declines at Information Management. As described more fully under the “HR Management” section below, revenue for 2009 includes $122.3 of previously deferred implementation revenue related to two large HR Management contracts. Customer Management revenues for 2009 and 2008 include $166.3 and $63.3, respectively, from the Intervoice acquisition that closed on September 3, 2008.
Operating loss for 2009 was $112.8 compared to an operating loss of $191.3 in the prior year. As described more fully under the “HR Management” section, the operating results for 2009 include the impact of the $122.3 of HR Management related implementation revenue and the impact of implementation-related, settlement and impairment charges in 2009 and 2008 of $366.1 and $334.0, respectively. The implementation-related, settlement and impairment charges noted above that were recorded both during 2009 and 2008 were primarily driven by two large HR Management contracts. Operating results for 2009 and 2008 also include restructuring charges of $47.0 and $34.4, respectively to streamline operations across the businesses. Excluding the impact of items discussed above, operating income increased slightly in 2009 compared to the prior year.
As a percentage of revenues, the cost of providing services and products sold was 68.1%, compared to 67.9% in the prior year. Decreases in the cost of providing services and products sold as a percentage of revenues both at Customer Management and Information Management were offset by increases at HR Management. The increase in cost of providing services and products sold at HR Management was due to the implementation-related and settlement charges of $255.6 and $65.4 recorded during 2009 and 2008, respectively as described under the “HR Management” section. Selling, general and administrative expenses of $648.8 increased 9% compared to the prior year. The increase was due to higher selling, general and administrative expenses at Customer Management, reflecting higher sales and marketing costs to service the expanded client base and extensive global channel partnerships obtained through the Intervoice acquisition.
Convergys Corporation 2009 Annual Report 19
Table of Contents
Item 7. Management’s Discussion and Analysis
of Financial Condition and Results of Operations (continued)
(Amounts in Millions Except Per Share Amounts)
As a percentage of revenues, selling, general and administrative expenses were 22.9% compared to 21.3% in the prior year. The 35% increase in research and development costs largely reflects our investments in the automated self-care and technology solutions related to the acquired Intervoice platforms.
As discussed more fully under the heading “Restructuring Charges,” we recorded restructuring charges of $47.0 in 2009 versus $34.4 in 2008, largely to streamline operations across the business. In 2009, we recorded equity income in the Cellular Partnerships of $41.0 compared to $35.7 recorded in 2008. Interest expense of $28.9 increased from $22.6 in the prior year reflecting a higher level of debt outstanding during the course of the year. The $16.9 other expense, net was due to higher foreign exchange transaction losses and a $2.3 loss on extinguishment of debt. The prior year income of $14.3 was the result of foreign exchange transaction gains and a $6.0 gain from the termination of treasury lock derivative instruments discussed in more detail in Note 13 of the Notes to Consolidated Financial Statements. The foreign exchange transaction gains and losses arise from transactions denominated in a currency other than the functional currency. As discussed in further detail in the section titled “Market Risk,” we periodically enter into forward exchange contracts to protect the Company against these foreign currency exposures. The gains and losses from these forward exchange contracts are reported within the other income (expense), net caption in the consolidated results of operations. Our effective tax benefit rate was 34.3% for 2009 compared to an effective tax benefit rate of 43.3% in the prior year. The lower tax benefit rate for 2009 is due primarily to the 2009 change of the reinvestment assertion related to certain foreign unremitted earnings, adjustments to income tax reserves and the geographic mix of world-wide income. See Note 15 of the Notes to Consolidated Financial Statements for further discussion related to effective tax rates.
As a result of the factors above, the 2009 net loss and diluted loss per share was $77.3 and $0.63, respectively, compared to net loss and diluted loss per share of $92.9 and $0.75, respectively, in the prior year.
2008 vs. 2007
Consolidated revenues for 2008 were $2,785.8, down 2% from 2007. Growth in revenues from Customer Management and HR Management partially offset by a decline in Information Management. Customer Management revenues for 2008 include revenue of $63.3 from the Intervoice acquisition that closed on September 3, 2008. The operating loss of $191.3 in 2008 was driven by the $334.0 of asset impairment and implementation charges recorded at HR Management as well as a 48% operating income decline at Customer Management and a 26% operating income decline at Information Management. The $334.0 of charges, as more fully described under the heading “HR Management,” reflect challenges with complex implementations, which caused an increase in overall implementation and delivery costs and an assessment of capitalized implementation expenses and goodwill. The 48% Customer Management operating income decline was due to the negative foreign exchange impact as well as higher costs related to investments in consulting and relationship technology resources and infrastructure partially offset by contribution from the Intervoice acquisition. The 26% Information Management operating income decline was driven by revenue declines resulting from North American client migrations as well as project completions. Operating income included restructuring charges of $34.4 and $3.4 during 2008 and 2007, respectively.
As a percentage of revenues, cost of providing services and products sold was 67.9% compared to 64.6% in 2007. The increase was primarily due to increases in cost of providing services and products sold at HR Management, reflecting expensing of the $65.4 of implementation costs as more fully described below under the heading “HR Management.” Selling, general and administrative expenses of $593.8 increased 7% compared to 2007. As a percentage of revenues, selling, general and administrative expenses were 21.3% compared to 19.5% in
20 Convergys Corporation 2009 Annual Report
Table of Contents
2007. The increase was due to higher selling, general and administrative expenses at Customer Management, reflecting additional investments in consulting and relationship technology resources and infrastructure costs. This increase was partially offset by lower selling, general and administrative expenses both at Information Management and HR Management, largely reflecting the benefits from cost saving initiatives. The 25% decrease in research and development costs largely reflects reduced spending at Information Management reflecting our selective approach to research and development spending, focusing our efforts on only what we consider the highest impact areas.
As discussed more fully under the heading, “Restructuring Charges,” we recorded net restructuring charges of $34.4 in 2008 versus $3.4 in 2007. In 2008, we recorded equity income in the Cellular Partnerships of $35.7 compared to $14.3 recorded in 2007. Interest expense of $22.6 increased from $17.5 in 2007 reflecting a higher level of debt resulting from the Intervoice acquisition. The $10.3 increase in other income, net, was primarily due to an increase in our foreign exchange transaction gains. Other income, net also includes a $6.0 gain from termination of treasury lock instruments that was offset by lower interest income in 2008. Our effective tax benefit rate was 43.3% for 2008 compared to an effective tax expense rate of 31.0% for 2007. This relatively high effective tax benefit rate was driven by the asset impairment and implementation charges at HR Management of which a significant portion was not tax deductible, a favorable impact from the resolution of uncertain tax positions (including resolution of tax audits and expiration of statutes of limitations during 2008), and the impact from the higher mix of non-U.S. income that is taxed at lower effective rates.
As a result of the above, net loss and diluted loss per share for 2008 were $92.9 and $0.75, respectively, compared with net income and diluted earnings per share of $169.5 and $1.23, respectively, in 2007.
Customer Management
| 2009 | 2008 | % Change 09 vs. 08 |
2007 | % Change 08 vs. 07 |
||||||||||||||
| Revenues: | ||||||||||||||||||
| Communications | $ | 1,176.0 | $ | 1,140.2 | 3 | $ | 1,075.0 | 6 | ||||||||||
| Technology | 153.9 | 159.5 | (4 | ) | 155.2 | 3 | ||||||||||||
| Financial services | 288.1 | 250.8 | 15 | 259.0 | (3 | ) | ||||||||||||
| Other | 368.7 | 404.3 | (9 | ) | 376.9 | 7 | ||||||||||||
| Total revenues |
1,986.7 | 1,954.8 | 2 | 1,866.1 | 5 | |||||||||||||
| Costs and Expenses: | ||||||||||||||||||
| Cost of providing services and products sold | 1,240.7 | 1,319.4 | (6 | ) | 1,244.1 | 6 | ||||||||||||
| Selling, general and administrative expenses | 507.8 | 454.7 | 12 | 380.7 | 19 | |||||||||||||
| Research and development costs |
22.2 | 8.4 | — | 4.6 | 83 | |||||||||||||
| Depreciation | 66.9 | 61.4 | 9 | 55.9 | 10 | |||||||||||||
| Amortization | 7.3 | 4.3 | 70 | 2.7 | 59 | |||||||||||||
| Restructuring charges | 7.9 | 14.0 | (44 | ) | — | — | ||||||||||||
| Asset impairment | — | — | — | 1.4 | (100 | ) | ||||||||||||
| Total costs and expenses |
1,852.8 | 1,862.2 | (1 | ) | 1,689.4 | 10 | ||||||||||||
| Operating Income | $ | 133.9 | $ | 92.6 | 45 | $ | 176.7 | (48 | ) | |||||||||
| Operating Margin |
6.7 | % | 4.7 | % | 9.5 | % | ||||||||||||
2009 vs. 2008
Revenues
Customer Management revenues for 2009 were $1,986.7, up 2% from 2008. This includes $166.3 and $63.3 in 2009 and 2008, respectively, in revenue from the Intervoice acquisition that closed on September 3, 2008.
Revenues from the communications vertical increased 3% from the prior year. Growth with our largest communications client and from the Intervoice acquisition was partially offset by a reduction in spending with a few communications clients largely due to the decline in their volumes, as well as a shift in our revenue mix for several of our clients from North America to off-shore locations.
Convergys Corporation 2009 Annual Report 21
Table of Contents
Item 7. Management’s Discussion and Analysis
of Financial Condition and Results of Operations (continued)
(Amounts in Millions Except Per Share Amounts)
Revenues from the financial services vertical increased 15%, primarily reflecting growth from the Intervoice acquisition as well as from new collections programs in the current year. Other revenues, which are comprised of clients outside of Customer Management’s largest industries, decreased 9% from the prior year. A decline in revenues from several retail and automotive clients as a result of the softness in the current economic environment were partially offset by growth from the Intervoice acquisition.
Costs and Expenses
Customer Management total costs and expenses were $1,852.8, a 1% decrease from the prior year. Customer Management cost of providing services and products sold decreased 6% to $1,240.7 from the prior year. As a percentage of revenues, cost of providing services and products sold was 62.5% for 2009, down 500 basis points from 67.5% in the prior year, due to effective live-agent workforce management, as well as positive contributions from the Intervoice acquisition. Selling, general and administrative expenses of $507.8 increased 12% compared to the prior year. This largely reflects higher sales and marketing costs to service the expanded client base and extensive global channel partnerships obtained through the Intervoice acquisition. As a percentage of revenues, selling, general and administrative expenses were 25.6% for 2009 compared to 23.3% in the prior year. The $13.8 increase in research and development costs reflects investments in the automated self-care and technology solutions related to the acquired Intervoice platforms. Compared to the prior year, the 9% increase in depreciation expense and the 70% increase in amortization expense reflect depreciation and amortization of the assets acquired through the Intervoice acquisition. As discussed more fully under the heading, “Restructuring Charges,” we recorded restructuring charges of $7.9 and $14.0 during 2009 and 2008, respectively, to better align cost structure to future business needs.
Operating results also include a favorable foreign currency impact of approximately 30 basis points. Customer Management serves a number of its U.S.-based clients using contact center capacity in the Philippines, India and Canada. Although the contracts with these clients are typically priced in U.S. dollars, a substantial portion of the costs incurred to operate these non-U.S. contact centers is denominated in Philippine pesos, Indian rupees or Canadian dollars, which represents a foreign exchange exposure. As discussed in further detail in the section titled “Market Risk,” we hedge this exposure by entering into foreign currency forward contracts and options to limit potential foreign currency exposure. We enter into these derivative instruments on a periodic basis over time and, therefore, the 2009 earnings impact is determined based on the difference in the extent of our hedged exposures as well as changes in foreign exchange rates between 2009 and 2008.
Operating Income
As a result of the foregoing, Customer Management 2009 operating income and operating margin were $133.9 and 6.7%, respectively, compared with $92.6 and 4.7%, respectively, in the prior year.
2008 vs. 2007
Revenues
Customer Management revenues for 2008 were $1,954.8, up 5% from 2007. This includes $63.3 in revenue from the Intervoice acquisition that closed on September 3, 2008.
Revenues from the communications vertical increased 6% from 2007. Growth with two large wireless clients and from the Intervoice acquisition was partially offset by a shift in our revenue mix for a few of our clients from North America to the Philippines. Revenues from the financial services vertical decreased 3%, reflecting completion of programs with clients that were partially offset by growth from the Intervoice acquisition. Revenues from the other vertical, which is comprised of clients outside of Customer Management’s three largest industries, increased 7% from 2007, reflecting growth from the new programs as well as the Intervoice acquisition.
22 Convergys Corporation 2009 Annual Report
Table of Contents
Costs and Expenses
Customer Management total costs and expenses were $1,862.2, a 10% increase from 2007. Customer Management cost of providing services and products sold increased 6% to $1,319.4 from 2007. As a percentage of revenues, cost of providing services and products sold was 67.5% for 2008, up 80 basis points from 66.7% in 2007. The impact of revenue growth and operating efficiencies were more than offset by the negative foreign currency impact of approximately 165 basis points. As discussed in further detail in the section titled “Market Risk,” we hedge this exposure by entering into foreign currency forward contracts and options.
Selling, general and administrative expenses of $454.7 increased 19% compared to 2007. This reflects higher investments in our consulting and relationship technology resources and infrastructure costs. As a percentage of revenues, selling, general and administrative expenses were 23.3% for 2008 compared to 20.4% in 2007. The $3.8, or 83%, increase in research and development costs reflects investments in our relationship technology solutions. The 10% increase in depreciation expense and the 59% increase in amortization expense largely reflect depreciation and amortization of the assets acquired through the Intervoice acquisition. As discussed more fully under the heading, “Restructuring Charges,” Customer Management recorded a restructuring charge of $14.0 during 2008 to streamline operations and reduce headcount.
Operating Income
As a result of the foregoing, Customer Management operating income and operating margin were $92.6 and 4.7%, respectively, compared with $176.7 and 9.5%, respectively, in the prior year.
Information Management
| 2009 | 2008 | % Change 09 vs. 08 |
2007 | % Change 08 vs. 07 |
||||||||||||||
| Revenues: | ||||||||||||||||||
| Data processing | $ | 113.9 | $ | 135.4 | (16 | ) | $ | 239.6 | (43 | ) | ||||||||
| Professional and consulting | 159.0 | 216.1 | (26 | ) | 262.8 | (18 | ) | |||||||||||
| License and other | 161.4 | 220.0 | (27 | ) | 220.6 | — | ||||||||||||
| Total revenues |
434.3 | 571.5 | (24 | ) | 723.0 | (21 | ) | |||||||||||
| Costs and Expenses: | ||||||||||||||||||
| Cost of providing services and products sold | 220.8 | 304.4 | (27 | ) | 382.7 | (20 | ) | |||||||||||
| Selling, general and administrative expenses | 79.9 | 79.3 | 1 | 101.4 | (22 | ) | ||||||||||||
| Research and development costs | 52.0 | 46.5 | 12 | 67.2 | (31 | ) | ||||||||||||
| Depreciation | 22.6 | 28.2 | (20 | ) | 32.4 | (13 | ) | |||||||||||
| Amortization | 3.6 | 7.0 | (49 | ) | 3.7 | 89 | ||||||||||||
| Restructuring charges | 30.4 | 9.7 | — | 3.4 | — | |||||||||||||
| Asset impairments | 3.1 | — | — | 1.3 | (100 | ) | ||||||||||||
| Total costs and expenses |
412.4 | 475.1 | (13 | ) | 592.1 | (20 | ) | |||||||||||
| Operating Income | $ | 21.9 | $ | 96.4 | (77 | ) | $ | 130.9 | (26 | ) | ||||||||
| Operating Margin | 5.0 | % | 16.9 | % | 18.1 | % | ||||||||||||
2009 vs. 2008
Revenues
Information Management revenues of $434.3 in 2009 were down 24% compared to the prior year, due to North American client migrations as well as international project completions, partially offset by revenue from new clients.
Data processing revenues of $113.9 decreased 16% from the prior year reflecting North American client migrations partially offset by revenues from a new client. Compared to the prior year, professional and consulting revenues of $159.0 decreased 26%, largely reflecting international project completions and reduction in services resulting from client migrations. License and other revenues decreased 27% to $161.4, due to international project completions. In addition, prior year included approximately $25 of termination revenue from client migrations.
Convergys Corporation 2009 Annual Report 23
Table of Contents
Item 7. Management’s Discussion and Analysis
of Financial Condition and Results of Operations (continued)
(Amounts in Millions Except Per Share Amounts)
Costs and Expenses
Information Management total costs and expenses were $412.4, a 13% decline from the prior year. Compared to prior year, Information Management cost of providing services and products sold decreased 27% to $220.8. As a percentage of revenues, cost of providing services and products sold was 50.8% for 2009, down from 53.3% in the prior year. Selling, general and administrative expenses of $79.9 remained relatively flat compared to prior year. Increased investments in sales and marketing resources were offset by a decline in other administrative costs. As a percentage of revenues, selling, general and administrative expenses were 18.4% compared to 13.9% in 2008, largely due to revenue declines. The 12% increase in research and development costs reflects our increased spending on strategic initiatives to enhance the functionality of our business support system offerings. The 20%, or $5.6, decrease in depreciation expense and 49%, or $3.4, decrease in amortization expense for 2009 compared to the prior year is the result of fully depreciated and amortized assets. As noted under the heading, “Restructuring Charges,” we recorded restructuring charges of $30.4 in 2009 related to both consolidating facilities and reductions in headcount. We also recorded a restructuring charge of $9.7 in 2008 to better align our cost structure to future business needs, as well as to shift the geographic mix of some of our resources.
Operating Income
As a result of the foregoing, Information Management 2009 operating income and operating margin were $21.9 and 5.0%, respectively, compared with $96.4 and 16.9%, respectively, in the prior year.
2008 vs. 2007
Revenues
Information Management revenues of $571.5 in 2008 were down 21% compared to 2007, due to North American client migrations as well as project completions.
Data processing revenues of $135.4 decreased 43% from 2007 reflecting North American client migrations. Professional and consulting revenues of $216.1 decreased 18% from 2007 reflecting project completions and reduction in services resulting from client migrations. License and other revenues remained relatively flat at $220.0 compared to 2007. Termination revenue resulting from the completion of the Sprint Nextel and another North American client migration was offset by several items including reduction in client budgets due to slowdown in the industry, delayed project acceptance and completion of some international programs.
Revenues from Sprint Nextel were down approximately $53, or 46%, in 2008 compared to 2007.
Costs and Expenses
Information Management total costs and expenses were $475.1, down 20% from 2007. Information Management cost of providing services and products sold decreased 20% to $304.4 from 2007. As a percentage of revenues, cost of providing services and products sold was 53.3% for 2008, and was relatively flat compared to 2007. Selling, general and administrative expenses of $79.3 decreased 22% from 2007, reflecting benefits from focus on reducing costs. As a percentage of revenues, selling, general and administrative expenses were 13.9% compared to 14.0% in 2007. The 31% decrease in research and development costs reflects our selective approach to research and development spending by focusing our efforts on only what we consider the highest impact areas.
As discussed more fully under the heading “Restructuring Charges,” we recorded restructuring charges of $9.7 during 2008 to better align our cost structure to future business needs, as well as to shift the geographic mix of some of our resources. We recorded a restructuring charge of $3.4 in 2007 related to a facility closure in the United Kingdom.
Operating Income
As a result of the foregoing, Information Management 2008 operating income and operating margin were $96.4 and 16.9%, respectively, compared with $130.9 and 18.1%, respectively, in 2007.
24 Convergys Corporation 2009 Annual Report
Table of Contents
HR Management
| 2009 | 2008 | % Change 09 vs. 08 |
2007 | % Change 08 vs. 07 |
||||||||||||||
| Revenues: | $ | 406.2 | $ | 259.5 | 57 | $ | 255.2 | 2 | ||||||||||
| Costs and Expenses: | ||||||||||||||||||
| Cost of providing services and products sold | 464.2 | 269.1 | 73 | 211.1 | 27 | |||||||||||||
| Selling, general and administrative expenses | 64.5 | 58.6 | 10 | 66.7 | (12 | ) | ||||||||||||
| Research and development costs | — | — | — | 1.6 | (100 | ) | ||||||||||||
| Depreciation | 8.6 | 9.3 | (8 | ) | 8.7 | 7 | ||||||||||||
| Amortization | 0.8 | 2.2 | (64 | ) | 2.6 | (15 | ) | |||||||||||
| Restructuring charges | 3.7 | 10.5 | (65 | ) | — | — | ||||||||||||
| Asset impairment | 110.5 | 268.6 | (59 | ) | 2.8 | — | ||||||||||||
| Total costs and expenses |
652.3 | 618.3 | 5 | 293.5 | — | |||||||||||||
| Operating Loss | $ | (246.1 | ) | $ | (358.8 | ) | (31 | ) | $ | (38.3 | ) | — | ||||||
2009 vs. 2008
Revenues
HR Management revenues for 2009 were $406.2, a 57% increase from 2008. This increase reflects $122.3 related to the accelerated recognition in 2009 of previously received and deferred implementation revenue related to two large HR Management contracts as discussed in more detail below and revenue growth with two large HR Management contracts. As of December 31, 2009, the remaining deferred implementation revenue not yet recognized related to these two contracts is approximately $81.
Costs and Expenses
Total costs and expenses include implementation-related, settlement and impairment charges of $366.1 and $334.0 in 2009 and 2008, respectively, substantially related to two large HR Management contracts. The $334.0 charges recorded during 2008 reflect HR Management-related asset and goodwill impairment, write-down of deferred charges, and expensing implementation costs in accordance with our capitalization policy. In 2009, the Company restructured these two HR Management contracts to eliminate future implementation obligations related to services not operational to continue providing services already in operation. As a result, during 2009, all of the remaining capitalized implementation costs related to these two HR Management contracts were written-off and a portion of the previously received and deferred implementation revenue related to the services not yet operational was recognized. Refer to the “Deferred Charges” section of Note 2 of the Notes to Consolidated Financial Statements, for detailed discussion on our policy related to evaluation of our deferred costs. Typically, implementation costs are deferred and amortized ratably over the life of the contract. Deferred amounts are periodically evaluated for impairment or when circumstances indicate a possible inability to recover their carrying amounts. In the event these costs are not deemed recoverable, we follow the guidance in SFAS No. 144, “Accounting for the Impairment or Disposal of Long-Lived Assets,” now codified in FASB Topic 310 in the Accounting Standards Codification (ASC), to determine whether impairment exists. The implementation-related, settlement and impairment charges of $366.1 recorded during 2009 consisted of (a) $255.6 recorded within the cost of providing services and products sold caption representing expensing of implementation and settlement costs related to the two large contracts discussed above and (b) $110.5 for impairment of deferred charges and other long-lived assets. During 2008, the implementation and impairment charges of $334.0 consisted of (a) $65.4 recorded within the cost of providing services and products sold caption, related to excess implementation costs that were expensed rather than capitalized in accordance with the Company’s accounting policy and (b) $268.6 for impairment of certain long-lived assets. Completing the contract restructurings during 2009 has stabilized the HR Management business and has eliminated the future implementation risk on services not yet operational.
HR Management cost of providing services and products sold for 2009 increased to $464.2 from $269.1 for 2008. As noted above, the cost of providing services and products sold for both 2009 and 2008 includes implementation-
Convergys Corporation 2009 Annual Report 25
Table of Contents
Item 7. Management’s Discussion and Analysis
of Financial Condition and Results of Operations (continued)
(Amounts in Millions Except Per Share Amounts)
related and settlement charges of $255.6 and $65.4, respectively. Excluding these charges, the cost of providing services and products sold was relatively flat in 2009 compared to 2008. Selling, general and administrative expenses of $64.5 for 2009 increased 10%, or $5.9 compared to the prior year due to the increase in revenues. As noted under the heading, “Restructuring Charges,” we recorded restructuring charges of $3.7 in 2009 and $10.5 during 2008 to better align staffing levels to expected future revenues.
Operating Income
As a result of the foregoing, HR Management 2009 operating loss was at $246.1 compared to $358.8 in the prior year.
2008 vs. 2007
Revenues
HR Management revenues for 2008 were $259.5, up 2% from 2007. Revenue growth from a contract termination payment received during 2008 and from the North American go-live of a large contract was partially offset by the elimination of pass-through revenue with a large HR outsourcing client during 2008, as well as declines from the completion of certain legacy programs. Pass-through revenues for 2008 and 2007 were $12.8 and $25.3, respectively.
Costs and Expenses
In 2008, we recorded $334.0 of asset impairment and implementation charges at HR Management, of which $207.5 related to impairment of deferred charges, $61.1 related to goodwill impairment and $65.4 related to expensing of implementation costs. The charges reflect challenges we experienced with complex implementations primarily pertaining to two large contracts which caused an increase in overall implementation and delivery costs and an assessment of capitalized implementation expenses and goodwill. The impairment of deferred charges recorded in 2008 triggered an impairment review of the goodwill related to the HR Management segment. As discussed more fully in Note 6 of the Notes to Consolidated Financial Statements, we are required to test goodwill for impairment annually and at other times if events have occurred or circumstances exist that indicate the carrying value of goodwill may no longer be recoverable. The impairment test for goodwill involves a two-step process. The first step compares the fair value of a reporting unit with its carrying amount, including the goodwill allocated to each reporting unit. If the carrying amount is in excess of the fair value, the second step requires the comparison of the implied fair value of the reporting unit goodwill with the carrying amount of the reporting unit goodwill. Any excess of the carrying value of the reporting unit goodwill over the implied fair value of the reporting unit goodwill will be recorded as an impairment loss. We determined that the fair value of the HR Management segment was less than its carrying value as of September 30, 2008 and, therefore, the second step of the test was required. This second step review of the HR Management segment was completed during the fourth quarter of 2008 and resulted in non-cash goodwill impairment charge of $61.1 recorded within the asset impairment caption in the accompanying Consolidated Statements of Operations. In determining the amount of the HR Management related goodwill impairment, we engaged a third-party appraisal firm to assist in valuing the significant intangible assets of the reporting unit. Key assumptions used by the Company in determining the fair value of the HR Management segment included revenue increases from existing contracts as services become operational and an estimate of future cash implementation costs and revenue.
HR Management cost of providing services and products sold for 2008 increased to $269.1 from $211.1 for 2007. As noted above, the cost of providing services and products sold for 2008 includes implementation-related charges of $65.4. Selling, general and administrative expenses of $58.6 for 2008 decreased 12%, or $8.1 compared to 2007 reflecting an increase in employees working on client-related projects in 2008 and savings realized from cost reduction initiatives. As a percentage of revenues, selling, general and administration expenses were 22.6% in 2008 compared to 26.1% in 2007. The
26 Convergys Corporation 2009 Annual Report
Table of Contents
decrease in research and development expense in 2008 reflects employees working on client related implementation projects. Additionally, as discussed in further detail under the heading, “Restructuring Charges,” HR Management recorded a restructuring charge of $10.5 in 2008 to better align our cost structure to future business needs.
Operating Income
As a result of the foregoing, HR Management 2008 operating loss was at $358.8 compared to $38.3 in 2007.
Restructuring Charges
As discussed in Note 9 of the Notes to Consolidated Financial Statements, we recorded the following restructuring charges:
2009
During 2009, the Company initiated a restructuring plan to reduce headcount and align resources to future business needs. The total charge of $47.0 included $30.7 of severance-related charges and $16.3 of facility-related charges. The $30.7 of severance-related charges was comprised of $15.3 at Information Management related to shifting the geographic mix of certain resources and further streamlining of operations, $6.7 of severance at Customer Management, resulting from a reduction in one international program and efforts to streamline operations, $3.7 at HR Management, related to headcount reductions across the globe in order to align resources to expected future revenue and $5.0 at Corporate to reduce headcount. The severance charge of $30.7 will largely be paid in cash pursuant to the Company’s existing severance policy and employment agreements. These actions will affect approximately 1,000 of our worldwide salaried employees and approximately 800 of our non-salaried employees. We expect the severance actions to be mostly completed by mid-2010 and we expect the payback period on these charges to be less than one year.
Below is a summary of the 2009 net restructuring charge of $47.0 ($32.1 after tax) by segment:
| Customer Management |
Information Management |
HR Management |
Corporate | Total | |||||||||||
| Severance costs | $ | 6.7 | $ | 15.3 | $ | 3.7 | $ | 5.0 | $ | 30.7 | |||||
| Facility-related costs | 1.2 | 15.1 | — | — | 16.3 | ||||||||||
| Net restructuring | $ | 7.9 | $ | 30.4 | $ | 3.7 | $ | 5.0 | $ | 47.0 | |||||
The $16.3 facility-related charge relates to lease rent accruals for properties that have closed as the result of consolidating facilities. The $15.1 reserve recorded at Information Management largely relates to consolidating facilities in the United Kingdom. The charge is equal to the future costs associated with the facility, net of proceeds from any probable future sublease agreements. We used estimates, based on consultation with our real estate advisors, to arrive at the proceeds from any future sublease agreements. We will continue to evaluate these estimates in recording the facilities abandonment charge. Consequently there may be additional reversals or charges relating to this facility closure in the future. At December 31, 2009, the outstanding balance was $16.0, which will be paid over several years until the leases expire.
Restructuring liability activity for the 2009 plan consisted of the following:
| 2009 | ||||
| Restructuring charge | $ | 47.0 | ||
| Severance payments |
(8.5 | ) | ||
| Facility payments |
(0.3 | ) | ||
| Balance at December 31 | $ | 38.2 | ||
2008
During 2008, the Company initiated a restructuring plan to align resources to future business needs and to shift the geographic mix of some of its resources. Restructuring actions were taken in each business segment, of which $14.0 related to Customer Management, $9.7 related to
Convergys Corporation 2009 Annual Report 27
Table of Contents
Item 7. Management’s Discussion and Analysis
of Financial Condition and Results of Operations (continued)
(Amounts in Millions Except Per Share Amounts)
Information Management, $10.5 related to HR Management and $0.2 related to Corporate. The $34.4 restructuring consisted primarily of cash paid pursuant to the Company’s severance policy and employment agreements. These actions, which affected approximately 1,500 professional and administrative employees and 1,000 non-salaried employees worldwide, were fully completed in 2009.
Below is a summary of the 2008 net restructuring charge of $34.4 ($22.4 after tax) by segment:
| Customer Management |
Information Management |
HR Management |
Corporate | Total | |||||||||||
| Severance costs | $ | 12.2 | $ | 9.7 | $ | 10.5 | $ | 0.2 | $ | 32.6 | |||||
| Facility-related costs | 1.8 | — | — | — | 1.8 | ||||||||||
| Net restructuring | $ | 14.0 | $ | 9.7 | $ | 10.5 | $ | 0.2 | $ | 34.4 | |||||
Restructuring liability activity for the 2008 plan consisted of the following:
| 2009 | 2008 | |||||||
| Balance at January 1 | $ | 22.1 | $ | — | ||||
| Restructuring charge |
— | 34.4 | ||||||
| Severance payments |
(20.4 | ) | (12.2 | ) | ||||
| Facility payments |
(1.7 | ) | (0.1 | ) | ||||
| Balance at December 31 | $ | — | $ | 22.1 | ||||
Client Concentration
During 2009, our three largest clients accounted for 33.1% of our revenues. We serve AT&T, our largest client with 19.8% of revenues in 2009, under Customer Management and Information Management contracts. We serve DirecTV and Comcast Corporation, our second and third largest clients in 2009, under Customer Management contracts. Volumes under certain of our long-term contracts are subject to variation based on, among other things, the spending by clients on outsourced customer support and subscriber levels.
Business Outlook
Expectations for 2010 performance are as follows:
| • | We expect overall revenue of approximately $2.6 billion. We expect a modest increase in Customer Management with full year revenue of approximately $2 billion reflecting our continued caution regarding existing client call volumes, which is balanced by the continuing solid new business signings. Information Management revenue is expected to be approximately $350 largely due to the impact of North American client migrations (as described in more detail in the Information Management section on Pages 17-18) and HR Management revenue is expected to be approximately $250 reflecting reduction in deferred revenue from the large amount recognized in 2009 and the reduced scope of two large HR Management contracts restructured in 2009. |
| • | For 2010, we expect earnings before interest, taxes, depreciation and amortization (EBITDA) of $330 to $360 and we expect earnings per share in the range of $1.05 to $1.20. The outcome depends partially upon the speed of economic recovery. EBITDA includes equity earnings in Cellular Partnerships and other income. Free cash flow is expected to exceed $150 in 2010. The expected 2010 free cash flow, combined with the $332 of cash on the balance sheet at December 31, 2009, will provide us with an improved ability to invest in our business in 2010 and beyond. |
| • | We also expect additional cash distribution of approximately $40 from the Cellular Partnerships. |
| • | We take opportunities to further streamline the business as we find them. Any future restructuring actions are not reflected in this guidance. Not included in this full year earnings per share, EBITDA and cash flow guidance is the 2010 impact of approximately $0.05 per share for the cost of the change in the President and Chief Executive Officer of the Company. |
28 Convergys Corporation 2009 Annual Report
Table of Contents
Financial Condition, Liquidity and Capital Resources
Liquidity and Cash Flows
We believe that Convergys has adequate liquidity from cash and expected future cash flows to fund ongoing operations, invest in the business and make required debt payments. The Company’s free cash flow, defined as cash flow from operating activities less capital expenditures (net of proceeds related to disposals) was $189.8 for 2009, which is significantly higher than the 2008 free cash flow of $100.2. Free cash flow is expected to exceed $150 in 2010. The expected 2010 free cash flow, combined with the $331.7 cash on the Balance Sheet at December 31, 2009 and availability under the account receivables securitization facility that was established during 2009, will provide us with an ability to invest in our business in 2010 and beyond.
Cash flows from operating activities generally provide us with a significant source of funding for our investing and financing activities. Cash flows for 2009, 2008 and 2007 were as follows:
| 2009 | 2008 | 2007 | ||||||||||
| Net cash flows from operating activities | $ | 264.7 | $ | 192.3 | $ | 209.9 | ||||||
| Net cash flows used in investing | (38.0 | ) | (365.1 | ) | (74.8 | ) | ||||||
| Net cash flows provided by (used in) financing | (135.0 | ) | 292.5 | (250.7 | ) | |||||||
| Computation of Free Cash Flows: | ||||||||||||
| Net cash flows from operations | $ | 264.7 | $ | 192.3 | $ | 209.9 | ||||||
| Capital expenditures, net of proceeds from disposal of assets | (74.9 | ) | (92.1 | ) | (101.3 | ) | ||||||
| Free Cash Flows | $ | 189.8 | $ | 100.2 | $ | 108.6 | ||||||
Cash flows from operating activities totaled $264.7 in 2009, compared to $192.3 in 2008 and $209.9 in 2007. The $72.4 increase in cash flows from operations from 2008 to 2009 was largely driven by a decrease in the net implementation spend reflecting completion of implementation activities related to two large HR Management contracts and improvement in our working capital requirements driven by improved accounts receivable collections. Net deferred charges (implementation costs less implementation revenue paid by the clients, and the related amortization of deferred cost and revenue is described as “net deferred charges”) increased by approximately $40 and $133 during 2009 and 2008, respectively, excluding the impact of the impairment and implementation charges that were incurred in the HR Management segment. The improvements in working capital were largely driven by improved accounts receivable collection. Days sales outstanding decreased to 60 days at December 31, 2009, versus 68 days at December 31, 2008. This performance measure is computed as follows: receivables, net of allowances, divided by average daily revenue.
The decrease in cash flows from operating activities during 2008, compared to 2007, was driven largely by the increase in net deferred charges due to additional HR Management contract implementation costs in 2008. During 2008, net deferred charges increased by approximately $133 excluding the impact of the impairment and implementation charges that were incurred in the HR Management segment. In 2007, the increase in net deferred charges related to client implementations incurred primarily at HR Management was approximately $30. The increase in net deferred charges during 2008 compared to 2007 was partially offset by a reduction in accounts receivable of approximately $60 and a decline in other working capital requirements of approximately $35.
We used $38.0 for investing activities during 2009 compared to $365.1 during 2008 and $74.8 in 2007. During 2008, we paid $312.2 (net of cash acquired) for the acquisition of Intervoice in the Customer Management segment and three other small acquisitions in the Information Management segment. The investing activity in 2009 was favorably impacted by a $40.0 return of capital from the Cellular Partnerships compared to $39.2 and $8.8 in 2008 and 2007, respectively. We are not aware of any material capital calls from the general partner of Cincinnati SMSA Limited Partnership.
Cash flows used for financing activities was $135.0 during 2009 compared to an inflow of $292.5 during 2008 and an
Convergys Corporation 2009 Annual Report 29
Table of Contents
Item 7. Management’s Discussion and Analysis
of Financial Condition and Results of Operations (continued)
(Amounts in Millions Except Per Share Amounts)
outflow of $250.7 in 2007. During 2009 we repaid approximately $130 of our 4.875% Senior Notes. During 2008, we borrowed the entire amount available under our $400 Five-Year Competitive Advance and Revolving Credit Facility to fund our acquisition of Intervoice. We also repurchased Company’s shares of common stock for $116.6 during 2008. The cash outflow during 2007 was due to repurchase of the Company’s common stock and debt repayments.
As of December 31, 2009, our credit ratings and outlook are as follows:
| Long-Term Debt | Outlook | |||
| Moody’s | Ba1 | Negative | ||
| Standard and Poor’s | BB+ | Negative | ||
Our credit ratings and outlook could impact our ability to raise capital in the future as well as increase borrowing costs.
The Company’s free cash flows, defined as cash flows from operating activities less capital expenditures (net of proceeds related to disposals), was $189.8, $100.2 and $108.6 for 2009, 2008 and 2007, respectively. Compared to the prior year, the increase in free cash flows of $89.6 in 2009 was largely due to a higher amount of cash generated from operating activities during 2009 as discussed above. The Company uses free cash flow to assess the financial performance of the Company. The Company believes that free cash flow is useful to investors because it relates the operating cash flow of the Company to the capital that is spent to continue and improve business operations, such as investment in the Company’s existing businesses. Further, free cash flow facilitates management’s ability to strengthen the Company’s balance sheet, to repay the Company’s debt obligations and to repurchase the Company’s common shares. Limitations associated with the use of free cash flow include that it does not represent the residual cash flow available for discretionary expenditures as it does not incorporate certain cash payments including payments made on capital lease obligations or cash payments for business acquisitions. Management compensates for these limitations by utilizing both the non-GAAP measure, free cash flow, and the GAAP measure, net cash flows from operating activities, in its evaluation of performance. There are no material purposes for which we use this non-GAAP measure beyond the purposes described above.
Capital Resources, Off-Balance Sheet Arrangements and Contractual Commitments
At December 31, 2009, total capitalization was $1,676.0, consisting of $469.6 of short-term and long-term debt and $1,206.4 of equity. At December 31, 2008, total capitalization was $1,816.0, consisting of $665.9 of short-term and long-term debt and $1,150.1 of equity. The total debt-to-capital ratio at December 31, 2009, was 28.0%, which compares to 36.7% at December 31, 2008. The decrease in this ratio is due to a lower level of borrowings in 2009 compared to 2008.
At December 31, 2009, we have borrowed the entire amount available under our $400 Five-Year Competitive Advance and Revolving Credit Facility. This borrowing was used mainly to fund our acquisition of Intervoice that closed on September 3, 2008. The maturity date of the Revolving Credit Facility Agreement is October 20, 2011. The Company’s credit facility includes certain restrictive covenants including maintenance of interest coverage and debt-to-EBITDA ratios (as defined in the Credit Facility Agreement). Our interest coverage ratio, defined as the ratio of consolidated earnings before interest, tax, depreciation and amortization (EBITDA) to consolidated interest expense, cannot be less than 4.00 to 1.00 for four consecutive quarters. Our debt-to-EBITDA ratio cannot be greater than 3.25 to 1.0 at any time. At December 31, 2009, we were in compliance with all covenants. During February 2010, we repaid $300.0 of the outstanding portion of the Revolving Credit Facility.
In December 2004, we issued $250.0 in 4.875% Unsecured Senior Notes (4.875% Senior Notes) due December 15, 2009. As described in Note 8 of Notes to Consolidated Financial Statements, during the first nine months of 2009, we retired approximately $58 of the outstanding
30 Convergys Corporation 2009 Annual Report
Table of Contents
debt and announced an exchange offer (Exchange Offer), under the terms of which the Company offered to exchange one-thousand twenty dollars in principal amount of its new 5.75% Junior Subordinated Convertible Debentures due September 2029 (2029 Convertible Debentures) for each one-thousand dollars in principal amount of its 4.875% Senior Notes. We issued a total of $125.0 aggregate principal amount of the 2029 Convertible Debentures in exchange for $122.5 of the 4.875% Senior Notes. This exchange transaction resulted in a loss on extinguishment of debt of $2.3 that is reflected within other income (expense), net, in the accompanying Statements of Operations and Comprehensive Income (Loss) for the year ended December 31, 2009. Following the settlement of the exchange, approximately $70 aggregate principal amount of the 4.875% Senior Notes remained outstanding that was fully paid in December 2009.
As discussed in Note 12 of Notes to Consolidated Financial Statements, we lease certain facilities and equipment used in our operations under operating leases. This includes our office complex in Orlando, Florida, which is leased from Wachovia Development Corporation (Lessor), a wholly owned subsidiary of Wells Fargo & Company, under an agreement that expires in June 2010. Upon termination or expiration of the lease, we must either purchase the property from the Lessor for $65.0 or arrange to have the office complex sold to a third party. If the office complex is sold to a third party for an amount less than the $65.0, we have agreed under a residual value guarantee to pay the Lessor up to $55.0. If the office complex is sold to a third party for an amount in excess of $65.0, Convergys is entitled to collect the excess. As of December 31, 2009, we have recognized a liability of approximately $12 for the related residual value guarantee. The value of the guarantee was determined by computing the estimated present value of probability-weighted cash flows that might be expended under the guarantee. The Company recorded a liability for the fair value of the obligation with a corresponding asset recorded as prepaid rent, which is being amortized to rental expense over the lease term. The liability will remain on the balance sheet until the end of the lease term. Under the terms of the lease, the Company also provides certain indemnities to the Lessor, including environmental indemnities. Due to the nature of such potential obligations, it is not possible to estimate the maximum amount of such exposure or the fair value. Convergys does not expect such amounts, if any, to be material. The Company has concluded that we are not required to consolidate the Lessor pursuant to authoritative guidance for the consolidation of variable interest entities included within FASB Topic 810, “Consolidation,” in the ASC. We are in the process of evaluating whether to purchase or refinance this property.
During 2009, we entered into a $125.0 asset securitization facility collateralized by accounts receivables of certain of the Company’s subsidiaries, of which $50.0 expires in June 2010 and $75.0 expires in June 2012. The asset securitization program is conducted through Convergys Funding Inc., a wholly-owned bankruptcy remote subsidiary of the Company. The asset securitization facility does not qualify for sale treatment under the authoritative guidance for the accounting for transfers and servicing of financial assets and extinguishments of liabilities included in FAS Topic 860, “Transfers and Servicing,” in the ASC. Accordingly, the accounts receivable and related debt obligation will remain on the Company’s Consolidated Balance Sheet. As of December 31, 2009, this facility remains undrawn. During February 2010, we drew approximately $65 from this facility.
The Company currently believes that its ability to borrow is greater than its established credit facilities in place.
We did not repurchase any shares of our common stock during 2009. We repurchased 7.7 million shares of our common stock for $116.6 during 2008 pursuant to outstanding authorizations. The timing and terms of any future transactions depend on a number of considerations including market conditions and our liquidity. At December 31, 2009, we had the authority to repurchase an additional 7.1 million common shares.
Convergys Corporation 2009 Annual Report 31
Table of Contents
Item 7. Management’s Discussion and Analysis
of Financial Condition and Results of Operations (continued)
(Amounts in Millions Except Per Share Amounts)
The following summarizes our contractual obligations at December 31, 2009, and the effect such obligations are expected to have on liquidity and cash flows in future periods:
| Contractual Obligations |
Total | Less Than 1 Year |
1-3 Years | After 3 Years | ||||||||
| Debt (1) | $ | 538.3 | $ | 405.2 | $ | 2.1 | $ | 131.0 | ||||
| Debt interest (2) | 193.0 | 21.4 | 22.1 | 149.5 | ||||||||
| Operating leases (3) | 131.0 | 45.2 | 59.9 | 25.9 | ||||||||
| Pension contributions (4) | 9.4 | 9.4 | — | — | ||||||||
| Unrecognized tax benefits (5) | — | — | — | — | ||||||||
| Purchase commitments (6) | 32.5 | 32.5 | — | — | ||||||||
| Total | $ | 904.2 | $ | 513.7 | $ | 84.1 | $ | 306.4 | ||||
| (1) | See Note 8 of the Notes to Consolidated Financial Statements for further information. |
| (2) | This includes interest expense on both variable and fixed rate debt. Variable interest rates have been assumed to remain constant at current levels through the end of the term. |
| (3) | See Note 12 of the Notes to Consolidated Financial Statements for further information. |
| (4) | In order to meet ERISA funding requirements, the Company expects to contribute $9.4 to fund its cash balance pension plan in 2010. There is no estimate available for 2011 and beyond. |
| (5) | Unrecognized tax benefits of $80.9 are excluded from this table as the uncertainty related to the amount and period of any cash settlement prevent the Company from making a reasonably reliable estimate. |
| (6) | This consists of contractual obligations to purchase services that are enforceable and legally binding. Excludes issuance of purchase orders made in the ordinary course of business that are short-term or cancelable, as well as renewable support and maintenance arrangements. |
At December 31, 2009, we had outstanding letters of credit of approximately $55 related to performance and payment guarantees, of which approximately $35 is set to expire by the end of 2010, approximately $8 is set to expire within one to three years and approximately $12 is set to expire after three years. We also had other bond obligations of approximately $41 related to performance and payment guarantees. We do not believe that any obligation that may arise under these arrangements will be material.
Market Risk
We are exposed to a variety of market risks, including the effects of changes in foreign currency exchange rates and interest rates. Market risk is the potential loss arising from adverse changes in market rates and prices. Our risk management strategy includes the use of derivative instruments to reduce the effects on our operating results and cash flows from fluctuations caused by volatility in currency exchange and interest rates. In using derivative financial instruments to hedge exposures to changes in exchange rates and interest rates, we expose ourselves to counterparty credit risk. We manage exposure to counterparty credit risk by entering into derivative financial instruments with highly-rated institutions that can be expected to perform fully under the terms of the agreements and by diversifying the number of financial institutions with which we enter into such agreements.
Interest Rate Risk
At December 31, 2009, we had $403.7 in outstanding variable rate borrowings and $134.6 in outstanding fixed rate borrowings. The carrying amount of our variable borrowings reflects fair value due to their short-term and variable interest rate features. Our variable interest rate debt had an effective interest rate of 3.4% during the year ended December 31, 2009. Based upon our exposure to variable rate borrowings, a one percentage point change in the weighted average interest rate would change our annual interest expense by approximately $4.
We sometimes use interest rate swaps to hedge our interest rate exposure. These instruments are hedges of the variability of cash flows to be received or paid related to a recognized asset or liability. These contracts are entered into to protect against the risk that the eventual cash flows resulting from such transactions will be adversely affected by changes in interest rates. There were no outstanding interest rate swaps covering interest rate exposure at December 31, 2009.
Foreign Currency Exchange Rate Risk
We serve many of our U.S.-based clients using contact center capacity in the Philippines, India and Canada. Although the contracts with these clients are typically priced in U.S. dollars, a substantial portion of the costs incurred to render services under these contracts are denominated in Philippine pesos (PHP), Indian rupees (INR) or Canadian dollars (CAD), which represents a foreign exchange exposure. As of December 31, 2009, we have hedged a portion of our exposure related to the anticipated cash flow requirements denominated in these
32 Convergys Corporation 2009 Annual Report
Table of Contents
foreign currencies by entering into forward contracts with several financial institutions to acquire a total of PHP 11,869 at a fixed price of $256 through September 2012, INR 9,790 at a fixed price of $231 through June 2012 and CAD 92 at a fixed price of $80 through December 2010. Additionally, we had entered into option contracts to purchase PHP 1,370 for a fixed price of $34 through June 2010. The fair value of these derivative instruments as of December 31, 2009 is presented in Note 13 of the Notes to Consolidated Financial Statements. The potential loss in fair value at December 31, 2009 for such contracts resulting from a hypothetical 10% adverse change in all foreign currency exchange rates is approximately $60. This loss would be mitigated by corresponding gains on the underlying exposures.
Other foreign currency exposures arise from transactions denominated in a currency other than the functional currency. We periodically enter into forward exchange contracts that are not designated as hedges. The purpose of these derivative instruments is to protect the Company against foreign currency exposure pertaining to receivables, payables and intercompany transactions that are denominated in currencies different from the functional currencies of the Company or the respective subsidiaries. As of December 31, 2009, the fair value of these derivatives was immaterial to the Consolidated Financial Statements.
Critical Accounting Policies and Estimates
We prepare our Financial Statements in conformity with accounting principles generally accepted in the United States. Our significant accounting policies are disclosed in Note 2 of Notes to Consolidated Financial Statements. The preparation of Financial Statements in accordance with accounting principles generally accepted in the United States requires us to make estimates and assumptions that affect reported amounts and related disclosures. On an ongoing basis, we evaluate our estimates and judgments in these areas based on historical experience and other relevant factors. Our estimates as of the date of the Financial Statements reflect our best judgment giving consideration to all currently available facts and circumstances. As such, these estimates may require adjustment in the future, as additional facts become known or as circumstances change.
We have identified below the accounting policies and estimates that we believe are most critical in compiling our statements of financial condition and operating results. We have reviewed these critical accounting policies and estimates and related disclosures with the Audit Committee of our Board of Directors.
Contingencies
The Company is from time to time subject to claims and administrative proceedings that are filed in the ordinary course of business. We believe that the results of any such claims or administrative proceedings, either individually or in the aggregate, will not have a materially adverse effect on the results of operations or our financial condition. However, the outcome of any litigation cannot be predicted with certainty. An unfavorable resolution of one or more pending matters could have a material adverse impact on our results of operations or our financial condition in the future.
Deferred Charges
In connection with our outsourcing arrangements, we often perform a significant amount of set-up activities or implementations, which include the installation and customization of our proprietary software in our centers. Under these arrangements, clients do not take possession of the software nor have the right to take possession of the software without incurring a significant penalty. In accordance with authoritative guidance for arrangements that include the right to use software stored on another entity’s hardware, the implementations are not treated as separate elements for revenue recognition purposes. Any proceeds collected for the implementations are deferred and recognized over the service period. Additionally, with respect to certain multiple-element arrangements, we defer all revenue related to the contracts until the final element is delivered. We capitalize all direct and incremental implementation and multiple-element costs,
Convergys Corporation 2009 Annual Report 33
Table of Contents
Item 7. Management’s Discussion and Analysis
of Financial Condition and Results of Operations (continued)
(Amounts in Millions Except Per Share Amounts)
to the extent recovery is probable, and amortize them ratably over the life of the arrangements as cost of providing services and products sold.
Deferred amounts are periodically evaluated for impairment or when circumstances indicate a possible inability to recover their carrying amounts. In the event these costs are not deemed recoverable, we follow the guidance in FASB Topic 360, “Accounting for the Impairment or Disposal of Long-Lived Assets,” in the ASC, to determine whether an impairment exists. We evaluate the probability of recovery by considering profits to be earned during the term of the contract, the creditworthiness of the client and, if applicable, contract termination penalties payable by the client in the event that the client terminates the contract early. Our estimate of profitability is dependent in large part on our estimate of costs. Although we make every reasonable effort to accurately estimate costs, revisions may be made based on actual costs incurred that could result in the recording of an impairment loss. Additionally, if the financial condition of a client were to deteriorate, resulting in a reduced ability to make payments, we may be unable to recover the costs, which would result in an impairment loss. Finally, our entitlement to termination fees may be subject to challenge if a client were to allege that we were in breach of contract. The implementation-related, settlement and asset impairment charges of $369.2 recognized during 2009 substantially reflect (a) the costs of implementing an HR Management outsourcing client contract that exceeded the amount recoverable under the contract and (b) impairment of deferred costs resulting from a decision by two large HR Management clients not to implement services that were not operational. During 2008, we recorded $272.9 of impairment and implementation charges related to deferred costs, of which $207.5 was due to impairment of deferred charges and $65.4 was due to expensing of implementation costs that exceeded the termination for convenience fees in a contract at September 30, 2008. Based on our evaluation of all the related contracts, we believe that the remaining $52.7 of deferred charges at December 31, 2009 is recoverable.
Goodwill
At December 31, 2009, we had goodwill with a net carrying value of $1,048.6. As disclosed in Note 6 of Notes to Consolidated Financial Statements, we test goodwill for impairment annually as of October 1 and at other times if events have occurred or circumstances exist that indicate the carrying value of goodwill may no longer be recoverable. The impairment test for goodwill involves a two-step process. The first step compares the fair value of a reporting unit with its carrying amount, including the goodwill allocated to each reporting unit. If the carrying amount is in excess of the fair value, the second step requires the comparison of the implied fair value of the reporting unit goodwill with the carrying amount of the reporting unit goodwill. Any excess of the carrying value of the reporting unit goodwill over the implied fair value of the reporting unit goodwill will be recorded as an impairment loss. Fair value of the reporting unit is determined using a combination of the market approach and the income approach. Under the market approach, fair value is based on actual stock price or transaction prices of comparable companies. The market approach requires significant judgment regarding the selection of comparable companies. Under the income approach, value is dependent on the present value of net cash flows to be derived from the ownership. The income approach requires significant judgment including estimates about future cash flows and discount rates.
Asset impairment charges recorded during 2009 and 2008 required a review of goodwill related to the HR Management segment both in 2009 and 2008. The review performed in 2009 did not result in any goodwill impairment, however the review performed in 2008 resulted in an impairment loss of $61.1 at HR Management. The goodwill impairment loss of $61.1 for 2008 is reflected in the asset impairment caption in the accompanying Consolidated Statements of Operations.
During the fourth quarter of 2009, we completed our annual impairment tests for the five reporting units: Information Management International, Information
34 Convergys Corporation 2009 Annual Report
Table of Contents
Management North America, Customer Management, Relationship Technology Management and HR Management. Based on the results of the first step, we had no goodwill impairment related to any of our reporting units. We believe we make every reasonable effort to ensure that we accurately estimate the fair value of the reporting units. However, future changes in the assumptions used to make these estimates could result in impairment losses.
Income Taxes
The Company accounts for income taxes in accordance with FASB Topic 740, “Income Taxes,” in the ASC (ASC 740), which recognizes deferred tax assets and liabilities based on the differences between the financial statement carrying amounts and the tax basis of assets and liabilities. The deferred tax assets and liabilities are determined based on the enacted tax rates expected to apply in the periods in which the deferred tax assets or liabilities are expected to be settled or realized.
The Company regularly reviews its deferred tax assets for recoverability and establishes a valuation allowance if it is more likely than not that some portion or all of a deferred tax asset will not be realized. The determination as to whether a deferred tax asset will be realized is made on a jurisdictional basis and is based on the evaluation of positive and negative evidence. This evidence includes historical taxable income, projected future taxable income, the expected timing of the reversal of existing temporary differences and the implementation of tax planning strategies. Projected future taxable income is based on expected results and assumptions as to the jurisdiction in which the income will be earned. The expected timing of the reversals of existing temporary differences is based on current tax law and the Company’s tax methods of accounting.
The Company also reviews its tax activities and records a liability for its uncertain tax positions in accordance with ASC 740. The guidance contains a two-step approach to recognizing and measuring uncertain tax positions. The first step is to evaluate the tax position for recognition by determining whether the weight of available evidence indicates that it is more likely than not that the position will be sustained on audit, including resolution of related appeals or litigation processes, if any. The second step is to measure the tax benefit, which is the largest amount that is more than 50% likely of being realized upon ultimate settlement. The Company’s policy is to recognize interest and penalties accrued on unrecognized tax benefits as part of income tax expense. Significant judgment is required in determining our liability for uncertain tax positions. The application of tax laws and regulations is subject to legal and factual interpretation, judgment and uncertainty. Tax laws and regulations themselves are subject to change as a result of changes in fiscal policy, changes in legislation, the evolution of regulations and court rulings. Therefore, the actual liability for U.S. or foreign taxes may be significantly different from our estimates, which could result in the need to record additional tax liabilities or potentially reverse previously recorded tax liabilities. We believe that we make a reasonable effort to ensure accuracy in our judgments and estimates.
Restructuring Charges
We account for restructuring charges in accordance with FASB Topic 420, “Exit or Disposal Cost Obligations,” in the ASC, recognizing liabilities for a cost associated with an exit or disposal activity measured initially at fair value only when the liability is incurred. During the last three years, we have recorded restructuring charges related to reductions in headcount and facility closures. As of December 31, 2009, we had a restructuring accrual of $38.2, $16.0 of which relates to facility closure costs that will be paid over several years until the leases expire. The accrual is equal to the future costs associated with the abandoned facilities, net of the proceeds from any probable future sublease agreements. We have used estimates, based on consultation with real estate advisors, to arrive at the proceeds from any future sublease agreements. We will continue to evaluate our estimates in recording the facilities abandonment charge. As a result, there may be additional charges or reversals in the future.
Convergys Corporation 2009 Annual Report 35
Table of Contents
Item 7. Management’s Discussion and Analysis
of Financial Condition and Results of Operations (continued)
(Amounts in Millions Except Per Share Amounts)
Revenue Recognition
Our revenue recognition policies are discussed in detail in Note 2 of the Notes to Consolidated Financial Statements. A portion of our revenues is derived from transactions that require a significant level of judgment. This includes:
Percentage of Completion—We recognize some software license and related professional and consulting revenues using the percentage-of-completion method of accounting by relating contract costs incurred to date to total estimated contract costs at completion. This method of accounting relies on estimates of total expected contract revenues and costs. This method is used because reasonably dependable estimates of the revenues and costs applicable to various stages of a contract can be made. Because the financial reporting of these contracts depends on estimates, which are assessed continually during the term of the contracts, recognized revenues are subject to revisions as the contracts progress to completion. Revisions in estimates are reflected in the period in which the facts that give rise to a revision become known. Accordingly, favorable changes in estimates result in additional revenue recognition, and unfavorable changes in estimates result in the reversal of previously recognized revenues. When estimates indicate a loss under a contract, a provision for such loss is recorded as a component of cost of providing services and products sold. As work progresses under a loss contract, revenues continue to be recognized, and a portion of the contract loss incurred in each period is charged to the contract loss reserve.
License Arrangements—The accounting for our license and support and maintenance arrangements can be complex and requires a significant amount of judgment. Some of the factors that we must assess include: the separate elements of the arrangement; vendor-specific objective evidence of fair value for the various undelivered elements of the arrangement; whether the software fees are fixed or determinable; whether the fees are considered collectible and whether services included in the arrangement represent significant production, customization or modification of the software.
Multiple Element Outsourcing Arrangements—HR Management, which accounted for 15% of our consolidated revenues in 2009, delivers multiple services under our client arrangements (e.g., benefits administration, recruiting, payroll and learning). In connection with these arrangements, we must assess these multiple-element arrangements to determine whether they can be separated into more than one unit of accounting. The authoritative guidance for revenue arrangements with multiple deliverables establishes the following criteria, all of which must be met, in order for a deliverable to qualify as a separate unit of accounting:
| • | The delivered items have value to the client on a stand-alone basis. |
| • | There is objective and reliable evidence of the fair value of the undelivered items. |
| • | If the arrangement includes a general right of return relative to the delivered items, delivery or performance of the undelivered items is considered probable and substantially in the control of the Company. |
If these criteria are met, each of the contractual services included in the contract is treated as a separate unit of accounting and revenue is recognized as we deliver each of the contractual services. If these criteria are not met, all of the services included are accounted for as a single unit of accounting. Revenue is then recognized either using a proportional performance method such as recognizing revenue based on transactional services delivered or on a straight-line basis once HR Management begins to deliver the final service.
The assessments of these areas require us to make a significant number of judgments. The judgments made in these areas could have a significant effect on revenues recognized in any period by changing the amount and/or
36 Convergys Corporation 2009 Annual Report
Table of Contents
the timing of the revenue recognized. We believe that we make a reasonable effort to ensure accuracy in our judgment and estimates.
Other
We have made certain other estimates that, while not involving the same degree of judgment, are important to understanding our financial statements. These estimates are in the areas of measuring our obligations related to our defined benefit plans, self-insurance accruals and assessing recoverability of intangible assets.
New Accounting Pronouncements
In June 2009, the FASB issued SFAS No. 168, “The FASB Accounting Standards CodificationTM and the Hierarchy of Generally Accepted Accounting Principles – a replacement of FAS No. 162,” now codified as FASB Topic 105, “Generally Accepted Accounting Principles,” (ASC 105) in the ASC as the single source of authoritative non-governmental U.S. GAAP. ASC 105 does not change current U.S. GAAP, but is intended to simplify user access to all authoritative U.S. GAAP by providing all authoritative literature related to a particular topic in one place. All existing accounting standard documents will be superseded and all other accounting literature not included in the FASB Codification will be considered non-authoritative. The provisions of ASC 105 are effective for interim and annual periods ending after September 15, 2009 and, accordingly, are effective for the Company for the current fiscal reporting period. The adoption of this pronouncement did not have an impact on the Company’s financial condition or results of operations, but will impact our financial reporting process by eliminating all references to pre-codification standards. On the effective date of this Statement, the Codification superseded all then-existing non-SEC accounting and reporting standards, and all other non-grandfathered non-SEC accounting literature not included in the Codification became non-authoritative.
In April 2007, the FASB issued EITF 06-04, “Accounting for Deferred Compensation and Postretirement Benefit Aspects of Endorsement Split Dollar Life Insurance Arrangements” which has subsequently been codified in FASB Topic 715 in the ASC (ASC 715). This Standard requires an employer to recognize a liability for future benefits in accordance with authoritative guidance for the accounting for postretirement benefits other than pensions if, in substance, a postretirement benefit plan exists. The Company adopted ASC 715 effective January 1, 2008. Adoption of this Standard resulted in a $2.2 reduction to the retained earnings balance as of January 1, 2008.
In December 2008, the FASB issued FASB Staff Position No. FAS 132(R)-1, “Employers’ Disclosures about Postretirement Benefit Plan Assets,” which was primarily codified in FASB Topic 715, “Compensation – Retirement Benefits” in the ASC. This guidance impacts an employer’s disclosures about plan assets of a defined benefit pension or other postretirement plan. The guidance is effective for fiscal years ending after December 15, 2009. The Company has included additional information about plan assets in Note 10 of the Notes to Consolidated Financial Statements.
In May 2009, the FASB issued SFAS No. 165, “Subsequent Events”, which was codified in FASB Topic 855, “Subsequent Events” in the ASC. This guidance establishes general standards of accounting for and disclosure of events that occur after the balance sheet date but before financial statements are issued. Specifically, the guidance addresses the period after the balance sheet date during which management of a reporting entity should evaluate events or transactions that may occur for potential recognition or disclosure in the financial statements; the circumstances under which an entity should recognize events or transactions occurring after the balance sheet date in its financial statements; and the disclosures that an entity should make about events or transactions that occurred after the balance sheet date. This guidance is effective for interim or annual financial periods ending after June 15, 2009, and shall be applied prospectively. We evaluated all events or transactions that occurred after
Convergys Corporation 2009 Annual Report 37
Table of Contents
Item 7. Management’s Discussion and Analysis
of Financial Condition and Results of Operations (continued)
(Amounts in Millions Except Per Share Amounts)
December 31, 2009 through the date we issued these financial statements, February 26, 2010. See Note 20 of the Notes to Consolidated Financial Statements for disclosures related to the Company’s subsequent events.
In June 2009, the FASB issued SFAS No. 166, “Accounting for Transfers of Financial Assets” (SFAS No. 166). SFAS No. 166, which has not yet been codified in the ASC, is a revision to SFAS No. 140, “Accounting for Transfers and Servicing of Financial Assets and Extinguishments of Liabilities,” and will require more information about transfers of financial assets, including securitization transactions, and where entities have continuing exposure to the risks related to transferred financial assets. It eliminates the concept of a “qualifying special-purpose entity,” changes the requirements for derecognizing financial assets and requires additional disclosures. SFAS No. 166 will be effective at the start of a reporting entity’s first fiscal year beginning after November 15, 2009. Early application is not permitted. The Company will provide the disclosures required by this Standard in the first quarter of 2010.
In October 2009, the FASB issued ASU 2009-13, “Multiple-Deliverable Revenue Arrangements,” (amendments to FASB ASC Topic 605, “Revenue Recognition”) (ASU 2009-13) and ASU 2009-14, “Certain Arrangements That Include Software Elements,” (amendments to FASB ASC Topic 985, “Software”) (ASU 2009-14). ASU 2009-13 requires entities to allocate revenue in an arrangement using estimated selling prices of the delivered goods and services based on a selling price hierarchy. The amendments eliminate the residual method of revenue allocation and require revenue to be allocated using the relative selling price method. ASU 2009-14 removes tangible products from the scope of software revenue guidance and provides guidance on determining whether software deliverables in an arrangement that includes a tangible product are covered by the scope of the software revenue guidance. ASU 2009-13 and ASU 2009-14 should be applied on a prospective basis for revenue arrangements entered into or materially modified in fiscal years beginning on or after June 15, 2010, with early adoption permitted. The Company is currently evaluating the impact of the adoption of ASU 2009-13 or ASU 2009-14 on the Company’s consolidated results of operations and financial condition.
Risks Relating to Convergys and Its Business
Client consolidations could result in a loss of clients and adversely affect our operating results.
We serve clients in industries that have experienced a significant level of consolidation. We cannot assure that additional consolidations will not occur in which our clients acquire additional businesses or are acquired themselves. Such consolidations may result in the termination of an existing client contract, which could have an adverse effect on our operating results.
AT&T, our largest client, has substantially migrated its subscribers from the legacy wireless billing system that we supported through a managed services agreement onto AT&T’s other wireless billing system. The migration began in 2008 and was substantially complete by the end of 2009. In addition, AT&T acquired several other Convergys clients, resulting in their migration to the other billing system. The loss of revenue resulting from the AT&T related migrations was approximately $30 in 2009 compared to our 2008 Information Management revenues. In September 2005, Sprint PCS, a large data processing outsourcing client, completed its acquisition of Nextel Communications. In 2006, Sprint Nextel informed us that it intended to consolidate its billing systems onto a competitor’s system. The migration began in 2006 and was fully completed during 2009. Revenues from Sprint Nextel were down approximately $50 for 2009 compared to the corresponding period last year.
A large portion of our revenue is generated from a limited number of clients in the communications industry, and the loss of one or more of our clients, or weakness in the communications industry, could cause a reduction in our revenues and earnings.
Our three largest clients, as discussed under the section above titled “Client Concentration,” collectively represented 33.1% of our revenues for 2009. Our relationship
38 Convergys Corporation 2009 Annual Report
Table of Contents
with AT&T is represented by separate contracts/work orders with Customer Management and Information Management. Our relationships with DirecTV and Comcast Corporation are represented by contracts under Customer Management. We do not believe that it is likely that our entire relationship with AT&T would terminate at one time; and, therefore, we are not substantially dependent on any particular contract/work order. However, the loss of all of the contracts/work orders with a particular client at the same time or the loss of one or more of the larger contracts/work orders with a client would adversely affect our total revenues if the revenues from such client were not replaced with revenues from that client or other clients. Our revenues and earnings would also be negatively impacted by general weakness or slowdown in the communications industry.
A large portion of our accounts receivable is payable by a limited number of clients and the inability of any of these clients to pay its accounts receivable could cause a reduction in our revenues and earnings.
Several significant clients account for a large percentage of our accounts receivable. As of December 31, 2009, our largest clients, AT&T, DirecTV and Comcast Corporation, collectively accounted for 29.8% of our accounts receivable. During the past five years, each of these clients has generally paid its accounts receivable on a timely basis, and write-downs that we have incurred in connection with such accounts receivable were consistent with write-downs that we incurred with other clients. We anticipate that several clients will continue to account for a large percentage of our accounts receivable. Although we currently do not expect payment issues with any of these clients, if any of them were unable or unwilling, for any reason, to pay our accounts receivable, our income would decrease. We have several important clients that are in industries, including automotive, that have been severely impacted by the current global economic slowdown. We also carry significant receivable balances with other clients whose declaration of bankruptcy could decrease our income. In addition, our income could be materially impacted by a number of small clients declaring bankruptcy in a short period of time.
If our clients are not successful, the amount of business that they outsource and the prices that they are willing to pay for such services may diminish and could result in a reduction of our revenues and earnings.
Our revenues depend on the success of our clients. If our clients or their specific programs are not successful, the amount of business that they outsource may be diminished. Thus, although we have signed contracts, many of which contain minimum revenue commitments, to provide services to our clients, there can be no assurance that the level of revenues generated by such contracts will meet expectations. This could result in stranded capacity and additional costs. In addition, we may face pricing pressure from clients, which could negatively affect our operating results. Revenues in most of our larger HR Management contracts are partially based on our clients’ headcount. Our revenues could be negatively impacted by headcount reductions and restructuring actions taken by our clients.
We process, transmit and store personally identifiable information and unauthorized access to or the unintended release of this information could result in a claim for damage or loss of business and create unfavorable publicity.
We process, transmit and store personally identifiable information, both in our role as a service provider and as an employer. This information may include social security numbers, financial and health information, as well as other personal information. As a result, we are subject to certain contractual terms, as well as federal, state and foreign laws and regulations designed to protect personally identifiable information. We take measures to protect against unauthorized access and to comply with these laws and regulations. We use the internet as a mechanism for delivering our services to clients, which may expose us to potential disruptive intrusions. Unauthorized access, system denials of service, or failure to comply with data privacy laws and regulations may subject us to contractual liability and damages, loss of business, damages from individual claimants, fines, penalties, criminal prosecution
Convergys Corporation 2009 Annual Report 39
Table of Contents
Item 7. Management’s Discussion and Analysis
of Financial Condition and Results of Operations (continued)
(Amounts in Millions Except Per Share Amounts)
and unfavorable publicity, any of which could negatively affect our operating results and financial condition. In addition, third party vendors that we engage to perform services for us may have an unintended release of personally identifiable information.
Our ability to deliver our services is at risk if the technology and network equipment that we rely upon is not maintained or upgraded in a timely manner.
Technology is a critical foundation in our service delivery. We utilize and deploy internally developed and third party software solutions across various hardware environments. We operate an extensive internal voice and data network that links our global sites together in a multi-hub model that enables the rerouting of traffic. Also, we rely on multiple public communication channels for connectivity to our clients. Maintenance of and investment in these foundational components are critical to our success. If the reliability of technology or network operations falls below required service levels, or a systemic fault affects the organization broadly, business from our existing and potential clients may be jeopardized and cause our revenue to decrease.
Emergency interruption of data centers and Customer Management and HR Management contact centers could have a materially adverse effect on our financial condition and results of operations.
In the event that we experience a temporary or permanent interruption at one or more of our data or contact centers, through casualty, operating malfunction or other causes, we may be unable to provide the data processing, customer management and HR management services we are contractually obligated to deliver. This could result in us being required to pay contractual damages to some clients or to allow some clients to terminate or renegotiate their contracts. Notwithstanding disaster recovery and business continuity plans and precautions instituted to protect our clients and us from events that could interrupt delivery of services (including property and business interruption insurance that we maintain), there is no guarantee that such interruptions would not result in a prolonged interruption in our ability to provide support services to our clients or that such precautions would adequately compensate us for any losses we may incur as a result of such interruptions.
Defects or errors within our software could adversely affect our business and results of operations.
Design defects or software errors may delay software introductions or reduce the satisfaction level of clients and may have a materially adverse effect on our business and results of operations. Our software is highly complex and may, from time to time, contain design defects or software errors that may be difficult to detect and/or correct. Since both our clients and we use our software to perform critical business functions, design defects, software errors or other potential problems within or outside of our control may arise from the use of our software. It may also result in financial or other damages to our clients, for which we may be held responsible. Although our license agreements with our clients may often contain provisions designed to limit our exposure to potential claims and liabilities arising from client problems, these provisions may not effectively protect us against such claims in all cases and in all jurisdictions. Claims and liabilities arising from client problems could result in monetary damages to us and could cause damage to our reputation, adversely affecting our business and results of operations.
If the global trend toward outsourcing does not continue, our financial condition and results of operations could be materially affected.
Revenue growth depends, in large part, on the trend toward outsourcing, particularly as it relates to our Customer Management operations. Outsourcing involves companies contracting with a third party, such as Convergys, to provide customer management services rather than performing such services in-house. There can be no assurance that this trend will continue, as organizations may elect to perform such services in-house. A significant change in this trend could have a materially adverse effect on our financial condition and results of operations.
40 Convergys Corporation 2009 Annual Report
Table of Contents
We are susceptible to business and political risks from domestic and international operations that could result in reduced revenues or earnings.
We operate a global business and have facilities located throughout North and South America, Europe, the Middle East and the Asian Pacific region. As part of our strategy, we plan to capture more of the international BSS and customer management markets. Additionally, North American companies require off-shore customer management outsourcing capacity. As a result, we expect to continue expansion through start-up operations and acquisitions in foreign countries. Expansion of our existing international operations and entry into additional countries will require management attention and financial resources. In addition, there are certain risks inherent in conducting business internationally including: exposure to currency fluctuations, longer payment cycles, greater difficulties in accounts receivable collection, difficulties in complying with a variety of foreign laws, changes in legal or regulatory requirements, difficulties in staffing and managing foreign operations, political instability and potentially adverse tax consequences. To the extent that we are adversely affected by these risks, our business could be adversely affected and our revenues and/or earnings could be reduced.
In addition, there has been political discussion and debate related to worldwide competitive sourcing, labor-related legislation and information-flow restrictions, particularly from the United States to off-shore locations. Federal and state legislation has been proposed that relates to this issue. Future legislation, if enacted, could have an adverse effect on our results of operations and financial condition. In particular, proposed legislation, known as the Employee Free Choice Act, if enacted in its current form or a similar variation thereof, could make it easier for union organizing drives to be successful and could give third party arbitrators the ability to impose terms of collective bargaining upon both the Company and a labor union if the parties are unable to agree to the terms of a collective bargaining agreement within specified timelines.
Our earnings are affected by changes in foreign currency.
Customer Management serves an increasing number of its U.S.-based clients using contact center capacity in the Philippines, India and Canada. About one-half of our approximately 60,000 contact center employees are located outside the United States. Although the contracts with these clients are typically priced in U.S. dollars, a substantial portion of the costs incurred by Customer Management to render services under these contracts is denominated in Philippine pesos, Indian rupees or Canadian dollars, which represents a foreign exchange exposure to the Company. We enter into forward exchange contracts and options to limit potential foreign currency exposure. As the U.S. dollar weakens the operating expenses of these contact centers, translated into U.S. dollars, increase. The increase in operating expenses will be partially offset by gains realized through the settlement of the hedged instruments. As the derivative instruments that limit our potential foreign currency exposures are entered into over a period of several years, the overall impact to earnings will be determined by both the timing of the derivative instruments and the movement of the U.S. dollar. In addition to the impact on our operating expenses that support dollar-denominated Customer Management contracts, changes in foreign currency impact the results of our international business units that are located outside of North America. In 2009, 16.5% of our revenues were generated outside of North America.
If we do not effectively manage our capacity, our results of operations could be adversely affected.
Our ability to profit from the global trend toward outsourcing depends largely on how effectively we manage our Customer Management and HR Management contact center capacity. In order to create the additional capacity necessary to accommodate new or expanded outsourcing projects, we may need to open new contact centers. The opening or expansion of a contact center may result, at least in the short term, in idle capacity until we fully implement the new or expanded program. Expanded use of home agents is helping to mitigate this risk. We periodi -
Convergys Corporation 2009 Annual Report 41
Table of Contents
Item 7. Management’s Discussion and Analysis
of Financial Condition and Results of Operations (continued)
(Amounts in Millions Except Per Share Amounts)
cally assess the expected long-term capacity utilization of our contact centers. As a result, we may, if deemed necessary, consolidate, close or partially close under-performing contact centers to maintain or improve targeted utilization and margins. There can be no guarantee that we will be able to achieve or maintain optimal utilization of our contact center capacity.
As part of our effort to consolidate our facilities, we seek to sublease a portion of our surplus space, if any, and recover certain costs associated with it. To the extent that we fail to sublease such surplus space, our expenses will increase.
If we are unable to hire or retain qualified personnel in certain areas of our business, our ability to execute our business plans in those areas could be impaired and revenues could decrease.
We employ approximately 70,000 employees worldwide. At times, we have experienced difficulties in hiring personnel with the desired levels of training or experience. Additionally, in regard to the labor-intensive business of Customer Management, quality service depends on our ability to retain employees and control personnel turnover. Any increase in the employee turnover rate could increase recruiting and training costs and could decrease operating effectiveness and productivity. We may not be able to continue to hire, train and retain a sufficient number of qualified personnel to adequately staff new client projects. Because a significant portion of our operating costs relates to labor costs, an increase in wages, costs of employee benefits or employment taxes could have a materially adverse effect on our business, results of operations or financial condition.
War and terrorist attacks or other civil disturbances could lead to economic weakness and could disrupt our operations resulting in a decrease of our revenues and earnings.
In the recent past, war and terrorist attacks have caused uncertainty in the global financial markets and economy. Additional attacks and wars could contribute to economic instability in the United States and disrupt our operations in the U.S. and abroad. Such disruptions could cause service interruptions or reduce the quality level of the services that we provide, resulting in a reduction of our revenues. These activities may also cause our clients to delay or defer decisions regarding their use of our services and, thus, delay receipt of additional revenues. In addition, war and terrorist attacks in other regions could disrupt our operations and/or create economic uncertainty with our clients, which could cause a reduction in revenues and earnings.
General economic and market conditions may adversely affect our financial condition, cash flow and results of operations.
Our results of operations are affected directly by the level of business activity of our clients, which in turn are affected by the level of economic activity in the industries and markets that they serve. Economic slowdowns in some markets, particularly in the United States, may cause reductions in technology and discretionary spending by our clients, which may result in reductions in the growth of new business as well as reductions in existing business. If our clients enter bankruptcy or liquidate their operations, our revenues could be adversely affected. There can be no assurance that weakening economic conditions throughout the world will not adversely impact our results of operations, cash flow and/or financial position. Further deterioration in equity markets will reduce the funded status of our pension plan, which will increase future required contributions. Reduced demand for our services could increase price competition.
We need to maintain adequate liquidity in order to have sufficient cash to meet operating cash flow requirements and to repay maturing debt and other obligations. If we fail to comply with the covenants contained in our various borrowing agreements, it may adversely affect our liquidity, results of operations and financial condition.
Our liquidity is a function of our ability to successfully generate cash flows from a combination of operations and access to capital markets. As of December 31, 2009, total cash and cash equivalents was $331.7. We believe our liquidity (including operating and other cash flows that we expect to generate) will be sufficient to meet operating requirements and required debt repayments as
42 Convergys Corporation 2009 Annual Report
Table of Contents
they occur; however, our ability to maintain sufficient liquidity going forward depends on our ability to generate cash from operations and access capital markets. As further described in the “Capital Resources” section of the Management Discussion and Analysis, our $400.0 revolving credit agreement, which was fully drawn at December 31, 2009, contains certain restrictive covenants. At December 31, 2009, we were in compliance with all covenants in the agreements.
Our results of operations could be adversely affected by litigation and other commitments and contingencies.
The Company faces risks arising from various unasserted and asserted litigation matters, including, but not limited to, commercial, securities law and patent infringement claims. Unfavorable outcomes in pending litigation matters, or in future litigation, could negatively affect us. Aggressive plaintiffs’ counsel often file litigation on a wide variety of allegations, and even when the allegations are groundless, we may need to expend considerable funds and other resources to respond to such litigation.
In the ordinary course of business, we may make certain commitments, including representations, warranties and indemnities relating to current and past operations, including those related to acquired or divested businesses and issue guarantees of third party obligations.
If we were required to make payments as a result of any of these matters, they could exceed the amounts accrued, thereby adversely affecting our results of operations, cash flows, financial condition, or business.
Our failure to successfully integrate or acquire businesses could cause our business to suffer.
Our expansion and growth may be dependent in part on our ability to make acquisitions. The risks we face related to acquisitions include that we could overpay for acquired businesses, face integration challenges, have difficulty finding appropriate acquisition candidates, and any acquired business could significantly under-perform relative to our expectations. If acquisitions are not successfully integrated, our revenues and profitability could be adversely affected as well as adversely impact our reputation. Our Board of Directors reviews our businesses, including acquired businesses, on an ongoing basis to assess how and to what extent they contribute to our strategic goals. Businesses that they determine are not strategic could be divested at any time.
Our debt ratings are not considered investment grade.
In 2008, both Moody’s and Standard and Poor’s downgraded our debt ratings to below investment grade. This could impact our ability to raise capital in the future as well as increase borrowing costs. In addition, prospective clients and vendors may be less willing to do business with a provider with higher perceived credit risk or demand more onerous terms.
We may incur additional non-cash goodwill impairment charges in the future.
As described in Note 6 of the Notes to Consolidated Financial Statements, we test goodwill for impairment annually as of October 1 and at other times if events have occurred or circumstances exist that indicates the carrying value of goodwill may no longer be recoverable. Although no goodwill impairment charges were recorded during 2009, during 2008 we recorded a non-cash goodwill impairment charge of $61.1. There can be no assurances that we will not incur additional charges in the future, particularly in the event of a prolonged economic slowdown.
We sometimes rely on business partners to market, develop and deliver our solutions. Their failure to perform could negatively impact our financial results and harm our reputation in the marketplace.
We use third party business partners to assist in project implementations, to provide components of our solutions and to expand our ability to sell into new markets. Failure of third parties to perform in a timely manner could result in contractual or regulatory penalties, project delays or cost overruns as well as a failure to close new business.
Convergys Corporation 2009 Annual Report 43
Table of Contents
Item 7. Management’s Discussion and Analysis
of Financial Condition and Results of Operations (continued)
(Amounts in Millions Except Per Share Amounts)
Our accounting for our long-term contracts requires using estimates and projections that may change over time. Such changes may have a significant or adverse effect on our reported results of operations and Consolidated Balance Sheet.
Projecting contract profitability on our long-term outsourcing contracts requires us to make assumptions and estimates of future contract results. All estimates are inherently uncertain and subject to change. In an effort to maintain appropriate estimates, we review each of our long-term outsourcing contracts, the related contract reserves and intangible assets on a regular basis. If we determine that we need to change our estimates for a contract, we will change the estimates in the period in which the determination is made. These assumptions and estimates involve the exercise of judgment and discretion, which may also evolve over time in light of operational experience, regulatory direction, developments in accounting principles and other factors. Further, initially foreseen effects could change over time as a result of changes in assumptions, estimates or developments in the business or the application of accounting principles related to long-term outsourcing contracts. Any such changes may have a significant or adverse effect on our reported results of operations and Consolidated Balance Sheet.
The outsourcing and consulting markets in which we operate include a large number of service providers and are highly competitive.
Many of our competitors are expanding the services they offer in an attempt to gain additional business. In addition, new competitors, alliances among competitors or mergers of competitors could emerge and gain significant market share and some of our competitors may have or may develop a lower cost structure, adopt more aggressive pricing policies or provide services that gain greater market acceptance than the services that we offer or develop. Large and well-capitalized competitors may be able to better respond to the need for technological changes faster, price their services more aggressively, compete for skilled professionals, finance acquisitions, fund internal growth and compete for market share. In order to respond to increased competition and pricing pressure, we may have to lower our pricing structure, which would have an adverse effect on our revenues and profit margin.
Our business performance and growth plans may be negatively affected if we are unable to manage effectively changes in the application and use of technology.
The utilization of technology in our industry has and will continue to increase rapidly. Our future success depends, in part, upon our ability to develop and implement technology solutions that anticipate and keep pace with continuing changes in technology, industry standards and client preferences. We may not be successful in anticipating or responding to these developments on a timely and cost-effective basis, and our ideas may not be accepted in the marketplace. Additionally, the effort to gain technological expertise and develop new technologies in our business requires us to incur significant expenses. If we cannot offer new technologies as quickly as our competitors or if our competitors develop more cost-effective technologies, it could have a material adverse effect on our ability to obtain and complete customer engagements. Also, if customer preferences for technology significantly disproportionately outpace other interaction preferences, it could have a material adverse impact on our revenue profile and growth plans.
44 Convergys Corporation 2009 Annual Report
Table of Contents
Item 7A. and 8.
Item 7A. Quantitative and Qualitative Disclosures about
Market Risk
The information required by Item 7A is included in Item 7 of this Form 10-K.
Item 8. Financial Statements and Supplementary Data
Beginning on page 47 are the Consolidated Financial Statements with applicable notes and the related Reports of Independent Registered Public Accounting Firm and the supplementary financial information specified by Item 302 of Regulation S-K.
Convergys Corporation 2009 Annual Report 45
Table of Contents
Report of Management
Management’s Responsibilities for and Audit Committee Oversight of the Financial Reporting Process
The management of Convergys Corporation is responsible for the preparation, integrity and fair presentation of the Consolidated Financial Statements and all related information appearing in this Annual Report. The Consolidated Financial Statements and notes have been prepared in conformity with accounting principles generally accepted in the United States and include certain amounts, which are estimates based upon currently available information, and management’s judgment of current conditions and circumstances.
The Audit Committee, consisting entirely of independent directors, meets regularly with management, the compliance officer, internal auditors and the independent registered public accounting firm, and reviews audit plans and results, as well as management’s actions taken in discharging responsibilities for accounting, financial reporting and internal control. Ernst & Young LLP, independent registered public accounting firm, and the internal auditors have direct and confidential access to the Audit Committee at all times to discuss the results of their examinations.
Management’s Report on Internal Control over Financial Reporting
Convergys’ management is also responsible for establishing and maintaining adequate internal control over financial reporting that is designed to produce reliable Financial Statements in conformity with accounting principles generally accepted in the United States. The system of internal control over financial reporting is evaluated for effectiveness by management and tested for reliability through a program of internal audits. Actions are taken to correct potential deficiencies as they are identified. Any internal control system, no matter how well designed, has inherent limitations, including the possibility that a control can be circumvented or overridden and misstatements due to error or fraud may occur and may not be detected. Also, because of changes in conditions, internal control effectiveness may vary over time. Accordingly, even an effective system of internal control will provide only reasonable assurance with respect to Financial Statement preparation and presentation.
Convergys’ management assessed the effectiveness of the Company’s internal control over financial reporting as of December 31, 2009. In making this assessment, it used the criteria set forth by the Committee of Sponsoring Organizations of the Treadway Commission (COSO) in Internal Control—Integrated Framework. Based on its assessment, management has concluded that, as of December 31, 2009, the Company’s internal control over financial reporting is effective based on those criteria.
Convergys engaged Ernst & Young LLP in 2009 to perform an integrated audit of the Consolidated Financial Statements in accordance with auditing standards of the Public Company Accounting Oversight Board (United States). Their report appears on page 48. Additionally, Ernst & Young LLP has issued an audit report on the Company’s internal control over financial reporting. That report appears on page 47.
| /s/ Jeffrey H. Fox |
| Jeffrey H. Fox |
| Chief Executive Officer |
| /s/ Earl C. Shanks |
| Earl C. Shanks |
| Chief Financial Officer |
46 Convergys Corporation 2009 Annual Report
Table of Contents
Report of Independent Registered Public Accounting Firm
The Board of Directors and Shareholders of
Convergys Corporation
We have audited Convergys Corporation’s internal control over financial reporting as of December 31, 2009, based on criteria established in Internal Control—Integrated Framework issued by the Committee of Sponsoring Organizations of the Treadway Commission (the COSO criteria). Convergys Corporation’s management is responsible for maintaining effective internal control over financial reporting, and for its assessment of the effectiveness of internal control over financial reporting included in the accompanying Report of Management. Our responsibility is to express an opinion on the company’s internal control over financial reporting based on our audit.
We conducted our audit in accordance with the standards of the Public Company Accounting Oversight Board (United States). Those standards require that we plan and perform the audit to obtain reasonable assurance about whether effective internal control over financial reporting was maintained in all material respects. Our audit included obtaining an understanding of internal control over financial reporting, assessing the risk that a material weakness exists, testing and evaluating the design and operating effectiveness of internal control based on the assessed risk, and performing such other procedures as we considered necessary in the circumstances. We believe that our audit provides a reasonable basis for our opinion.
A company’s internal control over financial reporting is a process designed to provide reasonable assurance regarding the reliability of financial reporting and the preparation of financial statements for external purposes in accordance with generally accepted accounting principles. A company’s internal control over financial reporting includes those policies and procedures that (1) pertain to the maintenance of records that, in reasonable detail, accurately and fairly reflect the transactions and dispositions of the assets of the company; (2) provide reasonable assurance that transactions are recorded as necessary to permit preparation of financial statements in accordance with generally accepted accounting principles, and that receipts and expenditures of the company are being made only in accordance with authorizations of management and directors of the company; and (3) provide reasonable assurance regarding prevention or timely detection of unauthorized acquisition, use, or disposition of the company’s assets that could have a material effect on the financial statements.
Because of its inherent limitations, internal control over financial reporting may not prevent or detect misstatements. Also, projections of any evaluation of effectiveness to future periods are subject to the risk that controls may become inadequate because of changes in conditions, or that the degree of compliance with the policies or procedures may deteriorate.
In our opinion, Convergys Corporation maintained, in all material respects, effective internal control over financial reporting as of December 31, 2009, based on the COSO criteria.
We also have audited, in accordance with the standards of the Public Company Accounting Oversight Board (United States), the consolidated balance sheets of Convergys Corporation as of December 31, 2009 and 2008, and the related consolidated statements of operations and comprehensive income (loss), shareholders’ equity, and cash flows for each of the three years in the period ended December 31, 2009 and our report dated February 26, 2010 expressed an unqualified opinion thereon.
| /s/ Ernst & Young LLP |
| Ernst & Young LLP |
| Cincinnati, Ohio |
| February 26, 2010 |
Convergys Corporation 2009 Annual Report 47
Table of Contents
Report of Independent Registered Public Accounting Firm
To the Board of Directors and Shareholders of Convergys Corporation
We have audited the accompanying consolidated balance sheets of Convergys Corporation as of December 31, 2009 and 2008, and the related consolidated statements of operations and comprehensive income (loss), shareholders’ equity, and cash flows for each of the three years in the period ended December 31, 2009. Our audits also included the financial statement schedule listed in the Index at Item 15(a). These financial statements and schedule are the responsibility of the Company’s management. Our responsibility is to express an opinion on these financial statements and schedule based on our audits.
We conducted our audits in accordance with the standards of the Public Company Accounting Oversight Board (United States). Those standards require that we plan and perform the audit to obtain reasonable assurance about whether the financial statements are free of material misstatement. An audit includes examining, on a test basis, evidence supporting the amounts and disclosures in the financial statements. An audit also includes assessing the accounting principles used and significant estimates made by management, as well as evaluating the overall financial statement presentation. We believe that our audits provide a reasonable basis for our opinion.
In our opinion, the financial statements referred to above present fairly, in all material respects, the consolidated financial position of Convergys Corporation at December 31, 2009 and 2008, and the consolidated results of its operations and its cash flows for each of the three years in the period ended December 31, 2009, in conformity with U.S. generally accepted accounting principles. Also, in our opinion, the related financial statement schedule referred to above, when considered in relation to the basic financial statements taken as a whole, presents fairly, in all material respects, the information set forth therein.
As discussed in Note 15 to the Consolidated Financial Statements, at January 1, 2007, Convergys Corporation changed its method of accounting for income taxes with the adoption of FASB Interpretation No. 48, “Accounting for Uncertainty in Income Taxes, an interpretation of FASB Statement No. 109” (codified primarily in FASB ASC Topic 740, “Income Taxes”). Additionally, as discussed in Note 10 to the Consolidated Financial Statements, at January 1, 2008, Convergys Corporation changed its method of accounting for certain employee benefit plans with the adoption of Emerging Issues Task Force Issue No. 06-04, “Accounting for Deferred Compensation and Postretirement Benefit Aspects of Endorsement Split-Dollar Life Insurance Arrangements” (codified primarily in FASB ASC Topic 715, “Compensation – Retirement Benefits”).
We also have audited, in accordance with the standards of the Public Company Accounting Oversight Board (United States), Convergys Corporation’s internal control over financial reporting as of December 31, 2009, based on criteria established in Internal Control-Integrated Framework issued by the Committee of Sponsoring Organizations of the Treadway Commission and our report dated February 26, 2010, expressed an unqualified opinion thereon.
| /s/ Ernst & Young LLP |
| Ernst & Young LLP |
| Cincinnati, Ohio |
| February 26, 2010 |
48 Convergys Corporation 2009 Annual Report
Table of Contents
Consolidated Statements of Operations and Comprehensive Income (Loss)
| Year Ended December 31, | ||||||||||||
| (Amounts In Millions Except Per Share Amounts) | 2009 | 2008 | 2007 | |||||||||
| Revenues | $ | 2,827.2 | $ | 2,785.8 | $ | 2,844.3 | ||||||
| Operating Costs and Expenses: | ||||||||||||
| Cost of providing services and products sold (1) |
1,925.8 | 1,892.9 | 1,837.9 | |||||||||
| Selling, general and administrative expenses |
648.8 | 593.8 | 554.9 | |||||||||
| Research and development costs |
74.2 | 54.9 | 73.4 | |||||||||
| Depreciation |
118.9 | 119.0 | 115.4 | |||||||||
| Amortization |
11.7 | 13.5 | 9.0 | |||||||||
| Restructuring charges |
47.0 | 34.4 | 3.4 | |||||||||
| Asset impairment |
113.6 | 268.6 | 5.5 | |||||||||
| Total costs and expenses |
2,940.0 | 2,977.1 | 2,599.5 | |||||||||
| Operating (Loss) Income | (112.8 | ) | (191.3 | ) | 244.8 | |||||||
| Equity in earnings of Cellular Partnerships | 41.0 | 35.7 | 14.3 | |||||||||
| Other income (expense), net | (16.9 | ) | 14.3 | 4.0 | ||||||||
| Interest expense | (28.9 | ) | (22.6 | ) | (17.5 | ) | ||||||
| (Loss) income before income taxes | (117.6 | ) | (163.9 | ) | 245.6 | |||||||
| Income tax (benefit) expense | (40.3 | ) | (71.0 | ) | 76.1 | |||||||
| Net (Loss) Income | $ | (77.3 | ) | $ | (92.9 | ) | $ | 169.5 | ||||
| Other Comprehensive (Loss) Income, net of tax: | ||||||||||||
| Foreign currency translation adjustments |
$ | 25.4 | $ | (59.4 | ) | $ | 12.9 | |||||
| Change related to pension liability (net of tax benefit (expense) of ($2.4), $12.2 and ($0.9)) |
2.2 | (20.3 | ) | 1.6 | ||||||||
| Unrealized gain (loss) on hedging activities (net of tax benefit (expense) of ($27.9), $57.5 and ($17.3)) |
51.8 | (107.0 | ) | 32.1 | ||||||||
| Total Comprehensive Income (Loss) | $ | 2.1 | $ | (279.6 | ) | $ | 216.1 | |||||
| (Loss) earnings per share: | ||||||||||||
| Basic |
$ | (0.63 | ) | $ | (0.75 | ) | $ | 1.26 | ||||
| Diluted |
$ | (0.63 | ) | $ | (0.75 | ) | $ | 1.23 | ||||
| Weighted average common shares outstanding: | ||||||||||||
| Basic |
122.8 | 123.5 | 134.1 | |||||||||
| Diluted |
122.8 | 123.5 | 137.7 | |||||||||
| (1) | Exclusive of depreciation and amortization, with the exception of amortization of deferred charges as disclosed in Note 7 of Notes to Consolidated Financial Statements. |
| The accompanying notes are an integral part of the Financial Statements. |
Convergys Corporation 2009 Annual Report 49
Table of Contents
| At December 31, | ||||||||
| (In Millions) | 2009 | 2008 | ||||||
| Assets | ||||||||
| Current Assets | ||||||||
| Cash and cash equivalents |
$ | 331.7 | $ | 240.0 | ||||
| Receivables, net of allowances of $17.6 and $10.8 |
433.1 | 523.8 | ||||||
| Deferred income tax benefits |
41.5 | 85.8 | ||||||
| Prepaid expenses |
41.3 | 36.0 | ||||||
| Other current assets |
113.5 | 92.4 | ||||||
| Total current assets |
961.1 | 978.0 | ||||||
| Property and equipment, net | 367.7 | 420.9 | ||||||
| Goodwill, net | 1,048.6 | 1,034.9 | ||||||
| Other intangibles, net | 50.2 | 68.8 | ||||||
| Investments in Cellular Partnerships | 52.7 | 51.4 | ||||||
| Deferred charges | 52.8 | 243.8 | ||||||
| Other assets | 80.5 | 43.6 | ||||||
| Total Assets |
$ | 2,613.6 | $ | 2,841.4 | ||||
| Liabilities and Shareholders’ Equity | ||||||||
| Current Liabilities | ||||||||
| Debt maturing within one year |
$ | 405.2 | $ | 259.5 | ||||
| Payables, deferred revenue and other current liabilities |
483.9 | 538.7 | ||||||
| Total current liabilities |
889.1 | 798.2 | ||||||
| Long-term debt | 64.4 | 406.4 | ||||||
| Deferred income tax liability | 57.7 | 39.5 | ||||||
| Accrued pension liability | 131.3 | 138.2 | ||||||
| Deferred revenue | 89.5 | 134.9 | ||||||
| Other long-term liabilities | 175.2 | 174.1 | ||||||
| Total liabilities |
1,407.2 | 1,691.3 | ||||||
| Shareholders’ Equity | ||||||||
| Preferred shares—without par value, 5.0 authorized; none outstanding |
— | — | ||||||
| Common shares—without par value, 500.0 authorized; |
||||||||
| 183.3 and 182.8 issued, 123.1 and 122.1 outstanding, as of December 31, 2009 and December 31, 2008, respectively |
1,048.1 | 1,034.2 | ||||||
| Additional paid-in capital |
36.0 | — | ||||||
| Treasury stock—60.2 shares in 2009 and 60.7 in 2008 |
(1,042.0 | ) | (1,050.0 | ) | ||||
| Retained earnings |
1,221.3 | 1,302.3 | ||||||
| Accumulated other comprehensive income (loss) |
(57.0 | ) | (136.4 | ) | ||||
| Total shareholders’ equity |
1,206.4 | 1,150.1 | ||||||
| Total Liabilities and Shareholders’ Equity |
$ | 2,613.6 | $ | 2,841.4 | ||||
The accompanying notes are an integral part of the Financial Statements.
50 Convergys Corporation 2009 Annual Report
Table of Contents
Consolidated Statements of Cash Flows
| Year Ended December 31, | ||||||||||||
| (Amounts in Millions) | 2009 | 2008 | 2007 | |||||||||
| Cash Flows from Operating Activities: | ||||||||||||
| Net (loss) income |
$ | (77.3 | ) | $ | (92.9 | ) | $ | 169.5 | ||||
| Adjustments to reconcile net (loss) income to net cash provided by operating activities: |
||||||||||||
| Depreciation and amortization |
130.6 | 132.5 | 124.4 | |||||||||
| Asset impairment |
113.6 | 268.6 | 5.5 | |||||||||
| Deferred income tax (benefit) expense |
(23.6 | ) | (41.5 | ) | 46.6 | |||||||
| Equity in earnings of Cellular Partnerships |
(41.0 | ) | (35.7 | ) | (14.3 | ) | ||||||
| Stock compensation |
19.1 | 19.4 | 25.6 | |||||||||
| Changes in assets and liabilities, net of effects from acquisitions: |
||||||||||||
| Change in receivables |
102.6 | 41.7 | (19.3 | ) | ||||||||
| Change in other current assets |
(14.5 | ) | (23.3 | ) | (25.4 | ) | ||||||
| Change in deferred charges, net |
93.2 | (143.6 | ) | (47.5 | ) | |||||||
| Change in other assets and liabilities |
(3.6 | ) | 72.1 | 8.2 | ||||||||
| Change in payables and other current liabilities |
(37.1 | ) | (3.9 | ) | (58.4 | ) | ||||||
| Other, net |
2.7 | (1.1 | ) | (5.0 | ) | |||||||
| Net cash provided by operating activities |
264.7 | 192.3 | 209.9 | |||||||||
| Cash Flows from Investing Activities: | ||||||||||||
| Capital expenditures |
(74.9 | ) | (100.5 | ) | (102.3 | ) | ||||||
| Sales of variable rate securities, net |
— | — | 20.5 | |||||||||
| Return of capital from Cellular Partnerships |
40.0 | 39.2 | 8.8 | |||||||||
| Acquisitions, net of cash acquired |
(3.1 | ) | (312.2 | ) | (2.8 | ) | ||||||
| Proceeds from disposal of property and equipment |
— | 8.4 | 1.0 | |||||||||
| Net cash used in investing activities |
(38.0 | ) | (365.1 | ) | (74.8 | ) | ||||||
| Cash Flows from Financing Activities: | ||||||||||||
| Borrowings (repayments) of credit facilities and other debt, net |
(135.0 | ) | 6.0 | (7.8 | ) | |||||||
| Borrowings under revolving credit facility |
— | 400.0 | — | |||||||||
| Purchase of treasury shares |
— | (116.6 | ) | (181.3 | ) | |||||||
| Repayments under Canadian & UK credit facility, net |
— | — | (75.8 | ) | ||||||||
| Other, net |
— | 3.1 | 14.2 | |||||||||
| Net cash (used) provided by financing activities |
(135.0 | ) | 292.5 | (250.7 | ) | |||||||
| Net increase (decrease) in cash and cash equivalents | 91.7 | 119.7 | (115.6 | ) | ||||||||
| Cash and cash equivalents at beginning of year | 240.0 | 120.3 | 235.9 | |||||||||
| Cash and cash equivalents at end of year | $ | 331.7 | $ | 240.0 | $ | 120.3 | ||||||
| Supplemental Cash Flow Information: | ||||||||||||
| Cash paid for interest |
$ | 31.1 | $ | 19.6 | $ | 17.5 | ||||||
| Income taxes paid, net of refunds |
$ | (13.5 | ) | $ | (13.0 | ) | $ | 36.2 | ||||
The accompanying notes are an integral part of the Financial Statements.
Convergys Corporation 2009 Annual Report 51
Table of Contents
Consolidated Statements of Shareholders’ Equity
| (Amounts in Millions) | Number of Common Shares |
Common Shares |
Additional Paid-In Capital |
Treasury Stock |
Retained Earnings |
Accumulated Other Comprehensive Income (Loss) |
Total | ||||||||||||||||||
| Balance at January 1, 2007 | 179.6 | $ | 965.1 | $ | — | $ | (749.4 | ) | $ | 1,235.7 | $ | 3.7 | $ | 1,455.1 | |||||||||||
| Adoption of FIN 48 |
(7.8 | ) | (7.8 | ) | |||||||||||||||||||||
| Issuance of common shares |
1.6 | 6.6 | 6.6 | ||||||||||||||||||||||
| Excess tax benefits from share-based payment arrangements |
7.6 | 7.6 | |||||||||||||||||||||||
| Repurchase of common shares |
(184.0 | ) | (184.0 | ) | |||||||||||||||||||||
| Net income |
169.5 | 169.5 | |||||||||||||||||||||||
| Other comprehensive income |
46.6 | 46.6 | |||||||||||||||||||||||
| Amortization of stock-based compensation |
28.1 | 28.1 | |||||||||||||||||||||||
| Balance at December 31, 2007 | 181.2 | 1,007.4 | — | (933.4 | ) | 1,397.4 | 50.3 | 1,521.7 | |||||||||||||||||
| Issuance of common shares |
1.6 | 3.5 | 3.5 | ||||||||||||||||||||||
| Tax related to share-based arrangements, net of excess tax benefits |
(11.3 | ) | (11.3 | ) | |||||||||||||||||||||
| Foreign tax valuation allowance release |
15.2 | 15.2 | |||||||||||||||||||||||
| Repurchase of common shares |
(116.6 | ) | (116.6 | ) | |||||||||||||||||||||
| Net loss |
(92.9 | ) | (92.9 | ) | |||||||||||||||||||||
| Adoption of ASC 715 |
(2.2 | ) | (2.2 | ) | |||||||||||||||||||||
| Other comprehensive loss |
(186.7 | ) | (186.7 | ) | |||||||||||||||||||||
| Amortization of stock-based compensation |
19.4 | 19.4 | |||||||||||||||||||||||
| Balance at December 31, 2008 | 182.8 | 1,034.2 | — | (1,050.0 | ) | 1,302.3 | (136.4 | ) | 1,150.1 | ||||||||||||||||
| Issuance of common shares |
0.5 | 3.9 | 3.9 | ||||||||||||||||||||||
| Treasury shares issued for share-based plans, net |
8.0 | (3.7 | ) | 4.3 | |||||||||||||||||||||
| Tax related to share-based arrangements, net of excess tax benefits |
(9.1 | ) | (9.1 | ) | |||||||||||||||||||||
| Equity component of 2029 Convertible Debentures, net of deferred tax liability |
36.0 | 36.0 | |||||||||||||||||||||||
| Net loss |
(77.3 | ) | (77.3 | ) | |||||||||||||||||||||
| Other comprehensive income |
79.4 | 79.4 | |||||||||||||||||||||||
| Amortization of stock-based compensation |
19.1 | 19.1 | |||||||||||||||||||||||
| Balance at December 31, 2009 | 183.3 | $ | 1,048.1 | $ | 36.0 | $ | (1,042.0 | ) | $ | 1,221.3 | $ | (57.0 | ) | $ | 1,206.4 | ||||||||||
The accompanying notes are an integral part of the Financial Statements.
52 Convergys Corporation 2009 Annual Report
Table of Contents
Notes to Consolidated Financial Statements
(Amounts in Millions Except Share and Per Share Amounts)
1. Background and Basis of Presentation
Convergys Corporation (the Company or Convergys) is a global leader in relationship management. The Company provides solutions that drive more value from the relationships its clients have with their customers and employees. Convergys turns these everyday interactions into a source of profit and strategic advantage for the Company’s clients. The Company’s unique combination of domain expertise, operational excellence and innovative technologies has delivered process improvement and actionable business insight to clients to enhance their relationships with customers and employees. The Company reports three segments: (i) Customer Management, which provides agent-assisted services, self-service, and intelligent technology care solutions; (ii) Information Management, which provides business support system (BSS) solutions; and (iii) HR Management, which provides global human resource business process outsourcing (HR BPO) solutions.
2. Accounting Policies
Consolidation — The Consolidated Financial Statements include the accounts of the Company’s majority-owned subsidiaries. All significant intercompany accounts and transactions are eliminated upon consolidation.
Reclassification — Certain prior year amounts have been reclassified to conform to current year presentation.
Use of Estimates — Preparation of Financial Statements in conformity with accounting principles generally accepted in the United States requires management to make estimates and assumptions that affect the amounts reported. These estimates include project completion dates, time and cost required to complete projects for purposes of revenue recognition and future revenue, expense and cash flow estimates for purposes of impairment analysis and loss contract evaluation. Actual results could differ from those estimates.
Foreign Currency — Assets and liabilities of foreign operations are translated to U.S. dollars at year-end exchange rates. Revenues and expenses are translated at average exchange rates for the year. Translation adjustments are accumulated and reflected as adjustments to comprehensive income (loss). Gains or losses resulting from foreign exchange transactions are recorded in the Consolidated Statements of Operations and Comprehensive Income (Loss) within other income (expense), net.
Revenue Recognition — Revenues from Customer Management and HR Management, which accounted for 70% and 15%, respectively, of the Company’s 2009 consolidated revenues, mostly consist of fees generated from outsourced services provided to the Company’s clients. Information Management, which accounted for 15% of 2009 consolidated revenues, generates its revenues from three primary sources: data processing, professional and consulting services and license and other services.
The Company’s revenues are recognized in conformity with Securities and Exchange Commission Staff Accounting Bulletin No. 104, “Revenue Recognition,” Accounting Standards Codification (ASC) 605, “Revenue Arrangements with Multiple Deliverables” (ASC 605), and ASC 985, “Software Revenue Recognition” (ASC 985). Revenues are recognized only when there is evidence of an arrangement and the Company determines that the fee is fixed and determinable and collection of the fee included in the arrangement is considered probable. When determining whether the fee is considered fixed and determinable and collection is probable, the Company considers a number of factors including the creditworthiness of the client and the contractual payment terms. If a client is not considered creditworthy, all revenue under arrangements with that client is recognized upon receipt of cash. If payment terms extend beyond what is considered customary or standard in the related industry and geographic location, the related fees are considered extended and deferred until they become due and payable.
Approximately 90% of Customer Management revenues are derived from agent-related services. The Company typically recognizes these revenues as services are performed based on staffing hours or the number of contacts handled by
Convergys Corporation 2009 Annual Report 53
Table of Contents
Notes to Consolidated Financial Statements (continued)
(Amounts in Millions Except Share and Per Share Amounts)
service agents using contractual rates. In a limited number of engagements where the client pays a fixed fee, the Company recognizes revenues, based on the specific facts and circumstances of the engagement, using the proportional performance method or upon final completion of the engagement. Customer Management’s remaining revenues are derived from sale of premise-based and hosted automated self-care and technology solutions. License, professional and consulting and maintenance and software support services revenues recognized from sale of these advanced speech recognition solutions are recognized pursuant to ASC 985, more fully described below with Information Management revenues.
Professional and consulting revenues accounted for 37% of the 2009 Information Management revenues. These revenues consist of fees generated for installation, implementation, customization, training and managed services related either to the clients’ use of Information Management’s software in Information Management’s data centers or in their own processing environments. The professional and consulting revenues are recognized monthly based on time and materials incurred at contractually agreed upon rates or, in some instances, based upon a fixed fee. Professional and consulting services provided in connection with license arrangements are evaluated to determine whether those services are essential to the client’s functionality of the software. When significant customization or modification of the software and the development of complex interfaces are required to meet the client’s functionality, those services are considered essential. Accordingly, the related professional and consulting revenue is recognized together with the license fee using the percentage-of-completion method. The Company calculates the percentage of work completed by comparing contract costs incurred to date to total estimated contract costs at completion. Payment for these services sometimes is dependent on milestones (e.g., commencement of work, completion of design plan, completion of configuration, completion of customization). These milestone payments normally do not influence the Company’s revenue recognition as the scheduled payments coincide with the period of time the Company completes the work. When the professional and consulting services provided in connection with license arrangements are not considered essential or when professional and consulting services are provided in connection with outsourcing arrangements, the revenues are recognized as the related services are delivered.
License and other revenues, which accounted for 37% of the 2009 Information Management revenues, consist of revenues generated from the sale of licenses to use Information Management’s proprietary software and related software support and maintenance fees. License arrangements are contracted as either perpetual or term licenses, depending on the software product. When Information Management provides professional and consulting services that are considered essential to the software’s functionality, the license element is recognized together with the professional and consulting element using the percentage-of-completion method. In circumstances where the Company is providing professional and consulting services that are considered essential to the software’s functionality, and the Company is unable to determine the pattern in which Information Management’s professional and consulting services will be utilized, the license revenue is recognized on a straight-line basis over the implementation period. When Information Management is not required to provide services that are considered essential to the software’s functionality, the license element is recognized upon delivery of the software, assuming all other revenue recognition criteria have been met.
In connection with its license arrangements, Information Management typically is engaged to provide support and maintenance services. Revenues for support and maintenance services are recognized ratably over the term of the agreement. For these arrangements, Information Management allocates the contract value to the elements based on fair value of the individual elements. Fair value is determined using vendor specific objective evidence
54 Convergys Corporation 2009 Annual Report
Table of Contents
(VSOE), which represents the normal pricing for these elements when sold separately. For a very limited number of its arrangements, the Company has not had sufficient VSOE of fair value of its undelivered elements, principally related to support and maintenance. As a result, revenue for the entire arrangement, including license fees and related professional and consulting fees, has been deferred and recognized over the term of the support and maintenance period. There may be cases in which there is VSOE of fair value of the undelivered item but no such evidence for the delivered items. In these cases, the residual method is used to allocate the arrangement consideration. Under the residual method, the amount of consideration allocated to the delivered items equals the total arrangement consideration less the aggregate VSOE of fair value of the undelivered elements.
Data processing, which accounted for 26% of the 2009 Information Management revenues, consists of monthly fees for processing client transactions in Information Management’s data centers and, in some cases, the clients’ data centers, using Information Management’s proprietary software. Data processing revenues are recognized based on the number of invoices, subscribers or events that are processed by Information Management using contractual rates. In connection with any new data processing outsourcing arrangements, Information Management often must perform significant set-up activities or implementations, including the installation and customization of its proprietary software in its centers. Under these arrangements, a client does not take possession of the software nor has the right to take possession of the software without incurring a significant penalty. As the client does not derive benefit from the implementation itself (but rather from the underlying services that are delivered once the systems and processes are launched), the implementation services do not meet the separation criteria as defined primarily under ASC 605. Therefore, any proceeds collected for the implementation are deferred and recognized over the contract period beginning from the commencement of services.
HR Management’s arrangements typically span several years and entail delivery of multiple services (e.g., benefits administration, compensation, payroll administration, recruiting and learning) in different countries. These multiple-element arrangements are assessed to determine whether they can be separated into more than one unit of accounting. ASC 605 establishes the following criteria, all of which must be met, in order for a deliverable to qualify as a separate unit of accounting: (i) the delivered items have value to the client on a stand-alone basis, (ii) there is objective and reliable evidence of the fair value of the undelivered items, and (iii) if the arrangement includes a general right of return relative to the delivered items, delivery or performance of the undelivered items is considered probable and substantially in the control of the Company. If these criteria are met, each of the contractual services included in the contract is treated as a separate unit of accounting and revenue is recognized as services are performed based on the number of employees or participants served. If the above criteria are not met, all of the services included are accounted for as a single unit of accounting. Revenue is then recognized either using a proportional performance method such as recognizing revenue based on transactional services delivered or on a straight-line basis once HR Management begins to deliver the final service.
Similar to Information Management’s data processing arrangements, HR Management’s arrangements normally involve significant implementation activities including the installation and configuration of software, migration of participant data and development of methods and procedures. To the extent the client pays directly for the implementations, the Company defers the proceeds and recognizes it over the service period once HR Management begins to deliver the services. Revenues for services provided outside the scope of the implementation activities are recognized as services are performed or upon completion of the engagement based on specific facts and circumstances of the engagement.
Convergys Corporation 2009 Annual Report 55
Table of Contents
Notes to Consolidated Financial Statements (continued)
(Amounts in Millions Except Share and Per Share Amounts)
The Company considers the criteria established primarily by ASC 605-45, “Reporting Revenue Gross as a Principal versus Net as an Agent,” in determining whether revenue should be recognized on a gross versus a net basis. Factors considered in determining if gross or net basis recognition is appropriate include whether the Company is primarily responsible to the client for the services, has discretion on vendor selection, or bears credit risk. The Company provides certain services to clients using third party vendors. Typically, the costs incurred with third party vendors related to these services are passed through to the clients. In consideration of the above mentioned criteria, total payments the Company receives from clients related to these services are recorded as revenue and payments the Company makes to third party vendors are recorded as cost of providing services and products sold.
The Company sometimes earns supplemental revenues in each of the three segments depending on the satisfaction of certain service levels or achievement of certain performance measurement targets. The supplemental revenues are recognized only after required measurement targets are met.
Stock Compensation — Convergys provides stock-based awards to certain employees and Directors. The Company accounts for these awards pursuant to Statement of Financial Accounting Standard (SFAS) No. 123(R), “Share-Based Payment,” (the guidance of which has subsequently been codified primarily under FASB Topic 718, in the ASC (ASC 718)) using the modified prospective method. Under ASC 718, the Company has elected to recognize the compensation cost of all share-based awards on a straight-line basis over the vesting period of the award. Tax benefits related to this stock compensation expense are reported as financing cash flow and tax expenses are reported as operating cash flow. Further, the Company applies an estimated forfeiture rate to unvested awards when computing the stock compensation-related expenses.
Income Taxes — The Company accounts for income taxes pursuant to SFAS No. 109, “Accounting for Income Taxes,” (the guidance of which has subsequently been codified primarily under FASB Topic 740, in the ASC (ASC 740)) which requires recognition of deferred tax assets and liabilities for the expected future income tax consequences of transactions that have been included in the financial statements or tax returns. Under this method, deferred tax assets and liabilities are determined based on the differences between the financial statement and tax basis of assets and liabilities using enacted tax rates in effect for the year in which the differences are expected to reverse. Deferred tax assets are reduced by a valuation allowance for amounts that do not satisfy the realization criteria of ASC 740.
The Company also reviews its tax activities and records a liability for its uncertain tax positions in accordance with FIN 48, “Accounting for Uncertainty in Income Taxes – an interpretation of SFAS No. 109” (the guidance of which is also primarily included under ASC 740). The interpretation contains a two-step approach to recognizing and measuring uncertain tax positions accounted for in accordance with ASC 740. The first step is to evaluate the tax position for recognition by determining if the weight of available evidence indicates that it is more likely than not that the position will be sustained on audit, including resolution of related appeals or litigation processes, if any. The second step is to measure the tax benefit, which is the largest amount that is more than 50% likely of being realized upon ultimate settlement. The Company’s policy is to recognize interest and penalties accrued on unrecognized tax benefits as part of income tax expense.
Other Comprehensive Income (Loss) — Components of other comprehensive income (loss) include currency translation adjustments, changes related to pension liabilities, net of tax, and unrealized gains (losses) on hedging activities, net of tax. Foreign currency translation adjustments generally are not adjusted for income taxes as they relate to indefinite investments in non-U.S. operations. Accumulated other comprehensive income (loss) also includes, net of tax, actuarial gains or losses, prior service costs or credits and transition assets and
56 Convergys Corporation 2009 Annual Report
Table of Contents
obligations that are not recognized as components of net periodic pension cost pursuant to SFAS No. 87, “Employers’ Accounting for Pensions,” (SFAS No. 87) and SFAS No. 106, “Employers’ Accounting for Postretirement Benefits Other than Pensions” (SFAS No. 106). The guidance described above in SFAS No. 87 and SFAS No. 106 has subsequently been codified primarily under SFAS Topic 715, in the ASC.
Concentration of Credit Risk — In the normal course of business, the Company is exposed to credit risk. The principal concentrations of credit risk are short-term investments, accounts receivable and derivative instruments. The Company regularly monitors credit risk exposures and takes steps to mitigate the likelihood of these exposures resulting in a loss. Historically, credit losses on accounts receivable have not been material because of the large concentration of revenues with a small number of large, established companies. The Company does not require collateral or other security to support accounts receivable. The Company evaluates the creditworthiness of its clients in conjunction with its revenue recognition processes, as discussed above, as well as through its ongoing collectability assessment processes for accounts receivable. The Company maintains an allowance for doubtful accounts receivable based upon factors surrounding the credit risk of specific clients, historical trends and other information. The Company limits its counterparty credit risk exposures by entering into derivative contracts with significant financial institutions that are rated A (S&P) or better.
Cash Equivalents — Cash equivalents consist of short-term, highly liquid investments with original maturities of three months or less.
Receivables — Trade receivables are comprised primarily of amounts owed to the Company by clients and are presented net of an allowance for doubtful accounts of $17.6 and $10.8 at December 31, 2009 and 2008, respectively. Contracts with individual clients determine when receivables are due, generally within 30-60 days, and whether interest is accrued on late payments.
Property and Equipment — Property and equipment are stated at cost. Depreciation is based on the straight-line method over the estimated useful lives of the assets. Buildings are depreciated over a 30-year life, software over a two- to eight-year life and equipment generally over a three- to five-year life. Leasehold improvements are depreciated over the shorter of their estimated useful life or the remaining term of the associated lease.
Software Development Costs — Research and development expenditures are charged to expense as incurred. The development costs of software to be marketed are charged to expense until technological feasibility is established and capitalized thereafter, subject to assessment of realizability. Amortization of the capitalized amounts is computed using the greater of the sales ratio method or the straight-line method over a life of five years or less. The Company did not capitalize any software development costs during the periods reported.
Internal Use Software — The Company follows ASC 350, “Accounting for the Costs of Computer Software Developed or Obtained for Internal Use,” that requires the capitalization of certain expenditures for software that is purchased or internally developed for use in the business. During 2009, 2008 and 2007, internally developed software amounts capitalized were $4.5, $9.0 and $14.7, respectively. Amortization of internal use software begins when the software is ready for service and continues on the straight-line method generally over a life of three years.
Goodwill and Other Intangibles — As discussed more fully in Note 6, goodwill is tested at least annually for impairment. Other intangibles, primarily customer relationship assets and trademarks, are amortized over a straight-line basis with lives ranging from four to twelve years and are evaluated periodically if events or circumstances indicate a possible inability to recover their carrying amounts.
Deferred Charges — As more fully described under the heading above “Revenue Recognition,” the Company often
Convergys Corporation 2009 Annual Report 57
Table of Contents
Notes to Consolidated Financial Statements (continued)
(Amounts in Millions Except Share and Per Share Amounts)
performs, in connection with its outsourcing arrangements, certain set-up activities or implementations, including the installation and customization of its proprietary software in its centers. Additionally, with regard to arrangements where all of the services are accounted for as a single unit of accounting, the Company defers all revenue until it begins to deliver the final service. In connection with these arrangements, the Company capitalizes all direct and incremental multiple-element costs (by analogy to ASC 310, “Accounting for Nonrefundable Fees and Costs Associated with Originating or Acquiring Loans and Initial Direct Costs of Leases” (ASC 310)), to the extent recovery of these costs is probable. All implementation and set-up activity costs are amortized ratably over the life of the arrangements as costs of providing service and products sold. Deferred amounts are periodically evaluated for impairment or when circumstances indicate a possible inability to recover their carrying amounts. In the event these costs are not deemed recoverable, the Company follows the guidance in ASC 360, “Accounting for the Impairment or Disposal of Long-Lived Assets,” to determine whether an impairment exists. The Company evaluates the probability of recovery by considering profits to be earned during the term of the related contract, the creditworthiness of the client and, if applicable, termination for convenience fees payable by the client in the event that the client terminates the contract early.
In connection with certain of the Company’s outsourcing arrangements, the Company from time to time will incur costs that are non-refundable cash payments to clients to acquire or extend a contractual relationship. To the extent recovery of these costs is probable, the Company capitalizes these client acquisition costs (by analogy to ASC 310) and amortizes them ratably over the life of the contract as a reduction of revenue.
Investments — The Company owns limited partnership interests of 33.8% in Cincinnati SMSA Limited Partnership, a provider of wireless communications in central and southwestern Ohio and northern Kentucky, and 45.0% in the Cincinnati SMSA Tower Holdings LLC, an operator of cellular tower space (the Cellular Partnerships). Cincinnati SMSA Limited Partnership conducts its operations as a part of AT&T. AT&T is the general partner and a limited partner of both Cincinnati SMSA Limited Partnership and Cincinnati SMSA Tower Holdings LLC with a partnership interest of approximately 66% and 53%, respectively.
The general partner is authorized to conduct and manage the business of the Cellular Partnerships. The Company, as a limited partner, does not take part in the day-to-day management of the Cellular Partnerships. Limited partners are entitled to their percentage share of earnings and cash distributions and are responsible for their share of losses. The Company accounts for its interest in the Cellular Partnerships under the equity method of accounting.
Postemployment Benefits — The Company provides severance benefits to certain employees. Pursuant to ASC 712, “Employers’ Accounting for Postemployment Benefits,” the Company accrues the benefits when it becomes probable that such benefits will be paid and when sufficient information exists to make reasonable estimates of the amounts to be paid.
Deferred Revenue and Government Grants — As more fully described under the heading above “Revenue Recognition,” amounts billable to the client for implementation or set-up activities are deferred and recognized as revenue evenly over the service period the outsourcing services are provided. During 2009, restructuring of two HR Management contracts resulted in termination of certain services that were not operational. This contract restructuring resulted in the Company recognizing all of the deferred implementation revenue related to services terminated in 2009. Additionally, billings and collections in excess of revenues recognized are recorded as deferred revenues until revenue recognition criteria are met.
From time to time, the Company receives grants from local or state governments as an incentive to locate or retain operations in their jurisdictions. Depending on the
58 Convergys Corporation 2009 Annual Report
Table of Contents
arrangement, the grants are either received up-front or at the time the Company achieves the milestones set forth in the grant. The Company’s policy is to record the grant funds received as deferred credit and to amortize the deferred credit as a reduction of cost of providing services and products sold or selling, general and administrative expense as the milestones are met over the term of the grant. The terms of the grants range from 6 to 15 years.
Derivative Instruments — The Company’s risk management strategy includes the use of derivative instruments to reduce the effects on its operating results and cash flows from fluctuations caused by volatility in currency exchange and interest rates. The Company currently uses cash flow and fair value hedges. These instruments are hedges of forecasted transactions or of the variability of cash flows to be received or paid related to a recognized asset or liability. The Company generally enters into forward exchange contracts and options expiring within 36 months as hedges of anticipated cash flows denominated in foreign currencies. These contracts are entered into to protect against the risk that the eventual cash flows resulting from such transactions will be adversely affected by changes in exchange rates. Additionally, the Company from time to time enters into interest rate swap agreements to effectively fix the interest rates of variable rate borrowings. In using derivative financial instruments to hedge exposures to changes in exchange rates and interest rates, the Company exposes itself to counterparty credit risk.
All derivatives, including foreign currency exchange contracts, are recognized in the Balance Sheet at fair value. Fair values for the Company’s derivative financial instruments are based on quoted market prices of comparable instruments or, if none are available, on pricing models or formulas using current assumptions. On the date the derivative contract is entered into, the Company determines whether the derivative contract should be designated as a hedge. For derivatives that are designated as hedges, the Company further designates the hedge as either a fair value or cash flow hedge. Changes in the fair value of derivatives that are highly effective and designated as fair value hedges are recorded in the Consolidated Statement of Operations along with the loss or gain on the hedged asset or liability. Changes in the fair value of derivatives that are highly effective and designated as cash flow hedges are reported as a component of Other Comprehensive Income (Loss) and reclassified into earnings in the same line-item associated with the forecasted transaction and in the same periods during which the hedged transaction affects earnings. The Company formally documents all relationships between hedging instruments and hedged items, as well as its risk management objective and strategy for undertaking various hedging activities. This process includes linking all derivatives that are designated as fair value or cash flow hedges to specific assets and liabilities on the balance sheet or to forecasted transactions. The Company also formally assesses, both at the hedge’s inception and on an ongoing basis, whether the derivatives that are used in hedging transactions are highly effective in offsetting changes in fair value or cash flows of hedged items. When it is determined that a derivative is not highly effective as a hedge or that it has ceased to be a highly effective hedge, the Company discontinues hedge accounting prospectively.
The Company also periodically enters into forward exchange contracts and options that are not designated as hedges. The purpose of the majority of these derivative instruments is to protect the Company against foreign currency exposure pertaining to receivables, payables and intercompany transactions that are denominated in currencies different from the functional currencies of the Company or the respective subsidiaries. The Company records changes in the fair value of these derivative instruments in the Consolidated Statements of Operations and Comprehensive Income (Loss) within other income (expense), net.
New Accounting Pronouncements — In June 2009, the FASB issued SFAS No. 168, “The FASB Accounting Standards CodificationTM and the Hierarchy of Generally
Convergys Corporation 2009 Annual Report 59
Table of Contents
Notes to Consolidated Financial Statements (continued)
(Amounts in Millions Except Share and Per Share Amounts)
Accepted Accounting Principles – a replacement of FAS No. 162,” now codified as FASB Topic 105, “Generally Accepted Accounting Principles,” (ASC 105) in the ASC as the single source of authoritative nongovernmental U.S. GAAP. ASC 105 does not change current U.S. GAAP, but is intended to simplify user access to all authoritative U.S. GAAP by providing all authoritative literature related to a particular topic in one place. All existing accounting standard documents will be superseded and all other accounting literature not included in the FASB Codification will be considered non-authoritative. These provisions of ASC 105 are effective for interim and annual periods ending after September 15, 2009 and, accordingly, are effective for the Company for the current fiscal reporting period. The adoption of this pronouncement did not have an impact on the Company’s financial condition or results of operations, but will impact the financial reporting process by eliminating all references to pre-codification standards. On the effective date of this Statement, the Codification superseded all then-existing non-SEC accounting and reporting standards, and all other non-grandfathered non-SEC accounting literature not included in the Codification became non-authoritative.
In April 2007, the FASB issued EITF 06-04, “Accounting for Deferred Compensation and Postretirement Benefit Aspects of Endorsement Split Dollar Life Insurance Arrangements” which has subsequently been codified in FASB Topic 715 in the ASC (ASC 715). This Standard requires an employer to recognize a liability for future benefits in accordance with authoritative guidance for the accounting for postretirement benefits other than pensions if, in substance, a postretirement benefit plan exists. The Company adopted ASC 715 effective January 1, 2008. Adoption of this Standard resulted in a $2.2 reduction to the retained earnings balance as of January 1, 2008.
In December 2008, the FASB issued FASB Staff Position No. FAS 132(R)-1, “Employers’ Disclosures about Postretirement Benefit Plan Assets,” which was primarily codified in FASB Topic 715, “Compensation – Retirement Benefits” in the ASC. This guidance impacts an employer’s disclosures about plan assets of a defined benefit pension or other postretirement plan. The guidance is effective for fiscal years ending after December 15, 2009. The Company has included additional information about plan assets in Note 10 of the Notes to Consolidated Financial Statements.
In May 2009, the FASB issued SFAS No. 165, “Subsequent Events”, which was codified in FASB Topic 855, “Subsequent Events” in the ASC. This guidance establishes general standards of accounting for and disclosure of events that occur after the balance sheet date but before financial statements are issued. Specifically, the guidance addresses the period after the balance sheet date during which management of a reporting entity should evaluate events or transactions that may occur for potential recognition or disclosure in the financial statements; the circumstances under which an entity should recognize events or transactions occurring after the balance sheet date in its financial statements; and the disclosures that an entity should make about events or transactions that occurred after the balance sheet date. This guidance is effective for interim or annual financial periods ending after June 15, 2009, and shall be applied prospectively. The Company evaluated all events or transactions that occurred after December 31, 2009 through the date these financial statements were issued, February 26, 2010. See Note 20 of the Notes to Consolidated Financial Statements for disclosures related to the Company’s subsequent events.
In June 2009, the FASB issued SFAS No. 166, “Accounting for Transfers of Financial Assets” (SFAS No. 166). SFAS No. 166, which has not yet been codified in the ASC, is a revision to SFAS No. 140, “Accounting for Transfers and Servicing of Financial Assets and Extinguishments of Liabilities,” and will require more information about transfers of financial assets, including securitization transactions, and where entities have continuing exposure to the risks related to transferred financial assets. It eliminates the concept of a “qualifying special-purpose
60 Convergys Corporation 2009 Annual Report
Table of Contents
entity,” changes the requirements for derecognizing financial assets and requires additional disclosures. SFAS No. 166 will be effective at the start of a reporting entity’s first fiscal year beginning after November 15, 2009. Early application is not permitted. The Company will provide the disclosures required by this Standard in the first quarter of 2010.
In October 2009, the FASB issued ASU 2009-13, “Multiple-Deliverable Revenue Arrangements,” (amendments to FASB ASC Topic 605, “Revenue Recognition”) (ASU 2009-13) and ASU 2009-14, “Certain Arrangements That Include Software Elements,” (amendments to FASB ASC Topic 985, “Software”) (ASU 2009-14). ASU 2009-13 requires entities to allocate revenue in an arrangement using estimated selling prices of the delivered goods and services based on a selling price hierarchy. The amendments eliminate the residual method of revenue allocation and require revenue to be allocated using the relative selling price method. ASU 2009-14 removes tangible products from the scope of software revenue guidance and provides guidance on determining whether software deliverables in an arrangement that includes a tangible product are covered by the scope of the software revenue guidance. ASU 2009-13 and ASU 2009-14 should be applied on a prospective basis for revenue arrangements entered into or materially modified in fiscal years beginning on or after June 15, 2010, with early adoption permitted. The Company is currently evaluating the impact of the adoption of ASU 2009-13 or ASU 2009-14 on the Company’s consolidated results of operations and financial condition.
3. Common and Preferred Shares
There were no shares repurchased during the year ended December 31, 2009. The timing and terms of any future transactions will depend on a number of considerations including market conditions and liquidity. Below is a summary of the Company’s share repurchases for the years ended December 31, 2008 and 2007:
| 2008 | 7.7 million shares | $ | 116.6 | ||
| 2007 | 9.9 million shares | $ | 184.0 | ||
At December 31, 2009, the Company has the authority to repurchase 7.1 million additional common shares pursuant to current authorizations.
As described in detail in Note 8 on Notes to Consolidated Financial Statements, during 2009 the Company issued approximately $125.0 aggregate principal amount of 5.75% Junior Subordinated Convertible Debentures due 2029 (2029 Convertible Debentures). The 2029 Convertible Debentures are convertible, subject to certain conditions, into shares of the Company’s common stock at an initial conversion price of approximately $12.07 per share, or 82.82 shares per one thousand in principal amount of debentures. Upon conversion, the Company will pay cash up to the aggregate principal amount of the 2029 Convertible Debentures and settle the remainder of the debentures in cash or stock at the Company’s option.
Preferred Shares
The Company is authorized to issue up to five million preferred shares, of which four million would have voting rights. At December 31, 2009 and 2008, there were no preferred shares outstanding.
Convergys Corporation 2009 Annual Report 61
Table of Contents
Notes to Consolidated Financial Statements (continued)
(Amounts in Millions Except Share and Per Share Amounts)
4. Earnings (Loss) Per Share
The following is a reconciliation of the numerator and denominator of the basic and diluted earnings per share (EPS) computations:
| Shares (in Millions) | Net Income (Loss) |
Shares | Per Share Amount |
|||||||
| 2009: | ||||||||||
| Basic EPS | $ | (77.3 | ) | 122.8 | $ | (0.63 | ) | |||
| Effect of dilutive securities: | ||||||||||
| Stock-based compensation arrangements |
— | — | — | |||||||
| 2029 Convertible Debentures |
— | — | — | |||||||
| Diluted EPS | $ | (77.3 | ) | 122.8 | $ | (0.63 | ) | |||
| 2008: | ||||||||||
| Basic EPS | $ | (92.9 | ) | 123.5 | $ | (0.75 | ) | |||
| Effect of dilutive securities: | ||||||||||
| Stock-based compensation arrangements |
— | — | — | |||||||
| Diluted EPS | $ | (92.9 | ) | 123.5 | $ | (0.75 | ) | |||
| 2007: | ||||||||||
| Basic EPS | $ | 169.5 | 134.1 | $ | 1.26 | |||||
| Effect of dilutive securities: | ||||||||||
| Stock-based compensation arrangements |
— | 3.6 | (0.03 | ) | ||||||
| Diluted EPS | $ | 169.5 | 137.7 | $ | 1.23 | |||||
The diluted EPS calculation for the years ended December 31, 2009 and 2008 excludes the effect of dilutive securities because of the loss from operations. The diluted EPS calculation excludes the effect of 8.8 million outstanding stock options for the year ended December 31, 2007, because they are anti-dilutive.
5. Acquisitions
On September 3, 2008, the Company acquired 100 percent of the outstanding common shares of Intervoice Inc. (Intervoice), a developer of automated voice response systems, for cash consideration of $338.8. Intervoice is a market leader in the delivery of personalized, multi-channel automated information solutions that connect people with information, empowering them to control the way they interact with a business. Integration of Intervoice’s speech automation and mobile applications with the Company’s agent-assisted services has enabled the Company to build upon its leadership position in relationship management solutions. The Company’s solutions result in improved operational efficiencies, new revenue streams, and most importantly enhanced differentiation in the large and growing automated services market.
The Intervoice acquisition was accounted for as a purchase transaction. The purchase price has been allocated to fixed assets, liabilities and tangible and identifiable intangible assets based upon valuations using management’s estimates and assumptions. Fair values for the intangible assets were valued by a third-party appraisal firm based on information provided by the Company. The excess purchase price over the estimated fair value of the net assets acquired was allocated to goodwill. The total amount of goodwill deductible for tax purposes is approximately $23. Intervoice’s operating results have been included in the Consolidated Financial Statements of the Company in the Customer Management segment since the date of acquisition and goodwill, as reflected in the table below, was entirely assigned to the Customer Management segment. This acquisition was financed using the Company’s $400 Five-Year Competitive Advance and Revolving Credit Facility.
The final allocation of purchase price to the assets and liabilities resulting from this acquisition is presented in the table below:
| Assets: | ||||
| Cash |
$ | 45.4 | ||
| Accounts receivable |
34.3 | |||
| Property, plant & equipment |
84.7 | |||
| Goodwill |
212.4 | |||
| Intangible assets |
40.0 | |||
| Other assets |
77.9 | |||
| Liabilities: | ||||
| Accounts payable and accrued liabilities |
(34.3 | ) | ||
| Deferred taxes, net |
(64.7 | ) | ||
| Other long-term liabilities |
(56.9 | ) | ||
| Acquisition Price | $ | 338.8 | ||
62 Convergys Corporation 2009 Annual Report
Table of Contents
Intangible assets of $40.0 above include $30.0 related to customer relationships with an estimated useful life of eleven years and $10.0 related to Intervoice trademarks with an estimated useful life of four years. The remaining weighted average useful life of the intangibles is 7.8 years. Included in property, plant and equipment of $84.7 is $38.8 of software assets with estimated useful lives of two to eight years with a remaining weighted average useful life of 5.7 years.
In addition, during 2008, the Company made three smaller strategic acquisitions to expand its business support systems solution footprint: Shanghai Hong Xun Software Co., Ltd. for its web self-care, service provisioning, and workforce management capabilities, Visage’s Subscriber Management Platform and Ceon Corporation in order to expand the breadth of its business support system solutions. The total initial purchase price related to these acquisitions was $20.7. In addition, with respect to the Ceon Corporation acquisition, the Company made additional earn-out payments of $3.1 during 2009 and $3.0 during January of 2010 as certain performance targets were met. All of the earn-out payments made are accounted for as goodwill. There are no additional earn-out payments due related to any of the acquisitions.
6. Goodwill and Other Intangible Assets
The Company tests goodwill for impairment annually as of October 1 and at other times if events have occurred or circumstances exist that indicate the carrying value of goodwill may no longer be recoverable. The impairment test for goodwill involves a two-step process. The first step compares the fair value of a reporting unit with its carrying amount, including the goodwill allocated to each reporting unit. If the carrying amount is in excess of the fair value, the second step requires the comparison of the implied fair value of the reporting unit goodwill with the carrying amount of the reporting unit goodwill. Any excess of the carrying value of the reporting unit goodwill over the implied fair value of the reporting unit goodwill will be recorded as an impairment loss. Fair value of the reporting units is determined using a combination of the market approach and the income approach. Under the market approach, fair value is based on actual stock price or transaction prices of comparable companies. Under the income approach, value is dependent on the present value of net cash flows to be derived from the ownership. Based on the results of its first-step impairment tests performed as of October 1, 2009, the Company had no goodwill impairment related to its five reporting units: Information Management International, Information Management North America, Customer Management, HR Management and Relationship Technology Management.
As more fully described in Note 7 of Notes to Consolidated Financial Statements, the impairment and implementation-related charges recorded at HR Management during 2009 and 2008 required a review of goodwill related to the HR Management segment both in 2009 and 2008. The reviews did not result in any goodwill impairment during 2009 and resulted in an impairment loss of $61.1 during 2008. The Company determined that the fair value of the HR Management segment was less than its carrying value in 2008 and, therefore, the second step of the test was required. This second step review resulted in a non-cash goodwill impairment charge of $61.1 recorded in the asset impairment caption in the accompanying Consolidated Statements of Operations. In determining the amount of the HR Management related goodwill impairment, the Company engaged a third-party appraisal firm to assist in valuing the significant intangible assets of the reporting unit. Key assumptions used by the Company in determining the fair value of the HR Management segment include revenue increases from existing contracts as services become operational and an estimate of future cash implementation costs and revenue. The approximate amount of the goodwill asset impairment charge that was deductible for tax purposes was $20. During the year ended December 31, 2008, the Company had no goodwill impairment related to any of its other reporting units. The Company believes it makes every reasonable effort to ensure that it accurately estimates the fair value of the reporting units. However, future
Convergys Corporation 2009 Annual Report 63
Table of Contents
Notes to Consolidated Financial Statements (continued)
(Amounts in Millions Except Share and Per Share Amounts)
changes in the assumptions used to make these estimates could result in impairment losses.
Below is a progression of goodwill for the Company’s segments for 2009 and 2008:
| Customer Management |
Information Management |
HR Management |
Total | |||||||||||||
| Balance at January 1, 2008 | $ | 578.5 | $ | 187.8 | $ | 129.9 | $ | 896.2 | ||||||||
| Acquisitions |
213.1 | 7.9 | — | 221.0 | ||||||||||||
| Impairment |
— | — | (61.1 | ) | (61.1 | ) | ||||||||||
| Other |
(15.2 | ) | (6.3 | ) | 0.3 | (21.2 | ) | |||||||||
| Balance at December 31, 2008 | $ | 776.4 | $ | 189.4 | $ | 69.1 | $ | 1,034.9 | ||||||||
| Acquisitions |
(0.7 | ) | 3.1 | — | 2.4 | |||||||||||
| Other |
10.2 | 1.0 | 0.1 | 11.3 | ||||||||||||
| Balance at December 31, 2009 | $ | 785.9 | $ | 193.5 | $ | 69.2 | $ | 1,048.6 | ||||||||
The goodwill additions to the Customer Management and Information Management segments for the years ended December 31, 2009 and 2008 resulted from the Intervoice acquisition and a few smaller Information Management acquisitions that are described in Note 5 of the Notes to Consolidated Financial Statements. The other changes to goodwill in 2009 and 2008 principally reflect foreign currency translation adjustments. Accumulated goodwill impairment charges at December 31, 2009 and 2008 were $61.1 and related entirely to HR Management.
The Company’s other intangible assets, primarily acquired through business combinations, are evaluated periodically if events or circumstances indicate a possible inability to recover their carrying amounts. The evaluation of intangible assets during 2009 resulted in recording impairment charges of $6.8 related to certain acquired intangible assets. As of December 31, 2009 and 2008, the Company’s other intangible assets consisted of the following:
| Gross Carrying Amount |
Accumulated Amortization |
Net | ||||||||
| 2009: | ||||||||||
| Software (classified with Property, Plant & Equipment) | $ | 92.2 | $ | (55.2 | ) | $ | 37.0 | |||
| Trademarks | 12.0 | (5.3 | ) | 6.7 | ||||||
| Customer relationships and other intangibles | 164.0 | (120.5 | ) | 43.5 | ||||||
| Total | $ | 268.2 | $ | (181.0 | ) | $ | 87.2 | |||
| 2008: | ||||||||||
| Software (classified with Property, Plant & Equipment) | $ | 92.2 | $ | (46.3 | ) | $ | 45.9 | |||
| Trademarks | 12.0 | (2.7 | ) | 9.3 | ||||||
| Customer relationships and other intangibles | 176.2 | (116.7 | ) | 59.5 | ||||||
| Total | $ | 280.4 | $ | (165.7 | ) | $ | 114.7 | |||
The intangible assets are being amortized using the following amortizable lives: two to eight years for software, four years for trademarks and five to twelve years for customer relationships and other. The remaining weighted average amortization period for intangible assets is 6.7 years.
64 Convergys Corporation 2009 Annual Report
Table of Contents
Customer relationships, trademarks and other intangibles amortization expense was $11.7 for the year ended December 31, 2009 and the related estimated expense for the five subsequent fiscal years is as follows:
| For the year ended 12/31/10 | $ | 10 | |
| For the year ended 12/31/11 | $ | 10 | |
| For the year ended 12/31/12 | $ | 9 | |
| For the year ended 12/31/13 | $ | 7 | |
| For the year ended 12/31/14 | $ | 3 | |
| Thereafter | $ | 11 | |
7. Deferred Charges, Deferred Revenue and Asset Impairment
During 2009, 2008 and 2007, the Company capitalized $151.4, $273.2 and $129.5 of client acquisition and implementation costs, respectively. The related amortization charge for these years was $34.1, $65.8 and $53.2, respectively. The Company also recognized implementation-related, settlement and impairment charges of $369.2 during the year ended December 31, 2009 and $334.0 during the year ended December 31, 2008. These charges related to the impairment of deferred charges, goodwill and other long term assets as well as expensing of implementation and settlement costs. These charges were substantially driven by two large HR Management contracts.
During 2009, 2008 and 2007, the Company deferred implementation revenue of $116.3, $140.6 and $63.9, respectively. The related deferred revenue amortization for these years was $38.1, $43.4 and $15.6, respectively. Also during the year ended December 31, 2009, the Company recognized on an accelerated basis $122.3 of deferred implementation revenue related to two of its HR Management contracts as discussed below. As of December 31, 2009, the remaining deferred implementation revenue not yet recognized related to these two contracts is approximately $81.
The 2009 charge of $369.2 includes (a) $255.6 recorded within the cost of providing services and products sold caption and (b) $113.6 for impairment of deferred charges and other long-lived assets. These charges substantially related to two large HR Management contracts. During 2009, the Company restructured two of its HR Management contracts that were in implementation stages to terminate services that were not operational. As a result, during 2009, all of the remaining capitalized implementation costs related to these contracts were written-off and of the related implementation revenue was recognized.
The 2008 charge of $334.0 includes (a) $65.4 recorded within the cost of providing services and products sold caption related to expensing of implementation costs that exceeded the termination for convenience fees in a contract and (b) $207.5 for impairment of deferred charges and $61.1 for impairment of goodwill. The charges related to HR Management and were primarily driven by the two large contracts that were restructured during 2009. Based upon the contract profitability analysis completed in 2008, two HR Management contracts were projected to be unprofitable over their contract terms due to an increase in overall implementation and delivery costs. As a result, $207.5 of the capitalized costs related to these contracts were impaired, and were, therefore, written down. See also “Deferred Charges” in Note 2 to Consolidated Financial for more detailed discussions on deferred charges and the Company’s policy on assessing recoverability of deferred charges.
Convergys Corporation 2009 Annual Report 65
Table of Contents
Notes to Consolidated Financial Statements (continued)
(Amounts in Millions Except Share and Per Share Amounts)
8. Debt
Debt consists of the following:
| At December 31, | ||||||||
| 2009 | 2008 | |||||||
| Revolving credit facility | $ | 400.0 | $ | 400.0 | ||||
| 4.875% Senior Notes | — | 249.8 | ||||||
| 2029 Convertible Debentures | 56.3 | — | ||||||
| Other | 13.3 | 16.1 | ||||||
| Total debt | 469.6 | 665.9 | ||||||
| Less current maturities |
405.2 | 259.5 | ||||||
| Long-term debt | $ | 64.4 | $ | 406.4 | ||||
| Weighted average effective interest rates: | ||||||||
| Revolving credit facility |
3.3 | % | 4.7 | % | ||||
| 4.875% Senior notes |
— | 5.0 | % | |||||
| 2029 Convertible Debentures |
7.6 | % | — | |||||
| Other |
8.3 | % | 4.4 | % | ||||
During 2008, the Company borrowed the entire amount available under the $400 Five-Year Competitive Advance and Revolving Credit Facility (the Revolving Credit Facility). This borrowing was mainly to fund the acquisition of Intervoice as detailed in Note 5 of the Notes to Consolidated Financial Statements. The interest rate on the Revolving Credit Facility is based on LIBOR or prime rate. The commitment fee on this facility at December 31, 2009 was 0.1%. The maturity date of the Credit Facility Agreement is October 20, 2011. The Company’s credit facility includes certain restrictive covenants including maintenance of interest coverage and debt-to-EBITDA ratios. The Company’s interest coverage ratio, defined as the ratio of consolidated earnings before interest, tax, depreciation and amortization (EBITDA) (as defined in the Credit Facility Agreement) to consolidated interest expense, cannot be less than 4.00 to 1.00 for four consecutive quarters. The Company’s debt-to-EBITDA ratio cannot be greater than 3.25 to 1.0 at any time. At December 31, 2009, the Company was in compliance with all covenants. During 2010, the Company repaid $300.0 of the outstanding portion of the Revolving Credit Facility.
In December 2004, the Company issued $250.0 in 4.875% Unsecured Senior Notes (4.875% Senior Notes) due December 15, 2009. During 2009, the Company announced an exchange offer (Exchange Offer) for up to $122.5 aggregate principal amount of its outstanding 4.875% Senior Notes. Under the terms of the Exchange offer, the Company offered to exchange one-thousand twenty dollars in principal amount of its new 5.75% Junior Subordinated Convertible Debentures due 2029 (2029 Convertible Debentures) for each one-thousand dollars in principal amount of its 4.875% Senior Notes. Upon settlement of the Exchange Offer on October 13, 2009, the Company issued a total of $125.0 aggregate principal amount of the 2029 Convertible Debentures in exchange for $122.5 of the 4.875% Senior Notes. This exchange transaction resulted in a loss on extinguishment of debt of $2.3 that is reflected within other income (expense), net, in the accompanying Statements of Operations and Comprehensive Income (Loss) for the year ended December 31, 2009.
The 2029 Convertible Debentures are convertible, subject to certain conditions, into shares of the Company’s common stock at an initial conversion price of approximately $12.07 per share, or 82.82 shares of the Company’s common stock per one thousand dollars in principal amount of debentures. Upon conversion, the Company will pay cash up to the aggregate principal amount of the 2029 Convertible Debentures and settle the remainder of the debentures in cash or stock at the Company’s option. The conversion rate will be subject to adjustment for certain events outlined in the indenture governing the debenture (the Indenture). The conversion rate will increase for a holder who elects to convert the debenture in connection with certain share exchanges, mergers or consolidations involving the Company, as described in the indenture.
The Company may not redeem the 2029 Convertible Debentures prior to September 15, 2019, except if certain U.S. federal tax legislation, regulations or rules are enacted or are issued. On or after September 15, 2019, the Company may redeem for cash all or part of the 2029 Convertible Debentures for the principal amount, plus any
66 Convergys Corporation 2009 Annual Report
Table of Contents
accrued and unpaid interest, if the last closing price of the Company’s common shares has been at least 150% of the applicable conversion price for at least 20 trading days immediately prior to the date on which the Company provides notice of redemption. Holders may convert their 2029 Convertible Debentures prior to the close of business on the business day immediately preceding September 15, 2028, if certain market conditions related to the trading price of the Company’s common shares and 2029 Convertible Debentures occur. On or after September 15, 2028, holders may convert their 2029 Convertible Debentures at the option of the holder regardless of the foregoing circumstances. Holders may also convert if the Company calls any or all of the 2029 Convertible Debentures for redemption prior to the maturity date. The conversion rate will equal 100% of the principal amount of the 2029 Convertible Debentures to be redeemed, plus accrued and unpaid interest and will be subject to adjustment for certain events outlined in the Indenture. If certain events occur in the future, the Indenture provides that each holder of the debentures can, for a pre-defined period of time, require the Company to repurchase the holder’s debentures for the principal amount plus any accrued and unpaid interest. The Company concluded that the dentures are not conventional convertible debt instruments and that the embedded stock conversion option qualifies as a derivative. Under the appropriate authoritative guidance, the Company further concluded that the option is indexed to the Company’s stock and does not require bifurcation from the host instrument. Therefore the embedded conversion option is not accounted for separately as a derivative.
The 2029 Convertible Debentures, which pay a fixed rate of interest semi-annually, have a contingent interest component that will require the Company to pay interest based on certain thresholds commencing on September 15, 2019, as outlined in the indenture. The maximum amount of contingent interest that will accrue is 0.75% per annum of the average trading price. The fair value of this embedded derivative was not significant at December 31, 2009.
The Company recognized both the liability and equity component of the 2029 Convertible Debenture at fair value. The liability component is recognized as the fair value of a similar instrument that does not have a conversion feature at issuance. The equity component, which is the value of the conversion feature at issuance, is recognized as the difference between the proceeds from the issuance of the debentures and the fair value of the liability component, after adjusting for the deferred tax impact. The 2029 Convertible Debentures were issued at a coupon rate of 5.75%, which was below that of a similar instrument that does not have a conversion feature. Therefore, the valuation of the debt component, using the income approach, resulted in a debt discount. The debt discount will be amortized over the life of the 2029 Convertible Debentures based upon the effective interest rate method and will be included within the interest expense caption in the accompanying Consolidated Statements of Operations.
Other debt of $13.3 and $16.1 at December 31, 2009 and 2008, respectively, consisted of capital leases and miscellaneous domestic and international borrowings.
At December 31, 2009, future minimum payments of the Company’s debt arrangements are as follows:
| 2010 | $ | 405.2 | |
| 2011 | 2.1 | ||
| 2012 | — | ||
| 2013 | — | ||
| 2014 | 6.0 | ||
| Thereafter | 125.0 | ||
| Total | $ | 538.3 | |
9. Restructuring
2009
During 2009, the Company initiated a restructuring plan to reduce headcount and align resources to future business needs. The total charge of $47.0 included $30.7 of severance-related charges and $16.3 of facility-related charges. The $30.7 of severance-related charges were comprised of $15.3 at Information Management related to
Convergys Corporation 2009 Annual Report 67
Table of Contents
Notes to Consolidated Financial Statements (continued)
(Amounts in Millions Except Share and Per Share Amounts)
shifting the geographic mix of certain resources and further streamlining of operations, $6.7 of severance at Customer Management resulting from a reduction in one international program and efforts to streamline operations, $3.7 at HR Management, related to headcount reductions across the globe to align resources to expected future revenue and $5.0 at Corporate to reduce headcount. The severance charge of $30.7 will largely be paid in cash pursuant to the Company’s severance policy and employment agreements. These actions will affect approximately 1,000 worldwide salaried employees and approximately 800 non-salaried employees. The severance actions are expected to be mostly completed by mid-2010.
Below is a summary of the 2009 net restructuring charge of $47.0 by segment:
| Customer Management |
Information Management |
HR Management |
Corporate | Total | |||||||||||
| Severance costs | $ | 6.7 | $ | 15.3 | $ | 3.7 | $ | 5.0 | $ | 30.7 | |||||
| Facility-related costs | 1.2 | 15.1 | — | — | 16.3 | ||||||||||
| Net restructuring | $ | 7.9 | $ | 30.4 | $ | 3.7 | $ | 5.0 | $ | 47.0 | |||||
The $16.3 facility-related charge relates to lease rent accruals for properties that have closed as the result of consolidating facilities. The $15.1 recorded at Information Management largely relates to consolidating facilities in the United Kingdom. The charge is equal to the future costs associated with the facility, net of proceeds from any probable future sublease agreements. The Company used estimates, based on consultation with the Company’s real estate advisors, to determine the proceeds from any future sublease agreements. The Company will continue to evaluate these estimates in recording the facilities abandonment charge. Consequently, there may be additional reversals or charges relating to this facility closure in the future. At December 31, 2009, this facility-related restructuring reserve had an outstanding balance of $16.0, which will be paid over several years until the leases expire.
Restructuring liability activity for the 2009 plan consisted of the following:
| 2009 | ||||
| Restructuring charge | $ | 47.0 | ||
| Severance payments |
(8.5 | ) | ||
| Facility payments |
(0.3 | ) | ||
| Balance at December 31 | $ | 38.2 | ||
2008
During 2008, the Company initiated a restructuring plan to align resources to future business needs and to shift the geographic mix of some of its resources. Restructuring actions were taken in each business segment, of which $14.0 related to Customer Management, $9.7 related to Information Management, $10.5 related to HR Management and $0.2 related to Corporate. The $34.4 restructuring consisted primarily of cash paid pursuant to the Company’s severance policy and employment agreements as well as facility closure related accruals of $1.8. These actions, which affected approximately 1,500 professional and administrative employees and 1,000 non-salaried employees worldwide, were fully completed in 2009.
Below is a summary of the 2008 net restructuring charge of $34.4 by segment:
| Customer Management |
Information Management |
HR Management |
Corporate | Total | |||||||||||
| Severance costs |
$ | 12.2 | $ | 9.7 | $ | 10.5 | $ | 0.2 | $ | 32.6 | |||||
| Facility-related costs | 1.8 | — | — | — | 1.8 | ||||||||||
| Net restructuring | $ | 14.0 | $ | 9.7 | $ | 10.5 | $ | 0.2 | $ | 34.4 | |||||
Restructuring liability activity for the 2008 plan consisted of the following:
| 2009 | 2008 | |||||||
| Balance at January 1 | $ | 22.1 | $ | — | ||||
| Restructuring charge |
— | 34.4 | ||||||
| Severance payments |
(20.4 | ) | (12.2 | ) | ||||
| Facility payments |
(1.7 | ) | (0.1 | ) | ||||
| Balance at December 31 | $ | — | $ | 22.1 | ||||
68 Convergys Corporation 2009 Annual Report
Table of Contents
10. Employee Benefit Plans
Pensions
The Company sponsors a defined benefit pension plan, which includes both a qualified and non-qualified portion, for all eligible employees (the cash balance plan). The Company also sponsors a non-qualified, unfunded executive deferred compensation plan and a supplemental, non-qualified, unfunded plan for certain senior executives (the executive pension plans). The pension benefit formula for the cash balance plan is determined by a combination of compensation and age-based credits and annual guaranteed interest credits. Benefits for the executive deferred compensation plan are based on employee deferrals, matching contributions and investment earnings on participant accounts. Benefits for the supplemental plan are based on age, years of service and eligible pay. Funding of the qualified portion of the cash balance plan has been achieved through contributions made to a trust fund. The contributions have been determined using the prescribed methods in accordance with the Pension Protection Act of 2006. Based on the funded status of the Cash Balance Plan and mandatory legislative requirements under the Pension Protection Act, beginning April 29, 2009, lump sum payments from the Cash Balance Plan have been partially restricted. The Company’s measurement date for all plans is December 31. The projected unit credit cost method is used for determining the unfunded executive pension cost for financial reporting purposes. The plan assumptions are evaluated annually and are updated as necessary.
During 2008, the Company amended its cash balance plan to cease future benefit accruals and to close participation effective March 31, 2008. After March 31, 2008, participants do not earn future accruals or credits to their cash balance account with respect to compensation earned after March 31, 2008, but will continue to be credited with interest to their cash balance account. This plan amendment resulted in recognizing a curtailment loss of $4.0 during 2008.
Components of pension cost and other amounts recognized in other comprehensive income (loss) for the cash balance plan are as follows:
| Year Ended December 31, | ||||||||||||
| 2009 | 2008 | 2007 | ||||||||||
| Service cost | $ | — | $ | 4.2 | $ | 17.9 | ||||||
| Interest cost on projected benefit obligation | 12.0 | 12.7 | 11.7 | |||||||||
| Expected return on plan assets | (10.4 | ) | (14.4 | ) | (14.6 | ) | ||||||
| Amortization and deferrals—net | 6.1 | 1.1 | 2.5 | |||||||||
| Settlement loss | — | 8.0 | — | |||||||||
| Curtailment loss | — | 4.0 | — | |||||||||
| Total pension cost | $ | 7.7 | $ | 15.6 | $ | 17.5 | ||||||
| Other comprehensive (income) loss | $ | (9.6 | ) | $ | 57.2 | $ | (0.3) | |||||
The settlement loss of $8.0 in 2008 resulted from the benefit payments exceeding the sum of the 2008 service cost and interest cost.
The reconciliation of the cash balance plan’s projected benefit obligation and the fair value of plan assets for the years ended December 31, 2009 and 2008 are as follows:
| At December 31, | ||||||||
| 2009 | 2008 | |||||||
| Change in benefit obligation: | ||||||||
| Benefit obligation at beginning of year |
$ | 201.4 | $ | 215.6 | ||||
| Service cost |
— | 4.2 | ||||||
| Interest cost |
12.0 | 12.7 | ||||||
| Actuarial (gain) loss |
9.8 | (0.5 | ) | |||||
| Benefits paid |
(14.6 | ) | (30.6 | ) | ||||
| Benefit obligation at end of year |
$ | 208.6 | $ | 201.4 | ||||
| Change in plan assets: | ||||||||
| Fair value of plan assets at beginning of year |
$ | 112.3 | $ | 185.1 | ||||
| Actual return on plan assets |
23.6 | (56.3 | ) | |||||
| Employer contribution |
8.4 | 14.1 | ||||||
| Benefits paid |
(14.6 | ) | (30.6 | ) | ||||
| Fair value of plan assets at end of year |
$ | 129.7 | $ | 112.3 | ||||
| Funded status |
$ | (78.9 | ) | $ | (89.1 | ) | ||
| Amounts recognized in the Consolidated Balance Sheets consisted of: | ||||||||
| Non-current liability |
$ | 78.9 | $ | 89.1 | ||||
| Accumulated other comprehensive loss |
83.4 | 93.0 | ||||||
Convergys Corporation 2009 Annual Report 69
Table of Contents
Notes to Consolidated Financial Statements (continued)
(Amounts in Millions Except Share and Per Share Amounts)
Accumulated other comprehensive loss at December 31, 2009 and 2008 represents unrecognized actuarial losses of $83.4 ($54.2, net of tax) and $93.0 ($60.4, net of tax), respectively. The actuarial loss included in accumulated other comprehensive loss that is expected to be recognized in net periodic pension cost during the fiscal year ended December 31, 2010 is $4.6. The accumulated benefit obligation for the cash balance plan was $208.6 and $201.4 at December 31, 2009 and 2008, respectively.
Estimated future benefit payments from the cash balance plan for the following five years are as follows:
| 2010 | $ | 10.5 | |
| 2011 | 9.8 | ||
| 2012 | 9.3 | ||
| 2013 | 9.0 | ||
| 2014 | 38.8 | ||
| Thereafter | 66.8 | ||
| Total | $ | 144.2 | |
Components of pension cost and other amounts recognized in other comprehensive income (loss) for the unfunded executive pension plans are as follows:
| Year Ended December 31, | ||||||||||||
| 2009 | 2008 | 2007 | ||||||||||
| Service cost | $ | 1.5 | $ | 2.0 | $ | 3.6 | ||||||
| Interest cost on projected benefit obligation | 2.1 | 3.5 | 4.4 | |||||||||
| Settlement loss | — | 3.3 | 0.7 | |||||||||
| Amortization and deferrals—net | (0.8 | ) | 0.3 | 1.1 | ||||||||
| Total pension cost | $ | 2.8 | $ | 9.1 | $ | 9.8 | ||||||
| Other comprehensive (income) loss | $ | 3.9 | $ | (24.0 | ) | $ | (6.2 | ) | ||||
The reconciliation of the unfunded executive pension plans’ projected benefit obligation for the years ended December 31, 2009 and 2008 is as follows:
| At December 31, | ||||||||
| 2009 | 2008 | |||||||
| Change in benefit obligation: | ||||||||
| Benefit obligation at beginning of year |
$ | 37.4 | $ | 75.1 | ||||
| Service cost |
1.5 | 2.0 | ||||||
| Interest cost |
2.1 | 3.5 | ||||||
| Change in plan provisions |
— | (2.1 | ) | |||||
| Actuarial loss (gain) |
3.1 | (18.3 | ) | |||||
| Benefits paid |
(7.0 | ) | (22.8 | ) | ||||
| Benefit obligation at end of year |
$ | 37.1 | $ | 37.4 | ||||
| Funded status |
$ | (37.1 | ) | $ | (37.4 | ) | ||
| Amounts recognized in the Consolidated Balance Sheets consisted of: |
||||||||
| Current Liability |
$ | 4.2 | $ | 5.6 | ||||
| Non-current liability |
32.9 | 31.8 | ||||||
| Accumulated other comprehensive income |
5.9 | 9.8 | ||||||
Included in accumulated other comprehensive income at December 31, 2009 are the following amounts that have not yet been recognized in net periodic pension cost: unrecognized prior service credits of 2.1 ($1.4, net of tax) and unrecognized actuarial gain of $3.8 ($2.5, net of tax). Included in accumulated other comprehensive income at December 31, 2008 are the following amounts that have not yet been recognized in net periodic pension cost: unrecognized prior service credits of $2.3 ($1.5, net of tax) and unrecognized actuarial gain $7.5 ($4.9, net of tax). The accumulated benefit obligation for the unfunded executive pension plans was $35.3 and $34.1 at December 31, 2009 and 2008, respectively. The prior service credit and actuarial gain included in accumulated other comprehensive income and expected to be recognized in net periodic pension cost during the year ending December 31, 2010 is ($0.2) and ($0.1), respectively.
70 Convergys Corporation 2009 Annual Report
Table of Contents
Estimated future benefit payments from the unfunded executive plans for the following five years are as follows:
| 2010 | $ | 4.2 | |
| 2011 | 3.4 | ||
| 2012 | 3.2 | ||
| 2013 | 2.9 | ||
| 2014 | 3.3 | ||
| Thereafter | 14.4 | ||
| Total | $ | 31.4 | |
The table above does not reflect expected future benefit payments of approximately $7 resulting from the change in the Company’s Chief Executive Officer as described in Note 20 in the Notes to Consolidated Financial Statements.
The following rates were used in determining the benefit obligations at December 31:
| 2009 | 2008 | |||
| Discount rate—projected benefit obligation | 5.50%-6.00% | 6.25%-6.50% | ||
| Future compensation growth rate | 4.00% | 4.00% | ||
| Expected long-term rate of return on plan assets | 8.00% | 8.00% | ||
The following rates were used in determining the pension cost for all years ended December 31:
| 2009 | 2008 | 2007 | ||||
| Discount rate—projected benefit obligation | 6.25%-6.50% | 6.25% | 5.75% | |||
| Future compensation growth rate | 4.00% | 4.00%-5.00% | 4.00%-5.00% | |||
| Expected long-term rate of return on plan assets | 8.00% | 8.50% | 8.50% | |||
As of December 31, 2009 and 2008, plan assets for the cash balance plan consisted of approximately 70% of equity securities and 30% of fixed income instruments, which is consistent with the Company’s targeted allocation. Plan assets for the cash balance plan included $3.6 and $2.6 of the Company’s common shares at December 31, 2009 and 2008, respectively. The investment objectives for the plan assets are to generate returns that will enable the plan to meets its future obligations. The Company’s expected long-term rate of return was determined based on the asset mix of the plan, past performance and other factors. The Company contributed $8.4 and $14.1 in 2009 and 2008, respectively, to fund its cash balance plan in order to satisfy its ERISA funding requirements. The Company expects to make $9.4 in contributions in 2010 to fund its cash balance plan. No plan assets are expected to be returned to the Company during 2010.
The following table sets forth by level, within the fair value hierarchy, the Plan’s assets at fair value as of December 31, 2009:
| Investments | Total | Quoted Prices In Active Markets for Identical Assets (Level 1) |
Significant Other Observable Inputs (Level 2) |
Significant Unobservable Inputs (Level 3) | |||||||||
| Common/Collective trusts | $ | 122.8 | $ | — | $ | 122.8 | (a) | $ | — | ||||
| Convergys common stock | 3.6 | 3.6 | — | — | |||||||||
| Equity funds | 3.3 | — | — | 3.3 | |||||||||
| Total investments | $ | 129.7 | $ | 3.6 | $ | 122.8 | $ | 3.3 | |||||
| (a) | 70% of shares of registered investment companies invest in equity securities and 30% in fixed income instruments. |
Savings Plans
The Company sponsors a defined contribution plan covering substantially all U.S. employees. The Company’s contributions to the plan are based on matching a portion of the employee contributions. Total Company contributions to the defined contribution plan were $17.6, $16.1 and $14.3 for 2009, 2008 and 2007, respectively. Plan assets for these plans included 2.6 million ($27.9) and 2.8 million ($17.9) of Company’s common shares at December 31, 2009 and 2008, respectively.
Employee Postretirement Benefits Other Than Pensions
The Company sponsors postretirement health and life insurance plans for certain eligible employees. The
Convergys Corporation 2009 Annual Report 71
Table of Contents
Notes to Consolidated Financial Statements (continued)
(Amounts in Millions Except Share and Per Share Amounts)
Company funds life insurance benefits of certain retirees through a Voluntary Employee Benefit Association (VEBA) trust. Contributions to the VEBA are subject to IRS limitations developed using the aggregate cost method. At December 31, 2006, the Company eliminated the postretirement life insurance plan benefits for non-retirement eligible employees. The Company’s postretirement benefit cost was $0.6, ($3.7) and $0.2 for 2009, 2008 and 2007, respectively. The accrued benefit costs pertaining to these benefits of $19.4 and $17.4 at December 31, 2009 and 2008, respectively, are classified with other long-term liabilities. The amounts included within accumulated other comprehensive income related to these benefits were $2.9 and $5.2 at December 31, 2009 and 2008, respectively. As discussed within the new accounting pronouncements section of Note 2 of the Notes to Consolidated Financial Statements, adoption of ASC 715 resulted in a $2.2 reduction to the retained earnings balance as of January 1, 2008.
11. Stock-Based Compensation Plans
At December 31, 2009, the Company had 38 million common shares that were authorized for issuance under the Convergys Corporation 1998 Long-Term Incentive Plan (Convergys LTIP), as amended on April 22, 2008. The Convergys LTIP provides for the issuance of stock-based awards to certain employees and Directors. From time to time, the Company grants restricted stock awards that generally vest over terms of three to five years, pursuant to the plan. During the restriction period, restricted stock awards entitle the holder to all the rights of a holder of common shares (other than the right to transfer the shares). Unvested shares are restricted as to disposition and subject to forfeiture under certain circumstances. The Company also grants stock options with exercise prices that are no less than market value of the stock at the grant date and have a ten-year term and vesting terms of three to four years. The Company has not issued any stock options to employees or Directors during 2009, 2008 and 2007. The Company also grants certain employees and Directors restricted stock units. Unlike the restricted stock awards discussed above, the restricted stock units do not possess dividend or voting rights. The restricted stock units consist of both time-related and performance-related units. The restrictions for the time-related restricted stock units generally lapse three years after the grant date. The performance-related units vest upon the Company’s satisfaction of certain financial performance conditions (relative shareholder return versus the S&P 500 return). Performance-related units that have not vested by the end of three years from the grant date (i.e. the performance conditions for vesting of those units have not been met within that period) are forfeited.
The following table shows certain information as of December 31, 2009, with respect to compensation plans under which common shares are authorized for issuance:
| No. of Common Shares to be Issued Upon Exercise |
Weighted Average Exercise Price |
Common shares Available for Future Issuance | |||||
| Equity compensation plans approved by shareholders | |||||||
| Stock options |
7,860,173 | $ | 32.21 | 6,496,551 | |||
| Restricted stock |
— | — | |||||
| Restricted stock units |
4,870,563 | N/A | |||||
| Equity compensation plans not approved by shareholders | — | — | — | ||||
| Total |
12,730,736 | $ | 32.21 | 6,496,551 | |||
The Company’s operating results reflect long-term incentive plan expense of $17.5, $18.3 and $24.5 for the years ended December 31, 2009, 2008 and 2007, respectively. Long-term incentive plan expenses include: (a) incentive plan expense that is paid in cash based on relative shareholder return, and (b) stock compensation expense. Stock compensation expense for the year ended December 31, 2009, 2008 and 2007 was $19.1, $19.4 and $25.6, respectively.
72 Convergys Corporation 2009 Annual Report
Table of Contents
Stock Options
Presented below is a summary of Company stock option activity:
| Shares (in Thousands) | Shares | Weighted Average Exercise Price | ||||
| Options outstanding at January 1, 2007 | 12,828 | $ | 28.69 | |||
| Options exercised in 2007 | (1,112 | ) | 14.73 | |||
| Options forfeited in 2007 | (775 | ) | 35.95 | |||
| Options outstanding and exercisable at December 31, 2007 | 10,941 | $ | 29.55 | |||
| Options exercised in 2008 | (233 | ) | $ | 13.29 | ||
| Options forfeited in 2008 | (1,362 | ) | 25.02 | |||
| Options outstanding and exercisable at December 31, 2008 | 9,346 | $ | 30.69 | |||
| Options exercised in 2009 | — | N/A | ||||
| Options forfeited in 2009 | (1,486 | ) | 22.67 | |||
| Options outstanding and exercisable at December 31, 2009 | 7,860 | $ | 32.21 | |||
The weighted average remaining contractual term for both the outstanding and exercisable options at December 31, 2009 was approximately 1.4 years. The weighted average grant date fair value per share for the outstanding and exercisable options at December 31, 2009 was $13.28.
The following table summarizes the status of the Company stock options outstanding and exercisable at December 31, 2009:
| Shares (in Thousands) | Options Outstanding and Exercisable | ||||||
| Range of Exercise Prices | Shares | Weighted Average Remaining Contractual Life |
Weighted Average Exercise Price | ||||
| $11.55 to $11.55 |
1,038 | 3.0 | $ | 11.55 | |||
| $11.56 to $21.81 |
464 | 3.2 | 13.94 | ||||
| $21.82 to $29.53 |
149 | 1.8 | 27.32 | ||||
| $29.54 to $36.49 |
1,795 | 0.1 | 29.89 | ||||
| $36.50 to $36.67 |
1,975 | 2.0 | 36.67 | ||||
| $36.68 to $43.50 |
399 | 0.5 | 38.76 | ||||
| $43.51 to $43.63 |
1,980 | 1.0 | 43.62 | ||||
| $43.64 and Over |
60 | 0.6 | 46.03 | ||||
| Total | 7,860 | 1.4 | $ | 32.21 | |||
Restricted Stock Awards and Restricted Stock Units
During 2009, 2008 and 2007, the Company granted 2.8 million, 1.6 million and 1.5 million shares, respectively, of restricted stock and restricted stock units. The weighted average fair values of these grants were $7.69, $12.09 and $24.08, respectively. Included in the total grants were 1.8 million, 1.2 million and 0.4 million of performance-related restricted stock units for 2009, 2008 and 2007, respectively.
The Company used a Monte Carlo simulation model to estimate the fair value for performance-based restricted stock units issued during 2009, 2008 and 2007. The assumptions used in this model for performance-based restricted stock units granted during 2009 and 2008 are set forth in the table below. Expected volatilities for the 2009 performance awards were based on historical volatility and daily returns for the three-year period ended
Convergys Corporation 2009 Annual Report 73
Table of Contents
Notes to Consolidated Financial Statements (continued)
(Amounts in Millions Except Share and Per Share Amounts)
January 1, 2009 of the Company’s stock and S&P 500 companies. For the 2009 performance awards, the total stock return for the Company over the performance period is based on comparing Convergys’ average closing price from the fourth quarter of 2008 with the average expected closing price for the fourth quarter of 2011. For these awards, the total stock return of the S&P 500 companies is computed by comparing the average closing price of the S&P 500 companies from the fourth quarter of 2008 with the average expected closing price for the fourth quarter of 2011. The risk-free interest rate for the expected term of the award granted is based on the U.S. Treasury yield curve in effect at the time of grant.
| 2009 | 2008 | |||
| Expected volatility | 52.8% | 30.1% | ||
| Expected term (in years) | 3.0 | 3.0 | ||
| Risk-free interest rate | 1.2% | 2.1% | ||
The total compensation cost related to non-vested restricted stock and restricted stock units not yet recognized as of December 31, 2009 was approximately $19, which is expected to be recognized over a weighted average of 1.1 years. Changes to non-vested restricted stock and restricted stock units for the years ended December 31, 2009 and 2008 were as follows:
| Amounts in millions | Number of Shares |
Weighted Average Fair Value at Date of Grant | ||||
| Non-vested at December 31, 2007 | 3.5 | $ | 20.35 | |||
| Granted |
1.6 | 12.09 | ||||
| Vested |
(1.2 | ) | 14.26 | |||
| Forfeited |
(0.3 | ) | 19.34 | |||
| Non-vested at December 31, 2008 | 3.6 | 16.82 | ||||
| Granted |
2.8 | 7.69 | ||||
| Vested |
(0.7 | ) | 19.09 | |||
| Forfeited |
(0.8 | ) | 13.92 | |||
| Non-vested at December 31, 2009 | 4.9 | $ | 12.18 | |||
12. Commitments and Contingencies
Commitments
The Company leases certain facilities and equipment used in its operations under operating leases. Total rent expense was $92.6, $85.4 and $86.4 in 2009, 2008 and 2007, respectively.
At December 31, 2009, the total minimum rental commitments under non-cancelable operating leases are as follows:
| 2010 | $ | 45.2 | |
| 2011 | 30.7 | ||
| 2012 | 19.2 | ||
| 2013 | 10.0 | ||
| 2014 | 6.8 | ||
| Thereafter | 19.1 | ||
| Total | $ | 131.0 | |
The Company leases certain equipment and facilities used in its operations under operating leases. This includes its office complex in Orlando, Florida, which is leased from Wachovia Development Corporation (Lessor), a wholly owned subsidiary of Wells Fargo & Company, under an agreement that expires in June 2010. Upon termination or expiration of the lease, the Company must either purchase the property from the Lessor for $65.0 or arrange to have the office complex sold to a third party. If the office complex is sold to a third party for an amount less than the $65.0, the Company has agreed under a residual value guarantee to pay the Lessor up to $55.0. If the office complex is sold to a third party for an amount in excess of $65.0, the Company is entitled to collect the excess. As of December 31, 2009, the Company has recognized a liability of approximately $12 for the related residual value guarantee. The value of the guarantee was determined based on the estimated present value of probability-weighted cash flows that might be expended under the guarantee. The Company recorded a liability for the fair value of the obligation with a corresponding asset recorded as prepaid rent, which is being amortized to rental expense over the lease term. The liability will
74 Convergys Corporation 2009 Annual Report
Table of Contents
remain on the Balance Sheet until the end of the lease term. Under the terms of the lease, the Company will also provide certain indemnities to the Lessor, including environmental indemnities. Due to the nature of such potential obligations, it is not possible to estimate the maximum amount of such exposure or the fair value. The Company does not expect such amounts, if any, to be material. The Company has concluded that it is not required to consolidate the Lessor pursuant to authoritative guidance for the consolidation of variable interest entities included within FASB Topic 810, “Consolidation” in the ASC. The Company is in the process of evaluating whether to purchase or refinance this property.
At December 31, 2009, the Company had outstanding letters of credit of approximately $55 and other bond obligations of approximately $41 related to performance and payment guarantees. The Company believes that any guarantee obligation that may arise will not be material.
The Company also has purchase commitments with three telecommunications providers of approximately $33 in 2010.
Contingencies
The Company from time to time is involved in various loss contingencies, including tax and legal contingencies that arise in the ordinary course of business. Pursuant to ASC 450, “Contingencies,” the Company accrues for a loss contingency when it is probable that a liability has been incurred and the amount of such loss can be reasonably estimated. At this time, the Company believes that the results of any such contingencies, either individually or in the aggregate, will not have a materially adverse effect on the Company’s results of operations or financial condition. However, the outcome of any litigation cannot be predicted with certainty. An unfavorable resolution of one or more pending matters could have a materially adverse impact on the Company’s results of operations or financial condition in the future.
Several related class action lawsuits were filed in the United States District Court for the Northern District of Texas on behalf of purchasers of common stock of Intervoice during the period from October 12, 1999 through June 6, 2000 (the Class Period). Plaintiffs have filed claims, which were consolidated into one proceeding, under Sections 10(b) and 20(a) of the Exchange Act and SEC Rule 10b-5 against Intervoice as well as certain named former officers and directors of Intervoice on behalf of the alleged class members. In the complaint, Plaintiffs claim that Intervoice and the named former officers and directors issued false and misleading statements during the Class Period concerning the financial condition of Intervoice, the results of the merger with Brite and the alleged future business projections of Intervoice. Plaintiffs have asserted that these alleged statements resulted in artificially inflated stock prices.
The District Court dismissed the Plaintiffs’ complaint because it lacked the degree of specificity and factual support to meet the pleading standards applicable to federal securities litigation. The Plaintiffs appealed the dismissal to the United States Court of Appeals for the Fifth Circuit, which affirmed the dismissal in part and reversed in part. The Fifth Circuit remanded a limited number of issues for further proceedings in the District Court.
On September 26, 2006, the District Court granted the Plaintiffs’ motion to certify a class of people who purchased Intervoice stock during the Class Period. On November 14, 2006, the Fifth Circuit granted Intervoice’s petition to appeal the District Court’s decision to grant Plaintiffs’ motion to certify a class. On January 8, 2008, the Fifth Circuit vacated the District Court’s class-certification order and remanded the case to the District Court for further consideration in light of the Fifth Circuit’s decision in Oscar Private Equity Investments v. Allegiance Telecom, Inc. The parties filed additional briefing in the District Court regarding class certification and are awaiting the District Court’s ruling. On July 7, 2009, the District Court ordered the parties to file additional briefing regarding class certification in light of the Fifth Circuit’s more recent decision in Alaska Electric
Convergys Corporation 2009 Annual Report 75
Table of Contents
Notes to Consolidated Financial Statements (continued)
(Amounts in Millions Except Share and Per Share Amounts)
Pension Fund v. Flowserve Corporation. On October 26, 2009, the District Court denied the Plaintiffs’ motion to certify a class. The named plaintiffs’ claims remain pending in the District Court. On November 9, 2009, the Plaintiffs sought permission from the Fifth Circuit to appeal the District Court’s order denying class certification. In December 2009, the Fifth Circuit accepted the plaintiff’s appeal.
Since 2002, the Company has been cooperating with the U.S. Department of Labor’s wage and hour division (DOL) on a number of matters to investigate and resolve allegations of the Company’s incorrect measurement of hourly call center employees’ work time. The Company expects to conclude its negotiations with the DOL, and to reach a mutually-satisfactory resolution in 2010. Such resolution would involve, among other things, the payment of back wages to some of the Company’s U.S. agents. The Company expects that the outcome of this DOL matter will not individually or in the aggregate have a material adverse effect on the Company’s results of operations or financial condition.
13. Financial Instruments
The Company is exposed to a variety of market risks, including the effects of changes in foreign currency exchange rates and interest rates. Market risk is the potential loss arising from adverse changes in market rates and prices. The Company’s risk management strategy includes the use of derivative instruments to reduce the effects on its operating results and cash flows from fluctuations caused by volatility in currency exchange and interest rates.
The Company serves many of its U.S.-based clients using contact center capacity in the Philippines, India and Canada. Although the contracts with these clients are typically priced in U.S. dollars, a substantial portion of the costs incurred to render services under these contracts are denominated in Philippine pesos (PHP), Indian rupees (INR) or Canadian dollars (CAD), which represents a foreign exchange exposure. The Company has hedged a portion of its exposure related to the anticipated cash flow requirements denominated in these foreign currencies by entering into forward exchange contracts and options with several financial institutions. These instruments mature within the next 36 months and had a notional value of $601.3 at December 31, 2009 and $866.7 at December 31, 2008. The derivative instruments discussed above are designated and effective as cash flow hedges. The following table reflects the fair values of these derivative instruments:
| December 31, | ||||||
| 2009 | 2008 | |||||
| Forward exchange contracts and options designated as hedging instruments under ASC 815 | ||||||
| Included within other current assets |
$ | 11.5 | $ | 1.8 | ||
| Included within other current liabilities |
18.3 | 40.8 | ||||
| Included within other long-term liabilities |
14.9 | 60.6 | ||||
The Company recorded deferred tax benefits of $8.0 and $35.8 related to these derivatives at December 31, 2009 and 2008, respectively. A total of $14.8 and $66.6 of deferred losses, net of tax, related to these cash flow hedges at December 31, 2009 and 2008, respectively, were in accumulated other comprehensive income (OCI). As of December 31, 2009, deferred losses of $11.2 ($7.3 net of tax), on derivative instruments included in accumulated other comprehensive income are expected to be reclassified into earnings during the next 12 months. The following table provides the effect of these derivative instruments on the Company’s Consolidated Financial Statements for the year ended December 31, 2009:
| Derivatives in FASB Cash Flow |
Gain (Loss) Recognized in OCI on Derivative (Effective Portion) |
Gain
(Loss) (Effective Portion) |
Location of Gain (Loss) Reclassified from Accumulated (Effective Portion) | ||||||
| Foreign exchange contracts |
$ | 49.8 | $ | (27.5 | ) | - Cost of providing services and products sold | |||
| - Selling, general and administrative | |||||||||
The gain recognized related to the ineffective portion of the derivative instruments was immaterial for the year ended December 31, 2009 and 2008.
76 Convergys Corporation 2009 Annual Report
Table of Contents
During 2009, 2008 and 2007, the Company recorded a net loss of $27.5 and net gains of $9.3 and $46.4, respectively, related to the settlement of forward contracts and options which were designated as cash flow hedges.
The Company also enters into derivative instruments (forwards) to economically hedge the foreign currency impact of assets and liabilities denominated in nonfunctional currencies. During the years ended December 31, 2009 and 2008, losses of $8.5 and $9.0, respectively, were recognized related to changes in fair value of these derivative instruments not designated as hedges. These losses are classified in other income (expense), net in the accompanying Consolidated Statements of Operations. The fair value of these derivative instruments not designated as hedges at December 31, 2009, was immaterial to the Company’s Consolidated Financial Statements. During early 2008, the Company had entered into treasury lock derivative instruments with a total notional amount of $200.0 in anticipation of a probable debt issuance later in 2008. As the Company did not expect issuance of the debt in the near future given the market conditions during the third quarter of 2008, the $6.0 gain on termination of the treasury lock was recognized within the other income, net in the accompanying Consolidated Statements of Operations for the year ended December 31, 2008.
Certain of the Company’s counterparty agreements related to derivative instruments contain provisions that require that the Company maintain collateral on derivative instruments in net liability positions. The aggregate fair value of all derivative instruments in liability position at December 31, 2009 was $33.2 for which the Company posted collateral of approximately $3, which is included in other current assets. Downgrades in the Company’s credit ratings and/or adverse change in the foreign currency markets will require additional collateral to counterparties.
14. Fair Value Disclosures
The following table summarizes the Company’s assets and liabilities measured and reported in the Financial Statements at fair value on a recurring basis as of December 31, 2009 and indicates the fair value hierarchy of the valuation techniques utilized to determine such fair value. The three levels of the fair value hierarchy defined by FASB Topic 820, “Fair Value Measurement and Disclosures,” in the ASC are as follows: level 1 inputs are quoted prices (unadjusted) in active markets for identical assets or liabilities; level 2 inputs are quoted prices for similar assets and liabilities in active markets or inputs that are observable for the asset or liability, either directly or indirectly through market corroboration, for substantially the full term of the financial instrument; and level 3 inputs are unobservable inputs based on the Company’s assumptions used to measure assets and liabilities at fair value. A financial asset or liability’s classification within the hierarchy is determined based on the lowest level input that is significant to the fair value measurement.
| Total | Quoted Prices In Active Markets for Identical Assets (Level 1) |
Significant Other Observable Inputs (Level 2) |
Significant Unobservable Inputs (Level 3) | |||||||
| Derivative assets | $ | 11.5 | — | $ | 11.5 | — | ||||
| Derivative liabilities | $ | 34.8 | — | $ | 34.8 | — | ||||
Effective January 1, 2009, the Company adopted Fair Value Measurements and Disclosures Topic, ASC 820-10-15-1a, for all nonfinancial assets and liabilities that are measured at fair value on a non-recurring basis, such as goodwill and identifiable intangible assets. The adoption of the guidance for nonfinancial assets and liabilities that are measured at fair value on a non-recurring basis did not impact the Company’s financial position or results of operations for the year ended December 31, 2009.
During 2009, as described in Note 7, the Company restructured two large HR Management contracts. These contract restructurings resulted in the Company evaluating the recoverability of deferred charges and certain other long-lived assets. The Company performed the recoverability analysis in accordance with FASB Subtopic 360-10, “Impairment or Disposal of Long-Lived Assets,” in the ASC, primarily based on a discounted cash flow model, which resulted in recording impairment charges of $113.6 largely related to its deferred charges.
Convergys Corporation 2009 Annual Report 77
Table of Contents
Notes to Consolidated Financial Statements (continued)
(Amounts in Millions Except Share and Per Share Amounts)
Fair values of cash equivalents, short-term investments and current accounts receivable and payable approximate the carrying amounts because of their short-term nature. The fair value of short-term debt approximates its recorded value because of its short-term nature. Based on quoted market prices at December 31, 2009, the fair value of the $125.0 of the Company’s 2029 Convertible Debentures is $149.3.
15. Income Taxes
The Company’s provision (benefit) for income taxes consists of the following:
| Year Ended December 31, | ||||||||||||
| 2009 | 2008 | 2007 | ||||||||||
| Current: | ||||||||||||
| United States federal |
$ | (31.7 | ) | $ | (32.2 | ) | $ | 3.8 | ||||
| Foreign |
11.6 | 17.4 | 22.9 | |||||||||
| State and local |
3.4 | (14.7 | ) | 2.8 | ||||||||
| Total current |
(16.7 | ) | (29.50 | ) | 29.5 | |||||||
| Deferred: | ||||||||||||
| United States federal |
(5.5 | ) | (27.8 | ) | 47.6 | |||||||
| Foreign |
(13.5 | ) | (0.6 | ) | (5.4 | ) | ||||||
| State and local |
(4.6 | ) | (13.1 | ) | 4.4 | |||||||
| Total deferred |
(23.6 | ) | (41.5 | ) | 46.6 | |||||||
| Total | $ | (40.3 | ) | $ | (71.0 | ) | $ | 76.1 | ||||
The Company’s combined pre-tax earnings from foreign subsidiaries or branches were $95.5, $56.5 and $93.1 during 2009, 2008 and 2007, respectively.
The following is a reconciliation of the statutory federal income tax rate with the effective tax rate for the tax benefit in 2009 and 2008 and the expense for 2007:
| Year Ended December 31, | |||||||||
| 2009 | 2008 | 2007 | |||||||
| U.S. federal statutory rate | 35.0 | % | 35.0 | % | 35.0 | % | |||
| Permanent differences | 1.4 | (9.5 | ) | 0.1 | |||||
| State and local income taxes, net of Federal income tax benefit | 2.1 | 3.5 | 1.4 | ||||||
| International rate differential | 11.9 | 12.8 | (6.0 | ) | |||||
| Foreign valuation allowances | 3.3 | (4.4 | ) | 0.4 | |||||
| Income tax reserve adjustments | (21.6 | ) | 4.4 | 0.9 | |||||
| Tax credits and other | 2.2 | 1.5 | (0.8 | ) | |||||
| Effective rate | 34.3 | % | 43.3 | % | 31.0 | % | |||
The 9.0% reduction in the income tax benefit rate in 2009 is primarily due to the impact on the tax rate of changes in reinvestment assertions related to certain foreign entities’ unremitted earnings, adjustments to income tax reserves and the geographic mix of world-wide income. The Company’s foreign taxes for 2009, 2008 and 2007 included $8.5 (7.2%), $13.7 (8.4%) and $11.8 (4.8%) respectively, of benefit derived from tax holidays in the Philippines and India. The Company’s foreign taxes for 2009, 2008 and 2007 include $7.5, $12.6 and $11.0, respectively, related to a tax holiday in India scheduled to expire March 2011. The tax holidays in the Philippines are scheduled to expire by December 2012. The Company has applied for one- or two-year extensions of the Philippine tax holidays in accordance with local law.
78 Convergys Corporation 2009 Annual Report
Table of Contents
The components of deferred tax assets and liabilities are as follows:
| At December 31, | ||||||||
| 2009 | 2008 | |||||||
| Deferred tax asset: | ||||||||
| Loss and credit carryforwards |
$ | 164.1 | $ | 218.0 | ||||
| Pension and employee benefits |
45.4 | 51.2 | ||||||
| Restructuring charges |
11.1 | 10.7 | ||||||
| Deferred revenue |
1.4 | 2.0 | ||||||
| Other comprehensive income |
34.1 | 63.2 | ||||||
| Other |
35.9 | 5.0 | ||||||
| Valuation allowance |
(51.3 | ) | (93.2 | ) | ||||
| Total deferred tax asset |
240.7 | 256.9 | ||||||
| Deferred tax liability: | ||||||||
| Depreciation and amortization |
143.0 | 118.4 | ||||||
| Deferred implementation costs |
11.2 | 72.8 | ||||||
| Other comprehensive income |
32.7 | — | ||||||
| Other |
14.5 | — | ||||||
| Total deferred tax liability |
201.4 | 191.2 | ||||||
| Net deferred tax asset |
$ | 39.3 | $ | 65.7 | ||||
As of December 31, 2009 and 2008, $22.0 and $23.6, respectively, of the valuation allowance relates to the Company’s foreign operations.
As of December 31, 2009, the Company has federal, state, and foreign operating loss carryforwards of $233.9, $974.3 and $145.0, respectively. The federal operating loss carryforwards and state operating loss carryforwards expire between 2020 and 2029. The foreign operating loss carryforwards include $102.2 with no expiration date; the remainder will expire between 2010 and 2024. The federal and state operating loss carryforwards include losses of $153.3 and $215.9, respectively, that were acquired in connection with business combinations. Utilization of the acquired federal and state tax loss carryforwards may be limited pursuant to Section 382 of the Internal Revenue Code of 1986. At December 31, 2009, the Company also had $9.7 in state tax credits that expire from 2010 to 2012.
The Company has not provided for U.S. federal income taxes or foreign withholding taxes on $292.5 of undistributed earnings of its foreign subsidiaries at December 31, 2009, because such earnings are intended to be reinvested indefinitely. It is not practicable to determine the amount of applicable taxes that would be due if such were distributed.
As of December 31, 2008, the liability for unrecognized tax benefits was $62.0, and is recoded within the other long-term liabilities in the accompanying Consolidated Financial Statements. The liability for unrecognized benefits of $62.0 as of December 31, 2008 included an accrual for interest and penalties of $17.9. As of December 31, 2009, the liability for unrecognized tax benefits was $80.9 and is recorded within other long-term liabilities in the accompanying Consolidated Financial Statements. The liability for unrecognized tax benefits of $80.9 as of December 31, 2009 included an accrual for interest and penalties of $16.2. The total amount of net unrecognized tax benefits that would affect income tax expense, if ever recognized in the Financial Statements, is $70.6. This amount includes net interest and penalties of $15.3. The Company’s policy is to recognize interest and penalties accrued on unrecognized tax benefits as part of income tax expense. During the years ended December 31, 2009 and 2008, the Company recognized approximately $5.5 and $5.8 in interest and penalties, respectively.
A reconciliation of the beginning and ending total amounts of unrecognized tax benefits (exclusive of interest and penalties) is as follows:
| 2009 | 2008 | |||||||
| Balance at January 1 | $ | 44.1 | $ | 60.4 | ||||
| Additions based on tax positions related to the current year |
39.0 | 2.3 | ||||||
| Additions for tax positions of prior years |
2.5 | 1.8 | ||||||
| Reductions for tax positions of prior years |
(3.7 | ) | (13.2 | ) | ||||
| Settlements |
(16.6 | ) | (4.0 | ) | ||||
| Lapse of statutes |
(0.6 | ) | (3.2 | ) | ||||
| Balance at December 31 | $ | 64.7 | $ | 44.1 | ||||
The increase in the liability for unrecognized tax benefits was largely due to uncertainty related to the deductibility
Convergys Corporation 2009 Annual Report 79
Table of Contents
Notes to Consolidated Financial Statements (continued)
(Amounts in Millions Except Share and Per Share Amounts)
of certain items, partially offset by decreases for the resolution of tax audits in the current year. The Company is currently attempting to resolve income tax audits relating to prior years in various jurisdictions. The Company has received assessments from these jurisdictions including transfer pricing and deductibility of expenses. The Company believes that it is appropriately reserved with regard to these assessments as of December 31, 2009. Furthermore, the Company believes that it is reasonably possible that the total amounts of unrecognized tax benefits will decrease between $5.0 to $10.0 prior to December 31, 2010, based upon resolution of audits; however, actual developments could differ from those currently expected.
The Company files income tax returns in the U.S. federal jurisdiction, and various states and foreign jurisdictions. With a few exceptions, the Company is no longer subject to examinations by tax authorities for years before 2002.
16. Asset Securitization
During 2009, the Company entered into a $125.0 asset securitization facility collateralized by accounts receivables of certain of its subsidiaries, of which $50.0 expires in June 2010 and $75.0 expires in June 2012. The asset securitization program is conducted through Convergys Funding Inc., a wholly-owned bankruptcy remote subsidiary of the Company. The asset securitization facility does not qualify for sale treatment under the authoritative guidance for the accounting for transfers and servicing of financial assets and extinguishments of liabilities included in FAS Topic 860, “Transfers and Servicing,” in the ASC. Accordingly, the accounts receivable and related debt obligation will remain on the Company’s Consolidated Balance Sheet. As of December 31, 2009, this facility remained undrawn. During February 2010, the Company has drawn down approximately $65 from this facility.
17. Additional Financial Information
| At December 31, | ||||||||
| 2009 | 2008 | |||||||
| Property and equipment, net: | ||||||||
| Land |
$ | 21.2 | $ | 21.2 | ||||
| Buildings |
179.4 | 178.5 | ||||||
| Leasehold improvements |
184.7 | 180.0 | ||||||
| Equipment |
647.5 | 643.8 | ||||||
| Software |
508.8 | 489.3 | ||||||
| Construction in progress and other |
28.1 | 35.7 | ||||||
| 1,569.7 | 1,548.5 | |||||||
| Less: Accumulated depreciation |
(1,202.0 | ) | (1,127.6 | ) | ||||
| $ | 367.7 | $ | 420.9 | |||||
| Payables and other current liabilities: | ||||||||
| Accounts payable |
$ | 37.5 | $ | 68.5 | ||||
| Accrued taxes |
37.5 | 26.8 | ||||||
| Accrued payroll-related expenses |
112.2 | 126.1 | ||||||
| Derivative Liabilities |
19.8 | 43.5 | ||||||
| Accrued expenses, other |
146.7 | 158.0 | ||||||
| Restructuring and exit costs |
38.2 | 23.1 | ||||||
| Deferred revenue and government grants |
92.0 | 92.7 | ||||||
| $ | 483.9 | $ | 538.7 | |||||
| Accumulated other comprehensive (loss) income: | ||||||||
| Foreign currency translation adjustments |
$ | 6.3 | $ | (19.1 | ) | |||
| Changes related to pension liability, net of tax benefit of $26.1 and $28.5 |
(48.5 | ) | (50.7 | ) | ||||
| Unrealized loss on hedging activities, net of tax benefit of $7.9 and $35.8 |
(14.8 | ) | (66.6 | ) | ||||
| $ | (57.0 | ) | $ | (136.4 | ) | |||
80 Convergys Corporation 2009 Annual Report
Table of Contents
Cellular Partnerships
Summarized financial information for the Cellular Partnerships is as follows:
| At December 31, | |||||||||
| 2009 | 2008 | 2007 | |||||||
| Current assets | $ | 59.9 | $ | 66.5 | $ | 68.7 | |||
| Non-current assets | 213.8 | 213.1 | 234.4 | ||||||
| Current liabilities | 29.0 | 30.4 | 27.0 | ||||||
| Non-current liabilities | 89.6 | 97.0 | 108.5 | ||||||
| Year Ended December 31, | |||||||||
| 2009 | 2008 | 2007 | |||||||
| Revenues | $ | 594.7 | $ | 514.9 | $ | 446.6 | |||
| Depreciation and amortization | 35.5 | 38.6 | 65.9 | ||||||
| Operating income | 123.2 | 107.4 | 45.3 | ||||||
| Net income | 121.3 | 103.8 | 41.8 | ||||||
18. Industry Segment and Geographic Operations
Industry Segment Information
The Company has three segments, which are identified by service offerings. Customer Management provides agent-assisted services, self-service and technology solutions. Information Management provides business support system solutions for the global communications industry. HR Management provides global human resource business process outsourcing solutions. These segments are consistent with the Company’s management of the business and reflect its internal financial reporting structure and operating focus.
The Company does not allocate activities below the operating income level to its reported segments. The Company’s business segment information is as follows:
| Year Ended December 31, | |||||||||
| 2009 | 2008 | 2007 | |||||||
| Revenues: | |||||||||
| Customer Management |
$ | 1,986.7 | $ | 1,954.8 | $ | 1,866.1 | |||
| Information Management |
434.3 | 571.5 | 723.0 | ||||||
| HR Management |
406.2 | 259.5 | 255.2 | ||||||
| $ | 2,827.2 | $ | 2,785.8 | $ | 2,844.3 | ||||
| Depreciation: | |||||||||
| Customer Management |
$ | 66.9 | $ | 61.4 | $ | 55.9 | |||
| Information Management |
22.6 | 28.2 | 32.4 | ||||||
| HR Management |
8.6 | 9.3 | 8.7 | ||||||
| Corporate and other (1) |
20.8 | 20.1 | 18.4 | ||||||
| $ | 118.9 | $ | 119.0 | $ | 115.4 | ||||
| Amortization: | |||||||||
| Customer Management |
$ | 7.3 | $ | 4.3 | $ | 2.7 | |||
| Information Management |
3.6 | 7.0 | 3.7 | ||||||
| HR Management |
0.8 | 2.2 | 2.6 | ||||||
| $ | 11.7 | $ | 13.5 | $ | 9.0 | ||||
| Restructuring Charges: | |||||||||
| Customer Management |
$ | 7.9 | $ | 14.0 | $ | — | |||
| Information Management |
30.4 | 9.7 | 3.4 | ||||||
| HR Management |
3.7 | 10.5 | — | ||||||
| Corporate and other |
5.0 | 0.2 | — | ||||||
| $ | 47.0 | $ | 34.4 | $ | 3.4 | ||||
| Asset Impairments: | |||||||||
| Customer Management |
$ | — | $ | — | $ | 1.4 | |||
| Information Management |
3.1 | — | 1.3 | ||||||
| HR Management |
110.5 | 268.6 | 2.8 | ||||||
| $ | 113.6 | $ | 268.6 | $ | 5.5 | ||||
Convergys Corporation 2009 Annual Report 81
Table of Contents
Notes to Consolidated Financial Statements (continued)
(Amounts in Millions Except Share and Per Share Amounts)
| Year Ended December 31, | ||||||||||||
| 2009 | 2008 | 2007 | ||||||||||
| Operating Income (Loss): | ||||||||||||
| Customer Management |
$ | 133.9 | $ | 92.6 | $ | 176.7 | ||||||
| Information Management |
21.9 | 96.4 | 130.9 | |||||||||
| HR Management |
(246.1 | ) | (358.8 | ) | (38.3 | ) | ||||||
| Corporate (1) |
(22.5 | ) | (21.5 | ) | (24.5 | ) | ||||||
| $ | (112.8 | ) | $ | (191.3 | ) | $ | 244.8 | |||||
| Capital Expenditures: | ||||||||||||
| Customer Management |
$ | 44.5 | $ | 49.7 | $ | 32.4 | ||||||
| Information Management |
10.8 | 17.9 | 18.4 | |||||||||
| HR Management |
3.7 | 8.3 | 17.1 | |||||||||
| Corporate (1) |
15.9 | 24.6 | 34.4 | |||||||||
| $ | 74.9 | $ | 100.5 | $ | 102.3 | |||||||
| (1) | Includes shared services-related capital expenditures and depreciation. |
| At December 31, | ||||||
| 2009 | 2008 | |||||
| Total Assets: | ||||||
| Customer Management |
$ | 1,503.1 | $ | 1,570.4 | ||
| Information Management |
464.6 | 516.7 | ||||
| HR Management |
156.0 | 385.5 | ||||
| Corporate |
489.9 | 368.8 | ||||
| $ | 2,613.6 | $ | 2,841.4 | |||
Geographic Operations
The following table presents certain geographic information regarding the Company’s operations:
| Year Ended December 31, | |||||||||
| 2009 | 2008 | 2007 | |||||||
| Revenues: | |||||||||
| North America |
$ | 2,361.2 | $ | 2,336.3 | $ | 2,449.8 | |||
| Rest of World |
466.0 | 449.5 | 394.5 | ||||||
| $ | 2,827.2 | $ | 2,785.8 | $ | 2,844.3 | ||||
| At December 31, | |||||||||
| 2009 | 2008 | 2007 | |||||||
| Long-lived Assets: | |||||||||
| North America |
$ | 1,490.8 | $ | 1,614.5 | $ | 1,465.5 | |||
| Rest of World |
161.7 | 240.5 | 230.2 | ||||||
| $ | 1,652.5 | $ | 1,855.0 | $ | 1,695.7 | ||||
Concentrations
The Customer Management and Information Management segments derive significant revenues from AT&T. Revenues from AT&T were 19.8%, 18.2% and 16.3% of the Company’s consolidated revenues for 2009, 2008 and 2007, respectively. Related accounts receivable from AT&T totaled $85.8 and $93.1 at December 31, 2009 and 2008, respectively.
19. Quarterly Financial Information (Unaudited)
| 1st Quarter |
2nd Quarter |
3rd Quarter |
4th Quarter |
Total | ||||||||||||||||
| 2009: | ||||||||||||||||||||
| Revenues | $ | 694.7 | $ | 682.7 | $ | 765.4 | $ | 684.4 | $ | 2,827.2 | ||||||||||
| Operating (loss) income | $ | 38.8 | (a) | $ | (71.1 | )(b) | $ | (90.3 | )(c) | $ | 9.8 | (d) | $ | (112.8 | ) | |||||
| Net (loss) income | $ | 28.0 | (a) | $ | (60.9 | )(b) | $ | (86.0 | )(c) | $ | 41.6 | (d) | $ | (77.3 | ) | |||||
| (Loss) earnings per share | ||||||||||||||||||||
| Basic |
$ | 0.23 | $ | (0.50 | ) | $ | (0.70 | ) | $ | 0.34 | $ | (0.63 | ) | |||||||
| Diluted |
$ | 0.23 | $ | (0.50 | ) | $ | (0.70 | ) | $ | 0.33 | $ | (0.63 | ) | |||||||
| 2008: | ||||||||||||||||||||
| Revenues | $ | 716.4 | $ | 689.5 | $ | 676.2 | $ | 703.7 | $ | 2,785.8 | ||||||||||
| Operating (loss) income | $ | 38.9 | $ | 47.4 | $ | (242.0 | )(e) | $ | (35.6 | )(f) | $ | (191.3 | ) | |||||||
| Net (loss) income | $ | 35.9 | $ | 40.5 | $ | (140.0 | )(e) | $ | (29.3 | )(f) | $ | (92.9 | ) | |||||||
| (Loss) earnings per share | ||||||||||||||||||||
| Basic |
$ | 0.28 | $ | 0.33 | $ | (1.15 | ) | $ | (0.24 | ) | $ | (0.75 | ) | |||||||
| Diluted |
$ | 0.28 | $ | 0.32 | $ | (1.15 | ) | $ | (0.24 | ) | $ | (0.75 | ) | |||||||
| Segment Data: | ||||||||||||||||||||
| Customer Management | ||||||||||||||||||||
| 2009: | ||||||||||||||||||||
| Revenues | $ | 516.9 | $ | 494.6 | $ | 491.6 | $ | 483.6 | $ | 1,986.7 | ||||||||||
| Operating income | $ | 40.3 | $ | 36.9 | $ | 33.5 | $ | 23.2 | $ | 133.9 | ||||||||||
| 2008: | ||||||||||||||||||||
| Revenues | $ | 476.0 | $ | 469.0 | $ | 483.2 | $ | 526.6 | $ | 1,954.8 | ||||||||||
| Operating income | $ | 21.9 | $ | 19.4 | $ | 23.3 | $ | 28.0 | $ | 92.6 | ||||||||||
82 Convergys Corporation 2009 Annual Report
Table of Contents
| 1st Quarter |
2nd Quarter |
3rd Quarter |
4th Quarter |
Total | ||||||||||||||||
| Information Management | ||||||||||||||||||||
| 2009: | ||||||||||||||||||||
| Revenues | $ | 107.6 | $ | 115.1 | $ | 99.2 | $ | 112.4 | $ | 434.3 | ||||||||||
| Operating income (loss) | $ | 12.5 | $ | 17.0 | $ | 3.3 | $ | (10.9 | )(g) | $ | 21.9 | |||||||||
| 2008: | ||||||||||||||||||||
| Revenues | $ | 163.2 | $ | 161.1 | $ | 133.6 | $ | 113.6 | $ | 571.5 | ||||||||||
| Operating income | $ | 29.5 | $ | 37.9 | $ | 17.4 | $ | 11.6 | $ | 96.4 | ||||||||||
| HR Management | ||||||||||||||||||||
| 2009: | ||||||||||||||||||||
| Revenues | $ | 70.2 | $ | 73.0 | $ | 174.6 | $ | 88.4 | $ | 406.2 | ||||||||||
| Operating (loss) income | $ | (9.5 | )(a) | $ | (119.4 | )(b) | $ | (124.9 | )(c) | $ | 7.7 | (h) | $ | (246.1 | ) | |||||
| 2008: | ||||||||||||||||||||
| Revenues | $ | 77.2 | $ | 59.4 | $ | 59.4 | $ | 63.5 | $ | 259.5 | ||||||||||
| Operating (loss) | $ | (4.9 | ) | $ | (4.2 | ) | $ | (279.8 | )(e) | $ | (69.9 | )(f) | $ | (358.8 | ) | |||||
| (a) | Includes implementation charges of $8.6. See Note 7 of the Notes to Consolidated Financial Statements for more details related to these charges. |
| (b) | Includes asset impairment and implementation charges of $121.0. See Note 7 of the Notes to Consolidated Financial Statements for more details related to these charges. |
| (c) | Includes asset impairment, settlement and implementation charges, net of previously deferred implementation recognized, of $118.3. See Note 7 of the Notes to Consolidated Financial Statements for more details related to these charges. |
| (d) | Includes asset impairment, settlement and implementation charges, net of previously deferred implementation revenue recognized, of ($1.0). See Note 7 of the Notes to Consolidated Financial Statements for more details related to these charges. |
| (e) | Includes asset impairment and implementation charges of $272.9. See Note 7 of the Notes to Consolidated Financial Statements for more details related to these charges. |
| (f) | Includes goodwill impairment charge of $61.1. See Note 6 of the Notes to Consolidated Financial Statements for more details related to this charge. |
| (g) | Includes asset impairment charge of $3.1. |
| (h) | Includes asset impairment, settlement and implementation charges, net of previously deferred implementation revenue recognized, of ($4.1). See Note 7 of the Notes to Consolidated Financial Statements for more details related to these charges. |
20. Subsequent Events
On February 9, 2010, David F. Dougherty’s role as President and Chief Executive Officer and a member of the Board of Directors terminated. On February 9, 2010, the Company appointed Jeffrey H. Fox as President and Chief Executive Officer of the Company. Mr. Fox is currently a member of the Board of Directors of the Company. The impact of this change on the Company’s net income for 2010 is expected to be approximately $6 to $7.
During February 2010, the Company repaid $300.0 of its outstanding portion of the Revolving Credit Facility and also drew approximately $65 from its $125.0 asset securitization facility. The Revolving Credit Facility and $125.0 asset securitization facility are described more fully under Notes 8 and 16, respectively, of the Notes to Consolidated Financial Statements.
Convergys Corporation 2009 Annual Report 83
Table of Contents
Item 9., 9A. and 9B.
Item 9. Changes in and Disagreements with Accountants on Accounting and Financial Disclosure
No disagreements with accountants on any accounting or financial disclosure or auditing scope or procedure occurred during 2009.
Item 9A. Controls and Procedures
Evaluation of Disclosure Controls and Procedures
The Company’s Chief Executive Officer and Chief Financial Officer evaluated, together with General Counsel, the Chief Accounting Officer and other key employees, the effectiveness of design and operation of the Company’s “disclosure controls and procedures” (as defined in Rules 13a-15(e) and 15d-15(e) under the Securities Exchange Act of 1934, as amended (the Act)) as of the year ended December 31, 2009 (Evaluation Date). Based on this evaluation, the Company’s Chief Executive Officer and Chief Financial Officer have concluded that the Company’s disclosure controls and procedures were effective as of the Evaluation Date such that the information required to be disclosed by the Company in the reports that it files or submits under the Act is accumulated and communicated to the Company’s management, including its Chief Executive Officer and Chief Financial Officer, as appropriate, to allow timely decisions regarding required disclosure, and are effective to ensure that such information is recorded, processed, summarized and reported within the time periods specified in the Security and Exchange Commission’s rules and forms.
Attestation Report on Internal Control Over Financial Reporting
Convergys’ management is responsible for establishing and maintaining adequate internal control over financial reporting (as such term is defined in Exchange Act Rule 13a-15(f)) that is designed to produce reliable Financial Statements in conformity with accounting principles generally accepted in the United States. Management conducted an evaluation of the effectiveness of the Company’s internal control over financial reporting as of December 31, 2009. In making this assessment, it used the criteria set forth by the Committee of Sponsoring Organizations of the Treadway Commission (COSO) in Internal Control – Integrated Framework. Based on its assessment, management concluded that, as of December 31, 2009, the Company’s internal control over financial reporting was effective based on those criteria. The Company’s independent registered accounting firm, Ernst & Young LLP, has issued an attestation report on internal control over financial reporting, which appears on page 47.
Changes in Internal Control
There have been no changes in the Company’s internal control over financial reporting that occurred during the year ended December 31, 2009 that have materially affected, or are reasonably likely to materially affect, the Company’s internal control over financial reporting.
None.
84 Convergys Corporation 2009 Annual Report
Table of Contents
Part III, Item 10. through 14.
PART III
Item 10. Directors, Executive Officers and Corporate Governance
The information required by Item 10 with respect to directors, the Audit Committee of the Board of Directors, Audit Committee financial experts, Financial Code of Ethics and Section 16 compliance is incorporated herein by reference to the Company’s proxy statement relating to its annual meeting of shareholders to be held on April 20, 2010.
Certain information concerning the executive officers of the Company is contained on page 13 of this Form 10-K.
Item 11. Executive Compensation
The information required by Item 11 is incorporated herein by reference to the Company’s proxy statement relating to its annual meeting of shareholders to be held on April 20, 2010.
Item 12. Security Ownership of Certain Beneficial Owners and Management and Related Stockholder Matters
The Share Ownership of Directors and Officers section is incorporated herein by reference to the Company’s proxy statement relating to its annual meeting of shareholders to be held on April 20, 2010.
The remaining information called for by this Item relating to “securities authorized for issuance under equity compensation plans” is incorporated by reference to Note 11 of the Notes to Consolidated Financial Statements.
Item 13. Certain Relationships and Related Transactions, and Director Independence
Relationships and related transactions section, and director independence is incorporated herein by reference to the Company’s proxy statement relating to its annual meeting of shareholders to be held on April 20, 2010.
Item 14. Principal Accounting Fees and Services
The information required by Item 14 is incorporated by reference to the Company’s proxy statement relating to its annual meeting of shareholders to be held on April 20, 2010.
Convergys Corporation 2009 Annual Report 85
Table of Contents
Part IV, Items 15., 15(a)(1) and (2)
PART IV
Item 15. Exhibits, Financial Statement Schedule
Item 15(a)(1) and (2). List of Financial Statements and Financial Statement Schedule
The following consolidated financial statements of Convergys are included in Item 8:
| Page | ||||
| (1) | Consolidated Financial Statements: | |||
| Reports of Independent Registered Public Accounting Firm | 47 | |||
| Consolidated Statements of Operations and Comprehensive Income (Loss) | 49 | |||
| Consolidated Balance Sheets | 50 | |||
| Consolidated Statements of Cash Flows | 51 | |||
| Consolidated Statements of Shareholders’ Equity | 52 | |||
| Notes to Consolidated Financial Statements | 53 | |||
| (2) | Financial Statement Schedule: | |||
| II - Valuation and Qualifying Accounts | 90 | |||
Financial statement schedules other than that listed above have been omitted because the required information is not required or applicable.
(3) Exhibits:
Exhibits identified in parenthesis below, on file with the Securities and Exchange Commission (SEC), are incorporated herein by reference as exhibits hereto.
Exhibit Number
| 3.1 | Amended Articles of Incorporation of Convergys Corporation. (Incorporated by reference from Exhibit 3.1 to Form S-3 Registration Statement (File No. 333-43404) filed on August 10, 2000.) |
| 3.2 | Amended and Restated Code of Regulations of Convergys Corporation. (Incorporated by reference from Exhibit 3.2 to Form 10-Q filed on May 5, 2009.) |
| 4.1 | Indenture, dated October 13, 2009, by and between Convergys Corporation and U.S. Bank National Associated, as trustee, relating to Convergys Corporation’s 5.75% Junior Subordinated Convertible Debentures due 2029. (Incorporated by reference from Exhibit 4.1 to Form 8-K filed October 13, 2009.) |
| 4.2 | Form of 5.75% Junior Subordinated Convertible Debenture due 2029. (Incorporated by reference from Exhibit 4.1 to Form 8-K filed October 13, 2009.) |
| 10.1 | Employment Letter between Convergys Corporation and Andrea J. Ayers dated June 4, 1998. |
| 10.2 | Change-in-control Agreement between Convergys Corporation and Andrea J. Ayers dated June 8, 2008. |
| 10.3 | Offer of Employment Letter between Convergys Corporation and James P. Boyce dated February 22, 2000. |
| 10.4 | Change-in-control Agreement between Convergys Corporation and James P. Boyce dated June 8, 2008. |
| 10.5 | Employment Agreement between Convergys Corporation and Robert A. Lento dated September 1, 2002. |
| 10.6 | Amendment to Employment Agreement dated September 1, 2002 between Convergys Corporation and Robert A. Lento dated December 29, 2008. |
| 10.8 | Offer Letter, dated February 9, 2010, between Convergys Corporation and Jeffrey Fox (Incorporated by reference from Exhibit 10.1 to Form 8-K filed on February 12, 2010). |
| 10.9 | Convergys Corporation Deferred Compensation and Long-Term Incentive Plan Award Deferral Plan for Non-Employee Directors as amended and restated effective February 24, 2004. (Incorporated by |
86 Convergys Corporation 2009 Annual Report
Table of Contents
| reference from Exhibit 10.24 to Form 10-Q filed on August 9, 2004.) * |
| 10.10 | Convergys Corporation Deferred Compensation Plan for Non-Employee Directors dated August 26, 2008. (Incorporated by reference from Exhibit 10.2 to Form 10-Q filed on November 5, 2008.) * |
| 10.11 | Convergys Corporation Long-Term Incentive Plan as amended and restated effective as of April 22, 2008. (Incorporated by reference from Exhibit 10.4 to Form 10-Q filed on May 7, 2008.) * |
| 10.12 | Convergys Corporation Supplemental Executive Retirement Plan amended effective February 20, 2007. (Incorporated by reference from Exhibit 10.1 to Form 10-Q filed on August 7, 2007.) * |
| 10.13 | Convergys Corporation Supplemental Executive Retirement Plan as amended dated August 26, 2008. (Incorporated by reference from Exhibit 10.3 to Form 10-Q filed on November 5, 2008.) * |
| 10.14 | Convergys Corporation Executive Deferred Compensation Plan as amended October 29, 2001. (Incorporated by reference from Exhibit 10.9 to Form 10-K filed on February 28, 2008.) * |
| 10.15 | Convergys Corporation Executive Deferred Compensation Plan as amended effective February 24, 2004. (Incorporated by reference from Exhibit 10.25 to Form 10-Q filed on August 9, 2004.) * |
| 10.16 | Convergys Corporation Executive Deferred Compensation Plan as amended dated December 21, 2005. (Incorporated by reference from Exhibit 10.14 to Form 10-K filed on February 27, 2009.) * |
| 10.17 | Convergys Corporation Executive Deferred Compensation Plan as amended dated October 21, 2008. (Incorporated by reference from Exhibit 10.15 to Form 10-K filed on February 27, 2009.) * |
| 10.18 | Convergys Corporation Employee Stock Purchase Plan. (Incorporated by reference from Appendix IV of Convergys Corporation’s Definitive Schedule 14A filed on March 12, 2004.) * |
| 10.19 | Convergys Corporation Retirement and Savings Plan as amended and restated dated January 28, 2008. (Incorporated by reference from Exhibit 10.17 to Form 10-K filed on February 27, 2009.) * |
| 10.20 | Amendment to Convergys Corporation Retirement and Savings Plan dated March 31, 2008. (Incorporated by reference from Exhibit 10.18 to Form 10-K filed on February 27, 2009.) * |
| 10.21 | Amendment to Convergys Corporation Retirement and Savings Plan dated December 23, 2008. (Incorporated by reference from Exhibit 10.19 to Form 10-K filed on February 27, 2009.) * |
| 10.22 | Convergys Corporation Canadian Employee Share Plan. (Incorporated by reference from Exhibit 4.2.1 to Form S-8 Registration Statement (File No. 333-86137) filed on December 29, 1999.) * |
| 10.23 | Annual Executive Incentive Plan dated February 20, 2007. (Incorporated by reference from Appendix IV of the Convergys Corporation’s Definitive Schedule 14A filed on March 13, 2007.) * |
| 10.24 | Convergys Corporation Qualified and Non-Qualified Pension Plan as amended and restated dated January 28, 2008. (Incorporated by reference from Exhibit 10.22 to Form 10-K filed on February 27, 2009.) * |
| 10.25 | Amended Convergys Corporation Qualified and Non-Qualified Pension Plan dated March 31, 2008. (Incorporated by reference from Exhibit 10.23 to Form 10-K filed on February 27, 2009.) * |
| 10.26 | Amended Convergys Corporation Qualified and Non-Qualified Pension Plan dated December 17, 2008. (Incorporated by reference from Exhibit 10.24 to Form 10-K filed on February 27, 2009.) * |
| 10.27 | Convergys Corporation Severance Pay Plan dated December 9, 2008. (Incorporated by reference from Exhibit 10.25 to Form 10-K filed on February 27, 2009.) * |
| 10.28 | 2007 Form of Performance-Based Restricted Stock Unit Award Agreement. (Incorporated by reference from Exhibit 10.26.1 to Form 10-K filed on February 28, 2007.) * |
Convergys Corporation 2009 Annual Report 87
Table of Contents
Part IV (continued)
| 10.29 | 2007 Form of Performance Unit Award Agreement. (Incorporated by reference from Exhibit 10.27.1 to Form 10-K filed on February 28, 2007.) * |
| 10.30 | 2007 Form of Time-Based Restricted Stock Unit Award Agreement for Directors. (Incorporated by reference from Exhibit 10.31 to Form 10-K filed on February 27, 2009.) * |
| 10.31 | 2008 Form of Time-Based Restricted Stock Unit Award for Directors. (Incorporated by reference from Exhibit 10.1 to Form 10-Q filed on May 7, 2008.) * |
| 10.32 | 2008 Form of Performance-Based Restricted Stock Unit Award. (Incorporated by reference from Exhibit 10.2 to Form 10-Q filed on May 7 2008.) * |
| 10.33 | 2008 Form of Performance Unit Award. (Incorporated by reference from Exhibit 10.3 to Form 10-Q filed on May 7, 2008.) * |
| 10.34 | Five-Year Competitive Advance and Revolving Credit Facility Agreement, dated October 20, 2006, between Convergys Corporation, certain financial institutions, JPMorgan Chase Bank, National Association, as Administrative Agent, Citicorp, USA, Inc., as Syndication Agent, and Deutsche Bank AG, New York Branch and PNC Bank, National Association, as Co-Documentation Agents. (Incorporated by reference from Exhibit 10.1 to Form 8-K filed October 24, 2006.) |
| 10.35 | Amendment to Five-Year Competitive Advance and Revolving Credit Facility Agreement dated as of August 11, 2008. (Incorporated by reference from Exhibit 10.4 to Form 10-Q filed on November 5, 2008.) |
| 10.36 | Participation Agreement, dated as of June 30, 2003, between Convergys Corporation, Various Guarantors and Wachovia Development Corporation. (Incorporated by reference from Exhibit 10.1 to Form 10-Q filed on August 12, 2003.) |
| 10.37 | Amended and Restated Lease Agreement, dated as of June 30, 2003, between Wachovia Development Corporation and Convergys Corporation. (Incorporated by reference from Exhibit 10.2 to Form 10-Q filed on August 12, 2003.) |
| 10.38 | Security Agreement, dated as of June 30, 2003, between Wachovia Development Corporation and Wachovia Bank, National Association and accepted and agreed to by Convergys Corporation. (Incorporated by reference from Exhibit 10.3 to Form 10-Q filed on August 12, 2003.) |
| 10.39 | Assignment and Recharacterization Agreement, dated as of June 30, 2003, between Convergys Corporation, Wells Fargo Bank Northwest, National Association, and Bank of America, National Association. (Incorporated by reference from Exhibit 10.4 to Form 10-Q filed on August 12, 2003.) |
| 10.40 | Agreement, dated February 4, 2009, by and between Convergys Corporation and JANA Partners LLC. (Incorporated by reference from Exhibit 10.1 to Form 8-K filed on February 5, 2009.) |
| 10.41 | First Amendment to Agreement, dated December 23, 2009, between Convergys Corporation and JANA Partners, LLC. (Incorporated by reference from Exhibit 10.1 for Form 8-K filed on December 28, 2009.) |
| 10.42 | Receivables Sales Agreement, dated as of June 30, 2009, between Convergys Corporation, as Originator, and Convergys Funding Inc., as Buyer. (Incorporated by reference from Exhibit 10.1 to Form 10-Q filed on August 4, 2009.) |
| 10.43 | Receivables Purchase Agreement, dated as of June 30, 2009, among Convergys Funding Inc. as Seller, Convergys Corporation as Services, Wachovia Bank, National Association, Liberty Street Funding LLC, the Bank of Nova Scotia, The Bank of Nova Scotia as Scotiabank Group Agent, and Wachovia Bank, National Association as Administrative Agent. (Incorporated by reference from Exhibit 10.2 to Form 10-Q filed on August 4, 2009.) |
| 10.44 | Second Amendment to the Five-Year Competitive Advance and Revolving Credit facility Agreement dated as of October 20, 2006, among Convergys Corporation, the Lenders party thereto and JPMorgan Chase Bank, National Association, as Administrative Agent, dated as of February 12, 2010. |
88 Convergys Corporation 2009 Annual Report
Table of Contents
Part IV (continued), Item 15(b) and (c).
| 10.45 | 2009 Form of Time-Based Restricted Stock Unit Award Agreement for Employees. * |
| 10.46 | 2009 Form of Performance-Based Stock Unit Award Agreement. * |
| 10.47 | 2009 Form of Performance-Based Restricted Stock Unit Award Agreement. * |
| 12 | Computation of Ratio of Earnings to Combined Fixed Charges and Preferred Dividends. |
| 21 | Subsidiaries of Convergys Corporation. |
| 23 | Consent of Ernst & Young LLP, Independent Registered Public Accounting Firm. |
| 24 | Powers of Attorney. |
| 31.1 | Rule 13(a) - 14(a) Certification by Chief Executive Officer. |
| 31.2 | Rule 13(a) - 14(a) Certification by Chief Financial Officer. |
| 32 | Section 1350 Certifications. |
| * | Management contract or compensatory plan or arrangement. |
Item 15(b) and (c). Exhibits and Financial Statement Schedule
The responses to these portions of Item 15 are submitted as a separate section of this report.
Convergys Corporation 2009 Annual Report 89
Table of Contents
SCHEDULE II — VALUATION AND QUALIFYING ACCOUNTS
(Millions of Dollars)
| COL. A | COL. B | COL. C | COL. D | COL. E | ||||||||||||||
| Additions | ||||||||||||||||||
| Description | Balance at Beginning of Period |
(1) Charged to Expense |
(2) Charged to Other Accounts |
Deductions | Balance at End of Period | |||||||||||||
| Year 2009 | ||||||||||||||||||
| Allowance for Doubtful Accounts | $ | 10.8 | $ | 23.1 | $ | — | $ | 16.3 | [a] | $ | 17.6 | |||||||
| Deferred Tax Asset Valuation Allowance | $ | 93.2 | $ | 6.6 | [b] | $ | (40.2 | )[c] | $ | 8.3 | [d] | $ | 51.3 | |||||
| Year 2008 | ||||||||||||||||||
| Allowance for Doubtful Accounts | $ | 7.6 | $ | 9.9 | $ | — | $ | 6.7 | [a] | $ | 10.8 | |||||||
| Deferred Tax Asset Valuation Allowance | $ | 56.0 | $ | 14.9 | [b] | $ | 29.2 | [e] | $ | 6.9 | [d] | $ | 93.2 | |||||
| Year 2007 | ||||||||||||||||||
| Allowance for Doubtful Accounts | $ | 12.0 | $ | 12.3 | — | $ | 16.7 | [a] | $ | 7.6 | ||||||||
| Deferred Tax Asset Valuation Allowance | $ | 73.6 | $ | 5.4 | [b] | $ | (18.0 | )[f] | $ | 5.0 | [d] | $ | 56.0 | |||||
| [a] | Primarily includes amounts written-off as uncollectible. |
| [b] | Amounts relate to valuation allowances recorded for state and foreign operating loss carryforwards. |
| [c] | Primarily includes adjustments for acquired net operating losses and credits no longer expected to be realized. Also includes foreign currency translation adjustment for foreign deferred tax assets. |
| [d] | Primarily includes the release of foreign valuation allowances related to the utilization of foreign net operating losses in the current year. |
| [e] | Primarily includes adjustments for: acquisition related net operating losses and credits of ($44.7), and valuation allowance release to additional paid-in capital of $15.2. |
| [f] | Includes adjustments to fully valued deferred tax assets and foreign currency translation adjustments on foreign deferred tax assets. |
90 Convergys Corporation 2009 Annual Report
Table of Contents
Pursuant to the requirements of Section 13 or 15(d) of the Securities Exchange Act of 1934, the registrant has duly caused this report to be signed on its behalf by the undersigned, thereunto duly authorized.
| CONVERGYS CORPORATION | ||||
| February 26, 2010 | By | /s/ Earl C. Shanks | ||
| Earl C. Shanks Chief Financial Officer | ||||
Pursuant to the requirements of the Securities Exchange Act of 1934, this report has been signed below by the following persons on behalf of the registrant and in the capacities and on the date indicated.
| Signature | Title | Date | ||
| /s/ JEFFREY H. FOX Jeffrey H. Fox |
Principal Executive Officer; Chief Executive Officer and Director | February 26, 2010 | ||
| /s/ EARL C. SHANKS Earl C. Shanks |
Principal Financial Officer; Chief Financial Officer | February 26, 2010 | ||
| /s/ ANDRE S. VALENTINE Andre S. Valentine |
Principal Accounting Officer; Senior Vice President, Controller | February 26, 2010 | ||
| ZOË BAIRD* Zoë Baird |
Director | |||
| JOHN F. BARRETT* John F. Barrett |
Director | |||
| WILLARD W. BRITTAIN JR.* Willard W. Brittain Jr. |
Director | |||
| RICHARD R. DEVENUTI* Richard R. Devenuti |
Director | |||
| DAVID B. DILLON* David B. Dillon |
Director | |||
| JOSEPH E. GIBBS* Joseph E. Gibbs |
Director | |||
| THOMAS L. MONAHAN III* Thomas L. Monahan III |
Director | |||
| RONALD L. NELSON* Ronald L. Nelson |
Director | |||
| PHILIP A. ODEEN* Philip A. Odeen |
Director | |||
| BARRY ROSENSTEIN* Barry Rosenstein |
Director | |||
| RICHARD F. WALLMAN* Richard F. Wallman |
Director | |||
| *By: /s/ Earl C. Shanks Earl C. Shanks as attorney-in-fact |
February 26, 2010 | |||
Convergys Corporation 2009 Annual Report 91