UNITED STATES SECURITIES AND EXCHANGE COMMISSION
Washington, D.C. 20549
Form 10-K
(Mark One)
| |
|
|
| þ |
|
ANNUAL REPORT PURSUANT TO SECTION 13 OR 15(d) OF THE SECURITIES EXCHANGE ACT OF 1934 |
For the Fiscal Year Ended December 31, 2009
or
| |
|
|
| o |
|
TRANSITION REPORT PURSUANT TO SECTION 13 OR 15(d) OF THE SECURITIES EXCHANGE ACT OF 1934 |
Commission File Number: 001-32407
AMERICAN REPROGRAPHICS COMPANY
(Exact name of Registrant as specified in its Charter)
| |
|
|
Delaware
(State or other jurisdiction of
incorporation or organization)
|
|
20-1700361
(I.R.S. Employer
Identification No.) |
1981 N. Broadway, Suite 385
Walnut Creek, California 94596
(925) 949-5100
(Address, including zip code, and telephone number,
including area code, of Registrant’s principal executive offices)
Securities registered pursuant to Section 12(b) of the Act:
| |
|
|
| Title of Each Class
|
|
Name of Each Exchange on Which Registered |
|
|
|
|
| Common Stock, par value $0.001 per share
|
|
New York Stock Exchange |
Securities registered pursuant to Section 12(g) of the Act:
NONE
Indicate by check mark if the registrant is a well-known seasoned issuer, as defined in
Rule 405 of the Securities Act. Yes o No þ
Indicate by check mark if the registrant is not required to file reports pursuant to
Section 13 or Section 15(d) of the Act. Yes o No þ
Indicate by check mark whether the registrant (1) has filed all reports required to be
filed by Section 13 or 15(d) of the Securities Exchange Act of 1934 during the preceding 12
months (or for such shorter period that the registrant was required to file such reports), and
(2) has been subject to such filing requirements for the past 90 days. Yes þ
No o
Indicate by check mark whether the registrant has submitted electronically and posted on
its corporate Web site, if any, every Interactive Data File required to be submitted and posted
pursuant to Rule 405 of Regulation S-T (§232.405 of this chapter) during the preceding 12
months (or for such shorter period that the registrant was required to submit and post such
files). Yes o No o
Indicate by check mark if disclosure of delinquent filers pursuant to Item 405 of
Regulation S-K is not contained herein, and will not be contained, to the best of registrant’s
knowledge, in definitive proxy or information statements incorporated by reference in Part III
of this Form 10-K or any amendment to this Form 10-K. o
Indicate by check mark whether the registrant is a large accelerated filer, an accelerated
filer, a non-accelerated filer, or a smaller reporting company. See the definitions of “large
accelerated filer,” “accelerated filer” and “smaller reporting company” in Rule 12b-2 of the
Exchange Act. (Check one):
| |
|
|
|
|
|
|
| Large accelerated filer o
|
|
Accelerated filer þ
|
|
Non-accelerated filer o
|
|
Smaller reporting company o |
|
|
|
|
(Do not check if a smaller reporting company) |
|
Indicate by check mark whether the registrant is a shell company (as defined in Rule 12b-2
of the Exchange Act). Yes o No þ
Based on the closing price of $8.32 of the registrant’s Common Stock on the New York Stock
Exchange on June 30, 2009 (the last business day of the registrant’s most recently completed
second fiscal quarter), the aggregate market value of the voting common equity held by
non-affiliates of the registrant on that date was approximately $303,848,080.
As of February 23, 2010, there were 45,664,999 shares of the Registrant’s common stock
outstanding.
DOCUMENTS INCORPORATED BY REFERENCE
Portions of the Registrant’s Proxy Statement for its 2010 Annual Meeting of Stockholders to be
held on April 29, 2010 are incorporated by reference in the Annual Report on Form 10-K in
response to Part III, Items 10, 11, 12, 13 and 14.
AMERICAN REPROGRAPHICS COMPANY
ANNUAL REPORT ON FORM 10-K
for the fiscal year ended December 31, 2009
Table of Contents
2
AMERICAN REPROGRAPHICS COMPANY
2009 ANNUAL REPORT ON FORM 10-K
In this Annual Report on Form 10-K, “American Reprographics Company,” “ARC,” “the Company,”
“we,” “us,” and “our” refer to American Reprographics Company, a Delaware corporation, and its
consolidated subsidiaries, unless the context otherwise dictates.
FORWARD-LOOKING STATEMENTS
This Annual Report on Form 10-K contains forward-looking statements within the meaning of
Section 27A of the Securities Act of 1933, as amended, and Section 21E of the Securities
Exchange Act of 1934, as amended. When used in this Annual Report on Form 10-K, the words
“believe,” “expect,” “anticipate,” “estimate,” “intend,” “plan,” “targets,” “likely,” “will,”
“would,” “could,” and variations of such words and similar expressions as they relate to our
management or to the Company are intended to identify forward-looking statements. These
forward-looking statements involve risks and uncertainties that could cause actual results to
differ materially from those contemplated herein. We have described in Part I, Item 1A-“Risk
Factors” a number of factors that could cause our actual results to differ from our projections
or estimates. These factors and other risk factors described in this report are not necessarily
all of the important factors that could cause actual results to differ materially from those
expressed in any of our forward-looking statements. Other unknown or unpredictable factors also
could harm our results. Consequently, there can be no assurance that the actual results or
developments anticipated by us will be realized or, even if substantially realized, that they
will have the expected consequences to, or effects on, us. Given these uncertainties, you are
cautioned not to place undue reliance on such forward-looking statements.
Except where otherwise indicated, the statements made in this Annual Report on Form 10-K
are made as of the date we filed this report with the Securities and Exchange Commission and
should not be relied upon as of any subsequent date. All future written and verbal
forward-looking statements attributable to us or any person acting on our behalf are expressly
qualified in their entirety by the cautionary statements contained or referred to in this
section. We undertake no obligation, and specifically disclaim any obligation, to publicly
update or revise any forward-looking statements, whether as a result of new information, future
events or otherwise. You should, however, consult further disclosures we make in future filings
of our Annual Reports on Form 10-K, Quarterly Reports on Form 10-Q, and Current Reports on Form
8-K, and any amendments thereto, as well as our proxy statements.
TRADEMARKS AND TRADE NAMES
We own or have rights to a number of trademarks, service marks, and trade names that we use
in conjunction with the operation of our business, including the name and design mark “ARC
American Reprographics Company ®,” “PlanWell ®,”
“PlanWell PDS ®,” “PlanWell Enterprise SM,” and various
design marks associated therewith. In addition, we own or have rights to various trademarks,
service marks, and trade names that we use regionally in conjunction with the operation of our
segments. This report also includes trademarks, service marks and trade names of other
companies.
3
PART I
Our Company
We are the leading reprographics company in the United States. Reprographics companies
generally provide business-to-business document-related services that typically include document
management, document distribution and logistics, and print-on-demand. Unlike most reprographics
companies, however, we develop technology applications to support and enhance our services.
Specifically, our technology increases the productivity of document managers and other
reprographers, streamlines document workflows, and makes it easier for other software to
interact with our services and hosted data. For many of our customers, we offer our services
on-site in our customers’ offices. We typically refer to this service line as “facilities
management” or “FM’s.”
Our primary market is the architectural, engineering and construction industry, or AEC
industry. We also provide services and technology to companies in non-AEC industries, such as
aerospace, technology, financial services, retail, entertainment, and food and hospitality.
We conduct our business through hundreds of locally-branded reprographics service centers,
and in thousands of our customers’ offices. We also sell reprographics equipment and supplies to
complement our service offerings.
Our services are critical to our customers because they shorten their document processing
and distribution time, improve the quality of their document management tasks, and provide a
secure, controlled environment in which to manage, distribute and produce their documents.
In support of our strategy to create technology standards in the reprographics industry, we
license several of our reprographics technology products, including our flagship internet-based
application, PlanWell, to independent reprographers.
As of December 31, 2009, we operated 272 reprographics service centers, including 259
service centers in 208 cities in 38 states throughout the United States and the District of
Columbia, seven reprographics service centers in Canada, one in United Kingdom and a business
venture company in China with five locations. Our reprographics service centers are located in
close proximity to the majority of our customers and we offer pickup and delivery services
within a 15 to 30 mile radius of our main locations. These service centers are digitally
connected as a cohesive network, allowing us to provide our services both locally and
nationally. We service approximately 138,000 active customers and employ approximately 3,500
people, including a sales and customer service staff of approximately 550 employees. In terms of
revenue, number of service facilities and number of customers, we believe we are the largest
company in our industry, operating in at least ten times as many cities and with more than nine
times the number of service facilities as our next largest competitor.
We identify operating segments based on the various business activities that earn revenue
and incur expense, whose operating results are reviewed by the chief operating decision maker.
Based on the fact that operating segments have similar products and services, classes of
customers, production processes and performance objectives, the Company is deemed to operate as
a single reportable segment. See Note 2 “Summary of Significant Accounting Policies” for further
information.
While we began operations in California and currently derive approximately 33% of our net
sales from operations in that state, our company has grown and our market share has increased
through more than 140 acquisitions of local reprographics and related companies with
well-recognized local brand names and, in most cases, more than 25 years of operating history.
Our preferred practice is to maintain the senior management of companies we acquire.
Our main office is located at 1981 N. Broadway, Suite 385, Walnut Creek, California, 94596,
and our telephone number at that location is (925) 949-5100.
Available Information
We file annual, quarterly and current reports, proxy statements, and other information with
the Securities and Exchange Commission (the “SEC”). You may read and copy any document we file
with the SEC at the SEC’s public reference room at 100 F Street, N.E, Washington, DC 20549.
Please call the SEC at 1-800-SEC-0330 for information on the public reference room. The SEC
maintains an internet site that contains annual, quarterly and current reports, proxy statements
and other information that issuers file electronically with the SEC. The SEC’s internet site
is www.sec.gov.
4
Our internet address is www.e-arc.com. You can access our Investor Relations webpage
through our website, www.e-arc.com, by clicking on the “Investor Relations” link at the
top of the page. We make available free of charge, through our Investor Relations webpage, our
proxy statements, Annual Reports on Form 10-K, Quarterly Reports on Form 10-Q, Current Reports
on Form 8-K, and any amendments to those reports filed or furnished pursuant to the Securities
Exchange Act of 1934, as amended (the “Exchange Act”), as soon as reasonably practicable after
such material is electronically filed with, or furnished to, the SEC. We also make available,
through our Investor Relations webpage, statements of beneficial ownership of our equity
securities filed by our directors, officers, 10% or greater stockholders and others under
Section 16 of the Exchange Act. The reference to our website does not constitute incorporation by reference of the information
contained in the website and should not be considered part of this document. You can request a
printed copy of these documents, excluding exhibits, at no cost, by contacting our Investor
Relations department by telephone at 925-949-5100 or in writing to 1981 North Broadway, Suite
385, Walnut Creek, California 94596, Attention: David Stickney, Vice President of Corporate
Communications.
Corporate Background and Reorganization
Our predecessor, Ford Graphics, a sole proprietorship, was founded in Los Angeles,
California in 1960. In 1967, that sole proprietorship was dissolved and a new corporate
structure was established under the name Micro Device, Inc., which continued to provide
reprographics services under the name Ford Graphics. In 1989, certain current and former members
of our senior management purchased Micro Device, Inc., and in November 1997 our company was
recapitalized as a California limited liability company, with management retaining a 50%
ownership position and the remainder owned by outside investors.
In February 2005, we reorganized from American Reprographics Holdings, L.L.C., a California
limited liability company, or Holdings, into a Delaware corporation, American Reprographics
Company. In the reorganization, the members of Holdings exchanged their common units and options
to purchase common units for shares of our common stock and options to purchase shares of our
common stock. As part of our reorganization, all outstanding warrants to purchase common units
of Holdings were exchanged for shares of our common stock. We conduct our operations through our
wholly-owned operating subsidiary, American Reprographics Company, L.L.C., a California limited
liability company, or Opco, and its subsidiaries.
Acquisitions
In addition to growing the business organically, we have pursued acquisitions to expand and
complement our existing service offerings and to expand our geographic locations where we
believe we could be a market leader. Since 1997, we have acquired more than 140 companies. Our
recent acquisitions include two reprographics companies and one Chinese reprographics company
for an aggregate purchase price of $2.9 million in 2009, and 13 reprographics companies acquired
in 2008 for an aggregate purchase price of $31.9 million.
On August 1, 2008, we commenced operations of UNIS Document Solutions Co., Ltd. (“UDS”),
our business venture with Unisplendour Corporation Limited (“Unisplendour” or “UNIS”). The
purpose of UDS is to pair the digital document management solutions of our Company with the
brand recognition and Chinese distribution channel of Unisplendour to deliver digital
reprographics services to China’s growing construction industry. Under the terms of the
agreement, our Company and Unisplendour have an economic ownership interest of 65 percent and 35
percent, respectively.
While our interest in acquisitions remains high, we have abstained from purchasing
reprographics companies during the current economic recession until business valuations have
stabilized. Our intent is to resume our acquisition program once an economic improvement in our
industry is evident.
Industry Overview
According to the International Reprographics Association, or IRgA, which is the only
third-party organization with research statistics on the reprographics industry in the United
States, the reprographics industry in the United States is approximately $4.5 billion in size.
The IRgA indicates that the reprographics industry is highly fragmented, consisting of
approximately 3,000 firms with average annual sales of approximately $1.5 million and 20 to 25
employees. Since construction documents are the primary medium of communication for the AEC
industry, demand for reprographics services in the AEC market is closely tied to the level of
activity in the construction industry which, in turn, is driven by macroeconomic trends such as
gross domestic product, or GDP, growth, interest rates, job creation, office vacancy rates, and
tax revenues. According to FMI Corporation, or FMI, a consulting firm to the construction
industry, construction industry spending “put in place” in the United States for 2009 was
estimated at $935.0 billion, with expenditures divided between residential construction at 27.6%
and commercial and public, or non-residential, construction at 72.4%. The $4.5 billion
reprographics industry is approximately 0.5% of the $935.0 billion construction industry in the
United States.
Reprographics customers in the AEC market are comprised of many companies in a wide variety
of trades and service categories. One construction project may involve hundreds of construction
services providers, each of whom is typically invoiced by the reprographer for their use of
documents and document management services. While these individual providers are responsible for
paying their reprographer for services rendered, reprographics invoices are typically passed
through to their customers for reimbursement. It is rare when reprographics companies bill a
project or project owner directly. It is this common industry practice that contributes to
market fragmentation, and makes it difficult to segment service revenues based on type of
construction, project type and project sector (public or private).
5
Market opportunities for business-to-business document management services such as ours
continue to expand into non-AEC industries. For example, non-AEC customers are increasingly
using large and small format color imaging for point-of-purchase displays, digital publishing,
presentation materials, educational materials and marketing materials as these services have
become more efficient and available on a short-run, on-demand basis through digital technology.
As a result, we believe that our addressable market is substantially larger than the core AEC
reprographics market. We believe that the growth of non-AEC industries is generally tied to growth in the United States GDP, which is estimated to have
increased 5.7% in 2009’s fourth quarter versus the third, on an annualized basis
Our Competitive Strengths
We believe that our competitive strengths include the following:
| |
• |
|
Leading Market Position in Fragmented Industry. Our size
and national footprint provide us with significant
purchasing power, economies of scale, the ability to invest
in industry-leading technologies, and the resources to
service large, national customers. |
| |
| |
• |
|
Leader in Technology and Innovation. We believe several of
our technology products are well positioned to become
industry standards for managing and procuring reprographics
services within the AEC industry, as well as managing
reprographics businesses themselves. We have developed
other proprietary software applications that complement
these applications, which enabled us to improve the
efficiency of our services, add services, and increase our
revenue. |
| |
| |
• |
|
Extensive National Footprint with Regional Expertise. Our
national network of service centers maintains local
customer relationships while benefiting from centralized
corporate functions and national scale. Our service
facilities are organized as hub and satellite structures
within individual markets, allowing us to balance
production capacity and minimize capital expenditures
through technology-sharing and the consolidation of
administrative and accounting functions among our service
centers within each market or region. In addition, we serve
our national and regional customers under a single contract
through our Global Services (formerly Premier Accounts)
program, while offering centralized access to project
specific services, billing, and tracking information. |
| |
| |
• |
|
Flexible Operating Model. Information from our local
businesses heavily influence our decision making for
marketing, pricing, and selling practices. It allows us to
remain responsive to our customers while benefiting from
the cost structure advantages of our centralized
administrative functions. Our flexible operating model also
allows us to capitalize on any business environment,
quickly scaling up or down as needed within a given
marketplace. |
| |
| |
• |
|
Consistent, Strong Cash Flow. Through management of our
inventory and receivables and our low capital expenditure
requirements, we have consistently generated strong cash
flows from operations in a variety of industry and economic
conditions. |
| |
| |
• |
|
Low Cost Operator. We believe we are one of the lowest cost
operators in the reprographics industry. We have achieved
this status by minimizing branch level expenses and
capitalizing on our significant scale for purchasing
efficiencies. |
| |
| |
• |
|
Experienced Management Team and Highly Trained Workforce.
Members of our executive and divisional senior management
teams have an average of more than 20 years of industry
experience. It is also our preferred practice to maintain
the senior management of the companies we acquire. |
Our Services
Reprographics services typically encompass business-to-business services including document
management, document distribution and logistics, and print-on-demand. We also develop technology
applications to support and enhance these services that improve control and efficiency in
document workflows, and increase productivity.
Document Management. We store, organize, print and track AEC and non-AEC project documents
using a variety of digital tools and our industry expertise. The documents we manage for the
construction industry are typically larger than 11"×17”, requiring specialized production
equipment, and the documents are iterative in nature; frequently 10 or more versions of a single
document must be tracked and managed throughout the course of a project.
6
Document Distribution and Logistics. We provide fully-integrated document distribution and
logistics, which consist of tracking document users, packaging prints, addressing and
coordinating services for shipment (either in hard copy or electronic form), as well as local
pick-up and delivery of documents to multiple locations within tight time constraints.
Print-on-demand. We produce small and large-format documents in black and white or color
using digital scanning and printing devices. We can reproduce documents when and where they are
needed by balancing production capacity between the high-volume equipment in our network of
reprographics service centers, sending production jobs from one location to another, as well as
producing work on equipment placed in our customers’ facilities.
We also provide any combination of the above services supplied on-site at our customers’
locations. These services are typically referred to as facilities management, or FMs.
These broad categories of services are provided to our AEC industry customers, as well as
to our customers in non-AEC industries that have similar document management and production
requirements. Our AEC customers work primarily with high volumes of large-format construction
plans and small-format specification documents that are technical, complex, constantly changing
and frequently confidential. Our non-AEC customers generally require services that apply to
black and white and color small format documents, promotional documents of all sizes, and the
digital distribution of document files to multiple locations for a variety of print-on-demand
needs including short-run digital publishing.
These services include:
| |
• |
|
Offering PlanWell Enterprise (“PlanWell”), our proprietary,
internet-based planroom software application launched in
June 2000, and our suite of other reprographics technology
products that enable online purchase and fulfillment of
document management services. |
| |
| |
• |
|
Production services, including print-on-demand, document
assembly, document finishing, mounting, laminating,
binding, and kitting. |
| |
| |
• |
|
Document distribution and logistics, including the physical
pick-up, delivery, and shipping of time-sensitive, critical
documents. Documents can be digitally transferred from one
service facility to another to balance production capacity
or take advantage of a “distribute and print” production
model. |
| |
| |
• |
|
Highly customized large and small format reprographics in
color and black and white. This includes digital
reproduction of posters, tradeshow displays, plans,
banners, signage, and maps. |
| |
| |
• |
|
Facilities management services, including recurring on-site
document management services and staffing at our customers’
locations. |
| |
| |
• |
|
Sales of reprographics equipment and supplies and licensing
of software to other reprographics companies and end-users
in the AEC industry. |
We also design and develop other document management and reprographics software
products, in addition to PlanWell, that supports ordering, tracking, job estimating, and other
customer-specific accounting information for a variety of projects and services. These
proprietary applications include:
| |
• |
|
Electronic Work Order (“EWO”), which offers our customers
access to the services of all of our service centers
through the internet. |
| |
| |
• |
|
MetaPrint Abacus, which provides a suite of software
modules for reprographers and their customers to track
documents produced from equipment installed as a part of a
facilities management program. |
| |
| |
• |
|
BidCaster Invitation-to-Bid, a data management internet
application inside PlanWell that issues customizable
“invitations to bid” from a customer’s desktop using email
and a hosted fax server. |
| |
| |
• |
|
MetaPrint Print Automation and Device Manager, a universal
print driver that facilitates the printing of documents
with output devices manufactured by multiple vendors, and
allows the reprographer to print multiple documents in
various formats as a single print submission. |
7
| |
• |
|
OneView Document Access and Customer Administration System,
an internet-based application that leverages the security
attributes of PlanWell to provide a single point of access
to all of a customer’s project documents inside PlanWell
planrooms, regardless of which of our local production
facilities stores the relevant documents. |
| |
| |
• |
|
Sub-Hub, an internet-based application that notifies
subscribers of upcoming construction jobs in their markets
and allows them to view plans online and order paper copies
from a reprographer. |
| |
| |
• |
|
PlanWell Databridge, which allows construction project
management software users to share common data between
applications, synchronize project information, bid packages
and contacts, eliminate redundant data entry, and easily
start projects in project management applications by
leveraging indexed data in PlanWell Enterprise. |
| |
| |
• |
|
ishipdocs, a web-based software application that allows
users to upload documents to a local reprographics business
for local production and printing. |
To further support and promote our major categories of services, we also:
| |
• |
|
License our suite of reprographics technology products,
including our flagship online planroom, PlanWell, to
independent reprographers. |
| |
| |
• |
|
Operate Profit and Education in Reprographics (“PEiR”)
Group, a trade organization wholly-owned by us, through
which we charge membership fees and provide purchasing,
technology, and educational benefits to other
reprographers. PEiR members are required to license
PlanWell and may purchase equipment and supplies at a lower
cost than they could obtain independently. We also
distribute our educational programs to PEiR members to help
establish and promote best practices within the
reprographics industry. |
Customers
Our business is not dependent on any single customer or few customers, the loss of any one
or more of whom would have a material adverse effect on our business. Our customers are both
local and national companies, with no single customer accounting for more than 2.5% of our net
sales in 2009.
We have a geographic concentration risk as sales in California, as a percentage of total
sales, were approximately 33%, 36% and 42% for the years ended December 31, 2009, 2008 and 2007,
respectively.
Operations
Geographic Presence. We operate 272 reprographics service centers, including 259 service
centers in 208 cities in 38 states throughout the United States and in the District of Columbia,
seven service centers in Canada, one in the United Kingdom and we also have a business venture
in China with five locations. Our reprographics service centers are located in close proximity
to the majority of our customers and offer pick-up and delivery services within a 15 to 30 mile
radius. In our three prior fiscal years, sales outside the United States have been small but
growing, amounting to $28.2 million, $24.2 million and $13.2 million for the years ending
December 31, 2009, 2008, and 2007, respectively.
Hub and Satellite Configuration. We organize our business into operating segments that
typically consist of a cluster configuration of at least one large service facility, or hub, and
several smaller facilities, or satellites, that are digitally connected as a cohesive network,
allowing us to provide all of our services both locally and nationwide. Our hub and satellite
configuration enables us to shorten our customers’ document processing and distribution time, as
well as achieve higher utilization of output devices by coordinating the distribution of work
orders digitally among our service centers.
Management Systems and Controls. We operate with a largely centralized administrative
function and business decisions are heavily influenced by local and regional business
information and business trends. Acquired companies typically retain their local business
identities, managers, sales force, and marketing efforts in order to maintain strong local
customer relationships. Our local management maintains autonomy over the day-to-day operations
of their business units, including profitability, customer billing, receivables collection, and
service mix decisions.
Our senior management closely monitors and reviews each of our segments through daily
reports that contain operating and financial information such as sales, inventory levels,
purchasing commitments, collections, and receivables. In addition, our operating segments submit
monthly reports to senior management that track each segments’ financial and operating
performance in comparison to historical performance.
8
Suppliers and Vendors
We purchase raw materials, consisting primarily of paper, toner, and other consumables. Our
reprographics equipment, which includes imaging and printing equipment, is typically leased for
use in our service facilities and facilities management sites. We use a two-tiered approach to
purchasing in order to maximize the economies associated with our size, while maintaining the
local efficiencies and time sensitivity required to meet customer demands. We continually
monitor market conditions and product developments to take advantage of our buying power.
Our primary vendors of equipment, maintenance services, and reprographics supplies include
Oce N.V., Azerty, and Xpedx, a division of International Paper Company. We have long-standing
relationships with all of our suppliers and we believe we receive favorable prices as compared
to our competition, due to the large quantities we purchase and strong relationships with our
vendors. Significant market fluctuations in our raw material costs have historically been
limited to paper prices and we have typically maintained strong gross margins as the result of
our ability to pass increased material costs through to our customers.
Sales and Marketing
Divisional Sales Force. We market our products and services throughout the United States
through localized sales forces and marketing efforts at the divisional level. We had
approximately 550 sales and customer service representatives as of December 31, 2009. Each sales
force generally consists of a sales manager and a staff of sales and customer service
representatives that target various customer segments. Sales teams serve both the central hub
service facility and satellite facilities, or if market demographics require, operate on behalf
of a single service facility.
Global Services (formerly “Premier Accounts”). To further enhance our market share and
service portfolio on a national level, we offer, on a consolidated basis, the services of all of
ARC operating locations to large regional and national customers. We created Global Services to
take advantage of growing globalization within the AEC market, and to establish ourselves at the
corporate level as the leading national reprographer with extensive geographic and service
capabilities. This consolidated service offering allows us to attract large AEC and non-AEC companies with document management,
distribution and logistics, and print-on-demand needs that span wide geographical or
organizational boundaries. As of December 31, 2009, we maintained 36 Global Services accounts.
PEiR Group. We established the PEiR Group in July 2003, a separate operating segment of our
corporate structure that is a membership-based organization for the reprographics industry.
Comprised of independent reprographers and reprographics vendors, PEiR members are required to
license PlanWell technology, facilitating the promotion of our applications as industry
standards. We also provide general purchasing discounts to PEiR members through our preferred
vendors. This provides other reprographics companies the opportunity to purchase equipment and
supplies at a lower cost than they could obtain independently, while increasing our influence
and purchasing power with our vendors. Through PEiR, we also present educational programs to
members to establish and promote best practices within the industry. As of December 31, 2009,
the PEiR Group had 154 domestic and international members.
Competition
According to the IRgA, most firms in the United States reprographics services industry are
small, privately-held entrepreneurial businesses. The larger reprographers in the United States,
besides ourselves, include Service Point USA, a subsidiary of Service Point Solutions, S.A.,
Thomas Reprographics, Inc., ABC Imaging, LLC, and National Reprographics Inc. While we have no
nationwide competitors, we do compete at the local level with a number of privately-held
reprographics companies, commercial printers, digital imaging firms, and to a limited degree,
retail copy shops. Competition is primarily based on customer service, technological leadership,
product performance and price. See Item 1A — “Risk Factors — Competition in our industry and
innovation by our competitors may hinder our ability to execute our business strategy and
maintain our profitability.”
Research and Development
We believe that to compete effectively we must address the growing adoption of technology
by our customers, and thus conduct research and development toward enhancing our existing
software and web-based applications, as well as create new ones. As of December 31, 2009, we
employed 43 engineers and technical specialists with expertise in software, internet-based
applications, database management, internet security and quality assurance. In total, research
and development amounted to $4.0 million, $5.1 million and $5.5 million during the fiscal years
ended December 31, 2009, 2008 and 2007, respectively.
9
Proprietary Rights
Our success depends on our proprietary information and technology. We rely on a combination
of copyright, trademark and trade secret laws, license agreements, nondisclosure and non-compete
agreements, reseller agreements, customer contracts, and technical measures to establish and
protect our rights in our proprietary technology. Our PlanWell license agreements grant our
customers a nonexclusive, nontransferable, limited license to use our products and receive our
services and contain terms and conditions prohibiting the unauthorized reproduction or transfer
of our proprietary technologies. We retain all title and rights of ownership in our software
products. In addition, we enter into agreements with some of our employees, third-party
consultants and contractors that prohibit the disclosure or use of our confidential information
and require the assignment to us of any new ideas, developments, discoveries or inventions
related to our business. We also require other third parties to enter into nondisclosure
agreements that limit use of, access to, and distribution of our proprietary information. We
also rely on a variety of technologies that are licensed from third parties to perform key
functions.
We have registered our “American Reprographics Company” combined name and design as a
trademark with the United States Patent and Trademark Office (USPTO), and we have registered
“PlanWell” and “PlanWell PDS” as trademarks with the USPTO and in Canada, Australia and the
European Union. We have also registered “Sub-Hub” as a service mark with the USPTO, in the
European Union, United Kingdom, Benelux and Mexico. Additionally, we have registered “MetaPrint”
as a trademark with the USPTO and we have applied for registration of “MetaPrint” as a trademark
in the European Union.
We do not own any other registered trademarks or service marks, or any patents, that are
material to our business.
For a discussion of the risks associated with our proprietary rights, see Item 1A — “Risk
Factors — Our failure to adequately protect the proprietary aspects of our technology,
including PlanWell, may cause us to lose market share.”
Information Technology
We operate two technology centers in Silicon Valley to support our reprographics services
and software development. We also have a facility in Kolkata, India which gives us a powerful
and cost effective resource to support our research and development. Our technology centers also
serve as design and development facilities for our software applications, and house our North
American database administration team and networking engineers.
From these technology centers, our technical staff is able to remotely manage, control and
troubleshoot the primary databases and connectivity of each of our operating segments. This
allows us to avoid the costs and expenses of employing costly database administrators and network engineers in each of our service facilities.
All of our reprographics service centers are connected via a high performance, dedicated
wide area network, with additional capacity and connectivity through a virtual private network
to handle customer data transmissions and e-commerce transactions. Our technology centers use
both commonly available software and custom applications running in a clustered computing
environment and employ industry-leading technologies for redundancy, backup, and security.
Employees
As of December 31, 2009, we had approximately 3,500 employees, 16 of whom are covered by
two collective bargaining agreements. The collective bargaining agreement with our subsidiary,
Ridgway’s, LLC, covers nine employees and the collective bargaining agreement with our
subsidiary, BPI Repro, LLC, covers seven employees. We have not experienced a work stoppage
during the past five years and believe that our relationships with our employees and collective
bargaining units are good.
Executive Officers of the Registrant
The following sets forth certain information regarding all of our executive officers as of
February 26, 2010:
| |
|
|
|
|
|
|
| Name |
|
Age |
|
Position |
Kumarakulasingam Suriyakumar
|
|
|
56 |
|
|
Chairman, President and Chief Executive
Officer |
Jonathan R. Mather
|
|
|
59 |
|
|
Chief Financial Officer and Secretary |
Rahul K. Roy
|
|
|
50 |
|
|
Chief Technology Officer |
Dilantha Wijesuriya
|
|
|
47 |
|
|
Senior Vice President-National Operations |
Kumarakulasingam (“Suri”) Suriyakumar has served as our President and Chief Executive
Officer since June 1, 2007, and he served as the Company’s President and Chief Operating Officer
from 1991 until his appointment as Chief Executive Officer. On July 24, 2008, Mr. Suriyakumar
was appointed Chairman of our Board of Directors. Mr. Suriyakumar served as an advisor of
Holdings from March 1998 until his appointment as a director of American Reprographics Company
in October 2004. Mr. Suriyakumar joined Micro Device, Inc. (our predecessor company) in 1989. He
became the Vice President of Micro Device, Inc. in 1990. Prior to joining the Company, Mr.
Suriyakumar was employed with Aitken Spence & Co. LTD, a highly diversified conglomerate and one
of the five largest corporations in Sri Lanka. Mr. Suriyakumar is an active member of the
International Reprographics Association (IRgA).
10
Jonathan R. Mather joined American Reprographics Company as its Chief Financial Officer in
December 2006. From 2001 to 2006, Mr. Mather was employed at NETGEAR, a manufacturer of computer
networking products, as its Executive Vice President and Chief Financial Officer. Before
NETGEAR, from July 1995 to March 2001, Mr. Mather worked at Applause Inc., a consumer products
company, where he served as President and Chief Executive Officer from 1998 to 2001, as Chief
Financial Officer and Chief Operating Officer from 1997 to 1998 and as Chief Financial Officer
from 1995 to 1997. From 1985 to 1995, Mr. Mather was employed with Home Fashions Inc., a
consumer products company, where he served as Chief Financial Officer from 1992 to 1995, and as
Vice President, Finance, of an operating segment, Louverdrape, from 1988 to 1992. Prior to that,
he spent more than two years at the semiconductor division of Harris Corporation, a
communications equipment company, where he served as the Finance Manager of the offshore
manufacturing division. He also worked in public accounting for four years with Coopers &
Lybrand (now part of PricewaterhouseCoopers LLP) and for two years with Ernst & Young. Mr.
Mather has an M.B.A. from Cornell University. He is a Certified Management Accountant (C.M.A.)
and a Fellow Chartered Accountant (F.C.A.).
Rahul K. Roy joined Holdings as its Chief Technology Officer in September 2000. Prior to
joining the Company, Mr. Roy was the founder, President and Chief Executive Officer of
MirrorPlus Technologies, Inc., which developed software for the reprographics industry, from
August 1993 until it was acquired by the Company in 1999. Mr. Roy also served as the Chief
Operating Officer of InPrint, a provider of printing, software, duplication, packaging,
assembly, and distribution services to technology companies, from 1993 until it was acquired by
the Company in 1999.
Dilantha Wijesuriya was appointed as the Company’s Senior Vice President — National
Operations effective August 7, 2008. Mr. Wijesuriya joined Ford Graphics, a segment of the
Company, in January of 1991. He subsequently became president of that segment in 2001, and
became a Company regional operations head in 2004, which position he retained until his
appointment as the Company’s Senior Vice President — National Operations. Prior to his
employment with the Company, Mr. Wijesuriya was a divisional manager with Aitken Spence & Co.
LTD, a highly diversified conglomerate and one of the five largest corporations in Sri Lanka.
Our business faces significant risks. The following risk factors could adversely affect our
results of operations and financial condition and the price of our common stock. We may
encounter risks in addition to those described below. Additional risks and uncertainties not
currently known to us or that we currently deem immaterial may also impair or adversely affect
our results of operations and financial condition.
Adverse domestic and global economic conditions and disruption of financial markets could have a
material adverse impact on our business and results of operations.
During the last year, domestic and international financial markets have experienced extreme
disruption, including, among other things, extreme volatility in stock prices (which was more
pronounced through the first quarter of fiscal year 2009) and severely diminished liquidity and
credit availability. These developments and the related severe domestic and international
economic downturn, have continued to adversely impact our business and financial condition in a
number of ways, including effects beyond those that were experienced in previous recessions in
the United States and foreign economies. The current restrictions in financial markets and the
severe economic downturn may adversely affect the ability of our customers and suppliers to
obtain financing for operations and purchases and to perform their obligations under agreements
with us. These restrictions could result in a decrease in, or cancellation of, existing
business, could limit new business, and could negatively impact our ability to collect on our
accounts receivable on a timely basis, if at all. Although there have been recent signs of
certain areas of economic improvement, we are unable to predict the duration and severity of the
current economic recession and disruption in financial markets and their effects on our business
and results of operations. These events are more severe than previous economic recessions and
may, in the aggregate, have a material adverse effect on our results of operations and financial
condition.
The residential and non-residential architectural, engineering and construction (AEC) industry
is in the midst of a severe downturn. A continuing decline in the residential AEC industry, and
a downturn in the non-residential AEC industry, could adversely affect our future revenue and
profitability.
We believe that the residential and non-residential AEC markets together accounted for
approximately 78% of our net sales for the year ended December 31, 2009, of which we believe the
non-residential AEC industry accounted for approximately 92% of our net sales to the AEC market
and the residential AEC industry accounted for approximately 8% of our net sales to the AEC
market. Our historical operating results reflect the cyclical and variable nature of the AEC
industry. Both the residential and non-residential portions of the AEC industry are in the midst
of a severe downturn. The effects of the current recession in the United States economy and
weakness in global economic conditions have resulted in a downturn in the residential and
non-residential portions of the AEC industry. We believe that the AEC industry generally
experiences downturns several months after a downturn in the general economy and that there may
be a similar delay in the recovery in the AEC industry following a recovery in the general
economy. A prolonged downturn in the AEC industry would diminish demand for our products and
services, and would therefore negatively impact our revenues and have a material adverse impact
on our business, operating results and financial condition.
11
Since we derive a majority of our revenues from reprographics products and services
provided to the AEC industry, our operating results are more sensitive to this industry than
other companies that serve more diversified markets. In addition, because approximately 55% of
our overall costs are fixed, changes in economic activity, positive or negative, affect our
results of operations. As a consequence, our results of operations are subject to volatility and
could deteriorate rapidly in an environment of declining revenues. Failure to maintain adequate
cash reserves and to effectively manage our costs could adversely affect our ability to offset
our fixed costs and may have a material adverse effect on our results of operations and
financial condition.
Covenants in our credit and guaranty agreement could adversely affect our financial condition.
Although we have adjusted certain financial ratio covenants in our amended credit agreement, we
may not be able to comply with the adjusted covenants in the future.
Our credit and guaranty agreement contains customary restrictions and covenants, including,
without limitation, interest coverage ratios, fixed charge coverage ratios, leverage coverage
ratios and limitations on maximum capital expenditures, which we must maintain. On October 5,
2009, we entered into an amendment to our credit and guaranty agreement (the “Amended Credit
Agreement”). Pursuant to the Amended Credit Agreement, certain of the financial ratio covenants
in our credit and guaranty agreement were adjusted. Our ability to meet the adjusted financial
covenants under the Amended Credit Agreement may be affected by a number of events, including
events beyond our control, and we may not be able to continue to meet those ratios in the
future. There can be no assurance that we will be able to comply in the future with the
financial ratio covenants, as adjusted pursuant to our Amended Credit Agreement. If we fail to
comply with the financial covenants under our Amended Credit Agreement, we would be in default.
A default, if not cured or waived, may permit acceleration of our indebtedness. In addition, our
lenders could terminate their commitments to make further extensions of credit under our credit
facilities. If our indebtedness is accelerated, we cannot be certain that we will have
sufficient funds to pay the accelerated indebtedness or that we will have the ability to
refinance accelerated indebtedness on terms favorable to us or at all. Any or all of these
events would have a material adverse effect on our business operations and our financial
condition.
Impairment of goodwill may adversely impact future results of operations.
We have intangible assets, including goodwill and other identifiable acquired intangibles
on our balance sheet due to prior acquisitions. The initial identification and valuation of
these intangible assets and the determination of the estimated useful lives at the time of
acquisition involve management judgments and estimates. Based on our annual goodwill impairment
assessment, we recorded a $37.4 million impairment during 2009.
The results of our impairment analysis are as of a particular point in time. If our
assumptions regarding future forecasted revenue or gross margins of our operating segments (or
“reporting units”) are not achieved, we may be required to record additional goodwill impairment
charges in future periods, whether in connection with our next annual impairment testing in the
third quarter of 2010 or prior to that, if any such change constitutes a triggering event prior
to the quarter in which we perform our annual goodwill impairment test. It is not possible at
this time to determine if any such future impairment charge would result or, if it does, whether
such charge would be material.
Competition in our industry and innovation by our competitors may hinder our ability to execute
our business strategy and maintain our profitability.
The markets for our products and services are highly competitive, with competition
primarily at local and regional levels. We compete primarily based on the level and quality of
customer service, technological leadership, product performance and price. Our future success
depends, in part, on our ability to continue to improve our service offerings, and develop and
integrate technological advances. If we are unable to effectively develop and integrate
technological advances into our service offerings and technology products in a timely manner,
our operating results may be adversely affected. Technological innovation by our existing or
future competitors could put us at a competitive disadvantage. In particular, our business could
be adversely affected if any of our competitors develop or acquire superior technology that
competes directly with or offers greater functionality than our proprietary technology,
including our flagship product, PlanWell.
We also face the possibility that competition will continue to increase, particularly if
copy and printing or business services companies choose to expand into the reprographics
services industry. Many of these companies are substantially larger and have significantly
greater financial resources than us, which could place us at a competitive disadvantage. In
addition, we could encounter competition in the future from large, well-capitalized companies
such as equipment dealers, system integrators, and other reprographics associations, that can
produce their own technology and leverage their existing distribution channels. We could also
encounter competition from non-traditional reprographics service providers that offer
reprographics services as a component of the other services that they provide to the AEC
industry, such as vendors to our industry that provide services directly to our customers,
bypassing reprographers. Any such future competition could adversely affect our business and
impair our future revenue and profitability.
12
The reprographics industry has undergone vast changes in recent years and will continue to
evolve. Our failure to anticipate and adapt to future changes in the reprographics industry
could harm our competitive position.
The reprographics industry has undergone vast changes in recent years. The industry’s main
production technology has migrated from analog to digital. This has prompted a number of trends
in the reprographics industry, including a rapid shift toward decentralized production and lower
labor utilization. As digital output devices become smaller, less expensive, easier to use and
interconnected, end users of construction drawings are placing these devices within their
offices and other locations. On-site reprographics equipment allows a customer to print
documents and review hard copies without the delays or interruptions associated with sending
documents out for duplication. Also, as a direct result of advancements in digital technology,
labor demands have decreased. Instead of producing one print job at a time, reprographers now
have the capability to produce multiple sets of documents with a single production employee. By
linking output devices through a single print server, a production employee simply directs
output to the device that is best suited for the job. As a result of these trends, reprographers
have had to modify their operations to decentralize printing and shift costs from labor to
technology.
We expect the reprographics industry to continue to evolve. Our industry is expected to
continue to embrace digital technology, not only in terms of production services, but also in
terms of network technology, digital document storage and management, and information
distribution, all of which will require investment in, and continued development of,
technological innovation. If we fail to keep pace with current changes or fail to anticipate or
adapt to future changes in our industry, our competitive position could be harmed which may have
a material adverse impact on our future profitability.
If we fail to continue to develop and introduce new services and technologies successfully, our
competitive positioning and our ability to grow our business could be harmed.
In order to remain competitive, we must continually invest in new technologies that will
enable us to meet the evolving demands of our customers. We cannot guarantee that we will be
successful in the introduction, marketing and adoption of any of our new services, or that we
will develop and introduce in a timely manner innovative services that satisfy customer needs or
achieve market acceptance. Our failure to develop new services and introduce them successfully
could harm our competitive position and our ability to grow our business, and our revenues and
operating results could suffer.
In addition, as reprographics technologies continue to develop, one or more of our current
service offerings may become obsolete. In particular, digital technologies may significantly
reduce the need for high volume printing. Digital technology makes traditional reprographics
equipment smaller and cheaper, which may cause larger AEC customers to discontinue outsourcing
their reprographics needs. Any such developments could adversely affect our business and impair
future revenue and profitability.
If we are unable to charge for our value-added services to offset potential declines in print
volumes, our long term revenue could decline.
Our customers value the ability to view and order prints over the internet and print to
output devices in their own offices and other locations throughout the country and other
locations in the world. In 2009, our reprographics services excluding digital revenues
represented approximately 61% of our total net sales, and our facilities management services
represented approximately 19% of our total net sales. Both categories of revenue are generally
derived from a charge per square foot of printed material. Future technological advances may
further facilitate and improve our customers’ ability to print in their own offices or at a job
site. As technology continues to improve, this trend toward consuming information on an “as
needed” basis could result in decreasing printing volumes and declining revenues in the longer
term. Failure to offset these potential declines in printing volumes by changing how we charge
for our services and developing additional revenue sources could significantly affect our
business and reduce our long term revenue, resulting in an adverse effect on our results of
operations and financial condition.
We derive a significant percentage of net sales from within the State of California and our
business could be disproportionately harmed by an economic downturn or natural disaster
affecting California.
We derived approximately 33% of our net sales in 2009 from our operations in California. As
a result, we are dependent to a large extent upon the AEC industry in California and,
accordingly, are sensitive to economic factors affecting California, including general and local
economic conditions, macroeconomic trends, and natural disasters (including earthquakes and
wildfires). In recent years, the real estate development projects (both residential and
non-residential) in California have significantly declined which, in turn, has resulted in a
decline in orders from within the California-based AEC industry. Any adverse developments
affecting California could have a disproportionately negative effect on our results of
operations and financial condition.
13
Our growth strategy depends, in part, on our ability to successfully complete and manage our
acquisitions and branch openings. Failure to do so could impede our future growth and adversely
affect our competitive position.
As part of our growth strategy, we intend to prudently pursue strategic acquisitions within
the reprographics industry. Since 1997, we have acquired more than 140 businesses, most of which
were long established in the communities in which they conduct their business. Our efforts to
execute our acquisition strategy may be affected by our ability to continue to identify,
negotiate, close acquisitions and effectively integrate acquired businesses. In addition, any
governmental review or investigation of our proposed acquisitions, such as by the Federal Trade
Commission, may impede, limit or prevent us from proceeding with an acquisition. Acquisition
activities have not been a significant part of our growth strategy in fiscal year 2009 due to
potential risks inherent in a depressed economy. As the economy improves, we currently expect to
resume acquisition activity as a substantial component of our growth strategy. There can be no
assurance, however, that any future acquisition activity, and any resulting growth, will equal
or exceed prior levels of acquisition activity and growth.
Acquisitions involve a number of unique risks. For example, there may be difficulties
integrating acquired personnel and distinct business cultures. Additional financing may be
necessary and, if used, would increase our debt level, dilute our outstanding equity, or both.
Acquisitions may divert management’s time and our other resources from existing operations. It
is possible that there could be a negative effect on our financial statements from the
impairment related to goodwill and other intangibles acquired through implementation of our
acquisition strategy. We may experience the loss of key employees or customers of acquired
companies. In addition, risks may include high transaction costs and expenses of integrating
acquired companies, as well as exposure to unforeseen liabilities of acquired companies and
failure of the acquired business to achieve expected results. These risks could hinder our
future growth and adversely affect our competitive position and operating results.
In addition to acquisitions, we expand our geographic coverage by opening additional
satellite branches in regions near our established operations to capture new customers and
greater market share. Although we believe that the capital investment for a new branch is
generally modest, the branches that we open in the future may not ultimately produce returns
that justify our investment.
If we are unable to successfully monitor and manage operations of our subsidiaries and segments,
our business and profitability could suffer.
Since 1997, we have acquired more than 140 businesses and, in most cases, have delegated
the responsibility for marketing, pricing, and selling practices with the local and operational
managers of those businesses. If we do not successfully manage our subsidiaries and segments
under this decentralized operating structure, we risk having disparate results, lost market
opportunities, lack of economic synergies, and a loss of vision and planning, all of which could
harm our business and profitability.
We depend on certain key vendors for reprographics equipment, maintenance services and supplies,
making us vulnerable to supply shortages and price fluctuations.
We purchase reprographics equipment and maintenance services, as well as paper, toner and
other supplies, from a limited number of vendors. Our three largest vendors in 2009 were Oce
N.V., Azerty, and Xpedx, a division of International Paper Company. Adverse developments
concerning key vendors or our relationships with them could force us to seek alternate sources
for our reprographics equipment, maintenance services and supplies, or to purchase such
items on unfavorable terms. An alternative source of supply of reprographics equipment,
maintenance services and supplies may not be readily available. A delay in procuring
reprographics equipment, maintenance services or supplies, or an increase in the cost to
purchase these items could limit our ability to provide services to our customers on a timely
and cost-effective basis and could harm our results of operations and financial condition.
14
Our failure to adequately protect the proprietary aspects of our technology, including PlanWell,
may cause us to lose market share.
Our success depends on our ability to protect and preserve the proprietary aspects of our
technologies, including PlanWell. We rely on a combination of copyright, trademark and trade
secret protection, confidentiality agreements, license agreements, non-compete agreements,
reseller agreements, customer contracts, and technical measures to establish and protect our
rights in our proprietary technologies. For example, under our PlanWell license agreements, we
grant other reprographers a non-exclusive, non-transferable, limited license to use our PlanWell
technology and services. Our license agreements contain terms and conditions prohibiting the
unauthorized reproduction or transfer of our products. These protections, however, may not be
adequate to remedy harm we suffer due to misappropriation of our proprietary rights by third
parties. In addition, United States law provides only limited protection of proprietary rights
and the laws of some foreign countries may offer less protection than the laws of the United
States. Third parties may unlawfully copy aspects of our technology products, unlawfully
distribute them, impermissibly reverse engineer them or otherwise obtain and use information
that we regard as proprietary. If competitors are able to develop such technologies and we
cannot successfully enforce our rights against them, they may be able to market and sell or
license products that compete with ours, and this competition could adversely affect our results
of operations and financial condition. Furthermore, we may, from time to time, be subject to
intellectual property litigation which can be expensive, a burden on management’s time and our
Company’s resources, and the outcome of any such litigation may be uncertain.
Damage or disruption to our facilities, our technology centers, our vendors or a majority of our
customers could impair our ability to effectively provide our services and may have a
significant impact on our revenues, expenses and financial condition.
We currently store most of our customer data at our two technology centers located in
Silicon Valley near known earthquake fault zones. Damage to or destruction of one or both of
these technology centers or a disruption of our data storage processes resulting from sustained
process abnormalities, human error, acts of terrorism, violence, war or a natural disaster, such
as fire, earthquake or flood, could have a material adverse effect on the markets in which we
operate and on our business operations. We store and maintain critical customer data on computer
servers at our technology centers that our customers access remotely through the internet and/or
directly through telecommunications lines. If our back-up power generators fail during any power
outage, if our telecommunications lines are severed or internet access is impaired for any
reason, our remote access customers would be unable to access their critical data, causing an
interruption in their operations. In such event, our remote access customers and their customers
could seek to hold us responsible for any losses that they may incur in this regard. We may also
potentially lose these customers and our reputation could be harmed. In addition, such damage or
destruction, particularly that directly impacting our technology centers or our vendors or
customers, could have an impact on our sales, supply chain, production capability, costs, and
our ability to provide services to our customers.
Although we currently maintain general property damage insurance, we do not maintain
insurance for loss from earthquakes, acts of terrorism or war. If we incur losses from uninsured
events, we could incur significant expenses which would adversely affect our results of
operations and financial condition.
If we lose key personnel or qualified technical staff, our ability to manage the day-to-day
aspects of our business will be adversely affected.
We believe that our ability to attract and retain qualified personnel is critical to our
success. If we lose key personnel and/or are unable to recruit qualified personnel, our ability
to manage the day-to-day aspects of our business will be adversely affected. Our operations and
prospects depend in large part on the performance of our senior management team and the managers
of our principal operating segments. Outside of the implementation of succession plans and
executive transitions done in the normal course of business, the loss of the services of one or
more members of our senior management team, in particular, the sudden loss of the services of
Mr. Suriyakumar, our Chairman, President and Chief Executive Officer, would disrupt our business
and impede our ability to execute our business strategy. Because the other members of our
executive and divisional management team have on average more than 20 years of experience within
the reprographics industry, it would be difficult to replace them.
Downgrades in our credit rating may adversely affect our business, financial condition and
results of operations.
From time to time, independent credit rating agencies rate our creditworthiness. Credit
market deterioration and its actual or perceived effects on our business, financial condition
and results of operation, along with deterioration in general economic conditions, may increase
the likelihood that major independent credit agencies will downgrade our credit rating. Any
downgrade in our credit rating could increase our cost of borrowing, which would adversely
affect our financial condition and results of operations, perhaps materially. Any downgrade in
our credit rating may also cause a decline in the market price of our common stock.
|
|
|
| Item 1B. |
|
Unresolved Staff Comments |
None.
15
At the end of 2009, we operated 272 reprographics service centers, of which 259 were in the
United States, seven were in Canada, five were in China, and one in London, England. We also
occupied two technology centers in Silicon Valley, California, a software programming facility in
Kolkata, India, as well as other facilities including our executive offices located in Walnut
Creek, California, and our finance and purchasing offices located in Glendale, California.
In total the company occupied approximately 1.8 million square feet as of December 31, 2009.
We lease nearly all of our reprographics service centers, each of our administrative
facilities and our technology centers. The two facilities that we own are subject to liens under
our credit facilities. In addition to the facilities that are owned, our fixed assets are
comprised primarily of machinery and equipment, trucks, and computer equipment. We believe that
our facilities are adequate and appropriate for the purposes for which they are currently used in
our operations and are well maintained.
|
|
|
| Item 3. |
|
Legal Proceedings |
We are involved in various legal proceedings and claims from time to time in the normal
course of business. We do not believe, based on currently available information, that the final
outcome of any of these matters, taken individually or as a whole, will have a material adverse
effect on our consolidated financial position, results of operations or cash flows. The Company
believes the amounts provided in its Consolidated Financial Statements, which are not material,
are adequate in light of the probable and estimable liabilities. However, because such matters
are subject to many uncertainties, the ultimate outcomes are not predictable and there can be no
assurances that the actual amounts required to satisfy alleged liabilities will not exceed the
amounts reflected in the Company’s Consolidated Financial Statements or will not have a material
adverse effect on its consolidated financial position, results of operations or cash flows.
|
|
|
| Item 4. |
|
Submission of Matters to a Vote of Security Holders |
None.
16
PART II
|
|
|
| Item 5. |
|
Market for Registrant’s Common Equity, Related Stockholder Matters and Issuer Purchases
of Equity Securities |
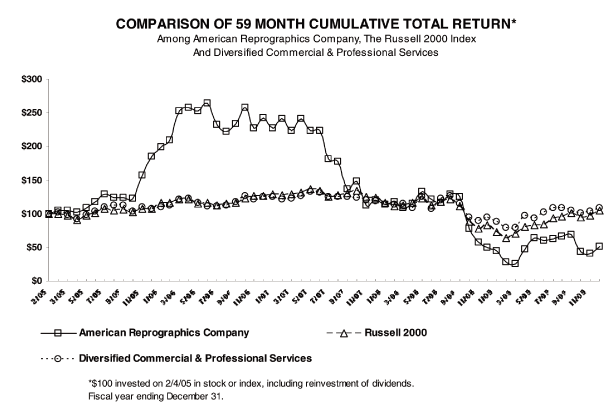
Our common stock, par value $0.001, is listed on the NYSE under the stock symbol “ARP”. The
following table sets forth for the fiscal periods indicated the high and low sales prices per
share of our common stock as reported by the NYSE.
| |
|
|
|
|
|
|
|
|
| |
|
High |
|
|
Low |
|
Fiscal Year 2008 |
|
|
|
|
|
|
|
|
First Quarter |
|
$ |
17.06 |
|
|
$ |
13.49 |
|
Second Quarter |
|
|
19.96 |
|
|
|
14.65 |
|
Third Quarter |
|
|
21.83 |
|
|
|
14.93 |
|
Fourth Quarter |
|
|
17.15 |
|
|
|
5.36 |
|
Fiscal Year 2009 |
|
|
|
|
|
|
|
|
First Quarter |
|
$ |
7.11 |
|
|
$ |
2.55 |
|
Second Quarter |
|
|
10.26 |
|
|
|
3.26 |
|
Third Quarter |
|
|
10.21 |
|
|
|
7.20 |
|
Fourth Quarter |
|
|
9.74 |
|
|
|
5.43 |
|
Performance Graph
The graph below compares the cumulative 59-month total return of holders of our common stock
with the cumulative total returns of the Russell 2000 index, and a customized peer group of six
companies that includes G & K Services Inc., Healthcare Services Group Inc., Mobile Mini Inc.,
School Specialty Inc., Tetra Tech Inc., and Viad Corp. The graph below tracks the performance of a
$100 investment in our common stock, in the peer group, and the index (with the reinvestment of
all dividends) from February 4, 2005 through December 31, 2009. The stock price performance
included in the graph below is not necessarily indicative of future stock price performance.
The following graph and related information shall not be deemed “soliciting material” or be
deemed to be “filed” with the SEC, nor shall such information be incorporated by reference into
any future filing under the Securities Act or the Exchange Act, whether made before or after the
date hereof, except to the extent that we specifically incorporate it by reference into such
filing.
17
| |
|
|
|
|
|
|
|
|
|
|
|
|
|
|
|
|
|
|
|
|
|
|
|
|
|
|
|
|
|
|
|
|
|
|
|
|
|
|
|
|
| |
|
2/05 |
|
|
2/05 |
|
|
3/05 |
|
|
4/05 |
|
|
5/05 |
|
|
6/05 |
|
|
7/05 |
|
|
8/05 |
|
|
9/05 |
|
|
10/05 |
|
|
|
|
|
|
|
|
|
|
|
|
|
|
|
|
|
|
|
|
|
|
|
|
|
|
|
|
|
|
|
|
|
|
|
|
|
|
|
|
|
|
American Reprographics Company |
|
|
100.00 |
|
|
|
105.09 |
|
|
|
104.36 |
|
|
|
102.18 |
|
|
|
108.36 |
|
|
|
117.02 |
|
|
|
129.45 |
|
|
|
123.56 |
|
|
|
124.36 |
|
|
|
122.55 |
|
Russell 2000 |
|
|
100.00 |
|
|
|
99.54 |
|
|
|
96.69 |
|
|
|
91.15 |
|
|
|
97.12 |
|
|
|
100.86 |
|
|
|
107.25 |
|
|
|
105.26 |
|
|
|
105.59 |
|
|
|
102.31 |
|
Diversified Commercial & Professional Services |
|
|
100.00 |
|
|
|
102.58 |
|
|
|
98.35 |
|
|
|
91.36 |
|
|
|
98.07 |
|
|
|
103.73 |
|
|
|
109.99 |
|
|
|
112.20 |
|
|
|
112.57 |
|
|
|
103.34 |
|
| |
|
|
|
|
|
|
|
|
|
|
|
|
|
|
|
|
|
|
|
|
|
|
|
|
|
|
|
|
|
|
|
|
|
|
|
|
|
|
|
|
|
|
|
|
|
|
|
|
|
|
|
|
|
|
|
|
| 11/05 |
|
12/05 |
|
|
1/06 |
|
|
2/06 |
|
|
3/06 |
|
|
4/06 |
|
|
5/06 |
|
|
6/06 |
|
|
7/06 |
|
|
8/06 |
|
|
9/06 |
|
|
10/06 |
|
|
11/06 |
|
|
12/06 |
|
|
1/07 |
|
|
|
|
|
|
|
|
|
|
|
|
|
|
|
|
|
|
|
|
|
|
|
|
|
|
|
|
|
|
|
|
|
|
|
|
|
|
|
|
|
|
|
|
|
|
|
|
|
|
|
|
|
|
|
|
|
|
156.44 |
|
|
184.80 |
|
|
|
198.55 |
|
|
|
208.73 |
|
|
|
252.29 |
|
|
|
257.96 |
|
|
|
252.15 |
|
|
|
263.64 |
|
|
|
232.58 |
|
|
|
221.96 |
|
|
|
233.16 |
|
|
|
258.18 |
|
|
|
227.35 |
|
|
|
242.25 |
|
|
|
227.78 |
|
107.28 |
|
|
106.79 |
|
|
|
116.37 |
|
|
|
116.05 |
|
|
|
121.68 |
|
|
|
121.66 |
|
|
|
114.82 |
|
|
|
115.56 |
|
|
|
111.80 |
|
|
|
115.11 |
|
|
|
116.07 |
|
|
|
122.75 |
|
|
|
125.98 |
|
|
|
126.41 |
|
|
|
128.52 |
|
109.24 |
|
|
107.66 |
|
|
|
109.53 |
|
|
|
112.34 |
|
|
|
121.37 |
|
|
|
122.89 |
|
|
|
115.98 |
|
|
|
110.84 |
|
|
|
110.58 |
|
|
|
112.18 |
|
|
|
117.52 |
|
|
|
126.66 |
|
|
|
121.23 |
|
|
|
124.73 |
|
|
|
124.86 |
|
| |
|
|
|
|
|
|
|
|
|
|
|
|
|
|
|
|
|
|
|
|
|
|
|
|
|
|
|
|
|
|
|
|
|
|
|
|
|
|
|
|
|
|
|
|
|
|
|
|
|
|
|
|
|
|
|
|
| 2/07 |
|
3/07 |
|
|
4/07 |
|
|
5/07 |
|
|
6/07 |
|
|
7/07 |
|
|
8/07 |
|
|
9/07 |
|
|
10/07 |
|
|
11/07 |
|
|
12/07 |
|
|
1/08 |
|
|
2/08 |
|
|
3/08 |
|
|
4/08 |
|
|
|
|
|
|
|
|
|
|
|
|
|
|
|
|
|
|
|
|
|
|
|
|
|
|
|
|
|
|
|
|
|
|
|
|
|
|
|
|
|
|
|
|
|
|
|
|
|
|
|
|
|
|
|
|
|
|
240.80 |
|
|
223.93 |
|
|
|
241.45 |
|
|
|
224.00 |
|
|
|
223.93 |
|
|
|
181.24 |
|
|
|
177.67 |
|
|
|
136.15 |
|
|
|
147.49 |
|
|
|
112.58 |
|
|
|
119.85 |
|
|
|
113.82 |
|
|
|
117.67 |
|
|
|
107.93 |
|
|
|
115.42 |
|
127.50 |
|
|
128.87 |
|
|
|
131.18 |
|
|
|
136.55 |
|
|
|
134.56 |
|
|
|
125.35 |
|
|
|
128.19 |
|
|
|
130.39 |
|
|
|
134.14 |
|
|
|
124.50 |
|
|
|
124.43 |
|
|
|
115.94 |
|
|
|
111.64 |
|
|
|
112.11 |
|
|
|
116.80 |
|
121.46 |
|
|
122.85 |
|
|
|
126.48 |
|
|
|
132.66 |
|
|
|
132.06 |
|
|
|
125.03 |
|
|
|
125.43 |
|
|
|
124.89 |
|
|
|
123.89 |
|
|
|
120.17 |
|
|
|
118.14 |
|
|
|
114.23 |
|
|
|
113.21 |
|
|
|
115.26 |
|
|
|
108.78 |
|
| |
|
|
|
|
|
|
|
|
|
|
|
|
|
|
|
|
|
|
|
|
|
|
|
|
|
|
|
|
|
|
|
|
|
|
|
|
|
|
|
|
|
|
|
|
|
|
|
|
|
|
|
|
|
|
|
|
| 5/08 |
|
6/08 |
|
|
7/08 |
|
|
8/08 |
|
|
9/08 |
|
|
10/08 |
|
|
11/08 |
|
|
12/08 |
|
|
1/09 |
|
|
2/09 |
|
|
3/09 |
|
|
4/09 |
|
|
5/09 |
|
|
6/09 |
|
|
7/09 |
|
|
|
|
|
|
|
|
|
|
|
|
|
|
|
|
|
|
|
|
|
|
|
|
|
|
|
|
|
|
|
|
|
|
|
|
|
|
|
|
|
|
|
|
|
|
|
|
|
|
|
|
|
|
|
|
|
|
133.02 |
|
|
121.09 |
|
|
|
116.44 |
|
|
|
128.80 |
|
|
|
125.45 |
|
|
|
77.38 |
|
|
|
56.95 |
|
|
|
50.18 |
|
|
|
44.22 |
|
|
|
28.36 |
|
|
|
25.75 |
|
|
|
46.91 |
|
|
|
63.35 |
|
|
|
60.51 |
|
|
|
62.91 |
|
122.17 |
|
|
112.77 |
|
|
|
116.94 |
|
|
|
121.16 |
|
|
|
111.51 |
|
|
|
88.31 |
|
|
|
77.87 |
|
|
|
82.39 |
|
|
|
73.22 |
|
|
|
64.32 |
|
|
|
70.07 |
|
|
|
80.90 |
|
|
|
83.33 |
|
|
|
84.56 |
|
|
|
92.70 |
|
124.63 |
|
|
106.64 |
|
|
|
122.73 |
|
|
|
126.00 |
|
|
|
114.88 |
|
|
|
95.03 |
|
|
|
88.83 |
|
|
|
95.08 |
|
|
|
88.27 |
|
|
|
79.26 |
|
|
|
79.58 |
|
|
|
96.67 |
|
|
|
93.27 |
|
|
|
101.63 |
|
|
|
108.08 |
|
| |
|
|
|
|
|
|
|
|
|
|
|
|
|
|
|
|
| 8/09 |
|
9/09 |
|
|
10/09 |
|
|
11/09 |
|
|
12/09 |
|
|
|
|
|
|
|
|
|
|
|
|
|
|
|
|
|
|
66.47 |
|
|
69.24 |
|
|
|
43.64 |
|
|
|
40.44 |
|
|
|
50.98 |
|
95.36 |
|
|
100.86 |
|
|
|
94.02 |
|
|
|
96.97 |
|
|
|
104.77 |
|
108.27 |
|
|
105.01 |
|
|
|
101.13 |
|
|
|
103.31 |
|
|
|
108.25 |
|
Holders
As of February 22, 2010, the approximate number of stockholders of record of our common stock
was 123 and the closing price of our common stock was $7.32 per share as reported by the NYSE.
Because many of the shares of our common stock are held by brokers and other institutions on
behalf of stockholders, we are unable to estimate the total number of beneficial owners
represented by these stockholders of record.
Dividends
We have never declared or paid cash dividends on our common stock. We currently intend to
retain all available funds and any future earnings for use in the operation of our business and
do not anticipate paying any cash dividends in the foreseeable future. Any future determination
to declare cash dividends will be made at the discretion of our board of directors, subject to
compliance with Delaware corporate law, certain covenants under our credit facility which
restrict or limit our ability to declare or pay dividends, and will depend on our financial
condition, results of operations, capital requirements, general business conditions, and other
factors that our board of directors may deem relevant.
Recent Sales of Unregistered Securities; Use of Proceeds from Registered Securities
None.
18
|
|
|
| Item 6. |
|
Selected Financial Data |
The selected historical financial data presented below is derived from the audited
financial statements of American Reprographics Company for the fiscal years ended December 31,
2009, 2008, 2007, 2006 and 2005. The selected historical financial data does not purport to
represent what our financial position or results of operations might be for any future period or
date. The financial data set forth below should be read in conjunction with “Management’s
Discussion and Analysis of Financial Condition and Results of Operations” and our audited
financial statements included elsewhere in this report.
| |
|
|
|
|
|
|
|
|
|
|
|
|
|
|
|
|
|
|
|
|
| |
|
Fiscal Year Ended December 31, |
|
| |
|
2009 |
|
|
2008 |
|
|
2007 |
|
|
2006 |
|
|
2005 |
|
| |
|
(Dollars in thousands) |
|
Statement of Operations Data: |
|
|
|
|
|
|
|
|
|
|
|
|
|
|
|
|
|
|
|
|
Reprographics services |
|
$ |
350,491 |
|
|
$ |
518,062 |
|
|
$ |
513,630 |
|
|
$ |
438,375 |
|
|
$ |
369,123 |
|
Facilities management |
|
|
97,401 |
|
|
|
120,983 |
|
|
|
113,848 |
|
|
|
100,158 |
|
|
|
83,125 |
|
Equipment and supplies sales |
|
|
53,657 |
|
|
|
61,942 |
|
|
|
60,876 |
|
|
|
53,305 |
|
|
|
41,956 |
|
|
|
|
|
|
|
|
|
|
|
|
|
|
|
|
|
Total net sales |
|
|
501,549 |
|
|
|
700,987 |
|
|
|
688,354 |
|
|
|
591,838 |
|
|
|
494,204 |
|
Cost of sales |
|
|
323,360 |
|
|
|
415,715 |
|
|
|
401,317 |
|
|
|
337,509 |
|
|
|
289,580 |
|
|
|
|
|
|
|
|
|
|
|
|
|
|
|
|
|
Gross profit |
|
|
178,189 |
|
|
|
285,272 |
|
|
|
287,037 |
|
|
|
254,329 |
|
|
|
204,624 |
|
Selling, general and administrative expenses |
|
|
115,020 |
|
|
|
154,728 |
|
|
|
143,811 |
|
|
|
131,743 |
|
|
|
112,679 |
|
Litigation (gain) reserve |
|
|
— |
|
|
|
— |
|
|
|
(2,897 |
) |
|
|
11,262 |
|
|
|
— |
|
Amortization of intangibles |
|
|
11,367 |
|
|
|
12,004 |
|
|
|
9,083 |
|
|
|
5,055 |
|
|
|
2,120 |
|
Goodwill impairment |
|
|
37,382 |
|
|
|
35,154 |
|
|
|
— |
|
|
|
— |
|
|
|
— |
|
Impairment of long-lived assets |
|
|
781 |
|
|
|
— |
|
|
|
— |
|
|
|
— |
|
|
|
— |
|
|
|
|
|
|
|
|
|
|
|
|
|
|
|
|
|
Income from operations |
|
|
13,639 |
|
|
|
83,386 |
|
|
|
137,040 |
|
|
|
106,269 |
|
|
|
89,825 |
|
Other income, net |
|
|
(171 |
) |
|
|
(517 |
) |
|
|
— |
|
|
|
(299 |
) |
|
|
(381 |
) |
Interest expense, net |
|
|
25,781 |
|
|
|
25,890 |
|
|
|
24,373 |
|
|
|
23,192 |
|
|
|
26,722 |
|
Loss on early extinguishment of debt |
|
|
— |
|
|
|
— |
|
|
|
1,327 |
|
|
|
— |
|
|
|
9,344 |
|
|
|
|
|
|
|
|
|
|
|
|
|
|
|
|
|
(Loss) income before income tax (benefit)
provision |
|
|
(11,971 |
) |
|
|
58,013 |
|
|
|
111,340 |
|
|
|
83,376 |
|
|
|
54,140 |
|
Income tax provision (benefit) (1) |
|
|
3,018 |
|
|
|
21,200 |
|
|
|
42,203 |
|
|
|
31,982 |
|
|
|
(6,336 |
) |
|
|
|
|
|
|
|
|
|
|
|
|
|
|
|
|
Net (loss) income |
|
|
(14,989 |
) |
|
|
36,813 |
|
|
|
69,137 |
|
|
|
51,394 |
|
|
|
60,476 |
|
Loss (income) attributable to noncontrolling interest |
|
|
104 |
|
|
|
(59 |
) |
|
|
— |
|
|
|
— |
|
|
|
— |
|
|
|
|
|
|
|
|
|
|
|
|
|
|
|
|
|
Net (loss) income attributable to American Reprographics Company |
|
$ |
(14,885 |
) |
|
$ |
36,754 |
|
|
$ |
69,137 |
|
|
$ |
51,394 |
|
|
$ |
60,476 |
|
|
|
|
|
|
|
|
|
|
|
|
|
|
|
|
|
| |
|
|
|
|
|
|
|
|
|
|
|
|
|
|
|
|
|
|
|
|
| |
|
Fiscal Year Ended December 31, |
|
| |
|
2009 |
|
|
2008 |
|
|
2007 |
|
|
2006 |
|
|
2005 |
|
| |
|
(In thousands, except per share amounts) |
|
(Loss) earnings per share attributable to
ARC shareholders: |
|
|
|
|
|
|
|
|
|
|
|
|
|
|
|
|
|
|
|
|
Basic |
|
$ |
(0.33 |
) |
|
$ |
0.82 |
|
|
$ |
1.52 |
|
|
$ |
1.14 |
|
|
$ |
1.43 |
|
Diluted |
|
$ |
(0.33 |
) |
|
$ |
0.81 |
|
|
$ |
1.51 |
|
|
$ |
1.13 |
|
|
$ |
1.40 |
|
|
|
|
|
|
|
|
|
|
|
|
|
|
|
|
|
|
|
|
|
|
Weighted average common shares
outstanding: |
|
|
|
|
|
|
|
|
|
|
|
|
|
|
|
|
|
|
|
|
Basic |
|
|
45,123 |
|
|
|
45,060 |
|
|
|
45,421 |
|
|
|
45,015 |
|
|
|
42,264 |
|
Diluted |
|
|
45,123 |
|
|
|
45,398 |
|
|
|
45,829 |
|
|
|
45,595 |
|
|
|
43,178 |
|
19
| |
|
|
|
|
|
|
|
|
|
|
|
|
|
|
|
|
|
|
|
|
| |
|
Fiscal Year Ended December 31, |
|
| |
|
2009 |
|
|
2008 |
|
|
2007 |
|
|
2006 |
|
|
2005 |
|
| |
|
(Dollars in thousands) |
|
Other Financial Data: |
|
|
|
|
|
|
|
|
|
|
|
|
|
|
|
|
|
|
|
|
Depreciation and
amortization |
|
$ |
49,543 |
|
|
$ |
50,121 |
|
|
$ |
39,445 |
|
|
$ |
27,749 |
|
|
$ |
19,165 |
|
Capital expenditures |
|
$ |
7,506 |
|
|
$ |
9,033 |
|
|
$ |
8,303 |
|
|
$ |
7,391 |
|
|
$ |
5,237 |
|
Interest expense, net |
|
$ |
25,781 |
|
|
$ |
25,890 |
|
|
$ |
24,373 |
|
|
$ |
23,192 |
|
|
$ |
26,722 |
|
| |
|
|
|
|
|
|
|
|
|
|
|
|
|
|
|
|
|
|
|
|
| |
|
As of December 31, |
|
| |
|
2009 |
|
|
2008 |
|
|
2007 |
|
|
2006 |
|
|
2005 |
|
| |
|
(Dollars in thousands) |
|
Balance Sheet Data: |
|
|
|
|
|
|
|
|
|
|
|
|
|
|
|
|
|
|
|
|
Cash and cash equivalents |
|
$ |
29,377 |
|
|
$ |
46,542 |
|
|
$ |
24,802 |
|
|
$ |
11,642 |
|
|
$ |
22,643 |
|
Total assets |
|
$ |
620,954 |
|
|
$ |
725,931 |
|
|
$ |
722,611 |
|
|
$ |
547,581 |
|
|
$ |
442,362 |
|
Long term obligations |
|
$ |
228,711 |
|
|
$ |
315,165 |
|
|
$ |
324,724 |
|
|
$ |
253,419 |
|
|
$ |
253,371 |
|
Total ARC stockholders’
equity |
|
$ |
282,024 |
|
|
$ |
287,902 |
|
|
$ |
251,651 |
|
|
$ |
184,244 |
|
|
$ |
113,569 |
|
Working capital |
|
$ |
(3,739 |
) |
|
$ |
29,798 |
|
|
$ |
4,695 |
|
|
$ |
21,150 |
|
|
$ |
35,797 |
|
| |
|
|
| (1) |
|
The Company was reorganized from a California limited
liability company to a Delaware corporation immediately
prior to the consummation of its initial public
offering on February 9, 2005. As a result of that
reorganization, a deferred tax benefit of $27.7 million
was booked concurrent with the consummation of the
initial public offering. |
20
|
|
|
| Item 7. |
|
Management’s Discussion and Analysis of Financial Condition and Results of Operations |
The following discussion should be read in conjunction with our consolidated financial
statements and the related notes and other financial information appearing elsewhere in this
Annual Report. This Annual Report contains forward-looking statements that involve risks and
uncertainties. Our actual results may differ materially from those indicated in forward-looking
statements. See “Forward-Looking Statements” and “Risk Factors.”
Executive Summary
ARC is the leading reprographics company in the United States. We provide
business-to-business document management services primarily to the AEC industry, through a
nationwide network of locally branded service centers. The majority of our customers know us as
a local reprographics provider, usually with a local brand and a long history in the community.
We also serve a variety of clients and businesses outside the AEC industry in need of
sophisticated document management services similar to our core AEC offerings.
Our services apply to time-sensitive and graphic-intensive documents, and fall into four
primary categories:
| |
• |
|
Document management; |
| |
| |
• |
|
Document distribution and logistics; |
| |
| |
• |
|
Print-on-demand; and |
| |
| |
• |
|
On-site services, frequently referred to as facilities
management (“FMs”), which is any combination of the above
services supplied at a customer’s location. |
We deliver these services through our specialized technology, more than 550 sales and
customer service employees interacting with our customers every day, and approximately 5,700
on-site services facilities at our customers’ locations. All of our local service centers are
connected by a digital infrastructure, allowing us to deliver services, products, and value to
approximately 138,000 customers throughout the country.
Our operating segments operate under local brand names. Each brand name typically
represents a business or group of businesses that has been acquired by us. We coordinate these
operating segments and consolidate their service offerings for large regional or national
customers through our central “Global Services” program.
A significant component of our historical growth has been from acquisitions. In 2009, we
acquired two U.S. businesses that consisted of “stand-alone acquisitions” and “fold-in
acquisitions” (refer to page 24 for an explanation of these terms) and one Chinese business
acquisition through UNIS Document Solutions Co. Ltd., (“UDS”), our business venture with
Unisplendour Corporation Limited (“Unisplendour”) for $2.9 million. In 2008, we acquired 13
businesses for $31.9 million. In 2007, we acquired 19 businesses for $146.3 million. In
connection with acquisitions completed in 2009, we have applied the provisions of Financial
Accounting Standards Board (“FASB”) Accounting Standards Codification (“ASC”) ASC 805, formerly
Statement of Financial Accounting Standards (“SFAS”) No. 141 (Revised 2007), Business
Combinations, using the acquisition method of accounting, however, acquisitions completed prior
to 2009 were accounted for by applying the provisions SFAS No. 141, Business Combinations,
(“SFAS 141”), our Consolidated Statements of Operations reflect sales and expenses of acquired
businesses only for post-acquisition periods.
On August 1, 2008, we commenced operations of UDS, our business venture with Unisplendour.
The purpose of UDS is to pair the digital document management solutions of our Company with the
brand recognition and Chinese distribution channel of Unisplendour to deliver digital
reprographics services to China’s growing construction industry. Under the terms of the
agreement, our Company and Unisplendour have an economic ownership interest of 65 percent and 35
percent, respectively.
As part of our growth strategy, we sometimes open or acquire branch or satellite service
centers in contiguous markets, which we view as a low cost, rapid form of market expansion. Our
branch openings require modest capital expenditures and are expected to generate operating
profit within 12 months from opening. We had 272 and 299 reprographic service centers for the
years ended December 31, 2009 and 2008, respectively.
21
Evaluating our Performance. We measure our success in delivering value to our stockholders
by striving for the following:
| |
• |
|
Creating consistent, profitable growth, or in the absence
of growth due to market conditions beyond our control,
stable margins superior to commonly understood industry
benchmarks; |
| |
| |
• |
|
Maintaining our industry leadership as measured by our
geographical footprint, market share and revenue
generation; |
| |
| |
• |
|
Continuing to develop and invest in our products, services,
and technology to meet the changing needs of our customers; |
| |
| |
• |
|
Maintaining a low cost structure; and |
| |
| |
• |
|
Maintaining a flexible capital structure that provides for
both responsible debt service and pursuit of acquisitions
and other high-return investments. |
Primary Financial Measures. We use net sales, costs and expenses, earnings before taxes
(“EBT”), earnings before interest and taxes (“EBIT”), earnings before interest, taxes,
depreciation and amortization (“EBITDA”) and operating cash flow to operate and assess the
performance of our business.
Net Sales. Net sales represent total sales less returns and discounts. These sales consist
of document management services, document distribution and logistics services, print-on-demand
services, and reprographics equipment and supplies sales. We generate sales by individual orders
through commissioned sales personnel and, in some cases, through national contracts.
Net sales are categorized as reprographics services, facilities management, and equipment
and supplies. Our current revenue sources are likely to change in the future if our digital
services revenue commands a greater and more distinctive role in our service mix. Digital
services currently comprise approximately 8.5% of our overall revenue.
Software licenses and membership fees are derived over the term of the license or the
membership agreement. Licensed technology includes PlanWell online planrooms, PlanWell EWO,
PlanWell BidCaster and MetaPrint, among others. Revenues from these agreements are separate from
digital services and typically are derived from other reprographics companies licensing the
applications as opposed to end users. Digital services we provide to our customers include
digital document management tasks, scanning and archiving digital documents, posting documents
to the web and other related work performed on a computer. Software licenses, membership fees
and digital services are categorized and reported as a part of “Reprographics services”.
Revenue from reprographics services is produced from document management, document
distribution and logistics, and print-on-demand services. We include revenues for all these
services under the caption “Reprographics services”.
On-site services, or facilities management, revenues are generated from providing
reprographics services in our customers’ locations using machines that we own or lease.
Generally, this revenue is derived from a single cost per-square-foot of printed material,
similar to our reprographics services.
Revenue from equipment and supplies is derived from the resale of such items to our
customers. We do not manufacture such items but rather purchase them from our vendors at
wholesale costs.
While our services are now most frequently delivered through the use of computers and
digital production equipment as opposed to manual document management processes and analog
printing devices, our primary revenue model remains based on the price of printing. Our progress
in charging for digital services has increased to 8.5% of our overall revenue, but the common
practices in the construction industry have yet to fully support a pricing model that takes
services other than print into a pricing equation. We believe the adoption of our technology
applications by our customers has begun to reshape our pricing justification, and we also
believe that the current economic hardship facing most construction companies will create more
opportunities to promote and charge for the full value of our digital services given the
productivity enhancements our technology provides to our customers’ workflows.
In 2009, our reprographics services represented 69.9% of net sales, facilities management
19.4%, and sales of reprographics equipment and supplies 10.7%. Digital services revenue, which
are included in reprographics services, approximated 8.5% of our net sales. Software licenses,
including PlanWell, and PEiR memberships have not, to date, contributed significant revenue.
While we achieve modest cost recovery through membership, licensing and maintenance fees charged
by the PEiR Group, we measure success in this area primarily by the adoption rate of our
programs and products.
We identify operating segments based on the various business activities that earn revenue
and incur expense, the operating results of which are reviewed by management. Based on the fact
that our operating segments have similar products and services, class of customers, production
process and performance objectives, our Company is deemed to operate as a single reportable
business segment.
22
While large orders involving thousands of documents and hundreds of recipients are common,
the bulk of our customer orders consist of organizing, printing or distributing less than 200
drawings at a time. Such “short-run” orders are usually recurring, despite their tendency to
arrive with no advance notice and a short turnaround requirement. Since we do not operate with a
backlog, it is difficult to predict the number, size and profitability of reprographics work
that we expect to undertake more than a few weeks in advance.
Costs and Expenses. Our cost of sales consists primarily of paper, toner and other
consumables, labor, and expenses for facilities and equipment. Facilities and equipment expenses
include maintenance, repairs, rents, insurance, and depreciation. Paper is the largest component
of our material cost. However, paper pricing typically does not affect our operating margins
because changes are generally passed on to our customers. We closely monitor material cost
as a percentage of net sales to measure volume and waste. We also track labor utilization, or
net sales per employee, to measure productivity and determine staffing levels.
We maintain low levels of inventory and other working capital. Capital expenditure
requirements are also low; most facilities and equipment are leased, with overall cash capital
spending averaging approximately 1.3% of annual net sales over the last three years. Since we
typically lease our reprographics equipment for three to five year terms, we are able to upgrade
equipment in response to rapid changes in technology.
Research and development costs consist mainly of the salaries, leased building space, and
computer equipment that comprise our data storage and development centers in Silicon Valley,
California and Kolkata, India. Such costs are recorded to cost of sales.
Our selling expenses generally include salaries and commissions paid to our sales
professionals, along with promotional, travel, and entertainment costs. Our general and
administrative expenses generally include salaries and benefits paid to support personnel at our
reprographics businesses and our corporate staff, as well as office rent, utilities,
communications expenses, and various professional services.
One of the primary methods we have used to maintain our margins during periods of economic
or industry decline has been to quickly and aggressively reduce our variable operating costs.
The largest portions of our variable costs are labor-related. Given that we manage production
capacity primarily through labor utilization during a given daily production schedule or shift,
we achieve cost containment objectives through the reduction of full-time employees, and the
close management of hourly schedules.
Operating Cash. “Operating Cash” or “Cash Flow from Operations” includes net income less
common expenditures requiring cash and is used as a measure to control working capital.
Other Common Financial Measures. We also use a variety of other common financial measures
as indicators of our performance, including:
| |
• |
|
Net income and earnings per share; |
| |
| |
• |
|
Material costs as a percentage of net sales; and |
| |
| |
• |
|
Days Sales Outstanding/Days Sales Inventory/Days Payable Outstanding. |
In addition to using these financial measures at the corporate level, we monitor some of
them daily and operating segment by operating segment through use of our proprietary company
intranet and reporting tools. Our corporate operations staff also conducts a monthly variance
analysis on the income statement, balance sheet, and cash flows of each operating segment.
We believe our current customer segment mix is approximately 78% of revenues derived from
the AEC industry, and 22% derived from non-AEC sources. We believe that non-AEC sources of
revenue currently offer more attractive revenue opportunities in light of current credit and
spending constraints being experienced by the AEC industry. Given our focus, we expect non-AEC
revenues to continue to grow relative to our overall revenue in the future.
Not all of these financial measurements are represented directly on our Consolidated
Financial Statements, but meaningful discussions of each are part of our quarterly disclosures
and presentations to the investment community.
Acquisitions. Our disciplined approach to complementary acquisitions has led us to acquire
reprographics businesses that fit our profile for performance potential and meet strategic
criteria for gaining market share. In most cases, performance of newly acquired businesses
improves almost immediately due to the application of financial best practices, significantly
greater purchasing power, and productivity-enhancing technology.
23
Based on our experience of completing more than 140 acquisitions since 1997, we believe
that the reprographics industry is highly-fragmented and comprised primarily of small businesses
with less than $7.0 million in annual sales. Although none of the individual acquisitions in the
past three years has added a material percentage of sales to our overall business, in the
aggregate they have fueled the bulk of our historical annual sales growth. Acquisition
activities have not been a meaningful part of our 2009 operations due to the potential risks
inherent in a depressed economy. As the economy improves, it is our current intention to resume
acquisition activity as a substantial component of our growth strategy.
When we acquire businesses, our management typically uses the previous year’s sales figures
as an informal basis for estimating future revenues for our Company. We do not use this approach
for formal accounting or reporting purposes but as an internal benchmark with which to measure
the future effect of operating synergies, best practices and sound financial management on the
acquired entity.
We also use the previous year’s sales figures to assist us in determining how the acquired
business will be integrated into the overall management structure of our Company. We categorize
newly acquired businesses in one of two ways:
| |
1. |
|
Standalone Acquisitions. Post-acquisition, these businesses
maintain their existing local brand and act as strategic
platforms for the Company to acquire market share in and
around the specific geographical location. |
| |
| |
2. |
|
Branch/Fold-in Acquisitions. These acquisitions are
equivalent to opening a new or “greenfield” branch. They
support an outlying portion of a larger market and rely on
a larger centralized production facility nearby for
strategic management, load balancing, providing specialized
services, and for administrative and other “back office”
support. We maintain the staff and equipment of these
businesses to a minimum to serve a small market or a single
large customer, or we may physically integrate (fold-in)
staff and equipment into a larger nearby production
facility. |
New acquisitions frequently carry a significant amount of goodwill in their purchase price,
even in the case of a low purchase multiple. This goodwill typically represents the purchase
price of an acquired business less the fair market value of tangible assets and identifiable
intangible assets. We test our goodwill components annually for impairment on September 30 or
more frequently if events and circumstances indicate that goodwill might be impaired. See Note 2
“Summary of Significant Accounting Policies” to our Consolidated Financial Statements for
further information.
Economic Factors Affecting Financial Performance. We estimate that sales to the AEC
industry accounted for 78% of our net sales for the period ended December 31, 2009, with the
remaining 22% consisting of sales to non-AEC industries (based on a compilation of approximately
90% of revenues from our operating segments and designating revenues using certain assumptions
as derived from either AEC or non-AEC based customers). As a result, our operating results and
financial condition can be significantly affected by economic factors that influence the AEC
industry, such as the availability of commercial credit at reasonably attractive rates,
non-residential and residential construction spending, GDP growth, interest rates, employment
rates, office vacancy rates, and government expenditures. The effects of the current economic
recession in the United States, and weakness in global economic conditions, have resulted in a
significant reduction of activity in the non-residential and residential portions of the AEC
industry, which in turn, has produced a decline in our revenues over the past 24 months. We
believe that the AEC industry generally experiences downturns several months after a downturn in
the general economy and that there may be a similar delay in the recovery of the AEC industry
following a recovery in the general economy. Similar to the AEC industry, the reprographics
industry typically lags a recovery in the broader economy.
Non-GAAP Measures
EBIT, EBITDA and related ratios presented in this report are supplemental measures of our
performance that are not required by or presented in accordance with accounting principles
generally accepted in the United States of America (“GAAP”). These measures are not measurements
of our financial performance under GAAP and should not be considered as alternatives to net
income, income from operations, or any other performance measures derived in accordance with
GAAP or as an alternative to cash flows from operating, investing or financing activities as a
measure of our liquidity.
EBIT represents net income before interest and taxes. EBITDA represents net income before
interest, taxes, depreciation and amortization. Amortization does not include $4.9 million, $4.3
million and $3.5 million of stock based compensation expense recorded in selling, general and
administrative expenses, for the years ended December 31, 2009, 2008 and 2007, respectively.
EBIT margin is a non-GAAP measure calculated by dividing EBIT by net sales. EBITDA margin is a
non-GAAP measure calculated by dividing EBITDA by net sales.
We present EBIT, EBITDA and related ratios because we consider them important supplemental
measures of our performance and liquidity. We believe investors may also find these measures
meaningful, given how our management makes use of them. The following is a discussion of our use
of these measures.
24
We use EBIT and EBITDA to measure and compare the performance of our operating segments.
Our operating segments’ financial performance includes all of the operating activities except
for debt and taxation which are managed at the corporate level for U.S. operating segments. As a
result, EBIT is the best measure of divisional profitability and the most useful metric by which
to measure and compare the performance of our operating segments. We also use EBIT to measure
performance for determining operating segment-level compensation and use EBITDA to measure
performance for determining consolidated-level compensation. We also use EBIT and EBITDA to
evaluate potential acquisitions and to evaluate whether to incur capital expenditures.
EBIT, EBITDA and related ratios have limitations as analytical tools, and you should not
consider them in isolation, or as a substitute for analysis of our results as reported under
GAAP. Some of these limitations are as follows:
| |
• |
|
They do not reflect our cash expenditures, or future requirements for capital
expenditures and contractual commitments; |
| |
| |
• |
|
They do not reflect changes in, or cash requirements for, our working capital needs; |
| |
| |
• |
|
They do not reflect the significant interest expense, or the cash requirements
necessary, to service interest or principal payments on our debt; |
| |
| |
• |
|
Although depreciation and amortization are non-cash charges, the assets being
depreciated and amortized will often have to be replaced in the future, and EBITDA
does not reflect any cash requirements for such replacements; and |
| |
| |
• |
|
Other companies, including companies in our industry, may calculate these measures
differently than we do, limiting their usefulness as comparative measures. |
Because of these limitations, EBIT, EBITDA, and related ratios should not be considered as
measures of discretionary cash available to us to invest in business growth or to reduce our
indebtedness. We compensate for these limitations by relying primarily on our GAAP results and
using EBIT, EBITDA and related ratios only as supplements. For more information, see our
Consolidated Financial Statements and related notes elsewhere in this report.
We have presented adjusted net income attributable to ARC and adjusted earnings per share
attributable to ARC shareholders for the years ended December 31, 2009 and 2008 to reflect the
exclusion of the goodwill impairment charge, long-lived assets impairment charge and costs
related to the 2009 amendments to our credit agreement and swap transaction, as discussed below
on page 38. This presentation facilitates a meaningful comparison of our operating results for
the years ended December 31, 2009, 2008 and 2007. We presented adjusted EBITDA in 2009 and 2008
to exclude the non-cash impairment charges of $38.2 million and $35.2 million, respectively, as
we believe this was a result of the current economic environment and not indicative of our
operations. The exclusion of the goodwill impairment charges and long-lived assets impairment
charge, and costs related to the 2009 amendments to our credit agreement and swap transaction to
arrive at adjusted EBITDA is consistent with the definition of adjusted EBITDA in the amendment
(the “Amended Credit Agreement”) to our credit agreement, therefore we believe this information
is useful to investors in assessing our ability to meet our debt covenants.
25
The following is a reconciliation of cash flows provided by operating activities to EBIT,
EBITDA, and net (loss) income attributable to ARC (amounts in thousands):
| |
|
|
|
|
|
|
|
|
|
|
|
|
| |
|
Fiscal Year Ended |
|
| |
|
December 31, |
|
| |
|
2009 |
|
|
2008 |
|
|
2007 |
|
|
|
|
|
|
|
|
|
|
|
|
|
|
Cash flows provided by operating activities |
|
$ |
97,425 |
|
|
$ |
127,266 |
|
|
$ |
101,386 |
|
Changes in operating assets and liabilities |
|
|
(19,919 |
) |
|
|
(4,829 |
) |
|
|
13,856 |
|
Non-cash (expenses) income, including
depreciation and amortization |
|
|
(92,495 |
) |
|
|
(85,624 |
) |
|
|
(46,105 |
) |
Income tax provision |
|
|
3,018 |
|
|
|
21,200 |
|
|
|
42,203 |
|
Interest expense, net |
|
|
25,781 |
|
|
|
25,890 |
|
|
|
24,373 |
|
Loss on early extinguishment of debt |
|
|
— |
|
|
|
— |
|
|
|
1,327 |
|
Net loss (income) attributable to the noncontrolling interest |
|
|
104 |
|
|
|
(59 |
) |
|
|
— |
|
|
|
|
|
|
|
|
|
|
|
| |
EBIT |
|
|
13,914 |
|
|
|
83,844 |
|
|
|
137,040 |
|
Depreciation and amortization |
|
|
49,543 |
|
|
|
50,121 |
|
|
|
39,445 |
|
|
|
|
|
|
|
|
|
|
|
|
|
|
|
|
EBITDA |
|
|
63,457 |
|
|
|
133,965 |
|
|
|
176,485 |
|
Interest expense |
|
|
(25,781 |
) |
|
|
(25,890 |
) |
|
|
(24,373 |
) |
Loss on early extinguishment of debt |
|
|
— |
|
|
|
— |
|
|
|
(1,327 |
) |
Income tax provision |
|
|
(3,018 |
) |
|
|
(21,200 |
) |
|
|
(42,203 |
) |
Depreciation and amortization |
|
|
(49,543 |
) |
|
|
(50,121 |
) |
|
|
(39,445 |
) |
|
|
|
|
|
|
|
|
|
|
| |
Net (loss) income attributable to American Reprographics Company |
|
$ |
(14,885 |
) |
|
$ |
36,754 |
|
|
$ |
69,137 |
|
|
|
|
|
|
|
|
|
|
|
The following is a reconciliation of net (loss) income attributable to ARC to EBIT, EBITDA
and adjusted EBITDA (amounts in thousands):
| |
|
|
|
|
|
|
|
|
|
|
|
|
| |
|
Fiscal Year Ended |
|
| |
|
December 31, |
|
| |
|
2009 |
|
|
2008 |
|
|
2007 |
|
| |
Net (loss) income attributable to
American Reprographics Company |
|
$ |
(14,885 |
) |
|
$ |
36,754 |
|
|
$ |
69,137 |
|
Interest expense, net |
|
|
25,781 |
|
|
|
25,890 |
|
|
|
24,373 |
|
Loss on early extinguishment of debt |
|
|
— |
|
|
|
— |
|
|
|
1,327 |
|
Income tax provision |
|
|
3,018 |
|
|
|
21,200 |
|
|
|
42,203 |
|
|
|
|
|
|
|
|
|
|
|
| |
EBIT |
|
|
13,914 |
|
|
|
83,844 |
|
|
|
137,040 |
|
Depreciation and amortization |
|
|
49,543 |
|
|
|
50,121 |
|
|
|
39,445 |
|
|
|
|
|
|
|
|
|
|
|
| |
EBITDA |
|
|
63,457 |
|
|
|
133,965 |
|
|
|
176,485 |
|
Special items: |
|
|
|
|
|
|
|
|
|
|
|
|
Goodwill impairment |
|
|
37,382 |
|
|
|
35,154 |
|
|
|
— |
|
Impairment of long-lived assets |
|
|
781 |
|
|
|
— |
|
|
|
— |
|
|
|
|
|
|
|
|
|
|
|
Adjusted EBITDA |
|
$ |
101,620 |
|
|
$ |
169,119 |
|
|
$ |
176,485 |
|
|
|
|
|
|
|
|
|
|
|
26
The following is a reconciliation of our net (loss) income margin to EBIT margin, EBITDA
margin and Adjusted EBITDA margin:
| |
|
|
|
|
|
|
|
|
|
|
|
|
| |
|
Fiscal Year Ended |
|
| |
|
December 31, |
|
| |
|
2009 (1) |
|
|
2008 (1) |
|
|
2007 (1) |
|
|
|
|
|
|
|
|
|
|
|
|
|
|
Net (loss) income margin |
|
|
(3.0 |
)% |
|
|
5.2 |
% |
|
|
10.0 |
% |
Interest expense, net |
|
|
5.1 |
% |
|
|
3.7 |
% |
|
|
3.5 |
% |
Loss on early extinguishment
of debt |
|
|
0.0 |
% |
|
|
0.0 |
% |
|
|
0.2 |
% |
Income tax provision |
|
|
0.6 |
% |
|
|
3.0 |
% |
|
|
6.1 |
% |
|
|
|
|
|
|
|
|
|
|
|
|
|
|
|
EBIT margin |
|
|
2.8 |
% |
|
|
12.0 |
% |
|
|
19.9 |
% |
Depreciation and amortization |
|
|
9.9 |
% |
|
|
7.2 |
% |
|
|
5.7 |
% |
|
|
|
|
|
|
|
|
|
|
|
|
|
|
|
EBITDA margin |
|
|
12.7 |
% |
|
|
19.1 |
% |
|
|
25.6 |
% |
Special items: |
|
|
|
|
|
|
|
|
|
|
|
|
Goodwill impairment |
|
|
7.5 |
% |
|
|
5.0 |
% |
|
|
0.0 |
% |
Impairment of long-lived assets |
|
|
0.2 |
% |
|
|
0.0 |
% |
|
|
0.0 |
% |
|
|
|
|
|
|
|
|
|
|
Adjusted EBITDA margin |
|
|
20.3 |
% |
|
|
24.1 |
% |
|
|
25.6 |
% |
|
|
|
|
|
|
|
|
|
|
| |
|
|
| (1) |
|
column does not foot due to rounding |
The following is a reconciliation of net (loss) income attributable to ARC to adjusted net
income attributable to ARC and (loss) earnings per share to adjusted earnings per share (amounts
in thousands, except share and per share data):
| |
|
|
|
|
|
|
|
|
|
|
|
|
| |
|
Fiscal Year Ended |
|
| |
|
December 31, |
|
| |
|
2009 |
|
|
2008 |
|
|
2007 |
|
|
|
|
|
|
|
|
|
|
|
|
|
|
Net (loss) income attributable to American
Reprographics Company |
|
$ |
(14,885 |
) |
|
$ |
36,754 |
|
|
$ |
69,137 |
|
Litigation gain |
|
|
— |
|
|
|
— |
|
|
|
(2,897 |
) |
Interest income due to litigation gain |
|
|
— |
|
|
|
— |
|
|
|
(418 |
) |
Goodwill impairment |
|
|
37,382 |
|
|
|
35,154 |
|
|
|
— |
|
Impairment of long-lived assets |
|
|
781 |
|
|
|
— |
|
|
|
— |
|
Amended Credit Agreement and Swap Transaction costs |
|
|
2,632 |
|
|
|
— |
|
|
|
— |
|
Income tax (benefit) provision, related to items above |
|
|
(8,748 |
) |
|
|
(12,932 |
) |
|
|
1,260 |
|
|
|
|
|
|
|
|
|
|
|
Adjusted net
income attributable to ARC |
|
$ |
17,162 |
|
|
$ |
58,976 |
|
|
$ |
67,082 |
|
|
|
|
|
|
|
|
|
|
|
|
|
|
|
|
|
|
|
|
|
|
|
|
(Loss) Earnings Per Share (Actual): |
|
|
|
|
|
|
|
|
|
|
|
|
Basic |
|
$ |
(0.33 |
) |
|
$ |
0.82 |
|
|
$ |
1.52 |
|
|
|
|
|
|
|
|
|
|
|
Diluted |
|
$ |
(0.33 |
) |
|
$ |
0.81 |
|
|
$ |
1.51 |
|
|
|
|
|
|
|
|
|
|
|
|
|
|
|
|
|
|
|
|
|
|
|
|
Earnings Per Share (Adjusted): |
|
|
|
|
|
|
|
|
|
|
|
|
Basic |
|
$ |
0.38 |
|
|
$ |
1.31 |
|
|
$ |
1.48 |
|
|
|
|
|
|
|
|
|
|
|
Diluted |
|
$ |
0.38 |
|
|
$ |
1.30 |
|
|
$ |
1.46 |
|
|
|
|
|
|
|
|
|
|
|
|
|
|
|
|
|
|
|
|
|
|
|
|
Weighted
average common shares Outstanding (Adjusted): |
|
|
|
|
|
|
|
|
|
|
|
|
Basic |
|
|
45,123,110 |
|
|
|
45,060,482 |
|
|
|
45,421,498 |
|
Diluted |
|
|
45,266,310 |
|
|
|
45,398,086 |
|
|
|
45,829,010 |
|
27
Results of Operations
The following table provides information on the percentages of certain items of selected
financial data compared to net sales for the periods indicated:
| |
|
|
|
|
|
|
|
|
|
|
|
|
| |
|
As a Percentage of Net Sales |
|
| |
|
Fiscal Year Ended December 31, |
|
| |
|
2009 (1) |
|
|
2008 (1) |
|
|
2007 (1) |
|
|
|
|
|
|
Net sales |
|
|
100.0 |
% |
|
|
100.0 |
% |
|
|
100.0 |
% |
Cost of sales |
|
|
64.5 |
|
|
|
59.3 |
|
|
|
58.3 |
|
|
|
|
|
|
|
|
|
|
|
Gross profit |
|
|
35.5 |
|
|
|
40.7 |
|
|
|
41.7 |
|
Selling, general and administrative expenses |
|
|
22.9 |
|
|
|
22.1 |
|
|
|
20.9 |
|
|
|
|
|
|
|
|
|
|
|
|
|
|
Litigation gain |
|
|
0.0 |
|
|
|
0.0 |
|
|
|
(0.4 |
) |
Amortization of intangibles |
|
|
2.3 |
|
|
|
1.7 |
|
|
|
1.3 |
|
Goodwill impairment |
|
|
7.5 |
|
|
|
5.0 |
|
|
|
0.0 |
|
Impairment of long-lived assets |
|
|
0.2 |
|
|
|
0.0 |
|
|
|
0.0 |
|
|
|
|
|
|
|
|
|
|
|
Income from operations |
|
|
2.7 |
|
|
|
11.9 |
|
|
|
19.9 |
|
Other income, net |
|
|
(0.0 |
) |
|
|
(0.1 |
) |
|
|
0.0 |
|
Interest expense, net |
|
|
5.1 |
|
|
|
3.7 |
|
|
|
3.5 |
|
Loss on early extinguishment of debt |
|
|
0.0 |
|
|
|
0.0 |
|
|
|
0.2 |
|
|
|
|
|
|
|
|
|
|
|
(Loss) income before income tax provision |
|
|
(2.4 |
) |
|
|
8.3 |
|
|
|
16.2 |
|
Income tax provision |
|
|
0.6 |
|
|
|
3.0 |
|
|
|
6.1 |
|
|
|
|
|
|
|
|
|
|
|
Net (loss) income |
|
|
(3.0 |
) |
|
|
5.3 |
|
|
|
10.0 |
% |
Loss attributable to the noncontrolling
interest |
|
|
0.0 |
|
|
|
0.0 |
|
|
|
0.0 |
|
|
|
|
|
|
|
|
|
|
|
Net (loss) income attributable to ARC |
|
|
(3.0 |
)% |
|
|
5.2 |
% |
|
|
10.0 |
% |
|
|
|
|
|
|
|
|
|
|
| |
|
|
| (1) |
|
column does not foot due to rounding |
Year Ended December 31, 2009 Compared to Year Ended December 31, 2008
| |
|
|
|
|
|
|
|
|
|
|
|
|
|
|
|
|
| |
|
Fiscal Year Ended |
|
|
|
|
| |
|
December 31, |
|
|
Increase (decrease) |
|
| |
|
2009 (1) |
|
|
2008 |
|
|
(In dollars) |
|
|
(Percent) |
|
| |
|
(In millions) |
|
|
|
|
|
|
|
|
|
|
|
|
|
|
|
|
|
|
Reprographics services |
|
$ |
350.5 |
|
|
$ |
518.1 |
|
|
$ |
(167.6 |
) |
|
|
-32.3 |
% |
Facilities management |
|
|
97.4 |
|
|
|
121.0 |
|
|
|
(23.6 |
) |
|
|
-19.5 |
% |
Equipment and supplies sales |
|
|
53.7 |
|
|
|
61.9 |
|
|
|
(8.2 |
) |
|
|
-13.2 |
% |
|
|
|
|
|
|
|
|
|
|
|
|
|
|
Total net sales |
|
$ |
501.5 |
|
|
$ |
701.0 |
|
|
$ |
(199.5 |
) |
|
|
-28.5 |
% |
|
|
|
|
|
|
|
|
|
|
|
|
|
|
|
|
|
Gross profit |
|
$ |
178.2 |
|
|
$ |
285.3 |
|
|
$ |
(107.1 |
) |
|
|
(37.5 |
)% |
Selling, general and administrative
expenses |
|
$ |
115.0 |
|
|
$ |
154.7 |
|
|
$ |
(39.7 |
) |
|
|
(25.7 |
)% |
Amortization of intangible assets |
|
$ |
11.4 |
|
|
$ |
12.0 |
|
|
$ |
(0.6 |
) |
|
|
(5.0 |
)% |
Goodwill impairment |
|
$ |
37.4 |
|
|
$ |
35.2 |
|
|
$ |
2.2 |
|
|
|
6.3 |
% |
Impairment of long-lived assets |
|
$ |
0.8 |
|
|
$ |
— |
|
|
$ |
0.8 |
|
|
|
100.0 |
% |
Interest expense, net |
|
$ |
25.8 |
|
|
$ |
25.9 |
|
|
$ |
(0.1 |
) |
|
|
(0.4 |
)% |
Income taxes provision |
|
$ |
3.0 |
|
|
$ |
21.2 |
|
|
$ |
(18.2 |
) |
|
|
(85.8 |
)% |
Net (loss) income attributable to ARC |
|
$ |
(14.9 |
) |
|
$ |
36.8 |
|
|
$ |
(51.7 |
) |
|
|
(140.5 |
)% |
EBITDA |
|
$ |
63.5 |
|
|
$ |
134.0 |
|
|
$ |
(70.5 |
) |
|
|
(52.6 |
)% |
| |
|
|
| (1) |
|
column does not foot due to rounding |
28
Net Sales
Net sales in 2009 decreased by 28.5%, the decrease in net sales was primarily due to
overall weakness in the global economy, and a significant slowdown in the construction market
and AEC industry. In 2009, sales were favorably impacted by sales growth of approximately 2%
from our standalone acquisitions completed since 2008.
Reprographics services. Net sales decreased by $167.6 million or 32.3% in 2009 compared to
2008.
Overall reprographics services sales nationwide were negatively affected by the recession
in the global economy and slow down in the construction market and AEC industry. The revenue
category that was most affected was large-format black and white printing, as this revenue
category is more closely tied to non-residential and residential construction. Large-format
black and white printing revenues represented approximately 40% of reprographics services in
2009; large-format black and white printing revenues decreased by approximately 41% in 2009
compared to 2008.
While most of our customers in the AEC industry still prefer to receive documents in
hardcopy, paper format, we have seen an increase in our digital service revenue as a percentage
of total sales. This increase is presumably due to the greater efficiency that digital document
workflows bring to our customers’ businesses, and also due to greater consistency in the way
that we charge for these services as they become more widely accepted throughout the
construction industry. As was the case with our overall sales, digital service revenue was also
negatively affected by current market conditions. During 2009, digital service revenue decreased
by $11.4 million or 21.1%, compared to 2008, but as a percentage of our overall sales it
increased to 8.5% from 7.7% in 2009 compared to 2008.
Facilities management. On-site, or FM sales in 2009 compared to 2008, decreased by
$23.6 million or 19.5%. FM revenue is derived from a single cost per square foot of printed
material, similar to our reprographics services revenue. As convenience and speed continue to
characterize our customers’ needs, and as printing equipment continues to become smaller and
more affordable, the trend of placing equipment, and sometimes staff, in an architectural studio
or construction company office remains strong despite a difficult market, as evidenced by a net
increase of approximately 100 facilities management accounts during 2009, bringing our total FM
accounts to approximately 5,700 as of December 31, 2009. By placing such equipment on-site and
billing on a per use and per project basis, the invoice continues to be issued by us, just as if
the work was produced in one of our centralized production facilities. The resulting benefit is
the convenience of on-site production with a pass-through or reimbursable cost of business that
many customers continue to find attractive. Despite the increase in FM accounts, sales decreased
as the volume of prints at FM locations significantly declined due to the current economic
conditions described above. As a percentage of total sales, FM sales has increased to 19.4% in
2009, compared to 17.3% in 2008.
Equipment and supplies sales. Equipment and supplies sales decreased by $8.2 million or
13.2% over the same period in 2008. During 2009, the decrease in equipment and supplies sales
was due primarily to current economic conditions. This trend was partially offset by the
operations of UDS, which commenced operations during the third quarter of 2008 and the
operations of Shanghai UNIS Document Printing Co., Ltd., a wholly-owned subsidiary of UDS which
acquired the assets of Shanghai Light Business Machines Co., Ltd. in July 2009. To date, the
Chinese market has shown a preference for owning reprographics equipment as opposed to acquiring
it via an on-site services or FM arrangement. Chinese operations had sales of equipment and
supplies of $13.1 million in 2009. Excluding the impact of acquisitions and continuing equipment
and supplies sales in China, we do not anticipate growth in equipment and supplies sales in the
U.S., as we are placing more focus on facilities management sales programs.
Gross Profit
During the 12 months ended December 31, 2009, gross profit and gross profit margin
decreased to $178.2 million or 35.5%, compared to $285.3 million or 40.7% during the same period
in 2008, on a sales decline of $199.5 million.
The primary driver of the decrease in gross margins was the absorption of overhead
resulting from the decrease in sales. Overhead as a percentage of sales was 440 basis points
higher in 2009, as compared to 2008, of which depreciation and facility rental were the primary
components and accounted for 320 basis points. The decrease in margins was also attributable to
an increase in material costs as a percentage of sales of 160 basis points in 2009, as compared
to 2008. This was primarily due to an increase in lower margin equipment and supplies sales as a
percentage of total sales due to the performance of UDS. Specifically, lower margin equipment
and supplies sales comprised 10.7% of total sales in 2009, compared to 8.8% in 2008. The
decrease in margins was partially offset by a favorable decrease as a percentage of sales of
direct labor of 80 basis points in 2009, as compared to 2008, that was driven by cost cutting
initiatives that were implemented in 2009 in response to lower sales.
29
Selling, General and Administrative Expenses
In 2009, selling, general and administrative expenses decreased by $39.7 million or 25.7%
over 2008. The decrease is
primarily due to the decline in sales and the implementation of cost reduction programs
initiated in response to the decline in sales. Specifically, sales personnel compensation
decreased by $10.0 million in 2009, compared to 2008, and general and administrative
compensation decreased by $16.0 million in 2009, compared to 2008. The decrease in sales
compensation, which includes commissions, is primarily attributed to the decline in sales volume
explained above, and the decrease in general and administrative compensation is primarily due to
staff reductions and bonus performance targets not being met. The cost reduction programs have
also resulted in a decrease in professional fees, consulting fees, advertising, and travel
expenses. These expenses have decreased by approximately $5.6 million in 2009, as compared to
2008. Also contributing to the decrease is a $1.9 million decrease in bad debt expense in 2009,
compared to 2008 as a result of improved collections and because the majority of the bad debt
expense related to the deterioration of the residential home building industry was recognized in
2008.
Selling, general and administrative expenses as a percentage of net sales increased from
22.1% in 2008 to 22.9% in 2009 as compared to 2008, primarily due to the significant decline in
sales resulting in unabsorbed administrative costs.
On April 22, 2009, we commenced a stock option exchange program to allow certain of our
employees the opportunity to exchange all or a portion of their eligible outstanding stock
options for an equivalent number of new, replacement options. In connection with the exchange
program, we issued 1,479,250 nonstatutory stock options with an exercise price of $8.20, equal
to the closing price of our common stock on the New York Stock Exchange on May 21, 2009.
Generally, all employees who held options upon expiration of the exchange program, other than
our board members, were eligible to participate in the program. The number of shares of our
common stock subject to outstanding options did not change as a result of the exchange offer.
New options issued as part of the exchange offer are subject to a two-year vesting schedule,
with 50% of the shares subject to an option vesting on the one-year anniversary of the date of
grant of the replacement option, and the remaining 50% of the shares subject to an option
vesting on the second anniversary of the date of grant of the replacement option. The total
incremental cost of the repriced options is approximately $2.4 million of which $0.7 million has
been recognized in our Consolidated Statements of Operations for the twelve months ended
December 31, 2009. For further information see Note 2 “Summary of Significant Accounting
Policies” to our Consolidated Financial Statements.
Amortization of Intangibles
Amortization of intangibles of $11.4 million in 2009 remained consistent with the amount in
prior year due to the fact that acquisition activity and the size of acquisitions decreased
significantly since September 30, 2008. In 2009, we only completed three acquisitions, as
compared to 13 in 2008 and 19 in 2007.
Goodwill Impairment
We assess goodwill at least annually for impairment as of September 30, or more frequently
if events and circumstances indicate that goodwill might be impaired. We concluded that, in the
absence of the annual goodwill impairment test, there were sufficient indicators to require us
to perform a goodwill impairment analysis as of September 30, 2009. The indicators were based on
a combination of factors, including the current economic recession and revised forecasted future
earnings. Goodwill impairment testing is performed at the operating segment (or “reporting
unit”) level. Goodwill is assigned to reporting units at the date the goodwill is initially
recorded. Once goodwill has been assigned to reporting units, it no longer retains its
association with a particular acquisition, and all of the activities within a reporting unit,
whether acquired or internally generated, are available to support the value of the goodwill.
Based on our annual goodwill impairment assessment, we recorded a $37.4 million impairment in
the third quarter of 2009. We continue to assess, among other things, the current economic
recession, reporting unit and consolidated performance against plan and the outlook for our
business and industry in general. A downward trend in one or more of these factors, or a
significant decrease in our stock price, could cause us to reduce the estimated fair value of
our reporting units and recognize a corresponding impairment of the goodwill in connection with
a future goodwill impairment analysis. Given the current economic environment, we have and will
continue to monitor the need to test our intangibles for impairment as required by ASC 805.
Based upon our assessment, we concluded that no goodwill impairment triggering events have
occurred during the fourth quarter of 2009 that would require an additional impairment test.
During the quarter ended December 31, 2008, based on a combination of factors, including the
then current economic environment, and a significant decline in market capitalization, we
concluded that there were sufficient indicators to require us to perform an interim goodwill
impairment analysis as of December 31, 2008. The result of such analysis indicated that eight of
our reporting units, six in the United States, one in Canada, and one in the United Kingdom had a
goodwill impairment. Accordingly, we recorded a pretax, non-cash charge for the year ended
December 31, 2008 to reduce the carrying value of goodwill by $35.2 million.
See Note 2 “Summary of Significant Accounting Policies” to our Consolidated Financial
Statements for further information.
30
Impairment of Long-Lived Assets
Our operating segments are being negatively impacted by the drop in commercial and
residential construction resulting from
the current economic recession. Before assessing our goodwill for impairment, we evaluated,
the long-lived assets of our operating segments for impairment. Based on this assessment, we
determined that there was an impairment of long-lived assets of our operating segment in the
United Kingdom. Accordingly, we recorded a pretax, non-cash charge in 2009 to reduce the
carrying value of other intangible assets by $0.8 million. See Note 2 “Summary of Significant
Accounting Policies” to our Consolidated Financial Statements for further information.
Other Income
Other income of $0.5 million for the twelve months ended December 31, 2008 was primarily
related to the sale of the Auto Desk sales department of our Imaging Technologies Services
operating segment. In 2009, we have not sold any departments, hence the decrease in other
income.
Interest Expense, Net
Net interest expense was $25.8 million in 2009, compared with $25.9 million in 2008. The
slight decrease is primarily due to our reduction of our principal balances of bank debt,
capital leases and seller notes payable which was mostly offset by additional interest expense
due to the cost of amending our credit facility and interest rate swap transaction in the fourth
quarter of 2009. Our total debt has decreased by over $86.0 million in 2009. Our interest
expense in 2009 includes an $0.8 million expense due to the amendment to our interest rate swap
(“Swap Transaction”) and $1.8 million related to fees to amend our credit facility in the fourth
quarter of 2009. In 2010, we expect to have a higher weighted average interest rate by 200 basis
points over the same period in 2009 due to the increase in our interest rate spread on our first
lien term loan facility.
Income Taxes
Our effective income tax rate in 2009 was primarily impacted by the impairment of goodwill
related to stock acquisitions in prior years. The goodwill and long-lived asset impairment of
$38.2 million resulted in a tax benefit of $7.5 million, a 19.6% benefit. This was due to that
$17.5 million of the impairment charges related to stock basis goodwill, which is not tax
deductible until the stock is disposed of and is treated as a permanent item for financial
reporting purposes. Additionally, $0.6 million of impairment related to goodwill in Canada,
which is not tax deductible for Canadian tax purposes, contributed to the negative impact on our
effective tax rate in 2009.
Barring discrete items and impairments, our effective income tax rate increased to 40.1% in
2009, from 39.0% in 2008. This increase is primarily due to a lower federal tax benefit in
relation to our domestic production activities deduction in 2009 as allowed by Internal Revenue
Code Section 199. The amount of deduction and related tax benefit is directly impacted by our
expected federal taxable income for the fiscal year 2009, which has dropped significantly in
light of the recent decrease in sales and the corresponding pretax income.
Noncontrolling Interest
Net loss attributable to noncontrolling interest represents 35% of the loss attributable to
UDS, our Chinese operations, which commenced operations on August 1, 2008.
Net (Loss) Income Attributable to ARC
Net loss attributable to ARC was $14.9 million in 2009, as compared to net income
attributable to ARC of $36.8 million in 2008. The decrease is primarily due to the decrease in
sales and gross margins, partially offset by the decrease in selling, general and administrative
expenses described above.
EBITDA
EBITDA margin decreased to 12.7% in 2009, as compared to 19.1% in 2008. EBITDA margin in
2009 compared 2008 was negatively impacted primarily due to the decrease in gross profit,
excluding the impact of depreciation, and the increase in selling, general and administrative
expenses as a percentage of sales described above. Excluding the impact of the non-cash
$37.4 million goodwill impairment and $0.8 million long-lived assets impairment charges, our
adjusted EBITDA margin was 20.3% in 2009.
31
Year Ended December 31, 2008 Compared to Year Ended December 31, 2007
| |
|
|
|
|
|
|
|
|
|
|
|
|
|
|
|
|
| |
|
Fiscal Year Ended |
|
|
|
|
| |
|
December 31, |
|
|
Increase (decrease) |
|
| |
|
2008 |
|
|
2007 |
|
|
(In dollars) |
|
|
(Percent) |
|
| |
|
(In millions) |
|
|
|
|
|
|
|
|
|
|
|
|
|
|
|
|
|
|
Reprographics services |
|
$ |
518.1 |
|
|
$ |
513.6 |
|
|
$ |
4.5 |
|
|
|
0.9 |
% |
Facilities management |
|
|
121.0 |
|
|
|
113.8 |
|
|
|
7.2 |
|
|
|
6.3 |
% |
Equipment and supplies sales |
|
|
61.9 |
|
|
|
60.9 |
|
|
|
1.0 |
|
|
|
1.6 |
% |
|
|
|
|
|
|
|
|
|
|
|
|
|
|
Total net sales |
|
$ |
701.0 |
|
|
$ |
688.3 |
|
|
$ |
12.7 |
|
|
|
1.8 |
% |
|
|
|
|
|
|
|
|
|
|
|
|
|
|
|
|
|
Gross profit |
|
$ |
285.3 |
|
|
$ |
287.0 |
|
|
$ |
(1.7 |
) |
|
|
(0.6 |
)% |
Selling, general and administrative expenses |
|
$ |
154.7 |
|
|
$ |
143.8 |
|
|
$ |
10.9 |
|
|
|
7.6 |
% |
Litigation gain |
|
$ |
— |
|
|
$ |
(2.9 |
) |
|
$ |
2.9 |
|
|
|
(100.0 |
)% |
Amortization of intangibles |
|
$ |
12.0 |
|
|
$ |
9.1 |
|
|
$ |
2.9 |
|
|
|
31.9 |
% |
Goodwill impairment |
|
$ |
35.2 |
|
|
$ |
— |
|
|
$ |
35.2 |
|
|
|
100.0 |
% |
Interest expense, net |
|
$ |
25.9 |
|
|
$ |
24.4 |
|
|
$ |
1.5 |
|
|
|
6.1 |
% |
Income taxes provision |
|
$ |
21.2 |
|
|
$ |
42.2 |
|
|
$ |
(21.0 |
) |
|
|
(49.8 |
)% |
Net income attributable to ARC |
|
$ |
36.8 |
|
|
$ |
69.1 |
|
|
$ |
(32.3 |
) |
|
|
(46.7 |
)% |
EBITDA |
|
$ |
134.0 |
|
|
$ |
176.5 |
|
|
$ |
(42.5 |
) |
|
|
(24.1 |
)% |
Net Sales
Net sales in 2008 increased by 1.8%; the increase in net sales was primarily due to two
factors: first, our standalone acquisitions acquired since the beginning of 2007 as they
contributed approximately 9.3% to our sales growth; and second, new sales acquired through our
Global Services (formerly Premier Accounts) program. The increase in sales due to standalone
acquisitions was partially offset by a drop in sales in our existing locations due to overall
weakness in the global economy, and a significant slowdown in the construction market driven by
a lack of commercial credit, especially in the second half of the year.
Reprographics services. Net sales increase of $4.5 million in 2008 compared to 2007 was due
primarily to the expansion of our market share through acquisitions, our Global Services program
and an increase in our digital sales. We acquired 13 businesses in 2008 and acquired 19
businesses in 2007, each with a primary focus on reprographics services. These acquired
businesses added sales from their pre-existing customers to our own, and in some cases, also
allowed us to aggregate regional work from larger clients. Our Global Services program also
added significant incremental sales from Global Services customers in 2008, contributing more
than $8.0 million of revenue, compared to 2007 most of which was for reprographics services.
Overall reprographics services sales nationwide were negatively affected by the economic
recession and slow-down in the construction industry, which partially offset the sales increases
described above. The largest negative contributor affecting reprographics services sales was the
decrease in our Southern California region reprographics services sales of approximately
$21 million, resulting from the significant downturn in residential construction in Southern
California and significant decreases in commercial construction in the area.
While most of our customers in the AEC industry still prefer paper plans, we have seen an
increase in our digital service revenue. This increase is presumably due to the greater
efficiency digital document workflows bring to our customers’ businesses, and also due to
greater consistency in the way that we charge for these services as they become more widely
accepted throughout the construction industry. During 2008, digital services revenue increased
by $11.8 million compared to 2007.
Facilities management. On-site, or facilities management services, posted solid dollar
volume and year-over-year percentage gains. Specifically, sales for the twelve months ended
December 31, 2008, compared to the same period in 2007 increased by $7.2 million or 6.3%. FM
revenue is derived from a single cost per-square-foot of printed material, similar to our
reprographics services sales. As convenience and speed continue to characterize our customers’
needs, and as printing equipment continues to become smaller and more affordable, the trend of
placing equipment (and sometimes staff) in an architectural studio or construction company
office remains strong, which is evidenced by an increase of approximately 1,000 facilities
management accounts in 2008, bringing our total FM accounts to approximately 5,600. By placing
such equipment on-site and billing on a per use and per project basis, the invoice continues to
be issued by us, just as if the work were produced in one of our centralized production
facilities. The resulting benefit is the convenience of on-site production with a pass-through
or reimbursable cost of business that many customers continue to find attractive, particularly
in light of customer cost savings initiatives.
32
Equipment and supplies sales. Equipment and supplies sales increased by $1.0 million or
1.6% over the same period in 2007. The increase in equipment and supplies sales was due
primarily to the commencement of operations of UDS during the third quarter of 2008. UDS had
sales of equipment and supplies of $5.8 million during 2008.
Gross Profit
During the 12 months ended December 31, 2008, gross profit margin decreased to
$285.3 million and was 40.7%, compared to $287.0 million and 41.7% for the same period in 2007,
on sales growth of $12.7 million.
The primary driver of the decrease in gross margins was the absorption of overhead
resulting from the drop in sales, and
acquisitions which carry lower gross margins than existing operating segments.
Specifically, the overhead increase was 115 basis points as a percentage of sales of which
depreciation was the primary component and accounted for 100 of the 115 basis point increase.
Until our typical performance standards can be applied, acquisitions temporarily depress gross
margins, as do new branch openings. The drop in margins was also attributable to unabsorbed
labor costs of approximately 25 basis points due to the drop in sales noted above. The decrease
in gross margins due to overhead and labor were partially offset by a drop in material costs as
a percentage of sales of 40 basis points primarily due to a favorable product mix. Specifically,
higher margin digital sales comprised 7.7% of total sales for 2008 compared to 6.1% for the same
period in 2007.
Selling, General and Administrative Expenses
In 2008, selling, general and administrative expenses increased by $10.9 million or 7.6%
over 2007. The increase is primarily attributable to a $3.7 million increase in bad debt expense
and an increase in our sales volume explained above. Specifically, sales personnel compensation
increased by $1.8 million that accompany the sales growth driven by acquisitions. The increase
in bad debt expense primarily related to the continued deterioration of the residential home
building industry and the recession in the economy. Some of our customers have been slow paying
due to liquidity issues.
Stock-based compensation expense also contributed to the increase in selling, general and
administrative expenses as stock-based compensation increased by $0.8 million primarily due to
stock options granted in April 2008.
Also contributing to the increase in selling, general and administrative expenses was a
$3.3 million favorable settlement of two related lawsuits in the second quarter of 2007.
Excluding costs related to that litigation, which included legal fees and compensation payments
related to the settlement, the settlement returned a $1.7 million benefit to us for the
12 months ended December 31, 2007. For more information on the details of these lawsuits and
settlement, please refer to Note 9 “Commitments and Contingencies” to our Consolidated Financial
Statements included in this report.
As a percentage of net sales, selling, general and administrative expenses increased by 120
basis points in 2008 as compared to 2007 primarily due to the increase in bad debt expense and
the financial benefit in 2007 of the lawsuit settlement described above.
Litigation Gain
In 2006, we accounted for the judgment entered against us in the previously-disclosed Louis
Frey bankruptcy litigation in the United States Bankruptcy Court, Southern District of New York,
by recording a litigation charge of $14 million that included a $11.3 million litigation reserve
($11.1 million in awarded damages, and $0.2 million in preference claims that we paid in 2006),
and interest expense of $2.7 million. We settled and paid this for $10.5 million during the
fourth quarter of 2007 and accordingly recognized a benefit of $3.3 million ($2.9 million
litigation gain, and $0.4 million in interest) in 2007. For more information on the Louis Frey
litigation, please refer to Note 9 “Commitments and Contingencies” to our Consolidated Financial
Statements included in this Annual Report on Form 10-K.
Amortization of Intangibles
Amortization of intangibles increased $2.9 million during 2008, compared to 2007 primarily
due to an increase in identified amortizable intangible assets such as customer relationships
and trade names associated with our 13 business acquisitions completed throughout 2008. Also
contributing to the increase is the full year impact of 2007 acquisitions. The three
acquisitions that had the biggest impact on amortization expense were the acquisition of MBC
Precision Imaging in March 2007, the acquisition of Imaging Technologies Services in April 2007,
and the acquisition of NGI USA in December 2007.
33
Goodwill Impairment
We assess goodwill at least annually for impairment as of September 30th or more frequently
if events and circumstances indicate that goodwill might be impaired. During the quarter ended
December 31, 2008, based on a combination of factors, including the then current economic
environment, and a significant decline in our market capitalization, we concluded that there
were sufficient indicators to require us to perform an interim goodwill impairment analysis as
of December 31, 2008. The results of our analysis indicated that eight of our reporting units,
six in the United States, one in Canada, and one in the United Kingdom had a goodwill
impairment. Accordingly, we recorded a pretax, non-cash charge for the year ended December 31,
2008 to reduce the carrying value of goodwill by $35.2 million.
Other Income
The biggest contributor to other income of $0.5 million for the 12 months ended
December 31, 2008 was the sale of the Autodesk sales department of our Imaging Technologies
Services operating segment. The Autodesk sales department was sold in
February of 2008 for $0.4 million and resulted in a gain of $0.2 million.
Interest Expense
Net interest expense was $25.9 million in 2008 compared with $24.4 million in 2007, an
increase of $1.5 million or 6.1% year-over-year. The net interest expense increase is primarily
due to a weighted average increase of approximately $57 million in our interest bearing debt
comprised of capital leases for our operations and bank debt and subordinated notes payable for
business acquisitions which was partially offset by a decrease of approximately 100 basis points
in our effective annual interest rate primarily due to our refinancing of our $350 million
credit facility in December 2007 and related interest rate hedge.
Loss on the extinguishment of debt
In 2008, we had no loss on the extinguishment of debt. In December 2007, we entered into a
new Credit and Guaranty Agreement and extinguished the debt under our previous credit facility.
Accordingly, we wrote off unamortized deferred financing costs of $0.9 million and recognized a
$0.4 million expense resulting from the termination of an interest rate collar associated with
the extinguished debt.
Noncontrolling Interest
Net loss attributable to noncontrolling interest represents 35% of the loss attributable to
UDS, our Chinese operations, which commenced operations on August 1, 2008.
Income Taxes
Our effective income tax rate decreased to 36.6% in 2008 from 37.9% in 2007. The decrease
is primarily due to a discrete item of $1.5 million related to federal and state income tax
credits recognized with respect to hiring employees and the purchase and lease of tangible
assets in certain qualified enterprise zones in 2007, 2006 and 2005. During the second half of
2008, we researched and determined that we qualified for these credits.
Net Income Attributable to ARC
Net income decreased by $32.3 million to $36.8 million in 2008 compared to $69.1 million in
2007 primarily due to the $35.2 million goodwill impairment charge noted above, the decrease in
gross margins, the increase in selling, general and administrative expenses in 2008, and the
litigation settlement in 2007. The litigation settlement, net of taxes, resulted in a positive
$2.1 million impact on 2007 net income.
EBITDA
Our EBITDA margin decreased to 19.1% in 2008 compared to 25.6% in 2007 primarily due to the
goodwill charge, the increase in cost of sales and selling, general and administrative expenses
explained above and was also affected by the litigation gain from the Louis Frey litigation
settlement in 2007. Excluding the impact of the non-cash goodwill impairment charge of
$35.2 million, our adjusted EBITDA margin was 24.1%.
Quarterly Results of Operations
The following table sets forth certain quarterly financial data for the eight quarters
ended December 31, 2009. This quarterly information has been prepared on the same basis as the
annual financial statements and, in our opinion, reflects all adjustments, necessary for a fair
presentation of the information for periods presented. Operating results for any quarter are not
necessarily indicative of results for any future period.
34
| |
|
|
|
|
|
|
|
|
|
|
|
|
|
|
|
|
|
|
|
|
|
|
|
|
|
|
|
|
|
|
|
|
| |
|
Quarter Ended |
|
| |
|
Mar. 31, |
|
|
June 30, |
|
|
Sept. 30, |
|
|
Dec. 31, |
|
|
Mar. 31, |
|
|
June
30, |
|
|
Sept. 30, |
|
|
Dec. 31, |
|
| |
|
2009 |
|
|
2008 |
|
Reprographics
services |
|
$ |
99,769 |
|
|
$ |
92,905 |
|
|
$ |
81,989 |
|
|
$ |
75,828 |
|
|
$ |
142,496 |
|
|
$ |
139,211 |
|
|
$ |
127,455 |
|
|
$ |
108,900 |
|
Facilities
management |
|
|
26,865 |
|
|
|
24,898 |
|
|
|
23,395 |
|
|
|
22,243 |
|
|
|
29,551 |
|
|
|
31,209 |
|
|
|
30,977 |
|
|
|
29,246 |
|
Equipment and
supplies sales |
|
|
12,849 |
|
|
|
13,251 |
|
|
|
13,966 |
|
|
|
13,591 |
|
|
|
15,396 |
|
|
|
14,521 |
|
|
|
16,153 |
|
|
|
15,872 |
|
|
|
|
|
|
|
|
|
|
|
|
|
|
|
|
|
|
|
|
|
|
|
|
|
|
Total net sales |
|
$ |
139,483 |
|
|
$ |
131,054 |
|
|
$ |
119,350 |
|
|
$ |
111,662 |
|
|
$ |
187,443 |
|
|
$ |
184,941 |
|
|
$ |
174,585 |
|
|
$ |
154,018 |
|
Quarterly sales as a
% of annual sales |
|
|
27.8 |
% |
|
|
26.1 |
% |
|
|
23.8 |
% |
|
|
22.3 |
% |
|
|
26.7 |
% |
|
|
26.4 |
% |
|
|
24.9 |
% |
|
|
22.0 |
% |
Gross profit |
|
$ |
51,979 |
|
|
$ |
49,155 |
|
|
$ |
41,131 |
|
|
$ |
35,924 |
|
|
$ |
79,603 |
|
|
$ |
79,088 |
|
|
$ |
70,015 |
|
|
$ |
56,566 |
|
Income (loss) from
operations |
|
$ |
18,030 |
|
|
$ |
16,202 |
|
|
$ |
(27,139 |
) |
|
$ |
6,546 |
|
|
$ |
36,894 |
|
|
$ |
36,776 |
|
|
$ |
28,228 |
|
|
$ |
(18,512 |
) |
EBITDA |
|
$ |
30,816 |
|
|
$ |
28,990 |
|
|
$ |
(14,885 |
) |
|
$ |
18,536 |
|
|
$ |
49,213 |
|
|
$ |
49,035 |
|
|
$ |
41,136 |
|
|
$ |
(5,419 |
) |
Net income (loss)
attributable to
ARC |
|
$ |
7,547 |
|
|
$ |
6,307 |
|
|
$ |
(28,164 |
) |
|
$ |
(575 |
) |
|
$ |
18,498 |
|
|
$ |
18,876 |
|
|
$ |
15,067 |
|
|
$ |
(15,687 |
) |
The following is a reconciliation of EBITDA to net income for each respective quarter.
| |
|
|
|
|
|
|
|
|
|
|
|
|
|
|
|
|
|
|
|
|
|
|
|
|
|
|
|
|
|
|
|
|
| |
|
Quarter Ended |
|
| |
|
Mar. 31, |
|
|
June 30, |
|
|
Sept. 30, |
|
|
Dec. 31, |
|
|
Mar. 31, |
|
|
June 30, |
|
|
Sept. 30, |
|
|
Dec. 31, |
|
| |
|
2009 |
|
|
2008 |
|
EBITDA |
|
$ |
30,816 |
|
|
$ |
28,990 |
|
|
$ |
(14,885 |
) |
|
$ |
18,536 |
|
|
$ |
49,213 |
|
|
$ |
49,035 |
|
|
$ |
41,136 |
|
|
$ |
(5,419 |
) |
Interest expense, net |
|
|
(5,796 |
) |
|
|
(5,836 |
) |
|
|
(6,428 |
) |
|
|
(7,721 |
) |
|
|
(7,146 |
) |
|
|
(6,559 |
) |
|
|
(6,180 |
) |
|
|
(6,005 |
) |
Income tax (provision)
benefit |
|
|
(4,758 |
) |
|
|
(4,096 |
) |
|
|
5,334 |
|
|
|
502 |
|
|
|
(11,452 |
) |
|
|
(11,384 |
) |
|
|
(7,041 |
) |
|
|
8,677 |
|
Depreciation and
amortization |
|
|
(12,715 |
) |
|
|
(12,751 |
) |
|
|
(12,185 |
) |
|
|
(11,892 |
) |
|
|
(12,117 |
) |
|
|
(12,216 |
) |
|
|
(12,848 |
) |
|
|
(12,940 |
) |
|
|
|
|
|
|
|
|
|
|
|
|
|
|
|
|
|
|
|
|
|
|
|
|
|
Net income (loss)
attributable to ARC |
|
$ |
7,547 |
|
|
$ |
6,307 |
|
|
$ |
(28,164 |
) |
|
$ |
(575 |
) |
|
$ |
18,498 |
|
|
$ |
18,876 |
|
|
$ |
15,067 |
|
|
$ |
(15,687 |
) |
|
|
|
|
|
|
|
|
|
|
|
|
|
|
|
|
|
|
|
|
|
|
|
|
|
We believe that quarterly revenues and operating results may vary significantly in the
future and that quarter-to-quarter comparisons of our results of operations are not necessarily
meaningful and should not be relied upon as indications of future performance. In addition, our
quarterly operating results are typically affected by seasonal factors, primarily the number of
working days in a quarter. Historically, our fourth quarter is the slowest, reflecting the
slowdown in construction activity during the holiday season. We recorded a goodwill impairment
in the amount of $37.4 million, and $35.2 million, during the quarter ended September 30, 2009,
and December 31, 2008, respectively.
Impact of Inflation
Inflation has not had a significant effect on our operations. Price increases for raw
materials, such as paper, typically have been, and we expect will continue to be, passed on to
customers in the ordinary course of business.
Liquidity and Capital Resources
Our principal sources of cash have been operations and borrowings under our bank credit
facilities. Our historical uses of cash have been for acquisitions of reprographics businesses,
payment of principal and interest on outstanding debt obligations, and capital expenditures.
Supplemental information pertaining to our historical sources and uses of cash is presented as
follows and should be read in conjunction with our Consolidated Statements of Cash Flows and
notes thereto included elsewhere in this report.
35
| |
|
|
|
|
|
|
|
|
|
|
|
|
| |
|
Year Ended December 31, |
|
| |
|
2009 |
|
|
2008 |
|
|
2007 |
|
|
|
|
|
|
|
|
|
|
|
|
|
|
Net cash provided by operating activities |
|
$ |
97,425 |
|
|
$ |
127,266 |
|
|
$ |
101,386 |
|
|
|
|
|
|
|
|
|
|
|
Net cash used in investing activities |
|
$ |
(9,349 |
) |
|
$ |
(30,807 |
) |
|
$ |
(132,688 |
) |
|
|
|
|
|
|
|
|
|
|
Net cash (used in) provided by financing
activities |
|
$ |
(105,332 |
) |
|
$ |
(74,334 |
) |
|
$ |
44,353 |
|
|
|
|
|
|
|
|
|
|
|
Operating Activities
Net cash provided by operating activities for the year ended December 31, 2009 was
primarily driven by sales, and net profit generated from these sales, excluding depreciation and
the goodwill impairment charge. The overall decrease in cash flows from operations in 2009
compared to 2008 was due to the decline in sales and corresponding EBITDA. Our strong cash flows
from operations in 2009, despite the decrease in profitability, was partially due to improved
accounts receivable collection efforts. As evidence of our improved collection efforts, our days
sales outstanding decreased to 43 days as of December 31, 2009, as compared to 45 days as of
December 31, 2008. Also contributing to the strong cash generation in 2009 is the fact that
higher sales in the fourth quarter of 2008, as compared to the sales trend in 2009, were
partially collected in 2009. With the downturn in the general economy, we will continue to focus
on our accounts receivable collections. If the recent negative sales trends continue throughout
2010, this will significantly impact our cash flows from operations in the future. Additionally,
the utilization of $3.6 million of prepaid taxes contributed to the cash flows from operations.
Net cash provided by operating activities for the year ended December 31, 2008 was
primarily related to adjusted net income of $59.0 million, depreciation and amortization of
$50.1 million and a change in accounts receivable of $21.6 million. Our cash flows from
operations are mainly driven by sales and net profit generated from these sales. Our increase in
cash flows from operations in 2008 compared to the same period in 2007 was mainly due to two
factors; improved accounts receivable collections, and in the fourth quarter of 2007 we had a
$10.5 million cash payment related to the settlement of the previously disclosed Louis Frey
litigation. As evidence of our improved collection efforts, our days sales outstanding of
45 days as of December 31, 2008 reflect a five day improvement, as compared to 50 days as of
December 31, 2007. The accounts receivable cash inflow from operating activities in 2008 was
positively affected by strong sales in the fourth quarter of 2007, which were collected in 2008.
Net cash provided by operating activities for the year ended December 31, 2007, primarily
related to net income of $69.1 million and depreciation and amortization of $39.4 million. Our
cash flows from operations are mainly driven by sales and net profit generated from these sales.
The cash flows from operating activities was partially offset by the $10.5 million cash payment
in the fourth quarter related to the settlement of the previously disclosed Louis Frey
litigation.
Investing Activities
Net cash used in investing activities primarily related to capital expenditures and
acquisition of businesses. Payments for businesses acquired, net of cash acquired and including
other cash payments and earnout payments associated with the acquisitions, amounted to
$3.5 million, $23.9 million, and $132.7 million during the years ended December 31, 2009, 2008,
and 2007, respectively. The decrease is due to the significant decrease in acquisition activity
in 2009 that we expect to continue in the near future and fewer earnout payments made in 2009.
We incurred capital expenditures totaling $7.5 million, $9.0 million, and $8.3 million during
the years ended December 31, 2009, 2008, and 2007, respectively. Other cash flows from investing
activities of $1.7 million, $1.2 million, and $0.4 million during the years ended December 31,
2009, 2008, and 2007, respectively, are primarily due to cash received from the sale of
property, and disposal of fixed assets. Our restricted cash inflow of $1.0 million in 2008
related to the receipt of an escrow account established in connection with the acquisition of a
business. Our restricted cash inflow of $7.9 million in 2007 related to the settlement of the
Louis Frey litigation in the fourth quarter of 2007. Cash used in investing activities will vary
depending on the timing and the size of acquisitions. Funds required to finance our business
expansion will come from operating cash flows and additional borrowings.
Financing Activities
Net cash of $105.3 million used in financing activities during the 12 months ended December
31, 2009, primarily relates to scheduled payments of $59 million on our debt agreements and
capital leases, a $35.0 million early paydown on our term loan facility, and approximately
$11 million in early paydowns of capital lease obligations. Net cash of $74.3 million used in
financing activities during the 12 months ended December 31, 2008, primarily relates to
scheduled payments of $51.9 million on our debt agreements and capital leases and a $22 million
pay down on our revolving credit facility. Net cash provided by financing activities in 2007
primarily related to net borrowing of $22 million on our existing revolving credit facility and
a $50 million borrowing from our term loan facility in order to facilitate the consummation of
certain acquisitions. We used
proceeds under the credit agreement entered into in December 2007 to prepay in full all
principal and interest payable under the then existing Second Amended and Restated Credit and
Guaranty Agreement dated as of December 21, 2005. The proceeds from this borrowing were offset
by scheduled payments of $19.2 million on capital lease obligations and $7.7 million used to
repurchase our Company stock.
36
Our cash position, working capital, and debt obligations as of December 31, 2009, 2008, and
2007 are shown below and should be read in conjunction with our Consolidated Balance Sheets and
notes thereto elsewhere in this report.
| |
|
|
|
|
|
|
|
|
|
|
|
|
| |
|
December 31, |
|
| |
|
2009 |
|
|
2008 |
|
|
2007 |
|
Cash and cash equivalents |
|
$ |
29,377 |
|
|
$ |
46,542 |
|
|
$ |
24,802 |
|
Working capital |
|
$ |
(3,739 |
) |
|
$ |
29,798 |
|
|
$ |
4,695 |
|
|
|
|
|
|
|
|
|
|
|
|
|
|
Borrowings from senior secured
credit facilities |
|
$ |
205,625 |
|
|
$ |
261,250 |
|
|
$ |
297,000 |
|
Other debt obligations |
|
|
68,606 |
|
|
|
99,790 |
|
|
|
93,267 |
|
|
|
|
|
|
|
|
|
|
|
Total debt obligations |
|
$ |
274,231 |
|
|
$ |
361,040 |
|
|
$ |
390,267 |
|
|
|
|
|
|
|
|
|
|
|
The decrease of $33.5 million in working capital in 2009 was primarily due $17.2 million
net cash decrease due to funds used for term loan facility paydown of $35.0 million and a
$23.3 million reduction in accounts receivable, partially offset by a $5.8 million decrease in
the current portion of capital leases. To manage our working capital, we focus on our number of
days sales outstanding and monitor the aging of our accounts receivable, as receivables are the
most significant element of our working capital.
We believe that our current cash balance of $29.4 million and additional cash flows
provided by operations should be adequate to cover the next twelve months working capital needs,
debt service requirements which consists of scheduled principal and interest payments, and
planned capital expenditures, to the extent such items are known or are reasonably determinable
based on current business and market conditions. In addition we may elect to finance certain of
our capital expenditure requirements through borrowings under our senior secured revolving
credit facility, which had no debt outstanding as of December 31, 2009, or the issuance
of additional debt which is dependent on availability of third party financing. See “Debt
Obligations” section for further information related to our Amended Credit Agreement.
We generate the majority of our revenue from sales of products and services provided to the
AEC industry. As a result, our operating results and financial condition can be significantly
affected by economic factors that influence the AEC industry, such as non-residential and
residential construction spending. The effects of the current economic recession in the United
States, and weakness in global economic conditions, have resulted in a downturn in the
residential and non-residential construction spending of the AEC industry, which have adversely
affected our operating results. The current diminished liquidity and credit availability in
financial markets and the general economic recession may adversely affect the ability of our
customers and suppliers to obtain financing for significant operations and purchases, and to
perform their obligations under their agreements with us. We believe the credit constraints in
the financial markets are resulting in a decrease in, or cancellation of, existing business,
could limit new business, and could negatively impact our ability to collect our accounts
receivable on a timely basis. We are unable to predict the duration and severity of the current
economic recession and disruption in financial markets or their effects on our business and
results of operations, but the consequences may be materially adverse and more severe than other
recent economic slowdowns.
Based on our 2010 projected revenue, we have been implementing operational plans that we
believe will enable us to achieve EBITDA and the related operating expenses at such levels that
will allow us to remain in compliance with the financial covenants under our Amended Credit
Agreement. However, our ability to further reduce expenses becomes more challenging if sales
decline beyond forecasted levels. As of December 31, 2009, we were in compliance with the
financial covenants in our Amended Credit Agreement and we expect to be in compliance through
the term of that agreement. However, due to the uncertainties described, above, it is possible
that a default under certain financial covenants may occur in the future. We believe, although
difficult, that further cost reductions could be implemented in the event that projected revenue
levels are not achieved. If actual sales for 2010 are lower than our current projections and/or
we do not successfully implement cost reduction plans, however, we could be at risk of default
under the financial covenants of our Amended Credit Agreement during 2010. Our ability to
maintain compliance under the financial covenants of our Amended Credit Agreement is highly
sensitive to, and dependent upon, achieving projected levels of EBITDA and related operating
expenses for 2010. If we default on the covenants under the Amended Credit Agreement and are
unable to obtain waivers from our lenders, the lenders will be able to exercise their rights and
remedies under the Amended Credit Agreement, including a call provision on outstanding debt,
which would have a material adverse effect on our business, financial condition and liquidity.
Because our Amended Credit Agreement contains cross-default provisions, triggering a default
provision under our Amended Credit Agreement may require us to repay all debt outstanding under
the credit facilities, including any amounts outstanding under our senior secured revolving
credit facility (which currently has no debt outstanding), and may also temporarily or
permanently restrict our ability to draw additional funds under the
37
revolving senior secured credit facility. There is no assurance that we would receive
waivers should we not meet our financial covenant requirements. Even if we are able to obtain a
waiver, we may be required to agree to other adverse economic changes to our Amended Credit
Agreement, including increased interest rates, amended covenants or lower availability
thresholds and to pay a fee for any such waiver. If we are not able to comply with revised terms
and conditions under our Amended Credit Agreement and we are unable to obtain waivers, we would
need to obtain additional sources of liquidity. Given the unprecedented instability in worldwide
credit markets, however, there can be no assurance that we will be able to obtain additional
sources of liquidity on terms acceptable to us, or at all, which would have a material adverse
effect on our business and financial condition.
During December 2007, we repurchased 447,654 shares of our common stock for $7.7 million
which were funded through cash flows from operations. During 2008 and 2009, we did not
repurchase any common stock. Our Amended Credit Agreement allows us to repurchase stock and/or
pay cash dividends in an amount not to exceed $15 million in aggregate over the term of the
facility. As of December 31, 2009 we had $7.3 million available to repurchase stock and/or pay
cash dividends under the credit facility. Additional share repurchases, if any, will be made in
such amounts and at such times as we deem appropriate based upon prevailing market and business
conditions and would be primarily purchased using subordinated debt in accordance with our
credit facility.
We continually evaluate potential acquisitions. Absent a compelling strategic reason, we
target potential acquisitions that would be cash flow accretive within six months. Currently, we
are not a party to any agreements, or engaged in any negotiations regarding a material
acquisition. We expect to fund future acquisitions through cash flows provided by operations and
additional borrowings. The extent to which we will be willing or able to use our equity or a mix
of equity and cash payments to make acquisitions will depend on the market value of our shares
from time to time, and the willingness of potential sellers to accept equity as full or partial
payment. We expect that the decreased level of acquisition activity during 2009 will continue in
the near future.
Debt Obligations
Credit Facilities. On December 6, 2007, we entered into a Credit and Guaranty Agreement
(“Credit Agreement”). The Credit Agreement provided for senior secured credit facilities
aggregating up to $350 million, consisting of a $275 million term loan facility and a
$75 million revolving credit facility. We used proceeds under the Credit Agreement in the amount
of $289.4 million to extinguish in full all principal and interest payable under the then
existing Second Amended and Restated Credit and Guaranty Agreement.
Loans under our Credit Agreement bore interest, at our option, at either the base rate,
which is equal to the higher of the bank prime lending rate or the federal funds rate plus 0.5%
or LIBOR, plus, in each case, the applicable rate. The applicable rate will be determined based
upon our leverage ratio (as defined in the Credit Agreement), with a minimum and maximum
applicable rate of 0.25% and 0.75%, respectively, for base rate loans and a minimum and maximum
applicable rate of 1.25% and 1.75%, respectively, for LIBOR loans. In the event of certain
events of default all amounts due under the Credit Agreement will bear interest at 2.0% above
the rate otherwise applicable.
The Credit Agreement contains covenants which, among other things, require us to maintain a
minimum interest coverage ratio of 2.25:1.00, minimum fixed charge coverage ratio of 1.10:1.00,
and maximum leverage ratio of 3.00:1.00. The minimum interest coverage ratio increases to
2.50:1.00 in 2009, 2.75:1:00 in 2010, 3.00:1.00 in 2011 and 2012. The covenant ratios were
assessed quarterly and calculated on a trailing 12 months basis. The Credit Agreement also
contains customary events of default, including failure to make payments when due under the
Credit Agreement; payment default under and cross-default to other material indebtedness; breach
of covenants; breach of representations and warranties; bankruptcy; material judgments;
dissolution; ERISA events; change of control; invalidity of guarantees or security documents or
repudiation by the our obligations thereunder. The Credit Agreement is secured by substantially
all of our assets.
On October 5, 2009, we entered into our Amended Credit Agreement to, among other things:
| |
• |
|
Add a new definition of “Creditable Excess Cash” and amend the definition of “Fixed Charge Coverage Ratio” to allow for an adjustment of Creditable
Excess Cash; |
| |
| |
• |
|
Defer to December 6, 2012 the $36.1 million in amortization payments that would have been due in 2011
to consenting lenders that have agreed to provide new Class B term loan commitments under the Amended
Credit Agreement; |
| |
| |
• |
|
Increase the applicable rate by 200 basis points for initial term loans and 300 basis points for
Class B term loans for purposes of calculating interest on loans outstanding under the Amended Credit
Agreement; |
| |
| |
• |
|
Reduce the total revolving commitments under the Credit Agreement from $74.5 million to $49.5 million; |
38
| |
• |
|
Provide for a $35.0 million prepayment to be applied on the business day following the effective date
of the Amended Credit Agreement to reduce initial term loan installments due on March 31, 2010,
June 30, 2010 and September 30, 2010 on a pro rata basis; |
| |
| |
• |
|
Amend the interest coverage ratio under the Credit Agreement as follows: |
| |
• |
|
2.00:1.00 for fiscal quarter ending December 31, 2009 |
| |
| |
• |
|
1.75:1.00 for quarters ending March 31, 2010 through September 30, 2010 |
| |
| |
• |
|
2.00:1.00 for quarters ending December 31, 2010 through September 30, 2011 |
| |
| |
• |
|
2.50:1.00 for quarter ending December 31, 2011 |
| |
| |
• |
|
3.00:1.00 for quarters ending March 31, 2012 through maturity; |
| |
• |
|
Amend the fixed charge coverage ratio under the Credit Agreement to be 1.00:1.00 for the fiscal
quarter ending December 31, 2009 through maturity; |
| |
| |
• |
|
Amend the maximum leverage ratio under the Credit Agreement as follows: |
| |
• |
|
3.25:1.00 for fiscal quarter ending December 31, 2009 |
| |
| |
• |
|
3.50:1.00 for fiscal quarter ending March 31, 2010 |
| |
| |
• |
|
3.85:1.00 for fiscal quarters ending June 30, 2010 through September 30, 2010 |
| |
| |
• |
|
3.25:1.00 for fiscal quarter ending December 31, 2010 |
| |
| |
• |
|
3.00:1.00 for fiscal quarters ending March 31, 2011 through maturity; |
| |
• |
|
Amend the maximum senior secured leverage ratio under the Credit Agreement as follows: |
| |
• |
|
3.00:1.00 for fiscal quarter ending December 31, 2009 |
| |
| |
• |
|
3.25:1.00 for fiscal quarter ending March 31, 2010 |
| |
| |
• |
|
3.65:1.00 for fiscal quarters ending June 30, 2010 through September 30, 2010 |
| |
| |
• |
|
3.00:1.00 for fiscal quarters ending December 31, 2010 through March 31, 2011 |
| |
| |
• |
|
2.50:1.00 for fiscal quarters ending June 30, 2011 through maturity. |
In exchange for the terms set forth in the Amended Credit Agreement, we agreed to pay to
each consenting lender an amendment fee equal to 50 basis points of the amount of each
consenting lender’s revolving commitment and outstanding term loans as of the effective date of
the Amended Credit Agreement (as determined on a pro forma basis after giving effect to the
$35.0 million prepayment and reduction of total revolving commitments to $49.5 million) which
amounted to $1.3 million. In addition, we agreed to pay to each consenting lender that has a
Class B term loan commitment under the Amended Credit Agreement an amortization deferral fee of
100 basis points of such consenting lender’s Class B term loan amount commitment which amounted
to $0.4 million. We also paid customary arrangement and service fees of $2.0 million in
connection with the Amended Credit Agreement. Total fees amounted to $3.7 million of which $2.1
million was capitalized into Deferred Financing Costs and $1.6 million was expensed under
interest expense for 2009.
Term loans under the Amended Credit Agreement are amortized over the term with the final
payment due on December 6, 2012. Amounts borrowed under the revolving credit facility under the
Amended Credit Agreement must be repaid by December 6, 2012. Outstanding obligations under the
Amended Credit Agreement may be prepaid in whole or in part without premium or penalty.
As of December 31, 2009, we were in compliance with the financial covenants in our Amended
Credit Agreement. Our trailing twelve months key financial covenant ratios as of December 31,
2009 were 2.51:1.00 for Interest Coverage, 1.14:1.00 for Fixed Charge Coverage, 2.57:1.00 for
Leverage and 2.37:1.00 for Senior Secured Leverage. Refer to our discussion above on page 37
regarding our projected compliance with 2010 debt covenants.
On December 19, 2007, we entered into a swap transaction in order to hedge the floating
interest rate risk on our long term variable rate debt (the “Swap Transaction”). Under the terms
of the Swap Transaction, we were required to make quarterly fixed rate payments to the
counterparty calculated based on an initial notional amount of $271.6 million at a fixed rate of
4.1%, while the counterparty was obligated to make quarterly floating rate payments to us based
on the three month LIBO rate. The notional amount of the Swap Transaction was scheduled to
decline over the term of the term loan facility consistent with the scheduled principal
payments. The Swap Transaction had an effective date of March 31, 2008 and a termination date of
December 6, 2012.
On October 2, 2009, we amended our Swap Transaction (the “Amended Swap Transaction”) to
reduce our initial notional amount from $271.6 million to $210.8 million to hedge our then
existing variable interest rate debt under the Amended Credit Agreement. As of December 31,
2009, the Amended Swap Transaction had a negative fair value of $10.9 million, of which
$6.9 million was recorded in accrued expenses and $4.0 million was recorded in other long-term
liabilities.
39
As of December 31, 2009 and 2008, we had standby letters of credit aggregated to
$4.0 million. The standby letters of credit reduce our borrowing capacity under the revolving
credit facility.
The following table sets forth the outstanding balance, borrowing capacity and applicable
interest rate under our senior secured credit facilities.
| |
|
|
|
|
|
|
|
|
|
|
|
|
|
|
|
|
|
|
|
|
|
|
|
|
| |
|
As of December 31, 2009 |
|
|
As of December 31, 2008 |
|
| |
|
|
|
|
|
Available |
|
|
|
|
|
|
|
|
|
|
Available |
|
|
|
|
| |
|
|
|
|
|
Borrowing |
|
|
Interest |
|
|
|
|
|
|
Borrowing |
|
|
Interest |
|
| |
|
Balance |
|
|
Capacity |
|
|
Rate |
|
|
Balance |
|
|
Capacity |
|
|
Rate |
|
| |
|
(Dollars in thousands) |
|
Term facility |
|
$ |
205,625 |
|
|
$ |
— |
|
|
|
8.10 |
% |
|
$ |
261,250 |
|
|
$ |
— |
|
|
|
5.39 |
% |
Revolving facilities |
|
|
1,523 |
|
|
|
46,073 |
|
|
|
6.00 |
% |
|
|
— |
|
|
|
70,996 |
|
|
|
|
|
|
|
|
|
|
|
|
|
|
|
|
|
|
|
|
|
|
|
|
|
|
|
|
$ |
207,148 |
|
|
$ |
46,073 |
|
|
|
|
|
|
$ |
261,250 |
|
|
$ |
70,996 |
|
|
|
|
|
|
|
|
|
|
|
|
|
|
|
|
|
|
|
|
|
|
|
|
|
|
In addition, under the revolving facility under our Amended Credit Agreement, we are
required to pay a fee, on a quarterly basis, for the total unused commitment amount. This fee
ranges from 0.30% to 0.50% based on our leverage ratio at the time. We may also draw upon this
credit facility through letters of credit, which carries a fee of 0.25% of the outstanding
letters of credit. The Amended Credit Agreement allows us to borrow incremental term loans to
the extent our senior secured leverage ratio (as defined in the Amended Credit Agreement)
remains below 2.50:1.00.
In the fourth quarter of 2009, in connection with our China operations, we entered into
one-year revolving credit facilities. The facilities provide for a maximum credit amount of 14.5
million Chinese Yuan Renminbi. This translates to $2.1 million as of December 31, 2009. Draws on
the facilities are limited to 30 day periods and incur a fee of .05% of the amount drawn and no
additional interest is charged.
Seller Notes. As of December 31, 2009, we had $21.8 million of seller notes outstanding,
with interest rates ranging between 5.0% and 7.1% and maturities between 2010 and 2012. These
notes were issued in connection with prior acquisitions.
Off-Balance Sheet Arrangements
As of December 31, 2009, and 2008, we did not have any relationships with unconsolidated
entities or financial partnerships, such as entities often referred to as structured finance or
special purpose entities, which would have been established for the purpose of facilitating
off-balance sheet arrangements or other contractually narrow or limited purposes.
Contractual Obligations and Other Commitments
Our future contractual obligations as of December 31, 2009, are as follows:
| |
|
|
|
|
|
|
|
|
|
|
|
|
|
|
|
|
|
|
|
|
| |
|
|
|
|
|
Less than |
|
|
|
|
|
|
|
|
|
|
More than |
|
| |
|
Total |
|
|
1 year |
|
|
1 to 3 years |
|
|
3 to 5 years |
|
|
5 years |
|
| |
|
(Dollars in thousands) |
|
Debt obligations |
|
$ |
228,903 |
|
|
$ |
34,603 |
|
|
$ |
194,300 |
|
|
$ |
— |
|
|
$ |
— |
|
Capital lease obligations |
|
|
45,328 |
|
|
|
18,917 |
|
|
|
21,725 |
|
|
|
4,679 |
|
|
|
7 |
|
Interest on long-term
debt and
capital leases (1) |
|
|
46,168 |
|
|
|
20,793 |
|
|
|
25,092 |
|
|
|
283 |
|
|
|
— |
|
Operating lease |
|
|
88,867 |
|
|
|
28,449 |
|
|
|
35,245 |
|
|
|
14,958 |
|
|
|
10,215 |
|
ASC 740 liability (2) |
|
|
— |
|
|
|
— |
|
|
|
— |
|
|
|
— |
|
|
|
— |
|
|
|
|
|
|
|
|
|
|
|
|
|
|
|
|
|
Total |
|
$ |
409,266 |
|
|
$ |
102,762 |
|
|
$ |
276,362 |
|
|
$ |
19,920 |
|
|
$ |
10,222 |
|
|
|
|
|
|
|
|
|
|
|
|
|
|
|
|
|
| |
|
|
| (1) |
|
Interest on long-term debt is inclusive of our interest rate Swap Transaction. |
| |
| (2) |
|
ASC 740, formerly FIN 48, Accounting for Uncertainty in Income Taxes,
Liability. As a result of the adoption of ASC 740, we have a $1.8 million
contingent liability for uncertain tax positions. We are not updating the
disclosures in our long-term contractual obligations table presented above
because of the difficulty in making reasonably reliable estimates of the
timing of cash settlements with the respective taxing authorities (see Note 8
“Income Taxes” to our Consolidated Financial Statements included in this
report for additional discussion). |
40
Operating Leases. We have entered into various noncancelable operating leases primarily
related to facilities, equipment and vehicles used in the ordinary course of our business.
Contingent Transaction Consideration. We have entered into earnout agreements in connection
with prior acquisitions. If the acquired businesses generate operating profits or revenues in
excess of predetermined targets, we are obligated to make additional cash payments in accordance
with the terms of such earnout agreements. As of December 31, 2009, the maximum amount that may
be required to be paid out under existing earnout agreements is $2.9 million, in the aggregate,
between 2009 and 2014.
Critical Accounting Policies
Our management prepares financial statements in conformity with accounting principles
generally accepted in the United States. This requires us to make estimates and assumptions that
affect the amounts reported in the Consolidated Financial Statements and accompanying notes. We
evaluate our estimates and assumptions on an ongoing basis and rely on historical experience and
other factors that we believe are reasonable under the circumstances. Actual results could
differ from those estimates and such differences may be material to the Consolidated Financial
Statements. We believe the critical accounting policies and areas that require more significant
judgments and estimates used in the preparation of our Consolidated Financial Statements to be
the following: impairment of long-lived assets; goodwill and other intangible assets; revenue
recognition; allowance for doubtful accounts; commitments and contingencies; and stock-based
compensation.
Impairment of Long-Lived Assets
We periodically assess potential impairments of long-lived assets in accordance with the
provisions of ASC 360. An impairment review is performed whenever events or changes in
circumstances indicate that the carrying value of the assets may not be recoverable. Factors we
considered include, but are not limited to, significant underperformance relative to historical
or projected operating results; significant changes in the manner of use of the acquired assets
or the strategy for the overall business; and significant negative industry or economic trends.
When the carrying value of a long-lived asset may not be recoverable based upon the existence of
one or more of the above indicators of impairment, we estimate the future undiscounted cash
flows expected to result from the use of the asset and its eventual disposition. If the sum of
the expected future undiscounted cash flows and eventual disposition is less than the carrying
amount of the asset, we recognize an impairment loss. An impairment loss is reflected as the
amount by which the carrying amount of the asset exceeds the fair value of the asset, based on
the fair market value, if available, or discounted cash flows, if not.
Our operating segments are being negatively impacted by the drop in commercial and
residential construction resulting from the current economic recession. As a result of this, our
earnings outlook has declined and we recorded a goodwill impairment of $37.4 million in the
third quarter of 2009 (see the section entitled “Goodwill and Other Intangible Assets” below).
Before assessing our goodwill for impairment, we evaluated, as described above, the long-lived
assets in our operating segments for impairment given the reduced level of expected sales,
profits and cash flows. Based on this assessment, we determined that there was an impairment of
long-lived assets for our operating segment in the United Kingdom. Accordingly, we recorded a
pretax, non-cash charge in the third quarter of 2009 to reduce the carrying value of other
intangible assets by $0.8 million.
Goodwill and Other Intangible Assets
We assess goodwill at least annually for impairment as of September 30, or more frequently
if events and circumstances indicate that goodwill might be impaired. We concluded that in the
absence of the annual goodwill impairment analysis, there were sufficient indicators to require
us to perform a goodwill impairment analysis as of September 30, 2009. The indicators were based
on a combination of factors, including the current economic recession and revised forecasted
future earnings. Goodwill impairment testing is performed at the operating segment (or
“reporting unit”) level. Goodwill is assigned to reporting units at the date the goodwill is
initially recorded. Once goodwill has been assigned to reporting units, it no longer retains its
association with a particular acquisition, and all of the activities within a reporting unit,
whether acquired or internally generated, are available to support the value of the goodwill.
Based on our annual goodwill impairment assessment, we recorded a $37.4 million impairment in
the third quarter of 2009. We continue to assess, among other things, the current economic
recession, reporting unit and consolidated performance against plan, and the outlook for our
business and industry in general. A downward trend in one or more of these factors, or a
significant decrease in our stock price, could cause us to reduce the estimated fair value of
our reporting units and recognize a corresponding impairment of the goodwill in connection with
a future goodwill impairment analysis. Given the current economic environment, we have and will
continue to monitor the need to test our intangibles for
impairment as required by ASC 805. Based upon our assessment, we concluded that no goodwill
impairment triggering events have occurred during the fourth quarter of 2009 that would require
an additional impairment test.
41
During the quarter ended December 31, 2008, based on a combination of factors, including the
then current economic environment, and a significant decline in market capitalization, we
concluded that there were sufficient indicators to require us to perform an interim goodwill
impairment analysis as of December 31, 2008. The result of such analysis indicated that eight of
our reporting units, six in the United States, one in Canada, and one in the United Kingdom had a
goodwill impairment. Accordingly, we recorded a pretax, non-cash charge for the year ended
December 31, 2008 to reduce the carrying value of goodwill by $35.2 million.
Goodwill impairment testing is a two-step process. Step one involves comparing the fair
value of our reporting units to their carrying amount. If the fair value of the reporting unit
is greater than its carrying amount, there is no impairment. If the reporting unit’s carrying
amount is greater than the fair value, the second step must be completed to measure the amount
of impairment, if any. Step two involves calculating the implied fair value of goodwill by
deducting the fair value of all tangible and intangible assets, excluding goodwill, of the
reporting unit from the fair value of the reporting unit as determined in step one. The implied
fair value of goodwill determined in this step is compared to the carrying value of goodwill. If
the implied fair value of goodwill is less than the carrying value of goodwill, an impairment
loss is recognized equal to the difference. The results of our analysis indicated that 11 of our
reporting units, nine in the United States, one in the United Kingdom and one in Canada, had a
goodwill impairment as of September 30, 2009. Accordingly, we recorded a pretax, non-cash charge
in the third quarter of 2009 to reduce the carrying value of goodwill by $37.4 million.
We determined the fair value of our reporting units using an income approach. Under the
income approach, we determined fair value based on estimated future cash flows of each reporting
unit. The cash flows are discounted by an estimated weighted-average cost of capital, which
reflects the overall level of inherent risk of a reporting unit. Determining the fair value of a
reporting unit is judgmental in nature and requires the use of significant estimates and
assumptions, including revenue growth rates, operating margins, discount rates, and future
market conditions, among others. We considered market information in assessing the
reasonableness of the fair value yielded under the income approach outlined above.
Given the current economic environment and the uncertainties regarding the impact on our
business, there can be no assurance that our estimates and assumptions regarding the duration of
the ongoing economic downturn, or the period or strength of recovery, made for purposes of our
goodwill impairment analysis will prove to be accurate predictions of the future. If our
assumptions regarding forecasted revenue or gross margins of certain reporting units are not
achieved, we may be required to record additional goodwill impairment charges in future periods,
whether in connection with our next annual impairment analysis in the third quarter of 2010 or
prior to that, if any such change constitutes a triggering event outside of the quarter from
when the annual goodwill impairment analysis is performed. It is not possible at this time to
determine if any such future impairment charge would result or, if it does, whether such charge
would be material. If the estimated fair value of our reporting units, as determined in our
annual goodwill impairment analysis as of September 30, 2009, was overstated by 5 percent, it
could potentially result in an additional goodwill impairment of $7.4 million. However as of
December 31, 2009, the Company has met its projections, used in the September 30, 2009 analysis,
and expects to continue to meet projections in the future.
In connection with acquisitions completed during the year ended December 31, 2009, we have
applied the provisions of ASC 805, using the acquisition method of accounting. However,
acquisitions completed prior to 2009 were accounted for by applying the former provisions of
SFAS 141, pursuant to which the assets and liabilities assumed were recorded at their estimated
fair values. The excess purchase price over the fair value of net tangible assets and
identifiable intangible assets acquired was recorded as goodwill.
The additions to goodwill include the excess purchase price over fair value of net assets
acquired, purchase price adjustments, and certain earnout payments. See Note 3 “Acquisitions” to
our Consolidated Financial Statements included in this report.
Customer relationships and trade names acquired are amortized over their estimated useful
lives of 13 (weighted average) and 20 years, respectively. Customer relationships are amortized
using the accelerated method (based on customer attrition rates) and trade names are amortized
using the straight-line method. The non-compete agreements are amortized over their weighted
average term on a straight-line basis.
Revenue Recognition
We apply the provisions of ASC 605, formerly the Securities and Exchange Commission
(“SEC”) Staff Accounting Bulletin (“SAB”) No. 104, Revenue Recognition in Financial Statements.
In general, we recognize revenue when (i) persuasive evidence of an arrangement exists,
(ii) shipment of products has occurred or services have been rendered, (iii) the sales price
charged is fixed or determinable and (iv) collection is reasonably assured. Net sales include an
allowance for estimated sales returns and discounts.
42
We recognize revenues from reprographics and facilities management services when services
have been rendered while revenues from the resale of reprographics supplies and equipment are
recognized upon delivery to the customer or upon customer pickup.
We have established contractual pricing for certain large national customer accounts
(“Global Services”). These contracts generally establish uniform pricing at all branches for
Global Services. Revenues earned from our Global Services are recognized in the same manner as
non-Global Services revenues.
Revenues from software licensing activities are recognized over the term of the license.
Revenues from membership fees are recognized over the term of the membership agreement.
Management provides for returns, discounts and allowances based on historic experience and
adjusts such allowances as considered necessary. To date, such provisions have been within the
range of management’s expectations.
Allowance for Doubtful Accounts
We perform periodic credit evaluations of the financial condition of our customers, monitor
collections and payments from customers, and generally do not require collateral. We provide for
the possible inability to collect accounts receivable by recording an allowance for doubtful
accounts. We write off an account when it is considered uncollectible. We estimate our allowance
for doubtful accounts based on historical experience, aging of accounts receivable, and
information regarding the creditworthiness of our customers. In 2009, 2008, and 2007, we
recorded expenses of $3.0 million, $4.9 million, and $1.3 million, respectively, related to the
allowance for trade receivables.
Commitments and Contingencies
In the normal course of business, we estimate potential future loss accruals related to
legal, workers compensation, tax and other contingencies. These accruals require management’s
judgment on the outcome of various events based on the best available information. However, due
to changes in facts and circumstances, the ultimate outcomes could differ from management’s
estimates.
Stock-Based Compensation
Effective January 1, 2006, we adopted ASC 718, formerly SFAS 123R (Revised 2004),
Shared-Based Payment, using the modified prospective transition method. Under this transition
method, stock-based compensation was recognized for: (i) expense related to the remaining
unvested portion of all stock option awards granted in 2005, based on the grant date fair value
estimated in accordance with the original provisions of SFAS 123, Accounting for Stock-Based
Compensation; and (ii) expense related to all stock option awards granted on or subsequent to
January 1, 2006, based on the grant date fair value estimated in accordance with the provisions
of ASC 718. In accordance with ASC 718-10, the remaining unvested options issued by us prior to
our initial public offering are not included in our ASC 718 option pool. As a result unless
subsequently modified, repurchased or canceled, such unvested options will not be included in
stock-based compensation. We apply the Black-Scholes valuation model in determining the fair
value of share-based payments to employees, which is then amortized on a straight-line basis
over the requisite service period. Upon the adoption FSP FAS 123(R-3), Transition Election
Related to Accounting for the Tax Effects of Share-Based Payment Awards, we used the “shortcut
method” for determining the historical windfall tax benefit.
Total stock-based compensation for the years ended December 31, 2009, 2008 and 2007, on
income before income taxes and net income was $4.9 million, $4.3 million and $3.5 million,
respectively and was recorded in selling, general, and administrative expenses. In addition,
upon the adoption of ASC 718, the excess tax benefit resulting from stock-based compensation, in
our Consolidated Statements of Cash Flows, are classified as cash flows from financing
activities.
Recent Accounting Pronouncements
See Note 2 “Summary of Significant Accounting Policies” to our Consolidated Financial
Statements for disclosure on recent accounting pronouncements.
|
|
|
| Item 7A. |
|
Quantitative and Qualitative Disclosures about Market Risk |
Our primary exposure to market risk is interest rate risk associated with our debt
instruments. We use both fixed and variable rate debt as sources of financing. We enter into
derivative instruments to manage our exposure to changes in interest rates. These instruments
allow us to raise funds at floating rates and effectively swap them into fixed rates, without
the exchange of the underlying principal amount.
43
On December 19, 2007, we entered into the Swap Transaction in order to hedge the floating
interest rate risk on our long term variable rate debt. Under the terms of the Swap Transaction,
we were required to make quarterly fixed rate payments to the counterparty calculated based on
an initial notional amount of $271.6 million at a fixed rate of 4.1%, while the counterparty was
obligated to make quarterly floating rate payments to us based on the three month LIBO rate. The
notional amount of the interest rate swap was scheduled to decline over the term of the term
loan facility consistent with the scheduled principal payments.
On October 2, 2009, we amended the Swap Transaction to reduce our initial notional amount
from $271.6 million to $210.8 million to hedge our existing term loan debt after taking into
effect the amendment to our credit facility in October of 2009.
The Swap Transaction has an effective date of March 31, 2008 and a termination date of
December 6, 2012. At December 31, 2009, the Amended Swap Transaction had a negative fair value
of $10.9 million of which $6.9 million was recorded in accrued expenses and $4.0 million was
recorded in other long-term liabilities.
As of December 31, 2009, we had $274.2 million of total debt and capital lease obligations,
none of which bore interest at variable rates, after factoring in our interest rate swap on our
senior secured debt.
We have not, and do not plan to, enter into any derivative financial instruments for
trading or speculative purposes. As of December 31, 2009, we had no other significant material
exposure to market risk, including foreign exchange risk and commodity risks.
|
|
|
| Item 8. |
|
Financial Statements and Supplementary Data |
Our financial statements and the accompanying notes that are filed as part of this report
are listed under “Part IV, Item 15. Financial Statements Schedules and Reports” and are set
forth beginning on page F-1 immediately following the signature pages of this Annual Report on
Form 10-K.
|
|
|
| Item 9. |
|
Changes in and Disagreements with Accountants on Accounting and Financial Disclosure |
None.
|
|
|
| Item 9A. |
|
Controls and Procedures |
Disclosure Controls and Procedures
We maintain disclosure controls and procedures that are designed to ensure that information
required to be disclosed in our reports under the Exchange Act are recorded, processed,
summarized, and reported within the time periods specified in the Securities and Exchange
Commission’s rules and forms, and that such information is accumulated and communicated to our
management, including our Chief Executive Officer and our Chief Financial Officer, as
appropriate, to allow timely decisions regarding required disclosures.
Under the supervision and with the participation of our management, including our Chief
Executive Officer and Chief Financial Officer we conducted an evaluation of the effectiveness of
our disclosure controls and procedures (as defined in Rule 13a-15(e) and 15d-15(e) under the
Securities Exchange Act of 1934) as of December 31, 2009. Based on that evaluation, our Chief
Executive Officer and our Chief Financial Officer concluded that as of December 31, 2009, our
disclosure controls and procedures were effective.
Management’s Report on Internal Control Over Financial Reporting
Management is responsible for establishing and maintaining adequate internal control over
financial reporting (as defined in Rule 13a-15(f) or 15(d)-15(f) of the Exchange Act). Under the
supervision and with the participation of the Company’s management, including our Chief
Executive Officer and President, and our Chief Financial Officer, the Company conducted an
evaluation of the effectiveness of its internal control over financial reporting based upon the
framework in Internal Control — Integrated Framework issued by the Committee of Sponsoring
Organizations of the Treadway Commission. Based on that evaluation, the Company’s management
concluded that its internal control over financial reporting was effective as of December 31,
2009.
Because of its inherent limitations, internal control over financial reporting may not
prevent or detect misstatements. Projections of any evaluation of effectiveness to future
periods are subject to the risk that controls may become inadequate because of changes in
conditions, or that the degree of compliance with the policies or procedures may deteriorate.
44
Changes in Internal Control Over Financial Reporting
There were no significant changes to internal control over financial reporting during the
quarter ended December 31, 2009, that have materially affected, or are reasonably likely to
materially affect, our internal control over financial reporting.
Our independent registered public accounting firm has issued an audit report on internal
control over financial reporting, which appears below.
REPORT OF INDEPENDENT REGISTERED PUBLIC ACCOUNTING FIRM
To the Board of Directors and Stockholders of
American Reprographics Company
Walnut Creek, California
We have audited the internal control over financial reporting of American Reprographics
Company (the ‘‘Company’’) as of December 31, 2009, based on criteria established in Internal
Control—Integrated Framework issued by the Committee of Sponsoring Organizations of the Treadway
Commission. The Company’s management is responsible for maintaining effective internal control
over financial reporting and for its assessment of the effectiveness of internal control over
financial reporting, included in the accompanying Management’s Report on Internal Control over
Financial Reporting. Our responsibility is to express an opinion on the Company’s internal
control over financial reporting based on our audit.
We conducted our audit in accordance with the standards of the Public Company Accounting
Oversight Board (United States). Those standards require that we plan and perform the audit to
obtain reasonable assurance about whether effective internal control over financial reporting
was maintained in all material respects. Our audit included obtaining an understanding of
internal control over financial reporting, assessing the risk that a material weakness exists,
testing and evaluating the design and operating effectiveness of internal control based on the
assessed risk, and performing such other procedures as we considered necessary in the
circumstances. We believe that our audit provides a reasonable basis for our opinion.
A company’s internal control over financial reporting is a process designed by, or under the
supervision of, the company’s principal executive and principal financial officers, or persons
performing similar functions, and effected by the company’s board of directors, management, and
other personnel to provide reasonable assurance regarding the reliability of financial reporting
and the preparation of financial statements for external purposes in accordance with generally
accepted accounting principles. A company’s internal control over financial reporting includes
those policies and procedures that (1) pertain to the maintenance of records that, in reasonable
detail, accurately and fairly reflect the transactions and dispositions of the assets of the
company; (2) provide reasonable assurance that transactions are recorded as necessary to permit
preparation of financial statements in accordance with generally accepted accounting principles,
and that receipts and expenditures of the company are being made only in accordance with
authorizations of management and directors of the company; and (3) provide reasonable assurance
regarding prevention or timely detection of unauthorized acquisition, use, or disposition of the
company’s assets that could have a material effect on the financial statements.
Because of the inherent limitations of internal control over financial reporting, including the
possibility of collusion or improper management override of controls, material misstatements due
to error or fraud may not be prevented or detected on a timely basis. Also, projections of any
evaluation of the effectiveness of the internal control over financial reporting to future
periods are subject to the risk that the controls may become inadequate because of changes in
conditions, or that the degree of compliance with the policies or procedures may deteriorate.
In our opinion, the Company maintained, in all material respects, effective internal control
over financial reporting as of December 31, 2009, based on the criteria established in Internal
Control—Integrated Framework issued by the Committee of Sponsoring Organizations of the Treadway
Commission.
We have also audited, in accordance with the standards of the Public Company Accounting
Oversight Board (United States), the consolidated financial statements and financial statement
schedule as of and for the year ended December 31, 2009 of the Company and our report dated
February 26, 2010 expressed an unqualified opinion on those financial statements and financial
statement schedules and included an explanatory paragraph regarding the Company’s change in
accounting for noncontrolling interests in consolidated subsidiaries.
/s/ DELOITTE & TOUCHE LLP
Los Angeles, California
February 26, 2010
|
|
|
| Item 9B. |
|
Other Information |
None.
45
PART III
|
|
|
| Item 10. |
|
Directors, Executive Officers and Corporate Governance |
Certain information regarding our executive officers is included in Part I, Item 1, of this
Annual Report on Form 10-K under “Executive Officers of the Registrant.” All other information
regarding directors, executive officers and corporate governance required by this item is
incorporated herein by reference to the applicable information in the proxy statement for our
2010 annual meeting of stockholders, which will be filed with the SEC within 120 days after our
fiscal year end of December 31, 2009, and is set forth under “Nominees for Director,” “Corporate
Governance Profile,” “Section 16(a) Beneficial Ownership Reporting Compliance,” and in other
applicable sections in the proxy statement.
Certain Executive Officer Certifications
Our common stock is listed on the NYSE. As required by Section 303A.12 of the NYSE
Listed Company Manual, we have filed as exhibits to this Annual Report on Form 10-K the Chief
Executive Officer and Chief Financial Officer certifications required by Section 302 and Section
906 of the Sarbanes-Oxley Act of 2002. On May 29, 2009, we submitted to the NYSE the Annual CEO
Certification regarding the Company’s compliance with the NYSE’s corporate governance listing
standards, as required as required by Section 303A.12 of the NYSE Listed Company Manual. There
were no qualifications to the certification.
|
|
|
| Item 11. |
|
Executive Compensation |
The information required by this item is incorporated herein by reference to the applicable
information in the proxy statement for our 2010 annual meeting of stockholders and is set forth
under “Executive Compensation.”
The information in the section of the proxy statement for our 2010 annual meeting captioned
“Compensation Committee Report” is incorporated by reference herein but shall be deemed
furnished, not filed and shall not be deemed to be incorporated by reference into any filing we
make under the Securities Act of 1933 or the Exchange Act.
|
|
|
| Item 12. |
|
Security Ownership of Certain Beneficial Owners and Management and Related Stockholder
Matters |
The information required by this item is incorporated herein by reference to the applicable
information in the proxy statement for our 2010 annual meeting of stockholders and is set forth
under “Beneficial Ownership of Voting Securities” and “Equity Compensation Plan Information.”
|
|
|
| Item 13. |
|
Certain Relationships and Related Transactions, and Director Independence |
The information required by this item is incorporated herein by reference to the applicable
information in the proxy statement for our 2010 annual meeting of stockholders and is set forth
under “Certain Relationships and Related Transactions” and “Corporate Governance Profile.”
|
|
|
| Item 14. |
|
Principal Accountant Fees and Services |
The information required by this item is incorporated herein by reference to the proxy
statement for our 2010 annual meeting of stockholders and is set forth under “Auditor Fees.”
46
PART IV
Item 15. Exhibits and Financial Statement Schedules.
(a) The following documents are filed as part of this Annual Report on Form 10-K:
(1) Financial Statements
| |
|
|
|
|
Report of Independent Registered Public Accounting Firm |
|
|
|
|
Deloitte & Touche LLP |
|
|
|
|
PricewaterhouseCoopers LLP |
|
|
|
|
Consolidated Balance Sheets as of December 31, 2009 and 2008 |
|
|
|
|
Consolidated Statements of Operations for the years ended December 31, 2009, 2008 and 2007 |
|
|
|
|
Consolidated Statements of Stockholders’ Equity and Comprehensive Income (Loss) for the years
ended December 31, 2009, 2008 and 2007 |
|
|
|
|
Consolidated Statements of Cash Flows for the years ended December 31, 2009, 2008 and 2007 |
|
|
|
|
Notes to Consolidated Financial Statements |
|
|
|
|
(2) Financial Statement Schedules
Schedule II — Valuation and Qualifying Accounts
All other schedules have been omitted as the required information is not present or is not
present in amounts sufficient to require submission of the schedule, or because the information
required is included in the Consolidated Financial Statements and notes thereto.
(3) Exhibits
See Item 15(b) below.
(b) Exhibits
The following exhibits are filed herewith as part of this Annual Report on Form 10-K or are
incorporated by reference to exhibits previously filed with the U.S. Securities and Exchange
Commission:
47
Index to Exhibits
| |
|
|
|
|
| Number |
|
Description |
| |
|
|
|
|
| |
3.1 |
|
|
Amended and Restated Certificate of Incorporation, filed February 2, 2005
(incorporated by reference to Exhibit 3.1 to the Registrant’s Form 10-K filed on
March 31, 2005). |
| |
|
|
|
|
| |
3.2 |
|
|
Second Amended and Restated Bylaws, (incorporated by reference to Exhibit 3.1 to the
Registrant’s Form 8-K filed on October 6, 2009). |
| |
|
|
|
|
| |
4.1 |
|
|
Specimen Stock Certificate (incorporated by reference to Exhibit 4.1 to the
Registrant’s Registration Statement on Form S-1 A (Reg. No. 333-119788), as amended
on January 13, 2005). |
| |
|
|
|
|
| |
10.1 |
|
|
Second Amended and Restated Credit and Guaranty Agreement dated as of December 21,
2005 by and among American Reprographics Company; American Reprographics Company,
L.L.C., American Reprographics Holdings, L.L.C., certain subsidiaries of American
Reprographics Company, L.L.C., or guarantors, and the lenders named therein
(incorporated by reference to Exhibit 10.1 of the Registrant’s Form 8-K filed on
December 21, 2005). |
| |
|
|
|
|
| |
10.2 |
|
|
First Amendment to Second Amended and Restated Credit and Guaranty Agreement dated
effective as of July 17, 2006, by and among American Reprographics Company L.L.C., a
California limited liability company, American Reprographics Company, a Delaware
corporation, certain financial institutions listed in the signature pages thereto,
Goldman Sachs Credit Partners L.P., as Sole Lead Arranger and Joint Bookrunner,
JPMorgan Securities, Inc., as Joint Bookrunner, General Electric Capital Corporation,
as Administrative Agent and as Collateral Agent and the Credit Support Parties listed
on the signature pages thereto (incorporated by reference to Exhibit 10.1 of the
Registrant’s Form 10-Q filed on August 14, 2006). |
| |
|
|
|
|
| |
10.3 |
|
|
Second Amendment to Second Amended and Restated Credit and Guaranty Agreement dated
as of April 27, 2007 by and among American Reprographics Company; American
Reprographics Company, L.L.C.; American Reprographics Holdings, L.L.C.; certain
subsidiaries of American Reprographics Company, L.L.C., or guarantors, the lenders
named therein, Goldman Sachs Credit Partners L.P., as sole lead arranger, sole
bookrunner and sole syndication agent, and General Electric Capital Corporation, as
administrative agent (incorporated by reference to Exhibit 10.1 to the Registrant’s
Form 8-K filed on May 2, 2007). |
| |
|
|
|
|
| |
10.4 |
|
|
American Reprographics Company 2005 Stock Plan (incorporated by reference to
Exhibit 10.7 to the Registrant’s Registration Statement on Form S-1 A (Reg.
No. 333-119788), as amended on January 13, 2005).ˆ |
| |
|
|
|
|
| |
10.5 |
|
|
Forms of Stock Option Agreements under the 2005 Stock Plan (incorporated by reference
to Exhibit 10.8 to the Registrant’s Registration Statement on Form S-1 (Reg.
No. 333-119788), as filed on October 15, 2004).ˆ |
| |
|
|
|
|
| |
10.6 |
|
|
Amendment No. 1 to American Reprographics Company 2005 Stock Plan dated May 22, 2007
(incorporated by reference to Exhibit 10.63 to the Registrant’s Form 10-Q filed on
August 9, 2007).ˆ |
| |
|
|
|
|
| |
10.7 |
|
|
Amendment No. 2 to American Reprographics Company 2005 Stock Plan dated May 2, 2008
(incorporated by reference to Exhibit 10.3 to the Registrant’s Form 10-Q filed
August 8, 2008). ˆ |
| |
|
|
|
|
| |
10.8 |
|
|
Amendment No. 3 to American Reprographics Company 2005 Stock Plan (incorporated by
reference to Exhibit 10.1 to the Registrant’s Form 10-Q filed August 7, 2009). ˆ |
| |
|
|
|
|
| |
10.9 |
|
|
Form of American Reprographics Company Stock Option Grant Notice — Non-employee
Directors (Discretionary Non-statutory Stock Options) (incorporated by reference to
Exhibit 10.1 to the Registrant’s Form 8-K filed on December 16, 2005).ˆ |
| |
|
|
|
|
| |
10.10 |
|
|
Form of American Reprographics Company Non-employee Directors — Stock Option
Agreement (Discretionary Grants) (incorporated by reference to Exhibit 10.2 to the
Registrant’s Form 8-K filed on December 16, 2005).ˆ |
48
| |
|
|
|
|
| Number |
|
Description |
| |
|
|
|
|
| |
10.11 |
|
|
Amended and Restated American Reprographics Company 2005 Employee Stock Purchase Plan
amended and restated as of July 30, 2009 (incorporated by reference to Exhibit 10.1
to the Registrant’s Form 10-Q filed on November 9, 2009).ˆ |
| |
|
|
|
|
| |
10.12 |
|
|
Lease Agreement, dated November 19, 1997, between American Reprographics Company,
L.L.C. (formerly Ford Graphics Group, L.L.C.) and Sumo Holdings LA, LLC (incorporated
by reference to Exhibit 10.10 to the Registrant’s Registration Statement on Form S-1
(Reg. No. 333-119788), as filed on October 15, 2004). |
| |
|
|
|
|
| |
10.13 |
|
|
Amendment to Lease for the premises commonly known as 934 and 940 Venice Boulevard,
Los Angeles, CA, effective as of August 2, 2005, by and between Sumo Holdings LA,
LLC, Landlord and American Reprographics Company, L.L.C. (formerly known as FORD
GRAPHICS GROUP, L.L.C.) Tenant (incorporated by reference to Exhibit 10.2 to the
Registrant’s Form 10-Q filed on November 14, 2005). |
| |
|
|
|
|
| |
10.14 |
|
|
Lease Agreement between American Reprographics Company, L.L.C. and Sumo Holdings San
Jose, LLC (incorporated by reference to Exhibit 10.11 to the Registrant’s
Registration Statement on Form S-1 (Reg. No. 333-119788), as filed on October 15,
2004). |
| |
|
|
|
|
| |
10.15 |
|
|
Amendment to Lease for the premises commonly known as 835 West Julian Street, San
Jose, CA by and between Sumo Holdings San Jose, LLC, Landlord, and American
Reprographics Company, L.L.C. Tenant (incorporated by reference to Exhibit 10.1 to
the Registrant’s Form 10-Q filed on May 8, 2009). |
| |
|
|
|
|
| |
10.16 |
|
|
Lease Agreement between American Reprographics Company, L.L.C. and Sumo Holdings
Irvine, LLC (incorporated by reference to Exhibit 10.12 to the Registrant’s
Registration Statement on Form S-1 (Reg. No. 333-119788), as filed on October 15,
2004). |
| |
|
|
|
|
| |
10.17 |
|
|
Amendment to Lease for the premises commonly known as 17721 Mitchell North, Irvine,
CA, effective as of August 2, 2005, by and between Sumo Holdings Irvine, LLC, Lessor
and American Reprographics Company, L.L.C., Lessee (incorporated by reference to
Exhibit 10.1 to the Registrant’s Form 10-Q filed on November 14, 2005). |
| |
|
|
|
|
| |
10.18 |
|
|
Assignment of Lease and Consent for the premises commonly known as 17721 Mitchell
North, Irvine, CA by and between OCB, LLC, American Reprographics Company, L.L.C.
and Sumo Holdings Irvine LLC (incorporated by reference to Exhibit 10.2 to the
Registrant’s Form 10-Q filed on May 8, 2009). |
| |
|
|
|
|
| |
10.19 |
|
|
Second Amendment to Lease for the premises commonly known as 17721 Mitchell North,
Irvine, CA by and between Sumo Holdings Irvine LLC, Lessor, and OCB, LLC, Lessee,
(incorporated by reference to Exhibit 10.3 to the Registrant’s Form 10-Q filed on May
8, 2009). |
| |
|
|
|
|
| |
10.20 |
|
|
Lease Agreement, dated December 1, 1997, between American Reprographics Company,
L.L.C. and Sumo Holdings Sacramento, LLC (Oakland Property) (incorporated by
reference to Exhibit 10.13 to the Registrant’s Registration Statement on Form S-1
(Reg. No. 333-119788), as filed on October 15, 2004). |
| |
|
|
|
|
| |
10.21 |
|
|
Lease Agreement between American Reprographics Company, L.L.C. (formerly Ford
Graphics Group, L.L.C.) and Sumo Holdings Sacramento, LLC (Sacramento Property)
(incorporated by reference to Exhibit 10.14 to the Registrant’s Registration
Statement on Form S-1 (Reg. No. 333-119788), as filed on October 15, 2004). |
| |
|
|
|
|
| |
10.22 |
|
|
Amendment to Lease for the premises commonly known as 1322 V Street, Sacramento, CA,
effective as of August 2, 2005, by and between Sumo Holdings Sacramento, LLC,
Landlord and American Reprographics Company, L.L.C. (formerly known as Ford Graphics
Group, L.L.C.) Tenant (incorporated by reference to Exhibit 10.4 to the Registrant’s
Form 10-Q filed on November 14, 2005). |
49
| |
|
|
|
|
| Number |
|
Description |
| |
|
|
|
|
| |
10.23 |
|
|
Lease Agreement, dated December 7, 1995, between Leet-Melbrook, Inc. and Sumo
Holdings Maryland, LLC (as successor lessor) (incorporated by reference to
Exhibit 10.15 to the Registrant’s Registration Statement on Form S-1 (Reg.
No. 333-119788), as filed on October 15, 2004). |
| |
|
|
|
|
| |
10.24 |
|
|
Amendment to Lease for the premises commonly known as 18810 Woodfield Road,
Gaithersburg, MD, effective as of August 2, 2005, by and between Sumo Holdings
Maryland, LLC, Landlord and Leet-Melbrook, Inc., Tenant (incorporated by reference to
Exhibit 10.3 to the Registrant’s Form 10-Q filed on November 14, 2005). |
| |
|
|
|
|
| |
10.25 |
|
|
Second Amendment to Lease for the premises commonly known as 18810 Woodfield Road,
Gaithersburg, MD, effective as of August 1, 2006 by and between Sumo Holdings
Maryland, LLC, Landlord and Leet-Melbrook Inc., Tenant (incorporated by reference to
Exhibit 10.24 to the Registrant’s Form 10-K filed on March 1, 2007). |
| |
|
|
|
|
| |
10.26 |
|
|
Lease Agreement, dated September 23, 2003, between American Reprographics Company
(dba Consolidated Reprographics) and Sumo Holdings Costa Mesa, LLC (incorporated by
reference to Exhibit 10.16 to the Registrant’s Registration Statement on Form S-1
(Reg. No. 333-119788), as filed on October 15, 2004). |
| |
|
|
|
|
| |
10.27 |
|
|
Lease agreement dated November 19, 1997, between Dieterich-Post Company and Ford
Graphics Group, L.L.C. (incorporated by reference to Exhibit 10.26 to the
Registrant’s Form 10-K filed on March 1, 2007). |
| |
|
|
|
|
| |
10.28 |
|
|
Indemnification Agreement, dated April 10, 2000, among American Reprographics
Company, L.L.C., American Reprographics Holdings, L.L.C., ARC Acquisition Co.,
L.L.C., Mr. Chandramohan, Mr. Suriyakumar, Micro Device, Inc., Dieterich-Post
Company, ZS Ford L.P., and ZS Ford L.L.C. (incorporated by reference to Exhibit 10.19
to the Registrant’s Registration Statement on Form S-1 (Reg. No. 333-119788), as
filed on October 15, 2004). |
| |
|
|
|
|
| |
10.29 |
|
|
Investor Registration Rights Agreement, dated April 10, 2000, among American
Reprographics Holdings, L.L.C., ARC Acquisition Co., L.L.C., Mr. Chandramohan,
Mr. Suriyakumar, GS Mezzanine Partners II, L.P. and GS Mezzanine Partners II
Offshore, L.P. (incorporated by reference to Exhibit 10.20 to the Registrant’s
Registration Statement on Form S-1 (Reg. No. 333-119788), as filed on October 15,
2004). |
| |
|
|
|
|
| |
10.30 |
|
|
First Amendment to Investor Registration Rights Agreement, among American
Reprographics Holdings, L.L.C., American Reprographics Company, ARC Acquisition Co.,
L.L.C., CHS Associates IV, Ms. Paige Walsh, Mr. Chandramohan, Mr. Suriyakumar, GS
Mezzanine Partners II, L.P., GS Mezzanine Partners II Offshore, L.P., Stone Street
Fund 2000, L.P. and Bridge Street Special Opportunities Fund, 2000, L.P.
(incorporated by reference to Exhibit 10.21 to the Registrant’s Registration
Statement on Form S-1 A (Reg. No. 333-119788), as amended on January 13, 2005). |
| |
|
|
|
|
| |
10.31 |
|
|
Forms of Restricted Stock Award Agreements under 2005 Stock Plan (incorporated by
reference to Exhibit 10.27 to the Registrant’s Registration Statement on Form S-1 A
(Reg. No. 333-119788), as amended on December 6, 2004).ˆ |
| |
|
|
|
|
| |
10.32 |
|
|
Form of Restricted Stock Unit Award Agreement under 2005 Stock Plan (incorporated by
reference to Exhibit 10.28 to the Registrant’s Registration Statement on Form S-1 A
(Reg. No. 333-119788), as amended on December 6, 2004).ˆ |
| |
|
|
|
|
| |
10.33 |
|
|
Form of Stock Appreciation Right Agreement under 2005 Stock Plan (incorporated by
reference to Exhibit 10.29 to the Registrant’s Registration Statement on Form S-1 A
(Reg. No. 333-119788), as amended on January 13, 2005).ˆ |
| |
|
|
|
|
| |
10.34 |
|
|
Employment Agreement, dated January 7, 2005, between American Reprographics Company
and Mr. Sathiyamurthy Chandramohan (incorporated by reference to Exhibit 10.30 to the
Registrant’s Registration Statement on Form S-1 A (Reg. No. 333-119788), as amended
on January 13, 2005).ˆ |
50
| |
|
|
|
|
| Number |
|
Description |
| |
|
|
|
|
| |
10.35 |
|
|
First Amendment to Employment Agreement between American Reprographics Company and
Mr. Sathiyamurthy Chandramohan, effective November 18, 2005 (incorporated by
reference to Exhibit 10.36 to the Registrant’s Form 10-K filed on March 16, 2006).ˆ |
| |
|
|
|
|
| |
10.36 |
|
|
Second Amendment to Employment Agreement between American Reprographics Company and
Mr. Sathiyamurthy Chandramohan, effective March 17, 2006 (incorporated by reference
to Exhibit 99.1 to the Registrant’s Form 8-K filed on March 23, 2006).ˆ |
| |
|
|
|
|
| |
10.37 |
|
|
Restricted Stock Award Grant Notice between American Reprographics Company and
Mr. Sathiyamurthy Chandramohan dated March 27, 2007 (incorporated by reference to
Exhibit 99.1 to the Registrant’s Form 8-K filed on March 30, 2007).ˆ |
| |
|
|
|
|
| |
10.38 |
|
|
Employment Agreement, dated January 7, 2005, between American Reprographics Company
and Mr. Kumarakulasingam Suriyakumar (incorporated by reference to Exhibit 10.31 to
the Registrant’s Registration Statement on Form S-1 A (Reg. No. 333-119788), as
amended on January 13, 2005).ˆ |
| |
|
|
|
|
| |
10.39 |
|
|
First Amendment to Employment Agreement between American Reprographics Company and
Mr. Kumarakulasingam Suriyakumar, effective November 18, 2005 (incorporated by
reference to Exhibit 10.38 to the Registrant’s Form 10-K filed on March 16, 2006).ˆ |
| |
|
|
|
|
| |
10.40 |
|
|
Second Amendment to Employment Agreement between American Reprographics Company and
Mr. Kumarakulasingam Suriyakumar, effective March 17, 2006 (incorporated by reference
to Exhibit 99.2 to the Registrant’s Form 8-K filed on March 23, 2006).ˆ |
| |
|
|
|
|
| |
10.41 |
|
|
Third Amendment to Employment Agreement between American Reprographics Company and
Mr. Kumarakulasingam Suriyakumar, dated July 27, 2007 (incorporated by reference to
Exhibit 99.1 to the Registrant’s Form 8-K filed on August 1, 2007).ˆ |
| |
|
|
|
|
| |
10.42 |
|
|
Fourth Amendment to Executive Employment Agreement, dated March 11, 2009 by and
between American Reprographics Company and Mr. Kumarakulasingam Suriyakumar
(incorporated by reference to Exhibit 10.1 to the Registrant’s Form 8-K filed on
March 11, 2009).ˆ |
| |
|
|
|
|
| |
10.43 |
|
|
Restricted Stock Award Grant Notice between American Reprographics Company and
Mr. Kumarakulasingam Suriyakumar dated March 27, 2007 (incorporated by reference to
Exhibit 99.2 to the Registrant’s Form 8-K filed on March 30, 2007).ˆ |
| |
|
|
|
|
| |
10.44 |
|
|
Employment Agreement, dated January 7, 2005, between American Reprographics Company
and Mr. Mark W. Legg (incorporated by reference to Exhibit 10.32 to the Registrant’s
Registration Statement on Form S-1 A (Reg. No. 333-119788), as amended on January 13,
2005).ˆ |
| |
|
|
|
|
| |
10.45 |
|
|
Employment Agreement, dated January 7, 2005, between American Reprographics Company
and Mr. Rahul K. Roy (incorporated by reference to Exhibit 10.33 to the Registrant’s
Registration Statement on Form S-1 A (Reg. No. 333-119788), as amended on January 13,
2005).ˆ |
| |
|
|
|
|
| |
10.46 |
|
|
First Amendment to Executive Employment Agreement between American Reprographics
Company and Mr. Rahul K. Roy, effective April 17, 2008 (incorporated by reference to
Exhibit 10.2 to the Registrant’s Form 10-Q filed on August 8, 2008).ˆ |
| |
|
|
|
|
| |
10.47 |
|
|
Second Amendment to Executive Employment Agreement between American Reprographics
Company and Mr. Rahul K. Roy, effective December 22, 2008 (incorporated by reference
to Exhibit 10.69 to the Registrant’s Form 10-K filed on February 27, 2009)ˆ |
| |
|
|
|
|
| |
10.48 |
|
|
Third Amendment to Executive Employment Agreement, dated March 11, 2009, by and
between American Reprographics Company and Mr. Rahul K. Roy (incorporated by
reference to Exhibit 10.3 to the Registrant’s Form 8-K filed on March 11, 2009). ˆ |
51
| |
|
|
|
|
| Number |
|
Description |
| |
|
|
|
|
| |
10.49 |
|
|
Agreement to Grant Stock dated effective December 7, 2004, between American
Reprographics Company and Mr. Rahul K. Roy (incorporated by reference to
Exhibit 10.36 to the Registrant’s Form 10-K filed on March 31, 2005).ˆ |
| |
|
|
|
|
| |
10.50 |
|
|
First Amendment to Agreement to Grant Stock dated May 17, 2006 between American
Reprographics Company and Mr. Rahul K. Roy (incorporated by reference to
Exhibit 10.48 to the Registrant’s Form 10-K filed on March 1, 2007).ˆ |
| |
|
|
|
|
| |
10.51 |
|
|
Executive Employment Agreement between American Reprographics Company and Mr.
Jonathan R. Mather dated November 29, 2006 (incorporated by reference to Exhibit 99.2
to the Registrant’s Form 8-K filed on November 30, 2006).ˆ |
| |
|
|
|
|
| |
10.52 |
|
|
First Amendment to Executive Employment Agreement between American Reprographics
Company and Mr. Jonathan R. Mather, effective April 17, 2008 (incorporated by
reference to Exhibit 10.1 to the Registrant’s Form 10-Q filed on August 8, 2008).ˆ |
| |
|
|
|
|
| |
10.53 |
|
|
Second Amendment to Executive Employment Agreement, dated March 11, 2009, by and
between American Reprographics Company and Mr. Jonathan R. Mather (incorporated by
reference to Exhibit 10.2 to the Registrant’s Form 8-K filed on March 11, 2009). ˆ |
| |
|
|
|
|
| |
10.54 |
|
|
Restricted Stock Award Grant Notice between American Reprographics Company and Mr.
Jonathan R. Mather dated April 17, 2008 (incorporated by reference to Exhibit 99.3 to
the Registrant’s Form 8-K filed on April 22, 2008). ˆ |
| |
|
|
|
|
| |
10.55 |
|
|
2007 Bonus Plan, dated February 20, 2007, between American Reprographics Company and
Mr. Jonathan R. Mather (incorporated by reference to Exhibit 10.60 to the
Registrant’s Form 10-K filed on February 27, 2008).ˆ |
| |
|
|
|
|
| |
10.56 |
|
|
Executive Employment Agreement between American Reprographics Company and Dilantha
Wijesuriya dated February 23, 2009 (incorporated by reference to Exhibit 10.2 to the
Registrant’s Form 8-K filed on February 25, 2009). ˆ |
| |
|
|
|
|
| |
10.57 |
|
|
First Amendment to Executive Employment Agreement, dated March 11, 2009, by and
between American Reprographics Company and Mr. Dilantha Wijesuriya (incorporated by
reference to Exhibit 10.4 to the Registrant’s Form 8-K filed on March 11, 2009). ˆ |
| |
|
|
|
|
| |
10.58 |
|
|
Indemnification Agreement dated February 23, 2009 between American Reprographics
Company and Dilantha Wijesuriya (incorporated by reference to Exhibit 10.1 to the
Registrant’s Form 8-K filed on February 25, 2009). |
| |
|
|
|
|
| |
10.59 |
|
|
Indemnification Agreement made as of December 4, 2006 between American Reprographics
Company and Jonathan Mather (incorporated by reference to Exhibit 10.50 to the
Registrant’s Form 10-K filed on March 1, 2007). |
| |
|
|
|
|
| |
10.60 |
|
|
Indemnification Agreement made as of September 30, 2004 between American
Reprographics Company and Sathiyamurthy Chandramohan (incorporated by reference to
Exhibit 10.37 to the Registrant’s Form 10-K filed on March 31, 2005). |
| |
|
|
|
|
| |
10.61 |
|
|
Indemnification Agreement made as of September 30, 2004 between American
Reprographics Company and Andrew W. Code (incorporated by reference to Exhibit 10.38
to the Registrant’s Form 10-K filed on March 31, 2005). |
| |
|
|
|
|
| |
10.62 |
|
|
Indemnification Agreement made as of September 30, 2004 between American
Reprographics Company and Thomas J. Formolo (incorporated by reference to
Exhibit 10.39 to the Registrant’s Form 10-K filed on March 31, 2005). |
52
| |
|
|
|
|
| Number |
|
Description |
| |
|
|
|
|
| |
10.63 |
|
|
Indemnification Agreement made as of October 7, 2004 between American Reprographics
Company and Mark W. Legg (incorporated by reference to Exhibit 10.40 to the
Registrant’s Form 10-K filed on March 31, 2005). |
| |
|
|
|
|
| |
10.64 |
|
|
Indemnification Agreement made as of September 30, 2004 between American
Reprographics Company and Manuel Perez de la Mesa (incorporated by reference to
Exhibit 10.41 to the Registrant’s Form 10-K filed on March 31, 2005). |
| |
|
|
|
|
| |
10.65 |
|
|
Indemnification Agreement made as of January 11, 2005 between American Reprographics
Company and Edward D. Horowitz (incorporated by reference to Exhibit 10.42 to the
Registrant’s Form 10-K filed on March 31, 2005). |
| |
|
|
|
|
| |
10.66 |
|
|
Indemnification Agreement made as of March 3, 2005 between American Reprographics
Company and Mark W. Mealy (incorporated by reference to Exhibit 10.43 to the
Registrant’s Form 10-K filed on March 31, 2005). |
| |
|
|
|
|
| |
10.67 |
|
|
Indemnification Agreement made as of September 30, 2004 between American
Reprographics Company and Kumarakulasingam Suriyakumar (incorporated by reference to
Exhibit 10.44 to the Registrant’s Form 10-K filed on March 31, 2005). |
| |
|
|
|
|
| |
10.68 |
|
|
Indemnification Agreement made as of October 7, 2004 between American Reprographics
Company and Rahul K. Roy (incorporated by reference to Exhibit 10.45 to the
Registrant’s Form 10-K filed on March 31, 2005). |
| |
|
|
|
|
| |
10.69 |
|
|
Indemnification Agreement made as of February 2, 2006 between American Reprographics
Company and Dewitt Kerry McCluggage (incorporated by reference to Exhibit 10.51 to
the Registrant’s Form 10-K filed on March 16, 2006). |
| |
|
|
|
|
| |
10.70 |
|
|
Indemnification Agreement made as of May 22, 2006, between American Reprographics
Company and Eriberto R. Scocimara (incorporated by reference to Exhibit 10.61 to the
Registrant’s Form 10-K filed on March 1, 2007). |
| |
|
|
|
|
| |
10.71 |
|
|
Indemnification Agreement made as of March 11, 2009, between American Reprographics
Company and James F. McNulty (incorporated by reference to Exhibit 10.1 to the
Registrant’s Form 8-K filed on June 25, 2009). |
| |
|
|
|
|
| |
10.72 |
|
|
Consulting Agreement dated February 28, 2007 between American Reprographics Company,
L.L.C. and Legg Consulting L.L.C. (incorporated by reference to Exhibit 10.62 to the
Registrant’s Form 10-K filed on March 1, 2007). |
| |
|
|
|
|
| |
10.73 |
|
|
Consulting Agreement between Sathiyamurthy Chandramohan and American Reprographics
Company, dated July 24, 2008 (incorporated by reference to Exhibit 10.4 to the
Registrant’s Form 10-Q filed on August 8, 2008). ˆ |
| |
|
|
|
|
| |
10.74 |
|
|
Credit and Guaranty Agreement dated as of December 6, 2007 by and among American
Reprographics Company, American Reprographics Company, L.L.C., certain subsidiaries
of American Reprographics Company, L.L.C., as guarantor, JPMorgan Chase Bank, N.A.,
as administrative agent and collateral agents, J.P. Morgan Securities, Inc. and
Wachovia Capital Markets, LLC, as joint bookrunners and joint lead arrangers, and
Wachovia Bank, National Association, as syndication agent (incorporated by reference
to Exhibit 10.1 to the Registrant’s Form 8-K filed on December 7, 2007). |
| |
|
|
|
|
| |
10.75 |
|
|
Second Amendment to Credit and Guaranty Agreement dated as of October 5, 2009 by and
among American Reprographics Company, American Reprographics Company, L.L.C.,
JPMorgan Chase Bank, N.A., as administrative and collateral agent, and the other
lenders named therein (incorporated by reference to Exhibit 10.1 to the Registrant’s
Form 8-K filed on October 6, 2009). |
53
| |
|
|
|
|
| Number |
|
Description |
| |
|
|
|
|
| |
10.76 |
|
|
Security Agreement dated as of December 6, 2007 by and among American Reprographics
Company, American Reprographics Company, L.L.C., the other Grantors party thereto and
JPMorgan Chase Bank, N.A. as collateral agent (incorporated by reference to
Exhibit 10.58 to the Registrant’s Form 10-K filed on February 27, 2008). |
| |
|
|
|
|
| |
10.77 |
|
|
ISDA Master Agreement dated as of December 19, 2007 by and among American
Reprographics Company, American Reprographics Company, L.L.C., and Wells Fargo Bank
N.A. (incorporated by reference to Exhibit 10.1 to the Registrant’s Form 8-K filed on
December 26, 2007). |
| |
|
|
|
|
| |
10.78 |
|
|
First Amended and Restated ISDA Confirmation dated October 2, 2009 by and among
American Reprographics Company, American Reprographics Company, L.L.C., and Wells
Fargo Bank N.A. (incorporated by reference to Exhibit 10.2 to the Registrant’s
Form 8-K filed on October 6, 2009). |
| |
|
|
|
|
| |
10.79 |
|
|
Restricted Stock Award Grant Notice between American Reprographics Company and
Dilantha Wijesuriya dated October 28, 2009. * ˆ |
| |
|
|
|
|
| |
10.80 |
|
|
Consent dated as of December 11, 2009, for the premises commonly known as 17721
Mitchell North, Irvine, CA by and between Sumo Holdings Irvine, LLC, OCB, LLC and
American Reprographics Company, L.L.C.* |
| |
|
|
|
|
| |
10.81 |
|
|
First Amendment and Waiver to Credit and Guaranty Agreement dated as of February 13,
2009 by and between American Reprographics Company, American Reprographics Company,
L.L.C., JPMorgan Chase Bank, N.A., Wachovia Bank, National Association, Bank of
America, N.A., and Wells Fargo Bank, N.A. * |
| |
|
|
|
|
| |
10.82 |
|
|
Third Amendment to Credit and Guaranty Agreement dated as of December 16, 2009 by and
among American Reprographics Company, American Reprographics Company, L.L.C.,
JPMorgan Chase Bank, N.A., as administrative and collateral agent, and the other
lenders named therein.* |
| |
|
|
|
|
| |
16.1 |
|
|
Letter from PricewaterhouseCoopers LLP addressed to the United States Securities and
Exchange Commission,dated March 31, 2009 (incorporated by reference to Exhibit 16 to
the Registrant’s Form 8-K filed on April 2, 2009). |
| |
|
|
|
|
| |
21.1 |
|
|
List of Subsidiaries.* |
| |
|
|
|
|
| |
23.1 |
|
|
Consent of Deloitte & Touche LLP, Independent Registered Public Accounting Firm.* |
| |
|
|
|
|
| |
23.2 |
|
|
Consent of PricewaterhouseCoopers LLP, Independent Registered Public Accounting Firm.* |
| |
|
|
|
|
| |
31.1 |
|
|
Certification of Principal Executive Officer pursuant to Rules 13a-14(a)/15d-14(a) of
the Securities Exchange Act of 1934, as adopted pursuant to Section 302 of the
Sarbanes-Oxley Act of 2002.* |
| |
|
|
|
|
| |
31.2 |
|
|
Certification of Principal Financial Officer pursuant to Rules 13a-14(a)/15d-14(a) of
the Securities Exchange Act of 1934, as adopted pursuant to Section 302 of the
Sarbanes-Oxley Act of 2002.* |
| |
|
|
|
|
| |
32.1 |
|
|
Certification of Chief Executive Officer pursuant to 18 U.S.C. Section 1350, as
adopted pursuant to Section 906 of the Sarbanes-Oxley Act of 2002.* |
| |
|
|
|
|
| |
32.2 |
|
|
Certification of Chief Financial Officer pursuant to 18 U.S.C. Section 1350, as
adopted pursuant to Section 906 of the Sarbanes-Oxley Act of 2002.* |
| |
|
|
| * |
|
Filed herewith |
| |
| ˆ |
|
Indicates management contract or compensatory plan or agreement |
54
SIGNATURES
Pursuant to the requirements of Section 13 or 15(d) of the Securities Exchange Act of 1934,
the Registrant has duly caused this report to be signed on its behalf by the undersigned,
thereunto duly authorized.
| |
|
|
|
|
| |
AMERICAN REPROGRAPHICS COMPANY
|
|
| |
By: |
/s/ KUMARAKULASINGAM SURIYAKUMAR |
|
| |
|
Chairman, President and Chief Executive Officer |
|
| |
|
|
|
| |
Date: February 26, 2010
Pursuant to the requirements of the Securities Exchange Act of 1934, this report has been
signed below by the following persons on behalf of the registrant in the capacities and on the
dates indicated.
| |
|
|
|
|
| Signature |
|
Title |
|
Date |
|
|
|
|
|
/s/ KUMARAKULASINGAM SURIYAKUMAR
Kumarakulasingam Suriyakumar
|
|
Chairman, President
and
Chief Executive
Officer and
Director
(Principal
Executive Officer)
|
|
February 26, 2010 |
|
|
|
|
|
/s/ JONATHAN R. MATHER
Jonathan R. Mather
|
|
Chief Financial
Officer and
Secretary
(Principal
Financial Officer
and
Principal
Accounting Officer)
|
|
February 26, 2010 |
|
|
|
|
|
/s/ THOMAS J. FORMOLO
Thomas J. Formolo
|
|
Director
|
|
February 26, 2010 |
|
|
|
|
|
/s/ ERIBERTO SCOCIMARA
Eriberto Scocimara
|
|
Director
|
|
February 26, 2010 |
|
|
|
|
|
/s/ DEWITT KERRY MCCLUGGAGE
Dewitt Kerry McCluggage
|
|
Director
|
|
February 26, 2010 |
|
|
|
|
|
/s/ JAMES F. MCNULTY
James F. McNulty
|
|
Director
|
|
February 26, 2010 |
|
|
|
|
|
/s/ MARK W. MEALY
Mark W. Mealy
|
|
Director
|
|
February 26, 2010 |
|
|
|
|
|
/s/ MANUEL PEREZ DE LA MESA
Manuel Perez de la Mesa
|
|
Director
|
|
February 26, 2010 |
55
INDEX TO CONSOLIDATED FINANCIAL STATEMENTS
| |
|
|
|
|
|
|
|
|
|
|
|
|
|
|
|
|
|
|
|
Deloitte & Touche LLP |
|
|
F-2 |
|
|
|
|
|
|
PricewaterhouseCoopers LLP |
|
|
F-3 |
|
|
|
|
|
|
|
|
|
F-4 |
|
|
|
|
|
|
|
|
|
F-5 |
|
|
|
|
|
|
|
|
|
F-6 |
|
|
|
|
|
|
|
|
|
F-7 |
|
|
|
|
|
|
|
|
|
F-8 |
|
|
|
|
|
|
Financial Statement Schedule: |
|
|
|
|
|
|
|
|
|
|
|
|
F-31 |
|
|
|
|
|
|
F-1
REPORT OF INDEPENDENT REGISTERED PUBLIC ACCOUNTING FIRM
To the Board of Directors and Stockholders of
American Reprographics Company
Walnut Creek, California
We have audited the accompanying consolidated balance sheet of American Reprographics Company and
subsidiaries (the “Company”) as of December 31, 2009, and the related consolidated statements of
operations, stockholders’ equity and comprehensive income (loss), and cash flows for the year then
ended. Our audit also includes the financial statement schedule listed in the Index at Item 15.
These financial statements and financial statement schedule are the responsibility of the Company’s
management. Our responsibility is to express an opinion on the financial statements and financial
statement schedule based on our audit.
We conducted our audit in accordance with the standards of the Public Company Accounting Oversight
Board (United States). Those standards require that we plan and perform the audit to obtain
reasonable assurance about whether the financial statements are free of material misstatement. An
audit includes examining, on a test basis, evidence supporting the amounts and disclosures in the
financial statements. An audit also includes assessing the accounting principles used and
significant estimates made by management, as well as evaluating the overall financial statement
presentation. We believe that our audit and the report of the other auditors provide a reasonable
basis for our opinion.
In our opinion, such consolidated financial statements present fairly, in all material respects,
the financial position of American Reprographics Company and subsidiaries as of December 31, 2009,
and the results of their operations and their cash flows for the year then ended in conformity with
accounting principles generally accepted in the United States of America. Also, in our opinion,
such financial statement schedule, when considered in relation to the basic consolidated financial
statements taken as a whole, present fairly, in all material respects, the information set forth
therein.
As discussed in Note 2 to the consolidated financial statements, on January 1, 2009, the Company
changed its method of accounting for noncontrolling interests in consolidated subsidiaries.
We have also audited, in accordance with the standards of the Public Company Accounting Oversight
Board (United States), the Company’s internal control over financial reporting as of December 31,
2009, based on the criteria established in Internal Control—Integrated Framework issued by the
Committee of Sponsoring Organizations of the Treadway Commission and our report dated February 26,
2010 expressed an unqualified opinion on the Company’s internal control over financial reporting.
/s/ DELOITTE & TOUCHE LLP
Los Angeles, California
February 26, 2010
F-2
REPORT OF INDEPENDENT REGISTERED PUBLIC ACCOUNTING FIRM
To the Board of Directors and Shareholders of American Reprographics Company:
In our opinion, the consolidated financial statements listed in the index appearing under Item
15(a)(1) present fairly, in all material respects, the financial position of American Reprographics
Company at December 31, 2008 and the results of its operations and its cash flows for each of the
two years in the period ended December 31, 2008 in conformity with accounting principles generally
accepted in the United States of America. In addition, in our opinion, the financial statement
schedule listed in the index appearing under Item 15(a)(2) presents fairly, in all material
respects, the information set forth therein when read in conjunction with the related consolidated
financial statements. These financial statements and financial statement schedule are the
responsibility of the Company’s management. Our responsibility is to express an opinion on these
financial statements and financial statement schedule based on our audits. We conducted our audits
of these statements in accordance with the standards of the Public Company Accounting Oversight
Board (United States). Those standards require that we plan and perform the audit to obtain
reasonable assurance about whether the financial statements are free of material misstatement. An
audit includes examining, on a test basis, evidence supporting the amounts and disclosures in the
financial statements, assessing the accounting principles used and significant estimates made by
management, and evaluating the overall financial statement presentation. We believe that our audits
provide a reasonable basis for our opinion.
/s/ PricewaterhouseCoopers LLP
Los Angeles, California
February 27, 2009, except for the effects of the change in the manner in which the Company accounts
for noncontrolling interest in consolidated subsidiaries as discussed in Note 2, as to which the
date is February 26, 2010
F-3
AMERICAN REPROGRAPHICS COMPANY AND SUBSIDIARIES
CONSOLIDATED BALANCE SHEETS
(Dollars in thousands, except per share data)
| |
|
|
|
|
|
|
|
|
| |
|
December 31, |
|
|
December 31, |
|
| |
|
2009 |
|
|
2008 |
|
Assets |
|
|
|
|
|
|
|
|
Current assets: |
|
|
|
|
|
|
|
|
Cash and cash equivalents |
|
$ |
29,377 |
|
|
$ |
46,542 |
|
Accounts receivable, net of allowances for accounts receivable of $4,685 and $5,424 at December 31, 2009 and December 31, 2008, respectively |
|
|
53,919 |
|
|
|
77,216 |
|
Inventories, net |
|
|
10,605 |
|
|
|
11,097 |
|
Deferred income taxes |
|
|
5,568 |
|
|
|
5,831 |
|
Prepaid expenses and other current assets |
|
|
7,011 |
|
|
|
11,976 |
|
|
|
|
|
|
|
|
Total current assets |
|
|
106,480 |
|
|
|
152,662 |
|
|
|
|
|
|
|
|
|
|
Property and equipment, net |
|
|
74,568 |
|
|
|
89,712 |
|
Goodwill |
|
|
332,518 |
|
|
|
366,513 |
|
Other intangible assets, net |
|
|
74,208 |
|
|
|
85,967 |
|
Deferred financing costs, net |
|
|
4,082 |
|
|
|
3,537 |
|
Deferred income taxes |
|
|
26,987 |
|
|
|
25,404 |
|
Other assets |
|
|
2,111 |
|
|
|
2,136 |
|
|
|
|
|
|
|
|
Total assets |
|
$ |
620,954 |
|
|
$ |
725,931 |
|
|
|
|
|
|
|
|
|
|
|
|
|
|
|
|
|
Liabilities and Stockholders’ Equity |
|
|
|
|
|
|
|
|
Current liabilities: |
|
|
|
|
|
|
|
|
Accounts payable |
|
$ |
23,355 |
|
|
$ |
25,171 |
|
Accrued payroll and payroll-related expenses |
|
|
8,804 |
|
|
|
13,587 |
|
Accrued expenses |
|
|
24,540 |
|
|
|
24,913 |
|
Current portion of long-term debt and capital leases |
|
|
53,520 |
|
|
|
59,193 |
|
|
|
|
|
|
|
|
Total current liabilities |
|
|
110,219 |
|
|
|
122,864 |
|
|
|
|
|
|
|
|
|
|
Long-term debt and capital leases |
|
|
220,711 |
|
|
|
301,847 |
|
Other long-term liabilities |
|
|
8,000 |
|
|
|
13,318 |
|
|
|
|
|
|
|
|
|
|
|
|
|
|
|
|
|
Total liabilities |
|
|
338,930 |
|
|
|
438,029 |
|
|
|
|
|
|
|
|
|
|
|
|
|
|
|
|
|
Commitments and contingencies (Note 9) |
|
|
|
|
|
|
|
|
|
|
|
|
|
|
|
|
|
Stockholders’ equity: |
|
|
|
|
|
|
|
|
Preferred stock, $0.001 par value, 25,000,000 shares authorized;
zero and zero shares issued and outstanding |
|
|
— |
|
|
|
— |
|
Common stock, $0.001 par value, 150,000,000 shares authorized;
46,112,653 and 45,674,810 shares issued and 45,664,999 and
45,227,156 shares outstanding in 2009 and 2008, respectively |
|
|
46 |
|
|
|
46 |
|
Additional paid-in capital |
|
|
89,982 |
|
|
|
85,207 |
|
Deferred stock-based compensation |
|
|
— |
|
|
|
(195 |
) |
Retained earnings |
|
|
200,961 |
|
|
|
215,846 |
|
Accumulated other comprehensive loss |
|
|
(7,273 |
) |
|
|
(11,414 |
) |
|
|
|
|
|
|
|
|
|
|
283,716 |
|
|
|
289,490 |
|
Less cost of common stock in treasury, 447,654 shares in 2009 and 2008 |
|
|
7,709 |
|
|
|
7,709 |
|
|
|
|
|
|
|
|
Total American Reprographics Company stockholders’ equity |
|
|
276,007 |
|
|
|
281,781 |
|
Noncontrolling interest |
|
|
6,017 |
|
|
|
6,121 |
|
|
|
|
|
|
|
|
Total stockholders’ equity |
|
|
282,024 |
|
|
|
287,902 |
|
|
|
|
|
|
|
|
Total liabilities and stockholders’ equity |
|
$ |
620,954 |
|
|
$ |
725,931 |
|
|
|
|
|
|
|
|
The accompanying notes are an integral part of these consolidated financial statements.
F-4
AMERICAN REPROGRAPHICS COMPANY AND SUBSIDIARIES
CONSOLIDATED STATEMENTS OF OPERATIONS
(Dollars in thousands, except per share data)
| |
|
|
|
|
|
|
|
|
|
|
|
|
| |
|
Year Ended December 31, |
|
| |
|
2009 |
|
|
2008 |
|
|
2007 |
|
Reprographics services |
|
$ |
350,491 |
|
|
$ |
518,062 |
|
|
$ |
513,630 |
|
Facilities management |
|
|
97,401 |
|
|
|
120,983 |
|
|
|
113,848 |
|
Equipment and supplies sales |
|
|
53,657 |
|
|
|
61,942 |
|
|
|
60,876 |
|
|
|
|
|
|
|
|
|
|
|
Total net sales |
|
|
501,549 |
|
|
|
700,987 |
|
|
|
688,354 |
|
Cost of sales |
|
|
323,360 |
|
|
|
415,715 |
|
|
|
401,317 |
|
|
|
|
|
|
|
|
|
|
|
Gross profit |
|
|
178,189 |
|
|
|
285,272 |
|
|
|
287,037 |
|
Selling, general and administrative expenses |
|
|
115,020 |
|
|
|
154,728 |
|
|
|
143,811 |
|
Litigation gain |
|
|
— |
|
|
|
— |
|
|
|
(2,897 |
) |
Amortization of intangible assets |
|
|
11,367 |
|
|
|
12,004 |
|
|
|
9,083 |
|
Goodwill impairment |
|
|
37,382 |
|
|
|
35,154 |
|
|
|
— |
|
Impairment of long-lived assets |
|
|
781 |
|
|
|
— |
|
|
|
— |
|
|
|
|
|
|
|
|
|
|
|
Income from operations |
|
|
13,639 |
|
|
|
83,386 |
|
|
|
137,040 |
|
Other income, net |
|
|
(171 |
) |
|
|
(517 |
) |
|
|
— |
|
Interest expense, net |
|
|
25,781 |
|
|
|
25,890 |
|
|
|
24,373 |
|
Loss on early extinguishment of debt |
|
|
— |
|
|
|
— |
|
|
|
1,327 |
|
|
|
|
|
|
|
|
|
|
|
(Loss) income before income tax provision |
|
|
(11,971 |
) |
|
|
58,013 |
|
|
|
111,340 |
|
Income tax provision |
|
|
3,018 |
|
|
|
21,200 |
|
|
|
42,203 |
|
|
|
|
|
|
|
|
|
|
|
Net (loss) income |
|
|
(14,989 |
) |
|
|
36,813 |
|
|
|
69,137 |
|
Loss (income) attributable to noncontrolling interest |
|
|
104 |
|
|
|
(59 |
) |
|
|
— |
|
|
|
|
|
|
|
|
|
|
|
Net (loss) income attributable to American
Reprographics Company |
|
$ |
(14,885 |
) |
|
$ |
36,754 |
|
|
$ |
69,137 |
|
|
|
|
|
|
|
|
|
|
|
|
|
|
|
|
|
|
|
|
|
|
|
|
(Loss) earnings per share attributable to American Reprographics Company shareholders: |
|
|
|
|
|
|
|
|
|
|
|
|
Basic |
|
$ |
(0.33 |
) |
|
$ |
0.82 |
|
|
$ |
1.52 |
|
|
|
|
|
|
|
|
|
|
|
Diluted |
|
$ |
(0.33 |
) |
|
$ |
0.81 |
|
|
$ |
1.51 |
|
|
|
|
|
|
|
|
|
|
|
|
|
|
|
|
|
|
|
|
|
|
|
|
Weighted average common shares outstanding: |
|
|
|
|
|
|
|
|
|
|
|
|
Basic |
|
|
45,123,110 |
|
|
|
45,060,482 |
|
|
|
45,421,498 |
|
Diluted |
|
|
45,123,110 |
|
|
|
45,398,086 |
|
|
|
45,829,010 |
|
The accompanying notes are an integral part of these consolidated financial statements.
F-5
AMERICAN REPROGRAPHICS COMPANY AND SUBSIDIARIES
CONSOLIDATED
STATEMENTS OF STOCKHOLDERS’ EQUITY AND COMPREHENSIVE INCOME (LOSS)
(Dollars in thousands, except per share data)
| |
|
|
|
|
|
|
|
|
|
|
|
|
|
|
|
|
|
|
|
|
|
|
|
|
|
|
|
|
|
|
|
|
|
|
|
|
| |
|
American Reprographics Company Shareholders |
|
|
|
|
|
|
|
|
| |
|
|
|
|
|
|
|
|
|
|
|
|
|
|
|
|
|
|
|
|
|
Accumulated |
|
|
|
|
|
|
|
|
|
|
|
| |
|
Common Stock |
|
|
Additional |
|
|
|
|
|
|
|
|
|
|
Other |
|
|
Common |
|
|
|
|
|
|
Total |
|
| |
|
|
|
|
|
Par |
|
|
Paid-In |
|
|
Deferred |
|
|
Retained |
|
|
Comprehensive |
|
|
Stock in |
|
|
Noncontrolling |
|
|
Stockholders’ |
|
| |
|
Shares |
|
|
Value |
|
|
Capital |
|
|
Compensation |
|
|
Earnings |
|
|
Loss |
|
|
Treasury |
|
|
Interest |
|
|
Equity |
|
Balance at December 31, 2006 |
|
|
45,346,099 |
|
|
$ |
45 |
|
|
$ |
75,465 |
|
|
$ |
(1,224 |
) |
|
$ |
109,955 |
|
|
$ |
3 |
|
|
$ |
— |
|
|
$ |
— |
|
|
$ |
184,244 |
|
Stock-based compensation |
|
|
41,524 |
|
|
|
|
|
|
|
2,917 |
|
|
|
551 |
|
|
|
|
|
|
|
|
|
|
|
|
|
|
|
|
|
|
|
3,468 |
|
Issuance of common stock under Employee Stock
Purchase Plan |
|
|
4,600 |
|
|
|
|
|
|
|
100 |
|
|
|
|
|
|
|
|
|
|
|
|
|
|
|
|
|
|
|
|
|
|
|
100 |
|
Stock options exercised |
|
|
169,550 |
|
|
|
1 |
|
|
|
1,108 |
|
|
|
|
|
|
|
|
|
|
|
|
|
|
|
|
|
|
|
|
|
|
|
1,109 |
|
Net tax benefit from stock-based compensation |
|
|
|
|
|
|
|
|
|
|
1,563 |
|
|
|
|
|
|
|
|
|
|
|
|
|
|
|
|
|
|
|
|
|
|
|
1,563 |
|
Comprehensive income |
|
|
|
|
|
|
|
|
|
|
|
|
|
|
|
|
|
|
|
|
|
|
|
|
|
|
|
|
|
|
|
|
|
|
|
|
Net income |
|
|
|
|
|
|
|
|
|
|
|
|
|
|
|
|
|
|
69,137 |
|
|
|
|
|
|
|
|
|
|
|
|
|
|
|
69,137 |
|
Foreign currency translation |
|
|
|
|
|
|
|
|
|
|
|
|
|
|
|
|
|
|
|
|
|
|
676 |
|
|
|
|
|
|
|
|
|
|
|
676 |
|
Gain (loss) on derivative, net of
tax effect |
|
|
|
|
|
|
|
|
|
|
|
|
|
|
|
|
|
|
|
|
|
|
(937 |
) |
|
|
|
|
|
|
|
|
|
|
(937 |
) |
|
|
|
|
|
|
|
|
|
|
|
|
|
|
|
|
|
|
|
|
|
|
|
|
|
|
|
|
|
|
|
|
|
|
|
|
Comprehensive income |
|
|
|
|
|
|
|
|
|
|
|
|
|
|
|
|
|
|
|
|
|
|
|
|
|
|
|
|
|
|
|
|
|
|
68,876 |
|
Purchase of treasury shares |
|
|
(447,654 |
) |
|
|
|
|
|
|
|
|
|
|
|
|
|
|
|
|
|
|
|
|
|
|
(7,709 |
) |
|
|
— |
|
|
|
(7,709 |
) |
|
|
|
|
|
|
|
|
|
|
|
|
|
|
|
|
|
|
|
|
|
|
|
|
|
|
|
|
Balance at December 31, 2007 |
|
|
45,114,119 |
|
|
$ |
46 |
|
|
$ |
81,153 |
|
|
$ |
(673 |
) |
|
$ |
179,092 |
|
|
$ |
(258 |
) |
|
$ |
(7,709 |
) |
|
$ |
— |
|
|
$ |
251,651 |
|
Stock-based compensation |
|
|
78,250 |
|
|
|
|
|
|
|
3,812 |
|
|
|
478 |
|
|
|
|
|
|
|
|
|
|
|
|
|
|
|
|
|
|
|
4,290 |
|
Issuance of common stock under Employee Stock
Purchase Plan |
|
|
3,087 |
|
|
|
|
|
|
|
35 |
|
|
|
|
|
|
|
|
|
|
|
|
|
|
|
|
|
|
|
|
|
|
|
35 |
|
Stock options exercised |
|
|
31,700 |
|
|
|
|
|
|
|
177 |
|
|
|
|
|
|
|
|
|
|
|
|
|
|
|
|
|
|
|
|
|
|
|
177 |
|
Net Tax benefit from stock-based compensation |
|
|
|
|
|
|
|
|
|
|
30 |
|
|
|
|
|
|
|
|
|
|
|
|
|
|
|
|
|
|
|
|
|
|
|
30 |
|
Noncontrolling interest resulting from
business combinations |
|
|
|
|
|
|
|
|
|
|
|
|
|
|
|
|
|
|
|
|
|
|
|
|
|
|
|
|
|
|
6,062 |
|
|
|
6,062 |
|
Comprehensive income |
|
|
|
|
|
|
|
|
|
|
|
|
|
|
|
|
|
|
|
|
|
|
|
|
|
|
|
|
|
|
|
|
|
|
|
|
Net income |
|
|
|
|
|
|
|
|
|
|
|
|
|
|
|
|
|
|
36,754 |
|
|
|
|
|
|
|
|
|
|
|
59 |
|
|
|
36,813 |
|
Foreign currency translation |
|
|
|
|
|
|
|
|
|
|
|
|
|
|
|
|
|
|
|
|
|
|
(1,989 |
) |
|
|
|
|
|
|
|
|
|
|
(1,989 |
) |
Gain (loss) on derivative, net of
tax effect |
|
|
|
|
|
|
|
|
|
|
|
|
|
|
|
|
|
|
|
|
|
|
(9,167 |
) |
|
|
|
|
|
|
|
|
|
|
(9,167 |
) |
|
|
|
|
|
|
|
|
|
|
|
|
|
|
|
|
|
|
|
|
|
|
|
|
|
|
|
|
|
|
|
|
|
|
|
|
Comprehensive income |
|
|
|
|
|
|
|
|
|
|
|
|
|
|
|
|
|
|
|
|
|
|
|
|
|
|
|
|
|
|
|
|
|
|
25,657 |
|
|
|
|
|
|
|
|
|
|
|
|
|
|
|
|
|
|
|
|
|
|
|
|
|
|
|
|
|
Balance at December 31, 2008 |
|
|
45,227,156 |
|
|
$ |
46 |
|
|
$ |
85,207 |
|
|
$ |
(195 |
) |
|
$ |
215,846 |
|
|
$ |
(11,414 |
) |
|
$ |
(7,709 |
) |
|
$ |
6,121 |
|
|
$ |
287,902 |
|
Stock-based compensation |
|
|
396,012 |
|
|
|
|
|
|
|
4,697 |
|
|
|
195 |
|
|
|
|
|
|
|
|
|
|
|
|
|
|
|
|
|
|
|
4,892 |
|
Issuance of common stock under Employee Stock
Purchase Plan |
|
|
30,031 |
|
|
|
|
|
|
|
164 |
|
|
|
|
|
|
|
|
|
|
|
|
|
|
|
|
|
|
|
|
|
|
|
164 |
|
Stock options exercised |
|
|
11,800 |
|
|
|
|
|
|
|
63 |
|
|
|
|
|
|
|
|
|
|
|
|
|
|
|
|
|
|
|
|
|
|
|
63 |
|
Tax deficiency from stock-based compensation, net of
tax benefit |
|
|
|
|
|
|
|
|
|
|
(149 |
) |
|
|
|
|
|
|
|
|
|
|
|
|
|
|
|
|
|
|
|
|
|
|
(149 |
) |
Comprehensive loss |
|
|
|
|
|
|
|
|
|
|
|
|
|
|
|
|
|
|
|
|
|
|
|
|
|
|
|
|
|
|
|
|
|
|
|
|
Net loss |
|
|
|
|
|
|
|
|
|
|
|
|
|
|
|
|
|
|
(14,885 |
) |
|
|
|
|
|
|
|
|
|
|
(104 |
) |
|
|
(14,989 |
) |
Foreign currency translation |
|
|
|
|
|
|
|
|
|
|
|
|
|
|
|
|
|
|
|
|
|
|
823 |
|
|
|
|
|
|
|
|
|
|
|
823 |
|
Gain (loss) on derivative, net of
tax effect |
|
|
|
|
|
|
|
|
|
|
|
|
|
|
|
|
|
|
|
|
|
|
3,318 |
|
|
|
|
|
|
|
|
|
|
|
3,318 |
|
|
|
|
|
|
|
|
|
|
|
|
|
|
|
|
|
|
|
|
|
|
|
|
|
|
|
|
|
|
|
|
|
|
|
|
|
Comprehensive loss |
|
|
|
|
|
|
|
|
|
|
|
|
|
|
|
|
|
|
|
|
|
|
|
|
|
|
|
|
|
|
|
|
|
|
(10,848 |
) |
|
|
|
|
|
|
|
|
|
|
|
|
|
|
|
|
|
|
|
|
|
|
|
|
|
|
|
|
Balance at December 31, 2009 |
|
|
45,664,999 |
|
|
$ |
46 |
|
|
$ |
89,982 |
|
|
$ |
— |
|
|
$ |
200,961 |
|
|
$ |
(7,273 |
) |
|
$ |
(7,709 |
) |
|
$ |
6,017 |
|
|
$ |
282,024 |
|
|
|
|
|
|
|
|
|
|
|
|
|
|
|
|
|
|
|
|
|
|
|
|
|
|
|
|
|
The accompanying notes are an integral part of these consolidated financial statements.
F-6
AMERICAN REPROGRAPHICS COMPANY AND SUBSIDIARIES
CONSOLIDATED STATEMENTS OF CASH FLOWS
(Dollars in thousands, except per share data)
| |
|
|
|
|
|
|
|
|
|
|
|
|
| |
|
Year Ended December 31, |
|
| |
|
2009 |
|
|
2008 |
|
|
2007 |
|
Cash flows from operating activities |
|
|
|
|
|
|
|
|
|
|
|
|
Net (loss) income |
|
$ |
(14,989 |
) |
|
$ |
36,813 |
|
|
$ |
69,137 |
|
Adjustments to reconcile net (loss) income to net cash provided by operating activities: |
|
|
|
|
|
|
|
|
|
|
|
|
Allowance for accounts receivable |
|
|
3,044 |
|
|
|
4,966 |
|
|
|
1,315 |
|
Depreciation |
|
|
38,176 |
|
|
|
38,117 |
|
|
|
30,362 |
|
Amortization of intangible assets |
|
|
11,367 |
|
|
|
12,004 |
|
|
|
9,083 |
|
Amortization of deferred financing costs |
|
|
1,357 |
|
|
|
1,267 |
|
|
|
515 |
|
Goodwill impairment |
|
|
37,382 |
|
|
|
35,154 |
|
|
|
— |
|
Impairment of long-lived assets |
|
|
781 |
|
|
|
— |
|
|
|
— |
|
Stock-based compensation |
|
|
4,892 |
|
|
|
4,289 |
|
|
|
3,469 |
|
Excess tax benefit related to stock-based compensation |
|
|
(18 |
) |
|
|
(30 |
) |
|
|
(1,563 |
) |
Deferred income taxes |
|
|
(4,477 |
) |
|
|
(10,172 |
) |
|
|
5,318 |
|
Write-off of deferred financing costs |
|
|
190 |
|
|
|
313 |
|
|
|
1,327 |
|
Litigation charge (gain) |
|
|
— |
|
|
|
— |
|
|
|
(3,315 |
) |
Other noncash items, net |
|
|
(199 |
) |
|
|
(284 |
) |
|
|
(406 |
) |
Changes in operating assets and liabilities, net of effect of business acquisitions: |
|
|
|
|
|
|
|
|
|
|
|
|
Accounts receivable |
|
|
21,099 |
|
|
|
21,556 |
|
|
|
(446 |
) |
Inventory |
|
|
1,344 |
|
|
|
3,134 |
|
|
|
694 |
|
Prepaid expenses and other assets |
|
|
6,302 |
|
|
|
(1,101 |
) |
|
|
44 |
|
Litigation settlement payment |
|
|
— |
|
|
|
— |
|
|
|
(10,500 |
) |
Accounts payable and accrued expenses |
|
|
(8,826 |
) |
|
|
(18,760 |
) |
|
|
(3,648 |
) |
|
|
|
|
|
|
|
|
|
|
Net cash provided by operating activities |
|
|
97,425 |
|
|
|
127,266 |
|
|
|
101,386 |
|
|
|
|
|
|
|
|
|
|
|
Cash flows from investing activities |
|
|
|
|
|
|
|
|
|
|
|
|
Capital expenditures |
|
|
(7,506 |
) |
|
|
(9,033 |
) |
|
|
(8,303 |
) |
Payments for businesses acquired, net of cash acquired
and including other cash payments associated with
the acquisitions |
|
|
(3,527 |
) |
|
|
(23,916 |
) |
|
|
(132,739 |
) |
Restricted cash |
|
|
— |
|
|
|
937 |
|
|
|
7,911 |
|
Other |
|
|
1,684 |
|
|
|
1,205 |
|
|
|
443 |
|
|
|
|
|
|
|
|
|
|
|
Net cash used in investing activities |
|
|
(9,349 |
) |
|
|
(30,807 |
) |
|
|
(132,688 |
) |
|
|
|
|
|
|
|
|
|
|
Cash flows from financing activities |
|
|
|
|
|
|
|
|
|
|
|
|
Proceeds from stock option exercises |
|
|
63 |
|
|
|
177 |
|
|
|
1,108 |
|
Proceeds from issuance of common stock under Employee Stock Purchase Plan |
|
|
164 |
|
|
|
35 |
|
|
|
100 |
|
Treasury stock repurchase |
|
|
— |
|
|
|
— |
|
|
|
(7,709 |
) |
Excess tax benefit related to stock-based compensation |
|
|
18 |
|
|
|
30 |
|
|
|
1,563 |
|
Proceeds from borrowings under long-term debt agreements |
|
|
— |
|
|
|
— |
|
|
|
325,000 |
|
Payments on long-term debt agreements and capital leases |
|
|
(105,008 |
) |
|
|
(51,850 |
) |
|
|
(292,685 |
) |
Net borrowings (repayments) under revolving credit facility |
|
|
1,523 |
|
|
|
(22,000 |
) |
|
|
22,000 |
|
Payment of loan fees |
|
|
(2,092 |
) |
|
|
(726 |
) |
|
|
(5,024 |
) |
|
|
|
|
|
|
|
|
|
|
Net cash (used in) provided by financing activities |
|
|
(105,332 |
) |
|
|
(74,334 |
) |
|
|
44,353 |
|
|
|
|
|
|
|
|
|
|
|
Effect of foreign currency translation on cash balances |
|
|
91 |
|
|
|
(385 |
) |
|
|
109 |
|
|
|
|
|
|
|
|
|
|
|
Net change in cash and cash equivalents |
|
|
(17,165 |
) |
|
|
21,740 |
|
|
|
13,160 |
|
Cash and cash equivalents at beginning of period |
|
|
46,542 |
|
|
|
24,802 |
|
|
|
11,642 |
|
|
|
|
|
|
|
|
|
|
|
Cash and cash equivalents at end of period |
|
$ |
29,377 |
|
|
$ |
46,542 |
|
|
$ |
24,802 |
|
|
|
|
|
|
|
|
|
|
|
Supplemental disclosure of cash flow information |
|
|
|
|
|
|
|
|
|
|
|
|
Cash paid for: |
|
|
|
|
|
|
|
|
|
|
|
|
Interest |
|
$ |
24,733 |
|
|
$ |
26,111 |
|
|
$ |
27,728 |
|
|
|
|
|
|
|
|
|
|
|
Income taxes |
|
$ |
2,507 |
|
|
$ |
33,939 |
|
|
$ |
41,840 |
|
|
|
|
|
|
|
|
|
|
|
Noncash investing and financing activities: |
|
|
|
|
|
|
|
|
|
|
|
|
Capital lease obligations incurred |
|
$ |
16,181 |
|
|
$ |
34,561 |
|
|
$ |
35,263 |
|
Issuance of subordinated notes in connection with the
acquisition of businesses |
|
$ |
466 |
|
|
$ |
10,414 |
|
|
$ |
23,758 |
|
Accrued liabilities in connection with the acquisition of businesses |
|
$ |
— |
|
|
$ |
100 |
|
|
$ |
570 |
|
Accrued liabilities in connection with deferred financing fees |
|
$ |
— |
|
|
$ |
— |
|
|
$ |
663 |
|
Gain (loss) on derivative, net of tax effect |
|
$ |
3,318 |
|
|
$ |
(9,167 |
) |
|
$ |
(937 |
) |
Contribution from noncontrolling interest |
|
$ |
— |
|
|
$ |
6,062 |
|
|
$ |
— |
|
The accompanying notes are an integral part of these consolidated financial statements.
F-7
AMERICAN REPROGRAPHICS COMPANY AND SUBSIDIARIES
NOTES TO CONSOLIDATED FINANCIAL STATEMENTS
(Dollars in thousands, except per share data)
1. DESCRIPTION OF BUSINESS AND BASIS OF PRESENTATION
American Reprographics Company (“ARC” or the “Company”) is the leading reprographics company
in the United States providing business-to-business document management services to the
architectural, engineering and construction industry, or AEC industry. ARC also provides these
services to companies in non-AEC industries, such as aerospace, technology, financial services,
retail, entertainment, and food and hospitality that require sophisticated document management
services. The Company conducts its operations through its wholly-owned operating subsidiary,
American Reprographics Company, L.L.C., a California limited liability company, and its
subsidiaries.
Basis of Presentation
The accompanying Consolidated Financial Statements include the accounts of the Company and its
subsidiaries. All material intercompany accounts and transactions have been eliminated in
consolidation.
All subsequent events have been evaluated through the date the Consolidated Financial
Statements were issued.
The preparation of financial statements in conformity with accounting principles generally
accepted in the United States of America (“GAAP”) requires management to make estimates and
assumptions that affect the amounts reported in the Consolidated Financial Statements and
accompanying notes. The Company evaluates its estimates and assumptions on an ongoing basis and
relies on historical experience and various other factors that it believes to be reasonable under
the circumstances to determine such estimates. Actual results could differ from those estimates and
such differences may be material to the Consolidated Financial Statements.
Risk and Uncertainties
The Company generates the majority of its revenue from sales of products and services provided
to the AEC industry. As a result, the Company’s operating results and financial condition can be
significantly affected by economic factors that influence the AEC industry, such as non-residential
and residential construction spending, GDP growth, interest rates, employment rates, office vacancy
rates, and government expenditures. The effects of the current economic recession in the United
States, and weakness in global economic conditions, have resulted in a significant downturn in the
non-residential and residential portions of the AEC industry. The Company’s management believes
that the AEC industry generally experiences downturns several months after a downturn in the
general economy and that there may be a similar delay in the recovery of the AEC industry following
a recovery in the general economy. Similar to the AEC industry, the reprographics industry
typically lags a recovery in the broader economy. A prolonged downturn in the AEC industry and the
reprographics industry would diminish demand for ARC’s products and services, and would therefore
negatively impact revenues and have a material adverse impact on its business, operating results
and financial condition.
2. SUMMARY OF SIGNIFICANT ACCOUNTING POLICIES
Cash Equivalents
Cash equivalents include demand deposits and short-term investments with a maturity of three
months or less when purchased.
The Company maintains its cash deposits at numerous banks located throughout the United
States, Canada, the United Kingdom and China, which at times, may exceed federally insured limits.
The Company has not experienced any losses in such accounts and believes it is not exposed to any
significant risk on cash and cash equivalents.
Concentrations of Credit Risk and Significant Vendors
Concentrations of credit risk with respect to trade receivables are limited due to a large,
diverse customer base. No individual customer represented more than 2.5% of net sales during the
years ended December 31, 2009, 2008 and 2007.
The Company has geographic concentration risk as sales in California, as a percent of total
sales, were approximately 33%, 36% and 42% for the years ended December 31, 2009, 2008 and 2007,
respectively.
F-8
The Company contracts with various suppliers. Although there are a limited number of suppliers
that could supply the Company’s inventory, management believes any shortfalls from existing
suppliers would be absorbed from other suppliers on
comparable terms. However, a change in suppliers could cause a delay in sales and adversely
effect results.
Purchases from the Company’s three largest vendors during the years ended December 31, 2009,
2008 and 2007 comprised approximately 51%, 42%, and 47% respectively, of the Company’s total
purchases of inventory and supplies.
Allowance for Doubtful Accounts
The Company performs periodic credit evaluations of the financial condition of its customers,
monitor collections and payments from customers, and generally do not require collateral. The
Company provides for the possible inability to collect accounts receivable by recording an
allowance for doubtful accounts. The Company writes off an account when it is considered
uncollectible. The Company estimates the allowance for doubtful accounts based on historical
experience, aging of accounts receivable, and information regarding the creditworthiness of its
customers. Additionally, the Company provides an allowance for returns and discounts based on
historical experience. In 2009, 2008, and 2007 the Company recorded expenses of $3,044, $4,966 and
$1,315, respectively, related to the allowance for doubtful accounts.
Inventories
Inventories are valued at the lower of cost (determined on a first-in, first-out basis; or
average cost) or market. Inventories primarily consist of reprographics materials for use and
resale, and equipment for resale. On an ongoing basis, inventories are reviewed and adjusted for
estimated obsolescence or unmarketable inventories to reflect the lower of cost or market. Charges
to increase inventory reserves are recorded as an increase in cost of sales. Estimated inventory
obsolescence has been provided for in the financial statements and has been within the range of
management’s expectations. As of December 31, 2009 and 2008, the reserves for inventory
obsolescence amounted to $595 and $555, respectively.
Property and Equipment
Property and equipment are stated at cost and are depreciated using the straight-line method
over their estimated useful lives, as follows:
| |
|
|
Buildings |
|
10-20 years |
Leasehold improvements |
|
10-20 years or lease term, if shorter |
Machinery and equipment |
|
3-7 years |
Furniture and fixtures |
|
3-7 years |
Assets acquired under capital lease arrangements are included in machinery and equipment and
are recorded at the present value of the minimum lease payments and are depreciated using the
straight-line method over the life of the asset or term of the lease, whichever is shorter.
Expenses for repairs and maintenance are charged to expense as incurred, while renewals and
betterments are capitalized. Gains or losses on the sale or disposal of property and equipment are
reflected in operating income.
The Company accounts for computer software costs developed for internal use in accordance with
Financial Accounting Standards Board (“FASB”) Accounting Standards Codification (“ASC”) 350-40,
formerly Statement of Position (“SOP”) 98-1, Accounting for the Costs of Computer Software
Developed or Obtained for Internal Use, which requires companies to capitalize certain qualifying
costs incurred during the application development stage of the related software development
project. The primary use of this software is for internal use and, accordingly, such capitalized
software development costs are depreciated on a straight-line basis over the economic lives of the
related products not to exceed three years. The Company’s machinery and equipment (see Note 4
“Property and Equipment”) includes $2,317 and $2,760 of capitalized software development costs as
of December 31, 2009 and 2008, respectively, net of accumulated amortization of $14,355 and $13,111
as of December 31, 2009 and 2008, respectively. Depreciation expense includes the amortization of
capitalized software development costs which amounted to $1,245, $2,128 and $1,769 during the years
ended December 31, 2009, 2008 and 2007, respectively.
Impairment of Long-Lived Assets
The Company periodically assesses potential impairments of its long-lived assets in accordance
with the provisions of ASC 360, formerly Statement of Financial Accounting Standards (“SFAS”)
No. 144, Accounting for the Impairment or Disposal of Long-lived Assets. An impairment review is
performed whenever events or changes in circumstances indicate that the carrying value of the
assets may not be recoverable. Factors considered by the Company include, but are not limited to,
significant underperformance relative to historical or projected operating results; significant
changes in the manner of use of the acquired assets or the strategy for the overall business; and
significant negative industry or economic trends. When the carrying value of a long-lived asset may
not be recoverable based upon the existence of one or more of the above indicators of impairment,
the Company estimates the future undiscounted cash flows expected to result from the use of the
asset and its eventual disposition. If the sum of the expected future undiscounted cash flows and
eventual disposition is less than the carrying amount of the asset, the Company recognizes an
impairment loss. An
impairment loss is reflected as the amount by which the carrying amount of the asset exceeds
the fair value of the asset, based on the fair market value, if available, or discounted cash
flows, if not.
F-9
The operating segments of the Company are being negatively impacted by the drop in commercial
and residential construction resulting from the current economic recession. As a result of this,
the Company’s earnings outlook has declined and the Company recorded a goodwill impairment of
$37.4 million in the third quarter of 2009 (see the section entitled “Goodwill and Other Intangible
Assets” below). Before assessing the Company’s goodwill for impairment, the Company evaluated, as
described above, the long-lived assets in its operating segments for impairment given the reduced
level of expected sales, profits and cash flows. Based on this assessment, the Company determined
that there was an impairment of long-lived assets for its operating segment in the United Kingdom.
Accordingly, the Company recorded a pretax, non-cash charge in the third quarter of 2009 to reduce
the carrying value of other intangible assets by $0.8 million.
Goodwill and Other Intangible Assets
The Company assesses goodwill at least annually for impairment as of September 30, or more
frequently if events and circumstances indicate that goodwill might be impaired. The Company
concluded that in the absence of the annual goodwill impairment analysis, there were sufficient
indicators to require the Company to perform a goodwill impairment analysis as of September 30,
2009. The indicators were based on a combination of factors, including the current economic
recession and revised forecasted future earnings. Goodwill impairment testing is performed at the
operating segment (or “reporting unit”) level. Goodwill is assigned to reporting units at the date
the goodwill is initially recorded. Once goodwill has been assigned to reporting units, it no
longer retains its association with a particular acquisition, and all of the activities within a
reporting unit, whether acquired or internally generated, are available to support the value of the
goodwill. Based on the Company’s annual goodwill impairment assessment, the Company recorded a
$37.4 million impairment in the third quarter of 2009. The Company continues to assess, among other
things, the current economic recession, reporting unit and consolidated performance against plan,
and the outlook for the Company’s business and industry in general. A downward trend in one or more
of these factors, or a significant decrease in its stock price, could cause the Company to reduce
the estimated fair value of its reporting units and recognize a corresponding impairment of the
goodwill in connection with a future goodwill impairment analysis. Given the current economic
environment, the Company has and will continue to monitor the need to test its intangibles for
impairment as required by ASC 805, formerly SFAS No. 141 (Revised 2007), Business Combinations.
Based upon its assessment, the Company concluded that no goodwill impairment triggering events have
occurred during the fourth quarter of 2009 that would require an additional impairment test.
During the quarter ended December 31, 2008, based on a combination of factors, including the
then current economic environment, and a significant decline in market capitalization, the Company
concluded that there were sufficient indicators to require the Company to perform an interim
goodwill impairment analysis as of December 31, 2008. The result of the Company’s analysis
indicated that eight of the Company’s reporting units, six in the United States, one in Canada, and
one in the United Kingdom had a goodwill impairment. Accordingly, the Company recorded a pretax,
non-cash charge for the year ended December 31, 2008 to reduce the carrying value of goodwill by
$35.2 million.
Goodwill impairment testing is a two-step process. Step one involves comparing the fair value
of the Company’s reporting units to their carrying amount. If the fair value of the reporting unit
is greater than its carrying amount, there is no impairment. If the reporting unit’s carrying
amount is greater than the fair value, the second step must be completed to measure the amount of
impairment, if any. Step two involves calculating the implied fair value of goodwill by deducting
the fair value of all tangible and intangible assets, excluding goodwill, of the reporting unit
from the fair value of the reporting unit as determined in step one. The implied fair value of
goodwill determined in this step is compared to the carrying value of goodwill. If the implied fair
value of goodwill is less than the carrying value of goodwill, an impairment loss is recognized
equal to the difference. The results of the Company’s analysis indicated that 11 of the Company’s
reporting units, nine in the United States, one in the United Kingdom and one in Canada, had a
goodwill impairment as of September 30, 2009. Accordingly, the Company recorded a pretax, non-cash
charge in the third quarter of 2009 to reduce the carrying value of goodwill by $37.4 million.
The Company determines the fair value of the Company’s reporting units using an income
approach. Under the income approach, the Company determined fair value based on estimated future
cash flows of each reporting unit. The cash flows are discounted by an estimated weighted-average
cost of capital, which reflects the overall level of inherent risk of a reporting unit. Determining
the fair value of a reporting unit is judgmental in nature and requires the use of significant
estimates and assumptions, including revenue growth rates, operating margins, discount rates, and
future market conditions, among others. The Company considered market information in assessing the
reasonableness of the fair value yielded under the income approach outlined above.
F-10
Given the current economic environment and the uncertainties regarding the impact on the
Company’s business, there can be no assurance that the Company’s estimates and assumptions
regarding the duration of the ongoing economic downturn, or the period or strength of recovery,
made for purposes of the Company’s goodwill impairment analysis will prove to be accurate
predictions of the future. If the Company’s assumptions regarding forecasted revenue or gross
margins of certain reporting units are not achieved, the Company may be required to record
additional goodwill impairment charges in future periods, whether in connection with the
Company’s next annual impairment analysis in the third quarter of 2010 or prior to that, if
any such change constitutes a triggering event outside of the quarter from when the annual goodwill
impairment analysis is performed. It is not possible at this time to determine if any such future
impairment charge would result or, if it does, whether such charge would be material.
In connection with acquisitions completed during the year ended December 31, 2009, the Company
has applied the provisions of ASC 805, using the acquisition method of accounting. However,
acquisitions completed prior to 2009 were accounted for by applying the former provisions of SFAS
No. 141, Business Combinations, (“SFAS 141”). The excess purchase price over the fair value of net
tangible assets and identifiable intangible assets acquired was recorded as goodwill.
The changes in the carrying amount of goodwill for the years ended December 31, 2009 and 2008
are summarized as follows:
| |
|
|
|
|
|
|
|
|
|
|
|
|
| |
|
|
|
|
|
Accumulated |
|
|
Net Carrying |
|
| |
|
Gross Goodwill |
|
|
Impairment Loss |
|
|
Amount |
|
January 1, 2008 |
|
$ |
382,519 |
|
|
$ |
— |
|
|
$ |
382,519 |
|
Additions |
|
|
20,004 |
|
|
|
— |
|
|
|
20,004 |
|
Goodwill impairment |
|
|
— |
|
|
|
35,154 |
|
|
|
(35,154 |
) |
Translation adjustment |
|
|
(856 |
) |
|
|
— |
|
|
|
(856 |
) |
|
|
|
|
|
|
|
|
|
|
December 31, 2008 |
|
|
401,667 |
|
|
|
35,154 |
|
|
|
366,513 |
|
Additions |
|
|
3,136 |
|
|
|
— |
|
|
|
3,136 |
|
Goodwill impairment |
|
|
— |
|
|
|
37,382 |
|
|
|
(37,382 |
) |
Translation adjustment |
|
|
251 |
|
|
|
— |
|
|
|
251 |
|
|
|
|
|
|
|
|
|
|
|
December 31, 2009 |
|
$ |
405,054 |
|
|
$ |
72,536 |
|
|
$ |
332,518 |
|
|
|
|
|
|
|
|
|
|
|
The additions to goodwill include the excess purchase price over fair value of net assets
acquired, purchase price adjustments, and certain earnout payments. See Note 3 “Acquisitions”.
Customer relationships and trade names acquired are amortized over their estimated useful
lives of 13 (weighted average) and 20 years, respectively. Customer relationships are amortized
using the accelerated method (based on customer attrition rates) and trade names are amortized
using the straight-line method. The non-compete agreements are amortized over their weighted
average term on a straight-line basis.
The following table sets forth the Company’s preliminary estimate of other intangible
assets resulting from business acquisitions at December 31, 2009 and December 31, 2008, which
continue to be amortized:
| |
|
|
|
|
|
|
|
|
|
|
|
|
|
|
|
|
|
|
|
|
|
|
|
|
| |
|
December 31, 2009 |
|
|
December 31, 2008 |
|
| |
|
Gross |
|
|
|
|
|
|
Net |
|
|
Gross |
|
|
|
|
|
|
Net |
|
| |
|
Carrying |
|
|
Accumulated |
|
|
Carrying |
|
|
Carrying |
|
|
Accumulated |
|
|
Carrying |
|
| |
|
Amount |
|
|
Amortization |
|
|
Amount |
|
|
Amount |
|
|
Amortization |
|
|
Amount |
|
| |
|
(Dollars in thousands) |
|
|
(Dollars in thousands) |
|
Amortizable other intangible assets: |
|
|
|
|
|
|
|
|
|
|
|
|
|
|
|
|
|
|
|
|
|
|
|
|
Customer relationships |
|
$ |
96,219 |
|
|
$ |
39,243 |
|
|
$ |
56,976 |
|
|
$ |
96,574 |
|
|
$ |
29,233 |
|
|
$ |
67,341 |
|
Trade names and trademarks |
|
|
20,294 |
|
|
|
3,139 |
|
|
|
17,155 |
|
|
|
20,359 |
|
|
|
2,126 |
|
|
|
18,233 |
|
Non-Compete Agreements |
|
|
303 |
|
|
|
226 |
|
|
|
77 |
|
|
|
1,278 |
|
|
|
885 |
|
|
|
393 |
|
|
|
|
|
|
|
|
|
|
|
|
|
|
|
|
|
|
|
|
|
|
$ |
116,816 |
|
|
$ |
42,608 |
|
|
$ |
74,208 |
|
|
$ |
118,211 |
|
|
$ |
32,244 |
|
|
$ |
85,967 |
|
|
|
|
|
|
|
|
|
|
|
|
|
|
|
|
|
|
|
|
Based on current information, estimated future amortization expense of other
intangible assets for this fiscal year, and each of the next five fiscal years, and thereafter
are as follows:
| |
|
|
|
|
2010 |
|
$ |
10,071 |
|
2011 |
|
|
9,122 |
|
2012 |
|
|
8,227 |
|
2013 |
|
|
7,323 |
|
2014 |
|
|
6,514 |
|
Thereafter |
|
|
32,951 |
|
|
|
|
|
|
|
$ |
74,208 |
|
|
|
|
|
F-11
Deferred Financing Costs
Direct costs incurred in connection with indebtedness agreements are capitalized as incurred
and amortized based on the effective interest method for the term loan credit facility and on the
straight line method for the senior secured revolving credit facility. At December 31, 2009 and
2008, the Company had deferred financing costs of $4,082 and $3,537, respectively, net of
accumulated amortization of $2,708 and $1,351, respectively.
In December 2007, the Company wrote off $876 of deferred financing costs due to the
extinguishment, in full, of its Second Amended and Restated Credit and Guaranty Agreement. The
total write off for 2007 was $1,327, including the termination of the interest rate collar. The
Company added $5,254 of deferred financing costs related to its Credit and Guaranty Agreement (the
“Credit Agreement”) dated December 6, 2007. In 2008, the Company wrote off $313 of deferred
financing costs. During 2009, the Company added $2,092 of deferred financing costs and wrote off
$190 of deferred financing costs related to the amendment to the Credit Agreement (“Amended Credit
Agreement”) described in Note 5 “Long-Term Debt”.
Derivative Financial Instruments
The Company enters into derivative instruments to manage its exposure to changes in interest
rates. These instruments allow the Company to raise funds at floating rates and effectively swap
them into fixed rates, without the exchange of the underlying principal amount. Such agreements are
designated and accounted for under ASC 815, formerly SFAS No. 133, Accounting for Derivative
Instruments and Hedging Activities. Derivative instruments are recorded at fair value as either
assets or liabilities in the Consolidated Balance Sheets.
Fair Values of Financial Instruments
The following methods and assumptions were used by the Company in estimating the fair value of
its financial instruments for disclosure purposes:
Cash and cash equivalents: The carrying amounts reported in the Company’s Consolidated Balance
Sheets for cash and cash equivalents approximate their fair value due to the relatively short
period to maturity of these instruments.
Short- and long-term debt: The carrying amount of the Company’s capital leases reported in the
Consolidated Balance Sheets approximates fair value based on the Company’s current incremental
borrowing rate for similar types of borrowing arrangements. The carrying amount reported in the
Company’s Consolidated Balance Sheet as of December 31, 2009 for its term loan credit facility is
$205.6 million and $21.8 million for its subordinated notes payable. Using a discounted cash flow
technique that incorporates a market interest rate which assumes adjustments for duration,
optionality, and risk profile, the Company has determined the fair value of its term loan credit
facility approximates its carrying value, and the fair value of its subordinated notes payable is
approximately $19.6 million as of December 31, 2009.
Interest rate hedge agreements: The fair value of the interest rate swap (the “Swap
Transaction”) is based on market interest rates using a discounted cashflow model and an adjustment
for counterparty risk. See Note 7 “Fair Value Measurements” for further information.
Insurance Liability
The Company maintains a high deductible insurance policy for a significant portion of its
risks and associated liabilities with respect to workers’ compensation. The accrued liabilities
associated with this program are based on the Company’s estimate of the ultimate costs to settle
known claims, as well as claims incurred but not yet reported to the Company, as of the balance
sheet date. The Company’s estimated liability is not discounted and is based on information
provided by the Company’s insurance brokers and insurers, combined with the Company’s judgments
regarding a number of assumptions and factors, including the frequency and severity of claims,
claims development history, case jurisdiction, applicable legislation, and the Company’s claims
settlement practices.
F-12
Commitments and Contingencies
In the normal course of business, the Company estimates potential future loss accruals related
to legal, workers compensation, tax and other contingencies. These accruals require management’s
judgment on the outcome of various events based on the best available information. However, due to
changes in facts and circumstances, the ultimate outcomes could differ from management’s estimates.
Revenue Recognition
The Company applies the provisions of ASC 605, formerly the Securities and Exchange Commission
(“SEC”) Staff Accounting Bulletin (“SAB”) No. 104, Revenue Recognition in Financial Statements. In
general, the Company recognizes revenue when (i) persuasive evidence of an arrangement exists,
(ii) shipment of products has occurred or services have been rendered, (iii) the sales price
charged is fixed or determinable and (iv) collection is reasonably assured. Net sales include an
allowance for estimated sales returns and discounts.
The Company recognizes revenues from reprographics and facilities management services when
services have been rendered while revenues from the resale of reprographics supplies and equipment
are recognized upon delivery to the customer or upon customer pickup.
The Company has established contractual pricing for certain large national customer accounts
(“Global Services”). These contracts generally establish uniform pricing at all operating segments
for Global Services. Revenues earned from the Company’s Global Services are recognized in the same
manner as non-Global Services revenues.
Included in revenues are fees charged to customers for shipping, handling, and delivery
services. Such revenues amounted to $22,617, $39,375, and $41,437 for the years ended December 31,
2009, 2008, and 2007 respectively.
Revenues from software licensing activities are recognized over the term of the license.
Revenues from membership fees are recognized over the term of the membership agreement. Revenues
from software licensing activities and membership revenues comprise less than 1% of the Company’s
consolidated revenues during the years ended December 31, 2009, 2008 and 2007.
Management provides for returns, discounts and allowances based on historic experience and
adjusts such allowances as considered necessary. To date, such provisions have been within the
range of management’s expectations.
Comprehensive Loss
The Company’s comprehensive loss includes foreign currency translation adjustments and changes
in the fair value of the Swap Transaction, net of taxes, which qualifies for hedge accounting.
Asset and liability accounts of international operations are translated into the Company’s
functional currency, U.S. dollars, at current rates. Revenues and expenses are translated at the
weighted-average currency rate for the fiscal year.
Segment and Geographic Reporting
The provisions of ASC 280, formerly SFAS No. 131, Disclosures about Segments of an Enterprise
and Related Information, require public companies to report financial and descriptive information
about their reportable operating segments. The Company identifies operating segments based on the
various business activities that earn revenue and incur expense, whose operating results are
reviewed by the chief operating decision maker. Based on the fact that operating segments have
similar products and services, classes of customers, production processes and performance
objectives, the Company is deemed to operate as a single reportable segment.
The Company recognizes revenues in geographic areas based on the location to which the product
was shipped or services have been rendered. Operations outside the United States, have been small
but growing. See table below for revenues and long-lived assets, net, attributable to the Company’s
U.S. operations and foreign operations.
| |
|
|
|
|
|
|
|
|
|
|
|
|
|
|
|
|
|
|
|
|
|
|
|
|
|
|
|
|
|
|
|
|
|
|
|
|
| |
|
2009 |
|
|
2008 |
|
|
2007 |
|
| |
|
U.S. |
|
|
Foreign |
|
|
Total |
|
|
U.S. |
|
|
Foreign |
|
|
Total |
|
|
U.S. |
|
|
Foreign |
|
|
Total |
|
Revenues from external
customers |
|
$ |
473,355 |
|
|
$ |
28,194 |
|
|
$ |
501,549 |
|
|
$ |
676,742 |
|
|
$ |
24,245 |
|
|
$ |
700,987 |
|
|
$ |
675,108 |
|
|
$ |
13,246 |
|
|
$ |
688,354 |
|
Long-lived assets, net |
|
$ |
478,489 |
|
|
$ |
8,998 |
|
|
$ |
487,487 |
|
|
$ |
538,056 |
|
|
$ |
9,809 |
|
|
$ |
547,865 |
|
|
$ |
552,434 |
|
|
$ |
8,536 |
|
|
$ |
560,970 |
|
Advertising and Shipping and Handling Costs
Advertising costs are expensed as incurred and approximated $2,113, $3,233, and $3,641 during
the years ended December 31, 2009, 2008 and 2007, respectively. Shipping and handling costs
incurred by the Company are included in cost of sales.
F-13
Income Taxes
The Company accounts for income taxes under an asset and liability approach. The objective is
to recognize the amount of taxes payable or refundable for the current year and deferred tax
liabilities and assets for the future tax consequences of events that have been recognized in the
Company’s financial statements or tax returns. Deferred tax liabilities or assets reflect temporary
differences between the amounts of assets and liabilities for financial and tax reporting purposes.
Such amounts are adjusted, as appropriate, to reflect changes in tax rates expected to be in effect
when the temporary differences reverse. Additionally, the Company assesses the
likelihood that its deferred tax assets will be recovered from future taxable income and to
the extent the Company believes that recovery is not likely, the Company establishes a valuation
allowance. As of December 31, 2009, the Company believes that all its deferred tax assets are
recoverable.
The Company calculates current and deferred tax provisions based on estimates and assumptions
that could differ from the actual results reflected in income tax returns filed during the
following year. Adjustments based on filed income tax returns are recorded when identified in the
subsequent year. The Company’s effective income tax rate differs from the statutory tax rate
primarily due to state income taxes, the Domestic Production Activities Deduction, nondeductible
items and income tax credits recognized with respect to hiring employees and the purchase and lease
of tangible assets in certain qualified enterprise zones. The amount of income taxes the Company
pays is subject to audits by federal, state and foreign tax authorities. The Company’s estimate of
the potential outcome of any uncertain tax issue is subject to management’s assessment of relevant
risks, facts and circumstances existing at that time. The Company believes that it has adequately
provided for reasonably foreseeable outcomes related to these matters.
Income tax benefits credited to stockholders’ equity are primarily related to employee
exercises of non-qualified stock options.
Stock-Based Compensation
Effective January 1, 2006, the Company adopted ASC 718, formerly SFAS 123R (Revised 2004),
Shared-Based Payment, using the modified prospective transition method. Under this transition
method, stock-based compensation was recognized for: (i) expense related to the remaining unvested
portion of all stock option awards granted in 2005, based on the grant date fair value estimated in
accordance with the original provisions of SFAS 123, Accounting for Stock-Based Compensation; and
(ii) expense related to all stock option awards granted on or subsequent to January 1, 2006, based
on the grant date fair value estimated in accordance with the provisions of ASC 718. In accordance
with ASC 718-10, the remaining unvested options issued by the Company prior to its initial public
offering are not included in its ASC 718 option pool. As a result unless subsequently modified,
repurchased or canceled, such unvested options will not be included in stock-based compensation.
The Company applies the Black-Scholes valuation model in determining the fair value of share-based
payments to employees, which is then amortized on a straight-line basis over the requisite service
period. Upon the adoption FSP FAS 123(R-3), Transition Election Related to Accounting for the Tax
Effects of Share-Based Payment Awards, the Company used the “shortcut method” for determining the
historical windfall tax benefit.
Total stock-based compensation for the years ended December 31, 2009, 2008 and 2007, on income
before income taxes and net income was $4.9 million, $4.3 million and $3.5 million, respectively
and was recorded in selling, general, and administrative expenses. In addition, upon the adoption
of ASC 718, the excess tax benefit resulting from stock-based compensation, in the Consolidated
Statements of Cash Flows, are classified as financing cash inflows.
The weighted average fair value at the grant date for options issued in the fiscal years ended
December 31, 2009, 2008 and 2007, was $3.34, $6.01, and $11.85 respectively. The fair value of each
option grant was estimated on the date of grant using the Black-Scholes option-pricing model using
the following weighted average assumptions for the year ended December 31, 2009 and 2008:
| |
|
|
|
|
|
|
|
|
| |
|
Year Ended |
|
| |
|
December 31, |
|
| |
|
2009 |
|
|
2008 |
|
Weighted average assumptions used: |
|
|
|
|
|
|
|
|
Risk free interest rate |
|
|
0.95 |
% |
|
|
2.79 |
% |
Expected volatility |
|
|
43.1 |
% |
|
|
32.70 |
% |
Expected dividend yield |
|
|
0.00 |
% |
|
|
0.00 |
% |
The expected option term of 6.00 years for options vesting over a 3 year period, 6.25 years
for options vesting over a 4 year period, 6.5 years for options vesting over a 5 year period, and
5.5 years for options vesting over a 1 year period under the “simplified” method as provided in ASC
718-10, were used for options granted during fiscal year 2009 and 2008. The Company concluded that
the use of ASC 718-10’s “simplified” method is a more reasonable estimate for determining the
expected term of options as the Company’s initial public offering was in 2005 and does not have
sufficient historical information.
F-14
For fiscal year 2009 and 2008, expected stock price volatility is based on a blended rate
which combines the Company’s recent historical volatility with that of its peer groups for a period
equal to the expected term. This blended method provides better information about future
stock-price movements, until the Company has a more reliable historical period to rely upon. The
risk-free interest rate is based on the U.S. Treasury yield curve in effect at the time of grant
with an equivalent remaining term. The Company has not paid dividends in the past and does not
currently plan to pay dividends in the near future. The Company assumed a forfeiture rate of 6.19%
in 2009 and 3.77% in 2008 based on the Company’s historical forfeiture rate. The Company reviews
its forfeiture rate at least on an annual basis.
Research and Development Expenses
Research and development activities relate to costs associated with the design and testing of
new technology or enhancements to existing technology and are expensed as incurred. In total,
research and development amounted to $4,011, $5,129 and $5,468 during the fiscal years ended
December 31, 2009, 2008 and 2007, respectively.
Sales Taxes
The Company bills sales taxes, as applicable, to its customers. The Company acts as an agent
and bills, collects, and remits the sales tax to the proper government jurisdiction. The sales
taxes are accounted for on a net basis, and therefore are not included as part of the Company’s
revenue.
Earnings Per Share
The Company accounts for earnings per share in accordance with ASC 260, formerly SFAS No. 128,
Earnings per Share. Basic earnings per share are computed by dividing net income attributable to
ARC by the weighted-average number of common shares outstanding for the period. Diluted earnings
per common share is computed similar to basic earnings per share except that the denominator is
increased to include the number of additional common shares that would have been outstanding if
common shares subject to outstanding options and acquisition rights had been issued and if the
additional common shares were dilutive. Common share equivalents are excluded from the computation
if their effect is anti-dilutive. There were 2.3 million, 1.5 million and 1.2 million common stock
options excluded for anti-dilutive effects for the years ended December 31, 2009, 2008 and 2007,
respectively. The Company’s common share equivalents consist of stock options issued under the
Company’s 2005 Stock Plan.
Basic and diluted earnings per common share were calculated using the following options for
the years ended December 31, 2009, 2008 and 2007:
| |
|
|
|
|
|
|
|
|
|
|
|
|
| |
|
Year Ended December 31, |
|
| |
|
2009 |
|
|
2008 |
|
|
2007 |
|
Weighted average common shares
outstanding during the period —
basic |
|
|
45,123,110 |
|
|
|
45,060,482 |
|
|
|
45,421,498 |
|
Effect of dilutive stock options |
|
|
— |
|
|
|
337,604 |
|
|
|
407,512 |
|
|
|
|
|
|
|
|
|
|
|
|
|
|
|
|
|
|
|
|
|
|
|
|
Weighted average common
shares outstanding during the
period — diluted |
|
|
45,123,110 |
|
|
|
45,398,086 |
|
|
|
45,829,010 |
|
|
|
|
|
|
|
|
|
|
|
There were no adjustments to net (loss) income in calculating basic or diluted
earnings per share.
Recent Accounting Pronouncements
In January 2010, the FASB issued Accounting Standards Update (“ASU”) No. 2010-06, Fair Value
Measurements and Disclosures, improving disclosures about Fair Value Measurements (“ASU 2010-06”).
This update provides amendments to the criteria of ASC 820-10, Fair Value Measurements and
Disclosures. The amendments to this update require (i) new disclosures for transfers in and out of
level 1 and 2, and activity in level 3 fair value measurements, (ii) provides amendments that
clarify existing disclosures for level of disaggregation and disclosures about inputs and valuation
techniques and (iii) includes conforming amendments to the guidance on employers’ disclosures about
postretirement benefit plan assets. ASU 2010-06 is effective for financial statements issued for
years beginning on or after December 15, 2010, and for interim periods within those fiscal years.
The Company is currently evaluating the impact, if any, that the adoption of ASU 2010-06 may have
on its Consolidated Financial Statements.
In October 2009, the FASB issued Accounting Standards Update (“ASU”) No. 2009-13,
Multiple-Deliverable Revenue Arrangements a consensus of the FASB Emerging Issues Task Force, (“ASU
2009-13”). This update provides amendments to the criteria of ASC 605, Revenue Recognition, for
separating consideration in multiple-deliverable arrangements. The amendments to this update
establish a selling price hierarchy for determining the selling price of a deliverable. ASU 2009-13
is effective for financial statements issued for years beginning on or after June 15, 2010. The
Company is currently evaluating the impact, if any, that the adoption of ASU 2009-13 may have on
its Consolidated Financial Statements.
F-15
In June 2009, the FASB issued ASC 105, formerly SFAS No. 168, The FASB Accounting Standards
Codification and the Hierarchy of Generally Accepted Accounting Principles, which replaced former
FASB Statement No. 162, The Hierarchy of Generally Accepted Accounting Principles. ASC 105
identifies the sources of accounting principles and the framework for selecting the principles used
in the preparation of financial statements of nongovernmental entities that are presented in
conformity with GAAP in the United States. Rules and interpretive releases of the SEC under federal
securities laws are also sources of authoritative GAAP for SEC registrants. All guidance contained
in the codification carries an equal level of authority. ASC 105 is effective for interim and
annual periods ending after September 15, 2009. The Company has disclosed codification citations in
place of corresponding references to legacy accounting pronouncements.
In May 2009, the FASB issued ASC 855, formerly SFAS No. 165, Subsequent Events, which
establishes general standards of accounting for and disclosure of events that occur after the
balance sheet date but before financial statements are issued or are available to be issued. ASC
855 requires disclosure of the date through which an entity has evaluated subsequent events and the
basis for that date. ASC 855 is effective for interim and annual periods ending after June 15,
2009. The Company adopted the provisions of ASC 855 effective June 30, 2009. See Note 1
“Description of Business and Basis of Presentation” for required disclosures.
In December 2007, the FASB issued ASC 805. ASC 805 establishes the principles and requirements
for how an acquirer: (i) recognizes and measures in its financial statements the identifiable
assets acquired, the liabilities assumed, and any noncontrolling interest in the acquiree;
(ii) recognizes and measures the goodwill acquired in the business combination or a gain from a
bargain purchase; and (iii) determines what information to disclose to enable users of the
financial statements to evaluate the nature and financial effects of the business combination. ASC
805 makes some significant changes to existing accounting practices for acquisitions. ASC 805 is to
be applied prospectively to business combinations consummated on or after the beginning of the
first annual reporting period on or after December 15, 2008. The initial adoption of ASC 805, did
not have a material impact on the Company’s Consolidated Financial Statements. Currently, the
Company is not a party to any agreements, or engaged in any negotiations regarding a material
acquisition.
In April 2009, the FASB issued ASC 805-20, formerly FSP No. FAS 141(R)-1, Accounting for
Assets Acquired and Liabilities Assumed in a Business Combination That Arise from Contingencies.
ASC 805-20, addresses application issues raised by preparers, auditors, and members of the legal
profession on initial recognition and measurement, subsequent measurement and accounting, and
disclosure of assets and liabilities arising from contingencies in a business combination. ASC
805-20 is effective for assets or liabilities arising from contingencies in business combinations
for which the acquisition date is on or after the beginning of the first annual reporting period
beginning on or after December 15, 2008. The initial adoption of ASC 805-20, did not have a
material impact on the Company’s Consolidated Financial Statements. Currently, the Company is not a
party to any agreements, or engaged in any negotiations regarding a material acquisition.
In April 2009, the FASB issued ASC 825-10-65, formerly FSP FAS No. 107-1 and Accounting
Principles Board (“APB”) 28-1, Interim Disclosures about Fair Value of Financial Instruments. ASC
825-10-65 requires disclosures about fair value of financial instruments for interim reporting
periods of publicly traded companies as well as in annual financial statements. ASC 825-10-65 also
amends former APB Opinion No. 28, Interim Financial Reporting, to require those disclosures in
summarized financial information at interim reporting periods. ASC 825-10-65 is effective for
interim reporting periods ending after June 15, 2009; early adoption is permitted for periods
ending after March 15, 2009. The Company disclosed required Fair Value Measurements disclosures on
the Consolidated Financial Statements.
In June 2008, the FASB issued ASC 260-10, formerly FSP Emerging Issues Task Force, (“EITF”)
No. 03-6-1, Determining Whether Instruments Granted in Share-Based Payment Transactions Are
Participating Securities. ASC 260-10 addresses whether instruments granted in share-based payment
transactions are participating securities prior to vesting and therefore need to be included in the
earnings allocation in calculating earnings per share under the two-class method described in ASC
260. ASC 260-10 requires companies to treat unvested share-based payment awards that have
non-forfeitable rights to dividend or dividend equivalents as a separate class of securities in
calculating earnings per share. ASC 260-10 is effective for calendar-year companies beginning
January 1, 2009. The adoption of ASC 260-10, did not have a material impact on the Company’s
Consolidated Financial Statements.
In April 2008, the FASB issued ASC 350-30, formerly FSP No. FAS 142-3, Determination of the
Useful Life of Intangible Asset, (“350-30”). ASC 350-30 amends the factors that should be
considered in developing renewal or extension assumptions used to determine the useful life of a
recognized intangible asset under ASC 350. ASC 350-30 is effective for calendar-year companies
beginning January 1, 2009. The requirement for determining useful lives must be applied
prospectively to intangible assets acquired after the effective date and the disclosure
requirements must be applied prospectively to all intangible assets recognized as of, and
subsequent to, the effective date. The adoption of ASC 350-30, did not have a material impact on
the Company’s Consolidated Financial Statements.
F-16
In March 2008, the FASB issued ASC 815-10, formerly SFAS No. 161, Disclosures about Derivative
Instruments and Hedging Activities — an amendment of FASB Statement No.133. This Standard requires
enhanced disclosures regarding derivatives and hedging activities, including: (a) the manner in
which an entity uses derivative instruments; (b) the manner in which derivative instruments and
related hedged items are accounted for under, ASC 815; and (c) the effect of derivative instruments
and related hedged items on an entity’s financial position, financial performance, and cash flows.
ASC 815-10 became effective beginning with the first quarter of 2009. See Note 7 “Fair Value
Measurements” for required disclosures.
In December 2007, the FASB issued ASC 810-10-65, formerly SFAS No. 160, Noncontrolling
Interests in Consolidated Financial Statements — an Amendment of ARB No. 51, which addresses the
accounting and reporting framework for noncontrolling interests by a parent company. ASC 810-10-65
also addresses disclosure requirements to distinguish between interests of the parent and interests
of the noncontrolling owners of a subsidiary. ASC 810-10-65 became effective in the first quarter
of 2009, which resulted in reporting noncontrolling interest as a component of equity in the
Company’s Consolidated Balance Sheets and below
income tax expense in the Company’s Consolidated Statements of Operations. In addition, the
provisions of ASC 810-10-65 require that minority interest be renamed noncontrolling interests and
that a company presents a consolidated net income measure that includes the amount attributable to
such noncontrolling interests for all periods presented. As required by ASC 810-10-65, the Company
has retrospectively applied the presentation to its prior year balances in the Company’s
Consolidated Financial Statements.
3. ACQUISITIONS
During 2009, the Company acquired the assets and liabilities of two reprographics companies in
the United States and one Chinese reprographics company. The aggregate purchase price of such
acquisitions, including related acquisition costs, amounted to approximately $2,936, for which the
Company paid $2,470 in cash and issued $466 of notes payable to the former owners of the acquired
companies.
During 2008, the Company acquired the assets and liabilities of 13 reprographics companies of
which 11 were in the United States, one in Canada and one in the United Kingdom. The aggregate
purchase price of such acquisitions, including related acquisition costs, amounted to approximately
$31,929, for which the Company paid $21,515 in cash and issued $10,414 of notes payable to the
former owners of the acquired companies.
On August 1, 2008, the Company commenced operations of UNIS Document Solutions Co., Ltd.
(“UDS”), its business venture with Unisplendour Corporation Limited (“Unisplendour”). The purpose
of UDS is to pair the digital document management solutions of the Company with the brand
recognition and Chinese distribution channel of Unisplendour to deliver digital reprographics
services to China’s growing construction industry. Under the terms of the agreement, the Company
and Unisplendour have an economic ownership interest of 65 percent and 35 percent, respectively.
The Board of Directors of UDS is comprised of five directors, three of whom are appointed by the
Company and two of whom are appointed by Unisplendour. The Company contributed $13,567 of cash,
while Unisplendor contributed the assets of its Engineering Product Division (“EPD”). These assets
included EPD’s customer list, use of the UNIS name, and certain other assets.
The Company accounts for its investment in UDS under the purchase method of accounting, in
accordance with ASC 805. UDS is consolidated in the Company’s financial statements from the date of
commencement. Noncontrolling interest, which represents the 35 percent non-controlling interest in
UDS, is reflected on the Company’s Consolidated Financial Statements.
During 2007, the Company acquired the assets and liabilities of 19 reprographics companies, of
which 17 were in the United States and two were in Canada. The aggregate purchase price of such
acquisitions, including related acquisition costs, amounted to approximately $146,301, for which
the Company paid $122,543 in cash and issued $23,758 of notes payable to the former owners of the
acquired companies.
The results of operations of the companies acquired during the years ended December 31, 2009,
2008 and 2007 have been included in the Consolidated Financial Statements from their respective
dates of acquisition.
For U.S. income tax purposes, $2,466, $23,619, and $114,474 of goodwill and intangibles
resulting from acquisitions completed during the years ended December 31, 2009, 2008 and 2007,
respectively, are amortized over a 15-year period. None of the Company’s acquisitions were related
or contingent upon any other acquisitions.
F-17
During 2009, the Company’s acquisitions were not material individually, or in the aggregate.
Thus, the impact of these acquisitions on the Company’s Consolidated Balance Sheets was immaterial.
The assets and liabilities of the entities acquired and business ventures entered into during 2008
are as follows:
| |
|
|
|
|
| |
|
December 31, |
|
| |
|
2008 |
|
Purchase price |
|
$ |
31,929 |
|
|
|
|
|
|
Cash and cash equivalents |
|
|
431 |
|
Accounts receivable |
|
|
6,186 |
|
Property and equipment |
|
|
2,749 |
|
Inventories |
|
|
2,889 |
|
Other assets |
|
|
601 |
|
|
|
|
|
Total assets |
|
|
12,856 |
|
| |
Accounts payable and other liabilities |
|
|
3,757 |
|
Capital Leases |
|
|
580 |
|
Minority Interest |
|
|
6,062 |
|
|
|
|
|
Net assets acquired |
|
|
2,457 |
|
|
|
|
|
|
|
|
|
|
Excess purchase price over net tangible assets acquired |
|
$ |
29,472 |
|
|
|
|
|
Intangible assets: |
|
|
|
|
Customer relationships |
|
$ |
10,208 |
|
Trade names |
|
|
2,016 |
|
Non-compete agreements |
|
|
— |
|
Goodwill |
|
|
17,248 |
|
|
|
|
|
|
|
$ |
29,472 |
|
|
|
|
|
For 2008 acquisitions, customer relationships and trade names acquired are amortized over
their estimated useful lives of 11 and 20 years, respectively.
The following summary presents the Company’s unaudited pro forma results, as if the 2008 and
2007 acquisitions had been completed at the beginning of the year of acquisition and the prior
year. The proforma results of the 2009 acquisitions would not have had a material impact on the
Company’s Consolidated Statements of Operations in 2009 and 2008:
| |
|
|
|
|
|
|
|
|
| |
|
Year ended December 31, |
|
| |
|
2008 |
|
|
2007 |
|
| |
|
(Dollars in thousands, except per share data) |
|
|
|
|
|
|
|
|
|
|
Net sales |
|
$ |
725,202 |
|
|
$ |
804,979 |
|
Net income |
|
$ |
37,482 |
|
|
$ |
71,993 |
|
|
|
|
|
|
|
|
|
|
Earnings per share — basic |
|
$ |
0.83 |
|
|
$ |
1.59 |
|
Earnings per share — diluted |
|
$ |
0.83 |
|
|
$ |
1.57 |
|
The above pro forma information is presented for comparative purposes only. The pro-forma
results include the amortization associated with the estimated value of acquired intangible assets
and estimated interest expense associated with debt used to fund the acquisition. However, pro
forma results are not necessarily indicative of what actually would have occurred had the
acquisitions been completed as of the beginning of each period presented, nor are they necessarily
indicative of future consolidated results.
Certain acquisition agreements entered into by the Company contain earnout agreements which
provide for additional consideration (Earnout Payments) to be paid if the acquired entity’s results
of operations, or sales, exceed certain targeted levels measured on an annual basis generally three
years after the acquisition. Accrued expenses in the accompanying Consolidated Balance Sheets
include $0 and $100 of Earnout Payments payable as of December 31, 2009 and 2008, respectively, to
former owners of acquired companies based on the earnings or revenues of acquired entities. The
increase to goodwill as of December 31, 2009 and 2008 as a result of the Earnout Payments was
$1,142 and $1,692, respectively.
The earnout provisions generally contain limits on the amount of Earnout Payments that may be
payable over the term of the agreement. The Company’s estimate of the aggregate amount of
additional consideration that may be payable over the terms of the earnout agreements subsequent to
December 31, 2009 is approximately $2,905.
F-18
The Company made certain adjustments to goodwill as a result of changes to the purchase price
of acquired entities. The net increase to goodwill as of December 31, 2009 and 2008 as a result of
purchase price adjustments was $139 and $1,064, respectively.
4. PROPERTY AND EQUIPMENT
Property and equipment consist of the following:
| |
|
|
|
|
|
|
|
|
| |
|
December 31, |
|
| |
|
2009 |
|
|
2008 |
|
Machinery and equipment |
|
$ |
233,292 |
|
|
$ |
225,020 |
|
Buildings and leasehold improvements |
|
|
20,768 |
|
|
|
23,504 |
|
Furniture and fixtures |
|
|
4,850 |
|
|
|
5,839 |
|
|
|
|
|
|
|
|
|
|
|
258,910 |
|
|
|
254,363 |
|
Less accumulated depreciation |
|
|
(184,342 |
) |
|
|
(164,651 |
) |
|
|
|
|
|
|
|
|
|
$ |
74,568 |
|
|
$ |
89,712 |
|
|
|
|
|
|
|
|
Depreciation expense was $38,176, $38,117, and $30,362 for the years ended December 31,
2009, 2008, and 2007, respectively.
The two facilities that the Company owns are subject to liens under its credit facilities.
5. LONG-TERM DEBT
Long-term debt consists of the following:
| |
|
|
|
|
|
|
|
|
| |
|
December 31, |
|
|
December 31, |
|
| |
|
2009 |
|
|
2008 |
|
| |
|
(Dollars in thousands) |
|
|
|
|
|
|
|
|
|
|
Borrowings from foreign Revolving Credit Facilities; 6.0% interest rate at
December 31, 2009; principal payable through January 2010 |
|
$ |
1,523 |
|
|
$ |
— |
|
|
|
|
|
|
|
|
|
|
Borrowings from senior secured First Priority — Term Loan Credit Facility;
interest payable quarterly (weighted average 8.1% and 5.4% interest rate
at December 31, 2009 and December 31, 2008, respectively, inclusive of
interest rate Swap Transaction); principal payable in varying quarterly
installments; any unpaid principal and interest due December 6, 2012 |
|
|
205,625 |
|
|
|
261,250 |
|
|
|
|
|
|
|
|
|
|
Various subordinated notes payable; weighted average 6.2% and 6.2%
interest rate at December 31, 2009 and December 31, 2008, respectively;
principal and interest payable monthly through June 2012 |
|
|
21,755 |
|
|
|
35,376 |
|
|
|
|
|
|
|
|
|
|
Various capital leases; weighted average 9.2% and 9.1% interest rate
at December 31, 2009 and December 31, 2008, respectively;
principal and interest payable monthly through January 2015 |
|
|
45,328 |
|
|
|
64,414 |
|
|
|
|
|
|
|
|
|
|
|
274,231 |
|
|
|
361,040 |
|
Less current portion |
|
|
(53,520 |
) |
|
|
(59,193 |
) |
|
|
|
|
|
|
|
|
|
$ |
220,711 |
|
|
$ |
301,847 |
|
|
|
|
|
|
|
|
Credit and Guaranty Agreement
On December 6, 2007, the Company entered into a credit and guaranty agreement (the “Credit
Agreement”). The Credit Agreement provides for senior secured credit facilities aggregating up to
$350 million, consisting of a $275 million term loan facility and a $75 million revolving credit
facility. The Company used proceeds under the Credit Agreement in the amount of $289.4 million to
extinguish in full all principal and interest payable under the Company’s former credit facility.
Loans to the Company under the Credit Agreement bear interest, at the Company’s option, at
either the base rate, which is equal to the higher of the bank prime lending rate or the federal
funds rate plus 0.5% or LIBOR, plus, in each case, the applicable rate. The applicable rate is
determined based upon the leverage ratio (as defined in the Credit Agreement), with a minimum and
maximum applicable rate of 0.25% and 0.75%, respectively, for base rate loans and a minimum and
maximum applicable rate of 1.25% and 1.75%, respectively, for LIBOR loans. In the event of certain
events of default all amounts due under the Credit Agreement will bear interest at 2.0% above the
rate otherwise applicable.
F-19
The Credit Agreement contains covenants which, among other things, required the Company to
maintain a minimum interest coverage ratio of 2.25:1.00, minimum fixed charge coverage ratio of
1.10:1.00, and maximum leverage ratio of 3.00:1.00. The minimum interest coverage ratio increases
to 2.50:1.00 in 2009, 2.75:1:00 in 2010, 3.00:1.00 in 2011 and 2012. The Credit Agreement also
contained customary events of default, including failure to make payments when due under the Credit
Agreement; payment default under and cross-default to other material indebtedness; breach of
covenants; breach of representations and warranties; bankruptcy; material judgments; dissolution;
ERISA events; change of control; invalidity of guarantees or security documents or repudiation by
the Company of its obligations thereunder. The Credit Agreement is secured by substantially all of
the assets of the Company.
In addition, under the revolving facility under the Credit Agreement, the Company is required
to pay a fee, on a quarterly basis, for the total unused commitment amount. This fee ranges from
0.30% to 0.50% based on the Company’s leverage ratio at the time. The Company may also draw upon
this credit facility through letters of credit, which carries a fee of 0.25% of the outstanding
letters of credit.
The Credit Agreement allowed the Company to borrow incremental term loans to the extent the
Company’s senior secured leverage ratio (as defined in the Credit Agreement) remains below
2.50:1.00.
On October 5, 2009 the Company entered into an amendment to the Credit Agreement (the “Amended
Credit Agreement”) to, among other things:
| |
• |
|
Add a new definition of “Creditable Excess Cash” and amend the definition of “Fixed Charge Coverage
Ratio” to allow for an adjustment of Creditable Excess Cash; |
| |
| |
• |
|
Defer to December 6, 2012 the $36.1 million in amortization payments that would have been due in 2011
to consenting lenders that have agreed to provide new Class B term loan commitments under the Amended
Credit Agreement; |
| |
| |
• |
|
Increase the applicable rate by 200 basis points for initial term loans and 300 basis points for
Class B term loans for purposes of calculating interest on loans outstanding under the Amended Credit
Agreement; |
| |
| |
• |
|
Reduce the total revolving commitments under the Credit Agreement from $74.5 million to $49.5 million; |
| |
| |
• |
|
Provide for a $35.0 million prepayment to be applied on the business day following the effective date
of the Amended Credit Agreement to reduce initial term loan installments due on March 31, 2010,
June 30, 2010 and September 30, 2010 on a pro rata basis; |
| |
| |
• |
|
Amend the interest coverage ratio under the Credit Agreement as follows: |
| |
• |
|
2.00:1.00 for fiscal quarter ending December 31, 2009 |
| |
| |
• |
|
1.75:1.00 for quarters ending March 31, 2010 through September 30, 2010 |
| |
| |
• |
|
2.00:1.00 for quarters ending December 31, 2010 through September 30, 2011 |
| |
| |
• |
|
2.50:1.00 for quarter ending December 31, 2011 |
| |
| |
• |
|
3.00:1.00 for quarters ending March 31, 2012 through maturity; |
| |
• |
|
Amend the fixed charge coverage ratio under the Credit Agreement to be 1.00:1.00 for the fiscal
quarter ending December 31, 2009 through maturity; |
| |
| |
• |
|
Amend the maximum leverage ratio under the Credit Agreement as follows: |
| |
• |
|
3.25:1.00 for fiscal quarter ending December 31, 2009 |
| |
| |
• |
|
3.50:1.00 for fiscal quarter ending March 31, 2010 |
| |
| |
• |
|
3.85:1.00 for fiscal quarters ending June 30, 2010 through September 30, 2010 |
| |
| |
• |
|
3.25:1.00 for fiscal quarter ending December 31, 2010 |
| |
| |
• |
|
3.00:1.00 for fiscal quarters ending March 31, 2011 through maturity; |
| |
• |
|
Amend the maximum senior secured leverage ratio under the Credit Agreement as follows: |
| |
• |
|
3.00:1.00 for fiscal quarter ending December 31, 2009 |
| |
| |
• |
|
3.25:1.00 for fiscal quarter ending March 31, 2010 |
| |
| |
• |
|
3.65:1.00 for fiscal quarters ending June 30, 2010 through September 30, 2010 |
| |
| |
• |
|
3.00:1.00 for fiscal quarters ending December 31, 2010 through March 31, 2011 |
| |
| |
• |
|
2.50:1.00 for fiscal quarters ending June 30, 2011 through maturity. |
F-20
In exchange for the terms set forth in the Amended Credit Agreement, the Company agreed to pay
to each consenting lender an amendment fee equal to 50 basis points of the amount of each
consenting lender’s revolving commitment and outstanding term loans as of the effective date of the
Amended Credit Agreement (as determined on a pro forma basis after giving effect to the
$35.0 million prepayment and reduction of total revolving commitments to $49.5 million) which
amounted to $1.3 million. In addition, the Company agreed to pay to each consenting lender that has
a Class B term loan commitment under the Amended Credit Agreement an amortization deferral fee of
100 basis points of such consenting lender’s Class B term loan commitment which amounted to $0.4
million. The Company also paid customary arrangement and service fees of $2.0 million in connection
with the Amended Credit Agreement. Total fees amounted to $3.7 million of which $2.1 million was
capitalized into Deferred Financing Costs and $1.6 million was expensed under interest expense for
2009.
In the fourth quarter of 2009, in conjunction with its China operations, the Company entered
into one-year revolving credit facilities. The facilities provide for a maximum credit amount of
14.5 million Chinese Yuan Renminbi. This translates to $2.1 million as of December 31, 2009. Draws
on the facilities are limited to 30 day periods and incur a fee of .05% of the amount drawn and no
additional interest is charged.
Despite the recent downturn in the economy, the Company’s cash position remains strong. The
Company had $29.4 million of cash and cash equivalents as of December 31, 2009. The Company
believes its 2010 projected operating cash flows will be sufficient to cover all of its debt
service requirements, working capital needs and budgeted capital expenditures. However, further
significant reductions from the Company’s fourth quarter 2009 EBITDA levels may potentially trigger
default provisions under the Amended Credit Agreement. As the impact and ramifications of the
current economic downturn become known, the Company will continue to adjust their operations
accordingly.
Based on the 2010 projected revenue, the Company is implementing operational plans that it
believes will enable it to achieve EBITDA and the related operating expenses at such levels that
will allow it to remain in compliance with the financial covenants under its Amended Credit
Agreement. As of December 31, 2009, the Company was in compliance with the financial covenants in
its Amended Credit Agreement. The Company’s trailing twelve months key financial covenant ratios as
of December 31, 2009 were 2.51:1.00 for Interest Coverage, 1.14:1.00 for Fixed Charge
Coverage, 2.57:1.00 for Leverage and 2.37:1.00 for Senior Secured Leverage. The Company believes that,
although difficult, further cost reductions could be implemented in the event that projected
revenue levels are not achieved. If actual sales for 2010 are lower than the current projections
and/or the Company does not successfully implement cost reduction plans, however, it could be at
risk of default under the financial covenants of its Amended Credit Agreement during 2010. The
Company’s ability to maintain compliance under the financial covenants of its Amended Credit
Agreement is highly sensitive to, and dependent upon, achieving projected levels of EBITDA and
related operating expenses for 2010. If the Company defaults on the covenants under the Amended
Credit Agreement and is unable to obtain waivers from its lenders, the lenders will be able to
exercise their rights and remedies under the Amended Credit Agreement, including a call provision
on outstanding debt, which would have a material adverse effect on its business, financial
condition and liquidity. Because its Amended Credit Agreement contains cross-default provisions,
triggering a default provision under its Amended Credit Agreement may require it to repay all debt
outstanding under the credit facilities, including any amounts outstanding under its revolving
senior secured (which currently has no debt outstanding) credit facility and may also temporarily
or permanently restrict its ability to draw additional funds under the revolving senior secured
credit facility.
As of December 31, 2009 and 2008, standby letters of credit aggregated to $4.0 million. The
standby letters of credit and borrowings under the revolving credit facility reduced the Company’s
borrowing availability under its senior secured revolving credit facility to $45.5 million and
$71.0 million as of December 31, 2009 and 2008, respectively.
Minimum future maturities of long-term debt and capital lease obligations as of December 31,
2009 are as follows:
| |
|
|
|
|
|
|
|
|
| |
|
Long-Term Debt |
|
|
Capital Lease Obligations |
|
|
|
|
|
|
|
|
|
|
Year ending December 31: |
|
|
|
|
|
|
|
|
2010 |
|
$ |
34,603 |
|
|
$ |
18,917 |
|
2011 |
|
|
40,658 |
|
|
|
13,609 |
|
2012 |
|
|
153,642 |
|
|
|
8,116 |
|
2013 |
|
|
— |
|
|
|
3,731 |
|
2014 |
|
|
— |
|
|
|
948 |
|
Thereafter |
|
|
— |
|
|
|
7 |
|
|
|
|
|
|
|
|
|
|
$ |
228,903 |
|
|
$ |
45,328 |
|
|
|
|
|
|
|
|
F-21
During December 2007, the Company repurchased 447,654 shares of its common stock for
$7.7 million which were funded through cash flows from operations. During 2008 and 2009, the
Company did not repurchase any of its common stock. The Amended Credit Agreement allows the Company
to repurchase stock and/or pay cash dividends in an amount not to exceed $15 million in aggregate
over the term of the facility. As of December 31, 2009 the Company had $7.3 million available to
repurchase stock and/or pay cash dividends under the credit facility. Additional share repurchases,
if any, will be subject to approval by our Board of Directors and made in such amounts and at such
times as the Company deems appropriate based upon prevailing market and business conditions and
would be primarily purchased using subordinated debt in accordance with its credit facility.
Interest Rate Swap Transaction
In March 2006, the Company entered into an interest rate collar agreement which became
effective on December 23, 2006, and had a fixed notional amount of $76.7 million until December 23,
2007, then decreased to $67.0 million until termination of the collar on December 23, 2007. The
interest rate collar had a cap strike three month LIBO rate of 5.50% and a floor strike three month
LIBO rate of 4.70%. In connection with the Company entering into a new credit facility in December
2007, the Company terminated the interest rate collar agreement and recognized an expense of $429
which is included in loss on early extinguishment of debt on the consolidated statements of
operations.
On December 19, 2007, the Company entered into an interest rate swap transaction (the “Swap
Transaction”) in order to hedge the floating interest rate risk on the Company’s long term variable
rate debt. Under the terms of the Swap Transaction, the Company was required to make quarterly
fixed rate payments to the counterparty calculated based on an initial notional amount of
$271.6 million at a fixed rate of 4.1375%, while the counterparty was obligated to make
quarterly floating rate payments to the Company based on the three month LIBO rate. The notional
amount of the Swap Transaction was scheduled to decline over the term of the term loan facility
consistent with the scheduled principal payments. The Swap Transaction had an effective date of
March 31, 2008 and a termination date of December 6, 2012.
On October 2, 2009, the Company amended its Swap Transaction (“Amended Swap Transaction”). The
Company entered into the Amended Swap Transaction in order to reduce the notional amount under the
initial Swap Transaction from $271.6 million to $210.8 million to hedge the Company’s then existing
variable interest rate debt under the Amended Credit Agreement. In exchange for the terms set forth
in the Amended Swap Transaction, the Company agreed to pay a fee of $0.8 million, which was
recorded as interest expense for the year end December 31, 2009.
As of December 31, 2009, the Amended Swap Transaction had a negative fair value of
$10.9 million of which $6.9 million was recorded in accrued expenses and $4.0 million was recorded
in other long-term liabilities.
6. DERIVATIVES AND HEDGING TRANSACTIONS
Effective for the first quarter of 2009, the Company adopted ASC 815-10, which expands the
quarterly and annual disclosure requirements about the Company’s derivative instruments and hedging
activities.
As of December 31, 2009 and 2008, the Company was party to a swap transaction, in which the
Company exchanges its floating-rate payments for fixed-rate payments. The Amended Swap Transaction
has a current notional amount of $205.6 million which is scheduled to amortize to $65.3 million at
maturity in December 2012. Such agreement qualifies as a cash flow hedge under ASC 815. The
effective portion of the change in the fair value of the derivative instrument is deferred in
Accumulated Other Comprehensive Loss (“AOCL”), net of taxes, until the underlying hedged item is
recognized in earnings. The ineffective portion of a fair value change on a qualifying cash flow
hedge is recognized in earnings immediately. Over the next 12 months, the Company expects to
reclassify $6,908 from AOCL to interest expense.
The following table summarizes the fair value and classification on the Consolidated Balance
Sheets of the Swap Transaction as of December 31, 2009 and 2008:
| |
|
|
|
|
|
|
|
|
|
|
| |
|
|
|
Fair Value |
|
| |
|
Balance Sheet |
|
December 31, |
|
| |
|
Classification |
|
2009 |
|
|
2008 |
|
Derivative designated as hedging instrument
under ASC 815 |
|
|
|
|
|
|
|
|
|
|
|
|
|
|
|
|
|
|
|
|
|
Swap Transaction — current portion |
|
Accrued expenses |
|
$ |
6,908 |
|
|
$ |
5,953 |
|
Swap Transaction — long term portion |
|
Other long-term liabilities |
|
|
4,010 |
|
|
|
10,531 |
|
|
|
|
|
|
|
|
|
|
|
|
|
|
|
|
|
|
|
|
|
Total derivatives designated as hedging |
|
|
|
$ |
10,918 |
|
|
$ |
16,484 |
|
|
|
|
|
|
|
|
|
|
F-22
The following table summarizes the loss recognized in AOCL of derivatives, designated and
qualifying as cash flow hedges for the years ended December 31, 2009, and 2008:
| |
|
|
|
|
|
|
|
|
| |
|
Amount of Gain or (Loss) Recognized in AOCL on |
|
| |
|
Derivative |
|
| |
|
Year Ended December 31, |
|
| |
|
2009 |
|
|
2008 |
|
Derivative in ASC 815 Cash Flow Hedging
Relationship |
|
|
|
|
|
|
|
|
|
|
|
|
|
|
|
|
|
Swap Transaction |
|
$ |
5,590 |
|
|
$ |
(14,877 |
) |
Tax effect |
|
|
(2,272 |
) |
|
|
5,710 |
|
|
|
|
|
|
|
|
Swap Transaction, net of tax effect |
|
$ |
3,318 |
|
|
$ |
(9,167 |
) |
|
|
|
|
|
|
|
The following table summarizes the effect of the Swap Transaction on the Consolidated
Statements of Operations for the years ended December 31, 2009 and 2008:
| |
|
|
|
|
|
|
|
|
|
|
|
|
|
|
|
|
| |
|
Amount of Gain or (Loss) |
|
|
Amount of Gain or (Loss) |
|
| |
|
Reclassified from AOCL into Income |
|
|
Recognized in Income |
|
| |
|
(effective portion) |
|
|
(ineffective portion) |
|
| |
|
Year Ended December 31, |
|
|
Year Ended December 31, |
|
| |
|
2009 |
|
|
2008 |
|
|
2009 |
|
|
2008 |
|
Location of Gain or (Loss)
Reclassified from AOCL into Income |
|
|
|
|
|
|
|
|
|
|
|
|
|
|
|
|
|
|
|
|
|
|
|
|
|
|
|
|
|
|
|
|
|
Interest expense |
|
$ |
(8,247 |
) |
|
$ |
(2,080 |
) |
|
$ |
(24 |
) |
|
$ |
— |
|
7. FAIR VALUE MEASUREMENTS
The Company adopted ASC 820, formerly SFAS No. 157, Fair Value Measurements, on January 1,
2008 for all financial assets and liabilities valued on a recurring basis, at least annually. ASC
820-10 delayed the effective date of ASC 820 for nonfinancial assets and liabilities, except for
certain items that are recognized or disclosed at fair value in the financial statements on a
recurring basis. The Company adopted ASC 820 with respect to nonfinancial assets and liabilities on
January 1, 2009. The Company has no non-financial assets and liabilities that are required to be
measured at fair value on a recurring basis as of December 31, 2009. In accordance with ASC 820,
the Company has categorized its assets and liabilities that are measured at fair value into a
three-level fair value hierarchy as set forth below. If the inputs used to measure fair value fall
within different levels of the hierarchy, the categorization is based on the lowest level input
that is significant to the fair value measurement. The three levels of the hierarchy are defined as
follows:
Level 1 — inputs to the valuation methodology are quoted prices
(unadjusted) for identical assets or liabilities in active markets.
Level 2 — inputs to the valuation methodology include quoted prices for similar
assets and liabilities in active markets, and inputs that are observable for
the asset or liability, either directly or indirectly, for substantially the
full term of the financial instrument.
Level 3 — inputs to the valuation methodology are unobservable and significant to the fair value measurement.
The following table sets forth, by level within the fair value hierarchy, the Company’s
financial assets and liabilities that were accounted for at fair value on a recurring basis as of
December 31, 2009 and 2008. As required by ASC 820, financial assets and liabilities are classified
in their entirety based on the lowest level of input that is significant to the fair value
measurement. The Company’s assessment of the significance of a particular input to the fair value
measurement requires judgment, and may affect the valuation of fair value assets and liabilities
and their placement within the fair value hierarchy levels.
| |
|
|
|
|
|
|
|
|
| |
|
Level 2 |
|
| |
|
December 31, |
|
| |
|
2009 |
|
|
2008 |
|
Recurring Fair Value
Measure |
|
|
|
|
|
|
|
|
|
|
|
|
|
|
|
|
|
Interest rate swap |
|
$ |
10,918 |
|
|
$ |
16,484 |
|
F-23
The Swap Transaction is valued at fair value based on current market interest rates using a
discounted cash flow model and an adjustment for counterparty risk. This model reflects the
contractual terms of the derivative instrument, including the time to maturity and debt repayment
schedule, and market-based parameters such as interest rates and yield curves. This model does not
require significant judgment, and the inputs are observable. Thus, the derivative instrument is
classified within Level 2 of the valuation hierarchy. The Company does not intend to terminate the
Swap Transaction prior to its expiration date of December 6, 2012.
8. INCOME TAXES
The following table includes the consolidated income tax provision for federal, state, and
local income taxes related to the Company’s total earnings before taxes for 2009, 2008 and 2007:
| |
|
|
|
|
|
|
|
|
|
|
|
|
| |
|
Year Ended December 31, |
|
| |
|
2009 |
|
|
2008 |
|
|
2007 |
|
Current: |
|
|
|
|
|
|
|
|
|
|
|
|
Federal |
|
$ |
5,767 |
|
|
$ |
25,644 |
|
|
$ |
30,362 |
|
State |
|
|
1,442 |
|
|
|
5,052 |
|
|
|
6,156 |
|
Foreign |
|
|
286 |
|
|
|
676 |
|
|
|
367 |
|
|
|
|
|
|
|
|
|
|
|
|
|
|
7,495 |
|
|
|
31,372 |
|
|
|
36,885 |
|
Deferred: |
|
|
|
|
|
|
|
|
|
|
|
|
Federal |
|
|
(2,854 |
) |
|
|
(6,510 |
) |
|
|
3,910 |
|
State |
|
|
(302 |
) |
|
|
(2,783 |
) |
|
|
1,376 |
|
Foreign |
|
|
(1,321 |
) |
|
|
(879 |
) |
|
|
32 |
|
|
|
|
|
|
|
|
|
|
|
|
|
|
(4,477 |
) |
|
|
(10,172 |
) |
|
|
5,318 |
|
|
|
|
|
|
|
|
|
|
|
Income tax provision |
|
$ |
3,018 |
|
|
$ |
21,200 |
|
|
$ |
42,203 |
|
|
|
|
|
|
|
|
|
|
|
F-24
The consolidated deferred tax assets and liabilities consist of the following:
| |
|
|
|
|
|
|
|
|
| |
|
December 31, |
|
| |
|
2009 |
|
|
2008 |
|
Current portion of deferred tax assets (liabilities): |
|
|
|
|
|
|
|
|
Financial statement accruals not currently deductible |
|
$ |
5,187 |
|
|
$ |
4,306 |
|
State taxes |
|
|
268 |
|
|
|
1,265 |
|
Tax credit carryforward |
|
|
113 |
|
|
|
260 |
|
|
|
|
|
|
|
|
Net current deferred tax assets |
|
|
5,568 |
|
|
|
5,831 |
|
|
|
|
|
|
|
|
Non-current portion of deferred tax assets and (liabilities): |
|
|
|
|
|
|
|
|
Excess of income tax basis over net book value of intangible assets |
|
|
18,420 |
|
|
|
21,403 |
|
Excess of income tax basis over net book value of property, plant and equipment |
|
|
10,800 |
|
|
|
9,855 |
|
Stock-based compensation |
|
|
4,225 |
|
|
|
2,781 |
|
Tax credit carryforward |
|
|
761 |
|
|
|
823 |
|
Foreign tax net operating loss carryforward |
|
|
1,392 |
|
|
|
133 |
|
Accumulated other comprehensive loss |
|
|
4,074 |
|
|
|
6,227 |
|
Excess of net book value over income tax basis of intangible assets |
|
|
(12,685 |
) |
|
|
(15,818 |
) |
|
|
|
|
|
|
|
Net non-current deferred tax assets |
|
|
26,987 |
|
|
|
25,404 |
|
|
|
|
|
|
|
|
Net deferred tax assets |
|
$ |
32,555 |
|
|
$ |
31,235 |
|
|
|
|
|
|
|
|
A reconciliation of the statutory federal income tax rate to the Company’s effective
tax rate is as follows:
| |
|
|
|
|
|
|
|
|
|
|
|
|
| |
|
Year Ended December 31, |
|
| |
|
2009 |
|
|
2008 |
|
|
2007 |
|
Statutory federal income tax rate |
|
|
35 |
% |
|
|
35 |
% |
|
|
35 |
% |
State taxes, net of federal benefit |
|
|
(5 |
) |
|
|
5 |
|
|
|
5 |
|
Foreign taxes |
|
|
4 |
|
|
|
— |
|
|
|
— |
|
Goodwill impairment |
|
|
(56 |
) |
|
|
1 |
|
|
|
— |
|
Non-deductible expenses and other |
|
|
(6 |
) |
|
|
2 |
|
|
|
1 |
|
Domestic Production Activities Deduction tax benefit |
|
|
3 |
|
|
|
(3 |
) |
|
|
(2 |
) |
Discrete item |
|
|
— |
|
|
|
(3 |
) |
|
|
(1 |
) |
|
|
|
|
|
|
|
|
|
|
Effective income tax rate |
|
|
(25 |
)% |
|
|
37 |
% |
|
|
38 |
% |
|
|
|
|
|
|
|
|
|
|
Goodwill impairment item represents non-deductible goodwill impairment related to stock
acquisitions in prior years. Non-deductible other items include meals and entertainment, incentive
stock option expense and other items that, individually, are not significant. The discrete item in
2007 is due to the 2006 Domestic Production Activities Deduction. The discrete item in 2008 is
primarily due to federal and state income tax credits recognized with respect to hiring employees
and the purchase and lease of tangible assets in certain qualified enterprise zones in prior years
2007, 2006 and 2005. During the second half of 2008, the Company researched and determined that it
qualified for these credits.
The Company or one of its subsidiaries files income tax returns in the U.S. federal
jurisdiction, and various states and foreign jurisdictions. With few exceptions, the Company is no
longer subject to U.S. federal, state and local, or non-U.S. income tax examinations by tax
authorities for years before 2005. The Internal Revenue Service (IRS) commenced an examination of
the Company’s U.S. income tax return for 2005 in the fourth quarter of 2007 and completed by the
end of 2008. The IRS did not propose any adjustments to the Company’s 2005 consolided federal
income tax return.
A reconciliation of the beginning and ending amount of unrecognized tax is as follows:
| |
|
|
|
|
|
|
|
|
|
|
|
|
| |
|
2009 |
|
|
2008 |
|
|
2007 |
|
Beginning balance at January 1, |
|
$ |
1,133 |
|
|
$ |
1,100 |
|
|
$ |
897 |
|
Additions based on tax positions related to the current
year |
|
|
424 |
|
|
|
379 |
|
|
|
379 |
|
Reductions for tax positions due to effective settlement
with taxing authorities |
|
|
— |
|
|
|
(346 |
) |
|
|
— |
|
|
|
|
|
|
|
|
|
|
|
Reductions for tax positions due to expiration of
statute of limitations |
|
|
— |
|
|
|
— |
|
|
|
(176 |
) |
|
|
|
|
|
|
|
|
|
|
Ending balance at December 31, |
|
$ |
1,557 |
|
|
$ |
1,133 |
|
|
$ |
1,100 |
|
|
|
|
|
|
|
|
|
|
|
F-25
All of the unrecognized tax benefits, reflected above, would affect the Company’s
effective tax rate, if recognized. The Company does not anticipate a significant change to
additions and reductions in 2010.
The Company recognizes penalties and interest related to unrecognized tax benefits in tax
expense. Interest expense of $202 and $93 is included in the ASC 740-10, formerly FIN 48,
Accounting for Uncertainty in Income Taxes, liability on the Company’s balance sheet as of December
31, 2009 and 2008, respectively.
9. COMMITMENTS AND CONTINGENCIES
The Company leases machinery, equipment, and office and operational facilities under
noncancelable operating lease agreements. Certain lease agreements for the Company’s facilities
generally contain renewal options and provide for annual increases in rent based on the local
Consumer Price Index. The following is a schedule of the Company’s future minimum lease payments as
of December 31, 2009:
| |
|
|
|
|
|
|
|
|
|
|
|
|
| |
|
Third Party |
|
|
Related Party |
|
|
Total |
|
Year ending December 31: |
|
|
|
|
|
|
|
|
|
|
|
|
2010 |
|
$ |
26,940 |
|
|
$ |
1,509 |
|
|
$ |
28,449 |
|
2011 |
|
|
19,370 |
|
|
|
1,244 |
|
|
|
20,614 |
|
2012 |
|
|
13,549 |
|
|
|
1,082 |
|
|
|
14,631 |
|
2013 |
|
|
8,188 |
|
|
|
852 |
|
|
|
9,040 |
|
2014 |
|
|
5,885 |
|
|
|
33 |
|
|
|
5,918 |
|
Thereafter |
|
|
10,215 |
|
|
|
— |
|
|
|
10,215 |
|
|
|
|
|
|
|
|
|
|
|
|
|
$ |
84,147 |
|
|
$ |
4,720 |
|
|
$ |
88,867 |
|
|
|
|
|
|
|
|
|
|
|
Total rent expense under operating leases, including month-to-month rentals, amounted to
$34,379, $37,452, and $36,185 during the years ended December 31, 2009, 2008 and 2007,
respectively. Under certain lease agreements, the Company is responsible for other costs such as
property taxes, insurance, maintenance, and utilities.
The Company has entered into indemnification agreements with each director and named executive
officer which provide indemnification under certain circumstances for acts and omissions which may
not be covered by any directors’ and officers’ liability insurance. The indemnification agreements
may require the Company, among other things, to indemnify its officers and directors against
certain liabilities that may arise by reason of their status or service as officers and directors
(other than liabilities arising from willful misconduct of a culpable nature), to advance their
expenses incurred as a result of any proceeding against them as to which they could be indemnified,
and to obtain officers’ and directors’ insurance if available on reasonable terms. There have been
no events to date which would require the Company to indemnify its officers or directors.
On November 8, 2007, the United States Bankruptcy Court, Southern District of New York,
granted a motion approving settlement of the previously-disclosed Louis Frey litigation. The
judgment entered in that litigation in 2006 awarded damages to plaintiff in the principal amount of
$11.1 million, $0.2 million in preference claims, and interest totaling $3.3 million through
September 30, 2007. Pursuant to the settlement, the Company paid $10.5 million to satisfy the
judgment entered against the Company.
The Company accounted for the judgment in 2006 by recording a one-time, non-recurring
litigation charge of $14.0 million, which included $11.1 million in awarded damages, $0.2 million
preference claim, and interest expense of $2.7 million through December 31, 2006. These charges
were offset by a corresponding tax benefit of $5.6 million, resulting in a negative impact of
$8.4 million to net income in 2006.
The Company paid the $0.2 million preference in 2006 and accrued an additional $0.6 million
for interest on the judgment for the nine months ended September 30, 2007. As a result of the
$10.5 million settlement, the Company recognized a pre-tax benefit of $3.3 million ($2.9 million
litigation settlement gain, and $0.4 million in interest reversal) in 2007.
As a result of a mediation conducted in June 2007, the Company settled lawsuits for
reimbursement of incurred legal expenses and claims asserted by the Company alleging unfair
competition, trade secret misappropriation, and breach of contract in consideration for a cash
payment to the Company in the sum of $3.3 million. The Company accounted for the settlement payment
by recording the benefit of $3.3 million as an offset to selling, general, and administrative
expense during 2007.
The Company is involved in various additional legal proceedings and other legal matters from
time to time in the normal course of business. The Company does not believe that the outcome of any
of these matters will have a material adverse effect on its consolidated financial position,
results of operations or cash flows.
F-26
10. RELATED PARTY TRANSACTIONS
The Company leases several of its facilities under lease agreements with entities owned by
certain of its current and former executive officers which expire through March 2014. Rental
expense on these facilities amounted to $1,586 during the years ended December 31, 2009, 2008 and
2007.
11. RETIREMENT PLANS
The Company sponsors a 401(k) Plan, which covers substantially all employees of the Company
who have attained age 21. Under the Company’s 401(k) Plan, eligible employees may contribute up to
75% of their annual eligible compensation (or in the case of highly compensated employees, up to 6%
of their annual eligible compensation), subject to contribution limitations imposed by the Internal
Revenue Service. The Company made an employer matching contribution equal to 20% of an employee’s
contributions, up to a total of 4% of that employee’s compensation. In July 2009, the Company
amended its 401(k) Plan to eliminate the mandatory company contribution and to provide for
discretionary company contributions. An independent third party administers the Company’s 401(k)
Plan. The Company’s total expense under these plans amounted to $400, $797, and $808 during the
years ended December 31, 2009, 2008, and 2007, respectively.
12. EMPLOYEE STOCK PURCHASE PLAN AND STOCK OPTION PLAN
Employee Stock Purchase Plan
The Company adopted the American Reprographics Company 2005 Employee Stock Purchase Plan (the
“ESPP”) in connection with the consummation of its initial public offering in February 2005.
Effective as of April 29, 2009, the ESPP was amended so that eligible employees may purchase up to
a calendar year maximum per eligible employee of the lesser of (i) 2,500 shares of common stock, or
(ii) a number of shares of common stock having an aggregate fair market value of $25 thousand as
determined on the date of purchase.
Under the April 29, 2009 amendment to the ESPP, the purchase price of common stock acquired
pursuant to the ESPP in any offering on or after June 30, 2009 was decreased from 95% to 85% of the
fair market value of such shares of common stock on the applicable purchase date. The compensation
expense in connection with the further amended ESPP in 2009 was $21 thousand.
In 2009 the Company issued 30,031 shares of its common stock to 93 eligible employees in
accordance with the ESPP at a weighted average price of $5.46. In 2008, the Company issued 3,087
shares of its common stock to 19 eligible employees in accordance with the ESPP at a weighted
average price of $11.48. In 2007, the Company issued 4,600 shares of its common stock to 32
eligible employees in accordance with the ESPP at a weighted average price of $21.65.
2005 Stock Plan
The Company adopted the American Reprographics Company 2005 Stock Plan (the “Stock Plan”) in
connection with the consummation of its initial public offering in February 2005. The Stock Plan
provides for the grant of incentive and non-statutory stock options, stock appreciation rights,
restricted stock purchase awards, restricted stock awards, and restricted stock units to employees,
directors and consultants of the Company. The Stock Plan authorizes the Company to issue up to
5,000,000 shares of common stock. This amount will automatically increase annually on the first day
of the Company’s fiscal year, from 2006 through and including 2010, by the lesser of (i) 1.0% of
the Company’s outstanding shares on the date of the increase; (ii) 300,000 shares; or (iii) such
smaller number of shares determined by the Company’s board of directors. At December 31, 2009,
2,478,755 shares remain available for grant under the Stock Plan.
Options granted under the Stock Plan generally expire no later than ten years from the date of
grant. Options generally vest and become fully exercisable over a period of three to five years,
except options granted to non-employee directors may vest over a shorter time period. The exercise
price of options must be equal to at least 100% (110% in the case of an incentive stock option
granted to a 10% stockholder) of the fair market value of the Company’s common stock as of the date
of grant. The Company allows for cashless exercises and grants new authorized shares upon the
exercise of a vested stock option.
In February 2009, the Company granted stock options covering 37,326 shares of common stock
to key employees with an exercise price equal to the fair market value of the Company’s stock on
the date of grant. The stock options vest ratably over a period of three years and expire 10
years after the date of grant.
F-27
Stock Option Exchange Program. On April 22, 2009, the Company commenced a stock option
exchange program to allow certain of its employees the opportunity to exchange all or a portion of
their eligible outstanding stock options for an equivalent number of new, replacement options. In
connection with the exchange program, the Company issued 1,479,250 nonstatutory stock options with
an exercise price of $8.20, equal to the closing price of the Company’s common stock on the New
York Stock Exchange on May 21, 2009. Generally, all employees who held options upon expiration of
the exchange program, other than the Company’s
board members, were eligible to participate in the program.
The number of shares of Company common stock subject to outstanding options did not change as
a result of the exchange offer. New options issued as part of the exchange offer are subject to a
two-year vesting schedule, with 50% of the shares subject to an option vesting on the one-year
anniversary of the date of grant of the replacement option, and the remaining 50% of the shares
subject to an option vesting on the two-year anniversary of the date of grant of the replacement
option. The new options will expire 10 years from the date of grant of the replacement options,
unless earlier terminated. In accordance with ASC 718, the Company measured the new fair value of
the replacement options and also revalued the original options as of the date of modification. The
excess fair value of the replacement options over the re-measured value of the original options
represents incremental compensation cost. The total incremental cost of the replacement options is
approximately $2.4 million of which $0.7 million has been recognized for the year ended December
31, 2009 with $1.7 million remaining to be recognized over the remaining service period of the
replacement options.
In October 2009, the Company granted a stock option covering 25,000 shares of common stock to
a key employee with an exercise price equal to the fair market value of the Company’s stock on the
date of grant. The stock option vests ratably over a period of five years and expires 10 years
after the date of grant.
In April 2008, the Company granted stock options covering 350,000 stock options to key
employees with an exercise price equal to the fair market value of the Company’s stock on the date
of grant. The stock options vest ratably over a period of five years and expire 10 years after the
date of grant.
In March 2007, the Company granted stock options covering 600,500 stock options to key
employees with an exercise price equal to the fair market value on the date of grant. In the second
quarter of 2007 the Company issued 7,500 stock options to an additional key employee with an
exercise price equal to the fair market value. The stock options vest ratably over a period of
three or five years and expire 10 years after the date of grant. The following is a further
breakdown of the stock option activity under the Stock Plan:
| |
|
|
|
|
|
|
|
|
|
|
|
|
|
|
|
|
| |
|
Year Ended Decemer 31, 2009 |
|
| |
|
|
|
|
|
|
|
|
|
Weighted |
|
|
|
|
| |
|
|
|
|
|
Weighted |
|
|
Average |
|
|
Aggregate |
|
| |
|
|
|
|
|
Average |
|
|
Contractual |
|
|
Intrinsic |
|
| |
|
|
|
|
|
Exercise |
|
|
Life |
|
|
Value |
|
| |
|
Shares |
|
|
Price |
|
|
(In years) |
|
|
(In thousands) |
|
|
|
|
|
|
|
|
|
|
|
|
|
|
|
|
|
|
Oustanding at December 31, 2007 |
|
|
2,057,796 |
|
|
$ |
20.26 |
|
|
|
|
|
|
|
|
|
Granted |
|
|
350,000 |
|
|
$ |
15.56 |
|
|
|
|
|
|
|
|
|
Exercised |
|
|
(31,700 |
) |
|
$ |
5.57 |
|
|
|
|
|
|
|
|
|
Forfeited |
|
|
(94,950 |
) |
|
$ |
26.23 |
|
|
|
|
|
|
|
|
|
|
|
|
|
|
|
|
|
|
|
|
|
|
|
|
Outstanding at December 31, 2008 |
|
|
2,281,146 |
|
|
$ |
19.49 |
|
|
|
|
|
|
|
|
|
Granted |
|
|
1,541,576 |
|
|
$ |
8.12 |
|
|
|
|
|
|
|
|
|
Exercised |
|
|
(11,800 |
) |
|
$ |
5.34 |
|
|
|
|
|
|
|
|
|
Forfeited/Cancelled |
|
|
(1,559,250 |
) |
|
$ |
24.50 |
|
|
|
|
|
|
|
|
|
|
|
|
|
|
|
|
|
|
|
|
|
|
Outstanding at December 31, 2009 |
|
|
2,251,672 |
|
|
$ |
7.76 |
|
|
|
7.22 |
|
|
$ |
1,128 |
|
|
|
|
|
|
|
|
|
|
|
|
|
|
Vested or expected to vest at December 31, 2009 |
|
|
2,143,829 |
|
|
$ |
7.74 |
|
|
|
7.23 |
|
|
$ |
1,128 |
|
|
|
|
|
|
|
|
|
|
|
|
|
|
Exercisable at December 31, 2009 |
|
|
722,096 |
|
|
$ |
7.00 |
|
|
|
2.97 |
|
|
$ |
1,075 |
|
|
|
|
|
|
|
|
|
|
|
|
|
|
The aggregate intrinsic value in the table above represents the total pretax intrinsic
value (the difference between the closing stock price on December 31, 2009 and the exercise
price, multiplied by the number of in-the-money options) that would have been received by the
option holders had all the option holders exercised their options on December 31, 2009. This
amount changes based on the fair market value of the common stock. Total intrinsic value of
options exercised during the years ended December 31, 2009 and 2008 was $0.05 million and
$0.4 million, respectively.
F-28
A summary of the Company’s non-vested stock options as of December 31, 2009, and changes
during the fiscal year then ended is as follows:
| |
|
|
|
|
|
|
|
|
| |
|
|
|
|
|
Weighted |
|
| |
|
|
|
|
|
Average Grant Date |
|
| Non-vested Options |
|
Shares |
|
|
Fair Market Value |
|
Non-vested at December 31, 2008 |
|
|
1,128,686 |
|
|
$ |
9.68 |
|
Granted |
|
|
1,541,576 |
|
|
$ |
3.34 |
|
Vested |
|
|
(35,929 |
) |
|
$ |
10.09 |
|
Forfeited/Cancelled |
|
|
(1,104,757 |
) |
|
$ |
9.60 |
|
|
|
|
|
|
|
|
Non-vested at December 31, 2009 |
|
|
1,529,576 |
|
|
$ |
3.34 |
|
|
|
|
|
|
|
|
As of December 31, 2009, total unrecognized stock-based compensation expense related
to nonvested stock based compensation was approximately $10.1 million, which is expected to be
recognized over a weighted average period of approximately 2.2 years.
The following table summarizes certain information concerning outstanding options at
December 31, 2009:
| |
|
|
|
|
| Range of Exercise |
|
Options Outstanding |
|
| Price |
|
at December 31, 2009 |
|
$4.88 - $5.85 |
|
|
638,000 |
|
$6.11 - $8.20 |
|
|
1,564,125 |
|
$23.85 - $35.42 |
|
|
49,547 |
|
|
|
|
|
$4.88 - $35.42 |
|
|
2,251,672 |
|
|
|
|
|
Restricted Stock
The Stock Plan provides for automatic grants of restricted stock awards to non-employee
directors of the Company, as of each annual meeting of the Company’s stockholders. In April 2009,
the Stock Plan was amended to automatically provide each non-employee director a restricted stock
award for that number of shares of the Company’s common stock having a then fair market value equal
to $50 thousand. Prior to an amendment of the Stock Plan in April 2009, each non-employee director
automatically received a restricted stock award for that number of shares of the Company’s common
stock having a then fair market value equal to $60 thousand.
In April 2009, the Company issued shares of restricted common stock at the prevailing market
price in the amount of $50 thousand or 7,752 shares, to each of the six non-employee members of its
Board of Directors. The shares of restricted stock granted to the non-employee board members will
vest on the one-year anniversary of the grant date.
In October 2009, the Company issued 349,500 shares of restricted common stock in the amount of
$2.1 million at the prevailing market price to certain key employees. The shares of restricted
stock subject to those grants will vest ratably over a period of five years.
In April 2008, the Company issued shares of restricted common stock at the prevailing market
price in the amount of $0.9 million or 60,000 shares, to the Company’s Chief Financial Officer
(“CFO”), and $60 thousand, or 3,650 shares, to each of the five non-employee board members in May
2008. The shares of restricted stock issued to the Company’s CFO will vest on the fourth
anniversary of the grant date; the shares of restricted stock granted to the non-employee board
members vested one year from their grant date.
In March 2007, the Company issued shares of restricted common stock at the prevailing market
price in the amount of $0.5 million, or 15,504 shares, to each of the Company’s then Chief
Executive Officer and President/Chief Operating Officer, and $60 thousand, or 1,966 shares, to each
of the five non-employee directors. The shares of restricted stock issued to the Company’s then
Chief Executive Officer and President/Chief Operating Officer will vest on the fifth anniversary of
the grant date; the shares of restricted stock granted to the non-employee directors vested 1 /
12th per month over twelve months.
In December 2004, the Company agreed to issue shares of restricted common stock at the
prevailing market price in the amount of $1.0 million to the Company’s Chief Technology Officer
(CTO) upon the CTO’s development of certain software applications. In November 2006, such software
had been completed pursuant to the Company’s specifications and the CTO was granted 28,253 shares
(determined by the average NYSE closing price for the 10 days immediately preceding the fifth day
prior to grant). Such shares vest on the fifth anniversary of grant, provided the CTO remains
employed with the Company and satisfactorily maintains and enhances the software.
F-29
13. QUARTERLY FINANCIAL DATA (Unaudited)
Quarterly financial data for the years ended December 31, 2009 and 2008 are as follows:
| |
|
|
|
|
|
|
|
|
|
|
|
|
|
|
|
|
| |
|
Quarter Ended |
|
| |
|
March 31, |
|
|
June 30, |
|
|
September 30, |
|
|
December 31, |
|
| |
|
2008 |
|
|
2008 |
|
|
2008 |
|
|
2008 |
|
Net sales |
|
$ |
187,443 |
|
|
$ |
184,941 |
|
|
$ |
174,585 |
|
|
$ |
154,018 |
|
Gross profit |
|
$ |
79,603 |
|
|
$ |
79,088 |
|
|
$ |
70,015 |
|
|
$ |
56,566 |
|
Net income (loss)
|
|
|
|
|
|
|
|
|
|
|
|
|
|
|
|
|
|
attributable to ARC |
|
$ |
18,498 |
|
|
$ |
18,876 |
|
|
$ |
15,067 |
|
|
$ |
(15,687 |
) |
Earnings (loss) per share: |
|
|
|
|
|
|
|
|
|
|
|
|
|
|
|
|
attributable to ARC: |
|
|
|
|
|
|
|
|
|
|
|
|
|
|
|
|
Basic |
|
$ |
0.41 |
|
|
$ |
0.42 |
|
|
$ |
0.33 |
|
|
$ |
(0.35 |
) |
Diluted |
|
$ |
0.41 |
|
|
$ |
0.42 |
|
|
$ |
0.33 |
|
|
$ |
(0.35 |
) |
| |
|
|
|
|
|
|
|
|
|
|
|
|
|
|
|
|
| |
|
Quarter Ended |
|
| |
|
March 31, |
|
|
June 30, |
|
|
September 30, |
|
|
December 31, |
|
| |
|
2009 |
|
|
2009 |
|
|
2009 |
|
|
2009 |
|
Net sales |
|
$ |
139,483 |
|
|
$ |
131,054 |
|
|
$ |
119,350 |
|
|
$ |
111,662 |
|
Gross profit |
|
$ |
51,979 |
|
|
$ |
49,155 |
|
|
$ |
41,131 |
|
|
$ |
35,924 |
|
Net income (loss)
|
|
|
|
|
|
|
|
|
|
|
|
|
|
|
|
|
attributable to ARC |
|
$ |
7,547 |
|
|
$ |
6,307 |
|
|
$ |
(28,164 |
) |
|
$ |
(575 |
) |
Earnings (loss) per share: |
|
|
|
|
|
|
|
|
|
|
|
|
|
|
|
|
attributable to ARC: |
|
|
|
|
|
|
|
|
|
|
|
|
|
|
|
|
Basic |
|
$ |
0.17 |
|
|
$ |
0.14 |
|
|
$ |
(0.62 |
) |
|
$ |
(0.01 |
) |
Diluted |
|
$ |
0.17 |
|
|
$ |
0.14 |
|
|
$ |
(0.62 |
) |
|
$ |
(0.01 |
) |
F-30
Schedule II
AMERICAN REPROGRAPHICS COMPANY AND SUBSIDIARIES
VALUATION AND QUALIFYING ACCOUNTS
| |
|
|
|
|
|
|
|
|
|
|
|
|
|
|
|
|
|
|
|
|
| |
|
Balance at |
|
|
Charges to |
|
|
Charged to |
|
|
|
|
|
|
Balance at |
|
| |
|
Beginning |
|
|
Cost and |
|
|
Other |
|
|
Deductions |
|
|
End of |
|
| |
|
of Period |
|
|
Expenses |
|
|
Accounts (1) |
|
|
(2) |
|
|
Period |
|
Year ended December 31, 2007 |
|
|
|
|
|
|
|
|
|
|
|
|
|
|
|
|
|
|
|
|
Allowance for accounts receivable |
|
$ |
4,344 |
|
|
$ |
1,315 |
|
|
$ |
708 |
|
|
$ |
(1,275 |
) |
|
$ |
5,092 |
|
Allowance for inventory
obsolescence |
|
|
527 |
|
|
|
104 |
|
|
|
282 |
|
|
|
(156 |
) |
|
|
757 |
|
|
|
|
|
|
|
|
|
|
|
|
|
|
|
|
|
|
|
$ |
4,871 |
|
|
$ |
1,419 |
|
|
$ |
990 |
|
|
$ |
(1,431 |
) |
|
$ |
5,849 |
|
|
|
|
|
|
|
|
|
|
|
|
|
|
|
|
|
|
|
|
|
|
|
|
|
|
|
|
|
|
|
|
|
|
|
|
|
|
Year ended December 31, 2008 |
|
|
|
|
|
|
|
|
|
|
|
|
|
|
|
|
|
|
|
|
Allowance for accounts receivable |
|
$ |
5,092 |
|
|
$ |
4,966 |
|
|
$ |
362 |
|
|
$ |
(4,996 |
) |
|
$ |
5,424 |
|
Allowance for inventory
obsolescence |
|
|
757 |
|
|
|
47 |
|
|
|
99 |
|
|
|
(348 |
) |
|
|
555 |
|
|
|
|
|
|
|
|
|
|
|
|
|
|
|
|
|
|
|
$ |
5,849 |
|
|
$ |
5,013 |
|
|
$ |
461 |
|
|
$ |
(5,344 |
) |
|
$ |
5,979 |
|
|
|
|
|
|
|
|
|
|
|
|
|
|
|
|
|
|
|
|
|
|
|
|
|
|
|
|
|
|
|
|
|
|
|
|
|
|
Year ended December 31, 2009 |
|
|
|
|
|
|
|
|
|
|
|
|
|
|
|
|
|
|
|
|
Allowance for accounts receivable |
|
$ |
5,424 |
|
|
$ |
3,044 |
|
|
$ |
— |
|
|
$ |
(3,783 |
) |
|
$ |
4,685 |
|
Allowance for inventory
obsolescence |
|
|
555 |
|
|
|
52 |
|
|
|
— |
|
|
|
(12 |
) |
|
|
595 |
|
|
|
|
|
|
|
|
|
|
|
|
|
|
|
|
|
|
|
$ |
5,979 |
|
|
$ |
3,096 |
|
|
$ |
— |
|
|
$ |
(3,795 |
) |
|
$ |
5,280 |
|
|
|
|
|
|
|
|
|
|
|
|
|
|
|
|
|
| |
|
|
| (1) |
|
Acquisition of businesses and sales returns and discounts. |
| |
| (2) |
|
Deductions represent uncollectible accounts written-off net of recoveries and inventory adjustments. |
F-31
EXHIBIT INDEX
| |
|
|
|
|
| Number |
|
Description |
| |
|
|
|
|
| |
10.79 |
|
|
Restricted Stock Award Grant Notice between American Reprographics Company and
Dilantha Wijesuriya dated October 28, 2009. * ˆ |
| |
|
|
|
|
| |
10.80 |
|
|
Consent dated as of December 11, 2009, for the premises commonly known as 17721
Mitchell North, Irvine, CA by and between Sumo Holdings Irvine, LLC, OCB, LLC and
American Reprographics Company, L.L.C.* |
| |
|
|
|
|
| |
10.81 |
|
|
First Amendment and Waiver to Credit and Guaranty Agreement dated as of February 13,
2009 by and between American Reprographics Company, American Reprographics Company,
L.L.C., JPMorgan Chase Bank, N.A., Wachovia Bank, National Association, Bank of
America, N.A., and Wells Fargo Bank, N.A. * |
| |
|
|
|
|
| |
10.82 |
|
|
Third Amendment to Credit and Guaranty Agreement dated as of December 16, 2009 by and
among American Reprographics Company, American Reprographics Company, L.L.C.,
JPMorgan Chase Bank, N.A., as administrative and collateral agent, and the other
lenders named therein.* |
| |
|
|
|
|
| |
21.1 |
|
|
List of Subsidiaries.* |
| |
|
|
|
|
| |
23.1 |
|
|
Consent of Deloitte & Touche LLP, Independent Registered Public Accounting Firm.* |
| |
|
|
|
|
| |
23.2 |
|
|
Consent of PricewaterhouseCoopers LLP, Independent Registered Public Accounting Firm.* |
| |
|
|
|
|
| |
31.1 |
|
|
Certification of Principal Executive Officer pursuant to Rule 13a-14(a) and Rule
15d-14(a) under the Securities Exchange Act of 1934, as adopted pursuant to
Section 302 of the Sarbanes-Oxley Act of 2002. * |
| |
|
|
|
|
| |
31.2 |
|
|
Certification of Principal Financial Officer pursuant to Rule 13a-14(a) and
Rule 15d-14(a) of the Securities Exchange Act of 1934, as adopted pursuant to
Section 302 of the Sarbanes-Oxley Act of 2002. * |
| |
|
|
|
|
| |
32.1 |
|
|
Certification of Chief Executive Officer pursuant to 18 U.S.C. Section 1350, as
adopted pursuant to Section 906 of the Sarbanes-Oxley Act of 2002. * |
| |
|
|
|
|
| |
32.2 |
|
|
Certification of Chief Financial Officer pursuant to 18 U.S.C. Section 1350, as
adopted pursuant to Section 906 of the Sarbanes-Oxley Act of 2002. * |
| |
|
|
| * |
|
Filed herewith |
| |
| ˆ |
|
Indicates management contract or compensatory plan or agreement |