Attached files
Table of Contents
UNITED STATES
SECURITIES AND EXCHANGE COMMISSION
Washington, D.C. 20549
Form 10-K
| þ | ANNUAL REPORT PURSUANT TO SECTION 13 OR 15(d) OF THE SECURITIES EXCHANGE ACT OF 1934 |
For the Fiscal Year Ended December 31, 2009
| ¨ | TRANSITION REPORT PURSUANT TO SECTION 13 OR 15(d) OF THE SECURITIES EXCHANGE ACT OF 1934 |
For the transition period from to
Commission File Number 001-08454
ACCO Brands Corporation
(Exact Name of Registrant as Specified in Its Charter)
| Delaware | 36-2704017 | |
| (State or Other Jurisdiction of Incorporation or Organization) |
(I.R.S. Employer Identification Number) | |
300 Tower Parkway
Lincolnshire, Illinois 60069
(Address of Registrant’s Principal Executive Office, Including Zip Code)
(847) 541-9500
(Registrant’s Telephone Number, Including Area Code)
Securities registered pursuant to Section 12(b) of the Act:
| Title of Each Class | Name of Each Exchange on Which Registered | |
| Common Stock, par value $.01 per share | New York Stock Exchange |
Securities registered pursuant to Section 12(g) of the Act:
None
Indicate by check mark if the registrant is a well-known seasoned issuer, as defined in Rule 405 of the Securities Act. Yes ¨ No þ
Indicate by check mark if the registrant is not required to file reports pursuant to Section 13 or Section 15(d) of the Act. Yes ¨ No þ
Indicate by check mark whether the registrant: (1) has filed all reports required to be filed by Section 13 or 15(d) of the Securities Exchange Act of 1934 during the preceding 12 months (or for such shorter period that the registrant was required to file such reports), and (2) has been subject to such filing requirements for the past 90 days. Yes þ No ¨
Indicate by check mark whether the registrant has submitted electronically and posted on its corporate website, if any, every Interactive Data File required to be submitted and posted pursuant to Rule 405 of Regulation S-T during the preceding 12 months (or for such shorter period that the registrant was required to submit and post such files). Yes ¨ No ¨
Indicate by check mark if disclosure of delinquent filers pursuant to Item 405 of Regulation S-K is not contained herein, and will not be contained, to the best of registrant’s knowledge, in definitive proxy or information statements incorporated by reference in Part III of this Form 10-K or any amendment to this Form 10-K. ¨
Indicate by check mark whether the registrant is a large accelerated filer, an accelerated filer, a non-accelerated filer or a smaller reporting company (as defined in Rule 12b-2 of the Exchange Act).
| Large accelerated filer ¨ | Accelerated filer þ | Non-accelerated filer ¨ | Smaller reporting company ¨ |
Indicate by check mark whether the registrant is a shell company (as defined in Rule 12b-2 of the Act). Yes ¨ No þ
As of June 30, 2009, the aggregate market value of the shares of Common Stock held by non-affiliates of the registrant was approximately $117 million.
As of January 29, 2010, the registrant had outstanding 54,572,191 shares of Common Stock.
DOCUMENTS INCORPORATED BY REFERENCE
Portions of the registrant’s definitive proxy statement to be issued in connection with registrant’s annual stockholder’s meeting to be held on May 18, 2010 are incorporated by reference into Part III of this report.
Table of Contents
2
Table of Contents
PART I
Cautionary Statement Regarding Forward-Looking Statements. Certain statements made in this Annual Report on Form 10-K are “forward-looking statements” within the meaning of Section 21E of the Securities Exchange Act of 1934, as amended. We intend such forward-looking statements to be covered by the safe harbor provisions for forward-looking statements contained in the Private Securities Litigation Reform Act of 1995, and are including this statement for purposes of invoking these safe harbor provisions. These forward-looking statements, which are based on certain assumptions and describe future plans, strategies and expectations of the Company, are generally identifiable by use of the words “will,” “believe,” “expect,” “intend,” “anticipate,” “estimate,” “forecast,” “project,” “plan,” or similar expressions. Our ability to predict results or the actual effect of future plans or strategies is inherently uncertain. Because actual results may differ from those predicted by such forward-looking statements, you should not rely on such forward-looking statements when deciding whether to buy, sell or hold the Company’s securities. We undertake no obligation to update these forward-looking statements in the future. The factors that could affect our results or cause plans, actions and results to differ materially from current expectations are detailed in this report, including under “Item 1. Business,” “Item 1A. Risk Factors” and the financial statement line item discussions set forth in “Item 7. Management’s Discussion and Analysis of Financial Conditions and Results of Operations” and from time to time in our other SEC filings.
Website Access to Securities and Exchange Commission Reports
The Company’s Internet website can be found at www.accobrands.com. The Company makes available free of charge on or through its website its annual reports on Form 10-K, quarterly reports on Form 10-Q, current reports on Form 8-K, and amendments to those reports filed or furnished pursuant to Section 13(a) or 15(d) of the Securities Exchange Act of 1934 as soon as practicable after the Company files them with, or furnishes them to, the Securities and Exchange Commission. We also make available the following documents on our Internet website: the Audit Committee Charter; the Compensation Committee Charter; the Corporate Governance and Nominating Committee Charter; our Corporate Governance Principles; and our Code of Business Conduct and Ethics. The Company’s Code of Business Conduct and Ethics applies to all of our directors, officers (including the Chief Executive Officer, Chief Financial Officer and Principal Accounting Officer) and employees. You may obtain a copy of any of the foregoing documents, free of charge, if you submit a written request to ACCO Brands Corporation, 300 Tower Parkway, Lincolnshire, IL. 60069, Attn: Investor Relations.
History, Spin-Off and Merger
ACCO Brands Corporation (“ACCO Brands” or the “Company”), formerly doing business under the name ACCO World Corporation (“ACCO World”), supplies branded office products to the office products resale industry. On August 16, 2005, Fortune Brands, Inc. (“Fortune Brands” or the “Parent”), then the majority stockholder of ACCO World, completed its spin-off of the Company by means of the pro rata distribution (the “Distribution”) of all outstanding shares of ACCO Brands held by Fortune Brands to its stockholders. In the Distribution, each Fortune Brands stockholder received one share of ACCO Brands common stock for every 4.255 shares of Fortune Brands common stock held of record as of the close of business on August 9, 2005. Following the Distribution, ACCO Brands became an independent, separately traded, publicly-held company. On August 17, 2005, pursuant to an Agreement and Plan of Merger dated as of March 15, 2005, as amended as of August 4, 2005 (the “Merger Agreement”), by and among Fortune Brands, ACCO Brands, Gemini Acquisition Sub, Inc., a wholly-owned subsidiary of the Company (“Acquisition Sub”) and General Binding Corporation (“GBC”), Acquisition Sub merged with and into GBC. Each outstanding share of GBC common stock and GBC Class B common stock was converted into the right to receive one share of ACCO Brands common stock and
3
Table of Contents
each outstanding share of Acquisition Sub common stock was converted into one share of GBC common stock. As a result of the merger, the separate corporate existence of Acquisition Sub ceased and GBC continues as the surviving corporation and a wholly-owned subsidiary of ACCO Brands.
Overview
ACCO Brands is one of the world’s largest suppliers of select categories of branded office products (excluding furniture, computers, printers and bulk paper) to the office products resale industry. We design, develop, manufacture and market a wide variety of traditional and computer-related office products, supplies, binding and laminating equipment and related consumable supplies, personal computer accessory products, paper-based time management products and presentation aids and products. Through a focus on research, marketing and innovation, we seek to develop new products that meet the needs of our consumers and commercial end-users, which we believe will increase the product positioning of our brands. We compete through a balance of innovation, a low-cost operating model and an efficient supply chain. We sell our products primarily to markets located in North America, Europe and Australia. Our brands include GBC ®, Kensington ®, Quartet ®, Rexel, Swingline®, Wilson Jones ®, Marbig, NOBO and Day-Timer ®, among others.
The majority of our office products are used by businesses. Most of these end-users purchase our products from our customers, which include commercial contract stationers, retail superstores, wholesalers, resellers, mail order and internet catalogs, mass merchandisers, club stores and dealers. We also supply our products directly to commercial and industrial end-users and to the educational market. Historically we have targeted the premium-end of the product categories in which we compete. However, we also supply private label products for our customers where we believe we have an economic advantage or where it is necessary to merchandise a complete category.
Our leading brand positions provide the scale to enable us to invest in product innovation and drive market growth across our product categories. In addition, the expertise we use to satisfy the exacting technical specifications of our more demanding commercial customers is in many instances the basis for expanding our products and innovations to consumer products.
Our current strategy centers on a combination of growing sales and market share and generating acceptable profitability and returns. Specifically, we have substantially reduced our operating expenses and seek to leverage our platform for organic growth through greater consumer understanding, product innovation, marketing and merchandising, disciplined category expansion including broader product penetration and possible strategic transactions and continued cost realignment. To achieve these goals, we plan to continue to execute the following strategies: (1) invest in research, marketing and innovation, (2) penetrate the full product spectrum of our categories and (3) opportunistically pursue strategic transactions.
We utilize a combination of manufacturing and third-party sourcing to procure our products, depending on transportation costs, service needs and direct labor costs associated with each product.
The integration of our businesses following the acquisition of GBC is complete. The synergies from the business combination are fully reflected in our 2009 results. Remaining cash disbursements, approximate $9.3 million, mainly relating to residual severance payments and unused facilities. We had identified and pursued significant potential savings opportunities resulting from the merger. These opportunities included cost reductions attributable to efficiencies and synergies derived from facility integration, headcount reduction, supply chain optimization, systems integration and revenue enhancement.
Our priority for cash flow over the near term, after internal growth, is to fund the reduction of debt and invest in new products through both organic development and acquisitions. For a description of certain factors that may have had, or may in the future have, a significant impact on our business, financial condition or results of operations, see Item 1A, Risk Factors.
4
Table of Contents
Reportable Segments
The Company is organized into three business segments: ACCO Brands Americas, ACCO Brands International and Computer Products Group.
The following table shows the percentage of the Company’s consolidated revenue from continuing operations derived from each of the Company’s reportable segments in the years indicated:
| Segment |
2009 | 2008 | 2007 | ||||||
| ACCO Brands Americas |
53 | % | 52 | % | 55 | % | |||
| ACCO Brands International |
34 | % | 35 | % | 32 | % | |||
| Computer Products Group |
13 | % | 13 | % | 13 | % |
ACCO Brands Americas and ACCO Brands International
ACCO Brands Americas and ACCO Brands International—These two segments manufacture, source and sell traditional office products and supplies and document finishing solutions. ACCO Brands Americas comprises the North, Central and South American markets, and ACCO Brands International comprises the rest of the world, principally Europe, Australia and Asia-Pacific.
Examples of our traditional office products and supplies are staplers, staples, punches, ring binders, trimmers, sheet protectors, hanging file folders, clips and fasteners, dry-erase boards, dry-erase markers, easels, bulletin boards, overhead projectors, transparencies, laser pointers and screens. These products are sold under leading brands including Quartet®, Rexel, Swingline®, Wilson Jones®, Marbig, NOBO, ACCO®, Derwent and Eastlight. Examples of our document finishing solutions are binding, lamination and punching equipment, binding and lamination supplies, report covers, archival report covers and shredders. These products are sold primarily under the GBC® brand. We also provide machine maintenance and repair services sold under the GBC brand. Included in the ACCO Brands Americas segment are our personal organization tools, including time management products, primarily under the Day-Timer® brand name.
The customer base to which our products are sold is made up of large global and regional resellers of our products. It is through these large resellers that the Company’s products reach the end consumer. Our customer base includes commercial contract stationers, office products superstores, wholesalers, distributors, mail order and internet catalogs, mass merchandisers, club stores and independent dealers. The majority of sales by our customers are to business end-users, which generally seek office products that have added value or ease of use features and a reputation for reliability, performance and professional appearance. Some of our document finishing products are sold directly to high volume end-users and commercial reprographic centers and indirectly to lower-volume consumers worldwide. Approximately two-thirds of the Day-Timer business is sold through the direct channel, which markets product through the internet and periodic sales catalogs and ships product directly to our end-user customers. The remainder of the business sells to large resellers and commercial dealers.
Computer Products Group
The Computer Products Group designs, distributes, markets and sells accessories for laptop and desktop computers and Apple® iPod® and iPhone® products. These accessories primarily include security locks, power adapters, input devices such as mice and keyboards, laptop computer carrying cases, hubs and docking stations, ergonomic devices and technology accessories for iPods® and iPhones®. The Computer Products Group sells mostly under the Kensington and Kensington Microsaver® brand names, with the majority of its revenue coming from the U.S. and Western Europe.
All of our computer products are manufactured by third-party suppliers, principally in Asia, and are stored in and distributed from our regional facilities. Our computer products are sold primarily to consumer electronics retailers, information technology value-added resellers, original equipment manufacturers and office products retailers.
5
Table of Contents
For further information on the Company’s business segments see Note 14, Information on Business Segments, to our consolidated financial statements contained in Item 8 of this report.
Discontinued Operations
In June 2009, the Company completed the sale of its commercial print finishing business for final gross proceeds of $16.2 million. The sale resulted in a pre-tax loss of $0.8 million ($1.1 million after-tax). The results of operations and loss on sale of this business are reported in discontinued operations for all periods presented. For further information on the Company’s discontinued operations see Note 10, Discontinued Operations, to our consolidated financial statements contained in Item 8 of this report.
Customers/Competition
Our sales are generated principally in North America, Europe and Australia. For the fiscal year ended December 31, 2009, these markets represented 59%, 25% and 13% of our net sales, respectively. Our top ten customers are Staples, Office Depot, OfficeMax, United Stationers, BPGI, S.P. Richards, Coles Group, Spicers, Wal-Mart/Sam’s Club and Tech Data, together accounting for 49% of our net sales for the fiscal year ended December 31, 2009. Sales to Staples amounted to approximately 13%, 13% and 12% of consolidated net sales for the years ended 2009, 2008 and 2007, respectively. Sales to Office Depot, Inc. and subsidiaries amounted to approximately 11%, 11% and 13% of consolidated net sales for the years ended 2009, 2008 and 2007, respectively. Sales to no other customer exceeded 10% of consolidated sales for any of these periods.
Current trends among our customers include fostering high levels of competition among suppliers, demanding innovative new products and requiring suppliers to maintain or reduce product prices and deliver products with shorter lead times and in smaller quantities. Other trends are for retailers to import generic products directly from foreign sources and sell those products, which compete with our products, under the customers’ own private-label brands. The combination of these market influences, along with a recent and continuing trend of consolidation among resellers, has created an intensely competitive environment in which our principal customers continuously evaluate which product suppliers to use, resulting in pricing pressures, the need for stronger end-user brands, broader product penetration within categories, the ongoing introduction of innovative new products and continuing improvements in customer service.
Competitors of the ACCO Brands Americas and ACCO Brands International segments include Avery Dennison, Esselte, 3M, Newell, Hamelin, Smead, Fellowes, Mead, Franklin Covey and Spiral Binding. Competitors of the Computer Products Group include Belkin, Logitech, Targus and Fellowes.
Certain financial information for each of our business segments and geographic regions is incorporated by reference to Note 14, Information on Business Segments, to our consolidated financial statements contained in Item 8 of this report.
Product Development and Product Line Rationalization
Our strong commitment to understanding our consumers and defining products that fulfill their needs drives our product development strategy, which we believe is and will be a key contributor to our success in the office products industry. Our new products are developed from our own consumer understanding, our own research and development or through partnership initiatives with inventors and vendors. Costs related to consumer research and product research when paid directly by ACCO Brands are included in marketing costs and research and development expenses, respectively. Research and development expenses amounted to $18.6 million, $22.3 million and $28.0 million for the years ended December 31, 2009, 2008 and 2007, respectively.
Our divestiture and product line rationalization strategy emphasizes the divestiture of businesses and rationalization of product offerings that do not meet our long-term strategic goals and objectives. We consistently
6
Table of Contents
review our businesses and product offerings, assess their strategic fit and seek opportunities to divest non-strategic businesses. The criteria we use in assessing the strategic fit include: the ability to increase sales for the business; the ability to create strong, differentiated brands; the importance of the business to key customers; the business relationship with existing product lines; the impact of the business to the market; and the business’s actual and potential impact on our operating performance.
As a result of this review process, during 2009 we completed the sale of our former commercial print finishing business. This business represented approximately $100 million in annual net sales. Previously we completed the sale of MACO® labels product line during the fourth quarter of 2007 and discontinued certain other low-margin products in the ACCO Brands Americas and ACCO Brands International segments in 2007.
Raw Materials
The primary materials used in the manufacturing of many of our products are plastics, resin, polyester and polypropylene substrates, paper, steel, wood, aluminum, melamine, zinc and cork. These materials are available from a number of suppliers, and we are not dependent upon any single supplier for any of these materials. In general, our gross profit may be affected from time to time by fluctuations in the prices of these materials because our customers require advance notice and negotiation to pass through raw material price increases, giving rise to a delay before cost increases can be passed on to our customers. See “Risk Factors—Risks Related to Our Business.” The raw materials and labor costs we incur are subject to price increases that could adversely affect our profitability. Based on experience, we believe that adequate quantities of these materials will be available in the foreseeable future. In addition, a significant portion of the products we sell in our international markets are sourced from China and other Far-Eastern countries and are paid for in U.S. dollars. Thus, movements of their local currency to the U.S. dollar have the same impacts as raw material price changes and we adjust our pricing in these markets to reflect these currency changes.
Supply
Our products are either manufactured or sourced to ensure that we supply our customers with appropriate customer service, quality products, innovative solutions and attractive pricing. We have built a customer-focused business model with a flexible supply chain to ensure that these factors are appropriately balanced. Using a combination of manufacturing and third-party sourcing also enables us to reduce our costs and effectively manage our production assets by lowering our capital investment and working capital requirements. Our strategy is to manufacture those products that would incur a relatively high freight expense or have high service needs and source those products that have a high proportion of direct labor cost. Low cost sourcing mainly comes from China, but we also source from other Asian countries and Eastern Europe. Where freight costs or service issues are significant, we source from factories located in or near to our domestic markets.
Seasonality
Our business, as it concerns both historical sales and profit, has experienced increased sales volume in the third and fourth quarters of the calendar year. Two principal factors have contributed to this seasonality: the office products industry, its customers and ACCO Brands specifically are major suppliers of products related to the “back-to-school” season, which occurs principally during the months of June, July, August and September for our North American business and November, December and January for our Australian business; and our offering includes several products which lend themselves to calendar year-end purchase timing, including Day-Timer planners, paper organization and storage products (including bindery) and Kensington computer accessories, which increase with traditionally strong fourth quarter sales of personal computers.
7
Table of Contents
Intellectual Property
We have many patents, trademarks, brand names and trade names that are, in the aggregate, important to our business. The loss of any individual patent or license, however, would not be material to us taken as a whole. Many of our trademarks are only important in particular geographic markets or regions. Our principal registered trademarks are: GBC®, Kensington®, Quartet®, Rexel, Swingline®, Wilson Jones®, Marbig, NOBO, Day-Timer®, Microsaver®, ACCO® and Apollo®. See “Risk Factors—Risks Related to Our Business.”
Environmental Matters
We are subject to federal, state and local laws and regulations concerning the discharge of materials into the environment and the handling, disposal and clean-up of waste materials and otherwise relating to the protection of the environment. It is not possible to quantify with certainty the potential impact of actions regarding environmental matters, particularly remediation and other compliance efforts that we may undertake in the future. In the opinion of our management, compliance with the present environmental protection laws, before taking into account estimated recoveries from third parties, will not have a material adverse effect upon our capital expenditures, financial condition, results of operations or competitive position. See “Risk Factors—Risks Related to Our Business.”
Employees
As of December 31, 2009, the Company had approximately 4,200 full-time and part-time employees. There have been no strikes or material labor disputes at any of our facilities during the past five years. We consider our employee relations to be good.
Risks Related to Our Business
Our business, operating results, cash flows and financial condition are subject to various risks and uncertainties, including, without limitation, those set forth below, any of which could cause our actual results to vary materially from recent results or from our anticipated future results.
Sales of our products may be adversely affected by issues that affect business, commercial and consumer spending decisions during periods of economic downturn.
The majority of our products are used by businesses, whose purchasing power is influenced by general economic conditions. With respect to our office products, because we have typically targeted the higher-margin, premium-end of the product categories in which we compete, sales of our products have been very sensitive to deteriorating U.S. and global economic conditions, particularly in categories where we compete against private label or generic products that generally are sold at lower prices. The adverse effects of a sustained U.S. or international economic downturn as we have experienced in 2008 and 2009 including sustained periods of decreased consumer and business spending, high unemployment levels, or declining consumer or business confidence, along with continued volatility and disruption in the credit and capital markets, have and is likely to continue to result in reduced demand for our products. We believe that consumer and commercial end-users choose our products based on the status of our brands and the perception that our products have added value and a reputation for reliability, ease-of-use, performance and professional appearance than less expensive alternatives. However, in economic downturns, businesses and consumers may seek or be forced to purchase more lower-cost private label or other economy brands, or to forego certain purchases altogether. To the extent this trend continues to occur, we may experience a further reduction in sales volume, particularly with respect to our higher margin products. If our operating costs and expenses are not likewise reduced with a reduction in sales, it could contribute to further operating losses.
8
Table of Contents
Our substantial indebtedness may adversely affect our ability to raise additional capital to fund our operations, limit our ability to react to changes in the economy or our industry, expose us to interest rate risk to the extent of our variable rate debt, prevent us from meeting our obligations under our indebtedness and otherwise adversely affect our results of operations and financial condition.
As of December 31, 2009, we had $725.8 million of outstanding debt. This indebtedness could have negative consequences to us, such as:
| • | making it more difficult for us to satisfy our obligations with respect to indebtedness; |
| • | requiring us to dedicate a substantial portion of our cash flow from operating activities to payments on our indebtedness, thereby reducing the availability of our cash flow to fund working capital, capital expenditures, research and development efforts, potential strategic acquisitions and other general corporate purposes; |
| • | limiting our ability to obtain additional financing to fund growth, working capital or capital expenditures, or to fulfill debt service requirements or other cash requirements; |
| • | increasing our vulnerability to economic downturns and changing market conditions; |
| • | limiting our operational flexibility due to the covenants contained in our debt agreements; |
| • | placing us at a competitive disadvantage relative to competitors that have less debt; |
| • | to the extent that our debt is subject to floating interest rates, increasing our vulnerability to fluctuations in market interest rates; and |
| • | limiting our ability to buy back our stock or pay cash dividends |
The agreements governing our indebtedness contain financial and other restrictive covenants that limit our ability to engage in activities that may be in our long-term best interests. Our ability to meet our expense and debt service obligations will depend on our future performance, which will be affected by financial, business, economic and other factors, including potential changes in customer preferences, the success of product and marketing innovation and pressure from competitors. If the sales decline we suffered in 2008 and 2009 continues or accelerates, we may not be able to generate sufficient cash flow to pay our debt service obligations when due. If we are unable to meet our debt service obligations, we may be required to refinance all or part of our existing debt (potentially on unfavorable terms), sell important strategic assets at unfavorable prices or borrow more money. We may not be able to, at any given time, refinance our debt, sell assets or borrow more money on terms acceptable to us or at all.
Our failure to comply with certain restrictive debt covenants, could result in an event of default which, if not cured or waived, could result in the acceleration of all of our debts.
Certain covenants we have made in connection with our existing borrowings restrict our ability to, among other things, incur additional indebtedness, incur certain liens on our assets, issue preferred stock or certain disqualified stock, pay dividends on capital stock, make other restricted payments, including investments, sell our assets, and enter into consolidations or mergers or other transactions with affiliates. Our asset-based revolving credit facility also requires us to maintain specified financial ratios under certain conditions and satisfy financial condition tests. Our ability to meet those financial ratios and tests and otherwise comply with our financial covenants may be affected by events beyond our control, and we may not be able to continue to meet those ratios, tests and covenants. Our ability to generate sufficient cash from operations to meet our debt obligations will depend upon our future operating performance, which will be affected by general economic, financial, competitive, legislative, regulatory, business and other factors beyond our control. A breach of any of these covenants, ratios, tests or restrictions, as applicable, or any inability to pay interest on, or principal of, our outstanding debt as it becomes due could result in an event of default under any of the agreements governing any
9
Table of Contents
of our debt obligations, in which case our lenders could elect to declare all amounts outstanding to be immediately due and payable. If the lenders accelerate the payment of any of our indebtedness, our assets may not be sufficient to repay in full such indebtedness and any other indebtedness that would become due as a result of such acceleration and, if we were unable to obtain replacement financing or any such replacement financing was on terms that were less favorable than the indebtedness being replaced, our liquidity and results of operations would be materially and adversely affected. See “Management’s Discussion and Analysis of Financial Condition and Results of Operations—Liquidity and Capital Resources.”
We require a significant amount of cash to service our debt. Our ability to meet our cash requirements and service our debt will be impacted by many factors that are outside our control, including the current global recession and restricted credit markets.
Our future operating performance is dependent on many factors, some of which are beyond our control, including prevailing economic, financial and industry conditions. Sales of our products have recently declined in part due to the current global recession and restricted credit markets, which have adversely impacted our customers’ commercial spending. Any increase in the sales of our products is primarily dependent on recovery and growth in the commercial, business-to-business sector of the economy. If global economic conditions continue to adversely impact commercial spending, our sales could continue to decline or become increasingly concentrated in lower margin products, and our business, financial condition, results of operations and/or cash flows could be materially adversely affected.
The impact of the current global recession and restricted credit markets on our suppliers and customers is also unpredictable, and may create additional risks for us, both directly and indirectly. The inability of suppliers to access financing or the insolvency of one or more of our suppliers could lead to disruptions in our supply chain, which could adversely impact our sales and/or increase our costs. Our suppliers may require us to pay cash in advance or obtain letters of credit for their benefit as a condition to selling us their products and services. A number of retailers have recently sought bankruptcy protection. If one or more of our principal customers were to file for bankruptcy, our sales could be adversely impacted and our ability to collect outstanding accounts receivable from any such customer could be limited. Any of these risks and uncertainties could have a material adverse effect on our business, financial condition, results of operations and/or cash flows.
Our operating performance and ability to comply with covenants under our borrowing arrangements are dependent on our continued ability to access funds under our credit and loan agreements, including under our new asset-backed revolving credit facility, and from cash on hand, maintain sales volumes, drive profitable growth, realize cost savings and generate cash from operations. The financial institutions that fund our new asset-based revolving credit facility are also being impacted by the volatility in the credit markets, and if one or more of them cannot fulfill our revolving credit requests, our operations may be adversely impacted. If our revolving credit is unavailable due to a lender not being able to fund requested amounts, or because we have not maintained compliance with our covenants, or we do not meet our costs, sales or growth initiatives within the time frame we expect, our cash flow could be materially adversely impacted. A material decrease in our cash flow could cause us to fail to meet covenants under our credit and loan agreements. A default under our credit or loan agreements could restrict or terminate our access to borrowings and materially impair our ability to meet our obligations as they come due. If we do not comply with any of our covenants and thereafter we do not obtain a waiver or amendment that otherwise addresses that non-compliance, our lenders may accelerate payment of all amounts outstanding under the affected borrowing arrangements, which amounts would immediately become due and payable, together with accrued interest. Such an acceleration would cause a default under the indentures governing the notes and the existing senior subordinated notes and other agreements that provide us with access to funding. Any one or more defaults, or our inability to generate sufficient cash flow from our operations in the future to service our indebtedness and meet our other needs, may require us to refinance all or a portion of our existing indebtedness or obtain additional financing or reduce expenditures that we deem necessary to our business. We cannot assure you that any refinancing of this kind would be possible or that any additional financing could be obtained. The inability to obtain additional financing could have a material adverse effect on our financial condition and on our ability to meet our obligations to noteholders.
10
Table of Contents
During the third quarter of 2009, the Company completed a series of transactions to refinance its indebtedness. These transactions resulted in both an increased amount of indebtedness as well as an increase to the weighted average interest rate on our indebtedness. As such, these transactions will increase the cost of servicing our debt, which could have a material adverse effect on our business, financial condition, results of operations or cash flows. (For a further discussion on the Company’s refinancing transactions, see Note 11, Long-term debt and Short-term borrowings, under Item 8, Financial Statements and Supplementary Data.)
Despite current indebtedness levels, we and our subsidiaries may still be able to incur substantially more debt. This could further exacerbate the risks associated with our substantial leverage.
We and our subsidiaries may be able to incur substantial additional indebtedness in the future because the terms of our existing indebtedness do not prohibit us or our subsidiaries from doing so, within certain limits. Based on our borrowing base, as of December 31, 2009 our revolving credit facility permitted borrowing of up to an additional $156.4 million. If new indebtedness is added to our and our subsidiaries’ current debt levels, the related risks that we and they now face could intensify.
Our business is dependent on a limited number of customers, and a substantial reduction in sales to these customers could significantly impact our operating results.
The office products industry is concentrated in a small number of major customers, principally office products superstores (which combine contract stationers, retail and mail order), office products resellers and mass merchandisers. A relatively limited number of customers account for a large percentage of our total net sales. Our top ten customers accounted for 49% of our net sales for the fiscal year ended December 31, 2009. Sales to Staples and Office Depot, Inc. and subsidiaries during the same period amounted to approximately 13% and 11%, respectively, of our 2009 net sales. The loss of, or a significant reduction in, business from one or more of our major customers could have a material adverse effect on our business, financial condition and results of operations. A concentrated customer base also exposes us to increased concentration of customer credit risk.
A bankruptcy of one or more of the Company’s major customers could have a material adverse effect on our financial condition and results of operations
In 2008 and in early 2009 several consumer products retailers sought protection under various bankruptcy laws. Were any of the Company’s major customers to make a bankruptcy filing, the Company could be adversely impacted. The nature of that impact could be not only a reduction in future sales, but also a loss associated with the potential inability to collect any outstanding accounts receivable from any such customer. Such a result could negatively impact our financial results and cash flows and ability to remain in compliance with our loan covenants.
Our pension costs could substantially increase as a result of volatility in the equity markets or interest rates.
The difference between plan obligations and assets, or the funded status of our defined benefit pension plans, is a significant factor in determining the net periodic benefit costs of our pension plans and the ongoing funding requirements of those plans. Changes in interest rates and the market value of plan assets can impact the funded status of these plans and cause volatility in the net periodic benefit cost and future funding requirements of these plans. The exact amount of cash contributions made to pension plans in any year is dependent upon a number of factors, and a significant increase in our pension funding requirements could have a negative impact on our cash flow. Investment returns on pension plan assets, which were negative in 2008, had a significant impact on our financial position, particularly our stockholders’ equity.
Impairment charges could have a material adverse effect on our financial results.
During 2008, we recorded $274.4 million of goodwill and asset impairment charges, which adversely affected that year’s financial results. Future events may occur that may also adversely affect the reported value of
11
Table of Contents
our assets and require impairment charges, which could further adversely affect our financial results. Such events may include, but are not limited to, a sustained decline in our stock price, strategic decisions made in response to changes in economic and competitive conditions, the impact of the economic environment on our customer base or a material adverse change in our relationship with significant customers.
Our industry is subject to further consolidation, and further consolidation of our customers could cause a reduction to our margins and sales.
While the office products industry already has a concentrated reseller base, if current trends continue, these resellers, our customers, are likely to consolidate further. Customer consolidation is likely to result in pricing pressures to which we are subject, leading to downward pressure on our margins and profits. Additionally, consolidation among customers can result in decreased inventory levels maintained by these customers, which can negatively impact our sales during the transition period for any such consolidation. Further, there can be no assurance that consolidating customers would leverage our international scope and distribution capabilities by concentrating their purchasing activity with us.
If we do not compete successfully in the competitive office products industry, our business and revenues may be adversely affected.
Our products and services are sold in highly competitive markets. We believe that the principal points of competition in these markets are product innovation, quality, price, merchandising, design and engineering capabilities, product development, timeliness and completeness of delivery, conformity to customer specifications and post-sale support. Competitive conditions may require us to significantly discount prices in order to retain business or market share. We believe that our competitive position will depend on continued investment in innovation and product development, manufacturing and sourcing, quality standards, marketing and customer service and support. Our success will depend in part on our ability to anticipate and offer products that appeal to the changing needs and preferences of our customers in the various market categories in which we compete. We may not have sufficient resources to make the investments that may be necessary to anticipate those changing needs and we may not anticipate, identify, develop and market products successfully or otherwise be successful in maintaining our competitive position. There are no significant barriers to entry into the markets for most of our products and services. We also face increasing competition from our own customers’ private label and direct sourcing initiatives.
Our business is subject to risks associated with seasonality, which could adversely affect our cash flow, financial condition or results of operations.
Our business, as it concerns both historical sales and profit, has experienced higher sales volume in the third and fourth quarters of the calendar year. Two principal factors have contributed to this seasonality: the office products industry’s customers and our product line. We are major suppliers of products related to the “back-to-school” season, which occurs principally during the months of June, July, August and September for our North American business, December and January for our Australian business; and our product line includes several products that lend themselves to calendar year-end purchase timing. If either of these typical seasonal increases in sales of certain portions of our product line does not materialize, we could experience a material adverse effect on our business, financial condition and results of operations.
The raw materials and labor costs we incur are subject to price increases that could adversely affect our profitability.
The primary materials used in the manufacturing of many of our products are resin, plastics, polyester and polypropylene substrates, paper, steel, wood, aluminum, melamine, zinc and cork. In general, our gross profit may be affected from time to time by fluctuations in the prices of these materials because our customers require advance notice and negotiation to pass through raw material price increases, giving rise to a delay before cost increases can be passed to our customers. We attempt to reduce our exposure to increases in these costs through a
12
Table of Contents
variety of measures, including periodic purchases, future delivery contracts and longer-term price contracts together with holding our own inventory; however, these measures may not always be effective. Inflationary and other increases in costs of materials and labor have occurred in the past and may recur, and raw materials may not continue to be available in adequate supply in the future. Shortages in the supply of any of the raw materials we use in our products and other factors, such as inflation, could result in price increases that could have a material adverse effect on our financial condition or results of operations.
We are subject to supplier credit and order fulfillment risk.
We purchase products for resale under credit arrangements with our vendors. In weak global markets, vendors may seek credit insurance to protect against non-payment of amounts due to them. If we continue to experience declining operating performance, and if we experience severe liquidity challenges, vendors may demand that we accelerate our payment for their products. Also, credit insurers may curtail or eliminate coverage to the vendors. If vendors begin to demand accelerated payment of amounts due to them or if they begin to require advance payments or letters of credit before goods are shipped to us, these demands could have a significant adverse impact on our operating cash flow and result in a severe drain on our liquidity. In addition, if our vendors are unable to access liquidity or become insolvent, they could be unable to supply us with product. Also, some of our vendors are dependent upon other industries for raw materials and other products and services necessary to produce and provide the products they supply to us. Any adverse impacts to those industries, as a result of the economic slowdown or credit crisis, could have a ripple effect on these vendors, which could adversely impact their ability to supply us at levels we consider necessary or appropriate for our business, or at all. Any such disruptions could negatively impact our ability to deliver products and services to our customers, which in turn could have an adverse impact on our business, operating results, financial condition or cash flow.
Risks associated with our foreign operations could harm our business.
Approximately 51% of our net sales for the fiscal year ended December 31, 2009 were from foreign sales. Our foreign operations may be significantly affected by economic, political and governmental conditions in the countries where our products are manufactured, distributed, or sold. Additionally, while the recent relative volatility of the U.S. dollar to other currencies has impacted our businesses’ sales, profitability and cash flows as the results of non-U.S. operations have decreased when reported in U.S. dollars, we cannot predict the rate at which the U.S. dollar will trade against other currencies in the future. If the U.S. dollar were to substantially strengthen, making the dollar significantly more valuable relative to other currencies in the global market, such an increase could harm our ability to compete, and therefore, materially and adversely affect our financial condition and our results of operations. More specifically, a significant portion of the products we sell are sourced from China and other Southeast Asian countries and are paid for in U.S. dollars. Thus, movements of their local currency to the U.S. dollar have the same impacts as raw material price changes in addition to the currency translation impact noted above.
Risks associated with outsourcing the production of certain of our products could harm our business.
Historically, we have outsourced certain manufacturing functions to third-party service providers in China and other countries. Outsourcing generates a number of risks, including decreased control over the manufacturing process potentially leading to production delays or interruptions, inferior product quality control and misappropriation of trade secrets. In addition, performance problems by these third-party service providers could result in cost overruns, delayed deliveries, shortages, quality issues or other problems, which could result in significant customer dissatisfaction and could materially and adversely affect our business, financial condition and results of operations.
If one or more of these third-party service providers becomes insolvent or unable or unwilling to continue to provide services of acceptable quality, at acceptable costs, in a timely manner or any combination thereof, our ability to deliver our products to our customers could be severely impaired. Furthermore, the need to identify and qualify substitute service providers or increase our internal capacity could result in unforeseen operational
13
Table of Contents
problems and additional costs. Substitute service providers might not be available or, if available, might be unwilling or unable to offer services on acceptable terms. Moreover, if customer demand for our products increases, we may be unable to secure sufficient additional capacity from our current service providers, or others, on commercially reasonable terms, if at all.
This dependence on outsourcing also exposes our cost of goods sold to cost fluctuations associated with foreign exchange currency movements, notably a change in the relative values of the Chinese yuan and the U.S. dollar.
We depend on GMP Co. Ltd. to supply many of the laminating machines we distribute, and any inability of GMP Co. Ltd. to perform its obligations could harm our business.
We rely on GMP Co. Ltd., in which we hold a minority equity interest, as our sole supplier of many of the laminating machines we distribute. GMP may not be able to continue to perform any or all of its obligations to us. GMP’s equipment manufacturing facility is located in the Republic of Korea, and its ability to supply us with laminating machines may be affected by Korean and other regional or worldwide economic, political or governmental conditions. Additionally, GMP has a highly leveraged capital structure and its ability to continue to obtain financing is required to ensure the orderly continuation of its operations. If GMP became incapable of supplying us with adequate equipment, and if we could not locate a suitable alternative supplier in a timely manner or at all, and negotiate favorable terms with such supplier, it would have a material adverse effect on our business.
Any inability to secure, protect and maintain rights to intellectual property could harm our business.
We own and license many patents, trademarks, brand names and trade names that are, in the aggregate, important to our business. The loss of any individual patent or license may not be material to us taken as a whole, but the loss of a number of patents or licenses that represent principal portions of our business, or expenses related to defending or maintaining the patents or licenses, could have a material adverse effect on our business.
We may become involved in intellectual property claims being asserted against us that could cause us to incur substantial costs, divert the efforts of our management, and require us to pay substantial damages or require us to obtain a license, which might not be available on reasonable terms, if at all. We could also incur substantial costs to pursue legal actions relating to the unauthorized use by third parties of our intellectual property, which could have a material adverse effect on our business, results of operation or financial condition. If our brands become diluted, if our patents are infringed or if our competitors introduce brands and products that cause confusion with our brands in the marketplace, the value that our consumers associate with our brands may become diminished, which could negatively impact our sales If third parties assert claims against our intellectual property rights and we are not able to successfully resolve those claims, or our intellectual property becomes invalidated, we could lose our ability to use the technology, brand names or other intellectual property that were the subject of those claims, which, if such intellectual property is material to the operation of our business or our financial results, could have a material adverse effect on our business, financial condition and results from operations.
Certain of our patents covering products in the computer security category begin to expire in January 2012. We recognized approximately $4.6 million, $7.6 million and $7.4 million in royalty revenue from these patents in the years ended December 31, 2009, 2008 and 2007, respectively. Once these patents expire and should we not create new proprietary intellectual property, competitors may be able to legally utilize our technology and competition could increase, resulting in the Company realizing lower gross margin from the loss of royalty receipts and possibly lower gross margin for certain of our products. There can be no assurance that the royalty income we currently receive pursuant to license agreements covering the patents that will expire can be replaced, that, prior to expiration of the patents, we will create new proprietary intellectual property in the computer security product category, or that we will not experience a decline in gross profit margin on related products if new proprietary intellectual property is not developed.
14
Table of Contents
Our success depends on our ability to attract and retain qualified personnel.
Our success will depend on our ability to attract and retain qualified personnel, including executive officers and other key management personnel. We may not be able to attract and retain qualified management and other personnel necessary for the development, manufacture and sale of our products, and key employees may not remain with us in the future. As part of our cost reduction initiatives, we temporarily suspended the 401(k) employer matching contributions and froze the accrual of benefits under our pension plan, which will adversely affect our key employees. These actions could result in an inability for us to retain some of our key employees. If we do not retain our key employees, we may experience substantial disruption in our businesses. The loss of key management personnel or other key employees or our potential inability to attract such personnel may adversely affect our ability to manage our overall operations and successfully implement our business strategy.
We are subject to global environmental regulation and environmental risks.
We and our operations, both in the United States and abroad, are subject to national, state, provincial and/or local environmental laws and regulations that impose limitations and prohibitions on the discharge and emission of, and establish standards for the use, disposal and management of, certain materials and waste. These environmental laws and regulations also impose liability for the costs of investigating and cleaning up sites, and certain damages resulting from present and past spills, disposals, or other releases of hazardous substances or materials. Environmental laws and regulations can be complex and may change often. Capital and operating expenses required to comply with environmental laws and regulations can be significant, and violations may result in substantial fines and penalties. In addition, environmental laws and regulations, such as the Comprehensive Environmental Response, Compensation and Liability Act, or CERCLA, in the United States impose liability on several grounds for the investigation and cleanup of contaminated soil, ground water and buildings and for damages to natural resources at a wide range of properties. For example, contamination at properties formerly owned or operated by us, as well as at properties we will own and operate, and properties to which hazardous substances were sent by us, may result in liability for us under environmental laws and regulations. The costs of complying with environmental laws and regulations and any claims concerning noncompliance, or liability with respect to contamination in the future could have a material adverse effect on our financial condition or results of operations.
Product liability claims or regulatory actions could adversely affect our financial results or harm our reputation or the value of our end-user brands.
Claims for losses or injuries purportedly caused by some of our products arise in the ordinary course of our business. In addition to the risk of substantial monetary judgments, product liability claims or regulatory actions could result in negative publicity that could harm our reputation in the marketplace or the value of our end-user brands. We also could be required to recall and possibly discontinue the sale of possible defective or unsafe products, which could result in adverse publicity and significant expenses. Although we maintain product liability insurance coverage, potential product liability claims are subject to a self-insured deductible or could be excluded under the terms of the policy.
ITEM 1B. UNRESOLVED STAFF COMMENTS
None.
15
Table of Contents
We have manufacturing facilities in North America, Europe and Australia, and maintain distribution centers in relation to the regional markets we service. We lease our principal U.S. headquarters in Lincolnshire, Illinois. The following table indicates the principal manufacturing and distribution facilities of our subsidiaries as of December 31, 2009:
| Location |
Functional Use |
Owned/Leased | ||
| U.S. Properties: |
||||
| Ontario, California |
Distribution/Manufacturing | Leased | ||
| Booneville, Mississippi |
Distribution/Manufacturing | Owned/Leased | ||
| Ogdensburg, New York |
Distribution/Manufacturing | Owned/Leased | ||
| East Texas, Pennsylvania |
Distribution/Manufacturing/Office | Owned | ||
| Pleasant Prairie, Wisconsin |
Distribution/Manufacturing | Leased | ||
| Non-U.S. Properties: |
||||
| Sydney, Australia |
Distribution/Manufacturing/Office | Owned/Leased | ||
| Brampton, Canada |
Distribution/Manufacturing/Office | Leased | ||
| Tabor, Czech Republic |
Manufacturing | Owned | ||
| Vozicka, Czech Republic |
Distribution | Owned | ||
| Denton, England |
Manufacturing | Owned | ||
| Halesowen, England |
Distribution | Owned | ||
| Tornaco, Italy |
Distribution | Leased | ||
| Lerma, Mexico |
Manufacturing/Office | Owned | ||
| Born, Netherlands |
Distribution | Leased | ||
| Wellington, New Zealand |
Distribution/Office | Owned | ||
| Arcos de Valdevez, Portugal |
Manufacturing | Owned |
We believe that the properties are suitable to the respective businesses and have production capacities adequate to meet the needs of the businesses.
We are, from time to time, involved in routine litigation incidental to our operations. None of the legal proceedings in which we are currently involved, individually or in the aggregate, is material to our consolidated financial condition or results of operations nor are we aware of any material pending or contemplated proceedings. We intend to vigorously defend, or resolve by settlement, any such matters as appropriate.
ITEM 4. SUBMISSION OF MATTERS TO A VOTE OF SECURITY HOLDERS
None.
16
Table of Contents
Part II
ITEM 5. MARKET FOR THE REGISTRANT’S COMMON EQUITY, RELATED STOCKHOLDER MATTERS AND ISSUER PURCHASES OF EQUITY SECURITIES
Our common stock is traded on the New York Stock Exchange (“NYSE”) under the symbol “ABD.” The following table sets forth, for the periods indicated, the high and low sales prices for our common stock as reported on the NYSE for 2008 and 2009:
| High | Low | |||
| 2008 |
||||
| First Quarter |
16.49 | 12.40 | ||
| Second Quarter |
15.80 | 11.21 | ||
| Third Quarter |
11.19 | 6.87 | ||
| Fourth Quarter |
7.38 | 0.65 | ||
| 2009 |
||||
| First Quarter |
4.79 | 0.67 | ||
| Second Quarter |
3.79 | 0.97 | ||
| Third Quarter |
7.67 | 2.24 | ||
| Fourth Quarter |
7.80 | 5.74 |
As of January 31, 2010, the Company had approximately 12,980 registered holders of its common stock.
Dividend Policy
We have not paid any dividends on our common stock since becoming a public company. We intend to retain any future earnings to fund the development and growth of our business and reduce our indebtedness. Currently our debt agreements restrict our ability to make dividend payments and we do not anticipate paying any cash dividends in the foreseeable future. Any determination as to the declaration of dividends is at our board of directors’ sole discretion based on factors it deems relevant.
17
Table of Contents
STOCK PERFORMANCE GRAPH
The following graph compares the cumulative total stockholder return on our common stock to that of the S&P Office Services and Supplies (SuperCap) Index and the Russell 2000 Index assuming an investment of $100 in each from the date on which our common stock began trading on the NYSE (August 17, 2005) through December 31, 2009.
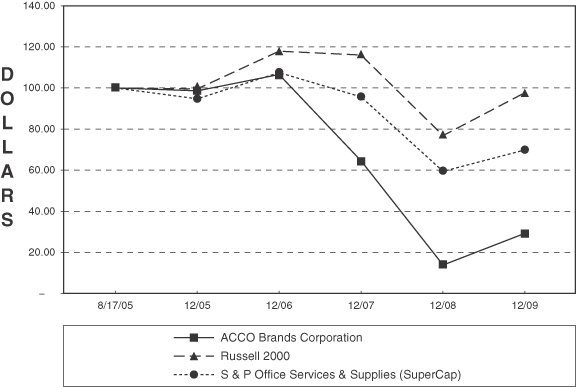
| Cumulative Total Return | ||||||||||||
| 8/17/05 | 12/31/05 | 12/31/06 | 12/31/07 | 12/31/08 | 12/31/09 | |||||||
| ACCO Brands Corporation |
100.00 | 98.55 | 106.48 | 64.52 | 13.88 | 29.28 | ||||||
| Russell 2000 |
100.00 | 99.57 | 117.86 | 116.01 | 76.82 | 97.69 | ||||||
| S & P Office Services & Supplies (SuperCap) |
100.00 | 94.62 | 107.41 | 95.56 | 59.32 | 69.87 | ||||||
18
Table of Contents
ITEM 6. SELECTED FINANCIAL DATA
SELECTED HISTORICAL FINANCIAL DATA
The following table sets forth our selected consolidated financial data. The selected consolidated financial data as of and for the fiscal years ended December 31, 2009, 2008, 2007, 2006 and 2005 is derived from our consolidated financial statements. The data should be read in conjunction with the financial statements and related notes included elsewhere in this annual report.
Basis of Presentation
Prior to August 17, 2005, the ACCO Brands businesses were managed largely as a stand-alone business segment of Fortune Brands, which provided certain corporate services. The financial statements include the use of “push down” accounting procedures in which certain assets, liabilities and expenses historically recorded or incurred at the Fortune Brands parent company level that related to or were incurred on behalf of ACCO Brands had been identified and allocated or “pushed down,” as appropriate, to the financial results of ACCO Brands for the periods presented through August 16, 2005. Allocations for expenses used the most relevant basis and, when not directly incurred, utilized net sales, segment assets or headcount in relation to the rest of Fortune Brands’ business segments to determine a reasonable allocation. In addition, interest expense had been allocated to ACCO Brands as a portion of Fortune Brands’ total interest expense. However, no debt had been allocated to ACCO Brands in relation to this interest expense.
| Year Ended December 31, | |||||||||||||||||
| 2009 | 2008 | 2007 | 2006 | 2005 | |||||||||||||
| (in millions of dollars, except per share data) | |||||||||||||||||
| Income Statement Data: |
|||||||||||||||||
| Net sales |
$ | 1,272.5 | $ | 1,578.2 | $ | 1,834.8 | $ | 1,847.0 | $ | 1,449.8 | |||||||
| Cost of products sold(1) |
893.2 | 1,094.4 | 1,262.3 | 1,305.2 | 1,020.5 | ||||||||||||
| Gross profit |
379.3 | 483.8 | 572.5 | 541.8 | 429.3 | ||||||||||||
| Operating costs and expenses: |
|||||||||||||||||
| Advertising, selling, general and administrative expenses(1) |
273.1 | 379.0 | 433.5 | 432.0 | 299.7 | ||||||||||||
| Amortization of intangibles |
7.2 | 7.7 | 7.9 | 8.4 | 4.0 | ||||||||||||
| Restructuring charges |
17.4 | 28.8 | 21.0 | 44.1 | 2.9 | ||||||||||||
| Goodwill and asset impairment charges(2) |
1.8 | 274.4 | 2.3 | — | — | ||||||||||||
| Total operating costs and expenses |
299.5 | 689.9 | 464.7 | 484.5 | 306.6 | ||||||||||||
| Operating income (loss) |
79.8 | (206.1 | ) | 107.8 | 57.3 | 122.7 | |||||||||||
| Interest expense, net |
67.0 | 63.7 | 64.1 | 61.1 | 28.8 | ||||||||||||
| Income (loss) from continuing operations before change in accounting principle(3,4) |
(115.8 | ) | (263.0 | ) | 34.0 | 2.1 | 54.8 | ||||||||||
| Per common share: |
|||||||||||||||||
| Income (loss) from continuing operations before change in accounting principle(3,4) |
|||||||||||||||||
| Basic |
$ | (2.13 | ) | $ | (4.85 | ) | $ | 0.63 | $ | 0.04 | $ | 1.32 | |||||
| Diluted |
$ | (2.13 | ) | $ | (4.85 | ) | $ | 0.62 | $ | 0.04 | $ | 1.29 | |||||
| Balance Sheet Data (at year end): |
|||||||||||||||||
| Total assets |
$ | 1,106.8 | $ | 1,282.2 | $ | 1,898.5 | $ | 1,849.6 | $ | 1,929.5 | |||||||
| External debt |
725.8 | 708.7 | 775.3 | 805.1 | 941.9 | ||||||||||||
| Total stockholders’ equity (deficit) |
(117.2 | ) | (3.4 | ) | 438.3 | 384.0 | 408.3 | ||||||||||
| Other Data: |
|||||||||||||||||
| Cash provided by operating activities |
$ | 71.5 | $ | 37.2 | $ | 81.2 | $ | 120.9 | $ | 65.3 | |||||||
| Cash used by investing activities |
3.9 | 18.7 | 55.2 | 21.4 | 32.4 | ||||||||||||
| Cash used by financing activities |
44.5 | 37.7 | 35.4 | 145.0 | 17.4 | ||||||||||||
| (1) | Income (loss) from continuing operations was impacted by certain other charges that have been recorded within cost of products sold, and advertising, selling, general and administrative expenses. These charges are incremental to the cost of the Company’s underlying restructuring actions and do not qualify as restructuring. These charges include redundant warehousing or storage costs during the |
19
Table of Contents
| transition to new distribution centers, equipment and other asset move costs, ongoing facility overhead and maintenance costs after exit, gains on the sale of exited facilities, certain costs associated with the Company’s debt refinancing and employee retention incentives. Within cost of products sold on the Consolidated Statements of Operations for the years ended December 31, 2009, 2008, 2007, 2006 and 2005, these charges totaled $3.4 million, $7.5 million, $17.2 million, $10.8 million and income of $1.3 million, respectively. Within advertising, selling, general and administrative expenses on the Consolidated Statements of Operations for the years ended December 31, 2009, 2008, 2007, 2006 and 2005, these charges totaled $1.2 million, $3.1 million, $16.3 million, $10.8 million and $15.4 million, respectively. Included within the 2008 results, is a charge for $4.2 million related to the exit of the Company’s former CEO, a $3.5 million gain on the sale of a manufacturing facility and net gains of $2.4 million on the sale of three additional properties |
| (2) | The following table sets forth the Company’s pre-tax impacts of the non-cash goodwill and asset impairment charges recorded during 2009, 2008 and 2007, respectively. For a further discussion of the impairment charges, see Note 5, Goodwill and Identifiable Intangible Assets, to our consolidated financial statements, contained in Item 8 of this report. |
| (in millions of dollars) | 2009 | 2008 | 2007 | ||||||
| Continuing Operations |
|||||||||
| Segment: |
|||||||||
| ACCO Brands Americas |
$ | 0.9 | $ | 160.6 | $ | 1.6 | |||
| ACCO Brands International |
0.9 | 111.0 | 0.7 | ||||||
| Computer Products Group |
— | 2.8 | — | ||||||
| Total Continuing Operations |
$ | 1.8 | $ | 274.4 | $ | 2.3 | |||
| (3) | During the second quarter of 2009, the Company recorded a non-cash charge of $108.1 million to establish a valuation allowance against its U.S. deferred taxes. For a further discussion of the valuation allowance, see Note 6, Income Taxes, to our consolidated financial statements, contained in Item 8 of this report. |
| (4) | In 2005 there was a change in accounting principle related to the elimination of a one-month lag in reporting by several foreign subsidiaries to align their reporting periods with ACCO Brands’ fiscal calendar. The net impact was income of $3.3 million or $0.08 per diluted share. |
20
Table of Contents
ITEM 7. MANAGEMENT’S DISCUSSION AND ANALYSIS OF FINANCIAL CONDITION AND RESULTS OF OPERATIONS
INTRODUCTION
ACCO Brands Corporation is one of the world’s largest suppliers of select categories of branded office products (excluding furniture, computers, printers and bulk paper) to the office products resale industry. We design, develop, manufacture and market a wide variety of traditional and computer-related office products, supplies, binding and laminating equipment and related consumable supplies, personal computer accessory products, paper-based time management products and presentation aids and products. Through a focus on research, marketing and innovation, we seek to develop new products that meet the needs of our consumers and commercial end-users, which we believe will increase the product positioning of our brands. We compete through a balance of innovation, a low-cost operating model and an efficient supply chain. We sell our products primarily to markets located in North America, Europe and Australia. Our brands include GBC®, Kensington®, Quartet®, Rexel, Swingline®, Wilson Jones®, Marbig, NOBO and Day-Timer®, among others.
The majority of our office products are used by businesses. Most of these end-users purchase our products from our customers, which include commercial contract stationers, retail superstores, wholesalers, resellers, mail order and internet catalogs, mass merchandisers, club stores and dealers. We also supply certain of our products directly to commercial end-users and to the educational market. Historically we have targeted the premium-end of the product categories in which we compete. However, we also supply private label products for our customers where we believe we have an economic advantage or where it is necessary to merchandise a complete category.
Our leading brand positions provide the scale to enable us to invest in product innovation and drive market growth across our product categories. In addition, the expertise we use to satisfy the exacting technical specifications of our more demanding commercial customers is in many instances the basis for expanding our products and innovations to consumer products.
Our current strategy centers on a combination of growing sales and market share and generating acceptable profitability and returns. Specifically, we have substantially reduced our operating expenses and seek to leverage our platform for organic growth through greater consumer understanding, product innovation, marketing and merchandising, disciplined category expansion including broader product penetration and possible strategic transactions and continued cost realignment. To achieve these goals, we plan to continue to execute the following strategies: (1) invest in research, marketing and innovation, (2) penetrate the full product spectrum of our categories and (3) opportunistically pursue strategic transactions.
In June 2009, the Company completed the sale of its commercial print finishing business for final gross proceeds of $16.2 million, after final working capital adjustments made during the third quarter. As a result of the adjustments, the Company received net cash proceeds before expenses of $12.5 million and a $3.65 million note due from the buyer payable in installments of $1.325 million in June, 2011 and $2.325 million in June, 2012. Interest on the unpaid balance is payable at the rate of 4.9 percent per annum. The gross proceeds received are before fees and expenses related to the transactions and provisions arising from law suits related to the transactions. The sale, net of expenses and provisions, resulted in a pre-tax loss of $0.8 million ($1.1 million after-tax). The commercial print finishing business has been classified as a discontinued operation in our consolidated financial statements for all periods presented.
Management’s discussion and analysis of financial condition and results of operations should be read in conjunction with the financial statements of ACCO Brands Corporation and the accompanying notes contained therein. Unless otherwise noted, the following discussion pertains only to our continuing operations.
21
Table of Contents
Overview of Company Performance
ACCO Brands’ results are dependent upon a number of factors affecting sales, including pricing and competition. Historically, key drivers of demand in the office products industry have included trends in white collar employment levels, gross domestic product (GDP) and growth in the number of small businesses and home offices together with increasing usage of personal computers. Pricing and demand levels for office products have also reflected a substantial consolidation within the global resellers of office products. This consolidation has led to multiple years of industry pricing pressure and a more efficient level of asset utilization by customers, resulting in lower sales volumes for suppliers of office products. We sell products in highly competitive markets, and compete against large international and national companies, regional competitors and against our own customers’ private-label direct sourcing.
During 2009, the Company continued to be impacted by challenging global economic conditions that affected all of its global markets. These conditions have translated into soft demand for our products, destocking of inventories by our customers and, as a result, the need for us to significantly reduce costs to mitigate the impact on our profits, requiring additional severance and related charges. In addition, the dramatic strengthening of the U.S. dollar against major European and Australian currencies, which occurred in late 2008, added further pressure on the Company’s operating results. A significant portion of the products we sell in international markets are sourced from Asia and are paid for in U.S. dollars. Declines in local currencies relative to the U.S. dollar effectively increase the cost of products sold for our non-U.S. operations. To partially mitigate these factors, the Company raised prices in international markets and intensified its cost-reduction activities during 2009. In addition to certain reductions in force, it also implemented reductions in sales support expenditures, and various temporary additional cost-reductions including: salary reductions, the suspension of 401(k) plan contributions, freezing of pension plan benefits for U.S. based employees and voluntary unpaid leave for European employees. These actions, along with cost reduction measures implemented during 2008 generated pre-tax savings of approximately $80 million in 2009. Approximately two-thirds of these cost savings relate to “Advertising, selling, general and administrative expenses”, with the remaining amount benefiting “Cost of products sold” as reflected in the Consolidated Statements of Operations.
The Company does not anticipate incurring restructuring and integration charges in 2010. Cash payments related to the Company’s restructuring and integration activities amounted to $38.3 million (excluding capital expenditures) during 2009. It is expected that additional disbursements of $9.3 million will be completed by the end of 2010 as the Company spends amounts accrued on the balance sheet. Residual expenses beyond 2010 are anticipated to be offset by expected proceeds from real estate held for sale.
As our capital expenditures have been reduced and as cash expenditures associated with recent restructuring initiatives are approaching completion, we expect to increase our flexibility to reduce debt and take other actions that build future shareholder value.
During the second quarter of 2009, the Company determined that it was no longer more likely than not that its U.S. deferred tax assets would be realized, and as a result, the Company recorded a non-cash charge of $108.1 million to establish a valuation allowance against its U.S. deferred tax assets. For a further discussion see Note 6, Income Taxes, under Item 8, Financial Statements and Supplementary Data. In addition, during the second quarter of 2009, the Company recorded a non-cash impairment charge of $1.8 million on certain of its trade names. During 2008, the Company recorded non-cash goodwill and trade name impairment charges of $274.4 million. For a further discussion of the impairment charges see Note 5, Goodwill and Identifiable Intangible Assets, under Item 8, Financial Statements and Supplementary Data.
Refinancing Transactions
On September 30, 2009, the Company issued $460.0 million aggregate principal amount of its 10.625% Senior Secured Notes due March 15, 2015 (the “Senior Secured Notes”), and entered into a four-year senior secured asset-based revolving credit facility providing for borrowings of up to $175.0 million subject to borrowing base limitations (the “ABL Facility”). Initial borrowings under the ABL Facility were $16.1 million.
22
Table of Contents
These funds together with the $453.1 million in proceeds from the issuance of the Senior Secured Notes were used to (i) repay all outstanding borrowings under and terminate the Company’s prior senior secured credit agreements, (ii) repay all outstanding borrowings under and terminate the Company’s accounts receivable securitization program, (iii) terminate the Company’s cross-currency swap agreement, (iv) repurchase approximately $29.1 million aggregate principal amount of its 7 5/8% senior subordinated notes due August 15, 2015 (“Senior Subordinated Notes”) and (v) pay the fees, expenses and other costs relating to such transactions (collectively the “Refinancing Transactions”).
The repayment of borrowings outstanding under the Company’s prior senior secured credit agreements consisted of the following:
| • | Repayment of $247.0 million of principal and accrued interest under its $400.0 million senior secured U.S. dollar term loan facility; |
| • | Repayment of $36.5 million of principal and accrued interest under its £63.6 million sterling term loan facility; |
| • | Repayment of $35.7 million of principal and accrued interest under its €68.2 million euro term loan facility; and |
| • | Repayment of $24.4 million of principal and accrued interest under its $130.0 million U.S. dollar revolving credit facility. |
The repayment of $403.0 million of borrowings outstanding under the Company’s senior secured credit agreements and accounts receivable securitization program resulted in a pre-tax loss of $9.1 million on the early extinguishment of debt and included the write-off of amendment fees and issuance costs associated with the senior secured credit agreements. The loss on the early extinguishment of debt is included in Other (income) expense, net in the consolidated statements of operations.
On September 30, 2009, the Company terminated its cross-currency swap agreement. The termination of the cross-currency swap resulted in payments of $40.8 million to counterparties representing the fair market value of the cross-currency swap on the termination date.
On September 30, 2009, the Company repurchased $29.1 million of outstanding Senior Subordinated Notes for a purchase price of $24.2 million, which resulted in a pre-tax gain of $4.9 million on the early extinguishment of debt and is included in Other (income) expense, net in the consolidated statements of operations.
Debt issuance costs of $20.6 million in connection with the refinancing transactions were deferred and will be amortized using the effective interest method over the terms of the Senior Secured Notes and ABL Facility.
For a further discussion on the Company’s refinancing transactions, see Note 11, Long-term debt and Short-term borrowings, under Item 8, Financial Statements and Supplementary Data.
In addition to the increased amount of indebtedness resulting from the refinancing transactions, the weighted-average interest rate on our indebtedness has increased, and as a result, the cost of servicing our debt has increased. Such an increase in the cost of servicing our debt could have a material adverse effect on our business, financial condition, results of operations and cash flows. The Company has significantly reduced the business risk associated with near term debt facility maturities, mandatory debt reduction requirements and maintenance covenants, partially offset by the increased debt and higher interest rates.
Based on its 2010 business plan and further supported by its cost cutting initiatives, the Company believes it will remain compliant with its debt covenants and will have adequate liquidity despite the possible disruption of the capital and credit markets for the foreseeable future.
23
Table of Contents
The Company funds liquidity needs for capital investment, working capital, hedging activities and other financial commitments through available cash balances and cash flow from continuing operations, and its $175.0 million ABL Facility. Based on our borrowing base, as of December 31, 2009, approximately $156.4 million remained available for borrowing under our ABL Facility, which expires in September 2013.
The Company is subject to credit risk, which relates to the ability of counterparties to meet their contractual payment obligations or the potential non-performance of counterparties to deliver contracted commodities or services at the contracted price. Management continues to closely monitor the status of the Company’s counterparties and will take action, as appropriate, to further manage its counterparty credit risk.
Effect of Global Recession on Suppliers and Customers
The impact of the current global recession and restricted credit markets on our suppliers and customers is unpredictable, outside of our control and may create additional risks for us, both directly and indirectly. The inability of suppliers to access financing or the insolvency of one or more of our suppliers could lead to disruptions in our supply chain, which could adversely impact our sales and/or increase our costs. Our suppliers may require us to pay cash in advance or obtain letters of credit for their benefit as a condition to selling us their products and services. A number of retailers have recently sought bankruptcy protection. If one or more of our principal customers were to file for bankruptcy, our sales could be adversely impacted and our ability to collect outstanding accounts receivable from any such customer could be limited. Any of these risks and uncertainties could have a material adverse effect on our business, financial condition, results of operations or cash flows.
Fiscal 2009 versus Fiscal 2008
The following table presents the Company’s results for the years ended December 31, 2009 and 2008.
| Year Ended December 31, |
Amount of Change | ||||||||||||||
| (in millions of dollars) | 2009 | 2008 | $ | % | |||||||||||
| Net sales |
$ | 1,272.5 | $ | 1,578.2 | $ | (305.7 | ) | (19 | )% | ||||||
| Cost of products sold |
893.2 | 1,094.4 | (201.2 | ) | (18 | )% | |||||||||
| Gross profit |
379.3 | 483.8 | (104.5 | ) | (22 | )% | |||||||||
| Gross profit margin |
29.8 | % | 30.7 | % | (0.9 | ) pts | |||||||||
| Advertising, selling, general and administrative expenses |
273.1 | 379.0 | (105.9 | ) | (28 | )% | |||||||||
| Restructuring charges |
17.4 | 28.8 | (11.4 | ) | (40 | )% | |||||||||
| Goodwill and asset impairment charges |
1.8 | 274.4 | (272.6 | ) | (99 | )% | |||||||||
| Operating income (loss) |
79.8 | (206.1 | ) | 285.9 | 139 | % | |||||||||
| Operating income margin |
6.3 | % | NM | NM | |||||||||||
| Interest expense, net |
67.0 | 63.7 | 3.3 | 5 | % | ||||||||||
| Equity in earnings of joint ventures |
(4.4 | ) | (6.5 | ) | 2.1 | 32 | % | ||||||||
| Other (income) expense, net |
5.1 | (17.2 | ) | 22.3 | 130 | % | |||||||||
| Income taxes |
127.9 | 16.9 | 111.0 | NM | |||||||||||
| Effective tax rate |
NM | NM | NM | ||||||||||||
| Loss from continuing operations |
(115.8 | ) | (263.0 | ) | 147.2 | 56 | % | ||||||||
| Loss from discontinued operations, net of income taxes |
(10.3 | ) | (76.2 | ) | 65.9 | 86 | % | ||||||||
| Net loss |
(126.1 | ) | (339.2 | ) | 213.1 | 63 | % | ||||||||
Net Sales
Net sales decreased $305.7 million, or 19%, to $1.27 billion. The decline in sales was broad-based and occurred in every business unit, driven mainly by weak consumer demand. The unfavorable impact of foreign currency translation reduced net sales by $57.1 million (4%). The decline in sales was partially offset by price increases in international markets, which offset the adverse foreign currency effect on our Asian sourced cost of goods sold in international markets.
24
Table of Contents
Cost of Products Sold
Cost of products sold includes all manufacturing, product sourcing and distribution costs, including depreciation related to assets used in the manufacturing and distribution process, inbound and outbound freight, shipping and handling costs, purchasing costs associated with materials and packaging used in the production processes. Cost of products sold decreased $201.2 million, or 18%, to $893.2 million. The decrease principally reflects the decrease in volume and the decrease from currency translation, partially offset by increased cost of goods from commodity costs and adverse foreign currency effect on our Asian sourced cost of goods sold in international markets.
In addition, certain other charges have been recorded within cost of products sold. These charges are incremental to the cost of the Company’s underlying restructuring actions but do not qualify as restructuring. These charges include redundant warehousing or storage costs during the transition to new distribution centers, equipment and other asset move costs, ongoing facility overhead and maintenance costs after exit, and employee retention incentives. For the year ended December 31, 2009 and 2008, these charges totaled $3.4 million and $7.5 million, respectively.
Gross Profit
Gross profit decreased $104.5 million, or 22%, to $379.3 million. Currency translation adversely impacted gross profit by $17.7 million. Gross profit decreased principally due to lower sales volume. Gross profit margin decreased to 29.8% from 30.7% due to adverse product mix and lower demand in our direct customer channel and higher commodity costs, reflecting the reduction in non-essential spending by customers and sustained weakness of the US dollar, respectively. Freight and distribution costs were also higher than planned as we continue to place great focus on our achievement of required customer service metrics. Partly offsetting the decline were benefits from the flow through of price increases and product outsourcing savings.
SG&A (Advertising, selling, general and administrative expenses)
Advertising, selling, general and administrative expenses (SG&A) include advertising, marketing, selling (including commissions), research and development, customer service, depreciation related to assets outside the manufacturing and distribution processes and all other general and administrative expenses outside the manufacturing and distribution functions (e.g., finance, human resources, information technology, etc.). SG&A decreased $105.9 million, or 28%, to $273.1 million, with favorable currency translation contributing $12.5 million, or 3% of the decline. As a percentage of sales, SG&A improved to 21.5% from 24.0% reflecting cost reduction initiatives, which included reducing marketing and discretionary expenditures, temporary pay and benefit reductions for U.S. based employees, including freezing the U.S. pension plan and voluntary unpaid leave in Europe (which benefitted mainly the first half by $13.4 million). In addition, management again paid minimal incentive plan payments, which was consistent with 2008.
In addition, certain other charges have been recorded within SG&A. These charges are incremental to the cost of the Company’s underlying restructuring actions and do not qualify as restructuring. These charges include redundant costs during the transition to a new location, asset move costs, facility overhead and maintenance costs after exit, gains on the sale of exited facilities, certain costs associated with the Company’s debt refinancing and employee retention incentives. For the year ended December 31, 2009 and 2008, these charges totaled $1.2 million and $3.1 million, respectively. Included within these amounts, in 2008, the Company recognized a $3.5 million gain on the sale of a manufacturing facility and recorded net gains of $2.4 million on the sale of three additional properties.
Operating Income (Loss)
Operating income was $79.8 million compared to an operating loss of $206.1 million in the prior year. The increase in operating income was principally driven by a net year over year decrease of $272.6 million in
25
Table of Contents
goodwill and trade name impairment charges lower marketing expenditures, the benefits from cost reductions including lower payroll costs, partially offset by lower sales volume, adverse product mix and adverse foreign exchange translation of $4.9 million.
Interest Expense, Equity in Earnings of Joint Ventures and Other (Income) Expense
Interest expense increased $3.3 million to $67.0 million, reflecting higher interest rates for the last quarter from the Company’s new capital structure.
Equity in earnings of joint ventures decreased $2.1 million to $4.4 million reflecting lower income from our unconsolidated joint ventures. The decrease reflects the economic slowdown, higher borrowing and other costs associated with a business acquisition made by the Australian joint venture in the first quarter of 2009 and adverse foreign currency translation.
Other expense was $5.1 million in the current year, compared to income of $17.2 million in the prior-year period. In connection with the refinancing transactions that occurred in September 2009, the Company recorded a $9.1 million loss on the early extinguishment of debt associated with the repayment of $403.0 million of borrowings outstanding under its senior secured credit agreements and accounts receivable securitization facility, partially offset by a $4.9 million gain on the early extinguishment of debt in connection with the repurchase of $29.1 million of Senior Subordinated Notes. See Note 10, Long-term debt and Short-term borrowings, under Item 8, Financial Statements and Supplementary Data for a further discussion on the Company’s refinancing transactions. During 2008, the Company purchased $49.6 million of its outstanding Senior Subordinated Notes resulting in gains of $19.0 million on the early extinguishment of debt.
Income Taxes
For the year ended December 31, 2009, the Company recorded income tax expense of $127.9 million on income before taxes of $12.1 million. This compares to income tax expense of $16.9 million on a loss before taxes of $246.1 million in the prior year period. During the second quarter of 2009, the Company recorded a non-cash charge of $108.1 million to establish a valuation allowance on its U.S. deferred tax assets. Income tax expense in 2008 was principally due to an increase in the valuation allowance of $27.4 million relating to certain foreign and domestic state deferred tax assets and tax loss carryforwards.
Loss from Continuing Operations
Loss from continuing operations was $115.8 million, or $2.13 per diluted share, compared to a loss from continuing operations of $263.0 million or $4.85 per diluted share in the prior year.
Loss from Discontinued Operations
Loss from discontinued operations was $10.3 million, or $0.19 per diluted share, compared to $76.2 million, or $1.41 per share, in the prior-year period. In the first quarter of 2009 the Company recorded an additional charge of $3.3 million ($1.8 million after-tax) to reflect a change in the estimate of the fair value less the cost to dispose of its commercial print finishing business. In June 2009, the Company completed the sale of its commercial print finishing business for final proceeds of $16.2 million, after final working capital adjustments made during the third quarter. As a result of the adjustments, the Company received net cash proceeds before expenses of $12.5 million and a $3.65 million note due from the buyer payable in installments of $1.325 million in June, 2011 and $2.325 million in June, 2012. Interest on the unpaid balance is payable at the rate of 4.9 percent per annum. The sale resulted in a pre-tax loss of $0.8 million ($1.1 million after-tax). The loss on sale includes a pre-tax pension curtailment gain of $0.5 million. During the year ended December 31, 2008, the Company recorded $84.8 million of goodwill and asset impairment charges. Included in this amount were charges to goodwill of $35.1 million, property, plant and equipment of $22.2 million, identifiable intangible assets of $10.5 million and other current assets of $17.0 million. For a further discussion of the Company’s discontinued operations see Note 10, Discontinued Operations, under Item 8, Financial Statements and Supplementary Data.
26
Table of Contents
The components of discontinued operations for the years ended December 31, 2009 and 2008, are as follows:
| (in millions of dollars) | 2009 | 2008 | ||||||
| Pre-tax loss |
$ | (9.0 | ) | $ | (88.4 | ) | ||
| Provision (benefit) for income taxes |
0.2 | (12.2 | ) | |||||
| Loss on sale, net of tax |
(1.1 | ) | — | |||||
| Loss from discontinued operations |
$ | (10.3 | ) | $ | (76.2 | ) | ||
Net Loss
Net loss was $126.1 million, or $2.32 per diluted share, compared to a net loss of $339.2 million, or $6.26 per diluted share in 2008.
Segment Discussion
ACCO Brands Americas
Results
| Year Ended December 31, |
Amount of Change | ||||||||||||||
| (in millions of dollars) | 2009 | 2008 | $ | % | |||||||||||
| Net sales |
$ | 671.5 | $ | 820.8 | $ | (149.3 | ) | (18 | )% | ||||||
| Operating income (loss) |
38.6 | (134.0 | ) | 172.6 | NM | ||||||||||
| Operating income margin |
5.7 | % | NM | NM | |||||||||||
| Impairment, restructuring and other charges |
6.9 | 181.5 | (174.6 | ) | NM | ||||||||||
ACCO Brands Americas net sales decreased $149.3 million, or 18%, to $671.5 million. The decrease reflects volume declines in all markets driven by weak consumer demand. Demand has been lower in direct and commercial channels than at retail and reflects the higher level of durable products in the product mix that have experienced greater volume decline due to the poor economy and are sold in those channels. Further contributing to the decline in net sales was $16.5 million of adverse foreign currency translation, which accounted for 2% of the overall sales decline.
ACCO Brands Americas operating income was $38.6 million compared to an operating loss of $134.0 million in the prior year. The increase in operating income was principally due to a net year-over-year decrease of $159.7 million in goodwill and trade name impairment charges, reduced restructuring and other charges and other cost reductions, including reduced marketing expenditures, headcount reductions, temporary salary and benefit reductions in the first two quarters, partially offset by lower sales volumes, commodity cost increases, and freight and distribution expense spending, which was higher than planned and which we considered necessary to achieve our improved customer service metrics.
ACCO Brands International
Results
| Year Ended December 31, |
Amount of Change | ||||||||||||||
| (in millions of dollars) | 2009 | 2008 | $ | % | |||||||||||
| Net sales |
$ | 438.0 | $ | 551.5 | $ | (113.5 | ) | (21 | )% | ||||||
| Operating income (loss) |
27.4 | (73.8 | ) | 101.2 | NM | ||||||||||
| Operating income margin |
6.3 | % | NM | NM | |||||||||||
| Impairment, restructuring and other charges |
13.5 | 121.3 | (107.8 | ) | (89 | )% | |||||||||
27
Table of Contents
ACCO Brands International net sales decreased $113.5 million, or 21%, to $438.0 million. The decrease reflects volume declines, principally in Europe, driven by weak consumer demand particularly for durable products and a small amount ($7.4 million) of lost product placement (share loss). In addition, the unfavorable impact of foreign currency translation reduced net sales by 6%, or $33.6 million. These items were partially offset by the flow-through from price increases.
ACCO Brands International operating income was $27.4 million compared to an operating loss of $73.8 million in the prior year. The increase in operating income was principally due to a net year-over-year decrease of $110.1 million in goodwill and trade name impairment charges and other cost savings associated with reduced selling and marketing expenditures, lower headcount, and business integration activities, partially offset by lower sales volumes, higher pension costs, and freight and distribution expense spending, which was higher than planned and which we considered necessary to achieve our improved customer service metrics. Price increases approximately offset higher Asian-sourced costs and freight due to the relative strength of the U.S. dollar.
Computer Products Group
Results
| Year Ended December 31, |
Amount of Change | ||||||||||||||
| (in millions of dollars) | 2009 | 2008 | $ | % | |||||||||||
| Net sales |
$ | 163.0 | $ | 205.9 | $ | (42.9 | ) | (21 | )% | ||||||
| Operating income |
31.7 | 30.1 | 1.6 | 5 | % | ||||||||||
| Operating income margin |
19.4 | % | 14.6 | % | 4.8 pts | ||||||||||
| Impairment, restructuring and other charges |
2.6 | 6.9 | (4.3 | ) | (62 | )% | |||||||||
Computer Products net sales decreased $42.9 million, or 21%, to $163.0 million. The decrease in sales was primarily due to lower sales volumes from weak demand, particularly in the United States and the United Kingdom, as well as $7.0 million of unfavorable currency translation that accounted for 3% of the total sales decline. Contributing to the decline in the United States was the loss of Circuit City as a major customer as a result of its bankruptcy in the fourth quarter of 2008, which accounted for 7% of the decline in the year.
Operating income increased $1.6 million, or 5%, to $31.7 million, and operating income margin increased to 19.4% from 14.6%. The increase in operating income was principally due to lower impairment, restructuring and other charges, cost-reductions including reduced marketing, legal and other discretionary expenditures, and temporary salary reductions, partially offset by lower sales volumes. The improvement in operating margin resulted from the substantial reductions in advertising, selling, general and administrative expenses including the temporary benefits from salary and benefit reductions for U.S. employees. Excess inventory largely resulting from the bankruptcy of Circuit City was fully liquidated during the year at favorable recovery rates, resulting in a $1.3 million credit in 2009.
28
Table of Contents
Fiscal 2008 versus Fiscal 2007
The following table presents the Company’s results for the years ended December 31, 2008 and 2007.
| Year Ended December 31, |
Amount of Change | ||||||||||||||
| (in millions of dollars) | 2008 | 2007 | $ | % | |||||||||||
| Net sales |
$ | 1,578.2 | $ | 1,834.8 | $ | (256.6 | ) | (14 | )% | ||||||
| Cost of products sold |
1,094.4 | 1,262.3 | (167.9 | ) | (13 | )% | |||||||||
| Gross profit |
483.8 | 572.5 | (88.7 | ) | (15 | )% | |||||||||
| Gross profit margin |
30.7 | % | 31.2 | % | (0.5 | ) pts | |||||||||
| Advertising, selling, general and administrative expenses |
379.0 | 433.5 | (54.5 | ) | (13 | )% | |||||||||
| Restructuring charges |
28.8 | 21.0 | 7.8 | 37 | % | ||||||||||
| Goodwill and asset impairment charges |
274.4 | 2.3 | 272.1 | NM | |||||||||||
| Operating income (loss) |
(206.1 | ) | 107.8 | (313.9 | ) | NM | |||||||||
| Operating income margin |
NM | 5.9 | % | NM | |||||||||||
| Interest expense, net |
63.7 | 64.1 | (0.4 | ) | (1 | )% | |||||||||
| Equity in earnings of joint ventures |
(6.5 | ) | (6.8 | ) | 0.3 | 4 | % | ||||||||
| Other income, net |
(17.2 | ) | (0.1 | ) | (17.1 | ) | NM | ||||||||
| Income taxes |
16.9 | 16.6 | 0.3 | 2 | % | ||||||||||
| Effective tax rate |
NM | 32.4 | % | NM | |||||||||||
| Income (loss) from continuing operations |
(263.0 | ) | 34.0 | (297.0 | ) | NM | |||||||||
| Income (loss) from discontinued operations, net of income taxes |
(76.2 | ) | (34.9 | ) | (41.3 | ) | NM | ||||||||
| Net income (loss) |
(339.2 | ) | (0.9 | ) | (338.3 | ) | NM | ||||||||
Net Sales
Net sales decreased $256.6 million, or 14%, to $1,578.2 million. The decrease reflects a significant decline in U.S. and European sales volumes, mainly driven by weak consumer demand and related customer inventory reductions, as well as a loss of market share. The decline in market share impacted sales by $49.5 million and the exit of certain non-strategic businesses impacted sales by a further $22.4 million. These decreases were partially offset by the positive impact of price increases and $12.2 million in currency translation.
Cost of Products Sold
Cost of products sold includes all manufacturing, product sourcing and distribution costs, including depreciation related to assets used in the manufacturing and distribution process, inbound and outbound freight, shipping and handling costs, purchasing costs associated with materials and packaging used in the production processes. Cost of products sold decreased $167.9 million, or 13%, to $1,094.4 million. The decrease principally reflects the decrease in volume and the decrease from currency translation, and also reflects increased cost of goods from commodity costs and adverse foreign currency effect on our Asian sourced cost of goods sold in international markets.
In addition, certain other charges have been recorded within cost of products sold. These charges are incremental to the cost of the Company’s underlying restructuring actions but do not qualify as restructuring. These charges include redundant warehousing or storage costs during the transition to new distribution centers, equipment and other asset move costs, ongoing facility overhead and maintenance costs after exit, and employee retention incentives. For the year ended December 31, 2008 and 2007, these charges totaled $7.5 million and $17.2 million, respectively.
Gross Profit
Gross profit decreased $88.7 million to $483.8 million. Gross profit decreased principally due to lower sales volume and adverse product-mix trends partially offset by the benefit from product outsourcing savings, lower
29
Table of Contents
restructuring-related expense included in cost of goods sold and currency translation which positively impacted gross profit by $4.2 million. Gross profit margin decreased to 30.7% from 31.2% as the flow-through from price increases did not fully offset increased product costs.
SG&A (Advertising, selling, general and administrative expenses)
SG&A includes advertising, marketing, selling (including commissions), research and development, customer service, depreciation related to assets outside the manufacturing and distribution processes and all other general and administrative expenses outside the manufacturing and distribution functions (e.g., finance, human resources, information technology, etc.). SG&A decreased $54.5 million, or 13%, to $379.0 million. Currency translation resulted in an increase of $2.2 million in SG&A. The reduced expense was related to cost-cutting initiatives taken during 2008, merger integration synergies, lower management incentives, pension and research and development costs and reduced levels of spending. SG&A increased as a percentage of sales to 24.0% from 23.6% as the cost reduction measures did not fully offset the adverse impact from lower sales volume. Included as part of the aforementioned lower management incentive costs, and as further discussed in Note 3, Stock-Based Compensation, during 2008 the Company determined that its outstanding performance-based equity compensation accruals were no longer attainable resulting in a net reduction of $2.3 million in SG&A.
In addition, certain other charges have been recorded within SG&A. These charges are incremental to the cost of the Company’s underlying restructuring actions and do not qualify as restructuring. These charges include redundant costs during the transition to a new location, asset move costs, facility overhead and maintenance costs after exit, gains on the sale of exited facilities and employee retention incentives. For the year ended December 31, 2008 and 2007, these charges totaled $3.1 million and $16.3 million, respectively. Included within these amounts in 2008 is $4.2 million of severance and related expenses for the Company’s former CEO, partially offset by a $3.5 million gain on the sale of a manufacturing facility in the second quarter of 2008 and $2.4 million of net gains recorded on the sale of three properties in the third quarter of 2008.
Operating Income (Loss)
Operating loss was $206.1 million compared to operating income of $107.8 million in the prior year. The operating loss was driven by $274.4 million of non-cash goodwill and asset impairment charges, as well as reduced sales volume, partially offset by the benefits from cost reductions and by reduced restructuring-related expense and favorable foreign currency translation.
Interest Expense, Equity in Earnings of Joint Ventures and Other (Income) Expense
Interest expense decreased $0.4 million to $63.7 million, reflecting lower floating interest rates and lower average debt balances, partially offset by amortization of fees associated with amending our senior secured credit facility, accelerated debt amortization costs due to loan prepayments, the impact of higher exchange rates on foreign borrowings, as well as a $0.9 million increase of non-cash charges relating to the Company’s cross-currency swap due to ineffectiveness.
Equity in earnings of joint ventures decreased $0.3 million to $6.5 million reflecting lower income from our unconsolidated joint ventures.
Other income increased $17.1 million to $17.2 million. The increase in other income was due to gains of $19.0 million on the early extinguishment of debt recorded during 2008 relating to the Company’s purchase of $49.6 million of its outstanding Senior Subordinated Notes partially offset by higher foreign exchange losses.
Income Taxes
For the year ended December 31, 2008, the Company recorded income tax expense of $16.9 million on a loss from continuing operations before income taxes of $246.1 million. This compares to income tax expense of $16.6 million on income before taxes of $50.6 million in the prior year period. Income tax expense in 2008 was
30
Table of Contents
principally due to an increase in the valuation allowance by $27.4 million on certain foreign and domestic state deferred tax assets and tax loss carryforwards. The prior year tax rate benefited from restructuring and other charges as well as an excess foreign tax credit associated with dividends offset in part by the $2.3 million goodwill impairment charge which is not tax deductible.
Income (Loss) from Continuing Operations
Loss from continuing operations was $263.0 million, or $4.85 per diluted share, compared to income from continuing operations of $34.0 million or $0.62 per diluted share in the prior year.
Loss from Discontinued Operations
Loss from discontinued operations was $76.2 million, or $1.41 per diluted share compared to $34.9 million or $0.63 per share in the prior year. The operating loss in 2008 includes $84.8 million of non-cash goodwill and asset impairment charges. Included in this amount were charges to goodwill of $35.1 million, property, plant and equipment of $22.2 million, identifiable intangible assets of $10.5 million and other current assets of $17.0 million. The 2007 results includes a non-cash goodwill impairment charge of $32.8 million.
The components of discontinued operations for the years ended 2008 and 2007, are as follows:
| (in millions of dollars) | 2008 | 2007 | ||||||
| Pre-tax loss |
$ | (88.4 | ) | $ | (35.6 | ) | ||
| Provision (benefit) for income taxes |
(12.2 | ) | (0.7 | ) | ||||
| Loss from discontinued operations |
$ | (76.2 | ) | $ | (34.9 | ) | ||
Net Loss
Net loss was $339.2 million, or $6.26 per diluted share, compared to a net loss of $0.9 million, or $0.02 per diluted share in 2007.
Segment Discussion
ACCO Brands Americas
Results
| (in millions of dollars) | Year Ended December 31, |
Amount of Change | |||||||||||||
| 2008 | 2007 | $ | % | ||||||||||||
| Net sales |
$ | 820.8 | $ | 1,014.5 | $ | (193.7 | ) | (19 | )% | ||||||
| Operating income (loss) |
(134.0 | ) | 77.8 | (211.8 | ) | NM | |||||||||
| Operating income margin |
NM | 7.7 | % | NM | |||||||||||
| Impairment, restructuring and other charges |
181.5 | 23.6 | 157.9 | NM | |||||||||||
ACCO Brands Americas net sales decreased $193.7 million, or 19%, to $820.8 million. The decrease primarily reflects volume declines in the U.S. and Canada, driven by weakening consumer demand accelerating during the year, exacerbated by customer inventory reductions. Loss of product placement ($38.4 million) and planned product exits ($11.6 million) were only partially offset by price increases.
ACCO Brands Americas operating loss was $134.0 million compared to operating income of $77.8 million in the prior year. The decrease was principally due to the $160.6 million in goodwill and intangible impairment charges as well as lower sales volumes. These factors were partially offset by merger integration synergies and
31
Table of Contents
other cost reductions including lower management incentives and reduced restructuring and other charges. Price increases did not fully recover commodity cost and labor cost increases.
ACCO Brands International
Results
| (in millions of dollars) | Year Ended December 31, |
Amount of Change | |||||||||||||
| 2008 | 2007 | $ | % | ||||||||||||
| Net sales |
$ | 551.5 | $ | 586.7 | $ | (35.2 | ) | (6 | )% | ||||||
| Operating income (loss) |
(73.8 | ) | 13.7 | (87.5 | ) | NM | |||||||||
| Operating income margin |
NM | 2.3 | % | NM | |||||||||||
| Impairment, restructuring and other charges |
121.3 | 27.6 | 93.7 | NM | |||||||||||
ACCO Brands International net sales decreased $35.2 million, or 6%, to $551.5 million despite favorable foreign currency translation of $9.2 million. The decrease reflects volume declines principally in Europe, driven by weakening consumer demand, exacerbated by customer inventory reductions. Sales volumes in Asia Pacific and Australia increased 5% on share gains. Loss of product placements ($14.7 million) and planned product exits ($10.5 million) were partially offset by price increases.
ACCO Brands International operating loss was $73.8 million compared to operating income of $13.7 million in the prior year. The decrease was principally due to goodwill and intangible impairment charges of $111.0 million and lower sales volumes. These factors were partially offset by reduced restructuring and other charges, merger integration synergies and other cost reductions including lower management incentives. Price increases did not fully recover commodity cost and labor cost increases.
Computer Products Group
Results
| Year Ended December 31, |
Amount of Change | ||||||||||||||
| (in millions of dollars) | 2008 | 2007 | $ | % | |||||||||||
| Net sales |
$ | 205.9 | $ | 233.6 | $ | (27.7 | ) | (12 | )% | ||||||
| Operating income |
30.1 | 46.4 | (16.3 | ) | (35 | )% | |||||||||
| Operating income margin |
14.6 | % | 19.9 | % | (5.3)pts | ||||||||||
| Impairment, restructuring and other charges |
6.9 | 5.4 | 1.5 | 28 | % | ||||||||||
Computer Products sales decreased $27.7 million, or 12%, to $205.9 million. Currency translation positively impacted net sales by $2.8 million. The decrease in sales was primarily due to lower sales volumes from weakening demand as the year progressed, particularly in the United States and United Kingdom.
Operating income decreased $16.3 million to $30.1 million, and operating income margin decreased to 14.6% from 19.9%. The decrease was principally due to lower sales volume, intangible impairment charges of $2.8 million, partially offset by lower restructuring and other charges and other cost-reductions including management incentives.
Liquidity and Capital Resources
Our primary liquidity needs are to service indebtedness, fund capital expenditures and support working capital requirements. Our principal sources of liquidity are cash flows from operating activities, cash and cash equivalents held and borrowings under our ABL Facility (defined below). We maintain adequate financing arrangements at market rates. Our priority for cash flow over the near term, after internal growth, is to fund the reduction of debt and invest in new products through both organic development and acquisitions.
32
Table of Contents
Refinancing Transactions
On September 30, 2009, the Company issued $460.0 million aggregate principal amount of its 10.625% Senior Secured Notes due March 15, 2015, and entered into a four-year senior secured asset-based revolving credit facility (“ABL Facility”) providing for borrowings of up to $175.0 million subject to borrowing base limitations including a $40 million sub-limit for letters of credit and an optional $50 million accordion feature (available to fund working capital growth if needed). Initial borrowings under the ABL Facility were $16.1 million and at December 31, 2009, there were no borrowings outstanding under the ABL Facility. These funds together with the $453.1 million in proceeds from the issuance of the Senior Secured Notes were used to (i) repay all outstanding borrowings under and terminate the Company’s prior senior secured credit agreements, (ii) repay all outstanding borrowings under and terminate the Company’s accounts receivable securitization program, (iii) terminate the Company’s cross-currency swap agreement, (iv) repurchase approximately $29.1 million aggregate principal amount of the Senior Subordinated Notes due August 15, 2015 and (v) pay the fees, expenses and other costs related to such transactions.
The repayment of borrowings outstanding under the Company’s prior senior secured credit agreements consisted of the following:
| • | Repayment of $247.0 million of principal and accrued interest under its $400.0 million senior secured U.S. dollar term loan facility; |
| • | Repayment of $36.5 million of principal and accrued interest under its £63.6 million sterling term loan facility; |
| • | Repayment of $35.7 million of principal and accrued interest under its €68.2 million euro term loan facility; and |
| • | Repayment of $24.4 million of principal and accrued interest under its $130.0 million U.S. dollar revolving credit facility. |
The repayment of $340.2 million of borrowings outstanding under the Company’s prior senior secured credit agreements resulted in a pre-tax loss of $8.9 million on the early extinguishment of debt and included the write-off of amendment fees and issuance costs associated with those agreements. The loss on the early extinguishment of debt is included in Other (income) expense, net in the consolidated statements of operations.
On September 30, 2009, the Company terminated its cross-currency swap agreement. The termination of the cross-currency swap resulted in payments of $40.8 million to counterparties representing the fair market value of the cross-currency swap on the termination date.
The repayment of $62.8 million of borrowings outstanding under and termination of the Company’s accounts receivable securitization program resulted in a pre-tax loss of $0.2 million on the early extinguishment of debt and included the write-off of issuance costs associated with the accounts receivable securitization program. The loss on the early extinguishment of debt is included in Other (income) expense, net in the consolidated statements of operations.
On September 30, 2009, the Company repurchased $29.1 million of outstanding Senior Subordinated Notes for a purchase price of $24.2 million, which resulted in a pre-tax gain of $4.9 million on the early extinguishment of debt and is included in Other (income) expense, net in the consolidated statements of operations.
Debt issuance costs of $20.6 million in connection with the refinancing transactions were deferred and will be amortized using the effective interest method over the terms of the Senior Secured Notes and ABL Facility.
See Note 11, Long-term debt and Short-term borrowings, under Item 8, Financial Statements and Supplementary Data for a further discussion on the Company’s refinancing transactions.
33
Table of Contents
Loan Covenants
The indentures governing the newly issued Senior Secured Notes and existing Senior Subordinated Notes do not contain quarterly or annual financial performance covenants. However, these indentures restrict, among other things, ACCO Brands’ ability and the ability of ACCO Brands’ restricted subsidiaries to, subject to certain exceptions, incur additional indebtedness, create liens, pay dividends, make certain investments, enter into certain types of transactions with affiliates and provide for limitations on any restricted subsidiary’s ability to pay dividends, make loans, or transfer assets to ACCO Brands or other restricted subsidiaries.
The ABL Facility contains customary terms and conditions, including limitations on liens and indebtedness, asset sales, and intercompany transactions. A springing fixed charge financial covenant of 1.10:1.0 will be triggered if the excess availability under the ABL Facility falls below $20.0 million or 15% of total commitments. The ABL Facility also contains cash dominion provisions that apply in the event that the Company’s excess availability fails to meet certain thresholds. Further, it limits the ability of the Company to repurchase Senior Subordinated Notes while the facility is utilized.
The Senior Secured Notes, Senior Subordinated Notes and the ABL Facility contain customary events of default, including payment default, breach of representation and warranties, covenant defaults, cross-defaults and cross-accelerations, certain bankruptcy or insolvency events, judgment defaults, certain ERISA-related events, changes in control or ownership and invalidity of any collateral or guarantee or other document. Any inability to pay interest on, or principal of, our outstanding debt as it becomes due could result in an event of default under any of the agreements governing any of our debt obligations, in which case our lenders could elect to declare all amounts outstanding to be immediately due and payable. If the lenders accelerate the payment of any of our indebtedness, our assets may not be sufficient to repay in full such indebtedness and any other indebtedness that would become due as a result of such acceleration and, if we were unable to obtain replacement financing or any such replacement financing was on terms that were less favorable than the indebtedness being replaced, our liquidity and results of operations would be materially and adversely affected.
Compliance with Loan Covenants
Based on our borrowing base, as of December 31, 2009, the amount available for borrowings under the Company’s ABL Facility was $156.4 million (allowing for $18.6 million of letters of credit outstanding on that date). The Company’s ABL Facility would not be affected by a change in its credit rating.
As of and for the period ended December 31, 2009, the Company was in compliance with all applicable loan covenants.
Guarantees and Security
The Senior Secured Notes are guaranteed on a senior secured basis by the Company’s existing and future domestic subsidiaries, with certain exceptions, and are secured on a first-priority basis by a lien on substantially all of the Company’s and guarantors’ present and future assets (other than receivables and inventory and their related general intangibles and certain other assets), including equipment, certain owned and leased real property interests, trade names and certain other intellectual property, certain intercompany receivables and all present and future equity interests of each of the Company’s and guarantors’ directly owned domestic subsidiaries and up to 65% of the present and future equity interests of certain of the Company’s and the guarantors’ directly owned foreign subsidiaries, in each case subject to certain exceptions and customary permitted liens. The Senior Secured Notes and the related guarantees also are secured on a second-priority basis by a lien on the assets that secure the Company’s and the guarantors’ obligations under the ABL Facility, including accounts receivable, inventory and the other assets identified as excluded first-lien assets above.
The Company’s obligations under the ABL Facility are guaranteed by the same subsidiaries that guarantee the Senior Secured Notes together with certain of the Company’s foreign subsidiaries and are secured on a first-priority basis by a lien on substantially all of the Company’s and such guarantors’ accounts receivable, inventory and the other assets identified as excluded first-lien assets above with respect to the Notes.
34
Table of Contents
Fiscal 2009 versus Fiscal 2008
Cash Flow from Operating Activities
For the year ended December 31, 2009, cash provided from operating activities was $71.5 million, compared to $37.2 million in the prior year. The net loss for 2009 was $126.1 million, and was principally the result of a $108.1 million non-cash charge related to the impairment of U.S. deferred tax assets. The net loss for the 2008 year was $339.2 million, and was principally the result of non-cash tangible and intangible asset impairment expenses totaling $359.2 million (pre-tax).
| 2009 | 2008 | |||||||
| Pre-tax Net Income/(Loss)—Continuing Operations |
$ | 12.1 | $ | (246.1 | ) | |||
| Pre-tax Net Income/(Loss)—Discontinued Operations |
(9.8 | ) | (88.4 | ) | ||||
| Pre-tax Net Income/(Loss) |
2.3 | (334.5 | ) | |||||
| Pre-tax Non-cash Charges |
59.9 | 390.7 | ||||||
| Pre-tax Net Income Adjusted for Non-cash Charges |
$ | 62.2 | $ | 56.2 | ||||
| 2009 | 2008 | |||||||
| Accounts Receivable |
$ | 41.5 | $ | 80.8 | ||||
| Inventories |
78.7 | (8.4 | ) | |||||
| Accounts Payable |
(54.9 | ) | (36.9 | ) | ||||
| Cash Flow from Net Working Capital |
$ | 65.3 | $ | 35.5 | ||||
Non-cash adjustments to net loss in 2009 totaled $59.9 million, compared to $390.7 million in 2008, on a pre-tax basis. Pre-tax net income adjusted for non-cash charges was $62.2 million in 2009 compared to $56.2 million in 2008. The operating cash flow of $71.5 million in 2009 included a net source of $65.3 million that was generated as we focused on right-sizing our working capital. Significant inventory reductions were achieved across our global businesses and our accounts receivable remained well-controlled as we responded to sales volume declines due to the economic downturn. Because of the inability of some of our suppliers to obtain credit insurance, we were required to pay certain suppliers more promptly, offsetting some of our gains from working capital management. For the year 2008, operating cash flow of $37.2 million included a net source of $35.5 million from working capital, driven by excess cash collections of accounts receivable during the fourth quarter, reflecting the significant decrease in sales which did not replenish our accounts receivable balance. This was partly offset by increased inventory levels, as we were not able to quickly right-size inventories in response to the lower sales demand that our business experienced during the second half of the year.
Cash Flow from Investing Activities
Cash used by investing activities was $3.9 million and $18.7 million for the years ended December 31, 2009 and 2008, respectively. Gross capital expenditures were $10.3 million and $43.5 million for the years ended December 31, 2009 and 2008, respectively. The decrease was driven by the completion of distribution facility and information technology projects in the prior year, as well as planned reductions in spending in 2009. The sale of discontinued operations during 2009 generated net cash proceeds of $9.2 million, net of selling costs. Additional cash proceeds of $3.8 million and additional costs associated with the sale of approximately $5.6 million are expected to be paid at a future date. Activity in 2008 included $24.8 million of net proceeds, primarily from the sale of four former manufacturing and administrative facilities.
Cash Flow from Financing Activities
Cash used by financing activities was $44.5 million and $37.7 million for the years ended December 31, 2009 and 2008, respectively. The increase in cash used by financing activities was entirely driven by the
35
Table of Contents
refinancing transactions described above, including $40.8 million associated with the settlement of our Euro debt cross-currency swap, and $20.6 million of debt issuance payments. See Note 11, Long-term debt and Short-term borrowings, for a further discussion on the Company’s refinancing transactions.
Fiscal 2008 versus Fiscal 2007
Cash Flow from Operating Activities
For the year ended December 31, 2008, cash provided from operating activities was $37.2 million, compared to $81.2 million in the prior year. The net loss for the 2008 year was $339.2 million, and was principally the result of non-cash tangible and intangible asset impairment expenses totaling $359.2 million (pre-tax). The net loss for the 2007 year was $0.9 million.
| 2008 | 2007 | |||||||
| Pre-tax Net Income/(Loss)—Continuing Operations |
$ | (246.1 | ) | $ | 50.6 | |||
| Pre-tax Net Income/(Loss)—Discontinued Operations |
(88.4 | ) | (35.6 | ) | ||||
| Pre-tax Net Income/(Loss) |
(334.5 | ) | 15.0 | |||||
| Pre-tax Non-cash Charges |
390.7 | 97.9 | ||||||
| Pre-tax Net Income Adjusted for Non-cash Charges |
$ | 56.2 | $ | 112.9 | ||||
| 2008 | 2007 | |||||||
| Accounts Receivable |
$ | 80.8 | $ | 21.9 | ||||
| Inventories |
(8.4 | ) | (15.6 | ) | ||||
| Accounts Payable |
(36.9 | ) | 8.9 | |||||
| Cash Flow from Net Working Capital |
$ | 35.5 | $ | 15.2 | ||||
Non-cash adjustments to net loss in 2008 totaled $390.7 million, compared to $97.9 million in 2007, on a pre-tax basis. Pre-tax income adjusted for noncash charges was $56.2 million in 2008 compared to $112.9 million in 2007. The operating cash flow of $37.2 million in 2008 included a net source of $35.5 million from working capital, driven by excess cash collections of accounts receivable during the fourth quarter, reflecting the significant decrease in sales which did not replenish our accounts receivable balance. This was partly offset by increased inventory levels, as we were not able to quickly right-size inventories in response to the lower sales demand that our business experienced during the second half of the year. For the year 2007, operating cash flow of $81.2 million included a net source of $15.2 million from working capital. The cash generated was reflective of higher operating profit and cash management initiatives, partly offset by increased inventory levels associated with the build-up of safety stock to support business integration and outsourcing activities and by significant cash payments related to restructuring activities.
Cash Flow from Investing Activities
Cash used by investing activities was $18.7 million and $55.2 million for the years ended December 31, 2008 and 2007, respectively. Gross capital expenditures in 2008 were $43.5 million and were $59.1 million in 2007. The capital spend in 2008 resulted from continued information technology investments and completion of distribution facilities, while the 2007 spend was driven by the cost of new distribution facilities and information technology investments. Proceeds from the sale of assets were $20.9 million higher than the prior year, and resulted primarily from the sale of four former manufacturing and administrative facilities.
Cash Flow from Financing Activities
Cash used by financing activities was $37.7 million and $35.4 million for the years 2008 and 2007, respectively. In January, 2008, the Company entered into a three-year accounts receivable securitization program. At the inception of the program the Company received cash proceeds of $75.0 million which was used to pay down the existing term loan facilities. As of December 31, 2008, the Company’s borrowings under the securitization program were $55.6 million.
36
Table of Contents
Capitalization
We had approximately 54.6 million common shares outstanding as of December 31, 2009.
Accounts Receivable Securitization Facility
In January, 2008, the Company entered into a three-year accounts receivable program with a financial institution. As part of the refinancing transactions, the Company repaid all outstanding borrowings under the accounts receivable securitization facility and then terminated the facility. The repayment and termination of $62.8 million of borrowings outstanding under the Company’s accounts receivable securitization program resulted in a pre-tax loss of $0.2 million on the early extinguishment of debt and included the write-off of issuance costs associated with the accounts receivable securitization program. The loss on the early extinguishment of debt is included in Other (income) expense, net in the consolidated statements of operations.
Adequacy of Liquidity Sources
The Company is subject to credit risk relative to the ability of counterparties to meet their contractual payment obligations or the potential non-performance of counterparties to deliver contracted commodities or services at the contracted price. The impact of the current global recession and restricted credit markets on our suppliers and customers is also unpredictable, outside of our control and may create additional risks for us, both directly and indirectly. The inability of suppliers to access financing or the insolvency of one or more of our suppliers could lead to disruptions in our supply chain, which could adversely impact our sales and/or increase our costs. Our suppliers may require us to pay cash in advance or obtain letters of credit for their benefit as a condition to selling us their products and services. A number of retailers have recently sought bankruptcy protection. If one or more of our principal customers were to file for bankruptcy, our sales could be adversely impacted and our ability to collect outstanding accounts receivable from any such customer could be limited. Any of these risks and uncertainties could have a material adverse effect on our business, financial condition, results of operations or cash flows.
Based on its 2010 business plan and latest forecasts, the Company believes that cash flow from operations, its current cash balance and other sources of liquidity, including borrowings available under our ABL Facility will be adequate to support requirements for working capital, capital expenditures and service indebtedness for the foreseeable future. Our future operating performance is dependent on many factors, some of which are beyond our control, including prevailing economic, financial and industry conditions. Sales of our products have declined due to the current global recession which has adversely impacted our consumers’ commercial spending. Any increase in the sales of our products is primarily dependent on recovery and growth in the commercial, business-to-business sector of the economy. If global economic conditions deteriorate and further adversely impact commercial spending, our sales could continue to decline or become increasingly concentrated in lower margin products, and our business, financial condition, results of operations or cash flows could be materially adversely affected.
Our operating performance and ability to comply with restrictions under our borrowing arrangements are dependent on our continued ability to access funds under our credit and loan agreements, including under our ABL Facility, and from cash on hand, maintain sales volumes, drive profitable growth, realize cost savings and generate cash from operations. The financial institutions that fund our ABL Facility are also being impacted by the volatility in the credit markets, and if one or more of them cannot fulfill our revolving credit requests, our operations may be adversely impacted. If our revolving credit is unavailable due to a lender not being able to fund requested amounts, or because we have not maintained compliance with our covenants, or we do not meet our sales or growth initiatives within the time frame we expect, our cash flow could be materially adversely impacted. A material decrease in our cash flow could cause us to fail to meet our obligations under our borrowing arrangements. A default under our credit or loan agreements could restrict or terminate our access to borrowings and materially impair our ability to meet our obligations as they come due. If we do not comply with
37
Table of Contents
any of our covenants and thereafter we do not obtain a waiver or amendment that otherwise addresses that non-compliance, our lenders may accelerate payment of all amounts outstanding under the affected borrowing arrangements, which amounts would immediately become due and payable, together with accrued interest. Such an acceleration would cause a default under the indentures governing the Senior Secured Notes and the Senior Subordinated Notes and other agreements that provide us with access to funding. Any one or more defaults, or our inability to generate sufficient cash flow from our operations in the future to service our indebtedness and meet our other needs, may require us to refinance all or a portion of our existing indebtedness or obtain additional financing or reduce expenditures that we deem necessary to our business. There can be no assurance that any refinancing of this kind would be possible or that any additional financing could be obtained. The inability to obtain additional financing could have a material adverse effect on our financial condition and on our ability to meet our obligations to noteholders.
Our cash flows from operating activities are dependent upon a number of factors that affect our sales, including demand, pricing and competition. Historically, key drivers of demand in the office products industry have included economic conditions generally, and specifically trends in gross domestic product (GDP), which affects business confidence and the propensity to purchase consumer durables, white collar employment levels, and growth in the number of small businesses and home offices together with increasing usage of personal computers. Pricing and demand levels for office products have also reflected a substantial consolidation within the global resellers of office products. Those resellers are our principal customers. This consolidation has led to increased pricing pressure on suppliers and a more efficient level of asset utilization by customers, resulting in lower sales volumes and higher costs from more frequent small orders for suppliers of office products. We sell products in highly competitive markets, and compete against large international and national companies, regional competitors and against our own customers’ direct and private-label sourcing initiatives.
Off-Balance-Sheet Arrangements and Contractual Financial Obligations
We do not have any material off-balance-sheet arrangements that have, or are reasonably likely to have, a current or future effect on our financial condition, changes in financial condition, revenues or expenses, results of operations, liquidity, capital expenditures or capital resources.
Our contractual obligations and related payments by period at December 31, 2009 were as follows:
| (in millions of dollars) | Total | 2010 | 2011-2012 | 2013-2014 | Thereafter | ||||||||||
| Contractual obligations |
|||||||||||||||
| Notes payable and long-term debt(1) |
$ | 732.5 | $ | 0.7 | $ | 0.2 | $ | 0.2 | $ | 731.4 | |||||
| Interest on long-term debt |
375.9 | 69.6 | 139.2 | 139.1 | 28.0 | ||||||||||
| Operating lease obligations |
82.0 | 21.4 | 26.5 | 11.3 | 22.8 | ||||||||||
| Purchase obligations(2) |
26.2 | 23.7 | 2.4 | 0.1 | — | ||||||||||
| Other long-term liabilities(3) |
17.2 | 17.2 | — | — | — | ||||||||||
| Total |
$ | 1,233.8 | $ | 132.6 | $ | 168.3 | $ | 150.7 | $ | 782.2 | |||||
| (1) | Debt obligations include an amount in excess of the carrying value of debt which reflects the original issue discount on the Senior Secured Notes ($6.7 million as of December 31, 2009). |
| (2) | Purchase obligations primarily consist of contracts and non-cancelable purchase orders for raw materials and finished goods. |
| (3) | Obligations related to the other long-term liabilities consist of payments for the Company’s pension plans. |
Due to the uncertainty with respect to the timing of future cash flows associated with our unrecognized tax benefits at December 31, 2009, we are unable to make reasonably reliable estimates of the period of cash settlement with the respective taxing authorities. Therefore, $6.0 million of unrecognized tax benefits have been
38
Table of Contents
excluded from the contractual obligations table above. See Note 6, Income Taxes, under Item 8, Financial Statements and Supplementary Data, for a discussion on income taxes.
Critical Accounting Policies
Our financial statements are prepared in conformity with accounting principles generally accepted in the United States of America. Preparation of our financial statements require us to make judgments, estimates and assumptions that affect the amounts of actual assets, liabilities, revenues and expenses presented for each reporting period. Actual results could differ significantly from those estimates. We regularly review our assumptions and estimates, which are based on historical experience and, where appropriate, current business trends. We believe that the following discussion addresses our critical accounting policies, which require more significant, subjective and complex judgments to be made by our management.
Revenue Recognition
We recognize revenue from product sales when earned, net of applicable provisions for discounts, returns and allowances. We consider revenue to be realized or realizable and earned when all of the following criteria are met: title and risk of loss have passed to the customer, persuasive evidence of an arrangement exists, delivery has occurred, the price is fixed or determinable and collectability is reasonably assured. We also provide for our estimate of potential bad debt at the time of revenue recognition.
Allowances for Doubtful Accounts and Sales Returns
Trade receivables are recorded at the stated amount, less allowances for discounts, doubtful accounts and returns. The allowance for doubtful accounts represents estimated uncollectible receivables associated with potential customer defaults on contractual obligations, usually due to customers’ potential insolvency. The allowance includes amounts for certain customers where a risk of default has been specifically identified. In addition, the allowance includes a provision for customer defaults on a general formula basis when it is determined the risk of some default is probable and estimable, but cannot yet be associated with specific customers. The assessment of the likelihood of customer defaults is based on various factors, including the length of time the receivables are past due, historical experience and existing economic conditions.
The allowance for sales returns represents estimated uncollectible receivables associated with the potential return of products previously sold to customers, and is recorded at the time that the sales are recognized. The allowance includes a general provision for product returns based on historical trends. In addition, the allowance includes a reserve for currently authorized customer returns that are considered to be abnormal in comparison to the historical basis.
Inventories
Inventories are priced at the lower of cost (principally first-in, first-out with minor amounts at average) or market. A reserve is established to adjust the cost of inventory to its net realizable value. Inventory reserves are recorded for obsolete or slow moving inventory based on assumptions about future demand and marketability of products, the impact of new product introductions and specific identification of items, such as product discontinuance or engineering/material changes. These estimates could vary significantly, either favorably or unfavorably, from actual requirements if future economic conditions, customer inventory levels or competitive conditions differ from expectations.
39
Table of Contents
Property, Plant and Equipment
Property, plant and equipment are carried at cost. Depreciation is provided, principally on a straight-line basis, over the estimated useful lives of the assets. Gains or losses resulting from dispositions are included in income. Betterments and renewals, which improve and extend the life of an asset, are capitalized; maintenance and repair costs are expensed. Purchased computer software is capitalized and amortized over the software’s useful life. Estimated useful lives of the related assets are as follows:
| Buildings |
40 to 50 years | |
| Leasehold improvements |
Lesser of lease term or 10 years | |
| Machinery, equipment and furniture |
3 to 10 years |
Long-Lived Assets
We test long-lived assets for impairment whenever events or changes in circumstances indicate that the assets’ carrying amount is not recoverable from its undiscounted cash flows. When such events occur, we compare the sum of the undiscounted cash flows expected to result from the use and eventual disposition of the asset or asset group to the carrying amount of a long-lived asset or asset group. The cash flows are based on our best estimate at the time of future cash flow, derived from the most recent business projections. If this comparison indicates that there is an impairment, the amount of the impairment is calculated using a quoted market price, or if unavailable, using discounted expected future cash flows. The discount rate applied to these cash flows is based on our weighted average cost of capital, computed by selecting market rates at the valuation dates for debt and equity that are reflective of the risks associated with an investment in the Company’s industry as estimated by using comparable publicly traded companies.
Indefinite-Lived Intangibles
Indefinite-lived intangibles are tested for impairment on an annual basis and written down when impaired. An interim impairment test is performed if an event occurs or conditions change that would more likely than not reduce the fair value below the carrying value.
In addition, purchased intangible assets other than goodwill are amortized over their useful lives unless their lives are determined to be indefinite. Certain of our trade names have been assigned an indefinite life as we currently anticipate that these trade names will contribute cash flows to ACCO Brands indefinitely.
We review indefinite-lived intangibles for impairment annually, and whenever market or business events indicate there may be a potential adverse impact on a particular intangible. We consider the implications of both external factors (e.g., market growth, pricing, competition, and technology) and internal factors (e.g., product costs, margins, support expenses, and capital investment) and their potential impact on cash flows for each business in both the near and long term, as well as their impact on any identifiable intangible asset associated with the business. Based on recent business results, consideration of significant external and internal factors, and the resulting business projections, indefinite-lived intangible assets are reviewed to determine whether they are likely to remain indefinite-lived, or whether a finite life is more appropriate. In addition, based on events in the period and future expectations, management considers whether the potential for impairment exists.
Goodwill and Intangible Assets
We test goodwill for impairment at least annually, normally in the second quarter, and on an interim basis if an event or circumstance indicates that it is more likely than not that an impairment has been incurred. If the carrying amount of the goodwill exceeds its fair value, an impairment loss is recognized. In applying a fair-value-based test, estimates are made of the expected future cash flows to be derived from each reporting unit. The resulting fair value determination is significantly impacted by estimates of future prices for our products, capital needs, economic trends and other factors.
40
Table of Contents
During the fourth quarter of 2008, the Company experienced a sustained, significant decline in its stock price. As a result of the decline in stock price, the Company’s market capitalization fell below the recorded value of its consolidated net assets. In addition, during the fourth quarter of 2008, the Company continued to experience a significant decline in both its sales and operating income as well as a reduction in its future forecasted cash flows. Given these impairment indicators, the Company determined that its goodwill might be impaired.
Accordingly, as of the end of the fourth quarter of 2008, the Company performed an assessment of goodwill for impairment. As part of our process for performing the step one impairment test of goodwill, we determine the fair value of a reporting unit using a combination of a discounted cash flow analysis and a market-based approach, which utilize significant unobservable inputs (Level 3) within the fair value hierarchy. A key assumption in our fair value estimate is the weighted average cost of capital utilized for discounting our cash flow estimates in our income approach. We selected a weighted average cost of capital of 14.0 percent. We reconciled the enterprise value to our overall market capitalization which included an expected control premium based on comparable transactions. Based on the results of the Company’s assessment of goodwill for impairment, it was determined that the carrying values of the ACCO Brands Americas and ACCO Brands International reporting units exceeded their estimated fair values. Therefore, the Company performed the second step of the impairment test to determine the implied fair value of goodwill of the ACCO Brands Americas and ACCO Brands International reporting units. As a result of the impairment assessment, the Company concluded that the carrying value of goodwill in both the ACCO Brands Americas and ACCO Brands International reporting units exceeded its implied fair value and therefore we recorded a goodwill impairment charge of $197.3 million, of which $112.6 million is attributable to the ACCO Brands Americas reporting unit and $84.7 million is attributable to the ACCO Brands International reporting unit. The Company determined that goodwill in its Computer Products Group segment was not impaired. If we were to increase the discount rate used in the discounted cash flow calculation by 1%, there would have been an additional impairment of goodwill of approximately $58 million. A decrease by 1% would have resulted in $70 million less of goodwill being impaired.
As of the end of the fourth quarter of 2008, the Company also revalued its other indefinite-lived intangibles, consisting of its indefinite-lived trade names. The Company estimated the fair value of its trade names by performing discounted cash flow analyses based on the relief-from-royalty approach. This approach treats the trade name as if it were licensed by the Company rather than owned, and calculates its value based on the discounted cash flow of the projected license payments. A key assumption in our fair value estimate is the discount rate utilized. We selected a discount rate of 18.0 percent. The analysis resulted in an impairment charge of $51.7 million, of which $31.3 million was recorded in the ACCO Brands Americas segment, $17.6 million was recorded in the ACCO Brands International segment and $2.8 million was recorded in the Computer Products Group segment.
In addition, as a result of the impairment indicators described above, the Company reviewed certain of our long-lived tangible and amortizable intangible assets. The Company determined that the forecasted undiscounted cash flows related to these asset groups were in excess of their carrying values, and therefore these assets were not impaired.
During the second and third quarters of 2008, as a result of reduced sales and operating profits in the Company’s former Commercial Laminating Solutions business segment, as well as reduced expected future cash flows, the Company recorded goodwill impairment charges of $36.5 million and $24.0 million, respectively. Of these charges, the digital print finishing business recorded $14.1 million and $11.3 million in the second and third quarters of 2008, respectively. Collectively, $16.7 million of these charges were recorded in the ACCO Brands Americas segment and $8.7 million were recorded in the ACCO Brands International segment. The commercial print finishing business, which has subsequently been reclassified as a discontinued operation, recorded goodwill impairment charges of $22.4 million and $12.7 million, in the second and third quarters of 2008, respectively. The financial results of the commercial print finishing business, as well as the impairment charges related to this business have been classified within the caption “Discontinued Operations” for all periods.
41
Table of Contents
During the fourth quarter of 2007, the Company recorded a goodwill impairment charge of $2.3 million pertaining to the Company’s digital print finishing business, of which $1.6 million was recorded in the ACCO Brands Americas segment and $0.7 million was recorded in the ACCO Brands International segment. In addition, during the fourth quarter of 2007, as a result of reduced profitability due to increased competition from lower-cost importers of high-speed laminating films, increased raw material costs and adverse mix, the Company recorded a goodwill impairment charge of $32.8 million related to its commercial print finishing business which is classified within Discontinued Operations.
Given the current economic environment and the uncertainties regarding the impact on our business, there can be no assurance that our estimates and assumptions made for purposes of our impairment testing during 2009 will prove to be accurate predictions of the future. If our assumptions regarding forecasted revenue or margin growth rates of certain reporting units are not achieved, we may be required to record additional impairment charges in future periods, whether in connection with our next annual impairment testing in the second quarter of fiscal year 2010 or prior to that, if any such change constitutes a triggering event outside of the quarter from when the annual impairment test is performed. It is not possible at this time to determine if any such future impairment charge would result or, if it does, whether such charge would be material.
Employee Benefit Plans
We provide a range of benefits to our employees and retired employees, including pensions, post-retirement, post-employment and health care benefits. We record annual amounts relating to these plans based on calculations specified by accounting principles generally accepted in the United States of America, which include various actuarial assumptions, including discount rates, assumed rates of return, compensation increases, turnover rates and health care cost trend rates. Actuarial assumptions are reviewed on an annual basis and modifications to these assumptions are made based on current rates and trends when it is deemed appropriate. As required by accounting principles generally accepted in the United States of America, the effect of our modifications are generally recorded and amortized over future periods. We believe that the assumptions utilized in recording our obligations under the plans are reasonable based on our experience. The actuarial assumptions used to record our plan obligations could differ materially from actual results due to changing economic and market conditions, higher or lower withdrawal rates or other factors which may impact the amount of retirement related benefit expense recorded by us in future periods.
The discount rate assumptions used to determine the postretirement obligations of the benefit plans is based on a spot-rate yield curve that matches projected future benefit payments with the appropriate interest rate applicable to the timing of the projected future benefit payments. The assumed discount rates reflect market rates for high-quality corporate bonds currently available. The Company’s discount rates were determined by considering the average of pension yield curves constructed of a large population of high quality corporate bonds. The resulting discount rates reflect the matching of plan liability cash flows to the yield curves.
The expected long-term rate of return on plan assets reflects management’s expectations of long-term average rates of return on funds invested based on our investment profile to provide for benefits included in the projected benefit obligations. The expected return is based on the outlook for inflation, fixed income returns and equity returns, while also considering historical returns over the last 10 years, and asset allocation and investment strategy.
Pension expenses were $6.3 million, $2.9 million and $10.2 million, respectively, in the years ended December 31, 2009, 2008 and 2007. There were no post-retirement expenses in 2009. Post-retirement expenses were $0.3 million and $0.5 million, respectively, for the years ended December 31, 2008 and 2007. In 2010, we expect no post-retirement expense and pension expense of approximately $8.6 million. On January 20, 2009, the Company’s Board of Directors approved plan amendments to temporarily freeze the Company’s U.S. pension and non-qualified supplemental retirement plans effective March 7, 2009. No additional benefits will accrue under these plans after that date until further action by the Board of Directors.
42
Table of Contents
A 25-basis point change (0.25%) in our discount rate assumption would lead to an increase or decrease in our pension expense of approximately $1.3 million for 2010. A 25-basis point change (0.25%) in our long-term rate of return assumption would lead to an increase or decrease in pension expense of approximately $0.9 million for 2010.
Customer Program Costs
Customer programs and incentives are a common practice in the office products industry. We incur customer program costs to obtain favorable product placement, to promote sell-through of products and to maintain competitive pricing. Customer program costs and incentives, including rebates, promotional funds and volume allowances, are accounted for as a reduction to gross sales. These costs are recorded at the time of sale based on management’s best estimates. Estimates are based on individual customer contracts and projected sales to the customer in comparison to any thresholds indicated by contract. In the absence of a signed contract, estimates are based on historical or projected experience for each program type or customer. Management periodically reviews accruals for these rebates and allowances, and adjusts accruals when circumstances indicate (typically as a result of a change in sales volume expectations or customer contracts).
Income Taxes
Deferred tax liabilities or assets are established for temporary differences between financial and tax reporting bases and are subsequently adjusted to reflect changes in tax rates expected to be in effect when the temporary differences reverse. A valuation allowance is recorded to reduce deferred tax assets to an amount that is more likely than not to be realized. Facts and circumstances may change that cause the Company to revise the conclusions on its ability to realize certain net operating losses and other deferred tax attributes.
The amount of income taxes that we pay is subject to ongoing audits by federal, state and foreign tax authorities. Our estimate of the potential outcome of any uncertain tax position is subject to management’s assessment of relevant risks, facts and circumstances existing at that time. We believe that we have adequately provided for reasonably foreseeable outcomes related to these matters. However, our future results may include favorable or unfavorable adjustments to our estimated tax liabilities in the period the assessments are revised or resolved.
Stock-Based Compensation
Stock-based compensation cost is estimated at the grant date based on the fair value of the award, and the cost is recognized as expense ratably over the vesting period. Determining the appropriate fair value model to use requires judgment. Determining the assumptions that enter into the model is highly subjective and also requires judgment, including long-term projections regarding stock price volatility, employee exercise, post-vesting termination, and pre-vesting forfeiture behaviors, interest rates and dividend yields. The grant date fair value of each award is estimated using the Black-Scholes option-pricing model.
We have utilized historical volatility for a pool of peer companies for a period of time that is comparable to the expected life of the option to determine volatility assumptions. The weighted average expected option term reflects the application of the simplified method, which defines the life as the average of the contractual term of the options and the weighted average vesting period for all option tranches. The risk-free interest rate for the expected term of the option is based on the U.S. Treasury yield curve in effect at the time of grant. Forfeitures are estimated at the time of grant in order to calculate the amount of share-based payment awards ultimately expected to vest. The forfeiture rate is based on historical rates.
43
Table of Contents
The use of different assumptions would result in different amounts of stock compensation expense. Holding all other variables constant, the indicated change in each of the assumptions below increases or decreases the fair value of an option (and hence, expense), as follows:
| Assumption |
Change to Assumption |
Impact on Fair Value of Option | ||
| Expected volatility |
Higher | Higher | ||
| Expected life |
Higher | Higher | ||
| Risk-free interest rate |
Higher | Higher | ||
| Dividend yield |
Higher | Lower |
The pre-vesting forfeitures assumption is ultimately adjusted to the actual forfeiture rate. Therefore, changes in the forfeitures assumption would not impact the total amount of expense ultimately recognized over the vesting period. Different forfeitures assumptions would only impact the timing of expense recognition over the vesting period. Estimated forfeitures will be reassessed in subsequent periods and may change based on new facts and circumstances.
Management is not able to estimate the probability of actual results differing from expected results, but believes our assumptions are appropriate, based upon our historical and expected future experience.
Recent Accounting Pronouncements
In December 2007, the Financial Accounting Standards Board (“FASB”) revised the authoritative guidance for business combinations which establishes the principles and requirements for how an acquirer (i) recognizes and measures in its financial statements the identifiable assets acquired, the liabilities assumed, and any noncontrolling interest in the acquiree; (ii) recognizes and measures the goodwill acquired in the business combination or a gain from a bargain purchase; and (iii) determines what information to disclose to enable users of the financial statements to evaluate the nature and financial effects of the business combination. The guidance makes significant changes to existing accounting practices for acquisitions, including the requirement to expense transaction costs and to reflect the fair value of contingent purchase price adjustments at the date of acquisition. In April 2009, the FASB issued authoritative guidance which amends and clarifies the initial recognition and measurement, subsequent measurement and accounting and disclosure of assets and liabilities arising from contingencies in a business combination. This guidance applies prospectively to business combinations for which the acquisition date is on or after January 1, 2009. As the Company has not made any acquisitions in fiscal 2009, the guidance adopted by the Company on January 1, 2009 did not impact the Company’s consolidated financial statements.
In December 2007, the FASB issued authoritative guidance which establishes new accounting and reporting standards for the noncontrolling interest in a subsidiary and for the deconsolidation of a subsidiary. The Company adopted this guidance beginning January 1, 2009. As the Company has no significant noncontrolling interests this guidance had no material impact on the Company’s consolidated financial statements.
In February 2008, the FASB issued authoritative guidance, which delayed for one year the effective date of the authoritative guidance for fair value measurements for all nonfinancial assets and nonfinancial liabilities, except those that are recognized or disclosed at fair value in the financial statements on a recurring basis, until periods beginning January 1, 2009. On January 1, 2009, the Company adopted the authoritative guidance for fair value measurements for nonfinancial assets and nonfinancial liabilities that are required to be measured at fair value. The adoption did not impact the Company’s consolidated financial statements.
In March 2008, the FASB issued authoritative guidance which is intended to improve the financial reporting about derivative instruments and hedging activities. This guidance requires entities to provide enhanced disclosures addressing how and why an entity uses derivative instruments, how derivative instruments and related hedged items are accounted for, and how derivative instruments and related hedged items affect an
44
Table of Contents
entity’s financial position, financial performance, and cash flows. The guidance is effective for fiscal years beginning after November 15, 2008. The Company has provided the required disclosures in Note 12 to the Consolidated Financial Statements, Derivative Financial Instruments.
In December 2008, the FASB issued authoritative guidance on an employer’s disclosures about plan assets of a defined benefit pension or other postretirement plan. This guidance is effective for fiscal years ending after December 15, 2009. The Company has provided the required disclosures in Note 4, to the Consolidated Financial Statements, Pensions and Other Retiree Benefits.
In April 2009, the FASB issued authoritative guidance that requires fair value disclosures in both interim as well as annual financial statements in order to provide more timely information about the effects of current market conditions on financial instruments. The Company adopted this guidance in the second quarter of 2009, the impact of which related only to disclosures of the Company’s debt and did not have a material impact on the Company’s consolidated financial statements. See Note 13 to the Consolidated Financial Statements, Fair Value of Financial Instruments.
In May 2009, the FASB issued authoritative guidance which establishes general standards of accounting for, and disclosures of, events that occur after the balance sheet date but before financial statements are issued or are available to be issued. It requires disclosure of the date through which an entity has evaluated subsequent events. The Company adopted this guidance in the second quarter of 2009 and its adoption did not impact the Company’s consolidated financial statements.
In June 2009, the FASB issued the Accounting Standards Codification (the “Codification”) to become the single official source of authoritative, nongovernmental U.S. generally accepted accounting principles (GAAP). The Codification did not change GAAP but reorganizes the literature. The Codification is to be applied for financial statements issued for interim and annual periods ending after September 15, 2009. The Company adopted this guidance in the third quarter of 2009 and its adoption did not impact the Company’s consolidated financial statements.
ITEM 7A. QUANTITATIVE AND QUALITATIVE DISCLOSURES ABOUT MARKET RISK
The office products industry is concentrated in a small number of major customers, principally office products superstores, large retailers, wholesalers and contract stationers. Customer consolidation and share growth of private-label products continue to increase pricing pressures, which may adversely affect margins for the Company and its competitors. The Company is addressing these challenges through design innovations, value-added features and services, as well as continued cost and asset reduction.
The Company is exposed to various market risks, including changes in foreign currency exchange rates and interest rate changes. The Company enters into financial instruments to manage and reduce the impact of these risks, not for trading or speculative purposes. The counterparties to these financial instruments are major financial institutions.
Foreign Exchange Risk Management
The Company enters into forward foreign currency and option contracts principally to hedge currency fluctuations in transactions (primarily anticipated inventory purchases and intercompany loans) denominated in foreign currencies, thereby limiting the risk that would otherwise result from changes in exchange rates. The majority of the Company’s exposure to local currency movements is in Europe, Australia, Japan and Canada. All of the existing foreign exchange contracts as of December 31, 2009 have maturity dates in 2010. Increases and decreases in the fair market values of the forward agreements are expected to be offset by gains/losses in recognized net underlying foreign currency transactions or loans. Notional amounts of outstanding foreign currency forward exchange contracts were $186.5 million and $325.3 million at December 31, 2009 and 2008, respectively. The net fair value of these foreign currency contracts was $0.0 million at December 31, 2009 and a
45
Table of Contents
net asset of $2.2 million at December 31, 2008. At December 31, 2009, a 10% unfavorable exchange rate movement in our portfolio of foreign currency forward contracts would have increased our unrealized losses by $18.0 million. Consistent with the use of these contracts to neutralize the effect of exchange rate fluctuations, such unrealized losses or gains would be offset by corresponding gains or losses, respectively, in the remeasurement of the underlying transactions being hedged. When taken together, the Company believes these forward contracts and the offsetting underlying commitments do not create material market risk.
For more information related to outstanding foreign currency forward exchange contracts see Note 13, Fair Value of Financial Instruments and Note 12, Derivative Financial Instruments, under Item 8, Financial Statements and Supplementary Data.
Interest Rate Risk Management
On September 30, 2009, the Company issued $460.0 million aggregate principal amount of Senior Secured Notes, and entered into a $175.0 million ABL Facility. Initial borrowings under the ABL Facility were $16.1 million. These funds together with the $453.1 million in proceeds the Company received from the issuance of the Senior Secured Notes were used to repay $343.6 million of borrowings outstanding and accrued interest on the Company’s prior senior secured credit agreements, repay $62.8 million of borrowings outstanding and accrued interest under the Company’s accounts receivable securitization program, pay $40.8 million to terminate the Company’s euro/dollar currency swap facility, repurchase $29.1 million of our Senior Subordinated Notes and to pay $20.6 million of debt issuance costs related to the Senior Secured Notes and ABL Facility. As a result the Company now primarily has fixed interest rates with the exception of the ABL facility.
Our Senior Secured Notes and Senior Subordinated Notes have fixed interest rates and, accordingly, are not exposed to market risk resulting from changes in interest rates. However, the fair market value of our long-term fixed interest rate debt is subject to interest rate risk. Generally, the fair market value of fixed interest rate debt will increase as interest rates fall and decrease as interest rates rise. In addition, fair market values will also reflect the credit markets’ view of credit risk spreads. These interest rate changes may affect the fair market value of the fixed interest rate debt and any repurchases of these notes, but do not impact our earnings or cash flows.
Interest rates under the ABL Facility are based on the London Interbank Offered Rate (LIBOR). Pricing is subject to quarterly adjustment based on the average availability under the ABL Facility during the prior quarter. The range of borrowing costs under the pricing grid is LIBOR plus 3.75% to LIBOR plus 4.25% with a LIBOR rate floor of 1.50%. The Company is required to pay a quarterly commitment fee on the unused portion of the ABL facility ranging from 0.5% to 1.0%. There were no borrowings outstanding under the Company’s ABL Facility as of December 31, 2009.
The following table summarizes information about the Company’s fixed rate debt as of December 31, 2009, including the principal cash payments (excluding the original issue discount on the Senior Secured Notes) and related weighted-average interest rates by expected maturity dates.
Debt Obligations
| Stated Maturity Date | Total | Fair Value | |||||||||||||||||||||||||||||
| (in millions) | 2010 | 2011 | 2012 | 2013 | 2014 | Thereafter | |||||||||||||||||||||||||
| Long term debt: |
|||||||||||||||||||||||||||||||
| Fixed rate (U.S. dollars) |
|||||||||||||||||||||||||||||||
| Senior Secured Notes (U.S. dollars) |
$ | — | $ | — | $ | — | $ | — | $ | — | $ | 460.0 | $ | 460.0 | $ | 510.6 | |||||||||||||||
| Average fixed interest rate |
10.63 | % | 10.63 | % | 10.63 | % | 10.63 | % | 10.63 | % | 10.63 | % | 10.63 | % | |||||||||||||||||
| Senior Subordinated Notes (U.S. dollars) |
$ | — | $ | — | $ | — | $ | — | $ | — | $ | 271.3 | $ | 271.3 | $ | 258.4 | |||||||||||||||
| Average fixed interest rate |
7.63 | % | 7.63 | % | 7.63 | % | 7.63 | % | 7.63 | % | 7.63 | % | 7.63 | % | |||||||||||||||||
46
Table of Contents
ITEM 8. FINANCIAL STATEMENTS AND SUPPLEMENTARY DATA
INDEX TO CONSOLIDATED FINANCIAL STATEMENTS
47
Table of Contents
REPORT OF INDEPENDENT REGISTERED PUBLIC ACCOUNTING FIRM
To the Board of Directors and Stockholders of ACCO Brands Corporation
We have audited the accompanying consolidated balance sheet of ACCO Brands Corporation and subsidiaries as of December 31, 2009, and the related consolidated statements of operations, stockholders’ equity (deficit) and comprehensive income (loss), and cash flows for the year then ended. In connection with our audit of the consolidated financial statements, we also audited the related consolidated financial statement schedule, Schedule II—Valuation and Qualifying Accounts and Reserves. We also have audited ACCO Brands Corporation’s internal control over financial reporting as of December 31, 2009, based on criteria established in Internal Control—Integrated Framework issued by the Committee of Sponsoring Organizations of the Treadway Commission (COSO). ACCO Brands Corporation’s management is responsible for these consolidated financial statements and financial statement schedule, for maintaining effective internal control over financial reporting, and for its assessment of the effectiveness of internal control over financial reporting, included in the accompanying management report on internal control over financial reporting. Our responsibility is to express an opinion on these consolidated financial statements and financial statement schedule, and an opinion on the Company’s internal control over financial reporting based on our audit.
We conducted our audit in accordance with the standards of the Public Company Accounting Oversight Board (United States). Those standards require that we plan and perform the audit to obtain reasonable assurance about whether the financial statements, and financial statement schedule, are free of material misstatement and whether effective internal control over financial reporting was maintained in all material respects. Our audit of the consolidated financial statements, and financial statement schedule, included examining, on a test basis, evidence supporting the amounts and disclosures in the financial statements, assessing the accounting principles used and significant estimates made by management, and evaluating the overall financial statement presentation. Our audit of internal control over financial reporting included obtaining an understanding of internal control over financial reporting, assessing the risk that a material weakness exists, and testing and evaluating the design and operating effectiveness of internal control based on the assessed risk. Our audit also included performing such other procedures as we considered necessary in the circumstances. We believe that our audit provides a reasonable basis for our opinion.
A company’s internal control over financial reporting is a process designed to provide reasonable assurance regarding the reliability of financial reporting and the preparation of financial statements for external purposes in accordance with generally accepted accounting principles. A company’s internal control over financial reporting includes those policies and procedures that (1) pertain to the maintenance of records that, in reasonable detail, accurately and fairly reflect the transactions and dispositions of the assets of the company; (2) provide reasonable assurance that transactions are recorded as necessary to permit preparation of financial statements in accordance with generally accepted accounting principles, and that receipts and expenditures of the company are being made only in accordance with authorizations of management and directors of the company; and (3) provide reasonable assurance regarding prevention or timely detection of unauthorized acquisition, use, or disposition of the company’s assets that could have a material effect on the financial statements.
Because of its inherent limitations, internal control over financial reporting may not prevent or detect misstatements. Also, projections of any evaluation of effectiveness to future periods are subject to the risk that controls may become inadequate because of changes in conditions, or that the degree of compliance with the policies or procedures may deteriorate.
In our opinion, the consolidated financial statements and financial statement schedule referred to above present fairly, in all material respects, the financial position of ACCO Brands Corporation and subsidiaries as of December 31, 2009, and the results of their operations and their cash flows for the year then ended, in conformity with U.S. generally accepted accounting principles. Also in our opinion, ACCO Brands Corporation maintained, in all material respects, effective internal control over financial reporting as of December 31, 2009, based on criteria established in Internal Control—Integrated Framework issued by the Committee of Sponsoring Organizations of the Treadway Commission.
/s/ KPMG LLP
Chicago, Illinois
February 26, 2010
48
Table of Contents
REPORT OF INDEPENDENT REGISTERED PUBLIC ACCOUNTING FIRM
To the Board of Directors and Stockholders of ACCO Brands Corporation:
In our opinion, the consolidated balance sheet as of December 31, 2008 and the related consolidated statements of operations, stockholders’ equity and comprehensive income and cash flows for each of the two years in the period ended December 31, 2008 present fairly, in all material respects, the financial position of ACCO Brands Corporation at December 31, 2008, and the results of their operations and their cash flows for each of the two years in the period ended December 31, 2008, in conformity with accounting principles generally accepted in the United States of America. In addition, in our opinion, the financial statement schedule for each of the two years in the period ended December 31, 2008 presents fairly, in all material respects, the information set forth therein when read in conjunction with the related consolidated financial statements. These financial statements and financial statement schedule are the responsibility of the Company’s management. Our responsibility is to express an opinion on these financial statements and financial statement schedule based on our audits. We conducted our audits of these statements in accordance with the standards of the Public Company Accounting Oversight Board (United States). Those standards require that we plan and perform the audit to obtain reasonable assurance about whether the financial statements are free of material misstatement. An audit includes examining, on a test basis, evidence supporting the amounts and disclosures in the financial statements, assessing the accounting principles used and significant estimates made by management, and evaluating the overall financial statement presentation. We believe that our audits provide a reasonable basis for our opinion.
/s/ PricewaterhouseCoopers LLP
Chicago, Illinois
March 2, 2009
49
Table of Contents
MANAGEMENT’S REPORT ON INTERNAL CONTROL OVER FINANCIAL REPORTING
Management of ACCO Brands Corporation and its subsidiaries is responsible for establishing and maintaining adequate internal controls over financial reporting, as defined in Rules 13a-15(f) and 15d-15(f) under the Securities Exchange Act of 1934. The Company’s internal control over financial reporting is designed and effected by the Company’s board of directors, management and other personnel to provide reasonable assurance regarding the reliability of the Company’s financial reporting and the preparation of financial statements for external purposes in accordance with U.S. generally accepted accounting principles.
Because of its inherent limitations, internal control over financial reporting may not prevent or detect misstatements. Also, projections of any evaluation of effectiveness to future periods are subject to the risk that controls may become inadequate because of changes in conditions, or that the degree of compliance with the policies or procedures may deteriorate.
As required by Section 404 of the Sarbanes-Oxley Act of 2002, management assessed the effectiveness of the Company’s internal control over financial reporting as of December 31, 2009. In making this assessment, management used the criteria set forth by the Committee of Sponsoring Organizations of the Treadway Commission (COSO) in Internal Control-Integrated Framework.
Based on our assessment, management concluded that the Company maintained effective internal control over financial reporting as of December 31, 2009.
The effectiveness of the Company’s internal control over financial reporting as of December 31, 2009 has been audited by KPMG LLP, an independent registered public accounting firm, as stated in their report that appears herein.
| /s/ ROBERT J. KELLER |
/s/ NEAL V. FENWICK | |
| Robert J. Keller | Neal V. Fenwick | |
| Chairman of the Board and | Executive Vice President and | |
| Chief Executive Officer | Chief Financial Officer | |
| (principal executive officer) | (principal financial officer) | |
| February 26, 2010 | February 26, 2010 |
50
Table of Contents
ACCO Brands Corporation and Subsidiaries
Consolidated Balance Sheets
| (in millions of dollars, except share data) | December 31, 2009 | December 31, 2008 | ||||||
| Assets | ||||||||
| Current assets: |
||||||||
| Cash and cash equivalents |
$ | 43.6 | $ | 18.1 | ||||
| Accounts receivable less allowances for discounts, doubtful accounts and returns; $18.3 and $23.1 for 2009 and 2008, respectively |
259.9 | 274.8 | ||||||
| Inventories |
202.4 | 266.5 | ||||||
| Deferred income taxes |
9.8 | 33.0 | ||||||
| Other current assets |
21.4 | 39.1 | ||||||
| Assets of discontinued operations held for sale |
— | 33.2 | ||||||
| Total current assets |
537.1 | 664.7 | ||||||
| Property, plant and equipment, net |
181.1 | 194.8 | ||||||
| Deferred income taxes |
31.5 | 81.7 | ||||||
| Goodwill |
143.4 | 139.5 | ||||||
| Identifiable intangibles, net of accumulated amortization of $91.0 and $81.5 for 2009 and 2008, respectively |
145.8 | 149.9 | ||||||
| Prepaid pension |
— | 0.6 | ||||||
| Other assets |
67.9 | 49.4 | ||||||
| Assets of discontinued operations held for sale |
— | 1.6 | ||||||
| Total assets |
$ | 1,106.8 | $ | 1,282.2 | ||||
| Liabilities and Stockholders’ Equity (Deficit) | ||||||||
| Current liabilities: |
||||||||
| Notes payable to banks |
$ | 0.5 | $ | 38.6 | ||||
| Current portion of long-term debt |
0.2 | 25.9 | ||||||
| Accounts payable |
101.0 | 143.8 | ||||||
| Accrued compensation |
18.9 | 21.5 | ||||||
| Accrued customer program liabilities |
74.6 | 86.8 | ||||||
| Accrued interest |
20.0 | 11.9 | ||||||
| Other current liabilities |
78.1 | 120.2 | ||||||
| Liabilities of discontinued operations held for sale |
5.6 | 15.1 | ||||||
| Total current liabilities |
298.9 | 463.8 | ||||||
| Long-term debt |
725.1 | 644.2 | ||||||
| Deferred income taxes |
86.6 | 42.8 | ||||||
| Pension and post retirement benefit obligations |
94.6 | 88.7 | ||||||
| Other non-current liabilities |
18.8 | 44.2 | ||||||
| Liabilities of discontinued operations held for sale |
— | 1.9 | ||||||
| Total liabilities |
1,224.0 | 1,285.6 | ||||||
| Commitments and contingencies—Note 16 |
||||||||
| Stockholders’ equity (deficit): |
||||||||
| Preferred stock, $0.01 par value, 25,000,000 shares authorized; none issued and outstanding |
— | — | ||||||
| Common stock, $0.01 par value, 200,000,000 shares authorized; 54,719,296 and 54,382,762 shares issued and 54,572,191 and 54,335,506 outstanding at December 31, 2009 and 2008, respectively |
0.5 | 0.6 | ||||||
| Treasury stock, 147,105 and 47,256 shares at December 31, 2009 and 2008, respectively |
(1.4 | ) | (1.1 | ) | ||||
| Paid-in capital |
1,397.0 | 1,394.8 | ||||||
| Accumulated other comprehensive loss |
(107.0 | ) | (117.5 | ) | ||||
| Accumulated deficit |
(1,406.3 | ) | (1,280.2 | ) | ||||
| Total stockholders’ equity (deficit) |
(117.2 | ) | (3.4 | ) | ||||
| Total liabilities and stockholders’ equity (deficit) |
$ | 1,106.8 | $ | 1,282.2 | ||||
See notes to consolidated financial statements.
51
Table of Contents
ACCO Brands Corporation and Subsidiaries
Consolidated Statements of Operations
| Year Ended December 31, | ||||||||||||
| (in millions of dollars, except per share data) | 2009 | 2008 | 2007 | |||||||||
| Net sales |
$ | 1,272.5 | $ | 1,578.2 | $ | 1,834.8 | ||||||
| Cost of products sold |
893.2 | 1,094.4 | 1,262.3 | |||||||||
| Gross profit |
379.3 | 483.8 | 572.5 | |||||||||
| Operating costs and expenses: |
||||||||||||
| Advertising, selling, general and administrative expenses |
273.1 | 379.0 | 433.5 | |||||||||
| Amortization of intangibles |
7.2 | 7.7 | 7.9 | |||||||||
| Restructuring charges |
17.4 | 28.8 | 21.0 | |||||||||
| Goodwill and asset impairment charges |
1.8 | 274.4 | 2.3 | |||||||||
| Total operating costs and expenses |
299.5 | 689.9 | 464.7 | |||||||||
| Operating income (loss) |
79.8 | (206.1 | ) | 107.8 | ||||||||
| Non-operating expense (income) |
||||||||||||
| Interest expense, net |
67.0 | 63.7 | 64.1 | |||||||||
| Equity in earnings of joint ventures |
(4.4 | ) | (6.5 | ) | (6.8 | ) | ||||||
| Other (income) expense, net |
5.1 | (17.2 | ) | (0.1 | ) | |||||||
| Income (loss) from continuing operations before income taxes |
12.1 | (246.1 | ) | 50.6 | ||||||||
| Income tax expense |
127.9 | 16.9 | 16.6 | |||||||||
| Income (loss) from continuing operations |
(115.8 | ) | (263.0 | ) | 34.0 | |||||||
| Loss from discontinued operations, net of income taxes |
(10.3 | ) | (76.2 | ) | (34.9 | ) | ||||||
| Net loss |
$ | (126.1 | ) | $ | (339.2 | ) | $ | (0.9 | ) | |||
| Per share: |
||||||||||||
| Basic earnings (loss) per share: |
||||||||||||
| Income (loss) from continuing operations |
$ | (2.13 | ) | $ | (4.85 | ) | $ | 0.63 | ||||
| Loss from discontinued operations |
(0.19 | ) | (1.41 | ) | (0.65 | ) | ||||||
| Basic loss per share |
$ | (2.32 | ) | $ | (6.26 | ) | $ | (0.02 | ) | |||
| Diluted earnings (loss) per share: |
||||||||||||
| Income (loss) from continuing operations |
$ | (2.13 | ) | $ | (4.85 | ) | $ | 0.62 | ||||
| Loss from discontinued operations |
(0.19 | ) | (1.41 | ) | (0.63 | ) | ||||||
| Diluted loss per share |
$ | (2.32 | ) | $ | (6.26 | ) | $ | (0.02 | ) | |||
| Weighted average number of shares outstanding: |
||||||||||||
| Basic |
54.5 | 54.2 | 54.0 | |||||||||
| Diluted |
54.5 | 54.2 | 55.0 | |||||||||
See notes to consolidated financial statements.
52
Table of Contents
ACCO Brands Corporation and Subsidiaries
Consolidated Statements of Cash Flows
| Year Ended December 31, | ||||||||||||
| (in millions of dollars) | 2009 | 2008 | 2007 | |||||||||
| Operating activities |
||||||||||||
| Net income (loss) from continuing operations |
$ | (115.8 | ) | $ | (263.0 | ) | $ | 34.0 | ||||
| Net loss from discontinued operations |
(10.3 | ) | (76.2 | ) | (34.9 | ) | ||||||
| Deferred income tax (benefit) provision |
112.7 | (26.9 | ) | (13.3 | ) | |||||||
| (Gain) loss on sale of assets |
0.8 | (6.0 | ) | 1.2 | ||||||||
| Depreciation |
32.1 | 33.9 | 34.1 | |||||||||
| Goodwill and asset impairment charges and other non-cash charges |
6.3 | 361.5 | 36.4 | |||||||||
| Amortization of debt issuance costs/bond discount |
6.5 | 5.9 | 4.4 | |||||||||
| Amortization of intangibles |
7.2 | 8.9 | 10.4 | |||||||||
| Stock based compensation |
3.0 | 5.5 | 11.4 | |||||||||
| (Gain) loss on retirement of bank debt |
4.0 | (19.0 | ) | — | ||||||||
| Changes in balance sheet items: |
||||||||||||
| Accounts receivable |
41.5 | 80.8 | 21.9 | |||||||||
| Inventories |
78.7 | (8.4 | ) | (15.6 | ) | |||||||
| Other assets |
10.2 | 1.5 | 2.7 | |||||||||
| Accounts payable |
(54.9 | ) | (36.9 | ) | 8.9 | |||||||
| Accrued expenses and other liabilities |
(37.5 | ) | (36.8 | ) | (27.3 | ) | ||||||
| Accrued taxes |
(8.8 | ) | 9.5 | 12.4 | ||||||||
| Other operating activities, net |
(4.2 | ) | 2.9 | (5.5 | ) | |||||||
| Net cash provided by operating activities |
71.5 | 37.2 | 81.2 | |||||||||
| Investing activities |
||||||||||||
| Additions to property, plant and equipment |
(10.3 | ) | (43.5 | ) | (59.1 | ) | ||||||
| Assets acquired |
(3.4 | ) | — | — | ||||||||
| Proceeds from sale of discontinued operations |
9.2 | — | — | |||||||||
| Proceeds from the disposition of assets |
0.6 | 24.8 | 3.9 | |||||||||
| Net cash used by investing activities |
(3.9 | ) | (18.7 | ) | (55.2 | ) | ||||||
| Financing activities |
||||||||||||
| Proceeds from long-term borrowings |
469.3 | — | — | |||||||||
| Repayments of long-term debt |
(397.9 | ) | (63.1 | ) | (40.5 | ) | ||||||
| Borrowings (repayments) of short-term debt, net |
(54.2 | ) | 32.0 | 0.8 | ||||||||
| Payment of Euro debt hedge |
(40.8 | ) | — | — | ||||||||
| Cost of debt issuance |
(20.6 | ) | — | — | ||||||||
| Cost of debt amendments |
— | (6.9 | ) | — | ||||||||
| Exercise of stock options and other |
(0.3 | ) | 0.3 | 4.3 | ||||||||
| Net cash used by financing activities |
(44.5 | ) | (37.7 | ) | (35.4 | ) | ||||||
| Effect of foreign exchange rate changes on cash |
2.4 | (5.0 | ) | 1.7 | ||||||||
| Net increase (decrease) in cash and cash equivalents |
25.5 | (24.2 | ) | (7.7 | ) | |||||||
| Cash and cash equivalents |
||||||||||||
| Beginning of year |
18.1 | 42.3 | 50.0 | |||||||||
| End of period |
$ | 43.6 | $ | 18.1 | $ | 42.3 | ||||||
| Cash paid during the year for: |
||||||||||||
| Interest |
$ | 54.4 | $ | 58.9 | $ | 60.3 | ||||||
| Income taxes |
$ | 19.7 | $ | 22.2 | $ | 17.4 | ||||||
See notes to consolidated financial statements.
53
Table of Contents
ACCO Brands Corporation and Subsidiaries
Consolidated Statements of Stockholders’ Equity (Deficit) and Comprehensive Income (Loss)
| (in millions of dollars) | Common Stock |
Paid-in Capital |
Accumulated Other Comprehensive Income (Loss) |
Treasury Stock |
Accumulated Deficit |
Total | Comprehensive Income/(Loss) |
|||||||||||||||||||||
| Balance at December 31, 2006 |
$ | 0.6 | $ | 1,374.6 | $ | (50.1 | ) | $ | (1.1 | ) | $ | (940.0 | ) | $ | 384.0 | |||||||||||||
| Net loss |
— | — | — | — | (0.9 | ) | (0.9 | ) | $ | (0.9 | ) | |||||||||||||||||
| Loss on derivative financial instruments, net of tax |
— | — | (2.2 | ) | — | — | (2.2 | ) | (2.2 | ) | ||||||||||||||||||
| Translation impact, net of tax |
— | — | 16.2 | — | — | 16.2 | 16.2 | |||||||||||||||||||||
| Pension and postretirement adjustment, net of tax |
— | — | 26.9 | — | — | 26.9 | 26.9 | |||||||||||||||||||||
| Total comprehensive income |
$ | 40.0 | ||||||||||||||||||||||||||
| Stock issuances—stock options and restricted stock units |
— | 4.3 | — | — | — | 4.3 | ||||||||||||||||||||||
| Stock-based compensation |
— | 11.4 | — | — | — | 11.4 | ||||||||||||||||||||||
| Other |
— | (1.4 | ) | — | — | — | (1.4 | ) | ||||||||||||||||||||
| Balance at December 31, 2007 |
0.6 | 1,388.9 | (9.2 | ) | (1.1 | ) | (940.9 | ) | 438.3 | |||||||||||||||||||
| Net loss |
— | — | — | — | (339.2 | ) | (339.2 | ) | $ | (339.2 | ) | |||||||||||||||||
| Income on derivative financial instruments, net of tax |
— | — | 3.9 | — | — | 3.9 | 3.9 | |||||||||||||||||||||
| Translation impact, net of tax |
— | — | (59.3 | ) | — | — | (59.3 | ) | (59.3 | ) | ||||||||||||||||||
| Pension and postretirement adjustment, net of tax |
— | — | (52.9 | ) | — | (0.1 | ) | (53.0 | ) | (53.0 | ) | |||||||||||||||||
| Total comprehensive loss |
$ | (447.6 | ) | |||||||||||||||||||||||||
| Stock issuances—stock options and restricted stock units |
— | 0.3 | — | — | — | 0.3 | ||||||||||||||||||||||
| Stock-based compensation |
— | 5.5 | — | — | — | 5.5 | ||||||||||||||||||||||
| Other |
— | 0.1 | — | — | — | 0.1 | ||||||||||||||||||||||
| Balance at December 31, 2008 |
0.6 | 1,394.8 | (117.5 | ) | (1.1 | ) | (1,280.2 | ) | (3.4 | ) | ||||||||||||||||||
| Net loss |
— | — | — | — | (126.1 | ) | (126.1 | ) | $ | (126.1 | ) | |||||||||||||||||
| Loss on derivative financial instruments, net of tax |
— | — | (3.3 | ) | — | — | (3.3 | ) | (3.3 | ) | ||||||||||||||||||
| Translation impact, net of tax |
— | — | 26.7 | — | — | 26.7 | 26.7 | |||||||||||||||||||||
| Pension and postretirement adjustment, net of tax |
— | — | (12.9 | ) | — | — | (12.9 | ) | (12.9 | ) | ||||||||||||||||||
| Total comprehensive loss |
$ | (115.6 | ) | |||||||||||||||||||||||||
| Tax withheld in restricted stock vesting |
— | — | — | (0.3 | ) | — | (0.3 | ) | ||||||||||||||||||||
| Stock-based compensation |
— | 3.0 | — | — | — | 3.0 | ||||||||||||||||||||||
| Other |
(0.1 | ) | (0.8 | ) | — | — | — | (0.9 | ) | |||||||||||||||||||
| Balance at December 31, 2009 |
$ | 0.5 | $ | 1,397.0 | $ | (107.0 | ) | $ | (1.4 | ) | $ | (1,406.3 | ) | $ | (117.2 | ) | ||||||||||||
Shares of Capital Stock
| Common Stock |
Treasury Stock |
Net Shares | |||||
| Shares at December 31, 2006 |
53,815,985 | (44,464 | ) | 53,771,521 | |||
| Stock issuances—stock options and restricted stock units |
331,912 | (2,722 | ) | 329,190 | |||
| Shares at December 31, 2007 |
54,147,897 | (47,186 | ) | 54,100,711 | |||
| Stock issuances—stock options and restricted stock units |
234,865 | (70 | ) | 234,795 | |||
| Shares at December 31, 2008 |
54,382,762 | (47,256 | ) | 54,335,506 | |||
| Stock issuances—stock options, stock-settled appreciation rights and restricted stock units |
336,534 | (99,849 | ) | 236,685 | |||
| Shares at December 31, 2009 |
54,719,296 | (147,105 | ) | 54,572,191 | |||
See notes to consolidated financial statements.
54
Table of Contents
ACCO Brands Corporation and Subsidiaries
Notes to Consolidated Financial Statements
1. Basis of Presentation
The management of ACCO Brands Corporation is responsible for the accuracy and internal consistency of the preparation of the consolidated financial statements and notes contained in this annual report.
The consolidated financial statements include the accounts of ACCO Brands Corporation and its domestic and international subsidiaries. Intercompany accounts and transactions have been eliminated in consolidation. Our investments in companies that are between 20% to 50% owned are accounted for as equity investments. ACCO Brands has equity investments in the following joint ventures: Pelikan-Artline Pty Ltd (“Pelikan-Artline”)—50% ownership; and Neschen/GBC Graphic Films (“Neschen”)—50% ownership. The Company’s share of earnings from equity investments is included on the line entitled “Equity in earnings of joint ventures” in the consolidated statements of operations. Companies in which our investment exceeds 50% have been consolidated.
The Company’s former commercial print finishing business is reported in discontinued operations in the consolidated financial statements and related notes for all periods presented in this Annual Report on Form 10-K. Additional information regarding discontinued operations is discussed in Note 10.
The Company has revised the format of its Consolidated Statements of Operations in order to provide better insight into its results of operations and to align its presentation to certain industry competitors. As a result, we have now added a gross profit subtotal line item within our Consolidated Statements of Operations. In addition, certain other reclassifications were made to conform prior years financial statements to the current presentation.
2. Significant Accounting Policies
Nature of Business
ACCO Brands is primarily involved in the manufacturing, marketing and distribution of office products—including traditional and computer-related office products, supplies, binding and laminating equipment and related consumable supplies, personal computer accessory products, paper-based time management products and presentation aids and products—selling primarily to large resellers. The Company’s subsidiaries operate principally in the United States, Australia, the United Kingdom and Canada.
Use of Estimates
The preparation of financial statements in conformity with accounting principles generally accepted in the United States of America requires management to make estimates and assumptions that affect the reported amounts of assets and liabilities and the disclosure of contingent assets and liabilities at the date of the financial statements, and the reported amounts of revenues and expenses during the reporting period. Actual results could differ from these estimates.
Cash and Cash Equivalents
Highly liquid investments with an original maturity of three months or less are included in cash and cash equivalents.
Allowances for Doubtful Accounts, Discounts and Returns
Trade receivables are stated net of discounts, allowances for doubtful accounts and allowance for returns. The allowance for doubtful accounts represents estimated uncollectible receivables associated with potential
55
Table of Contents
ACCO Brands Corporation and Subsidiaries
Notes to Consolidated Financial Statements (Continued)
2. Significant Accounting Policies (Continued)
customer non-payment on contractual obligations, usually due to customers’ potential insolvency. The allowances include amounts for certain customers where a risk of non-payment has been specifically identified. In addition, the allowances include a provision for customer non-payment on a general formula basis when it is determined the risk of some non-payment is probable and estimable, but cannot yet be associated with specific customers. The assessment of the likelihood of customer non-payment is based on various factors, including the length of time the receivables are past due, historical experience and existing economic conditions.
The allowance for sales returns represents estimated uncollectible receivables associated with the potential return of products previously sold to customers, and is recorded at the time that the sales are recognized. The allowance includes a general provision for product returns based on historical trends. In addition, the allowance includes a reserve for currently authorized customer returns that are considered to be abnormal in comparison to the historical basis.
Inventories
Inventories are priced at the lower of cost (principally first-in, first-out) or market. A reserve is established to adjust the cost of inventory to its net realizable value. Inventory reserves are recorded for obsolete or slow-moving inventory based on assumptions about future demand and marketability of products, the impact of new product introductions and specific identification of items, such as product discontinuance or engineering/material changes. These estimates could vary significantly, either favorably or unfavorably, from actual requirements if future economic conditions, customer inventory levels or competitive conditions differ from expectations.
Property, Plant and Equipment
Property, plant and equipment are carried at cost. Depreciation is provided, principally on a straight-line basis, over the estimated useful lives of the assets. Gains or losses resulting from dispositions are included in operating income. Betterments and renewals that improve and extend the life of an asset are capitalized; maintenance and repair costs are expensed. Purchased computer software is capitalized and amortized over the software’s useful life. The following table shows estimated useful lives of property, plant and equipment:
| Buildings |
40 to 50 years | |
| Leasehold improvements |
Lesser of lease term or 10 years | |
| Machinery, equipment and furniture |
3 to 10 years |
Long-Lived Assets
We test long-lived assets for impairment whenever events or changes in circumstances indicate that the assets’ carrying amount is not recoverable from its undiscounted cash flows. When such events occur, the Company compares the sum of the undiscounted cash flows expected to result from the use and eventual disposition of the asset or asset group to the carrying amount of a long-lived asset or asset group. If this comparison indicates that there is an impairment, the amount of the impairment is typically calculated using discounted expected future cash flows. The discount rate applied to these cash flows is based on the Company’s weighted average cost of capital, computed by selecting market rates at the valuation dates for debt and equity that are reflective of the risks associated with an investment in the Company’s industry as estimated by using comparable publicly traded companies.
56
Table of Contents
ACCO Brands Corporation and Subsidiaries
Notes to Consolidated Financial Statements (Continued)
2. Significant Accounting Policies (Continued)
Intangible Assets
Intangible assets are comprised primarily of indefinite-lived intangible assets acquired and purchased intangible assets arising from the application of purchase accounting to the merger with GBC. Indefinite-lived intangible assets are not amortized, but are evaluated annually to determine whether the indefinite useful life is appropriate. Indefinite-lived intangibles are tested for impairment on an annual basis and written down where impaired. Certain of the Company’s trade names have been assigned an indefinite life as these trade names are currently anticipated to contribute cash flows to the Company indefinitely.
The Company reviews indefinite-lived intangibles for impairment annually, and whenever market or business events indicate there may be a potential impact on a particular intangible. The Company considers the implications of both external (e.g., market growth, pricing, competition, and technology) and internal factors (e.g., product costs, margins, support expenses, capital investment) and their potential impact on cash flows for each business in both the near and long term, as well as their impact on any identifiable intangible asset associated with the business. Based on recent business results, consideration of significant external and internal factors, and the resulting business projections, indefinite lived intangible assets are reviewed to determine whether they are likely to remain indefinite lived, or whether a finite life is more appropriate. Finite lived intangibles are amortized over 15, 23 or 30 years.
Goodwill
Goodwill has been recorded on the Company’s balance sheet related to the merger with GBC and represents the excess of the cost of the acquisition when compared to the fair value of the net assets acquired on August 17, 2005 (the acquisition date). The Company tests goodwill for impairment at least annually, normally in the second quarter and on an interim basis if an event or circumstance indicates that it is more likely than not that an impairment loss has been incurred. Recoverability of goodwill is evaluated using a two-step process. In the first step, the fair value of a reporting unit is compared to its carrying value. If the fair value of a reporting unit exceeds the carrying value of the net assets assigned to a reporting unit, goodwill is considered not impaired and no further testing is required. If the carrying value of the net assets assigned to a reporting unit exceeds the fair value of a reporting unit, the second step of the impairment test is performed in order to determine the implied fair value of a reporting unit’s goodwill. Determining the implied fair value of goodwill requires valuation of a reporting unit’s tangible and intangible assets and liabilities in a manner similar to the allocation of purchase price in a business combination. If the carrying value of a reporting unit’s goodwill exceeds its implied fair value, goodwill is deemed impaired and is written down to the extent of the difference. Similar to the review for impairment of other long-lived assets, the resulting fair value determination is significantly impacted by estimates of future sales for the Company’s products, capital needs, economic trends and other factors.
Employee Benefit Plans
The Company and its subsidiaries provide a range of benefits to their employees and retired employees, including pension, postretirement, post-employment and health care benefits. The Company records annual amounts relating to these plans based on calculations, which include various actuarial assumptions, including discount rates, assumed rates of return on plan assets, compensation increases, turnover rates and health care cost trend rates. The Company reviews its actuarial assumptions on an annual basis and makes modifications to the assumptions based on current rates and trends when it is deemed appropriate to do so. The effect of the modifications are generally recorded and amortized over future periods.
57
Table of Contents
ACCO Brands Corporation and Subsidiaries
Notes to Consolidated Financial Statements (Continued)
2. Significant Accounting Policies (Continued)
Income Taxes
Deferred tax liabilities or assets are established for temporary differences between financial and tax reporting bases and are subsequently adjusted to reflect changes in tax rates expected to be in effect when the temporary differences reverse. A valuation allowance is recorded to reduce deferred tax assets to an amount that is more likely than not to be realized.
The amount of income taxes that we pay is subject to ongoing audits by federal, state and foreign tax authorities. Our estimate of the potential outcome of any uncertain tax position is subject to management’s assessment of relevant risks, facts and circumstances existing at that time. We believe that we have adequately provided for our best estimate of the expected outcomes related to these matters. However, our future results may include favorable or unfavorable adjustments to our estimated tax liabilities in the period the assessments are revised or resolved.
Revenue Recognition
We recognize revenue from product sales when earned, net of applicable provisions for discounts, return and allowances. We consider revenue to be realized or realizable and earned when all of the following criteria are met: title and risk of loss have passed to the customer, persuasive evidence of an arrangement exists, delivery has occurred, the price is fixed or determinable and collectability is reasonably assured. We also provide for our estimate of potential bad debt at the time of revenue recognition.
Cost of Products Sold
Cost of products sold includes all manufacturing, product sourcing and distribution costs, including depreciation related to assets used in the manufacturing and distribution process, inbound and outbound freight, shipping and handling costs, purchasing costs associated with materials and packaging used in the production processes.
Advertising, Selling, General and Administrative Expenses
Advertising, selling, general and administrative expenses include advertising, marketing, selling (including commissions), research and development, customer service, depreciation related to assets outside the manufacturing and distribution processes and all other general and administrative expenses outside the manufacturing and distribution functions (e.g., finance, human resources, information technology, etc.).
Customer Program Costs
Customer program costs include, but are not limited to, sales rebates which are generally tied to achievement of certain sales volume levels, in-store promotional allowances, shared media and customer catalog allowances and other cooperative advertising arrangements, and freight allowance programs. The Company generally recognizes customer program costs as a deduction to gross sales at the time that the associated revenue is recognized. Certain customer incentives that do not directly relate to future revenues are expensed when initiated.
In addition, “accrued customer programs” principally include, but are not limited to, sales volume rebates, promotional allowances, shared media and customer catalog allowances and other cooperative advertising arrangements, and freight allowances as discussed above.
58
Table of Contents
ACCO Brands Corporation and Subsidiaries
Notes to Consolidated Financial Statements (Continued)
2. Significant Accounting Policies (Continued)
Shipping and Handling
The Company reflects all amounts billed to customers for shipping and handling in net sales and the costs incurred from shipping and handling product (including costs to ship and move product from the seller’s place of business to the buyer’s place of business, as well as costs to store, move and prepare products for shipment) in cost of products sold.
Warranty Reserves
The Company offers its customers various warranty terms based on the type of product that is sold. Estimated future obligations related to products sold under these warranty terms are provided by charges to operations in the period in which the related revenue is recognized.
Advertising Costs
Advertising costs amounted to $89.9 million, $143.9 million and $149.2 million for the years ended December 31, 2009, 2008 and 2007, respectively. These costs include, but are not limited to, cooperative advertising and promotional allowances as described in “Customer Program Costs” above, and are principally expensed as incurred.
Research and Development
Research and development expenses, which amounted to $18.6 million, $22.3 million and $28.0 million for the years ended December 31, 2009, 2008 and 2007, respectively, are classified as general and administrative expenses and are charged to expense as incurred.
Stock-Based Compensation
Our primary types of share-based compensation consist of stock options, stock-settled appreciation rights, restricted stock unit awards, and performance stock unit awards. Stock-based compensation cost is measured at the grant date, based on the fair value of the award, and is recognized as expense over the requisite service period. Where awards are made with non-substantive vesting periods (for example, where a portion of the award vests upon retirement eligibility), we estimate and recognize expense based on the period from the grant date to the date on which the employee is retirement eligible.
Foreign Currency Translation
Foreign currency balance sheet accounts are translated into U.S. dollars at the rates of exchange at the balance sheet date. Income and expenses are translated at the average rates of exchange in effect during the period. The related translation adjustments are made directly to a separate component of the Accumulated Other Comprehensive Income (Loss) caption in stockholders’ equity. Some transactions are made in currencies different from an entity’s functional currency. Gain and losses on these foreign currency transactions are included in income as they occur.
59
Table of Contents
ACCO Brands Corporation and Subsidiaries
Notes to Consolidated Financial Statements (Continued)
2. Significant Accounting Policies (Continued)
Derivative Financial Instruments
The Company recognizes all derivatives as either assets or liabilities on the balance sheet and measures those instruments at fair value. If the derivative is designated as a fair value hedge and is effective, the changes in the fair value of the derivative and of the hedged item attributable to the hedged risk are recognized in earnings in the same period. If the derivative is designated as a cash flow hedge, the effective portions of changes in the fair value of the derivative are recorded in other comprehensive income and are recognized in the income statement when the hedged item affects earnings. Ineffective portions of changes in the fair value of cash flow hedges are recognized in earnings.
Certain forecasted transactions, assets and liabilities are exposed to foreign currency risk. The Company continually monitors its foreign currency exposures in order to maximize the overall effectiveness of its foreign currency hedge positions. Principal currencies hedged include the U.S. dollar, Euro and Pound sterling.
Recent Accounting Pronouncements
In December 2007, the Financial Accounting Standards Board (“FASB”) revised the authoritative guidance for business combinations, which establishes the principles and requirements for how an acquirer (i) recognizes and measures in its financial statements the identifiable assets acquired, the liabilities assumed, and any noncontrolling interest in the acquiree; (ii) recognizes and measures the goodwill acquired in the business combination or a gain from a bargain purchase; and (iii) determines what information to disclose to enable users of the financial statements to evaluate the nature and financial effects of the business combination. The guidance makes significant changes to existing accounting practices for acquisitions, including the requirement to expense transaction costs and to reflect the fair value of contingent purchase price adjustments at the date of acquisition. In April 2009, the FASB issued authoritative guidance which amends and clarifies the initial recognition and measurement, subsequent measurement and accounting and disclosure of assets and liabilities arising from contingencies in a business combination. This guidance applies prospectively to business combinations for which the acquisition date is on or after January 1, 2009. As the Company has not made any acquisitions in fiscal 2009, the guidance adopted by the Company on January 1, 2009 did not impact the Company’s consolidated financial statements.
In December 2007, the FASB issued authoritative guidance which establishes new accounting and reporting standards for the noncontrolling interest in a subsidiary and for the deconsolidation of a subsidiary. The Company adopted this guidance beginning January 1, 2009. As the Company has no significant noncontrolling interests this guidance had no material impact on the Company’s consolidated financial statements.
In February 2008, the FASB issued authoritative guidance, which delayed for one year the effective date of the authoritative guidance for fair value measurements for all nonfinancial assets and nonfinancial liabilities, except those that are recognized or disclosed at fair value in the financial statements on a recurring basis, until periods beginning January 1, 2009. On January 1, 2009, the Company adopted the authoritative guidance for fair value measurements for nonfinancial assets and nonfinancial liabilities that are required to be measured at fair value. The adoption did not impact the Company’s consolidated financial statements.
In March 2008, the FASB issued authoritative guidance which is intended to improve the financial reporting about derivative instruments and hedging activities. This guidance requires entities to provide enhanced disclosures addressing how and why an entity uses derivative instruments, how derivative instruments and related hedged items are accounted for, and how derivative instruments and related hedged items affect an
60
Table of Contents
ACCO Brands Corporation and Subsidiaries
Notes to Consolidated Financial Statements (Continued)
2. Significant Accounting Policies (Continued)
entity’s financial position, financial performance, and cash flows. The guidance is effective for fiscal years beginning after November 15, 2008. The Company has provided the required disclosures in Note 12, Derivative Financial Instruments.
In December 2008, the FASB issued authoritative guidance on an employer’s disclosures about plan assets of a defined benefit pension or other postretirement plan. This guidance is effective for fiscal years ending after December 15, 2009. The Company has provided the required disclosures in Note 4, Pensions and Other Retiree Benefits.
In April 2009, the FASB issued authoritative guidance that requires fair value disclosures in both interim as well as annual financial statements in order to provide more timely information about the effects of current market conditions on financial instruments. The Company adopted this guidance in the second quarter of 2009, the impact of which related only to disclosures of the Company’s debt and did not have a material impact on the Company’s consolidated financial statements. See Note 13, Fair Value of Financial Instruments.
In May 2009, the FASB issued authoritative guidance which establishes general standards of accounting for, and disclosures of, events that occur after the balance sheet date but before financial statements are issued or are available to be issued. It requires disclosure of the date through which an entity has evaluated subsequent events. The Company adopted this guidance in the second quarter of 2009 and its adoption did not impact the Company’s consolidated financial statements.
In June 2009, the FASB issued the Accounting Standards Codification (the “Codification”) to become the single official source of authoritative, nongovernmental U.S. generally accepted accounting principles (GAAP). The Codification did not change GAAP but reorganizes the literature. The Codification is to be applied for financial statements issued for interim and annual periods ending after September 15, 2009. The Company adopted this guidance in the third quarter of 2009 and its adoption did not impact the Company’s consolidated financial statements.
3. Stock-Based Compensation
The Company has two share-based compensation plans: (i) the Amended and Restated ACCO Brands Corporation 2005 Incentive Plan (“Restated LTIP”); and (ii) Sub-Plan A of the Assumed Plan (“Sub-Plan A”).
Restated LTIP—Under the terms of the Restated LTIP, the number of shares of the Company’s common stock reserved for issuance in respect of stock-based awards to its key employees and non-employee directors is 6,703,000.
Sub-Plan A—As part of the acquisition and merger with GBC, options and restricted stock units held by former GBC employees were converted to similar instruments in ACCO Brands stock on a one-for-one basis at the time of the merger. Restricted stock units that had been previously awarded to GBC employees that did not convert to the right to receive common stock of the Company upon completion of the merger in accordance with the terms of such awards were converted to similar ACCO Brands restricted stock units on a one-for-one basis. The converted options and restricted stock units are now subject to the terms of Sub-Plan A. No additional awards may be made under Sub-Plan A.
61
Table of Contents
ACCO Brands Corporation and Subsidiaries
Notes to Consolidated Financial Statements (Continued)
3. Stock-Based Compensation (Continued)
The following table summarizes the impact of all stock-based compensation from continuing operations on the Company’s consolidated statements of operations for the years ended December 31, 2009, 2008 and 2007.
| (in millions of dollars) | 2009 | 2008 | 2007 | ||||||
| Advertising, selling, general and administrative expense |
$ | 2.8 | $ | 5.3 | $ | 11.1 | |||
| Restructuring charges |
0.2 | 0.1 | — | ||||||
| Income from continuing operations before income taxes |
$ | 3.0 | $ | 5.4 | $ | 11.1 | |||
There was no capitalization of stock based compensation expense.
Stock-based compensation by award type (including stock options, stock-settled appreciation rights (“SSARs”), restricted stock units (“RSUs”) and performance stock units (“PSUs”)) for the years ended December 31, 2009, 2008 and 2007 are as follows:
| (in millions of dollars) | 2009 | 2008 | 2007 | |||||||
| Stock option compensation expense |
$ | 0.8 | $ | 3.8 | $ | 6.3 | ||||
| SSAR compensation expense |
0.2 | — | — | |||||||
| RSU compensation expense |
1.8 | 4.0 | 4.0 | |||||||
| PSU compensation expense (income) |
0.2 | (2.3 | ) | 1.1 | ||||||
| Subtotal |
3.0 | 5.5 | 11.4 | |||||||
| Less discontinued operations |
— | 0.1 | 0.3 | |||||||
| Total stock-based compensation from continuing operations |
$ | 3.0 | $ | 5.4 | $ | 11.1 | ||||
Stock Options and SSAR Awards
The exercise price of each stock option and SSAR equals or exceeds the market price of the Company’s stock on the date of grant. Options/SSARs can generally be exercised over a maximum term of up to seven years. The vesting period of stock options/SSARs outstanding as of December 31, 2009 generally vest ratably over three years. For options granted to retirement eligible employees (age 55 with at least 5 years of service) the value of the stock option is recognized immediately on the date of grant. During 2009, the Company granted only SSAR awards. The fair value of each option/SSAR grant is estimated on the date of grant using the Black-Scholes option-pricing model using the weighted average assumptions as outlined in the following table:
| Year Ended December 31, | ||||||||||||
| 2009 | 2008 | 2007 | ||||||||||
| Weighted average expected lives |
4.5 years | 4.7 years | 4.5 years | |||||||||
| Weighted average risk-free interest rate |
2.1 | % | 2.3 | % | 4.4 | % | ||||||
| Weighted average expected volatility |
41.5 | % | 34.6 | % | 32.6 | % | ||||||
| Expected dividend yield |
0.0 | % | 0.0 | % | 0.0 | % | ||||||
| Weighted average grant date fair value |
$ | 0.24 | $ | 3.57 | $ | 7.46 | ||||||
The Company has utilized historical volatility for a pool of peer companies for a period of time that is comparable to the expected life of the option/SSAR to determine volatility assumptions. The risk-free interest rate assumption is based upon the average daily closing rates during the quarter for U.S. treasury notes that have a life which approximates the expected life of the option/SSAR. The dividend yield assumption is based on the
62
Table of Contents
ACCO Brands Corporation and Subsidiaries
Notes to Consolidated Financial Statements (Continued)
3. Stock-Based Compensation (Continued)
Company’s expectation of dividend payouts. The expected life of employee stock options/SSARs represents the weighted-average period the stock options/SSARs are expected to remain outstanding. The weighted average expected lives reflects the application of the simplified method.
A summary of the changes in stock options/SSARs outstanding under the Company’s stock compensation plans during the year ended December 31, 2009 is presented below:
| Number Outstanding |
Weighted Average Exercise Price |
Weighted Average Remaining Contractual Term |
Aggregate Intrinsic Value | ||||||||
| Outstanding at December 31, 2008 |
4,500,839 | $ | 17.89 | ||||||||
| Granted |
3,050,000 | $ | 0.90 | ||||||||
| Exercised |
— | $ | — | ||||||||
| Lapsed |
(541,828 | ) | $ | 14.61 | |||||||
| Outstanding at December 31, 2009 |
7,009,011 | $ | 10.75 | 4.9 years | $ | 19.1 million | |||||
| Exercisable shares at December 31, 2009 |
3,741.406 | $ | 18.24 | 3.8 years | $ | 0.2 million | |||||
| Options/SSARs vested or expected to vest |
6,818,662 | $ | 10.94 | 4.8 years | $ | 18.2 million | |||||
The Company received cash of $0.0 million, $0.3 million and $4.3 million from the exercise of stock options for the years ended December 31, 2009, 2008 and 2007, respectively. There were no SSARs that were exercised or vested for the years ended December 31, 2009, 2008 and 2007. The aggregate intrinsic values of the options exercised during the years ended December 31, 2009, 2008 and 2007, respectively, totaled $0.0 million, $0.1 million and $2.7 million, respectively and the fair value of options vested was $1.7 million, $6.0 million and $9.4 million, respectively. As of December 31, 2009, the Company had $1.1 million of total unrecognized compensation expense related to stock options/SSARs that will be recognized over a weighted average period of 1.0 year.
Stock Unit Awards
The Restated LTIP provides for stock based awards in the form of RSUs, PSUs, incentive and non-qualified stock options, and stock appreciation rights, any of which may be granted alone or with other types of awards and dividend equivalents. RSUs vest over a pre-determined period of time, generally three to four years from the date of grant. PSUs also vest over a pre-determined period of time, presently three years, but are further subject to the achievement of certain business performance criteria in future periods. Based upon the level of achieved performance, the number of shares actually awarded can vary from 0% to 150% of the original grant. Beginning in 2007, the value of the PSU’s granted to retirement eligible employees is either recognized immediately upon the date of grant or through the date at which the employee reaches retirement eligibility.
There were 512,047 RSUs outstanding at December 31, 2009. All outstanding RSUs as of December 31, 2009 vest within four years of the date of grant. Also outstanding at December 31, 2009 were 722,077 PSUs. All outstanding PSUs as of December 31, 2009 vest at the end of their respective performance periods subject to achievement of the performance targets associated with such awards. Upon vesting, all of these awards will be converted into the right to receive one share of common stock of the Company for each unit that vests. The cost of these awards is determined using the fair value of the shares on the date of grant, and compensation expense is recognized over the period during which the employees provide the requisite service to the Company. The Company generally recognizes compensation expense for its PSU awards ratably over the performance period based on management’s judgment of the likelihood that performance measures will be attained. During 2008,
63
Table of Contents
ACCO Brands Corporation and Subsidiaries
Notes to Consolidated Financial Statements (Continued)
3. Stock-Based Compensation (Continued)
management determined that performance measures related to all of its outstanding PSUs were no longer attainable. As a result, during 2008, the Company reversed $2.3 million of previously recognized compensation expense. As of December 31, 2009, the Company had no outstanding PSU awards accrued. During the fourth quarter of 2008, the Company recognized approximately $1.0 million of compensation expense for PSU awards related to the Company’s former CEO. A summary of the changes in the stock unit awards outstanding under the Company’s equity compensation plans during 2009 is presented below:
| Stock Units |
Weighted Average Grant Date Fair Value | |||||
| Unvested at December 31, 2008 |
1,614,414 | $ | 14.84 | |||
| Granted |
17,686 | $ | 7.58 | |||
| Vested |
(215,862 | ) | $ | 20.85 | ||
| Forfeited |
(182,114 | ) | $ | 14.69 | ||
| Unvested at December 31, 2009 |
1,234,124 | $ | 13.72 | |||
The weighted-average grant date fair value of our stock unit awards was $7.58, $12.29, and $21.85 for the years ended December 31, 2009, 2008, and 2007, respectively. The fair value of stock unit awards that vested during the years ended December 31, 2009, 2008 and 2007 was $4.5 million, $6.2 million and $1.2 million, respectively. As of December 31, 2009, the Company had $3.0 million of total unrecognized compensation expense related to stock unit awards, which will be recognized over the weighted average period of 1.0 years. The Company will satisfy the requirement for delivering the common shares for stock-based plans by issuing new shares.
4. Pension and Other Retiree Benefits
The Company has a number of pension plans, principally in the United States and the United Kingdom. The plans provide for payment of retirement benefits, mainly commencing between the ages of 60 and 65, and also for payment of certain disability and severance benefits. After meeting certain qualifications, an employee acquires a vested right to future benefits. The benefits payable under the plans are generally determined on the basis of an employee’s length of service and earnings. Cash contributions to the plans are made as necessary to ensure legal funding requirements are satisfied.
The Company provides postretirement health care and life insurance benefits to certain employees and retirees in the United States and certain employee groups outside of the United States. These benefit plans have been frozen to new participants. Many employees and retirees outside of the United States are covered by government health care programs.
On January 20, 2009, the Company’s Board of Directors approved plan amendments to temporarily freeze the Company’s U.S. pension and non-qualified supplemental retirement plans effective March 7, 2009. No additional benefits will accrue under these plans after that date until further action by the Board of Directors. As a result, the Company recognized a curtailment gain of $1.0 million (pre-tax) during 2009, and its 2009 full year pension expense was reduced by $5.1 million. Further, the impact of the curtailment reduced the Company’s projected benefit obligation by $9.9 million.
During 2008, as a result of workforce reductions in the U.S., the Company experienced a pension curtailment. The impact of the curtailment reduced the Company’s projected benefit obligation by $1.6 million. The curtailment gain had minimal impact on 2008 pension expense.
64
Table of Contents
ACCO Brands Corporation and Subsidiaries
Notes to Consolidated Financial Statements (Continued)
4. Pension and Other Retiree Benefits (Continued)
The following table sets forth the Company’s defined benefit pension plans and other postretirement benefit plans funded status and the amounts recognized in the Company’s consolidated balance sheets.
| (in millions of dollars) | Pension Benefits | Postretirement | ||||||||||||||||||||||
| U.S. | International | |||||||||||||||||||||||
| 2009 | 2008 | 2009 | 2008 | 2009 | 2008 | |||||||||||||||||||
| Change in projected benefit obligation (PBO) |
||||||||||||||||||||||||
| Projected benefit obligation at beginning of year |
$ | 151.4 | $ | 139.2 | $ | 203.4 | $ | 302.7 | $ | 12.9 | $ | 16.7 | ||||||||||||
| Service cost |
1.3 | 4.7 | 2.4 | 3.9 | 0.1 | 0.2 | ||||||||||||||||||
| Interest cost |
9.1 | 8.9 | 13.7 | 16.2 | 0.8 | 1.0 | ||||||||||||||||||
| Actuarial (gain) loss |
10.5 | 7.5 | 40.9 | (40.1 | ) | (0.3 | ) | (2.5 | ) | |||||||||||||||
| Participants’ contributions |
— | — | 1.3 | 2.2 | 0.2 | 0.2 | ||||||||||||||||||
| Foreign exchange rate changes |
— | — | 21.7 | (69.1 | ) | 0.5 | (1.7 | ) | ||||||||||||||||
| Benefits paid |
(8.0 | ) | (7.5 | ) | (11.2 | ) | (16.2 | ) | (0.8 | ) | (1.1 | ) | ||||||||||||
| Curtailment gain |
(9.9 | ) | (1.5 | ) | (1.1 | ) | (0.9 | ) | — | — | ||||||||||||||
| Other items |
— | 0.1 | — | 4.7 | — | 0.1 | ||||||||||||||||||
| Projected benefit obligation at end of year |
154.4 | 151.4 | 271.1 | 203.4 | 13.4 | 12.9 | ||||||||||||||||||
| Change in plan assets |
||||||||||||||||||||||||
| Fair value of plan assets at beginning of year |
87.4 | 142.6 | 190.2 | 320.0 | — | — | ||||||||||||||||||
| Actual return on plan assets |
28.2 | (47.8 | ) | 27.6 | (55.4 | ) | — | — | ||||||||||||||||
| Employer contributions |
0.3 | 0.1 | 5.7 | 5.6 | 0.6 | 1.0 | ||||||||||||||||||
| Participants’ contributions |
— | — | 1.3 | 2.2 | 0.2 | 0.2 | ||||||||||||||||||
| Foreign exchange rate changes |
— | — | 20.9 | (70.6 | ) | — | — | |||||||||||||||||
| Other |
— | — | — | 4.6 | — | (0.1 | ) | |||||||||||||||||
| Benefits paid |
(8.0 | ) | (7.5 | ) | (11.2 | ) | (16.2 | ) | (0.8 | ) | (1.1 | ) | ||||||||||||
| Fair value of plan assets at end of year |
107.9 | 87.4 | 234.5 | 190.2 | — | — | ||||||||||||||||||
| Funded status (Fair value of plan assets less PBO) |
$ | (46.5 | ) | $ | (64.0 | ) | $ | (36.6 | ) | $ | (13.2 | ) | $ | (13.4 | ) | $ | (12.9 | ) | ||||||
| Amounts recognized in the consolidated balance sheet consist of: |
||||||||||||||||||||||||
| Prepaid pension benefit |
$ | — | $ | — | $ | — | $ | 0.6 | $ | — | $ | — | ||||||||||||
| Other current liabilities |
0.2 | 0.2 | 0.6 | 0.6 | 1.1 | 1.2 | ||||||||||||||||||
| Accrued benefit liability |
46.3 | 63.8 | 36.0 | 13.2 | 12.3 | 11.7 | ||||||||||||||||||
| Components of Accumulated Other Comprehensive Income, net of tax: |
||||||||||||||||||||||||
| Unrecognized prior service cost (benefit) |
— | (0.1 | ) | 0.5 | 0.7 | (0.1 | ) | (0.1 | ) | |||||||||||||||
| Unrecognized actuarial (gain) loss |
40.2 | 49.3 | 56.6 | 34.7 | (4.3 | ) | (4.5 | ) | ||||||||||||||||
65
Table of Contents
ACCO Brands Corporation and Subsidiaries
Notes to Consolidated Financial Statements (Continued)
4. Pension and Other Retiree Benefits (Continued)
Of the amounts included within accumulated other comprehensive income, the Company expects to recognize the following pre-tax amounts as components of net periodic benefit cost during 2010:
| (in millions of dollars) | Pension Benefits | Postretirement | ||||||||
| U.S. | International | |||||||||
| Prior service cost |
$ | — | $ | 0.2 | $ | — | ||||
| Actuarial (gain) loss |
3.0 | 5.0 | (0.9 | ) | ||||||
| $ | 3.0 | $ | 5.2 | $ | (0.9 | ) | ||||
The accumulated benefit obligation for all defined benefit pension plans was $410.7 million and $339.0 million at December 31, 2009 and 2008, respectively.
The following table sets out information for pension plans with an accumulated benefit obligation in excess of plan assets:
| (in millions of dollars) | U.S. | International | ||||||||||
| 2009 | 2008 | 2009 | 2008 | |||||||||
| Projected benefit obligation |
$ | 154.4 | $ | 151.4 | $ | 268.5 | $ | 32.0 | ||||
| Accumulated benefit obligation |
154.4 | 141.5 | 253.5 | 29.0 | ||||||||
| Fair value of plan assets |
107.9 | 87.4 | 231.8 | 18.2 | ||||||||
The following table sets out the components of net periodic benefit cost:
| Pension Benefits | Postretirement | |||||||||||||||||||||||||||||||||||
| U.S. | International | |||||||||||||||||||||||||||||||||||
| (in millions of dollars) | 2009 | 2008 | 2007 | 2009 | 2008 | 2007 | 2009 | 2008 | 2007 | |||||||||||||||||||||||||||
| Service cost |
$ | 1.3 | $ | 4.7 | $ | 7.4 | $ | 2.4 | $ | 3.9 | $ | 5.7 | $ | 0.1 | $ | 0.2 | $ | 0.3 | ||||||||||||||||||
| Interest cost |
9.1 | 8.9 | 8.6 | 13.7 | 16.2 | 15.5 | 0.8 | 1.0 | 1.0 | |||||||||||||||||||||||||||
| Expected return on plan assets |
(10.7 | ) | (11.5 | ) | (11.4 | ) | (12.8 | ) | (19.8 | ) | (19.9 | ) | — | — | — | |||||||||||||||||||||
| Amortization of prior service cost (credit) |
— | (0.1 | ) | (0.1 | ) | 0.2 | 0.2 | 0.5 | — | — | — | |||||||||||||||||||||||||
| Amortization of net loss (gain) |
1.2 | — | 0.8 | 3.4 | 0.5 | 3.1 | (0.9 | ) | (0.9 | ) | (0.8 | ) | ||||||||||||||||||||||||
| Curtailment |
(1.0 | ) | 0.1 | — | (0.5 | ) | (0.2 | ) | — | — | — | — | ||||||||||||||||||||||||
| Net periodic benefit cost |
$ | (0.1 | ) | $ | 2.1 | $ | 5.3 | $ | 6.4 | $ | 0.8 | $ | 4.9 | $ | — | $ | 0.3 | $ | 0.5 | |||||||||||||||||
66
Table of Contents
ACCO Brands Corporation and Subsidiaries
Notes to Consolidated Financial Statements (Continued)
4. Pension and Other Retiree Benefits (Continued)
Other changes in plan assets and benefit obligations that were recognized in other comprehensive income during the years ended December 31, 2009, 2008 and 2007, respectively, were as follows:
| Pension Benefits | Postretirement | ||||||||||||||||||||||||||||||||||
| U.S. | International | ||||||||||||||||||||||||||||||||||
| (in millions of dollars) | 2009 | 2008 | 2007 | 2009 | 2008 | 2007 | 2009 | 2008 | 2007 | ||||||||||||||||||||||||||
| Current year actuarial (gain)/loss |
$ | (16.1 | ) | $ | 65.3 | $ | (12.4 | ) | $ | 26.1 | $ | 34.4 | $ | (22.2 | ) | $ | (0.3 | ) | $ | (2.5 | ) | $ | (1.7 | ) | |||||||||||
| Amortization of actuarial (gain) loss |
(1.2 | ) | — | (0.8 | ) | (3.6 | ) | (1.0 | ) | (3.1 | ) | 1.0 | 0.9 | 0.8 | |||||||||||||||||||||
| Current year prior service cost |
— | — | — | — | 0.4 | 0.1 | — | — | — | ||||||||||||||||||||||||||
| Amortization of prior service cost/(credit) |
— | 0.1 | 0.1 | (0.3 | ) | (0.4 | ) | (0.5 | ) | — | — | — | |||||||||||||||||||||||
| Curtailment gain |
0.2 | — | (0.3 | ) | — | — | — | — | — | — | |||||||||||||||||||||||||
| Exchange rate adjustment |
— | — | — | 5.8 | (14.9 | ) | 1.0 | (0.4 | ) | 1.4 | (0.1 | ) | |||||||||||||||||||||||
| Other |
— | — | — | — | (0.1 | ) | — | — | 0.1 | — | |||||||||||||||||||||||||
| Total recognized in other comprehensive income |
$ | (17.1 | ) | $ | 65.4 | $ | (13.4 | ) | $ | 28.0 | $ | 18.4 | $ | (24.7 | ) | $ | 0.3 | $ | (0.1 | ) | $ | (1.0 | ) | ||||||||||||
| Total recognized in net periodic benefit cost and other comprehensive income |
$ | (17.2 | ) | $ | 67.5 | $ | (8.1 | ) | $ | 34.4 | $ | 19.2 | $ | (19.8 | ) | $ | 0.3 | $ | 0.2 | $ | (0.5 | ) | |||||||||||||
Assumptions
Weighted average assumptions used to determine benefit obligations for years ended December 31, 2009, 2008 and 2007 were:
| Pension Benefits | Postretirement | ||||||||||||||||||||||||||
| U.S. | International | ||||||||||||||||||||||||||
| 2009 | 2008 | 2007 | 2009 | 2008 | 2007 | 2009 | 2008 | 2007 | |||||||||||||||||||
| Discount rate |
5.9 | % | 6.5 | % | 6.6 | % | 5.8 | % | 6.5 | % | 5.8 | % | 5.9 | % | 6.5 | % | 6.3 | % | |||||||||
| Rate of compensation increase |
4.0 | % | 4.0 | % | 4.0 | % | 4.5 | % | 3.6 | % | 4.4 | % | — | — | — | ||||||||||||
Weighted average assumptions used to determine net cost for years ended December 31, 2009, 2008 and 2007 were:
| Pension Benefits | Postretirement | ||||||||||||||||||||||||||
| U.S. | International | ||||||||||||||||||||||||||
| 2009 | 2008 | 2007 | 2009 | 2008 | 2007 | 2009 | 2008 | 2007 | |||||||||||||||||||
| Discount rate |
6.5 | % | 6.6 | % | 5.9 | % | 6.5 | % | 5.8 | % | 4.9 | % | 6.5 | % | 6.3 | % | 5.4 | % | |||||||||
| Expected long-term rate of return |
8.2 | % | 8.2 | % | 8.4 | % | 6.3 | % | 6.7 | % | 6.7 | % | — | — | — | ||||||||||||
| Rate of compensation increase |
4.0 | % | 4.0 | % | 4.0 | % | 3.6 | % | 4.4 | % | 4.0 | % | — | — | — | ||||||||||||
67
Table of Contents
ACCO Brands Corporation and Subsidiaries
Notes to Consolidated Financial Statements (Continued)
4. Pension and Other Retiree Benefits (Continued)
Weighted average health care cost trend rates used to determine postretirement benefit obligations and net cost at December 31, 2009, 2008 and 2007 were:
| Postretirement Benefits | |||||||||
| 2009 | 2008 | 2007 | |||||||
| Health care cost trend rate assumed for next year |
7 | % | 9 | % | 9 | % | |||
| Rate that the cost trend rate is assumed to decline (the ultimate trend rate) |
5 | % | 5 | % | 5 | % | |||
| Year that the rate reaches the ultimate trend rate |
2020 | 2020 | 2020 | ||||||
Assumed health care cost trend rates may have a significant effect on the amounts reported for the health care plans. A one-percentage-point change in assumed health care cost trend rates would have the following effects:
| (in millions of dollars) | 1-Percentage- Point Increase |
1-Percentage- Point Decrease |
|||||
| Effect on total of service and interest cost |
$ | 0.7 | $ | (0.1 | ) | ||
| Effect on postretirement benefit obligation |
0.6 | (1.1 | ) | ||||
Plan Assets
The investment strategy for the Company is to optimize investment returns through a diversified portfolio of investments, taking into consideration underlying plan liabilities and asset volatility. Each plan has a different target asset allocation which is reviewed periodically and is based on the underlying liability structure. The target asset allocation for our U.S. plan is 65% in equity securities and 35% in fixed income securities. The target asset allocation for non-U.S. plans is set by the local plan trustees.
The Company’s pension plan weighted average asset allocations at December 31, 2009 and 2008 were as follows:
| 2009 | 2008 | |||||||||||
| U.S. | International | U.S. | International | |||||||||
| Asset category |
||||||||||||
| Equity securities |
69 | % | 48 | % | 63 | % | 44 | % | ||||
| Fixed income |
31 | 41 | 37 | 41 | ||||||||
| Real estate |
— | 4 | — | 5 | ||||||||
| Other(1) |
— | 7 | — | 10 | ||||||||
| Total |
100 | % | 100 | % | 100 | % | 100 | % | ||||
| (1) | Cash and cash equivalents and insurance contracts for certain of our international plans. |
68
Table of Contents
ACCO Brands Corporation and Subsidiaries
Notes to Consolidated Financial Statements (Continued)
4. Pension and Other Retiree Benefits (Continued)
U.S. Pension Plan Assets
Fair value measurements of our U.S. pension plan assets by asset category at December 31, 2009 are as follows:
| (in millions of dollars) | Quoted Prices in Active Markets for Identical Assets (Level 1) |
Significant Other Observable Inputs (Level 2) |
Significant Unobservable Inputs (Level 3) |
Fair Value as of December 31, 2009 | ||||||||
| Common stocks |
$ | 5.6 | $ | — | $ | — | $ | 5.6 | ||||
| Mutual funds |
69.3 | — | — | 69.3 | ||||||||
| Common collective trust funds |
— | 9.0 | — | 9.0 | ||||||||
| Government debt securities |
— | 7.9 | — | 7.9 | ||||||||
| Corporate debt securities |
— | 5.9 | — | 5.9 | ||||||||
| Collateralized mortgage obligations |
— | 4.6 | — | 4.6 | ||||||||
| Asset-backed securities, mortgage backed securities, and other fixed income securities |
— | 5.6 | — | 5.6 | ||||||||
| Total |
$ | 74.9 | $ | 33.0 | $ | — | $ | 107.9 | ||||
Mutual funds and common stocks: The fair values of mutual fund and common stock fund investments are determined by obtaining quoted prices on nationally recognized securities exchanges (level 1 inputs).
Common collective trusts: The fair values of participation units held in common collective trusts are based on their net asset values, as reported by the managers of the common collective trusts and as supported by the unit prices of actual purchase and sale transactions occurring as of or close to the financial statement date (level 2 inputs).
Debt securities: Fixed income securities, such as corporate and government bonds, collateralized mortgage obligations, asset-backed securities, and other debt securities are valued using quotes from independent pricing vendors based on recent trading activity and other relevant information, including market interest rate curves, referenced credit spreads, and estimated prepayment rates, where applicable (level 2 inputs).
International Pension Plans Assets
Fair value measurements of our international pension plans assets by asset category at December 31, 2009 are as follows:
| (in millions of dollars) | Quoted Prices in Active Markets for Identical Assets (Level 1) |
Significant Other Observable Inputs (Level 2) |
Significant Unobservable Inputs (Level 3) |
Fair Value as of December 31, 2009 | ||||||||
| Cash and cash equivalents |
$ | 3.9 | $ | — | $ | — | $ | 3.9 | ||||
| Equity securities |
114.1 | — | — | 114.1 | ||||||||
| Government debt securities |
— | 20.6 | — | 20.6 | ||||||||
| Corporate debt securities |
— | 69.2 | — | 69.2 | ||||||||
| Other debt securities |
— | 6.8 | — | 6.8 | ||||||||
| Real estate |
— | 8.7 | — | 8.7 | ||||||||
| Insurance contracts |
— | 11.2 | — | 11.2 | ||||||||
| Total |
$ | 118.0 | $ | 116.5 | $ | — | $ | 234.5 | ||||
69
Table of Contents
ACCO Brands Corporation and Subsidiaries
Notes to Consolidated Financial Statements (Continued)
4. Pension and Other Retiree Benefits (Continued)
Equity securities: The fair values of equity securities are determined by obtaining quoted prices on nationally recognized securities exchanges (level 1 inputs).
Debt securities: Fixed income securities, such as corporate and government bonds and other debt securities consisting of index linked securities. These debt securities are valued using quotes from independent pricing vendors based on recent trading activity and other relevant information, including market interest rate curves, referenced credit spreads, and estimated prepayment rates, where applicable (level 2 inputs).
Real estate: Real estate consists of publicly traded real estate investment trust securities (level 2 inputs).
Insurance contracts: Valued at contributions made, plus earnings, less participant withdrawals and administrative expenses, which approximates fair value (level 2 inputs).
Cash Contributions
The Company expects to contribute $17.2 million to its pension plans in 2010.
The Company sponsors a number of defined contribution plans. Contributions are determined under various formulas. Costs related to such plans amounted to $2.1 million, $7.2 million and $7.2 million in 2009, 2008 and 2007, respectively. In January 2009, the Company’s Board of Directors approved amendments to the Company’s U.S. 401(k) plan to suspend employer matching contributions for all participants effective February 21, 2009. The Company reinstated its employer matching contributions for all 401(k) plan participants in October, 2009. This action resulted in pre-tax savings of approximately $3.2 million during 2009.
The following table presents estimated future benefit payments for the next ten fiscal years:
| (in millions of dollars) | Pension Benefits |
Postretirement Benefits | ||||
| 2010 |
$ | 18.0 | $ | 1.2 | ||
| 2011 |
$ | 19.1 | $ | 1.3 | ||
| 2012 |
$ | 20.8 | $ | 1.3 | ||
| 2013 |
$ | 20.6 | $ | 1.3 | ||
| 2014 |
$ | 21.3 | $ | 1.3 | ||
| Years 2015 – 2019 |
$ | 121.6 | $ | 4.9 | ||
70
Table of Contents
ACCO Brands Corporation and Subsidiaries
Notes to Consolidated Financial Statements (Continued)
5. Goodwill and Identifiable Intangible Assets
Goodwill
Changes in the net carrying amount of goodwill by segment was as follows:
| (in millions of dollars) | ACCO Brands Americas |
ACCO Brands International |
Computer Products Group |
Total | |||||||||||
| Balance at December 31, 2007 |
$ | 229.2 | $ | 144.4 | $ | 6.8 | $ | 380.4 | |||||||
| Translation and other |
(13.1 | ) | (5.1 | ) | — | (18.2 | ) | ||||||||
| Impairment charges |
(129.3 | ) | (93.4 | ) | — | (222.7 | ) | ||||||||
| Balance at December 31, 2008 |
86.8 | 45.9 | 6.8 | 139.5 | |||||||||||
| Translation and other |
2.2 | 1.7 | — | 3.9 | |||||||||||
| Balance at December 31, 2009 |
$ | 89.0 | $ | 47.6 | $ | 6.8 | $ | 143.4 | |||||||
| Goodwill |
$ | 219.9 | $ | 141.7 | $ | 6.8 | $ | 368.4 | |||||||
| Accumulated impairment losses |
(130.9 | ) | (94.1 | ) | — | (225.0 | ) | ||||||||
| Balance at December 31, 2009 |
$ | 89.0 | $ | 47.6 | $ | 6.8 | $ | 143.4 | |||||||
The authoritative guidance on goodwill and other intangible assets requires that goodwill be tested for impairment at a reporting unit level. The Company has determined that its reporting units are its ACCO Brands Americas, ACCO Brands International and Computer Products Group segments based on its organizational structure and the financial information that is provided to and reviewed by management. The Company tests goodwill for impairment annually and whenever events or circumstances make it more likely than not that an impairment may have occurred. Goodwill is tested for impairment using a two-step process. In the first step, the fair value of a reporting unit is compared to its carrying value. If the fair value of a reporting unit exceeds the carrying value of the net assets assigned to a reporting unit, goodwill is considered not impaired and no further testing is required. If the carrying value of the net assets assigned to a reporting unit exceeds the fair value of a reporting unit, the second step of the impairment test is performed in order to determine the implied fair value of a reporting unit’s goodwill. Determining the implied fair value of goodwill requires valuation of a reporting unit’s tangible and intangible assets and liabilities in a manner similar to the allocation of purchase price in a business combination. If the carrying value of a reporting unit’s goodwill exceeds its implied fair value, goodwill is deemed impaired and is written down to the extent of the difference. Based upon our most recent annual impairment test completed during the second quarter of 2009, the fair value of goodwill of each of our reporting units was substantially in excess of its related carrying value.
Given the current economic environment and the uncertainties regarding the impact on our business, there can be no assurance that our estimates and assumptions made for purposes of our impairment testing as of the second quarter of 2009 will prove to be accurate predictions of the future. If our assumptions regarding forecasted revenue or margin growth rates are not achieved, we may be required to record additional impairment charges in future periods, whether in connection with our next annual impairment testing in the second quarter of 2010 or prior to that, if any such change constitutes a triggering event outside of the quarter from when the annual impairment test is performed. It is not possible at this time to determine if any such future impairment charge would result or, if it does, whether such charge would be material.
71
Table of Contents
ACCO Brands Corporation and Subsidiaries
Notes to Consolidated Financial Statements (Continued)
5. Goodwill and Identifiable Intangible Assets (Continued)
2008
During the fourth quarter of 2008, the Company experienced a sustained, significant decline in its stock price. As a result of the decline in stock price, the Company’s market capitalization fell below the recorded value of its consolidated net assets. In addition, during the fourth quarter of 2008, the Company continued to experience a significant decline in both its sales and operating income as well as a reduction in its future forecasted cash flows. Given these impairment indicators, the Company determined that its goodwill might be impaired.
Accordingly, as of the end of the fourth quarter of 2008, the Company performed an assessment of goodwill for impairment. As part of our process for performing the step one impairment test of goodwill, we determine the fair value of a reporting unit using a combination of a discounted cash flow analysis and a market-based approach, which utilize significant unobservable inputs (Level 3) within the fair value hierarchy. A key assumption in our fair value estimate is the weighted average cost of capital utilized for discounting our cash flow estimates in our income approach. We selected a weighted average cost of capital of 14.0 percent. We reconciled the enterprise value to our overall market capitalization which included an expected control premium, based on comparable transactions. Based on the results of the Company’s assessment of goodwill for impairment, it was determined that the carrying values of the ACCO Brands Americas and ACCO Brands International reporting units exceeded their estimated fair values. Therefore, the Company performed the second step of the impairment test to determine the implied fair value of goodwill of the ACCO Brands Americas and ACCO Brands International reporting units. As a result of the impairment assessment, the Company concluded that the carrying value of goodwill in both the ACCO Brands Americas and ACCO Brands International reporting units exceeded its implied fair value and therefore we recorded a goodwill impairment charge of $197.3 million, of which $112.6 million is attributable to the ACCO Brands Americas reporting unit and $84.7 million is attributable to the ACCO Brands International reporting unit. The Company determined that goodwill in its Computer Products Group segment was not impaired.
During the second and third quarters of 2008, as a result of reduced sales and operating profits in the Company’s former Commercial Laminating Solutions business segment, as well as reduced expected future cash flows, the Company recorded goodwill impairment charges of $36.5 million and $24.0 million, respectively. Of these charges, the digital print finishing business recorded $14.1 million and $11.3 million in the second and third quarters of 2008, respectively. Collectively, $16.7 million of these charges were recorded in the ACCO Brands Americas segment and $8.7 million were recorded in the ACCO Brands International segment. The commercial print finishing business, which has subsequently been reclassified as a discontinued operation, recorded goodwill impairment charges of $22.4 million and $12.7 million, in the second and third quarters of 2008, respectively. The financial results of the commercial print finishing business, as well as the impairment charges related to this business have been classified within the caption “Discontinued Operations” for all periods.
72
Table of Contents
ACCO Brands Corporation and Subsidiaries
Notes to Consolidated Financial Statements (Continued)
5. Goodwill and Identifiable Intangible Assets (Continued)
Identifiable Intangibles
The gross carrying value and accumulated amortization by class of identifiable intangible assets as of December 31, 2009 and December 31, 2008 are as follows:
| As of December 31, 2009 | As of December 31, 2008 | |||||||||||||||||||
| (in millions of dollars) | Gross Carrying Amounts |
Accumulated Amortization |
Net Book Value |
Gross Carrying Amounts |
Accumulated Amortization |
Net Book Value | ||||||||||||||
| Indefinite-lived intangible assets: |
||||||||||||||||||||
| Trade names |
$ | 139.7 | $ | (44.5 | )(1) | $ | 95.2 | $ | 140.7 | $ | (44.5 | )(1) | $ | 96.2 | ||||||
| Amortizable intangible assets: |
||||||||||||||||||||
| Trade names |
59.6 | (23.6 | ) | 36.0 | 56.8 | (19.5 | ) | 37.3 | ||||||||||||
| Customer and contractual relationships |
26.9 | (17.3 | ) | 9.6 | 24.1 | (13.4 | ) | 10.7 | ||||||||||||
| Patents/proprietary technology |
10.6 | (5.6 | ) | 5.0 | 9.8 | (4.1 | ) | 5.7 | ||||||||||||
| Subtotal |
97.1 | (46.5 | ) | 50.6 | 90.7 | (37.0 | ) | 53.7 | ||||||||||||
| Total identifiable intangibles |
$ | 236.8 | $ | (91.0 | ) | $ | 145.8 | $ | 231.4 | $ | (81.5 | ) | $ | 149.9 | ||||||
| (1) | Accumulated amortization prior to the adoption of authoritative guidance on goodwill and other intangible assets. |
The Company’s intangible amortization was $7.2 million, $7.7 million and $7.9 million for the years ended December 31, 2009, 2008 and 2007, respectively. Estimated amortization for 2010 is $7.2 million, and is expected to decline by approximately $0.8 million for each of the five years following.
2009
As of the end of the second quarter of 2009, in connection with its annual goodwill impairment test, the Company tested its other indefinite-lived intangibles, consisting of its indefinite-lived trade names. The Company estimated the fair value of its trade names by performing discounted cash flow analyses based on the relief-from-royalty approach. This approach treats the trade name as if it were licensed by the Company rather than owned, and calculates its value based on the discounted cash flow of the projected license payments. A key assumption in our fair value estimate is the discount rate utilized. We selected a discount rate of 17.0 percent. The analysis resulted in an impairment charge of $1.8 million, of which $0.9 million was recorded in the ACCO Brands Americas segment and $0.9 million was recorded in the ACCO Brands International segment.
As discussed further in Note 6, Income Taxes, during the second quarter of 2009, the Company recorded a $108.1 million non-cash charge to establish a valuation allowance on the Company’s U.S. deferred tax assets. In connection with this non-cash charge, the Company reviewed certain of its long-lived tangible and amortizable intangible assets and determined that the forecasted undiscounted cash flows related to these asset groups were in excess of their carrying values and, therefore, these assets were not impaired.
2008
As of the end of the fourth quarter of 2008, the Company revalued its other indefinite-lived intangibles, consisting of its indefinite-lived trade names. The Company estimated the fair value of its trade names by performing discounted cash flow analyses based on the relief-from-royalty approach. This approach treats the
73
Table of Contents
ACCO Brands Corporation and Subsidiaries
Notes to Consolidated Financial Statements (Continued)
5. Goodwill and Identifiable Intangible Assets (Continued)
trade name as if it were licensed by the Company rather than owned, and calculates its value based on the discounted cash flow of the projected license payments. A key assumption in our fair value estimate is the discount rate utilized. We selected a discount rate of 18.0 percent. The analysis resulted in an impairment charge of $51.7 million, of which $31.3 million was recorded in the ACCO Brands Americas segment, $17.6 million was recorded in the ACCO Brands International segment and $2.8 million was recorded in the Computer Products Group segment.
6. Income Taxes
The components of income (loss) before income taxes from continuing operations are as follows:
| (in millions of dollars) | 2009 | 2008 | 2007 | |||||||||
| Domestic operations |
$ | (38.6 | ) | $ | (192.4 | ) | $ | (8.1 | ) | |||
| Foreign operations |
50.7 | (53.7 | ) | 58.7 | ||||||||
| Total |
$ | 12.1 | $ | (246.1 | ) | $ | 50.6 | |||||
The reconciliation of income taxes computed at the U.S. federal statutory income tax rate to the Company’s effective income tax rate for continuing operations is as follows:
| (in millions of dollars) | 2009 | 2008 | 2007 | |||||||||
| Income tax (benefit) expense computed at U.S. statutory income tax rate |
$ | 4.2 | $ | (86.1 | ) | $ | 17.9 | |||||
| State, local and other income taxes, net of federal tax benefit |
(1.0 | ) | 0.4 | (0.2 | ) | |||||||
| U.S. effect of foreign dividends and earnings |
23.6 | 11.0 | (0.9 | ) | ||||||||
| Impairment of non-deductible goodwill and other intangible assets |
— | 74.7 | 0.6 | |||||||||
| Foreign income taxed at lower effective tax rate |
(5.7 | ) | (11.5 | ) | (8.4 | ) | ||||||
| Increase of valuation allowance |
109.9 | 31.0 | 7.0 | |||||||||
| Change in prior year tax estimates |
(1.2 | ) | (1.6 | ) | 0.6 | |||||||
| Other |
(1.9 | ) | (1.0 | ) | — | |||||||
| Income taxes as reported |
$ | 127.9 | $ | 16.9 | $ | 16.6 | ||||||
During the second quarter of 2009, the Company established a valuation allowance against its domestic deferred tax assets to reduce them to the value more likely than not to be realized with a corresponding non-cash charge of $108.1 million to the provision for income taxes. Additionally, no tax benefits were provided on losses incurred during 2009 in the U.S. and certain foreign jurisdictions. At December 31, 2009 a valuation allowance has been provided for domestic and certain foreign deferred tax assets in those jurisdictions where the Company has determined that it is more likely than not that the deferred tax assets will not be realized. The lower than-expected tax rate for 2008 was principally due to the goodwill impairment charges of $222.7 million which are not tax deductible, additional taxes on previously untaxed income from foreign earnings and an increase in the valuation allowance on certain foreign and domestic state deferred tax assets and tax loss carryforwards. The 2007 tax year benefited from an excess foreign tax credit associated with dividends received.
The effective tax rate for discontinued operations was a tax rate of 4.2% in 2009 and reflected the absence of income tax benefits in the U.S. and Netherlands due to the tax valuation allowances established for those countries. The effective tax rate for discontinued operations was a tax benefit of 13.8% in 2008 and included the impact of non-deductible goodwill. The effective tax rate for discontinued operations was a tax benefit of 2.0% in 2007 and included the impact of non-deductible goodwill.
74
Table of Contents
ACCO Brands Corporation and Subsidiaries
Notes to Consolidated Financial Statements (Continued)
6. Income Taxes (Continued)
The U.S. federal statute of limitations remains open for the years 2006 and forward. Foreign and U.S. state jurisdictions have statutes of limitations generally ranging from 3 to 5 years. Years still open to examination by foreign tax authorities in major jurisdictions include Canada (2004 forward) and the United Kingdom (2005 forward). The Company is currently under examination in foreign jurisdictions.
The components of the income tax expense from continuing operations are as follows:
| (in millions of dollars) | 2009 | 2008 | 2007 | |||||||||
| Current expense (benefit) |
||||||||||||
| Federal |
$ | (0.6 | ) | $ | 10.2 | $ | 1.3 | |||||
| Foreign |
15.3 | 17.9 | 27.5 | |||||||||
| Other |
0.5 | 1.2 | 0.4 | |||||||||
| Total current income tax expense |
15.2 | 29.3 | 29.2 | |||||||||
| Deferred expense (benefit) |
||||||||||||
| Federal and other |
111.6 | (17.1 | ) | (3.0 | ) | |||||||
| Foreign |
1.1 | 4.7 | (9.6 | ) | ||||||||
| Total deferred income tax expense (benefit) |
112.7 | (12.4 | ) | (12.6 | ) | |||||||
| Total income tax expense |
$ | 127.9 | $ | 16.9 | $ | 16.6 | ||||||
The components of deferred tax assets (liabilities) are as follows:
| (in millions of dollars) | 2009 | 2008 | ||||||
| Deferred tax assets |
||||||||
| Compensation and benefits |
$ | 7.5 | $ | 13.7 | ||||
| Pension |
38.0 | 33.8 | ||||||
| Currency swap |
— | 10.3 | ||||||
| Inventory valuation related |
6.5 | 8.0 | ||||||
| Other reserves |
8.1 | 8.7 | ||||||
| Restructuring |
1.7 | 5.9 | ||||||
| Accounts receivable |
5.2 | 6.4 | ||||||
| Capital loss carryforwards |
10.3 | 10.2 | ||||||
| Foreign tax credit carryforwards |
20.5 | 20.4 | ||||||
| Net operating loss carryforwards |
116.4 | 55.6 | ||||||
| Assets related to refinancing |
— | 22.3 | ||||||
| Other |
1.4 | 5.7 | ||||||
| Gross deferred income tax assets |
215.6 | 201.0 | ||||||
| Valuation allowance |
(188.9 | ) | (63.8 | ) | ||||
| Net deferred tax assets |
26.7 | 137.2 | ||||||
| Deferred tax liabilities |
||||||||
| Depreciation |
(4.5 | ) | (4.6 | ) | ||||
| Identifiable intangibles |
(65.2 | ) | (57.6 | ) | ||||
| Other |
(2.3 | ) | (3.1 | ) | ||||
| Gross deferred tax liabilities |
(72.0 | ) | (65.3 | ) | ||||
| Net deferred tax assets (liabilities) |
$ | (45.3 | ) | $ | 71.9 | |||
75
Table of Contents
ACCO Brands Corporation and Subsidiaries
Notes to Consolidated Financial Statements (Continued)
6. Income Taxes (Continued)
The Company amended the terms of its loan agreement in December of 2008. For U.S. income tax purposes this refinancing triggered a tax gain which was principally offset by U.S. tax loss carryforwards. As a result, this did not result in a significant cash tax obligation.
Deferred income taxes are not provided on certain undistributed earnings of foreign subsidiaries that are expected to be permanently reinvested in those companies, aggregating approximately $490.4 million at December 31, 2009 and $343.9 million at December 31, 2008. If these amounts were distributed to the United States, in the form of a dividend or otherwise, the Company would be subject to additional U.S. income taxes. Determination of the amount of unrecognized deferred income tax liabilities on these earnings is not practicable.
At December 31, 2009, $354.3 million of net operating loss carryforwards and $29.4 million of capital loss carryforwards are available to reduce future taxable income of domestic and international companies. These loss carryforwards expire in the years 2010 through 2029 or have an unlimited carryover period.
The Company recognizes interest and penalties related to unrecognized tax benefits as a component of income taxes in its results of operations. As of December 31, 2009, the Company had $0.3 million accrued for interest and penalties.
A reconciliation of the beginning and ending amount of unrecognized tax benefits is as follows:
| (in millions of dollars) | 2009 | 2008 | ||||||
| Balance at January 1 |
$ | 5.4 | $ | 7.2 | ||||
| Additions for tax positions of prior years |
1.8 | — | ||||||
| Settlements |
(1.2 | ) | (1.8 | ) | ||||
| Balance at December 31 |
$ | 6.0 | $ | 5.4 | ||||
As of December 31, 2009 the amount of unrecognized tax benefits increased to $6.0 million, of which $6.0 million would affect the Company’s effective tax rate, if recognized. The Company expects the amount of unrecognized tax benefits to change within the next twelve months but these changes are not expected to have a significant impact on the Company’s results of operations or financial position.
None of the positions included in the unrecognized tax benefit relates to tax positions for which the ultimate deductibility is highly certain but for which there is uncertainty about the timing of such deductibility.
7. Inventories
Inventories are stated at the lower of cost or market value. The components of inventories were as follows:
| December 31, | ||||||
| (in millions of dollars) | 2009 | 2008 | ||||
| Raw materials |
$ | 25.1 | $ | 26.7 | ||
| Work in process |
5.0 | 8.2 | ||||
| Finished goods |
172.3 | 231.6 | ||||
| Total inventories |
$ | 202.4 | $ | 266.5 | ||
76
Table of Contents
ACCO Brands Corporation and Subsidiaries
Notes to Consolidated Financial Statements (Continued)
8. Property, Plant and Equipment
Property, plant and equipment, net consisted of:
| December 31, | ||||||||
| (in millions of dollars) | 2009 | 2008 | ||||||
| Land and improvements |
$ | 13.4 | $ | 14.7 | ||||
| Buildings and improvements to leaseholds |
118.2 | 120.7 | ||||||
| Machinery and equipment |
336.2 | 366.0 | ||||||
| Construction in progress |
7.9 | 13.9 | ||||||
| 475.7 | 515.3 | |||||||
| Less: accumulated depreciation |
(294.6 | ) | (320.5 | ) | ||||
| Net property, plant and equipment(1) |
$ | 181.1 | $ | 194.8 | ||||
| (1) | Net property, plant and equipment as of December 31, 2009 and 2008 contained $35.2 million and $43.5 million of computer software assets, which are classified within machinery and equipment. Amortization of software costs was $9.7 million, $9.3 million and $7.2 million for the years ended December 31, 2009, 2008 and 2007, respectively. |
9. Restructuring and Other Charges
Restructuring
The Company has initiated significant restructuring actions which have resulted in the closure or consolidation of facilities that are engaged in manufacturing and distributing the Company’s products, primarily in North America and Europe. The Company recorded pre-tax restructuring and asset impairment charges associated with continuing operations of $17.4 million, $28.8 million and $21.0 million during the years ended December 31, 2009, 2008 and 2007, respectively. The Company’s cost reduction actions are now complete and no additional charges are anticipated in 2010. However, cash disbursements will continue into 2010 with respect to facilities no longer utilized by the business and certain remaining payments due under severance arrangements.
A summary of the activity in the restructuring accounts and a reconciliation of the liability for, and as of, the year ended December 31, 2009 is as follows:
| (in millions of dollars) | Balance at December 31, 2008 |
Total Provision |
Cash Expenditures |
Non-cash Items/ Currency Change |
Balance at December 31, 2009 | ||||||||||||
| Rationalization of operations |
|||||||||||||||||
| Employee termination costs |
$ | 21.8 | $ | 11.9 | $ | (26.4 | ) | $ | 0.7 | $ | 8.0 | ||||||
| Termination of lease agreements |
3.1 | 3.3 | (2.3 | ) | 0.3 | 4.4 | |||||||||||
| Other(1) |
— | 0.3 | (0.1 | ) | (0.2 | ) | — | ||||||||||
| Sub-total |
24.9 | 15.5 | (28.8 | ) | 0.8 | 12.4 | |||||||||||
| Asset impairments/net loss on disposal of assets resulting from restructuring activities |
— | 1.9 | — | (1.9 | ) | — | |||||||||||
| Total rationalization of operations |
$ | 24.9 | $ | 17.4 | $ | (28.8 | ) | $ | (1.1 | ) | $ | 12.4 | |||||
| (1) | Includes $0.2 million of stock-based compensation expense related to terminated employees. |
77
Table of Contents
ACCO Brands Corporation and Subsidiaries
Notes to Consolidated Financial Statements (Continued)
9. Restructuring and Other Charges (Continued)
Management expects the $8.0 million employee termination costs balance to be substantially paid within the next twelve months. Lease costs included in the $4.4 million balance are expected to continue until the last lease terminates in 2013.
A summary of the activity in the restructuring accounts and a reconciliation of the liability for, and as of, the year ended December 31, 2008 is as follows:
| (in millions of dollars) | Balance at December 31, 2007 |
Total Provision |
Cash Expenditures |
Non-cash Items/ Currency Change |
Balance at December 31, 2008 | ||||||||||||
| Rationalization of operations |
|||||||||||||||||
| Employee termination costs |
$ | 18.2 | $ | 25.0 | $ | (20.6 | ) | $ | (0.8 | ) | $ | 21.8 | |||||
| Termination of lease agreements |
2.8 | 2.4 | (1.7 | ) | (0.4 | ) | 3.1 | ||||||||||
| Sub-total |
21.0 | 27.4 | (22.3 | ) | (1.2 | ) | 24.9 | ||||||||||
| Asset impairments/net loss on disposal of assets resulting from restructuring activities |
— | 1.4 | — | (1.4 | ) | — | |||||||||||
| Total rationalization of operations |
$ | 21.0 | $ | 28.8 | $ | (22.3 | ) | $ | (2.6 | ) | $ | 24.9 | |||||
A summary of the activity in the restructuring accounts and a reconciliation of the liability for, and as of, the year ended December 31, 2007 is as follows:
| (in millions of dollars) |
Balance at December 31, 2006 |
Total Provision |
Cash Expenditures |
Non-cash Items/ Currency Change |
Balance at December 31, 2007 | ||||||||||||
| Rationalization of operations |
|||||||||||||||||
| Employee termination costs |
$ | 18.0 | $ | 18.8 | $ | (19.5 | ) | $ | 0.9 | $ | 18.2 | ||||||
| Termination of lease agreements |
4.5 | 1.9 | (3.5 | ) | (0.1 | ) | 2.8 | ||||||||||
| Sub-total |
22.5 | 20.7 | (23.0 | ) | 0.8 | 21.0 | |||||||||||
| Asset impairments/net loss on disposal of assets resulting from restructuring activities |
0.1 | 0.3 | — | (0.4 | ) | — | |||||||||||
| Total rationalization of operations |
$ | 22.6 | $ | 21.0 | $ | (23.0 | ) | $ | 0.4 | $ | 21.0 | ||||||
Other Charges
In addition to the recognition of restructuring costs, the Company also recognized other charges, incremental to the cost of its underlying restructuring actions that do not qualify as restructuring. These charges include redundant warehousing or storage costs during the transition to a new distribution center, equipment and other asset move costs, facility overhead and maintenance costs after exit, gains on the sale of exited facilities, certain costs associated with the Company’s debt refinancing and employee retention incentives. Within cost of
78
Table of Contents
ACCO Brands Corporation and Subsidiaries
Notes to Consolidated Financial Statements (Continued)
9. Restructuring and Other Charges (Continued)
products sold on the Consolidated Statements of Operations for the years ended December 31, 2009, 2008 and 2007, respectively, these charges totaled $3.4 million, $7.5 million and $17.2 million, respectively. Within advertising, selling, general and administrative expenses on the Consolidated Statements of Operations for the years ended December 31, 2009, 2008 and 2007, respectively, these charges totaled $1.2 million, $3.1 million and $16.3 million, respectively. Included within the 2008 results, is a charge for $4.2 million related to the exit of the Company’s former CEO, a $3.5 million gain on the sale of a manufacturing facility and net gains of $2.4 million on the sale of three additional properties.
10. Discontinued Operations
The financial statement caption “discontinued operations” includes the results of the Company’s former commercial print finishing business, which supplied commercial laminating film and equipment to printers and packaging suppliers and represented approximately $100 million in annual net sales. During the fourth quarter of 2008, the Company’s Board of Directors authorized management to sell its commercial print finishing business and in the first quarter of 2009, the Company announced it had reached a definitive agreement to sell this business and to exit from selling high volume laminating film and equipment.
In June 2009, the Company completed the sale of its commercial print finishing business for final proceeds of $16.2 million, after final working capital adjustments made during the third quarter. As a result of the adjustments, the Company received net cash proceeds before expenses of $12.5 million and a $3.65 million note due from the buyer payable in installments of $1.325 million in June, 2011 and $2.325 million in June, 2012. Interest on the unpaid balance is payable at the rate of 4.9 percent per annum. The sale resulted in a pre-tax loss of $0.8 million ($1.1 million after-tax). The loss on sale includes a pre-tax pension curtailment gain of $0.5 million.
The operating results and financial position of discontinued operations are as follows:
| (in millions, except per share data) | 2009 | 2008 | 2007 | |||||||||
| Operating Results: |
||||||||||||
| Net sales |
$ | 29.4 | $ | 99.4 | $ | 104.1 | ||||||
| Operating loss(1) |
(9.3 | ) | (87.4 | ) | (35.3 | ) | ||||||
| Other (income) expense, net |
(0.3 | ) | 1.0 | 0.3 | ||||||||
| Pre-tax loss |
(9.0 | ) | (88.4 | ) | (35.6 | ) | ||||||
| Provision (benefit) for income taxes |
0.2 | (12.2 | ) | (0.7 | ) | |||||||
| Loss on sale, net of tax |
(1.1 | ) | — | — | ||||||||
| Loss from discontinued operations |
$ | (10.3 | ) | $ | (76.2 | ) | $ | (34.9 | ) | |||
| Per share: |
||||||||||||
| Basic loss from discontinued operations |
$ | (0.19 | ) | $ | (1.41 | ) | $ | (0.65 | ) | |||
| Diluted loss from discontinued operations |
$ | (0.19 | ) | $ | (1.41 | ) | $ | (0.63 | ) | |||
| (1) | During the first quarter of 2009, the Company recorded an impairment charge of $3.3 million ($1.8 million after-tax) to reflect a change in the estimate of fair value less the cost to dispose of its commercial print finishing business. During 2008, the Company recorded non-cash goodwill and asset impairment charges of $84.8 million. Included in this amount were charges to goodwill of $35.1 million, property, plant and |
79
Table of Contents
ACCO Brands Corporation and Subsidiaries
Notes to Consolidated Financial Statements (Continued)
10. Discontinued Operations (Continued)
| equipment of $22.2 million, identifiable intangible assets of $10.5 million and other current assets of $17.0 million. Non-cash goodwill impairment charges of $32.8 million were recorded in 2007. |
| (in millions of dollars) | December 31, 2009 |
December 31, 2008 | ||||
| Financial Position: |
||||||
| Current assets |
$ | — | $ | 33.2 | ||
| Long-term assets |
— | 1.6 | ||||
| Total assets |
$ | — | $ | 34.8 | ||
| Current liabilities(2) |
$ | 5.6 | $ | 15.1 | ||
| Long-term liabilities |
— | 1.9 | ||||
| Total liabilities |
$ | 5.6 | $ | 17.0 | ||
| (2) | Liabilities remaining as of December 31, 2009, consist principally of litigation accruals and severance costs. |
11. Long-term Debt and Short-term Borrowings
Notes payable and long-term debt consisted of the following at December 31, 2009 and 2008:
| (in millions of dollars) | 2009 | 2008 | ||||||
| Senior Secured Notes, due March 2015, net of discount(1) (fixed interest rate of 10.625%) |
$ | 453.3 | $ | — | ||||
| U.S. Dollar Senior Secured Term Loan Credit Facility (weighted-average floating interest rate of 7.75% at December 31, 2008) |
— | 246.0 | ||||||
| British Pound Senior Secured Term Loan Credit Facility (weighted-average floating interest rate of 9.49% at December 31, 2008) |
— | 32.8 | ||||||
| Euro Senior Secured Term Loan Credit Facility (weighted-average floating interest rate of 9.03% at December 31, 2008) |
— | 34.4 | ||||||
| U.S. Dollar Senior Secured Revolving Credit Facility (floating interest rate of 7.75% at December 31, 2008) |
— | 36.0 | ||||||
| Securitization borrowings (floating interest rate of 2.69% at December 31, 2008) |
— | 55.6 | ||||||
| U.S. Dollar Senior Subordinated Notes, due August 2015 (fixed interest rate of 7.625%) |
271.3 | 300.4 | ||||||
| Other borrowings |
1.2 | 3.5 | ||||||
| Total debt |
725.8 | 708.7 | ||||||
| Less: current portion |
(0.7 | ) | (64.5 | ) | ||||
| Total long-term debt |
$ | 725.1 | $ | 644.2 | ||||
| (1) | Represents unamortized original issue discount of $6.7 million, which is amortizable through March 15, 2015. |
Refinancing Transactions
On September 30, 2009, the Company issued $460.0 million aggregate principal amount of its 10.625% senior secured notes due March 15, 2015 (the “Senior Secured Notes”), and entered into a four-year senior secured asset-based revolving credit facility providing for borrowings of up to $175.0 million subject to
80
Table of Contents
ACCO Brands Corporation and Subsidiaries
Notes to Consolidated Financial Statements (Continued)
11. Long-term Debt and Short-term Borrowings (Continued)
borrowing base limitations (the “ABL Facility”). Initial borrowings under the ABL Facility were $16.1 million. These funds together with the $453.1 million in proceeds from the issuance of the Senior Secured Notes were used to (i) repay all outstanding borrowings under and terminate the Company’s prior senior secured credit agreements, (ii) repay all outstanding borrowings under and terminate the Company’s accounts receivable securitization program, (iii) terminate the Company’s cross-currency swap agreement, (iv) repurchase approximately $29.1 million aggregate principal amount of its 7 5/8% senior subordinated notes due August 15, 2015 (“Senior Subordinated Notes”), and (v) pay the fees, expenses and other costs relating to such transactions (collectively the “Refinancing Transactions”). The Company elected to enter into the Refinancing Transactions due to the upcoming maturity of its prior credit facilities.
The repayment of borrowings outstanding under the Company’s prior senior secured credit agreements consisted of the following:
| • | Repayment of $247.0 million of principal and accrued interest under its $400.0 million senior secured U.S. dollar term loan facility; |
| • | Repayment of $36.5 million of principal and accrued interest under its £63.6 million sterling term loan facility; |
| • | Repayment of $35.7 million of principal and accrued interest under its €68.2 million euro term loan facility; and |
| • | Repayment of $24.4 million of principal and accrued interest under its $130.0 million U.S. dollar revolving credit facility. |
The repayment of $340.2 million of borrowings outstanding under the Company’s senior secured credit agreements resulted in a pre-tax loss of $8.9 million on the early extinguishment of debt and included the write-off of amendment fees and issuance costs associated with the senior secured credit agreements. The loss on the early extinguishment of debt is included in Other (income) expense, net in the consolidated statements of operations.
In September 2005, the Company entered into a cross-currency swap agreement to hedge a portion of its net investment in Euro-based subsidiaries against movements in exchange rates. The five-year cross currency derivative swapped $185.0 million at 3-month U.S. LIBOR interest rates for €152.2 million at three-month EURIBOR rates plus a credit spread. Under the terms of the swap, the Company made quarterly interest payments on €152.2 million and received quarterly interest payments on $185.0 million. The swap served as an effective net investment hedge. The Company used the spot rate method for accounting purposes and, accordingly, any increase or decrease in the fair value of the swap was recorded in the cumulative translation adjustment account within accumulated other comprehensive income. Any hedging ineffectiveness was recorded in the “Interest expense, net” line in the consolidated statements of operations. On September 30, 2009, the Company terminated its cross-currency swap agreement. The termination of the cross-currency swap resulted in payments of $40.8 million to counterparties representing the fair market value of the cross-currency swap on the termination date.
The repayment of $62.8 million of borrowings outstanding under and termination of the Company’s accounts receivable securitization program resulted in a pre-tax loss of $0.2 million on the early extinguishment of debt and included the write-off of issuance costs associated with the accounts receivable securitization program. The loss on the early extinguishment of debt is included in Other (income) expense, net in the consolidated statements of operations.
81
Table of Contents
ACCO Brands Corporation and Subsidiaries
Notes to Consolidated Financial Statements (Continued)
11. Long-term Debt and Short-term Borrowings (Continued)
On September 30, 2009, the Company repurchased $29.1 million of outstanding Senior Subordinated Notes for a purchase price of $24.2 million which resulted in a pre-tax gain of $4.9 million on the early extinguishment of debt and is included in Other (income) expense, net in the consolidated statements of operations.
Debt issuance costs of $20.6 million in connection with the refinancing transactions were deferred and will be amortized using the effective interest method over the terms of the Senior Secured Notes and ABL Facility.
Senior Secured Notes
On September 30, 2009, the Company issued an aggregate principal amount of $460.0 million of Senior Secured Notes with semi-annual interest payments payable March 15 and September 15 of each year. The Senior Secured Notes were issued at 98.5% of par value, equating to an effective yield to maturity of approximately 11%. The proceeds from the sale of the Senior Secured Notes were $453.1 million, after deducting an original issue discount of $6.9 million. As discussed above in “Refinancing Transactions”, in conjunction with the proceeds from the initial draw under the ABL Facility, the Company entered into a series of transactions that included repayment of all amounts outstanding under and termination of its senior secured credit agreements, repayment and termination of its accounts receivable securitization program, termination of its cross-currency swap agreement, the repurchase of a portion of its Senior Subordinated Notes and the payment of fees, expenses and other costs relating to such transactions.
The Senior Secured Notes were offered and sold in a private placement to qualified institutional buyers in the United States pursuant to Rule 144A under the Securities Act of 1933, as amended (the “Securities Act”) and to non-U.S. persons outside the United States under Regulation S under the Securities Act.
The indenture governing the Senior Secured Notes does not contain financial performance covenants. However, that indenture does contain covenants limiting, among other things, the ability to incur additional debt, create liens, pay dividends on capital stock or repurchase capital stock or indebtedness, make certain investments, enter into certain types of transactions with affiliates, restrict or limit dividend or other payments by our restricted subsidiaries to the Company or other restricted subsidiaries, use assets as security in other transactions, sell certain assets or enter into consolidations with or into other companies.
Guarantees and Security
The Senior Secured Notes are unconditionally guaranteed, jointly and severally, on a senior secured basis by all of our existing and future domestic subsidiaries, with certain exceptions. The Senior Secured Notes and the related guarantees will rank equally in right of payment with all existing and future senior debt and will rank senior in right of payment to all existing and future subordinated debt.
The Senior Secured Notes and the guarantees are secured on a first-priority basis by a lien on substantially all of the Company’s and the guarantors’ present and future assets (other than accounts receivable, inventory, deposit accounts and certain other assets) and up to 65% of the present and future equity interests of certain of the Company’s and the guarantors directly owned foreign subsidiaries, in each case subject to certain exceptions and customary permitted liens. The Senior Secured Notes and the guarantees also are secured on a second-priority basis by a lien on the assets that secure the Company’s and the guarantors’ obligations under the ABL Facility, including accounts receivable, inventory, and other assets excluded as first-lien assets under the Senior Secured Notes.
82
Table of Contents
ACCO Brands Corporation and Subsidiaries
Notes to Consolidated Financial Statements (Continued)
11. Long-term Debt and Short-term Borrowings (Continued)
Redemption Options
The Company may redeem the Senior Secured Notes, in whole or in part, at any time on or after (i) September 15, 2012, at a redemption price equal to 105.3% of the principal amount of the Senior Secured Notes redeemed, (ii) September 15, 2013, at a redemption price equal to 102.7% of the principal amount of the Senior Secured Notes redeemed, or (iii) September 15, 2014, at a redemption price equal to 100% of the principal amount of the Senior Secured Notes redeemed, in each case plus accrued and unpaid interest, including any additional interest. At any time on or before September 15, 2012, the Company may redeem up to 35% of the aggregate principal amount of the Senior Secured Notes with the net proceeds of qualified equity offerings at a redemption price of 110.6% plus accrued and unpaid interest, including any additional interest. At any time the Company may also repurchase the Senior Secured Notes through open market or privately negotiated repurchases.
Requirements to Offer to Repurchase
If the Company experiences certain change of control events, the Company must offer to repurchase the Senior Secured Notes at a repurchase price equal to 101% of the principal amount of the Senior Secured Notes repurchased plus accrued and unpaid interest to the repurchase date. If the Company or its subsidiaries sell assets under specified circumstances, the Company must offer to repurchase the Senior Secured Notes at a repurchase price equal to 100% of the principal amount of the Senior Secured Notes being repurchased, plus accrued and unpaid interest to the repurchase date.
Asset-Based Revolving Credit Facility (ABL Facility)
On September 30, 2009, the Company, and certain domestic and foreign subsidiaries (collectively, the “Borrowers”) entered into a four-year senior secured asset-based revolving credit facility maturing in September 2013 with Deutsche Bank AG, as administrative agent, a co-collateral agent and a lender, and five other lenders, providing for revolving credit financing of up to $175.0 million, including a $40.0 million sub-limit for letters of credit and, subject to certain conditions, an optional $50.0 million additional credit capacity using an accordion feature. Amounts borrowed under the ABL Facility by the Company and its domestic subsidiaries are guaranteed by each of the Company’s domestic subsidiaries that guarantee the Senior Secured Notes, and amounts borrowed under the ABL Facility by the Company’s foreign subsidiaries are guaranteed by each of the Company, its domestic subsidiaries that guarantee the Senior Secured Notes and certain foreign subsidiaries.
The Borrowers’ ability to borrow under the ABL Facility is limited to a borrowing base equal to 85% of eligible accounts receivable plus up to the lesser of (1) 65% of the lower of cost or fair market value of eligible inventory and (2) 85% of the net orderly liquidation value of eligible inventory minus availability reserves, and is subject to other conditions, limitations and reserve requirements.
Interest rates under the ABL Facility are based on the London Interbank Offered Rate (LIBOR). Pricing is subject to quarterly adjustment based on the average availability under the ABL Facility during the prior quarter. The range of borrowing costs under the pricing grid is LIBOR plus 3.75% to LIBOR plus 4.25% with a LIBOR rate floor of 1.50%. The weighted-average interest rate of the ABL Facility as of September 30, 2009 was 5.97%. The Company is required to pay a quarterly commitment fee on the unused portion of the ABL facility ranging from 0.5% to 1.0%.
Borrowings under the ABL Facility are secured on a first priority basis by all accounts receivable, inventory and cash of the Company and its subsidiaries organized in the U.S. and certain foreign subsidiaries, and on a
83
Table of Contents
ACCO Brands Corporation and Subsidiaries
Notes to Consolidated Financial Statements (Continued)
11. Long-term Debt and Short-term Borrowings (Continued)
second priority basis by property and equipment of the Company and its subsidiaries organized in the U.S. and the other assets that secure the Senior Secured Notes on a first priority basis.
The ABL Facility contains customary terms and conditions, including among other things, limitations on liens and indebtedness, asset sales, repurchase of Senior Subordinated Notes, and intercompany transactions. A springing fixed charge financial covenant of 1.10:1.0 will be triggered if the excess availability under the ABL Facility falls below $20.0 million or 15% of total commitments. The ABL Facility also contains bank account restrictions that apply in the event that the Company’s excess availability fails to meet certain thresholds. As of December 31, 2009, the amount available for borrowings under the Company’s ABL Facility was $156.4 million (allowing for $18.6 million of letters of credit outstanding on that date). There were no borrowings outstanding under the Company’s ABL Facility as of December 31, 2009.
Senior Subordinated Notes
The indenture governing the Senior Subordinated Notes does not contain financial performance covenants. However, that indenture does contain covenants limiting, among other things, the Company’s and its subsidiaries ability to, incur additional debt, pay dividends on capital stock or repurchase capital stock or indebtedness, make certain investments, enter into certain types of transactions with affiliates, make dividend or other payments by our restricted subsidiaries to ACCO Brands, use assets as security in other transactions, sell certain assets or enter into consolidations with or into other companies.
Compliance with Loan Covenants
As of and for the period ended December 31, 2009, the Company was in compliance with all applicable loan covenants.
The Company’s ABL Facility would not be affected by a change in its credit rating.
12. Derivative Financial Instruments
The Company is exposed to various market risks, including changes in foreign currency exchange rates and interest rate changes. The Company enters into financial instruments to manage and reduce the impact of these risks, not for trading or speculative purposes. The counterparties to these financial instruments are major financial institutions. The Company continually monitors its foreign currency exposures in order to maximize the overall effectiveness of its foreign currency hedge positions. Principal currencies hedged include the U.S. dollar, Euro, Australian dollar, Canadian dollar and Pound sterling. The Company is subject to credit risk, which relates to the ability of counterparties to meet their contractual payment obligations or the potential non-performance by counterparties to financial instrument contracts. Management continues to monitor the status of the Company’s counterparties and will take action, as appropriate, to further manage its counterparty credit risk. There are no credit contingency features in our derivative financial instruments.
On the date in which the Company enters into a derivative, the derivative is designated as a hedge of the identified exposure. The Company measures the effectiveness of its hedging relationships both at hedge inception and on an ongoing basis.
84
Table of Contents
ACCO Brands Corporation and Subsidiaries
Notes to Consolidated Financial Statements (Continued)
12. Derivative Financial Instruments (Continued)
Forward Currency Contracts
The Company enters into forward foreign currency contracts to reduce the effect of fluctuating foreign currencies, primarily on foreign denominated inventory purchases and intercompany loans. The majority of the Company’s exposure to local currency movements is in Europe, Australia, Canada, Mexico and Japan.
Forward currency contracts used to hedge foreign denominated inventory purchases are designated as a cash flow hedge. Unrealized gains and losses on these contracts for inventory purchases are deferred in other comprehensive income until the contracts are settled and the underlying hedged transactions are recognized, at which time the deferred gains or losses will be reported in the “Cost of products sold” line in the consolidated statements of operations. As of December 31, 2009 and December 31, 2008, the Company had cash flow designated foreign exchange contracts outstanding with a U.S. dollar equivalent notional value of $61.9 million and $49.0 million, respectively.
Forward currency contracts used to hedge foreign denominated intercompany loans are not designated as hedging instruments. Gains and losses on these derivative instruments are recognized within Other (income) expense, net in the consolidated statements of operations and are largely offset by the changes in the fair value of the hedged item. The periods of the forward foreign exchange contracts correspond to the periods of the hedged transactions, and do not extend beyond 2010. As of December 31, 2009 and 2008, the Company had undesignated foreign exchange contracts outstanding with a U.S. dollar equivalent notional value of $124.6 million and $276.3 million, respectively.
Cross-Currency Swap
In September 2005, the Company entered into a cross-currency swap agreement to hedge a portion of its net investment in Euro-based subsidiaries against movements in exchange rates. The five-year cross currency derivative swapped $185 million at 3-month U.S. LIBOR interest rates for €152.2 million at three-month EURIBOR rates plus a credit spread. Under the terms of the swap, the Company made quarterly interest payments on €152.2 million and received quarterly interest payments on $185.0 million. The swap served as an effective net investment hedge. The Company used the spot rate method for accounting purposes and, accordingly, any increase or decrease in the fair value of the swap was recorded in the cumulative translation adjustment account within accumulated other comprehensive income. Any hedging ineffectiveness was recorded in the “Interest expense, net” line in the consolidated statements of operations. On September 30, 2009, in connection with the issuance of the Senior Secured Notes and entry into the ABL Facility, the Company terminated its cross-currency swap agreement. The termination of the cross-currency swap resulted in payments of $40.8 million to counterparties representing the fair market value of the cross-currency swap on the termination date. The Company did not enter into a new cross-currency swap facility when it refinanced its senior secured debt.
Hedge of Net Investment in Foreign Operations
The Company has designated third-party term borrowings as a hedge against the exposure of changes in the underlying foreign currency denominated subsidiary net assets. The effective portion of the change in fair value of net investment hedges is recorded in the cumulative translation adjustment account within accumulated other comprehensive income. The U.S. dollar equivalent of term debt designated as net investment hedges was $0.0 million and $32.8 million at December 31, 2009 and 2008, respectively.
85
Table of Contents
ACCO Brands Corporation and Subsidiaries
Notes to Consolidated Financial Statements (Continued)
12. Derivative Financial Instruments (Continued)
The following table summarizes the fair value of the Company’s derivative financial instruments as of December 31, 2009 and 2008, respectively.
| Fair Value of Derivative Instruments | ||||||||||||||||
| Derivative Assets |
Derivative Liabilities | |||||||||||||||
| (in millions of dollars) | Balance Sheet |
Dec. 31, 2009 |
Dec. 31, 2008 |
Balance Sheet Location |
Dec. 31, 2009 |
Dec. 31, 2008 | ||||||||||
| Derivatives designated as hedging instruments: |
||||||||||||||||
| Foreign exchange contracts |
Other current assets |
$ | 0.2 | $ | 5.1 | Other current liabilities |
$ | 1.0 | $ | 1.3 | ||||||
| Cross-currency swap |
Other non-current liabilities |
— | 29.4 | |||||||||||||
| Derivatives not designated as hedging instruments: |
||||||||||||||||
| Foreign exchange contracts |
Other current assets |
1.8 | 9.8 | Other current liabilities |
1.0 | 11.4 | ||||||||||
| Total derivatives |
$ | 2.0 | $ | 14.9 | $ | 2.0 | $ | 42.1 | ||||||||
The following table summarizes the pre-tax effect of the Company’s derivative financial instruments on the Consolidated Statements of Operations for the years ended December 31, 2009 and 2008, respectively.
| (in millions of dollars) | The Effect of Derivative Instruments in Cash Flow Hedging Relationships on the Consolidated Statements of Operations for the Years Ended December 31, 2009 and 2008 | |||||||||||||||||||||||||
| Amount of (Gain) Loss Recognized in OCI (Effective Portion) |
Location of (Gain) Loss Reclassified from OCI to Income |
Amount of (Gain) Loss Reclassified from AOCI to Income (Effective Portion) |
Location of (Gain) Loss Recognized in Income |
Amount of (Gain) Loss Recognized in Income (Ineffective Portion) | ||||||||||||||||||||||
| 2009 | 2008 | 2009 | 2008 | 2009 | 2008 | |||||||||||||||||||||
| Cash flow hedges: |
||||||||||||||||||||||||||
| Foreign exchange contracts |
$ | (4.4 | ) | $ | (4.7 | ) | Cost of products sold | $ | (0.3 | ) | $ | 0.7 | Cost of products sold |
$ | — | $ | — | |||||||||
| Net investment hedges: |
||||||||||||||||||||||||||
| Cross-currency swap |
10.0 | (9.5 | ) | Other (income)/expense | — | — | Interest expense, net |
(0.9 | ) | 1.6 | ||||||||||||||||
| Net investment in foreign operations |
15.0 | (12.0 | ) | Other (income)/expense | — | — | Other (income)/expense |
— | — | |||||||||||||||||
| Total |
$ | 20.6 | $ | (26.2 | ) | $ | (0.3 | ) | $ | 0.7 | $ | (0.9 | ) | $ | 1.6 | |||||||||||
| (in millions of dollars) | The Effect of Derivatives Not Designated as Hedging Instruments on the Consolidated Statements of Operations |
|||||||||
| Location of (Gain) Loss Recognized in Income on Derivatives |
Amount of (Gain) Loss Recognized in Income Year Ended Dec. 31, |
|||||||||
| 2009 | 2008 | |||||||||
| Foreign exchange contracts |
Other (income)/expense | $ | (8.8 | ) | $ | (5.9 | ) | |||
86
Table of Contents
ACCO Brands Corporation and Subsidiaries
Notes to Consolidated Financial Statements (Continued)
13. Fair Value of Financial Instruments
The Company adopted the authoritative guidance for fair value measurements on January 1, 2008 for financial assets and liabilities measured on a recurring basis. The guidance applies to all financial assets and financial liabilities that are being measured and reported on a fair value basis. There was no impact as a result of the adoption of the guidance for fair value measurements to the consolidated financial statements. On January 1, 2009, the Company adopted authoritative guidance for fair value measurements which permitted the delay of the effective date for all nonfinancial assets and nonfinancial liabilities that are required to be measured at fair value. The adoption did not impact the Company’s consolidated financial statements.
The authoritative guidance for fair value measurements requires disclosure that establishes a framework for measuring fair value and expands disclosure about fair value measurements. The guidance defines fair value as the price that would be received to sell an asset or paid to transfer a liability in an orderly transaction between market participants at the measurement date (exit price). The guidance classifies the inputs used to measure fair value into the following hierarchy:
| Level 1 | Unadjusted quoted prices in active markets for identical assets or liabilities |
| Level 2 | Unadjusted quoted prices in active markets for similar assets or liabilities, or |
| Unadjusted quoted prices for identical or similar assets or liabilities in markets that are not active, or |
| Inputs other than quoted prices that are observable for the asset or liability |
| Level 3 | Unobservable inputs for the asset or liability |
The Company utilizes the best available information in measuring fair value. Financial assets and liabilities are classified in their entirety based on the lowest level of input that is significant to the fair value measurement. The Company has determined that its financial assets and liabilities are Level 2 in the fair value hierarchy. The following table sets forth the Company’s financial assets and liabilities that were accounted for at fair value on a recurring basis as of December 31, 2009 and 2008, respectively:
| December 31, 2009 |
December 31, 2008 | |||||
| Assets: |
||||||
| Forward currency contracts |
$ | 2.0 | $ | 14.9 | ||
| Liabilities: |
||||||
| Cross-currency swap |
$ | — | $ | 29.4 | ||
| Forward currency contracts |
$ | 2.0 | $ | 12.7 | ||
The Company’s forward currency contracts are included in Other Current Assets or Other Current Liabilities and mature within 12 months. The Company’s cross-currency swap at December 31, 2008 was recorded in Other Non-Current Liabilities. As discussed in Note 11, Long-term debt and Short-term borrowings, in connection with the issuance of the Senior Secured Notes and entry into the ABL Facility, on September 30, 2009, the Company terminated its cross-currency swap agreement. The forward foreign currency exchange contracts and cross-currency swap are primarily valued based on the foreign currency spot and forward rates quoted by the banks or foreign currency dealers. As such, these derivative instruments are classified within Level 2.
87
Table of Contents
ACCO Brands Corporation and Subsidiaries
Notes to Consolidated Financial Statements (Continued)
13. Fair Value of Financial Instruments (Continued)
The fair values of cash and cash equivalents, notes payable to banks, accounts receivable and accounts payable approximate carrying amounts due principally to their short maturities. The carrying amount of total debt was $725.8 million and $708.7 million and the estimated fair value of total debt was $770.2 million and $494.3 million at December 31, 2009 and 2008, respectively. The fair values are determined from quoted market prices, where available, and from investment bankers using current interest rates considering credit ratings and the remaining terms of maturity.
14. Information on Business Segments
The Company’s business segments are aligned along geographic markets. The Company’s three business segments consist of ACCO Brands Americas, ACCO Brands International and Computer Products Group.
ACCO Brands Americas and ACCO Brands International
ACCO Brands Americas and ACCO Brands International—These two segments manufacture, source and sell traditional office products and supplies and document finishing solutions. ACCO Brands Americas comprises the North, Central and South American markets and ACCO Brands International comprises the rest of the world, principally Europe, Australia and Asia-Pacific.
Examples of our traditional office products and supplies are staplers, staples, punches, ring binders, trimmers, sheet protectors, hanging file folders, clips and fasteners, data binders, dry-erase boards, dry-erase markers, easels, bulletin boards, overhead projectors, transparencies, laser pointers and screens. These products are sold under leading brands including Quartet®, Rexel, Swingline®, Wilson Jones®, Marbig, NOBO, ACCO®, Derwent and Eastlight. Examples of our document finishing solutions are binding, lamination and punching equipment, binding and lamination supplies, report covers, archival report covers and shredders. These products are sold primarily under the GBC® brand. We also provide machine maintenance and repair services sold under the GBC brand. Included in the ACCO Brands Americas segment are our personal organization tools, including time management products, primarily sold under the Day-Timer® brand name.
The customer base to which our products are sold is made up of large global and regional resellers of our products. It is through these large resellers that the Company’s products reach the end consumer. Our customer base includes commercial contract stationers, office products superstores, wholesalers, distributors, mail order and internet catalogs, mass merchandisers, club stores and independent dealers. The majority of sales by our customers are to business end-users, which generally seek premium office products that have added value or ease of use features and a reputation for reliability, performance and professional appearance. Some of our document finishing products are sold directly to high volume end-users and commercial reprographic centers and indirectly to lower-volume consumers worldwide. Approximately two-thirds of the Day-Timer business is sold through the direct channel, which markets product through periodic sales catalogs and ships product directly to our end-user customers. The remainder of the business sells to large resellers and commercial dealers.
Computer Products Group
The Computer Products Group designs, distributes, markets and sells accessories for laptop and desktop computers and Apple® iPod® and iPhone® products. These accessories primarily include security locks, power adapters, input devices such as mice and keyboards, laptop computer carrying cases, hubs and docking stations, ergonomic devices and technology accessories for iPods® and iPhones®. The Computer Products Group sells mostly under the Kensington and Kensington Microsaver® brand names, with the majority of its revenue coming from the U.S. and Western Europe.
88
Table of Contents
ACCO Brands Corporation and Subsidiaries
Notes to Consolidated Financial Statements (Continued)
14. Information on Business Segments (Continued)
All of our computer products are manufactured to our specifications by third-party suppliers, principally in Asia, and are stored and distributed from our regional facilities. Our computer products are sold primarily to consumer electronic retailers, information technology value-added resellers, original equipment manufacturers and office products retailers.
Financial information by reportable segment is set forth below.
Net sales by business segment for the years ended December 31, 2009, 2008 and 2007 are as follows:
| (in millions of dollars) | 2009 | 2008 | 2007 | ||||||
| ACCO Brands Americas |
$ | 671.5 | $ | 820.8 | $ | 1,014.5 | |||
| ACCO Brands International |
438.0 | 551.5 | 586.7 | ||||||
| Computer Products Group |
163.0 | 205.9 | 233.6 | ||||||
| Net sales |
$ | 1,272.5 | $ | 1,578.2 | $ | 1,834.8 | |||
Operating income (loss) by business segment for the years ended December 31, 2009, 2008 and 2007 are as follows (a):
| (in millions of dollars) | 2009 | 2008 | 2007 | |||||||||
| ACCO Brands Americas(b) |
$ | 38.6 | $ | (134.0 | ) | $ | 77.8 | |||||
| ACCO Brands International(b) |
27.4 | (73.8 | ) | 13.7 | ||||||||
| Computer Products Group(b) |
31.7 | 30.1 | 46.4 | |||||||||
| Subtotal |
97.7 | (177.7 | ) | 137.9 | ||||||||
| Corporate |
(17.9 | ) | (28.4 | ) | (30.1 | ) | ||||||
| Operating income (loss) |
79.8 | (206.1 | ) | 107.8 | ||||||||
| Interest expense |
67.0 | 63.7 | 64.1 | |||||||||
| Equity in earnings of joint ventures |
(4.4 | ) | (6.5 | ) | (6.8 | ) | ||||||
| Other (income) expense, net |
5.1 | (17.2 | ) | (0.1 | ) | |||||||
| Income (loss) from continuing operations before income taxes |
$ | 12.1 | $ | (246.1 | ) | $ | 50.6 | |||||
| (a) | Operating income (loss) as presented in the segment table above is defined as i) net sales; ii) less cost of products sold; iii) less advertising, selling, general and administrative expenses; iv) less amortization of intangibles; and v) less restructuring, goodwill and asset impairment charges. |
| (b) | The table below summarizes the non-cash goodwill and asset impairment charges during 2009, 2008 and 2007. For a further discussion of the impairment charges see Note 5, Goodwill and Identifiable Intangible Assets. |
| (in millions of dollars) | 2009 | 2008 | 2007 | ||||||
| Segment: |
|||||||||
| ACCO Brands Americas |
$ | 0.9 | $ | 160.6 | $ | 1.6 | |||
| ACCO Brands International |
0.9 | 111.0 | 0.7 | ||||||
| Computer Products Group |
— | 2.8 | — | ||||||
| Total Continuing Operations |
$ | 1.8 | $ | 274.4 | $ | 2.3 | |||
89
Table of Contents
ACCO Brands Corporation and Subsidiaries
Notes to Consolidated Financial Statements (Continued)
14. Information on Business Segments (Continued)
Segment assets:
The following table presents the measure of segment assets used by the Company’s chief operating decision maker.
| December 31, | ||||||
| (in millions of dollars) | 2009 | 2008 | ||||
| ACCO Brands Americas(c) |
$ | 325.0 | $ | 400.6 | ||
| ACCO Brands International(c) |
270.3 | 278.6 | ||||
| Computer Products Group(c) |
71.0 | 85.3 | ||||
| Total segment assets |
666.3 | 764.5 | ||||
| Assets of discontinued operations |
— | 34.8 | ||||
| Unallocated assets |
432.7 | 477.5 | ||||
| Corporate(c) |
7.8 | 5.4 | ||||
| Total assets |
$ | 1,106.8 | $ | 1,282.2 | ||
| (c) | Represents total assets, excluding: goodwill and identifiable intangibles resulting from business acquisitions, intercompany balances, cash, deferred taxes, prepaid pension assets, prepaid debt issuance costs and joint ventures accounted for on an equity basis. |
As a supplement to the presentation of segment assets presented above, the table below presents segment assets, including the allocation of identifiable intangible assets and goodwill resulting from business combinations (d).
| December 31, | ||||||
| (in millions of dollars) | 2009 | 2008 | ||||
| ACCO Brands Americas(d) |
$ | 504.6 | $ | 583.0 | ||
| ACCO Brands International(d) |
363.4 | 371.5 | ||||
| Computer Products Group(d) |
87.5 | 99.4 | ||||
| Total segment assets |
955.5 | 1,053.9 | ||||
| Assets of discontinued operations |
— | 34.8 | ||||
| Unallocated assets |
143.5 | 188.1 | ||||
| Corporate(d) |
7.8 | 5.4 | ||||
| Total assets |
$ | 1,106.8 | $ | 1,282.2 | ||
| (d) | Represents total assets, excluding: intercompany balances, cash, deferred taxes, prepaid pension assets, prepaid debt issuance costs and joint ventures accounted for on an equity basis. |
Long-lived assets, net by geographic region are as follows (e):
| (in millions of dollars) | 2009 | 2008 | ||||
| United States |
$ | 99.5 | $ | 116.1 | ||
| United Kingdom |
27.0 | 25.9 | ||||
| Australia |
16.4 | 13.3 | ||||
| Portugal |
7.3 | 7.5 | ||||
| Other countries |
30.9 | 32.0 | ||||
| Long-lived assets |
$ | 181.1 | $ | 194.8 | ||
| (e) | Represents property, plant and equipment, net. |
90
Table of Contents
ACCO Brands Corporation and Subsidiaries
Notes to Consolidated Financial Statements (Continued)
14. Information on Business Segments (Continued)
Net sales by geographic region are as follows (f):
| (in millions of dollars) | 2009 | 2008 | 2007 | ||||||
| United States |
$ | 619.6 | $ | 760.3 | $ | 967.2 | |||
| Australia |
159.3 | 163.5 | 153.8 | ||||||
| United Kingdom |
105.7 | 160.7 | 194.9 | ||||||
| Canada |
87.6 | 108.9 | 124.3 | ||||||
| Other countries |
300.3 | 384.8 | 394.6 | ||||||
| Net sales |
$ | 1,272.5 | $ | 1,578.2 | $ | 1,834.8 | |||
| (f) | Net sales are attributed to geographic areas based on the location of the selling company. |
Major Customers
A significant percentage of the Company’s sales are to customers engaged in the office products resale industry. Concentration of credit risk with respect to trade accounts receivable is partially mitigated because a large number of geographically diverse customers make up each operating companies’ domestic and international customer base, thus spreading the credit risk. Consolidated trade receivables from the Company’s five largest customers were $107.9 million, $116.2 million and $173.0 million at December 31, 2009, 2008 and 2007, respectively.
Sales to the Company’s five largest customers totaled $466.4 million, $564.3 million and $725.8 million in 2009, 2008 and 2007, respectively. Our sales to Staples were $159.8 million (13%), $202.2 million (13%) and $222.1 (12%) in 2009, 2008 and 2007, respectively. Our sales to Office Depot were $137.0 (11%), $174.2 (11%) and $238.5 (13%) in 2009, 2008 and 2007, respectively. Sales to no other customer exceeded 10% of annual sales.
91
Table of Contents
ACCO Brands Corporation and Subsidiaries
Notes to Consolidated Financial Statements (Continued)
15. Earnings per Share
The calculation of basic earnings per common share is based on the weighted average number of common shares outstanding in the year over which they were outstanding. The Company’s diluted earnings per common share assume that any common shares outstanding were increased by shares that would be issued upon exercise of those stock options for which the average market price for the period exceeds the exercise price; less, the shares that could have been purchased by the Company with the related proceeds, including compensation expense measured but not yet recognized, net of tax. Due to the loss from continuing operations in 2009 and 2008 the denominator in the diluted earnings per share calculation does not include the effects of options as it would result in a less dilutive computation. As a result, 2009 and 2008 diluted earnings per share from continuing operations are the same as basic earnings per share.
| (in millions) | 2009 | 2008 | 2007 | |||
| Weighted average number of common shares outstanding—basic |
54.5 | 54.2 | 54.0 | |||
| Employee stock options |
— | — | 0.8 | |||
| Restricted stock units |
— | — | 0.2 | |||
| Adjusted weighted-average shares and assumed conversions—diluted(1) |
54.5 | 54.2 | 55.0 |
| (1) | The Company has dilutive shares related to stock options, stock-settled appreciation rights and restricted stock units that were granted under the Company’s stock compensation plans. As of December 31, 2009, 2008 and 2007, approximately 7.5 million, 5.5 million and 3.9 million shares, respectively, were excluded from the calculation of diluted earnings per share as their inclusion would have been anti-dilutive. |
16. Commitments and Contingencies
Pending Litigation
The Company and its subsidiaries are defendants in various claims and legal proceedings associated with their business and operations. It is not possible to predict the outcome of the pending actions, but management believes that there are meritorious defenses to these actions and that these actions if adjudicated or settled in a manner adverse to the Company, would not have a material adverse effect upon the results of operations, cash flows or financial condition of the Company.
Lease Commitments
| (in millions of dollars) | |||
| 2010 |
$ | 21.4 | |
| 2011 |
15.4 | ||
| 2012 |
11.1 | ||
| 2013 |
6.9 | ||
| 2014 |
4.4 | ||
| Remainder |
22.8 | ||
| Total minimum rental payments |
82.0 | ||
| Less minimum rentals to be received under non-cancelable subleases |
— | ||
| $ | 82.0 | ||
Total rental expense reported in the Company’s statement of operations for continuing operations for all non-cancelable operating leases (reduced by minor amounts from subleases) amounted to $26.5 million, $23.9 million and $25.3 million in 2009, 2008 and 2007, respectively.
92
Table of Contents
ACCO Brands Corporation and Subsidiaries
Notes to Consolidated Financial Statements (Continued)
16. Commitments and Contingencies (Continued)
Unconditional Purchase Commitments
Future minimum payments under unconditional purchase commitments, primarily for inventory purchase commitments at December 31, 2009 are as follows:
| (in millions of dollars) | |||
| 2010 |
$ | 23.7 | |
| 2011 |
1.5 | ||
| 2012 |
0.9 | ||
| 2013 |
0.1 | ||
| $ | 26.2 | ||
Environmental
The Company is subject to laws and regulations relating to the protection of the environment. While it is not possible to quantify with certainty the potential impact of actions regarding environmental matters, particularly remediation and other compliance efforts that the Company’s subsidiaries may undertake in the future, in the opinion of management, compliance with the present environmental protection laws, before taking into account any estimated recoveries from third parties, will not have a material adverse effect upon the results of operations, cash flows or financial condition of the Company.
17. Accumulated Other Comprehensive Income (Loss)
Comprehensive income is defined as net income (loss) and other changes in stockholders’ equity from transactions and other events from sources other than stockholders. The components of and changes in accumulated other comprehensive income (loss) were:
| (in millions of dollars) | Derivative Financial Instruments |
Foreign Currency Adjustments |
Unrecognized Pension and Other Postretirement Benefit Costs |
Accumulated Other Comprehensive Income (Loss) |
||||||||||||
| Balance at December 31, 2007 |
$ | (1.6 | ) | $ | 19.5 | $ | (27.1 | ) | $ | (9.2 | ) | |||||
| Changed during the year (net of taxes of $24.3) |
3.9 | (59.3 | ) | (52.9 | ) | (108.3 | ) | |||||||||
| Balance at December 31, 2008 |
2.3 | (39.8 | ) | (80.0 | ) | (117.5 | ) | |||||||||
| Changed during the year (net of taxes of $(1.0)) |
(3.3 | ) | 26.7 | (12.9 | ) | 10.5 | ||||||||||
| Balance at December 31, 2009 |
$ | (1.0 | ) | $ | (13.1 | ) | $ | (92.9 | ) | $ | (107.0 | ) | ||||
93
Table of Contents
ACCO Brands Corporation and Subsidiaries
Notes to Consolidated Financial Statements (Continued)
18. Joint Venture Investments
Summarized below is financial information for the Company’s joint ventures, which are accounted for under the equity method. Accordingly, the Company has recorded its proportionate share of earnings or losses on the line entitled “Equity in earnings of joint ventures” in the consolidated statements of operations:
| Year Ended December 31, | |||||||||
| (in millions of dollars) | 2009 | 2008 | 2007 | ||||||
| Net sales |
$ | 134.9 | $ | 124.3 | $ | 121.3 | |||
| Gross profit |
71.6 | 69.4 | 63.7 | ||||||
| Operating income |
13.4 | 17.7 | 17.6 | ||||||
| Net income |
8.8 | 13.7 | 13.3 | ||||||
| December 31, | |||||||||
| (in millions of dollars) | 2009 | 2008 | |||||||
| Current assets |
78.0 | 48.6 | |||||||
| Noncurrent assets |
35.2 | 18.4 | |||||||
| Current liabilities |
36.3 | 26.2 | |||||||
| Noncurrent liabilities |
25.0 | 8.7 | |||||||
19. Subsequent Events
Management has evaluated and disclosed, as required, any subsequent events up to and including February 26, 2010, the date of the filing of this report with the Securities and Exchange Commission.
94
Table of Contents
ACCO Brands Corporation and Subsidiaries
Notes to Consolidated Financial Statements (Continued)
20. Quarterly Financial Information (Unaudited)
The following is an analysis of certain items in the consolidated statements of operations by quarter for 2009 and 2008:
| (in millions of dollars, except per share data) | 1st Quarter | 2nd Quarter | 3rd Quarter | 4th Quarter | ||||||||||||
| 2009 |
||||||||||||||||
| Net sales |
$ | 293.4 | $ | 303.8 | $ | 322.5 | $ | 352.8 | ||||||||
| Gross profit |
82.1 | 88.8 | 99.9 | 108.5 | ||||||||||||
| Operating income(1) |
13.4 | 11.0 | 27.5 | 27.9 | ||||||||||||
| Income (loss) from continuing operations(1,2) |
(3.7 | ) | (116.7 | ) | 1.7 | 2.9 | ||||||||||
| Loss from discontinued operations(1) |
(3.3 | ) | (4.7 | ) | (0.4 | ) | (1.9 | ) | ||||||||
| Net income (loss)(1) |
(7.0 | ) | (121.4 | ) | 1.3 | 1.0 | ||||||||||
| Basic earnings per common share: |
||||||||||||||||
| Income (loss) from continuing operations(1,2) |
$ | (0.07 | ) | $ | (2.14 | ) | $ | 0.03 | $ | 0.05 | ||||||
| Loss from discontinued operations(1) |
(0.06 | ) | (0.09 | ) | (0.01 | ) | (0.04 | ) | ||||||||
| Net income (loss)(1,2) |
$ | (0.13 | ) | $ | (2.23 | ) | $ | 0.02 | $ | 0.02 | ||||||
| Diluted earnings per common share: |
||||||||||||||||
| Income (loss) from continuing operations(1,2) |
$ | (0.07 | ) | $ | (2.14 | ) | $ | 0.03 | $ | 0.05 | ||||||
| Loss from discontinued operations(1) |
(0.06 | ) | (0.09 | ) | (0.01 | ) | (0.03 | ) | ||||||||
| Net income (loss)(1,2) |
$ | (0.13 | ) | $ | (2.23 | ) | $ | 0.02 | $ | 0.02 | ||||||
| 2008 |
||||||||||||||||
| Net sales |
$ | 400.0 | $ | 414.0 | $ | 410.8 | $ | 353.4 | ||||||||
| Gross profit |
120.9 | 124.8 | 125.8 | 112.3 | ||||||||||||
| Operating income (loss)(1) |
10.4 | 12.0 | 18.2 | (246.7 | ) | |||||||||||
| Loss from continuing operations(1) |
(2.1 | ) | (5.8 | ) | (15.0 | ) | (240.1 | ) | ||||||||
| Income (loss) from discontinued operations(1) |
0.3 | (40.9 | ) | (17.7 | ) | (17.9 | ) | |||||||||
| Net loss(1) |
(1.8 | ) | (46.7 | ) | (32.7 | ) | (258.0 | ) | ||||||||
| Basic earnings per common share: |
||||||||||||||||
| Loss from continuing operations(1) |
$ | (0.04 | ) | $ | (0.11 | ) | $ | (0.28 | ) | $ | (4.43 | ) | ||||
| Income (loss) from discontinued operations(1) |
0.01 | (0.75 | ) | (0.33 | ) | (0.33 | ) | |||||||||
| Net loss(1) |
$ | (0.03 | ) | $ | (0.86 | ) | $ | (0.60 | ) | $ | (4.76 | ) | ||||
| Diluted earnings per common share: |
||||||||||||||||
| Loss from continuing operations(1) |
$ | (0.04 | ) | $ | (0.11 | ) | $ | (0.28 | ) | $ | (4.43 | ) | ||||
| Income (loss) from discontinued operations(1) |
0.01 | (0.75 | ) | (0.33 | ) | (0.33 | ) | |||||||||
| Net loss(1) |
$ | (0.03 | ) | $ | (0.86 | ) | $ | (0.60 | ) | $ | (4.76 | ) | ||||
| (1) | During the second quarter of 2009, the Company recorded pre-tax non-cash trade name impairment charges totaling $1.8 million related to the ACCO Brands Americas ($0.9 million) and ACCO Brands International ($0.9 million) reporting units. The 2008 results include non-cash goodwill and asset impairment charges. The table below summarizes the quarterly pre-tax impacts of the non-cash goodwill and asset impairment charges during 2008. For a further discussion of the impairment charges see Note 5, Goodwill and Identifiable Intangible Assets and Note 10, Discontinued Operations. |
95
Table of Contents
ACCO Brands Corporation and Subsidiaries
Notes to Consolidated Financial Statements (Continued)
20. Quarterly Financial Information (Unaudited) (Continued)
| (in millions of dollars) | First Quarter |
Second Quarter |
Third Quarter |
Fourth Quarter | ||||||||
| Continuing Operations |
||||||||||||
| Segment: |
||||||||||||
| ACCO Brands Americas |
$ | — | $ | 9.9 | $ | 6.8 | $ | 143.9 | ||||
| ACCO Brands International |
— | 4.2 | 4.5 | 102.3 | ||||||||
| Computer Products Group |
— | — | — | 2.8 | ||||||||
| Total Continuing Operations |
$ | — | $ | 14.1 | $ | 11.3 | $ | 249.0 | ||||
| Discontinued Operations |
$ | — | $ | 48.3 | $ | 19.5 | $ | 17.0 | ||||
| (2) | During the second quarter of 2009, the Company recorded a non-cash charge of $108.1 million to establish a valuation allowance against its U.S. deferred taxes. For a further discussion of the valuation allowance see Note 6, Income Taxes. |
21. Condensed Consolidated Financial Information
The Company’s 100% owned domestic subsidiaries are required to jointly and severally, fully and unconditionally guarantee the notes issued in 2005 (see Note 11, Long-term Debt and Short-term Borrowings). Rather than filing separate financial statements for each guarantor subsidiary with the Securities and Exchange Commission, the Company has elected to present the following consolidating financial statements, which detail the results of operations for the years ended December 31, 2009, 2008 and 2007, cash flows for the years ended December 31, 2009, 2008 and 2007 and financial position as of December 31, 2009 and 2008 of the Company and its guarantor and non-guarantor subsidiaries (in each case carrying investments under the equity method), and the eliminations necessary to arrive at the reported consolidated financial statements of the Company.
96
Table of Contents
ACCO Brands Corporation and Subsidiaries
Notes to Consolidated Financial Statements (Continued)
21. Condensed Consolidated Financial Information (Continued)
Condensed Consolidating Balance Sheets
| December 31, 2009 | ||||||||||||||||||||
| (in millions of dollars) | Parent | Guarantors | Non-Guarantors | Eliminations | Consolidated | |||||||||||||||
| Assets |
||||||||||||||||||||
| Current assets |
||||||||||||||||||||
| Cash and cash equivalents |
$ | 14.2 | $ | (1.5 | ) | $ | 30.9 | $ | — | $ | 43.6 | |||||||||
| Accounts receivable, net |
— | 89.4 | 170.5 | — | 259.9 | |||||||||||||||
| Inventories |
— | 106.4 | 96.0 | — | 202.4 | |||||||||||||||
| Receivables from affiliates |
314.2 | 74.3 | 36.9 | (425.4 | ) | — | ||||||||||||||
| Deferred income taxes |
2.2 | — | 7.6 | — | 9.8 | |||||||||||||||
| Other current assets |
2.7 | 7.3 | 11.4 | — | 21.4 | |||||||||||||||
| Total current assets |
333.3 | 275.9 | 353.3 | (425.4 | ) | 537.1 | ||||||||||||||
| Property, plant and equipment, net |
1.6 | 97.9 | 81.6 | — | 181.1 | |||||||||||||||
| Deferred income taxes |
18.8 | — | 12.7 | — | 31.5 | |||||||||||||||
| Goodwill |
— | 93.4 | 50.0 | — | 143.4 | |||||||||||||||
| Identifiable intangibles, net |
58.0 | 57.8 | 30.0 | — | 145.8 | |||||||||||||||
| Other assets |
25.9 | 4.6 | 37.4 | — | 67.9 | |||||||||||||||
| Investment in, long-term receivable from, affiliates |
510.9 | 854.9 | 200.0 | (1,565.8 | ) | — | ||||||||||||||
| Total assets |
$ | 948.5 | $ | 1,384.5 | $ | 765.0 | $ | (1,991.2 | ) | $ | 1,106.8 | |||||||||
| Liabilities and Stockholders’ (Deficit) Equity |
||||||||||||||||||||
| Current liabilities |
||||||||||||||||||||
| Notes payable to banks |
$ | — | $ | — | $ | 0.5 | $ | — | $ | 0.5 | ||||||||||
| Current portion of long-term debt |
— | 0.1 | 0.1 | — | 0.2 | |||||||||||||||
| Accounts payable |
— | 54.8 | 46.2 | — | 101.0 | |||||||||||||||
| Accrued compensation |
2.6 | 4.6 | 11.7 | — | 18.9 | |||||||||||||||
| Accrued customer program liabilities |
— | 27.8 | 46.8 | — | 74.6 | |||||||||||||||
| Accrued interest |
20.0 | — | — | — | 20.0 | |||||||||||||||
| Other current liabilities |
1.9 | 29.6 | 46.6 | — | 78.1 | |||||||||||||||
| Payables to affiliates |
63.9 | 497.7 | 293.5 | (855.1 | ) | — | ||||||||||||||
| Liabilities of discontinued operations held for sale |
— | 4.5 | 1.1 | — | 5.6 | |||||||||||||||
| Total current liabilities |
88.4 | 619.1 | 446.5 | (855.1 | ) | 298.9 | ||||||||||||||
| Long-term debt |
724.7 | 0.4 | — | — | 725.1 | |||||||||||||||
| Long-term notes payable to affiliates |
178.2 | 16.4 | 1.6 | (196.2 | ) | — | ||||||||||||||
| Deferred income taxes |
67.8 | 3.8 | 15.0 | — | 86.6 | |||||||||||||||
| Pension and other post retirement obligations |
5.1 | 48.8 | 40.7 | — | 94.6 | |||||||||||||||
| Other non-current liabilities |
1.5 | 5.8 | 11.5 | — | 18.8 | |||||||||||||||
| Total liabilities |
1,065.7 | 694.3 | 515.3 | (1,051.3 | ) | 1,224.0 | ||||||||||||||
| Stockholders’ (deficit) equity |
||||||||||||||||||||
| Common stock |
0.5 | 562.2 | 76.0 | (638.2 | ) | 0.5 | ||||||||||||||
| Treasury stock, at cost |
(1.4 | ) | — | — | — | (1.4 | ) | |||||||||||||
| Paid-in capital |
1,397.0 | 661.4 | 303.9 | (965.3 | ) | 1,397.0 | ||||||||||||||
| Accumulated other comprehensive income (loss) |
(107.0 | ) | (50.1 | ) | (21.7 | ) | 71.8 | (107.0 | ) | |||||||||||
| Accumulated (deficit) retained earnings |
(1,406.3 | ) | (483.3 | ) | (108.5 | ) | 591.8 | (1,406.3 | ) | |||||||||||
| Total stockholders’ (deficit) equity |
(117.2 | ) | 690.2 | 249.7 | (939.9 | ) | (117.2 | ) | ||||||||||||
| Total liabilities and stockholders’ (deficit) equity |
$ | 948.5 | $ | 1,384.5 | $ | 765.0 | $ | (1,991.2 | ) | $ | 1,106.8 | |||||||||
97
Table of Contents
ACCO Brands Corporation and Subsidiaries
Notes to Consolidated Financial Statements (Continued)
21. Condensed Consolidated Financial Information (Continued)
Condensed Consolidating Balance Sheets
| December 31, 2008 | ||||||||||||||||||||
| (in millions of dollars) | Parent | Guarantors | Non-Guarantors | Eliminations | Consolidated | |||||||||||||||
| Assets |
||||||||||||||||||||
| Current assets |
||||||||||||||||||||
| Cash and cash equivalents |
$ | 0.5 | $ | (0.8 | ) | $ | 18.4 | $ | — | $ | 18.1 | |||||||||
| Accounts receivable, net |
— | (9.0 | ) | 283.8 | — | 274.8 | ||||||||||||||
| Inventories |
— | 154.3 | 112.2 | — | 266.5 | |||||||||||||||
| Receivables from affiliates |
198.8 | 38.1 | 249.9 | (486.8 | ) | — | ||||||||||||||
| Deferred income taxes |
15.4 | 8.2 | 9.4 | — | 33.0 | |||||||||||||||
| Other current assets |
2.8 | 13.4 | 22.9 | — | 39.1 | |||||||||||||||
| Assets of discontinued operations held for sale |
— | 12.3 | 20.9 | — | 33.2 | |||||||||||||||
| Total current assets |
217.5 | 216.5 | 717.5 | (486.8 | ) | 664.7 | ||||||||||||||
| Property, plant and equipment, net |
1.7 | 114.3 | 78.8 | — | 194.8 | |||||||||||||||
| Deferred income taxes |
50.0 | 25.8 | 5.9 | — | 81.7 | |||||||||||||||
| Goodwill |
— | 72.0 | 67.5 | — | 139.5 | |||||||||||||||
| Identifiable intangibles, net |
58.1 | 60.3 | 31.5 | — | 149.9 | |||||||||||||||
| Other assets |
19.1 | 4.7 | 26.2 | — | 50.0 | |||||||||||||||
| Investment in, long-term receivable from, affiliates |
556.4 | 1,045.9 | 198.0 | (1,800.3 | ) | — | ||||||||||||||
| Assets of discontinued operations held for sale |
— | 0.5 | 1.1 | — | 1.6 | |||||||||||||||
| Total assets |
$ | 902.8 | $ | 1,540.0 | $ | 1,126.5 | $ | (2,287.1 | ) | $ | 1,282.2 | |||||||||
| Liabilities and Stockholders’ (Deficit) Equity |
||||||||||||||||||||
| Current liabilities |
||||||||||||||||||||
| Notes payable to banks |
$ | 36.0 | $ | — | $ | 2.6 | $ | — | $ | 38.6 | ||||||||||
| Current portion of long-term debt |
— | 0.1 | 25.8 | — | 25.9 | |||||||||||||||
| Accounts payable |
— | 79.5 | 64.3 | — | 143.8 | |||||||||||||||
| Accrued compensation |
3.0 | 5.9 | 12.6 | — | 21.5 | |||||||||||||||
| Accrued customer program liabilities |
— | 42.9 | 43.9 | — | 86.8 | |||||||||||||||
| Accrued interest |
10.1 | 0.9 | 0.9 | — | 11.9 | |||||||||||||||
| Other current liabilities |
4.4 | 49.5 | 66.3 | — | 120.2 | |||||||||||||||
| Payables to affiliates |
50.6 | 599.0 | 281.0 | (930.6 | ) | — | ||||||||||||||
| Liabilities of discontinued operations held for sale |
— | 7.6 | 7.5 | — | 15.1 | |||||||||||||||
| Total current liabilities |
104.1 | 785.4 | 504.9 | (930.6 | ) | 463.8 | ||||||||||||||
| Long-term debt |
546.4 | 0.5 | 97.3 | — | 644.2 | |||||||||||||||
| Long-term notes payable to affiliates |
178.2 | 83.8 | 2.1 | (264.1 | ) | — | ||||||||||||||
| Deferred income taxes |
37.2 | (8.1 | ) | 13.7 | — | 42.8 | ||||||||||||||
| Pension and other post retirement obligations |
5.5 | 66.1 | 17.1 | — | 88.7 | |||||||||||||||
| Other non-current liabilities |
34.8 | 7.6 | 1.8 | — | 44.2 | |||||||||||||||
| Liabilities of discontinued operations held for sale |
— | — | 1.9 | — | 1.9 | |||||||||||||||
| Total liabilities |
906.2 | 935.3 | 638.8 | (1,194.7 | ) | 1,285.6 | ||||||||||||||
| Stockholders’ (deficit) equity |
||||||||||||||||||||
| Common stock |
0.6 | 562.1 | 76.0 | (638.1 | ) | 0.6 | ||||||||||||||
| Treasury stock, at cost |
(1.1 | ) | — | — | — | (1.1 | ) | |||||||||||||
| Paid-in capital |
1,394.8 | 675.3 | 517.3 | (1,192.6 | ) | 1,394.8 | ||||||||||||||
| Accumulated other comprehensive income (loss) |
(117.5 | ) | (59.1 | ) | (36.8 | ) | 95.9 | (117.5 | ) | |||||||||||
| Accumulated (deficit) retained earnings |
(1,280.2 | ) | (573.6 | ) | (68.8 | ) | 642.4 | (1,280.2 | ) | |||||||||||
| Total stockholders’ (deficit) equity |
(3.4 | ) | 604.7 | 487.7 | (1,092.4 | ) | (3.4 | ) | ||||||||||||
| Total liabilities and stockholders’ (deficit) equity |
$ | 902.8 | $ | 1,540.0 | $ | 1,126.5 | $ | (2,287.1 | ) | $ | 1,282.2 | |||||||||
98
Table of Contents
ACCO Brands Corporation and Subsidiaries
Notes to Consolidated Financial Statements (Continued)
21. Condensed Consolidated Financial Information (Continued)
Consolidating Statement of Operations
| Year Ended December 31, 2009 | ||||||||||||||||||||
| (in millions of dollars) | Parent | Guarantors | Non-Guarantors | Eliminations | Consolidated | |||||||||||||||
| Unaffiliated sales |
$ | — | $ | 619.6 | $ | 652.9 | $ | — | $ | 1,272.5 | ||||||||||
| Affiliated sales |
— | 22.7 | 3.4 | (26.1 | ) | — | ||||||||||||||
| Net sales |
— | 642.3 | 656.3 | (26.1 | ) | 1,272.5 | ||||||||||||||
| Cost of products sold |
— | 473.7 | 445.6 | (26.1 | ) | 893.2 | ||||||||||||||
| Gross profit |
— | 168.6 | 210.7 | — | 379.3 | |||||||||||||||
| Advertising, selling, general and administrative expenses |
18.6 | 131.3 | 123.2 | — | 273.1 | |||||||||||||||
| Amortization of intangibles |
0.1 | 4.1 | 3.0 | — | 7.2 | |||||||||||||||
| Restructuring charges |
0.1 | 3.7 | 13.6 | — | 17.4 | |||||||||||||||
| Goodwill and asset impairment charges |
— | 0.8 | 1.0 | — | 1.8 | |||||||||||||||
| Operating income (loss) |
(18.8 | ) | 28.7 | 69.9 | — | 79.8 | ||||||||||||||
| Interest (income) expense from affiliates |
(0.1 | ) | (0.5 | ) | 0.6 | — | — | |||||||||||||
| Interest expense |
53.3 | 7.2 | 6.5 | — | 67.0 | |||||||||||||||
| Equity in (earnings) of joint ventures |
— | 0.2 | (4.6 | ) | — | (4.4 | ) | |||||||||||||
| Other (income) expense, net |
4.0 | (16.0 | ) | 17.1 | — | 5.1 | ||||||||||||||
| Income (loss) from continuing operations before income taxes and earnings (losses) of wholly owned subsidiaries |
(76.0 | ) | 37.8 | 50.3 | — | 12.1 | ||||||||||||||
| Income taxes |
110.5 | (2.4 | ) | 19.8 | — | 127.9 | ||||||||||||||
| Income (loss) from continuing operations |
(186.5 | ) | 40.2 | 30.5 | — | (115.8 | ) | |||||||||||||
| Income (loss) from discontinued operations, net of income taxes |
— | (15.1 | ) | 4.8 | — | (10.3 | ) | |||||||||||||
| Income (loss) before earnings (losses) of wholly owned subsidiaries |
(186.5 | ) | 25.1 | 35.3 | — | (126.1 | ) | |||||||||||||
| Earnings (losses) of wholly owned subsidiaries |
60.4 | (13.3 | ) | — | (47.1 | ) | — | |||||||||||||
| Net income (loss) |
$ | (126.1 | ) | $ | 11.8 | $ | 35.3 | $ | (47.1 | ) | $ | (126.1 | ) | |||||||
99
Table of Contents
ACCO Brands Corporation and Subsidiaries
Notes to Consolidated Financial Statements (Continued)
21. Condensed Consolidated Financial Information (Continued)
Consolidating Statement of Operations
| Year Ended December 31, 2008 | ||||||||||||||||||||
| (in millions of dollars) | Parent | Guarantors | Non-Guarantors | Eliminations | Consolidated | |||||||||||||||
| Unaffiliated sales |
$ | — | $ | 760.2 | $ | 818.0 | $ | — | $ | 1,578.2 | ||||||||||
| Affiliated sales |
— | 59.7 | 30.9 | (90.6 | ) | — | ||||||||||||||
| Net sales |
— | 819.9 | 848.9 | (90.6 | ) | 1,578.2 | ||||||||||||||
| Cost of products sold |
— | 600.9 | 584.1 | (90.6 | ) | 1,094.4 | ||||||||||||||
| Gross profit |
— | 219.0 | 264.8 | — | 483.8 | |||||||||||||||
| Advertising, selling, general and administrative expenses |
27.2 | 192.7 | 159.1 | — | 379.0 | |||||||||||||||
| Amortization of intangibles |
0.1 | 3.8 | 3.8 | — | 7.7 | |||||||||||||||
| Restructuring charges |
0.1 | 16.0 | 12.7 | — | 28.8 | |||||||||||||||
| Goodwill and asset impairment charges |
11.9 | 142.4 | 120.1 | — | 274.4 | |||||||||||||||
| Operating income (loss) |
(39.3 | ) | (135.9 | ) | (30.9 | ) | — | (206.1 | ) | |||||||||||
| Interest (income) expense from affiliates |
(3.3 | ) | (2.3 | ) | 5.6 | — | — | |||||||||||||
| Interest expense |
46.6 | 6.1 | 11.0 | — | 63.7 | |||||||||||||||
| Equity in (earnings) of joint ventures |
— | (0.1 | ) | (6.4 | ) | — | (6.5 | ) | ||||||||||||
| Other (income) expense, net |
(18.7 | ) | (2.8 | ) | 4.3 | — | (17.2 | ) | ||||||||||||
| Income (loss) from continuing operations before income taxes earnings (losses) of wholly owned subsidiaries |
(63.9 | ) | (136.8 | ) | (45.4 | ) | — | (246.1 | ) | |||||||||||
| Income taxes |
3.3 | (11.8 | ) | 25.4 | — | 16.9 | ||||||||||||||
| Income (loss) from continuing operations |
(67.2 | ) | (125.0 | ) | (70.8 | ) | — | (263.0 | ) | |||||||||||
| Income (loss) from discontinued operations, net of income taxes |
— | (39.9 | ) | (36.3 | ) | — | (76.2 | ) | ||||||||||||
| Income (loss) before earnings (losses) of wholly owned subsidiaries |
(67.2 | ) | (164.9 | ) | (107.1 | ) | — | (339.2 | ) | |||||||||||
| Earnings (losses) of wholly owned subsidiaries |
(272.0 | ) | 12.5 | — | 259.5 | — | ||||||||||||||
| Net income (loss) |
$ | (339.2 | ) | $ | (152.4 | ) | $ | (107.1 | ) | $ | 259.5 | $ | (339.2 | ) | ||||||
100
Table of Contents
ACCO Brands Corporation and Subsidiaries
Notes to Consolidated Financial Statements (Continued)
21. Condensed Consolidated Financial Information (Continued)
Consolidated Statement of Operations
| Year Ended December 31, 2007 | ||||||||||||||||||||
| (in millions of dollars) | Parent | Guarantors | Non-Guarantors | Eliminations | Consolidated | |||||||||||||||
| Unaffiliated sales |
$ | — | $ | 967.1 | $ | 867.7 | $ | — | $ | 1,834.8 | ||||||||||
| Affiliated sales |
— | 56.7 | 44.3 | (101.0 | ) | — | ||||||||||||||
| Net sales |
— | 1,023.8 | 912.0 | (101.0 | ) | 1,834.8 | ||||||||||||||
| Cost of products sold |
— | 734.6 | 628.7 | (101.0 | ) | 1,262.3 | ||||||||||||||
| Gross profit |
— | 289.2 | 283.3 | — | 572.5 | |||||||||||||||
| Advertising, selling, general and administrative expenses |
35.3 | 217.1 | 181.1 | — | 433.5 | |||||||||||||||
| Amortization of intangibles |
0.1 | 4.0 | 3.8 | — | 7.9 | |||||||||||||||
| Restructuring charges |
— | 2.3 | 18.7 | — | 21.0 | |||||||||||||||
| Goodwill and asset impairment charges |
— | 1.6 | 0.7 | — | 2.3 | |||||||||||||||
| Operating income (loss) |
(35.4 | ) | 64.2 | 79.0 | — | 107.8 | ||||||||||||||
| Interest (income) expense from affiliates |
(3.2 | ) | (1.6 | ) | 4.8 | — | — | |||||||||||||
| Interest expense |
42.7 | 11.0 | 10.4 | — | 64.1 | |||||||||||||||
| Equity in (earnings) losses of joint ventures |
— | 0.1 | (6.9 | ) | — | (6.8 | ) | |||||||||||||
| Other (income) expense, net |
(1.6 | ) | (8.8 | ) | 10.3 | — | (0.1 | ) | ||||||||||||
| Income (loss) from continuing operations before income taxes and earnings (losses) of wholly owned subsidiaries |
(73.3 | ) | 63.5 | 60.4 | — | 50.6 | ||||||||||||||
| Income taxes |
0.1 | (0.6 | ) | 17.1 | — | 16.6 | ||||||||||||||
| Income (loss) from continuing operations |
(73.4 | ) | 64.1 | 43.3 | — | 34.0 | ||||||||||||||
| Income (loss) from discontinued operations, net of income taxes |
— | (22.2 | ) | (12.7 | ) | — | (34.9 | ) | ||||||||||||
| Income (loss) before earnings (losses) of wholly owned subsidiaries |
(73.4 | ) | 41.9 | 30.6 | — | (0.9 | ) | |||||||||||||
| Earnings (losses) of wholly owned subsidiaries |
72.5 | 0.9 | — | (73.4 | ) | — | ||||||||||||||
| Net income (loss) |
$ | (0.9 | ) | $ | 42.8 | $ | 30.6 | $ | (73.4 | ) | $ | (0.9 | ) | |||||||
101
Table of Contents
ACCO Brands Corporation and Subsidiaries
Notes to Consolidated Financial Statements (Continued)
21. Condensed Consolidated Financial Information (Continued)
Condensed Consolidating Statement of Cash Flows
| Year Ended December 31, 2009 | ||||||||||||||||
| (in millions of dollars) | Parent | Guarantors | Non-Guarantors | Consolidated | ||||||||||||
| Net cash provided by operating activities: |
$ | (58.1 | ) | $ | 94.6 | $ | 35.0 | $ | 71.5 | |||||||
| Investing activities: |
||||||||||||||||
| Additions to property, plant and equipment |
(0.4 | ) | (3.9 | ) | (6.0 | ) | (10.3 | ) | ||||||||
| Assets acquired |
(1.9 | ) | (0.9 | ) | (0.6 | ) | (3.4 | ) | ||||||||
| Proceeds from sale of discontinued operations |
— | 2.1 | 7.1 | 9.2 | ||||||||||||
| Proceeds from the disposition of assets |
— | — | 0.6 | 0.6 | ||||||||||||
| Net cash provided by (used by) investing activities |
(2.3 | ) | (2.7 | ) | 1.1 | (3.9 | ) | |||||||||
| Financing activities: |
||||||||||||||||
| Intercompany financing |
(17.6 | ) | (111.5 | ) | 129.1 | — | ||||||||||
| Net dividends |
3.2 | 18.9 | (22.1 | ) | — | |||||||||||
| Proceeds from long-term borrowings |
463.1 | — | 6.2 | 469.3 | ||||||||||||
| Repayments of long-term debt |
(270.1 | ) | — | (127.8 | ) | (397.9 | ) | |||||||||
| Repayments of short-term debt |
(46.0 | ) | — | (8.2 | ) | (54.2 | ) | |||||||||
| Payment of Euro debt hedge |
(40.8 | ) | — | — | (40.8 | ) | ||||||||||
| Cost of debt issuance |
(17.4 | ) | — | (3.2 | ) | (20.6 | ) | |||||||||
| Proceeds from the exercise of stock options |
(0.3 | ) | — | — | (0.3 | ) | ||||||||||
| Net cash provided by (used by) financing activities |
74.1 | (92.6 | ) | (26.0 | ) | (44.5 | ) | |||||||||
| Effect of foreign exchange rate changes on cash |
— | — | 2.4 | 2.4 | ||||||||||||
| Net increase (decrease) in cash and cash equivalents |
13.7 | (0.7 | ) | 12.5 | 25.5 | |||||||||||
| Cash and cash equivalents at the beginning of the period |
0.5 | (0.8 | ) | 18.4 | 18.1 | |||||||||||
| Cash and cash equivalents at the end of the period |
$ | 14.2 | $ | (1.5 | ) | $ | 30.9 | $ | 43.6 | |||||||
102
Table of Contents
ACCO Brands Corporation and Subsidiaries
Notes to Consolidated Financial Statements (Continued)
21. Condensed Consolidated Financial Information (Continued)
Condensed Consolidating Statement of Cash Flows
| Year Ended December 31, 2008 | ||||||||||||||||
| (in millions of dollars) | Parent | Guarantors | Non-Guarantors | Consolidated | ||||||||||||
| Net cash provided by operating activities: |
$ | (65.1 | ) | $ | 61.3 | $ | 41.0 | $ | 37.2 | |||||||
| Investing activities: |
||||||||||||||||
| Additions to property, plant and equipment |
(0.9 | ) | (30.3 | ) | (12.3 | ) | (43.5 | ) | ||||||||
| Proceeds from the disposition of assets |
— | 7.7 | 17.1 | 24.8 | ||||||||||||
| Net cash provided by (used by) investing activities |
(0.9 | ) | (22.6 | ) | 4.8 | (18.7 | ) | |||||||||
| Financing activities: |
||||||||||||||||
| Intercompany financing |
113.6 | (180.9 | ) | 67.3 | — | |||||||||||
| Net dividends |
— | 11.2 | (11.2 | ) | — | |||||||||||
| Repayments of long-term debt |
(85.6 | ) | 111.0 | (88.5 | ) | (63.1 | ) | |||||||||
| Proceeds from short-term debt |
36.0 | — | (4.0 | ) | 32.0 | |||||||||||
| Cost of debt amendments |
(6.2 | ) | — | (0.7 | ) | (6.9 | ) | |||||||||
| Proceeds from the exercise of stock options |
0.3 | — | — | 0.3 | ||||||||||||
| Net cash provided by (used by) financing activities |
58.1 | (58.7 | ) | (37.1 | ) | (37.7 | ) | |||||||||
| Effect of foreign exchange rate changes on cash |
— | — | (5.0 | ) | (5.0 | ) | ||||||||||
| Net increase (decrease) in cash and cash equivalents |
(7.9 | ) | (20.0 | ) | 3.7 | (24.2 | ) | |||||||||
| Cash and cash equivalents at the beginning of the period |
8.4 | (0.3 | ) | 34.2 | 42.3 | |||||||||||
| Cash and cash equivalents at the end of the period |
$ | 0.5 | $ | (20.3 | ) | $ | 37.9 | $ | 18.1 | |||||||
103
Table of Contents
ACCO Brands Corporation and Subsidiaries
Notes to Consolidated Financial Statements (Continued)
21. Condensed Consolidated Financial Information (Continued)
Condensed Consolidating Statement of Cash Flows
| Year Ended December 31, 2007 | ||||||||||||||||
| (in millions of dollars) | Parent | Guarantors | Non-Guarantors | Consolidated | ||||||||||||
| Net cash provided by (used by) operating activities: |
$ | (56.8 | ) | $ | 102.8 | $ | 35.2 | $ | 81.2 | |||||||
| Investing activities: |
||||||||||||||||
| Additions to property, plant and equipment |
(0.8 | ) | (43.3 | ) | (15.0 | ) | (59.1 | ) | ||||||||
| Proceeds from the disposition of assets |
— | 3.2 | 0.7 | 3.9 | ||||||||||||
| Net cash used by investing activities |
(0.8 | ) | (40.1 | ) | (14.3 | ) | (55.2 | ) | ||||||||
| Financing activities: |
||||||||||||||||
| Intercompany financing |
66.5 | (83.6 | ) | 17.1 | — | |||||||||||
| Net dividends |
7.6 | 14.1 | (21.7 | ) | — | |||||||||||
| Repayments of long-term debt |
(15.0 | ) | — | (25.5 | ) | (40.5 | ) | |||||||||
| Borrowings of short-term debt |
— | — | 0.8 | 0.8 | ||||||||||||
| Proceeds from the exercise of stock options |
4.3 | — | — | 4.3 | ||||||||||||
| Net cash provided by (used by) financing activities |
63.4 | (69.5 | ) | (29.3 | ) | (35.4 | ) | |||||||||
| Effect of foreign exchange rate changes on cash |
— | — | 1.7 | 1.7 | ||||||||||||
| Net increase (decrease) in cash and cash equivalents |
5.8 | (6.8 | ) | (6.7 | ) | (7.7 | ) | |||||||||
| Cash and cash equivalents at the beginning of the period |
2.6 | 6.5 | 40.9 | 50.0 | ||||||||||||
| Cash and cash equivalents at the end of the period |
$ | 8.4 | $ | (0.3 | ) | $ | 34.2 | $ | 42.3 | |||||||
104
Table of Contents
ITEM 9. Changes in and Disagreements with Accountants on Accounting and Financial Disclosure
Not applicable.
ITEM 9A. Controls and Procedures
As of the end of the period covered by this Annual Report on Form 10-K, the Company carried out an evaluation, under the supervision and with the participation of the Company’s Disclosure Committee and the Company’s management, including the Chief Executive Officer and the Chief Financial Officer, of the effectiveness of the design and operation of the Company’s disclosure controls and procedures. Based upon that evaluation, the Chief Executive Officer and the Chief Financial Officer concluded that the Company’s disclosure controls and procedures were effective.
The report called for by Item 308(a) of Regulation S-K is incorporated herein by reference to the Report of Management on Internal Control Over Financial Reporting included in Part II, Item 8 of this report.
The attestation report called for by Item 308(b) of Regulation S-K is incorporated herein by reference to the Reports of Independent Registered Public Accounting Firms, included in Part II, Item 8 of this report.
There has been no change in our internal control over financial reporting that occurred during the Company’s last fiscal quarter that has materially affected, or is reasonably likely to materially affect, the Company’s internal control over financial reporting.
Not applicable.
PART III
ITEM 10. Directors, Executive Officers and Corporate Governance
Information required under this Item is contained in the Company’s 2010 Definitive Proxy Statement, which is to be filed with the Securities and Exchange Commission prior to April 30, 2010 and is incorporated herein by reference.
Code of Business Conduct
The Company has adopted a code of business conduct as required by the listing standards of the New York Stock Exchange and rules of the Securities and Exchange Commission. This code applies to all of the Company’s directors, officers and employees. The code of business conduct is published and available at the Investor Relations Section of the Company’s internet website at www.accobrands.com. The Company will post on its website any amendments to, or waivers from, our code of business conduct applicable to any of its directors or executive officers. The foregoing information will be available in print to any shareholder who requests such information from ACCO Brands Corporation, 300 Tower Parkway, Lincolnshire, IL 60069, Attn: Office of the General Counsel.
As required by Section 303A.12(a) of the New York Stock Exchange Listed Company Manual, the Company’s Chief Executive Officer certified to the NYSE within 30 days after the Company’s 2009 Annual Meeting of Stockholders that he was not aware of any violation by the Company of the NYSE Corporate Governance Listing Standards.
ITEM 11. Executive Compensation
Information required under this Item is contained in the Company’s 2010 Definitive Proxy Statement, which is to be filed with the Securities and Exchange Commission prior to April 30, 2010 and is incorporated herein by reference.
105
Table of Contents
ITEM 12. Security Ownership of Certain Beneficial Owners and Management and Related Stockholder Matters
Equity Compensation Plan Information
The following table gives information, as of December 31, 2009, about our common stock that may be issued upon the exercise of options, stock-settled appreciation rights (“SSARs”) and other equity awards under all compensation plans under which equity securities are reserved for issuance.
| Plan category |
Number of securities to be issued upon exercise of outstanding options, warrants and rights (a) |
Weighted-average exercise price of outstanding options, warrants and rights (b) |
Number of securities remaining available for future issuance under equity compensation plans (excluding securities reflected in column (a)) (c) |
|||||
| Equity compensation plans approved by security holders(1) |
7,009,011 | $ | 10.75 | 74,787 | (2) | |||
| Equity compensation plans not approved by security holders |
— | — | — | |||||
| Total |
7,009,011 | $ | 10.75 | 74,787 | ||||
| (1) | This number includes 4,980,043 common shares that were subject to issuance upon the exercise of stock options/SSARs granted under the Amended and Restated 2005 Incentive Plan (the “Plan”), and 2,028,968 common shares that were subject to issuance upon the exercise of stock options/SSARs pursuant to the Company’s 2005 Assumed Option and Restricted Stock Unit Plan. The weighted-average exercise price in column (b) of the table reflects all such options/SSARs. |
| (2) | These are shares available for grant as of December 31, 2009 under the Plan pursuant to which the compensation committee of the Board of Directors may make various stock-based awards including grants of stock options, stock-settled appreciation rights, restricted stock, restricted stock units and performance share units. In addition to these shares, the following shares may become available for grant under the Plan and, to the extent such shares have become available as of December 31, 2009, they are included in the table as available for grant: (i) shares covered by outstanding awards under the Plan that were forfeited or otherwise terminated and (ii) shares that are used to pay the exercise price of the stock options/SSARs and shares used to pay withholding taxes on equity awards generally. |
Other information required under this Item is contained in the Company’s 2010 Definitive Proxy Statement, which is to be filed with the Securities and Exchange Commission prior to April 30, 2010, and is incorporated herein by reference.
ITEM 13. Certain Relationships, Related Transactions and Director Independence
Information required under this Item is contained in the Company’s 2010 Definitive Proxy Statement, which is to be filed with the Securities and Exchange Commission prior to April 30, 2010 and is incorporated herein by reference.
ITEM 14. Principal Accountant Fees and Services
Information required under this Item is contained in the Company’s 2010 Definitive Proxy Statement, which is to be filed with the Securities and Exchange Commission Prior to April 30, 2010 and is incorporated herein by reference.
106
Table of Contents
Part IV
ITEM 15. Exhibits and Financial Statement Schedules
The following Exhibits are filed herewith or are incorporated by reference to exhibits previously filed with the Commission, as indicated in the description of each. We agree to furnish to the Commission upon request a copy of any instrument with respect to long-term debt not filed herewith as to which the total amount of securities authorized there under does not exceed 10 percent of our total assets on a consolidated basis.
| (a) | Financial Statements, Financial Statement Schedules and Exhibits |
| 1. | All Financial Statements |
The following consolidated financial statements of the Company and its subsidiaries are filed as part of this report under Item 8—Financial Statements and Supplementary Data, as part of this Report on Form 10-K:
| 2. | Financial Statement Schedule: |
| Schedule II—Valuation and Qualifying Accounts and Reserves, for each of the years ended December 31, 2009, 2008 and 2007. |
| 3. | Exhibits: |
| See Index to Exhibits on page 108 of this report. |
107
Table of Contents
EXHIBIT INDEX
| Number |
Description of Exhibit | |
| 2.1 | Agreement and Plan of Merger, dated as of March 15, 2005, by and among Fortune Brands, Inc., ACCO World Corporation, Gemini Acquisition Sub, Inc. and General Binding Corporation (incorporated by reference to Annex A to the proxy statement/prospectus—information statement included in ACCO Brands Corporation’s (the “Registrant”) Registration Statement on Form S-4 (File No. 333-124946)) | |
| 2.2 | Amendment to Agreement and Plan of Merger, dated as of August 4, 2005, by and among Fortune Brands, Inc., ACCO World Corporation, Gemini Acquisition Sub, Inc. and General Binding Corporation (incorporated by reference to Exhibit 2.2 to The Registrant’s Current Report on Form 8-K dated August 3, 2005 and filed August 8, 2005 (File No. 001-08454)) | |
| 3.1 | Restated Certificate of Incorporation of ACCO Brands Corporation (incorporated by reference to Exhibit 3.1 to Form 8-K filed by the Registrant on May 19, 2008 (File No. 001-08454)) | |
| 3.2 | Certificate of Designation of Series A Junior Participating Preferred Stock (incorporated by reference to Exhibit 3.2 to the Registrant’s Current Report on Form 8-K filed August 17, 2005) | |
| 3.3 | By-laws of ACCO Brands Corporation as amended through December 19, 2008 (incorporated by reference to Exhibit 3.1 to the Form 8-K filed by the Registrant on December 24, 2008 (File No. 001-08454)) | |
| 4.1 | Indenture, dated as of August 5, 2005, between ACCO Financial, Inc. and Wachovia Bank, National Association, as Trustee (incorporated by reference to Exhibit 4.2 to the Registrant’s Current Report on Form 8-K dated August 3,2005 and filed August 8, 2005 (File No. 001-08454)) | |
| 4.2 | Supplemental Indenture, dated as of August 17, 2005, among ACCO Brands Corporation, the Guarantors signatory thereto and Wachovia Bank, National Association, as Trustee (incorporated by reference to Exhibit 4.1 to the Registrant’s Current Report on Form 8-K dated August 17, 2005 and filed August 23, 2005 (File No. 001-08454)) | |
| 4.3 | Registration Rights Agreement, dated as of August 5, 2005, among ACCO Finance I, Inc., Citigroup Global Markets Inc., Goldman, Sachs & Co., Harris Nesbitt Corp., ABN AMRO Incorporated, NatCity Investments, Inc. and Piper Jaffray & Co. (incorporated by reference to Exhibit 4.4 to the Registrant’s Current Report on Form 8-K dated August 3, 2005 and filed August 8, 2005 (File No. 001-08454)) | |
| 4.4 | Joinder Agreement, dated as of August 17, 2005, among ACCO Brands Corporation, the Guarantors signatory thereto and Citigroup Global Markets Inc. and Goldman, Sachs & Co., as representatives of the Initial Purchasers (incorporated by reference to Exhibit 4.2 to the Registrant’s Current Report on Form 8-K dated August 17, 2005 and filed August 23, 2005 (File No. 001-08454)) | |
| 4.5 | Indenture, dated as of September 30, 2009, among ACCO Brands Corporation, the guarantors named therein and U.S. Bank National Association, as trustee (incorporated by reference to Exhibit 4.1 to Form 8-K filed by the Registrant on October 6, 2009 (File No. 001-08454)) | |
| 4.6 | Registration Rights Agreement, dated as of September 30, 2009, among ACCO Brands Corporation, the guarantors named therein and Credit Suisse Securities (USA) LLC, Deutsche Bank Securities Inc., Banc of America Securities LLC, BMO Capital Markets Corp., SunTrust Robinson Humphrey, Inc., Barclays Capital Inc., CJS Securities, Inc. and Barrington Research Associates, Inc. (incorporated by reference to Exhibit 4.2 to Form 8-K filed by the Registrant on October 6, 2009 (File No. 001-08454)) | |
108
Table of Contents
| Number |
Description of Exhibit | |
| 4.7 | Intercreditor Agreement, dated as of September 30, 2009 among ACCO Brands Corporation, the other grantors from time to time party thereto, Deutsche Bank AG New York Branch, as collateral agent under the Syndicated Facility Agreement—ABL Revolving Facility, and U.S. Bank National Association, as collateral trustee under the Senior Secured Notes Indenture (incorporated by reference to Exhibit 4.3 to Form 8-K filed by the Registrant on October 6, 2009 (File No. 001-08454)) | |
| 4.8 | Collateral Trust Agreement, dated as of September 30, 2009 among ACCO Brands Corporation, as issuer, the guarantors from time to time party thereto, U.S. Bank National Association, as trustee under the indenture, the other secured debt representatives from time to time party thereto and U.S. Bank National Association, as collateral trustee (incorporated by reference to Exhibit 4.4 to Form 8-K filed by the Registrant on October 6, 2009 (File No. 001-08454)) | |
| 4.9 | Pledge Agreement among ACCO Brands Corporation, certain other subsidiaries of ACCO Brands Corporation from time to time party thereto and U.S. Bank National Association, as collateral trustee, dated as of September 30, 2009 (incorporated by reference to Exhibit 4.5 to Form 8-K filed by the Registrant on October 6, 2009 (File No. 001-08454)) | |
| 4.10 | Security Agreement among ACCO Brands Corporation, certain other subsidiaries of ACCO Brands Corporation from time to time party thereto and U.S. Bank National Association, as collateral trustee, dated as of September 30, 2009 (incorporated by reference to Exhibit 4.6 to Form 8-K filed by the Registrant on October 6, 2009 (File No. 001-08454)) | |
| 10.1 | Credit Agreement, dated as of August 17, 2005, by and among ACCO Brands Corporation, ACCO Brands Europe Ltd., Furlon Holding B.V. (to be renamed ACCO Nederland Holdings B.V.) and the lenders and issuers party hereto, Citicorp North America, Inc., as Administrative Agent, and ABN AMRO Bank,N.V., as Syndication Agent (incorporated by reference to Exhibit 10.1 to the Registrant’s Current Report on Form 8-K dated August 17, 2005 and filed August 23, 2005 (File No. 001-08454)) | |
| 10.2 | Amendment No. 1 and Waiver to Credit Agreement among ACCO Brands Corporation, ACCO Nederland Holdings B.V. (as successor to Furlon Holding B.V.), ACCO Brands Europe Ltd., the lenders listed therein, Citicorp North America Inc., as administrative agent (incorporated by reference to Exhibit 10.1 to the Registrant’s Current Report on Form 8-K filed February 14, 2006) | |
| 10.3 | Amendment No. 2 to Credit Agreement among the Company, certain of its subsidiaries, the lenders listed on the signature pages thereto, and Citicorp North America, Inc., as Administrative Agent (incorporated by reference to Exhibit 10.1 to Form 8-K filed by the Registrant on April 4, 2006 (File No. 001-08454)) | |
| 10.4 | Amendment No. 3 to Credit Agreement among the Company, certain of its subsidiaries, the lenders listed on the signature pages thereto, and Citicorp North America, Inc., as Administrative Agent (incorporated by reference to Exhibit 10.1 to Form 10-Q filed by the Registrant on November 9, 2006 (File No. 001-08454)) | |
| 10.5 | Amendment No. 4 to Credit Agreement among the Company, certain of its subsidiaries, the lenders listed on the signature pages thereto, and Citicorp North America, Inc., as Administrative Agent (incorporated by reference to Exhibit 10.1 to Form 8-K filed by the Registrant on January 22, 2008 (File No. 001-08454)) | |
| 10.6 | Amendment No. 5 to Credit Agreement, dated as of December 15, 2008, entered into by ACCO Brands Corporation, ACCO Nederland Holdings B.V., ACCO Brands Europe Ltd. and Citicorp North America, Inc., as administrative agent, and the lenders party thereto (incorporated by reference to Exhibit 10.1 to Form 8-K filed by the Registrant on December 15, 2008 (File No. 001-08454)) | |
109
Table of Contents
| Number |
Description of Exhibit | |
| 10.7 | Distribution Agreement, dated as of March 15, 2005, by and between Fortune Brands, Inc. and ACCO World Corporation (incorporated by reference to Annex B to the proxy statement/ prospectus—information statement included in the Registrant’s Registration Statement on Form S-4 (File No. 333-124946)) | |
| 10.8 | Amendment to Distribution Agreement, dated as of August 4, 2005, by and between Fortune Brands, Inc. and ACCO World Corporation (incorporated by reference to Exhibit 2.2 to the Registrant’s Current Report on Form 8-K dated August 3, 2005 and filed August 8, 2005 (File No. 001-08454)) | |
| 10.9 | ACCO Brands Corporation 2005 Long-Term Incentive Plan (incorporated by reference to Exhibit 10.1 to the Registrant’s Current Report on Form 8-K dated August 3, 2005 and filed August 8, 2005 (File No. 001-08454)) | |
| 10.10 | ACCO Brands Corporation 2005 Assumed Option and Restricted Stock Unit Plan, together with Sub-Plan A thereto (incorporated by reference to Exhibit 10.2 to the Registrant’s Current Report on Form 8-K dated August 3,2005 and filed August 8, 2005 (File No. 001-08454)) | |
| 10.11 | Copy of resolutions of the Board of Directors of ACCO, adopted August 3, 2005, approving the conversion to ACCO stock options of certain stock options granted pursuant to the Fortune Brands, Inc. 1999 Long-Term Incentive Plan (the “Fortune 1999 LTIP”), the Fortune Brands, Inc. 2003 Long-Term Incentive Plan (the “Fortune 2003 LTIP”), the General Binding Corporation 1989 Stock Option Plan, as amended and restated (the “GBC 1989 Stock Option Plan”), the General Binding Corporation 2001 Stock Incentive Plan for Employees (the “GBC 2001 Stock Plan”) and the General Binding Corporation Non-Employee Directors 2001 Stock Option Plan (the “GBC 2001 Directors Plan”) and the conversion to ACCO restricted stock units of certain restricted stock units that did not vest in full upon consummation of the merger of Acquisition Sub and GBC (incorporated by reference to Exhibit 10.4 to the Registrant’s Quarterly Report on Form 10-Q for the quarterly period ended June 25, 2005 (File No. 001-08454)) | |
| 10.12 | ACCO Brands Corporation Annual Executive Incentive Compensation Plan (incorporated by reference to Exhibit 10.3 to the Registrant’s Current Report on Form 8-K dated August 3, 2005 and filed August 8, 2005 (File No. 001-08454)) | |
| 10.13 | Tax Allocation Agreement, dated as of August 16, 2005, between ACCO World Corporation and Fortune Brands, Inc. (incorporated by reference to Exhibit 10.1 to the Registrant’s Current Report on Form 8-K dated August 12, 2005 and filed August 17, 2005 (File No. 001-08454)) | |
| 10.14 | Tax Allocation Agreement, dated as of August 16, 2005, between General Binding Corporation and Lane Industries, Inc. (incorporated by reference to Exhibit 10.2 to the Registrant’s Current Report on Form 8-K dated August 12, 2005 and filed August 17, 2005 (File No. 001-08454)) | |
| 10.15 | Transition Services Agreement, dated as of August 16, 2005, between ACCO World Corporation and Fortune Brands, Inc. (incorporated by reference to Exhibit 10.20 to the Registrant’s Registration Statement on Form S-4 (File No. 333-128784)) | |
| 10.16 | Description of changes to terms of oral employment agreements for Neal V. Fenwick and Steven Rubin (incorporated by reference to Item 1.01 of the Registrant’s Current Report on Form 8-K dated September 27, 2005 and filed October 3, 2005 (File No. 001-08454)) | |
| 10.17 | Description of changes to terms of compensation arrangements Messrs. Fenwick and Boris Elisman (incorporated by reference to Item 1.01 of Form 8-K of the Registrant filed on March 6, 2006 (File No. 001-08454)) | |
| 10.18 | Description of changes to terms of compensation arrangements for Messrs. Fenwick and Elisman (incorporated by reference to Item 5.02 of Form 8-K of the Registrant filed on March 7, 2007 (File No. 001-08454)) | |
110
Table of Contents
| Number |
Description of Exhibit | |
| 10.19 | Employee Matters Agreement, dated as of March 15, 2005, by and among Fortune Brands, Inc., ACCO World Corporation and General Binding Corporation (incorporated by reference to Exhibit 10.2 to the Registrant’s Registration Statement on Form S-4 (File No. 333-124946)) | |
| 10.20 | Executive Severance/Change in Control Agreement, dated as of August 26, 2000, by and between Steven Rubin and GBC (incorporated by reference to Exhibit 10.15 to General Binding Corporation’s Annual Report on Form 10-K for the fiscal year ended December 31, 2004 (File No. 001-08454)) | |
| 10.21 | Letter Agreement, dated as of September 5, 2003, between ACCO World Corporation and Neal Fenwick (incorporated by reference to Exhibit 10.6 to the Registrant’s Registration Statement on Form S-4 (File No. 333-124946)) | |
| 10.22 | Letter Agreement, dated November 8, 2000, as revised in January 2001, between ACCO World Corporation and Neal Fenwick (incorporated by reference to Exhibit 10.7 to the Registrant’s Registration Statement on Form S-4 (File No. 333-124946)) | |
| 10.23 | Letter Agreement, dated September 8, 1999, between ACCO World Corporation and Neal Fenwick (incorporated by reference to Exhibit 10.8 to the Registrant’s Registration Statement on Form S-4 (File No. 333-124946)) | |
| 10.24 | Amended and Restated ACCO Brands Corporation 2005 Incentive Plan (incorporated by reference to Annex A of the Registrant’s definitive proxy statement filed April 4, 2006 (File No. 001-08454)) | |
| 10.25 | Amendment to the Amended and Restated ACCO Brands Corporation 2005 Incentive Plan (incorporated by reference to Exhibit 10.1 to Form 8-K filed by the Registrant on May 19, 2008 (File No. 001-08454)) | |
| 10.26 | ACCO Brands Corporation Executive Severance Plan (effective December 1, 2007) (incorporated by reference to Exhibit 10.1 to Form 8-K filed by the Registrant on November 29, 2007 (File No. 001-08454)) | |
| 10.27 | 2008 Amended and Restated ACCO Brands Corporation Supplemental Retirement Plan (incorporated by reference to Exhibit 10.31 to Form 10-K filed by the Registrant on February 29, 2008 (File No. 001-08454)) | |
| 10.28 | Amendment to the 2008 Amended and Restated ACCO Brands Corporation Supplemental Retirement Plan (incorporated by reference to Exhibit 10.1 to Form 8-K filed by the Registrant on January 22, 2009 (File No. 001-08454)) | |
| 10.29 | Receivables Sale and Contribution Agreement, dated January 9, 2008, among ACCO Brands Receivables Funding LLC as Buyer and ACCO Brands USA LLC as Originator, Servicer and sole member of ACCO Brands Receivables Funding LLC (incorporated by reference to Exhibit 10.1 to Form 8-K filed by the Registrant on January 10, 2008 (File No. 001-08454)) | |
| 10.30 | Receivables Purchase Agreement, dated January 9, 2008, among ACCO Brands Receivables Funding LLC, as Seller, ACCO Brands USA LLC, as Servicer, Gotham Funding Corporation, as Purchaser, and The Bank of Tokyo-Mitsubishi UFJ, Ltd., as Agent (incorporated by reference to Exhibit 10.2 to Form 8-K filed by the Registrant on January 10, 2008 (File No. 001-08454)) | |
| 10.31 | Retirement Agreement for David D. Campbell effective as of May 1, 2008 (incorporated by reference to Exhibit 10.3 to Form 10-Q filed by the Registrant on May 7, 2008 (File No. 001-08454)) | |
| 10.32 | Retirement Agreement for Neal V. Fenwick effective as of May 1, 2008 (incorporated by reference to Exhibit 10.4 to Form 10-Q filed by the Registrant on May 7, 2008 (File No. 001-08454)) | |
111
Table of Contents
| Number |
Description of Exhibit | |
| 10.33 | Form of Amendment No. 1 to Performance Stock Unit Award Agreement (2006 – 2008 Performance Period) issued under the ACCO Brands Corporation Amended and Restated 2005 Incentive Plan. (incorporated by reference to Exhibit 10.1 to Form 10-Q filed by the Registrant on May 7, 2008 (File No. 001-08454)) | |
| 10.34 | Form of Amendment No. 1 to Performance Stock Unit Award Agreement (2007 – 2009 Performance Period) issued under the ACCO Brands Corporation Amended and Restated 2005 Incentive Plan (incorporated by reference to Exhibit 10.2 to Form 10-Q filed by the Registrant on May 7, 2008 (File No. 001-08454)) | |
| 10.35 | Letter Agreement and General Release between the Company and David D. Campbell (incorporated by reference to Exhibit 10.1 to Form 8-K filed by the Registrant on November 26, 2008 (File No. 001-08454)) | |
| 10.36 | Letter Agreement dated November 4, 2008, between ACCO Brands Corporation and Robert J. Keller (incorporated by reference to Exhibit 10.1 to Form 8-K filed by the Registrant on November 5, 2008 (File No. 001-08454)) | |
| 10.37 | Form of Indemnification Agreement (incorporated by reference to Exhibit 10.1 to Form 8-K filed by the Registrant on December 24, 2008 (File No. 001-08454)) | |
| 10.38 | Form of Stock-settled Stock Appreciation Rights Agreement under the ACCO Brands Corporation Amended and Restated 2005 Long-Term Incentive Plan, as amended (incorporated by reference to Exhibit 10.46 to Form 10-K filed by the Registrant on March 2, 2009 (File No. 001-08454)) | |
| 10.39 | Letter agreement, dated October 11, 2007, from ACCO Brands Corporation to David A. Kaput (incorporated by reference to Exhibit 10.1 to Form 8-K filed by the Registrant on March 3, 2009 (File No. 001-08454)) | |
| 10.40 | Syndicated Facility Agreement-ABL Revolving Facility, dated as of September 30, 2009, among ACCO Brands Corporation, certain direct and indirect subsidiaries of ACCO Brands Corporation party thereto, Deutsche Bank AG New York Branch, as administrative agent for the secured parties and in such capacity, a co-collateral agent, Bank of America, N.A., and General Electric Capital Corporation, as co-collateral agents, and the other agents and lenders named therein (incorporated by reference to Exhibit 10.1 to Form 8-K filed by the Registrant on October 6, 2009 (File No. 001-08454)) | |
| 10.41 | Amended and Restated ACCO Brands Deferred Compensation Plan for Non-Employee Directors, effective December 14, 2009* | |
| 10.42 | Letter agreement, dated November 4, 2008, from ACCO Brands Corporation to Christopher M. Franey* | |
| 10.43 | Letter agreement, dated March 6, 2009, from ACCO Brands Corporation to Thomas H. Shortt* | |
| 16.1 | Letter from PricewaterhouseCoopers LLP to the Securities and Exchange Commission dated May 21, 2009 (incorporated by reference to Exhibit 16.1 to Form 8-K filed by the Registrant on May 22, 2009 (File No. 001-08454)) | |
| 21.1 | Subsidiaries of the registrant* | |
| 23.1 | Consent of KPMG LLP* | |
| 23.2 | Consent of PricewaterhouseCoopers LLP* | |
| 24.1 | Power of attorney* | |
| 31.1 | Certification of the Chief Executive Officer pursuant to Section 302 of the Sarbanes-Oxley Act of 2002* | |
112
Table of Contents
| Number |
Description of Exhibit | |
| 31.2 | Certification of the Chief Financial Officer pursuant to Section 302 of the Sarbanes-Oxley Act of 2002* | |
| 32.1 | Certification of the Chief Executive Officer pursuant to Section 906 of the Sarbanes-Oxley Act of 2002* | |
| 32.2 | Certification of the Chief Financial Officer pursuant to Section 906 of the Sarbanes-Oxley Act of 2002* | |
| * | Filed herewith. |
113
Table of Contents
Pursuant to the requirements of Section 13 or 15(d) of the Securities Exchange Act of 1934, the Registrant has duly caused this report to be signed on its behalf by the undersigned thereunto duly authorized.
| REGISTRANT: | ||
| ACCO BRANDS CORPORATION | ||
| By: |
/s/ ROBERT J. KELLER | |
| Robert J. Keller | ||
| Chairman of the Board and Chief Executive Officer (principal executive officer) | ||
| By: |
/s/ NEAL V. FENWICK | |
| Neal V. Fenwick | ||
| Executive Vice President and Chief Financial Officer (principal financial officer) |
| By: |
/s/ THOMAS P. O’NEILL, JR. | |
| Thomas P. O’Neill, Jr. | ||
| Senior Vice President, Finance and Accounting (principal accounting officer) |
February 26, 2010
Pursuant to the requirements of the Securities Exchange Act of 1934, this report has been signed on its behalf by the following persons on behalf of the Registrant and in the capacities and on the dates indicated.
| Signature |
Title |
Date | ||
| /S/ ROBERT J. KELLER Robert J. Keller |
Chairman of the Board and Chief Executive Officer (principal executive officer) |
February 26, 2010 | ||
| /S/ NEAL V. FENWICK Neal V. Fenwick |
Executive Vice President and Chief Financial Officer (principal financial officer) |
February 26, 2010 | ||
| /S/ THOMAS P. O’NEILL, JR. Thomas P. O’Neill, Jr. |
Senior Vice President, Finance and Accounting (principal accounting officer) | February 26, 2010 | ||
| /S/ GEORGE V. BAYLY* George V. Bayly |
Director | February 26, 2010 | ||
114
Table of Contents
| Signature |
Title |
Date | ||
| /S/ DR. PATRICIA O. EWERS* Dr. Patricia O. Ewers |
Director | February 26, 2010 | ||
| /S/ G. THOMAS HARGROVE* G. Thomas Hargrove |
Director | February 26, 2010 | ||
| /S/ ROBERT H. JENKINS* Robert H. Jenkins |
Director | February 26, 2010 | ||
| /S/ THOMAS KROEGER* Thomas Kroeger |
Director | February 26, 2010 | ||
| /S/ MICHAEL NORKUS* Michael Norkus |
Director | February 26, 2010 | ||
| /S/ NORMAN H. WESLEY* Norman H. Wesley |
Director | February 26, 2010 | ||
| /S/ NEAL V. FENWICK * Neal V. Fenwick as Attorney-in-Fact |
||||
115
Table of Contents
ACCO Brands Corporation
VALUATION AND QUALIFYING ACCOUNTS AND RESERVES
SCHEDULE II
Allowances for Doubtful Accounts
Changes in the allowances for doubtful accounts were as follows:
| Year Ended December 31, |
||||||||||||
| (in millions of dollars) | 2009 | 2008 | 2007 | |||||||||
| Balance at beginning of year |
$ | 7.1 | $ | 6.9 | $ | 7.7 | ||||||
| Additions charged to expense |
4.0 | 3.1 | 1.9 | |||||||||
| Deductions—write offs |
(4.3 | ) | (2.3 | ) | (3.2 | ) | ||||||
| Foreign exchange changes |
0.3 | (0.6 | ) | 0.5 | ||||||||
| Balance at end of year |
$ | 7.1 | $ | 7.1 | $ | 6.9 | ||||||
Allowances for Sales Returns and Discounts
Changes in the allowances for sales returns and discounts were as follows:
| Year Ended December 31, |
||||||||||||
| (in millions of dollars) | 2009 | 2008 | 2007 | |||||||||
| Balance at beginning of year |
$ | 14.9 | $ | 20.2 | $ | 16.5 | ||||||
| Additions charged to expense |
40.8 | 52.7 | 65.2 | |||||||||
| Deductions—returns |
(46.7 | ) | (57.1 | ) | (61.9 | ) | ||||||
| Foreign exchange changes |
1.0 | (0.9 | ) | 0.4 | ||||||||
| Balance at end of year |
$ | 10.0 | $ | 14.9 | $ | 20.2 | ||||||
Allowances for Cash Discounts
Changes in the allowances for cash discounts were as follows:
| Year Ended December 31, |
||||||||||||
| (in millions of dollars) | 2009 | 2008 | 2007 | |||||||||
| Balance at beginning of year |
$ | 1.1 | $ | 1.7 | $ | 1.6 | ||||||
| Additions charged to expense |
11.6 | 14.6 | 14.9 | |||||||||
| Deductions—discounts taken |
(11.7 | ) | (15.1 | ) | (14.9 | ) | ||||||
| Foreign exchange changes |
0.2 | (0.1 | ) | 0.1 | ||||||||
| Balance at end of year |
$ | 1.2 | $ | 1.1 | $ | 1.7 | ||||||
116
Table of Contents
ACCO Brands Corporation
VALUATION AND QUALIFYING ACCOUNTS AND RESERVES
SCHEDULE II (continued)
Warranty Reserves
Changes in the reserve for warranty claims were as follows:
| Year Ended December 31, |
||||||||||||
| (in millions of dollars) | 2009 | 2008 | 2007 | |||||||||
| Balance at beginning of year |
$ | 3.0 | $ | 3.5 | $ | 5.9 | ||||||
| Provision for warranties issued |
2.5 | 2.2 | 2.4 | |||||||||
| Settlements made (in cash or in kind) |
(2.7 | ) | (2.7 | ) | (4.8 | ) | ||||||
| Balance at end of year |
$ | 2.8 | $ | 3.0 | $ | 3.5 | ||||||
Income Tax Valuation Allowance
Changes in the deferred tax valuation allowances were as follows:
| Year Ended December 31, | |||||||||||
| (in millions of dollars) | 2009 | 2008 | 2007 | ||||||||
| Balance at beginning of year |
$ | 63.8 | $ | 54.1 | $ | 45.8 | |||||
| Additions charged to expense |
123.1 | 20.3 | 16.1 | ||||||||
| Acquisition of GBC |
— | — | (3.3 | ) | |||||||
| Deductions |
— | (10.6 | ) | (4.5 | ) | ||||||
| Other |
2.0 | — | — | ||||||||
| Balance at end of year |
$ | 188.9 | $ | 63.8 | $ | 54.1 | |||||
117