UNITED STATES
SECURITIES AND EXCHANGE COMMISSION
Washington, D.C. 20549
Form 10-K
| |
|
|
|
(Mark One)
|
|
|
|
x
|
|
ANNUAL REPORT PURSUANT TO SECTION 13 OR 15(d) OF THE
SECURITIES EXCHANGE ACT OF 1934
|
|
|
|
|
|
|
|
For the fiscal year ended December 31, 2009
|
|
OR
|
|
|
|
|
|
o
|
|
TRANSITION REPORT PURSUANT TO SECTION 13 OR 15(d) OF THE
SECURITIES EXCHANGE ACT OF 1934
|
|
|
|
|
|
|
|
For the transition period from
to
|
|
|
|
|
|
|
|
Commission file number 1-8520
|
Terra Industries Inc.
(Exact name of registrant as specified in its charter)
| |
|
|
|
Maryland
(State or other jurisdiction of
incorporation or organization)
|
|
52-1145429
(I.R.S. Employer Identification No.)
|
|
|
|
|
Terra Centre
600 Fourth Street
P. O. Box 6000
Sioux City, Iowa
(Address of principal executive offices)
|
|
51102-6000
(Zip Code)
(712) 277-1340
(Registrant’s telephone number)
|
Securities registered pursuant to Section 12(b) of the
Act:
| |
|
|
|
|
|
Name of each exchange
|
|
Title of each class
|
|
on which registered
|
|
|
|
Common Shares, without par value
|
|
New York Stock Exchange
|
Securities registered pursuant to section 12(g) of the
Act: None
Indicate by check mark if the registrant is a well-known
seasoned issuer, as defined in Rule 405 of the Securities
Act.
Yes
o
No
x
Indicate by check mark if the registrant is not required to file
reports pursuant to Section 13 or Section 15(d) of the
Act.
Yes
o
No
x
Indicate by check mark whether the registrant (1) has filed
all reports required to be filed by Section 13 or 15(d) of
the Exchange during the preceding 12 months (or for such
shorter period that the registrant was required to file such
reports), and (2) has been subject to such filing
requirements for the past 90 days.
Yes
x
No
o
Indicate by check mark whether the registrant has submitted
electronically and posted on its corporate Web site, if any,
every interactive Data File required to be submitted and posted
pursuant to Rule 405 of
Regulation S-T
during the preceding 12 months (or for such shorter period
that the registrant was required to submit and post such files.)
Yes
o
No
x
Indicate by check mark if disclosure of delinquent filers
pursuant to Item 405 of
Regulation S-K
is not contained herein, and will not be contained, to the best
of Registrant’s knowledge, in definitive proxy or
information statements incorporated by reference in
Part III of this
Form 10-K
or any amendment to this
Form 10-K.
o
Indicate by check mark whether the registrant is a large
accelerated filer, an accelerated filer, a non-accelerated
filer, or a smaller reporting company. See the definitions of
“large accelerated filer,” “accelerated
filer” and “smaller reporting company” in
Rule 12b-2
of the Exchange Act. (Check one):
| |
|
|
|
|
|
|
|
Large accelerated
filer x
|
|
Accelerated
filer o
|
|
Non-accelerated
filer o
(Do not check if a smaller
reporting company)
|
|
Smaller reporting
company o
|
Indicate by check mark whether the registrant is a shell company
(as defined in
Rule 12b-2
of the Act).
Yes
o
No
x
The aggregate market value of the voting and non-voting common
shares held by non-affiliates computed by reference to the price
at which the common shares were last sold, or the average bid
and asked price of such common shares, as of the last business
day of the registrant’s most recently completed second
fiscal quarter was $2,380,919,125.90.
The number of Common Shares, without par value, outstanding as
of February 25, 2010 was 100,105,516.
Documents
Incorporated by Reference
Certain portions of the proxy statement for the 2010 Annual
Meeting of Stockholders of Terra Industries Inc. are
incorporated by reference into Part III hereof. The proxy
statement for the 2010 Annual Meeting of Stockholders will be
filed with the Securities and Exchange Commission, pursuant to
Regulation 14A, not later than 120 days after the end
of the 2009 fiscal year, or, if we do not file the proxy
statement within such
120-day
period, we will amend this Annual Report on
Form 10-K
to include the information required under Part III hereof
not later than the end of such
120-day
period.
Forward-Looking
Information is Subject to Risk and Uncertainty
Certain statements in this Annual Report of
Form 10-K
may constitute “forward-looking” statements within the
meaning of the Private Securities Litigation Reform Act of 1995.
Forward-looking statements are based upon assumptions as to
future events that may not prove to be accurate. Actual outcomes
and results may differ materially from what is expressed or
forecasted in these forward-looking statements. As a result,
these statements speak only as of the date they were made and we
undertake no obligation to publicly update or revise any
forward-looking statements, whether as a result of new
information, future events or otherwise, except as otherwise
required by law.
Words such as “expects,” “intends,”
“plans,” “projects,” “believes,”
“estimates,” and similar expressions are used to
identify these forward-looking statements. The forward looking
statements contained herein include statements about the
proposed business combination with Yara International ASA
(“Yara”). Forward-looking statements are not
guarantees of future performance and involve risks,
uncertainties and assumptions that are difficult to predict.
These risks, uncertainties and assumptions include, among others:
|
|
|
|
| |
§
|
the possibility that various closing conditions for the proposed
business combination with Yara may not be satisfied or waived,
including that a governmental entity may prohibit, delay, or
refuse to grant approval for the consummation of the transaction,
|
|
| |
| |
§
|
the risk that Terra’s stockholders fail to approve the
proposed business combination,
|
|
| |
| |
§
|
the risk that Yara’s stockholders fail to approve the
proposed capital increase for its rights offering,
|
|
| |
| |
§
|
the risk that the proposed business combination with Yara will
not close within the anticipated time period,
|
|
| |
| |
§
|
the risk that disruptions from the proposed business combination
with Yara will harm Terra’s relationships with its
customers, employees and suppliers,
|
|
| |
| |
§
|
the diversion of management time on issues related to the
proposed business combination with Yara,
|
|
| |
| |
§
|
the outcome of any legal proceedings challenging the proposed
business combination with Yara,
|
|
| |
| |
§
|
the amount of the costs, fees, expenses and charges related to
the proposed business combination with Yara,
|
|
| |
| |
§
|
changes in financial and capital markets,
|
|
| |
| |
§
|
general economic conditions within the agricultural industry,
|
|
| |
| |
§
|
competitive factors and price changes (principally, sales prices
of nitrogen and methanol products and natural gas costs),
|
|
| |
| |
§
|
changes in product mix,
|
|
| |
| |
§
|
changes in the seasonality of demand patterns,
|
|
| |
| |
§
|
changes in weather conditions,
|
|
| |
| |
§
|
changes in environmental and other government regulations,
|
|
| |
| |
§
|
changes in agricultural regulations and
|
|
| |
| |
§
|
changes in the securities trading markets.
|
|
Additional information as to these factors can be found in the
sections entitled “Business,” “Risk
Factors,” “Legal Proceedings,” and
“Management’s Discussion and Analysis of Financial
Condition and Results of Operations” and in the Notes to
our consolidated financial statements included as part of this
Annual Report on
Form 10-K.
Glossary
of Terms
| |
|
|
|
|
|
|
|
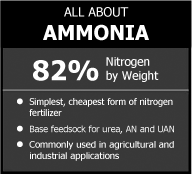
AN
|
|
Ammonium Nitrate, a solid nitrogen product that Terra sells in
agricultural and industrial grades. AN contains 34 percent
nitrogen by weight.
|
|
|
|
|
|
API
|
|
American Petroleum Institute, the primary U.S trade association
for the oil and natural gas industry.
|
|
|
|
|
|
ASC
|
|
Accounting Standards Codification – also referred to
as “Codification”.
|
|
|
|
|
|
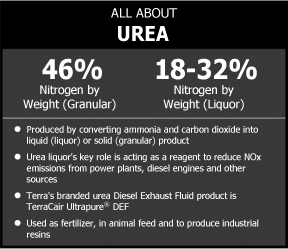
DEF
|
|
Diesel Exhaust Fluid. Urea solution that reduces NOx emissions
from the exhaust stream of diesel engines. Terra’s branded
DEF product is TerraCair
Ultrapure®
DEF.
|
|
|
|
|
|
DHS
|
|
Department of Homeland Security, A Cabinet department of the
U.S. federal government responsible for protecting the U.S. from
terrorist attacks and responding to natural disasters.
|
|
|
|
|
|
EPA
|
|
Environmental Protection Agency, a U.S. federal government
agency charged with protecting human health and the environment.
|
|
|
|
|
|
FASB
|
|
Financial Accounting Standards Board
|
|
|
|
|
|
GAAP
|
|
General Accepted Accounting Principles
|
|
|
|
|
|
GrowHow
|
|
GrowHow UK Ltd., the U.K. joint venture in which Terra owns a
50 percent interest.
|
|
|
|
|
|
HAT
|
|
Houston Ammonia Terminal, a facility in which Terra owns a
50 percent interest. HAT was part of Terra’s 2004
acquisition of Mississippi Chemical Corporation.
|
|
|
|
|
|
IGAN
|
|
Industrial Grade Ammonium Nitrate, a prilled, low-density
product containing 34 percent nitrogen by weight that is
used as feedstock for blasting agents used in the mining
industry and in other industrial applications.
|
|
|
|
|
|
NOx
|
|
Nitrogen Oxides, the EPA-regulated compounds that are reduced
through the use of SCR technology and nitrogen-based reagents.
|
|
|
|
|
|
NYMEX
|
|
New York Mercantile Exchange
|
|
|
|
|
|
OSHA
|
|
Occupational Safety & Health Administration, a U.S.
federal agency that regulates workplace safety and health.
|
|
|
|
|
|
PLNL
|
|
Point Lisas Nitrogen Limited, the ammonia manufacturing joint
venture in the Republic of Trinidad and Tobago in which Terra
owns a 50 percent interest. Also referred to as “Point
Lisas”.
|
|
|
|
|
|
SCR
|
|
Selective Catalytic Reduction, the process that allows
nitrogen-based reagents to reduce the nitrogen oxides that form
when fossil fuels are combusted to atmospheric nitrogen and pure
water.
|
|
|
|
|
|
TerraCair
|
|
TerraCair
Ultrapure®
DEF, Terra’s branded diesel exhaust fluid product.
TerraCair’s quality is certified by the API.
|
|
|
|
|
|
TET
|
|
Terra Environmental Technologies Inc., Terra’s
environmental business. TET was formed in 2003 and incorporated
in 2007. It is a wholly-owned subsidiary of Terra Industries Inc.
|
|
|
|
|
|
TFI
|
|
The Fertilizer Institute, a trade organization of which Terra is
a member. TFI represents the fertilizer industry on issues of
public policy, communication and statistical needs of producers,
manufacturers, retailers and transporters.
|
| |
|
|
|
|
|
|
|
TNCLP
|
|
Terra Nitrogen Company, L.P., the Master Limited Partnership of
which Terra Industries Inc. owns 75.3 percent of the
outstanding units. TNCLP’s operations consist of the
Verdigris, Oklahoma nitrogen manufacturing facility and terminal
assets in Blair, Nebraska and Pekin, Illinois. TNCLP is traded
under the ticker symbol TNH.
|
|
|
|
|
|
UAN
|
|
Urea Ammonium Nitrate solutions, Terra’s premiere product.
UAN is a clear, odorless non-hazardous liquid that contains 28
to 32 percent nitrogen by weight. UAN is safer to store,
transport and apply than ammonia.
|
|
|
|
|
|
U.K.
|
|
United Kingdom
|
|
|
|
|
|
USDA
|
|
United States Department of Agriculture, the U.S. federal
executive department responsible for developing and executing
U.S. federal government policy on farming, agriculture and food.
|
Item 1.
Business
TERRA: A HISTORY
OF GROWTH THROUGH ACQUISITION
Terra Industries Inc. was founded with the commission of its
Port Neal, Iowa nitrogen manufacturing facility in 1964. Three
years later, the plant began to produce nitrogen-based
fertilizer for sale primarily into the Midwestern corn markets
in its backyard. From those humble beginnings, Terra has grown
into a leading international nitrogen producer with operations
in the U.S., Canada, the United Kingdom (U.K.) and the Republic
of Trinidad and Tobago.
Terra has accomplished this growth through a series of
acquisitions, partnering arrangements and subsequent facility
upgrades:
|
|
|
|
| |
§
|
In 1976, Terra doubled its nitrogen production capacity by
forming a partnership to operate a new plant in Woodward,
Oklahoma. Terra later bought out its partner’s interest in
this facility, and expanded its ammonia plant. In 2010, Terra
expects to complete a project to add 500,000 tons per year of
urea ammonium nitrate solutions (UAN) capacity at this facility,
consistent with the company’s strategic focus on
higher-value, upgraded products.
|
|
| |
| |
§
|
In 1993, Terra made its first investment outside the
U.S. with the purchase of a nitrogen fertilizer
manufacturing complex in Courtright, Ontario, Canada. Shortly
thereafter, Terra combined the two existing urea plants in
Courtright into an improved single unit that manufactures
product that can be granulated or used as a feedstock in UAN
production.
|
|
| |
| |
§
|
Just a year after the Courtright acquisition, Terra purchased
Agricultural Minerals and Chemicals Inc., with manufacturing
facilities in Verdigris, Oklahoma and Blytheville, Arkansas,
again doubling its nitrogen production capacity. The acquisition
also included terminal assets. Terra eventually closed the
Blytheville manufacturing facility permanently when high
North American gas prices and stiff competition from Gulf
importers rendered the facility unprofitable. We sold the
Blytheville terminal assets in 2005, but retained access to the
ammonia and UAN storage capacity through a leasing agreement. We
continue to operate terminal assets in Blair, Nebraska and
Pekin, Illinois that we gained through this acquisition.
|
|
| |
| |
§
|
Terra expanded beyond North America in 1997 with the acquisition
of two nitrogen fertilizer plants in the U.K., at Billingham and
Severnside. Ten years later, Terra contributed its U.K. assets
to a joint venture with Kemira GrowHow Oyj to form GrowHow
UK Ltd. (GrowHow). Recognizing that the U.K. market could be
better served with two manufacturing facilities rather than the
three it was then operating, GrowHow soon closed the Severnside
facility. Terra continues to own a 50 percent interest in
GrowHow, and the steps undertaken to realize synergies and
right-size production to U.K. demand has allowed the joint
venture to contribute meaningfully to Terra’s financial
performance.
|
|
| |
| |
§
|
In 1997, Terra also completed an expansion project at its Port
Neal, Iowa facility, increasing its UAN capacity by more than
60 percent and furthering Terra’s leading position in
UAN.
|
|
| |
| |
§
|
In 2004, Terra acquired Mississippi Chemical Corporation,
including a manufacturing facility in Yazoo City, Mississippi;
an ammonia plant and deepwater terminal in Donaldsonville,
Louisiana; a 50 percent interest in Point Lisas Nitrogen
Limited (Point Lisas) in the Republic of Trinidad and Tobago, an
ammonia production joint venture with a long-term, beneficial
natural gas contract; and a 50 percent interest in an
ammonia terminal near Houston, Texas. Terra has since restarted
the previously idle Donaldsonville ammonia facility and modified
one of the Yazoo City ammonium nitrate (AN) towers to allow it
to produce industrial grade AN in addition to agricultural grade
AN. The modifications allowed Terra to more fully utilize Yazoo
City’s AN capacity, and fulfill commitments to a
significant new industrial customer.
|
|
1
Terra has also pursued organic growth opportunities, as with the
formation of its environmental arm, Terra Environmental
Technologies (TET). Established in 2003, TET provides products
and services to customers using nitrogen products to reduce
nitrogen oxides (NOx) and other emissions from various sources,
including power plants; and in other environmental processes,
such as water treatment. A new opportunity is emerging for TET
with the North American use of urea liquor solution to reduce
harmful emissions from the exhaust of diesel engines. TET is
positioned to be a leader in North American environmental
nitrogen.
TERRA
TODAY
Terra, along with its subsidiaries, is a leading North American
producer and marketer of nitrogen products, serving agricultural
and industrial (including environmental) markets. In addition to
manufacturing facilities at Port Neal, Iowa; Courtright,
Ontario, Canada; Yazoo City, Mississippi; Donaldsonville,
Louisiana and Woodward, Oklahoma, we own a 75.3 percent
interest in Terra Nitrogen Company, L.P. (TNCLP), which, through
its subsidiary, Terra Nitrogen, Limited Partnership, operates
our manufacturing facility at Verdigris, Oklahoma. We are the
sole general partner and the majority limited partner of TNCLP.
In addition, we own a 50 percent interest in Point Lisas,
an ammonia production joint venture in the Republic of Trinidad
and Tobago. We also own a 50 percent interest in GrowHow, a
nitrogen products manufacturing joint venture with facilities in
the U.K.
Terra is one of the largest North American producers of
anhydrous ammonia (or ammonia), the basic building block of
nitrogen fertilizers. We convert a significant portion of the
ammonia we produce into UAN, AN and urea. Each of these products
is easier for distributors and farmers to transport, store and
apply to crops than ammonia. We also convert ammonia to nitric
acid and dinitrogen tetroxide for use in industrial
applications, and capture and sell carbon dioxide to industrial
users.
The principal customers for our North American nitrogen products
are national agricultural retail chains, farm cooperatives,
independent dealers and industrial customers. Agricultural
customers generally use nitrogen products as fertilizer for
crops. Industrial customers use nitrogen products to manufacture
chemicals, plastics and other products such as acrylonitrile,
polyurethanes, fibers, explosives and adhesives; to reduce NOx
and other emissions from power plants; and in water treatment
processes. Our facility in Yazoo City, Mississippi produces
industrial grade ammonium nitrate (IGAN) prills (a form of dry
pellet) and ammonium nitrate solution that are utilized as
explosives in the mining industry as well as a raw material in
the production of catalyst materials. We have a long term supply
contract with one of our customers to provide IGAN products for
a majority of the Yazoo City capacity.
Agricultural and industrial customers accounted for
approximately 70 and 30 percent of our 2009 North American
nitrogen product revenues respectively.
Financial information about our principal industry segment and
geographic areas is included in Item 7,
Management’s Discussion and Analysis of Financial
Condition and Results of Operations , and Note 22,
Industry Segment Data, of the Notes to the Consolidated
Financial Statements, included in Item 8, Financial
Statements and Supplementary Data, of this Annual Report on
Form 10-K.
The Pending Yara
Merger
On February 12, 2010, Terra entered into an Agreement and
Plan of Merger (the “Yara Merger Agreement”) with Yara
International ASA (“Yara”) and Yukon Merger Sub, Inc.
(“Merger Sub”), an indirect, wholly owned subsidiary
of Yara. If the transactions contemplated by the Yara Merger
Agreement are consummated, Merger Sub will merge with and into
Terra (the “Yara Merger”), with the result that Terra
will become an indirect, wholly owned subsidiary of Yara.
Upon consummation of the Yara Merger, each outstanding share of
Terra common stock will be converted into the right to receive
$41.10 in cash, without interest and less any taxes required to
be withheld. The purchase price is subject to increase as
provided in the Yara Merger Agreement if Yara does not hold its
stockholders meeting to obtain the Yara Stockholder Approval (as
defined below) within 90 days from the date of execution of
the Yara Merger Agreement.
The consummation of the Yara Merger is subject to certain
conditions, including, among others, (i) the approval by
Terra’s stockholders (the “Terra Stockholder
Approval”) of the Yara Merger, (ii) the approval by
Yara’s stockholders
2
(the “Yara Stockholder Approval”) of the issuance of
Yara common stock to finance a portion of the Yara Merger
consideration, (iii) the receipt of regulatory approvals
(or the expiration of applicable waiting periods) in the United
States, Canada and the European Union, (iv) the absence of
legal restraints preventing consummation of the Yara Merger,
(v) the absence of pending lawsuits by any governmental
entity seeking to prevent consummation of the Yara Merger that
would reasonably be expected to result in certain material
adverse effects on Terra and (vi) the absence since
January 1, 2009 of any change or event that, individually
or in the aggregate, has resulted in or would be reasonably
expected to result in a material adverse effect on Terra. The
Yara Merger is not subject to any financing condition.
The Yara Merger Agreement contains certain termination rights
and provides that (i) upon the termination of the Yara
Merger Agreement under specified circumstances, including, among
others, by Terra to accept a superior proposal or by Yara upon a
change in the recommendation of Terra’s board of directors,
Terra will owe Yara a cash termination fee of $123 million
and (ii) upon the termination of the Yara Merger Agreement
due to Yara’s failure to obtain the Yara Stockholder
Approval, Yara will owe Terra a cash termination fee of
$123 million.
2009 OVERVIEW
Executing Our Business Strategy
Our income attributable to common stockholders was
$152.6 million ($1.53 per diluted share), compared to
$631.9 million ($6.20 per diluted share) for 2008, an
exceptional year, and Terra’s most profitable. Results for
2009 were reduced by special charges totaling
$86.4 million, net of tax ($0.86 per diluted share),
related to tax expenses for repatriation of funds to the U.S.,
fees on early debt retirement and operating expenses related to
CF Industries Holdings, Inc.’s (CF) unsolicited proposals
to acquire Terra. Excluding these special charges, Terra’s
full-year 2009 adjusted results represent the third-best annual
financial performance in the company’s history.
Terra delivered this strong performance against a backdrop of
lackluster nitrogen demand resulting from the global economic
crisis and the psychological effect on buyers of having managed
through high-priced inventory from the previous year. The
sluggish nitrogen demand resulted in depressed selling prices
and weaker sales volumes, which were partially offset by natural
gas price reductions. Our ability to generate significant cash
in this difficult environment is testament to the effectiveness
of our strategic positioning over the past several years.
A discussion of significant activities for the year follows.
Expanding
Upgrading Capacity
We announced in May 2008 plans to expand the upgrading capacity
at our Woodward, Oklahoma nitrogen manufacturing facility at a
cost of approximately $180 million. As a result of this
project, ammonia available for sale as a finished product will
decrease from 310,000 to about 100,000 tons per year, and UAN
capacity will increase by about 500,000 tons per year.
Ammonia sales out of the Woodward facility have traditionally
been into industrial and local agricultural markets. Once this
project is complete, Woodward will serve primarily agricultural
markets with its reduced ammonia and increased UAN output.
Because agricultural customers are closer to the Woodward
facility than industrial customers previously serviced, and
because UAN is a value-added product, we expect the capacity
upgrade to strengthen our competitive position in the region.
We made substantial progress on this project in 2009, completing
enhanced loading facilities, a new substation, a new control
room and tie-ins to the existing plant. The project continues on
schedule and on budget, and we expect to complete the new
upgrading in the third quarter of 2010.
Positioning Terra
Environmental Technologies for Market Leadership
We formed TET, an indirect, wholly owned Terra subsidiary, in
2003 to expand upon our industrial business by focusing on the
fast-growing emissions reduction business. The 1990 Amendments
to the Clean Air Act form the basis of these businesses through
the promulgation of various Environmental Protection Agency
(EPA) regulations to govern and reduce the emissions of NOx from
all sources. Nitrogen oxides are major contributors to
ground-level
3
ozone and smog. The EPA recently strengthened these ambient air
standards and have proposed even further reductions, even though
significant portions of the country do not yet comply with
current standards.
Nitrogen oxides form when fossil fuels are combusted. These
oxides, when mixed with nitrogen-based products in the presence
of air, are reduced to atmospheric nitrogen and water. This
reduction occurs naturally, but its efficiency can be improved
significantly with the use of Selective Catalytic Reduction
(SCR) technology. SCR represents the post-combustion, emissions
after-treatment technology of choice for most power, industrial
and diesel engine applications.
TET provides emissions control solutions, offering
nitrogen-based products (reagents) including anhydrous ammonia,
ammonium hydroxide, and liquid and dry urea; and a broad range
of technical, engineering and logistical services. TET serves
two discrete customers: stationary and mobile. Stationary
customers include coal-fired power plants and other large
industries seeking to reduce NOx emissions. Mobile customers
include all businesses involved in supplying diesel exhaust
fluid (DEF) to consumers who use it to reduce harmful emissions
from the exhaust stream of diesel engines, including automotive
fluid distributors, truck stops, a variety of retail outlets and
original equipment manufacturers (OEMs).
Stationary
Business: Established and Growing
In 2009, TET-supplied reagents reduced more than 800,000 tons of
NOx produced at fossil-fuel-based power plants and from large
and small industrial boiler applications. We deliver these
products to our customers by tanker truck or railcar either
directly from Terra’s manufacturing facilities or through
our many terminal locations. Fossil fuels generate
70 percent of the U.S.’s electricity needs, with coal
and natural gas contributing 50 and 20 percent,
respectively, of that generating capacity. We believe the
EPA’s continued focus on improving air quality and the
heavy reliance on fossil fuels to power the nation’s
industrial and household energy needs will provide excellent
growth opportunities for sales to stationary customers for the
foreseeable future.
Mobile
Customers: A Source of New Revenues
Mobile sales are poised for growth over the next few years, and
we believe TET is positioned to be a leader in this arena.
TET’s branded diesel exhaust fluid—TerraCair
Ultrapure®
DEF (TerraCair)—is a urea solution that helps clean the air
by reducing NOx emissions from the exhaust stream of diesel
engines. Its use is driven by EPA legislation taking effect in
2010 that will require new on-road vehicles with diesel engines
to meet more stringent emissions requirements.
Product quality is essential to success in the DEF marketplace,
since an impure product can damage SCR equipment, negatively
impact aftertreatment operating performance and nullify
manufacturer warranties. Customers prefer domestically produced
DEF due to quality requirements: the liquid product is expensive
to transport due to its high water content, and the granular
product, while less expensive to move, uses formaldehyde—a
material that can foul catalyst systems—as a stabilizer.
TET’s
2009 Accomplishments Were Significant
TET has been laying the groundwork for leadership for some time.
Significant accomplishments in 2009 were:
|
|
|
|
| |
§
|
Working with the American Petroleum Institute (API) to certify
the quality of TerraCair. Through this exhaustive process, we
ultimately received certification that recognizes that our
product meets the stringent quality standards that engine
manufacturer service warranties require.
|
|
| |
| |
§
|
Executing an agreement with Excelda Manufacturing Company for
the packaging and distribution of TerraCair in package sizes of
50 gallons or less. This agreement complements one that TET
signed with Brenntag North America in December 2008. Together,
the Excelda and Brenntag agreements provide avenues for TET to
distribute TerraCair in package sizes ranging from one-gallon
containers to bulk truckloads.
|
|
| |
| |
§
|
Signing DEF supply agreements with Daimler Trucks North America
LLC; Volvo Group North America, Inc; Mack Trucks, Inc. and Ford
Motor Company.
|
|
| |
| |
§
|
Launching a new Web site at www.tet-terra.com in support of
TET’s position as a North American leader in emissions
reduction.
|
|
4
Recalibrating Our
Balance Sheet
In the 2009 fourth quarter, Terra recalibrated its balance
sheet, paying off approximately $318 million in debt and
assuming approximately $600 million in new debt under more
flexible terms that, among other things, enabled Terra to pay
shareholders a $7.50-per-share dividend in December 2009. With
cash in excess of $500 million at December 31, 2009,
Terra has the financial flexibility to complete the planned
acquisition of a 50 percent interest in Agrium, Inc.’s
(Agrium) Carseland, Alberta, Canada nitrogen manufacturing
facility, and pursue other growth opportunities. The acquisition
is conditioned upon Agrium’s successful acquisition of CF,
and the satisfaction of certain other conditions.
Returning Value
to Shareholders
Since 2006, Terra has consistently returned cash to its
shareholders. Over the past three years, Terra has returned more
than $1 billion, or 108 percent of its net income, to
shareholders in the form of share buybacks and cash dividends,
including the December 2009 return of approximately
$750 million of cash to shareholders through a special
dividend.
Living Our
Values
Some of our guiding principles are to protect the safety of our
employees, neighbors and communities; institute and observe
effective security procedures at our manufacturing sites and in
the transportation and delivery of our products; be responsible
stewards of the environment; provide excellent customer service;
be good corporate citizens; and extend competitive wages and
benefits to our employees. Following are examples of how we
acted on these values in 2009.
Operate
Safely
Our employees’ commitment to practicing safe work habits
resulted in three notable achievements in 2009:
|
|
|
|
| |
§
|
Our Verdigris facility was awarded Occupational
Safety & Health Administration (OSHA) VPP Star status,
representing the highest level of voluntary safety program
recognition that can be achieved in industry.
|
|
| |
| |
§
|
Our Courtright staff achieved three million
man-hours
worked without a lost-time injury.
|
|
| |
| |
§
|
Our Yazoo City staff achieved one million
man-hours
worked without a lost-time injury.
|
|
Focus on
Security
We continue to track a number of new legislative and regulatory
security initiatives. In 2009, Terra worked closely with The
Fertilizer Institute (TFI) to help the Department of Homeland
Security (DHS) on the newly developed Secure Handling of
Ammonium Nitrate Act (Act). Terra supports this Act and has made
comments to enhance the implementation of its requirements to
register all those who receive AN in a national database
maintained through the DHS. We have sent letters to all our AN
customers to inform them of existing regulations and updates on
the development of the Act.
Sustain Our
Business through Green Initiatives
We are doing our part to preserve the environment. The
fastest-growing arm of our business—TET—is devoted to
reducing emissions, and we have also spent the capital necessary
to voluntarily reduce EPA Toxic Release Inventory emissions from
our U.S. facilities to the air and water by more than
70 percent over the past 20 years. Some 2009
accomplishments in this arena were:
|
|
|
|
| |
§
|
Terra reduced its total direct greenhouse gas emissions by six
percent in 2009 with the installation of projects on nitric acid
units at Verdigris and Yazoo City. The projects resulted in a
decrease in greenhouse gas emissions of more than 600,000 metric
tons of carbon dioxide over the course of the year.
|
|
| |
| |
§
|
TET-supplied reagents reduced more than 800,000 tons of NOx
produced at fossil-fuel-based power plants and from large and
small industrial boiler applications.
|
|
5
|
|
|
|
| |
§
|
We completed our second full year of partnering with Envirofresh
Produce Inc. on an innovative project that reduces our
Courtright manufacturing facility’s environmental
footprint. Envirofresh built greenhouses on 170 acres of
Terra land in 2008. Today, excess energy from the manufacturing
process heats the greenhouses, and carbon dioxide that would
formerly have been released into the air is now captured and
used in food production. The project ties in perfectly with
Terra’s primary business of providing crop nutrients and
also aligns with our desire and ongoing efforts to be
environmentally responsible.
|
|
Listen and
Respond to Customer Needs
Terra is committed to building relationships with customers by
providing excellent service. We demonstrated this in 2009
through the following initiatives:
|
|
|
|
| |
§
|
We instituted a web-based customer portal that gives our
customers greater visibility and access to their account
information. The portal environment has been well used and
highly appreciated by our customers.
|
|
| |
| |
§
|
Consistent with our past practices, we conducted a customer
survey to broaden our understanding of customer wants and needs
and develop appropriate responses to meet those needs. This
project is part of an ongoing process to continuously improve
our relations with agricultural, industrial and environmental
customers.
|
|
Support Our
Communities
Terra strives to be a leading corporate citizen in the
communities in which we operate. We support our local
communities through United Way fund drives, Big Brothers/Big
Sisters classroom partnering, hosting an annual charity golf
tournament, supporting local and state 4H Foundations, and
supporting higher education through internships and
partnerships, among other events and activities. We also make
dollars and manpower available for one-off events such Yazoo
City providing for the construction of “Kidstown.”
Over the course of several weeks, Terra provided the manpower
and tools to lay cement foundations for elaborate play equipment
for the city park, assemble all the equipment and secure it to
the foundations.
THE NITROGEN
INDUSTRY: CONDUCTING BUSINESS IN A GLOBAL MARKETPLACE
The nitrogen business operates in a global environment. Large
volumes of ammonia, UAN, urea and AN trade across continents
each year. Of these products, UAN is used principally in North
America and Western Europe, and has only recently been traded in
other countries. The global trade of nitrogen products is
directly affected by each product’s water content.
UAN’s high water content and need for transportation in
tankers can cause transportation costs per unit of nitrogen to
be higher than for other forms of internationally traded
nitrogen products.
Strategic
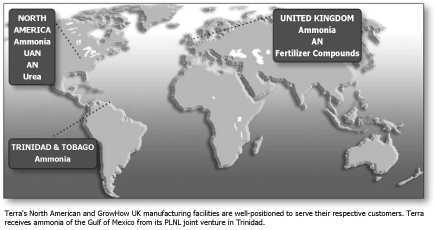
Production Locations
When shipping a high volume and frequently liquid product,
transportation costs and distance to market are key factors to
success. The locations of our North American production
facilities provide us an advantage in serving agricultural
customers in the Corn Belt and other major agricultural areas in
the United States and Canada. The GrowHow facilities are
positioned to serve customers throughout the U.K. The Point
Lisas
6
ammonia production facility in Trinidad and Tobago serves
U.S. and international nitrogen customers, benefiting from
access to low-cost natural gas supplies.
Product
Mix
Ammonia, UAN, urea and AN are the principal nitrogen products we
produce and sell in North America. GrowHow produces and sells
primarily ammonia, AN and fertilizer compounds in the U.K. The
Point Lisas production facility in Trinidad provides ammonia for
sale to both U.S. and international customers. Other
products we manufacture include nitric acid, dinitrogen
tetroxide and carbon dioxide. These products, along with a
portion of our ammonia, AN and urea production, are used in
industrial applications.
Although the different nitrogen fertilizer products are
interchangeable to some extent, each has its own characteristics
that make one product or another preferable to the end-user.
Anhydrous
Ammonia
We are the leading U.S. producer of ammonia. Ammonia is
produced when natural gas reacts with steam and air at high
temperatures and pressures in the presence of catalysts.
Although generally the cheapest source of nitrogen available to
agricultural customers, ammonia can be less desirable to
end-users than UAN, urea and AN because of its need for
specialized application equipment and its limited application
flexibility.
In 2009, we produced approximately 3,045,000 tons of ammonia at
our North American facilities. Consistent with the terms of
our contract which runs through 2018. In 2009, we purchased
one-half of the ammonia produced at Point Lisas based on market
indexed prices. In 2009, this amounted to approximately 360,000
tons. We sold a total of 1,607,000 tons of ammonia worldwide in
2009 and consumed approximately 1,438,000 tons of ammonia as a
raw material to manufacture our other nitrogen products.
Urea Ammonium
Nitrate Solutions (UAN)
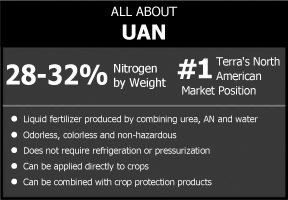
Terra is the largest UAN producer in the world. We focus on this
product because of its unique qualities which provide many
benefits over ammonia. UAN is a clear, non-hazardous liquid that
can be applied to crops directly or mixed with crop protection
products, permitting the application of several materials
simultaneously, reducing energy and labor costs and accelerating
field preparation for planting. UAN has high water content,
which increases transportation costs. A major portion of our UAN
is produced in the Corn Belt, giving us close proximity to the
end user and minimizing transportation costs. UAN may be applied
from ordinary tanks and trucks and sprayed or injected into the
soil, or applied through irrigation systems. In addition, UAN
may be applied throughout the growing season, providing
significant application flexibility. Due to its stability, UAN
(like AN) may be used for no-till row crops where fertilizer is
spread on the surface of the soil.
In 2009, we produced and sold approximately 3,297,000 and
3,226,000 tons of UAN, respectively.
Ammonium Nitrate
(AN)
Terra produces AN in three major forms, which we sell to
agricultural and industrial customers. In 2009, we produced and
sold approximately 995,000 and 879,000 tons of AN, respectively.
7
ANS (Ammonium
Nitrate Solution)
All AN production begins with ANS, a liquid product that is
89 percent AN, or 31 percent nitrogen. ANS is diluted
to an 84 percent AN concentration for merchant sales to
industrial customers who use it as a feedstock to:
|
|
|
|
| |
§
|
produce an emulsion that is used as a blasting agent in the
mining industry;
|
|
| |
| |
§
|
act as an oxidant in the production of catalyst for oil
refineries; and
|
|
| |
| |
§
|
produce nitrous oxide, or laughing gas, which is used primarily
in dentistry.
|
|
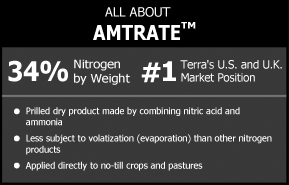
Terra also further processes the 89 percent ANS into the
upgraded nitrogen products
Amtratetm
(agricultural grade AN) and IGAN (Industrial Grade Ammonium
Nitrate.)
Amtratetm
We are the largest manufacturer and marketer of
agricultural-grade AN fertilizer in the U.S., and through
production at GrowHow, in the U.K.
Amtratetm,
our branded agricultural grade AN, contains 34 percent
nitrogen by weight. Because it is not subject to evaporation
losses, it is the product of choice for pastures and no-till
crops where fertilizer is spread upon the soil’s
surface.
IGAN
IGAN is prilled, low-density product containing
34 percent nitrogen by weight that is used as feedstock for
blasting agents used in the mining industry and in other
industrial applications.
Urea
We produce both a solid form of urea (granular urea) for
industrial and agricultural markets, and a liquid form (urea
liquor) for animal supplements and industrial (including
environmental) applications.
Granular urea has the highest nitrogen content of any solid
nitrogen product.
In 2009, we produced and sold approximately 803,000 and 284,000
tons of urea, respectively.
Non-Core Products
Terra reduces our impact on the environment and maximizes
the efficiency of our manufacturing facilities by capturing
and/or
further processing by-products from the manufacture of our core
product mix. Descriptions of these secondary products follow.
Nitric
Acid
Nitric acid is made by oxidizing ammonia with air. Terra uses
this product as a raw material for other nitrogen products and
sells it to industrial customers to produce such materials as
nylon fibers, polyurethane foams and specialty fibers.
Dinitrogen
Tetroxide
Dinitrogen tetroxide is the propellant oxidizer used in various
satellite, rocket and missile propulsion systems. It is also
used by industrial customers in the manufacturing of
pharmaceuticals. Dinitrogen tetroxide is produced by cooling and
8
condensing a slipstream of process gas from a nitric acid plant
containing various oxides of nitrogen. The recovered product is
filtered and its composition adjusted to meet final product
specifications.
Carbon
Dioxide
Carbon dioxide, or
CO2,
is a tasteless, colorless, odorless, nonflammable, liquefied
gas. Terra’s captures much of the carbon dioxide produced
in our manufacturing process, then purifies and liquefies it and
sells it to industrial customers. These customers use it to
produce everyday products like carbonated soft drinks, fire
extinguishers and dry ice, among many others.
Customer
Base
Agricultural
Our agricultural customers consist of independent dealers,
national retail chains and cooperatives. These agricultural
customers, in turn, sell product to dealers, farmers and other
end-users. A key to Terra’s competitiveness is our close
proximity to agricultural customers. This allows us, in most
instances, to have the lowest delivered cost for the
customer’s product of choice. It also enables Terra to
respond quickly to customer needs.
Industrial
Our industrial customers use nitrogen products as feedstocks for
a variety of chemical processes and in the manufacture of pulp,
paper, fibers and a range of other everyday products.
Environmental
Our TET business provides products and services to customers
using nitrogen products (chiefly ammonia, aqua ammonia and urea)
to reduce NOx emissions from various stationary sources, such as
power plants; in other environmental processes, such as water
treatment; and in the emerging DEF business.
Distribution
Terra’s nitrogen distribution network, one of North
America’s largest, is located to position Terra products
near the customers we serve. Terra either owns or has storage
agreements that provide access to nearly 1.3 million tons
of nitrogen fertilizer storage space at more than 50 locations.
Terra’s system has extensive modal flexibility to deliver
products by truck, rail, barge, vessel and pipeline.
Terra’s Donaldsonville facility not only produces ammonia
but also serves as an import facility for ocean-going vessels of
both ammonia and UAN. In addition, Terra is the only domestic
ammonia producer with operating ammonia production facilities
that originate on both interstate ammonia pipelines. Our Blair
terminal is one of only two facilities in the country that can
receive product from both major interstate ammonia pipelines. In
2009, the Blair facility shipped more ammonia than any other
year in its history.
Terra has exclusive right of use of certain terminal assets at
Blytheville, consisting of storage and supporting infrastructure
for 40,000 tons of ammonia and 9,500 tons of UAN.
In addition to our bulk storage distribution network, Terra has
partnered with a number of railcar receiving direct-transfer
facilities to deliver trucks of ammonia and reagent grade urea
liquor to NOx reduction customers.
We also own a 50 percent interest in the Houston Ammonia
Terminal (HAT), located on the Houston Ship Channel near
Pasadena, Texas. HAT has two 15,000-ton ammonia storage tanks
which provide ammonia to industrial customers in the area via a
pipeline system. The terminal can also receive ocean-going
vessels.
Transportation
We use several modes of transportation to distribute products to
customers, including railcars, common carrier trucks, barges and
common carrier pipelines:
|
|
|
|
| |
§
|
Railcars are the major mode of transportation at our North
American manufacturing facilities. At December 31, 2009,
our rail distribution system had approximately 3,000 railcars,
including those dedicated to hauling TET product. We believe our
fleet of UAN railcars is the largest in North America.
|
|
9
|
|
|
|
| |
§
|
We also deliver significant quantities of our product by truck.
We own and operate a common carrier, Terra Express, Inc., that
specializes in transporting all forms of nitrogen.
|
|
| |
| |
§
|
We use barges to move product up the river system and into the
Corn Belt. We hold twelve UAN and six ammonia barges under
long-term charter. We know of no recognized public source for
industry barge data, but believe that our long-term charters
comprise about 20 and 17 percent of the total available UAN
and ammonia fleets, respectively.
|
|
| |
| |
§
|
We use two separate pipeline transportation agreements to move
ammonia to the Corn Belt from our facilities. The Magellan
ammonia pipeline is directly connected to our Verdigris, Blair
and Port Neal facilities and the NuStar ammonia pipeline is
directly connected to our Donaldsonville and Blair facilities.
Our Woodward facility injects product into the Magellan system
as warranted via truck transfers. The location of our
manufacturing facilities and our network of distribution and
transportation resources allow Terra to efficiently provide
nitrogen products to agricultural and industrial customers.
|
|
NITROGEN INDUSTRY
OVERVIEW
Building Blocks for Growth
The three major nutrients required for plant growth are
nitrogen, produced from natural gas; phosphorous, mined as
phosphate rock; and potassium, mined as potash.
These three nutrients occur naturally in the soil, but must be
replaced because as crops grow, they remove them from the
ground. Nitrogen, to a greater extent than phosphate and potash,
must be reapplied each year in areas of intense agricultural
usage because of nitrogen absorption by crops and its tendency
to escape from the soil by evaporation or leaching.
Consequently, demand for nitrogen fertilizer tends to be more
consistent on a
year-to-year,
per-acre-planted
basis than is demand for phosphate or potash fertilizer.
The major nitrogen consuming crops in North America are corn and
wheat, although cotton, rice and sugar cane all require
significant application rates of nitrogen per acre. In the U.K.,
wheat is the major nitrogen consuming crop. Certain crops, such
as soybeans and other legumes, can better absorb atmospheric
nitrogen and do not require nitrogen fertilizers.
Demand: Stable
Growth
Global demand for fertilizers generally—and nitrogen in
particular—grows at predictable rates that tend to
correspond to growth in grain production and expansion of
industrial markets. Global fertilizer demand is driven in the
long-term by population growth, rising use of biofuels,
increases in disposable income and associated improvements in
diet. Short-term fertilizer demand depends on world economic
growth rates and factors creating temporary imbalances in supply
and demand. These factors include weather patterns, the level of
world grain stocks relative to consumption, agricultural
commodity prices, energy prices, crop mix, fertilizer
application rates, farm income and temporary disruptions in
fertilizer trade from government intervention such as changes in
the buying patterns of China and India.
Long-term global demand growth for nitrogen is also present in
the industrial and environmental businesses. Industrial growth
is tied to increasing demand for coal and the expansion of
industries that use nitrogen as a raw material. Growth in the
environmental business is tied to increased use of nitrogen
products that reduce NOx emissions. In the short-term
environmental growth is spurred by changes in legislation and
regulations. When these changes become institutionalized, they
form the foundation for organic long-term growth as the
environmental business increases in size over time.
10
Supply:
Influenced by Gas Costs and Capital/Construction Costs
Over the past seven years, global ammonia capacity has increased
incrementally, growing at an average of approximately
2.5 percent per year. This result was attributable
principally to the combination of new project capacity being
offset by permanent plant closings in the U.S. and in
Europe. As global operating rates and prices have risen, so have
plans for new capacity.
This anticipated new global capacity will come primarily from
advantaged natural gas regions of the world, such as the Middle
East and Africa. This expansion of capacity could be limited,
however, by high capital and construction costs, lower nitrogen
prices and increasing natural gas prices. Russia has increased
domestic gas prices as well as prices paid by their export
customers. This has increased production costs for new and
existing plants in Russia and Europe.
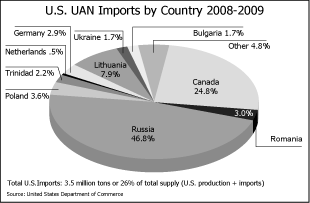
Imports account for a significant portion of U.S. nitrogen
product supply. Producers from Russia, Canada, the Middle East,
Trinidad and Venezuela are major exporters to the
U.S. These export producers are often most competitive in
regions close to the point of entry for imports, primarily the
Gulf coast and east coast of North America. Due to higher
freight costs and limited distribution infrastructure, importers
are less competitive in serving the main corn-growing regions of
the U.S., which are more distant from these points of entry.
According to Fertecon, a leading fertilizer industry
publication, world ammonia imports grew from 17.0 million
tons in 2000 to 20.3 million tons by 2008 due to the
exceptional increase in gas prices in the U.S. and Europe
during this period and the consequent closure of
U.S. capacity.
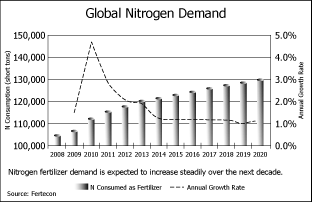
Outlook: Broadly
Positive
As of October 2009, Fertecon forecasted global nitrogen
fertilizer demand to rise by around 2 percent per year from
2008 to 2020, increasing by 23.9 million tons or close to
23 percent over the period. In North America, nitrogen
fertilizer consumption is expected to increase in the same
period from 14.1 million tons to 16.0 million tons, a
14 percent increase.
The continued growth in nitrogen demand has helped stabilize
global ammonia capacity utilization rates, which averaged
82 percent between 2007 and 2008. Fertecon forecasts global
ammonia utilization rates to remain stable at approximately
80 percent, and North American ammonia utilization rates to
remain stable at approximately 85 percent, through 2015.
To help meet the growing global demand for fertilizers,
especially in high growth areas like China and India, new
ammonia capacity is expected to come on stream globally in the
next decade. According to Fertecon, global ammonia capacity is
forecasted to increase by 17.5 million tons by 2015, a
total increase of 12 percent. This projected capacity
increase excludes Chinese plants, as any new volumes in China
are not expected to reach global markets. There are
11
a number of new capacity projects expected or underway in gas
advantaged regions, however, increased construction costs and
changes in market dynamics have delayed a number of such
projects.
World trade in ammonia is expected to increase by
4.1 million tons or 22 percent from 2009 to 2015,
according to Fertecon, representing more modest growth than 2000
to 2005. Fertecon projects that higher gas costs for Russian and
Ukrainian exporters and the lower relative gas price outlook for
the U.S. would appear to support continued operating rates
at the remaining U.S. ammonia capacity, limiting the
near-term growth in ammonia imports.
Global grain inventories are currently at levels significantly
below the ten-year average, and corn prices, which have been
volatile over the past several years, stand at $3.34 per bushel
as of February 19, 2010 versus $3.40 per bushel one year
prior and $4.98 per bushel two years prior. Both of these
factors influence the outlook for demand for our products.
The emergence of ethanol as an alternative energy source has the
potential to drive incremental fertilizer demand. Corn, the
primary feedstock for U.S. ethanol production, represents
approximately 46 percent of fertilizer demand in North
America. New ethanol capacity is increasing the demand for corn
and is expected to increase U.S. corn acreage for ethanol
production from 20 million acres in 2008 to 29 million
acres in 2012. The amount of corn used in the U.S. for
ethanol production has more than doubled in the last five years.
In
2007-2008,
approximately 3.0 billion bushels of corn were used for
ethanol production. This number is projected to rise to over
4.0 billion bushels by
2009-2010,
equivalent to approximately 32 percent of the
U.S. corn crop.
The 1990 Amendments to the Clean Air Act increasingly require
companies that combust fossil fuels to reduce their emissions.
Reduction of oxides of both nitrogen and sulfur are accomplished
with SCR and wet scrubbing technologies. Environmental control
devices using ammonia or ammonia-based compounds, across a broad
range of applications from coal based generation to diesel
engines, are very effective in meeting emissions targets.
Further, TET is establishing an infrastructure to serve DEF
customers. We believe these new and emerging opportunities may
increase North American demand for ammonia by up to
2.5 million tons by 2018.
Seasonality and
Volatility
The fertilizer business is highly seasonal based upon the
planting, growing and harvesting cycles. Nitrogen fertilizer
inventories must be accumulated to permit uninterrupted customer
deliveries and require significant storage capacity. This
seasonality generally results in higher fertilizer prices during
peak consumption periods, with prices normally reaching their
highest point in the spring, decreasing in the summer, and
increasing again in the late fall/early winter period as
depleted inventories are restored.
Nitrogen fertilizer prices can also be volatile as a result of a
number of other factors. The most important of these factors are:
|
|
|
|
| |
§
|
Weather patterns and field conditions (particularly during
periods of high fertilizer consumption);
|
|
| |
| |
§
|
Quantities of fertilizers imported to primary markets;
|
|
| |
| |
§
|
Current and projected grain inventories and prices, which are
heavily influenced by U.S. exports, worldwide grain
markets, and domestic demand (food, feed and biofuel); and
|
|
| |
| |
§
|
Price fluctuations in natural gas, the principal raw material
used to produce nitrogen fertilizer.
|
|
Governmental policies may directly or indirectly influence the
number of acres planted, the level of grain inventories, the mix
of crops planted, crop prices and environmental demand.
Raw
Materials
The sole purchased feedstock used to produce manufactured
nitrogen products is natural gas.
Natural gas costs in 2009 accounted for approximately
43 percent of our total costs and expenses. Significant
increases in natural gas costs that are not hedged or recovered
through increased prices to customers would have an adverse
impact on our business, financial condition and results of
operations. We believe there will be a sufficient
12
supply of natural gas for the foreseeable future and we will, as
opportunities present themselves, enter into firm transportation
contracts to minimize the risk of interruption or curtailment of
natural gas supplies during the peak-demand season. We use a
combination of spot and term purchases of varied duration from a
variety of suppliers to obtain natural gas supply.
| |
|
|
|
|
|
|
|
How Natural Gas Gets to
Terra’s Facilities
|
|
|
|
|
|
|
2009 Average Basis
|
|
|
Facility
|
|
Mode of
Transportation
|
|
Difference From Henry
Hub
|
|
|
Courtright, Ontario
|
|
Purchased from local utility distribution company, through open
access
|
|
|
0.29
|
|
|
Donaldsonville, Louisiana
|
|
Four intrastate pipelines
|
|
|
.04
|
|
|
Port Neal, Iowa
|
|
Interstate, open-access pipelines
|
|
|
(0.44
|
)
|
|
Verdigris, Oklahoma*
|
|
Intrastate pipelines
|
|
|
(0.79
|
)
|
|
Woodward, Oklahoma*
|
|
Interstate and intrastate pipelines
|
|
|
(0.79
|
)
|
|
Yazoo City, Mississippi
|
|
Three interstate pipelines and one intrastate pipeline
|
|
|
.04
|
|
|
|
|
|
|
|
|
|
|
* The intrastate pipelines serving Woodward and Verdigris
are not open-access carriers, but are nonetheless part of a
regional system which allows receipt from other major Oklahoma
sources. We also have limited access to
out-of-state
natural gas supplies for these facilities.
|
|
|
|
|
|
|
|
|
We use derivative instruments to hedge a portion of our natural
gas purchases. Our policy is designed to hedge exposure to
natural gas price fluctuations for production required for
estimated forward product sales commitments. We hedge natural
gas prices through the use of supply contracts, financial
derivatives and other instruments.
The settlement dates of forward-pricing contracts coincide with
gas purchase dates as well as shipment periods on forward
committed sales. Forward-pricing contracts are based on a
specified price referenced to spot market prices or appropriate
New York Mercantile Exchange (NYMEX) futures contract prices.
Point Lisas has a contract through 2018 to purchase natural gas
from the National Gas Company of Trinidad and Tobago. The joint
venture’s cost of natural gas has historically been
significantly lower than U.S. natural gas costs, which has
resulted in the joint venture being substantially more
profitable than comparable North American ammonia only
facilities.
Competition
The categories in which we operate are highly competitive.
Competition for agricultural product sales takes place largely
on the basis of price, supply reliability, delivery time and
quality of service. Feedstock availability to production
facilities and the cost and efficiency of production,
transportation and storage facilities are also important
competitive factors.
Government intervention in international trade can distort the
competitive environment. The relative cost and availability of
natural gas are also important competitive factors. Significant
determinants of the competitive position of our plants are the
natural gas acquisition and transportation contracts we
negotiate with our major suppliers, as well as proximity to
natural gas sources
and/or
end-users.
Our domestic competitors in nitrogen fertilizers are primarily
other independent fertilizer companies. Nitrogen fertilizers
imported into the U.S. compete with domestically produced
nitrogen fertilizers, including those we produce. Imports of
nitrogen products represent approximately 46 percent of
nitrogen used in North America. Some foreign competitors in
countries with inexpensive sources of natural gas (whether as a
result of government regulation or otherwise) can produce
nitrogen fertilizers at a low cost. A substantial amount of new
ammonia capacity is expected to be added abroad in the
foreseeable future in countries with favored natural gas costs.
Credit
Our credit terms are generally
15-30 days,
but may be extended for longer periods during certain sales
seasons, consistent with industry practices.
13
Environmental and
Other Regulatory Matters
Our U.S. operations are subject to various federal, state
and local environmental, health and safety laws and regulations,
including laws relating to air emissions, hazardous or solid
wastes and water discharges. Our operations in Canada are
subject to various federal and provincial regulations regarding
such matters, including the Canadian Environmental Protection
Act administered by Environment Canada, and the Ontario
Environmental Protection Act administered by the Ontario
Ministry of the Environment. All of our facilities require
operating permits that are subject to review by governmental
agencies. We are also involved in the manufacture, handling,
transportation, storage and disposal of materials that are or
may be classified as hazardous or toxic by federal, state,
provincial or other regulatory agencies. We take precautions to
reduce the likelihood of accidents (including human exposure)
involving these materials. If such materials have been or are
disposed of at sites that are targeted for investigation
and/or
remediation by federal or state regulatory agencies, we may be
responsible under the Comprehensive Environmental Response,
Compensation and Liability Act of 1980 (CERCLA) or analogous
state laws for all or part of the costs of such investigation
and remediation, and damages to natural resources.
With respect to the Verdigris, Oklahoma facility,
Freeport-McMoRan Resource Partners, Limited Partnership (a
former owner and operator of the facility) retains liability for
certain environmental matters. We retained certain liability for
the pre-closing environmental condition of the Billingham and
Severnside, England facilities in conjunction with the
establishment of the GrowHow joint venture in 2007. After
ceasing production at the Severnside, England facility on
January 31, 2008, we dismantled the facility and completed
remediation at the site. We are entitled to the proceeds of sale
of the Severnside site.
We endeavor to comply in all material respects with applicable
environmental, health and safety regulations and we have
incurred substantial costs in connection with this compliance.
Because these laws and regulations are expected to continue to
change and generally become more restrictive than current
requirements, the costs of compliance will likely increase. We
do not expect our compliance with these laws and regulations to
have a material adverse effect on our results of operations,
financial position or net cash flows; however, there can be no
guarantee that new regulations will not result in material
costs. We may be required to install additional air and water
quality control equipment, such as low nitrous oxide burners,
scrubbers, ammonia sensors and continuous emission monitors, at
certain facilities, such as our nitric acid facilities, to
comply with applicable environmental requirements. Our capital
expenditures related to environmental control in 2009, 2008 and
2007 were approximately $7.6 million, $5.3 million and
$2.5 million, respectively. Projected environmental capital
expenditures are $11.0 million for 2010, $13.9 million
for 2011 and $9.1 million for 2012.
We believe that our policies and procedures are in compliance
with applicable environmental laws and with the permits relating
to the facilities in all material respects. However, in the
normal course of our business, we are exposed to risks relating
to possible releases of hazardous substances, including
anhydrous ammonia, into the environment. Such releases could
cause substantial damages or injuries. Although environmental
expenditures have not been material during the past year, it is
impossible to predict or quantify the impact of future
environmental liabilities associated with accidental releases of
hazardous substances from our facilities. Such liabilities could
have a material adverse impact on our results of operations,
financial position
and/or net
cash flows.
Employees
Terra had 929 full-time employees at December 31, 2009.
14
Available
Information
Terra was incorporated in Maryland in 1978 and is subject to the
reporting requirements of the Securities Exchange Act of 1934
(the Exchange Act) and its rules and regulations. The Exchange
Act requires us to file reports, proxy statements and other
information with the U.S. Securities and Exchange
Commission (SEC). Copies of these reports, proxy statements and
other information can be obtained through the SEC’s Web
site at
http://www.sec.gov,
at the SEC’s Office of Public Reference,
100 F Street, NE Room 1580, Washington, D.C.
20549, or by calling
(800) SEC-0330.
We make available, free of charge on our Web site at
www.terraindustries.com, our annual report on
Form 10-K,
quarterly reports on
Form 10-Q,
current reports on
Form 8-K,
and amendments to these reports filed or furnished pursuant to
Section 13(a) or 15(d) of the Exchange Act, as soon as
reasonably practicable after we electronically file these
documents with, or furnish them to, the SEC.
We also make available, free of charge on our Web site, the
charters of the Audit Committee, the Compensation Committee, and
the Nominating and Corporate Governance Committee, as well as
the Corporate Governance Guidelines of our Board of Directors
(the Board) and our Code of Ethics and Standards of Business
Conduct (including any amendment to, or waiver from, a provision
of our Code of Ethics and Standards of Business Conduct) adopted
by our Board.
Copies of any of these documents are also made available, free
of charge, upon written request to:
Terra Industries Inc.
Attention: Investor Relations
600 Fourth Street
P.O. Box 6000
Sioux City, Iowa
51102-6000
15
ITEM 1A. RISK
FACTORS
In addition to the other information contained in this
Form 10-K,
the following risk factors should be considered carefully in
evaluating our business. Our business, financial condition, or
results of operations could be materially adversely affected by
any of these risks. Please note that additional risks not
presently known to us or that our management currently deems
immaterial may also impair our business, financial condition and
results of operations.
A substantial portion of Terra’s operating expense is
related to the cost of natural gas, and an increase in such cost
that is either unexpected or not accompanied by increases in
selling prices of products could result in reduced profit
margins and lower product production.
The principal raw material used to produce nitrogen products is
natural gas. Natural gas costs in 2009 comprised approximately
43 percent of total costs and expenses. A significant
increase in the price of natural gas (which can be driven by,
among other things, supply disruptions, governmental or
regulatory actions, cold weather and oil price spikes) that is
not hedged or recovered through an increase in the price of
related nitrogen products could result in reduced profit margins
and lower product production. We have previously idled one or
more of our plants in response to high natural gas prices and
may do so again in the future. A significant portion of our
competitors’ global nitrogen production occurs at
facilities with access to fixed-priced
and/or
product related natural gas supplies, similar to our gas supply
contract in Trinidad. The natural gas costs for these
competitors’ global nitrogen facilities have been and
likely will continue to be substantially lower than our North
American and U.K. gas costs.
Declines in the prices of our products may reduce profit
margins.
Prices for nitrogen products are influenced by the global supply
and demand conditions for ammonia and other nitrogen-based
products. Long-term demand is affected by population growth and
rising living standards that determine food consumption.
Short-term demand is affected by world economic conditions and
international trade decisions. Supply is affected by increasing
worldwide capacity and the increasing availability of nitrogen
product exports from major producing regions such as Russia,
Canada, the Middle East, Trinidad and Venezuela. New global
ammonia capacity is expected abroad in the foreseeable future.
If this anticipated growth in new capacity exceeds the growth in
demand, the price at which we sell our nitrogen products may
decline, resulting in reduced profit margins, lower production
of products and potential plant closures. Supply in the
U.S. and Europe is also affected by trade regulatory
measures, which restrict import supply into those regions.
Changes in those measures would likely adversely impact
available supply and pricing.
Our products are subject to price volatility resulting from
periodic imbalances of supply and demand, which may cause our
results of operations to fluctuate.
Historically, the prices for our products have reflected
frequent changes in supply and demand conditions. Changes in
supply result from capacity additions or reductions and from
changes in inventory levels. Demand for products is dependent on
demand for crop nutrients by the global agricultural industry
and on the level of industrial production. Periods of high
demand, high capacity utilization and increasing operating
margins tend to result in new plant investment and increased
production until supply exceeds demand, followed by periods of
declining prices and declining capacity utilization until the
cycle is repeated. In addition, demand for our products is
affected by general economic conditions. As a result of periodic
imbalances of supply and demand, product prices have been
volatile, with frequent and significant price changes. During
periods of oversupply, the price at which we sell our products
may be depressed and this could have a material adverse effect
on our business, financial condition and results of operations.
Our products are global commodities and we face intense
competition from other producers.
Our products are global commodities and can be subject to
intense price competition from both domestic and foreign
sources. Customers, including end-users, dealers and other
crop-nutrient producers and distributors, base their purchasing
decisions principally on the delivered price and availability of
the product. We compete with a number of U.S. producers and
producers in other countries, including state-owned and
government-subsidized entities. The U.S. and the European
Commission each have implemented trade regulatory measures,
changes in which could have an adverse impact on our sales and
profitability of the particular products involved. Some of our
principal competitors have greater total resources and are less
dependent on earnings from nitrogen fertilizer sales. In
addition, a portion of
16
global production benefits from natural gas contracts that have
been, and could continue to be, substantially lower priced than
our natural gas. Our inability to compete successfully could
result in the loss of customers, which could adversely affect
sales and profitability.
Our business is subject to risks related to weather
conditions.
Adverse weather conditions may have a significant effect on
demand for our nitrogen products. Weather conditions that delay
or intermittently disrupt field work during the planting and
growing season may cause agricultural customers to use less or
different forms of nitrogen fertilizer, which may adversely
affect demand for the product that we sell. Weather conditions
following harvest may delay or eliminate opportunities to apply
fertilizer in the fall. Weather can also have an adverse effect
on crop yields, which lowers the income of growers and could
impair their ability to pay our customers.
Weather
and/or
weather forecasts can dramatically affect the price of natural
gas, our main raw material. Colder than normal winters as well
as warmer than normal summers increase the natural gas demand
for residential use. Also, hurricanes affecting the gulf coastal
states can severely impact the supply of natural gas and cause
prices to rise sharply.
Our risk measurement and hedging activities might not prevent
losses.
We manage commodity price risk for our businesses as a whole.
Although we implemented risk measurement systems that use
various methodologies to quantify the risk, these systems might
not always be followed or might not always work as planned.
Further, such risk measurement systems do not in themselves
manage risk, and adverse changes involving volatility, adverse
correlation of commodity prices and the liquidity of markets
might still adversely affect earnings and cash flows, as well as
the balance sheet under applicable accounting rules, even if
risks have been identified. The ability to manage exposure to
commodity price risk in the purchase of natural gas through the
use of financial derivatives may be affected by limitations
imposed by the covenants in the agreements governing our
indebtedness.
In an effort to manage financial exposure related to commodity
price and market fluctuations, we have entered into contracts to
hedge certain risks associated with our business, its assets and
operations. In these hedging activities, we have used
fixed-price, forward, physical purchase and sales contracts,
futures, financial swaps and option contracts traded in the
over-the-counter
markets or on exchanges. Nevertheless, no single hedging
arrangement can adequately address all risks present in a given
contract or industry. Therefore, unhedged risks will always
continue to exist. We may not be able to successfully manage all
credit risk and as such, future cash flows could be impacted by
counterparty default. As part of our policies and procedures
with respect to swap counterparties, we perform credit analysis
and maintain an approved counterparty listing with established
individual counterparty credit exposure limits.
Counterparty credit exposure limits did not exceed
$20 million for any individual counterparty during the
fiscal year ended December 31, 2009.
We are substantially dependent on our manufacturing
facilities, and any operational disruption could result in a
reduction of sales volumes and could cause us to incur
substantial expenditures.
Our manufacturing operations may be interrupted if one or more
of our facilities were to experience a major accident, equipment
failure or damage by severe weather or other natural disaster.
In addition, our operations are subject to hazards, such as
fires, accidental releases or explosions, inherent in chemical
manufacturing. These events may cause personal injury and loss
of life, severe damage to or destruction of property and
equipment and environmental contamination, and, in some cases,
could result in suspension of operations and the imposition of
civil or criminal penalties. For example, an explosion at our
Port Neal, Iowa facility in 1994 required us to rebuild nearly
the entire facility, and a June 1, 2006 explosion shut down
the ammonia production plant in Billingham, England until
repairs were completed in August 2006. In addition,
approximately four weeks of unplanned outages at our Point Lisas
Nitrogen facility during the 2006 third quarter to repair
failing heat exchangers were only partly successful and the
plant operated at about 80 percent of capacity until
replacement exchangers were installed during a scheduled
turnaround in early 2007. Also, a mechanical outage at the
Courtright, Ontario facility in April 2001 required us to shut
down that facility for approximately two months. We currently
maintain property insurance, including business
17
interruption insurance, but we may not have sufficient coverage
to cover all our losses, or may be unable in the future to
obtain sufficient coverage at reasonable costs.
We may incur costs or liabilities under environmental laws or
regulations to which we are subject.
Our operations and properties are subject to various foreign,
federal, state, provincial and local environmental, safety and
health laws and regulations, including laws relating to air
emissions, the use and disposal of hazardous and solid materials
and wastes, water quality, investigation and remediation of
contamination, transportation and worker health and safety. We
could incur substantial costs, including capital expenditures
for equipment upgrades, civil and criminal fines and penalties
and third-party claims for damages, as a result of violations of
or liabilities under environmental laws and regulations. In
connection with the manufacturing, handling, transportation,
storage and disposal of materials that are or may be classified
as hazardous or toxic by foreign, federal, state, provincial or
local agencies, Terra may be responsible under CERCLA or
analogous state laws if such materials have been or are disposed
of or released at sites that require investigation
and/or
remediation, including for damages to natural resources. Under
some of these laws, responsible parties may be held jointly and
severally liable for such costs, regardless of fault or the
legality of the original disposal or release.
We have liability as a “potentially responsible party”
at certain sites under certain environmental remediation laws,
and have also been subject to related claims by private parties
alleging property damage and possible personal injury arising
from contamination relating to active as well as discontinued
operations. We may be subject to additional liability or
additional claims in the future. Some of these matters may
require significant expenditures for investigation
and/or
cleanup or other costs.
From time to time, our production of anhydrous ammonia has
resulted in accidental releases that have temporarily disrupted
our manufacturing operations and resulted in liability for
administrative penalties and claims for personal injury.
Although, to date, our costs to resolve these liabilities have
not been material, we could incur significant costs if our
liability coverage is not sufficient to pay for all or a large
part of any judgments against us, or if our carrier refuses
coverage for these losses.
We may be required to install additional pollution control
equipment at certain facilities in order to maintain compliance
with applicable environmental requirements.
Continued government and public emphasis on environmental
issues, including proposals to reduce emissions of carbon
dioxide and other greenhouse gases, can be expected to result in
increased future investments for environmental controls at
ongoing operations. We may be required to install additional air
and water quality control equipment, such as low nitrous oxide
burners, scrubbers, ammonia sensors and continuous emission
monitors, at certain of our facilities in order to comply with
applicable environmental requirements. Such investments would
reduce income from future operations. Present and future
environmental laws and regulations applicable to operations,
more vigorous enforcement policies and discovery of previously
unknown conditions may require substantial expenditures in
excess of our estimates and may have a material adverse effect
on our results of operations, financial position or net cash
flows.
Government regulation and agricultural policy may reduce the
demand for our products.
Existing and future government regulations and laws may reduce
the demand for our products. Existing and future agricultural
and/or
environmental laws and regulations may impact the amounts and
locations of fertilizer application and may lead to decreases in
the quantity of nitrogen fertilizer applied to crops. Changes in
U.S. energy policies may affect the demand for our nitrogen
products. Any such decrease in the demand for fertilizer
products could result in lower unit sales and lower selling
prices for nitrogen fertilizer products. U.S. and E.U.
governmental policies affecting the number of acres planted, the
level of grain inventories, the mix of crops planted and crop
prices could also affect the demand and selling prices of our
products. In addition, we manufacture and sell AN in the
U.S. and, in the U.K., through our GrowHow joint venture.
AN can be used as an explosive and was used in the Oklahoma City
bombing in April 1995. It is possible that either the
U.S. or U.K. governments could impose limitations on the
use, sale or distribution of AN, thereby limiting our ability to
manufacture or sell this product.
18
We are subject to risks associated with possible climate
change legislation, regulation and international accords.
Greenhouse gas emissions have increasingly become the subject of
a large amount of international, national, regional, state and
local attention. Cap and trade initiatives to limit greenhouse
gas emissions have been introduced in the EU. Similarly,
numerous bills related to climate change have been introduced in
the US Congress, which could adversely impact all industries. In
addition, future regulation of greenhouse gas could occur
pursuant to future US treaty obligations, statutory or
regulatory changes under the Clean Air Act or new climate change
legislation.
While not all are likely to become law, this is a strong
indication that additional climate change related mandates may
be forthcoming, and it is expected that they may adversely
impact our costs by increasing energy costs and raw material
prices and establishing costly emissions trading schemes and
requiring modification of equipment.
A step toward potential federal restriction on greenhouse gas
emissions was taken on December 7, 2009 when the EPA issued
its Endangerment Finding in response to a decision of the
Supreme Court of the United States. The EPA found that the
emission of six greenhouse gases, including carbon dioxide
(which is emitted from the combustion of fossil fuels), may
reasonably be anticipated to endanger public health and welfare.
Based on this finding, the EPA defined the mix of these six
greenhouse gases to be “air pollution” subject to
regulation under the Clean Air Act. Although the EPA has stated
a preference that greenhouse gas regulation be based on new
federal legislation rather than the existing Clean Air Act, many
sources of greenhouse gas emissions may be regulated without the
need for further legislation.
The US Congress is considering legislation that would create an
economy-wide
“cap-and-trade”
system that would establish a limit (or cap) on overall
greenhouse gas emissions and create a market for the purchase
and sale of emissions permits or “allowances.” Under
the leading
cap-and-trade
proposals before Congress, the fertilizer industry likely would
be affected due to anticipated increases in the cost of natural
gas fuel and feedstock, and the cost of emissions allowances,
which the Company would be required to obtain. In addition,
cap-and-trade
proposals would likely increase the cost of electricity used by
the Company. Other countries are also considering or have
implemented
“cap-and-trade”
systems. Future environmental regulatory developments related to
climate change are possible, which could materially increase
operating costs in the fertilizer industry and thereby increase
our manufacturing and delivery costs.
We are subject to risks associated with international
operations.
Our international business operations are subject to numerous
risks and uncertainties, including difficulties and costs
associated with complying with a wide variety of complex laws,
treaties and regulations; unexpected changes in regulatory
environments; currency fluctuations; tax rates that may exceed
those in the U.S.; earnings that may be subject to withholding
requirements; and the imposition of tariffs, exchange controls
or other restrictions. During 2009, we derived approximately
5 percent of our net sales from outside of the
U.S. Terra’s business operations include a
50 percent interest in an ammonia production joint venture
in the Republic of Trinidad and Tobago and a 50 percent
interest in a U.K. joint venture for the production of ammonia.
Our business may be adversely impacted by our leverage, which
may require the use of a substantial portion of excess cash flow
to service debt and may limit our access to additional
capital.
Our debt could have important consequences on our business. For
example, it could (i) increase our vulnerability to adverse
economic and industry conditions by limiting flexibility in
reacting to changes in our business or industry,
(ii) reduce our cash flow available to fund working
capital, capital expenditures and other general corporate
purposes, (iii) place us at a competitive disadvantage
compared to competitors that have less leverage and
(iv) limit our ability to borrow additional funds and
increase the cost of funds that we can borrow. We may not be
able to reduce financial leverage when we choose to do so, and
may not be able to raise capital to fund growth opportunities.
We may be unable to refinance our debt upon a change of
control.
In the event that we experience a “change of control”
(as defined in our bond indenture and the instruments governing
our 4.25 percent Series A Cumulative Convertible
Perpetual Preferred Shares (Series A Preferred Shares)),
such as the Yara Merger, we may need to refinance large amounts
of debt and the Series A Preferred Shares. If a change of
19
control occurs, we must offer to buy back the notes under our
indenture governing the 7.75 percent senior notes due 2019
and the Series A Preferred Shares for a price equal to
101 percent of the notes’ principal amount or
100 percent of the liquidation value of the Series A
Preferred Shares, as applicable, plus any interest or dividends
which have accrued and remain unpaid as of the repurchase date.
There can be no assurance that there will be sufficient funds
available for any repurchases that could be required by a change
of control.
Additionally, under our revolving credit facilities
(facilities), a change of control will occur if, among other
such things, an individual or group acquires beneficial
ownership of more than 35 percent of the outstanding voting
shares of Terra, which will be the case upon consummation of the
Yara Merger. Such a change of control would constitute an event
of default under our revolving credit facilities. In addition, a
change of control (as defined in the indenture) will also result
in a change of control under the facilities. We may not be able
to replace our current revolving credit facilities on terms
equal to or more favorable than the current terms if the
commitments are terminated and the loans are repaid under our
existing credit facilities upon an event of default.
If the global economic downturn continues or worsens, our
business could be adversely impacted.
In the latter part of 2008 and into 2009, the global economic
downturn worsened and nitrogen markets continued to weaken. We
have experienced declining demand and falling prices for some of
our products due to the general economic slowdown and our
customers’ reluctance to replenish inventories. In
particular, industrial demand for ammonia has remained
relatively weak as the economy has struggled to recover. At the
same time, the economic downturn has also reduced demand and
pricing for natural gas, the primary raw material used in the
production of nitrogen products, which has helped to reduce our
production costs. In light of these varied and sometimes
offsetting effects, the overall impact of the global economic
downturn is difficult to predict and our business could be
adversely impacted.
We are exposed to risks associated with our joint venture
investments.
We participate in several joint ventures with third parties. Our
joint venture partners may have shared or majority control over
the operations of our joint ventures. As a result, our
investments in joint ventures involve risks that are different
from the risks involved in owning facilities and operations
independently. These risks include the possibility that our
joint ventures or our partners:
|
|
|
|
| |
§
|
have economic or business interests or goals that are or become
inconsistent with our business interests or goals;
|
|
| |
| |
§
|
are in a position to take action contrary to our instructions,
requests, policies or objectives;
|
|
| |
| |
§
|
subject the property to liabilities exceeding those contemplated;
|
|
| |
| |
§
|
take actions that reduce our return on investment; or
|
|
| |
| |
§
|
take actions that harm our reputation or restrict our ability to
run our business.
|
|
In addition, we may become involved in disputes with our joint
venture partners, which could lead to impasses or situations
that could harm the joint venture, which could reduce our
revenues, increase our costs and lower our profits.
Disruption in or increased costs of transportation services
could have an adverse effect on our profitability.
We depend on rail, barge, truck and pipeline transportation
services to deliver nitrogen products to our customers, and
transportation costs are a significant component of the total
cost of supplying nitrogen products. Disruptions of these
transportation services could temporarily impair our ability to
supply nitrogen products to our customers. In addition,
increases in our transportation costs, or changes in such costs
relative to transportation costs incurred by our competitors,
could have an adverse effect on our revenues and results of
operations.
We and Yara may not satisfy certain closing conditions
necessary to consummate the Yara Merger.
On February 12, 2010, Terra entered into the Yara Merger
Agreement with Yara and an indirect, wholly owned subsidiary of
Yara. The consummation of the Yara Merger is subject to Terra
obtaining the Terra Stockholder Approval
20
and Yara obtaining the Yara Stockholder Approval. The Yara
Merger is also subject to receipt of regulatory approvals (or
the expiration of applicable waiting periods) in the United
States, Canada and the European Union, the absence of legal
restraints preventing consummation of the Yara Merger, the
absence of pending lawsuits by any governmental entity seeking
to prevent consummation of the Yara Merger that would reasonably
be expected to result in certain material adverse effects on
Terra and the absence since January 1, 2009 of any change
or event that, individually or in the aggregate, has resulted in
or would reasonably be expected to result in a material adverse
effect on Terra. We cannot predict whether or not these
conditions, or any of the other conditions set forth in the Yara
Merger Agreement, will be satisfied. To the extent either we or
Yara are unable to satisfy the closing conditions, the Yara
Merger may not be consummated.
If the Yara Merger is not consummated, we will have incurred
substantial costs that may adversely affect our business,
financial condition and results of operations and the market
price of our common stock.
If the Yara Merger is not consummated, the price of our common
stock may decline. In addition, we have incurred and will incur
substantial transaction costs and expenses in connection with
the Yara Merger. These costs are primarily associated with the
fees of our financial advisors and attorneys. In addition,
management resources may be diverted in an effort to consummate
the Yara Merger and we are subject to certain restrictions
contained in the Yara Merger Agreement on the conduct of our
business. If the Yara Merger is not consummated, we will have
incurred significant costs for which we will have received
little or no benefit. Also, if the Yara Merger Agreement is
terminated for certain reasons, including, among others, by us
to accept a superior proposal or by Yara upon a change in the
recommendation of our board of directors, we may be obligated to
pay Yara a cash termination fee of $123 million. In
addition, if the Yara Merger is not consummated, we may
experience negative reactions from the financial markets and our
stockholders, potential investors, customers and employees. Each
of these factors may also adversely affect the trading price of
our common stock and our business, financial condition and
results of operations.
The pending Yara Merger may create uncertainty for our
customers and employees.
While the Yara Merger is pending, customers may delay or defer
decisions to purchase our products and existing customers may
experience uncertainty about our products. This may adversely
affect our ability to gain new customers and retain existing
customers, which could adversely affect our business, financial
condition and results of operations. Current employees may
experience uncertainty about their post-Yara Merger roles with
Yara, and key employees may depart because of issues relating to
the uncertainty and difficulty of integration or a desire not to
remain with Terra following the Yara Merger. The loss of key
employees could adversely affect our business, financial
condition and results of operations.
21
ITEM 1B. UNRESOLVED
STAFF COMMENTS
None.
ITEM 2. PROPERTIES
Terra’s North American manufacturing facilities and its
joint venture manufacturing facilities, in which Terra owns a
50 percent interest, are designed to operate continuously,
except for planned shutdowns (usually biennial) for maintenance
and efficiency improvements. Capacity utilization (gross tons
produced divided by capacity tons at expected operating rates
and on-stream factors) of the nitrogen products manufacturing
facilities was approximately 91 percent, 100 percent
and 98 percent in 2009, 2008 and 2007, respectively.
Terra owns all of its manufacturing facilities, unless otherwise
indicated below.
Our facilities have the following production capacities:
| |
|
|
|
|
|
|
|
|
|
|
|
|
|
|
|
|
|
|
|
|
|
|
|
Annual
Capacity1
|
|
|
|
|
|
|
|
|
|
|
|
|
|
|
|
|
Fertilizer
|
|
Location
|
|
Ammonia2
|
|
|
UAN3
|
|
|
AN4
|
|
|
Urea5
|
|
|
Compounds4
|
|
|
Donaldsonville,
Louisiana6
|
|
|
500,000
|
|
|
|
—
|
|
|
|
—
|
|
|
|
—
|
|
|
|
—
|
|
|
Port Neal, Iowa
|
|
|
370,000
|
|
|
|
735,000
|
|
|
|
—
|
|
|
|
60,000
|
|
|
|
—
|
|
|
Verdigris, Oklahoma
|
|
|
1,050,000
|
|
|
|
1,925,000
|
|
|
|
—
|
|
|
|
—
|
|
|
|
—
|
|
|
Woodward,
Oklahoma7
|
|
|
440,000
|
|
|
|
298,0008
|
|
|
|
—
|
|
|
|
25,000
|
|
|
|
—
|
|
|
Yazoo City,
Mississippi9,
10
|
|
|
500,000
|
|
|
|
525,000
|
|
|
|
775,00010
|
|
|
|
20,000
|
|
|
|
—
|
|
|
Courtright, Ontario
|
|
|
480,000
|
|
|
|
350,000
|
|
|
|
—
|
|
|
|
175,000
|
|
|
|
—
|
|
|
Ince,
U.K.11
|
|
|
201,000
|
|
|
|
—
|
|
|
|
343,000
|
|
|
|
—
|
|
|
|
340,000
|
|
|
Billingham, U.K.
11
|
|
|
287,000
|
|
|
|
—
|
|
|
|
319,000
|
|
|
|
—
|
|
|
|
—
|
|
|
Point Lisas, Trinidad and
Tobago12
|
|
|
360,000
|
|
|
|
—
|
|
|
|
—
|
|
|
|
—
|
|
|
|
—
|
|
|
|
|
|
|
|
|
|
|
|
|
|
|
|
|
|
|
|
|
|
|
|
|
Total
|
|
|
4,188,000
|
|
|
|
3,833,000
|
|
|
|
1,437,000
|
|
|
|
280,000
|
|
|
|
340,000
|
|
|
|
|
|
|
|
|
|
|
|
|
|
|
|
|
|
|
|
|
|
|
|
|
|
|
|
1.
|
|
Annual capacity includes an
allowance for planned maintenance shutdowns. Unless otherwise
indicated, annual capacity is not limited by the production of
other products at the same facility.
|
|
2.
|
|
Measured in gross tons of ammonia
produced; net tons available for sale will vary with upgrading
requirements.
|
|
3.
|
|
Measured in tons of UAN containing
32 percent nitrogen by weight.
|
|
4.
|
|
Measured in tons.
|
|
5.
|
|
Urea is sold as urea liquor from
the Port Neal, Woodward and Yazoo City facilities and as either
granular urea or urea liquor from the Courtright facility.
Production capacities shown are for urea sold in tons.
|
|
6.
|
|
The Donaldsonville facility’s
manufacturing capacity consists of a single ammonia plant. This
plant was mothballed in January 2005, and was restarted
September 2008.
|
|
7.
|
|
Woodward’s plant capacity
depends on product mix (ammonia/methanol). Sales of methanol for
the years ended December 31, 2009 and 2008 were
23.3 million and 28.0 million gallons, respectively.
|
|
8.
|
|
Woodward facility UAN capacity
does not include the effects of the upgrade project scheduled
for completion in 2010.
|
|
9.
|
|
The Yazoo City facility also
produces merchant nitric acid; sales for the years ended
December 31, 2009 and 2008 were 19,200 and 20,700 product
tons, respectively.
|
|
10.
|
|
Terra’s full AN capacity at
Yazoo City is 835,000 tons, however such production would limit
Yazoo City’s UAN production to approximately 450,000 tons
and increase urea production to 45,000 tons. The plant has the
ability to produce both agricultural grade AN and industrial
grade AN (IGAN).
|
|
11.
|
|
Represents Terra’s
50 percent interest in the capacity of facilities owned by
GrowHow.
|
|
12.
|
|
Represents Terra’s
50 percent interest in the Point Lisas plant capacity.
|
22
Donaldsonville, Louisiana. The
Donaldsonville facility is located on approximately
742 acres fronting the Mississippi River and, in 2004,
included two ammonia plants, a urea plant and two melamine
crystal production plants. During 2006 all of these plants,
except for one ammonia plant, were decommissioned and sold for
parts or scrap. The remaining ammonia plant which had been idled
was restarted in the third quarter of 2008. The facility
contains a deep-water port facility on the Mississippi River,
allowing for barge transportation and making Donaldsonville one
of the northernmost points on the river capable of receiving
economical ocean-going vessels.
Port Neal, Iowa. The Port Neal facility
is located on approximately 1,268 acres 12 miles south
of Sioux City, Iowa on the Missouri River. The facility consists
of an ammonia plant, two urea plants, two nitric acid plants and
a UAN plant.
Verdigris, Oklahoma. The Verdigris
facility is located on 635 acres northeast of Tulsa,
Oklahoma, near the Verdigris River. It is the second largest UAN
production facility in North America. The facility comprises two
ammonia plants, two nitric acid plants, two UAN plants and a
port terminal. Terra owns the plants and leases the port
terminal from the Tulsa-Rogers County Port Authority.
Woodward, Oklahoma. The Woodward
facility is located on approximately 465 acres in rural
northwest Oklahoma and consists of an integrated
ammonia/methanol plant, a nitric acid plant, a urea plant and a
UAN plant.
Yazoo City, Mississippi. The Yazoo City
facility is located on approximately 2,251 acres in Yazoo
County, Mississippi with approximately 60 acres of such
land subject to a long-term lease with Yazoo County. The
facility includes one ammonia plant, four nitric acid plants, an
AN plant, two urea plants, a UAN plant and a dinitrogen
tetroxide production and storage facility.
Courtright, Ontario, Canada. The
Courtright facility is located on 665 acres south of
Sarnia, Ontario near the St. Clair River. The facility consists
of one ammonia plant, a UAN plant, a nitric acid plant and one
urea plant.
Billingham, U.K. The Billingham
facility is owned by GrowHow and located in the Teesside
chemical area, is geographically split among three separate
areas: the main site contains an ammonia plant, three nitric
acid plants and a carbon dioxide plant; the Portrack site
approximately two miles away contains an AN fertilizer plant;
and the north Tees site approximately five miles away has
ammonia storage which GrowHow operates under a
99-year
lease with a third-party and import/export facility that GrowHow
uses under license from the Crown and under an agreement with a
third-party operator. The Billingham facility is owned by
GrowHow.
Ince, U.K. The Ince facility is located
in northwestern England and is owned by GrowHow. The facility
consists of one ammonia plant, three nitric acid plants, an AN
plant and three fertilizer compound plants.
Point Lisas, Trinidad. The Point Lisas
Nitrogen facility in the Republic of Trinidad and Tobago is
owned by a
50/50
joint venture with KNC Trinidad Limited. This facility has the
capacity to produce annually 720,000 tons of ammonia from
natural gas supplied under contract with the National Gas
Company of Trinidad and Tobago.
23
ITEM 3. LEGAL
PROCEEDINGS
From time to time, we are involved in claims, disputes,
administrative proceedings and litigation, arising in the
ordinary course of business. We do not believe that the matters
in which we are currently involved, either individually or in
the aggregate, will have a material adverse effect on our
business, results of operations, financial position or net cash
flows.
On February 19, 2010, Philip Perlman filed a putative class
action complaint in the Iowa District Court for Woodbury County
against Terra, our directors, certain of our officers, Yara and
Merger Sub. The complaint generally alleges that the
consideration to be received by our stockholders in connection
with the Yara Merger is inadequate and that the individual
defendants breached their fiduciary duties of care and loyalty
by, among other things, approving the Yara Merger on the basis
of such allegedly inadequate consideration and under certain
circumstances of certain alleged self-dealing. The complaint
further alleges that we, Yara and Merger Sub aided and abetted
the individual defendants in the breach of their fiduciary
duties to our stockholders by entering into the Yara Merger
Agreement. The complaint seeks injunctive relief:
(i) declaring the Yara Merger Agreement to have been
entered into in breach of the fiduciary duties of the individual
defendants, and therefore unlawful and unenforceable;
(ii) enjoining the defendants from proceeding with the Yara
Merger, unless we implement procedures to obtain the highest
possible price for our stockholders; and (iii) directing
the individual defendants to obtain a transaction which is in
the best interests of our stockholders. The complaint also seeks
to recover costs and disbursements from the defendants,
including reasonable attorneys’ and experts’ fees. The
lawsuit is in a preliminary stage. Terra and Yara each believe
that the lawsuit is without merit and intend to defend it
vigorously.
On February 22, 2010, James Lindsay filed a putative class
action complaint in the Iowa District Court for Woodbury County
against Terra, our directors, certain of our officers, Yara and
Merger Sub. The complaint generally alleges that the
consideration to be received by our stockholders in connection
with the Yara Merger is inadequate and that the individual
defendants breached their fiduciary duties of care and loyalty
by, among other things, approving the Yara Merger on the basis
of such allegedly inadequate consideration and under certain
circumstances of certain alleged self-dealing. The complaint
further alleges that Yara and Merger Sub aided and abetted the
individual defendants in the breach of their fiduciary duties to
our stockholders by entering into the Yara Merger Agreement. The
complaint seeks injunctive relief: (i) declaring the Yara
Merger Agreement to have been entered into in breach of the
fiduciary duties of the individual defendants, and therefore
unlawful and unenforceable; (ii) enjoining the defendants
from proceeding with the Yara Merger, unless we implement
procedures to obtain the highest possible price for our
stockholders; and (iii) directing the individual defendants
to obtain a transaction which is in the best interests of our
stockholders. The complaint also seeks to recover costs and
disbursements from the defendants, including reasonable
attorneys’ and experts’ fees. The lawsuit is in a
preliminary stage. Terra and Yara each believe that the lawsuit
is without merit and intend to defend it vigorously.
|
|
|
ITEM 4.
|
SUBMISSION
OF MATTERS TO A VOTE OF SECURITY HOLDERS
|
The 2009 Annual Meeting of stockholders was held on
November 20, 2009 in New York, New York. A total of
84,332,545 shares of the Corporation’s common stock,
representing 84.48 percent of the Corporation’s common
stock outstanding as of October 9, 2009, the record date
for the 2009 Annual Meeting, were represented at the meeting.
24
The vote on the election of three Class II directors to the
Corporation’s Board of Directors to hold office until the
2012 Annual Meeting, or until their successors are elected and
qualified, was as follows:
| |
|
|
|
|
|
|
|
|
|
NAME
|
|
FOR
|
|
|
WITHHELD
|
|
|
|
|
|
|
|
Martha O. Hesse
|
|
|
35,497,627
|
|
|
|
2,497,232
|
|
|
Dennis McGlone
|
|
|
35,501,074
|
|
|
|
2,493,785
|
|
|
Henry R. Slack
|
|
|
35,492,207
|
|
|
|
2,502,652
|
|
|
John N. Lilly
|
|
|
45,389,922
|
|
|
|
947,764
|
|
|
David A. Wilson
|
|
|
45,081,217
|
|
|
|
1,256,469
|
|
|
Irving B. Yoskowitz
|
|
|
45,510,241
|
|
|
|
827,445
|
|
After Messrs. Lilly, Wilson and Yoskowitz were elected and
qualified as Class II directors, the Corporation’s
Board of Directors was expanded from eight to eleven and the
Corporation’s Board of Directors voted to fill the
vacancies created at such time by appointing Martha O. Hesse,
Dennis McGlone and Henry R. Slack to the board. At such time, in
addition to those directors elected and qualified as directors
at the 2009 Annual Meeting, the names of the other directors
serving on the Corporation’s Board of Directors are as
follows: Michael L. Bennett, David E. Fisher, Dod A. Fraser,
Martha O. Hesse, Peter S. Janson, James R. Kroner, Dennis
McGlone and Henry R. Slack.
The stockholders ratified the selection by the Audit Committee
of the Corporation’s Board of Directors of
Deloitte & Touche LLP as independent registered public
accountants for the Corporation for 2009. The number of votes
cast for such proposal was 80,320,751, the number against was
1,832,287 and the number of abstentions was 2,179,503.
25
Executive
Officers of Terra
The following sets forth the name, age and offices of each
present executive officer of Terra, the period during which each
executive officer has served as such and each executive
officer’s business experience during the past five years:
| |
|
|
|
|
|
Present positions and offices with the Company
|
|
Name
|
|
and principal occupations
during the past five years
|
|
|
|
|
|
Michael L. Bennett
|
|
President and Chief Executive Officer of Terra since April 2001;
President of Terra Nitrogen GP Inc. (TNGP) (or its predecessor),
the General Partner of TNCLP, since June 1998; Chairman of the
Board of TNGP (or its predecessor) since 2002. Age 56.
|
|
Daniel D. Greenwell
|
|
Senior Vice President and Chief Financial Officer of Terra since
July 2007; Vice President, Controller of Terra from April 2005
to July 2007; Director of TNGP, the General Partner of TNCLP,
since March 2008; Vice President and Chief Financial Officer of
TNGP since February 2008; Vice President and Chief Accounting
Officer of TNGP from April 2006 to February 2008; Corporate
Controller for Belden CDT Inc. from 2002 to 2005; and Chief
Financial Officer of Zoltek Companies Inc. from 1996 to 2002.
Age 47.
|
|
Joseph D. Giesler
|
|
Senior Vice President, Commercial Operations of Terra since
December 2004; Vice President of Industrial Sales and Operations
of Terra from December 2002 to December 2004; Global Director,
Industrial Sales of Terra from September 2001 to December 2002;
Vice President of TNGP, the General Partner of TNCLP, since
April 2006. Age 51.
|
|
Douglas M. Stone
|
|
Senior Vice President, Sales and Marketing since September 2007;
Vice President, Corporate Development and Strategic Planning
from 2006 to September 2007; Director, Industrial Sales from
2003 to 2006; Manager, Methanol and Industrial Nitrogen from
2000 to 2003; Vice President of TNGP, the General Partner of
TNCLP, since April 2009. Age 44.
|
|
Edward J. Dillon
|
|
Vice President and Controller of Terra since November 2008; Vice
President of TNGP, the General Partner of TNCLP, since April
2009. In 1998, he joined the General Electric Company and served
in numerous roles including Finance Manager for the National
Broadcasting Company in New York City, progressing to Global
Controller for the Consumer & Industrial segment in
Louisville, Kentucky. He joined INVISTA, a subsidiary of Koch
Industries, Inc. (KII) in 2005 in Wichita as Director of
Corporate Finance and in 2007, moved to KII Corporation as
Finance Director. Age 42.
|
|
Joe A. Ewing
|
|
Vice President, Investor Relations and Human Resources of Terra
since December 2004; Vice President, Human Resources of
Mississippi Chemical Corporation from April 2003 to December
2004; Vice President, Marketing and Distribution of Mississippi
Chemical Corporation from 1999 to April 2003. Age 59.
|
|
John W. Huey
|
|
Vice President, General Counsel and Corporate Secretary of Terra
since October 2006; Vice President, General Counsel and
Corporate Secretary of TNGP, the General Partner of TNCLP, since
October 2006; Counsel with Shughart Thomson &
Kilroy, P.C. from 2005-2006; Attorney with Butler
Manufacturing Company from 1978 to 2004, Vice President of
Administration from 1993 to 1998, Vice President, General
Counsel and Corporate Secretary from 1998 to 2004. Age 62.
|
|
Geoffrey J. Obeney
|
|
Vice President, Information Technology of Terra since February
of 2008, a Director and member of the Compensation Committee of
Wireless Ronin (RNIN) from April 2008 to present, Interim CEO of
Spirit Computing Ltd from November 2005 to January 2008; CIO of
SEI LLC, a start-up company from October 2004 to October 2005.
Age 52.
|
26
| |
|
|
|
Richard S. Sanders Jr.
|
|
Vice President, Manufacturing of Terra since August 2003; Vice
President, Manufacturing of TNGP (or its predecessor), the
General Partner of TNCLP, since October 2003; Plant Manager,
Verdigris, Oklahoma manufacturing facility from 1995 to August
2003. Age 52.
|
|
Earl B. Smith
|
|
Vice President, Business Development of Terra since March 2008;
Registered Financial Advisor with UBS from 2006 to 2008. Various
positions with Vulcan Materials Company from 1982 to 2005,
serving last a Global Business Manager from 2003 to 2005. Age
49.
|
Except for any employment described above with TNGP (or its
predecessor), the General Partner of TNCLP, which is an indirect
subsidiary of Terra, no occupation carried on by any executive
officer of Terra during the past five years as described above
was carried on with any corporation or organization that is a
parent, subsidiary or other affiliate of Terra. There are no
family relationships among the executive officers and directors
of Terra or arrangements or understandings between any executive
officer and any other person pursuant to which any executive
officer was selected as such. Officers of Terra are elected
annually to serve until their respective successors are elected
and qualified.
27
Part II
|
|
|
ITEM 5.
|
MARKET
FOR TERRA’S COMMON EQUITY AND RELATED STOCKHOLDER MATTERS
AND ISSUER PURCHASES OF EQUITY SECURITIES
|
Terra’s common shares are traded on the New York Stock
Exchange (NYSE) under the symbol “TRA”. Set forth
below are the high and low sales prices of Terra’s common
shares during each quarter specified as reported on the NYSE.
| |
|
|
|
|
|
|
|
|
|
|
|
|
|
|
|
|
|
(per-share data and stock prices)
|
|
March 31
|
|
|
June 30
|
|
|
Sept. 30
|
|
|
Dec. 31
|
|
|
2009
|
|
|
|
|
|
|
|
|
|
|
|
|
|
|
|
|
|
Common Share Price:
|
|
|
|
|
|
|
|
|
|
|
|
|
|
|
|
|
|
High
|
|
$
|
30.09
|
|
|
$
|
30.81
|
|
|
$
|
37.25
|
|
|
$
|
43.13
|
|
|
Low
|
|
|
14.45
|
|
|
|
23.60
|
|
|
|
23.90
|
|
|
|
31.03
|
|
|
|
|
|
|
|
|
|
|
|
|
|
|
|
|
|
|
|
|
2008
|
|
|
|
|
|
|
|
|
|
|
|
|
|
|
|
|
|
Common Share Price:
|
|
|
|
|
|
|
|
|
|
|
|
|
|
|
|
|
|
High
|
|
$
|
53.48
|
|
|
$
|
56.25
|
|
|
$
|
57.64
|
|
|
$
|
30.00
|
|
|
Low
|
|
|
33.80
|
|
|
|
33.85
|
|
|
|
25.85
|
|
|
|
11.21
|
|
As of February 25, 2010 there were approximately 5,471
record holders of Terra’s common stock.
In 2009, Terra’s Board of Directors declared and paid the
following dividends:
| |
|
|
|
|
|
|
|
|
|
|
|
|
|
|
|
|
|
Declared and Paid
|
|
|
Date of Declaration
|
|
Date of Record
|
|
Date of Payment
|
|
|
Per Common Share
|
|
|
February 10, 2009
|
|
March 18, 2009
|
|
April 7, 2009
|
|
|
$
|
0.10
|
|
|
April 21, 2009
|
|
May 20, 2009
|
|
June 9, 2009
|
|
|
|
0.10
|
|
|
July 23, 2009
|
|
August 20, 2009
|
|
September 10, 2009
|
|
|
|
0.10
|
|
|
October 22, 2009
|
|
November 23, 2009
|
|
December 11, 2009
|
|
|
|
0.10
|
|
|
October 29, 2009
|
|
November 23, 2009
|
|
December 11, 2009
|
|
|
|
7.50
|
|
|
|
|
|
|
|
|
|
|
|
|
|
|
|
|
|
|
|
|
$
|
7.90
|
|
|
|
|
|
|
|
|
|
|
|
|
|
|
|
|
|
|
|
|
|
|
|
In 2008, Terra’s board of Directors declared and paid the
following dividends:
| |
|
|
|
|
|
|
|
|
|
|
|
|
|
|
|
|
|
Declared and Paid
|
|
|
Date of Declaration
|
|
Date of Record
|
|
Date of Payment
|
|
|
Per Common Share
|
|
|
May 8, 2008
|
|
May 28, 2008
|
|
June 13, 2008
|
|
|
$
|
0.10
|
|
|
July 24, 2008
|
|
August 25, 2008
|
|
September 12, 2008
|
|
|
|
0.10
|
|
|
October 23, 2008
|
|
November 24, 2008
|
|
December 12, 2008
|
|
|
|
0.10
|
|
|
|
|
|
|
|
|
|
|
|
|
|
|
|
|
|
|
|
|
$
|
0.30
|
|
|
|
|
|
|
|
|
|
|
|
|
|
|
|
|
|
|
|
|
|
|
|
Future dividends are necessarily dependent upon future earnings,
capital requirements, general financial condition, general
business conditions, approval from our Board of Directors and
other factors. Pursuant to the terms of the Yara Merger
Agreement, Terra is restricted from paying dividends on shares
of our common stock other than the regular dividend for the
fourth quarter of 2009, which was declared by the Board of
Directors on February 18, 2010 to holders of record as of
March 17, 2010 and is payable on April 7, 2010, and
for the first quarter of 2010.
28
On October 29, 2009, Terra’s Board of Directors
declared a special cash dividend of $7.50 per common share to
holders of record on November 23, 2009 and paid on
December 11, 2009. In connection with our special cash
dividend, we recorded a charge of $608.0 million to
retained earnings equal to the retained earnings balance at the
date of the divided declaration with the excess of
$140.7 million charged to additional paid-in capital.
On February 12, 2010, the Compensation Committee of
Terra’s Board of Directors approved an adjustment to the
number of outstanding non-vested stock shares with performance
conditions and to the number of outstanding phantom awards as of
December 11, 2009, in order to preserve the value of such
awards following the special cash dividend of $7.50 per common
share in which these awards did not participate. In addition,
the Compensation Committee approved an adjustment to the number
of shares available under the Terra Industries Inc. 2007 Omnibus
Incentive Compensation Plan.
Performance
Graph
A comparative performance graph is to be included with our
annual report to security holders that accompanies or precedes a
proxy or information statement relating to an annual meeting of
security holders at which directors are to be elected. A
line-graph presentation is required, comparing cumulative,
indexed, five-year stockholder returns on specified,
hypothetical investments. These investments must include the
S&P 500 Stock Index and either a nationally recognized
industry standard or an index of peer companies selected by
Terra.
The “Annual Return Percentage” table below illustrates
the annual returns realized in each of the years from 2005
through 2009 on hypothetical investments in Terra, the S&P
500 Stock Index, Terra’s New Industry Peer Group and
Terra’s Former Industry Peer Group.
| |
|
|
|
|
|
|
|
|
|
|
|
|
|
|
|
|
Annual Return
Percentage
|
|
|
|
|
Year Ending December 31,
|
|
Company Name/Index
|
|
|
2005
|
|
|
2006
|
|
|
2007
|
|
|
2008
|
|
|
2009
|
|
Terra Industries Inc.
|
|
|
(36.94)%
|
|
|
113.93%
|
|
|
298.66%
|
|
|
(64.71)%
|
|
|
141.18%
|
|
|
|
|
|
|
|
|
|
|
|
|
|
|
|
|
|
|
S&P 500 Stock Index
|
|
|
4.91%
|
|
|
15.79%
|
|
|
5.49%
|
|
|
(37.00)%
|
|
|
26.46%
|
|
|
|
|
|
|
|
|
|
|
|
|
|
|
|
|
|
|
New Industry Peer Group
|
|
|
(1.19)%
|
|
|
49.63%
|
|
|
174.63%
|
|
|
(56.30)%
|
|
|
72.12%
|
|
|
|
|
|
|
|
|
|
|
|
|
|
|
|
|
|
|
Former Industry Peer Group
|
|
|
(3.98)%
|
|
|
44.53%
|
|
|
167.38%
|
|
|
(56.87)%
|
|
|
72.14%
|
|
|
|
|
|
|
|
|
|
|
|
|
|
|
|
|
|
The “Indexed Annual Returns” table assumes three
investments of $100 at the close of the last trading day in
2004, and follows these investments through the subsequent five
years. The three investments are in Terra common shares, the
S&P 500 Stock Index, Terra’s New Industry Peer Group
and Terra’s Former Industry Peer Group.
29
| |
|
|
|
|
|
|
|
|
|
|
|
|
|
|
|
|
Indexed Annual Returns on
Hypothetical $100 Investment
|
|
|
|
|
Year Ending December 31,
|
|
Company Name/Index
|
|
|
2005
|
|
|
2006
|
|
|
2007
|
|
|
2008
|
|
|
2009
|
|
Terra Industries Inc.
|
|
|
$63.06
|
|
|
$134.91
|
|
|
$537.84
|
|
|
$189.81
|
|
|
$457.78
|
|
|
|
|
|
|
|
|
|
|
|
|
|
|
|
|
|
|
S&P 500 Stock Index
|
|
|
$104.91
|
|
|
$121.48
|
|
|
$128.16
|
|
|
$80.74
|
|
|
$102.11
|
|
|
|
|
|
|
|
|
|
|
|
|
|
|
|
|
|
|
New Industry Peer Group
|
|
|
$98.81
|
|
|
$147.84
|
|
|
$406.02
|
|
|
$177.42
|
|
|
$305.37
|
|
|
|
|
|
|
|
|
|
|
|
|
|
|
|
|
|
|
Former Industry Peer Group
|
|
|
$96.02
|
|
|
$138.71
|
|
|
$370.87
|
|
|
$159.95
|
|
|
$275.32
|
|
|
|
|
|
|
|
|
|
|
|
|
|
|
|
|
|
Terra has for some years chosen to use a self-selected industry
peer group. In the graph and tables above, companies in
Terra’s self-selected industry peer group manufacture
commodity chemicals (including chemicals other than nitrogen
products and methanol) and have market caps similar to
Terra’s. Terra’s current peer group consists of the
following companies: Agrium, Inc., CF Industries Holdings, Inc.,
Cytec Industries, Inc., Georgia Gulf Corporation, Huntsman
Chemical, Methanex Corporation, Mosaic, Potash Corporation of
Saskatchewan Inc., TNCLP, and Yara International ASA
(collectively, the New Industry Peer Group).
In 2008, Terra’s peer group consisted of the following
companies: Agrium, Inc., Celanese AG, CF Industries Holdings,
Inc., Cytec Industries, Inc., Georgia Gulf Corporation, Huntsman
Chemical, Methanex Corporation, Millennium Chemicals Inc.,
Mosaic, NOVA Chemicals Corp., Potash Corporation of Saskatchewan
Inc., TNCLP, and Yara International ASA (collectively, the
Former Industry Peer Group). Celanese AG is not included in the
New Industry Peer Group because it was delisted in 2006.
Millennium Chemicals Inc. and NOVA Chemicals Corp. are not
included in the New Industry Peer Group because they were
acquired by one of their peers in 2004 and 2009, respectively.
Company Purchases
of Equity Securities
On May 6, 2008, the Board of Directors authorized us to
repurchase a maximum of 12,841,717 shares of our
outstanding common stock. The stock buyback program has been and
will be conducted on the open market, in private transactions or
otherwise at such times prior to June 30, 2010, and at such
prices as determined appropriate by us. During 2009, we did not
purchase any shares of our outstanding common stock. The
remaining number of common shares that we are authorized to
repurchase is 7,448,662 at December 31, 2009.
On August 20, 2008, our Board of Directors authorized us to
make cash payments to holders of our 4.25 percent
Series A Cumulative Convertible Perpetual Preferred Shares
(Series A Preferred Shares), a total of 120,000 shares
of which were then outstanding, in order to induce such holders
of Series A Preferred Shares to convert such Series A
Preferred Shares to common stock of the Company. As a result of
such action, a total of 118,400 Series A Preferred Shares
were converted into 11,887,550 shares of the Company’s
common stock at a cash premium of $5.3 million.
30
ITEM 6. SELECTED
FINANCIAL DATA
The following table presents our selected financial data. The
table should be read in conjunction with Item 7,
Management’s Discussion and Analysis of Financial
Condition and Results of Operations, and Item 8,
Financial Statements and Supplementary Data, of this
Annual Report on
Form 10-K.
Certain prior-year amounts have been reclassified to conform to
the current-year presentation. See Note 1, Summary of
Significant Accounting Policies, in Item 8,
Financial Statements and Supplementary Data, of this
Annual Report on
Form 10-K
for information on our retrospective adoption of our
noncontrolling interest.
| |
|
|
|
|
|
|
|
|
|
|
|
|
|
|
|
|
|
|
|
|
|
(In thousands, except per share data)
|
|
2009(1)
|
|
|
2008(2)
|
|
|
2007(3)
|
|
|
2006
|
|
|
2005(4)
|
|
|
|
|
|
|
|
Income Statement Data:
|
|
|
|
|
|
|
|
|
|
|
|
|
|
|
|
|
|
|
|
|
|
Revenues
|
|
$
|
1,581,432
|
|
|
$
|
2,891,479
|
|
|
$
|
2,342,929
|
|
|
$
|
1,819,696
|
|
|
$
|
1,930,796
|
|
|
Gross profit
|
|
|
386,256
|
|
|
|
863,227
|
|
|
|
527,508
|
|
|
|
118,517
|
|
|
|
154,687
|
|
|
Income from continuing operations, net of
tax(5)
|
|
|
177,499
|
|
|
|
700,456
|
|
|
|
271,038
|
|
|
|
16,015
|
|
|
|
45,825
|
|
|
|
|
|
|
|
|
|
|
|
|
|
|
|
|
|
|
|
|
|
|
|
|
Amounts attributable to
Terra Industries Inc.:
|
|
|
|
|
|
|
|
|
|
|
|
|
|
|
|
|
|
|
|
|
|
Income from continuing operations
|
|
$
|
151,515
|
|
|
$
|
632,772
|
|
|
$
|
220,757
|
|
|
$
|
4,729
|
|
|
$
|
31,618
|
|
|
Income (loss) from discontinued operations
|
|
|
1,118
|
|
|
|
8,269
|
|
|
|
(18,861
|
)
|
|
|
(516
|
)
|
|
|
(9,531
|
)
|
|
|
|
|
|
Net income attributable to
Terra Industries Inc.
|
|
$
|
152,633
|
|
|
$
|
641,041
|
|
|
$
|
201,896
|
|
|
$
|
4,213
|
|
|
$
|
22,087
|
|
|
|
|
|
|
|
|
|
|
|
|
|
|
|
|
|
|
|
|
|
|
|
|
|
|
|
|
Net income
|
|
$
|
178,617
|
|
|
$
|
708,725
|
|
|
$
|
252,177
|
|
|
$
|
15,499
|
|
|
$
|
35,754
|
|
|
Less: Net income attributable to noncontrolling interest
|
|
|
25,984
|
|
|
|
67,684
|
|
|
|
50,281
|
|
|
|
11,286
|
|
|
|
13,667
|
|
|
|
|
|
|
Net income attributable to
Terra Industries Inc.
|
|
$
|
152,633
|
|
|
$
|
641,041
|
|
|
$
|
201,896
|
|
|
$
|
4,213
|
|
|
$
|
22,087
|
|
|
|
|
|
|
|
|
|
|
|
|
|
|
|
|
|
|
|
|
|
|
|
|
|
|
|
|
Preferred share dividends
|
|
$
|
(56
|
)
|
|
$
|
(3,876
|
)
|
|
$
|
(5,100
|
)
|
|
$
|
(5,100
|
)
|
|
$
|
(5,134
|
)
|
|
Cash dividends declared
per common share
|
|
$
|
7.90
|
|
|
$
|
0.30
|
|
|
$
|
—
|
|
|
$
|
—
|
|
|
$
|
—
|
|
|
Per Share Data:
|
|
|
|
|
|
|
|
|
|
|
|
|
|
|
|
|
|
|
|
|
|
Basic income (loss) per common share attributable to Terra
Industries Inc.:
|
|
|
|
|
|
|
|
|
|
|
|
|
|
|
|
|
|
|
|
|
|
Continuing operations
|
|
$
|
1.53
|
|
|
$
|
6.65
|
|
|
$
|
2.38
|
|
|
$
|
—
|
|
|
$
|
0.28
|
|
|
Discontinued operations
|
|
|
0.01
|
|
|
|
0.09
|
|
|
|
(0.21
|
)
|
|
|
(0.01
|
)
|
|
|
(0.10
|
)
|
|
|
|
|
|
Basic income (loss) per common share
|
|
$
|
1.54
|
|
|
$
|
6.74
|
|
|
$
|
2.17
|
|
|
$
|
(0.01
|
)
|
|
$
|
0.18
|
|
|
|
|
|
|
|
|
|
|
|
|
|
|
|
|
|
|
|
|
|
|
|
|
|
|
|
|
Diluted income (loss) per common share attributable to
|
|
|
|
|
|
|
|
|
|
|
|
|
|
|
|
|
|
|
|
|
|
Terra Industries Inc.:
|
|
|
|
|
|
|
|
|
|
|
|
|
|
|
|
|
|
|
|
|
|
Continuing operations
|
|
$
|
1.52
|
|
|
$
|
6.12
|
|
|
$
|
2.07
|
|
|
$
|
—
|
|
|
$
|
0.28
|
|
|
Discontinued operations
|
|
|
0.01
|
|
|
|
0.08
|
|
|
|
(0.17
|
)
|
|
|
(0.01
|
)
|
|
|
(0.10
|
)
|
|
|
|
|
|
Diluted income (loss) per common share
|
|
$
|
1.53
|
|
|
$
|
6.20
|
|
|
$
|
1.90
|
|
|
$
|
(0.01
|
)
|
|
$
|
0.18
|
|
|
|
|
|
31
| |
|
|
|
|
|
|
|
|
|
|
|
|
|
|
|
|
|
|
|
|
|
Balance Sheet Data:
|
|
|
|
|
|
|
|
|
|
|
|
|
|
|
|
|
|
|
|
|
|
Total assets
|
|
$
|
1,599,743
|
|
|
$
|
2,113,017
|
|
|
$
|
1,888,327
|
|
|
$
|
1,572,713
|
|
|
$
|
1,523,625
|
|
|
Long-term debt and capital leases
|
|
$
|
602,434
|
|
|
$
|
330,000
|
|
|
$
|
330,000
|
|
|
$
|
331,300
|
|
|
$
|
331,300
|
|
|
Preferred stock
|
|
$
|
483
|
|
|
$
|
1,544
|
|
|
$
|
115,800
|
|
|
$
|
115,800
|
|
|
$
|
115,800
|
|
|
|
|
|
1.
|
|
The 2009 selected financial data
includes (i) the effects of a special cash dividend of
$7.50 per share (or $748.7 million) declared on
October 29, 2010 and paid on December 11, 2010;
(ii) $42.8 million, net of tax ($0.43 per diluted
share) in U.S. tax expense associated with the repatriation of
funds to the U.S.; (iii) $32.4 million, net of tax
($0.32 per diluted share) for the early retirement of debt; and
(iv) $11.2 million, net of tax ($0.11 per diluted
share) of other operating expenses related to the CF Industries
Holdings, Inc. unsolicited acquisition offers.
|
|
2.
|
|
The 2008 selected financial data
includes (i) the effects of the Series A Preferred
Shares inducement pursuant to which a total of 118,400
Series A Preferred Shares were converted to
11,887,550 shares of Terra common stock; (ii) the
effects of instituting a cash dividend per common share of $0.10
per quarter starting in May 2008; (iii) the full year
equity earnings effect of the GrowHow joint venture of
$95.6 million, and (iv) we declared our Beaumont
methanol plant as discontinued operations in 2008 with all
fiscal years presented reflecting the classification of
Beaumont’s financial results as discontinued operations.
|
|
3.
|
|
The 2007 selected financial data
includes (i) the effects of contributing our Terra Nitrogen
U.K. operations to the GrowHow joint venture on
September 14, 2007, (ii) a $39.0 million
impairment charge for our Beaumont, Texas assets and
(iii) a $38.8 million loss on the early retirement of
debt associated with the debt refinancing that we completed
during 2007.
|
|
4.
|
|
The 2005 selected financial data
includes the full year income statement effects of the
December 21, 2004 acquisition of Mississippi Chemical
Corporation.
|
|
5.
|
|
These figures are before the
allocation of noncontrolling interest expense.
|
32
|
|
|
ITEM 7.
|
MANAGEMENT’S
DISCUSSION AND ANALYSIS OF FINANCIAL CONDITION AND RESULTS OF
OPERATIONS
|
Overview
As you read this management’s discussion and analysis of
financial condition and results of operations, you should refer
to our Consolidated Financial Statements and related Notes
included in Item 8, Financial Statements and
Supplementary Data, of this Annual Report on
Form 10-K.
Introduction
In this discussion and analysis, we explain our business in the
following areas:
|
|
|
|
| |
§
|
Company Overview
|
|
| |
| |
§
|
2009 Executive Summary
|
|
| |
| |
§
|
Business Strategy
|
|
| |
| |
§
|
Recent Business Environment
|
|
| |
| |
§
|
Results of Operations
|
|
| |
| |
§
|
Liquidity and Capital Resources
|
|
| |
| |
§
|
Off Balance Sheet Transactions
|
|
| |
| |
§
|
Applications of Critical Accounting Policies and Estimates
|
|
| |
| |
§
|
Quantitative and Qualitative Disclosures about Market Risk
|
|
33
Company
Overview
Pending Yara
Merger
On February 12, 2010, Terra entered into the Yara Merger
Agreement with Yara and an indirect, wholly owned subsidiary of
Yara. Upon consummation of the Yara Merger, each outstanding
share of Terra common stock will be converted into the right to
receive $41.10 in cash, without interest and less any taxes
required to be withheld. The purchase price is subject to
increase as provided in the Yara Merger Agreement if Yara does
not hold its stockholders meeting to obtain the Yara Stockholder
Approval within 90 days from the date of execution of the
Yara Merger Agreement. The consummation of the Yara Merger is
subject to Terra obtaining the Terra Stockholder Approval and
Yara obtaining the Yara Stockholder Approval. The consummation
of the Yara Merger is also subject to regulatory approvals and
other customary terms and conditions. For further information on
the Yara Merger, see Item 1, “Business”,
Item 1A, “Risk Factors” and Note 27,
Subsequent Events, included in Item 8,
“Consolidated Financial Statements”. Unless stated
otherwise, all forward-looking information contained in this
Management’s Discussion and Analysis of Financial Condition
and Results of Operations do not take into account or give any
effect to the impact of our pending merger with Yara.
Pure Play
Nitrogen Company
As the leading pure play nitrogen producer in North America,
Terra serves both agricultural and industrial customers. We
upgrade a significant portion of our ammonia capacity to
value-added and higher margin products.
Upgraded Products
At our North American facilities, Terra produces about
3.0 million tons of ammonia annually, then upgrades most of
it, resulting in about 6.1 million tons of saleable
product. This 6.1 million tons includes over a million tons
of merchant ammonia, but a large majority of our total output is
sold as higher-value upgraded product, particularly UAN.
Terra’s
Production Locations
Our asset base includes six manufacturing plants in North
America, and a 50 percent interest in joint ventures in
Trinidad and Tobago and the U.K. The asset base is the result of
successful business combinations and the identification of
internal growth opportunities through expansion.
Our North American plants are well-positioned to serve customers
in the Cornbelt because our transportation costs are lower than
those of Gulf or offshore producers.
In addition to lower transportation costs, our two plants in
Oklahoma have a significant natural gas basis advantage as
compared to the Henry Hub. These Oklahoma plants are served by
OneOK (Panhandle)
34
gas. Our Verdigris plant is the second largest UAN facility in
North America and consumes approximately 36 BCF of gas annually.
Our Sioux City plant also realizes a basis advantage as compared
to the Henry Hub.
Our Trinidad joint venture provides approximately 360,000 tons
of ammonia that we bring into our Donaldsonville deep water
ammonia terminal via ocean-going vessels. Even during difficult
times, our Trinidad operation has been profitable. This is
because that plant’s natural gas supply is indexed to Gulf
ammonia prices. So even though Gulf ammonia selling prices were
very low during the period, our Trinidad gas cost was still at a
considerable advantage to that of other import production.
Our U.K. joint venture includes two plants—one at
Billingham on the eastern coast and one near Chester in the
western part of the country.
Natural gas costs in the U.K. have historically been volatile
but during 2009 we saw some moderation. A significant portion of
the U.K. business serves industrial markets. The joint venture
serves approximately 50 percent of the British agricultural
market, primarily with AN; the remainder is served by imported
product.
Supplying
Industry, Cleaning the Air, Feeding the World
Our industrial business is an integral part of our diversified
business strategy by supplying a stable margin business that
counteracts the cyclical nature of the Nitrogen agriculture
industry. We supply IGAN as a blasting product for mining
applications, nitric acid as a raw material for nylon fibers,
polyurethane foams, specialty fibers, and dinitrogen tetroxide
as a propellant in various satellite, rocket, and missile
propulsion systems.
A growing part of our business relates to increased emission
reduction requirements. We provide nitrogen products that reduce
NOx emissions. Today, TET serves the stationary power industry
and the advancing vehicle DEF category. TET is a leading DEF
producer in North America and has dedicated production capacity
to meet the growing demand. With our decade of experience in the
urea-based SCR technology we have a highly experienced technical
team that oversees the implementation, quality certification,
and training with our customers. We have developed a dedicated
distribution channel that allows us complete supply chain
oversight. Our commitment to quality is fundamental to success
in the DEF category.
The core of our pure play nitrogen strategy is meeting the
nitrogen demand of the agriculture industry, specifically for
corn production. In the latter half of this decade we have seen
a shortage in world grain stocks as a result of the growing
population, developing economies in India and China, and on a
smaller scale, the influence of the ethanol fuel market.
Nitrogen is vital to successful corn yields and unlike other
fertilizers such as potash and phosphate which can be applied on
a rotational basis, nitrogen must be applied annually.
2009 Executive
Summary
Significant
Results
|
|
|
|
| |
§
|
During 2009, Terra’s shareholders achieved a
141 percent return, including the $7.50 per share special
cash dividend paid in December 2009. Terra’s performance
was industry leading.
|
|
35
|
|
|
|
| |
§
|
In 2009 we achieved net income attributable to Terra of
$152.6 million on revenues of $1.6 billion. Net income
was down $488.4 million year over year, gross margin as a
percentage of sales decreased from 29.9 percent to
24.4 percent. Throughout the volatile year, we effectively
managed the business in order to maximize our gross margin
potential.
|
|
| |
| |
§
|
Results for 2009 were reduced by special charges totaling
$86.4 million, net of tax ($0.86 per diluted share),
related to tax expenses for repatriation of funds to the U.S.
($42.8 million), loss on early debt retirement
($32.4 million, net of tax) and operating expenses related
to CF’s unsolicited acquisition proposals for Terra
($11.2 million, net of tax).
|
|
| |
| |
§
|
We executed our strategy to return value to our shareholders by
returning $788.6 million of cash to shareholders through
dividends paid in 2009.
|
|
| |
| |
§
|
In the fourth quarter we refinanced our $330 million
7.0 percent Unsecured Senior Notes due 2017, with
$600 million 7.75 percent Unsecured Senior Notes due
2019 to allow flexibility to execute our strategic growth
opportunities.
|
|
| |
| |
§
|
Through ongoing tax planning our effective rate, excluding the
$42.8 million tax repatriation charge, was
14.0 percent. Including this charge, our effective tax rate
for 2009 was 32.9 percent.
|
|
Significant
Developments
|
|
|
|
| |
§
|
On February 12, 2010, Terra entered into an Agreement and
Plan of Merger with Yara International ASA and an indirect,
wholly owned subsidiary of Yara. Upon consummation of the Yara
Merger, each outstanding share of Terra common stock will be
converted into the right to receive $41.10 in cash, without
interest and less any taxes required to be withheld.
|
|
| |
| |
§
|
On January 14, 2010, CF withdrew its offer to acquire
Terra, announced that it was no longer pursuing the proposed
acquisition and has sold all of its shares of Terra common stock.
|
|
| |
| |
§
|
TET entered into exclusive initial fill agreements with Daimler
Trucks North America LLC; Volvo Group North America, Inc; Mack
Trucks, Inc. and Ford Motor Company to supply
TerraCair®.
TET has also established a nationwide distribution network
complete with national providers such as Brenntag North America
and Excelda Manufacturing Company and a second tier “last
mile” distribution network.
|
|
| |
| |
§
|
Our $180 million Woodward UAN expansion is 50 percent
complete and on budget and we expect it to be completed in the
third quarter of 2010.
|
|
Significant
Drivers
|
|
|
|
| |
§
|
Weather conditions added significant variability to the 2009
planting season; fertilizer application was affected by a wet
spring, which resulted in delayed planting, followed by a wet
fall and early snow fall which delayed harvest and prevented
fall fill.
|
|
| |
| |
§
|
Unprecedented sales volumes and prices in 2008 led to inventory
channel imbalances in 2009. As a result of carrying higher
priced inventory in a time of declining fertilizer prices,
retailers were reluctant to make purchases until their inventory
levels were drawn down and they had firm commitments from
growers. However, due to the early inclement weather during
planting season, growers were equally hesitant to further their
capital investment in the planting season that was not starting
off under optimal conditions.
|
|
36
|
|
|
|
| |
§
|
Due to the decrease in fertilizer prices in 2009, there were
fewer imports attracted to North America.
|
|
| |
| |
§
|
The decline in the global economy continued to impact our
business. Industrial customers entered curtailments which
reduced demand. The agriculture industry continued to be
impacted by the credit crisis at the end of 2008.
|
|
| |
| |
§
|
Overall, the TET business saw growth of 14 percent in total
revenues during 2009. The advancing enactments of the 2010
emission standards of the 1990 Amendments of the Clean Air Act
saw OEMs start to prepare for the new requirements.
|
|
Business
Strategy
Our business strategy seeks to pursue profitable growth in the
core, nitrogen-based products business as a scale operator in
North America. We also seek to leverage our current business and
manufacturing strength outside the core business in
closely-adjacent segments that help to assure long-term cash
flow growth and tend to reduce volatility in earnings. Elements
of this strategy include:
|
|
|
|
| |
§
|
Developing products and markets for upgraded products made from
ammonia such as UAN, our primary nitrogen fertilizer product,
and
TerraCair®,
a liquid product for the treatment of diesel exhaust in
automotive applications;
|
|
| |
| |
§
|
Seeking opportunities to expand our existing asset base to take
advantage of logistical or feedstock advantages both
domestically and internationally;
|
|
| |
| |
§
|
Managing our North American and international assets to realize
a rate of return that meets or exceeds our cost of capital
throughout the business cycle;
|
|
| |
| |
§
|
Maintaining our facilities to be safe, reliable and
environmentally compliant, cultivation of relationships with
customers who, due to their physical location, can receive our
product most economically, and close management of the supply
chain to keep storage, transportation and other costs at an
appropriate level; and
|
|
| |
| |
§
|
Continuing to evaluate business opportunities in nitrogen
categories and businesses that leverage Terra’s core
competencies in chemical manufacturing, distribution and product
application.
|
|
Recent Business
Environment
The following factors are the key drivers of our profitability:
nitrogen products selling prices, as determined primarily by the
global nitrogen demand/supply balance and natural gas costs,
particularly in North American markets.
Demand
During 2009, the nitrogen business was affected by the decline
in the global economy. Industrial markets curtailed production
lessening the demand for our industrial based nitrogen products.
2009 saw a decrease in energy costs, which lessened demand for
alternative fuels. As a result, some ethanol production was
curtailed during the first half of the year. As energy prices
have rebounded some of the production has since come back on
line.
The agriculture business faced similar effects of the economic
downturn, with volatile crop prices, escalating input costs and
credit constraints impacting growers’ buying behavior. In
2009, farmers saw a $30 billion decrease in net farm income
as compared to 2008 due primarily to a decrease in crop prices.
This hampered demand and, coupled with the volatility present in
fertilizer pricing in 2008, resulted in cautious buying
behaviors among growers and retailers as they waited for firm
orders from growers at the end of 2009.
Long term demand for nitrogen products is driven by a growing
global population, its desire for a higher protein diet, and to
a lesser degree, by the rise in demand of alternative bio-fuels
in North America. 2010 is expected to see a strong recovery in
the fertilizer markets as the fundamentals for corn demand have
improved. Corn pricing remains strong at $3.34 per bushel as of
February 19, 2010, input costs have declined and the
lending markets are improving.
37
An increase in ethanol demand is expected in the coming years
due to the government mandated volumes of 15.0 billion
gallons in 2015 and an anticipated increase in the ethanol blend
rate by the EPA from 10 percent to 15 percent in 2010.
In 2009, production exceeded the mandated volumes of
10.5 billion gallons by 2.5 billion gallons;
therefore, the 2010 increase to 12.0 billion gallons is
already covered by current production volumes. However, an
increase in the blend rate would impact the immediate demand for
corn in 2010. Energy prices and policy will have an impact on
the magnitude of ethanol’s impact on nitrogen demand in the
future.
The population is growing and diets are improving in China, the
Southeast Asian countries and Russia. As the economies and
population of these countries continue to grow, so does the
demand for grain. For example, India, with a population in
excess of 1 billion people, has seen its grain consumption
grow 31 percent in the last two decades due to an increase
in population of 35 percent.
We expect the demand for UAN to continue to grow over the long
term. Weather and field conditions are variables present in
every planting season. By using UAN, growers have greater
application flexibility, which allows them to mitigate some of
this risk. While upgraded products contain less nitrogen by
weight, they are generally easier to ship, store and apply than
ammonia and are safer to handle.
Supply
Over the past seven years, global ammonia capacity has increased
incrementally, growing at an average of approximately
2.5 percent per year. This result was attributable
principally to the combination of new project capacity offset by
permanent plant closings in the U.S. and in Europe. As
global operating rates and prices have risen, so have plans for
new capacity.
This anticipated new global capacity is expected to come
primarily from advantaged natural gas regions of the world, such
as the Middle East and Africa. This expansion of capacity could
be limited, however, by high capital and construction costs,
lower nitrogen prices and increasing natural gas prices. Russia
has increased domestic gas prices as well as prices paid by
their export customers. This has increased production costs for
new and existing plants in Russia and Europe.
Imports account for a significant portion of U.S. nitrogen
product supply. Producers from Russia, Canada, the Middle East,
Trinidad and Venezuela are major exporters to the
U.S. These export producers are often competitive in
regions close to the point of entry for imports, primarily the
Gulf Coast and east coast of North America. Due to higher
freight costs and limited distribution infrastructure, importers
are less competitive in serving the main corn growing regions of
the U.S., which are more distant from these points of entry.
To help meet the growing global demand for fertilizers,
especially in high growth areas like China and India, new
ammonia capacity is expected to come on stream globally in the
next decade. This projected capacity increase excludes Chinese
plants as any new volumes in China are not expected to reach
global markets, but instead are expected to be consumed by
China’s growing in-country demand. For ammonia, there are a
number of new capacity projects expected or underway in gas
advantaged regions; however, increased construction costs and
changes in demand have delayed a number of such projects.
In 2009, the industry began the year with high inventories and
weak demand. To effectively manage the supply/demand dynamic we
curtailed production at certain plants and managed import
volumes. Demand strengthened in the second half of 2009 which
allowed plant rates to return to planned production rates.
Natural Gas
Costs
Natural gas in North America continues to be the most volatile
commodity, but the absolute price level for 2009 NYMEX
settlements were less than half of the 2008 NYMEX settlement
prices. The economic downturn of 2009 played a significant role
in the price decline in 2009. Consumption dropped by
5-7 percent by analysts’ calculations. Natural gas
production stayed steady and rose in some places in North
America, adding fuel to the lagging prices. Based on projected
net increases in natural gas supply for most of 2010, coupled
with high storage volumes, we expect moderate North American
natural gas prices to continue, enabling us to remain
competitive with global producers. Although geographic basis has
tightened, we believe that our geographic plant positions in
Oklahoma and Iowa provide us with a favorable delivered gas cost
basis as compared to our Gulf Coast competitors.
38
The following is the average NYMEX forward natural gas price for
the succeeding twelve-month period noted for the respective
dates:
| |
|
|
|
|
|
|
|
|
|
|
|
|
|
|
|
|
|
(in $per MMBtu)
|
|
March 31,
|
|
June 30,
|
|
September 30,
|
|
December 31,
|
|
2009
|
|
$
|
4.69
|
|
|
$
|
5.09
|
|
|
$
|
5.72
|
|
|
$
|
5.79
|
|
|
2008
|
|
$
|
10.50
|
|
|
$
|
13.22
|
|
|
$
|
7.90
|
|
|
$
|
6.09
|
|
As shown in the table above, natural gas prices in 2009 were not
as volatile as in 2008. Some semblance of seasonal pricing
patterns existed and the economy had a major impact on lowering
prices. The first half of 2009 experienced slow price erosion
and the fourth quarter of 2009 saw an increase as cooler weather
caused heating demand to rise in the southern states.
Our strategy for natural gas procurement is to manage our
exposure to price volatility by locking in our margin for known
commitments. We execute our risk management approach by hedging
natural gas prices through the use of supply contracts,
financial derivatives and other instruments.
39
Results of
Operations
Consolidated
Results
We recorded 2009 net income attributable to Terra
Industries Inc. of $152.6 million on revenues of
$1.6 billion compared with 2008 net income
attributable to Terra Industries Inc. of $641.0 million on
revenues of $2.9 billion. The decrease in net income
attributable to Terra Industries Inc. and revenue is due to the
overall economic decline and an imbalance in the inventory
channel for most of 2009, which drove pricing down.
Additionally, the aggregate impact of costs associated with the
income tax repatriation charge ($42.8 million), the loss on
early retirement of debt ($32.4 million, net of tax), and
the unsolicitated proposals by CF ($11.2 million, net of
tax) was $86.4 million, net of tax. Diluted income per
share for 2009 was $1.53 compared with $6.20 for 2008.
The following table shows the results of operation for the three
years ended December 31, 2009, 2008 and 2007 (certain
percentages that are not considered to be meaningful are
represented by “NM”):
| |
|
|
|
|
|
|
|
|
|
|
|
|
|
|
|
|
|
|
|
|
|
|
|
|
|
|
|
|
|
|
|
Year Ended December 31,
|
|
|
2009-2008
|
|
|
2008-2007
|
|
|
(In millions, except per share data)
|
|
2009
|
|
|
2008
|
|
|
2007
|
|
|
Change
|
|
|
Percent
|
|
|
Change
|
|
|
Percent
|
|
|
|
|
|
|
|
Net sales
|
|
$
|
1,581.4
|
|
|
$
|
2,891.5
|
|
|
$
|
2,342.9
|
|
|
$
|
(1,310.1
|
)
|
|
|
-45
|
%
|
|
$
|
548.6
|
|
|
|
23
|
%
|
|
Cost of sales
|
|
|
1,195.2
|
|
|
|
2,028.3
|
|
|
|
1,815.4
|
|
|
|
(833.1
|
)
|
|
|
-41
|
%
|
|
|
212.9
|
|
|
|
12
|
%
|
|
|
|
|
|
Gross profit
|
|
|
386.2
|
|
|
|
863.2
|
|
|
|
527.5
|
|
|
|
(477.0
|
)
|
|
|
-55
|
%
|
|
|
335.7
|
|
|
|
64
|
%
|
|
Gross profit percentage
|
|
|
24.4
|
%
|
|
|
29.9
|
%
|
|
|
22.5
|
%
|
|
|
-5.4
|
%
|
|
|
-18
|
%
|
|
|
7.3
|
%
|
|
|
33
|
%
|
|
Selling, general and administrative expenses
|
|
|
67.1
|
|
|
|
70.7
|
|
|
|
92.0
|
|
|
|
(3.6
|
)
|
|
|
-5
|
%
|
|
|
(21.3
|
)
|
|
|
-23
|
%
|
|
Other operating expenses
|
|
|
18.0
|
|
|
|
—
|
|
|
|
—
|
|
|
|
18.0
|
|
|
|
NM
|
|
|
|
—
|
|
|
|
0
|
%
|
|
Equity in earnings of North American affiliates
|
|
|
(17.7
|
)
|
|
|
(56.2
|
)
|
|
|
(16.2
|
)
|
|
|
38.5
|
|
|
|
-69
|
%
|
|
|
(40.0
|
)
|
|
|
247
|
%
|
|
|
|
|
|
Income from operations
|
|
|
318.8
|
|
|
|
848.7
|
|
|
|
451.7
|
|
|
|
(529.9
|
)
|
|
|
-62
|
%
|
|
|
397.0
|
|
|
|
88
|
%
|
|
Interest income (expense), net
|
|
|
(27.7
|
)
|
|
|
(4.0
|
)
|
|
|
(11.8
|
)
|
|
|
(23.8
|
)
|
|
|
595
|
%
|
|
|
7.8
|
|
|
|
-66
|
%
|
|
Loss on early retirement of debt
|
|
|
(53.5
|
)
|
|
|
—
|
|
|
|
(38.8
|
)
|
|
|
(53.5
|
)
|
|
|
NM
|
|
|
|
38.8
|
|
|
|
-100
|
%
|
|
|
|
|
|
Income before income taxes, noncontrolling interest and equity
earnings (loss) of GrowHow UK Limited
|
|
|
237.6
|
|
|
|
844.7
|
|
|
|
401.1
|
|
|
|
(607.2
|
)
|
|
|
-72
|
%
|
|
|
443.6
|
|
|
|
111
|
%
|
|
Income tax provision
|
|
|
(74.3
|
)
|
|
|
(239.9
|
)
|
|
|
(127.3
|
)
|
|
|
165.6
|
|
|
|
-69
|
%
|
|
|
(112.6
|
)
|
|
|
88
|
%
|
|
Equity earnings (loss) of GrowHow UK Limited
|
|
|
14.2
|
|
|
|
95.6
|
|
|
|
(2.7
|
)
|
|
|
(81.4
|
)
|
|
|
-85
|
%
|
|
|
98.3
|
|
|
|
NM
|
|
|
|
|
|
|
Income from continuing operations, net of tax
|
|
|
177.5
|
|
|
|
700.4
|
|
|
|
271.1
|
|
|
|
(523.0
|
)
|
|
|
-75
|
%
|
|
|
429.3
|
|
|
|
158
|
%
|
|
Income (loss) from discontinued operations, net of tax
|
|
|
1.1
|
|
|
|
8.3
|
|
|
|
(18.9
|
)
|
|
|
(7.2
|
)
|
|
|
-87
|
%
|
|
|
27.2
|
|
|
|
-144
|
%
|
|
|
|
|
|
Net income
|
|
|
178.6
|
|
|
|
708.7
|
|
|
|
252.2
|
|
|
|
(530.2
|
)
|
|
|
-75
|
%
|
|
|
456.5
|
|
|
|
181
|
%
|
|
Less: Net income attributable to noncontrolling interest
|
|
|
26.0
|
|
|
|
67.7
|
|
|
|
50.3
|
|
|
|
(41.8
|
)
|
|
|
-62
|
%
|
|
|
17.4
|
|
|
|
35
|
%
|
|
|
|
|
|
Net income attributable to Terra Industries Inc.
|
|
$
|
152.6
|
|
|
$
|
641.0
|
|
|
$
|
201.9
|
|
|
$
|
(488.4
|
)
|
|
|
-76
|
%
|
|
$
|
439.1
|
|
|
|
217
|
%
|
|
|
|
|
|
|
|
|
|
|
|
|
|
|
|
|
|
|
|
|
|
|
|
|
|
|
|
|
|
|
|
|
|
|
|
Diluted earnings per share
|
|
$
|
1.53
|
|
|
$
|
6.20
|
|
|
$
|
1.90
|
|
|
|
|
|
|
|
|
|
|
|
|
|
|
|
|
|
|
Weighted average diluted shares
|
|
|
99,992
|
|
|
|
103,359
|
|
|
|
106,454
|
|
|
|
|
|
|
|
|
|
|
|
|
|
|
|
|
|
40
The following table shows North American volumes and prices for
the three years ended 2009, 2008 and 2007:
| |
|
|
|
|
|
|
|
|
|
|
|
|
|
|
|
|
|
|
|
|
|
|
|
|
|
|
|
2009
|
|
|
2008
|
|
|
2007
|
|
|
|
|
(quantities in
|
|
Sales
|
|
|
Average
|
|
|
Sales
|
|
|
Average
|
|
|
Sales
|
|
|
Average
|
|
|
thousands of tons)
|
|
Volumes
|
|
|
Unit
Price(1)
|
|
|
Volumes
|
|
|
Unit
Price(1)
|
|
|
Volumes
|
|
|
Unit
Price(1)
|
|
|
|
|
|
|
|
Ammonia(2)
|
|
|
1,607
|
|
|
$
|
313
|
|
|
|
1,670
|
|
|
$
|
552
|
|
|
|
1,765
|
|
|
$
|
337
|
|
|
UAN-32% basis
|
|
|
3,226
|
|
|
$
|
196
|
|
|
|
3,917
|
|
|
$
|
335
|
|
|
|
4,072
|
|
|
$
|
226
|
|
|
Urea(3)
|
|
|
284
|
|
|
$
|
307
|
|
|
|
249
|
|
|
$
|
467
|
|
|
|
247
|
|
|
$
|
333
|
|
|
Ammonium nitrate
(2)(4)
|
|
|
879
|
|
|
$
|
196
|
|
|
|
990
|
|
|
$
|
309
|
|
|
|
968
|
|
|
$
|
224
|
|
|
|
|
|
|
|
|
|
(1)
|
|
After deducting
$150.0 million, $159.0 million and $137.3 million
outbound freight costs for 2009, 2008 and 2007, respectively.
|
|
(2)
|
|
The 2007 ammonia and AN sales
volumes and prices have been adjusted to exclude Terra’s
U.K. operations for comparability to 2008 and 2009 volumes and
pricing.
|
|
(3)
|
|
Urea sales volumes and prices
include granular urea and urea solutions data.
|
|
(4)
|
|
Ammonium nitrate sales volumes and
prices include agricultural grade AN, industrial grade AN (IGAN)
and ammonium nitrate solution (ANS).
|
41
Results of
Operations—2009 Compared with 2008
Our net sales for 2009 decreased by 45 percent to
$1.6 billion from $2.9 billion in 2008. The decrease
in net sales was primarily attributable to a significant decline
in nitrogen prices across all products and a moderate decrease
in sales volumes as compared to 2008. Specifically, 2009
ammonia, UAN and AN pricing were 43 percent,
41 percent and 37 percent, respectively, below 2008
price levels. 2009 volumes for ammonia, UAN and AN were down
4 percent, 18 percent and 11 percent,
respectively, below 2008 volume levels. The decline in nitrogen
prices reflected the softening in demand due to imbalances that
were present in the retail inventory channel. Despite the
86 million acres of corn planted in 2009, we did not see
the typical seasonal demand due to inclement weather conditions
and excess inventory carried over from 2008. Industry reports
also indicate a decline of approximately 6 percent in
overall fertilizer application during 2009, which contributed to
the decline in volumes experienced in 2009.
The events of 2008 had a significant impact on the results of
2009. The 2008 record corn acres created a deviation in buying
behavior with retailers buying more and earlier in fear of ever
rising prices. However, the 2008 credit crisis led to the rapid
decline of the economy. Nitrogen prices plummeted in the fourth
quarter of 2008 leaving many retailers holding inventory priced
higher than what the market would support. Even though growers
had strong balance sheets, banks were reluctant to lend due to
their evaluation of the risk at that time. Without credit,
growers had limited working capital and were not willing to make
advance purchases for their fertilizer needs. This trend has
continued which is evident in our prepayment balances at year
end. At December 31, 2008, we had $111.6 million in
customer prepayments compared to $39.2 million at
December 31, 2009.
The lower prices deterred imports which helped to correct the
excess inventory issues. At the end 2009, inventory balances in
the channel remained low due to low fall fill orders.
Traditionally, growers apply nitrogen in the fall after harvest
in order to be ready for the spring planting season. However,
wet weather in the fall delayed farmers from accessing their
fields. The situation worsened in December 2009 when several
winter snow storms left approximately 5 percent of the 2009
harvest still standing in the fields. This will leave farmers
with additional work in the spring to finish harvest and plant
next season’s crops. The harvest issue in conjunction with
the cautious buying behavior prevalent in the industry decreased
our fall fill shipments during 2009. This has potential to
increase pressure on logistics during the peak demand season in
the spring of 2010 as there are limits to the amount of product
that can be moved in the critical timeframe.
In order to effectively manage our inventory levels throughout
the year, aggregate production rates were reduced to
91 percent and production was curtailed at various times
throughout the year at our Donaldsonville and Woodward
production facilities. The fixed costs associated with these
curtailments were $21.2 million. During 2009 several of our
facilities performed turnarounds. The period costs associated
with the facilities being offline during the turnaround were
$13.9 million for the twelve months ended December 31,
2009.
Our gross margin was $386.2 million in 2009 compared to
$863.2 in 2008 and decreased as a percentage of sales to
24.4 percent from 29.9 percent. For the year, natural
gas unit costs, net of forward pricing gains and losses,
decreased by 48 percent from $9.33 per MMBtu in 2008 to
$4.85 per MMBtu in 2009. As a result of forward price contracts,
2009 natural gas costs were $151.2 million higher than spot
prices, as compared to 2008 natural gas costs, which were
$134.0 million higher than spot prices.
We enter into forward sales commitments by utilizing forward
pricing and prepayment programs with customers. We use
derivative instruments to hedge a portion of our natural gas
requirements based upon these forward sales. The use of these
derivative instruments is designed to hedge exposure to natural
gas price fluctuations for production required for forward sales
estimates. The net cost of derivatives for 2009 was
$112.1 million, as compared to the net cost of
$172.5 million for 2008. Excluding the impact of the hedge
cost, natural gas cost was $3.82 per MMBtu and $8.10 per MMBtu
for 2009 and 2008, respectively.
Discontinued
Operations
We have reported our Beaumont, Texas methanol operations as
discontinued operations for the years ending December 31,
2009, 2008 and 2007. The Beaumont operations were included in
our methanol segment in prior years. In connection with
reporting discontinued operations, we have determined that our
methanol segment no longer meets the requirements of a reporting
segment.
42
In connection with the sale of the Beaumont facility to Eastman
Chemical Company (Eastman) that was finalized in 2008, we
received $5.4 million from Eastman and recognized
$1.1 million of net income from discontinued operations,
net of tax.
Selling, General
and Administrative Costs and Other Operating Expenses
Selling, general and administrative costs decreased
$3.6 million primarily due to a decrease in short term
incentive compensation, offset by an increase in the long term
incentive compensation in the form of phantom stock which
increased with the appreciation of our stock price during 2009.
Other operating expenses of $18.0 million primarily
represent costs associated with the unsolicited proposals from
CF, the last of which was withdrawn on January 14, 2010.
Equity Earnings
of Unconsolidated Affiliates—North America
Our North American equity investments include a 50 percent
ownership interest in Point Lisas Nitrogen Limited (PLNL), which
operates an ammonia production joint venture in the Republic of
Trinidad and Tobago. We operate the plant jointly with Koch
Industries. In addition, we have a 50 percent interest in
an ammonia storage joint venture, Houston Ammonia Terminal,
L.P., located in Houston, Texas and a 50 percent interest
in a joint venture in Oklahoma
CO2,located
at our Verdigris, Oklahoma facility.
We recorded equity earnings of $17.7 million from our North
American equity investments in 2009 as compared to
$56.2 million in 2008. In addition, we also received cash
distributions of $35.8 million from our North American
equity investments in 2009 as compared to $72.8 in 2008. The
decrease in the results for 2009 is primarily due to the
decrease in Gulf ammonia pricing which affects the results of
our Point Lisas facility, as compared to 2008. PLNL ammonia
sales prices decreased 59 percent in 2009, offset by a
slight increase in sales volumes of 3 percent and a
66 percent decrease in natural gas cost.
Equity Earnings
of Unconsolidated Affiliates—GrowHow
We recorded income of $14.2 million from GrowHow in 2009 as
compared to income of $95.6 million in 2008. The decrease
is primarily due to a 29 percent decrease in sales price
and a 26 percent decrease in sales volumes, partially
offset by a 60 percent decrease in natural gas costs in
2009 as compared to 2008. The U.K. market faced similar
challenges to North America related to the decline in the global
economy affecting demand.
Despite the decline in equity earnings of $81.4 million, we
received balancing consideration and other payments of
$21.2 million during 2009 as compared to the
$61.3 million received for balancing payments and
$27.4 million received as a contribution settlement in 2008.
Loss on Early
Retirement of Debt
On September 24, 2009, we commenced a cash tender offer for
any and all of the Senior Unsecured Notes due in 2017 (2017
Notes). On October 27, 2009, we announced completion of the
tender offer and received tenders from holders of approximately
$317.5 aggregate principal amount of the 2017 Notes,
representing approximately 96.2 percent of the outstanding
notes. As of December 31, 2009, the outstanding debt
balance related to the 2017 Notes is $12.5 million. We
recorded a $53.5 million pre-tax loss ($32.4 million,
net of tax) on the early retirement of debt which consisted of
$48.8 million for the early call premium, $4.5 million
of unamortized issuance costs, and $0.2 million in related
expenses for the tender of the 2017 Notes.
Noncontrolling
Interest
Noncontrolling interest represents third-party interests in the
earnings of the publicly held common units of Terra Nitrogen
Company, L.P. (TNCLP). We own an aggregate of 75.3 percent
of TNCLP through general and limited partnership interests.
TNCLP has its manufacturing facility in Verdigris, Oklahoma and
is a major U.S. producer of nitrogen fertilizer products.
The noncontrolling interest reported in 2009 and 2008 amounts
are directly related to TNCLP earnings and losses. The TNCLP
Agreement of Limited Partnership allows for the General Partner
to receive Incentive Distribution Rights (IDR’s) once a
minimum threshold has been met. During 2009, the Minimum
Quarterly Distribution was met during the year, which entitled
us to increased income allocations as provided for in the TNCLP
Agreement of Limited
43
Partnership. The 2009 noncontrolling interest balance reflects
the impact of these adjusted income allocations. Our increased
income allocation attributed to our General Partner interest was
$10.6 million in 2009 and $36.6 million in 2008.
Noncontrolling interest expense was $26.0 million in 2009
and $67.7 million in 2008.
Income
Taxes
Our income tax expense in 2009 and 2008 was $74.3 million
and $239.9 million, respectively. The 2009 effective rate
was 32.9 percent, compared to 27.5 percent in 2008.
Our effective tax rate reflects tax benefits derived from
operations outside the U.S. which are generally taxed at
rates lower than the U.S. federal statutory rate of
35 percent.
During the fourth quarter of 2009, the Company recognized
U.S. tax expense associated with repatriation of funds to
the U.S. The amount of additional tax expense associated
with the repatriation of funds was approximately
$42.8 million. Excluding the $42.8 million income tax
repatriation charge, our 2009 effective tax rate was
14.0 percent.
The tax provision rate for 2009 includes benefits related to the
fourth quarter 2008 intercompany restructuring of our foreign
operations into a global holding company structure. Terra’s
effective tax rate also reflects tax credits primarily related
to the Woodward UAN upgrade project. The 2009 benefit recorded
from current tax credit usage is approximately
$7.3 million. Also during 2008, Terra completed its
evaluation of the domestic manufacturer’s deduction
provision of the American Jobs Creation Act of 2004 and recorded
a 2009 benefit of approximately $5.3 million as a result of
qualifying production activity income derived in the U.S.
For a full reconciliation of our effective tax rate to the
U.S. federal and state statutory rates and further
explanation of our provision for income taxes, see Note 20,
Income Taxes, of the Notes to the Consolidated Financial
Statements, included in Item 8, Financial Statements and
Supplementary Data, of this Annual Report on
Form 10-K.
Results of
Operations—2008 Compared with 2007
Our net sales for 2008 increased by 23 percent to
$2.9 billion from $2.3 billion in 2007. The increase
in net sales was primarily attributable to higher sales prices
across all products resulting from strong nitrogen demand driven
by high commodity grain prices. Specifically, 2008 ammonia, UAN
and AN pricing were 64 percent, 48 percent and
38 percent, respectively, above 2007 price levels. Volumes
for ammonia and UAN were down 5 percent and 4 percent,
respectively, compared to 2007 due to light nitrogen demand in
the fourth quarter, while AN volumes were unchanged. Net sales
in 2007 included $319.1 million from U.K. operations which
were contributed into GrowHow during the 2007 third quarter and
its 2008 results are classified as non-operating equity earnings.
Our gross margin was $863.2 million in 2008 compared to
$527.5 in 2007 and increased as a percentage of sales to
29.9 percent from 22.5 percent. The gross margin
percentage improvement for 2008 reflects price increases more
than offsetting our increase in natural gas costs. For the year,
natural gas unit costs, net of forward pricing gains and losses,
increased by 32 percent from $7.08 per MMBtu in 2007 to
$9.33 per MMBtu in 2008. We enter into forward sales commitments
by utilizing forward pricing and prepayment programs with
customers. We use derivative instruments to hedge a portion of
our natural gas requirements. The use of these derivative
instruments is designed to hedge exposure to natural gas price
fluctuations for production required for forward sales
estimates. As a result of forward price contracts, 2008 natural
gas costs were $134.0 million higher than spot prices, as
compared to 2007 natural gas costs which were $53.3 million
higher than spot prices.
Primarily due to market price declines, we recorded an inventory
valuation charge to cost of sales of $17.4 million for the
fourth quarter 2008. For additional information regarding our
accounting policy on inventory valuation, see Note 1,
Summary of Significant Accounting Policies, of the Notes
to the Consolidated Financial Statements, included in
Item 8, Financial Statements and Supplementary Data,
of this Annual Report on
Form 10-K.
Due to a significant decline in fertilizer demand during late
2008, we decided to temporarily halt production at our
Donaldsonville and Woodward facilities. We recorded a charge of
$16.5 million to cost of sales representing the fair value
carried in accumulated other comprehensive income (loss) of
related derivative contracts because these contracts no longer
qualify under hedge accounting. In addition, we recorded a
$16.0 million charge to cost of sales representing a
portion of fair value carried in accumulated other comprehensive
income for those contracts that we determined would not result
in production costs that would support reasonably profitable
operations.
44
Discontinued
Operations
We have reported our Beaumont, Texas methanol operations as
discontinued operations for the years ending December 31,
2008 and 2007. The Beaumont operations were included in our
methanol segment in prior years. In connection with reporting
discontinued operations, we have determined that our methanol
segment no longer meets the requirements of a reporting segment.
During the third quarter of 2007 we recorded an asset impairment
charge of $39.0 million related to the Beaumont asset. We
also recorded revenue of $12.0 million pursuant to a
contractual agreement with the Methanex Corporation for each of
the years ending December 31, 2008 and 2007.
Selling, General
and Administrative Costs
Selling, general and administrative costs decreased
$21.2 million primarily due to lower share-based
compensation expense and U.K. operations included within 2007
results, offset by increases in salary and wages due to
headcount increases in 2008 and professional services.
Equity Earnings
of Unconsolidated Affiliates—North America
We recorded income of $56.2 million from our North American
equity investments in 2008 as compared to $16.2 million in
2007. In addition, we also received cash distributions of
$72.8 million from our North American equity investments in
2008 as compared to $29.5 in 2007. Our North American joint
ventures benefited from strong demand in 2008 which drove
pricing increases.
Equity Earnings
of Unconsolidated Affiliates—GrowHow
We recorded income of $95.6 million from GrowHow in 2008 as
compared to a loss of $2.7 million in 2007. We received a
contribution settlement payment and a balancing consideration
payment from GrowHow of $27.4 million and
$61.3 million, respectively, in 2008. Our U.K. operations
were contributed into GrowHow on September 14, 2007,
therefore 2007 results only include the period from formation
through December 31, 2007. The joint venture benefited from
strong demand in 2008 which drove pricing increases.
Additionally, the continued relative strength of the British
pound provided favorable foreign exchange translation.
Noncontrolling
Interest
Noncontrolling interest represents third-party interests in the
earnings of the publicly held common units of TNCLP. The 2008
and 2007 amounts are directly related to TNCLP earnings and
losses. During 2008, the cumulative shortfall of the Minimum
Quarterly Distribution was satisfied which entitled us to
increased income allocations as provided for in the TNCLP
Partnership Agreement. The 2008 noncontrolling interest balance
reflects the impact of these adjusted income allocations. Our
increased income allocation attributed to our General Partner
interest was $36.6 million in the year ended
December 31, 2008. The net income attributable to the
noncontrolling interest was $67.7 million in 2008 and
$50.3 million in 2007.
Income
Taxes
Our income tax expense in 2008 and 2007 was $239.9 million
and $127.3 million, respectively. The 2008 effective rate
was 27.5 percent, compared to 36.6 percent in 2007.
Our effective tax rate reflects tax benefits derived from
operations outside the U.S. which are generally taxed at
rates lower than the U.S. federal statutory rate of
35 percent.
The tax provision rate for 2008 includes a benefit of
approximately $33.3 million related to a fourth quarter
2008 intercompany restructuring of our foreign operations into a
global holding company structure. Terra’s effective tax
rate also reflects tax credits primarily related to the Woodward
UAN upgrade project. The 2008 benefit recorded from current tax
credit usage is approximately $19.5 million. Also during
2008, Terra completed its evaluation of the domestic
manufacturer’s deduction provision of the American Jobs
Creation Act of 2004 and recorded a benefit of approximately
$13.3 million as a result of qualifying production activity
income derived in the U.S.
For a full reconciliation of our effective tax rate to the
U.S. federal and state statutory rates and further
explanation of our provision for income taxes, see Note 20,
Income Taxes, of the Notes to the Consolidated Financial
Statements, included in Item 8, Financial Statements and
Supplementary Data, of this Annual Report on
Form 10-K.
45
Liquidity and
Capital Resources
Summary
Our primary uses of cash and cash equivalents were to fund our
working capital requirements, make payments for plant
turnarounds and capital expenditures, repurchase our common
stock under the share repurchase program, make distributions to
noncontrolling interests, and fund common stock dividends. The
principal sources of funds were cash flows from operations and
funds received from GrowHow and proceeds from the sale of the
Beaumont, Texas facility. Cash and cash equivalent balances at
December 31, 2009 were $501.3 million. During 2009,
cash and cash equivalents decreased $465.4 million.
Cash and cash equivalents consist of all cash balances and all
highly liquid investments purchased with an original maturity of
three months or less. Our cash equivalents included
$280.5 million invested in money market mutual funds. There
are no withdrawal restrictions on any of these funds. The
remaining cash equivalents were invested in obligations of
highly-rated financial institutions with an average weighted
maturity of approximately 43 days.
Cash
Flows
The following table summarizes our cash flows from operating,
investing and financing activities for each of the past three
fiscal years ($ in millions):
| |
|
|
|
|
|
|
|
|
|
|
|
|
|
Total cash provided by (used in):
|
|
2009
|
|
|
2008
|
|
|
2007
|
|
|
|
|
|
|
|
Operating activities
|
|
$
|
204.1
|
|
|
$
|
483.1
|
|
|
$
|
747.9
|
|
|
Investing activities
|
|
|
(93.1
|
)
|
|
|
51.6
|
|
|
|
(94.5
|
)
|
|
Financing activities
|
|
|
(572.2
|
)
|
|
|
(262.2
|
)
|
|
|
(133.6
|
)
|
|
Effect of exchange rate changes on cash
|
|
|
(4.2
|
)
|
|
|
(4.0
|
)
|
|
|
(0.6
|
)
|
|
|
|
|
|
Increase (decrease) in cash and cash equivalents
|
|
$
|
(465.4
|
)
|
|
$
|
268.5
|
|
|
$
|
519.2
|
|
|
|
|
|
Operating
Activities
Our cash flows from operating activities were
$204.1 million during 2009. The $204.1 million is
comprised of $267.0 million from operations offset by
$62.9 million from changes in our working capital accounts.
The $267.0 million includes $152.6 million of net
income attributable to Terra, adjusted for non-cash expenses.
The significant non-cash expenses that we incurred include
$84.8 million of depreciation of property, plant and
equipment and amortization of deferred plant turnaround costs
and $16.2 million of share based compensation expense,
offset by $14.2 million of equity earnings from GrowHow and
$18.2 million of deferred income taxes.
Included in the December 31, 2009 cash and cash equivalents
balance of $501.3 million is $39.2 million of customer
prepayments for the selling price and delivery costs of products
that we expect to ship during the first half of 2010, as
compared to the December 31, 2008 cash and cash equivalents
balance of $966.7 which included $111.6 million in customer
prepayments.
Investing
Activities
Our investing activities used cash of $93.1 million during
2009. The primary uses of cash were related to
$108.5 million of property, plant and equipment purchases
for our operations and $25.4 million for turnaround
activities. The primary sources of cash were related to the
balancing consideration payment and other payments from GrowHow
of $21.2 million, $14.0 million from distributions
received from North American Equity investments, and
$5.4 million in connection to the sale of the Beaumont
facility to Eastman that occurred in 2008.
Financing
Activities
Our financing activities used cash of $572.2 million during
2009. The primary use was $788.6 million for dividends paid
to holders of common stock, including the $7.50-per-share
special cash dividend paid in the fourth quarter of 2009. To
declare and pay the special cash dividend we completed a debt
refinancing whereby we issued $600 million of
7.75 percent unsecured senior notes due 2019. The proceeds
were used to redeem $317.5 million of the $330 million
7 percent unsecured senior notes due 2017 and to pay the
special cash dividend. We incurred
46
$14.4 million in debt issuance costs related to the
refinancing in the fourth quarter of 2009. Other uses of cash
include $41.1 million of distributions to the
noncontrolling interest holders of TNCLP; and $6.6 million
for common stock issuances, offset by $6.3 million related
to excess tax benefits from share compensation plans.
On May 6, 2008, the Board of Directors adopted a resolution
for the repurchase of 12,841,717 shares, representing
14 percent of our then outstanding common stock. The stock
buyback program commenced on May 7, 2008 and has been and
will be conducted on the open market, in private transactions or
otherwise at such times prior to June 30, 2010, and at such
prices we determine appropriate. Purchases may be commenced or
suspended at any time without notice. As of December 31,
2009, there were 7,448,662 shares available to be purchased
under the plan. There were no share repurchases during 2009 as
compared to the 5,393,055 shares repurchased during 2008.
Long-term Debt
and Revolving Credit Facilities
During 2009, we completed a debt refinancing whereby we issued
$600 million of 7.75 percent unsecured senior notes
due 2019. These proceeds were used to redeem $317.5 million
of 7.00 percent senior secured notes due 2017 and to fund
dividends paid to holders of common stock.
In connection with the debt refinancing, we amended our
revolving credit facilities to expand our capabilities to pay
dividends, invest in capital expenditures, and invest in joint
venture opportunities. Borrowing availability under the
facilities is generally based on eligible cash balances,
85 percent of eligible accounts receivable and
60 percent of eligible inventory, less outstanding letters
of credit. These facilities include $50 million solely
dedicated for the use of TNCLP, one of our consolidated
subsidiaries.
At December 31, 2009, there were no outstanding revolving
credit borrowings and there were $8.0 million in
outstanding letters of credit, resulting in remaining borrowing
availability of approximately $192.0 million under the
facilities. We are required to maintain a minimum unused
borrowing availability of $30 million. The facilities also
require that we adhere to certain limitations on additional
debt, capital expenditures, acquisitions, liens, asset sales,
investments, prepayments of subordinated indebtedness, changes
in lines of business and transactions with affiliates. In
addition, if our borrowing availability falls below a combined
$60 million, we are required to have generated
$60 million of operating cash flows, or earnings before
interest, income taxes, depreciation, amortization and other
non-cash items (as defined in the facilities) for the preceding
four quarters. The facilities also require that there be no
change of control related to Terra, such that no individual or
group acquires more than 35 percent of the beneficial
ownership of the outstanding voting shares of Terra. Such change
of control, such as the Yara Merger, would constitute an event
of default under the facilities.
Our ability to meet facilities covenants will depend on future
operating cash flows, working capital needs, receipt of customer
prepayments and trade credit terms. Failure to meet these
covenants could result in additional costs and fees to amend the
facilities or could result in termination of the facilities.
Access to adequate bank facilities may be required to fund our
need to build inventories during the second half of the year in
order the ensure product availability during the peak sales
season. We believe that our facilities are adequate for expected
2010 sales levels.
In addition, our ability to manage our exposure to commodity
price risk in the purchase of natural gas through the use of
financial derivatives may be affected by our ability to obtain
sufficient credit terms. For additional information regarding
commodity price risk, see Item 7A, Quantitative and
Qualitative Disclosures about Market Risk.
Based on our December 31, 2009 financial position and the
current market conditions for our finished products and for
natural gas, we anticipate that we will be able to comply with
our covenants through 2010.
Preferred Shares
and Common Stock
We had 4.25 percent Cumulative Convertible Perpetual
Series A Preferred Shares (Series A Preferred Shares)
with a liquidation value of $0.5 million outstanding at
December 31, 2009. The Series A Preferred Shares are
not redeemable, but are convertible into common stock at a
conversion price of $9.96 per common share at the option of the
holder. These Series A Preferred Shares may, at our option,
be automatically converted to common shares after
December 20, 2009 if the closing price for common shares
exceeds 140 percent of the conversion price for any twenty
days within a consecutive
thirty-day
period prior to such a conversion. Upon the occurrence of a
fundamental change to our capital structure, including a change
of control, merger, or sale of Terra, holders of the
Series A Preferred
47
Shares may require us to purchase any or all of their shares at
a price equal to their liquidation value plus any accumulated,
but unpaid, dividends. We also have the right, under certain
conditions, to require holders of the Series A Preferred
Shares to exchange their shares for convertible subordinated
debentures with similar terms. The Yara Merger Agreement
requires us to convert all outstanding Series A Preferred
Shares into common stock prior to the closing of the Yara
Merger. On February 24, 2010, we announced that all
outstanding Series A Preferred Shares will convert to
shares of common stock on March 15, 2010.
During 2008, we made inducement payments of $5.3 million to
holders of our Series A Preferred Shares, which resulted in
a conversion of 118,400 Series A Preferred Shares into
11,887,550 shares of common stock. An additional 1,100
Series A Preferred Shares were redeemed in the third
quarter of 2009 for 110,442 common shares. As the inducement
offer had expired in 2008, there were no inducement payments for
the redemption occurring in 2009.
During 2009, 2008 and 2007 we paid $0.1 million,
$3.9 million and $5.1 million, respectively, for
preferred share dividends. We paid $788.6 million in common
stock dividends in 2009. We paid $28.3 million in common
stock dividends in 2008. There were no common stock dividends
paid in 2007.
Share
Repurchases
In May 2008, the Board authorized the repurchase of
10 million shares of common stock and carried over the
balance of 2.8 million unpurchased shares from the prior
program, for total authorization of approximately
12.8 million shares, representing approximately
14 percent of our then outstanding common stock, on the
open market in private transactions or otherwise. Terra
repurchased no common stock during 2009.
Capital
Expenditures
During 2009 and 2008, we funded plant and equipment purchases of
$108.5 million and $79.2 million, respectively. Our
2009 capital expenditures were primarily for the expansion of
the UAN production at our Woodward facility and replacement or
sustaining capital needs at all of our production facilities. We
expect the Woodward expansion to cost $180.0 million and to
be completed during 2010. During 2009, capital expenditures
related to the expansion were $85.8 million.
We expect 2010 plant and equipment purchases to approximate
$175-180 million consisting primarily of
$90-95 million in expenditures for replacement of equipment
or to improve operating results at our manufacturing facilities
and approximately $85-90 million for the expansion of our
Woodward facility.
Plant turnaround costs represent cash used for the periodic
scheduled major maintenance of our continuous process production
facilities that is performed at each plant, generally every two
years. We funded $25.4 million and $10.1 million of
plant turnaround costs in 2009 and 2008, respectively. We
estimate 2010 plant turnaround costs will approximate
$25-30 million.
Off-Balance Sheet
Transactions
We have leases for equipment, railcars and production, office
and storage facilities. These leases are accounted for as
operating leases. The assets and liabilities associated with the
operating leases are not recorded on our balance sheet.
48
Contractual
Obligations
Contractual obligations and commitments to make future payments
at December 31, 2009 were:
| |
|
|
|
|
|
|
|
|
|
|
|
|
|
|
|
|
|
|
|
|
|
(in millions)
|
|
Payments Due In
|
|
|
|
|
|
|
|
Total
|
|
|
2010
|
|
|
2011-2012
|
|
|
2013-2014
|
|
|
Thereafter
|
|
|
|
|
|
|
|
Long-term debt
|
|
$
|
612.5
|
|
|
$
|
—
|
|
|
$
|
—
|
|
|
$
|
—
|
|
|
$
|
612.5
|
|
|
Interest payments on long-term debt
|
|
|
472.0
|
|
|
|
47.4
|
|
|
|
94.8
|
|
|
|
94.8
|
|
|
|
235.0
|
|
|
Operating leases
|
|
|
157.1
|
|
|
|
43.3
|
|
|
|
70.2
|
|
|
|
33.0
|
|
|
|
10.6
|
|
|
Ammonia purchase
obligations(1)
|
|
|
923.4
|
|
|
|
102.6
|
|
|
|
205.2
|
|
|
|
205.2
|
|
|
|
410.4
|
|
|
Natural gas and other purchase obligations
|
|
|
348.1
|
|
|
|
276.4
|
|
|
|
47.0
|
|
|
|
24.7
|
|
|
|
—
|
|
|
|
|
|
|
Total(2)
|
|
$
|
2,513.1
|
|
|
$
|
469.7
|
|
|
$
|
417.2
|
|
|
$
|
357.7
|
|
|
$
|
1,268.5
|
|
|
|
|
|
|
|
|
|
1.
|
|
We have a contractual obligation
to purchase one-half of the ammonia produced by Point Lisas. The
purchase price is based on the average market price of ammonia,
F.O.B. Caribbean, less a discount. Obligations in the above
table are based on purchasing 360,000 short tons per year at the
three year average price paid. This contract expires in October
2018.
|
|
2.
|
|
The total contractual obligations
and commitments do not include an ASC 740 liability of
$62.4 million. (See Note 21, Unrecognized Tax
Benefit, to our Consolidated Financial Statements included
in Item 8, Financial Statements and Supplemental
Data, of this Annual Report on
Form 10-K.)
|
Remediation of
Severnside under Joint Venture Agreement
In conjunction with the formation of GrowHow, we commenced the
closure of our Severnside, U.K. facility. Pursuant to the
agreement with Kemira, we are responsible for an remediation
costs required to prepare the Severnside site for disposal.
During 2009 Severnside underwent remediation and we incurred
$8.7 million in relation to the remediation costs. We
estimate a remaining $2-3 million in remediation cost to be
incurred in 2010. Upon the disposition of Severnside, Terra is
entitled to receive the net sales proceeds. We anticipate that
the proceeds related to the sale of the Severnside land will
exceed the total cost of reclamation of the site.
Pension Assets
and Liabilities
We have three pension plans—an employees’ retirement
plan (U.S. Employees’ Plan) and an excess benefit plan
(U.S. Excess Plan) in the United States and a pension plan
for employees of Terra International (Canada) Inc. (Canadian
Employees’ Plan) in Canada. Our U.S. Employees’
Plan and Canada Employees’ Plan are not fully funded with
combined projected benefit obligations exceeding plan assets by
$11.0 million. Our U.S. Excess Plan is unfunded and
had a projected benefit obligation of $10.8 million at
December 31, 2009.
The pension projected benefit obligations were computed based on
a 5.9 percent discount rate, which was based on yields for
high-quality corporate bonds (Moody’s Investor Service
“AA” rated or equivalent) with a maturity
approximating the duration of our pension obligation. Future
declines in comparable bond yields would increase our pension
obligation and future increases in bond yields would decrease
our pension obligation. Our pension obligation, net of plan
assets, could increase or decrease depending on the extent that
returns on pension plan assets is lower or higher than the
discount rate.
Our cash contributions to pension plans were $2.4 million
in 2009. Future contributions depend on our funding decisions,
actual returns for plan assets, and legislative changes to
pension funding requirements
and/or plan
amendments. See Note 17, Retirement Benefit Plans,
of the Notes to our Consolidated Financial Statements included
in Item 8, Financial Statements and Supplementary
Data, of this Annual Report on
Form 10-K
for further information on our retirement benefits plans.
Environmental,
Health and Safety
Expenditures related to environmental, health and safety
regulation compliance are primarily composed of operating costs
that totaled $11.6 million in 2009. Because environmental
health and safety regulations are expected to
49
continue to change and generally to become more restrictive than
current requirements, the cost of compliance likely will
increase. We do not expect compliance with such regulations to
have a material adverse effect on the results of operations,
financial position or net cash flows.
We incurred $12.8 million of 2009 capital expenditures to
ensure compliance with environmental, health and safety
regulations. We may be required to install additional air and
water quality control equipment, such as low nitrous oxide
burners, scrubbers, ammonia sensors and continuous emission
monitors to continue to achieve compliance with the Clean Air
Act and similar requirements. These equipment requirements
typically apply to competitors as well.
We estimate that the cost of complying with existing
requirements in 2010, 2011, 2012 and beyond will be
approximately $34.0 million in the aggregate.
Noncontrolling
Interest
Noncontrolling interest represents the third party interest in
the earnings of the publicly held common units of Terra Nitrogen
Company, L.P. We own 75.3 percent of the outstanding units.
TNCLP makes cash distributions to the General and Limited
Partners based upon formulas defined in the Agreement of Limited
Partnership. Available Cash for distribution is defined
generally as all cash receipts less all cash disbursements,
adjusted for changes in certain reserves established as the
General Partner determines in its reasonable discretion to be
necessary. Cash distributions to the Limited Partner and General
Partner vary depending on when the cumulative distributions
exceed the Minimum Quarterly Distribution (MQD) target levels
set forth in the Agreement of Limited Partnership.
The cumulative shortfall of the MQD was satisfied during 2009
which entitled the General Partner to increased income
allocations as provided for in the Agreement of Limited
Partnership. The increased income allocation attributed to our
General Partner interest was $10.6 million in 2009 and
$36.6 million for 2008.
During 2009, 2008 and 2007, TNCLP distributed
$41.1 million, $69.6 million and $35.2 million,
respectively, to the noncontrolling TNCLP common unitholders.
Application of
Critical Accounting Policies and Estimates
The preparation of financial statements and related disclosures
in conformity with accounting principles generally accepted in
the United States requires management to make judgments,
assumptions and estimates that affect the amounts reported in
our Consolidated Financial Statements and accompanying notes.
Note 1, Summary of Significant Accounting Policies,
of the Notes to the Consolidated Financial Statements, included
in Item 8, Financial Statements and Supplemental
Data, of this Annual Report on
Form 10-K
describes the significant accounting policies and methods used
in preparing the Consolidated Financial Statements. Management
considers the accounting policies described below to be our most
critical accounting policies because they are impacted
significantly by estimates that management makes. Management
bases its estimates on historical experience or various
assumptions that they believe to be reasonable under the
circumstances, and the results form the basis for making
judgments about the reported values of assets, liabilities,
revenues and expenses. Management has discussed the development
and selection of our critical accounting estimates, and the
disclosure regarding them, with the audit committee of our Board
of Directors, and does so on a regular basis. Actual results may
differ materially from these estimates.
Derivative and
Financial Instruments
We enter into derivative financial instruments, including swaps,
basis swaps and put and call options, to manage the effect of
changes in natural gas costs and the prices of our nitrogen
products. We evaluate each derivative transaction and make an
election of whether to designate the derivative as a fair-value
or cash flow hedge or not to elect hedge designation for the
derivative. Upon election of hedge designation, and to the
extent such hedge is determined to be effective, changes in fair
value are either (a) offset by the change in fair value of
the hedged asset or liability or (b) reported as a
component of accumulated other comprehensive income (loss) in
the period of change, and subsequently recognized in the
determination of net income in the period that the offsetting
hedged transaction occurs. For derivatives that are not
designated as hedges, or to the extent a hedge-designated
derivative is determined to be ineffective, changes in fair
value are recognized in earnings in the period of change.
50
Until our derivatives settle, we test the derivatives for
ineffectiveness. This includes assessing the correlation of
NYMEX pricing, which is commonly used as an index in natural gas
derivatives, to the natural gas pipelines’ pricing at our
manufacturing facilities. This assessment requires management
judgment to determine the statistically- and
industry-appropriate analysis of prior operating relationships
between the NYMEX prices and the natural gas pipelines’
prices at our facilities.
To the extent possible, we base our market value calculations on
third party data. Due to multiple types of settlement methods
available, not all settlement methods for future period trades
are available from third party sources. In the event that a
derivative is measured for fair value based on a settlement
method that is not readily available, we estimate the fair value
based on forward pricing information for similar types of
settlement methods.
Revenue
Recognition
Revenue is recognized when persuasive evidence of a transaction
exists, delivery has occurred, the price is fixed or
determinable, no obligations remain and collectability is
probable. Revenue from sales is generally recognized upon
shipment of product to the customer in accordance with the terms
of the sales agreement. As part of the revenue recognition
process, we determine whether collection of trade receivables
are reasonably assured based on various factors, including
evaluation of whether there has been deterioration in the credit
quality of our customers that could result in the inability to
collect the receivable balance. In situations where it is
unclear whether we will be able to collect the receivable,
revenue and related costs are deferred. Related costs are
recognized when it has been determined that the collection of
the receivable is unlikely.
Inventory
Valuation
Inventories are stated at the lower of cost or market. Market is
defined as current replacement cost, except that market should
not exceed the net realizable value and should not be less than
net realizable value reduced by an allowance for an
approximately normal profit margin. The cost of inventories is
determined by using the
first-in,
first-out method. We perform a monthly analysis of our inventory
balances to determine if the carrying amount of inventories
exceeds their net realizable value. Our determination of
estimated net realizable value is based on customer orders,
market trends and historical pricing. If the carrying amount
exceeds the estimated net realizable value, the carrying amount
is reduced to the estimated net realizable value. We estimate a
reserve for obsolescence and excess of our materials and
supplies inventory. Inventory is stated net of the reserve.
Pension Assets
and Liabilities
Pension assets and liabilities are affected by the estimated
market value of plan assets, estimates of the expected return on
plan assets and discount rates. Actual changes in the fair
market value of plan assets and differences between the actual
return on plan assets and the expected return on plan assets
will affect the amount of pension expense ultimately recognized.
Our U.S. Employees’ Plan and Canada Employees’
Plan are not fully funded with combined projected benefit
obligations exceeding plan assets by $11.0 million. Our
U.S. Excess Plan is unfunded and had a projected benefit
obligation of $10.8 million at December 31, 2009. The
December 31, 2009 pension obligation was computed based on
an average 5.9 percent discount rate, which was based on
yields for high-quality corporate bonds with a maturity
approximating the duration of our pension liability. The
long-term return on plan assets is determined based on
historical portfolio results and management’s expectations
of the future economic environment. Declines in comparable bond
yields would decrease our net pension asset. Our net pension
asset could increase or decrease depending on the extent to
which returns on pension plan assets are lower or higher than
the discount rate.
Deferred Income
Taxes
Terra accounts for income taxes using the asset and liability
method described in the Accounting Standards Codification
(Codification or ASC) Topic 740, Income Taxes. Under the
asset and liability method, deferred tax assets and liabilities
are recognized for the future tax consequences attributed to
differences between the financial statement carrying amounts of
existing assets and liabilities and their respective tax bases
and tax credits and loss carry-forwards. Deferred tax assets and
liabilities are measured using enacted tax rates expected to
apply to taxable income in the years in which those temporary
differences and carry-forwards are expected to be recovered or
settled. The effect on deferred tax assets and liabilities of a
change in tax rates is recognized in income in the period that
51
includes the enactment date. A valuation allowance is
established when necessary to reduce deferred tax assets to
amounts expected to be realized.
Additionally, undistributed earnings of a subsidiary are
accounted for as a temporary difference, except that
undistributed earnings of Terra’s foreign subsidiaries and
affiliated corporate joint ventures accounted for on the equity
method are considered to be permanently reinvested, and
accordingly, no provision for U.S. income taxes has been
provided thereon. If we receive distributions from any of these
foreign subsidiaries or affiliates or determine the
undistributed earnings of these foreign subsidiaries or
affiliates to not be permanently reinvested, we record
U.S. tax liabilities in the consolidated financial
statements.
Significant judgment is required in determining the worldwide
provision for income taxes and there are many transactions for
which the ultimate tax outcome is uncertain. It is our policy to
establish provisions for taxes that may become payable in future
years as a result of an examination by tax authorities. We
establish the provisions based upon management’s assessment
of exposure associated with permanent tax differences, tax
credits and other filing positions. The provisions are analyzed
periodically and adjustments are made as events occur that
warrant adjustments to those provisions.
We adopted the provision of ASC 740, Income Taxes
(previously referred to as FASB Interpretation No. 48,
Accounting for Uncertainty to Income Taxes
(FIN 48)), on January 1, 2007. Under ASC 740, tax
benefits are recorded only for tax positions that are more
likely than not to be sustained upon examination by tax
authorities. The amount recognized is measured as the largest
amount of benefit that is greater than 50 percent likely to
be realized upon ultimate settlement. Unrecognized tax benefits
are tax benefits claimed in our tax returns that do not meet
these recognition and measurement standards.
Plant Turnaround
Costs
Plant turnarounds are periodically performed to extend the
useful life, increase output
and/or
efficiency and ensure the long-term reliability and safety of
integrated plant machinery at our continuous process production
facilities. The nature of a turnaround is such that it occurs on
less than annual basis and requires a multi-week shutdown of
plant operations. Specific procedures performed during the
turnaround include the disassembly, inspection and replacement
or overhaul of plant machinery (boilers, pressure vessels,
piping, heat exchangers, etc.) and rotating equipment
(compressors, pumps, turbines, etc.), equipment recalibration
and internal equipment efficiency assessments.
Preceding a turnaround, plants experience decreased efficiency
in resource conversion to finished products. Replacement or
overhaul of equipment and items such as compressors, turbines,
pumps, motors, valves, piping and other parts that have an
estimated useful life of at least two years, the internal
assessment of production equipment, replacement of aged
catalysts, and new installation/recalibration of measurement and
control devices result in increased production output
and/or
improved plant efficiency after the turnaround. Turnaround
activities are betterments that meet at least one of the
following criteria: 1) extend the equipment useful life, or
2) increase the output
and/or
efficiency of the equipment. As a result, we follow the deferral
method of accounting for these turnaround costs and thus they
are capitalized and amortized over the period benefited, which
is generally the two-year period until the next turnaround.
Turnaround activities may extend the useful life of the assets
since the overhaul of heat exchangers, pressure vessels,
compressors, turbines, pumps, motors, etc. allow the continued
use beyond the original design. If criteria for betterment or
useful life extension are not met, we expense the turnaround
expenditures as repair and maintenance activities in the period
performed.
Impairment of
Long-Lived Assets
Management assesses the recoverability of long-lived assets when
indicators of impairment exist. The assessment of the
recoverability of long-lived assets reflects management’s
assumptions and estimates. Factors that management must estimate
when performing impairment tests include sales demand,
production levels, prices and costs, inflation, discount rates,
currency exchange rates and capital spending. Significant
management judgment is involved in estimating these factors, and
they include inherent uncertainties. All assumptions utilized in
the impairment analysis are consistent with management’s
internal planning.
52
During 2007, we entered into an option agreement to sell our
Beaumont, Texas facility. In connection with this option
agreement, we evaluated the Beaumont facility for impairment and
determined that the assets were impaired. We recorded a
$39 million impairment charge for these assets.
Recently Issued
Accounting Standards
In June 2009, the FASB issued new guidance on Generally Accepted
Accounting Principles (GAAP) relating to the Codification. This
guidance establishes the Codification as the source of
authoritative accounting principles recognized by the FASB to be
applied by nongovernmental entities in the preparation of
financial statements in conformity with GAAP. Rules and
interpretive releases of the SEC under authority of federal
securities laws are also sources of authoritative GAAP for SEC
registrants. The FASB will no longer issue new standards in the
form of Statements, FASB Staff Positions, or Emerging Issues
Task Force (EITF) Abstracts; instead the FASB will issue
Accounting Standards Updates. Accounting Standards Updates will
not be authoritative in their own right as they will only serve
to update the Codification. This guidance was effective for
financial statements issued for interim and annual periods
ending after September 15, 2009. The adoption did not have
an impact on our consolidated financial position, results of
operations or cash flows.
In December 2007, the FASB issued new guidance on business
combinations, which was effective for us for business
combinations with the acquisition date on or after
January 1, 2009. This guidance requires the acquiring
entity in a business combination to recognize all (and only) the
assets acquired and liabilities assumed in the transaction and
establishes the acquisition-date fair value as the measurement
objective for all assets acquired and liabilities assumed in a
business combination. Certain provisions of this guidance will,
among other things, impact the determination of acquisition-date
fair value of consideration paid in a business combination
(including contingent consideration); exclude transaction costs
from acquisition accounting; and change accounting practices for
acquired contingencies, acquisition-related restructuring costs,
in-process research and development, indemnification assets, and
tax benefits. The adoption did not have an impact on our
consolidated financial position, results of operations or cash
flows.
In December 2007, the FASB issued new guidance on noncontrolling
interests, which we adopted on January 1, 2009. This
guidance amends the accounting for and disclosure of the
noncontrolling interest in a subsidiary and for the
deconsolidation of a subsidiary. This guidance clarifies the
definition and classification of a noncontrolling interest,
revises the presentation of noncontrolling interests in the
consolidated income statement, establishes a single method of
accounting for changes in a parent’s ownership interest in
a subsidiary that does not result in deconsolidation, and
requires that a parent recognize a gain or loss in net income
(loss) when a subsidiary is deconsolidated. This guidance also
required expanded disclosures in the consolidated financial
statements that clearly identify and distinguish between the
interests of the parent’s owners and the interests of the
noncontrolling owners of a subsidiary. The required changes in
presentation have been reflected in the consolidated balance
sheets, statements of operations and statements of cash flows
and in the notes to the consolidated financial statements, where
applicable.
In March 2008, the FASB issued new guidance on derivatives and
hedging, which requires entities to provide enhanced disclosures
about how and why an entity uses derivative instruments, how
derivative instruments and related hedged items are accounted,
and how derivative instruments and related hedged items affect
an entity’s financial position, results of operations, and
cash flows. We adopted this guidance on January 1, 2009 and
these disclosures are included in Note 5 herein.
In June 2008, the FASB issued new guidance on earnings per
share. The FASB decided that unvested share-based payout awards
that contain non-forfeitable rights to dividends or dividend
equivalents (whether paid or unpaid) are participating
securities and shall be included in the computation of earnings
per share pursuant to the two-class method. We adopted this
guidance on January 1, 2009 and the adoption did not have
an impact on our consolidated financial position, results of
operations or cash flows.
In December 2008, the FASB issued new guidance on compensation,
which amends previous guidance to require more detailed
disclosures about employers’ pension plan assets. New
disclosures will include more information on investment
strategies, major categories of plan assets, concentrations of
risk within the plan assets and valuation techniques used to
measure the fair value of plan assets. This new guidance
required new disclosures only, and did
53
not impact our consolidated financial position, results of
operations or cash flows. We have included these additional
disclosures in Note 17 herein.
In April 2009, the FASB issued guidance on fair value
measurements and disclosures, which provides additional guidance
on estimating fair value when the volume and level of activity
for an asset or liability have significantly decreased in
relation to normal market activity. This also provides
additional guidance on circumstances that may indicate that a
transaction is not orderly and requires additional disclosures.
We adopted this guidance on April 1, 2009, and the adoption
did not have an impact on our consolidated financial position,
results of operations or cash flows.
In April 2009, the FASB issued new guidance relating to
investments, which amends the
other-than-temporary
recognition guidance for debt securities and requires additional
interim and annual disclosures of
other-than-temporary
impairments on debt and equity interim securities. Pursuant to
the new guidance, an
other-than-temporary
impairment has occurred if a company does not expect to recover
the entire amortized cost basis of the security. In this
situation, if the company does not intend to sell the impaired
security, and it is not more likely than not it will be required
to sell the security before the recovery of its amortized cost
basis, the amount of the
other-than-temporary
impairment recognized in earnings is limited to the portion
attributed to the credit loss. The remaining portion of the
other-than-temporary
impairment is then recorded in other comprehensive income. We
adopted this guidance on April 1, 2009 and the adoption did
not have an impact on our consolidated financial position,
results of operations or cash flows.
In April 2009, the FASB issued new guidance relating to interim
disclosures about the fair value of financial instruments. This
guidance required disclosures about fair value of all financial
instruments for interim reporting periods. This guidance relates
to fair value disclosures for any financial instruments that are
not currently reflected in a company’s balance sheet at
fair value. Prior to the effective date of this guidance, fair
values for these assets and liabilities were only disclosed once
a year. This guidance will now require these disclosures to be
made on a quarterly basis, providing qualitative and
quantitative information about fair value estimates for all
those financial instruments not measured on the balance sheet at
fair value. We adopted this guidance on April 1, 2009 and
included the additional interim disclosure information in our
quarterly SEC filings.
In June 2009, the FASB issued new guidance on subsequent events.
This guidance provides authoritative accounting literature and
disclosure requirements for material events occurring subsequent
to the balance sheet date and prior to the issuance of the
financial statements. This guidance is effective for us for the
periods ended on and after June 30, 2009. The adoption did
not have an impact on our consolidated financial position,
results of operations or cash flows. We have reviewed and
disclosed all material subsequent events in Note 27 herein.
In June 2009, the FASB issued new guidance on transfers and
servicing, an amendment of previous authoritative guidance. The
most significant amendments resulting from this guidance consist
of the removal of the concept of a qualifying special-purpose
entity (SPE) from previous authoritative guidance, and the
elimination of the exception for qualifying SPEs from the
consolidation guidance regarding variable interest entities.
This guidance is effective for us January 1, 2010 and we
are currently assessing the impact this guidance will have on
our financial statements.
In June 2009, the FASB issued an amendment to the accounting and
disclosure requirements for transfers of financial assets. This
guidance affects the overall consolidation analysis and requires
enhanced disclosures on involvement with variable interest
entities. This guidance is effective for us January 1, 2010
and we are currently assessing the impact this guidance will
have on our financial statements.
In September 2009, the FASB issued amendments to the accounting
and disclosure for revenue recognition. This guidance will
change the accounting for revenue recognition for arrangements
with multiple deliverables and will enable entities to
separately account for individual deliverables for many more
revenue arrangements. This guidance eliminates the requirement
that all undelivered elements must have objective and reliable
evidence of fair value before a company can recognize the
portion of the overall arrangement fee that is attributable to
items that already have been delivered. As a result, the new
guidance may allow some companies to recognize revenue on
transactions that involve multiple deliverables earlier than
under current requirements. This guidance is effective for us
January 1, 2011 and we are currently assessing the impact
this guidance will have on our financial statements.
54
In January 2010, the FASB issued Accounting Standards Update
No. 2010-06,
Improving Disclosures about Fair Value Measurements. The
Update provides amendments to FASB ASC
820-10 that
require entities to disclose separately the amounts of
significant transfers in and out of Level 1 and
Level 2 fair value measurements and describe the reasons
for the transfers. In addition the Update requires entities to
present separately information about purchases, sales,
issuances, and settlements in the reconciliation for fair value
measurements using significant unobservable inputs
(Level 3). The disclosures related to Level 1 and
Level 2 fair value measurements are effective for us in
2010 and the disclosures related to Level 3 fair value
measurements are effective for us in 2011. The
Update requires new disclosures only, and will have no impact on
our consolidated financial position, results of operations or
cash flows.
ITEM 7A. QUANTITATIVE
AND QUALITATIVE DISCLOSURES ABOUT MARKET RISK
Risk Management
and Financial Instruments
Market risk represents the risk of loss that may impact our
financial position, results of operations or cash flows due to
adverse changes in financial and commodity market prices and
rates. We manage risk using derivative financial instruments for
changes in natural gas supply prices and changes in nitrogen
prices. Derivative financial instruments have credit risk and
market risk. See Note 5, Derivative Financial
Instruments, of the Notes to the Consolidated Financial
Statements included in Item 8, Financial Statements and
Supplementary Data, of this Annual Report on
Form 10-K
for additional information on the use of derivative financial
instruments.
Our policy is to avoid unnecessary risk and to limit, to the
extent practical, risks associated with operating activities.
Our management may not engage in activities that expose us to
speculative or non-operating risks and is expected to limit
risks to acceptable levels. The use of derivative financial
instruments is consistent with our overall business objectives.
Derivatives are used to manage operating risk within the limits
established by our Board of Directors, and in response to
identified exposures, provided they qualify as hedge activities.
As such, derivative financial instruments are used to manage
exposure to interest rate fluctuations, to hedge specific assets
and liabilities denominated in foreign currency, to hedge firm
commitments and forecasted natural gas purchase transactions, to
set a floor for nitrogen selling prices and to protect against
foreign exchange rate movements between different currencies
that impact revenue and earnings expressed in U.S. dollars.
The use of derivative financial instruments subjects us to some
inherent risks associated with future contractual commitments,
including market and operational risks, credit risk associated
with counterparties, product location (basis) differentials and
market liquidity. We continuously monitor the valuation of
identified risks and adjust the portfolio based on current
market conditions.
Foreign Currency
Fluctuations
Our policy is to manage risk associated with foreign currency
fluctuations by entering into forward exchange and option
contracts covering specific currency obligations or net foreign
currency operating requirements, as deemed necessary and
appropriate in each individual circumstance. Such hedging is
limited to the amounts and duration of the specific obligations
being hedged and, in the case of operating requirements, no more
than 75 percent of the forecasted requirements. The primary
currencies to which we are exposed are the Canadian dollar and
the British pound. At December 31, 2009, we had no open
forward currency positions.
Natural Gas
Prices—North American Operations
Natural gas is the principal raw material used to manufacture
nitrogen and methanol. Natural gas prices are volatile and we
mitigate some of this volatility through the use of derivative
commodity instruments. Our current policy is to hedge natural
gas provided that such arrangements would not result in costs
greater than expected selling prices for our finished products.
Estimated North American natural gas requirements for 2010 are
approximately 113 billion cubic feet (BCF). We have hedged
14 percent of our expected 2010 North American requirements
and none of our requirements beyond December 31, 2010. The
fair value of these instruments is estimated based, in part, on
quoted market prices from brokers, realized gains or losses and
our computations. These instruments and other natural gas
55
positions fixed natural gas prices at $7.7 million
(includes $8.4 million related to accumulated other
comprehensive loss) more than published prices for
December 31, 2009 forward markets. Market risk is estimated
as the potential loss in fair value resulting from a
hypothetical price change. Changes in the market value of these
derivative instruments have a high correlation to changes in the
spot price of natural gas. Based on our derivatives outstanding
at December 31, 2009 and 2008, which included swaps, basis
swaps and call options, a $1 per MMBtu increase in NYMEX would
result in a $15.6 million and $2.4 million,
respectively change or fluctuation in our natural gas cost.
Natural Gas
Prices—Trinidad Operation
The natural gas requirements of Point Lisas Nitrogen Limited are
supplied under contract until 2018 with the Natural Gas Company
of Trinidad and Tobago. The cost of natural gas to the joint
venture fluctuates based on changes in the market price of
ammonia.
Seasonality and
Volatility
The fertilizer business is highly seasonal, based upon the
planting, growing and harvesting cycles. Nitrogen fertilizer
inventories must be accumulated to permit uninterrupted customer
deliveries and require significant storage capacity. This
seasonality generally results in higher fertilizer prices during
peak consumption periods, with prices normally reaching their
highest point in the spring, decreasing in the summer, and
increasing again in the late fall/early winter period as
depleted inventories are restored.
Nitrogen fertilizer prices can also be volatile as a result of a
number of other factors. The most important of these factors are:
|
|
|
|
| |
§
|
Weather patterns and field conditions (particularly during
periods of high fertilizer consumption);
|
|
| |
| |
§
|
Quantities of fertilizers imported to primary markets;
|
|
| |
| |
§
|
Current and projected grain inventories and prices, which are
heavily influenced by U.S. exports, worldwide grain
markets, and domestic demand (food, feed and biofuel); and
|
|
| |
| |
§
|
Price fluctuations in natural gas, the principal raw material
used to produce nitrogen fertilizer.
|
|
Governmental policies may directly or indirectly influence the
number of acres planted, the level of grain inventories, the mix
of crops planted, crop prices and environmental demand.
Nitrogen
Prices
The prices for nitrogen products can be volatile and from time
to time we mitigate some of this volatility through the use of
derivative commodity instruments. We have not hedged any of our
2010 North American sales.
Interest Rate
Fluctuations
The table below provides information about our financial
instruments that are sensitive to changes in interest rates. For
debt obligations, the table presents principal cash flows and
related weighted average interest rates by expected maturity
dates. We had no interest rate financial derivatives outstanding
at December 31, 2009. We had no short-term borrowings under
our revolving credit facilities at December 31, 2009.
Interest Rate
Sensitivity
| |
|
|
|
|
|
|
|
|
|
|
|
|
|
|
|
|
|
|
|
|
|
|
|
|
|
|
|
|
|
|
|
|
|
(in millions)
|
|
Expected Maturity Date
|
|
|
|
|
|
|
|
2010
|
|
|
2011
|
|
|
2012
|
|
|
2013
|
|
|
2014
|
|
|
Thereafter
|
|
|
Total
|
|
|
Fair Value
|
|
|
|
|
|
|
|
Long-Term Debt
|
|
|
|
|
|
|
|
|
|
|
|
|
|
|
|
|
|
|
|
|
|
|
|
|
|
|
|
|
|
|
|
|
|
Senior Unsecured Notes fixed rate of 7.75% ($US)
|
|
$
|
—
|
|
|
$
|
—
|
|
|
$
|
—
|
|
|
$
|
—
|
|
|
$
|
—
|
|
|
$
|
600.0
|
|
|
$
|
600.0
|
|
|
$
|
639.7
|
|
|
|
|
|
|
Senior Unsecured Notes fixed rate of 7.00% ($US)
|
|
$
|
—
|
|
|
$
|
—
|
|
|
$
|
—
|
|
|
$
|
—
|
|
|
$
|
—
|
|
|
$
|
12.5
|
|
|
$
|
12.5
|
|
|
$
|
12.9
|
|
|
|
|
|
56
ITEM 8. FINANCIAL
STATEMENTS AND SUPPLEMENTARY DATA
Our management is responsible for the preparation, integrity and
objectivity of the accompanying consolidated financial
statements and the related financial information. The
consolidated financial statements have been prepared in
conformity with accounting principles generally accepted in the
United States of America and necessarily include certain amounts
that are based on estimates and informed judgments. Our
management also prepared the related financial information
included in this Annual Report on
Form 10-K
and is responsible for its accuracy and consistency with the
consolidated financial statements.
The accompanying consolidated financial statements have been
audited by Deloitte & Touche LLP, an independent
registered public accounting firm, who conducted its audits in
accordance with the standards of the Public Company Accounting
Oversight Board. The independent registered public accounting
firm’s responsibility is to express an opinion as to the
fairness with which such financial statements present our
financial position, results of operations and cash flows in
accordance with accounting principles generally accepted in the
United States.
57
Report of
Independent Registered Public Accounting Firm
To the Board of Directors and Stockholders of Terra Industries
Inc.:
We have audited the accompanying consolidated statements of
financial position of Terra Industries Inc. and subsidiaries
(the Company) as of December 31, 2009 and 2008, and the
related consolidated statements of operations, statements of
changes in common stockholders’ equity, and statements of
cash flows for each of the three years in the period ended
December 31, 2009. Our audits also included the financial
statement schedule listed in the Index at Item 15. These
financial statements and financial statement schedule are the
responsibility of the Company’s management. Our
responsibility is to express an opinion on the financial
statements and the financial statement schedule based on our
audits.
We conducted our audits in accordance with the standards of the
Public Company Accounting Oversight Board (United States). Those
standards require that we plan and perform the audit to obtain
reasonable assurance about whether the financial statements are
free of material misstatement. An audit includes examining, on a
test basis, evidence supporting the amounts and disclosures in
the financial statements. An audit also includes assessing the
accounting principles used and significant estimates made by
management, as well as evaluating the overall financial
statement presentation. We believe that our audits provide a
reasonable basis for our opinion.
In our opinion, such consolidated financial statements present
fairly, in all material respects, the financial position of
Terra Industries Inc. and subsidiaries at December 31, 2009
and 2008, and the results of their operations and their cash
flows for each of the three years in the period ended
December 31, 2009, in conformity with accounting principles
generally accepted in the United States of America. Also, in our
opinion, such financial statement schedule, when considered in
relation to the basic consolidated financial statements taken as
a whole, presents fairly, in all material respects, the
information set forth therein.
As discussed in Note 1 to the consolidated financial
statements, the accompanying financial statements have been
retrospectively adjusted for the adoption of consolidation
guidance issued by the Financial Accounting Standards Board
related to noncontrolling interests in consolidated financial
statements effective January 1, 2009.
We have also audited, in accordance with the standards of the
Public Company Accounting Oversight Board (United States), the
Company’s internal control over financial reporting as of
December 31, 2009, based on the criteria established in
Internal Control—Integrated Framework issued by the
Committee of Sponsoring Organizations of the Treadway Commission
and our report dated February 25, 2010, expressed an
unqualified opinion on the Company’s internal control over
financial reporting.
Omaha, Nebraska
February 25, 2010
58
Consolidated
Statements of Financial Position
| |
|
|
|
|
|
|
|
|
|
|
|
At December 31,
|
|
|
(in thousands)
|
|
2009
|
|
|
2008
|
|
|
|
|
|
|
|
Assets
|
|
|
|
|
|
|
|
|
|
Cash and cash equivalents
|
|
$
|
501,310
|
|
|
$
|
966,700
|
|
|
Accounts receivable, less allowance for
doubtful accounts of $1,403 and $290
|
|
|
100,216
|
|
|
|
130,390
|
|
|
Inventories, net
|
|
|
137,073
|
|
|
|
197,091
|
|
|
Margin deposits with derivative counterparties
|
|
|
—
|
|
|
|
36,945
|
|
|
Other current assets
|
|
|
87,703
|
|
|
|
61,338
|
|
|
|
|
|
|
Total current assets
|
|
|
826,302
|
|
|
|
1,392,464
|
|
|
|
|
|
|
Property, plant and equipment, net
|
|
|
456,702
|
|
|
|
403,313
|
|
|
Equity method investments
|
|
|
258,860
|
|
|
|
270,915
|
|
|
Deferred plant turnaround costs, net
|
|
|
25,011
|
|
|
|
23,467
|
|
|
Other assets
|
|
|
32,868
|
|
|
|
22,858
|
|
|
|
|
|
|
Total assets
|
|
$
|
1,599,743
|
|
|
$
|
2,113,017
|
|
|
|
|
|
|
|
|
|
|
|
|
|
|
|
|
Liabilities
|
|
|
|
|
|
|
|
|
|
Accounts payable
|
|
$
|
87,898
|
|
|
$
|
99,893
|
|
|
Customer prepayments
|
|
|
39,238
|
|
|
|
111,592
|
|
|
Derivative hedge liabilities
|
|
|
281
|
|
|
|
125,925
|
|
|
Accrued and other current liabilities
|
|
|
78,792
|
|
|
|
127,770
|
|
|
|
|
|
|
Total current liabilities
|
|
|
206,209
|
|
|
|
465,180
|
|
|
|
|
|
|
Long-term debt
|
|
|
602,434
|
|
|
|
330,000
|
|
|
Deferred taxes
|
|
|
76,819
|
|
|
|
61,443
|
|
|
Pension liabilities
|
|
|
27,521
|
|
|
|
9,170
|
|
|
Other liabilities
|
|
|
101,126
|
|
|
|
78,553
|
|
|
|
|
|
|
Total liabilities
|
|
|
1,014,109
|
|
|
|
944,346
|
|
|
|
|
|
|
|
|
|
|
|
|
|
|
|
|
Commitments and contingencies (Note 13)
|
|
|
—
|
|
|
|
—
|
|
|
|
|
|
|
|
|
|
|
|
|
Preferred Shares—liquidation value of $500 and $1,600
|
|
|
483
|
|
|
|
1,544
|
|
|
|
|
|
|
|
|
|
|
|
|
Common Stockholders’ Equity
|
|
|
|
|
|
|
|
|
|
Capital stock
|
|
|
|
|
|
|
|
|
|
Common Shares, authorized 133,500 shares;
99,841 and 99,330 shares outstanding
|
|
|
152,802
|
|
|
|
152,111
|
|
|
Paid-in capital
|
|
|
446,078
|
|
|
|
579,164
|
|
|
Accumulated other comprehensive loss
|
|
|
(120,362
|
)
|
|
|
(175,529
|
)
|
|
Retained earnings
|
|
|
12,219
|
|
|
|
507,299
|
|
|
|
|
|
|
Total common stockholders’ equity
|
|
|
490,737
|
|
|
|
1,063,045
|
|
|
Noncontrolling interest
|
|
|
94,414
|
|
|
|
104,082
|
|
|
|
|
|
|
Total equity
|
|
|
585,151
|
|
|
|
1,167,127
|
|
|
|
|
|
|
Total liabilities and equity
|
|
$
|
1,599,743
|
|
|
$
|
2,113,017
|
|
|
|
|
|
See accompanying Notes to the
Consolidated Financial Statements
59
Consolidated
Statements of Operations
| |
|
|
|
|
|
|
|
|
|
|
|
|
|
|
|
Year ended December 31,
|
|
|
(in thousands, except per-share
amounts)
|
|
2009
|
|
|
2008
|
|
|
2007
|
|
|
|
|
|
|
|
Product revenues
|
|
$
|
1,576,528
|
|
|
$
|
2,880,255
|
|
|
$
|
2,335,874
|
|
|
Other income
|
|
|
4,904
|
|
|
|
11,224
|
|
|
|
7,055
|
|
|
|
|
|
|
Total Revenue
|
|
|
1,581,432
|
|
|
|
2,891,479
|
|
|
|
2,342,929
|
|
|
|
|
|
|
Cost and Expenses
|
|
|
|
|
|
|
|
|
|
|
|
|
|
Cost of sales
|
|
|
1,195,176
|
|
|
|
2,028,252
|
|
|
|
1,815,421
|
|
|
Selling, general and administrative expenses
|
|
|
67,137
|
|
|
|
70,736
|
|
|
|
91,971
|
|
|
Other operating expenses
|
|
|
18,000
|
|
|
|
—
|
|
|
|
—
|
|
|
Equity in earnings of North American affiliates
|
|
|
(17,702
|
)
|
|
|
(56,237
|
)
|
|
|
(16,209
|
)
|
|
|
|
|
|
|
|
|
1,262,611
|
|
|
|
2,042,751
|
|
|
|
1,891,183
|
|
|
|
|
|
|
Income from operations
|
|
|
318,821
|
|
|
|
848,728
|
|
|
|
451,746
|
|
|
Interest income
|
|
|
4,136
|
|
|
|
23,370
|
|
|
|
17,262
|
|
|
Interest expense
|
|
|
(31,860
|
)
|
|
|
(27,369
|
)
|
|
|
(29,100
|
)
|
|
Loss on early retirement of debt
|
|
|
(53,476
|
)
|
|
|
—
|
|
|
|
(38,836
|
)
|
|
|
|
|
|
Income before income taxes, noncontrolling interest
and equity earnings (loss) of GrowHow UK Limited
|
|
|
237,621
|
|
|
|
844,729
|
|
|
|
401,072
|
|
|
Income tax provision
|
|
|
(74,299
|
)
|
|
|
(239,851
|
)
|
|
|
(127,316
|
)
|
|
Equity earnings (loss) of GrowHow UK Limited
|
|
|
14,177
|
|
|
|
95,578
|
|
|
|
(2,718
|
)
|
|
|
|
|
|
Income from continuing operations, net of tax
|
|
|
177,499
|
|
|
|
700,456
|
|
|
|
271,038
|
|
|
Income (loss) from discontinued operations,
net of tax
|
|
|
1,118
|
|
|
|
8,269
|
|
|
|
(18,861
|
)
|
|
|
|
|
|
Net income
|
|
|
178,617
|
|
|
|
708,725
|
|
|
|
252,177
|
|
|
Less: Net income attributable to the noncontrolling interest
|
|
|
25,984
|
|
|
|
67,684
|
|
|
|
50,281
|
|
|
|
|
|
|
Net income attributable to Terra Industries Inc.
|
|
$
|
152,633
|
|
|
$
|
641,041
|
|
|
$
|
201,896
|
|
|
|
|
|
|
|
|
|
|
|
|
|
|
|
|
|
|
|
|
Amounts attributable to Terra Industries Inc. common
stockholders:
|
|
|
|
|
|
|
|
|
|
|
|
|
|
Income from continuing operations, net of tax
|
|
$
|
151,515
|
|
|
$
|
632,772
|
|
|
$
|
220,757
|
|
|
Income (loss) from discontinued operations, net of tax
|
|
|
1,118
|
|
|
|
8,269
|
|
|
|
(18,861
|
)
|
|
Less: Inducement payment of preferred stock conversion
|
|
|
—
|
|
|
|
5,266
|
|
|
|
—
|
|
|
Less: Preferred share dividends
|
|
|
56
|
|
|
|
3,876
|
|
|
|
5,100
|
|
|
|
|
|
|
Net income attributable to Terra Industries Inc.
common stockholders
|
|
$
|
152,577
|
|
|
$
|
631,899
|
|
|
$
|
196,796
|
|
|
|
|
|
|
|
|
|
|
|
|
|
|
|
|
|
|
|
|
Basic income per common share attributable to
Terra Industries Inc. common stockholders:
|
|
|
|
|
|
|
|
|
|
|
|
|
|
Continuing operations
|
|
$
|
1.53
|
|
|
$
|
6.65
|
|
|
$
|
2.38
|
|
|
Discontinued operations
|
|
|
0.01
|
|
|
|
0.09
|
|
|
|
(0.21
|
)
|
|
|
|
|
|
Earnings per share
|
|
$
|
1.54
|
|
|
$
|
6.74
|
|
|
$
|
2.17
|
|
|
|
|
|
|
|
|
|
|
|
|
|
|
|
|
|
|
|
|
Diluted income per common share attributable to
Terra Industries Inc. common stockholders:
|
|
|
|
|
|
|
|
|
|
|
|
|
|
Continuing operations
|
|
$
|
1.52
|
|
|
$
|
6.12
|
|
|
$
|
2.07
|
|
|
Discontinued operations
|
|
|
0.01
|
|
|
|
0.08
|
|
|
|
(0.17
|
)
|
|
|
|
|
|
Earnings per share
|
|
$
|
1.53
|
|
|
$
|
6.20
|
|
|
$
|
1.90
|
|
|
|
|
|
|
|
|
|
|
|
|
|
|
|
|
|
|
|
|
Weighted Average Shares Outstanding:
|
|
|
|
|
|
|
|
|
|
|
|
|
|
Basic
|
|
|
99,386
|
|
|
|
93,827
|
|
|
|
90,575
|
|
|
Diluted
|
|
|
99,992
|
|
|
|
103,359
|
|
|
|
106,454
|
|
See accompanying Notes to the
Consolidated Financial Statements
60
Consolidated
Statements of Cash Flows
| |
|
|
|
|
|
|
|
|
|
|
|
|
|
|
|
Year ended December 31,
|
|
|
(in thousands)
|
|
2009
|
|
|
2008
|
|
|
2007
|
|
|
|
|
|
|
|
Operating Activities
|
|
|
|
|
|
|
|
|
|
|
|
|
|
Net income
|
|
$
|
178,617
|
|
|
$
|
708,725
|
|
|
$
|
252,177
|
|
|
Income (loss) from discontinued operations, net of tax
|
|
|
1,118
|
|
|
|
8,269
|
|
|
|
(18,861
|
)
|
|
|
|
|
|
Income from continuing operations, net of tax
|
|
|
177,499
|
|
|
|
700,456
|
|
|
|
271,038
|
|
|
Adjustments to reconcile income from continuing operations
to net cash flows from operating activities:
|
|
|
|
|
|
|
|
|
|
|
|
|
|
Depreciation of property, plant and equipment and amortization
of deferred plant turnaround costs
|
|
|
84,840
|
|
|
|
78,854
|
|
|
|
94,784
|
|
|
Loss on sale of property, plant and equipment
|
|
|
827
|
|
|
|
2,321
|
|
|
|
—
|
|
|
Deferred income taxes
|
|
|
(18,236
|
)
|
|
|
(15,180
|
)
|
|
|
103,400
|
|
|
Distributions in excess of equity earnings
of North American affiliates
|
|
|
4,074
|
|
|
|
8,343
|
|
|
|
8,536
|
|
|
Equity (earnings) loss of GrowHow UK Limited
|
|
|
(14,177
|
)
|
|
|
(95,578
|
)
|
|
|
2,718
|
|
|
Non-cash loss on derivatives
|
|
|
675
|
|
|
|
39,779
|
|
|
|
1,300
|
|
|
Share-based compensation
|
|
|
16,174
|
|
|
|
8,104
|
|
|
|
28,102
|
|
|
Amortization of intangible and other assets
|
|
|
9,719
|
|
|
|
8,705
|
|
|
|
6,954
|
|
|
Non-cash loss on early retirement of debt
|
|
|
4,546
|
|
|
|
—
|
|
|
|
4,662
|
|
|
Change in operating assets and liabilities:
|
|
|
|
|
|
|
|
|
|
|
|
|
|
Accounts receivable
|
|
|
27,874
|
|
|
|
36,310
|
|
|
|
(38,180
|
)
|
|
Inventories
|
|
|
65,036
|
|
|
|
(71,422
|
)
|
|
|
45,772
|
|
|
Accounts payable and customer prepayments
|
|
|
(87,584
|
)
|
|
|
(197,452
|
)
|
|
|
218,081
|
|
|
Margin deposits with derivative counterparties
|
|
|
36,945
|
|
|
|
(36,307
|
)
|
|
|
(601
|
)
|
|
Derivative hedge liabilities
|
|
|
(125,644
|
)
|
|
|
111,192
|
|
|
|
(7,858
|
)
|
|
Other assets and liabilities, net
|
|
|
20,435
|
|
|
|
(103,142
|
)
|
|
|
(4,924
|
)
|
|
|
|
|
|
Net cash flows from operating
activities – continuing operations
|
|
|
203,003
|
|
|
|
474,983
|
|
|
|
733,784
|
|
|
Net cash flows from operating
activities – discontinued operations
|
|
|
1,118
|
|
|
|
8,161
|
|
|
|
14,081
|
|
|
|
|
|
|
Net Cash Flows from Operating Activities
|
|
|
204,121
|
|
|
|
483,144
|
|
|
|
747,865
|
|
|
|
|
|
|
Investing Activities
|
|
|
|
|
|
|
|
|
|
|
|
|
|
Capital expenditures and plant turnaround expenditures
|
|
|
(133,934
|
)
|
|
|
(89,307
|
)
|
|
|
(82,376
|
)
|
|
Proceeds from the sale of property, plant and equipment
|
|
|
188
|
|
|
|
2,073
|
|
|
|
24
|
|
|
Distributions received from North American affiliates
|
|
|
14,049
|
|
|
|
8,180
|
|
|
|
4,705
|
|
|
Cash retained by GrowHow UK Limited
|
|
|
—
|
|
|
|
—
|
|
|
|
(16,788
|
)
|
|
Contribution settlement received from GrowHow UK Limited
|
|
|
—
|
|
|
|
27,427
|
|
|
|
—
|
|
|
Balancing consideration and other payments from GrowHow UK
Limited
|
|
|
21,205
|
|
|
|
61,272
|
|
|
|
—
|
|
|
|
|
|
|
Net cash flows from investing
activities – continued operations
|
|
|
(98,492
|
)
|
|
|
9,645
|
|
|
|
(94,435
|
)
|
|
Net cash flows from investing
activities – discontinued operations
|
|
|
5,356
|
|
|
|
41,879
|
|
|
|
—
|
|
|
|
|
|
|
Net Cash Flows from Investing Activities
|
|
|
(93,136
|
)
|
|
|
51,524
|
|
|
|
(94,435
|
)
|
|
|
|
|
|
Financing Activities
|
|
|
|
|
|
|
|
|
|
|
|
|
|
Issuance of debt
|
|
|
589,788
|
|
|
|
—
|
|
|
|
330,000
|
|
|
Payments under borrowing arrangements
|
|
|
(317,475
|
)
|
|
|
—
|
|
|
|
(331,300
|
)
|
|
Payments for debt issuance costs
|
|
|
(14,360
|
)
|
|
|
—
|
|
|
|
(6,444
|
)
|
61
Consolidated
Statements of Cash Flows (continued)
| |
|
|
|
|
|
|
|
|
|
|
|
|
|
|
|
Year ended December 31,
|
|
|
(in thousands)
|
|
2009
|
|
|
2008
|
|
|
2007
|
|
|
|
|
|
|
|
Preferred share dividends paid
|
|
|
(56
|
)
|
|
|
(3,876
|
)
|
|
|
(5,100
|
)
|
|
Inducement payment to preferred stockholders
|
|
|
—
|
|
|
|
(5,266
|
)
|
|
|
—
|
|
|
Common stock dividends paid
|
|
|
(788,588
|
)
|
|
|
(28,274
|
)
|
|
|
—
|
|
|
Common stock issuances and vestings
|
|
|
(6,642
|
)
|
|
|
(9,839
|
)
|
|
|
(1,424
|
)
|
|
Excess tax benefits from equity compensation plans
|
|
|
6,304
|
|
|
|
12,122
|
|
|
|
3,317
|
|
|
Payments under share repurchase program
|
|
|
—
|
|
|
|
(157,500
|
)
|
|
|
(87,426
|
)
|
|
Distribution to noncontrolling interests
|
|
|
(41,149
|
)
|
|
|
(69,557
|
)
|
|
|
(35,239
|
)
|
|
|
|
|
|
Net Cash Flows from Financing Activities
|
|
|
(572,178
|
)
|
|
|
(262,190
|
)
|
|
|
(133,616
|
)
|
|
|
|
|
|
Effect of Exchange Rate Changes on Cash
|
|
|
(4,197
|
)
|
|
|
(4,016
|
)
|
|
|
(593
|
)
|
|
|
|
|
|
(Decrease) Increase in Cash and Cash Equivalents
|
|
|
(465,390
|
)
|
|
|
268,462
|
|
|
|
519,221
|
|
|
Cash and Cash Equivalents at Beginning of Year
|
|
|
966,700
|
|
|
|
698,238
|
|
|
|
179,017
|
|
|
|
|
|
|
Cash and Cash Equivalents at End of Year
|
|
$
|
501,310
|
|
|
$
|
966,700
|
|
|
$
|
698,238
|
|
|
|
|
|
|
Supplemental cash flow information:
|
|
|
|
|
|
|
|
|
|
|
|
|
|
Interest paid
|
|
$
|
29,625
|
|
|
$
|
24,256
|
|
|
$
|
23,200
|
|
|
Income tax refunds received
|
|
|
3,774
|
|
|
|
1,455
|
|
|
|
558
|
|
|
Income taxes paid
|
|
|
146,048
|
|
|
|
200,528
|
|
|
|
22,697
|
|
|
Supplemental schedule of non-cash investing and
financing activities:
|
|
|
|
|
|
|
|
|
|
|
|
|
|
Conversion of warrants to common stock
|
|
$
|
—
|
|
|
$
|
2,496
|
|
|
$
|
568
|
|
|
Conversion of preferred shares to common stock
|
|
|
1,061
|
|
|
|
114,256
|
|
|
|
—
|
|
|
Terra Nitrogen U.K. contributed for equity investment
|
|
|
—
|
|
|
|
—
|
|
|
|
213,235
|
|
|
Supplemental schedule of unconsolidated affiliates
distributions:
|
|
|
|
|
|
|
|
|
|
|
|
|
|
Distributions received from North American affiliates
|
|
$
|
35,825
|
|
|
$
|
72,760
|
|
|
$
|
29,450
|
|
|
Contribution settlement payments, balancing consideration
and other payments received from GrowHow UK Limited
|
|
|
21,205
|
|
|
|
88,699
|
|
|
|
—
|
|
|
|
|
|
|
Total Cash Received from Unconsolidated Affiliates
|
|
$
|
57,030
|
|
|
$
|
161,459
|
|
|
$
|
29,450
|
|
|
|
|
|
See accompanying Notes to the
Consolidated Financial Statements
62
Statements of
Changes in Common Stockholders’ Equity
| |
|
|
|
|
|
|
|
|
|
|
|
|
|
|
|
|
|
|
|
|
|
|
|
|
|
|
|
|
|
|
|
|
|
|
|
|
|
|
|
|
|
|
|
|
|
|
|
Accumulated
|
|
|
|
|
|
(Accumulated
|
|
|
|
|
|
|
|
|
|
|
|
|
|
|
|
|
|
|
|
Other
|
|
|
|
|
|
Deficit)
|
|
|
|
|
|
|
|
|
|
|
Common Stock
|
|
|
Paid-In
|
|
|
Comprehensive
|
|
|
Noncontrolling
|
|
|
Retained
|
|
|
|
|
|
Comprehensive
|
|
|
(in thousands)
|
|
Shares
|
|
|
Amount
|
|
|
Capital
|
|
|
Loss
|
|
|
Interest
|
|
|
Earnings
|
|
|
Total
|
|
|
Income
|
|
|
|
|
|
|
January 1, 2007
|
|
|
92,630
|
|
|
$
|
144,976
|
|
|
$
|
693,896
|
|
|
$
|
(63,739
|
)
|
|
$
|
94,687
|
|
|
$
|
(292,137
|
)
|
|
$
|
577,683
|
|
|
|
|
|
|
|
|
|
|
|
|
|
|
|
|
|
|
|
|
|
|
|
|
|
|
|
|
|
|
|
|
|
|
|
|
|
|
|
|
Comprehensive Income:
|
|
|
|
|
|
|
|
|
|
|
|
|
|
|
|
|
|
|
|
|
|
|
|
|
|
|
|
|
|
|
|
|
|
Net income
|
|
|
—
|
|
|
|
—
|
|
|
|
—
|
|
|
|
—
|
|
|
|
50,281
|
|
|
|
201,896
|
|
|
|
252,177
|
|
|
$
|
252,177
|
|
|
Foreign currency translation adjustments
|
|
|
—
|
|
|
|
—
|
|
|
|
—
|
|
|
|
(46,882
|
)
|
|
|
—
|
|
|
|
—
|
|
|
|
(46,882
|
)
|
|
|
(46,882
|
)
|
|
Change in fair value of derivatives, net of taxes of $3,351
|
|
|
—
|
|
|
|
—
|
|
|
|
—
|
|
|
|
7,372
|
|
|
|
(1,148
|
)
|
|
|
—
|
|
|
|
6,224
|
|
|
|
6,224
|
|
|
Pension and post-retirement benefit liabilities, net of taxes of
$8,599
|
|
|
—
|
|
|
|
—
|
|
|
|
—
|
|
|
|
15,797
|
|
|
|
—
|
|
|
|
—
|
|
|
|
15,797
|
|
|
|
15,797
|
|
|
|
|
|
|
|
|
|
|
|
|
|
|
|
|
|
|
|
|
|
|
|
|
|
|
|
|
|
|
|
|
|
|
|
|
Transfer of U.K. pension plan to GrowHow UK Limited
|
|
|
—
|
|
|
|
—
|
|
|
|
—
|
|
|
|
43,272
|
|
|
|
—
|
|
|
|
—
|
|
|
|
43,272
|
|
|
|
|
|
|
Comprehensive income
|
|
|
|
|
|
|
|
|
|
|
|
|
|
|
|
|
|
|
|
|
|
|
|
|
|
|
|
|
|
|
227,316
|
|
|
Comprehensive income attributable to noncontrolling interest
|
|
|
|
|
|
|
|
|
|
|
|
|
|
|
|
|
|
|
|
|
|
|
|
|
|
|
|
|
|
|
(49,133
|
)
|
|
|
|
|
|
|
|
|
|
|
|
|
|
|
|
|
|
|
|
|
|
|
|
|
|
|
|
|
|
|
|
|
|
|
|
Comprehensive income attributable to Terra Industries Inc.
|
|
|
|
|
|
|
|
|
|
|
|
|
|
|
|
|
|
|
|
|
|
|
|
|
|
|
|
|
|
$
|
178,183
|
|
|
|
|
|
|
|
|
|
|
|
|
|
|
|
|
|
|
|
|
|
|
|
|
|
|
|
|
|
|
|
|
|
|
|
|
Distributions to noncontrolling interest
|
|
|
—
|
|
|
|
—
|
|
|
|
—
|
|
|
|
—
|
|
|
|
(35,239
|
)
|
|
|
—
|
|
|
|
(35,239
|
)
|
|
|
|
|
|
Preferred share dividends
|
|
|
—
|
|
|
|
—
|
|
|
|
—
|
|
|
|
—
|
|
|
|
—
|
|
|
|
(5,100
|
)
|
|
|
(5,100
|
)
|
|
|
|
|
|
Exercise of stock options
|
|
|
336
|
|
|
|
336
|
|
|
|
786
|
|
|
|
—
|
|
|
|
—
|
|
|
|
—
|
|
|
|
1,122
|
|
|
|
|
|
|
Net vested stock
|
|
|
53
|
|
|
|
290
|
|
|
|
(2,836
|
)
|
|
|
—
|
|
|
|
—
|
|
|
|
—
|
|
|
|
(2,546
|
)
|
|
|
|
|
|
Net conversion of warrants
|
|
|
568
|
|
|
|
568
|
|
|
|
(568
|
)
|
|
|
—
|
|
|
|
—
|
|
|
|
—
|
|
|
|
—
|
|
|
|
|
|
|
Shares purchased and retired under share repurchase program
|
|
|
(4,000
|
)
|
|
|
(4,000
|
)
|
|
|
(83,426
|
)
|
|
|
—
|
|
|
|
—
|
|
|
|
—
|
|
|
|
(87,426
|
)
|
|
|
|
|
|
Share-based compensation
|
|
|
—
|
|
|
|
—
|
|
|
|
11,022
|
|
|
|
—
|
|
|
|
—
|
|
|
|
—
|
|
|
|
11,022
|
|
|
|
|
|
|
|
|
|
|
|
|
|
|
|
|
|
|
|
|
|
|
|
|
|
|
|
|
|
|
|
|
|
|
|
|
|
|
|
|
December 31, 2007
|
|
|
89,587
|
|
|
$
|
142,170
|
|
|
$
|
618,874
|
|
|
$
|
(44,180
|
)
|
|
$
|
108,581
|
|
|
$
|
(95,341
|
)
|
|
$
|
730,104
|
|
|
|
|
|
|
|
|
|
|
|
|
|
|
|
|
|
63
Statements of
Changes in Common Stockholders’ Equity
(cont’d)
| |
|
|
|
|
|
|
|
|
|
|
|
|
|
|
|
|
|
|
|
|
|
|
|
|
|
|
|
|
|
|
|
|
|
|
|
|
|
|
|
|
|
|
|
|
|
|
|
Accumulated
|
|
|
|
|
|
(Accumulated
|
|
|
|
|
|
|
|
|
|
|
|
|
|
|
|
|
|
|
|
Other
|
|
|
|
|
|
Deficit)
|
|
|
|
|
|
|
|
|
|
|
Common Stock
|
|
|
Paid-In
|
|
|
Comprehensive
|
|
|
Noncontrolling
|
|
|
Retained
|
|
|
|
|
|
Comprehensive
|
|
|
(in thousands)
|
|
Shares
|
|
|
Amount
|
|
|
Capital
|
|
|
Loss
|
|
|
Interest
|
|
|
Earnings
|
|
|
Total
|
|
|
Income
|
|
|
|
|
|
|
January 1, 2008
|
|
|
89,587
|
|
|
$
|
142,170
|
|
|
$
|
618,874
|
|
|
$
|
(44,180
|
)
|
|
$
|
108,581
|
|
|
$
|
(95,341
|
)
|
|
$
|
730,104
|
|
|
|
|
|
|
|
|
|
|
|
|
|
|
|
|
|
|
|
|
|
|
|
|
|
|
|
|
|
|
|
|
|
|
|
|
|
|
|
|
Comprehensive Income:
|
|
|
|
|
|
|
|
|
|
|
|
|
|
|
|
|
|
|
|
|
|
|
|
|
|
|
|
|
|
|
|
|
|
Net income
|
|
|
—
|
|
|
|
—
|
|
|
|
—
|
|
|
|
—
|
|
|
|
67,684
|
|
|
|
641,041
|
|
|
|
708,725
|
|
|
$
|
708,725
|
|
|
Foreign currency translation adjustments
|
|
|
—
|
|
|
|
—
|
|
|
|
—
|
|
|
|
(98,308
|
)
|
|
|
—
|
|
|
|
—
|
|
|
|
(98,308
|
)
|
|
|
(98,308
|
)
|
|
Change in fair value of derivatives, net of taxes of ($22,157)
|
|
|
—
|
|
|
|
—
|
|
|
|
—
|
|
|
|
(31,861
|
)
|
|
|
(2,626
|
)
|
|
|
—
|
|
|
|
(34,487
|
)
|
|
|
(34,487
|
)
|
|
Pension and post-retirement benefit liabilities, net of taxes of
($1,947)
|
|
|
—
|
|
|
|
—
|
|
|
|
—
|
|
|
|
(1,180
|
)
|
|
|
—
|
|
|
|
—
|
|
|
|
(1,180
|
)
|
|
|
(1,180
|
)
|
|
|
|
|
|
|
|
|
|
|
|
|
|
|
|
|
|
|
|
|
|
|
|
|
|
|
|
|
|
|
|
|
|
|
|
Comprehensive income
|
|
|
|
|
|
|
|
|
|
|
|
|
|
|
|
|
|
|
|
|
|
|
|
|
|
|
|
|
|
|
574,750
|
|
|
Comprehensive income attributable to noncontrolling interest
|
|
|
|
|
|
|
|
|
|
|
|
|
|
|
|
|
|
|
|
|
|
|
|
|
|
|
|
|
|
|
(65,058
|
)
|
|
|
|
|
|
|
|
|
|
|
|
|
|
|
|
|
|
|
|
|
|
|
|
|
|
|
|
|
|
|
|
|
|
|
|
Comprehensive income attributable to Terra Industries Inc.
|
|
|
|
|
|
|
|
|
|
|
|
|
|
|
|
|
|
|
|
|
|
|
|
|
|
|
|
|
|
$
|
509,692
|
|
|
|
|
|
|
|
|
|
|
|
|
|
|
|
|
|
|
|
|
|
|
|
|
|
|
|
|
|
|
|
|
|
|
|
|
Distribution to noncontrolling interest
|
|
|
—
|
|
|
|
—
|
|
|
|
—
|
|
|
|
—
|
|
|
|
(69,557
|
)
|
|
|
—
|
|
|
|
(69,557
|
)
|
|
|
|
|
|
Preferred share dividends
|
|
|
—
|
|
|
|
—
|
|
|
|
—
|
|
|
|
—
|
|
|
|
—
|
|
|
|
(3,876
|
)
|
|
|
(3,876
|
)
|
|
|
|
|
|
Common stock dividends
|
|
|
—
|
|
|
|
—
|
|
|
|
—
|
|
|
|
—
|
|
|
|
—
|
|
|
|
(28,274
|
)
|
|
|
(28,274
|
)
|
|
|
|
|
|
Excess tax benefit
|
|
|
—
|
|
|
|
—
|
|
|
|
14,603
|
|
|
|
—
|
|
|
|
—
|
|
|
|
—
|
|
|
|
14,603
|
|
|
|
|
|
|
Exercise of stock options
|
|
|
11
|
|
|
|
11
|
|
|
|
23
|
|
|
|
—
|
|
|
|
—
|
|
|
|
—
|
|
|
|
34
|
|
|
|
|
|
|
Net vested stock
|
|
|
277
|
|
|
|
475
|
|
|
|
(12,897
|
)
|
|
|
—
|
|
|
|
—
|
|
|
|
—
|
|
|
|
(12,422
|
)
|
|
|
|
|
|
Net conversion of warrants
|
|
|
2,961
|
|
|
|
2,961
|
|
|
|
(413
|
)
|
|
|
—
|
|
|
|
—
|
|
|
|
—
|
|
|
|
2,548
|
|
|
|
|
|
|
Inducement of preferred stock
|
|
|
11,887
|
|
|
|
11,887
|
|
|
|
102,368
|
|
|
|
—
|
|
|
|
—
|
|
|
|
(5,266
|
)
|
|
|
108,989
|
|
|
|
|
|
|
Shares purchased and retired under the share repurchase program
|
|
|
(5,393
|
)
|
|
|
(5,393
|
)
|
|
|
(152,107
|
)
|
|
|
—
|
|
|
|
—
|
|
|
|
—
|
|
|
|
(157,500
|
)
|
|
|
|
|
|
Share-based compensation
|
|
|
—
|
|
|
|
—
|
|
|
|
8,713
|
|
|
|
—
|
|
|
|
—
|
|
|
|
—
|
|
|
|
8,713
|
|
|
|
|
|
|
Adoption of SFAS 158 measurement to date
|
|
|
—
|
|
|
|
—
|
|
|
|
—
|
|
|
|
—
|
|
|
|
—
|
|
|
|
(985
|
)
|
|
|
(985
|
)
|
|
|
|
|
|
|
|
|
|
|
|
|
|
|
|
|
|
|
|
|
|
|
|
|
|
|
|
|
|
|
|
|
|
|
|
|
|
|
|
December 31, 2008
|
|
|
99,330
|
|
|
$
|
152,111
|
|
|
$
|
579,164
|
|
|
$
|
(175,529
|
)
|
|
$
|
104,082
|
|
|
$
|
507,299
|
|
|
$
|
1,167,127
|
|
|
|
|
|
|
|
|
|
|
|
|
|
|
|
|
|
64
Statements of
Changes in Common Stockholders’ Equity
(cont’d)
| |
|
|
|
|
|
|
|
|
|
|
|
|
|
|
|
|
|
|
|
|
|
|
|
|
|
|
|
|
|
|
|
|
|
|
|
|
|
|
|
|
|
|
|
|
|
|
|
Accumulated
|
|
|
|
|
|
|
|
|
|
|
|
|
|
|
|
|
|
|
|
|
|
|
|
|
|
Other
|
|
|
|
|
|
|
|
|
|
|
|
|
|
|
|
|
Common Stock
|
|
|
Paid-In
|
|
|
Comprehensive
|
|
|
Noncontrolling
|
|
|
Retained
|
|
|
|
|
|
Comprehensive
|
|
|
(in thousands)
|
|
Shares
|
|
|
Amount
|
|
|
Capital
|
|
|
Loss
|
|
|
Interest
|
|
|
Earnings
|
|
|
Total
|
|
|
Income
|
|
|
|
|
|
|
January 1, 2009
|
|
|
99,330
|
|
|
$
|
152,111
|
|
|
$
|
579,164
|
|
|
$
|
(175,529
|
)
|
|
$
|
104,082
|
|
|
$
|
507,299
|
|
|
$
|
1,167,127
|
|
|
|
|
|
|
|
|
|
|
|
|
|
|
|
|
|
|
|
|
|
|
|
|
|
|
|
|
|
|
|
|
|
|
|
|
|
|
|
|
Comprehensive Income:
|
|
|
|
|
|
|
|
|
|
|
|
|
|
|
|
|
|
|
|
|
|
|
|
|
|
|
|
|
|
|
|
|
|
Net income
|
|
|
—
|
|
|
|
—
|
|
|
|
—
|
|
|
|
—
|
|
|
|
25,984
|
|
|
|
152,633
|
|
|
|
178,617
|
|
|
$
|
178,617
|
|
|
Foreign currency translation adjustments
|
|
|
—
|
|
|
|
—
|
|
|
|
—
|
|
|
|
25,211
|
|
|
|
—
|
|
|
|
—
|
|
|
|
25,211
|
|
|
|
25,211
|
|
|
Change in fair value of derivatives, net of taxes of $28,403
|
|
|
—
|
|
|
|
—
|
|
|
|
—
|
|
|
|
39,746
|
|
|
|
5,497
|
|
|
|
—
|
|
|
|
45,243
|
|
|
|
45,243
|
|
|
Pension and post-retirement benefit liabilities, net of taxes of
($6,710)
|
|
|
—
|
|
|
|
—
|
|
|
|
—
|
|
|
|
(9,790
|
)
|
|
|
—
|
|
|
|
—
|
|
|
|
(9,790
|
)
|
|
|
(9,790
|
)
|
|
|
|
|
|
|
|
|
|
|
|
|
|
|
|
|
|
|
|
|
|
|
|
|
|
|
|
|
|
|
|
|
|
|
|
Comprehensive income
|
|
|
|
|
|
|
|
|
|
|
|
|
|
|
|
|
|
|
|
|
|
|
|
|
|
|
|
|
|
|
239,281
|
|
|
Comprehensive income attributable to noncontrolling interest
|
|
|
|
|
|
|
|
|
|
|
|
|
|
|
|
|
|
|
|
|
|
|
|
|
|
|
|
|
|
|
(31,481
|
)
|
|
|
|
|
|
|
|
|
|
|
|
|
|
|
|
|
|
|
|
|
|
|
|
|
|
|
|
|
|
|
|
|
|
|
|
Comprehensive income attributable to Terra Industries Inc.
|
|
|
|
|
|
|
|
|
|
|
|
|
|
|
|
|
|
|
|
|
|
|
|
|
|
|
|
|
|
$
|
207,800
|
|
|
|
|
|
|
|
|
|
|
|
|
|
|
|
|
|
|
|
|
|
|
|
|
|
|
|
|
|
|
|
|
|
|
|
|
Distributions to noncontrolling interest
|
|
|
—
|
|
|
|
—
|
|
|
|
—
|
|
|
|
—
|
|
|
|
(41,149
|
)
|
|
|
—
|
|
|
|
(41,149
|
)
|
|
|
|
|
|
Preferred share dividends
|
|
|
—
|
|
|
|
—
|
|
|
|
—
|
|
|
|
—
|
|
|
|
—
|
|
|
|
(56
|
)
|
|
|
(56
|
)
|
|
|
|
|
|
Common stock dividends
|
|
|
—
|
|
|
|
—
|
|
|
|
(140,664
|
)
|
|
|
—
|
|
|
|
—
|
|
|
|
(647,924
|
)
|
|
|
(788,588
|
)
|
|
|
|
|
|
Excess tax benefit
|
|
|
—
|
|
|
|
—
|
|
|
|
6,304
|
|
|
|
—
|
|
|
|
—
|
|
|
|
—
|
|
|
|
6,304
|
|
|
|
|
|
|
Net vested stock
|
|
|
401
|
|
|
|
581
|
|
|
|
(7,223
|
)
|
|
|
—
|
|
|
|
—
|
|
|
|
—
|
|
|
|
(6,642
|
)
|
|
|
|
|
|
Inducement of preferred stock
|
|
|
110
|
|
|
|
110
|
|
|
|
951
|
|
|
|
—
|
|
|
|
—
|
|
|
|
—
|
|
|
|
1,061
|
|
|
|
|
|
|
Share-based compensation
|
|
|
—
|
|
|
|
—
|
|
|
|
7,546
|
|
|
|
—
|
|
|
|
—
|
|
|
|
—
|
|
|
|
7,546
|
|
|
|
|
|
|
Other
|
|
|
—
|
|
|
|
—
|
|
|
|
—
|
|
|
|
—
|
|
|
|
—
|
|
|
|
267
|
|
|
|
267
|
|
|
|
|
|
|
|
|
|
|
|
|
|
|
|
|
|
|
|
|
|
|
|
|
|
|
|
|
|
|
|
|
|
|
|
|
|
|
|
|
December 31, 2009
|
|
|
99,841
|
|
|
$
|
152,802
|
|
|
$
|
446,078
|
|
|
$
|
(120,362
|
)
|
|
$
|
94,414
|
|
|
$
|
12,219
|
|
|
$
|
585,151
|
|
|
|
|
|
|
|
|
|
|
|
|
|
|
|
|
|
|
|
|
|
|
|
|
|
|
|
|
|
|
|
|
|
|
|
|
|
|
|
|
|
|
|
|
|
|
|
|
|
|
|
|
|
|
|
|
|
|
|
|
|
|
|
|
|
|
|
|
|
|
|
|
|
See accompanying Notes to the
Consolidated Financial Statements
65
Notes to the
Consolidated Financial Statements
1. Summary of
Significant Accounting Policies
Basis of presentation: The Consolidated Financial
Statements include the accounts of Terra Industries Inc. and all
majority owned subsidiaries (Terra, we, our, or us). All
intercompany accounts and transactions have been eliminated.
Noncontrolling interest in earnings and ownership has been
recorded for the percentage of limited partnership common units
not owned by us for each respective period presented.
Description of business: We produce nitrogen
products for agricultural dealers and industrial users, and
methanol for industrial users.
Foreign exchange: Results of operations for the
foreign subsidiaries are translated using average currency
exchange rates during the period; assets and liabilities are
translated using period-end rates. Resulting translation
adjustments are recorded as foreign currency translation
adjustments in accumulated other comprehensive income (loss) in
common stockholders’ equity.
Cash and cash equivalents: Cash and cash equivalents
consist of all cash balances and all highly liquid investments
purchased with an original maturity of three months or less. Our
cash equivalents included $280.5 million invested in money
market mutual funds. There are no withdrawal restrictions on any
of these funds. The remaining cash equivalents were invested in
obligations of highly-rated financial institutions with an
average weighted maturity of approximately 43 days.
Inventories: Production costs include the cost of
direct labor and materials, depreciation and amortization, and
overhead costs related to manufacturing activities. We allocate
fixed production overhead costs based on the normal capacity of
our production facilities and unallocated overhead costs are
recognized as expense in the period incurred. We determine the
cost of inventories using the
first-in,
first-out method.
Inventories are stated at the lower of cost or market. Market is
defined as current replacement cost, except that market should
not exceed the net realizable value and should not be less than
net realizable value reduced by an allowance for an
approximately normal profit margin. We perform a monthly
analysis of our inventory balances to determine if the carrying
amount of inventories exceeds our net realizable value. Our
determination of estimated net realizable value is based on
customer orders, market trends and historical pricing. If the
carrying amount exceeds the estimated net realizable value, the
carrying amount is reduced to the estimated net realizable value.
We estimate a reserve for obsolescence and excess of our
materials and supplies inventory. Inventory is stated net of the
reserve.
Property, plant and equipment: Expenditures for
plant and equipment additions, replacements and major
improvements are capitalized. Related depreciation is charged to
expense on a straight-line basis over estimated useful lives
ranging from 15 to 22 years for buildings and 2 to
18 years for plants and equipment. Equipment under capital
leases is recorded in property with the corresponding
obligations in long-term debt. The amount capitalized is the
present value at the beginning of the lease term of the
aggregate future minimum lease payments. Maintenance and repair
costs are expensed as incurred.
Plant turnaround costs: Plant turnarounds are
periodically performed to extend the useful life, increase
output
and/or
efficiency and ensure the long-term reliability and safety of
integrated plant machinery at our continuous process production
facilities. The nature of a turnaround is such that it occurs on
less than an annual basis and requires a multi-week shutdown of
plant operations. Specific procedures performed during the
turnaround include the disassembly, inspection and replacement
or overhaul of plant machinery (boilers, pressure vessels,
piping, heat exchangers, etc.) and rotating equipment
(compressors, pumps, turbines, etc.), equipment recalibration
and internal equipment efficiency assessments.
Preceding a turnaround, plants experience decreased efficiency
in resource conversion to finished products. Replacement or
overhaul of equipment and items such as compressors, turbines,
pumps, motors, valves, piping and other parts that have an
estimated useful life of at least two years, the internal
assessment of production equipment, replacement of aged
catalysts, and new installation/recalibration of measurement and
control devices result in
66
increased production output
and/or
improved plant efficiency after the turnaround. Turnaround
activities are betterments that meet at least one of the
following criteria: 1) extend the equipment useful life, or
2) increase the output
and/or
efficiency of the equipment. As a result, we follow the deferral
method of accounting for these turnaround costs and thus they
are capitalized and amortized over the period benefited, which
is generally the two-year period until the next turnaround.
Turnaround activities may extend the useful life of the assets
since the overhaul of heat exchangers, pressure vessels,
compressors, turbines, pumps, motors, etc. allow the continued
use beyond the original design. If criteria for betterment or
useful life extension are not met, we expense the turnaround
expenditures as repair and maintenance activities in the period
performed.
In addition, state and certain other regulatory agencies require
a scheduled biennial safety inspection of plant components, such
as steam boilers and registered pressure vessels and piping,
which can only be performed during the period of shut down. A
full shutdown and dismantling of components of the plant is
generally mandatory to facilitate the inspection and
certification. We defer costs associated with regulatory safety
inspection mandates that are incurred during the turnaround.
These costs are amortized over the period benefited, which is
generally the two-year period until the next turnaround.
During a turnaround event, there will also be routine repairs
and maintenance activities performed for normal operating
purposes. The routine repairs and maintenance costs are expensed
as incurred. We do not classify routine repair and maintenance
activities as part of the turnaround cost capitalization since
they are not considered asset betterments.
The installation of major equipment items can occur at any time,
but frequently occurs during scheduled plant outages, such as a
turnaround. During a plant turnaround, expenditures for
replacing major equipment items are capitalized as separate
fixed assets.
We classify capitalized turnaround costs as an investing
activity under the caption “Capital expenditures and plant
turnaround expenditures” in the Statement of Cash Flows,
since this cash outflow relates to expenditures related to
productive assets. Repair, maintenance costs, and gas costs are
expensed as incurred and are included in the operating cash flow.
There are three acceptable methods of accounting for turnaround
costs: 1) direct expensing method, 2) built-in
overhaul method and 3) deferral method. We utilize the
deferral method and recognize turnaround expense over the period
benefited since these expenditures are asset betterments. If the
direct expense method was utilized, all turnaround expenditures
would be recognized in the statement of operations as a period
cost when incurred and reflected in cash flows from operating
activities in the statement of cash flows.
Equity investments: Equity investments are carried
at original cost adjusted for the proportionate share of the
investees’ income, losses and distributions. We have a
basis difference between carrying value and the affiliates’
book value primarily due to the
step-up in
basis for fixed asset values, which is being depreciated over a
period of 12 to 15 years. We assess the carrying value of
our equity investments when an indicator of a loss in value is
present and record a loss in value of the investment when the
assessment indicates that an
other-than-temporary
decline in the investment exists.
We classify our equity in earnings of unconsolidated affiliates
for our North America and Trinidad equity investments as a
component of income from operations because these investments
provide additional nitrogen capacity and are integrated with our
supply chain and sales activities in our nitrogen segment. We
classify our equity earnings of unconsolidated affiliates for
our U.K. equity investment as a component of net income, but not
income from operations, because this investment does not provide
additional nitrogen capacity nor is it integrated with any
sales, supply chain or administrative activities.
Intangible asset—customer relationships: Our
customer relationships have a finite useful life and are
amortized using the straight-line method over the estimated
useful life of five years. We monitor our intangible asset and
record an impairment loss on the intangible asset when
circumstances indicate that the carrying amount is not
recoverable and that the carrying amount exceeds its fair value.
67
The customer relationships were recorded at $9.4 million in
connection with the acquisition of Mississippi Chemical
Corporation in December 2004. During 2009, 2008 and 2007, we
recorded $1.9 million of amortization expense each year.
The customer relationships are fully amortized as of
December 31, 2009.
Debt issuance costs: Costs associated with the
issuance are included in other noncurrent assets and are
amortized over the term of the related debt using the
straight-line method. Debt issuance discounts are netted against
the related debt and are amortized over the term of the related
debt using the effective interest method.
Impairment of long-lived assets: We review and
evaluate our long-lived assets for impairment when events and
changes in circumstances indicate that the carrying amount of
the assets may not be recoverable. Impairment is considered to
exist if the total estimated future cash flows on an
undiscounted basis are less than the carrying value of the
asset. Future cash flows include estimates of production levels,
pricing of our products, costs of natural gas and capital
expenditures. If the assets are impaired, a calculation of fair
value is performed; if the fair value is less than the carrying
value of the assets, the assets are reduced to their fair value.
On September 28, 2007, Eastman Chemical Company exercised
its option to purchase our Beaumont, Texas assets, including the
methanol and ammonia production facilities. In connection with
entering into this agreement, we determined that the value of
our Beaumont property was impaired. We recorded a
$39.0 million impairment charge for the quarter ended
September 30, 2007. We closed the sale on December 31,
2008. For additional information regarding the sale of our
Beaumont facility, see Note 2, Discontinued
Operations, of the Notes to the Consolidated Financial
Statements.
Noncontrolling interests: On January 1, 2009 we
adopted the provisions of the Financial Accounting Standards
Board (FASB) Statement on Consolidations topic of the FASB
Accounting Standards Codification (Codification), which
clarifies that a noncontrolling interest in a subsidiary is an
ownership interest in the consolidated entity that should be
reported as equity in the consolidated statements of operations.
The Consolidations topic also requires consolidated net income
to be reported at amounts that include the amounts attributable
to both the parent and noncontrolling interest on the face of
the consolidated statement of operations. The Consolidations
topic further requires a reconciliation of the beginning and the
end of the period of the carrying amount of total equity (net
assets), equity (net assets) attributable to the parent, and
equity (net assets) attributable to the noncontrolling interest.
Upon adoption, we included our noncontrolling interest as a
separate column within our consolidated statements of changes in
common stockholders’ equity, which reconciles the
noncontrolling interest beginning balance to ending balance by
separately breaking out the net income attributable to the
noncontrolling interest, distributions to noncontrolling
interest, and other comprehensive income (loss) items
attributable to noncontrolling interest. As the Company was
required to retrospectively adopt, the statement of financial
position for the year ended December 31, 2008 and
consolidated statements of operations, cash flows, and changes
in common stockholders’ equity have been revised to reflect
the reclassification of the noncontrolling interest. See
Note 19, Comprehensive Income, of the Notes to the
Consolidated Financial Statements.
Derivatives and financial instruments: We enter into
derivative financial instruments, including swaps, basis swaps,
purchased put and call options and sold call options, to manage
the effect of changes in natural gas costs and the prices of our
nitrogen products. We report the fair value of the derivatives
on our balance sheet. If the derivative is not designated as a
hedging instrument, changes in fair value are recognized in
earnings in the period of change. If the derivative is
designated as a hedge, and to the extent such hedge is
determined to be effective, changes in fair value are either
(a) offset by the change in fair value of the hedged asset
or liability or (b) reported as a component of accumulated
other comprehensive income (loss) in the period of change, and
subsequently recognized in our statement of operations in the
period the offsetting hedged transaction occurs. If an
instrument or the hedged item is settled early, we evaluate
whether the hedged forecasted transaction is still probable of
occurring when determining whether to reclass any gains or
losses immediately in cost of sales or wait until the forecasted
transaction occurs.
Until our derivatives settle, we test the derivatives for
ineffectiveness. This includes assessing the correlation of
NYMEX pricing, which is commonly used as an index in natural gas
derivatives, to the natural gas pipelines’ pricing at our
manufacturing facilities. This assessment requires management
judgment to determine the statistically- and
68
industry-appropriate analysis of prior operating relationships
between the NYMEX prices and the natural gas pipelines’
prices at our facilities.
To the extent possible, we base our market value calculations on
third party data. Due to multiple types of settlement methods
available, not all settlement methods for future period trades
are available from third party sources. In the event that a
derivative is measured for fair value based on a settlement
method that is not readily available, we estimate the fair value
based on forward pricing information for similar types of
settlement methods.
Revenue recognition: Revenue is recognized when
persuasive evidence of an arrangement exists, delivery has
occurred, the price is fixed or determinable, no obligations
remain and collectability is probable.
Revenues are primarily comprised of sales of our products,
including any realized hedging gains or losses related to
nitrogen product derivatives, and are reduced by estimated
discounts and trade allowances. We classify amounts directly or
indirectly billed to our customers for shipping and handling as
revenue.
Profit sharing revenue pertaining to a contractual agreement
with the Methanex Corporation is recognized when the estimated
margin on an annualized basis is probable. For the year ending
December 31, 2009, we did not recognize any profit sharing
revenue, compared to $12.0 million of profit sharing
revenue for the year ending December 31, 2008. We include
the profit sharing revenue under this contract within our
discontinued operations.
Cost of sales and hedging transactions: Costs of
sales are primarily related to manufacturing and purchased costs
related to our products, including any realized hedging gains or
losses related to natural gas derivatives. We classify amounts
directly or indirectly billed for shipping and handling of
products to our customers or our terminals as cost of sales.
Share-based compensation: We account for our
stock-based compensation in accordance with ASC 718,
Compensation—Stock Compensation, using the modified
prospective method, which requires companies to record stock
compensation expense for all non-vested and new awards beginning
as of January 1, 2006. Under ASC Topic 718, we measure and
record compensation expense for our nonvested share awards based
on their fair value of our common stock at the date of grant.
Compensation expense is recognized for nonvested stock awards on
a straight-line basis over the vesting period. Our phantom
shares, however, are liability awards as they settle in cash;
therefore, we measure and record compensation expense for these
awards based on their fair value at the end of each reporting
period until their vesting date. This may cause fluctuations in
earnings that do not exist under the accounting requirements for
our nonvested shares. ASC 718 requires forfeitures to be
estimated at the time of grant and revised, if necessary, in
subsequent periods if actual forfeitures differ from initial
estimates. We have thus recorded stock-based compensation
expense net of estimated forfeitures. Cash flows resulting from
the tax benefits due to tax deductions in excess of the
compensation cost recognized for those awards (excess tax
benefits) are classified as financing cash flows. See
Note 16, Share-Based Compensation, of the Notes to
the Consolidated Financial Statements.
Per share results: Basic earnings per share data are
based on the weighted-average number of common shares
outstanding during the period. Diluted earnings per share data
are based on the weighted-average number of common shares
outstanding and the effect of all dilutive potential common
shares including convertible preferred shares, common stock
options, nonvested stock and common stock warrants.
Estimates: The preparation of financial statements
in conformity with accounting principles generally accepted in
the United States of America requires management to make
estimates and assumptions that affect the reported amounts of
assets and liabilities and disclosure of contingent assets and
liabilities at the date of the financial statements and the
reported amounts of revenues and expenses during the reporting
period. The significant areas requiring the use of
management’s estimates relate to assumptions used to
calculate pension and other post-retirement benefits costs,
future cash flows from long-lived assets, estimates of market
for lower of cost or market analysis and the useful lives
utilized for depreciation, amortization and accretion
calculations. Actual results could differ from those estimates.
Recently issued accounting standards: In June 2009,
the FASB issued new guidance on Generally Accepted Accounting
Principles (GAAP) relating to the Codification. This guidance
establishes the Codification as the source of
69
authoritative accounting principles recognized by the FASB to be
applied by nongovernmental entities in the preparation of
financial statements in conformity with GAAP. Rules and
interpretive releases of the SEC under authority of federal
securities laws are also sources of authoritative GAAP for SEC
registrants. The FASB will no longer issue new standards in the
form of Statements, FASB Staff Positions, or Emerging Issues
Task Force (EITF) Abstracts; instead the FASB will issue
Accounting Standards Updates. Accounting Standards Updates will
not be authoritative in their own right as they will only serve
to update the Codification. This guidance was effective for
financial statements issued for interim and annual periods
ending after September 15, 2009. The adoption did not have
an impact on our consolidated financial position, results of
operations or cash flows.
In December 2007, the FASB issued new guidance on business
combinations, which was effective for us for business
combinations with the acquisition date on or after
January 1, 2009. This guidance requires the acquiring
entity in a business combination to recognize all (and only) the
assets acquired and liabilities assumed in the transaction and
establishes the acquisition-date fair value as the measurement
objective for all assets acquired and liabilities assumed in a
business combination. Certain provisions of this guidance will,
among other things, impact the determination of acquisition-date
fair value of consideration paid in a business combination
(including contingent consideration); exclude transaction costs
from acquisition accounting; and change accounting practices for
acquired contingencies, acquisition-related restructuring costs,
in-process research and development, indemnification assets, and
tax benefits. The adoption did not have an impact on our
consolidated financial position, results of operations or cash
flows.
In December 2007, the FASB issued new guidance on noncontrolling
interests, which we adopted on January 1, 2009. This
guidance amends the accounting for and disclosure of the
noncontrolling interest in a subsidiary and for the
deconsolidation of a subsidiary. This guidance clarifies the
definition and classification of a noncontrolling interest,
revises the presentation of noncontrolling interests in the
consolidated income statement, establishes a single method of
accounting for changes in a parent’s ownership interest in
a subsidiary that does not result in deconsolidation, and
requires that a parent recognize a gain or loss in net income
(loss) when a subsidiary is deconsolidated. This guidance also
required expanded disclosures in the consolidated financial
statements that clearly identify and distinguish between the
interests of the parent’s owners and the interests of the
noncontrolling owners of a subsidiary. The required changes in
presentation have been reflected in the consolidated balance
sheets, statements of operations and statements of cash flows
and in the notes to the consolidated financial statements, where
applicable.
In March 2008, the FASB issued new guidance on derivatives and
hedging, which requires entities to provide enhanced disclosures
about how and why an entity uses derivative instruments, how
derivative instruments and related hedged items are accounted,
and how derivative instruments and related hedged items affect
an entity’s financial position, results of operations, and
cash flows. We adopted this guidance on January 1, 2009 and
these disclosures are included in Note 5 herein.
In June 2008, the FASB issued new guidance on earnings per
share. The FASB decided that unvested share-based payout awards
that contain non-forfeitable rights to dividends or dividend
equivalents (whether paid or unpaid) are participating
securities and shall be included in the computation of earnings
per share pursuant to the two-class method. We adopted this
guidance on January 1, 2009 and the adoption did not have
an impact on our consolidated financial position, results of
operations or cash flows.
In December 2008, the FASB issued new guidance on compensation,
which amends previous guidance to require more detailed
disclosures about employers’ pension plan assets. New
disclosures will include more information on investment
strategies, major categories of plan assets, concentrations of
risk within the plan assets and valuation techniques used to
measure the fair value of plan assets. This new guidance
required new disclosures only, and did not impact our
consolidated financial position, results of operations or cash
flows. We have included these additional disclosures in
Note 17 herein.
In April 2009, the FASB issued guidance on fair value
measurements and disclosures, which provides additional guidance
on estimating fair value when the volume and level of activity
for an asset or liability have significantly decreased in
relation to normal market activity. This also provides
additional guidance on circumstances that may indicate that a
transaction is not orderly and requires additional disclosures.
We adopted this guidance on April 1,
70
2009, and the adoption did not have an impact on our
consolidated financial position, results of operations or cash
flows.
In April 2009, the FASB issued new guidance relating to
investments, which amends the
other-than-temporary
recognition guidance for debt securities and requires additional
interim and annual disclosures of
other-than-temporary
impairments on debt and equity securities. Pursuant to the new
guidance, an
other-than-temporary
impairment has occurred if a company does not expect to recover
the entire amortized cost basis of the security. In this
situation, if the company does not intend to sell the impaired
security, and it is not more likely than not it will be required
to sell the security before the recovery of its amortized cost
basis, the amount of the
other-than-temporary
impairment recognized in earnings is limited to the portion
attributed to the credit loss. The remaining portion of the
other-than-temporary
impairment is then recorded in other comprehensive income. We
adopted this guidance on April 1, 2009 and the adoption did
not have an impact on our consolidated financial position,
results of operations or cash flows.
In April 2009, the FASB issued new guidance relating to interim
disclosures about the fair value of financial instruments. This
guidance required disclosures about fair value of all financial
instruments for interim reporting periods. This guidance relates
to fair value disclosures for any financial instruments that are
not currently reflected in a company’s balance sheet at
fair value. Prior to the effective date of this guidance, fair
values for these assets and liabilities were only disclosed once
a year. This guidance will now require these disclosures to be
made on a quarterly basis, providing qualitative and
quantitative information about fair value estimates for all
those financial instruments not measured on the balance sheet at
fair value. We adopted this guidance on April 1, 2009 and
included the additional interim disclosure information in our
quarterly SEC filings.
In June 2009, the FASB issued new guidance on subsequent events.
This guidance provides authoritative accounting literature and
disclosure requirements for material events occurring subsequent
to the balance sheet date and prior to the issuance of the
financial statements. This guidance is effective for us for the
periods ended on and after June 30, 2009. The adoption did
not have an impact on our consolidated financial position,
results of operations or cash flows. We have reviewed and
disclosed all material subsequent events in Note 27 herein.
In June 2009, the FASB issued new guidance on transfers and
servicing, an amendment of previous authoritative guidance. The
most significant amendments resulting from this guidance consist
of the removal of the concept of a qualifying special-purpose
entity (SPE) from previous authoritative guidance, and the
elimination of the exception for qualifying SPEs from the
consolidation guidance regarding variable interest entities.
This guidance is effective for us January 1, 2010 and we
are currently assessing the impact this guidance will have on
our financial statements.
In June 2009, the FASB issued an amendment to the accounting and
disclosure requirements for transfers of financial assets. This
guidance affects the overall consolidation analysis and requires
enhanced disclosures on involvement with variable interest
entities. This guidance is effective for us January 1, 2010
and we are currently assessing the impact this guidance will
have on our financial statements.
In September 2009, the FASB issued amendments to the accounting
and disclosure for revenue recognition. This guidance will
change the accounting for revenue recognition for arrangements
with multiple deliverables and will enable entities to
separately account for individual deliverables for many more
revenue arrangements. This guidance eliminates the requirement
that all undelivered elements must have objective and reliable
evidence of fair value before a company can recognize the
portion of the overall arrangement fee that is attributable to
items that already have been delivered. As a result, the new
guidance may allow some companies to recognize revenue on
transactions that involve multiple deliverables earlier than
under current requirements. This guidance is effective for us
January 1, 2011 and we are currently assessing the impact
this guidance will have on our financial statements.
In January 2010, the FASB issued Accounting Standards Update
No. 2010-06,
Improving Disclosures about Fair Value Measurements. The
Update provides amendments to FASB ASC
820-10 that
require entities to disclose separately the amounts of
significant transfers in and out of Level 1 and
Level 2 fair value measurements and describe the reasons
for the transfers. In addition the Update requires entities to
present separately information about purchases, sales,
issuances, and settlements in the reconciliation for fair value
measurements using significant unobservable inputs
(Level 3). The disclosures related to Level 1 and
Level 2 fair value measurements are effective
71
for us in 2010 and the disclosures related to Level 3 fair
value measurements are effective for us in 2011. The Update
requires new disclosures only, and will have no impact on our
consolidated financial position, results of operations or cash
flows.
2. Discontinued
Operations
On December 31, 2008, pursuant to a 2007 agreement, we sold
our Beaumont, Texas assets, including the methanol and ammonia
production facilities, to Eastman Chemical Company (Eastman).
Consideration received, including cash and a Promissory Note
from Eastman of $5.2 million plus interest, approximated
this facility’s carrying value. In connection with the sale
of the Beaumont facility that was finalized in 2008, we received
$5.4 million from Eastman and recognized $1.1 million
of net income from discontinued operations, net of tax.
Pursuant to the requirements of the Property, Plant and
Equipment topic of the Codification, we classified and accounted
for the Beaumont assets and liabilities as held for sale in the
statements of financial position and the results of operations
on a net of tax basis in the statement of operations. The
Property, Plant and Equipment topic of the Codification requires
that assets held for sale are valued on an
asset-by-asset
basis at the lower of carrying amount or fair value less costs
to sell. In applying those provisions, we considered cash flow
analyses, and offers related to those assets. In accordance with
the provisions of the Property, Plant and Equipment topic of the
Codification, assets held for sale are not depreciated. In
fiscal 2007, we recorded an impairment charge of
$39.0 million related to the Beaumont facility.
Summarized
Financial Results of Discontinued Operations
| |
|
|
|
|
|
|
|
|
|
|
|
|
|
|
|
Year Ended December 31,
|
|
|
(in thousands)
|
|
2009
|
|
|
2008
|
|
|
2007
|
|
|
|
|
|
|
|
Operating revenue
|
|
$
|
1,848
|
|
|
$
|
18,333
|
|
|
$
|
17,137
|
|
|
Operating and other expenses
|
|
|
—
|
|
|
|
(4,574
|
)
|
|
|
(48,519
|
)
|
|
|
|
|
|
Pretax income (loss) from operations of
discontinued components
|
|
|
1,848
|
|
|
|
13,759
|
|
|
|
(31,382
|
)
|
|
Income tax (expense) benefit
|
|
|
(730
|
)
|
|
|
(5,490
|
)
|
|
|
12,521
|
|
|
|
|
|
|
Income (loss) from discontinued operations
|
|
$
|
1,118
|
|
|
$
|
8,269
|
|
|
$
|
(18,861
|
)
|
|
|
|
|
As of December 31, 2009 and 2008, we did not have any
assets or liabilities held for sale related to discontinued
operations due to the sale of the Beaumont, Texas facility on
December 31, 2008.
3. Earnings Per
Share
Basic income per share data is based on the weighted-average
number of common shares outstanding during the period. Diluted
income per share data is based on the weighted average number of
common shares outstanding and the effect of all dilutive
potential common shares including stock options, nonvested
stock, convertible preferred shares and common stock warrants.
Nonvested stock carries dividend and voting rights, but is not
involved in the weighted average number of common shares
outstanding used to compute basic income per share.
72
The following table provides a reconciliation between basic and
diluted income per share for the years ended December 31,
2009, 2008 and 2007.
| |
|
|
|
|
|
|
|
|
|
|
|
|
|
(in thousands, except per-share
data)
|
|
2009
|
|
|
2008
|
|
|
2007
|
|
|
|
|
|
|
|
Basic income per common share attributed to
Terra Industries Inc. common stockholders:
|
|
|
|
|
|
|
|
|
|
|
|
|
|
Income from continuing operations attributable to
Terra Industries Inc.
|
|
$
|
151,515
|
|
|
$
|
632,772
|
|
|
$
|
220,757
|
|
|
Less: Preferred share dividends
|
|
|
(56
|
)
|
|
|
(3,876
|
)
|
|
|
(5,100
|
)
|
|
Inducement of preferred shares
|
|
|
—
|
|
|
|
(5,266
|
)
|
|
|
—
|
|
|
|
|
|
|
Income from continuing operations
available to common stockholders
|
|
|
151,459
|
|
|
|
623,630
|
|
|
|
215,657
|
|
|
Income (loss) from discontinued operations
available to common stockholders
|
|
|
1,118
|
|
|
|
8,269
|
|
|
|
(18,861
|
)
|
|
|
|
|
|
Income available to
common stockholders
|
|
$
|
152,577
|
|
|
$
|
631,899
|
|
|
$
|
196,796
|
|
|
|
|
|
|
|
|
|
|
|
|
|
|
|
|
|
|
|
|
Weighted average shares outstanding
|
|
|
99,386
|
|
|
|
93,827
|
|
|
|
90,575
|
|
|
|
|
|
|
Income per share – continuing operations
|
|
$
|
1.53
|
|
|
$
|
6.65
|
|
|
$
|
2.38
|
|
|
Income (loss) per share – discontinued operations
|
|
|
0.01
|
|
|
|
0.09
|
|
|
|
(0.21
|
)
|
|
|
|
|
|
Net income per share
|
|
$
|
1.54
|
|
|
$
|
6.74
|
|
|
$
|
2.17
|
|
|
|
|
|
|
|
|
|
|
|
|
|
|
|
|
|
|
|
|
Diluted income per common share attributed to
Terra Industries Inc. common shareholders:
|
|
|
|
|
|
|
|
|
|
|
|
|
|
Income from continuing operations available to
common stockholders
|
|
$
|
151,459
|
|
|
$
|
623,630
|
|
|
$
|
215,657
|
|
|
Add: Preferred share dividends
|
|
|
56
|
|
|
|
3,876
|
|
|
|
5,100
|
|
|
Inducement of preferred shares
|
|
|
—
|
|
|
|
5,266
|
|
|
|
—
|
|
|
|
|
|
|
Income available to common stockholders
and assumed conversions
|
|
$
|
151,515
|
|
|
$
|
632,772
|
|
|
$
|
220,757
|
|
|
|
|
|
|
|
|
|
|
|
|
|
|
|
|
|
|
|
|
Weighted average shares outstanding
|
|
|
99,386
|
|
|
|
93,827
|
|
|
|
90,575
|
|
|
Add incremental shares from assumed conversions:
|
|
|
|
|
|
|
|
|
|
|
|
|
|
Preferred Shares
|
|
|
128
|
|
|
|
8,090
|
|
|
|
12,048
|
|
|
Nonvested stock
|
|
|
478
|
|
|
|
619
|
|
|
|
823
|
|
|
Common stock options
|
|
|
—
|
|
|
|
1
|
|
|
|
111
|
|
|
Common stock warrants
|
|
|
—
|
|
|
|
822
|
|
|
|
2,897
|
|
|
|
|
|
|
Dilutive potential common shares
|
|
|
99,992
|
|
|
|
103,359
|
|
|
|
106,454
|
|
|
|
|
|
|
|
|
|
|
|
|
|
|
|
|
|
|
|
|
Income per share – continuing operations
|
|
$
|
1.52
|
|
|
$
|
6.12
|
|
|
$
|
2.07
|
|
|
Income (loss) per share – discontinued operations
|
|
|
0.01
|
|
|
|
0.08
|
|
|
|
(0.17
|
)
|
|
|
|
|
|
Net income per share
|
|
$
|
1.53
|
|
|
$
|
6.20
|
|
|
$
|
1.90
|
|
|
|
|
|
73
In 2008, we commenced individual offers (the inducement offer)
to pay a cash premium to holders of our 4.25 percent
Cumulative Convertible Perpetual Series A Preferred Shares
(Series A Preferred Shares) who elected to convert their
Series A Preferred Shares into shares of Terra common
stock, see Note 15, Common Stockholders’
Equity, of the Notes to the Consolidated Financial
Statements. A total of 118,400 shares, or 99 percent,
of the outstanding shares of Series A Preferred Shares were
surrendered and converted as part of the inducement offer. The
former holders of the Series A Preferred Shares received
11,887,550 shares of Terra common stock and a cash premium
of approximately $5.3 million.
When convertible preferred stock is converted pursuant to an
inducement offer, the excess of the fair value of the
consideration transferred in the transaction to the holders of
the convertible preferred stock over the fair value of the
securities issuable pursuant to the original conversion terms
should be subtracted from net income to arrive at net income
available to common stockholders in the calculation of earnings
per share. As such, the inducement payments and offering costs
paid in connection with the inducement offer resulted in a
reduction of net income available to common stockholders.
For purposes of our computation of diluted net income per share
for the year ended December 31, 2008, the portion of our
Series A Preferred Shares that was converted was considered
separately from the portion of Series A Preferred Shares
that was not converted. The inducement payment was attributed to
the portion of the Series A Preferred Shares that was
converted. As a result, conversion of the portion of the
Series A Preferred Shares that was converted into
11,887,550 weighted average common shares outstanding for the
year ended December 31, 2008 was also not assumed because
the resulting impact on the calculation of diluted net income
per common share would have been anti-dilutive. The portion of
our Series A Preferred Shares that was not converted was
also not assumed because the resulting impact on the calculation
of diluted net income per common share would have been
anti-dilutive.
4.
Inventories
Inventories consisted of the following at December 31:
| |
|
|
|
|
|
|
|
|
|
(in thousands)
|
|
2009
|
|
|
2008
|
|
|
Raw materials
|
|
$
|
19,757
|
|
|
$
|
17,805
|
|
|
Supplies
|
|
|
37,770
|
|
|
|
33,825
|
|
|
Finished goods
|
|
|
79,546
|
|
|
|
145,461
|
|
|
|
|
|
|
|
|
|
|
|
|
Total
|
|
$
|
137,073
|
|
|
$
|
197,091
|
|
|
|
|
|
5. Derivative
Financial Instruments
We enter into derivative financial instruments, including swaps,
basis swaps, purchased put and call options and sold call
options, to manage the effect of changes in natural gas costs
and the price of our nitrogen products. We report the fair value
of the derivatives on our balance sheet. If the derivative is
not designated as a hedging instrument, changes in fair value
are recognized in earnings in the period of change. If the
derivative is designated as a cash flow hedge, and to the extent
such hedge is determined to be effective, changes in fair value
are reported as a component of accumulated other comprehensive
income (loss) in the period of change, and subsequently
recognized in our statement of operations in the period the
offsetting hedged transaction occurs. If an instrument or the
hedged item is settled early, we evaluate whether the hedged
forecasted transaction is still probable of occurring when
determining whether to reclassify any gains or losses
immediately in cost of sales or wait until the forecasted
transaction occurs.
Until our derivatives settle, we test derivatives for
ineffectiveness. This includes assessing the correlation of New
York Mercantile Exchange (NYMEX) pricing, which is commonly used
as an index in natural gas derivatives, to the natural gas
pipelines’ pricing at our manufacturing facilities. This
assessment requires management judgment to determine the
statistically and industry appropriate analysis of prior
operating relationships between the NYMEX prices and the natural
gas pipelines’ prices at our facilities.
74
To the extent possible, we base our market value calculations on
third party data. Due to multiple types of settlement methods
available, not all settlement methods for future period trades
are available from third party sources. In the event that a
derivative is measured for fair value based on a settlement
method that is not readily available, we estimate the fair value
based on forward pricing information for similar types of
settlement methods.
We manage risk using derivative financial instruments for
changes in natural gas supply prices and changes in nitrogen
prices. Derivative financial instruments have credit risk and
market risk.
To manage credit risk, we enter into derivative transactions
only with counter-parties who are currently rated as BBB or
better or equivalent as recognized by a national rating agency.
We will not enter into transactions with a counter-party if the
additional transaction will result in credit exposure exceeding
$20 million. The credit rating of counter-parties may be
modified through guarantees, letters of credit or other credit
enhancement vehicles. As of December 31, 2009, we did not
have any credit risk related contingent features that would
require us to settle the derivative instruments or to post
collateral upon the occurrence of a credit event.
We classify a derivative financial instrument as a hedge if all
of the following conditions are met:
|
|
|
| |
1.
|
The item to be hedged must expose us to currency, interest or
price risk;
|
| |
| |
2.
|
It must be probable that the results of the hedge position
substantially offset the effects of currency, interest or price
changes on the hedged item (i.e., there is a high correlation
between the hedge position and changes in market value of the
hedge item); and
|
| |
| |
3.
|
The derivative financial instrument must be designated as a
hedge of the item at the inception of the hedge.
|
Natural gas supplies to meet production requirements at our
North American production facilities are purchased at market
prices. Natural gas market prices are volatile and we
effectively fix prices for a portion of our natural gas
production requirements and inventory through the use of futures
contracts, swaps and options. The North American contracts
reference physical natural gas prices or appropriate NYMEX
futures contract prices. Contract physical prices for North
America are frequently based on prices at the Henry Hub in
Louisiana, the most common and financially liquid location of
reference for financial derivatives related to natural gas.
However, natural gas supplies for Terra’s North American
production facilities are purchased at locations other than
Henry Hub, which often creates a location basis differential
between the contract price and the physical price of natural
gas. Accordingly, the use of financial derivatives may not
exactly offset the change in the price of physical gas. Natural
gas derivatives are designated as cash flow hedges, provided
that the derivatives meet the conditions discussed above. The
contracts are traded in months forward and settlement dates are
scheduled to coincide with gas purchases during that future
period.
A swap is a contract between us and a third party to exchange
cash based on a designated price. Option contracts give the
holder the right to either own or sell a futures or swap
contract. The futures contracts require maintenance of cash
balances generally 10 percent to 20 percent of the
contract value and option contracts require initial premium
payments ranging from 2 percent to 5 percent of
contract value. Basis swap contracts require payments to or from
us for the amount, if any, that monthly published gas prices
from the source specified in the contract differ from prices of
NYMEX natural gas futures during a specified period. There are
no initial cash requirements related to the swap and basis swap
agreements.
We may use a collar structure where we will enter into a swap,
sell a call at a higher price and buy a put. The collar
structure allows for greater participation in a decrease to
natural gas prices and protects against moderate price
increases. However, the collar exposes us to large price
increases.
As of December 31, 2009 and 2008, we had open derivative
contracts of 15.6 million MMBtus and 17.9 million
MMBtus, respectively, of natural gas.
The following summarizes the gross fair market value of all
derivative instruments and their location in our Consolidated
Balance Sheet are shown by those in an asset or liability
position and are categorized as commodity derivatives.
75
| |
|
|
|
|
|
|
|
|
|
|
|
|
|
|
|
|
|
Asset Derivatives
(a)
|
|
|
|
|
|
December 31,
|
|
December 31,
|
|
|
|
Derivative Instrument
|
|
Location
|
|
2009
|
|
2008
|
|
|
|
|
|
|
|
Commodity Derivatives
|
|
|
Other current assets
|
|
|
$
|
9,076
|
|
|
$
|
25,773
|
|
|
|
|
|
| |
|
|
|
|
|
|
|
|
|
|
|
|
|
|
|
|
|
Liability Derivatives
(a)
|
|
|
|
|
|
December 31,
|
|
December 31,
|
|
|
|
Derivative Instrument
|
|
Location
|
|
2009
|
|
2008
|
|
|
|
|
|
|
|
Commodity Derivatives
|
|
|
Derivative hedge liabilities
|
|
|
$
|
(281
|
)
|
|
$
|
(125,925
|
)
|
|
|
|
|
|
|
|
|
(a)
|
|
Amounts are disclosed at gross
fair value as required by the Derivative and Hedging topic of
the FASB Accounting Standards Codification. All of our commodity
derivatives are designated as cash flow hedging instruments. The
deferred taxes related to these commodity derivatives for the
periods ended December 31, 2009 and 2008 were
$(3.2) million and $25.2 million, respectively.
|
Certain derivatives outstanding at December 31, 2009 and
2008, which settled during January 2010 and January 2009,
respectively, are included in the position of open natural gas
derivatives in the table above. The January 2010 derivatives
settled for an approximate $3.4 million gain compared to
the January 2009 derivatives which settled for an approximate
$39.4 million loss. All open derivatives at
December 31, 2009 will settle during the next
12 months.
We are required to maintain certain margin deposits on account
with derivative counterparties. At December 31, 2009, we
had no margin deposits with derivative counterparties, which are
reported as “Margin deposits with derivative
counterparties” on the Consolidated Statements of Financial
Position. At December 31, 2008, we had margin deposits with
derivative counterparties of $36.9 million.
At December 31, 2009 and 2008, we determined that a portion
of certain derivative contracts were ineffective for accounting
purposes and, as a result, recorded a $0.7 million and
$3.0 million charge to cost of sales, respectively.
Certain derivative contracts were entered into to mitigate the
risk of changes in prices of natural gas purchases associated
with fixed-priced sales orders from customers. Due to a
significant decline in fertilizer demand during late 2008, we
decided to temporarily halt production at our Donaldsonville,
Louisiana and Woodward, Oklahoma facilities. In 2008, we
recorded a charge of $16.5 million to cost of sales
representing the fair value carried in accumulated other
comprehensive income (loss) of related derivative contracts
because we no longer anticipate purchasing the natural gas due
to the production curtailments. Additionally in 2008, we
recorded a charge of $16.0 million to cost of sales
representing a portion of fair value carried in accumulated
other comprehensive income (loss) for those contracts that we
determined would not result in production costs that would
support reasonably profitable operations.
The effective portion of gains and losses on derivative
contracts that qualify for hedge treatment are carried as
accumulated other comprehensive income (loss) and credited or
charged to cost of sales in the month in which the hedged
transaction settles. Gains and losses on the contracts that do
not qualify for hedge treatment are credited or charged to cost
of sales based on the positions fair value. The risk and reward
of outstanding natural gas positions are directly related to
increases or decreases in natural gas prices in relation to the
underlying NYMEX natural gas contract prices.
The following table presents the effect of our commodity
derivative instruments on the Consolidated Statement of
Operations for the year ended December 31, 2009 and 2008.
76
| |
|
|
|
|
|
|
|
|
|
|
|
|
|
|
|
|
|
|
|
|
|
|
|
|
|
|
|
|
|
|
|
Year Ended
December 31,
|
|
|
|
|
|
Location of Gain
|
|
Amount of Gain (Loss)
|
|
Location of
|
|
|
|
|
Amount of Gain (Loss)
|
|
(Loss) Reclassified
|
|
Reclassified from AOCI
|
|
Gain (Loss)
|
|
Amount of Gain (Loss)
|
|
Recognized in OCI
|
|
from AOCI into
|
|
into Income
|
|
Recognized
|
|
Recognized in
Income(b)
|
|
2009
|
|
2008
|
|
Income(a)
|
|
2009
|
|
2008
|
|
in
Income(b)
|
|
2009
|
|
2008
|
|
|
|
|
|
$
|
8,367
|
|
|
$
|
(65,279
|
)
|
|
|
Cost of Sales
|
|
|
$
|
(112,119
|
)
|
|
$
|
(172,521
|
)
|
|
|
Cost of Sales
|
|
|
$
|
(675
|
)
|
|
$
|
(7,332
|
)
|
|
|
|
|
(a)
|
|
Effective portion of gain (loss)
|
| |
|
(b)
|
|
The amount of gain or (loss)
recognized in the income represents $(0.7) million and
$(3.0) million related to the ineffective portion of the
hedging relationships and $0.0 million and
$(4.3) million related to the amount excluded from the
assessment of hedge effectiveness.
|
At times, we also use forward derivative instruments to fix or
set floor prices for a portion of our nitrogen sales volumes. At
December 31, 2009, we had 9,000 tons of open nitrogen
solution sold swap contracts, offset by 9,000 tons of purchased
swap contracts. Outstanding nitrogen solution contracts do not
qualify for hedge treatment due to inadequate trading history to
demonstrate effectiveness. Consequently, these contracts are
marked-to-market
and unrealized gains or losses are reflected in revenue in the
statement of operations. For the years ending December 31,
2009, 2008 and 2007, we recognized losses of $0.3 million,
$0.0 million and $2.6 million, respectively.
6. Fair Value
Measurements, Financial Instruments and Concentrations of Credit
Risk
The Fair Value Measurements and Disclosures topic of the
Codification establishes a three level hierarchal disclosure
framework that prioritizes and ranks the level of market price
observability used in measuring assets and liabilities at fair
value. Market price observability is impacted by a number of
factors, including the type of asset or liability and its
characteristics. Assets and liabilities with readily available
active quoted prices or for which fair value can be measured
from actively quoted prices generally will have a higher degree
of market price observability and a lesser degree of judgment
used in measuring fair value.
The three levels are defined as follows:
Level 1—inputs to the valuation methodology are
unadjusted quoted prices for identical assets or liabilities in
active markets.
Level 2—inputs to the valuation methodology
include quoted prices for similar assets and liabilities in
active markets, and inputs that are observable for the asset or
liability, either directly or indirectly, for substantially the
full term of the financial instrument.
Level 3—inputs to the valuation methodology are
unobservable and significant to the fair value measurement.
We evaluated our assets and liabilities to determine which items
should be disclosed according to the Fair Value Measurements and
Disclosures topic of the Codification. We currently measure our
money market funds and derivative contracts on a recurring basis
at fair value. The fair value of our money market fund
investments was determined based on quoted prices in active
markets for identical assets. The inputs included in the fair
value measurement of our derivative contracts use adjusted
quoted prices from an active market, which are classified as
level 2 as a significant other observable input in the
disclosure hierarch framework as defined by the Fair Value
Measurements and Disclosures topic of the FASB Accounting
Standard Codification. Our gas derivative contracts, which are
classified as a level 2 input, are comprised of swaps,
basis swaps and options. The valuation techniques for these
contacts are observable market data for inputs, including prices
quoted on the NYMEX, prices quoted in spot markets and commonly
referenced industry publications and prices quoted by market
makers. There have been no changes in valuation techniques
during the year ended December 31, 2009.
77
The following table summarizes the valuation of Terra’s
assets and liabilities in accordance with the Fair Value
Measurements and Disclosures topic of the Codification fair
value hierarchy levels as of December 31, 2009:
| |
|
|
|
|
|
|
|
|
|
|
|
|
|
|
|
Quoted Market
|
|
|
Significant Other
|
|
|
Significant
|
|
|
|
|
Prices in Active
|
|
|
Observable
|
|
|
Unobservable
|
|
|
|
|
Markets
|
|
|
Inputs
|
|
|
Inputs
|
|
|
(in thousands)
|
|
(Level 1)
|
|
|
(Level 2)
|
|
|
(Level 3)
|
|
|
|
|
|
|
|
Assets
|
|
|
|
|
|
|
|
|
|
|
|
|
|
Money market funds
|
|
$
|
280,470
|
|
|
$
|
—
|
|
|
$
|
—
|
|
|
Derivative contracts
|
|
|
—
|
|
|
|
9,076
|
|
|
|
—
|
|
|
|
|
|
|
Total
|
|
$
|
280,470
|
|
|
$
|
9,076
|
|
|
$
|
—
|
|
|
|
|
|
|
|
|
|
|
|
|
|
|
|
|
|
|
|
|
Liabilities
|
|
|
|
|
|
|
|
|
|
|
|
|
|
Derivative contracts
|
|
$
|
—
|
|
|
$
|
(281
|
)
|
|
$
|
—
|
|
|
|
|
|
|
Total
|
|
$
|
—
|
|
|
$
|
(281
|
)
|
|
$
|
—
|
|
|
|
|
|
The following table summarizes the valuation of Terra’s
assets and liabilities in accordance with the Fair Value
Measurements and Disclosures topic of the Codification fair
value hierarchy levels as of December 31, 2008:
| |
|
|
|
|
|
|
|
|
|
|
|
|
|
|
|
Quoted Market
|
|
|
Significant Other
|
|
|
Significant
|
|
|
|
|
Prices in Active
|
|
|
Observable
|
|
|
Unobservable
|
|
|
|
|
Markets
|
|
|
Inputs
|
|
|
Inputs
|
|
|
(in thousands)
|
|
(Level 1)
|
|
|
(Level 2)
|
|
|
(Level 3)
|
|
|
|
|
|
|
|
Assets
|
|
|
|
|
|
|
|
|
|
|
|
|
|
Money market funds
|
|
$
|
755,501
|
|
|
$
|
—
|
|
|
$
|
—
|
|
|
Derivative contracts
|
|
|
—
|
|
|
|
25,773
|
|
|
|
—
|
|
|
|
|
|
|
Total
|
|
$
|
755,501
|
|
|
$
|
25,773
|
|
|
$
|
—
|
|
|
|
|
|
|
|
|
|
|
|
|
|
|
|
|
|
|
|
|
Liabilities
|
|
|
|
|
|
|
|
|
|
|
|
|
|
Derivative contracts
|
|
$
|
—
|
|
|
$
|
(125,925
|
)
|
|
$
|
—
|
|
|
|
|
|
|
Total
|
|
$
|
—
|
|
|
$
|
(125,925
|
)
|
|
$
|
—
|
|
|
|
|
|
The following table represents the carrying amounts and
estimated fair values of Terra’s financial instruments at
December 31, 2009 and 2008.
| |
|
|
|
|
|
|
|
|
|
|
|
|
|
|
|
|
|
|
|
2009
|
|
|
2008
|
|
|
|
|
Carrying
|
|
|
Fair
|
|
|
Carrying
|
|
|
Fair
|
|
|
(in millions)
|
|
Amount
|
|
|
Value
|
|
|
Amount
|
|
|
Value
|
|
|
|
|
|
|
|
Financial Assets
|
|
|
|
|
|
|
|
|
|
|
|
|
|
|
|
|
|
Cash and cash equivalents
|
|
$
|
501.3
|
|
|
$
|
501.3
|
|
|
$
|
966.7
|
|
|
$
|
966.7
|
|
|
Margin deposits with derivative counterparties
|
|
|
—
|
|
|
|
—
|
|
|
|
36.9
|
|
|
|
36.9
|
|
|
Financial liabilities
|
|
|
|
|
|
|
|
|
|
|
|
|
|
|
|
|
|
Long-term debt
|
|
|
602.4
|
|
|
|
652.6
|
|
|
|
330.0
|
|
|
|
241.3
|
|
|
Preferred shares
|
|
|
0.5
|
|
|
|
1.6
|
|
|
|
1.5
|
|
|
|
2.7
|
|
|
|
|
|
78
The following methods and assumptions were used to estimate the
fair value of each class of financial instrument:
|
|
|
|
| |
§
|
Cash and receivables: The carrying amounts approximate
fair value because of the short maturity of those instruments.
|
|
| |
| |
§
|
Long-term debt: The fair value of our long-term debt is
estimated by discounting expected cash flows at the rates
currently offered for debt of the same remaining maturities.
|
|
| |
| |
§
|
Preferred shares: Preferred shares are valued on the
basis of market quotes, when available and management estimates
based on comparisons with similar instruments that are publicly
traded.
|
|
Concentration of Credit Risk: We are subject to credit
risk through trade receivables and short-term investments.
Although a substantial portion of our debtors’ ability to
pay depends upon the agribusiness economic sector, credit risk
with respect to trade receivables generally is minimized due to
its geographic dispersion. Short-term cash investments are
placed in short duration corporate and government debt
securities funds with well-capitalized, high quality financial
institutions.
Financial Instruments: At December 31, 2009, we had
letters of credit outstanding totaling $8.0 million,
guaranteeing various insurance and financing activities.
7. Property,
Plant and Equipment, Net
Property, plant and equipment, net consisted of the following at
December 31:
| |
|
|
|
|
|
|
|
|
|
(in thousands)
|
|
2009
|
|
|
2008
|
|
|
|
|
|
|
|
Land
|
|
$
|
8,444
|
|
|
$
|
8,416
|
|
|
Buildings and improvements
|
|
|
60,985
|
|
|
|
57,352
|
|
|
Plant and equipment
|
|
|
948,441
|
|
|
|
862,057
|
|
|
Construction in progress
|
|
|
78,274
|
|
|
|
46,383
|
|
|
|
|
|
|
|
|
|
1,096,144
|
|
|
|
974,208
|
|
|
Less accumulated depreciation and amortization
|
|
|
(639,442
|
)
|
|
|
(570,895
|
)
|
|
|
|
|
|
Total
|
|
$
|
456,702
|
|
|
$
|
403,313
|
|
|
|
|
|
Depreciation expense for property, plant and equipment for the
years ending December 31, 2009, 2008 and 2007 was
$60.6 million, $51.8 million and $70.6 million,
respectively.
8. Equity
Investments
North
America
Our investments in North American companies that are accounted
for on the equity method of accounting consist of the following:
(1) 50 percent ownership interest in Point Lisas
Nitrogen Limited (PLNL), which operates an ammonia production
plant in Trinidad, (2) 50 percent interest in an
ammonia storage joint venture located in Houston, Texas and
(3) 50 percent interest in a joint venture in Oklahoma
CO2,
located in Verdigris, Oklahoma, which produces
CO2at
our Verdigris nitrogen plant. These investments were
$113.9 million and $131.6 million at December 31,
2009 and 2008, respectively. We include the net earnings of
these investments as equity in earnings of North American
affiliates as an element of income from operations because the
investees’ operations provide additional capacity to our
operations.
79
The combined results of operations and financial position of our
North American equity method investments are summarized below:
| |
|
|
|
|
|
|
|
|
|
|
|
|
|
(in thousands)
|
|
2009
|
|
|
2008
|
|
|
2007
|
|
|
|
|
|
|
|
Condensed income statement information:
|
|
|
|
|
|
|
|
|
|
|
|
|
|
Net sales
|
|
$
|
168,234
|
|
|
$
|
380,540
|
|
|
$
|
151,723
|
|
|
|
|
|
|
|
|
|
|
|
|
|
|
|
|
|
|
|
|
Net income
|
|
$
|
48,554
|
|
|
$
|
123,019
|
|
|
$
|
38,411
|
|
|
|
|
|
|
|
|
|
|
|
|
|
|
|
|
|
|
|
|
Terra’s equity in earnings of North American affiliates
|
|
$
|
17,702
|
|
|
$
|
56,237
|
|
|
$
|
16,209
|
|
|
|
|
|
| |
|
|
|
|
|
|
|
|
|
(in thousands)
|
|
2009
|
|
|
2008
|
|
|
|
|
|
|
|
Condensed balance sheet information:
|
|
|
|
|
|
|
|
|
|
Current assets
|
|
$
|
52,701
|
|
|
$
|
50,582
|
|
|
Long-lived assets
|
|
|
156,825
|
|
|
|
173,631
|
|
|
|
|
|
|
Total assets
|
|
$
|
209,526
|
|
|
$
|
224,213
|
|
|
|
|
|
|
|
|
|
|
|
|
|
|
|
|
Current liabilities
|
|
$
|
23,041
|
|
|
$
|
20,212
|
|
|
Long-term liabilities
|
|
|
19,083
|
|
|
|
19,380
|
|
|
Equity
|
|
|
167,402
|
|
|
|
184,621
|
|
|
|
|
|
|
Total liabilities and equity
|
|
$
|
209,526
|
|
|
$
|
224,213
|
|
|
|
|
|
The carrying value of these investments at December 31,
2009 was $30.2 million more than our share of the
affiliates’ book value. The excess is attributable
primarily to the
step-up in
basis for fixed asset values, which is being depreciated over a
period of approximately 15 years. Our equity in earnings of
unconsolidated subsidiaries is different than our ownership
interest in income reported by the unconsolidated subsidiaries
due to deferred profits on intergroup transactions and
amortization of basis differences.
We have transactions in the normal course of business with PLNL,
whereby we are obliged to purchase 50 percent of the
ammonia produced by PLNL at current market prices. During the
year ended December 31, 2009, we purchased approximately
$79.1 million of ammonia from PLNL. During the year ended
December 31, 2008, we purchased approximately
$182.4 million of ammonia from PLNL.
The total cash distributions from our North American equity
method investments were $35.8 million, $72.8 million,
and $29.5 million at December 31, 2009, 2008 and 2007,
respectively.
United
Kingdom
On September 14, 2007, we completed the formation of
GrowHow UK Limited (GrowHow), a joint venture between Terra and
Kemira GrowHow Oyj (Kemira). Pursuant to the joint venture
agreement, we contributed our United Kingdom subsidiary Terra
Nitrogen (UK) Limited to the joint venture for a 50 percent
interest. Subsequent to the formation, we have accounted for our
investment in GrowHow as a non-operating equity method
investment. We do not include the net earnings of this
investment as an element of income from operations since the
investees’ operations do not provide additional capacity to
us, nor are its operations integrated with our supply chain in
North America. The GrowHow joint venture includes the Kemira
site at Ince and our former Teeside and Severnside sites.
In conjunction with the formation of GrowHow, we commenced the
closure of our Severnside, U.K. facility. Pursuant to the
agreement with Kemira, we are responsible for the remediation
costs required to prepare the Severnside site for disposal.
During 2009, Severnside underwent remediation and we incurred
$8.7 million in relation to the remediation costs. We
estimate a remaining $2-3 million in remediation cost to be
incurred in 2010. Upon the disposition of
80
Severnside, Terra is entitled to receive the net sales proceeds.
We anticipate the proceeds related to the sale of the Severnside
land will exceed the total cost of reclamation of the site.
The Joint Venture Contribution Agreement specifies that we are
entitled to receive balancing consideration payments up to
£60 million based on GrowHow’s operating results
for fiscal 2008 to 2010. Pursuant to agreements with Kemira, we
received minimum balancing consideration and other payments
totaling £13.7 million ($21.2 million) and
£38.0 million ($61.3 million) during the year
ended December 31, 2009 and 2008, respectively. We also
received $27.4 million from GrowHow during 2008 for the
refund of working capital contributions in excess of amounts
specified in the Joint Venture Contribution Agreement. The
carrying value of this equity method investment was
$144.9 million and $139.3 million at December 31,
2009 and 2008, respectively.
The financial position of our equity method investment in
GrowHow at December 31, 2009 and 2008 and the results of
operations for the year ended December 31, 2009, 2008 and
2007 are summarized below.
| |
|
|
|
|
|
|
|
|
|
|
|
|
|
(in thousands)
|
|
2009
|
|
|
2008
|
|
|
2007
|
|
|
|
|
|
|
|
Condensed income statement information:
|
|
|
|
|
|
|
|
|
|
|
|
|
|
Net sales
|
|
$
|
494,202
|
|
|
$
|
1,111,272
|
|
|
$
|
233,103
|
|
|
|
|
|
|
Net income
|
|
$
|
38,691
|
|
|
$
|
191,781
|
|
|
$
|
4,253
|
|
|
|
|
|
|
Terra’s equity in earnings (losses)
of GrowHow
|
|
$
|
14,177
|
|
|
$
|
95,578
|
|
|
$
|
(2,718
|
)
|
|
|
|
|
| |
|
|
|
|
|
|
|
|
|
(in thousands)
|
|
2009
|
|
|
2008
|
|
|
|
|
|
|
|
Condensed balance sheet information:
|
|
|
|
|
|
|
|
|
|
Current assets
|
|
$
|
206,225
|
|
|
$
|
212,992
|
|
|
Long-lived assets
|
|
|
288,101
|
|
|
|
239,589
|
|
|
|
|
|
|
Total assets
|
|
$
|
494,326
|
|
|
$
|
452,581
|
|
|
|
|
|
|
|
|
|
|
|
|
|
|
|
|
Current liabilities
|
|
$
|
82,877
|
|
|
$
|
86,471
|
|
|
Long-term liabilities
|
|
|
186,257
|
|
|
|
132,754
|
|
|
Equity
|
|
|
225,192
|
|
|
|
233,356
|
|
|
|
|
|
|
Total liabilities and equity
|
|
$
|
494,326
|
|
|
$
|
452,581
|
|
|
|
|
|
The carrying value of these investments at December 31,
2009 and 2008, was $32.3 million and $22.7 million,
respectively, more than our share of GrowHow’s book value.
The excess is attributable to basis differences for fixed asset
values, which is being depreciated over a period of
12 years, and the balancing consideration payment from
GrowHow as previously discussed. Our equity in earnings of
GrowHow is different than our ownership interest in
GrowHow’s net income due to the amortization of basis
differences.
81
9. Revolving
Credit Facility and Long-Term Debt
Long-term debt and capital lease obligations consisted of the
following at December 31:
| |
|
|
|
|
|
|
|
|
|
(in thousands)
|
|
2009
|
|
|
2008
|
|
|
|
|
|
|
|
Unsecured Senior Notes, 7.0%
due 2017
|
|
$
|
12,525
|
|
|
$
|
330,000
|
|
|
Unsecured Senior Notes, 7.75%
due 2019
|
|
|
600,000
|
|
|
|
—
|
|
|
|
|
|
|
|
|
|
612,525
|
|
|
|
330,000
|
|
|
Less net unamortized debt discount
|
|
|
(10,091
|
)
|
|
|
—
|
|
|
Less current maturities
|
|
|
—
|
|
|
|
—
|
|
|
|
|
|
|
Total long-term debt
|
|
$
|
602,434
|
|
|
$
|
330,000
|
|
|
|
|
|
In October 2009, we issued $600 million of
7.75 percent Unsecured Senior Notes due in 2019 (2019
Notes) in order to fund the special cash dividend and refinance
our Senior Unsecured Notes due in 2017 (2017 Notes). The notes
are unconditionally guaranteed by Terra and certain of its
U.S. subsidiaries, see Note 24, Guarantor
Subsidiaries, of the Notes to the Consolidated Financial
Statements. These notes and guarantees are unsecured and will
rank equal in right of payment with any existing and future
senior obligations of such guarantors.
The Indenture governing the 2019 Notes contains covenants that
limit, among other things, our ability to: incur additional
debt, pay dividends on common stock of Terra or repurchase
shares of such common stock, make certain investments, sell
assets, enter into transactions with affiliates, limit dividends
or other payments by our restricted subsidiaries, enter into
sale and leaseback transactions, engage in other businesses,
sell all or substantially all of our assets or merge with or
into other companies, and reduce our insurance coverage.
Upon a Change of Control (as defined in the Indenture), such as
the proposed merger pursuant to the Agreement and Plan of Merger
by and among Yara International ASA, Yukon Merger Sub, Inc. and
Terra, dated as of February 12, 2010 (see Note 27,
Subsequent Events, of the Notes to the Consolidated
Financial Statements), we are obligated to repurchase the 2019
Notes at a cash price equal to 101 percent of the aggregate
principal amount outstanding at that time, plus accrued interest
as of the date of purchase. The Indenture governing the 2019
Notes contains events of default and remedies customary for a
financing of this type.
On September 24, 2009, we commenced a cash tender offer for
any and all of the 2017 Notes. On October 27, 2009, we
announced completion of the tender offer and received tenders
from holders of approximately $317.5 aggregate principal amount
of the 2017 Notes, representing approximately 96.2 percent
of the outstanding notes. As of December 31, 2009, the
outstanding debt balance related to the 2017 Notes is
$12.5 million. We recorded a $53.5 million pre-tax
loss ($32.4 million, net of tax) on the early retirement of
debt which consisted of $48.8 million for the early call
premium, $4.5 million of unamortized issuance costs, and
$0.2 million in related expenses for the tender of the 2017
Notes. There are no covenants on the remaining 2017 Notes.
We have revolving credit facilities totaling $200 million
that expire January 31, 2012. The revolving facilities are
secured by substantially all of our working capital. Borrowing
availability is generally based on 100 percent of eligible
cash balances, 85 percent of eligible accounts receivable,
approximately 60 percent of eligible finished goods
inventory and is reduced by outstanding letters of credit. These
facilities include $50 million only available for the use
of Terra Nitrogen Company L.P. (TNCLP), one of our consolidated
subsidiaries. Borrowings under the revolving facilities will
bear interest at a floating rate plus an applicable margin,
which can be either a base rate, or, at our option, a London
Interbank Offered Rate (LIBOR). At December 31, 2009, the
LIBOR rate was 0.24 percent. The base rate is the highest
of (1) Citibank, N.A.’s base rate (2) the federal
funds effective rate, plus one-half percent (0.50 percent)
per annum and (3) the base three month certificate of
deposit rate, plus one-half percent (0.50 percent) per
annum, plus an applicable margin in each case. LIBOR loans will
bear interest at LIBOR plus an applicable margin. The applicable
margins for base rate loans and LIBOR loans are
2.00 percent and 3.00 percent, respectively, at
82
December 31, 2009. The facilities require an initial
three-quarter percent (0.75 percent) commitment fee on the
difference between committed amounts and amounts actually
borrowed.
At December 31, 2009, we had no outstanding revolving
credit borrowings and $8.0 million in outstanding letters
of credit. The $8.0 million in outstanding letters of
credit reduced our borrowing availability to $192.0 million
at December 31, 2009. The credit facilities require that we
adhere to certain limitations on additional debt, capital
expenditures, acquisitions, liens, asset sales, investments,
prepayments of subordinated indebtedness, changes in lines of
business and transactions with affiliates. If our borrowing
availability falls below $60 million, we are required to
have achieved minimum operating cash flows or earnings before
interest, income taxes, depreciation, amortization and other
non-cash items of $60 million during the most recent four
quarters.
The facilities also require that there be no change of control
related to Terra, such that no individual or group acquires more
than 35 percent of the outstanding voting shares of Terra.
Such a change of control, such as the proposed merger pursuant
to the Agreement and Plan of Merger by and among Yara
International ASA, Yukon Merger Sub, Inc. and Terra, dated as of
February 12, 2010 (see Note 27, Subsequent
Events, of the Notes to the Consolidated Financial
Statements), would constitute an event of default under the
facilities.
10. Turnaround
Costs
The following represents a summary of the deferred plant
turnaround costs for the year ended December 31, 2009 and
2008:
| |
|
|
|
|
|
|
|
|
|
|
|
|
|
|
|
|
|
|
|
|
|
|
|
|
|
|
Turnaround
|
|
|
|
|
|
Currency
|
|
|
|
|
|
|
|
Beginning
|
|
|
Costs
|
|
|
Turnaround
|
|
|
Translation
|
|
|
Ending
|
|
|
(in thousands)
|
|
Balance
|
|
|
Capitalized
|
|
|
Amortization
|
|
|
Adjustments
|
|
|
Balance
|
|
|
|
|
|
|
|
Year ended:
|
|
|
|
|
|
|
|
|
|
|
|
|
|
|
|
|
|
|
|
|
|
December 31, 2009
|
|
$
|
23,467
|
|
|
$
|
25,427
|
|
|
$
|
(24,267
|
)
|
|
$
|
384
|
|
|
$
|
25,011
|
|
|
December 31, 2008
|
|
$
|
42,190
|
|
|
$
|
10,125
|
|
|
$
|
(27,017
|
)
|
|
$
|
(1,831
|
)
|
|
$
|
23,467
|
|
|
|
|
11.
|
Accrued and Other
Current Liabilities
|
Accrued and other current liabilities consisted of the following
at December 31:
| |
|
|
|
|
|
|
|
|
|
(in thousands)
|
|
2009
|
|
|
2008
|
|
|
|
|
|
|
|
Payroll and benefit costs
|
|
$
|
18,913
|
|
|
$
|
27,104
|
|
|
Accrued CF defense costs
|
|
|
14,730
|
|
|
|
—
|
|
|
Income taxes payable
|
|
|
9,441
|
|
|
|
63,999
|
|
|
Accrued interest
|
|
|
8,898
|
|
|
|
9,748
|
|
|
Accrued property taxes
|
|
|
3,554
|
|
|
|
3,291
|
|
|
Current accrued phantom shares
|
|
|
3,449
|
|
|
|
4,341
|
|
|
Accrued consulting
|
|
|
1,972
|
|
|
|
1,390
|
|
|
Deferred revenue
|
|
|
1,530
|
|
|
|
3,346
|
|
|
Unrecognized tax benefit (see Note 21)
|
|
|
1,506
|
|
|
|
—
|
|
|
Other
|
|
|
14,799
|
|
|
|
14,551
|
|
|
|
|
|
|
Total
|
|
$
|
78,792
|
|
|
$
|
127,770
|
|
|
|
|
|
83
12. Other
Liabilities
Other liabilities consisted of the following at December 31:
| |
|
|
|
|
|
|
|
|
|
(In thousands)
|
|
2009
|
|
|
2008
|
|
|
|
|
|
|
|
Unrecognized tax benefit (See Note 21)
|
|
$
|
60,904
|
|
|
$
|
35,949
|
|
|
Long-term medical and closed facilities reserve
|
|
|
21,483
|
|
|
|
23,887
|
|
|
Long-term deferred revenue
|
|
|
9,178
|
|
|
|
10,488
|
|
|
Accrued phantom shares
|
|
|
2,355
|
|
|
|
2,430
|
|
|
Other
|
|
|
7,206
|
|
|
|
5,799
|
|
|
|
|
|
|
Total
|
|
$
|
101,126
|
|
|
$
|
78,553
|
|
|
|
|
|
13. Commitments
and Contingencies
We are committed to various non-cancelable operating leases for
equipment, railcars and production, office and storage
facilities expiring on various dates through 2017.
Total minimum rental payments are as follows:
| |
|
|
|
|
|
(in thousands)
|
|
|
|
|
|
|
|
|
|
2010
|
|
$
|
43,273
|
|
|
2011
|
|
|
39,185
|
|
|
2012
|
|
|
31,058
|
|
|
2013
|
|
|
21,200
|
|
|
2014
|
|
|
11,741
|
|
|
2015 and thereafter
|
|
|
10,600
|
|
|
|
|
|
|
Net minimum lease payments
|
|
$
|
157,057
|
|
|
|
|
|
Total rental expense under all leases, including short-term
cancelable operating leases, was $24.2 million,
$23.5 million and $23.1 million for the years ended
December 31, 2009, 2008 and 2007, respectively.
We have entered into various contractual agreements that create
an obligation into the future. These agreements expire on
various dates through 2018 and are as follows:
| |
|
|
|
|
|
(in thousands)
|
|
|
|
|
|
|
|
|
|
2010
|
|
$
|
378,961
|
|
|
2011
|
|
|
126,987
|
|
|
2012
|
|
|
125,188
|
|
|
2013
|
|
|
118,317
|
|
|
2014
|
|
|
111,643
|
|
|
2015 and thereafter
|
|
|
410,400
|
|
|
|
|
|
|
Total obligations
|
|
$
|
1,271,496
|
|
|
|
|
|
Included above are purchase agreements for various services and
products relating to operations. These commitments include open
purchase orders, inventory purchase commitments and firm utility
and natural gas commitments. Our minimum commitments for natural
gas purchases which are floating-rate contracts are calculated
using the prevailing NYMEX forward prices at December 31,
2009.
We have a contractual agreement to purchase one-half of the
ammonia produced by PLNL, our joint venture ammonia plant
located in Trinidad. The purchase price is based on the average
market price of ammonia, F.O.B.
84
Caribbean, less a discount. The agreement is in place until
October of 2018. Assuming purchases of 360,000 short tons per
year at the three year average price paid, the annual purchase
obligation would be $102.6 million.
We are liable for retiree medical benefits of employees of coal
mining operations sold in 1993, under the Coal Industry Retiree
Health Benefit Act of 1992, which mandated liability for certain
retiree medical benefits for union coal miners. We have provided
reserves adequate to cover the estimated present-value of these
liabilities at December 31, 2009. Our long-term medical and
closed facilities reserve at December 31, 2009, includes
$21.5 million for expected future payments for the coal
operation’s retirees and other former employees. We may
recover a portion of these payments through our rights in
bankruptcy against Harman Coal Company (a former coal
subsidiary), and subject to damages received by Harman Coal
Company through its on-going litigation with Massey Energy
Company. No provision for such recoveries has been made in our
financial statements.
The Asset Retirement and Environmental Obligations topic of the
Codification requires recognition of a liability for the fair
value of a conditional asset retirement obligation if the fair
value of the liability can be reasonably estimated. We have
certain facilities that contain asbestos insulation around
certain piping and heated surfaces. The asbestos insulation is
in adequate condition to prevent leakage and can remain in place
as long as the facility is operated or remains assembled. We
plan to maintain the facilities in an adequate condition to
prevent leakage through our standard repair and maintenance
activities. We have not recorded a liability relating to the
asbestos insulation, as management believes that it is not
possible to reasonably estimate a settlement date for asbestos
insulation removal because the facilities have an indeterminate
life.
We are involved in various legal actions and claims, including
environmental matters, arising from the normal course of
business. Management believes that the ultimate resolution of
these matters will not have a material adverse effect on the
results of our operations, financial position or net cash flows.
14. Preferred
Shares
The components of preferred shares outstanding at December 31:
| |
|
|
|
|
|
|
|
|
|
|
|
|
|
|
|
|
|
|
|
2009
|
|
|
2008
|
|
|
|
|
Number
|
|
|
Carrying
|
|
|
Number
|
|
|
Carrying
|
|
|
(in thousands)
|
|
of shares
|
|
|
Value
|
|
|
of shares
|
|
|
Value
|
|
|
|
|
|
|
|
Series A Preferred Shares
(120,000 shares authorized,
$1,000 per share liquidation value)
|
|
|
500
|
|
|
$
|
483
|
|
|
|
1,600
|
|
|
$
|
1,544
|
|
We have 500 shares of Series A Preferred Shares with a
liquidation value of $1,000 per share outstanding at
December 31, 2009 and 1,600 shares with a liquidation
value of $1,000 per share at December 31, 2008. Cumulative
dividends of $10.625 per share are payable quarterly. The
Series A Preferred Shares are not redeemable, but are
convertible into our common stock at the option of the holder
for a conversion price of $9.96 per common share. The
Series A Preferred Shares may automatically be converted to
common shares after December 20, 2009 if the closing price
for our common shares exceeds 140 percent of the conversion
price for any twenty days within a consecutive thirty day period
prior to such conversion. Upon the occurrence of a fundamental
change to our capital structure, including a change of control,
merger, or sale of Terra, such as the proposed merger pursuant
to the Agreement and Plan of Merger by and among Yara
International ASA, Yukon Merger Sub, Inc. and Terra, dated as of
February 12, 2010 (see Note 27, Subsequent
Events, of the Notes to the Consolidated Financial
Statements), holders of the Series A Preferred Shares may
require us to purchase any or all of their shares at a price
equal to their liquidation value plus any accumulated, but
unpaid, dividends. We also have the right, under certain
conditions, to require holders of the Series A Preferred
Shares to exchange their shares for convertible subordinated
debentures with similar terms. The merger agreement with Yara
International ASA and Yukon Merger Sub, Inc. requires Terra to
convert all outstanding Series A Preferred Shares into
common stock prior to the closing of the proposed merger. On
February 24, 2010, we announced that all outstanding
Series A Preferred Shares will convert to shares of common
stock on March 15, 2010.
85
In 2008, we commenced offers (the inducement offers) to pay a
cash premium to holders of the Series A Preferred Shares
who elected to convert their Series A Preferred Shares into
shares of Terra common stock. At total of 118,400 shares,
or 99 percent of the outstanding shares of Series A
Preferred Shares were surrendered and converted as part of the
inducement offers. In the aggregate, the former holders of the
Series A Preferred Shares received 11,887,550 shares
of Terra Industries common stock and a cash premium of
approximately $5.3 million.
The $5.3 million represents the difference between the fair
value of all securities and other consideration transferred in
the transaction to the preferred stockholders and the fair value
of securities issuable pursuant to the original conversion terms
of the Series A Preferred Shares less the costs related to
the inducement offer.
In 2009, a total of 1,100 shares of the outstanding
Series A Preferred Shares were surrendered and converted
into 110,442 shares of Terra Industries common stock and no
cash premium was paid.
15. Common
Stockholders’ Equity
Terra allocates $1.00 per share upon the issuance of Common
Shares to the Common Share capital account. The Common Shares
have no par value. At December 31, 2009, 0.8 million
common shares were reserved for issuance upon award of
restricted shares.
In 2009, Terra’s Board of Directors declared and paid the
following dividends:
| |
|
|
|
|
|
|
|
|
|
|
|
|
|
|
|
Declared and Paid
|
|
|
Date of Declaration
|
|
Date of Record
|
|
Date of Payment
|
|
Per Common Share
|
|
|
|
|
|
|
|
February 10, 2009
|
|
March 18, 2009
|
|
April 7, 2009
|
|
$
|
0.10
|
|
|
April 21, 2009
|
|
May 20, 2009
|
|
June 9, 2009
|
|
|
0.10
|
|
|
July 23, 2009
|
|
August 20, 2009
|
|
September 10, 2009
|
|
|
0.10
|
|
|
October 22, 2009
|
|
November 23, 2009
|
|
December 11, 2009
|
|
|
0.10
|
|
|
October 29, 2009
|
|
November 23, 2009
|
|
December 11, 2009
|
|
|
7.50
|
|
|
|
|
|
|
|
|
|
|
|
|
|
|
|
|
|
|
$
|
7.90
|
|
|
|
|
|
|
|
|
|
|
|
In 2008, Terra’s Board of Directors declared and paid the
following dividends:
| |
|
|
|
|
|
|
|
|
|
|
|
|
|
|
|
Declared and Paid
|
|
|
Date of Declaration
|
|
Date of Record
|
|
Date of Payment
|
|
Per Common Share
|
|
|
|
|
|
|
|
May 8, 2008
|
|
May 28, 2008
|
|
June 13, 2008
|
|
$
|
0.10
|
|
|
July 24, 2008
|
|
August 25, 2008
|
|
September 12, 2008
|
|
|
0.10
|
|
|
October 23, 2008
|
|
November 24, 2008
|
|
December 12, 2008
|
|
|
0.10
|
|
|
|
|
|
|
|
|
|
|
|
|
|
|
|
|
|
|
$
|
0.30
|
|
|
|
|
|
|
|
|
|
|
|
Future dividends are necessarily dependent upon future earnings,
capital requirements, general financial condition, general
business conditions, approval from our Board of Directors and
other factors. Pursuant to the terms of the Yara Merger
Agreement, Terra is restricted from paying dividends on shares
of our common stock other than the regular dividend for the
fourth quarter of 2009, which was declared by the Board of
Directors on February 18, 2010 to holders of record as of
March 17, 2010 and is payable on April 7, 2010, and
for the first quarter of 2010.
On October 29, 2009, Terra’s Board of Directors
declared a special cash dividend of $7.50 per share to holders
of record on November 23, 2009 and paid on
December 11, 2009. In connection with our special cash
dividend, we recorded a charge of $608.0 million to
retained earnings equal to the retained earnings balance at the
date of the dividend declaration with the excess of
$140.7 million charged to additional paid-in capital.
In connection with the Mississippi Chemical Corporation
(MCC) acquisition, we issued warrants to purchase
4.0 million of our common shares at $5.48 per share. These
warrants were valued at $21.1 million at the MCC closing.
During
86
2005, shareholders approved the issuance of the underlying
shares and the warrant value was reclassified to common
stockholders’ equity. During 2008, all of these warrants
were exercised and were redeemed for common shares.
On May 6, 2008, the Board of Directors adopted a resolution
for the repurchase of 12,841,717 shares, representing
14 percent of our then outstanding common stock. The stock
buyback program commenced on May 7, 2008 and has been and
will be conducted on the open market, in private transactions or
otherwise at such times prior to June 30, 2010, and at such
prices we determine appropriate. Purchases may be commenced or
suspended at any time without notice. As of December 31,
2009, there were 7,448,662 shares available to be purchased
under the plan. There were no share repurchases during the year
ending December 31, 2009.
16. Share-Based
Compensation
We sponsor two share-based compensation plans, the Terra
Industries Inc. Stock Incentive Plan of 2002 (2002 Plan) and the
Terra Industries Inc. 2007 Omnibus Incentive Compensation Plan
(2007 Plan). The Terra Industries Inc. 1997 Stock Incentive Plan
expired and the remaining awards were exercised in 2008. As of
December 31, 2009 there were approximately
7,000,000 shares authorized in the 2002 and 2007 Plans. Of
the total authorized shares, approximately 875,000 and
3,047,000 shares are available in the 2002 Plan and the
2007 Plan, respectively. The 2002 Plan has 383,900 shares
reserved and the 2007 Plan has 376,500 shares reserved.
On February 12, 2010, the Compensation Committee of our
Board of Directors approved an adjustment to the total number of
shares available under the 2007 Plan to account for our special
cash dividend of $7.50 per common share that was paid on
December 11, 2009.
Awards granted under the plans may consist of incentive stock
options (ISOs) or non-qualified stock options (NQSOs), stock
appreciation rights (SARs), nonvested stock awards or other
share-based awards (i.e. performance shares), with the exception
that non-employee directors may not be granted SARs and only
employees of Terra may be granted ISOs.
The Compensation Committee of our Board of Directors administers
the plans and determines the exercise price, exercise period,
vesting period and all other terms of the grant. All share-based
awards to directors, officers and employees expire ten years
after the date of the grant. ISOs and NQSOs, which are not
exercised after vesting, expire ten years after the date of the
award. The vesting period for nonvested stock is determined at
the grant date of the award; the vesting period is usually three
years. The vesting date for other share-based awards is also set
at the time of the award but can vary in length; there is
usually no expiration date for other share-based awards.
On February 12, 2010, the Compensation Committee of our
Board of Directors approved an adjustment to the number of
outstanding, nonvested stock shares with performance conditions
and to the number of outstanding phantom share awards as of
December 11, 2009 in order to preserve the value of such
awards following a special cash dividend of $7.50 per common
share that was paid on December 11, 2009.
We account for our stock-based compensation in accordance with
ASC 718, Compensation—Stock Compensation, using the
modified prospective method, which requires companies to record
stock compensation expense for all non-vested and new awards
beginning as of January 1, 2006. Under ASC Topic 718, we
measure and record compensation expense for our nonvested share
awards based on their fair value of our common stock at the date
of grant. Compensation expense is recognized for nonvested stock
awards on a straight-line basis over the vesting period. Our
phantom shares, however, are liability awards as they settle in
cash; therefore, we measure and record compensation expense for
these awards based on their fair value at the end of each
reporting period until their vesting date. This may cause
fluctuations in earnings that do not exist under the accounting
requirements for our nonvested shares. ASC 718 requires
forfeitures to be estimated at the time of grant and revised, if
necessary, in subsequent periods if actual forfeitures differ
from initial estimates. We have thus recorded stock-based
compensation expense net of estimated forfeitures. Cash flows
resulting from the tax benefits due to tax deductions in excess
of the compensation cost recognized for those awards (excess tax
benefits) are classified as financing cash flows.
87
Compensation cost charged against income and the total income
tax benefit recognized for share-based compensation arrangements
is included below:
| |
|
|
|
|
|
|
|
|
|
|
|
|
|
|
|
Year ended December 31,
|
|
|
(in thousands)
|
|
2009
|
|
|
2008
|
|
|
2007
|
|
|
|
|
|
|
|
Compensation cost charged to SG&A expense
|
|
$
|
16,174
|
|
|
$
|
8,104
|
|
|
$
|
31,452
|
|
|
|
|
|
|
Total compensation cost charged to income
|
|
$
|
16,174
|
|
|
$
|
8,104
|
|
|
$
|
31,452
|
|
|
|
|
|
|
Income tax benefit
|
|
$
|
6,389
|
|
|
$
|
2,836
|
|
|
$
|
11,008
|
|
|
|
|
|
Nonvested
Stock Shares and Phantom Share Awards
We currently have outstanding nonvested shares and phantom share
awards with both service conditions and performance conditions.
Nonvested stock shares and phantom share awards with service and
performance conditions usually “cliff vest” in three
years from the grant date. This means that the performance
conditions of the nonvested shares and phantom share awards are
based on a calculated return on capital over a three-year
period. For awards with performance conditions, the grants will
be forfeited if the performance conditions are not achieved.
We recognize compensation expense for nonvested stock share
awards over the vesting periods based on fair value, which is
equal to the market price of our stock on the date of grant.
During 2009, 2008 and 2007, we recorded compensation expense of
$9.6 million, $9.9 million and $11.0 million,
respectively. We recognize compensation expense for the phantom
share awards over the vesting periods based on fair value, which
is equal to the market price of our stock at each reporting
period date. The phantom share awards settle in cash. During
2009 we recognized a stock compensation expense of
$6.6 million related to phantom stock. We recorded a stock
compensation benefit of $1.8 million in 2008, compared to a
$20.4 million stock compensation expense in 2007. The
year-over-year
fluctuations in phantom stock expense are a direct result of our
stock performance since we mark these awards to market each
reporting period. Compensation costs for nonvested stock shares
and phantom share awards are reduced for estimated forfeitures
and then amortized to expense using the straight-line method.
For awards with performance conditions, we estimate the expected
number of awards to vest at the time of the award grant. We
record the compensation expense for the awards with performance
conditions ratably over the requisite service period related to
the performance condition, taking into consideration any changes
to the expected shares to vest as such matters arise.
A summary of the status of our nonvested share awards as of
December 31, 2009, and changes during the year then ended,
is:
| |
|
|
|
|
|
|
|
|
|
|
|
|
|
|
Weighted Average
|
|
|
|
|
|
|
|
Grant-Date
|
|
|
(in thousands, except fair values)
|
|
Shares
|
|
|
Fair Value
|
|
|
|
|
|
|
|
Outstanding at January 1, 2009
|
|
|
897
|
|
|
$
|
14.49
|
|
|
Granted
|
|
|
274
|
|
|
|
25.87
|
|
|
Vested
|
|
|
(624
|
)
|
|
|
14.25
|
|
|
Terminated
|
|
|
—
|
|
|
|
—
|
|
|
|
|
|
|
Outstanding at December 31, 2009
|
|
|
547
|
|
|
$
|
27.66
|
|
|
|
|
|
The fair value of the nonvested shares and phantom shares that
vested during 2009 was $19.9 million and $6.8 million,
respectively. The fair value of the nonvested shares and phantom
shares that vested during 2008 was $38.1 million and
$5.1 million, respectively.
At December 31, 2009, the total unrecognized compensation
cost related to all nonvested share awards was
$7.1 million. That cost is expected to be recognized over a
weighted-average period of 1.3 years.
88
17. Retirement
Benefit Plans
We maintain defined benefit pension plans that cover certain
salaried and hourly employees. Benefits are based on a pay
formula. In 2008, we adopted the measurement date provisions of
the Compensation for Retirement Benefits topic of the
Codification and converted to a December 31 measurement date. We
had previously used a September 30 measurement date in 2007.
This adoption resulted in a $1.0 million decrease in
retained earnings related to the additional pension expense for
the period from October 1, 2007 through December 31,
2007.
The defined benefit plans’ assets consist principally of
equity securities and corporate and government debt securities.
We also have certain non-qualified pension plans covering
executives, which are unfunded. We accrue pension costs based
upon actuarial information we obtain for each plan and fund
these costs in accordance with statutory requirements.
The components of net periodic pension expense are:
| |
|
|
|
|
|
|
|
|
|
|
|
|
|
(in thousands)
|
|
2009
|
|
|
2008
|
|
|
2007
|
|
|
|
|
|
|
|
Service cost
|
|
$
|
2,754
|
|
|
$
|
3,665
|
|
|
$
|
3,113
|
|
|
Interest cost
|
|
|
19,339
|
|
|
|
23,239
|
|
|
|
17,648
|
|
|
Adjustment for measurement date change
|
|
|
—
|
|
|
|
(5,380
|
)
|
|
|
—
|
|
|
Expected return on plan assets
|
|
|
(19,125
|
)
|
|
|
(18,804
|
)
|
|
|
(18,063
|
)
|
|
Amortization of prior service cost
|
|
|
(38
|
)
|
|
|
(37
|
)
|
|
|
(36
|
)
|
|
Amortization of actuarial loss
|
|
|
963
|
|
|
|
646
|
|
|
|
1,871
|
|
|
|
|
|
|
Pension expense
|
|
$
|
3,893
|
|
|
$
|
3,329
|
|
|
$
|
4,533
|
|
|
|
|
|
We have defined benefit plans in the U.S. and Canada.
During 2007, we contributed our Terra Nitrogen (UK) subsidiary
into a joint venture. The joint venture assumed the pension
liabilities associated with Terra Nitrogen (UK). We administer
our plans to comply with the applicable laws in each country.
89
The following table reconciles, by geographic location, the
plans’ funded status to amounts included in the
Consolidated Statements of Financial Position at
December 31, 2009:
| |
|
|
|
|
|
|
|
(in thousands)
|
|
U.S.
|
|
Canada
|
|
Total
|
|
|
|
|
|
Change in Projected Benefit Obligation Present Value
|
|
|
|
|
|
|
|
Projected benefit obligation—beginning of year
|
|
$251,835
|
|
$40,170
|
|
$292,005
|
|
Service cost
|
|
1,725
|
|
1,029
|
|
2,754
|
|
Interest cost
|
|
16,440
|
|
2,899
|
|
19,339
|
|
Actuarial gain
|
|
24,706
|
|
(738)
|
|
23,968
|
|
Foreign currency exchange rate changes
|
|
—
|
|
6,751
|
|
6,751
|
|
Benefits paid
|
|
(15,861)
|
|
(1,509)
|
|
(17,370)
|
|
|
|
|
|
Projected benefit obligation—end of year
|
|
278,845
|
|
48,602
|
|
327,447
|
|
|
|
|
|
Change in Plan Assets
|
|
|
|
|
|
|
|
Fair value plan assets—beginning of year
|
|
243,709
|
|
41,542
|
|
285,251
|
|
Actual return on plan assets
|
|
22,146
|
|
5,931
|
|
28,077
|
|
Foreign currency exchange rate changes
|
|
—
|
|
7,351
|
|
7,351
|
|
Employer contribution
|
|
706
|
|
1,686
|
|
2,392
|
|
Benefits paid
|
|
(15,861)
|
|
(1,509)
|
|
(17,370)
|
|
|
|
|
|
Fair value plan assets—end of year
|
|
250,700
|
|
55,001
|
|
305,701
|
|
|
|
|
|
Funded Status
|
|
(28,145)
|
|
6,399
|
|
(21,746)
|
|
Unrecognized net actuarial loss
|
|
37,236
|
|
5,341
|
|
42,577
|
|
Unrecognized prior service cost
|
|
(199)
|
|
—
|
|
(199)
|
|
|
|
|
|
Prepaid benefit cost
|
|
$ 8,892
|
|
$ 11,740
|
|
$ 20,632
|
|
|
|
|
90
The following table reconciles, by geographic location, the
plans’ funded status to amounts included in the
Consolidated Statements of Financial Position at
December 31, 2008:
| |
|
|
|
|
|
|
|
|
|
|
|
|
|
(in thousands)
|
|
U.S.
|
|
|
Canada
|
|
|
Total
|
|
|
|
|
|
|
|
Change in Projected Benefit Obligation Present Value
|
|
|
|
|
|
|
|
|
|
|
|
|
|
Projected benefit obligation—beginning of year
|
|
$
|
253,446
|
|
|
$
|
52,171
|
|
|
$
|
305,617
|
|
|
Service cost
|
|
|
2,134
|
|
|
|
1,531
|
|
|
|
3,665
|
|
|
Interest cost
|
|
|
19,808
|
|
|
|
3,431
|
|
|
|
23,239
|
|
|
Actuarial gain
|
|
|
(4,118
|
)
|
|
|
(4,501
|
)
|
|
|
(8,619
|
)
|
|
Foreign currency exchange rate changes
|
|
|
—
|
|
|
|
(10,131
|
)
|
|
|
(10,131
|
)
|
|
Benefits paid
|
|
|
(19,435
|
)
|
|
|
(2,331
|
)
|
|
|
(21,766
|
)
|
|
|
|
|
|
Projected benefit obligation—end of year
|
|
|
251,835
|
|
|
|
40,170
|
|
|
|
292,005
|
|
|
|
|
|
|
Change in Plan Assets
|
|
|
|
|
|
|
|
|
|
|
|
|
|
Fair value plan assets—beginning of year
|
|
|
250,319
|
|
|
|
56,000
|
|
|
|
306,319
|
|
|
Actual return on plan assets
|
|
|
12,137
|
|
|
|
(3,395
|
)
|
|
|
8,742
|
|
|
Foreign currency exchange rate changes
|
|
|
—
|
|
|
|
(10,634
|
)
|
|
|
(10,634
|
)
|
|
Employer contribution
|
|
|
688
|
|
|
|
1,902
|
|
|
|
2,590
|
|
|
Benefits paid
|
|
|
(19,435
|
)
|
|
|
(2,331
|
)
|
|
|
(21,766
|
)
|
|
|
|
|
|
Fair value plan assets—end of year
|
|
|
243,709
|
|
|
|
41,542
|
|
|
|
285,251
|
|
|
|
|
|
|
Funded Status
|
|
|
(8,126
|
)
|
|
|
1,372
|
|
|
|
(6,754
|
)
|
|
Unrecognized net actuarial loss
|
|
|
18,394
|
|
|
|
9,147
|
|
|
|
27,541
|
|
|
Unrecognized prior service cost
|
|
|
(236
|
)
|
|
|
—
|
|
|
|
(236
|
)
|
|
|
|
|
|
Prepaid benefit cost
|
|
$
|
10,032
|
|
|
$
|
10,519
|
|
|
$
|
20,551
|
|
|
|
|
|
The amounts recognized in the Consolidated Statement of
Financial Position for the plans described above are as follows:
| |
|
|
|
|
|
|
|
|
|
(in thousands)
|
|
2009
|
|
|
2008
|
|
|
|
|
|
|
|
Accrued (prepaid) benefit cost
|
|
$
|
(20,632
|
)
|
|
$
|
(20,551
|
)
|
|
Accumulated other comprehensive loss
|
|
|
26,093
|
|
|
|
17,179
|
|
|
Deferred tax asset
|
|
|
16,285
|
|
|
|
10,126
|
|
|
Funding subsequent to valuation
|
|
|
—
|
|
|
|
—
|
|
|
|
|
|
|
Amount recognized (net)
|
|
|
21,746
|
|
|
|
6,754
|
|
|
Pension asset
|
|
|
6,481
|
|
|
|
3,275
|
|
|
Less: current portion
|
|
|
(706
|
)
|
|
|
(859
|
)
|
|
|
|
|
|
Pension liabilities (gross)
|
|
$
|
27,521
|
|
|
$
|
9,170
|
|
|
|
|
|
The accumulated benefit obligation for our pension plans was
$315.5 million and $282.1 million at December 31,
2009 and 2008, respectively. The projected benefit obligation
for our pension plans was $327.4 million and
$292.0 million at December 31, 2009 and 2008,
respectively. Pension plan assets were $21.7 million less
than the projected benefit obligation at December 31, 2009
and were $6.8 million less than the projected benefit
obligation at December 31, 2008.
We have two pension plans in the United States—Terra
Industries Inc. Employees’ Retirement Plan (Employee’s
Retirement Plan) and Terra Industries Inc. Excess Benefit Plan
(Excess Benefit Plan). Our Employees Retirement
91
Plan is not fully funded and has a $17.4 million liability
balance. Our Excess Benefit Plan is not funded and has a $10.8
liability balance.
The assumptions used to determine the actuarial present value of
benefit obligations and pension expense during each of the years
ended December 31 were as follows:
| |
|
|
|
|
|
|
|
|
|
|
|
|
|
|
|
2009
|
|
|
2008
|
|
|
2007
|
|
|
|
|
|
|
|
Weighted average discount rate
|
|
|
5.9
|
%
|
|
|
6.7
|
%
|
|
|
6.3
|
%
|
|
Long-term per annum compensation increase
|
|
|
3.5
|
%
|
|
|
4.1
|
%
|
|
|
3.6
|
%
|
|
Long-term return on plan assets
|
|
|
6.2
|
%
|
|
|
6.6
|
%
|
|
|
5.4
|
%
|
|
|
|
|
We employ a total return investment approach whereby a mix of
equities and fixed income investments are used to maximize the
long-term return of plan assets for a prudent level of risk. The
intent of this strategy is to minimize plan expenses by
outperforming plan liabilities over the long run. Risk tolerance
is established through careful consideration of plan
liabilities, plan funded status, and our corporate financial
condition. The investment portfolio contains a diversified blend
of equity and fixed income investments. Derivatives may be used
to gain market exposure in an efficient and timely manner;
however, derivatives may not be used to leverage the portfolio
beyond the market value of the underlying investments.
Investment risk is measured and monitored on an ongoing basis
through annual liability measurements, periodic asset/liability
studies, and quarterly investment portfolio reviews.
We select a long-term rate of return of each of our plans
individually. We consult with our two actuaries, as well as each
of the fund’s money managers. The expected long-term rate
of return is based on the portfolio as a whole and not on the
sum of the returns on individual asset categories. While
historical returns are taken into consideration, current market
trends such as inflation and current equity and fixed income
returns are also taken into consideration.
The percentage of the Fair Market Value of the total plan assets
for each major asset category of the plan’s assets is as
follows:
| |
|
|
|
|
|
|
|
|
|
|
|
2009
|
|
|
2008
|
|
|
|
|
|
|
|
Asset Allocation
|
|
|
|
|
|
|
|
|
|
Equities
|
|
|
12.3
|
%
|
|
|
11.3
|
%
|
|
Bonds
|
|
|
81.1
|
%
|
|
|
81.7
|
%
|
|
Cash and cash equivalents
|
|
|
6.6
|
%
|
|
|
7.0
|
%
|
|
|
|
|
|
|
|
|
100.0
|
%
|
|
|
100.0
|
%
|
|
|
|
|
Fair Value
Measurements
The pension plan assets are valued at fair value. The following
is a description of the valuation methodologies used for the
investments measured at fair value, including the general
classification of such instruments pursuant to the requirements
of ASC 715, Compensation–Retirement Benefits.
Cash and cash equivalents – These investments
consist of U.S. dollars and foreign currencies and other
securities with maturities generally less than one year. Cash
Equivalents that are readily liquid and redeemable at par are
classified as Level 1 investments. Cash Equivalents
consisting of currency forwards, Treasuries, and other
securities are classified as Level 2 investments.
Corporate, state, mortgage, and municipal debt
securities – Corporate, State, Mortgage, and
Municipal debt securities consist of fixed income securities
issued by U.S. and
non-U.S. corporations,
U.S. states and municipalities. These assets are valued
using data provided by independent pricing sources. These
securities are classified as Level 2 investments.
Common collective trusts – Common collective
trusts are comprised of shares or units in commingled funds that
are not publicly traded. The underlying assets in these funds
(equity securities, fixed income securities, and
92
commodity-related securities) are publicly traded on exchanges
and price quotes for the assets held by these funds are readily
available. Holdings of common collective trusts are classified
as Level 2 investments.
Registered investment companies – Registered
Investment Companies are mutual funds, unit trusts, and other
commingled funds registered with the Securities and Exchange
Commission. Mutual fund and unit trust shares are traded
actively on public exchanges. The share prices for mutual funds
and unit trusts are published at the close of each business day.
These assets are classified as Level 1 investments.
Common and preferred stock – This investment
category consists of common and preferred stock issued by
U.S. and
non-U.S. corporations.
Common and preferred shares are traded actively on exchanges and
price quotes for these shares are readily available. These
securities are classified as Level 1 investments.
Government securities – Government Securities
consist of bills, notes, bonds, and other fixed income
securities issued directly by the U.S. Treasury,
government-sponsored enterprises, or treasuries of
non-U.S. governments.
These assets are valued using data provided by independent
pricing sources. These securities are classified as Level 2
investments.
Options, futures, and swaps – Exchange-traded
options and futures are traded actively on exchanges and price
quotes for these assets are readily available. These securities
are classified as Level 1 investments. Swaps are traded
over the counter and are valued using data from independent
pricing sources and are classified as Level 2 investments.
As of December 31, 2009, the pension plan assets measured
at fair value on a recurring basis were as follows:
| |
|
|
|
|
|
|
|
|
|
|
|
|
|
|
|
|
|
|
|
|
|
|
|
Quoted Prices in Active
|
|
|
|
|
|
Significant
|
|
|
|
|
|
|
|
|
|
|
Markets for Identical
|
|
|
Significant Other
|
|
|
Unobservable
|
|
|
|
|
|
|
|
|
|
|
Assets
|
|
|
Observable Inputs
|
|
|
Inputs
|
|
|
|
|
|
|
|
|
(in thousands)
|
|
Level 1
|
|
|
Level 2
|
|
|
Level 3
|
|
|
Total
|
|
|
|
|
|
|
|
|
|
|
Cash and cash equivalents
|
|
$
|
7,396
|
|
|
$
|
12,652
|
|
|
$
|
—
|
|
|
$
|
20,048
|
|
|
|
|
|
|
Corporate debt instruments
|
|
|
—
|
|
|
|
170,396
|
|
|
|
—
|
|
|
|
170,396
|
|
|
|
|
|
|
Exchange-traded mutual funds
|
|
|
77,467
|
|
|
|
—
|
|
|
|
—
|
|
|
|
77,467
|
|
|
|
|
|
|
Collective mutual funds
|
|
|
—
|
|
|
|
88
|
|
|
|
—
|
|
|
|
88
|
|
|
|
|
|
|
Corporate and preferred stock
|
|
|
—
|
|
|
|
562
|
|
|
|
—
|
|
|
|
562
|
|
|
|
|
|
|
U.S. government securities
|
|
|
—
|
|
|
|
6,985
|
|
|
|
—
|
|
|
|
6,985
|
|
|
|
|
|
|
Non-U.S.
government securities
|
|
|
—
|
|
|
|
7,729
|
|
|
|
—
|
|
|
|
7,729
|
|
|
|
|
|
|
State and municipal securities
|
|
|
—
|
|
|
|
12,949
|
|
|
|
—
|
|
|
|
12,949
|
|
|
|
|
|
|
Mortgage obligations
|
|
|
—
|
|
|
|
5,496
|
|
|
|
—
|
|
|
|
5,496
|
|
|
|
|
|
|
Options, futures and swaps
|
|
|
(265
|
)
|
|
|
4,246
|
|
|
|
—
|
|
|
|
3,981
|
|
|
|
|
|
|
|
|
|
|
Totals
|
|
$
|
84,598
|
|
|
$
|
221,103
|
|
|
$
|
—
|
|
|
$
|
305,701
|
|
|
|
|
|
|
|
|
|
93
During the 2008 first quarter, we fully funded our Employees
Retirement Plan and our Canadian Pension Plan. As a result, we
changed our plan asset allocation to 25 percent and
75 percent for equities and bonds, respectively. The
expected benefits to be paid from the pension plan are as
follows:
| |
|
|
|
|
|
(in thousands)
|
|
Payments
|
|
|
|
|
|
|
|
Estimated Future Benefit Payments
|
|
|
|
|
|
2010
|
|
$
|
19,085
|
|
|
2011
|
|
|
19,705
|
|
|
2012
|
|
|
20,551
|
|
|
2013
|
|
|
21,287
|
|
|
2014
|
|
|
22,139
|
|
|
2015-2019
|
|
|
122,189
|
|
The amounts in accumulated other comprehensive loss that have
not yet been recognized as components of pension expense at
December 31, 2009, and the expected amortization of these
amounts as components of net periodic benefit cost for the year
ended December 31, 2010 are:
Components of accumulated other comprehensive loss:
| |
|
|
|
|
|
(in thousands)
|
|
|
|
|
|
|
|
|
|
Net actuarial loss
|
|
$
|
42,577
|
|
|
Net prior service cost (credit)
|
|
|
(199
|
)
|
|
Net transition obligation (asset)
|
|
|
—
|
|
|
|
|
|
|
|
|
$
|
42,378
|
|
|
|
|
|
Expected amortization during 2010:
| |
|
|
|
|
|
(in thousands)
|
|
|
|
|
|
|
|
|
|
Amortization of net transition obligation
|
|
$
|
—
|
|
|
Amortization of prior service cost
|
|
|
(40
|
)
|
|
Amortization of net losses
|
|
|
928
|
|
|
|
|
|
|
|
|
$
|
888
|
|
|
|
|
|
We also sponsor defined contribution savings plans covering most
full-time employees. Contributions made by participating
employees are matched based on a specified percentage of
employee contributions. The cost of our contributions to these
plans totaled $5.0 million in 2009, $4.1 million in
2008 and $5.4 million in 2007.
94
18.
Post-Retirement Benefits
We provide health care benefits for certain North American
employees who retired on or before January 1, 2002.
Participant contributions and co-payments are subject to
escalation. The plan pays a stated percentage of most medical
expenses reduced for any deductible and payments made by
government programs. The plan is unfunded.
The following table indicates the components of the
post-retirement medical benefits obligation included in our
Consolidated Statements of Financial Position at December 31:
| |
|
|
|
|
|
|
|
|
|
(in thousands)
|
|
2009
|
|
|
2008
|
|
|
|
|
|
|
|
Change in Benefit Obligation
|
|
|
|
|
|
|
|
|
|
Projected benefit obligation—beginning of year
|
|
$
|
4,702
|
|
|
$
|
5,235
|
|
|
Service cost
|
|
|
11
|
|
|
|
17
|
|
|
Interest cost
|
|
|
309
|
|
|
|
397
|
|
|
Participants’ contributions
|
|
|
149
|
|
|
|
194
|
|
|
Actuarial loss
|
|
|
1,592
|
|
|
|
183
|
|
|
Foreign currency exchange rate changes
|
|
|
135
|
|
|
|
(198
|
)
|
|
Benefits paid
|
|
|
(1,063
|
)
|
|
|
(1,126
|
)
|
|
|
|
|
|
Projected benefit obligation—end of year
|
|
|
5,835
|
|
|
|
4,702
|
|
|
|
|
|
|
Change in Plan Assets
|
|
|
|
|
|
|
|
|
|
Fair value plan assets—beginning of year
|
|
|
—
|
|
|
|
—
|
|
|
Employer contribution
|
|
|
914
|
|
|
|
932
|
|
|
Participants’ contributions
|
|
|
149
|
|
|
|
194
|
|
|
Benefits paid
|
|
|
(1,063
|
)
|
|
|
(1,126
|
)
|
|
|
|
|
|
Fair value plan assets—end of year
|
|
|
—
|
|
|
|
—
|
|
|
|
|
|
|
Funded Status
|
|
|
(5,835
|
)
|
|
|
(4,702
|
)
|
|
Unrecognized net actuarial loss
|
|
|
3,140
|
|
|
|
1,645
|
|
|
Unrecognized prior service cost
|
|
|
536
|
|
|
|
605
|
|
|
Employer contribution
|
|
|
—
|
|
|
|
—
|
|
|
|
|
|
|
Accrued benefit cost
|
|
$
|
(2,158
|
)
|
|
$
|
(2,452
|
)
|
|
|
|
|
Net periodic post-retirement medical benefit expense consisted
of the following components:
| |
|
|
|
|
|
|
|
|
|
|
|
|
|
(in thousands)
|
|
2009
|
|
|
2008
|
|
|
2007
|
|
|
|
|
|
|
|
Service cost
|
|
$
|
11
|
|
|
$
|
17
|
|
|
$
|
12
|
|
|
Interest cost
|
|
|
309
|
|
|
|
397
|
|
|
|
311
|
|
|
Adjustment for measurement date change
|
|
|
—
|
|
|
|
(65
|
)
|
|
|
—
|
|
|
Amortization of prior service cost
|
|
|
69
|
|
|
|
69
|
|
|
|
69
|
|
|
Amortization of actuarial gain
|
|
|
103
|
|
|
|
96
|
|
|
|
89
|
|
|
|
|
|
|
Post-retirement medical benefit expense
|
|
$
|
492
|
|
|
$
|
514
|
|
|
$
|
481
|
|
|
|
|
|
The projected benefit obligation (PBO) and accumulated benefit
obligation (ABO) at December 31, 2009 was
$5.8 million. The PBO and ABO at December 31, 2008 was
$4.7 million.
We limit our future obligation for post-retirement medical
benefits by capping at 5 percent the annual rate of
increase in the cost of claims we assume under the plan. The
weighted average discount rate used in determining the
95
accumulated post-retirement medical benefit obligation was
5.5 percent in 2009, 6.7 percent in 2008 and
6.3 percent in 2007. The assumed annual health care cost
trend rate was 5.0 percent in 2009, 2008 and 2007. The
impact on the benefit obligation of a 1 percent increase in
the assumed health care cost trend rate would be approximately
$0.6 million while a 1 percent decline in the rate
would decrease the benefit obligation by approximately
$0.6 million.
In December 2003, the Medicare Prescription Drug, Improvement
and Modernization Act of 2003 (the Act) was signed into law. The
Act introduced a prescription drug benefit under Medicare
Part D and a federal subsidy to sponsors of retirement
health care plans that provide a benefit that is at least
actuarially equivalent to Medicare Part D. The subsidy is
based on approximately 28 percent of an individual
beneficiary’s annual prescription drug costs between $250
and $5,000.
Future benefit payments expected to be paid for post-retirement
medical benefits are as follows:
Estimated future
benefit payments
| |
|
|
|
|
|
(in thousands)
|
|
Payments
|
|
|
|
|
|
|
|
2010
|
|
$
|
571
|
|
|
2011
|
|
|
611
|
|
|
2012
|
|
|
647
|
|
|
2013
|
|
|
656
|
|
|
2014
|
|
|
675
|
|
|
2015-2019
|
|
|
3,321
|
|
The amounts in accumulated other comprehensive loss that have
not yet been recognized as components of retiree medical expense
at December 31, 2009, and the expected amortization of
these amounts as components of net periodic benefit cost for the
year ended December 31, 2010 are:
Components of accumulated other comprehensive loss:
| |
|
|
|
|
|
(in thousands)
|
|
|
|
|
|
|
|
|
|
Net actuarial loss
|
|
$
|
3,140
|
|
|
Net prior service cost
|
|
|
536
|
|
|
Net transition obligation
|
|
|
—
|
|
|
|
|
|
|
|
|
$
|
3,676
|
|
|
|
|
|
Expected amortization during 2010:
| |
|
|
|
|
|
(in thousands)
|
|
|
|
|
|
|
|
|
|
Amortization of net transition obligation
|
|
$
|
—
|
|
|
Amortization of prior service cost
|
|
|
69
|
|
|
Amortization of net losses
|
|
|
224
|
|
|
|
|
|
|
|
|
$
|
293
|
|
|
|
|
|
96
19. Comprehensive
Income
Comprehensive income attributable to Terra Industries Inc. and
its components, net of tax, were as follows:
| |
|
|
|
|
|
|
|
|
|
|
|
|
|
|
|
Year Ended December 31,
|
|
|
(in thousands)
|
|
2009
|
|
|
2008
|
|
|
2007
|
|
|
|
|
|
|
|
Net income
|
|
$
|
178,617
|
|
|
$
|
708,725
|
|
|
$
|
252,177
|
|
|
Changes in cumulative foreign currency
translation adjustment
|
|
|
25,211
|
|
|
|
(98,308
|
)
|
|
|
(46,882
|
)
|
|
Changes in market value of derivative financial instruments
classified as cash flow hedges, net of tax
|
|
|
45,243
|
|
|
|
(34,487
|
)
|
|
|
6,224
|
|
|
Changes in pension and post-retirement benefit liabilities, net
of tax
|
|
|
(9,790
|
)
|
|
|
(1,180
|
)
|
|
|
15,797
|
|
|
|
|
|
|
Comprehensive income
|
|
|
239,281
|
|
|
|
574,750
|
|
|
|
227,316
|
|
|
Comprehensive income attributable to noncontrolling interest
|
|
|
(31,481
|
)
|
|
|
(65,058
|
)
|
|
|
(49,133
|
)
|
|
|
|
|
|
Comprehensive income attributable to Terra Industries Inc.
|
|
$
|
207,800
|
|
|
$
|
509,692
|
|
|
$
|
178,183
|
|
|
|
|
|
The following table reconciles equity attributable to
noncontrolling interest:
| |
|
|
|
|
|
|
|
|
|
|
|
|
|
|
|
Year Ended December 31,
|
|
|
(in thousands)
|
|
2009
|
|
|
2008
|
|
|
2007
|
|
|
|
|
|
|
|
Noncontrolling interest, January 1
|
|
$
|
104,082
|
|
|
$
|
108,581
|
|
|
$
|
94,687
|
|
|
Net income attributable to noncontrolling interest
|
|
|
25,984
|
|
|
|
67,684
|
|
|
|
50,281
|
|
|
Distributions to noncontrolling interests
|
|
|
(41,149
|
)
|
|
|
(69,557
|
)
|
|
|
(35,239
|
)
|
|
Changes in market value of derivative financial instruments
classified as cash flow hedges, net of tax, attributable to the
noncontrolling interest
|
|
|
5,497
|
|
|
|
(2,626
|
)
|
|
|
(1,148
|
)
|
|
|
|
|
|
Noncontrolling interest, December 31
|
|
$
|
94,414
|
|
|
$
|
104,082
|
|
|
$
|
108,581
|
|
|
|
|
|
Components of the income tax provision applicable to continuing
operations are as follows:
| |
|
|
|
|
|
|
|
|
|
|
|
|
|
(in thousands)
|
|
2009
|
|
|
2008
|
|
|
2007
|
|
|
|
|
|
|
|
Current:
|
|
|
|
|
|
|
|
|
|
|
|
|
|
Federal
|
|
$
|
73,537
|
|
|
$
|
210,635
|
|
|
$
|
3,892
|
|
|
International
|
|
|
10,739
|
|
|
|
24,678
|
|
|
|
6,056
|
|
|
State
|
|
|
8,259
|
|
|
|
19,718
|
|
|
|
13,968
|
|
|
|
|
|
|
|
|
|
92,535
|
|
|
|
255,031
|
|
|
|
23,916
|
|
|
|
|
|
|
Deferred:
|
|
|
|
|
|
|
|
|
|
|
|
|
|
Federal
|
|
|
(14,213
|
)
|
|
|
(11,974
|
)
|
|
|
87,209
|
|
|
International
|
|
|
(3,832
|
)
|
|
|
3,246
|
|
|
|
14,653
|
|
|
State
|
|
|
(191
|
)
|
|
|
(6,452
|
)
|
|
|
1,538
|
|
|
|
|
|
|
|
|
|
(18,236
|
)
|
|
|
(15,180
|
)
|
|
|
103,400
|
|
|
|
|
|
|
Total income tax provision
|
|
$
|
74,299
|
|
|
$
|
239,851
|
|
|
$
|
127,316
|
|
|
|
|
|
97
The following table reconciles the income tax provision per the
Consolidated Statements of Operations to the federal statutory
provision:
| |
|
|
|
|
|
|
|
|
|
|
|
|
|
(in thousands)
|
|
2009
|
|
|
2008
|
|
|
2007
|
|
|
|
|
|
|
|
Income before income taxes:
|
|
|
|
|
|
|
|
|
|
|
|
|
|
Domestic
|
|
$
|
273,408
|
|
|
$
|
687,718
|
|
|
$
|
270,857
|
|
|
International
|
|
|
(47,594
|
)
|
|
|
184,905
|
|
|
|
77,216
|
|
|
|
|
|
|
|
|
|
225,814
|
|
|
|
872,623
|
|
|
|
348,073
|
|
|
|
|
|
|
Statutory income tax expense:
|
|
|
|
|
|
|
|
|
|
|
|
|
|
Domestic
|
|
|
107,732
|
|
|
|
270,541
|
|
|
|
108,071
|
|
|
International
|
|
|
(12,911
|
)
|
|
|
29,392
|
|
|
|
24,699
|
|
|
|
|
|
|
|
|
|
94,821
|
|
|
|
299,933
|
|
|
|
132,770
|
|
|
|
|
|
|
|
|
|
|
|
|
|
|
|
|
|
|
|
|
Nontaxable foreign earnings
|
|
|
(52,432
|
)
|
|
|
(33,299
|
)
|
|
|
—
|
|
|
Repatriation of foreign earnings
|
|
|
42,778
|
|
|
|
—
|
|
|
|
—
|
|
|
State and federal tax credits
|
|
|
(9,707
|
)
|
|
|
(19,510
|
)
|
|
|
—
|
|
|
Domestic production activity deduction
|
|
|
(5,348
|
)
|
|
|
(13,275
|
)
|
|
|
—
|
|
|
Change in statutory tax rates
|
|
|
2,215
|
|
|
|
(507
|
)
|
|
|
(4,043
|
)
|
|
Valuation allowance
|
|
|
6,518
|
|
|
|
414
|
|
|
|
4,178
|
|
|
Foreign tax credit
|
|
|
—
|
|
|
|
—
|
|
|
|
(6,765
|
)
|
|
Other
|
|
|
(4,546
|
)
|
|
|
6,095
|
|
|
|
1,176
|
|
|
|
|
|
|
Income tax expense
|
|
$
|
74,299
|
|
|
$
|
239,851
|
|
|
$
|
127,316
|
|
|
|
|
|
98
The tax effect of net operating loss (NOL), tax credit
carryforwards and significant temporary differences between
reported and taxable earnings that gave rise to net deferred tax
assets (liabilities) were as follows:
| |
|
|
|
|
|
|
|
|
|
(in thousands)
|
|
2009
|
|
|
2008
|
|
|
|
|
|
|
|
Current deferred tax asset
|
|
|
|
|
|
|
|
|
|
Accrued liabilities
|
|
$
|
15,715
|
|
|
$
|
6,428
|
|
|
Inventory valuation
|
|
|
1,419
|
|
|
|
760
|
|
|
Unsettled derivative losses
|
|
|
1,973
|
|
|
|
—
|
|
|
|
|
|
|
Net current deferred tax asset
|
|
|
19,107
|
|
|
|
7,188
|
|
|
|
|
|
|
Non-current deferred tax liability
Depreciation
|
|
|
(90,464
|
)
|
|
|
(94,467
|
)
|
|
Investments in partnership
|
|
|
(2,755
|
)
|
|
|
(1,195
|
)
|
|
Investment in affiliates
|
|
|
(2,278
|
)
|
|
|
(2,578
|
)
|
|
Intangible asset
|
|
|
—
|
|
|
|
(732
|
)
|
|
Unfunded employee benefits
|
|
|
(4,755
|
)
|
|
|
(5,723
|
)
|
|
Discontinued business costs
|
|
|
7,819
|
|
|
|
8,664
|
|
|
Deferred revenues—long-term
|
|
|
3,566
|
|
|
|
4,079
|
|
|
NOL, capital loss and tax credit carryforwards
|
|
|
38,703
|
|
|
|
32,633
|
|
|
Valuation allowance
|
|
|
(38,672
|
)
|
|
|
(32,154
|
)
|
|
Accumulated other comprehensive income
|
|
|
14,510
|
|
|
|
36,203
|
|
|
Other, net
|
|
|
(2,493
|
)
|
|
|
(6,173
|
)
|
|
|
|
|
|
Net noncurrent deferred tax liability
|
|
|
(76,819
|
)
|
|
|
(61,443
|
)
|
|
|
|
|
|
Net deferred tax liability
|
|
$
|
(57,712
|
)
|
|
$
|
(54,255
|
)
|
|
|
|
|
We have NOLs at December 31, 2009 which were generated in
1996 and is subject to limitation. This NOL, if unused, will
begin to expire in 2011. Also during 2009, Terra began recording
NOLs generated in Luxembourg which are not anticipated to be
utilized. The Company has NOLs in Canada which will be utilized
by way of carry-back. A full valuation allowance has been
established against any NOL credit carryforward that is more
likely than not that we will not be able to utilize. United
States income taxes have not been provided on the remaining
amount of the undistributed earnings of international
subsidiaries and affiliated corporate joint ventures. Those
earnings are considered to be indefinitely reinvested. Upon
distribution of those earnings in the form of dividends or
otherwise, Terra may be subject to both U.S. income taxes
(subject to adjustment for foreign tax credits) and withholding
taxes payable to the various foreign countries.
99
21. Unrecognized
Tax Benefit
We adopted the provision of ASC 740, Income Taxes
(previously referred to as FASB Interpretation No. 48,
Accounting for Uncertainty to Income Taxes
(FIN 48)), on January 1, 2007. Under ASC 740, tax
benefits are recorded only for tax positions that are more
likely than not to be sustained upon examination by tax
authorities. The amount recognized is measured as the largest
amount of benefit that is greater than 50 percent likely to
be realized upon ultimate settlement. Unrecognized tax benefits
are tax benefits claimed in our tax returns that do not meet
these recognition and measurement standards.
The following table summarizes the activity related to our
unrecognized tax benefits, interest and penalties:
| |
|
|
|
|
|
|
|
|
|
|
|
|
|
(in thousands)
|
|
2009
|
|
|
2008
|
|
|
2007
|
|
|
|
|
|
|
|
Unrecognized tax benefits at January 1
|
|
$
|
33,560
|
|
|
$
|
33,560
|
|
|
$
|
33,560
|
|
|
Gross increases (decreases) – tax positions in
prior periods
|
|
|
27,415
|
|
|
|
—
|
|
|
|
—
|
|
|
Gross increases (decreases) – tax positions in
current period
|
|
|
898
|
|
|
|
—
|
|
|
|
—
|
|
|
Decreases relating to settlements with tax authorities
|
|
|
—
|
|
|
|
—
|
|
|
|
—
|
|
|
Decreases from the lapse of applicable statue of limitations
|
|
|
(6,712
|
)
|
|
|
—
|
|
|
|
—
|
|
|
|
|
|
|
Unrecognized tax benefits at December 31
|
|
$
|
55,161
|
|
|
$
|
33,560
|
|
|
$
|
33,560
|
|
|
Accrued interest and penalties
|
|
|
7,249
|
|
|
|
2,389
|
|
|
|
—
|
|
|
|
|
|
|
Total ASC 740 liability
|
|
$
|
62,410
|
|
|
$
|
35,949
|
|
|
$
|
33,560
|
|
|
|
|
|
The primary jurisdictions in which we or one of our subsidiaries
files income tax returns are the United States including state
and local jurisdictions and Canada. U.S. tax authorities
have completed their federal income tax examinations for all
years prior to 1998. With respect to state and local
jurisdictions inside the United States, with limited exceptions,
Terra and its subsidiaries are no longer subject to income tax
audits for years before 2002. For Canada, income tax returns
remain subject to examination by tax authorities for calendar
years beginning in 2001. Although the outcome of tax audits is
always uncertain, we believe that adequate amounts of tax,
including interest and penalties, have been provided for any
adjustments that are expected to result from those years.
The adoption of ASC 740 had no impact on our financial
statements other than the reclassification of the unrecognized
tax benefit. Other liabilities include a ASC 740 liability of
$60.9 million and other current liability of
$1.5 million, including accrued interest, at
December 31, 2009. During the next twelve months we expect
to settle an issue with Revenue Canada and have, therefore,
classified $1.5 million as current. If recognized,
$49.9 million of the ASC 740 liability would have an impact
on the effective tax rate.
When applicable, we recognize accrued interest and penalties
related to unrecognized tax benefits in income taxes on the
statement of operations. Interest and penalties were recognized
at December 31, 2009 in the amount of $5.9 million.
100
22. Industry
Segment Data
We operate in one principal industry segment—Nitrogen
Products. The Nitrogen Products business produces and
distributes ammonia, urea, UAN, ammonium nitrate and other
nitrogen products to agricultural and industrial (including
environmental) users.
We allocate revenues to countries based on the location to which
the product was shipped. The following summarizes geographic
information about Terra:
| |
|
|
|
|
|
|
|
|
|
|
|
|
|
|
|
|
|
|
|
|
|
|
|
|
|
|
|
Revenues
|
|
|
Long-lived Assets
|
|
|
|
|
Year Ended December 31,
|
|
|
December 31,
|
|
|
(in thousands)
|
|
2009
|
|
|
2008
|
|
|
2007
|
|
|
2009
|
|
|
2008(1)
|
|
|
2007(1)
|
|
|
|
|
|
|
|
United States
|
|
$
|
1,522,126
|
|
|
$
|
2,785,269
|
|
|
$
|
1,954,060
|
|
|
$
|
571,446
|
|
|
$
|
523,968
|
|
|
$
|
572,329
|
|
|
Canada
|
|
|
59,306
|
|
|
|
106,210
|
|
|
|
69,760
|
|
|
|
201,995
|
|
|
|
196,585
|
|
|
|
286,088
|
|
|
United
Kingdom(1)
|
|
|
—
|
|
|
|
—
|
|
|
|
319,109
|
|
|
|
—
|
|
|
|
—
|
|
|
|
—
|
|
|
|
|
|
|
|
|
$
|
1,581,432
|
|
|
$
|
2,891,479
|
|
|
$
|
2,342,929
|
|
|
$
|
773,441
|
|
|
$
|
720,553
|
|
|
$
|
858,417
|
|
|
|
|
|
|
|
|
|
1.
|
|
On September 14, 2007, we
completed the formation of GrowHow UK Limited (GrowHow), a joint
venture between Terra and Kemira GrowHow Oyj. Pursuant to the
joint venture agreement, we contributed our United Kingdom
subsidiary Terra Nitrogen (UK) Limited to the joint venture for
a 50 percent interest. Subsequent to the formation, we have
accounted for our investment in GrowHow as an equity method
investment and it is included in our Canadian long-lived assets.
|
23.
Noncontrolling interest
We own an aggregate 75.3 percent of TNCLP through general
and limited partnership interests. Outside investors own
24.7 percent of the limited partnership interests. TNCLP
has its manufacturing facility in Verdigris, Oklahoma and is a
major U.S. producer of nitrogen fertilizer products. For
financial reporting purposes, the assets, liabilities and
earnings of the partnership are consolidated into our financial
statements. The outside investors limited partnership interest
in the partnership has been recorded as noncontrolling interest
on our consolidated financial statements. The noncontrolling
interest represents the noncontrolling unitholders’
interest in the equity of TNCLP. At December 31, 2009 and
2008, we reported noncontrolling interest in the statement of
financial position of $94.4 million and
$104.1 million, respectively. For the years 2009, 2008 and
2007, we recorded noncontrolling unitholders’ interest in
the statement of operations of $26.0 million,
$67.7 million and $50.3 million, respectively.
TNCLP makes cash distributions to the General and Limited
Partners based upon formulas defined within the Agreement of
Limited Partnership. Available Cash for distribution is defined
generally as all cash receipts less all cash disbursements,
adjusted for changes in certain reserves established as the
General Partner determines in its reasonable discretion to be
necessary. Cash distributions to the Limited Partner and General
Partner vary depending on when the cumulative distributions
exceed the Minimum Quarterly Distribution (MQD) target levels
set forth in the Agreement of Limited Partnership.
During 2009 the cumulative shortfall of the MQD was satisfied
which entitled us to increased income allocations as provided
for in the Agreement of Limited Partnership. The increased
income allocation attributed to our General Partner interest was
$10.6 million for 2009.
24. Guarantor
Subsidiaries
Terra Industries Inc, excluding all majority owned subsidiaries
(Parent), files a consolidated United States federal income tax
return. Beginning in 1995, the Parent adopted the tax sharing
agreements, under which all domestic operating subsidiaries
provide for and remit income taxes to the Parent based on their
pretax accounting income, adjusted for permanent differences
between pretax accounting income and taxable income. The tax
sharing agreements allocated the benefits of operating losses
and temporary differences between financial reporting and tax
basis income to the Parent.
101
Condensed consolidating financial information regarding the
Parent, Terra Capital, Inc. (TCAPI), the Guarantor Subsidiaries
and subsidiaries of the Parent that are not guarantors of the
Senior Unsecured Notes (see Note 9, Revolving Credit
Facility and Long-Term Debt, of the Notes to the
Consolidated Financial Statements) for December 31, 2009,
2008 and 2007 are presented below for purposes of complying with
the reporting requirements of the Guarantor Subsidiaries. The
guarantees of the Guarantor Subsidiaries are full and
unconditional. The Guarantor Subsidiaries guarantees are joint
and several with the Parent.
Guarantor subsidiaries include: subsidiaries
that own the Woodward, Oklahoma; Port Neal, Iowa; Yazoo City,
Mississippi; and Beaumont, Texas plants; Terra Environmental
Technologies; Terra Global Holding Company Inc., Terra
Investment Fund LLC, Terra Investment Fund II LLC,
Terra (U.K.) Holdings Inc., and the corporate headquarters
facility in Sioux City, Iowa. All guarantor subsidiaries are
wholly owned by the Parent. All other company facilities are
owned by non-guarantor subsidiaries. In 2008, we declared the
Beaumont, Texas facility as a discontinued operation and
classified the facility as held for sale. In December 2008, the
Beaumont, Texas facility was sold, see Note 2,
Discontinued Operations, of the Notes to the Consolidated
Financial Statements.
102
Condensed
Consolidating Statement of Financial Position at
December 31, 2009:
| |
|
|
|
|
|
|
|
|
|
|
|
|
|
|
|
|
|
|
|
|
|
|
|
|
|
|
|
|
|
|
|
|
|
Guarantor
|
|
|
Non-Guarantor
|
|
|
|
|
|
|
|
|
|
|
Parent
|
|
|
TCAPI
|
|
|
Subsidiaries
|
|
|
Subsidiaries
|
|
|
Eliminations
|
|
|
Consolidated
|
|
|
|
|
|
|
|
Assets
|
|
|
|
|
|
|
|
|
|
|
|
|
|
|
|
|
|
|
|
|
|
|
|
|
|
Cash and cash equivalents
|
|
$
|
—
|
|
|
$
|
74,541
|
|
|
$
|
180,140
|
|
|
$
|
246,629
|
|
|
$
|
—
|
|
|
$
|
501,310
|
|
|
Accounts receivable, net
|
|
|
—
|
|
|
|
—
|
|
|
|
59,120
|
|
|
|
41,096
|
|
|
|
—
|
|
|
|
100,216
|
|
|
Inventories, net
|
|
|
—
|
|
|
|
—
|
|
|
|
86,291
|
|
|
|
50,782
|
|
|
|
—
|
|
|
|
137,073
|
|
|
Other current assets
|
|
|
52,850
|
|
|
|
532
|
|
|
|
14,756
|
|
|
|
19,565
|
|
|
|
—
|
|
|
|
87,703
|
|
|
|
|
|
|
Total current assets
|
|
|
52,850
|
|
|
|
75,073
|
|
|
|
340,307
|
|
|
|
358,072
|
|
|
|
—
|
|
|
|
826,302
|
|
|
|
|
|
|
Property, plant and equipment, net
|
|
|
—
|
|
|
|
6,037
|
|
|
|
322,062
|
|
|
|
128,603
|
|
|
|
—
|
|
|
|
456,702
|
|
|
Equity method investments
|
|
|
—
|
|
|
|
—
|
|
|
|
9,462
|
|
|
|
249,398
|
|
|
|
—
|
|
|
|
258,860
|
|
|
Other current assets
|
|
|
—
|
|
|
|
15,588
|
|
|
|
21,434
|
|
|
|
20,857
|
|
|
|
—
|
|
|
|
57,879
|
|
|
Investments in and advances to (from) affiliates
|
|
|
643,853
|
|
|
|
849,707
|
|
|
|
2,975,069
|
|
|
|
533,631
|
|
|
|
(5,002,260
|
)
|
|
|
—
|
|
|
|
|
|
|
Total Assets
|
|
$
|
696,703
|
|
|
$
|
946,405
|
|
|
$
|
3,668,334
|
|
|
$
|
1,290,561
|
|
|
$
|
(5,002,260
|
)
|
|
$
|
1,599,743
|
|
|
|
|
|
|
Liabilities
|
|
|
|
|
|
|
|
|
|
|
|
|
|
|
|
|
|
|
|
|
|
|
|
|
|
Accounts payable
|
|
$
|
277
|
|
|
$
|
—
|
|
|
$
|
60,042
|
|
|
$
|
27,579
|
|
|
$
|
—
|
|
|
$
|
87,898
|
|
|
Customer prepayments
|
|
|
—
|
|
|
|
—
|
|
|
|
14,857
|
|
|
|
24,381
|
|
|
|
—
|
|
|
|
39,238
|
|
|
Derivative hedge liabilities
|
|
|
130
|
|
|
|
—
|
|
|
|
85
|
|
|
|
66
|
|
|
|
—
|
|
|
|
281
|
|
|
Accrued and other current liabilities
|
|
|
21,860
|
|
|
|
8,375
|
|
|
|
32,370
|
|
|
|
16,187
|
|
|
|
—
|
|
|
|
78,792
|
|
|
|
|
|
|
Total current liabilities
|
|
|
22,267
|
|
|
|
8,375
|
|
|
|
107,354
|
|
|
|
68,213
|
|
|
|
—
|
|
|
|
206,209
|
|
|
|
|
|
|
Long-term debt
|
|
|
—
|
|
|
|
602,434
|
|
|
|
—
|
|
|
|
—
|
|
|
|
—
|
|
|
|
602,434
|
|
|
Deferred taxes
|
|
|
70,564
|
|
|
|
—
|
|
|
|
—
|
|
|
|
6,255
|
|
|
|
—
|
|
|
|
76,819
|
|
|
Pension and other liabilities
|
|
|
112,652
|
|
|
|
—
|
|
|
|
10,187
|
|
|
|
5,808
|
|
|
|
—
|
|
|
|
128,647
|
|
|
|
|
|
|
Total liabilities
|
|
|
205,483
|
|
|
|
610,809
|
|
|
|
117,541
|
|
|
|
80,276
|
|
|
|
—
|
|
|
|
1,014,109
|
|
|
|
|
|
|
|
|
|
|
|
|
|
|
|
|
|
|
|
|
|
|
|
|
|
|
|
|
|
|
|
|
Preferred Shares
|
|
|
483
|
|
|
|
—
|
|
|
|
—
|
|
|
|
—
|
|
|
|
—
|
|
|
|
483
|
|
|
|
|
|
|
|
|
|
|
|
|
|
|
|
|
|
|
|
|
|
|
|
|
|
|
|
|
Common Stockholders’ Equity
|
|
|
|
|
|
|
|
|
|
|
|
|
|
|
|
|
|
|
|
|
|
|
|
|
|
Common stock
|
|
|
152,802
|
|
|
|
—
|
|
|
|
73
|
|
|
|
92,262
|
|
|
|
(92,335
|
)
|
|
|
152,802
|
|
|
Paid in capital
|
|
|
446,078
|
|
|
|
150,218
|
|
|
|
1,892,773
|
|
|
|
699,191
|
|
|
|
(2,742,182
|
)
|
|
|
446,078
|
|
|
Accumulated other comprehensive loss
|
|
|
(120,362
|
)
|
|
|
—
|
|
|
|
—
|
|
|
|
(88,563
|
)
|
|
|
88,563
|
|
|
|
(120,362
|
)
|
|
Retained earnings
|
|
|
12,219
|
|
|
|
166,929
|
|
|
|
1,581,982
|
|
|
|
507,395
|
|
|
|
(2,256,306
|
)
|
|
|
12,219
|
|
|
|
|
|
|
Total common stockholders’ equity
|
|
|
490,737
|
|
|
|
317,147
|
|
|
|
3,474,828
|
|
|
|
1,210,285
|
|
|
|
(5,002,260
|
)
|
|
|
490,737
|
|
|
|
|
|
|
Noncontrolling interest
|
|
|
—
|
|
|
|
18,449
|
|
|
|
75,965
|
|
|
|
—
|
|
|
|
—
|
|
|
|
94,414
|
|
|
|
|
|
|
Total equity
|
|
|
490,737
|
|
|
|
335,596
|
|
|
|
3,550,793
|
|
|
|
1,210,285
|
|
|
|
(5,002,260
|
)
|
|
|
585,151
|
|
|
|
|
|
|
Total liabilities and equity
|
|
$
|
696,703
|
|
|
$
|
946,405
|
|
|
$
|
3,668,334
|
|
|
$
|
1,290,561
|
|
|
$
|
(5,002,260
|
)
|
|
$
|
1,599,743
|
|
|
|
|
|
103
Condensed
Consolidating Statement of Operations for the Year Ended
December 31, 2009:
| |
|
|
|
|
|
|
|
|
|
|
|
|
|
|
|
|
|
|
|
|
|
|
|
|
|
|
|
|
|
|
|
|
|
Guarantor
|
|
|
Non-Guarantor
|
|
|
|
|
|
|
|
|
|
|
Parent
|
|
|
TCAPI
|
|
|
Subsidiaries
|
|
|
Subsidiaries
|
|
|
Eliminations
|
|
|
Consolidated
|
|
|
|
|
|
|
|
Revenues
|
|
|
|
|
|
|
|
|
|
|
|
|
|
|
|
|
|
|
|
|
|
|
|
|
|
Product revenues
|
|
$
|
—
|
|
|
$
|
—
|
|
|
$
|
908,089
|
|
|
$
|
668,439
|
|
|
$
|
—
|
|
|
$
|
1,576,528
|
|
|
Other income
|
|
|
—
|
|
|
|
—
|
|
|
|
3,544
|
|
|
|
1,360
|
|
|
|
—
|
|
|
|
4,904
|
|
|
|
|
|
|
Total revenues
|
|
|
—
|
|
|
|
—
|
|
|
|
911,633
|
|
|
|
669,799
|
|
|
|
—
|
|
|
|
1,581,432
|
|
|
|
|
|
|
Cost and Expense
|
|
|
|
|
|
|
|
|
|
|
|
|
|
|
|
|
|
|
|
|
|
|
|
|
|
Cost of sales
|
|
|
—
|
|
|
|
333
|
|
|
|
699,811
|
|
|
|
495,032
|
|
|
|
—
|
|
|
|
1,195,176
|
|
|
Selling, general and administrative expenses
|
|
|
2,726
|
|
|
|
(8,309
|
)
|
|
|
41,979
|
|
|
|
30,741
|
|
|
|
—
|
|
|
|
67,137
|
|
|
Other operating expenses
|
|
|
18,000
|
|
|
|
—
|
|
|
|
—
|
|
|
|
—
|
|
|
|
—
|
|
|
|
18,000
|
|
|
Equity earnings of North American affiliates
|
|
|
—
|
|
|
|
—
|
|
|
|
(1,219
|
)
|
|
|
(16,483
|
)
|
|
|
—
|
|
|
|
(17,702
|
)
|
|
|
|
|
|
Total cost and expenses
|
|
|
20,726
|
|
|
|
(7,976
|
)
|
|
|
740,571
|
|
|
|
509,290
|
|
|
|
—
|
|
|
|
1,262,611
|
|
|
|
|
|
|
Income (loss) from operations
|
|
|
(20,726
|
)
|
|
|
7,976
|
|
|
|
171,062
|
|
|
|
160,509
|
|
|
|
—
|
|
|
|
318,821
|
|
|
Interest income
|
|
|
157
|
|
|
|
1,970
|
|
|
|
996
|
|
|
|
1,013
|
|
|
|
—
|
|
|
|
4,136
|
|
|
Interest expense
|
|
|
(1,860
|
)
|
|
|
(29,667
|
)
|
|
|
103,626
|
|
|
|
(103,959
|
)
|
|
|
—
|
|
|
|
(31,860
|
)
|
|
Loss on early retirement of debt
|
|
|
—
|
|
|
|
(53,476
|
)
|
|
|
—
|
|
|
|
—
|
|
|
|
—
|
|
|
|
(53,476
|
)
|
|
|
|
|
|
Income (loss) before income taxes, noncontrolling interest and
equity earnings
|
|
|
(22,429
|
)
|
|
|
(73,197
|
)
|
|
|
275,684
|
|
|
|
57,563
|
|
|
|
—
|
|
|
|
237,621
|
|
|
Income tax benefit (provision)
|
|
|
5,039
|
|
|
|
(10,374
|
)
|
|
|
(61,931
|
)
|
|
|
(7,033
|
)
|
|
|
—
|
|
|
|
(74,299
|
)
|
|
Equity earnings of unconsolidated affiliates
|
|
|
170,023
|
|
|
|
285,609
|
|
|
|
—
|
|
|
|
14,177
|
|
|
|
(455,632
|
)
|
|
|
14,177
|
|
|
|
|
|
|
Income from continuing operations, net of tax
|
|
|
152,633
|
|
|
|
202,038
|
|
|
|
213,753
|
|
|
|
64,707
|
|
|
|
(455,632
|
)
|
|
|
177,499
|
|
|
Income from discontinued operations, net of tax
|
|
|
—
|
|
|
|
—
|
|
|
|
1,118
|
|
|
|
—
|
|
|
|
—
|
|
|
|
1,118
|
|
|
|
|
|
|
Net income
|
|
|
152,633
|
|
|
|
202,038
|
|
|
|
214,871
|
|
|
|
64,707
|
|
|
|
(455,632
|
)
|
|
|
178,617
|
|
|
Less: Net income attributable to the noncontrolling interest
|
|
|
—
|
|
|
|
5,015
|
|
|
|
20,969
|
|
|
|
—
|
|
|
|
—
|
|
|
|
25,984
|
|
|
|
|
|
|
Net Income attributable to Terra Industries Inc.
|
|
$
|
152,633
|
|
|
$
|
197,023
|
|
|
$
|
193,902
|
|
|
$
|
64,707
|
|
|
$
|
(455,632
|
)
|
|
$
|
152,633
|
|
|
|
|
|
104
Condensed
Consolidating Statement of Cash Flows for the Year Ended
December 31, 2009:
| |
|
|
|
|
|
|
|
|
|
|
|
|
|
|
|
|
|
|
|
|
|
|
|
|
|
|
|
|
|
|
|
|
|
Guarantor
|
|
|
Non-Guarantor
|
|
|
|
|
|
|
|
|
|
|
Parent
|
|
|
TCAPI
|
|
|
Subsidiaries
|
|
|
Subsidiaries
|
|
|
Eliminations
|
|
|
Consolidated
|
|
|
|
|
|
|
|
Operating Activities
|
|
|
|
|
|
|
|
|
|
|
|
|
|
|
|
|
|
|
|
|
|
|
|
|
|
Net income
|
|
$
|
152,633
|
|
|
$
|
202,038
|
|
|
$
|
214,871
|
|
|
$
|
64,707
|
|
|
$
|
(455,632
|
)
|
|
$
|
178,617
|
|
|
Income from discontinued operations, net of tax
|
|
|
—
|
|
|
|
—
|
|
|
|
1,118
|
|
|
|
—
|
|
|
|
—
|
|
|
|
1,118
|
|
|
|
|
|
|
Income from continuing operations,
net of tax
|
|
|
152,633
|
|
|
|
202,038
|
|
|
|
213,753
|
|
|
|
64,707
|
|
|
|
(455,632
|
)
|
|
|
177,499
|
|
|
Adjustments to reconcile income from continuing operations to
net cash flows from operating activities:
|
|
|
|
|
|
|
|
|
|
|
|
|
|
|
|
|
|
|
|
|
|
|
|
|
|
Depreciation and amortization
|
|
|
—
|
|
|
|
—
|
|
|
|
55,976
|
|
|
|
28,864
|
|
|
|
—
|
|
|
|
84,840
|
|
|
Loss on sale of property, plant and equipment
|
|
|
—
|
|
|
|
—
|
|
|
|
767
|
|
|
|
60
|
|
|
|
—
|
|
|
|
827
|
|
|
Deferred income taxes
|
|
|
(18,236
|
)
|
|
|
—
|
|
|
|
—
|
|
|
|
—
|
|
|
|
—
|
|
|
|
(18,236
|
)
|
|
Distributions in excess of (less than) equity earnings
|
|
|
(170,023
|
)
|
|
|
(285,609
|
)
|
|
|
186
|
|
|
|
3,888
|
|
|
|
455,632
|
|
|
|
4,074
|
|
|
Equity earnings of GrowHow UK Limited
|
|
|
—
|
|
|
|
—
|
|
|
|
—
|
|
|
|
(14,177
|
)
|
|
|
—
|
|
|
|
(14,177
|
)
|
|
Non-cash loss on derivatives
|
|
|
675
|
|
|
|
—
|
|
|
|
—
|
|
|
|
—
|
|
|
|
—
|
|
|
|
675
|
|
|
Share-based compensation
|
|
|
16,174
|
|
|
|
—
|
|
|
|
—
|
|
|
|
—
|
|
|
|
—
|
|
|
|
16,174
|
|
|
Amortization of intangible and other assets
|
|
|
—
|
|
|
|
121
|
|
|
|
7,410
|
|
|
|
2,188
|
|
|
|
—
|
|
|
|
9,719
|
|
|
Non-cash loss on early retirement of debt
|
|
|
—
|
|
|
|
4,546
|
|
|
|
—
|
|
|
|
—
|
|
|
|
—
|
|
|
|
4,546
|
|
|
Change in operating assets and liabilities –
continuing operations
|
|
|
28,981
|
|
|
|
41,260
|
|
|
|
(72,981
|
)
|
|
|
(60,198
|
)
|
|
|
—
|
|
|
|
(62,938
|
)
|
|
|
|
|
|
Net cash flows from operating activities – continuing
operations
|
|
|
10,204
|
|
|
|
(37,644
|
)
|
|
|
205,111
|
|
|
|
25,332
|
|
|
|
—
|
|
|
|
203,003
|
|
|
Net cash flows from operating activities –
discontinued operations
|
|
|
—
|
|
|
|
—
|
|
|
|
1,118
|
|
|
|
—
|
|
|
|
—
|
|
|
|
1,118
|
|
|
|
|
|
|
Net Cash Flows from
Operating Activities
|
|
|
10,204
|
|
|
|
(37,644
|
)
|
|
|
206,229
|
|
|
|
25,332
|
|
|
|
—
|
|
|
|
204,121
|
|
|
|
|
|
|
Investing Activities
|
|
|
|
|
|
|
|
|
|
|
|
|
|
|
|
|
|
|
|
|
|
|
|
|
|
Capital expenditures and plant turnaround expenditures
|
|
|
—
|
|
|
|
—
|
|
|
|
(92,991
|
)
|
|
|
(40,943
|
)
|
|
|
—
|
|
|
|
(133,934
|
)
|
|
Proceeds from the sale of property, plant and equipment
|
|
|
—
|
|
|
|
—
|
|
|
|
102
|
|
|
|
86
|
|
|
|
—
|
|
|
|
188
|
|
|
Distributions received from North American affiliates
|
|
|
—
|
|
|
|
—
|
|
|
|
470
|
|
|
|
13,579
|
|
|
|
—
|
|
|
|
14,049
|
|
|
Balancing consideration and other payments received from GrowHow
UK Limited
|
|
|
—
|
|
|
|
—
|
|
|
|
—
|
|
|
|
21,205
|
|
|
|
—
|
|
|
|
21,205
|
|
|
|
|
|
105
Condensed
Consolidating Statement of Cash Flows at December 31, 2009
(continued):
| |
|
|
|
|
|
|
|
|
|
|
|
|
|
|
|
|
|
|
|
|
|
|
|
|
|
|
|
|
|
|
|
|
|
Guarantor
|
|
|
Non-Guarantor
|
|
|
|
|
|
|
|
|
|
|
Parent
|
|
|
TCAPI
|
|
|
Subsidiaries
|
|
|
Subsidiaries
|
|
|
Eliminations
|
|
|
Consolidated
|
|
|
|
|
|
|
|
Net cash flows from investing activities – continuing
operations
|
|
|
—
|
|
|
|
—
|
|
|
|
(92,419
|
)
|
|
|
(6,073
|
)
|
|
|
—
|
|
|
|
(98,492
|
)
|
|
Net cash flows from investing activities –
discontinued operations
|
|
|
—
|
|
|
|
—
|
|
|
|
5,356
|
|
|
|
—
|
|
|
|
—
|
|
|
|
5,356
|
|
|
|
|
|
|
Net Cash Flows from Investing Activities
|
|
|
—
|
|
|
|
—
|
|
|
|
(87,063
|
)
|
|
|
(6,073
|
)
|
|
|
—
|
|
|
|
(93,136
|
)
|
|
|
|
|
|
Financing Activities
|
|
|
|
|
|
|
|
|
|
|
|
|
|
|
|
|
|
|
|
|
|
|
|
|
|
Issuance of debt
|
|
|
—
|
|
|
|
589,788
|
|
|
|
—
|
|
|
|
—
|
|
|
|
—
|
|
|
|
589,788
|
|
|
Payments under borrowing arrangements
|
|
|
—
|
|
|
|
(317,475
|
)
|
|
|
—
|
|
|
|
—
|
|
|
|
—
|
|
|
|
(317,475
|
)
|
|
Payments for debt issuance costs
|
|
|
—
|
|
|
|
(14,360
|
)
|
|
|
—
|
|
|
|
—
|
|
|
|
—
|
|
|
|
(14,360
|
)
|
|
Preferred share dividends paid
|
|
|
(56
|
)
|
|
|
—
|
|
|
|
—
|
|
|
|
—
|
|
|
|
—
|
|
|
|
(56
|
)
|
|
Common stock dividends paid
|
|
|
(788,588
|
)
|
|
|
—
|
|
|
|
—
|
|
|
|
—
|
|
|
|
—
|
|
|
|
(788,588
|
)
|
|
Common stock issuances and vestings
|
|
|
(6,642
|
)
|
|
|
—
|
|
|
|
—
|
|
|
|
—
|
|
|
|
—
|
|
|
|
(6,642
|
)
|
|
Change in investments and advances from (to) affiliates
|
|
|
778,778
|
|
|
|
(469,767
|
)
|
|
|
(190,250
|
)
|
|
|
(118,761
|
)
|
|
|
—
|
|
|
|
—
|
|
|
Excess tax benefits from equity compensation plans
|
|
|
6,304
|
|
|
|
—
|
|
|
|
—
|
|
|
|
—
|
|
|
|
—
|
|
|
|
6,304
|
|
|
Distributions to noncontrolling interests
|
|
|
—
|
|
|
|
(7,715
|
)
|
|
|
(33,434
|
)
|
|
|
—
|
|
|
|
—
|
|
|
|
(41,149
|
)
|
|
|
|
|
|
Net Cash Flows from Financing Activities
|
|
|
(10,204
|
)
|
|
|
(219,529
|
)
|
|
|
(223,684
|
)
|
|
|
(118,761
|
)
|
|
|
—
|
|
|
|
(572,178
|
)
|
|
|
|
|
|
Effect of Foreign Exchange Rate on Cash
|
|
|
—
|
|
|
|
—
|
|
|
|
—
|
|
|
|
(4,197
|
)
|
|
|
—
|
|
|
|
(4,197
|
)
|
|
|
|
|
|
Decrease in Cash and Cash Equivalents
|
|
|
—
|
|
|
|
(257,173
|
)
|
|
|
(104,518
|
)
|
|
|
(103,699
|
)
|
|
|
—
|
|
|
|
(465,390
|
)
|
|
|
|
|
|
Cash and Cash Equivalents at Beginning of Year
|
|
|
—
|
|
|
|
331,714
|
|
|
|
284,658
|
|
|
|
350,328
|
|
|
|
—
|
|
|
|
966,700
|
|
|
|
|
|
|
Cash and Cash Equivalents at End of Year
|
|
$
|
—
|
|
|
$
|
74,541
|
|
|
$
|
180,140
|
|
|
$
|
246,629
|
|
|
$
|
—
|
|
|
$
|
501,310
|
|
|
|
|
|
106
Condensed
Consolidating Statement of Financial Position at
December 31, 2008:
| |
|
|
|
|
|
|
|
|
|
|
|
|
|
|
|
|
|
|
|
|
|
|
|
|
|
|
|
|
|
|
|
|
|
Guarantor
|
|
|
Non-Guarantor
|
|
|
|
|
|
|
|
|
|
|
Parent
|
|
|
TCAPI
|
|
|
Subsidiaries
|
|
|
Subsidiaries
|
|
|
Eliminations
|
|
|
Consolidated
|
|
|
|
|
|
|
|
Assets
|
|
|
|
|
|
|
|
|
|
|
|
|
|
|
|
|
|
|
|
|
|
|
|
|
|
Cash and cash equivalents
|
|
$
|
—
|
|
|
$
|
331,714
|
|
|
$
|
284,658
|
|
|
$
|
350,328
|
|
|
$
|
—
|
|
|
$
|
966,700
|
|
|
Accounts receivable, net
|
|
|
9
|
|
|
|
74
|
|
|
|
73,358
|
|
|
|
56,949
|
|
|
|
—
|
|
|
|
130,390
|
|
|
Inventories, net
|
|
|
—
|
|
|
|
—
|
|
|
|
111,295
|
|
|
|
85,796
|
|
|
|
—
|
|
|
|
197,091
|
|
|
Margin deposits with derivative counterparties
|
|
|
—
|
|
|
|
36,945
|
|
|
|
—
|
|
|
|
—
|
|
|
|
—
|
|
|
|
36,945
|
|
|
Other current assets
|
|
|
23,807
|
|
|
|
10,440
|
|
|
|
13,596
|
|
|
|
13,495
|
|
|
|
—
|
|
|
|
61,338
|
|
|
|
|
|
|
Total current assets
|
|
|
23,816
|
|
|
|
379,173
|
|
|
|
482,907
|
|
|
|
506,568
|
|
|
|
—
|
|
|
|
1,392,464
|
|
|
|
|
|
|
Property, plant and equipment, net
|
|
|
—
|
|
|
|
6,037
|
|
|
|
288,449
|
|
|
|
108,827
|
|
|
|
—
|
|
|
|
403,313
|
|
|
Equity method investments
|
|
|
—
|
|
|
|
—
|
|
|
|
10,117
|
|
|
|
260,798
|
|
|
|
—
|
|
|
|
270,915
|
|
|
Other current assets
|
|
|
2,230
|
|
|
|
7,156
|
|
|
|
21,146
|
|
|
|
15,793
|
|
|
|
—
|
|
|
|
46,325
|
|
|
Investments in and advances to (from) affiliates
|
|
|
1,252,608
|
|
|
|
94,542
|
|
|
|
3,103,357
|
|
|
|
588,172
|
|
|
|
(5,038,679
|
)
|
|
|
—
|
|
|
|
|
|
|
Total Assets
|
|
$
|
1,278,654
|
|
|
$
|
486,908
|
|
|
$
|
3,905,976
|
|
|
$
|
1,480,158
|
|
|
$
|
(5,038,679
|
)
|
|
$
|
2,113,017
|
|
|
|
|
|
|
Liabilities
|
|
|
|
|
|
|
|
|
|
|
|
|
|
|
|
|
|
|
|
|
|
|
|
|
|
Accounts payable
|
|
$
|
205
|
|
|
$
|
62
|
|
|
$
|
70,473
|
|
|
$
|
29,153
|
|
|
$
|
—
|
|
|
$
|
99,893
|
|
|
Customer prepayments
|
|
|
—
|
|
|
|
—
|
|
|
|
58,922
|
|
|
|
52,670
|
|
|
|
—
|
|
|
|
111,592
|
|
|
Derivative hedge liabilities
|
|
|
35,254
|
|
|
|
7,476
|
|
|
|
39,880
|
|
|
|
43,315
|
|
|
|
—
|
|
|
|
125,925
|
|
|
Accrued and other current liabilities
|
|
|
51,861
|
|
|
|
8,947
|
|
|
|
42,261
|
|
|
|
24,701
|
|
|
|
—
|
|
|
|
127,770
|
|
|
|
|
|
|
Total current liabilities
|
|
|
87,320
|
|
|
|
16,485
|
|
|
|
211,536
|
|
|
|
149,839
|
|
|
|
—
|
|
|
|
465,180
|
|
|
|
|
|
|
Long-term debt
|
|
|
—
|
|
|
|
330,000
|
|
|
|
—
|
|
|
|
—
|
|
|
|
—
|
|
|
|
330,000
|
|
|
Deferred taxes
|
|
|
51,770
|
|
|
|
—
|
|
|
|
—
|
|
|
|
9,673
|
|
|
|
—
|
|
|
|
61,443
|
|
|
Pension and other liabilities
|
|
|
74,975
|
|
|
|
—
|
|
|
|
10,983
|
|
|
|
1,765
|
|
|
|
—
|
|
|
|
87,723
|
|
|
|
|
|
|
Total liabilities
|
|
|
214,065
|
|
|
|
346,485
|
|
|
|
222,519
|
|
|
|
161,277
|
|
|
|
—
|
|
|
|
944,346
|
|
|
|
|
|
|
|
|
|
|
|
|
|
|
|
|
|
|
|
|
|
|
|
|
|
|
|
|
|
|
|
|
Preferred Shares
|
|
|
1,544
|
|
|
|
—
|
|
|
|
—
|
|
|
|
—
|
|
|
|
—
|
|
|
|
1,544
|
|
|
|
|
|
|
|
|
|
|
|
|
|
|
|
|
|
|
|
|
|
|
|
|
|
|
|
|
Common Stockholders’ Equity
|
|
|
|
|
|
|
|
|
|
|
|
|
|
|
|
|
|
|
|
|
|
|
|
|
|
Common stock
|
|
|
152,111
|
|
|
|
—
|
|
|
|
73
|
|
|
|
83,332
|
|
|
|
(83,405
|
)
|
|
|
152,111
|
|
|
Paid in capital
|
|
|
579,164
|
|
|
|
150,218
|
|
|
|
2,201,646
|
|
|
|
963,435
|
|
|
|
(3,315,299
|
)
|
|
|
579,164
|
|
|
Accumulated other comprehensive loss
|
|
|
(175,529
|
)
|
|
|
—
|
|
|
|
—
|
|
|
|
(170,574
|
)
|
|
|
170,574
|
|
|
|
(175,529
|
)
|
|
Retained earnings (accumulated deficit)
|
|
|
507,299
|
|
|
|
(30,094
|
)
|
|
|
1,397,955
|
|
|
|
442,688
|
|
|
|
(1,810,549
|
)
|
|
|
507,299
|
|
|
|
|
|
|
Total common stockholders’ equity
|
|
|
1,063,045
|
|
|
|
120,124
|
|
|
|
3,599,674
|
|
|
|
1,318,881
|
|
|
|
(5,038,679
|
)
|
|
|
1,063,045
|
|
|
|
|
|
|
Noncontrolling interest
|
|
|
—
|
|
|
|
20,299
|
|
|
|
83,783
|
|
|
|
—
|
|
|
|
—
|
|
|
|
104,082
|
|
|
|
|
|
|
Total equity
|
|
|
1,063,045
|
|
|
|
140,423
|
|
|
|
3,683,457
|
|
|
|
1,318,881
|
|
|
|
(5,038,679
|
)
|
|
|
1,167,127
|
|
|
|
|
|
|
Total liabilities and equity
|
|
$
|
1,278,654
|
|
|
$
|
486,908
|
|
|
$
|
3,905,976
|
|
|
$
|
1,480,158
|
|
|
$
|
(5,038,679
|
)
|
|
$
|
2,113,017
|
|
|
|
|
|
107
Condensed
Consolidating Statement of Operations for the Year Ended
December 31, 2008:
| |
|
|
|
|
|
|
|
|
|
|
|
|
|
|
|
|
|
|
|
|
|
|
|
|
|
|
|
|
|
|
|
|
|
Guarantor
|
|
|
Non-Guarantor
|
|
|
|
|
|
|
|
|
|
|
Parent
|
|
|
TCAPI
|
|
|
Subsidiaries
|
|
|
Subsidiaries
|
|
|
Eliminations
|
|
|
Consolidated
|
|
|
|
|
|
|
|
Revenues
|
|
|
|
|
|
|
|
|
|
|
|
|
|
|
|
|
|
|
|
|
|
|
|
|
|
Product revenues
|
|
$
|
—
|
|
|
$
|
—
|
|
|
$
|
1,709,509
|
|
|
$
|
1,170,746
|
|
|
$
|
—
|
|
|
$
|
2,880,255
|
|
|
Other income
|
|
|
—
|
|
|
|
—
|
|
|
|
8,064
|
|
|
|
3,160
|
|
|
|
—
|
|
|
|
11,224
|
|
|
|
|
|
|
Total revenues
|
|
|
—
|
|
|
|
—
|
|
|
|
1,717,573
|
|
|
|
1,173,906
|
|
|
|
—
|
|
|
|
2,891,479
|
|
|
|
|
|
|
Cost and Expense
|
|
|
|
|
|
|
|
|
|
|
|
|
|
|
|
|
|
|
|
|
|
|
|
|
|
Cost of sales
|
|
|
—
|
|
|
|
333
|
|
|
|
1,368,161
|
|
|
|
659,758
|
|
|
|
—
|
|
|
|
2,028,252
|
|
|
Selling, general and administrative expenses
|
|
|
2,776
|
|
|
|
(11,595
|
)
|
|
|
47,326
|
|
|
|
32,229
|
|
|
|
—
|
|
|
|
70,736
|
|
|
Equity (earnings) loss of North American affiliates
|
|
|
—
|
|
|
|
—
|
|
|
|
(58,923
|
)
|
|
|
2,686
|
|
|
|
—
|
|
|
|
(56,237
|
)
|
|
|
|
|
|
Total cost and expenses
|
|
|
2,776
|
|
|
|
(11,262
|
)
|
|
|
1,356,564
|
|
|
|
694,673
|
|
|
|
—
|
|
|
|
2,042,751
|
|
|
|
|
|
|
Income (loss) from operations
|
|
|
(2,776
|
)
|
|
|
11,262
|
|
|
|
361,009
|
|
|
|
479,233
|
|
|
|
—
|
|
|
|
848,728
|
|
|
Interest income
|
|
|
—
|
|
|
|
13,044
|
|
|
|
777
|
|
|
|
9,549
|
|
|
|
—
|
|
|
|
23,370
|
|
|
Interest expense
|
|
|
(1,860
|
)
|
|
|
(24,840
|
)
|
|
|
8,012
|
|
|
|
(8,681
|
)
|
|
|
—
|
|
|
|
(27,369
|
)
|
|
|
|
|
|
Income (loss) before income taxes and noncontrolling interest
|
|
|
(4,636
|
)
|
|
|
(534
|
)
|
|
|
369,798
|
|
|
|
480,101
|
|
|
|
—
|
|
|
|
844,729
|
|
|
Income tax benefit (provision)
|
|
|
1,368
|
|
|
|
(104,556
|
)
|
|
|
(109,165
|
)
|
|
|
(27,498
|
)
|
|
|
—
|
|
|
|
(239,851
|
)
|
|
Equity earnings of unconsolidated affiliates
|
|
|
644,309
|
|
|
|
762,462
|
|
|
|
—
|
|
|
|
95,578
|
|
|
|
(1,406,771
|
)
|
|
|
95,578
|
|
|
|
|
|
|
Income from continuing operations – net of tax
|
|
|
641,041
|
|
|
|
657,372
|
|
|
|
260,633
|
|
|
|
548,181
|
|
|
|
(1,406,771
|
)
|
|
|
700,456
|
|
|
Income from discontinued operations – net of tax
|
|
|
—
|
|
|
|
—
|
|
|
|
8,269
|
|
|
|
—
|
|
|
|
—
|
|
|
|
8,269
|
|
|
|
|
|
|
Net income
|
|
|
641,041
|
|
|
|
657,372
|
|
|
|
268,902
|
|
|
|
548,181
|
|
|
|
(1,406,771
|
)
|
|
|
708,725
|
|
|
Less: Net income attributable to the noncontrolling interest
|
|
|
—
|
|
|
|
13,063
|
|
|
|
54,621
|
|
|
|
—
|
|
|
|
—
|
|
|
|
67,684
|
|
|
|
|
|
|
Net Income attributable to Terra Industries Inc.
|
|
$
|
641,041
|
|
|
$
|
644,309
|
|
|
$
|
214,281
|
|
|
$
|
548,181
|
|
|
$
|
(1,406,771
|
)
|
|
$
|
641,041
|
|
|
|
|
|
108
Condensed
Consolidating Statement of Cash Flows for the Year Ended
December 31, 2008:
| |
|
|
|
|
|
|
|
|
|
|
|
|
|
|
|
|
|
|
|
|
|
|
|
|
|
|
|
|
|
|
|
|
|
Guarantor
|
|
|
Non-Guarantor
|
|
|
|
|
|
|
|
|
|
|
Parent
|
|
|
TCAPI
|
|
|
Subsidiaries
|
|
|
Subsidiaries
|
|
|
Eliminations
|
|
|
Consolidated
|
|
|
|
|
|
|
|
Operating Activities
|
|
|
|
|
|
|
|
|
|
|
|
|
|
|
|
|
|
|
|
|
|
|
|
|
|
Net income
|
|
$
|
641,041
|
|
|
$
|
657,372
|
|
|
$
|
268,902
|
|
|
$
|
548,181
|
|
|
$
|
(1,406,771
|
)
|
|
$
|
708,725
|
|
|
Income from discontinued operations
|
|
|
—
|
|
|
|
—
|
|
|
|
8,269
|
|
|
|
—
|
|
|
|
—
|
|
|
|
8,269
|
|
|
|
|
|
|
Income from continuing operations
|
|
|
641,041
|
|
|
|
657,372
|
|
|
|
260,633
|
|
|
|
548,181
|
|
|
|
(1,406,771
|
)
|
|
|
700,456
|
|
|
Adjustments to reconcile income (loss) from continuing
operations to net cash flows from operating activities:
|
|
|
|
|
|
|
|
|
|
|
|
|
|
|
|
|
|
|
|
|
|
|
|
|
|
Depreciation and amortization
|
|
|
—
|
|
|
|
—
|
|
|
|
43,657
|
|
|
|
35,197
|
|
|
|
—
|
|
|
|
78,854
|
|
|
Loss on sale of property, plant and equipment
|
|
|
—
|
|
|
|
—
|
|
|
|
1,146
|
|
|
|
1,175
|
|
|
|
—
|
|
|
|
2,321
|
|
|
Deferred income taxes
|
|
|
(15,180
|
)
|
|
|
—
|
|
|
|
—
|
|
|
|
—
|
|
|
|
—
|
|
|
|
(15,180
|
)
|
|
Distributions in excess of (less than) equity earnings
|
|
|
(644,309
|
)
|
|
|
(762,462
|
)
|
|
|
5,657
|
|
|
|
2,686
|
|
|
|
1,406,771
|
|
|
|
8,343
|
|
|
Equity earnings – GrowHow UK Limited
|
|
|
—
|
|
|
|
—
|
|
|
|
—
|
|
|
|
(95,578
|
)
|
|
|
—
|
|
|
|
(95,578
|
)
|
|
Non-cash loss on derivatives
|
|
|
39,779
|
|
|
|
—
|
|
|
|
—
|
|
|
|
—
|
|
|
|
—
|
|
|
|
39,779
|
|
|
Share-based compensation
|
|
|
8,104
|
|
|
|
—
|
|
|
|
—
|
|
|
|
—
|
|
|
|
—
|
|
|
|
8,104
|
|
|
Amortization of intangible and other assets
|
|
|
—
|
|
|
|
—
|
|
|
|
5,284
|
|
|
|
3,421
|
|
|
|
—
|
|
|
|
8,705
|
|
|
Change in operating assets and liabilities –
continuing operations
|
|
|
(142,756
|
)
|
|
|
(57,788
|
)
|
|
|
(8,762
|
)
|
|
|
(51,515
|
)
|
|
|
—
|
|
|
|
(260,821
|
)
|
|
|
|
|
|
Net cash flows from operating activities – continuing
operations
|
|
|
(113,321
|
)
|
|
|
(162,878
|
)
|
|
|
307,615
|
|
|
|
443,567
|
|
|
|
—
|
|
|
|
474,983
|
|
|
Net cash flows from operating activities –
discontinued operations
|
|
|
—
|
|
|
|
—
|
|
|
|
8,161
|
|
|
|
—
|
|
|
|
—
|
|
|
|
8,161
|
|
|
|
|
|
|
Net Cash Flows from
Operating Activities
|
|
|
(113,321
|
)
|
|
|
(162,878
|
)
|
|
|
315,776
|
|
|
|
443,567
|
|
|
|
—
|
|
|
|
483,144
|
|
|
|
|
|
|
Investing Activities
|
|
|
|
|
|
|
|
|
|
|
|
|
|
|
|
|
|
|
|
|
|
|
|
|
|
Capital expenditures and plant turnaround expenditures
|
|
|
—
|
|
|
|
—
|
|
|
|
(77,109
|
)
|
|
|
(12,198
|
)
|
|
|
—
|
|
|
|
(89,307
|
)
|
|
Proceeds from the sale of property, plant and equipment
|
|
|
—
|
|
|
|
—
|
|
|
|
1,666
|
|
|
|
407
|
|
|
|
—
|
|
|
|
2,073
|
|
|
Distributions received from unconsolidated affiliate
|
|
|
—
|
|
|
|
—
|
|
|
|
8,180
|
|
|
|
—
|
|
|
|
—
|
|
|
|
8,180
|
|
109
Condensed
Consolidating Statement of Cash Flows at December 31, 2008
(continued):
| |
|
|
|
|
|
|
|
|
|
|
|
|
|
|
|
|
|
|
|
|
|
|
|
|
|
|
|
|
|
|
|
|
|
Guarantor
|
|
|
Non-Guarantor
|
|
|
|
|
|
|
|
|
|
|
Parent
|
|
|
TCAPI
|
|
|
Subsidiaries
|
|
|
Subsidiaries
|
|
|
Eliminations
|
|
|
Consolidated
|
|
|
|
|
|
|
|
Contribution settlement received from GrowHow UK Limited
|
|
|
—
|
|
|
|
—
|
|
|
|
—
|
|
|
|
27,427
|
|
|
|
—
|
|
|
|
27,427
|
|
|
Balancing consideration payment from GrowHow UK Limited
|
|
|
—
|
|
|
|
—
|
|
|
|
—
|
|
|
|
61,272
|
|
|
|
—
|
|
|
|
61,272
|
|
|
|
|
|
|
Net cash flows from investing activities – continuing
operations
|
|
|
—
|
|
|
|
—
|
|
|
|
(67,263
|
)
|
|
|
76,908
|
|
|
|
—
|
|
|
|
9,645
|
|
|
Net cash flows from investing activities –
discontinued operations
|
|
|
—
|
|
|
|
—
|
|
|
|
41,879
|
|
|
|
—
|
|
|
|
—
|
|
|
|
41,879
|
|
|
|
|
|
|
Net Cash Flows from Investing Activities
|
|
|
—
|
|
|
|
—
|
|
|
|
(25,384
|
)
|
|
|
76,908
|
|
|
|
—
|
|
|
|
51,524
|
|
|
|
|
|
|
Financing Activities
|
|
|
|
|
|
|
|
|
|
|
|
|
|
|
|
|
|
|
|
|
|
|
|
|
|
Preferred share dividends paid
|
|
|
(3,876
|
)
|
|
|
—
|
|
|
|
—
|
|
|
|
—
|
|
|
|
—
|
|
|
|
(3,876
|
)
|
|
Preferred share inducement
|
|
|
(5,266
|
)
|
|
|
—
|
|
|
|
—
|
|
|
|
—
|
|
|
|
—
|
|
|
|
(5,266
|
)
|
|
Common stock dividends paid
|
|
|
(28,274
|
)
|
|
|
—
|
|
|
|
—
|
|
|
|
—
|
|
|
|
—
|
|
|
|
(28,274
|
)
|
|
Common stock issuances and vestings
|
|
|
(9,839
|
)
|
|
|
—
|
|
|
|
—
|
|
|
|
—
|
|
|
|
—
|
|
|
|
(9,839
|
)
|
|
Change in investments and advances from (to) affiliates
|
|
|
305,954
|
|
|
|
438,735
|
|
|
|
(203,322
|
)
|
|
|
(1,072,883
|
)
|
|
|
531,516
|
|
|
|
—
|
|
|
Excess tax benefits from equity compensation plans
|
|
|
12,122
|
|
|
|
—
|
|
|
|
—
|
|
|
|
—
|
|
|
|
—
|
|
|
|
12,122
|
|
|
Payments under share repurchase program
|
|
|
(157,500
|
)
|
|
|
—
|
|
|
|
—
|
|
|
|
—
|
|
|
|
—
|
|
|
|
(157,500
|
)
|
|
Distributions to noncontrolling interests
|
|
|
—
|
|
|
|
—
|
|
|
|
(69,557
|
)
|
|
|
—
|
|
|
|
—
|
|
|
|
(69,557
|
)
|
|
|
|
|
|
Net cash flows from financing activities – continuing
operations
|
|
|
113,321
|
|
|
|
438,735
|
|
|
|
(272,879
|
)
|
|
|
(1,072,883
|
)
|
|
|
531,516
|
|
|
|
(262,190
|
)
|
|
Net cash flows from financing activities –
discontinued operations
|
|
|
—
|
|
|
|
—
|
|
|
|
—
|
|
|
|
—
|
|
|
|
—
|
|
|
|
—
|
|
|
|
|
|
|
Net Cash Flows from
|
|
|
|
|
|
|
|
|
|
|
|
|
|
|
|
|
|
|
|
|
|
|
|
|
|
Financing Activities
|
|
|
113,321
|
|
|
|
438,735
|
|
|
|
(272,879
|
)
|
|
|
(1,072,883
|
)
|
|
|
531,516
|
|
|
|
(262,190
|
)
|
|
|
|
|
|
Effect of Foreign Exchange Rate on Cash
|
|
|
—
|
|
|
|
—
|
|
|
|
—
|
|
|
|
(4,016
|
)
|
|
|
—
|
|
|
|
(4,016
|
)
|
|
|
|
|
|
Increase (Decrease) in Cash and Cash Equivalents
|
|
|
—
|
|
|
|
275,857
|
|
|
|
17,513
|
|
|
|
(556,424
|
)
|
|
|
531,516
|
|
|
|
268,462
|
|
|
|
|
|
|
Cash and Cash Equivalents at Beginning of Year
|
|
|
—
|
|
|
|
55,857
|
|
|
|
267,145
|
|
|
|
906,752
|
|
|
|
(531,516
|
)
|
|
|
698,238
|
|
|
|
|
|
|
Cash and Cash Equivalents at End of Year
|
|
$
|
—
|
|
|
$
|
331,714
|
|
|
$
|
284,658
|
|
|
$
|
350,328
|
|
|
$
|
—
|
|
|
$
|
966,700
|
|
|
|
|
|
110
Condensed
Consolidating Statement of Operations for the Year Ended
December 31, 2007:
| |
|
|
|
|
|
|
|
|
|
|
|
|
|
|
|
|
|
|
|
|
|
|
|
|
|
|
|
|
|
|
|
|
|
Guarantor
|
|
|
Non-Guarantor
|
|
|
|
|
|
|
|
|
|
|
Parent
|
|
|
TCAPI
|
|
|
Subsidiaries
|
|
|
Subsidiaries
|
|
|
Eliminations
|
|
|
Consolidated
|
|
|
|
|
|
|
|
Revenues
|
|
|
|
|
|
|
|
|
|
|
|
|
|
|
|
|
|
|
|
|
|
|
|
|
|
Product revenues
|
|
$
|
—
|
|
|
$
|
—
|
|
|
$
|
1,181,736
|
|
|
$
|
1,154,138
|
|
|
$
|
—
|
|
|
$
|
2,335,874
|
|
|
Other income
|
|
|
—
|
|
|
|
—
|
|
|
|
5,104
|
|
|
|
1,951
|
|
|
|
—
|
|
|
|
7,055
|
|
|
|
|
|
|
Total revenues
|
|
|
—
|
|
|
|
—
|
|
|
|
1,186,840
|
|
|
|
1,156,089
|
|
|
|
—
|
|
|
|
2,342,929
|
|
|
|
|
|
|
Cost and Expense
|
|
|
|
|
|
|
|
|
|
|
|
|
|
|
|
|
|
|
|
|
|
|
|
|
|
Cost of sales
|
|
|
900
|
|
|
|
345
|
|
|
|
982,627
|
|
|
|
831,548
|
|
|
|
1
|
|
|
|
1,815,421
|
|
|
Selling, general and administrative expenses
|
|
|
2,179
|
|
|
|
(10,611
|
)
|
|
|
32,439
|
|
|
|
67,962
|
|
|
|
2
|
|
|
|
91,971
|
|
|
Equity earnings of North American affiliates
|
|
|
—
|
|
|
|
—
|
|
|
|
(16,209
|
)
|
|
|
—
|
|
|
|
—
|
|
|
|
(16,209
|
)
|
|
|
|
|
|
Total cost and expenses
|
|
|
3,079
|
|
|
|
(10,266
|
)
|
|
|
998,857
|
|
|
|
899,510
|
|
|
|
3
|
|
|
|
1,891,183
|
|
|
|
|
|
|
Income (loss) from operations
|
|
|
(3,079
|
)
|
|
|
10,266
|
|
|
|
187,983
|
|
|
|
256,579
|
|
|
|
(3
|
)
|
|
|
451,746
|
|
|
Interest income
|
|
|
—
|
|
|
|
6,093
|
|
|
|
5,077
|
|
|
|
6,092
|
|
|
|
—
|
|
|
|
17,262
|
|
|
Interest expense
|
|
|
(1,860
|
)
|
|
|
(26,909
|
)
|
|
|
(6
|
)
|
|
|
(325
|
)
|
|
|
—
|
|
|
|
(29,100
|
)
|
|
Loss on early retirement of debt
|
|
|
—
|
|
|
|
(38,836
|
)
|
|
|
—
|
|
|
|
—
|
|
|
|
—
|
|
|
|
(38,836
|
)
|
|
Foreign currency gain (loss)
|
|
|
—
|
|
|
|
(1,886
|
)
|
|
|
8
|
|
|
|
1,878
|
|
|
|
—
|
|
|
|
—
|
|
|
|
|
|
|
Income (loss) before income taxes and noncontrolling interest
|
|
|
(4,939
|
)
|
|
|
(51,272
|
)
|
|
|
193,062
|
|
|
|
264,224
|
|
|
|
(3
|
)
|
|
|
401,072
|
|
|
Income tax benefit (provision)
|
|
|
1,790
|
|
|
|
(37,582
|
)
|
|
|
(70,815
|
)
|
|
|
(20,709
|
)
|
|
|
—
|
|
|
|
(127,316
|
)
|
|
Equity (earnings) loss of unconsolidated affiliates
|
|
|
205,045
|
|
|
|
303,602
|
|
|
|
—
|
|
|
|
(2,718
|
)
|
|
|
(508,647
|
)
|
|
|
(2,718
|
)
|
|
|
|
|
|
Income from continuing operations – net of tax
|
|
|
201,896
|
|
|
|
214,748
|
|
|
|
122,247
|
|
|
|
240,797
|
|
|
|
(580,650
|
)
|
|
|
271,038
|
|
|
Income from discontinued operations – net of tax
|
|
|
—
|
|
|
|
—
|
|
|
|
(18,861
|
)
|
|
|
—
|
|
|
|
—
|
|
|
|
(18,861
|
)
|
|
|
|
|
|
Net income
|
|
|
201,896
|
|
|
|
214,748
|
|
|
|
103,386
|
|
|
|
240,797
|
|
|
|
(580,650
|
)
|
|
|
252,177
|
|
|
Less: Net income attributable to the noncontrolling interest
|
|
|
—
|
|
|
|
9,704
|
|
|
|
40,577
|
|
|
|
—
|
|
|
|
—
|
|
|
|
50,281
|
|
|
|
|
|
|
Net income attributable to
Terra Industries Inc.
|
|
$
|
201,896
|
|
|
$
|
205,044
|
|
|
$
|
62,809
|
|
|
$
|
240,797
|
|
|
$
|
(508,650
|
)
|
|
$
|
201,896
|
|
|
|
|
|
111
Condensed
Consolidating Statement of Cash Flows for the Year Ended
December 31, 2007:
| |
|
|
|
|
|
|
|
|
|
|
|
|
|
|
|
|
|
|
|
|
|
|
|
|
|
|
|
|
|
|
|
|
|
Guarantor
|
|
|
Non-Guarantor
|
|
|
|
|
|
|
|
|
|
|
Parent
|
|
|
TCAPI
|
|
|
Subsidiaries
|
|
|
Subsidiaries
|
|
|
Eliminations
|
|
|
Consolidated
|
|
|
|
|
|
|
|
Operating Activities
|
|
|
|
|
|
|
|
|
|
|
|
|
|
|
|
|
|
|
|
|
|
|
|
|
|
Net income
|
|
$
|
201,896
|
|
|
$
|
214,748
|
|
|
$
|
103,386
|
|
|
$
|
240,797
|
|
|
$
|
(508,650
|
)
|
|
$
|
252,177
|
|
|
Loss from discontinued operations
|
|
|
—
|
|
|
|
—
|
|
|
|
(18,861
|
)
|
|
|
—
|
|
|
|
—
|
|
|
|
(18,861
|
)
|
|
|
|
|
|
Income from continuing operations
|
|
|
201,896
|
|
|
|
214,748
|
|
|
|
122,247
|
|
|
|
240,797
|
|
|
|
(508,650
|
)
|
|
|
271,038
|
|
|
Adjustments to reconcile income (loss) from continuing
operations to net cash flows from operating activities:
|
|
|
|
|
|
|
|
|
|
|
|
|
|
|
|
|
|
|
|
|
|
|
|
|
|
Depreciation and amortization
|
|
|
—
|
|
|
|
—
|
|
|
|
40,407
|
|
|
|
54,377
|
|
|
|
—
|
|
|
|
94,784
|
|
|
Deferred income taxes
|
|
|
90,879
|
|
|
|
—
|
|
|
|
12,521
|
|
|
|
—
|
|
|
|
—
|
|
|
|
103,400
|
|
|
Distributions in excess of (less than) equity earnings
|
|
|
(205,045
|
)
|
|
|
(303,602
|
)
|
|
|
8,536
|
|
|
|
379,935
|
|
|
|
128,712
|
|
|
|
8,536
|
|
|
Equity earnings – GrowHow UK Limited
|
|
|
—
|
|
|
|
—
|
|
|
|
—
|
|
|
|
2,718
|
|
|
|
—
|
|
|
|
2,718
|
|
|
Non-cash loss on derivatives
|
|
|
1,300
|
|
|
|
—
|
|
|
|
—
|
|
|
|
—
|
|
|
|
—
|
|
|
|
1,300
|
|
|
Share-based compensation
|
|
|
28,103
|
|
|
|
—
|
|
|
|
—
|
|
|
|
—
|
|
|
|
(1
|
)
|
|
|
28,102
|
|
|
Amortization of intangible and other assets
|
|
|
—
|
|
|
|
—
|
|
|
|
3,713
|
|
|
|
3,240
|
|
|
|
1
|
|
|
|
6,954
|
|
|
Non-cash loss on early retirement of debt
|
|
|
—
|
|
|
|
4,662
|
|
|
|
—
|
|
|
|
—
|
|
|
|
—
|
|
|
|
4,662
|
|
|
Change in operating assets and liabilities –
continuing operations
|
|
|
(83,235
|
)
|
|
|
(1,849
|
)
|
|
|
84,546
|
|
|
|
460,090
|
|
|
|
(247,262
|
)
|
|
|
212,290
|
|
|
|
|
|
|
Net cash flows from operating activities – continuing
operations
|
|
|
33,898
|
|
|
|
(86,041
|
)
|
|
|
271,970
|
|
|
|
1,141,157
|
|
|
|
(627,200
|
)
|
|
|
733,784
|
|
|
Net cash flows from operating activities –
discontinued operations
|
|
|
—
|
|
|
|
—
|
|
|
|
14,081
|
|
|
|
—
|
|
|
|
—
|
|
|
|
14,081
|
|
|
|
|
|
|
Net Cash Flows from
Operating Activities
|
|
|
33,898
|
|
|
|
(86,041
|
)
|
|
|
286,051
|
|
|
|
1,141,157
|
|
|
|
(627,200
|
)
|
|
|
747,865
|
|
|
|
|
|
|
Investing Activities
|
|
|
|
|
|
|
|
|
|
|
|
|
|
|
|
|
|
|
|
|
|
|
|
|
|
Capital expenditures and plant turnaround expenditures
|
|
|
—
|
|
|
|
—
|
|
|
|
(18,676
|
)
|
|
|
(63,699
|
)
|
|
|
(1
|
)
|
|
|
(82,376
|
)
|
|
Cash retained by GrowHow UK Limited
|
|
|
—
|
|
|
|
—
|
|
|
|
—
|
|
|
|
(16,788
|
)
|
|
|
—
|
|
|
|
(16,788
|
)
|
|
Proceeds from the sale of property, plant and equipment
|
|
|
—
|
|
|
|
—
|
|
|
|
24
|
|
|
|
—
|
|
|
|
—
|
|
|
|
24
|
|
|
Distributions received from unconsolidated affiliate
|
|
|
—
|
|
|
|
—
|
|
|
|
4,705
|
|
|
|
—
|
|
|
|
—
|
|
|
|
4,705
|
|
|
|
|
|
112
Condensed
Consolidating Statement of Cash Flows for the Year Ended
December 31, 2007: (continued)
| |
|
|
|
|
|
|
|
|
|
|
|
|
|
|
|
|
|
|
|
|
|
|
|
|
|
|
|
|
|
|
|
|
|
Guarantor
|
|
|
Non-Guarantor
|
|
|
|
|
|
|
|
|
|
|
Parent
|
|
|
TCAPI
|
|
|
Subsidiaries
|
|
|
Subsidiaries
|
|
|
Eliminations
|
|
|
Consolidated
|
|
|
|
|
|
|
|
Net Cash Flows from
Investing Activities
|
|
|
—
|
|
|
|
—
|
|
|
|
(13,947
|
)
|
|
|
(80,487
|
)
|
|
|
(1
|
)
|
|
|
(94,435
|
)
|
|
|
|
|
|
Financing Activities
|
|
|
|
|
|
|
|
|
|
|
|
|
|
|
|
|
|
|
|
|
|
|
|
|
|
Issuance of debt
|
|
|
—
|
|
|
|
330,000
|
|
|
|
—
|
|
|
|
—
|
|
|
|
—
|
|
|
|
330,000
|
|
|
Payments under borrowing arrangements
|
|
|
—
|
|
|
|
(331,300
|
)
|
|
|
(1
|
)
|
|
|
—
|
|
|
|
1
|
|
|
|
(331,300
|
)
|
|
Payments for debt issuance costs
|
|
|
—
|
|
|
|
(6,444
|
)
|
|
|
—
|
|
|
|
—
|
|
|
|
—
|
|
|
|
(6,444
|
)
|
|
Preferred share dividends paid
|
|
|
(5,100
|
)
|
|
|
—
|
|
|
|
—
|
|
|
|
—
|
|
|
|
—
|
|
|
|
(5,100
|
)
|
|
Common stock issuances and vestings
|
|
|
(1,424
|
)
|
|
|
—
|
|
|
|
—
|
|
|
|
—
|
|
|
|
—
|
|
|
|
(1,424
|
)
|
|
Change in investments and advances from (to) affiliates
|
|
|
56,734
|
|
|
|
48,906
|
|
|
|
30,281
|
|
|
|
(231,607
|
)
|
|
|
95,686
|
|
|
|
—
|
|
|
Excess tax benefits from equity compensation plans
|
|
|
3,317
|
|
|
|
—
|
|
|
|
—
|
|
|
|
—
|
|
|
|
—
|
|
|
|
3,317
|
|
|
Payments under share repurchase program
|
|
|
(87,426
|
)
|
|
|
—
|
|
|
|
—
|
|
|
|
—
|
|
|
|
—
|
|
|
|
(87,426
|
)
|
|
Distributions to noncontrolling interests
|
|
|
—
|
|
|
|
—
|
|
|
|
(35,239
|
)
|
|
|
—
|
|
|
|
—
|
|
|
|
(35,239
|
)
|
|
|
|
|
|
Net Cash Flows from
Financing Activities
|
|
|
(33,899
|
)
|
|
|
41,162
|
|
|
|
(4,959
|
)
|
|
|
(231,607
|
)
|
|
|
95,687
|
|
|
|
(133,616
|
)
|
|
|
|
|
|
Effect of Foreign Exchange
Rate Changes on Cash
|
|
|
—
|
|
|
|
—
|
|
|
|
—
|
|
|
|
(593
|
)
|
|
|
—
|
|
|
|
(593
|
)
|
|
|
|
|
|
Increase (Decrease) in Cash
and Cash Equivalents
|
|
|
(1
|
)
|
|
|
(44,879
|
)
|
|
|
267,145
|
|
|
|
828,470
|
|
|
|
(531,514
|
)
|
|
|
519,221
|
|
|
|
|
|
|
Cash and Cash Equivalents
at Beginning of Year
|
|
|
1
|
|
|
|
100,736
|
|
|
|
—
|
|
|
|
78,282
|
|
|
|
(2
|
)
|
|
|
179,017
|
|
|
|
|
|
|
Cash and Cash Equivalents
at End of Year
|
|
$
|
—
|
|
|
$
|
55,857
|
|
|
$
|
267,145
|
|
|
$
|
906,752
|
|
|
$
|
(531,516
|
)
|
|
$
|
698,238
|
|
|
|
|
|
113
|
|
|
25.
|
Quarterly
Financial Data (Unaudited)
|
| |
|
|
|
|
|
|
|
|
|
|
|
|
|
|
|
|
|
(in thousands, except per-share
data)
|
|
March 31
|
|
|
June 30
|
|
|
Sept. 30
|
|
|
Dec. 31
|
|
|
|
|
|
|
|
2009
|
|
|
|
|
|
|
|
|
|
|
|
|
|
|
|
|
|
|
|
|
|
Revenues
|
|
$
|
419,753
|
|
|
$
|
453,503
|
|
|
$
|
347,046
|
|
|
$
|
361,130
|
|
|
Cost of sales
|
|
|
342,957
|
|
|
|
296,690
|
|
|
|
281,621
|
|
|
|
273,908
|
|
|
|
|
|
|
Gross profit
|
|
$
|
76,796
|
|
|
$
|
156,813
|
|
|
$
|
65,425
|
|
|
$
|
87,222
|
|
|
|
|
|
|
|
|
|
|
|
|
|
|
|
|
|
|
|
|
|
|
|
|
Amounts attributable to Terra Industries Inc.:
|
|
|
|
|
|
|
|
|
|
|
|
|
|
|
|
|
|
Income (loss) from continuing operations, net of tax
|
|
$
|
29,995
|
|
|
$
|
80,474
|
|
|
$
|
45,118
|
|
|
$
|
(4,072
|
)
|
|
Income from discontinued operations, net of tax
|
|
|
—
|
|
|
|
—
|
|
|
|
810
|
|
|
|
308
|
|
|
|
|
|
|
Net income (loss) attributable to
Terra Industries Inc.
|
|
$
|
29,995
|
|
|
$
|
80,474
|
|
|
$
|
45,928
|
|
|
$
|
(3,764
|
)
|
|
|
|
|
|
|
|
|
|
|
|
|
|
|
|
|
|
|
|
|
|
|
|
Net income
|
|
$
|
37,903
|
|
|
$
|
89,948
|
|
|
$
|
48,900
|
|
|
$
|
1,866
|
|
|
Less: Net income attributable to noncontrolling interest
|
|
|
7,908
|
|
|
|
9,474
|
|
|
|
2,972
|
|
|
|
5,630
|
|
|
|
|
|
|
Net income (loss) attributable to Terra Industries Inc.
|
|
$
|
29,995
|
|
|
$
|
80,474
|
|
|
$
|
45,928
|
|
|
$
|
(3,764
|
)
|
|
|
|
|
|
|
|
|
|
|
|
|
|
|
|
|
|
|
|
|
|
|
|
Per Share Data:
|
|
|
|
|
|
|
|
|
|
|
|
|
|
|
|
|
|
Basic income (loss) per common share attributable to Terra
Industries Inc.:
|
|
|
|
|
|
|
|
|
|
|
|
|
|
|
|
|
|
Continuing operations
|
|
$
|
0.30
|
|
|
$
|
0.81
|
|
|
$
|
0.46
|
|
|
$
|
(0.04
|
)
|
|
Discontinued operations
|
|
|
—
|
|
|
|
—
|
|
|
|
0.01
|
|
|
|
—
|
|
|
|
|
|
|
Basic income (loss) per common share
|
|
$
|
0.30
|
|
|
$
|
0.81
|
|
|
$
|
0.47
|
|
|
$
|
(0.04
|
)
|
|
|
|
|
|
Diluted income (loss) per common share attributable to Terra
Industries Inc.:
|
|
|
|
|
|
|
|
|
|
|
|
|
|
|
|
|
|
Continuing operations
|
|
$
|
0.30
|
|
|
$
|
0.81
|
|
|
$
|
0.45
|
|
|
$
|
(0.04
|
)
|
|
Discontinued operations
|
|
|
—
|
|
|
|
—
|
|
|
|
0.01
|
|
|
|
—
|
|
|
|
|
|
|
Diluted income (loss) per common share
|
|
$
|
0.30
|
|
|
$
|
0.81
|
|
|
$
|
0.46
|
|
|
$
|
(0.04
|
)
|
|
|
|
|
|
2008
|
|
|
|
|
|
|
|
|
|
|
|
|
|
|
|
|
|
|
|
|
|
Revenues
|
|
$
|
574,704
|
|
|
$
|
843,097
|
|
|
$
|
790,214
|
|
|
$
|
683,464
|
|
|
Cost of sales
|
|
|
406,989
|
|
|
|
547,070
|
|
|
|
578,310
|
|
|
|
495,883
|
|
|
|
|
|
|
Gross profit
|
|
$
|
167,715
|
|
|
$
|
296,027
|
|
|
$
|
211,904
|
|
|
$
|
187,581
|
|
|
|
|
|
|
Amounts attributable to Terra Industries Inc.:
|
|
|
|
|
|
|
|
|
|
|
|
|
|
|
|
|
|
Income from continuing operations, net of tax
|
|
$
|
101,305
|
|
|
$
|
196,116
|
|
|
$
|
171,270
|
|
|
$
|
164,081
|
|
|
Income from discontinued operations, net of tax
|
|
|
152
|
|
|
|
7,319
|
|
|
|
141
|
|
|
|
657
|
|
|
|
|
|
|
Net income attributable to Terra Industries Inc.
|
|
$
|
101,457
|
|
|
$
|
203,435
|
|
|
$
|
171,411
|
|
|
$
|
164,738
|
|
|
|
|
|
|
Net income
|
|
$
|
119,583
|
|
|
$
|
221,930
|
|
|
$
|
187,159
|
|
|
$
|
180,053
|
|
|
Less: Net income attributable to noncontrolling interest
|
|
|
18,126
|
|
|
|
18,495
|
|
|
|
15,748
|
|
|
|
15,315
|
|
|
|
|
|
|
Net income attributable to Terra Industries Inc.
|
|
$
|
101,457
|
|
|
$
|
203,435
|
|
|
$
|
171,411
|
|
|
$
|
164,738
|
|
|
|
|
|
114
| |
|
|
|
|
|
|
|
|
|
|
|
|
|
|
|
|
|
Per Share Data:
|
|
|
|
|
|
|
|
|
|
|
|
|
|
|
|
|
|
Basic income per common share attributable to Terra Industries
Inc.:
|
|
|
|
|
|
|
|
|
|
|
|
|
|
|
|
|
|
Continuing operations
|
|
$
|
1.11
|
|
|
$
|
2.14
|
|
|
$
|
1.75
|
|
|
$
|
1.65
|
|
|
Discontinued operations
|
|
|
—
|
|
|
|
0.08
|
|
|
|
—
|
|
|
|
0.01
|
|
|
|
|
|
|
Basic income per common share
|
|
$
|
1.11
|
|
|
$
|
2.22
|
|
|
$
|
1.75
|
|
|
$
|
1.66
|
|
|
|
|
|
|
Diluted income per common share attributable to Terra Industries
Inc.:
|
|
|
|
|
|
|
|
|
|
|
|
|
|
|
|
|
|
Continuing operations
|
|
$
|
0.97
|
|
|
$
|
1.87
|
|
|
$
|
1.64
|
|
|
$
|
1.64
|
|
|
Discontinued operations
|
|
|
—
|
|
|
|
0.07
|
|
|
|
—
|
|
|
|
0.01
|
|
|
|
|
|
|
Diluted income per common share
|
|
$
|
0.97
|
|
|
$
|
1.94
|
|
|
$
|
1.64
|
|
|
$
|
1.65
|
|
|
|
|
|
26. Unsolicited
Proposals for a Business Combination by CF Industries Holdings,
Inc.
During 2009, CF Industries Holdings, Inc. made a number of
unsolicited business proposals to acquire Terra. Each such
proposal was examined by the Board of Directors of Terra and
each such proposal was unanimously rejected by the Board of
Directors of Terra.
On January 14, 2010, CF announced that it had withdrawn its
proposal to acquire Terra, was no longer pursuing the
acquisition and had sold all of its Terra common stock.
For the year ending December 31, 2009, Terra incurred
defense costs of $18.0 million related to CF’s
unsolicited business proposals.
On February 12, 2010, Terra entered into an Agreement and
Plan of Merger (the “Yara Merger Agreement”) with Yara
International ASA (“Yara”) and Yukon Merger Sub, Inc.
(“Merger Sub”), an indirect, wholly owned subsidiary
of Yara. If the transactions contemplated by the Yara Merger
Agreement are consummated, Merger Sub will merge with and into
Terra (the “Yara Merger”), with the result that Terra
will become an indirect, wholly owned subsidiary of Yara.
Upon consummation of the Yara Merger, each outstanding share of
Terra common stock will be converted into the right to receive
$41.10 in cash, without interest and less any taxes required to
be withheld. The purchase price is subject to increase as
provided in the Yara Merger Agreement if Yara does not hold its
stockholders meeting to obtain the Yara Stockholder Approval (as
defined below) within 90 days from the date of execution of
the Yara Merger Agreement.
The consummation of the Yara Merger is subject to certain
conditions, including, among others, (i) the approval by
Terra’s stockholders (the “Terra Stockholder
Approval”) of the Yara Merger, (ii) the approval by
Yara’s stockholders (the “Yara Stockholder
Approval”) of the issuance of Yara common stock to finance
a portion of the Yara Merger consideration, (iii) the
receipt of regulatory approvals (or the expiration of applicable
waiting periods) in the United States, Canada and the European
Union, (iv) the absence of legal restraints preventing
consummation of the Yara Merger, (v) the absence of pending
lawsuits by any governmental entity seeking to prevent
consummation of the Yara Merger that would reasonably be
expected to result in certain material adverse effects on Terra
and (vi) the absence since January 1, 2009 of any
change or event that, individually or in the aggregate, has
resulted in or would reasonably be expected to result in a
material adverse effect on Terra. The Yara Merger is not subject
to any financing condition.
The Yara Merger Agreement contains certain termination rights
and provides that (i) upon the termination of the Yara
Merger Agreement under specified circumstances, including, among
others, by Terra to accept a superior proposal or by Yara upon a
change in the recommendation of Terra’s board of directors,
Terra will owe Yara a cash termination fee of $123 million
and (ii) upon the termination of the Yara Merger Agreement
due to Yara’s failure to obtain the Yara Stockholder
Approval, Yara will owe Terra a cash termination fee of
$123 million.
115
|
|
|
ITEM 9.
|
CHANGES
IN AND DISAGREEMENTS WITH ACCOUNTANTS ON ACCOUNTING AND
FINANCIAL DISCLOSURE
|
None.
|
|
|
ITEM 9A.
|
CONTROLS
AND PROCEDURES
|
(a) Disclosure
Controls and Procedures
We maintain disclosure controls and procedures that are designed
to ensure that information required to be disclosed by us in the
reports we file or submit under the Securities Exchange Act of
1934 (the Exchange Act) is recorded, processed, summarized and
reported within the time periods specified in the SEC’s
rules and forms, and that such information is accumulated and
communicated to our management, including our Chief Executive
Officer (principal executive officer) and Chief Financial
Officer (principal financial officer), to allow timely decisions
regarding required disclosure. We have established a Disclosure
Committee, consisting of certain members of management, to
assist in this evaluation. The Disclosure Committee meets on a
quarterly basis and more often if necessary.
Our management, with the participation of our Chief Executive
Officer and Chief Financial Officer, has evaluated the
effectiveness of our disclosure controls and procedures (as such
term is defined in
Rules 13a-15(e)
and
15d-15(e)
under the Exchange Act), as of the end of the period covered by
this report. Based on the evaluation performed by our
management, including our Chief Executive Officer and Chief
Financial Officer, management has concluded that, as of the end
of such period, our disclosure controls and procedures are
effective in recording, processing, summarizing and reporting
within the time periods specified by the Securities and Exchange
Commission’s rules and forms and that information required
to be disclosed by the Company in the reports that it files or
submits is accumulated and communicated to management, including
the Chief Executive Officer and Chief Financial Officer, as
appropriate to allow timely decisions regarding required
disclosures.
|
|
|
(b)
|
Changes in
Internal Control over Financial Reporting
|
There were no changes in internal control over financial
reporting (as such term is defined in
Rules 13a-15(f)
and 15(a)-15(f) under the Exchange Act) during the fiscal fourth
quarter ended December 31, 2009, that have materially
affected, or are reasonably likely to materially affect, our
internal control over financial reporting. There were no
material weaknesses identified in the review and evaluation, and
therefore no corrective actions were taken.
|
|
|
(c)
|
Management’s
Report on Internal Control over Financial Reporting
|
Section 404 of the Sarbanes-Oxley Act of 2002 requires that
management document and test the Company’s internal control
over financial reporting and include in this Annual Report on
Form 10-K
a report on management’s assessment of the effectiveness of
our internal control over financial reporting. See
“Management’s Report on Internal Control over
Financial Reporting” below. Deloitte & Touche
LLP’s attestation report on the effectiveness of our
internal control over financial reporting is included below in
this Annual Report on
Form 10-K.
The certifications of our Chief Executive Officer and our Chief
Financial Officer required by Section 302 of the
Sarbanes-Oxley Act of 2002 are filed as
Exhibits No. 31.1 and No. 31.2, respectively, to
this Annual Report on
Form 10-K.
116
Management’s
Annual Report on Internal Control over Financial
Reporting
Our management is responsible for establishing and maintaining
adequate internal control over financial reporting as defined in
Rule 13a-15(f)
and
15a-15(f)
under the Securities Exchange Act of 1934. Our internal control
over financial reporting is designed by, and under the
supervision of our Chief Executive Officer and Chief Financial
Officer, and effected by our Board of Directors, management and
other personnel, to provide reasonable assurance regarding the
reliability of financial reporting and the preparation of
financial statements for external purposes in accordance with
accounting principles generally accepted in the United States
and includes those policies and procedures that:
|
|
|
| |
1.
|
Pertain to the maintenance of records that in reasonable detail
accurately and fairly reflect our transactions and the
dispositions of our assets;
|
| |
| |
2.
|
Provide reasonable assurance that our transactions are recorded
as necessary to permit preparation of financial statements in
accordance with generally accepted accounting principles, and
that our receipts and expenditures are being made only in
accordance with authorizations of our management and Board of
Directors; and
|
| |
| |
3.
|
Provide reasonable assurance regarding prevention or timely
detection of unauthorized acquisition, use or disposition of our
assets that could have a material effect on our financial
statements.
|
Because of its inherent limitations, internal control over
financial reporting may not prevent or detect misstatements.
Therefore, even those systems determined to be effective can
provide only reasonable assurance with respect to financial
statement preparation and presentation.
Under the supervision and with the participation of our
management, including our principal executive officer and
principal financial officer, we assessed the effectiveness of
our internal control over financial reporting as of
December 31, 2009, using the criteria set forth by the
Committee of Sponsoring Organizations of the Treadway Commission
in Internal Control – Integrated Framework.
Based on its assessment, management has concluded that our
internal control over financial reporting was effective as of
December 31, 2009. During its assessment, management did
not identify any material weaknesses in our internal control
over financial reporting.
The effectiveness of the Company’s internal control over
financial reporting as of December 31, 2009 has been
audited by Deloitte & Touche LLP, an independent
registered public accounting firm, as stated in their report, a
copy of which is included in this Annual Report on
Form 10-K.
117
Report of
Independent Registered Public Accounting Firm
To the Board of Directors and Stockholders of Terra
Industries Inc.:
We have audited the internal control over financial reporting of
Terra Industries Inc. and subsidiaries (the Company) as of
December 31, 2009, based on the criteria established in
Internal Control – Integrated Framework issued
by the Committee of Sponsoring Organizations of the Treadway
Commission. The Company’s management is responsible for
maintaining effective internal control over financial reporting
and for its assessment of the effectiveness of internal control
over financial reporting, included in the accompanying
Management’s Annual Report on Internal Control Over
Financial Reporting. Our responsibility is to express an
opinion on the Company’s internal control over financial
reporting based on our audit.
We conducted our audit in accordance with the standards of the
Public Company Accounting Oversight Board (United States). Those
standards require that we plan and perform the audit to obtain
reasonable assurance about whether effective internal control
over financial reporting was maintained in all material
respects. Our audit included obtaining an understanding of
internal control over financial reporting, assessing the risk
that a material weakness exists, testing and evaluating the
design and operating effectiveness of internal control based on
the assessed risk, and performing such other procedures as we
considered necessary in the circumstances. We believe that our
audit provides a reasonable basis for our opinion.
A company’s internal control over financial reporting is a
process designed by, or under the supervision of, the
company’s principal executive and principal financial
officers, or persons performing similar functions, and effected
by the company’s board of directors, management, and other
personnel to provide reasonable assurance regarding the
reliability of financial reporting and the preparation of
financial statements for external purposes in accordance with
generally accepted accounting principles. A company’s
internal control over financial reporting includes those
policies and procedures that (1) pertain to the maintenance
of records, that, in reasonable detail, accurately and fairly
reflect the transactions and dispositions of the assets of the
company; (2) provide reasonable assurance that transactions
are recorded as necessary to permit preparation of financial
statements in accordance with generally accepted accounting
principles, and that receipts and expenditures of the company
are being made only in accordance with authorizations of
management and directors of the company; and (3) provide
reasonable assurance regarding prevention or timely detection of
unauthorized acquisition, use, or disposition of the
company’s assets that could have a material effect on the
financial statements.
Because of the inherent limitations of internal control over
financial reporting, including the possibility of collusion or
improper management override of controls, material misstatements
due to error or fraud may not be prevented or detected on a
timely basis. Also, projections of any evaluation of the
effectiveness of the internal control over financial reporting
to future periods are subject to the risk that the controls may
become inadequate because of changes in conditions, or that the
degree of compliance with the policies or procedures may
deteriorate.
In our opinion, the Company maintained, in all material
respects, effective internal control over financial reporting as
of December 31, 2009, based on the criteria established in
Internal Control – Integrated Framework issued
by the Committee of Sponsoring Organizations of the Treadway
Commission.
We have also audited, in accordance with the standards of the
Public Company Accounting Oversight Board (United States), the
consolidated financial statements and financial statement
schedule as of and for the year ended December 31, 2009, of
the Company and our report dated February 25, 2010
expressed an unqualified opinion on those financial statements
and financial statement schedule and included an explanatory
paragraph regarding the Company’s retrospective adoption of
the guidance related to noncontrolling interest in consolidated
financial statements effective January 1, 2009.
Omaha, Nebraska
February 25, 2010
118
|
|
|
ITEM 9B.
|
OTHER
INFORMATION
|
There was no information required to be disclosed in a Current
Report on
Form 8-K
during the fourth quarter of the fiscal year covered by this
Annual Report on
Form 10-K
that was not reported.
119
Part III
|
|
|
ITEM 10.
|
DIRECTORS,
EXECUTIVE OFFICERS AND CORPORATE GOVERNANCE
|
Information with respect to directors of Terra will be set forth
under the caption “Election of Directors” in the proxy
statement for the 2010 Annual Meeting of Stockholders of Terra,
and is incorporated herein by reference. Information with
respect to executive officers of Terra is set forth under the
caption “Executive Officers of Terra” in Part I
hereof and is incorporated herein by reference.
We have a Code of Ethics and Standards of Business Conduct that
applies to Terra’s principal executive officer and its
principal financial officer. The code also applies to our other
officers, directors and employees. The Code of Ethics and
Standards of Business Conduct is posted on Terra’s Web
site, www.terraindustries.com, and is available in hard copy
upon request. In addition, the information set forth under
“Section 16(a) Beneficial Ownership Reporting
Compliance” in the proxy statement for the 2010 Annual
Meeting of Stockholders of Terra is incorporated herein by
reference.
|
|
|
ITEM 11.
|
EXECUTIVE
COMPENSATION
|
Information with respect to executive officer and director
compensation will be set forth under the caption “Executive
Compensation and Other Information” and “Compensation
Committee Interlocks and Insider Participation” in the
proxy statement for the 2010 Annual Meeting of Stockholders of
Terra, and is incorporated herein by reference.
|
|
|
ITEM 12.
|
SECURITY
OWNERSHIP OF CERTAIN BENEFICIAL OWNERS AND MANAGEMENT AND
RELATED STOCKHOLDER MATTERS
|
Information with respect to security ownership of certain
beneficial owners and management will be set forth under the
caption “Equity Security Ownership” in the proxy
statement for the 2010 Annual Meeting of Stockholders of Terra,
and is incorporated herein by reference.
We currently have the ability to make stock-based awards under
our Stock Incentive Plan of 2002 and our 2007 Omnibus Incentive
Compensation Plan, which may consist of incentive stock options,
non-qualified stock options, stock appreciation rights,
nonvested stock awards and other stock-based awards. For more
information on our equity compensation plans, see Note 16,
Share-Based Compensation, of the Notes to the
Consolidated Financial Statements, included in Item 8,
Financial Statements and Supplementary Data, of this
Annual Report on
Form 10-K.
| |
|
|
|
|
|
|
|
|
|
|
Equity Compensation Plan
Information
|
|
|
|
|
(a)
|
|
|
(b)
|
|
|
(c)
|
|
|
|
|
Number of securities to be
|
|
|
Weighted-average
|
|
|
Number of securities remaining available
|
|
|
|
|
issued upon exercise of
|
|
|
exercise price of
|
|
|
for future issuance under equity
|
|
|
|
|
outstanding options, warrants
|
|
|
outstanding options,
|
|
|
compensation plans (excluding securities
|
Plan category
|
|
|
and rights
|
|
|
warrants and rights
|
|
|
reflected in column (a))
|
|
Equity compensation plans approved by security holders
|
|
|
-0-
|
|
|
-0-
|
|
|
3,832,433
|
|
|
|
|
|
|
|
|
|
|
|
|
Equity compensation plans not approved by security holders
|
|
|
-0-
|
|
|
-0-
|
|
|
-0-
|
|
|
|
|
|
|
|
|
|
|
|
|
Total
|
|
|
-0-
|
|
|
$-0-
|
|
|
3,832,433
|
|
|
|
|
|
|
|
|
|
|
|
120
|
|
|
ITEM 13.
|
CERTAIN
RELATIONSHIPS AND RELATED TRANSACTIONS
|
Information with respect to certain relationships and related
transactions with related persons will be set forth under the
caption “Transactions with Related Persons” and
“Policies and Procedures” of the proxy statement for
the 2010 Annual Meeting of Stockholders of Terra, and is
incorporated herein by reference. Information with regard to
director independence will be set forth under the caption
“Corporate Governance” and “Board of Directors
and Committees” of the proxy statement for the 2010 Annual
Meeting of Stockholders of Terra, and is incorporated herein by
reference.
ITEM 14. PRINCIPAL
ACCOUNTANT FEES AND SERVICES
Principal
Accountant Audit Fees and Services Fees
Information with respect to principal accountant audit fees and
service fees will be set forth under the caption
“Proposal 2: Ratification of Selection of Independent
Accountants—Principal Accountant Audit Fees and Service
Fees” in the proxy statement for the 2010 Annual Meeting of
Stockholders of Terra, and is incorporated herein by reference.
Audit Committee
Pre-Approval Policies and Procedures
Pursuant to its charter, the Audit Committee is responsible for
reviewing and approving, in advance, any audit and any
permissible non-audit engagement or relationship between Terra
and its independent registered public accountants.
Deloitte & Touche LLP’s engagement to conduct the
audit of Terra’s financial statements included herein was
approved by the Audit Committee on February 17, 2009.
Additionally, each permissible non-audit engagement or
relationship between Terra and services performed by
Deloitte & Touche LLP since May 2003 has been reviewed
and approved in advance by the Audit Committee, as provided in
its charter.
121
Part IV
ITEM 15.
EXHIBITS AND FINANCIAL STATEMENT SCHEDULES
(a) Documents Filed as a Part of this Report
| |
|
|
|
|
|
|
|
1.
|
|
Consolidated Financial Statements of Terra and its subsidiaries
are included in Item 8 herein.
|
|
|
|
Consolidated Statements of Financial Position at December 31,
2009 and 2008
|
|
|
|
Consolidated Statements of Operations for the years ended
December 31, 2009, 2008 and 2007
|
|
|
|
Consolidated Statements of Cash Flows for the years ended
December 31, 2009, 2008 and 2007
|
|
|
|
Consolidated Statements of Changes in Stockholders’ Equity
for the years ended December 31, 2009, 2008 and 2007
|
|
|
|
Notes to the Consolidated Financial Statements
|
|
|
|
Report of Independent Registered Public Accounting Firm
|
|
2.
|
|
Index to Financial Statement Schedules, Reports and Consents
|
|
|
|
See Index to Financial Statement Schedules of Terra and its
subsidiaries at
page S-1
|
|
3.
|
|
Other Financial Statements
|
|
|
|
Individual financial statements of Terra’s 50 percent
owned joint ventures accounted for on the equity method have
been omitted because they do not constitute a significant
subsidiary.
|
(b) Exhibits
| |
|
|
|
|
|
|
2
|
.1
|
|
Stock Purchase Agreement dated as of August 6, 2004 among
Terra Industries Inc., MissChem Acquisition Inc. and Mississippi
Chemical Corporation, filed as Exhibit 99.2 to Terra
Industries Inc.’s
Form 8-K
dated August 9, 2004, is incorporated herein by reference.
|
|
|
2
|
.2
|
|
Agreement and Plan of Merger dated as of February 12, 2010
by and among Yara International ASA, Yukon Merger Sub Inc., and
Terra Industries Inc., filed as Exhibit 2.1 to Terra
Industries Inc.’s
Form 8-K
dated February 16, 2010, is incorporated herein by
reference.
|
|
|
3
|
.1
|
|
Articles of Restatement of Terra Industries Inc. filed with the
State Department of Assessments and Taxation of Maryland on
August 3, 2005, restating the Charter of Terra Industries
Inc., filed as Exhibit 3.3 to Terra Industries Inc.’s
Form 8-K
dated August 3, 2005, are incorporated herein by reference.
|
|
|
3
|
.2
|
|
Amended and Restated By-Laws of Terra Industries Inc., effective
as of August 3, 2005, filed as Exhibit 3.4 to Terra
Industries Inc.’s
Form 8-K,
dated August 3, 2005, are incorporated herein by reference.
|
|
|
3
|
.3
|
|
Amendment No. 1 to the Amended and Restated By-Laws of
Terra Industries Inc., filed as Exhibit 3.1 to Terra
Industries Inc.’s
Form 8-K
dated April 14, 2009, is incorporated herein by reference.
|
|
|
3
|
.4
|
|
A Certificate of Correction to correct errors and omissions to
the August 3, 2005 Articles of Restatement for Terra
Industries Inc., as filed with the State Department of
Assessments and Taxation of Maryland on April 30, 2008, was
included as Exhibit 99.1 to Terra Industries Inc.’s
Form 8-K
dated May 5, 2008, and is incorporated herein by reference.
|
|
|
3
|
.5
|
|
Certificate of Incorporation of Terra Capital, Inc. filed as
Exhibit 3.i.(a) to Terra Capital, Inc.’s Registration
Statement filed on
Form S-4
on November 13, 2001, is incorporated herein by reference.
|
|
|
3
|
.6
|
|
Certificate of Incorporation of Beaumont Ammonia Inc. filed as
Exhibit 3.i.(b) to Terra Capital, Inc.’s Registration
Statement filed on
Form S-4
on November 13, 2001, is incorporated herein by reference.
|
|
|
3
|
.7
|
|
Certificate of Incorporation of Beaumont Holdings Corporation,
filed as Exhibit 3.i.(c) to Terra Capital, Inc.’s
Registration Statement filed on
Form S-4
on November 13, 2001, is incorporated herein by reference.
|
122
| |
|
|
|
|
|
|
3
|
.8
|
|
Certificate of Incorporation of BMC Holdings Inc. filed as
Exhibit 3.1.(d) to Terra Capital, Inc.’s Registration
Statement filed on
Form S-4
on November 3, 2001, is incorporated herein by reference.
|
|
|
3
|
.9
|
|
Certificate of Incorporation of Port Neal Corporation filed as
Exhibit 3.i.(e) to Terra Capital, Inc.’s Registration
Statement filed on
Form S-4
on November 13, 2001, is incorporated herein by reference.
|
|
|
3
|
.10
|
|
Certificate of Incorporation of Terra (U.K.) Holdings Inc. filed
as Exhibit 3.i.(f) to Terra Capital, Inc.’s
Registration Statement filed on
Form S-4
on November 13, 2001, is incorporated herein by reference.
|
|
|
3
|
.11
|
|
Certificate of Incorporation of Terra Capital Holdings, Inc.
filed as Exhibit 3.1.(g) to Terra Capital, Inc.’s
Registration Statement filed on
Form S-4
on November 13, 2001, is incorporated herein by reference.
|
|
|
3
|
.12
|
|
Certificate of Incorporation of Terra International (Oklahoma)
Inc. filed as Exhibit 3.i.(k) to Terra Capital, Inc.’s
Registration Statement filed on
Form S-4
on November 13, 2001, is incorporated herein by reference.
|
|
|
3
|
.13
|
|
Certificate of Incorporation of Terra International, Inc. filed
as Exhibit 3.i.(l) to Terra Capital, Inc.’s
Registration Statement filed on
Form S-4
on November 13, 2001, is incorporated herein by reference.
|
|
|
3
|
.14
|
|
Certificate of Incorporation of Terra Methanol Corporation filed
as Exhibit 3.i.(m) to Terra Capital, Inc.’s
Registration Statement filed on
Form S-4
on November 13, 2001, is incorporated herein by reference.
|
|
|
3
|
.15
|
|
Certificate of Incorporation of Terra Nitrogen Corporation filed
as Exhibit 3.i.(n) to Terra Capital, Inc.’s
Registration Statement filed on
Form S-4
on November 13, 2001, is incorporated herein by reference.
|
|
|
3
|
.16
|
|
Certificate of Incorporation of Terra Real Estate Corporation
filed as Exhibit 3.i.(o) to Terra Capital, Inc.’s
Registration Statement filed on
Form S-4
on November 13, 2001, is incorporated herein by reference.
|
|
|
3
|
.17
|
|
By-Laws of Terra Capital, Inc. filed as Exhibit 3.ii.(a) to
Terra Capital, Inc.’s Registration Statement filed on
Form S-4
on November 13, 2001, is incorporated herein by reference.
|
|
|
3
|
.18
|
|
By-Laws of Beaumont Ammonia Inc. filed as Exhibit 3.ii.(b)
to Terra Capital, Inc.’s Registration Statement filed on
Form S-4
on November 13, 2001, is incorporated herein by reference.
|
|
|
3
|
.19
|
|
By-Laws of Beaumont Holdings Corporation filed as
Exhibit 3.ii.(c) to Terra Capital, Inc.’s Registration
Statement filed on
Form S-4
on November 13, 2001, is incorporated herein by reference.
|
|
|
3
|
.20
|
|
By-Laws of BMC Holdings, Inc. filed as Exhibit 3.ii.(d) to
Terra Capital, Inc.’s Registration Statement filed on
Form S-4
on November 13, 2001, is incorporated herein by reference.
|
|
|
3
|
.21
|
|
By-Laws of Port Neal Corporation filed as Exhibit 3.ii.(e)
to Terra Capital, Inc.’s Registration Statement filed on
Form S-4
on November 13, 2001, is incorporated herein by reference.
|
|
|
3
|
.22
|
|
By-Laws of Terra (U.K.) Holdings Inc. filed as
Exhibit 3.ii.(f) to Terra Capital, Inc.’s Registration
Statement filed on
Form S-4
on November 13, 2001, is incorporated herein by reference.
|
|
|
3
|
.23
|
|
By-Laws of Terra Capital Holdings, Inc. filed as
Exhibit 3.ii.(g) to Terra Capital, Inc.’s Registration
Statement filed on
Form S-4
on November 13, 2001, is incorporated herein by reference.
|
|
|
3
|
.24
|
|
By-Laws of Terra International (Oklahoma) Inc. filed as
Exhibit 3.ii.(i) to Terra Capital, Inc.’s Registration
Statement filed on
Form S-4
on November 13, 2001, is incorporated herein by reference.
|
|
|
3
|
.25
|
|
By-Laws of Terra International, Inc. filed as
Exhibit 3.ii.(j) to Terra Capital, Inc.’s Registration
Statement filed on
Form S-4
on November 13, 2001, is incorporated herein by reference.
|
|
|
3
|
.26
|
|
By-Laws of Terra Methanol Corporation filed as
Exhibit 3.ii.(k) to Terra Capital, Inc.’s Registration
Statement filed on
Form S-4
on November 13, 2001, is incorporated herein by reference.
|
|
|
3
|
.27
|
|
By-Laws of Terra Nitrogen Corporation filed as
Exhibit 3.ii.(l) to Terra Capital, Inc.’s Registration
Statement filed on
Form S-4
on November 13, 2001, is incorporated herein by reference.
|
|
|
3
|
.28
|
|
By-Laws of Terra Real Estate Corporation filed as
Exhibit 3.ii.(m) to Terra Capital, Inc.’s Registration
Statement filed on
Form S-4
on November 13, 2001, is incorporated herein by reference.
|
|
|
3
|
.29
|
|
Certificate of Incorporation of Terra Nitrogen GP Inc., filed as
Exhibit 3.2 to the September 7, 2005 Terra Nitrogen
Company, L.P.’s
Form 8-K,
is incorporated herein by reference.
|
123
| |
|
|
|
|
|
|
3
|
.30
|
|
By-Laws of Terra Nitrogen GP Inc., filed as Exhibit 3.3 to
the September 7, 2005 Terra Nitrogen Company, L.P.’s
Form 8-K,
are incorporated herein by reference.
|
|
|
3
|
.31
|
|
Certificate of Incorporation of Terra Nitrogen GP Holdings Inc.,
filed as Exhibit 3.29 to Terra Industries Inc.’s
Form 10-K
for the year ended December 31, 2006, is incorporated
herein by reference.
|
|
|
3
|
.32
|
|
By-Laws of Terra Nitrogen GP Holdings Inc., filed as
Exhibit 3.30 to Terra Industries Inc.’s
Form 10-K
for the year ended December 31, 2006, is incorporated
herein by reference.
|
|
|
3
|
.33
|
|
Certificate of Incorporation of Terra Environmental Technologies
Inc., filed as Exhibit 3.33 to Terra Capital, Inc.’s
Registration Statement filed on
Form S-4
on December 16, 2009, is incorporated herein by reference.
|
|
|
3
|
.34
|
|
By-Laws of Terra Environmental Technologies Inc. filed as
Exhibit 3.34 to Terra Capital, Inc.’s Registration
Statement filed on
Form S-4
on December 16, 2009, in incorporated herein by reference.
|
|
|
3
|
.35
|
|
Certificate of Incorporation of Terra Global Holding Company
Inc., filed as Exhibit 3.35 to Terra Capital, Inc.’s
Registration Statement filed on
Form S-4
on December 16, 2009, is incorporated herein by reference.
|
|
|
3
|
.36
|
|
By-Laws of Terra Global Holding Company Inc., filed as
Exhibit 3.36 to Terra Capital, Inc.’s Registration
Statement filed on
Form S-4
on December 16, 2009, is incorporated herein by reference.
|
|
|
3
|
.37
|
|
Operating Agreement of Terra Investment Fund LLC, filed as
Exhibit 3.37 to Terra Capital, Inc.’s Registration
Statement filed on
Form S-4
on December 16, 2009, is incorporated herein by reference.
|
|
|
3
|
.38
|
|
Articles of Organization of Terra Investment Fund LLC,
filed as Exhibit 3.38 to Terra Capital, Inc.’s
Registration Statement filed on
Form S-4
on December 16, 2009, is incorporated herein by reference.
|
|
|
3
|
.39
|
|
Operating Agreement of Terra Investment Fund II LLC, filed
as Exhibit 3.39 to Terra Capital, Inc.’s Registration
Statement filed on
form S-4
on December 16, 29 , is incorporated herein by reference.
|
|
|
3
|
.40
|
|
Articles of Organization of Terra Investment Fund II LLC,
filed as Exhibit 3.40 to Terra Capital, Inc.’s
Registration Statement filed on
Form S-4
on December 16, 2009, is incorporated herein by reference.
|
|
|
3
|
.41
|
|
Certificate of Incorporation of Terra Mississippi Holdings
Corp., filed as Exhibit 3.41 to Terra Capital, Inc.’s
Registration Statement filed on
Form S-4
on December 16, 2009, is incorporated herein by reference.
|
|
|
3
|
.42
|
|
By-Laws of Terra Mississippi Holdings Corp (f/k/a Mississippi
Chemical Corporation), filed as Exhibit 3.42 to Terra
Capital, Inc.’s Registration Statement filed on
Form S-4
on December 16, 2009, is incorporated herein by reference.
|
|
|
3
|
.43
|
|
Certificate of incorporation for Terra Mississippi Nitrogen,
Inc., filed as Exhibit 3.43 to Terra Capital, Inc.’s
Registration Statement filed on
Form S-4
on December 16, 2009, is incorporated herein by reference.
|
|
|
3
|
.44
|
|
By-Laws of Terra Mississippi Nitrogen, Inc. (f/k/a Mississippi
Nitrogen, Inc.), filed as Exhibit 3.44 to Terra Capital,
Inc.’s Registration Statement filed on
Form S-4
on December 16, 2009, is incorporated herein by reference.
|
|
|
3
|
.45
|
|
Certificate of Incorporation of Terra Houston Ammonia, Inc.,
filed as Exhibit 3.45 to Terra Capital, Inc.’s
Registration Statement filed on
Form S-4
on December 16, 2009, is incorporated herein by reference.
|
|
|
3
|
.46
|
|
By-Laws of Terra Houston Ammonia, Inc. (f/k/a Mississippi
Chemical Management Company), filed as Exhibit 3.46 to
Terra Capital, Inc.’s Registration Statement filed on
Form S-4
on December 16, 2009, is incorporated herein by reference.
|
|
|
3
|
.47
|
|
Limited Liability Company Agreement of Terra LP Holdings LLC,
filed as Exhibit 3.47 to Terra Capital, Inc.’s
Registration Statement filed on
Form S-4
on December 16, 2009, is incorporated herein by reference.
|
|
|
4
|
.1
|
|
Indenture dated as of October 10, 2001 among Terra Capital,
Inc., certain guarantors and U.S. Bank National Association, as
trustee, including the form of note, filed as Exhibit 4.1
to Terra Industries Inc.’s
Form 8-K
dated October 10, 2001, is incorporated herein by
reference.
|
124
| |
|
|
|
|
|
|
4
|
.2
|
|
Amendment No. 1 to the Amended and Restated Credit
Agreement dated January 26, 2005, among Terra Capital,
Inc., Mississippi Chemical Corporation and Terra Nitrogen (U.K.)
Limited (collectively, Borrowers), Terra Industries Inc., Terra
Capital Holdings, Inc., the financial institutions from time to
time party thereto as issuing banks (Issuers) and Citicorp USA
Inc., as administrative agent and collateral agent for Lenders
and Issuers, filed as Exhibit 4.3 to Terra Industries
Inc.’s
Form 10-Q
for the fiscal quarter ended September 30, 2005, is
incorporated herein by reference.
|
|
|
4
|
.3
|
|
Amendment No. 2 to the Amended and Restated Credit
Agreement dated July 29, 2005, among Terra Capital, Inc.,
Terra Mississippi Holdings Corp. (f/k/a Mississippi Chemical
Corporation) and Terra Nitrogen (U.K.) Limited (collectively,
Borrowers), Terra Industries Inc., Terra Capital Holdings, Inc.,
the Lenders party hereto and Citicorp USA Inc. as administrative
agent and collateral agent for the Lenders and Issuers, filed as
Exhibit 4.4 to Terra Industries Inc.’s
Form 10-Q
for the fiscal quarter ended September 30, 2005, is
incorporated herein by reference.
|
|
|
4
|
.4
|
|
Amendment No. 3 to the Amended and Restated Credit
Agreement dated October 30, 2006, among Terra Capital,
Inc., Terra Mississippi Holdings Corp. (f/k/a/ Mississippi
Chemical Corporation) and Terra Nitrogen (U.K.) Limited
(collectively, Borrowers), Terra Industries Inc., Terra Capital
Holdings, Inc., the Lenders party hereto and Citicorp USA Inc.
as administrative agent and collateral agent for the Lenders and
Issuers, filed as Exhibit 4.1 to Terra Industries
Inc.’s
Form 10-Q
for the fiscal quarter ended September 30, 2006, is
incorporated herein by reference.
|
|
|
4
|
.5
|
|
Amendment No. 4 to the Amended and Restated Credit
Agreement dated February 2, 2007, among Terra Capital,
Inc., Terra Mississippi Holdings Corp. (f/k/a Mississippi
Chemical Corporation) and Terra Nitrogen (U.K.) Limited
(collectively, Borrowers). Terra Industries Inc., Terra Capital
Holdings, Inc., the Lenders party hereto and Citicorp USA Inc.
as administrative agent and collateral agent for the Lenders and
Issuers, filed as Exhibit 4.5 to Terra Industries
Inc.’s
Form 10-K
for the year ended 2007, is incorporated by reference.
|
|
|
4
|
.6
|
|
Amendment No. 5 to the Amended and Restated Credit
Agreement dated July 11, 2007, among Terra Capital, Inc.,
Terra Mississippi Holdings Corp. (f/k/a Mississippi Chemical
Corporation) and Terra Nitrogen (U.K.) Limited (collectively,
Borrowers), Terra Industries Inc., Terra Capital Holdings, Inc.,
the Lenders party hereto and Citicorp USA Inc. as administrative
agent and collateral agent for the Lenders and Issuers, filed as
Exhibit 4.6 to Terra Industries Inc.’s
Form 10-K
for the year ended 2007, is incorporated by reference.
|
|
|
4
|
.7
|
|
Amendment No. 6 to the Amended and Restated Credit
Agreement dated August 28, 2007, among Terra Capital, Inc.,
Terra Mississippi Holdings Corp. (f/k/a Mississippi Chemical
Corporation) and Terra Nitrogen (U.K.) Limited (collectively,
Borrowers), Terra Industries Inc., Terra Capital Holdings, Inc.,
the Lenders party hereto and Citicorp USA Inc. as administrative
agent and collateral agent for the Lenders and Issuers, filed as
Exhibit 4.7 to Terra Industries Inc.’s
Form 10-K
for the year ended 2007, is incorporated by reference.
|
|
|
4
|
.8
|
|
Amendment No. 7 to the Amended and Restated Credit
Agreement dated March 24, 2008, among Terra Capital, Inc.,
Mississippi Chemical Corporation and Terra Nitrogen (U.K.)
Limited, as the borrowers, Terra Industries Inc., Terra Capital
Holdings, Inc., the financial institutions from time to time
party thereto as lenders, and Citicorp USA, Inc., as
administrative agent and collateral agent, filed as
Exhibit 4.8 to Terra Capital, Inc.’s Registration
Statement filed on
Form S-4
on December 16, 2009, is incorporated herein by reference.
|
|
|
4
|
.9
|
|
Amendment No. 8 to the to the Amended and Restated Credit
Agreement dated July 16, 2008, among Terra Capital, Inc.,
Mississippi Chemical Corporation and Terra Nitrogen (U.K.)
Limited, as the borrowers, Terra Industries Inc., Terra Capital
Holdings, Inc., the financial institutions from time to time
party thereto as lenders, and Citicorp USA, Inc., as
administrative agent and collateral agent, filed as
Exhibit 4.9 to Terra Capital, Inc.’s Registration
Statement filed on
Form S-4
on December 16, 2009, is incorporated herein by reference
|
125
| |
|
|
|
|
|
|
4
|
.10
|
|
Amendment No. 9 to the to the Amended and Restated Credit
Agreement dated August 29, 2008, among Terra Capital, Inc.,
Mississippi Chemical Corporation and Terra Nitrogen (U.K.)
Limited, as the borrowers, Terra Industries Inc., Terra Capital
Holdings, Inc., the financial institutions from time to time
party thereto as lenders, and Citicorp USA, Inc., as
administrative agent and collateral agent, filed as
Exhibit 4.10 to Terra Capital, Inc.’s Registration
Statement filed on
Form S-4
on December 16, 2009, is incorporated herein by reference.
|
|
|
4
|
.11
|
|
Amendment No. 10 to the Amended and Restated Credit
Agreement dated November 17, 2008, among Terra Capital,
Inc., Mississippi Chemical Corporation and Terra Nitrogen (U.K.)
Limited, as the borrowers, Terra Industries Inc., Terra Capital
Holdings, Inc., the financial institutions from time to time
party thereto as lenders, and Citicorp USA, Inc., as
administrative agent and collateral agent, filed as
Exhibit 4.11 to Terra Capital, Inc.’s Registration
Statement filed on
Form S-4
on December 16, 2009, is incorporated herein by reference.
|
|
|
4
|
.12
|
|
Amendment No. 11 to the Amended and Restated Credit
Agreement dated October 9, 2009, among Terra Capital, Inc.,
Mississippi Chemical Corporation and Terra Nitrogen (U.K.)
Limited, as the borrowers, Terra Industries Inc., Terra Capital
Holdings, Inc., the financial institutions from time to time
party thereto as lenders, and Citicorp USA, Inc., as
administrative agent and collateral agent, filed as
Exhibit 4.12 to Terra Capital, Inc.’s Registration
Statement filed on
Form S-4
on December 16, 2009, is incorporated herein by reference.
|
|
|
4
|
.13
|
|
Amendment No. 12 to the Amended and Restated Credit
Agreement dated December 4, 2009, among Terra Capital,
Inc., Mississippi Chemical Corporation and Terra Nitrogen (U.K.)
Limited, as the borrowers, Terra Industries Inc., Terra Capital
Holdings, Inc., the financial institutions from time to time
party thereto as lenders, and Citicorp USA, Inc., as
administrative agent and collateral agent, filed as
Exhibit 4.8 to Terra Capital, Inc.’s Registration
Statement filed on
Form S-4
on December 16, 2009, is incorporated herein by reference.
|
|
|
4
|
.14
|
|
Amendment No. 1 to the Credit Agreement dated July 29,
2005 among Terra Nitrogen, Limited Partnership (Borrower), Terra
Nitrogen Company, L.P., the Lenders party hereto and Citicorp
USA Inc. as administrative agent and collateral agent for the
Lenders and Issuers, filed as Exhibit 4.5 to Terra
Industries Inc.’s
Form 10-Q
for the quarter ended September 30, 2005, is incorporated
herein by reference.
|
|
|
4
|
.15
|
|
Amendment No. 2 to the Credit Agreement dated
February 2, 2007, among Terra Nitrogen, Limited Partnership
(Borrower), Terra Nitrogen Company, L.P., the Lenders party
hereto, and Citicorp USA, Inc. as administrative agent and
collateral agent for the Lenders and Issuers, filed as
Exhibit 4.8 to Terra Nitrogen Company, L.P.’s
Form 10-K
for the year ended December 31, 2007.
|
|
|
4
|
.16
|
|
Amendment No. 3 to the Credit Agreement dated
October 9, 2009, among Terra Nitrogen, Limited Partnership
(Borrower), Terra Nitrogen Company, L.P., the Lenders party
hereto, and Citicorp USA, Inc. as administrative agent and
collateral agent for the Lenders and Issuers, filed as
Exhibit 4.16 to Terra Capital, Inc.’s Registration
Statement filed on
Form S-4
on December 16, 2009, is incorporated herein by reference.
|
|
|
4
|
.17
|
|
Indenture dated May 21, 2003, between the Company, the
guarantors party hereto and U.S. National Bank Association as
Trustee with respect to the
111/2%
Second Priority Senior Secured Notes due 2010 (including the
form of
111/2%
Second Priority Senior Secured Notes), previously filed as
Exhibit 4.i to Amendment No. 1 to the
Registrant’s Registration Statement of
Form S-4
filed on June 12, 2003 and incorporated by reference
herein, filed as Exhibit 4.6 to Terra Industries
Inc.’s
Form 10-Q
for the quarter ended June 30, 2003, is incorporated herein
by reference.
|
|
|
4
|
.18
|
|
Articles Supplementary of Terra Industries Inc. relating to
the Retirement of the Company’s Trust Shares, filed as
Exhibit 3.1 to Terra Industries Inc.’s
Form 8-K
dated August 3, 2005, are incorporated herein by reference.
|
|
|
4
|
.19
|
|
Articles Supplementary of Terra Industries Inc. relating to
the Reclassification of the Company’s Series B
Cumulative Redeemable Preferred Shares, filed as
Exhibit 3.2 to Terra Industries Inc.’s
Form 8-K
August 3, 2005, are incorporated herein by reference.
|
126
| |
|
|
|
|
|
|
4
|
.20
|
|
Registration Rights Agreement dated as of October 7, 2004,
among Terra and Citigroup Global Markets Inc., as Representative
of the Initial Purchasers, filed as Exhibit 4.6 to
Terra’s
Form S-3
dated January 4, 2005, is incorporated herein by reference.
|
|
|
4
|
.21
|
|
Registration Rights Agreement, dated as of December 16,
2004, among Terra Industries Inc. and the initial purchasers
named therein, filed as Exhibit 4.7 to Terra’s
Form S-3/A
filed February 9, 2005, is incorporated by reference.
|
|
|
4
|
.22
|
|
Registration Rights Agreement, dated as of December 21,
2004, among Terra Industries Inc., Värde Investment
Partners, L.P., Perry Principals Investments LLC, Citigroup
Financial Products, Inc., filed as Exhibit 4.7 to
Terra’s
Form S-3
dated March 17, 2005, is incorporated herein by reference.
|
|
|
4
|
.23
|
|
Form of Indenture relating to the 4.25% Convertible
Subordinated Debentures, filed as Exhibit 4.7 to
Terra’s
Form S-3
dated January 4, 2005, is incorporated herein by reference.
|
|
|
4
|
.24
|
|
$150,000,000 Amended and Restated Credit Agreement dated as of
December 21, 2004, among Terra Capital, Inc., Terra
Nitrogen (U.K.) Limited, Mississippi Chemical Corporation, as
Borrowers; Terra Industries Inc. and Terra Capital Holdings,
Inc., as Guarantors; and the Lenders and Issuers Party thereto;
and Citicorp USA, Inc., as Administrative Agent and Collateral
Agent, Citigroup Global Markets Inc. as Lead Arranger and Sole
Book Runner, filed as Exhibit 4.18 to Terra Industries
Inc.’s
Form 10-K
for the fiscal year ended December 31, 2004, is
incorporated herein by reference.
|
|
|
4
|
.25
|
|
$50,000,000 Credit Agreement dated as of December 21, 2004
among Terra Nitrogen, Limited Partnership, as Borrower; Terra
Nitrogen Company, L.P., as a Guarantor; and the Lenders and
Issuers Party thereto; and Citicorp USA, Inc., as Administrative
Agent and Collateral Agent; and Citigroup Global Markets Inc.,
as Lead Arranger and Sole Book Runner, filed as
Exhibit 4.19 to Terra Industries Inc.’s
Form 10-K
for the fiscal year ended December 31, 2004, is
incorporated herein by reference.
|
|
|
4
|
.26
|
|
Third Supplement to Indenture, dated as of January 29,
2007, by and among Terra Capital, Inc., the guarantors named
therein and U.S. Bank National Association, as trustee, with
respect to the
127/8% Senior
Secured Notes due 2008, filed as Exhibit 4.1 to Terra
Industries Inc.’s
Form 8-K
dated January 30, 2007, is incorporated herein by reference.
|
|
|
4
|
.27
|
|
Third Supplement to Indenture, dated as of January 29,
2007, by and among Terra Capital, Inc., the guarantors named
therein and U.S. Bank National Association, as trustee, with
respect to the 11
1/2%
Second Priority Senior Secured Notes due 2010, filed as
Exhibit 4.2 to Terra Industries Inc.’s
Form 8-K
dated January 30, 2007, is incorporated herein by reference.
|
|
|
4
|
.28
|
|
Indenture, dated February 2, 2007, by and among Terra
Capital, Inc., Terra Industries Inc., the guarantors named
therein and U.S. Bank National Association, as trustee, relating
to the 7% Senior Notes due 2017, filed as Exhibit 4.1
to Terra Industries Inc.’s
Form 8-K
dated February 6, 2007, is incorporated herein by reference.
|
|
|
4
|
.29
|
|
First Supplemental Indenture, dated January 9, 2008, by and
among Terra Capital, Inc., Terra Industries Inc., Terra
Environmental Technologies, Inc., the existing guarantors named
therein and U.S. Bank National Association, as trustee filed as
Exhibit 4.1 to Terra Industries Inc.’s
Form 8-K
dated January 10, 2008, is incorporated herein by reference.
|
|
|
4
|
.30
|
|
Second Supplemental Indenture, dated as of April 27, 2009,
by and among Terra Capital, Inc., Terra Industries Inc., each of
the subsidiary guarantors listed in Appendix I thereto and
U.S. Bank National Association, as trustee, filed as
Exhibit 4.31 to Terra Capital, Inc.’s Registration
Statement filed on
Form S-4
on December 16, 2009, is incorporated herein by reference.
|
|
|
4
|
.31
|
|
Third Supplemental Indenture, dated as of October 16, 2009,
by and among Terra Capital, Inc., Terra Industries Inc., each of
the subsidiary guarantors listed in Appendix I thereto and
U.S. Bank National Association, as trustee, filed as
Exhibit 4. 1 to Terra Industries Inc.’s
Form 8-K
dated October 16, 2009, is incorporated herein by reference.
|
|
|
4
|
.32
|
|
Form of Regulation S Global Note relating to 7% Senior
Notes due 2017 (attached as an exhibit to Exhibit 4.30).
|
127
| |
|
|
|
|
|
|
4
|
.33
|
|
Form of Regulation 144A Global Note relating to
7% Senior Notes due 2017 (attached as an exhibit to
Exhibit 4.30).
|
|
|
4
|
.34
|
|
Form of Guarantee relating to 7% Senior Notes due 2017
(attached as an exhibit to Exhibit 4.30).
|
|
|
4
|
.35
|
|
Registration Agreement, dated as of February 2, 2007, by
and among Terra Capital, Inc., the guarantors named therein and
Citigroup Global Markets Inc., relating to the 7% Senior
Notes due 2017, filed as Exhibit 10.1 to Terra Industries
Inc.’s
Form 8-K
dated February 5, 2007, is incorporated herein by reference.
|
|
|
4
|
.36
|
|
Indenture, dated October 26, 2009, by and among Terra
Capital, Inc., Terra Industries Inc., the guarantors named
therein and U.S. Bank national Association, as trustee, relating
to the 7.75% Senior Notes due 2019, filed as
Exhibit 4.37 to Terra Capital, Inc.’s Registration
Statement filed on
Form S-4
on December 16, 2009, is incorporated herein by reference.
|
|
|
4
|
.37
|
|
First Supplemental Indenture, dated as of December 4, 2009,
by and among Terra Capital, Inc., Terra Industries Inc., Terra
LP Holdings LLC, each of the subsidiary guarantors listed in
Appendix I thereto and U.S. Bank National Association, as
trustee, filed as Exhibit 4.1 to Terra Industries
Inc.’s
Form 8-K
dated December 8, 2009, is incorporated herein by reference.
|
|
|
4
|
.38
|
|
Form of Regulation S Global Note relating to the
7.75% Senior Notes due 2019 (attached as an exhibit to
Exhibit 4.37).
|
|
|
4
|
.39
|
|
Form of Regulation 144A Global Note relating to the
7.75% Senior Notes due 2019 (attached as an exhibit to
Exhibit 4.37).
|
|
|
4
|
.40
|
|
Form of Guarantee relating to the 7.75% Senior Notes due
2019 (attached as an exhibit to Exhibit 4.37).
|
|
|
4
|
.41
|
|
Exchange and Registration Rights to Agreement, dated as of
October 26 2009, by and among Terra Capital, Inc., the
guarantors named therein, and Credit Suisse Securities (USA) LLC
and Citigroup Global Markets Inc., relating to the
7.75% Senior Notes due 2019, filed as Exhibit 4.42 to
Terra Capital, Inc.’s Registration Statement filed on
Form S-4
on December 16, 2009, is incorporated herein by reference.
|
|
|
10
|
.1.1
|
|
Excess Benefit Plan of Terra Industries Inc., as amended and
restated effective as of January 1, 2008, was included as
Exhibit 10.1 to Terra Industries Inc.’s
Form 10-Q
filed with the Securities and Exchange Commission on
April 29, 2008, and is incorporated herein by reference.
|
|
|
10
|
.1.2
|
|
Terra Industries Inc. Supplemental Deferred Compensation Plan
effective as of December 20, 1993 filed as
Exhibit 10.1.9 to Terra Industries Inc.’s
Form 10-K
for the year ended December 31, 1993, is incorporated
herein by reference.
|
|
|
10
|
.1.3
|
|
Amendment No. 1 to the Terra Industries Inc. Supplemental
Deferred Compensation Plan, filed as Exhibit 10.1.15 to
Terra Industries’
Form 10-Q
for the quarter ended June 30, 1995, is incorporated herein
by reference.
|
|
|
10
|
.1.4
|
|
Amendment No. 2 to the Terra Industries Inc. Supplemental
Deferred Compensation Plan, dated July 26, 2000, filed as
Exhibit 10.1.8.a to the Terra Industries Inc.’s
Form 10-K
for the year ended December 31, 2000, is incorporated
herein by reference.
|
|
|
10
|
.1.5
|
|
Amendment No. 3 to the Terra Industries Inc. Supplemental
Deferred Compensation Plan, dated March 29, 2002, filed as
Exhibit 10.1.8.b. to Terra Industries Inc.’s
Form 10-K
for the year ended December 31, 2001, is incorporated
herein by reference.
|
|
|
10
|
.1.6
|
|
Amendment No. 4 to the Terra Industries Inc. Supplemental
Deferred Compensation Plan, dated December 29, 2004, filed
as Exhibit 10.1.6 to Terra Industries Inc.’s
Form 10-K/A
filed with the Securities and Exchange Commission on
April 28, 2008, is incorporated herein by reference.
|
|
|
10
|
.1.7
|
|
Terra Industries Inc. Stock Incentive Plan of 2002, filed as
Exhibit 10.1.18 to Terra Industries Inc.’s
Form 10-K
for the year ended December 31, 2001, is incorporated
herein by reference.
|
|
|
10
|
.1.8
|
|
Form of Restricted Stock Award to Non-Employee Directors under
the Terra Industries Inc. Stock Incentive Plan of 2002, filed as
Exhibit 10.1.23 to Terra Industries Inc.’s
Form 10-K
for the year ended December 31, 2002, is incorporated
herein by reference.
|
128
| |
|
|
|
|
|
|
10
|
.1.9
|
|
Form of Restricted Stock Award to Officers and Other Key
Employees under Terra Industries Inc. Stock Incentive Plan of
2002, filed as Exhibit 10.1.24 to Terra Industries
Inc.’s
Form 10-K
for the year ended December 31, 2002, is incorporated
herein by reference.
|
|
|
10
|
.1.10
|
|
Revised Form of Restricted Stock Award of Terra Industries Inc.
under its Stock Incentive Plan of 2002, filed as
Exhibit 10.9 to Terra Industries Inc.’s
Form 10-Q
for the fiscal quarter ended September 30, 2005, is
incorporated herein by reference.
|
|
|
10
|
.1.11
|
|
Form of Long-Term Incentive Award for Time and Performance Based
Shares of Terra Industries Inc. under its Stock Incentive Plan
of 2002, filed as Exhibit 10.10 to Terra Industries
Inc.’s
10-Q for the
fiscal quarter ended September 30, 2005, is incorporated
herein by reference.
|
|
|
10
|
.1.12
|
|
Form of Long-Term Incentive Award for Phantom Time and
Performance Based Shares of Terra Industries Inc. under its
Stock Incentive Plan of 2002, filed as Exhibit 10.11 to
Terra Industries Inc.’s
Form 10-Q
for the fiscal quarter ended September 30, 2005, is
incorporated herein by reference.
|
|
|
10
|
.1.13
|
|
Form of Long-Term Incentive Award for Performance Shares of
Terra Industries Inc. under its Stock Incentive Plan of 2002
filed as Exhibit 10.1.23 to Terra Industries Inc.’s
Form 10-K
for the year ended 2005, is incorporated by reference.
|
|
|
10
|
.1.14
|
|
Form of Long-Term Incentive Award for Phantom Performance Shares
of Terra Industries Inc. under its Stock Incentive Plan of 2002
filed as Exhibit 10.1.24 to Terra Industries Inc.’s
Form 10-K
for the year ended 2005, is incorporated by reference.
|
|
|
10
|
.1.15
|
|
Form of Indemnity Agreement of Terra Industries Inc., filed as
Exhibit 10.1 to Terra Industries Inc.’s
Form 8-K
dated July 7, 2006, is incorporated by reference.
|
|
|
10
|
.1.16
|
|
Form of Unrestricted Annual Share Award to Non-Employee
Directors under the Terra Industries Inc. Stock Incentive Plan
of 2002, filed as Exhibit 99.1 to Terra Industries
Inc.’s
Form 8-K
dated August 10, 2006, is incorporated herein by reference.
|
|
|
10
|
.1.17
|
|
Employment Severance Agreement between Terra Industries Inc. and
Michael L. Bennett dated October 5, 2006, filed as
Exhibit 10.1 to Terra Industries Inc.’s
Form 8-K
dated October 5, 2006, is incorporated herein by reference.
|
|
|
10
|
.1.18
|
|
Form of Employment Severance Agreement for Section 16(b)
Executive Officers, filed as Exhibit 10.2 to Terra
Industries Inc.’s
Form 8-K
dated October 5, 2006, is incorporated herein by reference.
|
|
|
10
|
.1.19
|
|
2007 Omnibus Incentive Compensation Plan, adopted by the board
of directors of Terra Industries Inc. (Terra) and subsequently
approved by its stockholders at the annual meeting of Terra on
May 8, 2007, reported on Terra’s
Form 8-K
filed May 10, 2007 and attached as Appendix A to
Terra’s Proxy Statement on Schedule 14A filed with the
Securities and Exchange Commission on March 15, 2007, is
incorporated herein by reference.
|
|
|
10
|
.1.20
|
|
Amendment Number One to Employment Severance Agreement, filed as
Exhibit 10.1.31 to Terra Industries Inc.’s
Form 10-K
for the year ended 2007, is incorporated by reference.
|
|
|
10
|
.1.21
|
|
Amendment to Restricted Share Agreement, filed as
Exhibit 10.1.32 to Terra Industries Inc.’s
Form 10-K
for the year ended 2007, is incorporated by reference.
|
|
|
10
|
.1.22
|
|
Amendment to Performance Share Award Agreement, filed as
Exhibit 10.1.33 to Terra Industries Inc.’s
Form 10-K
for the year ended 2007, is incorporated by reference.
|
|
|
10
|
.1.23
|
|
Amendment to Terra Long Term Incentive Award dated
October 23, 2007, for former Terra, now GrowHow UK Limited
joint venture employees, filed as Exhibit 10.1.34 to Terra
Industries Inc.’s
Form 10-K
for the year ended 2007, is incorporated by reference.
|
|
|
10
|
.1.24
|
|
Form of Phantom Performance Share Award agreement of February
2008, filed as Exhibit 10.1 to Terra Industries Inc.’s
Form 10-Q
dated July 25, 2008, is incorporated herein by reference.
|
|
|
10
|
.1.25
|
|
Form of Performance Share Award agreement as of February 2008,
filed as Exhibit 10.2 to Terra Industries Inc.’s
Form 10-Q
dated July 25, 2008, is incorporated herein by reference.
|
129
| |
|
|
|
|
|
|
10
|
.2
|
|
First Amended and Restated Agreement of Limited Partnership of
Terra Nitrogen, Limited Partnership dated September 1,
2005, filed as Exhibit 10.3 to Terra Nitrogen Company,
L.P.’s
Form 8-K
dated September 7, 2005, is incorporated herein by
reference.
|
|
|
10
|
.3
|
|
General and Administrative Services Agreement regarding Services
by Terra Industries Inc. filed as Exhibit 10.11 to Terra
Industries Inc.
Form 10-Q
for the quarter ended March 31, 1995, is incorporated
herein by reference.
|
|
|
10
|
.4
|
|
Amendment No. 1 to the General and Administrative Service
Agreement regarding Services by Terra Industries Inc. dated
September 1, 2005, filed as Exhibit 10.4 to the Terra
Nitrogen Company, L.P.’s
Form 8-K
dated September 7, 2005, is incorporated herein by
reference.
|
|
|
10
|
.5
|
|
Amendment No. 1 to the General and Administrative Services
Agreement regarding Services by Terra Nitrogen Corporation dated
September 1, 2005, filed as Exhibit 10.5 to Terra
Nitrogen Company, L.P.’s
Form 8-K
dated September 7, 2005, is incorporated herein by
reference.
|
|
|
10
|
.6
|
|
Amended and Restated General and Administrative Services
Agreement between Terra Industries Inc., Terra Nitrogen
Corporation, and Terra Nitrogen GP Inc., dated October 23,
2007, filed as Exhibit 10.1 to Terra Nitrogen Company,
L.P.’s
Form 10-Q
filed on October 29, 2007, is incorporated herein by
reference.
|
|
|
10
|
.7
|
|
Reorganization Agreement among Terra Nitrogen Company, L.P.,
Terra Nitrogen, Limited Partnership and Terra Nitrogen
Corporation dated September 1, 2005, filed as
Exhibit 10.1 to Terra Nitrogen Company, L.P.’s
Form 8-K
dated September 7, 2005, is incorporated herein by
reference.
|
|
|
10
|
.8
|
|
Conveyance, Assignment and Assumption Agreement by and between
Terra Nitrogen Corporation and Terra Nitrogen GP Inc. dated
September 1, 2005, filed as Exhibit 10.2 to Terra
Nitrogen Company, L.P.’s
Form 8-K
dated September 7, 2005, is incorporated herein by
reference.
|
|
|
10
|
.9
|
|
Sale of Business Agreement dated November 20, 1997 between
ICI Chemicals & Polymers Limited, Imperial Chemical
Industries PLC, Terra Nitrogen (U.K.) Limited (f/k/a Terra
Industries Limited) and Terra Industries Inc. filed as
Exhibit 2 to Terra Industries Inc.’s
Form 8-K/A
dated December 31, 1997, is incorporated herein by
reference.
|
|
|
10
|
.10
|
|
Ammonium Nitrate Agreement dated December 31, 1997 between
Terra International (Canada) Inc and ICI Chemicals &
Polymers Limited filed as Exhibit 99 to Terra Industries
Inc.’s
Form 8-K/A
dated December 31, 1997, is incorporated herein by
reference.
|
|
|
10
|
.11
|
|
Asset Sale and Purchase Agreement dated as of May 3, 1999
by and between Terra Industries Inc. and Cenex/Land O’Lakes
Agronomy Company, filed as Exhibit 10.12 to Terra
Industries’
Form 8-K
dated May 3, 1999, is incorporated herein by reference.
|
|
|
10
|
.12
|
|
Warrant Agreement dated December 21, 2004 among Terra
Industries Inc., Perry Principals Investments LLC, Citigroup
Financial Products Inc. and Värde Investment Partners,
L.P., filed as Exhibit 10.11 to Terra Industries
Inc.’s
Form 10-K
for the year ended December 31, 2004, is incorporated
herein by reference.
|
|
|
10
|
.13†
|
|
Ammonium Nitrate Supply Agreement between Terra Mississippi
Nitrogen, Inc. and Orica USA Inc. dated July 21, 2005,
filed as Exhibit 10.7 to Terra Industries Inc.’s
Form 10-Q
for the fiscal quarter ended September 30, 2005, is
incorporated herein by reference.
|
|
|
10
|
.14
|
|
Option Agreement, dated as of July 18, 2007, by and between
Terra Industries Inc. and Eastman Chemical Company, filed as
Exhibit 10.1 to Terra Industries Inc.’s
Form 8-K
dated July 23, 2007, is incorporated herein by reference.
|
|
|
10
|
.15
|
|
Joint Venture Contribution Agreement, dated September 14,
2007, by and among GrowHow UK Limited, Terra International
(Canada), Inc., Kemira GrowHow Oyj and Terra Industries Inc.,
filed as Exhibit 10.1 to Terra Industries Inc.’s
Form 10-Q
dated October 29, 2007, is incorporated herein for
reference.
|
|
|
10
|
.16
|
|
Shareholders’ Agreement, dated September 14, 2007, by
and among Kemira GrowHow Oyj, Terra International (Canada),
Inc., Terra Industries Inc and GrowHow UK Limited filed as
Exhibit 10.2 to Terra Industries Inc.’s
Form 10-Q
dated October 29, 2007, is incorporated herein for
reference.
|
130
| |
|
|
|
|
|
|
10
|
.17
|
|
Consulting and Non-Competition Agreement between Terra
Industries Inc. and Francis G. Meyer dated April 1, 2008,
filed as Exhibit 10.1 to Terra Industries Inc.’s
Form 8-K
dated April 1, 2008, is incorporated herein by reference.
|
|
|
10
|
.18†
|
|
Amended and Restated Services Agreement among Terra Industries
Inc., BMC Holdings Inc., and Methanex Methanol Company dated
December 2, 2008, filed as Exhibit 10.18 to Terra
Capital, Inc.’s Registration Statement filed on
Form S-4/A
on January 15, 2010, is incorporated herein by reference.
|
|
|
10
|
.19
|
|
Carseland Facility Interest Purchase and Sale Agreement between
Agrium, Agrium Products Inc., Agrium Inc., Terra Industries Inc.
and Terra International (Canada) Inc. dated February 15,
2010, filed as Exhibit 2.1 to Terra Industries Inc.’s
Form 8-K
dated February 19, 2010, is incorporated herein by
reference.
|
|
|
12
|
.1 *
|
|
Ratio of Earnings to Fixed Charges.
|
|
|
21
|
.1 *
|
|
Subsidiaries of Terra Industries Inc..
|
|
|
23
|
.1 *
|
|
Consent of Deloitte & Touche LLP
|
|
|
31
|
.1 *
|
|
Certification of Chief Executive Officer pursuant to
Section 302 of the Sarbanes-Oxley Act of 2002.
|
|
|
31
|
.2 *
|
|
Certification of Chief Financial Officer pursuant to
Section 302 of the Sarbanes-Oxley Act of 2002.
|
|
|
32
|
.1 *
|
|
Certification of Chief Executive Officer pursuant to
Section 906 of the Sarbanes-Oxley Act of 2002.
|
|
|
32
|
.2 *
|
|
Certification of Chief Financial Officer pursuant to
Section 906 of the Sarbanes-Oxley Act of 2002.
|
|
|
|
|
*
|
|
Filed herewith.
|
| |
|
†
|
|
Confidential treatment has been
requested for portions of this document.
|
Exhibits 10.1.1 through 10.1.27 are management contracts or
compensatory plans or arrangements.
131
SIGNATURES
Pursuant to the requirements of Section 13 or 15(d) of the
Securities Exchange Act of 1934, the Registrant has duly caused
this report to be signed on its behalf by the undersigned,
thereunto duly authorized.
| |
|
|
|
|
|
|
|
|
|
TERRA INDUSTRIES INC.
|
|
Date: February 25, 2010
|
|
By:
|
|
/s/ DANIEL
D. GREENWELL
Daniel
D. Greenwell
Senior Vice President and Chief Financial Officer
|
Pursuant to the requirements of the Securities Exchange Act of
1934, this report has been signed below by the following persons
on behalf of the Registrant and in the capacities and on the
dates indicated:
| |
|
|
|
|
|
Signature
|
|
Title
|
|
|
|
|
|
|
|
/s/ HENRY
R. SLACK
Henry
R. Slack
|
|
Chairman of the Board
|
|
|
|
|
|
/s/ MICHAEL
L. BENNETT
Michael
L. Bennett
|
|
Director, President and Chief Executive Officer
(Principal Executive Officer)
|
|
|
|
|
|
/s/ DANIEL
D. GREENWELL
Daniel
D. Greenwell
|
|
Senior Vice President and Chief Financial Officer
(Principal Financial Officer and Principal
Accounting Officer)
|
|
|
|
|
|
/s/ DAVID
E. FISHER
David
E. Fisher
|
|
Director
|
|
|
|
|
|
/s/ DOD
A. FRASER
Dod
A. Fraser
|
|
Director
|
|
|
|
|
|
/s/ MARTHA
O. HESSE
Martha
O. Hesse
|
|
Director
|
|
|
|
|
|
/s/ PETER
S. JANSON
Peter
S. Janson
|
|
Director
|
|
|
|
|
|
/s/ JAMES
R. KRONER
James
R. Kroner
|
|
Director
|
|
|
|
|
|
/s/ JOHN
N. LILLY
John
N. Lilly
|
|
Director
|
|
|
|
|
|
/s/ DENNIS
MCGLONE
Dennis
McGlone
|
|
Director
|
132
| |
|
|
|
|
|
|
|
|
|
/s/ DAVID
A. WILSON
David
A. Wilson
|
|
Director
|
|
|
|
|
|
/s/ IRVING
B. YOSKOWITZ
Irving
B. Yoskowitz
|
|
Director
|
Date: February 25, 2010
133
INDEX TO
FINANCIAL STATEMENT SCHEDULES
| |
|
|
|
|
|
|
|
Schedule No.
|
|
|
|
|
|
|
|
|
I
|
|
|
Condensed Financial Information of Registrant, is included in
Item 8 herein,
Footnote 4, Column 1, “Parent.”
|
|
|
|
|
|
|
|
|
|
|
|
|
II
|
|
|
Valuation and Qualifying Accounts:
Years Ended December 31, 2009, 2008 and 2007
|
|
S-2
|
Financial statement schedules not included in this report have
been omitted because they are not applicable or the required
information is shown in the consolidated financial statements or
the notes thereto.
S-1
Schedule II
Terra Industries
Inc.
Valuation and Qualifying
Accounts
Years
Ended December 31, 2009, 2008, and 2007
(in
thousands)
| |
|
|
|
|
|
|
|
|
|
|
|
|
|
|
|
|
|
|
|
|
|
|
|
|
|
Less Write-
|
|
|
|
|
|
|
|
|
|
|
Additions
|
|
|
offs, and
|
|
|
|
|
|
|
|
Balance at
|
|
|
Charged to
|
|
|
Transfers,
|
|
|
Balance
|
|
|
|
|
Beginning of
|
|
|
Costs and
|
|
|
Net of
|
|
|
at End
|
|
|
Description
|
|
Period
|
|
|
Expenses
|
|
|
Recoveries
|
|
|
of Period
|
|
|
|
|
|
|
|
Year Ended December 31, 2009:
|
|
|
|
|
|
|
|
|
|
|
|
|
|
|
|
|
|
|
|
|
|
|
|
|
|
|
|
|
|
|
|
|
|
|
|
Allowance for doubtful accounts
|
|
$
|
290
|
|
|
$
|
1,065
|
|
|
$
|
48
|
|
|
$
|
1,403
|
|
|
Allowance for deferred tax assets
|
|
$
|
32,154
|
|
|
$
|
14,615
|
|
|
$
|
(8,097
|
)
|
|
$
|
38,672
|
|
|
|
|
|
|
|
|
|
|
|
|
|
|
|
|
|
|
|
|
Year Ended December 31, 2008:
|
|
|
|
|
|
|
|
|
|
|
|
|
|
|
|
|
|
|
|
|
|
|
|
|
|
|
|
|
|
|
|
|
|
|
|
Allowance for doubtful accounts
|
|
$
|
264
|
|
|
$
|
8
|
|
|
$
|
18
|
|
|
$
|
290
|
|
|
Allowance for deferred tax assets
|
|
$
|
31,740
|
|
|
$
|
—
|
|
|
$
|
414
|
|
|
$
|
32,154
|
|
|
|
|
|
|
|
|
|
|
|
|
|
|
|
|
|
|
|
|
Year Ended December 31, 2007:
|
|
|
|
|
|
|
|
|
|
|
|
|
|
|
|
|
|
|
|
|
|
|
|
|
|
|
|
|
|
|
|
|
|
|
|
Allowance for doubtful accounts
|
|
$
|
332
|
|
|
$
|
15
|
|
|
$
|
(83
|
)
|
|
$
|
264
|
|
|
Allowance for deferred tax assets
|
|
$
|
61,361
|
|
|
$
|
3,939
|
|
|
$
|
(33,560
|
)
|
|
$
|
31,740
|
|
S-2