Attached files
| file | filename |
|---|---|
| EX-31.2 - EX-31.2 - Startek, Inc. | a09-36239_1ex31d2.htm |
| EX-32.1 - EX-32.1 - Startek, Inc. | a09-36239_1ex32d1.htm |
| EX-10.82 - EX-10.82 - Startek, Inc. | a09-36239_1ex10d82.htm |
| EX-21.1 - EX-21.1 - Startek, Inc. | a09-36239_1ex21d1.htm |
| EX-31.1 - EX-31.1 - Startek, Inc. | a09-36239_1ex31d1.htm |
| EX-10.84 - EX-10.84 - Startek, Inc. | a09-36239_1ex10d84.htm |
| EX-10.83 - EX-10.83 - Startek, Inc. | a09-36239_1ex10d83.htm |
| EX-23.1 - EX-23.1 - Startek, Inc. | a09-36239_1ex23d1.htm |
UNITED
STATES
SECURITIES AND EXCHANGE COMMISSION
Washington, D.C. 20549
Form 10-K
(Mark One)
x ANNUAL REPORT PURSUANT TO SECTION 13 OR 15(d) OF THE SECURITIES EXCHANGE ACT OF 1934
For the fiscal year ended December 31, 2009
or
o TRANSITION REPORT PURSUANT TO SECTION 13 OR 15(d) OF THE SECURITIES EXCHANGE ACT OF 1934
For the transition period from to
Commission file number 1-12793
StarTek, Inc.
(Exact name of registrant as specified in its charter)
|
Delaware |
|
84-1370538 |
|
(State or other jurisdiction of |
|
(I.R.S. employer |
|
incorporation or organization) |
|
Identification No.) |
|
|
|
|
|
44 Cook Street, 4th Floor |
|
80206 |
|
Denver, Colorado |
|
(Zip code) |
|
(Address of principal executive offices) |
|
|
(303) 262-4500
(Registrant’s telephone number, including area code)
Securities registered pursuant to Section 12(b) of the Act:
|
Title of Each Class |
|
Name of Each Exchange on Which Registered |
|
Common Stock, $.01 par value |
|
New York Stock Exchange, Inc. |
Securities registered pursuant to Section 12(g) of the Act: None
Indicate by check mark if the registrant is a well-known seasoned issuer, as defined in Rule 405 of the Securities Act. Yes o No x
Indicate by check mark if the registrant is not required to file reports pursuant to Section 13 or Section 15(d) of the Act. Yes o No x
Indicate by check mark whether the registrant (1) has filed all reports required to be filed by Section 13 or 15(d) of the Securities Exchange Act of 1934 during the preceding 12 months (or for such shorter period that the registrant was required to file such reports), and (2) has been subject to such filing requirements for the past 90 days. Yes x No o
Indicate by check mark whether the registrant has submitted electronically and posted on its corporate Web site, if any, every Interactive Data File required to be submitted and posted pursuant to Rule 405 of Regulation S-T during the preceding 12 months (or for such shorter period that the registrant was required to submit and post such files). Yes o No o
Indicate by check mark if disclosure of delinquent filers pursuant to Item 405 of Regulation S-K is not contained herein, and will not be contained, to the best of the registrant’s knowledge, in definitive proxy or information statements incorporated by reference in Part III of this Form 10-K or any amendment to this Form 10-K. o
Indicate by check mark whether the registrant is a large accelerated filer, an accelerated filer, a non-accelerated filer, or a smaller reporting company. See definitions of “large accelerated filer,” “accelerated filer” and “smaller reporting company” in Rule 12b-2 of the Exchange Act. (Check one):
|
Large accelerated filer o |
|
Accelerated filer x |
|
Non-accelerated filer o |
|
Smaller reporting company o |
|
(Do not check if a smaller reporting company) |
|
|
Indicate by checkmark whether the registrant is a shell company (as defined in Rule 12b-2 of the Act). Yes o No x
As of February 12, 2010, 14,882,990 shares of common stock were outstanding. The aggregate market value of common stock held by non-affiliates of the registrant on June 30, 2009 was $94.5 million, based upon the closing price of the registrant’s common stock as quoted on the New York Stock Exchange composite tape on such date. Shares of common stock held by each executive officer and director and by each person who owned 5% or more of the outstanding common stock as of such date have been excluded, as such persons may be deemed to be affiliates. This determination of affiliate status is not necessarily a conclusive determination for other purposes.
DOCUMENTS INCORPORATED BY REFERENCE
Part III incorporates certain information by reference from the registrant’s proxy statement to be delivered in connection with its 2010 annual meeting of stockholders. With the exception of certain portions of the proxy statement specifically incorporated herein by reference, the proxy statement is not deemed to be filed as part of this Form 10-K.
CAUTIONARY STATEMENT REGARDING FORWARD-LOOKING STATEMENTS
This Form 10-K contains forward-looking statements within the meaning of Section 27A of the Securities Act of 1933, as amended, and Section 21E of the Securities Exchange Act of 1934, as amended, including the following:
· certain statements, including possible or assumed future results of operations, in “Management’s Discussion and Analysis of Financial Condition and Results of Operations”;
· any statements contained herein regarding the prospects for our business or any of our services;
· any statements preceded by, followed by or that include the words “may”, “will”, “should”, “seeks”, “believes”, “expects”, “anticipates”, “intends”, “continue”, “estimate”, “plans”, “future”, “targets”, “predicts”, “budgeted”, “projections”, “outlooks”, “attempts”, “is scheduled”, or similar expressions; and
· other statements contained herein regarding matters that are not historical facts.
Our business and results of operations are subject to risks and uncertainties, many of which are beyond our ability to control or predict. Because of these risks and uncertainties, actual results may differ materially from those expressed or implied by forward-looking statements, and investors are cautioned not to place undue reliance on such statements. All forward-looking statements herein speak only as of the date hereof, and we undertake no obligation to update any such forward-looking statements. Important factors that could cause actual results to differ materially from our expectations and may adversely affect our business and results of operations include, but are not limited to those items set forth in Item 1A. “Risk Factors” appearing in this Form 10-K.
Unless otherwise noted in this report, any description of “us” or “we” refers to StarTek, Inc. and our subsidiaries. Financial information in this report is presented in U.S. dollars.
Part I
ITEM 1. BUSINESS
BUSINESS OVERVIEW
StarTek is a provider of business process outsourcing services. We partner with our clients to meet their business objectives and improve customer retention, increase revenues and reduce costs through an improved customer experience. Our solutions leverage industry knowledge, best business practices, skilled agents, proven operational excellence and flexible technology. The StarTek comprehensive service suite includes customer care, sales support, complex order processing, accounts receivable management, technical and product support and other industry-specific processes. We operate our business within three reportable segments, based on the geographic regions in which our services are rendered: (1) the U.S., (2) Canada and (3) Offshore. As of December 31, 2009, our U.S. segment included the operations of our thirteen facilities in the U.S.; our Canada segment included the operations of our five facilities in Canada; and our Offshore segment included the operations of our facility in Makati City, Philippines. Financial information for each of our reportable segments for the last three fiscal years is included in Note 16, “Segment Information,” to our Consolidated Financial Statements, which are included at Item 8. “Financial Statements and Supplementary Financial Data,” of this Form 10-K.
Our business is providing high-end Customer Service Offerings through the effective deployment of People and Technology.
Customer Service Offerings
We provide our clients with an outsourced customer care service offering so that they may focus on their core business and preserve capital. Our service offering includes customer care, sales support, complex order processing, accounts receivable management, technical and product support and other industry-specific processes. We are well positioned to help our telecommunications clients implement the convergence of product lines, including wire-line, wireless, cable and broadband, high technical consumer and insurance products. Under each service offering, we deliver a transparent extension of our clients’ brands.
Customer Care Management. We provide customer care management throughout the life cycle of our clients’ customers. These programs include management of customer acquisition, new account set-up, repair services management, customer information verification, loyalty programs, service activation, renewals, account inquiries, complaint resolutions, product information, and billing support. These services are aimed at seamlessly managing the relationships between our clients and their customers in a manner that cultivates customer retention and loyalty.
Technical and Product Support. Our technical and product support service offering provides our clients’ customers with high-end technical support services by telephone, e-mail, facsimile and the internet, 24 hours per day, seven days per week. Technical support
inquiries are generally driven by a customer’s purchase of a product or service, or by a customer’s need for ongoing technical assistance.
Sales Support. Through our sales support service we seek to increase the revenue generation of our clients through cross-selling and up-selling our clients’ products to their customers. We have the ability to increase customer purchasing levels, implement product promotion programs, introduce our clients’ customers to new products, secure and process additional customer orders, contract renewal programs and handle inquiries related to product shipments and billing.
Provisioning and Complex Order Processing. Our complex order processing services provide our clients with large scale project management and direct relationship management for our clients’ large enterprise customers. This service includes order management and technical sales support for high-end communications services, such as wire-line, wireless, data and customer premise equipment. In addition, we process order fallout from our clients’ automated systems, complete billing review and revenue recovery, and perform quality assurance. Our services enable a client to provide large scale project management and customer relations services to their customers in a more efficient and cost-effective way.
Receivables Management. We provide billing, credit card support and first party collections through our receivables management services. These services allow our clients to reduce the risk of non-payment by automatically transferring the calls made by delinquent customers to us, at which point our representatives encourage the customers to pay their bill in order to continue to receive service. Customers may bring their bill current through credit or debit card payments, electronic checks or money orders. This service allows us to help our clients reduce their number of days sales outstanding and bad debt write-offs.
Other. We provide other industry-specific processes including technical support, phone number portability and directory management. We provide number portability services to facilitate the process when our clients’ customers wish to keep their phone number when changing service providers. Our phone number portability services, which include both automated and live agent interaction, facilitate pre-port validation, data collection, automatic processing of port-out/in requests, direct and automated interface with the service order activation platform, fallout management tool and port request tracking and archiving. We also provide 411 directory listing management services.
People
Our success is driven by our people, who we believe are industry trained experts in providing the communications industry with proven business practices and solutions to help our clients achieve their business goals. Many of the members of our management team, in addition to our trained customer service representatives, have a background in the communications industry, and bring deep experience to ensure the delivery of optimal solutions to our clients. We believe that this expertise in our human capital is what allows us to succeed in providing excellent account management and tailored solutions in serving the communications marketplace.
Technology
Our ability to deliver exceptional service to our clients is enhanced by our technology infrastructure, agent performance tools, analytics, self service applications and technology professional services. Our technology support services include hosted IT infrastructure and application services encompassing interactive voice response (“IVR”), virtual queuing, IP-PBX (a business telephone system that supports call delivery using voice over internet protocol (VoIP)), workforce management, quality assurance monitoring, disposition tools, business intelligence reporting and eServices, including our e-mail, chat and knowledge base capabilities. Through our technology, we are able to rapidly respond to ever-changing client demands in a tailored, yet cost-effective and efficient manner. We are capable of handling large call volumes at each of our contact centers through our reliable and scalable contact center solutions. We staff our IT personnel such that we can support our infrastructure and still have the capability to design programs to meet the specific needs of our clients.
CUSTOMER TRENDS
In collaborating with our clients, we have observed a few emerging trends. Our clients are increasingly focused on: (1) improving customer satisfaction and retention; (2) improving the customer experience; and (3) increasing sales and retention. We provide some of the industry’s highest customer satisfaction evidenced by our clients’ customer service awards and our clients’ ranking of StarTek relative to other outsourced partners. We have demonstrated to our clients our success in increasing revenue per subscriber by incorporating up-sell and cross-sell methodologies during customer interactions. Our clients value a combination of an on-shore, near-shore, offshore and home agent delivery platform. They realize the value of on-shore call centers in North America for the cultural and language familiarity available as a way to improve the customer experience particularly in the case of voice-enabled services. A platform consisting of home agents is also popular due to the high level of quality generally delivered by these agents at a lower cost than traditional call center agents, due to the more limited fixed costs for items such as property and equipment. Given this demand, we have invested in StarTek@Home technologies and plan to grow our number of home agents during 2010. Customers also have a desire for near-shore and offshore options in order to reduce their costs. In response to this demand for offshore solutions, we
opened our first facility in the Philippines in 2008, and plan to open a second facility there in 2010. Also in 2010, we are opening a new facility in Costa Rica which will enable us to provide a near-shore solution, as well as Spanish speaking capabilities.
KEY COMPETITIVE DIFFERENTIATORS
We offer a variety of customer management solutions that provide front to back-office capabilities utilizing the StarTek Choice delivery platform. StarTek Choice includes onshore, near shore, offshore, and StarTek@Home sourcing alternatives. We also offer multi-channel interactions across voice, chat, email, and IVR channels. Our solution configuration is aligned with our clients’ unique requirements. We are flexible in designing solutions around our clients’ strategic goals, and we provide experienced management teams that bring together a trained, productive workforce, equipped with the right tools and technology. We believe that we are differentiated by our flexibility, people, quality, execution, results and competitive pricing.
Flexibility. We believe that we provide high quality business process outsourcing (BPO) solutions, and we leverage our expertise in working with our clients to design solutions around their goals. We offer customer management solutions that help our clients manage customer relationships across the customer lifecycle to improve the customer experience, retention, and sales, and reduce the total cost of customer management. We are able to achieve these results through our people, applied technology, dedication to continuous improvement, and integrated North American, offshore and home agent delivery platform.
People. Our people are the key to our success. We possess a unique culture where people are dedicated to serving our clients and their customers. Whether it be an at home agent or call center representative, we use a screening process to ensure people will have the right skills and attitude to thrive in our culture. We offer blended classroom and eLearning training, knowledge management systems, and other desktop tools to ensure that our representatives are fully equipped to deliver an outstanding customer experience.
Quality. Quality delivery is the driving force behind our culture. We are frequently ranked highly by our clients, but just as importantly, ranked highly by our clients’ customers. We believe that we are a catalyst enabling our clients to earn the JD Power and other coveted industry quality awards.
Execution. Our clients’ customer strategies are the driving force behind our solutions and their delivery. We seek to execute on our clients’ quality metrics and rank among the top of all of their outsourced vendors, while continuing to be a cost effective solution. In order to achieve these goals, our program managers find ways to optimize the effectiveness and efficiency of the delivery of our solutions.
Results. We manage customer relationships to increase loyalty and profitability for our clients. Loyal customers purchase more frequently, provide higher revenues per purchase, acquire multiple products or services, refer our clients to others, and continue to purchase from our clients over long periods of time. Our solutions derive more benefits from customer interactions by delivering increased customer satisfaction and revenue, which in turn leads to a higher return on our client’s customer investment.
STRATEGY
We seek to become a market leader in providing high-value services to clients. Our approach is to develop relationships with our clients that are partnering and collaborative in nature and create industry-based solutions to meet our clients’ business needs. To be a leader in the market, our strategy is to:
· grow our existing client base by deepening and broadening our relationships,
· add new clients and continue to diversify our client base,
· improve the profitability of our business through operational improvements and securing higher margin business,
· achieve site optimization at our facilities and close facilities that are not financially viable long-term,
· expand our global delivery platform by growing offshore and near-shore,
· invest in our StarTek@Home platform to increase our presence of home agents,
· broaden our service offerings by providing more technology solutions,
· enter new vertical markets, including healthcare, insurance and technology to diversify our client base and
· make prudent acquisitions to expand our business scale and service offerings.
During 2009, we executed on our strategic objective to expand our delivery platform near-shore by building out a facility in Costa Rica, which will open in the first quarter of 2010. We also entered into a lease in January 2010 for our second facility in the Philippines, which will open in the second quarter of 2010. We believe that diversifying our geographic platform will position us for future growth. In addition, we continued to execute on our site optimization plan by closing an unprofitable Canadian location in February 2009, and we have recently announced three other North American closures, which will occur in early 2010. We expect these site closures to improve our profitability long-term as these sites contributed negative gross margins in 2009, which adversely affected our overall results. Refer to “Management’s Discussion and Analysis of Financial Condition and Results of Operations” included in Item 7 of this Form 10-K for further information. In 2009, we also added five new clients, launched a number of new programs with existing clients and made significant investments in new systems, home agents and employee programs.
HISTORY OF THE BUSINESS
StarTek was founded in 1987. At that time, our business was centered on supply chain management services, which included packaging, fulfillment, marketing support and logistics services. On December 16, 2005, we sold our supply chain management services platform.
After our initial public offering on June 19, 1997, we began operating contact center services, which primarily focused on customer care, and grew to include our current suite of offerings as described in the “Business Overview” section of this Form 10-K.
While our business is not generally seasonal, it does fluctuate quarterly based on our clients’ product offerings as well as their customer interaction volume. See Item 1A. “Risk Factors,” for a more complete description of the seasonality of our business.
INDUSTRY
According to a November 2009 report published by IDC, a leading provider of industry research and market intelligence, it is estimated that worldwide spending on customer care business process outsourcing services is expected to grow at a compound annual rate of 6.8% during the period 2005 to 2013, with worldwide customer service BPO revenues reaching $76 billion in 2013. The customer interaction segment of customer care business process outsourcing is currently a $50 billion market and is expected to grow at a 6.9% compound annual growth rate through 2013. This IDC report also states that it expects the Asia/Pacific region to experience the strongest growth with a 10.1% compound annual growth rate. It is expected that EMEA (Europe, Middle East and Africa) will be the slowest, with a rate of 5.8%, and that the Americas will grow 6.7% through 2013.
Outsourcing of non-core activities, such as those we provide, offers companies the ability to focus on their core competencies, leverage economies of scale and control variable costs of the business while accessing new technology and trained expert personnel. As the business environment continues to evolve, it has become more difficult and expensive for some companies to maintain the necessary personnel and product capabilities in-house to provide business process services on a cost-effective basis. Accordingly, our anticipation is that outsourced customer care services will grow significantly in the coming years. In general, we believe that industries having higher levels of customer contact and service volume, such as the communications industry, tend to be more likely to seek outsourced services as a more efficient method for managing their technical support and customer care functions. We believe that outsourced service providers, including ourselves, will continue to benefit from these outsourcing trends.
COMPETITION
We believe that our competitive differentiators are our flexibility, people, quality, execution and results. We compete with a number of companies that provide similar services on an outsourced basis, including technical support and customer care companies such as APAC Customer Services, Inc.; Teleperformance; Convergys Corporation; NCO Group; Aegis PeopleSupport; Sitel Corporation; Sykes Enterprises, Incorporated; TeleTech Holdings, Inc., Stream Global Services, Inc. and West Corporation. We compete with the aforementioned companies for new business, for expansion of existing business, and within the companies we currently serve. Many of these competitors are significantly larger than us in revenue, income, number of contact centers and customer agents, number of product offerings, and market capitalization. We believe that while smaller than many of our competitors, we are able to compete because of our flexibility and ability to react quickly and efficiently to integrate client technology into our contact centers. We believe our success is contingent more on our quality of service than our overall size. We also compete with in-house process outsourcing operations of our current and potential clients. Such in-house operations include customer care, technical support, internet operations and e-commerce support. As noted in our industry discussion, it is believed that many outsourced services will continue to migrate to other countries with lower wages than those prevailing in the U.S. Accordingly, our strategic objectives include expanding our geographic platform so that we may compete with those companies who have devoted significant time and money to operating offshore. Several of our competitors merged during 2009, which increased the size and reach of those competitors, which may affect our competitive position; however, we believe there are integration challenges involved in consolidations, which may provide us an opportunity to deliver superior customer service to our clients. Some competitors may offer a broader range of services than we do, which may result in clients and potential clients consolidating their use of outsourced services with larger competitors, rather than using our services. Therefore, part of our strategy is to expand our service offerings by increasing our presence offshore, near-shore and with @Home agents, as well as to invest in new technologies which will enhance our competitive advantage. We primarily compete with the aforementioned companies on the basis of price and quality. As such, our strategy continues to be to execute on our clients’ quality metrics and rank among the top of all of their outsourced vendors, while continuing to be a cost effective solution. We view our competitive advantage as being a large enough company to offer the breadth of service offerings that are often requested by our clients, yet being agile enough to quickly respond to our clients needs.
CLIENTS
As mentioned previously, we seek to become the expert provider of outsourced customer care and related services for the communications industry and believe that we possess expertise in servicing clients within that industry. Accordingly, more than 95% of our revenue is derived from customers within that industry. Our two largest customers, AT&T Inc. (“AT&T”) and T-Mobile USA, Inc. (“T-Mobile”) (a subsidiary of Deutsche Telekom), account for a significant percentage of our revenue. While we believe that we have good relationships with these clients, a loss of one or more of these principal clients, or a large program from one of these clients, could adversely affect our business and our results of operations (see Item 1A. “Risk Factors”). The following table represents revenue concentration of our principal clients:
|
|
|
Year Ended December 31, |
|
||||
|
|
|
2009 |
|
2008 |
|
2007 |
|
|
AT&T Services, Inc. and AT&T Mobility, LLC, subsidiaries of AT&T, Inc. |
|
63.6 |
% |
55.0 |
% |
50.5 |
% |
|
T-Mobile USA, Inc., a subsidiary of Deutsche Telekom |
|
21.5 |
% |
26.8 |
% |
21.9 |
% |
GOVERNMENT AND ENVIRONMENTAL REGULATION
We are subject to numerous federal, state, and local laws in the states and territories in which we operate, including tax, environmental and other laws that govern the way we conduct our business. There are risks inherent in conducting business internationally, including significant changes in domestic government programs, policies, regulatory requirements, and taxation with respect to foreign operations, potentially longer working capital cycles, unexpected changes in foreign government programs, policies, regulatory requirements and labor laws, and difficulties in staffing and effectively managing foreign operations.
EMPLOYEES AND TRAINING
Our success in recruiting, hiring, training, and retaining large numbers of full and part-time skilled employees, and obtaining large numbers of hourly employees during peak periods is critical to our ability to provide high quality outsourced services. We compete for labor with firms offering similar paying jobs in the communities in which we are located, which includes other contact centers. During 2009 and 2008, we experienced difficulties hiring and retaining agents as we faced economic pressures in and around certain of our site locations. Refer to Item 1A. “Risk Factors” for further discussion of risks surrounding our ability to recruit and retain personnel.
As of December 31, 2009, we employed approximately 8,900 employees. We believe the demographics surrounding our facilities, and our reputation, stability, and compensation plans should allow us to continue to attract and retain qualified employees. None of our employees were members of a labor union or were covered by a collective bargaining agreement during 2009.
CORPORATE INFORMATION
We were founded in 1987 and on June 19, 1997, we completed an initial public offering of our common stock. We conduct our business through our wholly owned operating subsidiaries, StarTek USA, Inc., StarTek Canada Services, Ltd and StarTek International, Limited. We are a Delaware corporation headquartered in Denver, Colorado. Our principal executive offices are located at 44 Cook Street, 4th Floor, Denver, Colorado 80206. Our telephone number is (303) 262-4500. Our website address is www.startek.com. Our stock currently trades on the New York Stock Exchange under the symbol SRT.
WEB SITE AVAILABILITY OF REPORTS
Copies of our Annual Report on Form 10-K, Quarterly Reports on Form 10-Q, Current Reports on Form 8-K, and amendments to those reports filed or furnished pursuant to Section 13(a) and 15(d) of the Securities Exchange Act of 1934 (the “Exchange Act”) are available free of charge through our web site (www.startek.com) as soon as practicable after we furnish it to the Securities and Exchange Commission (“SEC”). We also make available on the “Investor Relations” page of our corporate website, the charters for the Compensation Committee, Audit Committee and Governance and Nominating Committee of our Board of Directors, as well as our Corporate Governance Guidelines and our Code of Ethics and Business Conduct.
None of the information on our website or any other website identified herein is part of this report. All website addresses in this report are intended to be inactive textual references only.
ITEM 1A. RISK FACTORS
Continuing unfavorable economic conditions could have a material adverse effect on our results of operations and financial condition.
The current economic downturn and disruptions in the capital and credit markets in the U.S. and world economies have reduced consumer spending and reduced spending by businesses. Since our revenue is largely concentrated in the telecommunications industry, and the majority of our business involves technical support and customer care services initiated by our clients’ customers, our revenue is dependent on the amount of telecommunications products and services demanded by our clients’ customers. Consequently, a general reduction in consumer demand for such products and services due to the recession in the domestic and international economies could reduce the demand for our services and have a material adverse effect on our results of operations.
In addition, our existing clients and a number of clients we are currently targeting have been decreasing the number of firms they rely on to outsource their business process outsourced services. Due to financial uncertainties and the potential reduction in demand for our clients’ products and services, our clients and prospective clients may decide to further consolidate the number of firms on which they rely for their business process outsourced services to reduce costs. Under these circumstances, our clients may cancel current contracts with us, or we may fail to attract new clients, which will adversely affect our financial condition. In addition, they may seek price reductions on our contracts as means to lower their costs. If global economic and market conditions remain uncertain or persist, spread, or deteriorate further, we may experience material impacts on our business, operating results, and financial condition.
Over 80% of our revenue in 2009 and 2008, and over 70% of our revenue in 2007, has been received from our two largest clients. The loss or reduction in business from any of these clients would adversely affect our business and results of operations.
The following table represents revenue concentration of our principal clients:
|
|
|
Year Ended December 31, |
|
||||
|
|
|
2009 |
|
2008 |
|
2007 |
|
|
AT&T Services, Inc. and AT&T Mobility, LLC, subsidiaries of AT&T, Inc. |
|
63.6 |
% |
55.0 |
% |
50.5 |
% |
|
T-Mobile USA, Inc., a subsidiary of Deutsche Telekom |
|
21.5 |
% |
26.8 |
% |
21.9 |
% |
The loss of a principal client, a material reduction in the amount of business we receive from a principal client, renegotiation of price by a client, or the loss, delay or termination of a principal client’s product launch or service offering would adversely affect our business, revenue and operating results. We may not be able to retain our principal clients or, if we were to lose any of our principal clients, we may not be able to timely replace the revenue generated by the lost clients. Loss of a principal client could result from many factors, including consolidation or economic downturns in our clients’ industries, as discussed further below.
Our work for AT&T is covered by several contracts for a variety of different lines of AT&T business. Some of these contracts expire in 2010 and others in 2011. The initial term of our master services agreement covering all AT&T work expired in January 2010. After the initial term, the agreement automatically renews month-to-month thereafter. We are currently renegotiating the new master services agreement and expect to execute the agreement during the first half of 2010. Until the new agreement is signed, our services provided to AT&T are covered under the existing master services agreement.
Our call center services agreement with T-Mobile is effective as of October 1, 2007 which had an initial term of two years. After the initial term, the contract automatically renews for one-year periods thereafter, unless either party provides written notice of termination at least 60 days prior to the expiration of the then-current term. Although the initial term of the contract ended on September 30, 2009, the contract automatically renewed for a one-year term which would expire on September 30, 2010. We are currently negotiating a new contract with T-Mobile and expect to execute the agreement during the first half of 2010. Until the new agreement is signed, our services provided to T-Mobile are covered under the existing agreement effective October 1, 2007.
We are working diligently to complete negotiation of the new agreements. However, if we fail to do so, it would have a material adverse effect on our business, results of operations, and financial condition.
The future revenue we generate from our principal clients may decline or grow at a slower rate than expected or than it has in the past. In the event we lose any of our principal clients or do not receive call volumes anticipated from these clients, we may suffer from the costs of underutilized capacity because of our inability to eliminate all of the costs associated with conducting business with that client, which could exacerbate the effect that the loss of a principal client would have on our operating results and financial condition. For example, there are no guarantees of volume under the current contract with AT&T. In addition, the current contract with AT&T provides for a tiered incentive pricing structure that provides for lower pricing at higher volumes. Additional productivity gains will be necessary to offset the negative impact that lower per-minute revenue at higher volume levels will have on our margins in future periods.
We face considerable pricing pressure in our business, and if we are not able to continually increase productivity, our gross margins and results of operations may be adversely affected.
Our strategy depends in part on our ability to increase productivity. We face significant price pressure arising from our clients’ desire to decrease their operating costs, and from other competitors operating in our targeted markets. Price pressure may be more pronounced during periods of economic uncertainty. In addition, our contract with our largest customer currently contains a tiered pricing structure, under which pricing declines as service volumes increase, creating increased pricing pressures in future years. Accordingly, our ability to maintain our operating margins depends on our ability to improve productivity and reduce operating costs. If we are not able to achieve sufficient improvements in productivity to adequately compensate for potential price decreases, our results of operations may be adversely affected.
Our contracts generally do not contain minimum purchase requirements and can generally be terminated by our customers on short notice without penalty.
We enter into written agreements with each client for our services. We seek to sign multi-year contracts with our clients; however these contracts generally permit termination upon 30 to 90 days notice by our clients; do not designate us as our clients’ exclusive outsourced services provider; do not penalize our clients for early termination; hold us responsible for work performed that does not meet pre-defined specifications; and do not contain minimum purchase requirements or volume commitments. Accordingly, we face the risk that our clients may cancel or renegotiate contracts we have with them, which may adversely affect our results. In addition, some contracts with our two largest clients either expire in 2010 or are currently under negotiation for renewal, and we cannot guarantee that they will be extended or renewed. If a principal client cancelled or did not renew their contract with us, our results would suffer. In addition, because the amount of revenue generated from any particular client is generally dependent on the volume and activity of our clients’ customers, as described above, our business depends in part on the success of our clients’ products. The number of customers who are attracted to the products of our clients may not be sufficient, or our clients may not continue to develop new products that will require our services, in which case it may be more likely for our clients to terminate their contracts with us. Moreover, clients who may not terminate their contacts with us without cause could generally reduce the volume of services they outsource to us, which would have an adverse effect on our revenue, results of operations, and overall financial condition.
Our client base is concentrated in the communications industry, which has recently experienced consolidation trends. As our clients’ businesses change as a result of merger and acquisition activity, there is no guarantee that the newly formed companies will continue to use our services.
Consolidation in the communications industry may decrease the potential number of buyers for our services. Likewise, there is no guarantee that the acquirer of one of our clients will continue to use our services after the consolidation is completed. We are particularly vulnerable on this issue given the relatively few significant clients we currently serve and the concentration of these clients in the telecommunications industry. For example, in late 2006, our client, AT&T acquired another of our clients, Cingular Wireless, LLC (now, AT&T Mobility, LLC), thereby further concentrating our revenue base. There can be no assurance that AT&T Mobility, LLC, AT&T, or other subsidiaries of AT&T will continue to use our services in the future. If we lose principal clients or our service volumes decrease as a result of principal clients being acquired, our business, financial condition and results of operations would be adversely affected. We expect to negotiate renewals of our contracts in due course; however, if any of such contracts or any order under such a contract is not ultimately renewed, it would have a material adverse effect on our results of operations and financial condition.
Our client base is concentrated in the communications industry and our strategy partially depends on a trend of communications companies continuing to outsource non-core services. If the communications industry suffers a downturn or the trend toward outsourcing reverses, our business will suffer.
Our current clients are almost exclusively communications companies, which include companies in the wire-line, wireless, cable and broadband lines of business. Over 95% of our revenue in 2009 was concentrated in the telecommunications industry. Our business and growth is largely dependent on continued demand for our services from clients in this industry, and other industries that we may target in the future, and on trends in those industries to purchase outsourced services. A general and continuing economic downturn in the telecommunications industry or in other industries that we target, or a slowdown or reversal of the trend in these industries to outsource services we provide, could adversely affect our business, results of operations, growth prospects, and financial condition. A general and continuing economic downturn in other industries may result in excess capacity of contact center services in those industries, which could attract clients in the telecommunications industry or in other industries that we target. If this happens, it could adversely affect our business, results of operations, growth prospects, and financial condition.
We have experienced significant management turnover and need to retain key management personnel.
On January 5, 2007, A. Laurence Jones was appointed President, Chief Executive Officer and Interim Chief Financial Officer as a successor to our former Chief Executive Officer, Steven D. Butler. On September 10, 2007, we hired David G. Durham as our
Executive Vice President, Treasurer and Chief Financial Officer. We filled several other key management positions during 2007, 2008 and 2009. In June 2009, we hired a new Senior Vice President, Sales to replace the previous Senior Vice President, Sales who left the Company in September 2008. High turnover of senior management can adversely impact our our client relationships, stock price, our results of operations, and may make recruiting for future management positions more difficult. In some cases, we may be required to pay significant amounts of severance to terminated management employees. In addition, we must successfully integrate any new management personnel that we hire within our organization in order to achieve our operating objectives. Changes in other key management positions may temporarily affect our financial performance and results of operations as new management becomes familiar with our business. Accordingly, our future financial performance will depend to a significant extent on our ability to motivate and retain key management personnel.
If we are not able to hire and retain qualified employees, our ability to service our existing customers and retain new customers will be adversely affected.
Our success is largely dependent on our ability to recruit, hire, train, and retain qualified employees. Our business is labor intensive and, as is typical for our industry, continues to experience high personnel turnover. Our operations, especially our technical support and customer care services, generally require specially trained employees. During 2009, we continued to experience a high rate of employee turnover, which, in turn, requires significant recruiting and training costs. Such turnover adversely affects our operating efficiency, productivity and ability to fully respond to client demand, thereby adversely impacting our results of operations. Some of this turnover can be attributed to the fact that we compete for labor not only with other call centers, but also with other similar-paying jobs, including retail, oil and gas industry labor, food service, etc. As such, improvements in the local economies in which we operate can adversely affect our ability to recruit agents in those locations. Further increases in employee turnover or failure to effectively address and remedy these high attrition rates would have an adverse effect on our results of operations and financial condition.
The addition of new clients or implementation of new projects for existing clients may require us to recruit, hire, and train personnel at accelerated rates. We may not be able to successfully recruit, hire, train, and retain sufficient qualified personnel to adequately staff for existing business or future growth, particularly if we undertake new client relationships in industries in which we have not previously provided services. Because a substantial portion of our operating expenses consists of labor-related costs, labor shortages or increases in wages (including minimum wages as mandated by the U.S. and Canadian federal governments, employee benefit costs, employment tax rates, and other labor related expenses) could cause our business, operating profits, and financial condition to suffer. In the past, some of our Canadian employees have attempted to organize a labor union and economic and legislative changes in the U.S. may encourage organizing efforts in the future, which, if successful, could further increase our recruiting and training costs and could decrease our operating efficiency and productivity.
If we are unable to renew or replace sources of capital funding on satisfactory terms, potential growth and results of operations may suffer.
We have a $15.0 million line of credit, which is scheduled to expire on August 1, 2010 (See Item 7. “Management’s Discussion and Analysis of Financial Condition and Results of Operations — Liquidity and Capital Resources — Contractual Obligations”). As of December, 31 2009, there was no balance outstanding on the line of credit, and we did not draw on the line during 2009. However, if we are unable to renew the line of credit or are unable to secure alternative sources of debt or capital financing under satisfactory terms, or at all, we may lose an important source of liquidity and be unable to meet short-term cash needs required for growth opportunities. This may adversely impact our financial results. In addition, if we do not meet the debt covenant requirements under the line of credit, we could face adverse effects on our financial statements, including payments for waivers or higher interest rate obligations. We believe we will obtain financing to replace or extend this line of credit that will allow us to meet our short-term cash needs. However, the weakened conditions of the U.S. credit markets may adversely impact our ability to obtain financing.
Our operating costs may increase as a result of higher labor costs.
During the past economic downturns, we, like a number of companies in our industry, sought to limit our labor costs by limiting salary increases and payment of cash bonuses to our employees. During 2009, the local economies in some of the locations in which we operate experienced growth, which caused us to increase labor rates to remain competitive within the local economies. If these growth trends continue, we may need to further increase salaries or otherwise compensate our employees at higher levels in order to remain competitive. Effective July 2009, the U.S. federal minimum wage was increased. The minimum wage applicable to most of our operations in Canada is rising even more dramatically than in the U.S. Higher salaries or other forms of compensation are likely to increase our cost of operations. If such increases are not offset by increased revenue, they will negatively impact our financial results. Conversely, if labor rates decrease due to higher unemployment in the current economic downturn, our cost of operations may decrease. In the past, some of our Canadian employees have attempted to organize a labor union and economic and legislative changes in the U.S. may encourage organizing efforts in the future, which, if successful, could further increase our recruiting and training costs and could decrease our operating efficiency and productivity.
We may need to add specialized sales personnel in order to grow our business. We may have difficulty recruiting candidates for these positions.
Our future growth depends on our ability to initiate, develop and maintain new client relationships, as well as our ability to maintain relationships with our existing principal clients. To generate opportunities for new business from existing clients, as well as obtain new clients, we may need to hire specialized sales and marketing staff to introduce new products and services. If we are unable to hire sales people with the specialized skills and knowledge needed to attract new business, we will not be able to diversify our revenue base and thereby reduce our reliance on our significant customers.
We may need to develop new products or services in order to compete for new customers or retain our existing customers.
If we are not able to develop new products or services, we may not be able to provide the same level of service provided bv our competitors, which could result in the loss of an existing client or being unable to generate new clients. If we are not able to develop new products and services, we could lose market share or not be able to grow our business and diversify our revenue base and thereby reduce our reliance on our significant customers.
Our operating results may be adversely affected if we are unable to maximize our facility capacity utilization.
Our profitability is influenced by our facility capacity utilization. The majority of our business involves technical support and customer care services initiated by our clients’ customers, and as a result, our capacity utilization varies and demands on our capacity are, to some degree, beyond our control. We have experienced, and in the future may experience, periods of idle capacity from opening new facilities where forecasted volume levels do not materialize. In addition, we have experienced, and in the future may experience, idle peak period capacity when we open a new facility or terminate or complete a large client program. These periods of idle capacity may be exacerbated if we expand our facilities or open new facilities in anticipation of new client business because we generally do not have the ability to require a client to enter into a long-term contract, or to require clients to reimburse us for capacity expansion costs if they terminate their relationship with us or do not provide us with anticipated service volumes. From time to time, we assess the expected long-term capacity utilization of our facilities. Accordingly, we may, if deemed necessary, consolidate or close under-performing facilities in order to maintain or improve targeted utilization and margins. In 2009, we determined it was necessary to close a facility in Regina, Saskatchewan, and we have announced that we will be closing sites in Victoria, Texas, Laramie, Wyoming and Thunder Bay, Ontario during the first quarter of 2010. These closures result in lease termination costs, severance costs or impairment charges. During 2009, we recognized $6.4 million in impairment losses and restructuring charges related to the Regina and Thunder Bay closures. We may incur further impairment losses and restructuring charges during 2010 related to our planned closures. There can be no assurance that we will be able to achieve or maintain optimal facility capacity utilization.
We generate revenue based on the demand for, and inquiries generated by, our clients’ products and services. If our clients’ products and services are not successful or do not generate the anticipated call volumes, our revenue and results of operations will be adversely affected.
In substantially all of our client relationships, we generate revenue based on the amount of products and services demanded by our clients’ customers. The amount of our revenue also depends on the number and duration of customer inquiries. Consequently, the amount of revenue generated from any particular client is dependent upon consumers’ interest in and use of that client’s products or services. In addition, if the reliability of our clients’ products or services increases as a result of technological improvements, the volume of calls that we service may be reduced. If customer interest in or increased reliability of any products or services offered by our clients and for which we provide outsourced services result in reduced service volumes, our revenue would be diminished. We utilize forecasts made by our clients based on demand from their customers. If the actual call volumes are materially different from the forecasted volumes, our financial results could be adversely affected.
In 2008, we expanded our capacity to include four new facilities. As business associated with these additional facilities ramped, we experienced excess capacity and incurred additional costs as we worked towards bringing these facilities to normal operational levels. In 2008 we closed two facilities, and in 2009 we closed one facility as part of our efforts to achieve site optimization at all of our locations. We have recently announced three more site closures in early 2010, and two new site openings in early 2010. If client demand declines due to economic conditions, or otherwise, we would not leverage our fixed costs as effectively, which would have a material adverse effect on our results of operations and financial condition.
Our existing and potential clients are currently decreasing the number of vendors they are using to outsource their business process services. If we lose more business than we gain as a result of this vendor consolidation, our business and results of operations will be adversely affected.
Our existing clients and a number of clients we are currently targeting have been decreasing the number of firms they rely on to outsource their business process outsourced services. We believe these clients are taking this action in order to increase accountability and decrease their costs, and under current economic conditions, there is an increased risk that our clients will outsource their business
process outsourced services to even fewer firms to further reduce costs. If this consolidation results in us losing one or more of our clients, our business and results of operations will be adversely affected. In addition, this consolidation could make it more difficult for us to secure new clients, which could limit our growth opportunities.
If we do not effectively manage our growth or control costs related to growth, our results of operations will suffer.
We intend to grow our business by increasing the number of services we provide to existing clients, by expanding our overall client base and, in the future, through merger and acquisition activity. Growth could place significant strain on our management, employees, operations, operating and financial systems, and other resources. To accommodate significant growth we would be required to open additional facilities, expand and improve our information systems and procedures, and hire, train, motivate, and manage a growing workforce, all of which would increase our costs. Our systems, facilities, procedures, and personnel may not be adequate to support our future operations. Further, we may not be able to maintain or accelerate our current growth, effectively manage our expanding operations, or achieve planned growth on a timely and profitable basis. During recent years, we incurred costs related to excess capacity as we opened new facilities in anticipation of volume levels that did not materialize. As a result, our operating profits declined, and our stock price was adversely impacted. If we are unable to manage our growth efficiently, or if growth does not occur, our business, results of operations, and financial condition could suffer.
Unauthorized disclosure of sensitive or confidential client and customer data could expose us to protracted and costly litigation and penalties and may cause us to lose clients.
We are dependent on IT networks and systems to process, transmit and store electronic information and to communicate among our locations around the world and with our alliance partners and clients. Security breaches of this infrastructure could lead to shutdowns or disruptions of our systems and potential unauthorized disclosure of confidential information. We are also required at times to manage, utilize and store sensitive or confidential client or customer data. As a result, we are subject to contractual terms and numerous U.S. and foreign laws and regulations designed to protect this information, such as various U.S. federal and state laws governing the protection of health or other individually identifiable information. If any person, including any of our employees, negligently disregards or intentionally breaches our established controls with respect to such data or otherwise mismanages or misappropriates that data, we could be subject to monetary damages, fines and/or criminal prosecution. Unauthorized disclosure of sensitive or confidential client or customer data, whether through systems failure, employee negligence, fraud or misappropriation, could damage our reputation and cause us to lose clients. Similarly, unauthorized access to or through our information systems or those we develop for our clients, whether by our employees or third parties, could result in negative publicity, legal liability and damage to our reputation, business, financial condition, results of operations and cash flows.
We process, transmit and store personally identifiable information and unauthorized access to or the unintended release of this information could result in a claim for damage or loss of business and create unfavorable publicity.
We process, transmit and store personally identifiable information, both in our role as a service provider and as an employer. This information may include social security numbers, financial and health information, as well as other personal information. As a result, we are subject to certain contractual terms, as well as federal, state and foreign laws and regulations designed to protect personally identifiable information. We take measures to protect against unauthorized access and to comply with these laws and regulations. We use the internet as a mechanism for delivering our services to clients, which may expose us to potential disruptive intrusions. Unauthorized access, system denials of service, or failure to comply with data privacy laws and regulations may subject us to contractual liability and damages, loss of business, damages from individual claimants, fines, penalties, criminal prosecution and unfavorable publicity, any of which could negatively affect our operating results and financial condition. In addition, third party vendors that we engage to perform services for us may have an unintended release of personally identifiable information.
If we fail to integrate businesses and assets that we may acquire through acquisitions, we may lose clients, and our liquidity, capital resources and profitability may be adversely affected.
We may pursue strategic acquisitions of companies with services, technologies, industry specializations, or geographic coverage that extend or complement our existing business. Acquisitions and joint ventures often involve a number of special risks, including the following:
· We may encounter difficulties integrating acquired software, operations and personnel and our management’s attention could be diverted from other business concerns;
· We may not be able to successfully incorporate acquired technology and rights into our service offerings and maintain uniform standards, controls, procedures and policies;
· The businesses or assets we acquire may fail to achieve the revenue and earnings we anticipated, causing us to incur additional debt to fund operations and to write down the value of acquisitions on our financial statements;
· We may assume liabilities associated with the sale of the acquired company’s products or services;
· Our resources may be diverted in asserting and defending our legal rights and we may ultimately be liable for contingent and other liabilities, not previously disclosed to us, of the companies that we acquire;
· Acquisitions may disrupt our ongoing business and dilute our ownership interest;
· Acquisitions may result in litigation from former employees or third parties; and
· Due diligence may fail to identify significant issues with product quality, product architecture, ownership rights and legal contingencies, among other matters.
In addition, negotiation of potential acquisitions and the resulting integration of acquired businesses, products, or technologies, could divert management’s time and resources. Future acquisitions could cause us to issue dilutive equity or incur debt, contingent liabilities, additional amortization charges from intangible assets, asset impairment charges, or write-off charges for in-process research and development and other indefinite-lived intangible assets that could adversely affect our business, financial condition, results of operations and cash flows.
Failure to implement technological advancements could make our services less competitive.
Technologies that our clients or competitors already possess, or may in the future develop or acquire, may decrease the cost or increase the efficiency of competing services. We believe that to remain competitive, we must continue to invest in technology to be able to compete for new business and maintain service levels for clients. We may not be able to develop and market any new services that use, or effectively compete with, existing or future technologies, and such services may not be commercially successful. Furthermore, our competitors may have greater resources to devote to research and development than we do, and accordingly may have the ability to develop and market new technologies, with which we are unable to successfully compete.
Our markets are highly competitive. If we do not compete effectively, we may lose our existing business or fail to gain new business.
The markets in which we operate are highly competitive, and we expect competition to persist and intensify in the future. We view in-house operations of our existing and potential clients to be a significant competitive threat. Many of our clients or potential clients have in-house capabilities, enabling them to perform some or all of the services that we provide. Our performance and growth could be impeded if clients, or potential clients, decide to shift in-house, operations services currently outsourced, or if potential clients retain or increase their in-house capabilities.
We anticipate that competition from low-cost, offshore providers of outsourced services will continue to increase in the future and that such providers will remain an important competitive threat. A number of our competitors have, or may develop, greater name recognition or financial and other resources than we have. In addition, new competitors with greater name recognition and resources may decide to enter the markets in which we operate. Some competitors may offer a broader range of services than we do, which may result in clients and potential clients consolidating their use of outsourced services with larger competitors, rather than using our services. Competitive pressure from current or future competitors could also result in substantial price erosion, as discussed below, which could adversely affect our revenue, margins, and financial condition.
Our operations in Canada, the Philippines and Costa Rica subject us to the risk of currency exchange fluctuations.
Because we conduct a material portion of our business in Canada, we are exposed to market risk from changes in the value of the Canadian dollar. For the smaller portion of our business that we conduct in the Philippines and will be conducting in Costa Rica, we are exposed to market risk from changes in the value of the Philippine peso and Costa Rican colon. Material fluctuations in exchange rates impact our results through translation and consolidation of the financial results of our foreign operations, and therefore may negatively impact our results of operations and financial condition. We have contracts wherein the revenue we earn is denominated in U.S. dollars, but the costs we incur to fulfill our obligations under those contracts are denominated in Canadian dollars and Philippine pesos, and in the future, Costa Rican colons. Therefore, the fluctuations in the U.S. dollar to the Canadian dollar, Philippine peso or Costa Rican colon exchange rates can cause significant fluctuations in our results of operations. During the years ended December 31, 2009 and 2008, we engaged in hedging activities relating to our exposure to such fluctuations in the value of the Canadian dollar versus the U.S. dollar. During 2009 and 2008, we did not enter into hedging agreements for the Philippine peso or Costa Rican colon. We may participate in hedging activities in the future relating to the Canadian dollar, Philippine peso and Costa Rican colon. However, currency hedges do not, and will not, eliminate our exposure to fluctuations in the currencies. In the past few years, there have been large fluctuations in the value of the U.S. dollar against the value of the Canadian dollar. If the U.S. dollar weakens against the value of the Canadian dollar, it would increase our costs and adversely affect our results from operations. Likewise, increases in the value of the Philippine peso or Costa Rican colon, or currencies in other foreign markets in which we may operate, in relation to the value of the U.S. dollar, would further increase our costs and adversely affect our results of operations.
We face risks inherent in conducting business outside of North America.
Our operations in Canada accounted for 26.4%, 33.4% and 39.2%, of our revenue in 2009, 2008, and 2007, respectively. Our operations in the Philippines accounted for 4.1%, 0.2% and 0% of our revenue in 2009, 2008 and 2007, respectively. We have also signed a lease on a new facility in Costa Rica which we expect to open in the first quarter of 2010, and for another facility in the Philippines which we expect to open in the second quarter of 2010. An important component of our growth strategy is continued international expansion. There are risks inherent in conducting business internationally, including but not limited to:
· Competition from local businesses or established multinational companies, who may have firmly established operations in particular foreign markets. This may give these firms an advantage regarding labor and material costs;
· Significant changes in U.S. government programs, policies and regulatory requirements with respect to foreign operations or multinational companies;
· Potentially adverse U.S. or foreign tax consequences with respect to foreign operations;
· Potentially longer working capital cycles;
· Unexpected changes in foreign government programs or policies;
· Regulatory requirements and labor laws;
· Difficulties in staffing and effectively managing foreign operations;
· Political and social instability; and
· Reluctance of our current or potential new clients to have us provide services to them from a location outside of North America.
One or more of these factors may have an impact on our international operations. Our lack of significant international operating experience may result in any of these factors impacting us to a greater degree than they impact our competitors. To the extent one or more of these factors impact our international operations it could adversely affect our business, results of operations, growth prospects, and financial condition as a whole.
Various other risk factors described in this Annual Report on Form 10-K may be exacerbated with regard to international operations, especially in countries where we do not have well-established operations. Such risks include those related to the need to retain key management personnel, the inability to hire and retain qualified employees, increases in operating costs, facility capacity utilization, management of growth and costs related to growth, geopolitical military conditions, interruptions to our business, and the quality and cost of telephone and data services infrastructure.
Our lack of a significant international presence outside of North America may adversely affect our ability to serve existing customers or limit our ability to obtain new customers.
Although we currently conduct operations in Canada and the Philippines and will begin operations in Costa Rica, we do not have a significant international presence. Our lack of significant international operations outside of North America could adversely affect our business if one or more of our customers decide to move their existing business process outsourcing services offshore. Our lack of a significant international presence outside of North America may also limit our ability to gain new clients who may require business process service providers to have this flexibility.
The movement of business process outsourcing services to other countries has been extensively reported in the press. Most analysts continue to believe that many outsourced services will continue to migrate to other countries with lower wages than those prevailing in the U.S. Accordingly, unless and until we continue to develop significant international operations outside of North America, we may be competitively disadvantaged compared to a number of our competitors who have already devoted significant time and money to establishing extensive offshore operations.
If we decide to open facilities in, or otherwise expand into, additional countries, we may not be able to successfully establish operations in the markets that we target. There are certain risks inherent in conducting business in other countries including, but not limited to, exposure to currency fluctuations, difficulties in complying with foreign laws, unexpected changes in government programs, policies, regulatory requirements and labor laws, difficulties in staffing and managing foreign operations, political instability, and potentially adverse tax consequences. There can be no assurance that one or more of such factors will not have a material adverse effect on our business, growth prospects, results of operations, and financial condition.
Our largest stockholder has the ability to significantly influence corporate actions.
A. Emmet Stephenson, Jr., one of our co-founders, owned approximately 19.6% of our outstanding common stock as of February 12, 2010. Mr. Stephenson’s spouse also owns shares of our common stock. Under an agreement we have entered into with Mr. Stephenson, so long as Mr. Stephenson, together with members of his family, beneficially owns 10% or more but less than 30% of our outstanding common stock, Mr. Stephenson will be entitled to designate one of our nominees for election to the board. In addition, our bylaws allow that any holder of 10% or more of our outstanding common stock may call a special meeting of our stockholders. The concentration of voting power in Mr. Stephenson’s hands, and the control Mr. Stephenson may exercise over us as described above, may discourage, delay or prevent a change in control that might otherwise benefit our stockholders.
Our stock price has been volatile and may decline significantly and unexpectedly.
The market price of our common stock has been volatile, and could be subject to wide fluctuations, in response to quarterly variations in our operating results, changes in management, the degree of success in implementing our business and growth strategies, announcements of new contracts or contract cancellations, announcements of technological innovations or new products and services by us or our competitors, changes in financial estimates by securities analysts, the perception that significant stockholders may sell or intend to sell their shares, or other events or factors we cannot currently foresee. We are also subject to broad market fluctuations, given the overall volatility of the current U.S. and global economies, where the market prices of equity securities of many companies experience substantial price and volume fluctuations that have often been unrelated to the operating performance of such companies. These broad market fluctuations may adversely affect the market price of our common stock. Additionally, because our common stock trades at relatively low volume levels, any change in demand for our stock can be expected to substantially influence market prices thereof. The trading price of our stock varied from a low of $2.25 to a high of $9.88 during 2009.
If we experience an interruption to our business, our results of operations may suffer.
Our operations depend on our ability to protect our facilities, computer equipment, telecommunications equipment, software systems and clients’ products and confidential client information against damage from telecommunications interruption, power loss, fire, natural disaster, theft, unauthorized intrusion, computer viruses, internet interruption, e-commerce interruption, bomb threats, terrorist attacks and other emergencies. Our location in the Philippines is exposed to a higher risk of weather related interruptions (including typhoon, flood and hurricane) than our North American operations. We maintain procedures and contingency plans to minimize the detrimental impact of adverse events, but if such an event occurs, our procedures and plans may not be successful in protecting us from losses or interruptions. In the event we experience temporary or permanent interruptions or other emergencies at one or more of our facilities, our business could suffer and we may be required to pay contractual damages to our clients, or allow our clients to terminate or renegotiate their arrangements with us. Although we maintain property and business interruption insurance, such insurance may not adequately or timely compensate us for all losses we may incur. Further, our telecommunication systems and networks, and our ability to timely and consistently access and use telephone, internet, e-commerce, e-mail, facsimile connections, and other forms of communication, are substantially dependent upon telephone companies, internet service providers, and various telecommunication infrastructures. If such communications are interrupted on a short- or long-term basis, our services would be similarly interrupted and delayed.
Increases in the cost of telephone and data services or significant interruptions in such services could adversely affect our business.
We depend on telephone and data service provided by various local and long distance telephone companies. Because of this dependence, any change to the telecommunications market that would disrupt these services or limit our ability to obtain services at favorable rates could affect our business. We have taken steps to mitigate our exposure to the risks associated with rate fluctuations and service disruption by entering into long-term contracts with various providers for telephone and data services and investing in redundant circuits. There is no obligation, however, for the vendors to renew their contracts with us, or to offer the same or lower rates in the future, and such contracts are subject to termination or modification for various reasons outside of our control. In addition, there is no assurance that a redundant circuit would not also be disrupted. A significant increase in the cost of telephone services that is not recoverable through an increase in the price of our services, or any significant interruption in telephone services, could adversely affect our business.
Compliance with SEC rules requiring that we and our independent auditors assess the effectiveness of our internal controls over financial reporting may have adverse consequences.
Section 404 of the Sarbanes-Oxley Act of 2002 (“Section 404”) requires our management, on an annual basis, to assess the effectiveness of our internal control over financial reporting. We have completed the process of documenting and testing our internal control over financial reporting in order to satisfy the requirements of Section 404, and the reports of our management and our independent auditors relating to our internal control over financial reporting are included elsewhere in this Form 10-K. We constantly test and improve our controls as we identify certain deficiencies that we believe require remediation, and this requires additional management time and other resources. If we incur significant expense relating to future compliance with Section 404, our operating results will be adversely impacted.
In addition, as our business develops and grows, we will be required to adapt our internal control systems and procedures to conform to our current business, and we will continue to work to improve our controls and procedures and to educate our employees in an effort to maintain an effective internal control environment. However, if internal control deficiencies arise in the future, we may not be able to remediate such deficiencies in a timely manner. As a consequence, we may have to disclose in future filings with the SEC any
material weaknesses in internal controls over our financial reporting system. Disclosures of this type could cause investors to lose confidence in our financial reporting, and may negatively affect our stock price. Moreover, effective internal controls are necessary to produce reliable financial reports and to prevent fraud. If we have deficiencies in our internal controls over financial reporting, it may negatively impact our business and operations.
Our quarterly operating results have historically varied, and may not be a good indicator of future performance.
We have experienced, and expect to continue to experience, quarterly variations in revenue and operating results, as a result of a variety of factors, many of which are outside our control. These factors include, changes in the amount and growth rate of revenue generated from our principal clients; the timing of receipt of payments from our clients; the timing of existing and future client product launches or service offerings; unanticipated volume fluctuations; expiration or termination of client projects; timing and amount of costs incurred to expand capacity in order to provide for further revenue growth from existing and future clients; and the seasonal nature of some clients’ businesses.
If the value of our portfolio of investment securities declines, our results of operations will suffer.
Approximately 0.3%, 5.7% and 10.5%, of our total assets as of December 31, 2009, 2008 and 2007, respectively, consisted of investment securities. During 2009, we made investments in corporate debt. We periodically review investments available for sale for other-than-temporary declines in fair value. We recorded no other-than-temporary impairments on our investments during 2009. During the year ended December 31, 2008, we recognized a loss totaling $0.5 million (representing the entire basis amount) on a Lehman Brothers corporate debt security that was determined to be other-than-temporarily impaired due to their bankruptcy announcement. Future adverse changes in market conditions, or poor operating results of companies in which we have invested, could result in losses.
ITEM 1B. UNRESOLVED STAFF COMMENTS
None.
ITEM 2. PROPERTIES
As of December 31, 2009, we owned or leased the following facilities, containing in the aggregate approximately 1.1 million square feet:
|
Properties |
|
Year Opened |
|
Approximate |
|
Leased or Owned |
|
U.S. Facilities |
|
|
|
|
|
|
|
Greeley, Colorado |
|
1998 |
|
35,000 |
|
Company Owned |
|
Laramie, Wyoming |
|
1998 |
|
22,000 |
|
Company Owned (d) |
|
Grand Junction, Colorado |
|
1999 |
|
46,350 |
|
Leased |
|
Greeley, Colorado |
|
1999 |
|
88,000 |
|
Company Owned |
|
Enid, Oklahoma |
|
2000 |
|
47,500 |
|
Company Owned |
|
Grand Junction, Colorado |
|
2000 |
|
54,500 |
|
Leased |
|
Decatur, Illinois |
|
2003 |
|
37,500 |
|
Leased |
|
Alexandria, Louisiana |
|
2003 |
|
40,000 |
|
Leased |
|
Lynchburg, Virginia |
|
2004 |
|
38,600 |
|
Leased |
|
Collinsville, Virginia |
|
2004 |
|
49,250 |
|
Leased |
|
Denver, Colorado |
|
2004 |
|
23,000 |
|
Leased (a) |
|
Victoria, Texas |
|
2008 |
|
54,100 |
|
Leased (e) |
|
Mansfield, Ohio |
|
2008 |
|
31,000 |
|
Leased |
|
Jonesboro, Arkansas |
|
2008 |
|
65,400 |
|
Leased |
|
Canadian Facilities |
|
|
|
|
|
|
|
Kingston, Ontario |
|
2001 |
|
49,000 |
|
Company Owned |
|
Kingston, Ontario |
|
2001 |
|
20,000 |
|
Leased |
|
Cornwall, Ontario |
|
2001 |
|
73,800 |
|
Leased |
|
Regina, Saskatchewan |
|
2003 |
|
62,000 |
|
Leased (c) |
|
Sarnia, Ontario |
|
2003 |
|
37,200 |
|
Leased |
|
Thunder Bay, Ontario |
|
2006 |
|
33,000 |
|
Leased (f) |
|
Hawkesbury, Ontario |
|
2006 |
|
41,000 |
|
Leased (b) |
|
Philippine Facilities |
|
|
|
|
|
|
|
Makati City, Philippines |
|
2008 |
|
78,000 |
|
Leased |
|
Costa Rica Facility |
|
|
|
|
|
|
|
Heredia, Costa Rica |
|
2009 |
|
37,000 |
|
Leased |
(a) Company headquarters, which houses executive and administrative employees.
(b) Our Hawkesbury, Ontario facility ceased operations in August 2007.
(c) Our Regina, Saskatchewan facility ceased operations in February 2009.
(d) Our Laramie, Wyoming facility ceased operations in January 2010.
(e) Our Victoria, Texas facility ceased operations in January 2010.
(f) Our Thunder Bay, Ontario facility is expected to cease operations in March 2010.
Substantially all of our facility space can be used to support any of our business process outsourced services. We believe our existing facilities are adequate for our current operations. We intend to maintain efficient levels of excess capacity to enable us to readily provide for needs of new clients and increasing needs of existing clients. We hold unencumbered, fee simple title to our company-owned facilities.
ITEM 3. LEGAL PROCEEDINGS
We and six of our former directors and officers were named as defendants in West Palm Beach Firefighters’ Pension Fund v. StarTek, Inc., Civil Action No. 05-cv-01265-WDM-MEH (the “Litigation”). The consolidated action was a purported class action brought on behalf of all persons (except defendants) who purchased shares of our common stock in a secondary offering by certain of our stockholders in June 2004, and in the open market between February 26, 2003 and May 5, 2005 (the “Class Period”). The consolidated complaint alleged that the defendants made false and misleading public statements about us and our business and prospects in the prospectus for the secondary offering, as well as in filings with the SEC and in press releases issued during the Class Period, and that as a result, the market price of our common stock was artificially inflated. The complaints alleged claims under Sections 11 and 15 of the Securities Act of 1933 and under Sections 10(b) and 20(a) of the Securities Exchange Act of 1934. The
plaintiffs in both cases sought compensatory damages on behalf of the alleged class and award of attorneys’ fees and costs of litigation.
On July 20, 2009, we executed a Stipulation of Settlement (“Stipulation”) with lead plaintiffs to settle the Litigation. Under the terms of the Stipulation, defendants agreed to $7.5 million to completely resolve the Litigation, in exchange for a release of all claims by lead plaintiffs and class members and a dismissal of the Litigation with prejudice. Our primary insurance carrier contributed $6.9 million and we contributed $0.6 million to the Settlement Fund (as defined in the Stipulation). The United States District Court for the District of Colorado (the “Court”) granted preliminary approval for the settlement on October 8, 2009. The final hearing was held on December 17, 2009, at which time the Stipulation received final approval by the Court. Our portion of the settlement due, or $0.6 million, was recorded in our Consolidated Statement of Operations during the year ended December 31, 2009.
We have been involved from time to time in other litigation arising in the normal course of business, none of which is expected by management to have a material adverse effect on our business, financial condition or results of operations.
ITEM 4. SUBMISSION OF MATTERS TO A VOTE OF SECURITY HOLDERS
No matters were submitted to a vote of security holders during the fourth quarter of 2009.
Part II
ITEM 5. MARKET FOR THE REGISTRANT’S COMMON STOCK, RELATED STOCKHOLDER MATTERS AND ISSUER PURCHASES OF EQUITY SECURITIES
MARKET FOR COMMON STOCK
Our common stock has been listed on the New York Stock Exchange under the symbol “SRT” since the effective date of our initial public offering on June 19, 1997. The following table shows the high and low closing sales prices for our common stock on the New York Stock Exchange for the periods shown:
|
|
|
High |
|
Low |
|
||
|
2009 |
|
|
|
|
|
||
|
First Quarter |
|
$ |
4.78 |
|
$ |
2.25 |
|
|
Second Quarter |
|
$ |
8.60 |
|
$ |
3.15 |
|
|
Third Quarter |
|
$ |
9.88 |
|
$ |
6.87 |
|
|
Fourth Quarter |
|
$ |
8.34 |
|
$ |
5.76 |
|
|
2008 |
|
|
|
|
|
||
|
First Quarter |
|
$ |
9.43 |
|
$ |
8.03 |
|
|
Second Quarter |
|
$ |
9.68 |
|
$ |
8.10 |
|
|
Third Quarter |
|
$ |
9.47 |
|
$ |
6.23 |
|
|
Fourth Quarter |
|
$ |
6.90 |
|
$ |
2.05 |
|
HOLDERS OF COMMON STOCK
As of February 12, 2010, there were 51 stockholders of record and 14,882,990 shares of common stock outstanding. See Item 1A. “Risk Factors,” set forth in this Form 10-K for a discussion of risks related to control that may be exercised over us by our principal stockholders.
DIVIDEND POLICY
On January 22, 2007, our board of directors announced it would not declare a quarterly dividend on our common stock in the first quarter of 2007, and did not expect to declare dividends in the near future, making the dividend paid in November 2006 the last quarterly dividend that will be paid in the foreseeable future. We plan to invest in growth initiatives in lieu of paying dividends. We had been paying quarterly dividends since August of 2003.
STOCK REPURCHASE PROGRAM
Effective November 4, 2004, our board of directors authorized repurchases of up to $25 million of our common stock. The repurchase program will remain in effect until terminated by the board of directors, and will allow us to repurchase shares of our
common stock from time to time on the open market, in block trades and in privately-negotiated transactions. Repurchases will be implemented by the Chief Financial Officer consistent with the guidelines adopted by the board of directors, and will depend on market conditions and other factors. Any repurchased shares will be held as treasury stock, and will be available for general corporate purposes. Any repurchases will be made in accordance with SEC rules. As of the date of this filing, no shares have been repurchased under this program.
STOCK PERFORMANCE GRAPH
The graph below compares the cumulative total stockholder return on our common stock over the past five years with the cumulative total return of the New York Stock Exchange Composite Index (“NYSE Composite”) and of the Russell 2000 Index (“Russell 2000”) over the same period. We do not believe stock price performance shown on the graph is necessarily indicative of future price performance.
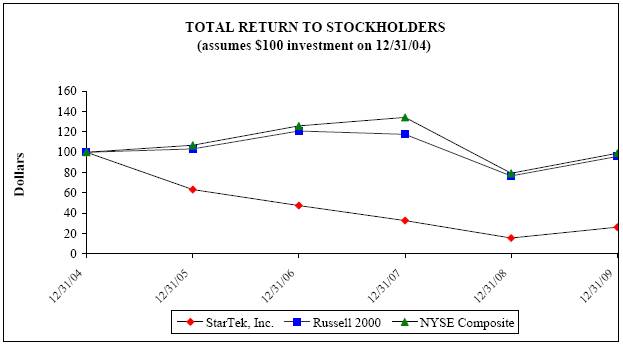
The information set forth under the heading “Stock Performance Graph” is not deemed to be “soliciting material” or to be “filed” with the SEC or subject to the SEC’s proxy rules or to the liabilities of Section 18 of the Exchange Act, and the graph shall not be deemed to be incorporated by reference into any of our prior or subsequent filings under the Securities Act or the Exchange Act.
ITEM 6. SELECTED FINANCIAL DATA
The following selected financial data should be read in conjunction with the Consolidated Financial Statements and Notes thereto which are included in Item 8. “Financial Statements and Supplementary Financial Data,” of this Form 10-K. Additionally, the following selected financial data should be read in conjunction with “Management’s Discussion and Analysis of Financial Condition and Results of Operations,” which is included in Item 7.
Due to the February 2009 sale of our subsidiary, Domain.com and the 2005 sale of our supply chain management services platform, the results of operations related to these lines of business have been reported as discontinued operations for all periods presented below.
|
|
|
Year Ended December 31, |
|
|||||||||||||
|
|
|
2009 |
|
2008 |
|
2007 |
|
2006 |
|
2005 |
|
|||||
|
|
|
(In thousands, except per share data) |
|
|||||||||||||
|
Consolidated Statement of Operations Data: |
|
|
|
|
|
|
|
|
|
|
|
|||||
|
Revenue |
|
$ |
288,980 |
|
$ |
272,338 |
|
$ |
244,615 |
|
$ |
237,115 |
|
$ |
215,973 |
|
|
Cost of services |
|
239,879 |
|
238,346 |
|
205,920 |
|
201,310 |
|
167,143 |
|
|||||
|
Gross profit |
|
49,101 |
|
33,992 |
|
38,695 |
|
35,805 |
|
48,830 |
|
|||||
|
Selling, general and administrative expenses |
|
43,196 |
|
40,814 |
|
38,991 |
|
30,247 |
|
28,435 |
|
|||||
|
Impairment losses and restructuring charges |
|
6,437 |
|
9,225 |
|
4,325 |
|
— |
|
— |
|
|||||
|
Operating (loss) income |
|
(532 |
) |
(16,047 |
) |
(4,621 |
) |
5,558 |
|
20,395 |
|
|||||
|
Net interest and other (expense) income |
|
(210 |
) |
55 |
|
745 |
|
2,126 |
|
1,479 |
|
|||||
|
(Loss) income from continuing operations before income taxes |
|
(742 |
) |
(15,992 |
) |
(3,876 |
) |
7,684 |
|
21,874 |
|
|||||
|
Income tax (benefit) expense |
|
(751 |
) |
(6,301 |
) |
(719 |
) |
2,159 |
|
8,058 |
|
|||||
|
Income (loss) from continuing operations |
|
9 |
|
(9,691 |
) |
(3,157 |
) |
5,525 |
|
13,816 |
|
|||||
|
Income (loss) from discontinued operations, net of tax |
|
4,640 |
|
(210 |
) |
326 |
|
239 |
|
(956 |
) |
|||||
|
Net income (loss) |
|
$ |
4,649 |
|
$ |
(9,901 |
) |
$ |
(2,831 |
) |
$ |
5,764 |
|
$ |
12,860 |
|
|
|
|
|
|
|
|
|
|
|
|
|
|
|||||
|
Net income (loss) per share from continuing operations: |
|
|
|
|
|
|
|
|
|
|
|
|||||
|
Basic |
|
$ |
0.00 |
|
$ |
(0.66 |
) |
$ |
(0.21 |
) |
$ |
0.38 |
|
$ |
0.94 |
|
|
Diluted |
|
$ |
0.00 |
|
$ |
(0.66 |
) |
$ |
(0.21 |
) |
$ |
0.38 |
|
$ |
0.94 |
|
|
|
|
|
|
|
|
|
|
|
|
|
|
|||||
|
Net income (loss) per share including discontinued operations: |
|
|
|
|
|
|
|
|
|
|
|
|||||
|
Basic |
|
$ |
0.31 |
|
$ |
(0.67 |
) |
$ |
(0.19 |
) |
$ |
0.39 |
|
$ |
0.88 |
|
|
Diluted |
|
$ |
0.31 |
|
$ |
(0.67 |
) |
$ |
(0.19 |
) |
$ |
0.39 |
|
$ |
0.88 |
|
|
|
|
|
|
|
|
|
|
|
|
|
|
|||||
|
Weighted average shares outstanding: |
|
|
|
|
|
|
|
|
|
|
|
|||||
|
Basic |
|
14,792 |
|
14,713 |
|
14,696 |
|
14,680 |
|
14,629 |
|
|||||
|
Diluted |
|
14,837 |
|
14,713 |
|
14,696 |
|
14,714 |
|
14,681 |
|
|||||
|
|
|
|
|
|
|
|
|
|
|
|
|
|||||
|
Balance Sheet Data: |
|
|
|
|
|
|
|
|
|
|
|
|||||
|
Total assets |
|
$ |
149,068 |
|
$ |
146,864 |
|
$ |
155,458 |
|
$ |
155,735 |
|
$ |
153,914 |
|
|
Total debt |
|
$ |
— |
|
$ |
6,494 |
|
$ |
11,355 |
|
$ |
15,968 |
|
$ |
5,650 |
|
|
Total stockholders’ equity |
|
$ |
116,716 |
|
$ |
107,019 |
|
$ |
118,214 |
|
$ |
118,382 |
|
$ |
128,164 |
|
|
|
|
|
|
|
|
|
|
|
|
|
|
|||||
|
Other Selected Financial Data: |
|
|
|
|
|
|
|
|
|
|
|
|||||
|
Capital expenditures, net of proceeds |
|
$ |
14,683 |
|
$ |
27,979 |
|
$ |
15,207 |
|
$ |
19,767 |
|
$ |
9,379 |
|
|
Depreciation |
|
$ |
15,977 |
|
$ |
17,803 |
|
$ |
17,092 |
|
$ |
16,758 |
|
$ |
13,364 |
|
|
Cash dividends declared per common share |
|
$ |
— |
|
$ |
— |
|
$ |
— |
|
$ |
1.11 |
|
$ |
1.50 |
|
ITEM 7. MANAGEMENT’S DISCUSSION AND ANALYSIS OF FINANCIAL CONDITION AND RESULTS OF OPERATIONS
The following discussion and analysis of the results of operations and financial condition should be read in conjunction with the accompanying Consolidated Financial Statements included elsewhere in this annual report.
OVERVIEW
StarTek is a provider of business process outsourcing services. We partner with our clients to meet their business objectives and improve customer retention, increase revenues and reduce costs through an improved customer experience. Our solutions leverage industry knowledge, best business practices, skilled agents, proven operational excellence and
flexible technology. The StarTek comprehensive service suite includes customer care, sales support, complex order processing, accounts receivable management, technical and product support and other industry-specific processes. We operate our business within three reportable segments, based on the geographic regions in which our services are rendered: (1) the U.S., (2) Canada and (3) Offshore. As of December 31, 2009, our U.S. segment included the operations of our thirteen facilities in the U.S.; our Canada segment included the operations of our five facilities in Canada; and our Offshore segment included the operations of our facility in Makati City, Philippines. As of December 31, 2008, there were thirteen, six and one operating centers in the U.S., Canada, and Offshore, respectively. We use gross profit as our measure of profit and loss for each business segment and do not allocate selling, general and administrative expenses to our business segments.
We endeavor to achieve site optimization at all of our operating facilities by routinely evaluating site performance. If local economic conditions, prevailing wage rates, or other factors negatively impact the long-term financial viability of a facility, management will from time to time make the decision to close a facility. As a result, we may incur impairment losses or restructuring charges in connection with the closure. Likewise, management is continually in pursuit of opportunities to open new facilities in economically viable geographic markets in order to improve profitability and grow the business.
We invoice our clients monthly in arrears and recognize revenue for such services when completed. Substantially all of our contractual arrangements are based either on a production rate, meaning that we recognize revenue based on the billable hours or minutes of each call center agent, or on a rate per transaction basis. These rates could be based on the number of paid hours the agent works, the number of minutes the agent is available to answer calls, or the number of minutes the agent is actually handling calls for the client, depending on the client contract. Production rates vary by client contract and can fluctuate based on our performance against certain pre-determined criteria related to quality and performance.
Overall economic conditions have impacted the telecommunications industry and our clients, as the growth in wireless subscribers appears to be slowing. In addition, the telecommunications space continues to shift away from traditional “wireline”, or land telephone services, to wireless as many consumers disconnect their home telephone lines in place of using wireless devices. These industry trends could adversely impact our financial results in 2010; however, we have also observed that our customers are increasingly shifting away from in-house call centers and toward outsourced providers as a means of cutting costs. This trend could positively impact our business in 2010. Our strategy includes expanding into other vertical markets, including healthcare, insurance and technology, to diversify our client base and reduce our exposure to the telecommunications industry. Finally, we have seen a shift toward offshore services as another avenue to cut costs. In response to this trend, part of our strategy involves expanding our offshore platform, as described in Item 1. “Business”.
SIGNIFICANT DEVELOPMENTS DURING THE YEAR ENDED DECEMBER 31, 2009
New Facilities
In July 2009, we entered into a lease agreement for the rental of a facility in Heredia, Costa Rica. The lease has an initial term of five years with a tenant option for an additional five years. The facility is approximately 37,000 square feet and we expect to open the facility for operations during the first quarter of 2010. Total lease commitments for the rental of this facility are approximately $4.5 million over the term of the lease.
Site Closures
In February 2009, we closed our facility in Regina, Saskatchewan. The closure of our Regina facility was driven by market conditions, namely recruiting challenges in this location, which impacted the profitability of the site. Management determined that it was in our long-term interest to close the location. This closure resulted in approximately $9.7 million less revenue during 2009, and increased gross profit by $0.9 million, compared to 2008 due to negative gross profit at this facility in 2008. We also incurred restructuring charges of approximately $4.4 million during the year ended December 31, 2009 related to the closure, which is discussed in further detail below.
In February 2009, we entered into an agreement with the landlord at our closed facility in Big Spring, Texas to buy-out the remaining lease obligation. We closed the facility in August 2008 and recorded restructuring costs associated with the remaining lease obligations at the facility. The original lease was due to expire in 2011. The buy-out was $0.2 million dollars, which was paid in February 2009. There was no material impact on our Consolidated Statements of Operations during the period related to the buy-out and we do not expect to incur any additional charges related to the Big Spring closure.
In August 2009, we entered into an agreement with the landlord at our closed facility in Petersburg, Virginia to buy-out the remaining lease obligation. We closed the facility in December 2008 and recorded restructuring costs associated with the remaining lease obligations at the facility. The original lease was due to expire in 2013. The buy-out was $0.8 million dollars, which was paid in August 2009. There was no material impact on our Consolidated Statements of Operations during the period related to the buy-out and we do not expect to incur any additional charges related to the Petersburg closure.
In October 2009, we entered into an agreement with the landlord at our closed facility in Hawkesbury, Ontario, Canada to buy-out the remaining lease obligation. We closed the facility in August 2007 and recorded restructuring costs associated with the remaining lease obligations at the facility. The original lease was due to expire in 2012. The buy-out was 1.1 million Canadian dollars, which was paid in October 2009. There was no material impact on our Consolidated Statements of Operations during the period related to the buy-out and we do not expect to incur any additional charges related to the Hawkesbury closure.
Other Events
On February 25, 2009, we entered into an agreement to sell the assets of Domain.com, our wholly owned subsidiary, to A. Emmet Stephenson, Jr., Inc. (“Mr. Stephenson”) in exchange for cash of $7.1 million. The assets of Domain.com consist of domain names, trademarks and corporation names. We conducted an auction for the assets and received bids from multiple parties, including Mr. Stephenson. Mr. Stephenson presented the highest bid, which represented the selling price, of $7.1 million and the sale was completed effective February 25, 2009. Mr. Stephenson is one of our co-founders, has managed the Domain.com subsidiary since 2006 and owns approximately 20% of our common shares outstanding. Because the transaction involves a related party, the Audit Committee of our Board of Directors considered and approved the transaction. The results of operations and cash flows of Domain.com have been reported as discontinued operations.
On July 20, 2009, we executed a Stipulation of Settlement with lead plaintiffs to settle a pending securities lawsuit. Refer to Item 3, “Legal Proceedings,” for further information on the lawsuit. Under the terms of the Stipulation, defendants paid $7.5 million to completely resolve the Litigation, in exchange for a release of all claims by lead plaintiffs and class members and a dismissal of the Litigation with prejudice. Our primary insurance carrier contributed $6.9 million and we contributed $0.6 million to the Settlement Fund (as defined in the Stipulation). The Court granted preliminary approval for the settlement on October 8, 2009. The final hearing was held on December 17, 2009, at which time the Stipulation received final approval by the Court. Our portion of the settlement due, or $0.6 million, was recorded in our Consolidated Statement of Operations during the year ended December 31, 2009.
SUBSEQUENT EVENTS
In January 2010, we entered into a lease agreement for the rental of a facility in Ortigas, Philippines. The lease has an initial term of five years with a tenant option for an additional five years. The facility is approximately 158,500 square feet and we expect to open the facility for operations during the second quarter of 2010. Total lease commitments for the rental of this facility are approximately $5.8 million over the initial term of the lease.
In January 2010, we closed our facilities in Laramie, Wyoming and Victoria, Texas. The facility in Laramie was closed because this work was transitioned either to StarTek’s @Home platform, whereby agents work from their homes, or our Greeley, Colorado facility. We closed our site in Victoria due to the loss of a client program, and we are currently evaluating the space to determine if we will utilize it for other programs or sublease to another tenant.
In January 2010, we announced the closure of our Thunder Bay, Ontario, Canada location which we expect to close in March 2010. The closure in Thunder Bay was driven by market conditions, namely recruiting challenges in this location, which negatively impacted the profitability of the location and management determined it was in our long-term interest to close the location. We recorded approximately $1.7 million in impairment losses during 2009 related to assets held at this facility because the carrying value of those assets was not recoverable.
RESULTS OF OPERATIONS — YEARS ENDED DECEMBER 31, 2009 AND DECEMBER 31, 2008
Due to the February 2009, sale of our subsidiary, Domain.com, the results of operations related to this line of business have been reported as discontinued operations for all periods presented below.
The following table presents selected items from our Consolidated Statements of Operations in thousands of dollars and as a percentage of revenue for the periods indicated:
|
|
|
Year Ended |
|
% of |
|
Year Ended |
|
% of |
|
% change |
|
||
|
Revenue |
|
$ |
288,980 |
|
100.0 |
% |
$ |
272,338 |
|
100.0 |
% |
6.1 |
% |
|
Cost of services |
|
239,879 |
|
83.0 |
% |
238,346 |
|
87.5 |
% |
0.6 |
% |
||
|
Gross profit |
|
49,101 |
|
17.0 |
% |
33,992 |
|
12.5 |
% |
44.4 |
% |
||
|
Selling, general and administrative expenses |
|
43,196 |
|
14.9 |
% |
40,814 |
|
15.0 |
% |
5.8 |
% |
||
|
Impairment losses and restructuring charges |
|
6,437 |
|
2.3 |
% |
9,225 |
|
3.4 |
% |
-30.2 |
% |
||
|
Operating loss |
|
(532 |
) |
-0.2 |
% |
(16,047 |
) |
-5.9 |
% |
NM |
|
||
|
Net interest and other (expense) income |
|
(210 |
) |
-0.1 |
% |
55 |
|
0.0 |
% |
NM |
|
||
|
Loss from continuing operations before income taxes |
|
(742 |
) |
-0.3 |
% |
(15,992 |
) |
-5.9 |
% |
NM |
|
||
|
Income tax benefit |
|
(751 |
) |
-0.3 |
% |
(6,301 |
) |
-2.3 |
% |
NM |
|
||
|
Income (loss) from continuing operations |
|
9 |
|
0.0 |
% |
(9,691 |
) |
-3.6 |
% |
NM |
|
||
|
Income (loss) from discontinued operations, net of tax |
|
4,640 |
|
1.6 |
% |
(210 |
) |
0.0 |
% |
NM |
|
||
|
Net income (loss) |
|
$ |
4,649 |
|
1.6 |
% |
$ |
(9,901 |
) |
-3.6 |
% |
NM |
|
The following table summarizes our revenues and gross profit for the periods indicated, by reporting segment:
|
|
|
For the Year Ended December 31, |
|
||||||||
|
|
|
2009 |
|
2008 |
|
||||||
|
|
|
(in 000s) |
|
(% of Total) |
|
(in 000s) |
|
(% of Total) |
|
||
|
United States: |
|
|
|
|
|
|
|
|
|
||
|
Revenue |
|
$ |
200,737 |
|
69.5 |
% |
$ |
180,761 |
|
66.4 |
% |
|
Cost of services |
|
164,472 |
|
68.6 |
% |
150,302 |
|
63.1 |
% |
||
|
Gross profit |
|
$ |
36,265 |
|
73.9 |
% |
$ |
30,459 |
|
89.6 |
% |
|
Gross profit % |
|
18.1 |
% |
|
|
16.9 |
% |
|
|
||
|
|
|
|
|
|
|
|
|
|
|
||
|
Canada: |
|
|
|
|
|
|
|
|
|
||
|
Revenue |
|
$ |
76,307 |
|
26.4 |
% |
$ |
90,929 |
|
33.4 |
% |
|
Cost of services |
|
64,397 |
|
26.8 |
% |
86,001 |
|
36.1 |
% |
||
|
Gross profit |
|
$ |
11,910 |
|
24.3 |
% |
$ |
4,928 |
|
14.5 |
% |
|
Gross profit % |
|
15.6 |
% |
|
|
5.4 |
% |
|
|
||
|
|
|
|
|
|
|
|
|
|
|
||
|
Offshore: |
|
|
|
|
|
|
|
|
|
||
|
Revenue |
|
$ |
11,936 |
|
4.1 |
% |
$ |
648 |
|
0.2 |
% |
|
Cost of services |
|
11,010 |
|
4.6 |
% |
2,043 |
|
0.8 |
% |
||
|
Gross profit |
|
$ |
926 |
|
1.8 |
% |
$ |
(1,395 |
) |
-4.1 |
% |
|
Gross profit % |
|
7.8 |
% |
|
|
-215.3 |
% |
|
|
||
Revenue
Revenue increased by $16.6 million, or 6.1%, from $272.3 million in 2008 to $289.0 million in 2009. The increase was driven by the U.S. and Offshore segments. Revenue in the U.S. segment increased by 11.1%, or $20.0 million, due in part to three sites that were opened in 2008 that contributed a full year of revenue in 2009, compared to only a portion of 2008. The incremental revenue in 2009 from these facilities was approximately $26.1 million. U.S. revenue also increased due to the full ramp of a site which transitioned to a different customer in 2009 and contributed approximately $4.6 million of additional revenue in 2009 compared to 2008. These increases to U.S. revenue were partially offset by 1) two U.S. site closures that occurred in 2008, and contributed revenue of $13.2 million that year and 2) a decrease of $1.7 million due to layoffs and hiring freezes in certain locations in order to address certain discrepancies in our hiring practices.
The remaining increase of $4.2 million at the other U.S. facilities was driven by an increase in the number of average full-time equivalent agents. Offshore revenue increased $11.3 million from $0.6 million to $11.9 million due to the ramp of our facility in Makati City, Philippines which opened in September 2008. Average full-time equivalent agents increased from 20 in 2008 to 391 in 2009 as new business in the facility was launched. Revenue from Canada decreased by $14.6 million, or 16.1%, due primarily to the closure of our Regina, Saskatchewan facility in February 2009, which had approximately $9.7 million less revenue during 2009 compared to 2008. In addition, revenue decreased by approximately $1.1 million due to changes in the foreign exchange rate between the U.S. dollar and Canadian dollar. The remainder of the decrease in the Canadian segment was due to a decrease in the number of average full-time equivalent agents.
Cost of Services and Gross Profit
Cost of services increased by $1.6 million, or 0.6%, from $238.3 million in 2008 to $239.9 million in 2009. Gross profit as a percentage of revenue increased from 12.5% in 2008 to 17.0% in 2009. The increase in gross profit was primarily due to better utilization in our U.S. and Offshore segments, and improvement in the U.S. dollar to Canadian dollar foreign exchange rates. Cost of services in the U.S. increased by approximately $14.2 million, or 9.4%, of which $5.8 million related to the three new sites, net of two closures, year over year as discussed above. Approximately $1.6 million of the increase in U.S. cost of services was due to the transition of some services from U.S. agents to Offshore agents. The remainder of the U.S. increase was due to the increase in other full-time equivalent agents, as described above. Cost of services increased by $9.0 million in 2009 compared to 2008 in the Offshore segment due to the ramp of our Makati site. These increases to cost of services were offset by lower cost of services in Canada, which decreased by approximately $21.6 million, or 25.1%. Of this decrease $10.6 million was due to the closure of the Regina location. Additionally, cost of services decreased by $6.4 million in 2009 compared to 2008 due to a stronger U.S. to Canadian dollar exchange rate. The remaining decrease in the Canadian segment was due to fewer agents, as described above.
Selling, General and Administrative Expenses
Selling, general and administrative expenses increased by $2.4 million, or 5.8%, from $40.8 million in 2008 to $43.2 million in 2009. As a percentage of revenue, selling, general and administrative expenses decreased slightly from 15.0% in 2008 to 14.9% in 2009. The increase in selling, general and administrative expenses was primarily due to $1.7 million greater payroll expense driven by higher salary, bonus and stock based compensation expense. The additional payroll expense was incurred primarily in the departments of information systems, business process improvement, and shared services, all considered strategic to support our scaling operations. In addition, we incurred legal expense of $0.6 million in connection with the settlement of the federal securities class action lawsuit, as well as a $0.5 million increase in hiring expense and $0.5 million in travel expense related primarily to the launch of new sites. These increases were partially offset by declines in depreciation expense of $0.6 million and training expense of $0.4 million.
Impairment Losses and Restructuring Charges
Impairment losses and restructuring charges totaled $6.4 million and $9.2 million for the years ended December 31, 2009 and 2008, respectively. We recorded approximately $1.7 million in impairment losses during 2009 in our Canadian segment due to the impairment of certain long-lived assets for which the carrying value of those assets is not recoverable. These assets are located in Thunder Bay, Ontario, a facility that we subsequently decided to close in January 2010. The long-lived assets include computer and telephone equipment, furniture and fixtures, leasehold improvements and software. We recorded $5.9 million in impairment losses in 2008 due to impairment of certain long-lived assets ($4.1 million in the U.S. segment and $1.8 million in the Canadian segment).
Restructuring charges totaled $4.7 million in 2009, related primarily to the February 2009 closure of our Regina, Saskatchewan facility. The costs relate primarily to the building lease costs through the remainder of the lease term, or July 2013. Accrued restructuring costs were valued using a discounted cash flow model and the cash flows consist of the future lease payment obligations required under the lease agreements and property taxes through the remainder of the lease term. We assumed that we could not sublease the vacant facilities for the remainder of the lease term. In the future, if we are able to sublease the facility, we may be required to record a gain in our Consolidated Statements of Operations. We recorded $3.3 million in restructuring charges in 2008 related to the closure of our Hawkesbury, Ontario facility in 2007, our Big Spring, Texas facility in August 2008, and our Petersburg, Virginia facility in December 2008 ($1.6 million related to the Canadian segment and $1.7 million related to the U.S. segment).
Operating Loss
We incurred operating losses of approximately $0.5 million and $16.0 million for the years ended December 31, 2009 and 2008, respectively. The decrease in the loss period over period was driven by the increase in revenue and fewer impairment losses and restructuring charges, offset by the increase in cost of services and selling, general and administrative expenses, as discussed previously.
Net Interest and Other (Expense) Income
Net interest and other expense was approximately $0.2 million in 2009, compared to net interest and other income of $0.1 million in 2008. The change was due primarily to a decrease in interest and investment income of approximately $1.1 million in 2009 compared to 2008 due to a decline in our investment balance period over period. This change was partially offset by $0.3 million less of interest expense due to the pay-off of certain notes payable in 2009 and $0.5 million in expense for other-than-temporary impairment on investments, which was recorded in 2008 and did not recur in 2009.
Income Tax Benefit
The effective rate for our tax benefit changed from 39.4% in 2008 to 101.2% in 2009. The primary reason for the change was the proportionately larger work opportunity credits in relation to our pre-tax loss in 2009. Included in our income tax benefit in 2009 was approximately $1.6 million of work opportunity credits, which increased from approximately $1.3 million in 2008, however, as a percentage of our pre-tax loss the effect was 142.6% on the effective rate in 2009 compared to 5.3% in 2008. Other factors in the rate included a decrease in the effect of state taxes, a decline in the Canadian statutory rate and a larger amount of operations in countries in which we have been granted tax holidays, primarily the Philippines.
Loss from Discontinued Operations, net of tax
Income from discontinued operations was approximately $4.6 million during 2009 and loss from discontinued operations was approximately $0.2 million in 2008. In February 2009, we sold Domain.com, a wholly owned subsidiary, for cash of approximately $7.1 million. We had a gain on the sale of approximately $6.9 million, less taxes of $2.3 million, resulting in the income of $4.6 million. The loss in 2008 was due to the write-off of an asset related to the sale of our supply chain management services platform in December 2005 of $0.5 million, partially offset by $0.3 million of income from discontinued operations related to Domian.com.
Net Income (Loss)
Net income was approximately $4.6 million in 2009 and net loss was approximately $9.9 million in 2008. The increase in net income was primarily due to higher revenue, income from discontinued operations and fewer impairment and restructuring charges, partially offset by higher cost of services and selling, general and administrative expenses and a decrease in the income tax benefit, as discussed previously.
RESULTS OF OPERATIONS — YEARS ENDED DECEMBER 31, 2008 AND DECEMBER 31, 2007
Due to the February 2009, sale of our subsidiary, Domain.com, the results of operations related to this line of business have been reported as discontinued operations for all periods presented below.
The following table presents selected items from our Consolidated Statements of Operations in thousands of dollars and as a percentage of revenue for the periods indicated:
|
|
|
Year Ended |
|
% of |
|
Year Ended |
|
% of |
|
% change |
|
||
|
Revenue |
|
$ |
272,338 |
|
100.0 |
% |
$ |
244,615 |
|
100.0 |
% |
11.3 |
% |
|
Cost of services |
|
238,346 |
|
87.5 |
% |
205,920 |
|
84.2 |
% |
15.7 |
% |
||
|
Gross profit |
|
33,992 |
|
12.5 |
% |
38,695 |
|
15.8 |
% |
-12.2 |
% |
||
|
Selling, general and administrative expenses |
|
40,814 |
|
15.0 |
% |
38,991 |
|
15.9 |
% |
4.7 |
% |
||
|
Impairment losses and restructuring charges |
|
9,225 |
|
3.4 |
% |
4,325 |
|
1.8 |
% |
113.3 |
% |
||
|
Operating loss |
|
(16,047 |
) |
-5.9 |
% |
(4,621 |
) |
-1.9 |
% |
NM |
|
||
|
Net interest and other income |
|
55 |
|
0.0 |
% |
745 |
|
0.3 |
% |
NM |
|
||
|
Loss from continuing operations before income taxes |
|
(15,992 |
) |
-5.9 |
% |
(3,876 |
) |
-1.6 |
% |
NM |
|
||
|
Income tax benefit |
|
(6,301 |
) |
-2.3 |
% |
(719 |
) |
-0.3 |
% |
NM |
|
||
|
Loss from continuing operations |
|
(9,691 |
) |
-3.6 |
% |
(3,157 |
) |
-1.3 |
% |
NM |
|
||
|
Loss (income) from discontinued operations, net of tax |
|
(210 |
) |
0.0 |
% |
326 |
|
0.1 |
% |
NM |
|
||
|
Net loss |
|
$ |
(9,901 |
) |
-3.6 |
% |
$ |
(2,831 |
) |
-1.2 |
% |
NM |
|
The following table summarizes our revenues and gross profit for the periods indicated, by reporting segment:
|
|
|
For the Year Ended December 31, |
|
||||||||
|
|
|
2008 |
|
2007 |
|
||||||
|
|
|
(in 000s) |
|
(% of Total) |
|
(in 000s) |
|
(% of Total) |
|
||
|
United States: |
|
|
|
|
|
|
|
|
|
||
|
Revenue |
|
$ |
180,761 |
|
66.4 |
% |
$ |
148,700 |
|
60.8 |
% |
|
Cost of services |
|
150,302 |
|
63.1 |
% |
115,820 |
|
56.2 |
% |
||
|
Gross profit |
|
$ |
30,459 |
|
89.6 |
% |
$ |
32,880 |
|
85.0 |
% |
|
Gross profit % |
|
16.9 |
% |
|
|
22.1 |
% |
|
|
||
|
|
|
|
|
|
|
|
|
|
|
||
|
Canada: |
|
|
|
|
|
|
|
|
|
||
|
Revenue |
|
$ |
90,929 |
|
33.4 |
% |
$ |
95,915 |
|
39.2 |
% |
|
Cost of services |
|
86,001 |
|
36.1 |
% |
90,100 |
|
43.8 |
% |
||
|
Gross profit |
|
$ |
4,928 |
|
14.5 |
% |
$ |
5,815 |
|
15.0 |
% |
|
Gross profit % |
|
5.4 |
% |
|
|
6.1 |
% |
|
|
||
|
|
|
|
|
|
|
|
|
|
|
||
|
Offshore: |
|
|
|
|
|
|
|
|
|
||
|
Revenue |
|
$ |
648 |
|
0.2 |
% |
$ |
— |
|
0.0 |
% |
|
Cost of services |
|
2,043 |
|
0.8 |
% |
— |
|
0.0 |
% |
||
|
Gross profit |
|
$ |
(1,395 |
) |
-4.1 |
% |
$ |
— |
|
0.0 |
% |
|
Gross profit % |
|
-215.3 |
% |
|
|
|
|
|
|
||
Revenue
Revenue increased by $27.7 million, or 11.3%, from $244.6 million in 2007 to $272.3 million in 2008. The increase was driven by the U.S. segment in which revenue increased by 21.6%, or $32.1 million, due to the opening of three new facilities during 2008. The Company opened facilities in Victoria, Texas in January 2008, Mansfield, Ohio in March 2008 and Jonesboro, Arkansas in July 2008. Revenue from these facilities during 2008 totaled approximately $31.7 million. Revenue also increased due to improved contract pricing, offset slightly by the closure of our Big Spring, Texas facility in August 2008, which resulted in a reduction in revenue of $4.6 million during 2008. Revenue in the Canada segment decreased by $5.0 million during 2008, of which $3.3 million was
attributable to lost revenue due to the closure of our Hawkesbury, Ontario site in August 2007. The Offshore segment generated $0.6 million in revenue during 2008 from the facility in Makati City, Philippines which opened in September 2008.
Cost of Services and Gross Profit
Cost of services increased by $32.4 million, from $205.9 million in 2007 to $238.3 million in 2008. Gross profit as a percentage of revenue decreased from 15.8% in 2007 to 12.5% in 2008. The decline in gross profit was primarily due to the launch and initial ramp of our new facilities and losses on foreign currency hedges. Cost of services in the U.S. segment increased by $34.5 million, from $115.8 million in 2007 to $150.3 million in 2008. Of this increase, approximately $30.0 million was related to the new facilities in Victoria, Mansfield and Jonesboro. Gross profit in Canada decreased by $0.9 million from $5.8 million in 2007 to $4.9 million in 2008. The decline was primarily due to lower utilization in Canada and a decline in our effective exchange rate, net of hedges. Our effective exchange rate (CAD to USD), net of hedges, decreased from 1.10 in 2007 to 1.01 in 2008. The Offshore segment contributed negative $1.4 million to gross profit during 2008 as the Makati City site was launched in September 2008 and continued to ramp through the remainder of 2008.
Selling, General and Administrative Expenses
Selling, general and administrative expenses increased by $1.8 million, or 4.7%, from $39.0 million in 2007 to $40.8 million in 2008. As a percentage of revenue, selling, general and administrative expenses were 15.9% in 2007 and 15.0% in 2008. The increase in selling, general and administrative expenses was due to investments in corporate personnel, human resource programs and technology in support of our long-term growth plans, as well as incremental SG&A costs associated with the new sites.
Impairment Losses and Restructuring Charges
Impairment losses and restructuring charges increased from $4.3 million in 2007 to $9.2 million in 2008. During 2008, we recognized impairment losses of $5.9 million. Approximately $1.8 million related to the Canada segment, which was comprised of $1.5 million and $0.3 million related to impairment of leasehold improvements, furniture and fixtures and equipment in connection with the closures of the Regina, Saskatchewan and Hawkesbury, Ontario facilities, respectively. Approximately $4.1 million of impairment losses related to the U.S. segment, which comprised of 1) $1.2 million related to the write-off of capitalized software costs for information technology infrastructure initiatives which management has decided to discontinue, 2) $1.1 million of leasehold improvements, furniture and fixtures and equipment in connection with the closure of our Big Spring, Texas facility, and 3) $1.8 million of leasehold improvements, furniture and fixtures and equipment in connection with the closure of our Petersburg, Virginia facility.
During 2008, we recognized restructuring charges of $3.3 million. The Canada segment recognized $1.6 million of restructuring charges relating to the closure of our Hawkesbury facility. Approximately $1.7 million related to the U.S. segment, of which $0.3 million and $1.4 million were related to the closures in Big Spring, Texas and Petersburg, Virginia, respectively.
During 2007, we incurred approximately $1.9 million in impairment losses and approximately $0.7 million in restructuring charges in our Canada segment due to the Hawkesbury closure. We recorded $1.7 million in impairment losses in the U.S. segment due to the write-off of capitalized software costs in which the projects were not completed and therefore, the carrying value was not recoverable.
Operating Loss
We incurred operating losses of approximately $16.0 million and $4.6 million for the years ended December 31, 2008 and 2007, respectively. The increase in the loss was driven by the decrease in gross margin, the increase in selling, general and administrative expenses, and the increase in impairment losses and restructuring charges, discussed previously.
Net Interest and Other Income
Net interest and other income was approximately $0.1 million and $0.7 million during the years ended December 31, 2008 and 2007, respectively. The primary reason for the change was the recognition of a loss of $0.5 million in 2008 on an investment in Lehman Brothers corporate debt securities that was determined to be other-than-temporarily impaired due to their bankruptcy announcement.
Income Tax Benefit
The effective tax rate increased from 18.6% in 2007 to 39.4% in 2008. The primary difference between the periods was the valuation allowance recorded in 2007 on capital loss carryforwards which management did not believe would be recognized before their expiration. This impact was offset by decreased work opportunity credits during 2008 compared to 2007 and the change in the Canadian statutory tax rate during 2008. Effective January 1, 2008, the general corporate income tax rate in Canada was reduced from
22.1% to 19.5% due in part to the elimination of the corporate surtax on large corporations of 1.12%. The impact was a reduction in our overall effective tax rate and a reduction of the value of certain deferred tax assets.
Loss from Discontinued Operations, net of tax
During the year ended December 31, 2008, we recorded a loss from discontinued operations, net of tax, of approximately $0.2 million compared to income from discontinued operations, net of tax, of approximately $0.3 million during 2007. The change was due to the write-off of an asset related to the sale of our supply chain management services platform in December 2005. The remainder of the income from discontinued operations, net of tax, during both periods was approximately $0.3 million in income related to Domain.com which was sold in February 2009.
Net Loss
We incurred net losses of approximately $9.9 million and $2.8 million for the years ended December 31, 2008 and 2007, respectively. The increase in the net loss was driven primarily by decreased gross margin, the increase in selling, general and administrative expenses, increased impairment losses and restructuring charges and loss from discontinued operations, partially offset by higher revenue and an income tax benefit, as discussed previously.
LIQUIDITY AND CAPITAL RESOURCES
As of December 31, 2009, working capital totaled $60.4 million and our current ratio was 3.42:1, compared to working capital of $47.6 million and a current ratio of 2.58:1 at December 31, 2008.
We have historically financed our operations, liquidity requirements, capital expenditures, and capacity expansion primarily through cash flows from operations, and to a lesser degree, through various forms of debt and leasing arrangements. In addition to funding basic operations, our primary uses of cash typically relate to capital expenditures to upgrade our existing information technologies and service offerings and investments in our facilities. We believe that cash flows from operations and cash provided by our line of credit will adequately meet our ongoing operating requirements. We did not draw on our line of credit during 2009; however, due to the timing of our collections of large billings with our major customers, we have historically needed to draw on our line of credit for ongoing operating activities.
We expect to be able to renew our existing line of credit or replace it with other financing arrangements when that line of credit expires on August 1, 2010. If we are unable to renew the line of credit or are unable to secure alternative sources of capital funding under satisfactory terms, or at all, we may be unable to meet cash needs required for growth opportunities. Any significant future expansion of our business may require us to secure additional cash resources. If we enter into an acquisition, it may require us to use our cash, draw on our line of credit or obtain additional financing, which could decrease cash available for operations. The current poor conditions of the U.S. credit markets may adversely impact our ability to obtain financing and could significantly impact our liquidity. A decrease in demand for our services, particularly from any of our principal clients, which could arise from a number of factors, including, but not limited to, competitive pressures, adverse trends in the business process outsourcing market, industry consolidation, adverse circumstances with respect to the industries we service, and any of the other factors we describe more fully in Item 1A. “Risk Factors” of this Form 10-K could adversely impact our liquidity.
(in thousands)
|
|
|
Year Ended December 31, |
|
|||||||
|
|
|
2009 |
|
2008 |
|
2007 |
|
|||
|
Net cash provided by (used in): |
|
|
|
|
|
|
|
|||
|
Operating activities |
|
$ |
15,654 |
|
$ |
11,616 |
|
$ |
20,647 |
|
|
Investing activities |
|
411 |
|
(20,621 |
) |
(25,672 |
) |
|||
|
Financing activities |
|
(6,849 |
) |
(3,722 |
) |
(5,828 |
) |
|||
|
Effect of foreign exchange rates on cash |
|
795 |
|
(719 |
) |
442 |
|
|||
|
Net increase (decrease) in cash and cash equivalents |
|
$ |
10,011 |
|
$ |
(13,446 |
) |
$ |
(10,411 |
) |
Our balance of cash and cash equivalents was $19.6 million at December 31, 2009, compared to a balance of $9.6 million at December 31, 2008.
CASH FLOWS — YEARS ENDED DECEMBER 31, 2009 AND DECEMBER 31, 2008
Operating Activities. Net cash provided by operating activities increased by $4.0 million from $11.6 million in 2008 to $15.7 million in 2009. Net cash provided by operating activities from continuing operations was $18.0 million in 2009, representing an increase of $6.2 million from 2008. The increase of $6.2 million in cash provided by operating activities from continuing operations was driven by the following increases: 1) $14.5 million in deferred income taxes, whereby the net deferred income tax asset declined by $7.0 million compared to an increase of $7.5 million in 2008 because of the utilization of net operating loss carry forwards, 2) $3.7 million higher income from continuing operations after impairment losses and depreciation expense (net income from continuing operations
improved by $9.7 million, partially offset by $6.0 million less impairment and depreciation expense) and 3) $2.8 million of higher collections of accounts receivable period over period due to the timing of collections of large billings. These increases to cash provided by operating activities from continuing operations were partially offset by the following decreases: 1) $7.3 million decrease in the change in accrued liabilities year-over-year resulting from a larger increase in 2008 from restructuring charges and accrued payroll, 2) $3.2 million in greater income tax receivable due to timing of tax payments and refunds, 3) $2.6 million greater increase in prepaids and other assets due primarily to an increase in maintenance contracts and 4) $1.7 million in a smaller change in accounts payable due to fewer capital expenditures in 2009.
Investing Activities. Net cash provided by investing activities was $0.4 million in 2009 compared to cash used in investing activities of $20.6 million in 2008. The increase was due to 1) a $13.3 million decrease in purchases of property, plant and equipment due to no new site openings in 2009 compared to the opening of four new sites in 2008, 2) proceeds from the sale of Domain.com of $7.1 million and 3) an increase in net proceeds from the sale of investments, net of purchases, of $0.6 million.
Financing Activities. Net cash used in financing activities increased by $3.1 million, from $3.7 million in 2008 to $6.8 million in 2009. The increase was due primarily to an increase in payments on long-term debt of $3.0 million resulting from the pay-off of our two equipment loans in the second quarter of 2009, partially offset by savings on principal payments since the pay-off of these loans.
CASH FLOWS — YEARS ENDED DECEMBER 31, 2008 AND DECEMBER 31, 2007
Operating Activities. Net cash provided by operating activities was $11.6 million in 2008, compared to $20.6 million in 2007. The decrease in cash provided by operating activities of approximately $9.0 million was primarily due to the larger net loss during the period which increased by $7.1 million. Cash from operating activities also decreased by $7.9 million due to the increase in deferred tax assets. Deferred tax assets increased primarily due to the net operating loss carry forwards generated during 2008 that did not exist in 2007. These decreases to cash provided by operating activities were offset by increases related to 1) $2.4 million larger impairment losses due to site closures in 2008 and 2) $3.2 million greater accrued liabilities, which was a result of higher accrued payroll at December 31, 2008 compared to December 31, 2007 because of the growth in our number of employees.
Investing Activities. Net cash used in investing activities was approximately $20.6 million in 2008, compared to $25.7 million in 2007. This represents a decrease of approximately $5.1 million, which was due to greater net proceeds from the sale of investments, partially offset by higher capital expenditures. During 2008, we had $7.4 million in proceeds from the sale of investments, net of purchases. During 2007, we had $10.5 million in purchases of investments, net of proceeds. This change was due to our focus on site expansion during 2008 which also resulted in capital expenditures increasing from $15.2 million in 2007 to $28.0 million in 2008. During 2008 we opened four new sites, compared to no site openings in 2007.
Financing Activities. Net cash used in financing activities was approximately $3.7 million in 2008, compared to $5.8 million in 2007. The decrease of $2.1 million was due to $2.0 million less in principal payments during 2008 compared to 2007. This was due in part to the maturity of our secured equipment loan with Wells Fargo Equipment Finance, Inc. whereby we made our final principal payment on February 28, 2008.
CONTRACTUAL OBLIGATIONS
Other than operating leases for certain equipment and real estate and commitments to purchase goods and services in the future, in each case as reflected in the table below, we have no off-balance sheet transactions, unconditional purchase obligations or similar instruments and we are not a guarantor of any other entities’ debt or other financial obligations. The following table presents a summary (in thousands), by period, of our future contractual obligations and payments as of December 31, 2009:
|
|
|
Within |
|
1 - 2 |
|
2 - 3 |
|
3 - 4 |
|
4 - 5 |
|
|
|
|
|
|||||||
|
|
|
1 Year |
|
Years |
|
Years |
|
Years |
|
Years |
|
Thereafter |
|
Total |
|
|||||||
|
Operating leases (1) |
|
$ |
7,527 |
|
$ |
6,453 |
|
$ |
4,707 |
|
$ |
3,782 |
|
$ |
3,500 |
|
$ |
6,508 |
|
$ |
32,477 |
|
|
Capital leases (2) |
|
146 |
|
87 |
|
95 |
|
18 |
|
7 |
|
— |
|
$ |
353 |
|
||||||
|
Purchase obligations (3) |
|
344 |
|
— |
|
— |
|
— |
|
— |
|
— |
|
$ |
344 |
|
||||||
|
Total contractual obligations |
|
$ |
8,017 |
|
$ |
6,540 |
|
$ |
4,802 |
|
$ |
3,800 |
|
$ |
3,507 |
|
$ |
6,508 |
|
$ |
33,174 |
|
(1) We lease facilities and equipment under various non-cancelable operating leases.
(2) We lease equipment under certain capital lease agreements.
(3) Purchase obligations include commitments to purchase goods and services that in some cases may include provisions for cancellation.
Line of Credit
On June 26, 2009, we entered into a business loan agreement, promissory note and three commercial security agreements (together the “Agreement”) with UMB Bank Colorado, N.A. (“UMB Bank”) for a $15 million secured revolving line of credit. The Agreement is effective July 1, 2009 through August 1, 2010. This Agreement replaced our $10 million secured revolving line of credit with Wells
Fargo Bank N.A., which expired by its terms on June 30, 2009. There was no balance outstanding on the line of credit with UMB Bank as of December 31, 2009.
Borrowings under the Agreement bear interest, at our option at the time of the borrowing, of the thirty, sixty or ninety day LIBOR index, plus 1.75%. The interest rate shall never be less than 3.25% per annum. Under the Agreement, we granted UMB Bank a security interest in all of our present and future accounts receivable, general intangibles, and owned real property. In addition, under the Agreement, we are subject to certain financial covenants, which include maintaining 1) a ratio of total liabilities to tangible net worth of less than 1.0 to 1.0, 2) a tangible net worth of at least $105 million, 3) unencumbered liquid assets, defined as cash, certificate of deposits and marketable securities, of at least $10 million measured on the last day of each fiscal quarter and 4) a cash flow coverage ratio, as defined in the Agreement, of greater than 1.50 to 1.0 measured on the last day of each fiscal quarter for the previous twelve months. As of December 31, 2009, we were in compliance with our debt covenants.
Other Events
During 2009, we paid the remaining principal balance on the Secured Equipment Promissory Note between Wells Fargo Equipment Finance, Inc. and StarTek USA, Inc., our wholly owned subsidiary, and the Canadian Dollar Secured Equipment Loan between Wells Fargo Equipment Finance Company, Inc. and StarTek Canada Services, Ltd., our wholly owned subsidiary. The loans had original maturity dates in November 2010. The total payoff on these loans, including pre-payment penalties, was approximately $5.7 million.
OTHER FACTORS IMPACTING LIQUIDITY
Effective November 4, 2004, our board of directors authorized purchases of up to $25 million of our common stock. The repurchase program will remain in effect until terminated by the board of directors and will allow us to repurchase shares of our common stock from time to time on the open market, in block trades and in privately-negotiated transactions. Repurchases will be implemented by the Chief Financial Officer consistent with the guidelines adopted by the board of directors from time to time and will depend on market conditions and other factors. Any repurchased shares will be made in accordance with SEC rules. We have not yet repurchased any shares pursuant to this board authorization.
Our business currently has a high concentration on a few principal clients. The loss of a principal client and/or changes in timing or termination of a principal client’s product launch or service offering would have a material adverse effect on our business, liquidity, operating results, and financial condition. These client relationships are further discussed in Item 1A. “Risk Factors” and in Note 5, “Principal Clients,” to our Consolidated Financial Statements, which are included at Item 8. “Financial Statements and Supplementary Financial Data,” of this Form 10-K. To limit our credit risk, management from time to time will perform credit evaluations of our clients. Although we are directly impacted by the economic conditions in which our clients operate, management does not believe substantial credit risk existed as of December 31, 2009.
As of December 31, 2009, we had approximately $0.5 million invested in corporate debt securities. There is a risk that if those companies in which we are invested suffer due to economic conditions or other reasons, we could realize losses on these investments which could impact our liquidity.
There is a risk that the counterparties to our hedging instruments could suffer financial difficulties due to economic conditions or other reasons and we could realize losses on these arrangements which could impact our liquidity. However, we do not believe we are exposed to more than a nominal amount of credit risk in our derivative hedging activities, as the counterparties are established, well-capitalized financial institutions.
Because we service relatively few, large clients, the availability of cash is highly dependent on the timing of cash receipts from accounts receivable. As a result, from time to time, we borrow cash from our line of credit to cover short-term cash needs. These borrowings are typically outstanding for a short period of time before they are repaid. However, our debt balance can fluctuate significantly during any given quarter as part of our ordinary course of business. Accordingly, our debt balance at the end of any given period is not necessarily indicative of the debt balance at any other time during that period.
Although management cannot accurately anticipate effects of domestic and foreign inflation on our operations, management does not believe inflation has had a material adverse effect on our results of operations or financial condition. However, there is a risk that inflation could occur in certain countries in which we operate which could have an adverse affect on our financial results. We engage in hedging activities which may reduce this risk; however, currency hedges do not, and will not, eliminate our exposure to foreign inflation.
VARIABILITY OF OPERATING RESULTS
Our business has been seasonal only to the extent that our clients’ marketing programs and product launches are geared toward the winter holiday buying season. We have experienced and expect to continue to experience some quarterly variations in revenue and
operating results due to a variety of factors, many of which are outside our control, including: (i) timing and amount of costs incurred to expand capacity in order to provide for volume growth from existing and future clients; (ii) changes in the volume of services provided to principal clients; (iii) expiration or termination of client projects or contracts; (iv) timing of existing and future client product launches or service offerings; (v) seasonal nature of certain clients’ businesses; and (vi) variability in demand for our services by our clients depending on demand for their products or services and/or depending on our performance.
CRITICAL ACCOUNTING POLICIES AND ESTIMATES
Our discussion and analysis of financial condition and results of operations are based upon our Consolidated Financial Statements, which have been prepared in accordance with U.S. generally accepted accounting principles. The preparation of our financial statements require us to make estimates that affect the reported amounts of assets, liabilities, revenues and expenses, and related disclosures of contingent assets and liabilities. We base our accounting estimates on historical experience and other factors that we believe to be reasonable under the circumstances. However, actual results may vary from these estimates due to factors beyond our control or due to changes in these assumptions or conditions. We have discussed the development and selection of critical accounting policies and estimates with our Audit Committee. The following is a summary of our critical accounting policies and estimates we make in preparing our Consolidated Financial Statements:
Revenue Recognition
We invoice our business process outsourcing services clients monthly in arrears and recognize revenue for such services when completed. For substantially all of our contractual arrangements for business process outsourcing services, we recognize revenue based either on the billable hours or minutes of each customer service representative, at rates provided in the client contract, or on a rate-per-transaction basis. The contractual rates can fluctuate based on our performance against certain pre-determined criteria related to quality and performance. Additionally, some clients are contractually entitled to penalties when we are out of compliance with certain quality and/or performance obligations defined in the client contract. Such penalties are recorded as a reduction to revenue as incurred, based on a measurement of the appropriate penalty under the terms of the client contract.
As a general rule, our contracts are not multiple element contracts. We provide initial training to customer service representatives upon commencement of new contracts and recognize revenues for such training as the services are provided based upon the production rate (i.e., billable hours and rates related to the training services as stipulated in our contractual arrangements). Accordingly, the corresponding training costs, consisting primarily of labor and related expenses, are recognized as incurred.
Fair Value of Financial Instruments
Fair value is the price that would be received from selling an asset or paid to transfer a liability in an orderly transaction between market participants at the measurement date. When determining the fair value measurements for assets and liabilities, which are required to be recorded at fair value, we consider the principal or most advantageous market in which we would transact and the market-based risk measurements or assumptions that market participants would use in pricing the asset or liability, such as inherent risk, transfer restrictions, and credit risk.
The fair value hierarchy prioritizes the inputs to valuation techniques used to measure fair value. The hierarchy gives the highest priority to unadjusted quoted prices in active markets for identical assets or liabilities (level 1 measurements) and the lowest priority to unobservable inputs (level 3 measurements). The levels of the fair value hierarchy are described below:
|
Level 1 |
|
Valuation is based upon quoted prices for identical instruments traded in active markets. |
|
|
|
|
|
Level 2 |
|
Valuation is based upon quoted prices for similar instruments in active markets, quoted prices for identical or similar instruments in markets that are not active, and model-based valuation techniques for which all significant assumptions are observable in the market. |
|
|
|
|
|
Level 3 |
|
Valuation is generated from model-based techniques that use significant assumptions not observable in the market. These unobservable assumptions reflect our own estimates of assumptions that market participants would use in pricing the asset or liability. Valuation techniques include use of option pricing models, discounted cash flow models and similar techniques. |
When determining the fair value measurements for assets and liabilities required or permitted to be recorded at and/or marked to fair value, we consider the principal or most advantageous market in which it would transact and consider assumptions that market participants would use when pricing the asset or liability. When possible, we look to active and observable markets to price identical assets or liabilities. When identical assets and liabilities are not traded in active markets, we look to market observable data for similar assets and liabilities. Nevertheless, if certain assets and liabilities are not actively traded in observable markets, we must use
alternative valuation techniques to derive a fair value measurement. Refer to Note 8, “Fair Value Measurements”, to our Consolidated Financial Statements, included in Item 8, “Financial Statements and Supplementary Financial Data.”
Impairment of Long-Lived Assets
We periodically, on at least an annual basis, evaluate potential impairments of our long-lived assets. In our annual evaluation or when we determine that the carrying value of a long-lived asset may not be recoverable, based upon the existence of one or more indicators of impairment, we evaluate the projected undiscounted cash flows related to the assets. If these cash flows are less than the carrying values of the assets, we measure the impairment based on the excess of the carrying value of the long-lived asset over the long-lived asset’s fair value. Our projections contain assumptions pertaining to anticipated levels of utilization and revenue that may or may not be under contract but are based on our experience and/or projections received from our customers. We recognized impairment losses of approximately $1.8 million, $5.9 million and $3.6 million during the years ended December 31, 2009, 2008 and 2007, respectively. The fair value of the long-lived assets after the impairment charge in 2009 was $0.2 million. For additional information, see Note 2, “Impairment Losses and Restructuring Charges,” to our Consolidated Financial Statements, included in Item 8. “Financial Statements and Supplementary Financial Data.”
Restructuring Charges
A liability for a cost associated with an exit or disposal activity is recognized when the liability is incurred, instead of upon commitment to an exit plan. On an ongoing basis, management assesses the profitability and utilization of our facilities and in some cases management has chosen to close facilities. A significant assumption used in determining the amount of the estimated liability for closing a facility is the estimated liability for future lease payments on vacant facilities, which we determine based on a third-party broker’s assessment of our ability to successfully negotiate early termination agreements with landlords and/or to sublease the facility. If the assumptions regarding early termination and the timing and amounts of sublease payments prove to be inaccurate, we may be required to record additional losses, or conversely, a future gain, in the Consolidated Statements of Operations and Comprehensive Income (Loss). In 2009, we entered into agreements with the respective landlords at three of our facilities (Big Spring, Texas, Petersburg, Virginia and Hawkesbury, Ontario) to buy-out the remaining lease obligations. There was no material impact on our Consolidated Statements of Operations during the period related to the buy-outs. We recognized restructuring charges of approximately $4.7 million, $3.3 million and $0.7 million during the years ended December 31, 2009, 2008 and 2007, respectively. In 2009, $4.4 million of the restructuring charges related to the closure of our Regina, Saskatchewan facility. These costs were valued using a discounted cash flow model. The cash flows consist of the future lease payment obligations required under the lease agreement. We assumed that we could not sublease the vacant facility for the remainder of the lease term based on our knowledge of the Regina marketplace, as well as our historical inability to sublease our facilities in other locations in which we operate. The future cash flows were discounted using a rate of 3%. For additional information, see Note 2, “Impairment Losses and Restructuring Charges,” to our Consolidated Financial Statements, included in Item 8. “Financial Statements and Supplementary Financial Data.”
Investments
Investments available for sale have historically consisted of debt securities reported at fair value. Under our investment policy, we may invest in certain U.S. Government and government-sponsored securities, repurchase agreements, investment grade corporate obligations, corporate debt securities, municipal securities, money market and mutual funds, subject to the terms of the policy. When the investments held in our portfolio as of December 31, 2009 mature, we intend to revise our investment policy such that we may invest in more conservative investments, including U.S. treasury securities, federal agency securities, repurchase agreements and money market funds. The Chief Financial Officer is responsible for oversight of the investment portfolio.
Investments are periodically evaluated for other-than-temporary impairment whenever the fair value falls below our cost basis and we either intend to sell the security or it is more likely than not we will be required to sell the security before it recovers. We then consider additional factors such as market conditions, the industry sectors in which the issuer of the investment operates, and the viability and prospects of each entity. Other-than-temporary declines in fair value are reflected on the statement of operations within Net Interest and Other Income. Original cost of investments available for sale is based on the specific identification method. Other-than-temporary impairments and interest income from investments available for sale are included in Net Interest and Other Income on our Consolidated Statements of Operations and Other Comprehensive Income (Loss). Investments available for sale are carried at fair market values. As of December 31, 2009 and 2008, we were not invested in any trading securities or held-to-maturity securities.
Derivative Instruments and Hedging Activities
We record derivative instruments (including certain derivative instruments embedded in other contracts) in the Consolidated Balance Sheet as either an asset or liability measured at its fair value, with changes in the fair value of qualifying hedges recorded in other comprehensive income. Changes in a derivative’s fair value are recognized currently in earnings unless specific hedge accounting criteria are met. Special accounting for qualifying hedges allows a derivative’s gains and losses to offset the related results of the
hedged item and requires that we must formally document, designate and assess the effectiveness of transactions that receive hedge accounting treatment.
We are generally able to apply cash flow hedge accounting which associates the results of the hedges with forecasted future expenses. The current mark-to-market gain or loss is recorded in accumulated other comprehensive income in the accompanying Consolidated Balance Sheets and will be re-classified to operations as the forecasted expenses are incurred, typically within one year. During 2009, 2008 and 2007, our cash flow hedges were highly effective and there were no amounts charged to the Consolidated Statements of Operations and Other Comprehensive (Loss) Income for hedge ineffectiveness. While we expect that our derivative instruments that have been designated as hedges will continue to meet the conditions for hedge accounting, if hedges do not qualify as highly effective or if we do not believe that forecasted transactions will occur, the changes in the fair value of the derivatives used as hedges will be reflected in earnings.
Income Taxes
We account for income taxes using the liability method. Deferred income taxes reflect net effects of temporary differences between carrying amounts of assets and liabilities for financial reporting purposes and amounts used for income tax purposes. We are subject to foreign income taxes on our foreign operations. We are required to estimate our income taxes in each jurisdiction in which we operate. This process involves estimating our actual current tax exposure, together with assessing temporary differences resulting from differing treatment of items for tax and financial reporting purposes. The tax effects of these temporary differences are recorded as deferred tax assets or deferred tax liabilities. Deferred tax assets generally represent items that can be used as a tax deduction or credit in our tax return in future years for which we have already recorded the expense in our financial statements. Deferred tax liabilities generally represent tax items that have been deducted for tax purposes, but have not yet been recorded as expenses in our financial statements.
We evaluate our deferred tax assets quarterly to determine if valuation allowances are required. We assess whether valuation allowances should be established based on the consideration of all available evidence using a “more likely than not” standard. We made this evaluation as of December 31, 2009 and believe our deferred tax assets other than those that carry a valuation allowance will primarily be realized through the generation of future taxable income, as well as through the reversal of our existing temporary differences and the execution of available tax planning strategies. We believe it is “more likely than not” based upon our current estimates of future taxable income that the deferred tax assets will be recognized. Additional valuation allowances may be required if we are unable to generate future taxable income. Additional tax valuation allowances could have a significant negative impact on future earnings.
We record tax benefits when they are more likely than not to be realized. Our policy is to reflect penalties and interest as part of income tax expense as they become applicable. We file numerous consolidated and separate income tax returns in the U.S. federal jurisdiction and in many state jurisdictions, as well as in Canada and the Philippines. Our U.S. federal returns and most state returns for tax years 2006 and forward are subject to examination. Canadian returns for tax years 2005 and forward are subject to examination. No U.S. federal or state returns are currently under audit, and no extensions of statute of limitations have been granted. As of December 31, 2009 and 2008, there were no unrecognized income tax benefits.
Stock-Based Compensation
We recognize expense related to all share-based payments to employees, including grants of employee stock options, in our Consolidated Statements of Operations and Other Comprehensive (Loss) Income based on the share-based payments’ fair values amortized straight-line over the period during which the employees are required to provide services in exchange for the equity instruments. We estimate forfeitures when calculating compensation expense. We use the Black-Scholes method for valuing stock-based awards. See Note 11, “Share-Based Compensation,” to our Consolidated Financial Statements, included in Item 8. “Financial Statements and Supplementary Financial Data.”
ITEM 7A. QUANTITATIVE AND QUALITATIVE DISCLOSURES ABOUT MARKET RISK
In the normal course of business, we are exposed to certain market risks related to changes in interest rates and other general market risks, equity market prices, and foreign currency exchange rates. We have established an investment portfolio policy which provides for, among other things, investment objectives and portfolio allocation guidelines. All of our investment decisions are currently supervised or managed by our Chief Financial Officer.
This discussion contains forward-looking statements subject to risks and uncertainties. Actual results could vary materially as a result of a number of factors, including but not limited to, changes in interest and inflation rates or market expectations thereon, equity market prices, foreign currency exchange rates, and those factors set forth in Item 1A. “Risk Factors” of this Form 10-K.
INTEREST RATE RISK
Cash and Cash Equivalents
At December 31, 2009, we had $19.6 million in cash and cash equivalents. Cash and cash equivalents are not restricted. We consider cash equivalents to be short-term, highly liquid investments readily convertible to known amounts of cash, and so near their maturity at purchase that they present insignificant risk of changes in value because of changes in interest rates. We do not expect any substantial loss with respect to our cash and cash equivalents as a result of interest rate changes, and the estimated fair value of our cash and cash equivalents approximates original cost.
Investments
At December 31, 2009, we had investments available for sale which, in the aggregate, had a fair market value of $0.5 million. At December 31, 2009, investments available for sale consisted entirely of investment-grade corporate bonds. Our investment portfolio is subject to interest and inflation rate risks and will fall in value if market interest and/or inflation rates or market expectations relating to these rates increase.
The fair market value of estimated cash flows from our investments in corporate bonds are substantially dependent upon the credit worthiness of certain corporations expected to repay their debts to us. If such corporations’ financial condition and liquidity adversely changes, our investments in these bonds would be materially and adversely affected.
The weighted-average interest rate related to our investments available for sale as of December 31, 2009 was 2.49%. All of our investments available for sale are set to mature within one year.
Management believes we have the ability to hold the foregoing investments until maturity, and therefore, if held to maturity, we would not expect the future proceeds from these investments to be affected, to any significant degree, by the effect of a sudden change in market interest rates. Declines in interest rates over time will, however, reduce our interest income derived from future investments.
Outstanding Debt
We currently have a $15.0 million unsecured revolving line of credit. The interest rate on our line of credit is variable based upon the LIBOR index, and therefore, is affected by changes in market interest rates. As of December 31, 2009, there was no amount outstanding on the line of credit. If the LIBOR increased 100 basis points, there would not be a material impact to our Consolidated Financial Statements.
FOREIGN CURRENCY EXCHANGE RISKS
We enter into foreign currency exchange contracts to hedge our anticipated operating commitments that are denominated in foreign currencies. The contracts cover periods commensurate with expected exposure, generally three to nine months, and are principally unsecured foreign exchange contracts. The market risk exposure is essentially limited to risk related to currency rate movements. We operate in Canada and the Philippines and are initiating operations in Costa Rica. The functional currencies in Canada and the Philippines are the Canadian dollar and the Philippine peso, which are used to pay labor and other operating costs in those countries. However, our client contracts generate revenues which are paid to us in U.S. dollars. In Costa Rica, our functional currency is the U.S. dollar and the majority of our costs are denominated in U.S. dollars.
The following table summarizes the relative strengthening (weakening) of the local currency against the U.S. dollar, average exchange rates and the amount of local currency used in operations (in 000’s) during the years presented:
|
|
|
Year Ended December 31, |
|
||||
|
|
|
2009 |
|
2008 |
|
2007 |
|
|
Canadian dollar vs. U.S. dollar |
|
|
|
|
|
|
|
|
Relative strengthening (weakening) during the year |
|
13.6 |
% |
(22.1 |
)% |
14.4 |
% |
|
Average exchange rate |
|
1.14 |
|
1.07 |
|
1.07 |
|
|
Amount of local currency used, net of receipts |
|
66,722 |
|
86,232 |
|
83,939 |
|
|
|
|
|
|
|
|
|
|
|
Philippine peso vs. U.S. dollar |
|
|
|
|
|
|
|
|
Relative strengthening (weakening) during the year |
|
2.6 |
% |
(15.2 |
)% |
15.9 |
% |
|
Average exchange rate |
|
47.4 |
|
45.5 |
|
51.1 |
|
|
Amount of local currency used, net of receipts |
|
572,433 |
|
122,979 |
|
— |
|
|
|
|
|
|
|
|
|
|
|
Costa Rican colon vs. U.S. dollar |
|
|
|
|
|
|
|
|
Relative strengthening (weakening) during the year |
|
(0.9 |
)% |
(11.5 |
)% |
3.7 |
% |
|
Average exchange rate |
|
572 |
|
523 |
|
516 |
|
|
Amount of local currency used, net of receipts |
|
— |
|
— |
|
— |
|
The fluctuations in the foreign currency exchange rates for the Philippine peso and Costa Rican colon during 2009 did not have a material impact on our Consolidated Financial Statements. However, we expect our expenditures in these countries to increase in 2010, and as such expect our exposure to currency fluctuations to grow, particularly in the Philippines. Therefore, we may enter into hedging arrangements in 2010 for these currencies. During 2009, we entered into Canadian dollar forward contracts with Wells Fargo Bank and UMB Bank for 44.1 million Canadian dollars to hedge our foreign currency risk with respect to labor costs in Canada. As of December 31, 2009, we had contracted to purchase 30.6 million Canadian dollars to be delivered periodically through June 2010 at a purchase price of approximately $28.6 million.
ITEM 8. FINANCIAL STATEMENTS AND SUPPLEMENTARY FINANCIAL DATA
The following Consolidated Financial Statements should be read in conjunction with Item 7. “Management’s Discussion and Analysis of Financial Condition and Results of Operations” of this Form 10-K.
StarTek, Inc. and Subsidiaries:
Report of Independent Registered Public Accounting Firm
The Board of Directors and Stockholders of StarTek, Inc.
We have audited the accompanying consolidated balance sheets of StarTek, Inc. and subsidiaries as of December 31, 2009 and 2008, and the related consolidated statements of operations and other comprehensive income (loss), cash flows and stockholders’ equity for each of the three years in the period ended December 31, 2009. These financial statements are the responsibility of the Company’s management. Our responsibility is to express an opinion on these financial statements based on our audits.
We conducted our audits in accordance with the standards of the Public Company Accounting Oversight Board (United States). Those standards require that we plan and perform the audit to obtain reasonable assurance about whether the financial statements are free of material misstatement. An audit includes examining, on a test basis, evidence supporting the amounts and disclosures in the financial statements. An audit also includes assessing the accounting principles used and significant estimates made by management, as well as evaluating the overall financial statement presentation. We believe that our audits provide a reasonable basis for our opinion.
In our opinion, the financial statements referred to above present fairly, in all material respects, the consolidated financial position of StarTek, Inc. and subsidiaries at December 31, 2009 and 2008, and the consolidated results of their operations and their cash flows for each of the three years in the period ended December 31, 2009, in conformity with U.S. generally accepted accounting principles.
We also have audited, in accordance with the standards of the Public Company Accounting Oversight Board (United States), StarTek, Inc.’s internal control over financial reporting as of December 31, 2009, based on criteria established in Internal Control-Integrated Framework issued by the Committee of Sponsoring Organizations of the Treadway Commission and our report dated February 25, 2010 expressed an unqualified opinion thereon.
|
|
/s/ Ernst & Young LLP |
|
|
|
|
|
|
|
Denver, Colorado |
|
|
February 25, 2010 |
|
STARTEK, INC. AND SUBSIDIARIES
CONSOLIDATED STATEMENTS OF OPERATIONS AND OTHER COMPREHENSIVE INCOME (LOSS)
(Dollars in thousands, except per share data)
|
|
|
Year Ended December 31, |
|
|||||||
|
|
|
2009 |
|
2008 |
|
2007 |
|
|||
|
Revenue |
|
$ |
288,980 |
|
$ |
272,338 |
|
$ |
244,615 |
|
|
Cost of services |
|
239,879 |
|
238,346 |
|
205,920 |
|
|||
|
Gross profit |
|
49,101 |
|
33,992 |
|
38,695 |
|
|||
|
Selling, general and administrative expenses |
|
43,196 |
|
40,814 |
|
38,991 |
|
|||
|
Impairment losses and restructuring charges |
|
6,437 |
|
9,225 |
|
4,325 |
|
|||
|
Operating loss |
|
(532 |
) |
(16,047 |
) |
(4,621 |
) |
|||
|
Net interest and other (expense) income |
|
(210 |
) |
55 |
|
745 |
|
|||
|
Loss from continuing operations before income taxes |
|
(742 |
) |
(15,992 |
) |
(3,876 |
) |
|||
|
Income tax benefit |
|
(751 |
) |
(6,301 |
) |
(719 |
) |
|||
|
Income (loss) from continuing operations |
|
9 |
|
(9,691 |
) |
(3,157 |
) |
|||
|
Income (loss) from discontinued operations, net of tax |
|
4,640 |
|
(210 |
) |
326 |
|
|||
|
Net income (loss) |
|
$ |
4,649 |
|
$ |
(9,901 |
) |
$ |
(2,831 |
) |
|
|
|
|
|
|
|
|
|
|||
|
Other comprehensive income (loss), net of tax: |
|
|
|
|
|
|
|
|||
|
Foreign currency translation adjustments, net of tax |
|
901 |
|
(1,463 |
) |
1,331 |
|
|||
|
Unrealized gain (loss) on investments available for sale, net of tax |
|
49 |
|
(32 |
) |
(30 |
) |
|||
|
Change in fair value of derivative instruments, net of tax |
|
1,838 |
|
(1,464 |
) |
255 |
|
|||
|
Comprehensive income (loss) |
|
$ |
7,437 |
|
$ |
(12,860 |
) |
$ |
(1,275 |
) |
|
|
|
|
|
|
|
|
|
|||
|
Net income (loss) per share from continuing operations: |
|
|
|
|
|
|
|
|||
|
Basic |
|
$ |
0.00 |
|
$ |
(0.66 |
) |
$ |
(0.21 |
) |
|
Diluted |
|
$ |
0.00 |
|
$ |
(0.66 |
) |
$ |
(0.21 |
) |
|
|
|
|
|
|
|
|
|
|||
|
Net income (loss) per share including discontinued operations: |
|
|
|
|
|
|
|
|||
|
Basic |
|
$ |
0.31 |
|
$ |
(0.67 |
) |
$ |
(0.19 |
) |
|
Diluted |
|
$ |
0.31 |
|
$ |
(0.67 |
) |
$ |
(0.19 |
) |
|
|
|
|
|
|
|
|
|
|||
|
Weighted average shares outstanding |
|
|
|
|
|
|
|
|||
|
Basic |
|
14,792 |
|
14,713 |
|
14,696 |
|
|||
|
Diluted |
|
14,837 |
|
14,713 |
|
14,696 |
|
|||
See Notes to Consolidated Financial Statements.
STARTEK, INC. AND SUBSIDIARIES
(Dollars in thousands, except share and per share data)
|
|
|
As of December 31, |
|
||||
|
|
|
2009 |
|
2008 |
|
||
|
ASSETS |
|
|
|
|
|
||
|
|
|
|
|
|
|
||
|
Current assets: |
|
|
|
|
|
||
|
Cash and cash equivalents |
|
$ |
19,591 |
|
$ |
9,580 |
|
|
Investments |
|
500 |
|
8,437 |
|
||
|
Trade accounts receivable, net |
|
50,521 |
|
50,829 |
|
||
|
Income tax receivable |
|
6,292 |
|
2,675 |
|
||
|
Deferred income tax assets |
|
511 |
|
2,185 |
|
||
|
Prepaid expenses |
|
5,979 |
|
3,273 |
|
||
|
Other current assets |
|
2,012 |
|
681 |
|
||
|
Total current assets |
|
85,406 |
|
77,660 |
|
||
|
|
|
|
|
|
|
||
|
Property, plant and equipment, net |
|
58,045 |
|
59,608 |
|
||
|
Long-term deferred income tax assets |
|
4,529 |
|
8,946 |
|
||
|
Other assets |
|
1,088 |
|
650 |
|
||
|
Total assets |
|
$ |
149,068 |
|
$ |
146,864 |
|
|
|
|
|
|
|
|
||
|
LIABILITIES AND STOCKHOLDERS’ EQUITY |
|
|
|
|
|
||
|
|
|
|
|
|
|
||
|
Current liabilities: |
|
|
|
|
|
||
|
Accounts payable |
|
$ |
4,884 |
|
$ |
6,193 |
|
|
Derivative liability |
|
— |
|
2,323 |
|
||
|
Accrued liabilities: |
|
|
|
|
|
||
|
Accrued payroll |
|
9,253 |
|
9,158 |
|
||
|
Accrued compensated absences |
|
4,016 |
|
4,856 |
|
||
|
Accrued restructuring costs |
|
1,317 |
|
995 |
|
||
|
Other accrued liabilities |
|
1,897 |
|
2,317 |
|
||
|
Current portion of long-term debt |
|
— |
|
3,295 |
|
||
|
Deferred revenue |
|
1,019 |
|
— |
|
||
|
Deferred income tax liabilities |
|
1,470 |
|
— |
|
||
|
Other current liabilities |
|
1,117 |
|
954 |
|
||
|
Total current liabilities |
|
24,973 |
|
30,091 |
|
||
|
|
|
|
|
|
|
||
|
Long-term debt, less current portion |
|
— |
|
3,199 |
|
||
|
Accrued restructuring charges |
|
2,663 |
|
1,714 |
|
||
|
Deferred rent |
|
4,144 |
|
4,757 |
|
||
|
Other liabilities |
|
572 |
|
84 |
|
||
|
Total liabilities |
|
32,352 |
|
39,845 |
|
||
|
|
|
|
|
|
|
||
|
Commitments and contingencies |
|
|
|
|
|
||
|
|
|
|
|
|
|
||
|
Stockholders’ equity: |
|
|
|
|
|
||
|
Common stock, 32,000,000 non-convertible shares, $0.01 par value, authorized; 14,882,990 and 14,813,912 shares issued and outstanding at December 31, 2009 and 2008, respectively |
|
149 |
|
148 |
|
||
|
Additional paid-in capital |
|
66,699 |
|
64,440 |
|
||
|
Accumulated other comprehensive income (loss) |
|
2,373 |
|
(415 |
) |
||
|
Retained earnings |
|
47,495 |
|
42,846 |
|
||
|
Total stockholders’ equity |
|
116,716 |
|
107,019 |
|
||
|
Total liabilities and stockholders’ equity |
|
$ |
149,068 |
|
$ |
146,864 |
|
See Notes to Consolidated Financial Statements.
STARTEK, INC. AND SUBSIDIARIES
CONSOLIDATED STATEMENTS OF CASH FLOWS
(Dollars in thousands)
|
|
|
Year Ended December 31, |
|
|||||||
|
|
|
2009 |
|
2008 |
|
2007 |
|
|||
|
Operating Activities |
|
|
|
|
|
|
|
|||
|
Net income (loss) |
|
$ |
4,649 |
|
$ |
(9,901 |
) |
$ |
(2,831 |
) |
|
Income (loss) from discontinued operations |
|
4,640 |
|
(210 |
) |
326 |
|
|||
|
Income (loss) from continuing operations |
|
9 |
|
(9,691 |
) |
(3,157 |
) |
|||
|
Adjustments to reconcile net income (loss) to net cash provided by operating activities: |
|
|
|
|
|
|
|
|||
|
Depreciation |
|
15,977 |
|
17,803 |
|
17,092 |
|
|||
|
Impairment of property, plant and equipment |
|
1,756 |
|
5,936 |
|
3,583 |
|
|||
|
Non-cash compensation cost |
|
1,987 |
|
1,493 |
|
1,107 |
|
|||
|
Deferred income taxes |
|
7,050 |
|
(7,492 |
) |
454 |
|
|||
|
Other, net |
|
22 |
|
538 |
|
60 |
|
|||
|
Changes in operating assets and liabilities: |
|
|
|
|
|
|
|
|||
|
Trade accounts receivable, net |
|
108 |
|
(2,683 |
) |
(2,367 |
) |
|||
|
Prepaid expenses and other assets |
|
(3,401 |
) |
(767 |
) |
1,004 |
|
|||
|
Accounts payable |
|
(1,374 |
) |
292 |
|
230 |
|
|||
|
Income taxes, net |
|
(3,528 |
) |
(309 |
) |
(1,214 |
) |
|||
|
Accrued and other liabilities |
|
(617 |
) |
6,706 |
|
3,529 |
|
|||
|
Net cash provided by continuing operating activities |
|
17,989 |
|
11,826 |
|
20,321 |
|
|||
|
Cash (used in) provided by discontinued operating activities |
|
(2,335 |
) |
(210 |
) |
326 |
|
|||
|
Net cash provided by operating activities |
|
15,654 |
|
11,616 |
|
20,647 |
|
|||
|
|
|
|
|
|
|
|
|
|||
|
Investing Activities |
|
|
|
|
|
|
|
|||
|
Purchases of investments available for sale |
|
— |
|
(11,384 |
) |
(36,813 |
) |
|||
|
Proceeds from disposition of investments available for sale |
|
8,019 |
|
18,742 |
|
26,348 |
|
|||
|
Purchases of property, plant and equipment |
|
(14,683 |
) |
(27,979 |
) |
(15,207 |
) |
|||
|
Net cash used in continuing investing activities |
|
(6,664 |
) |
(20,621 |
) |
(25,672 |
) |
|||
|
Cash provided by discontinued investing activities |
|
7,075 |
|
— |
|
— |
|
|||
|
Net cash provided by (used in) investing activities |
|
411 |
|
(20,621 |
) |
(25,672 |
) |
|||
|
|
|
|
|
|
|
|
|
|||
|
Financing Activities |
|
|
|
|
|
|
|
|||
|
Proceeds from stock option exercises |
|
20 |
|
— |
|
— |
|
|||
|
Principal payments on borrowings |
|
(6,855 |
) |
(3,835 |
) |
(5,828 |
) |
|||
|
Proceeds from line of credit |
|
22,236 |
|
116,886 |
|
56,782 |
|
|||
|
Principal payments on line of credit |
|
(22,236 |
) |
(116,886 |
) |
(56,782 |
) |
|||
|
Proceeds from the issuance of common stock |
|
251 |
|
172 |
|
— |
|
|||
|
Principal payments on capital lease obligations |
|
(265 |
) |
(59 |
) |
— |
|
|||
|
Net cash used in continuing financing activities |
|
(6,849 |
) |
(3,722 |
) |
(5,828 |
) |
|||
|
Cash provided by discontinued financing activities |
|
— |
|
— |
|
— |
|
|||
|
Net cash used in financing activities |
|
(6,849 |
) |
(3,722 |
) |
(5,828 |
) |
|||
|
Effect of exchange rate changes on cash |
|
795 |
|
(719 |
) |
442 |
|
|||
|
Net increase (decrease) in cash and cash equivalents |
|
10,011 |
|
(13,446 |
) |
(10,411 |
) |
|||
|
Cash and cash equivalents at beginning of period |
|
9,580 |
|
23,026 |
|
33,437 |
|
|||
|
Cash and cash equivalents at end of period |
|
$ |
19,591 |
|
$ |
9,580 |
|
$ |
23,026 |
|
|
|
|
|
|
|
|
|
|
|||
|
Supplemental Disclosure of Cash Flow Information |
|
|
|
|
|
|
|
|||
|
Cash paid for interest |
|
$ |
166 |
|
$ |
660 |
|
$ |
772 |
|
|
Cash paid for income taxes |
|
$ |
750 |
|
$ |
2,312 |
|
$ |
1,990 |
|
|
Property, plant and equipment acquired or refinanced under long-term debt |
|
$ |
290 |
|
$ |
385 |
|
$ |
— |
|
See Notes to Consolidated Financial Statements.
STARTEK, INC. AND SUBSIDIARIES
CONSOLIDATED STATEMENTS OF STOCKHOLDERS’ EQUITY
(Dollars in thousands)
|
|
|
|
|
|
|
|
|
Accumulated |
|
|
|
|
|
|||||
|
|
|
|
|
|
|
Additional |
|
Other |
|
|
|
Total |
|
|||||
|
|
|
Common Stock |
|
Paid-In |
|
Comprehensive |
|
Retained |
|
Stockholders’ |
|
|||||||
|
|
|
Shares |
|
Amount |
|
Capital |
|
Income (Loss) |
|
Earnings |
|
Equity |
|
|||||
|
Balance, January 1, 2007 |
|
14,695,791 |
|
$ |
147 |
|
$ |
61,669 |
|
$ |
988 |
|
$ |
55,578 |
|
$ |
118,382 |
|
|
Restricted shares granted |
|
40,000 |
|
— |
|
— |
|
— |
|
— |
|
— |
|
|||||
|
Stock-based compensation expense |
|
— |
|
— |
|
1,107 |
|
— |
|
— |
|
1,107 |
|
|||||
|
Net loss |
|
|
|
|
|
|
|
|
|
(2,831 |
) |
(2,831 |
) |
|||||
|
Foreign currency translation adjustments, net of tax |
|
— |
|
— |
|
— |
|
1,331 |
|
— |
|
1,331 |
|
|||||
|
Unrealized loss on investments available for sale, net of tax |
|
— |
|
— |
|
— |
|
(30 |
) |
— |
|
(30 |
) |
|||||
|
Change in fair value of derivative instruments, net of tax |
|
— |
|
— |
|
— |
|
255 |
|
— |
|
255 |
|
|||||
|
Balance, December 31, 2007 |
|
14,735,791 |
|
$ |
147 |
|
$ |
62,776 |
|
$ |
2,544 |
|
$ |
52,747 |
|
$ |
118,214 |
|
|
Restricted shares granted |
|
47,800 |
|
1 |
|
(1 |
) |
|
|
— |
|
— |
|
|||||
|
Restricted shares forfeited |
|
(7,000 |
) |
— |
|
— |
|
— |
|
— |
|
— |
|
|||||
|
Issuance of common stock pursuant to Employee Stock Purchase Plan |
|
37,321 |
|
— |
|
172 |
|
— |
|
— |
|
172 |
|
|||||
|
Stock-based compensation expense |
|
— |
|
— |
|
1,493 |
|
— |
|
— |
|
1,493 |
|
|||||
|
Net loss |
|
|
|
|
|
|
|
— |
|
(9,901 |
) |
(9,901 |
) |
|||||
|
Foreign currency translation adjustments, net of tax |
|
— |
|
— |
|
— |
|
(1,463 |
) |
— |
|
(1,463 |
) |
|||||
|
Unrealized loss on investments available for sale, net of tax |
|
— |
|
— |
|
— |
|
(32 |
) |
— |
|
(32 |
) |
|||||
|
Change in fair value of derivative instruments, net of tax |
|
— |
|
— |
|
— |
|
(1,464 |
) |
— |
|
(1,464 |
) |
|||||
|
Balance, December 31, 2008 |
|
14,813,912 |
|
$ |
148 |
|
$ |
64,440 |
|
$ |
(415 |
) |
$ |
42,846 |
|
$ |
107,019 |
|
|
Stock options exercised |
|
5,082 |
|
— |
|
20 |
|
— |
|
— |
|
20 |
|
|||||
|
Restricted shares granted |
|
7,200 |
|
— |
|
— |
|
— |
|
— |
|
— |
|
|||||
|
Restricted shares forfeited |
|
(3,249 |
) |
— |
|
— |
|
— |
|
— |
|
— |
|
|||||
|
Issuance of common stock pursuant to Employee Stock Purchase Plan |
|
60,045 |
|
1 |
|
252 |
|
— |
|
— |
|
253 |
|
|||||
|
Stock-based compensation expense |
|
— |
|
— |
|
1,987 |
|
— |
|
— |
|
1,987 |
|
|||||
|
Net income |
|
— |
|
— |
|
— |
|
— |
|
4,649 |
|
4,649 |
|
|||||
|
Foreign currency translation adjustments, net of tax |
|
— |
|
— |
|
— |
|
901 |
|
— |
|
901 |
|
|||||
|
Unrealized gain on investments available for sale, net of tax |
|
— |
|
— |
|
— |
|
49 |
|
— |
|
49 |
|
|||||
|
Change in fair value of derivative instruments, net of tax |
|
— |
|
— |
|
— |
|
1,838 |
|
— |
|
1,838 |
|
|||||
|
Balance, December 31, 2009 |
|
14,882,990 |
|
$ |
149 |
|
$ |
66,699 |
|
$ |
2,373 |
|
$ |
47,495 |
|
$ |
116,716 |
|
See Notes to Consolidated Financial Statements.
STARTEK, INC. AND SUBSIDIARIES
NOTES TO CONSOLIDATED FINANCIAL STATEMENTS
DECEMBER 31, 2009
(In thousands, except share and per share data)
1. BASIS OF PRESENTATION AND SUMMARY OF SIGNIFICANT ACCOUNTING POLICIES
StarTek, Inc. is a provider of business process optimization services for outsourced customer interactions. Since 1987, we have provided customer experience management solutions that solve strategic business challenges so that fast-moving businesses can effectively manage customer relationships across all contact points including web, voice, email, fax, and video. This blended solution helps companies create and maintain customer satisfaction and frees them to focus on preserving capital, while we deliver the customer experience. Headquartered in Denver, Colorado, we operated 19 facilities in the U.S., Canada and the Philippines as of December 31, 2009. We operate within three business segments: the U.S., Canada and Offshore. We have evaluated all subsequent events through February 25, 2010, the date the financial statements were issued.
Consolidation
Our Consolidated Financial Statements include the accounts of all wholly-owned subsidiaries after elimination of intercompany accounts and transactions.
Reclassifications
Certain reclassifications have been made to the 2008 and 2007 financial statements to conform to 2009 presentation, primarily for the presentation of discontinued operations (See Note 3).
Use of Estimates
The preparation of Consolidated Financial Statements in conformity with U.S. generally accepted accounting principles requires our management to make estimates and assumptions that affect amounts reported in our Consolidated Financial Statements and accompanying Notes. Actual results could differ from those estimates. Estimates and assumptions are reviewed periodically, and the effects of revisions are reflected in the Consolidated Financial Statements in the period they are determined to be necessary.
Concentration of Credit Risk
We are exposed to credit risk in the normal course of business, primarily related to accounts receivable and derivative instruments. Historically, the losses related to credit risk have been immaterial. We regularly monitor credit risk to mitigate the possibility of current and future exposures resulting in a loss. We evaluate the creditworthiness of clients prior to entering into an agreement to provide services and on an on-going basis as part of the processes of revenue recognition and accounts receivable. We do not believe we are exposed to more than a nominal amount of credit risk in our derivative hedging activities, as the counter parties are established, well-capitalized financial institutions.
Foreign Currency Translation
The assets and liabilities of our foreign operations that are recorded in foreign currencies are translated into U.S. dollars at exchange rates prevailing at the balance sheet date. Revenues and expenses are translated at the weighted-average exchange rate during the reporting period. Resulting translation adjustments, net of applicable deferred income taxes, are recorded in accumulated other comprehensive income in the accompanying Consolidated Balance Sheets, which is a separate component of stockholders’ equity. Foreign currency transaction gains and losses are included in the accompanying Consolidated Statements of Operations and Other Comprehensive Income (Loss). Such gains and losses were not material for any period presented.
Revenue Recognition
Business Process Outsourcing Services —We invoice our clients monthly in arrears and recognize revenues for such services when completed. Substantially all of our contractual arrangements are based either on a production rate, meaning that we recognize revenue based on the billable hours or minutes of each call center agent, or on a rate per transaction basis. These rates could be based on the number of paid hours the agent works, the number of minutes the agent is available to answer calls, or the number of minutes the agent is actually handling calls for the client, depending on the client contract. Production rates vary by client contract and can fluctuate based on our performance against certain pre-determined criteria related to quality and performance. Additionally, some clients are contractually entitled to penalties when we are out of compliance with certain quality and/or performance obligations defined in the client contract. Such penalties are recorded as a reduction to revenue as incurred based on a measurement of the
appropriate penalty under the terms of the client contract. Likewise, some client contracts stipulate that we are entitled to bonuses should we meet or exceed these predetermined quality and/or performance obligations. These bonuses are recognized as incremental revenue in the period in which they are earned.
As a general rule, our contracts do not include multiple elements. We provide initial training to customer service representatives upon commencement of new contracts and recognize revenues for such training as the services are provided based upon the production rate (i.e., billable hours and rates related to the training services as stipulated in our contractual arrangements). Accordingly, the corresponding training costs, consisting primarily of labor and related expenses, are recognized as incurred.
Allowance for Doubtful Accounts
An allowance for doubtful accounts is provided for known and estimated potential losses arising from sales to customers based on a periodic review of these accounts. The allowance for doubtful accounts was not material as of December 31, 2009 or 2008.
Fair Value of Financial Instruments
Fair value is the price that would be received from selling an asset or paid to transfer a liability in an orderly transaction between market participants at the measurement date. When determining the fair value measurements for assets and liabilities, which are required to be recorded at fair value, we consider the principal or most advantageous market in which we would transact and the market-based risk measurements or assumptions that market participants would use in pricing the asset or liability, such as inherent risk, transfer restrictions, and credit risk.
Accounting guidance for the measurement of fair value establishes a hierarchy that prioritizes the inputs to valuation techniques used to measure fair value. The hierarchy gives the highest priority to unadjusted quoted prices in active markets for identical assets or liabilities (level 1 measurements) and the lowest priority to unobservable inputs (level 3 measurements). The levels of the fair value hierarchy are described below:
|
Level 1 |
|
Valuation is based upon quoted prices for identical instruments traded in active markets. |
|
|
|
|
|
Level 2 |
|
Valuation is based upon quoted prices for similar instruments in active markets, quoted prices for identical or similar instruments in markets that are not active, and model-based valuation techniques for which all significant assumptions are observable in the market. |
|
|
|
|
|
Level 3 |
|
Valuation is generated from model-based techniques that use significant assumptions not observable in the market. These unobservable assumptions reflect our own estimates of assumptions that market participants would use in pricing the asset or liability. Valuation techniques include use of option pricing models, discounted cash flow models and similar techniques. |
When determining the fair value measurements for assets and liabilities required or permitted to be recorded at and/or marked to fair value, we consider the principal or most advantageous market in which it would transact and consider assumptions that market participants would use when pricing the asset or liability. When possible, we look to active and observable markets to price identical assets or liabilities. When identical assets and liabilities are not traded in active markets, we look to market observable data for similar assets and liabilities. Nevertheless, if certain assets and liabilities are not actively traded in observable markets, we must use alternative valuation techniques to derive a fair value measurement. Refer to Note 8, “Fair Value Measurements,” for additional information on how we determine fair value for our assets and liabilities.
Cash and Cash Equivalents
We consider cash equivalents to be short-term, highly liquid investments readily convertible to known amounts of cash and so near their maturity at purchase that they present insignificant risk of changes in value because of changes in interest rates.
Investments
Investments available for sale have historically consisted of debt securities reported at fair value. Under our investment policy, we may invest in certain U.S. Government and government-sponsored securities, repurchase agreements, investment grade corporate obligations, corporate debt securities, municipal securities, money market and mutual funds, subject to the terms of the policy. When the investments held in our portfolio as of December 31, 2009 mature, we intend to revise our investment policy such that we may invest in more conservative investments, including U.S. treasury securities, federal agency securities, repurchase agreements and money market funds. The Chief Financial Officer is responsible for oversight of the investment portfolio.
Investments are periodically evaluated for other-than-temporary impairment whenever the fair value falls below our cost basis and we either intend to sell the security or its more likely than not we will be required to sell the security before it recovers. We then consider additional factors such as market conditions, the industry sectors in which the issuer of the investment operates, and the viability and prospects of each entity. Other-than-temporary declines in fair value are reflected on the Consolidated Statements of Operations and Other Comprehensive Income (Loss) within Net Interest and Other Income. Original cost of investments available for sale is based on the specific identification method. Other-than-temporary impairments and interest income from investments available for sale are included in Net Interest and Other Income on the accompanying Consolidated Statements of Operations and Other Comprehensive Income (Loss). Investments available for sale are carried at fair market values. As of December 31, 2009 and 2008, we were not invested in any trading securities or held-to-maturity securities.
Derivative Instruments and Hedging Activities
Our derivative instruments (including certain derivative instruments embedded in other contracts) recorded in the Consolidated Balance Sheets as either an asset or liability measured at its fair value, with changes in the fair value of qualifying hedges recorded in other comprehensive income. Changes in a derivative’s fair value are recognized currently in earnings unless specific hedge accounting criteria are met. Special accounting for qualifying hedges allows a derivative’s gains and losses to offset the related results of the hedged item and requires that we must formally document, designate and assess the effectiveness of transactions that receive hedge accounting treatment.
We generally are able to apply cash flow hedge accounting which associates the results of the hedges with forecasted future expenses. The current mark-to-market gain or loss is recorded in accumulated other comprehensive income in the accompanying Consolidated Balance Sheets and will be re-classified to operations as the forecasted expenses are incurred, typically within one year. During 2009, 2008 and 2007, our cash flow hedges were highly effective and there were no amounts charged to the Consolidated Statements of Operations and Other Comprehensive Income (Loss) for hedge ineffectiveness. While we expect that our derivative instruments that have been designated as hedges will continue to meet the conditions for hedge accounting, if hedges do not qualify as highly effective or if we do not believe that forecasted transactions will occur, the changes in the fair value of the derivatives used as hedges will be reflected in earnings.
Legal Proceedings
We reserve for legal contingencies when a liability for those contingencies has become probable and the cost is reasonably estimable. Any significant litigation or significant change in our estimates on our outstanding litigation could cause us to increase our provision for related costs, which, in turn, could materially affect our financial results. Any provision made for these anticipated costs are expensed to operating expenses in our Consolidated Statements of Operations and Other Comprehensive Income (Loss).
Property, Plant and Equipment
Property, plant, and equipment are stated at depreciated cost. Additions, improvements, and major renewals are capitalized. Maintenance, repairs, and minor renewals are expensed as incurred. Depreciation and amortization is computed using the straight-line method based on their estimated useful lives, as follows:
|
|
|
Estimated Useful Life |
|
|
Buildings and building improvements |
|
15-30 years |
|
|
Telephone and computer equipment |
|
3-5 years |
|
|
Software |
|
3 years |
|
|
Furniture, fixtures, and miscellaneous equipment |
|
5-7 years |
|
We depreciate leasehold improvements associated with operating leases over the shorter of the expected useful life or remaining life of the lease. Depreciation for assets obtained under a capital lease is included in depreciation expense.
Impairment of Long-Lived Assets
We periodically, on at least an annual basis, evaluate potential impairments of our long-lived assets. In our annual evaluation or when we determine that the carrying value of a long-lived asset may not be recoverable, based upon the existence of one or more indicators of impairment, we evaluate the projected undiscounted cash flows related to the assets. If these cash flows are less than the carrying values of the assets, we measure the impairment based on the excess of the carrying value of the long-lived asset over the long-lived asset’s fair value. Our projections contain assumptions pertaining to anticipated levels of utilization and revenue that may or may not be under contract but are based on our experience and/or projections received from our customers.
Restructuring Charges
A liability for a cost associated with an exit or disposal activity is recognized when the liability is incurred, instead of upon commitment to an exit plan. On an ongoing basis, management assesses the profitability and utilization of our facilities and in some cases management has chosen to close facilities. A significant assumption used in determining the amount of the estimated liability for closing a facility is the estimated liability for future lease payments on vacant facilities, which we determine based on a third-party broker’s assessment of our ability to successfully negotiate early termination agreements with landlords and/or to sublease the facility. If the assumptions regarding early termination and the timing and amounts of sublease payments prove to be inaccurate, we may be required to record additional losses, or conversely, a future gain, in the Consolidated Statements of Operations and Comprehensive Income (Loss).
Operating Leases
We have negotiated certain rent holidays, landlord/tenant incentives and escalations in the base price of the rent payments over the term of our operating leases. We recognize rent holidays and rent escalations on a straight-line basis over the lease term. The landlord/tenant incentives are recorded as deferred rent and amortized on a straight line over the lease term.
Income Taxes
We account for income taxes using the liability method of accounting. Deferred income taxes reflect net effects of temporary differences between carrying amounts of assets and liabilities for financial reporting purposes and amounts used for income tax purposes. We are subject to foreign income taxes on our foreign operations. We evaluate our deferred tax assets quarterly to determine if valuation allowances are required. We assess whether valuation allowances should be established based on the consideration of all available evidence using a “more likely than not” standard. We made this evaluation as of December 31, 2009 and believe our deferred tax assets other than those that carry a valuation allowance will primarily be realized through the generation of future taxable income, as well as through the reversal of our existing temporary differences. We believe it is “more likely than not” based upon our current estimates of future taxable income that the deferred tax assets will be recognized. Additional valuation allowances may be required if we are unable to generate future taxable income. Additional tax valuation allowances could have a significant negative impact on future earnings.
We record tax benefits when they are more likely than not to be realized. Our policy is to reflect penalties and interest as part of income tax expense as they become applicable. We file numerous consolidated and separate income tax returns in the U.S. federal jurisdiction and in many state jurisdictions, as well as in Canada and the Philippines. Our U.S. federal returns and most state returns for tax years 2006 and forward are subject to examination. Canadian returns for tax years 2005 and forward are subject to examination. Our Philippine returns since our commencement of operations in the Philippines in 2008 are subject to examination. No U.S. federal or state returns, Canadian returns or Philippine returns are currently under audit, and no extensions of statute of limitations have been granted. As of December 31, 2009 and 2008, there were no unrecognized income tax benefits.
Stock-Based Compensation
We recognize expense related to all share-based payments to employees, including grants of employee stock options, in our Consolidated Statements of Operations and Other Comprehensive Income (Loss) based on the share-based payments’ fair values amortized straight-line over the period during which the employees are required to provide services in exchange for the equity instruments. We include an estimate of forfeitures when calculating compensation expense. We use the Black-Scholes method for valuing stock-based awards. See Note 11, “Share-Based Compensation,” for further information regarding the assumptions used to calculate share-based payment expense.
Employee Benefit Plan
We have a safe harbor 401(k) plan that allows participation by employees who have completed six months of service and are 21 years or older. Participants may defer up to 60% of their gross pay, up to a maximum limit determined by U.S. federal law. Participants receive a matching contribution after one year of service of 100% of the participant’s contribution for the first 3% and 50% of the participant’s contribution for the next 2%. Company matching contributions to the 401(k) plan totaled $650, $624 and $459 for the years ended December 31, 2009, 2008 and 2007, respectively.
2. IMPAIRMENT LOSSES AND RESTRUCTURING CHARGES
Impairment Losses
During the year ended December 31, 2009, we incurred $1,756 of impairment losses in our Canadian segment, due to the impairment of certain long-lived assets for which the carrying value of those assets is not recoverable. These assets are located in a facility for which we are uncertain about our ability to generate future cash flows to support the carrying value of these assets. The long-lived assets include computer and telephone equipment, furniture and fixtures, leasehold improvements and software. Refer to Note 8, “Fair Value Measurements,” for additional information on the fair value measurements for all assets and liabilities that are measured at fair value in the Consolidated Financial Statements.
During the year ended December 31, 2008, we recognized impairment losses of approximately $5,936. Approximately $1,794 related to the Canada segment, which was comprised of 1) $1,486 related to impairment of long-lived assets at certain Canadian locations in which the future cash flows were less than the carrying value of the assets and 2) $308 of leasehold improvements, furniture and fixtures and equipment in connection with the closure of our Hawkesbury, Ontario, Canada facility. Approximately $4,142 of impairment losses related to the U.S. segment, which comprised of 1) $1,189 related to the write-off of capitalized software costs for information technology infrastructure initiatives which management decided to discontinue, 2) $1,087 of leasehold improvements, furniture and fixtures and equipment in connection with the closure of our Big Spring, Texas facility, and 3) $1,866 of leasehold improvements, furniture and fixtures and equipment in connection with the closure of our Petersburg, Virginia facility.
Restructuring Charges
In August 2007, August 2008, December 2008 and February 2009, we closed facilities in Hawkesbury, Ontario, Big Spring, Texas, Petersburg, Virginia and Regina, Saskatchewan, respectively. We have recorded restructuring charges related to lease costs and other expenses related to the facility closures. We record expense in addition to the initially recorded expense when a change in estimate occurs or to accrete a discounted liability to the amount expected to be paid. We recognized the liability when it was incurred, instead of upon commitment to a plan.
During the year ended December 31, 2009, we entered into an agreement with the respective landlords at the facilities in Big Spring, Texas, Petersburg, Virginia and Hawkesbury, Ontario to buy-out our remaining lease obligations for $184 U.S. dollars, $813 U.S. dollars and $1,125 Canadian dollars, respectively. As of December 31, 2009, these payments have been made and we do not expect to incur any additional charges. The cumulative amount paid as of December 31, 2009 related to the closure of the facility in Regina, Saskatchewan was $1,294, and we expect to incur total restructuring charges of $5,667 (adjusted for the December 31, 2009 Canadian dollar to U.S. dollar exchange rate). We expect completion of the Regina restructuring plan no later than 2013; however, it may be earlier depending on our ability to sublease the facility or buy-out the lease. Refer to Note 8, “Fair Value Measurements,” for additional information on the fair value measurements for all assets and liabilities, including restructuring charges, that are measured at fair value in the Consolidated Financial Statements.
A summary of the activity under the restructuring plans as of December 31, 2009, and changes during the years ended December 31, 2009, 2008 and 2007 are presented below:
|
|
|
Facility-Related Costs |
|
|||||||||||||||||||
|
|
|
Hawkesbury |
|
Regina |
|
Canada |
|
Big Spring |
|
Petersburg |
|
U.S. Total |
|
Company |
|
|||||||
|
Balance as of January 1, 2007 |
|
$ |
— |
|
$ |
— |
|
$ |
— |
|
$ |
— |
|
$ |
— |
|
$ |
— |
|
$ |
— |
|
|
Expense |
|
742 |
|
— |
|
742 |
|
— |
|
— |
|
— |
|
742 |
|
|||||||
|
Payments |
|
(288 |
) |
— |
|
(288 |
) |
— |
|
— |
|
— |
|
(288 |
) |
|||||||
|
Reclassification from other liabilities |
|
48 |
|
— |
|
48 |
|
— |
|
— |
|
— |
|
48 |
|
|||||||
|
Foreign currency translation adjustment |
|
— |
|
— |
|
— |
|
— |
|
— |
|
— |
|
— |
|
|||||||
|
Balance as of December 31, 2007 |
|
$ |
502 |
|
$ |
— |
|
$ |
502 |
|
$ |
— |
|
$ |
— |
|
$ |
— |
|
$ |
502 |
|
|
Expense |
|
1,554 |
|
— |
|
1,554 |
|
271 |
|
1,464 |
|
1,735 |
|
3,289 |
|
|||||||
|
Payments |
|
(617 |
) |
— |
|
(617 |
) |
(195 |
) |
(158 |
) |
(353 |
) |
(970 |
) |
|||||||
|
Reclassification from other liabilities |
|
— |
|
— |
|
— |
|
132 |
|
96 |
|
228 |
|
228 |
|
|||||||
|
Foreign currency translation adjustment |
|
(340 |
) |
— |
|
(340 |
) |
— |
|
— |
|
— |
|
(340 |
) |
|||||||
|
Balance as of December 31, 2008 |
|
$ |
1,099 |
|
$ |
— |
|
$ |
1,099 |
|
$ |
208 |
|
$ |
1,402 |
|
$ |
1,610 |
|
$ |
2,709 |
|
|
Expense |
|
16 |
|
4,436 |
|
4,452 |
|
31 |
|
198 |
|
229 |
|
4,681 |
|
|||||||
|
Payments |
|
(1,582 |
) |
(1,294 |
) |
(2,876 |
) |
(239 |
) |
(1,334 |
) |
(1,573 |
) |
(4,449 |
) |
|||||||
|
Reclassification from other liabilities |
|
321 |
|
118 |
|
439 |
|
— |
|
(266 |
) |
(266 |
) |
173 |
|
|||||||
|
Foreign currency translation adjustment |
|
146 |
|
720 |
|
866 |
|
— |
|
— |
|
— |
|
866 |
|
|||||||
|
Balance as of December 31, 2009 |
|
$ |
— |
|
$ |
3,980 |
|
$ |
3,980 |
|
$ |
— |
|
$ |
— |
|
$ |
— |
|
$ |
3,980 |
|
3. DISCONTINUED OPERATIONS
On February 25, 2009, we entered into an agreement to sell the assets of Domain.com, our wholly owned subsidiary, to A. Emmet Stephenson, Jr., Inc. (“Mr. Stephenson”) in exchange for cash of $7,075. The assets of Domain.com consist of domain names, trademarks and corporation names. We conducted an auction for the assets and received bids from multiple parties, including Mr. Stephenson. Mr. Stephenson presented the highest bid, which represented the selling price, of $7,075 and the sale was completed effective February 25, 2009. Mr. Stephenson is one of our co-founders, has managed the Domain.com subsidiary since 2006 and owns approximately 20% of our common shares outstanding. Because the transaction involved a related party, the Audit Committee of our Board of Directors considered and approved the transaction. The results of operations and cash flows of Domain.com have been reported in the Consolidated Statements of Operations and Other Comprehensive Income (Loss) as discontinued operations.
During the year ended December 31, 2008, we recorded a loss from discontinued operations of $740 due to the write-off of an asset related to the sale of our supply chain management services platform in December 2005, less a tax benefit of $279.
The following table summarizes the results of discontinued operations:
|
|
|
Year Ended December 31, |
|
|||||||
|
|
|
2009 |
|
2008 |
|
2007 |
|
|||
|
Operating income from discontinued operations before income taxes |
|
$ |
27 |
|
$ |
402 |
|
$ |
522 |
|
|
Gain (loss) on the sale of discontinued operations |
|
6,937 |
|
(740 |
) |
— |
|
|||
|
Income tax (expense) benefit |
|
(2,324 |
) |
128 |
|
(196 |
) |
|||
|
Income (loss) from discontinued operations, net of tax |
|
$ |
4,640 |
|
$ |
(210 |
) |
$ |
326 |
|
4. NET INCOME (LOSS) PER SHARE
Basic net income (loss) per common share is computed on the basis of our weighted-average number of common shares outstanding. Diluted earnings per share is computed on the basis of our weighted average number of common shares outstanding plus the effect of dilutive outstanding stock options and non-vested restricted stock using the treasury stock method. Anti-dilutive securities totaling 1,808 for the year ended December 31, 2009 were not included in our calculation because the stock options’ exercise prices were greater than the average market price of the common shares during such period. Anti-dilutive securities totaling 1,690 and 1,660 for the years ended December 31, 2008 and 2007, respectively, were not included in our calculation due to our net loss position. Our basic and diluted net income (loss) per common share were as follows:
|
|
|
Year Ended December 31, |
|
|||||||
|
|
|
2009 |
|
2008 |
|
2007 |
|
|||
|
|
|
|
|
|
|
|
|
|||
|
Income (loss) from continuing operations |
|
$ |
9 |
|
$ |
(9,691 |
) |
$ |
(3,157 |
) |
|
Income (loss) from discontinued operations, net of tax |
|
4,640 |
|
(210 |
) |
326 |
|
|||
|
Net income (loss) |
|
$ |
4,649 |
|
$ |
(9,901 |
) |
$ |
(2,831 |
) |
|
|
|
|
|
|
|
|
|
|||
|
Weighted average shares of common stock |
|
14,792 |
|
14,713 |
|
14,696 |
|
|||
|
Dilutive effect of stock options |
|
45 |
|
— |
|
— |
|
|||
|
Common stock and common stock equivalents |
|
14,837 |
|
14,713 |
|
14,696 |
|
|||
|
|
|
|
|
|
|
|
|
|||
|
Basic net income (loss) per share from: |
|
|
|
|
|
|
|
|||
|
Continuing operations |
|
$ |
0.00 |
|
$ |
(0.66 |
) |
$ |
(0.21 |
) |
|
Discontinued operations |
|
0.31 |
|
(0.01 |
) |
0.02 |
|
|||
|
Net income (loss) |
|
$ |
0.31 |
|
$ |
(0.67 |
) |
$ |
(0.19 |
) |
|
|
|
|
|
|
|
|
|
|||
|
Diluted net income (loss) per share from: |
|
|
|
|
|
|
|
|||
|
Continuing operations |
|
$ |
0.00 |
|
$ |
(0.66 |
) |
$ |
(0.21 |
) |
|
Discontinued operations |
|
0.31 |
|
(0.01 |
) |
0.02 |
|
|||
|
Net income (loss) |
|
$ |
0.31 |
|
$ |
(0.67 |
) |
$ |
(0.19 |
) |
5. PRINCIPAL CLIENTS
The following table represents revenue concentration of our principal clients.
|
|
|
Year Ended December 31, |
|
||||
|
|
|
2009 |
|
2008 |
|
2007 |
|
|
AT&T Services, Inc. and AT&T Mobility, LLC, subsidiaries of AT&T, Inc. |
|
63.6 |
% |
55.0 |
% |
50.5 |
% |
|
T-Mobile USA, Inc., a subsidiary of Deutsche Telekom |
|
21.5 |
% |
26.8 |
% |
21.9 |
% |
The revenues from AT&T and T-Mobile were generated in our U.S. and Canada segments during 2009, 2008 and 2007. During 2008 and 2009, a portion of the revenue in our Offshore segment related to AT&T. The loss of a principal client and/or changes in timing or termination of a principal client’s product launch, volume delivery or service offering would have a material adverse effect on our business, revenue, operating results, and financial condition. To limit our credit risk, management from time to time will perform credit evaluations of our clients. Although we are directly impacted by the economic conditions in which our clients operate, management does not believe substantial credit risk existed as of December 31, 2009.
Our work for AT&T is covered by several contracts for a variety of different lines of AT&T business. Some of these contracts expire in 2010 and others in 2011. The initial term of our master services agreement covering all AT&T work expired in January 2010. After the initial term, the agreement automatically renews month-to-month. We are currently renegotiating the new master services agreement. Until the new agreement is signed, our services provided to AT&T are covered under the existing master services agreement.
Our call center services agreement with T-Mobile is effective as of October 1, 2007 which had an initial term of two years. After the initial term, the contract automatically renews for one-year periods thereafter, unless either party provides written notice of termination at least 60 days prior to the expiration of the then-current term. Although the initial term of the contract ended on September 30, 2009, the contract automatically renewed for a one-year term which would expire on September 30, 2010. We are currently negotiating a new contract with T-Mobile. Until the new agreement is signed, our services provided to T-Mobile are covered under the existing agreement effective October 1, 2007.
We are working diligently to complete negotiation of the new agreements. However, if we fail to do so, it would have a material adverse effect on our business, results of operations, and financial condition.
6. INVESTMENTS
As of December 31, 2009 and 2008, investments available for sale consisted of:
|
|
|
Basis |
|
Gross |
|
Gross |
|
Fair Value |
|
||||
|
As of December 31, 2009: |
|
|
|
|
|
|
|
|
|
||||
|
Corporate debt securities |
|
$ |
499 |
|
$ |
1 |
|
$ |
— |
|
$ |
500 |
|
|
|
|
|
|
|
|
|
|
|
|
||||
|
As of December 31, 2008: |
|
|
|
|
|
|
|
|
|
||||
|
Corporate debt securities |
|
$ |
8,513 |
|
$ |
9 |
|
$ |
(85 |
) |
$ |
8,437 |
|
During the year ended December 31, 2008, we recognized a loss totaling $500 (representing the entire purchase basis amount) on a Lehman Brothers corporate debt security that was determined to be other-than-temporarily impaired due to their bankruptcy announcement. The Lehman Brothers corporate debt security was in an unrealized loss position for eleven months prior to the recognition of the other-than-temporary impairment. We did not record any other-than-temporary impairments for the years ended December 31, 2009 or 2008.
The following table summarizes the aggregate fair value of those investments in a gross unrealized loss position:
|
|
|
As of |
|
||||
|
|
|
December 31, 2009 |
|
December 31, 2008 |
|
||
|
Investments in a continuous unrealized loss position for less than 12 months |
|
|
|
|
|
||
|
Aggregate unrealized losses on corporate debt securities |
|
$ |
— |
|
$ |
(38 |
) |
|
Aggregate fair value of corporate debt securities |
|
— |
|
1,996 |
|
||
|
|
|
|
|
|
|
||
|
Investments in a continuous unrealized loss position for greater than 12 months |
|
|
|
|
|
||
|
Aggregate unrealized losses on corporate debt securities |
|
$ |
— |
|
$ |
(47 |
) |
|
Aggregate fair value of corporate debt securities |
|
— |
|
3,447 |
|
||
Proceeds from the sale of investment securities available for sale were $8,019, $18,742 and $26,348 in 2009, 2008 and 2007, respectively; gross realized gains included in other income in 2009, 2008 and 2007 were $5, $1 and $0, respectively; and gross realized losses included in other income in 2009, 2008 and 2007 were $2, $501 and $0, respectively. As of December 31, 2009, all of our investments available for sale are set to mature within one year.
7. DERIVATIVE INSTRUMENTS
We use derivatives to partially offset our business exposure to foreign currency exchange risk. We enter into foreign currency exchange contracts to hedge our anticipated operating commitments that are denominated in foreign currencies. The contracts cover periods commensurate with expected exposure, generally three to nine months, and are principally unsecured foreign exchange contracts. The market risk exposure is essentially limited to risk related to currency rate movements. We operate in Canada and the Philippines and are initiating operations in Costa Rica, and the functional currencies in those countries are the Canadian dollar, the Philippine peso, and the Costa Rican colon, respectively, which are used to pay labor and other operating costs in those countries. However, our client contracts primarily generate revenues which are paid to us in U.S. dollars.
During the years ended December 31, 2009, 2008 and 2007, we entered into Canadian dollar forward contracts with Wells Fargo Bank and UMB Bank for a notional amount of 44,080, 98,400 and 78,700 Canadian dollars, respectively, to hedge our foreign currency risk with respect to labor costs in Canada. As of December 31, 2009, we have not entered into any arrangements to hedge our exposure to fluctuations in the Philippine peso or Costa Rican colon relative to the U.S. dollar.
The following table shows the notional principal of our derivative instruments as of December 31, 2009:
|
|
|
Currency |
|
Notional |
|
|
Instruments qualifying as accounting hedges: |
|
|
|
|
|
|
Foreign exchange contracts |
|
Canadian dollar |
|
30,580 |
|
The above foreign exchange contracts are to be delivered periodically through June 2010 at a purchase price of approximately $28,579. The estimates of fair value are based on applicable and commonly used pricing models and prevailing financial market information as of December 31, 2009. Refer to Note 8, “Fair Value Measurements,” for additional information on the fair value measurements for all assets and liabilities, including derivative assets and derivative liabilities, that are measured at fair value in the Consolidated Financial Statements.
The following table shows our derivative instruments measured at gross fair value as reflected in the Consolidated Balance Sheet in other current assets and/or derivative liability as of December 31, 2009 and 2008:
|
|
|
As of December 31, |
|
||||
|
|
|
2009 |
|
2008 |
|
||
|
Derivative assets: |
|
|
|
|
|
||
|
Foreign exchange contracts |
|
$ |
628 |
|
$ |
316 |
|
|
|
|
|
|
|
|
||
|
Derivative liabilities: |
|
|
|
|
|
||
|
Foreign exchange contracts |
|
$ |
— |
|
$ |
(2,639 |
) |
The following table shows the effect of our derivative instruments designated as cash flow hedges in the Consolidated Statement of Operations for the years ended December 31, 2009 and 2008:
|
|
|
Years Ended |
|
Location of Gain |
|
||||||||||
|
|
|
December 31, 2009 |
|
December 31, 2008 |
|
(Loss) |
|
||||||||
|
|
|
Gain Recognized |
|
Gain Reclassified |
|
Loss Recognized |
|
Loss Reclassified |
|
Reclassified from |
|
||||
|
|
|
in AOCI, net of |
|
from AOCI into |
|
in AOCI, net of |
|
from AOCI into |
|
AOCI into |
|
||||
|
|
|
tax |
|
Income |
|
tax |
|
Income |
|
Income |
|
||||
|
Cash flow hedges: |
|
|
|
|
|
|
|
|
|
|
|
||||
|
Foreign exchange contracts |
|
$ |
1,184 |
|
$ |
1,047 |
|
$ |
620 |
|
$ |
3,445 |
|
Cost of services |
|
8. FAIR VALUE MEASUREMENTS
Investments
As of December 31, 2009 and 2008, our investments consisted entirely of corporate debt securities. Our corporate debt securities are based on quoted market information. The inputs to the valuation are generally classified as Level 1 given the active market for these securities; however, if an active market does not exist, the inputs are recorded at a lower level in the fair value hierarchy.
Derivative Instruments and Hedging Activities
The values of our derivative instruments are derived from pricing models using inputs based upon market information, including contractual terms, market prices and yield curves. The inputs to the valuation pricing models are observable in the market, and as such are generally classified as Level 2 in the fair value hierarchy.
Restructuring Charges
Accrued restructuring costs were valued using a discounted cash flow model. Significant assumptions used in determining the amount of the estimated liability for closing a facility are the estimated liability for future lease payments on vacant facilities, which we determine based on a third-party broker’s assessment of our ability to successfully negotiate early termination agreements with landlords and/or to sublease the facility, and the discount rate utilized to determine the present value of the future expected cash flows. If the assumptions regarding early termination and the timing and amounts of sublease payments prove to be inaccurate, we may be required to record additional losses, or conversely, a future gain, in the Consolidated Statements of Operations and Other Comprehensive Income (Loss).
As described in Note 2, “Impairment Losses and Restructuring Charges,” during the year ended December 31, 2009, we closed our facility in Regina, Saskatchewan, which resulted in $4,436 of accrued restructuring costs for the year then ended. These costs were valued using a discounted cash flow model. The cash flows consist of the future lease payment obligations required under the lease agreement. We assumed that we could not sublease the vacant facility for the remainder of the lease term based on our knowledge of the Regina marketplace, as well as our historical inability to sublease our facilities in other locations in which we operate. In the future, if we are able to sublease the facility, we may be required to record a gain in the Consolidated Statements of Operations and Other Comprehensive Income (Loss). Future cash flows also include estimated property taxes through the remainder of the lease
term, which are valued based upon historical tax payments. The future cash flows were discounted using a rate of 3%. Given that the restructuring charges were valued using our internal estimates using a discounted cash flow model, we have classified the accrued restructuring costs as Level 3 in the fair value hierarchy.
Impairment of Long-Lived Assets
As described in Note 2, “Impairment Losses and Restructuring Charges,” during the year ended December 31, 2009, we recorded approximately $1,756 of impairment losses in our Canadian segment, due to the impairment of certain long-lived assets for which the carrying value of those assets is not recoverable. The fair value of these long-lived assets after the impairment charge was $228. Given that the impairment losses were valued using internal estimates, we have classified the remaining fair value of long-lived assets as Level 3 in the fair value hierarchy.
Fair Value Hierarchy
The following tables set forth our assets and liabilities measured at fair value on a recurring basis and a non-recurring basis by level within the fair value hierarchy. Assets and liabilities are classified in their entirety based on the lowest level of input that is significant to the fair value measurement.
|
|
|
Assets Measured at Fair Value |
|
||||||||||
|
|
|
on a Recurring Basis as of December 31, 2009 |
|
||||||||||
|
|
|
Level 1 |
|
Level 2 |
|
Level 3 |
|
Total |
|
||||
|
Assets: |
|
|
|
|
|
|
|
|
|
||||
|
Corporate debt securities |
|
$ |
500 |
|
$ |
— |
|
$ |
— |
|
$ |
500 |
|
|
Derivative instruments |
|
— |
|
628 |
|
— |
|
628 |
|
||||
|
Total fair value of assets measured on a recurring basis |
|
$ |
500 |
|
$ |
628 |
|
$ |
— |
|
$ |
1,128 |
|
|
|
|
Assets and Liabilities Measured at Fair Value on a |
|
||||||||||
|
|
|
Non-Recurring Basis During the Year ended December 31, 2009 |
|
||||||||||
|
|
|
Level 1 |
|
Level 2 |
|
Level 3 |
|
Total |
|
||||
|
Assets: |
|
|
|
|
|
|
|
|
|
||||
|
Property, plant and equipment, net |
|
$ |
— |
|
$ |
— |
|
$ |
228 |
|
$ |
228 |
|
|
Total fair value of assets measured on a non-recurring basis |
|
$ |
— |
|
$ |
— |
|
$ |
228 |
|
$ |
228 |
|
|
|
|
|
|
|
|
|
|
|
|
||||
|
Liabilities: |
|
|
|
|
|
|
|
|
|
||||
|
Accrued restructuring costs |
|
$ |
— |
|
$ |
— |
|
$ |
4,436 |
|
$ |
4,436 |
|
|
Total fair value of liabilities measured on a non-recurring basis |
|
$ |
— |
|
$ |
— |
|
$ |
4,436 |
|
$ |
4,436 |
|
9. PROPERTY, PLANT & EQUIPMENT
Our property, plant and equipment as of December 31, 2009 and 2008, consisted of the following, by asset class:
|
|
|
As of December 31, |
|
||||
|
|
|
2009 |
|
2008 |
|
||
|
Land |
|
$ |
1,715 |
|
$ |
1,671 |
|
|
Buildings and improvements |
|
49,217 |
|
47,895 |
|
||
|
Telephone and computer equipment |
|
53,052 |
|
48,092 |
|
||
|
Software |
|
37,353 |
|
29,937 |
|
||
|
Furniture, fixtures, and miscellaneous equipment |
|
22,835 |
|
21,285 |
|
||
|
Construction in progress |
|
4,133 |
|
3,388 |
|
||
|
|
|
168,305 |
|
152,268 |
|
||
|
Less accumulated depreciation |
|
(110,260 |
) |
(92,660 |
) |
||
|
Total property, plant and equipment, net |
|
$ |
58,045 |
|
$ |
59,608 |
|
10. DEBT
As of December 31, 2009 and 2008, respectively, we had the following balances outstanding on our long-term debt facilities:
|
|
|
As of December 31, |
|
||||
|
|
|
2009 |
|
2008 |
|
||
|
Secured equipment promissory note |
|
$ |
— |
|
$ |
2,484 |
|
|
Canadian dollar secured equipment loan |
|
— |
|
4,010 |
|
||
|
Total debt |
|
— |
|
6,494 |
|
||
|
Less current portion of long-term debt |
|
— |
|
(3,295 |
) |
||
|
Long-term debt, less current portion |
|
$ |
— |
|
$ |
3,199 |
|
Line of Credit
On June 26, 2009, we entered into a business loan agreement, promissory note and three commercial security agreements (together the “Agreement”) with UMB Bank Colorado, N.A. (“UMB Bank”) for a $15 million secured revolving line of credit. The Agreement is effective July 1, 2009 through August 1, 2010. This Agreement replaced our $10 million secured revolving line of credit with Wells Fargo Bank N.A., which expired by its terms on June 30, 2009. There was no balance outstanding on the line of credit with UMB Bank as of December 31, 2009.
Borrowings under the Agreement bear interest, at our option at the time of the borrowing, of the thirty, sixty or ninety day LIBOR index, plus 1.75%. The interest rate shall never be less than 3.25% per annum. Under the Agreement, we granted UMB Bank a security interest in all of our present and future accounts receivable, general intangibles, and owned real property. In addition, under the Agreement, we are subject to certain financial covenants, which include maintaining 1) a ratio of total liabilities to tangible net worth of less than 1.0 to 1.0, 2) a tangible net worth of at least $105 million, 3) unencumbered liquid assets, defined as cash, certificate of deposits and marketable securities, of at least $10 million measured on the last day of each fiscal quarter and 4) a cash flow coverage ratio, as defined in the Agreement, of greater than 1.50 to 1.0 measured on the last day of each fiscal quarter for the previous twelve months. As of December 31, 2009, we were in compliance with our debt covenants.
Secured Equipment Promissory Note
On November 17, 2006, our subsidiary, StarTek USA, Inc., borrowed approximately $4.9 million from Wells Fargo Equipment Finance, Inc. As of December 31, 2008, we had an outstanding balance of approximately $2.5 million. In May 2009, we paid the remaining principal balance of approximately $2.1 million. The original maturity date was in November 2010.
Canadian Dollar Secured Equipment Loan
On November 17, 2006, StarTek Canada Services, Ltd., one of our subsidiaries, borrowed approximately $9.6 million Canadian dollars from Wells Fargo Equipment Finance Company, Inc. As of December 31, 2008, we had an outstanding balance of approximately $4.0 million. In May 2009, we paid the remaining principal balance of approximately $3.6 million. The original maturity date was in November 2010.
11. SHARE-BASED COMPENSATION
On May 5, 2008, our stockholders approved the StarTek, Inc. 2008 Equity Incentive Plan (the “Plan”). The Plan replaced the StarTek, Inc. Stock Option Plan and StarTek, Inc. Directors’ Stock Option Plan (together, the “Prior Plans”). A total of 900,000 shares were authorized for grant under the Plan. In addition, a total of 274,298 shares remaining available for future grants under the Prior Plans were carried over and were made available for grant under the Plan. As of December 31, 2009, there were 590,319 shares available for future grant under our equity compensation plans. The types of awards that may be granted under the Plan include restricted stock awards, restricted stock unit awards, stock option awards, stock appreciation rights and performance units. The Compensation Committee (the “Committee”) also has the discretion to grant other types of awards, as long as they are consistent with the terms and purposes of the Plan. The terms of the awards granted under the Plan will expire no later than ten years from the grant date. The Committee may determine the vesting conditions of awards; however, subject to certain exceptions, an award that is not subject to the satisfaction of performance measures may not fully vest or become fully exercisable earlier than three years from the grant date, and the performance period for an award subject to performance measures may not be shorter than one year.
Stock options granted to employees under the Plan vest as to 25% of the shares on the first anniversary of the date of grant and 2.0833% of the shares each month thereafter for 36 months. Restricted stock awards granted under the Plan vest as to one third of the shares on the first anniversary of the date of grant and one third of the shares on each of the second and third anniversary thereafter. Stock options or restricted stock awards granted to our board of directors under the Plan vest as to 25% of the shares after three months from the date of grant, 25% of the shares after six months from the date of grant, 25% of the shares after nine months from the date of grant and 25% each three months thereafter until fully vested.
On May 5, 2008, our stockholders approved the StarTek, Inc. Employee Stock Purchase Plan (the “ESPP”). Under the ESPP, participants may purchase our common stock as of the last day of a purchase period at a price, which shall be no less than the lesser of (a) 85% of the closing price of a share of common stock on the first day of the purchase period; or (b) 85% of the closing price of a share of common stock on the last day of the purchase period. The purchase period is defined as each quarterly period commencing January 1 and ending March 31, commencing April 1 and ending June 30, commencing July 1 and ending September 30, or commencing October 1 and ending December 31, unless otherwise determined by the Committee. Subject to certain maximum stock ownership restrictions, employees are eligible to participate in the ESPP if employed by the Company for at least six months prior to the start of a Purchase Period and whose customary employment is at least 20 hours per week. Participating employees may elect to have up to 10% of their base pay in effect at the commencement of each offering period withheld pursuant to the ESPP.
The compensation cost that has been charged against income for the Plan, the Prior Plans, the ESPP, and for restricted stock awards granted outside of those plans, as described below (together, the “Plans”), for the years ended December 31, 2009, 2008 and 2007 was $1,987, $1,493 and $1,107, respectively, and is included in selling, general and administrative expense. As of December 31, 2009, there was $3,176 of total unrecognized compensation cost related to nonvested stock options granted under the Plans. That cost is expected to be recognized over a weighted-average period of 2.42 years. As of December 31, 2009, there was $198 of total unrecognized compensation cost related to nonvested restricted stock awards granted under the Plans. That cost is expected to be recognized over a weighted-average period of 1.1 years.
Stock Options
A summary of stock option activity under the Plans as of December 31, 2009, and changes during the year ended December 31, 2009 are presented below:
|
|
|
|
|
Weighted |
|
Weighted-Average |
|
Aggregate |
|
||
|
|
|
|
|
Average |
|
Remaining |
|
Intrinsic |
|
||
|
|
|
Shares |
|
Exercise Price |
|
Contractual Term (in yrs) |
|
Value |
|
||
|
Outstanding as of January 1, 2009 |
|
1,628,702 |
|
$ |
11.45 |
|
|
|
|
|
|
|
Granted |
|
773,500 |
|
4.78 |
|
|
|
|
|
||
|
Exercised |
|
(5,082 |
) |
3.00 |
|
|
|
|
|
||
|
Forfeited |
|
(232,292 |
) |
10.29 |
|
|
|
|
|
||
|
Expired |
|
(24,100 |
) |
33.53 |
|
|
|
|
|
||
|
Outstanding as of December 31, 2009 |
|
2,140,728 |
|
$ |
8.93 |
|
7.87 |
|
$ |
2,190 |
|
|
Vested and exercisable as of December 31, 2009 |
|
852,925 |
|
$ |
12.20 |
|
6.80 |
|
$ |
44 |
|
|
Vested and expected to vest as of December 31, 2009 |
|
1,892,749 |
|
$ |
8.13 |
|
8.07 |
|
$ |
1,872 |
|
The weighted-average grant date fair value of options granted during the years ended December 31, 2009, 2008 and 2007 was $2.42, $3.20 and $4.10, respectively. The total fair value of shares vested during the years ended December 31, 2009, 2008 and 2007 was $1,361, $2,408 and $389, respectively.
The assumptions used to determine the value of our stock-based awards under the Black-Scholes method are summarized below:
|
|
|
2009 |
|
2008 |
|
2007 |
|
|
Risk-free interest rate |
|
0.55% - 2.66% |
|
1.26% - 3.60% |
|
3.16% - 4.74% |
|
|
Dividend yield |
|
0% |
|
0% |
|
0% |
|
|
Expected volatility |
|
61.38% - 117.38% |
|
43.81% - 57.62% |
|
43.12% - 50.47% |
|
|
Expected life in years |
|
3.9 |
|
4.1 |
|
4.3 |
|
The risk-free interest rate for periods within the contractual life of the option is based on either the four year or seven year U.S. Treasury strip yield in effect at the time of grant. Expected life and volatilities are based on historical experience, which we believe will be indicative of future experience.
Restricted Stock Awards
A summary of restricted stock award activity under the Plans as of December 31, 2009, and changes during the years ended December 31, 2009, 2008 and 2007 are presented below:
|
|
|
Number of |
|
Weighted-Average |
|
|
|
|
|
Restricted Shares |
|
Grant Date Fair Value |
|
|
|
Nonvested balance as of January 1, 2009 |
|
62,067 |
|
$ |
10.45 |
|
|
Granted |
|
7,200 |
|
4.76 |
|
|
|
Vested |
|
(21,329 |
) |
8.45 |
|
|
|
Forfeited |
|
(3,000 |
) |
9.01 |
|
|
|
Nonvested balance as of December 31, 2009 |
|
44,938 |
|
$ |
10.58 |
|
Included in the table above are grants of restricted stock awards made outside the Plan or the Prior Plans to A. Laurence Jones and David G. Durham. On January 5, 2007, Mr. A. Laurence Jones was granted 30,000 restricted shares pursuant to his appointment as President and Chief Executive Officer. These shares vest as follows: 10,000 shares on January 5, 2008 and 20,000 shares on January 5, 2011, provided that the restrictions on the 20,000 share tranche may lapse earlier pursuant to certain performance criteria. The performance criteria specify that the 20,000 share tranche may vest as to 10,000 shares upon certification by the Committee that Mr. Jones achieved at least 80% performance of specified criteria for the 2008 fiscal year and 10,000 shares upon certification by the Committee that Mr. Jones achieved at least 80% performance of specified criteria for the 2009 fiscal year. The Committee determined that Mr. Jones did not achieve the performance criteria for the 2008 fiscal year, and did achieve the performance criteria for the 2009 fiscal year. As such, 10,000 of such shares vested in February 2010. On September 10, 2007, Mr. David G. Durham was granted 10,000 restricted shares pursuant to his appointment as Executive Vice President, Treasurer, and Chief Financial Officer. These shares vest in the same manner as those restricted shares granted under the Plan. The total fair value of restricted stock awards vested during the years ended December 31, 2009, 2008 and 2007 was $180, $213 and $0, respectively.
Employee Stock Purchase Plan
The first purchase period under the ESPP commenced July 1, 2008. During 2009, we completed four offering periods in which 60,045 shares were purchased at a weighted-average price of $4.14 per share. During 2008, we completed two offering periods in which 37,321 shares were purchased at a weighted-average price of $4.62 per share. Total expense recognized related to the ESPP during the years ended December 31, 2009 and 2008 was $130 and $68, respectively. The assumptions used to value the shares under the ESPP using the Black-Scholes method were as follows:
|
|
|
2009 |
|
2008 |
|
|
Risk-free interest rate |
|
0.08% - 0.22% |
|
0.85% - 1.87% |
|
|
Dividend yield |
|
0% |
|
0% |
|
|
Expected volatility |
|
75.28% - 160.19% |
|
34.06% - 39.82% |
|
|
Expected life in years |
|
3 months |
|
3 months |
|
The weighted average grant date fair value of these shares was $2.16 and $1.80 per share during the year ended December 31, 2009 and 2008, respectively.
12. NET INTEREST AND OTHER INCOME
Net interest and other income for the years ended December 31, 2009, 2008 and 2007 were composed of the following:
|
|
|
Year Ended December 31, |
|
|||||||
|
|
|
2009 |
|
2008 |
|
2007 |
|
|||
|
Interest income |
|
$ |
119 |
|
$ |
1,210 |
|
$ |
1,579 |
|
|
Interest expense |
|
(291 |
) |
(726 |
) |
(854 |
) |
|||
|
Realized loss on investments available for sale |
|
— |
|
(500 |
) |
— |
|
|||
|
Investment and other loss |
|
(38 |
) |
71 |
|
20 |
|
|||
|
Net interest and other income |
|
$ |
(210 |
) |
$ |
55 |
|
$ |
745 |
|
13. INCOME TAXES
Pre-tax income from continuing operations before income taxes was:
|
|
|
Year Ended December 31, |
|
|||||||
|
|
|
2009 |
|
2008 |
|
2007 |
|
|||
|
U.S. |
|
$ |
1,168 |
|
$ |
(16,285 |
) |
$ |
(8,332 |
) |
|
Foreign |
|
(1,910 |
) |
293 |
|
4,456 |
|
|||
|
Total |
|
$ |
(742 |
) |
$ |
(15,992 |
) |
$ |
(3,876 |
) |
Significant components of the provision for income taxes from continuing operations were:
|
|
|
Year Ended December 31, |
|
|||||||
|
|
|
2009 |
|
2008 |
|
2007 |
|
|||
|
Current: |
|
|
|
|
|
|
|
|||
|
Federal |
|
$ |
(7,408 |
) |
$ |
(970 |
) |
$ |
(2,070 |
) |
|
State |
|
(246 |
) |
(127 |
) |
(224 |
) |
|||
|
Foreign |
|
101 |
|
1,872 |
|
1,159 |
|
|||
|
Total current (benefit) expense |
|
$ |
(7,553 |
) |
$ |
775 |
|
$ |
(1,135 |
) |
|
|
|
|
|
|
|
|
|
|||
|
Deferred: |
|
|
|
|
|
|
|
|||
|
Federal |
|
$ |
7,402 |
|
$ |
(5,241 |
) |
$ |
(1,554 |
) |
|
State |
|
245 |
|
(682 |
) |
(169 |
) |
|||
|
Foreign |
|
(845 |
) |
(1,108 |
) |
421 |
|
|||
|
Net change in valuation allowance |
|
— |
|
(45 |
) |
1,718 |
|
|||
|
Total deferred expense (benefit) |
|
$ |
6,802 |
|
$ |
(7,076 |
) |
$ |
416 |
|
|
|
|
|
|
|
|
|
|
|||
|
Income tax benefit |
|
$ |
(751 |
) |
$ |
(6,301 |
) |
$ |
(719 |
) |
Significant components of deferred tax assets and deferred tax liabilities included in the accompanying Consolidated Balance Sheets as of December 31, 2009 and 2008 were:
|
|
|
Year Ended December 31, |
|
||||
|
|
|
2009 |
|
2008 |
|
||
|
Current deferred tax assets: |
|
|
|
|
|
||
|
Accrued liabilities |
|
$ |
— |
|
$ |
933 |
|
|
Restructuring costs |
|
401 |
|
223 |
|
||
|
Impairment of assets |
|
— |
|
1,117 |
|
||
|
Unrealized loss on investments and derivative instruments |
|
— |
|
916 |
|
||
|
Other |
|
110 |
|
201 |
|
||
|
Total current net deferred tax assets |
|
$ |
511 |
|
$ |
3,390 |
|
|
|
|
|
|
|
|
||
|
Current deferred tax assets (liabilities): |
|
|
|
|
|
||
|
Accrued liabilities |
|
$ |
861 |
|
$ |
— |
|
|
State NOL carryforward |
|
271 |
|
— |
|
||
|
Unrealized gain on investments and derivative instruments |
|
(230 |
) |
|
|
||
|
Prepaid expenses |
|
(1,189 |
) |
(542 |
) |
||
|
Cumulative translation adjustment |
|
(1,183 |
) |
(663 |
) |
||
|
Total current net deferred tax liabilities |
|
$ |
(1,470 |
) |
$ |
(1,205 |
) |
|
|
|
|
|
|
|
||
|
Long-term deferred tax assets (liabilities): |
|
|
|
|
|
||
|
Depreciation and amortization |
|
$ |
(634 |
) |
$ |
(817 |
) |
|
Loss on impaired investments |
|
— |
|
986 |
|
||
|
Foreign tax credit carryforward |
|
554 |
|
554 |
|
||
|
Stock-based compensation |
|
1,410 |
|
921 |
|
||
|
Work opportunity credit carryforward |
|
2,800 |
|
3,048 |
|
||
|
Operating loss caryforward |
|
— |
|
3,823 |
|
||
|
Accrued restructuring |
|
811 |
|
538 |
|
||
|
Other |
|
143 |
|
737 |
|
||
|
Net long-term deferred tax assets |
|
$ |
5,084 |
|
$ |
9,790 |
|
|
|
|
|
|
|
|
||
|
Subtotal |
|
$ |
4,125 |
|
$ |
11,975 |
|
|
Valuation allowance |
|
(555 |
) |
(844 |
) |
||
|
|
|
|
|
|
|
||
|
Total net deferred tax asset |
|
$ |
3,570 |
|
$ |
11,131 |
|
As of December 31, 2009, we had net current deferred tax assets in our foreign tax jurisdictions and net current deferred tax liabilities in the U.S. As of December 31, 2008, we had net current deferred tax assets in both our foreign tax jurisdictions and in the U.S.
Deferred taxes are not recognized on temporary differences from undistributed earnings of foreign subsidiaries of approximately $25,000 as these earnings are deemed to be permanently reinvested. We have not provided for U.S. federal income and foreign withholding taxes on undistributed earnings from non-U.S. operations as of December 31, 2009 because we intend to reinvest such earnings indefinitely outside of the U.S.
Differences between U.S. federal statutory income tax rates and our effective tax rates for the years ended December 31, 2009, 2008 and 2007 for continuing operations were:
|
|
|
Year Ended December 31, |
|
||||
|
|
|
2009 |
|
2008 |
|
2007 |
|
|
U.S. statutory tax rate |
|
35.0 |
% |
35.0 |
% |
35.0 |
% |
|
Effect of state taxes (net of federal benefit) |
|
-11.9 |
% |
2.5 |
% |
4.5 |
% |
|
Effect of change in Canadian tax rate |
|
-14.0 |
% |
-2.3 |
% |
0.0 |
% |
|
Capital loss valuation allowance |
|
0.0 |
% |
0.3 |
% |
-44.3 |
% |
|
Work opportunity tax credits |
|
142.6 |
% |
5.3 |
% |
21.5 |
% |
|
Other permanent differences (including meals and entertainment) |
|
-21.7 |
% |
-1.0 |
% |
-2.3 |
% |
|
Stock based compensation |
|
-19.0 |
% |
0.0 |
% |
0.0 |
% |
|
Other, net |
|
-9.8 |
% |
-0.4 |
% |
4.2 |
% |
|
Total |
|
101.2 |
% |
39.4 |
% |
18.6 |
% |
As of December 31, 2009, we had gross foreign tax credit carry forwards of $555, which expire as follows: $25 in 2011, $4 in 2012, and $526 in 2013. A full tax-basis valuation allowance was established against these carry forwards during 2006 due to the fact that it is more likely than not that these credits will not be used prior to their expiration date. As of December 31, 2008, we had gross federal net operating loss carry forwards of $10,017. These federal net operating loss carry forwards were utilized during 2009 and no federal net operating loss carry forwards exist as of December 31, 2009.
We have been granted “Tax Holidays” as an incentive to attract foreign investment by the governments of the Philippines and Costa Rica. Generally, a Tax Holiday is an agreement between us and a foreign government under which we receive certain tax benefits in that country, such as exemption from taxation on profits derived from export-related activities. In the Philippines, we have been granted approval for a Tax Holiday, whereby we have an exemption from income tax until 2012. In Costa Rica, we have been granted approval for an exemption equal to 100% of income tax for eight years beginning with the commencement of operations, which is expected in March 2010, and for 50% of income tax for the four years thereafter. The aggregate effect on income tax expense for the years ended December 31, 2009, 2008 and 2007 was $216, $0 and $0, respectively, which had a favorable impact on net income of $0.01 per share, $0 and $0, respectively.
14. ACCUMULATED OTHER COMPREHENSIVE INCOME (LOSS)
Accumulated other comprehensive income (loss) consisted of the following items:
|
|
|
Year Ended December 31, |
|
||||
|
|
|
2009 |
|
2008 |
|
||
|
Accumulated foreign currency translation adjustments: |
|
|
|
|
|
||
|
Beginning balance |
|
$ |
1,090 |
|
$ |
2,553 |
|
|
Translation adjustments |
|
1,420 |
|
(2,057 |
) |
||
|
Taxes associated with translation adjustments |
|
(519 |
) |
594 |
|
||
|
Ending balance |
|
$ |
1,991 |
|
$ |
1,090 |
|
|
Accumulated unrealized derivative (losses) gains: |
|
|
|
|
|
||
|
Beginning balance |
|
$ |
(1,444 |
) |
$ |
20 |
|
|
Gain (loss) reclassified to earnings, net of tax |
|
654 |
|
(2,084 |
) |
||
|
Change in fair value of cash flow hedges, net of tax |
|
1,184 |
|
620 |
|
||
|
Ending balance |
|
$ |
394 |
|
$ |
(1,444 |
) |
|
Accumulated unrealized losses on available for sale securities: |
|
|
|
|
|
||
|
Beginning balance |
|
$ |
(61 |
) |
$ |
(29 |
) |
|
Gain (loss) reclassified to earnings, net of tax |
|
1 |
|
(303 |
) |
||
|
Change in fair value of available for sale securities, net of tax |
|
48 |
|
271 |
|
||
|
Ending balance |
|
$ |
(12 |
) |
$ |
(61 |
) |
15. COMMITMENTS AND CONTINGENCIES
Leases
We lease facilities and equipment under various non-cancelable operating leases. Some of these leases have renewal clauses that vary both in length and fee, based on our negotiations with the lessors. Rental expense, including equipment rentals, for 2009, 2008 and
2007 was $7,652, $6,900 and $4,602, respectively. As of December 31, 2009, future minimum rental commitments for operating leases were:
|
|
|
Minimum Lease |
|
|
|
|
|
Payments |
|
|
|
2010 |
|
$ |
7,527 |
|
|
2011 |
|
6,453 |
|
|
|
2012 |
|
4,707 |
|
|
|
2013 |
|
3,782 |
|
|
|
2014 |
|
3,500 |
|
|
|
Thereafter |
|
6,508 |
|
|
|
Total minimum lease payments |
|
$ |
32,477 |
|
Legal Proceedings
We and six of our former directors and officers were named as defendants in West Palm Beach Firefighters’ Pension Fund v. StarTek, Inc., Civil Action No. 05-cv-01265-WDM-MEH (the “Litigation”). The consolidated action was a purported class action brought on behalf of all persons (except defendants) who purchased shares of our common stock in a secondary offering by certain of our stockholders in June 2004, and in the open market between February 26, 2003 and May 5, 2005 (the “Class Period”). The consolidated complaint alleged that the defendants made false and misleading public statements about us and our business and prospects in the prospectus for the secondary offering, as well as in filings with the SEC and in press releases issued during the Class Period, and that as a result, the market price of our common stock was artificially inflated. The complaints alleged claims under Sections 11 and 15 of the Securities Act of 1933 and under Sections 10(b) and 20(a) of the Securities Exchange Act of 1934. The plaintiffs in both cases sought compensatory damages on behalf of the alleged class and award of attorneys’ fees and costs of litigation.
On July 20, 2009, we executed a Stipulation of Settlement (“Stipulation”) with lead plaintiffs to settle the Litigation. Under the terms of the Stipulation, defendants agreed to $7.5 million to completely resolve the Litigation, in exchange for a release of all claims by lead plaintiffs and class members and a dismissal of the Litigation with prejudice. Our primary insurance carrier contributed $6.9 million and we contributed $0.6 million to the Settlement Fund (as defined in the Stipulation). The United States District Court for the District of Colorado (the “Court”) granted preliminary approval for the settlement on October 8, 2009. The final hearing was held on December 17, 2009, at which time the Stipulation received final approval by the Court. Our portion of the settlement due, or $0.6 million, was recorded in our Consolidated Statement of Operations during the year ended December 31, 2009.
We have been involved from time to time in other litigation arising in the normal course of business, none of which is expected by management to have a material adverse effect on our business, financial condition or results of operations.
16. SEGMENT INFORMATION
We operate within three business segments, the U.S., Canada and Offshore. The business segments align with those regions in which our services are rendered. As of December 31, 2009, our U.S. segment included the operations of our thirteen facilities in the U.S.; our Canada segment included the operations of our five facilities in Canada; and our Offshore segment included the operations of our facility in Makati City, Philippines. As of December 31, 2008, there were thirteen, six and one operating centers in the U.S., Canada, and Offshore, respectively. We use gross profit as our measure of profit and loss for each business segment and do not allocate selling, general and administrative expenses to our business segments.
Information about our reportable segments, which correspond to the geographic areas in which we operate, for the years ended December 31, 2009, 2008 and 2007 is as follows:
|
|
|
For the Year Ended December 31, |
|
|||||||
|
|
|
2009 |
|
2008 |
|
2007 |
|
|||
|
Revenue: |
|
|
|
|
|
|
|
|||
|
United States |
|
$ |
200,737 |
|
$ |
180,761 |
|
$ |
148,700 |
|
|
Canada |
|
76,307 |
|
90,929 |
|
95,915 |
|
|||
|
Offshore |
|
11,936 |
|
648 |
|
— |
|
|||
|
Total |
|
$ |
288,980 |
|
$ |
272,338 |
|
$ |
244,615 |
|
|
|
|
|
|
|
|
|
|
|||
|
Gross profit: |
|
|
|
|
|
|
|
|||
|
United States |
|
$ |
36,265 |
|
$ |
30,459 |
|
$ |
32,880 |
|
|
Canada |
|
11,910 |
|
4,928 |
|
5,815 |
|
|||
|
Offshore |
|
926 |
|
(1,395 |
) |
— |
|
|||
|
Total |
|
$ |
49,101 |
|
$ |
33,992 |
|
$ |
38,695 |
|
|
|
|
|
|
|
|
|
|
|||
|
Depreciation: |
|
|
|
|
|
|
|
|||
|
United States |
|
$ |
11,194 |
|
$ |
12,526 |
|
$ |
11,480 |
|
|
Canada |
|
3,036 |
|
5,040 |
|
5,612 |
|
|||
|
Offshore |
|
1,747 |
|
237 |
|
— |
|
|||
|
Total |
|
$ |
15,977 |
|
$ |
17,803 |
|
$ |
17,092 |
|
|
|
|
|
|
|
|
|
|
|||
|
Capital expenditures: |
|
|
|
|
|
|
|
|||
|
United States |
|
$ |
10,828 |
|
$ |
21,739 |
|
$ |
12,883 |
|
|
Canada |
|
770 |
|
1,844 |
|
2,324 |
|
|||
|
Offshore |
|
3,085 |
|
4,396 |
|
— |
|
|||
|
Total |
|
$ |
14,683 |
|
$ |
27,979 |
|
$ |
15,207 |
|
|
|
|
As of December 31, |
|
||||
|
|
|
2009 |
|
2008 |
|
||
|
Total property, plant and equipment, net: |
|
|
|
|
|
||
|
United States |
|
$ |
43,486 |
|
$ |
45,093 |
|
|
Canada |
|
7,785 |
|
10,300 |
|
||
|
Offshore |
|
6,774 |
|
4,215 |
|
||
|
Total |
|
$ |
58,045 |
|
$ |
59,608 |
|
|
|
|
|
|
|
|
||
|
Total assets: |
|
|
|
|
|
||
|
United States |
|
$ |
116,108 |
|
$ |
123,967 |
|
|
Canada |
|
28,049 |
|
17,099 |
|
||
|
Offshore |
|
4,911 |
|
5,798 |
|
||
|
Total |
|
$ |
149,068 |
|
$ |
146,864 |
|
17. QUARTERLY FINANCIAL DATA (UNAUDITED)
The following represents selected information from our unaudited quarterly Statements of Operations for the years ended December 31, 2009 and 2008. Due to the February 2009, sale of our subsidiary, Domain.com, the results of operations related to this line of business have been reported as discontinued operations for all periods presented below.
|
|
|
2009 Quarters Ended |
|
||||||||||
|
|
|
March 31 |
|
June 30 |
|
September 30 |
|
December 31 |
|
||||
|
Revenue |
|
$ |
70,711 |
|
$ |
73,290 |
|
$ |
72,462 |
|
$ |
72,517 |
|
|
Gross profit |
|
10,723 |
|
13,129 |
|
13,474 |
|
11,775 |
|
||||
|
Selling, general and administrative expenses |
|
9,692 |
|
10,889 |
|
11,084 |
|
11,531 |
|
||||
|
Impairment losses and restructuring charges |
|
6,437 |
|
— |
|
— |
|
— |
|
||||
|
Operating (loss) income |
|
(5,406 |
) |
2,240 |
|
2,390 |
|
244 |
|
||||
|
(Loss) income from continuing operations |
|
(3,988 |
) |
1,327 |
|
1,795 |
|
875 |
|
||||
|
Income from discontinued operations |
|
4,640 |
|
— |
|
— |
|
— |
|
||||
|
Net income |
|
$ |
652 |
|
$ |
1,327 |
|
$ |
1,795 |
|
$ |
875 |
|
|
|
|
|
|
|
|
|
|
|
|
||||
|
Basic net income (loss) per share from: |
|
|
|
|
|
|
|
|
|
||||
|
Continuing operations |
|
$ |
(0.27 |
) |
$ |
0.09 |
|
$ |
0.12 |
|
$ |
0.06 |
|
|
Discontinued operations |
|
0.31 |
|
— |
|
— |
|
— |
|
||||
|
Net income (loss) |
|
$ |
0.04 |
|
$ |
0.09 |
|
$ |
0.12 |
|
$ |
0.06 |
|
|
|
|
|
|
|
|
|
|
|
|
||||
|
Diluted net income (loss) per share from: |
|
|
|
|
|
|
|
|
|
||||
|
Continuing operations |
|
$ |
(0.27 |
) |
$ |
0.09 |
|
$ |
0.12 |
|
$ |
0.06 |
|
|
Discontinued operations |
|
0.31 |
|
— |
|
— |
|
— |
|
||||
|
Net income (loss) |
|
$ |
0.04 |
|
$ |
0.09 |
|
$ |
0.12 |
|
$ |
0.06 |
|
|
|
|
2008 Quarters Ended |
|
||||||||||
|
|
|
March 31 |
|
June 30 |
|
September 30 |
|
December 31 |
|
||||
|
Revenue |
|
$ |
64,583 |
|
$ |
65,467 |
|
$ |
68,937 |
|
$ |
73,351 |
|
|
Gross profit |
|
9,467 |
|
8,304 |
|
8,209 |
|
8,012 |
|
||||
|
Selling, general and administrative expenses |
|
10,090 |
|
10,227 |
|
10,205 |
|
10,292 |
|
||||
|
Impairment losses and restructuring charges |
|
108 |
|
5,500 |
|
346 |
|
3,271 |
|
||||
|
Operating loss |
|
(731 |
) |
(7,423 |
) |
(2,342 |
) |
(5,551 |
) |
||||
|
Loss from continuing operations |
|
(403 |
) |
(4,588 |
) |
(1,503 |
) |
(3,197 |
) |
||||
|
Income (loss) from discontinued operations |
|
72 |
|
69 |
|
(407 |
) |
56 |
|
||||
|
Net loss |
|
$ |
(331 |
) |
$ |
(4,519 |
) |
$ |
(1,910 |
) |
$ |
(3,141 |
) |
|
|
|
|
|
|
|
|
|
|
|
||||
|
Basic net (loss) income per share from: |
|
|
|
|
|
|
|
|
|
||||
|
Continuing operations |
|
$ |
(0.03 |
) |
$ |
(0.31 |
) |
$ |
(0.10 |
) |
$ |
(0.22 |
) |
|
Discontinued operations |
|
0.01 |
|
— |
|
(0.03 |
) |
0.01 |
|
||||
|
Net loss |
|
$ |
(0.02 |
) |
$ |
(0.31 |
) |
$ |
(0.13 |
) |
$ |
(0.21 |
) |
|
|
|
|
|
|
|
|
|
|
|
||||
|
Diluted net (loss) income per share from: |
|
|
|
|
|
|
|
|
|
||||
|
Continuing operations |
|
$ |
(0.03 |
) |
$ |
(0.31 |
) |
$ |
(0.10 |
) |
$ |
(0.22 |
) |
|
Discontinued operations |
|
0.01 |
|
— |
|
(0.03 |
) |
0.01 |
|
||||
|
Net loss |
|
$ |
(0.02 |
) |
$ |
(0.31 |
) |
$ |
(0.13 |
) |
$ |
(0.21 |
) |
18. SUBSEQUENT EVENTS
In January 2010, we entered into a lease agreement for the rental of a facility in Ortigas, Philippines. The lease has an initial term of five years with a tenant option for an additional five years. The facility is approximately 158,500 square feet and we expect to open the facility for operations during the second quarter of 2010. Total lease commitments for the rental of this facility are approximately $5.8 million over the initial term of the lease.
In January 2010, we closed our facilities in Laramie, Wyoming and Victoria, Texas. The facility in Laramie was closed because this work was transitioned either to StarTek’s @Home platform, whereby agents work from their homes, or our Greeley, Colorado facility. We closed our site in Victoria due to the loss of a client program, and we are currently evaluating the space to determine if we will utilize it for other programs or sublease to a tenant.
In January 2010, we announced the closure of our Thunder Bay, Ontario, Canada location which we expect to close in March 2010. The closure in Thunder Bay was driven by market conditions, namely recruiting challenges in this location, which negatively impacted the profitability of the location and management determined it was in our long-term interest to close the location. We recorded approximately $1.7 million in impairment losses during 2009 related to assets held at this facility because the carrying value of those assets was not recoverable.
ITEM 9. CHANGES IN AND DISAGREEMENTS WITH ACCOUNTANTS ON ACCOUNTING AND FINANCIAL DISCLOSURE
None.
ITEM 9A. CONTROLS AND PROCEDURES
Conclusion Regarding the Effectiveness of Disclosure Controls and Procedures
As of December 31, 2009, we carried out an evaluation, under the supervision and with the participation of our management, including our Chief Executive Officer and Chief Financial Officer, of the effectiveness of the design and operation of our disclosure controls and procedures (as defined in Rules 13a-15(e) and 15d-15(e) under the Exchange Act). Based on such evaluation, our Chief Executive Officer and Chief Financial Officer concluded that, as of December 31, 2009, our disclosure controls and procedures were effective and were designed to ensure that all information required to be disclosed by us in our reports filed or submitted under the Exchange Act is recorded, processed, summarized and reported within the time periods specified in the rules and forms of the SEC, and accumulated and communicated to our management, including our principal executive officer and principal financial officer, to allow timely decisions regarding required disclosure.
Management’s Report on Internal Control over Financial Reporting
Our management is responsible for establishing and maintaining adequate internal control over financial reporting, as such term is defined in Exchange Act Rules 13a-15(f) and 15d-15(f). Under the supervision and with the participation of our management, including our Chief Executive Officer and Chief Financial Officer, we conducted an evaluation of the effectiveness of our internal control over financial reporting as of December 31, 2009, based on the framework in Internal Control—Integrated Framework issued by the Committee of Sponsoring Organizations of the Treadway Commission (COSO). Based on that evaluation, our management concluded that our internal control over financial reporting was effective as of December 31, 2009.
Our independent registered public accounting firm, Ernst & Young LLP, issued a report on the effectiveness of our internal control over financial reporting as of December 31, 2009. Ernst & Young LLP’s report is included in Item 9A. of this Form 10-K.
Changes in Internal Control over Financial Reporting
There were no changes in our internal control over financial reporting that occurred during the quarter ended December 31, 2009, that has materially affected, or is reasonably likely to materially affect, our internal control over financial reporting.
Report of Independent Registered Public Accounting Firm
The Board of Directors and Stockholders of StarTek, Inc.
We have audited StarTek Inc.’s internal control over financial reporting as of December 31, 2009, based on criteria established in Internal Control—Integrated Framework issued by the Committee of Sponsoring Organizations of the Treadway Commission (the COSO criteria). StarTek Inc.’s management is responsible for maintaining effective internal control over financial reporting, and for its assessment of the effectiveness of internal control over financial reporting included in the accompanying Management’s Report on Internal Control over Financial Reporting. Our responsibility is to express an opinion on the Company’s internal control over financial reporting based on our audit.
We conducted our audit in accordance with the standards of the Public Company Accounting Oversight Board (United States). Those standards require that we plan and perform the audit to obtain reasonable assurance about whether effective internal control over financial reporting was maintained in all material respects. Our audit included obtaining an understanding of internal control over financial reporting, assessing the risk that a material weakness exists, testing and evaluating the design and operating effectiveness of internal control based on the assessed risk, and performing such other procedures as we considered necessary in the circumstances. We believe that our audit provides a reasonable basis for our opinion.
A company’s internal control over financial reporting is a process designed to provide reasonable assurance regarding the reliability of financial reporting and the preparation of financial statements for external purposes in accordance with generally accepted accounting principles. A company’s internal control over financial reporting includes those policies and procedures that (1) pertain to the maintenance of records that, in reasonable detail, accurately and fairly reflect the transactions and dispositions of the assets of the company; (2) provide reasonable assurance that transactions are recorded as necessary to permit preparation of financial statements in accordance with generally accepted accounting principles, and that receipts and expenditures of the company are being made only in accordance with authorizations of management and directors of the company; and (3) provide reasonable assurance regarding prevention or timely detection of unauthorized acquisition, use, or disposition of the company’s assets that could have a material effect on the financial statements.
Because of its inherent limitations, internal control over financial reporting may not prevent or detect misstatements. Also, projections of any evaluation of effectiveness to future periods are subject to the risk that controls may become inadequate because of changes in conditions, or that the degree of compliance with the policies or procedures may deteriorate.
In our opinion, StarTek, Inc. maintained, in all material respects, effective internal control over financial reporting as of December 31, 2009, based on the COSO criteria.
We also have audited, in accordance with the standards of the Public Company Accounting Oversight Board (United States), the consolidated balance sheets of StarTek, Inc. as of December 31, 2009 and 2008, and the related consolidated statements of operations and other comprehensive income (loss), stockholders’ equity, and cash flows for each of the three years in the period ended December 31, 2009, and our report dated February 25, 2010 expressed an unqualified opinion thereon.
|
|
/s/ Ernst & Young LLP |
|
|
|
|
Denver, Colorado |
|
|
February 25, 2010 |
|
ITEM 9B. OTHER INFORMATION
None.
Part III
ITEMS 10 THROUGH 14
Information required by Item 10 (Directors, Executive Officers and Corporate Governance), Item 11 (Executive Compensation), Item 12 (Security Ownership of Certain Beneficial Owners and Management and Related Stockholder Matters), Item 13 (Certain Relationships and Related Transactions and Director Independence), and Item 14 (Principal Accounting Fees and Services) will be included in our definitive proxy statement to be delivered in connection with our 2010 annual meeting of stockholders and is incorporated herein by reference.
Part IV
ITEM 15. EXHIBITS AND FINANCIAL STATEMENT SCHEDULES
(a) The following documents are filed as a part of this Form 10-K:
1. Consolidated Financial Statements. See the index to the Consolidated Financial Statements of StarTek, Inc. and its subsidiaries that appears in Item 8 of this Form 10-K.
3. An Index of Exhibits follows the signature pages of this Form 10-K.
SIGNATURES
Pursuant to the requirements of Section 13 or 15(d) of the Securities Exchange Act of 1934, the registrant has duly caused this Form 10-K to be signed on its behalf by the undersigned thereunto duly authorized.
|
STARTEK, INC. (REGISTRANT) |
|
|
|
|
|
|
||
|
|
|
|
|
|
|
|
|
|
|
By: |
/s/ A. LAURENCE JONES |
|
Date: February 25, 2010 |
|
|
A. Laurence Jones |
|
|
|
|
President and Chief Executive Officer |
|
|
|
|
(Principal Executive Officer) |
|
|
|
By: |
/s/ DAVID G. DURHAM |
|
Date: February 25, 2010 |
|
|
David G. Durham |
|
|
|
|
Executive Vice President, Chief |
|
|
|
|
Financial Officer and Treasurer |
|
|
|
|
(Principal Financial and Accounting Officer) |
|
|
Pursuant to the requirements of the Securities Exchange Act of 1934, this Form 10-K has been signed below by the following persons on behalf of the registrant and in the capacities and on the dates indicated.
|
/s/ A. LAURENCE JONES |
|
President and Chief Executive Officer |
|
Date: February 25, 2010 |
|
A. Laurence Jones |
|
|
|
|
|
|
|
|
|
|
|
|
|
|
|
|
|
/s/ DAVID G. DURHAM |
|
Executive Vice President, Chief Financial |
|
Date: February 25, 2010 |
|
David G. Durham |
|
Officer and Treasurer |
|
|
|
|
|
|
|
|
|
|
|
|
|
|
|
/s/ ED ZSCHAU |
|
Chairman of the Board |
|
Date: February 25, 2010 |
|
Ed Zschau |
|
|
|
|
|
|
|
|
|
|
|
/s/ ALBERT C. YATES |
|
Director |
|
Date: February 25, 2010 |
|
Albert C. Yates |
|
|
|
|
|
|
|
|
|
|
|
/s/ P. KAY NORTON |
|
Director |
|
Date: February 25, 2010 |
|
P. Kay Norton |
|
|
|
|
|
|
|
|
|
|
|
/s/ HARVEY A. WAGNER |
|
Director |
|
Date: February 25, 2010 |
|
Harvey A. Wagner |
|
|
|
|
STARTEK, INC.
INDEX OF EXHIBITS
|
Exhibit |
|
|
|
Incorporated Herein by Reference |
||||
|
No. |
|
Exhibit Description |
|
Form |
|
Exhibit |
|
Filing Date |
|
3.1 |
|
Restated Certificate of Incorporation of StarTek, Inc.. |
|
S-1 |
|
3.1 |
|
1/29/1997 |
|
3.2 |
|
Restated Bylaws of StarTek, Inc.. |
|
8-K |
|
3.2 |
|
8/2/2007 |
|
3.3 |
|
Certificate of Amendment to the Certificate of Incorporation of StarTek, Inc. filed with the Delaware Secretary of State on May 21, 1999. |
|
10-K |
|
3.3 |
|
3/8/2000 |
|
3.4 |
|
Certificate of Amendment to the Certificate of Incorporation of StarTek, Inc. filed with the Delaware Secretary of State on May 23, 2000. |
|
10-Q |
|
3.4 |
|
8/14/2000 |
|
4.1 |
|
Specimen Common Stock certificate. |
|
10-Q |
|
4.2 |
|
11/6/2007 |
|
10.1 |
|
Registration Rights Agreement by and among StarTek, Inc. and A. Emmet Stephenson, Jr. |
|
10-K |
|
10.47 |
|
3/9/2004 |
|
10.2 |
|
Investor Rights Agreement by and among StarTek, Inc., A. Emmet Stephenson Jr., and Toni E. Stephenson. |
|
10-K |
|
10.48 |
|
3/9/2004 |
|
10.3† |
|
StarTek, Inc. Stock Option Plan, as amended. |
|
Def 14a |
|
A |
|
3/27/2007 |
|
10.4† |
|
Form of Stock Option Agreement. |
|
S-1/A |
|
10.2 |
|
3/7/1997 |
|
10.5† |
|
Form of Option Agreement pursuant to StarTek, Inc. Stock Option Plan (four year vesting schedule). |
|
8-K |
|
10.26 |
|
6/16/2006 |
|
10.6† |
|
StarTek, Inc. Directors’ Stock Option Plan, as amended. |
|
Def 14a |
|
B |
|
3/27/2007 |
|
10.7† |
|
Form of Option Agreement pursuant to StarTek, Inc. Directors’ Stock Option Plan. |
|
8-K |
|
10.2 |
|
9/9/2004 |
|
10.8† |
|
StarTek, Inc. Employee Stock Purchase Plan. |
|
Def#14a |
|
A |
|
3/20/2008 |
|
10.9† |
|
StarTek, Inc. 2008 Equity Incentive Plan. |
|
Def#14a |
|
B |
|
3/20/2008 |
|
10.10† |
|
Form of Non-Statutory Stock Option Agreement (Employee) pursuant to StarTek, Inc. 2008 Equity Incentive Plan. |
|
8-K |
|
10.2 |
|
5/5/2008 |
|
10.11† |
|
Form of Non-Statutory Stock Option Agreement (Director) pursuant to StarTek, Inc. 2008 Equity Incentive Plan. |
|
8-K |
|
10.3 |
|
5/5/2008 |
|
10.12† |
|
Form of Incentive Stock Option Agreement pursuant to StarTek, Inc. 2008 Equity Incentive Plan. |
|
8-K |
|
10.4 |
|
5/5/2008 |
|
10.13† |
|
Form of Restricted Stock Award Agreement (Employee) pursuant to StarTek, Inc. 2008 Equity Incentive Plan. |
|
8-K |
|
10.5 |
|
5/5/2008 |
|
10.14† |
|
Form of Restricted Stock Award Agreement (Director) pursuant to StarTek, Inc. 2008 Equity Incentive Plan. |
|
8-K |
|
10.6 |
|
5/5/2008 |
|
10.15† |
|
Form of Indemnification Agreement between StarTek, Inc. and its Officers and Directors. |
|
10-K |
|
10.49 |
|
3/9/2004 |
|
10.16† |
|
Form of Executive Confidentiality and Non-Competition Agreement. |
|
8-K |
|
10.1 |
|
9/14/2004 |
|
10.17† |
|
Form of Executive Employment Contract. |
|
8-K |
|
10.115 |
|
8/21/2007 |
|
10.18† |
|
Amendment No. 1 to Form of Executive Employment Contract. |
|
10-K |
|
10.11 |
|
2/29/2008 |
|
10.19† |
|
Employment Agreement between StarTek, Inc. and A. Laurence Jones. |
|
8-K |
|
10.78 |
|
1/08/2007 |
|
10.20† |
|
Amendment to Employment Agreement of A. Laurence Jones signed July 9, 2007. |
|
10-Q |
|
10.110 |
|
8/8/2007 |
|
10.21† |
|
Amendment to Employment Agreement of A. Laurence Jones signed May 23, 2008. |
|
10-Q |
|
10.9 |
|
8/11/2008 |
|
10.22† |
|
Option Agreement between StarTek, Inc. and A. Laurence Jones. |
|
8-K |
|
10.79 |
|
1/08/2007 |
|
10.23† |
|
Restricted Stock Agreement between StarTek, Inc. and A. Laurence Jones. |
|
8-K |
|
10.80 |
|
1/08/2007 |
|
10.24† |
|
Employment Agreement (Stock Option and Restricted Stock Agreements are attachments to the Employment Agreement) between StarTek, Inc. and David G. Durham dated August 22, 2007. |
|
8-K |
|
10.116 |
|
8/27/2007 |
|
10.25† |
|
Transition Agreement between StarTek, Inc. and Mr. Michael Griffith effective September 30, 2008. |
|
8-K |
|
10.1 |
|
9/30/2008 |
|
10.26† |
|
2007 Sales Commission Plan. |
|
10-Q |
|
10.113 |
|
8/8/2007 |
|
10.27† |
|
Sales Commission Plan (2008 and 2009). |
|
10-K |
|
10.24 |
|
2/29/2008 |
|
10.28† |
|
Amended Sales Commission Plan (2008 and 2009). |
|
10-Q |
|
10.1 |
|
10/31/2008 |
|
10.29† |
|
Incentive Bonus Plan (2008 and 2009). |
|
10-K |
|
10.25 |
|
2/29/2008 |
|
10.30 |
|
Credit Agreement and $10,000,000 Revolving Line of Credit Note between StarTek, Inc. and Wells Fargo Bank West, National Association dated June 30, 2003. |
|
10-Q |
|
10.32 |
|
8/14/2003 |
|
10.31 |
|
Renewal and Amended Credit Agreement by and between StarTek, Inc. and Wells Fargo NA, dated June 30, 2005. |
|
8-K |
|
10.34 |
|
7/5/2005 |
|
10.32 |
|
Third Amendment to Credit Agreement and $10,000,000 Revolving Line of Credit Note, each entered into as of June 1, 2007. |
|
8-K |
|
10.88 |
|
7/3/2007 |
|
10.33 |
|
Fourth Amendment to Credit Agreement entered into as of April 30, 2008. |
|
10-Q |
|
10.23 |
|
8/11/2008 |
|
10.34 |
|
Fifth Amendment to Credit Agreement, $10,000,000 Revolving Line of Credit Note, and Addendum to Promissory Note, each entered into as of June 30, 2008. |
|
10-Q |
|
10.24 |
|
8/11/2008 |
|
10.35 |
|
Continuing Security Agreement between StarTek USA, Inc. and Wells Fargo Bank, National Association, entered into as of June 30, 2008. |
|
10-Q |
|
10.25 |
|
8/11/2008 |
|
10.36 |
|
Continuing Security Agreement between StarTek, Inc. and Wells Fargo Bank, National Association, entered into as of June 30, 2008. |
|
10-Q |
|
10.26 |
|
8/11/2008 |
|
10.37 |
|
Promissory Note to Wells Fargo Equipment Finance, Inc. |
|
10-K |
|
10.50 |
|
3/9/2004 |
|
10.438 |
|
Security Agreement between StarTek Canada Services, Ltd. and Wells Fargo Equipment Finance Company. |
|
8-K |
|
10.74 |
|
11/21/2006 |
|
10.439 |
|
Form of Guaranty of StarTek Canada Obligations executed by StarTek, Inc. and StarTek USA, Inc. |
|
8-K |
|
10.75 |
|
11/21/2006 |
|
10.40 |
|
Promissory Note between StarTek USA, Inc. and Wells Fargo Equipment Finance, Inc. |
|
8-K |
|
10.76 |
|
11/21/2006 |
|
10.41 |
|
Form of Guaranty of StarTek USA Obligations executed by StarTek, Inc. and StarTek Canada Services, Ltd. |
|
8-K |
|
10.77 |
|
11/21/2006 |
|
10.42 |
|
Share Purchase Agreement by and among StarTek, Inc., StarTek Europe Ltd. and Taelus Limited, dated September 30, 2004. |
|
8-K |
|
10.1 |
|
10/6/2004 |
|
10.43 |
|
Promissory Note between StarTek USA, Inc. and DPL Corporation Southeast. |
|
8-K |
|
10.72 |
|
12/21/2005 |
|
10.44# |
|
Services Agreement and Statement of Work by and between StarTek, Inc. and T-Mobile USA, Inc. for certain call center services dated effective October 1, 2007. |
|
10-Q |
|
10.120 |
|
11/6/2007 |
|
10.45# |
|
Amendment No. 1 effective February 24, 2008 to Services Agreement and Statement of Work by and between StarTek, Inc. and T-Mobile USA, Inc. for certain call center services dated effective October 1, 2007. |
|
10-Q |
|
10.7 |
|
5/6/2008 |
|
10.46# |
|
Master Services Agreement No. GAMSA-STAR081106-00 effective August 11, 2006 between StarTek USA, Inc. and Cingular Wireless LLC. |
|
10-K |
|
10.85 |
|
3/15/2007 |
|
10.47# |
|
Amendment No. cing7367.A.001 effective December 7, 2007 to Master Services Agreement No. GAMSA-STAR081106-00 effective August 11, 2006 between StarTek, Inc. and AT&T Mobility, LLC (f/k/a Cingular Wireless, LLC). |
|
10-K |
|
10.46 |
|
2/29/2008 |
|
10.48# |
|
Statement of Work GASOW-STAR100606-00 dated December 21, 2006, between StarTek USA, Inc. and Cingular Wireless, LLC. |
|
10-K |
|
10.83 |
|
3/15/2007 |
|
10.49# |
|
Amendment Cing7866.A.001 effective April 16, 2008 between StarTek USA, Inc. and AT&T Mobility LLC |
|
10-Q |
|
10.15 |
|
8/11/2008 |
|
10.50 |
|
Amendment No. GASOW-STAR10.0606-00.A.004 effective March 1, 2009 to GASOW-STAR100606-00 between StarTek USA, Inc. and AT&T Mobility LLC (successor-in-interest to Cingular Wireless, LLC). |
|
10-K |
|
10.52 |
|
3/3/2009 |
|
10.51# |
|
Work Order 20080122.003.C effective May 1, 2008 between StarTek USA, Inc. and AT&T Mobility LLC. |
|
10-Q |
|
10.14 |
|
8/11/2008 |
|
10.52& |
|
Work Order GAMSA-STAR081106-00.S.001 effective October 1, 2008, between StarTek USA, Inc. and AT&T Mobility LLC (f/k/a Cingular Wireless, LLC). |
|
10-K |
|
10.54 |
|
3/3/2009 |
|
10.53& |
|
Work Order GAMSA-STAR081106-00.S.004 effective December 1, 2008, between StarTek, Inc. and AT&T Mobility LLC (f/k/a Cingular Wireless, LLC). |
|
10-K |
|
10.55 |
|
3/3/2009 |
|
10.54# |
|
Contact Call Center Agreement No. 20070105.006.C between StarTek, Inc. and AT&T Services, Inc., effective January 26, 2007. |
|
10-Q |
|
10.90 |
|
5/8/2007 |
|
10.55# |
|
Amendment 20070105.006.A.001 effective October 31, 2007 to Master Services Agreement 20070105.006.C entered on January 26, 2007 between StarTek, Inc. and AT&T Services, Inc. |
|
10-K |
|
10.50 |
|
2/29/2008 |
|
10.56# |
|
Agreement Order No. 20070105.006.S.002 for Tier III Service Management by and between StarTek, Inc. and AT&T Services, Inc., signed May 2, 2007. |
|
10-Q |
|
10.105 |
|
8/8/2007 |
|
10.57# |
|
Amendment 20070105.006.S.002.A.001 effective June 27, 2008 by and between StarTek, Inc. and AT&T Services, Inc. |
|
10-Q |
|
10.16 |
|
8/11/2008 |
|
10.658 |
|
Termination of Agreement Order No. 20070105.006.S.002 effective 12/31/2008. |
|
10-K |
|
10.58 |
|
3/3/2009 |
|
10.59# |
|
Agreement Order 20070105.006.S.007 for EMBR Program between StarTek, Inc. and AT&T Corp. signed June 15, 2007. |
|
10-Q |
|
10.106 |
|
8/8/2007 |
|
10.60# |
|
Amendment 20070105.006.S.007.A.001 effective July 14, 2008 between StarTek, Inc. and AT&T Corp. |
|
10-Q |
|
10.17 |
|
8/11/2008 |
|
10.61# |
|
General Agreement Order 20070105.006.S.008 effective June 19, 2008 by and between StarTek, Inc. and AT&T Services, Inc. |
|
10-Q |
|
10.18 |
|
8/11/2008 |
|
10.62# |
|
General Agreement Order 20070105.006.S.009 effective June 5, 2008 by and between StarTek, Inc. and AT&T Services, Inc. |
|
10-Q |
|
10.19 |
|
8/11/2008 |
|
10.63# |
|
General Agreement Order 20070105.006.S.010 effective June 5, 2008 by and between StarTek, Inc. and AT&T Services, Inc. |
|
10-Q |
|
10.20 |
|
8/11/2008 |
|
10.64# |
|
General Agreement Order 20070105.006.S.011 effective June 5, 2008 by and between StarTek, Inc. and AT&T Services, Inc. |
|
10-Q |
|
10.21 |
|
8/11/2008 |
|
10.65# |
|
General Agreement Order 20070105.006.S.012 effective July 10, 2008 by and between StarTek, Inc. and AT&T Services, Inc. |
|
10-Q |
|
10.22 |
|
8/11/2008 |
|
10.66 |
|
Asset Purchase Agreement among StarTek, Inc., Domain.com, Inc. and A. Emmet Stephenson Jr., Inc effective February 25, 2009. The schedules have been omitted from this filing pursuant to Item 601(b)(2) of Regulation S-K. The registrant agrees to furnish supplementally a copy of any omitted schedule to the Securities and Exchange Commission upon request. |
|
10-Q |
|
10.1 |
|
5/8/2009 |
|
10.67 |
|
Amendment GASOW-STAR100606-00.A.005 effective April 1, 2009 between StarTek, Inc. and AT&T Mobility LLC. |
|
10-Q |
|
10.2 |
|
5/8/2009 |
|
10.768 |
|
Promissory Note, dated June 26, 2009, between StarTek, Inc., StarTek USA, Inc., StarTek Canada Services, Ltd. and UMB Bank Colorado, N.A. |
|
8-K |
|
10.3 |
|
7/2/2009 |
|
10.769 |
|
Business Loan Agreement, dated June 26, 2009, among StarTek, Inc., StarTek USA, Inc., StarTek Canada Services, Ltd. and UMB Bank Colorado, N.A. |
|
8-K |
|
10.4 |
|
7/2/2009 |
|
10.70 |
|
Commercial Security Agreement, dated June 26, 2009, among StarTek, Inc., as grantor, StarTek, Inc., StarTek USA, Inc., StarTek Canada Services, Ltd. and UMB Bank Colorado, N.A. |
|
8-K |
|
10.5 |
|
7/2/2009 |
|
10.71 |
|
Commercial Security Agreement, dated June 26, 2009, among StarTek USA, Inc., as grantor, StarTek, Inc., StarTek USA, Inc., StarTek Canada Services, Ltd. and UMB Bank Colorado, N.A. |
|
8-K |
|
10.6 |
|
7/2/2009 |
|
10.72 |
|
Commercial Security Agreement, dated June 26, 2009, among StarTek Canada Services, Ltd., as grantor, StarTek, Inc., StarTek USA, Inc., StarTek Canada Services, Ltd. and UMB Bank Colorado, N.A. |
|
8-K |
|
10.7 |
|
7/2/2009 |
|
10.73# |
|
Amendment No. 20070105.006.S.012.A.001 effective April 10, 2009 to Agreement No. 20070105.006.S.012 between StarTek, Inc. and AT&T Services, Inc. |
|
10-Q |
|
10.6 |
|
7/31/2009 |
|
10.74# |
|
Work Order No. 20070105.006.S.014 effective March 1, 2009 pursuant to Master Services Agreement No. 20070105.006.C dated January 26, 2007 between StarTek, Inc. and AT&T Services Inc. |
|
10-Q |
|
10.7 |
|
7/31/2009 |
|
10.75# |
|
Amendment 2007105.006.S.007.A.002 effective June 30, 2009 to Agreement No. 20070105.006.S.007 between StarTek, Inc. and AT&T Services, Inc. |
|
10-Q |
|
10.8 |
|
7/31/2009 |
|
10.76 |
|
Amendment 20070105.006.A.002 effective April 14, 2009 to Agreement No. 20070105.006.C between StarTek, Inc. and AT&T Services, Inc. |
|
10-Q |
|
10.9 |
|
7/31/2009 |
|
10.77# |
|
Amendment 20070105.006.A.003 effective June 24, 2009 to |
|
10-Q |
|
10.10 |
|
7/31/2009 |
|
|
|
Agreement No. 20070105.006.C between StarTek, Inc. and AT&T Services, Inc. |
|
|
|
|
|
|
|
10.78 |
|
Amendment GASOW-STAR100606-00.A.006 to Work Order GASOW-STAR100606-00 effective as of July 1, 2009 between StarTek USA, Inc. and AT&T Mobility LLC. |
|
10-Q |
|
10.11 |
|
7/31/2009 |
|
10.79# |
|
Amendment No. 2 to T-Mobile USA, Inc. Services Agreement Call Center Services dated April 1, 2009 between T-Mobile USA, Inc. and StarTek USA, Inc. |
|
10-Q |
|
10.12 |
|
7/31/2009 |
|
10.80# |
|
Work Order No. 20070105.006.S.013 effective November 30, 2008 pursuant to Master Services Agreement No. 20070105.006.C dated January 26, 2007 between StarTek, Inc. and AT&T Services Inc. |
|
10-Q |
|
10.1 |
|
10/30/2009 |
|
10.81# |
|
Amendment 2007105.006.S.014.A.001 effective March 1, 2009 to Agreement No. 20070105.006.S.014 between StarTek, Inc. and AT&T Services, Inc. |
|
10-Q |
|
10.2 |
|
10/30/2009 |
|
10.82*& |
|
Amendment 20080122.003.A.001 effective November 13, 2009 between StarTek, Inc. and AT&T Mobility LLC. |
|
|
|
|
|
|
|
10.83*& |
|
Amendment GASOW-STAR081106-00.S.001.A.001 effective November 13, 2009 between StarTek, Inc. and AT&T Mobility LLC. |
|
|
|
|
|
|
|
10.84*& |
|
Work Order No. 20070105.006.S.016 effective December 9, 2009 pursuant to Master Services Agreement No. 20070105.006.C dated January 26, 2007 between StarTek, Inc. and AT&T Services, Inc. |
|
|
|
|
|
|
|
21.1* |
|
Subsidiaries of the Registrant. |
|
|
|
|
|
|
|
23.1* |
|
Consent of Ernst & Young, LLP, Independent Registered Public Accounting Firm. |
|
|
|
|
|
|
|
31.1* |
|
Certification of A. Laurence Jones pursuant to Section 302 of the Sarbanes-Oxley Act of 2002. |
|
|
|
|
|
|
|
31.2* |
|
Certification of David G. Durham pursuant to Section 302 of the Sarbanes-Oxley Act of 2002. |
|
|
|
|
|
|
|
32.1* |
|
Written Statement of the Chief Executive Officer and Chief Financial Officer furnished pursuant to Section 906 of the Sarbanes-Oxley Act of 2002. |
|
|
|
|
|
|
|
* |
|
Filed with this Form 10-K. |
|
† |
|
Management contract or compensatory plan or arrangement. |
|
# |
|
The Securities and Exchange Commission has granted our request that certain material in this agreement be treated as confidential. Such material has been redacted from the exhibit as filed. |
|
& |
|
Certain portions of this exhibit have been omitted pursuant to a request for confidential treatment and have been filed separately with the Securities and Exchange Commission |