Attached files
Table of Contents
UNITED STATES
SECURITIES AND EXCHANGE COMMISSION
Washington, D.C. 20549
FORM 10-K
ANNUAL REPORT
PURSUANT TO SECTIONS 13 OR 15(d) OF THE
SECURITIES EXCHANGE ACT OF 1934
(Mark One)
| x | ANNUAL REPORT PURSUANT TO SECTION 13 OR 15(d) OF THE SECURITIES EXCHANGE ACT OF 1934 |
For the fiscal year ended December 31, 2009 OR
| ¨ | TRANSITION REPORT PURSUANT TO SECTION 13 OR 15(d) OF THE SECURITIES EXCHANGE ACT OF 1934 |
For the transition period from to
Commission file number 1-12289
SEACOR Holdings Inc.
(Exact name of Registrant as Specified in Its Charter)
| Delaware | 13-3542736 | |
| (State or Other Jurisdiction of Incorporation or Organization) |
(I.R.S. Employer Identification No.) | |
| 2200 Eller Drive, P.O. Box 13038, | 33316 | |
| Fort Lauderdale, Florida | (Zip Code) | |
| (Address of Principal Executive Offices) | ||
(954) 523-2200
Registrant’s telephone number, including area code
Securities registered pursuant to Section 12 (b) of the Act:
| Title of Each Class |
Name of Each Exchange on Which Registered | |
| Common Stock, par value $.01 per share | New York Stock Exchange |
Securities registered pursuant to Section 12 (g) of the Act:
None
(Title of Class)
Indicate by check mark if the registrant is a well-known seasoned issuer, as defined in Rule 405 of the Securities Act. x Yes ¨ No
Indicate by check mark if the registrant is not required to file reports pursuant to Section 13 or Section 15(d) of the Act. ¨ Yes x No
Indicate by check mark whether the registrant (1) has filed all reports required to be filed by Section 13 or 15 (d) of the Securities Exchange Act of 1934 during the preceding 12 months (or such shorter period that the registrant was required to file such reports), and (2) has been subject to such filing requirements for the past 90 days. x Yes ¨ No
Indicate by check mark whether the registrant has submitted electronically and posted on its corporate Web site, if any, every Interactive Data File required to be submitted and posted pursuant to Rule 405 of Regulation S-T (§ 232.405 of this chapter) during the preceding 12 months (or for such shorter period that the registrant was required to submit and post such files). ¨ Yes ¨ No
Indicate by check mark if disclosure of delinquent filers pursuant to Item 405 of Regulation S-K is not contained herein, and will not be contained, to the best of registrant’s knowledge, in definitive proxy or information statements incorporated by reference in Part III of this Form 10-K or any amendment to this Form 10-K. ¨
Indicate by check mark whether the registrant is a large accelerated filer, an accelerated filer, a non-accelerated filer, or a smaller reporting company. See definitions of “large accelerated filer,” “accelerated filer,” and “smaller reporting company” in Rule 12b-2 of the Exchange Act. (Check one):
| Large accelerated filer x | Accelerated filer ¨ | Non-accelerated filer ¨ (Do not check if a smaller reporting company) |
Smaller reporting company ¨ |
Indicate by check mark whether the registrant is a shell company (as defined in Rule 12b-2 of the Exchange Act). ¨ Yes x No
The aggregate market value of the voting stock of the registrant held by non-affiliates as of June 30, 2009 was approximately $1,412,564,488 based on the closing price on the New York Stock Exchange on such date. The total number of shares of Common Stock issued and outstanding as of February 19, 2010 was 22,614,077.
DOCUMENTS INCORPORATED BY REFERENCE
Portions of the Registrant’s definitive proxy statement for its 2010 Annual Meeting of Stockholders to be filed with the Securities and Exchange Commission (the “Commission”) pursuant to Regulation 14A within 120 days after the end of the Registrant’s last fiscal year is incorporated by reference into Part III of this Annual Report on Form 10-K.
Table of Contents
FORM 10-K
TABLE OF CONTENTS
Table of Contents
Table of Contents
FORWARD-LOOKING STATEMENTS
Certain statements discussed in Item 1 (Business), Item 1A (Risk Factors), Item 3 (Legal Proceedings), Item 7 (Management’s Discussion and Analysis of Financial Condition and Results of Operations), Item 7A (Quantitative and Qualitative Disclosures About Market Risk) and elsewhere in this Annual Report on Form 10-K as well as in other materials and oral statements that the Company releases from time to time to the public constitute “forward-looking statements” within the meaning of the Private Securities Litigation Reform Act of 1995. Such forward-looking statements concerning management’s expectations, strategic objectives, business prospects, anticipated economic performance and financial condition and other similar matters involve significant known and unknown risks, uncertainties and other important factors that could cause the actual results, performance or achievements of results to differ materially from any future results, performance or achievements discussed or implied by such forward-looking statements. Such risks, uncertainties and other important factors are discussed in Item 1A (Risk Factors). In addition, these statements constitute the Company’s cautionary statements under the Private Securities Litigation Reform Act of 1995. It should be understood that it is not possible to predict or identify all such factors. Consequently, the following should not be considered to be a complete discussion of all potential risks or uncertainties. The words “anticipate,” “estimate,” “expect,” “project,” “intend,” “believe,” “plan,” “target,” “forecast” and similar expressions are intended to identify forward-looking statements. Forward-looking statements speak only as of the date of the document in which they are made. The Company disclaims any obligation or undertaking to provide any updates or revisions to any forward-looking statement to reflect any change in the Company’s expectations or any change in events, conditions or circumstances on which the forward-looking statement is based. It is advisable, however, to consult any further disclosures the Company makes on related subjects in its 10-Q and 8-K reports to the Securities and Exchange Commission.
| ITEM 1. | BUSINESS |
Unless the context indicates otherwise, the terms “we,” “our,” “ours,” “us” and the “Company” refer to SEACOR Holdings Inc. and its consolidated subsidiaries. “SEACOR” refers to SEACOR Holdings Inc., incorporated in 1989 in Delaware. “Common Stock” refers to the common stock, par value $.01 per share, of SEACOR. The Company’s fiscal year ended on December 31, 2009.
The Company is in the business of owning, operating, investing in and marketing equipment, primarily in the offshore oil and gas, industrial aviation and marine transportation industries. The Company operates a diversified fleet of offshore support vessels and helicopters servicing oil and gas exploration, development and production facilities worldwide and a fleet of U.S.-flag product tankers that transport petroleum, chemicals and crude products primarily in the U.S. domestic or “coastwise” trade. In addition, the Company operates a fleet of inland river barges and towboats transporting grain, liquids and other bulk commodities on the U.S. Inland River Waterways. The Company’s environmental services segment primarily provides emergency preparedness and response services to oil, chemical, industrial and marine transportation clients, and government agencies in the United States and abroad. The Company’s commodity trading and logistics segment is an integrated business involved in the purchase, storage, transportation and sale of agricultural and energy commodities.
SEACOR’s principal executive offices are located at 2200 Eller Drive, P.O. Box 13038, Fort Lauderdale, Florida 33316, and the telephone number is (954) 523-2200. SEACOR’s website address is www.seacorholdings.com.
The Company’s Corporate Governance policies, including the Board of Directors’ Audit Committee, Compensation Committee and Nominating and Corporate Governance Committee charters are made available, free of charge, on the Company’s website or in print for shareholders.
1
Table of Contents
All of the Company’s periodic report filings with the Securities and Exchange Commission (“SEC”) pursuant to Section 13(a) or 15(d) of the Securities Exchange Act of 1934, as amended, are made available, free of charge, through the Company’s website, including its Annual Report on Form 10-K, Quarterly Reports on Form 10-Q, Current Reports on Form 8-K and any amendments to those reports. These reports and amendments are available through the Company’s website as soon as reasonably practicable after the Company electronically files such reports or amendments with the SEC. They are also available to be read and copied at the SEC’s Public Reference Room at 100 F Street, N.E., Washington, D.C. 20549. Information as to the operation of the SEC’s Public Reference Room can be obtained by calling the SEC at 1-800-SEC-0330. The SEC maintains a website (www.sec.gov) that contains reports, proxy and information statements and other information.
Segment and Geographic Information
The Company’s operations are divided into six main business segments: Offshore Marine Services, Marine Transportation Services, Inland River Services, Aviation Services, Environmental Services and Commodity Trading and Logistics. The Company also has activities that are referred to and described under Other, which primarily includes Harbor and Offshore Towing Services, various other investments in joint ventures and lending and leasing activities. Financial data for segment and geographic areas is reported in Part IV “Note 15. Major Customers and Segment Data” of this Annual Report on Form 10-K.
Business
Offshore Marine Services operates a diversified fleet of support vessels primarily servicing offshore oil and gas exploration, development and production facilities worldwide. Vessels in this service are employed to deliver cargo and personnel to offshore installations, handle anchors for drilling rigs and other marine equipment, support offshore construction and maintenance work, provide standby safety support and emergency response services. From time to time, Offshore Marine Services supports projects such as well stimulation, seismic data gathering and offshore accommodation. Offshore Marine Services also offers logistics services in support of offshore oil and gas exploration, development and production operations, including shorebased, marine transport and other supply chain management services. This segment contributed 33%, 43% and 51% of consolidated operating revenues in 2009, 2008 and 2007, respectively.
2
Table of Contents
Equipment and Services
The following tables identify the types of vessels that comprise Offshore Marine Services’ fleet as of December 31 for the indicated years. “Owned” are those majority owned by the Company. “Joint Ventured” are those owned by entities in which the Company does not have a controlling interest. “Leased-in” may be either vessels contracted from third parties or from leasing companies to which the Company may have sold such vessels. “Pooled” are owned by entities not affiliated with Offshore Marine Services with the revenues or results of operations of these vessels being shared with the revenues or results of operations of certain vessels of similar type owned by Offshore Marine Services based upon an agreed formula. “Managed” are owned by entities not affiliated with the Company but operated by Offshore Marine Services for a fee. See Glossary of Vessel Types below for an explanation of the services they perform.
| Owned | Joint Ventured |
Leased-in | Pooled or Managed |
Total | ||||||
| 2009 |
||||||||||
| Anchor handling towing supply |
18 | 1 | 1 | 3 | 23 | |||||
| Crew |
41 | 2 | 11 | 3 | 57 | |||||
| Mini-supply |
6 | — | 5 | — | 11 | |||||
| Standby safety |
24 | 1 | — | — | 25 | |||||
| Supply |
11 | — | 8 | 8 | 27 | |||||
| Towing supply |
7 | 3 | 2 | 1 | 13 | |||||
| Specialty |
4 | 5 | — | — | 9 | |||||
| 111 | 12 | 27 | 15 | 165 | ||||||
| 2008 |
||||||||||
| Anchor handling towing supply |
18 | 1 | 1 | — | 20 | |||||
| Crew |
49 | 2 | 23 | 1 | 75 | |||||
| Mini-supply |
11 | — | 5 | — | 16 | |||||
| Standby safety |
24 | — | — | 5 | 29 | |||||
| Supply |
12 | — | 8 | 7 | 27 | |||||
| Towing supply |
9 | 3 | 2 | — | 14 | |||||
| Specialty |
6 | 3 | — | — | 9 | |||||
| 129 | 9 | 39 | 13 | 190 | ||||||
| 2007 |
||||||||||
| Anchor handling towing supply |
15 | 1 | 2 | 2 | 20 | |||||
| Crew |
52 | 2 | 23 | — | 77 | |||||
| Mini-supply |
15 | — | 5 | 1 | 21 | |||||
| Standby safety |
23 | 1 | — | 5 | 29 | |||||
| Supply |
13 | — | 10 | 2 | 25 | |||||
| Towing supply |
13 | 4 | 2 | 2 | 21 | |||||
| Specialty |
10 | 3 | — | — | 13 | |||||
| 141 | 11 | 42 | 12 | 206 | ||||||
The following table indicates average fleet age in years as of December 31:
| 2009 | 2008 | 2007 | ||||
| Including standby safety vessels |
15.1 | 14.7 | 15.5 | |||
| Excluding standby safety vessels |
10.6 | 11.0 | 12.8 |
3
Table of Contents
Glossary of Vessel Types
Anchor handling towing supply (“AHTS”) vessels are used primarily to support offshore drilling activities in the towing, positioning and mooring of drilling rigs and other marine equipment. AHTS vessels are also used to transport supplies and equipment from shore bases to offshore drilling rigs, platforms and other installations. The defining characteristics of AHTS vessels are horsepower (“bhp”), size of winch in terms of “line pull” and wire storage capacity. Offshore Marine Services’ fleet of AHTS vessels has varying capabilities and supports offshore mooring activities in water depths ranging from 300 to 8,000 feet. Most modern AHTS vessels are equipped with dynamic positioning (“DP”) systems that enable them to maintain a fixed position in close proximity to a rig without the use of tie-up lines.
Crew boats are used primarily to move cargo and personnel to and from offshore drilling rigs, platforms and other installations. Historically, crew boats transported people and were also used to deliver “light” cargo such as personal effects, small machinery and small quantities of fuel and water. These boats also served as field stand-by vessels, moving personnel between platforms and providing emergency stand-by services. Crew boats built prior to 1990 are generally 100 to 130 feet in length and are capable of 20 knots speed in light conditions and calm seas. Vessels built since 1998, also referred to as Fast Support Vessels (“FSVs”), range from 130 to 200 feet in length and are capable of speeds between 25 and 35 knots. Modern FSVs have enhanced cargo carrying capacities enabling them to support both drilling operations and production services. Vessels supporting deep water drilling are usually equipped with DP capabilities, ride control systems and firefighting equipment.
Mini-supply vessels are approximately 145 to 165 feet in length and typically carry deck cargo, liquid mud, methanol, diesel fuel and water. These vessels are typically used to support construction projects, maintenance work, certain drilling support activities and production support.
Standby safety vessels typically remain on location proximate to offshore rigs and production facilities to respond to emergencies. These vessels carry special equipment to rescue personnel and are equipped to provide first aid and shelter. These vessels sometimes perform a dual role, also functioning as supply vessels.
Supply vessels and towing supply vessels are generally more than 200 feet in length and are used to deliver cargo to rigs and platforms where drilling and work-over activity is underway or to support construction work by delivering pipe to vessels performing underwater installations. Supply vessels are distinguished from other vessels by the total carrying capacity (expressed as deadweight: “dwt”), available area of clear deck space, below-deck capacity for storage of mud and cement used in the drilling process and tank storage for water and fuel oil. The ability to hold station in open water and moderately rough seas is a key factor in differentiating supply vessels. To improve station keeping ability, certain supply vessels have DP capabilities. Towing supply vessels perform similar cargo delivery functions to those handled by supply vessels. They are, however, equipped with more powerful engines (4,000 – 8,000 bhp) and winches, giving them the added capability to perform general towing functions, buoy setting and limited anchor handling work.
Specialty includes anchor handling tugs, lift boats, accommodation, line handling and other vessels. These vessels generally have specialized features adapting them to specific applications including offshore maintenance and construction services, freight hauling services and accommodation services.
Markets
The demand for vessels is affected by the level of offshore exploration and drilling activities, which in turn is influenced by a number of factors including:
| • | expectations as to future oil and gas commodity prices |
| • | customer assessments of offshore drilling prospects compared with land-based opportunities |
| • | customer assessments of cost, geological opportunity and political stability in host countries |
| • | worldwide demand for oil and natural gas |
4
Table of Contents
| • | the ability of The Organization of Petroleum Exporting Countries (“OPEC”) to set and maintain production levels and pricing |
| • | the level of production of non-OPEC countries |
| • | the relative exchange rates for the U.S. dollar |
| • | various United States and international government policies regarding exploration and development of oil and gas reserves |
Offshore Marine Services operates vessels in six principal geographic regions. From time to time, vessels are relocated between these regions to meet customer demand for equipment. The table below sets forth vessel types by geographic market as of December 31 for the indicated years. Offshore Marine Services sometimes participates in joint venture arrangements in certain geographical locations in order to enhance marketing capabilities and facilitate operations in certain foreign markets. This allows for the expansion of Offshore Marine Services’ fleet and operations while diversifying risks and reducing capital outlays associated with such expansion.
| 2009 | 2008 | 2007 | ||||
| United States: |
||||||
| Anchor handling towing supply |
12 | 11 | 12 | |||
| Crew |
31 | 42 | 49 | |||
| Mini-supply |
7 | 13 | 19 | |||
| Supply |
8 | 8 | 9 | |||
| Towing supply |
2 | 2 | 4 | |||
| Specialty |
2 | 2 | 2 | |||
| 62 | 78 | 95 | ||||
| Africa, primarily West Africa: |
||||||
| Anchor handling towing supply |
3 | 5 | 6 | |||
| Crew |
11 | 11 | 12 | |||
| Supply |
5 | 4 | 5 | |||
| Towing Supply |
5 | 5 | 11 | |||
| Specialty |
2 | 2 | 3 | |||
| 26 | 27 | 37 | ||||
| United Kingdom, primarily North Sea: |
||||||
| Standby safety |
25 | 29 | 29 | |||
| Middle East: |
||||||
| Crew |
7 | 6 | 4 | |||
| Mini-supply |
4 | 2 | — | |||
| Supply |
4 | 5 | 5 | |||
| Towing supply |
3 | 3 | 3 | |||
| Specialty |
4 | 4 | 7 | |||
| 22 | 20 | 19 | ||||
5
Table of Contents
| 2009 | 2008 | 2007 | ||||
| Asia: |
||||||
| Anchor handling towing supply |
2 | 2 | 2 | |||
| Crew |
2 | 5 | 4 | |||
| Supply |
1 | 1 | 1 | |||
| Towing Supply |
3 | 4 | 3 | |||
| 8 | 12 | 10 | ||||
| Mexico, Central and South America: |
||||||
| Anchor handling towing supply |
6 | 2 | — | |||
| Crew |
6 | 11 | 8 | |||
| Mini-supply |
— | 1 | 2 | |||
| Supply |
9 | 9 | 5 | |||
| Specialty |
1 | 1 | 1 | |||
| 22 | 24 | 16 | ||||
| Total Foreign Fleet |
103 | 112 | 111 | |||
| Total Fleet |
165 | 190 | 206 | |||
United States. As of December 31, 2009, 62 vessels were operating in the U.S. Gulf of Mexico, including 33 owned, 24 leased-in, three joint ventured and two pooled. Offshore Marine Services’ expertise in this market is deepwater anchor handling with its fleet of AHTS vessels, and exploration and production support with its fleet of crew and mini-supply vessels. Over the last few years, the market has split between the traditional shallow water shelf activity and the developing deepwater market. The shelf market is highly price sensitive and quickly affected by movements in commodity prices. Customers in the deepwater market place greater emphasis on vessel specifications and features in addition to price.
Africa, primarily West Africa. As of December 31, 2009, 26 vessels were operating in West Africa, including 18 owned, two leased-in, four joint ventured and two managed. Offshore Marine Services operates primarily in Angola, servicing large-scale, multi-year projects for major oil companies. The other vessels in this region operate from ports in Nigeria, the Republic of the Congo, Cameroon, Gabon, Equatorial Guinea and South Africa.
United Kingdom, primarily North Sea. As of December 31, 2009, 25 vessels were operating in the North Sea, including 24 owned and one joint ventured. The North Sea fleet provides standby safety and supply services. Demand in the North Sea market for standby services developed in 1991 after the United Kingdom passed legislation requiring offshore operators to maintain higher specification standby safety vessels. The legislation requires a vessel to “stand by” to provide a means of evacuation and rescue for platform and rig personnel in the event of an emergency at an offshore installation.
Middle East. As of December 31, 2009, 22 vessels were operating in the Middle East region, including 16 owned, one leased-in, two joint ventured and three managed. Offshore Marine Services’ vessels operating in this area generally support activities in countries along the Arabian Gulf and Arabian Sea, including the United Arab Emirates, Qatar, Saudi Arabia and India.
Asia. As of December 31, 2009, eight vessels were operating in Asia, including six owned and two joint ventured. Offshore Marine Services’ vessels operating in this area generally support exploration programs. To date, Offshore Marine Services’ largest markets in this area have been Vietnam and Indonesia.
6
Table of Contents
Mexico, Central and South America. As of December 31, 2009, 22 vessels were operating in Mexico, Central and South America, including 14 owned and eight managed. Offshore Marine Services’ primary markets in this region are Brazil, Argentina and Mexico.
Customers and Contractual Arrangements
The Offshore Marine Services segment earns revenues primarily from the time charter and bareboat charter of vessels to customers based upon daily rates of hire. Under a time charter, Offshore Marine Services provides a vessel to a customer and is responsible for all operating expenses, typically excluding fuel. Under a bareboat charter, Offshore Marine Services provides a vessel to the customer and the customer assumes responsibility for all operating expenses and assumes all risk of operation. Vessel charters may range from several days to several years. In the U.S. Gulf of Mexico, time charter durations and rates are typically established in the context of master service agreements that govern the terms and conditions of charter.
Offshore Marine Services’ principal customers are major integrated oil companies, large independent oil and gas exploration and production companies and emerging independent companies. Consolidation of oil and gas companies through mergers and acquisitions over the past several years has reduced Offshore Marine Services’ customer base. In 2009, there was no single customer responsible for 10% or more of consolidated operating revenues. The ten largest customers of Offshore Marine Services accounted for approximately 50% of Offshore Marine Services’ operating revenues. The loss of one or a few of these customers could have a material adverse effect on Offshore Marine Services’ results of operations.
Competitive Conditions
Each of the markets in which Offshore Marine Services operates is highly competitive. The most important competitive factors are pricing and the availability and specifications of equipment to fit customer requirements. Other important factors include service, reputation, flag preference, local marine operating conditions, the ability to provide and maintain logistical support given the complexity of a project and the cost of moving equipment from one geographical location to another.
Offshore Marine Services has numerous competitors in each of the geographical regions in which it operates, ranging from international companies that operate in many regions to smaller local companies that typically concentrate their activities in one specific region.
Risks of Foreign Operations
For the years ended December 31, 2009, 2008 and 2007, 63%, 52% and 52%, respectively, of Offshore Marine Services’ operating revenues were derived from foreign operations.
Foreign operations are subject to inherent risks, including, among others, political instability, asset seizures, blockades, blacklisting, nationalization of assets, terrorist attacks, piracy, kidnapping, fluctuating currency values, hard currency shortages, controls on currency exchange, the repatriation of income or capital, import-export quotas and other forms of public and governmental regulation, all of which are beyond the control of Offshore Marine Services. It is difficult to predict whether or when any of these conditions or events may develop in the future. The occurrence of any one or more of these conditions or events could have a material adverse effect on Offshore Marine Services’ financial position and its results of operations.
Marine Transportation Services
Business
Marine Transportation Services owns a fleet of eight U.S.-flag product tankers, providing marine transportation services for petroleum products and chemicals moving in the U.S. domestic coastwise trade. This segment contributed 5%, 7% and 9% of consolidated operating revenues in 2009, 2008 and 2007, respectively.
7
Table of Contents
Equipment and Services
The Oil Pollution Act of 1990 (“OPA 90”) prohibits vessels without double-hulls from transporting crude oil and petroleum products in U.S. coastwise transportation after certain dates based on the age and carrying capacity of the vessel. In addition, single-hulled vessels will be prohibited from transporting petroleum products in most international markets under a phase-out schedule established by the International Maritime Organization (“IMO”). The table below sets forth the Marine Transportation Services’ fleet as of December 31, 2009.
| Name of Vessel |
Capacity in barrels |
Tonnage in “dwt”(1) |
OPA 90 Retirement date |
Type | ||||
| Seabulk Trader |
294,000 | 48,700 | None | Double-hull | ||||
| Seabulk Challenge |
294,000 | 48,700 | None | Double-hull | ||||
| California Voyager (formerly—HMI Brenton Reef) |
341,000 | 45,000 | None | Double-hull | ||||
| Seabulk Energy |
341,000 | 45,000 | None | Double-hull | ||||
| Seabulk Arctic |
340,000 | 46,000 | None | Double-hull | ||||
| Mississippi Voyager (formerly—Seabulk Mariner) |
340,000 | 46,000 | None | Double-hull | ||||
| Seabulk Pride |
340,000 | 46,000 | None | Double-hull | ||||
| Seabulk America |
297,000 | 46,300 | 2015 | Double-bottom |
| (1) | Deadweight tons or “dwt”. |
Markets
Petroleum Product Transportation. In the domestic energy trade, oceangoing vessels transport fuel and other petroleum products primarily from refineries and storage facilities along the coast of the U.S. Gulf of Mexico to utilities, waterfront industrial facilities and distribution facilities along the U.S. Gulf of Mexico, and the U.S. Atlantic and Pacific coasts, as well as transport crude and product between Alaska and the U.S. Pacific coast and Hawaii. The number of U.S.-flag oceangoing vessels eligible to participate in the U.S. domestic trade and capable of transporting fuel or petroleum products has fluctuated in recent years as vessels have reached the end of their useful lives or have been retired due to OPA 90 requirements and newbuilds are placed into service.
Chemical Transportation. In the U.S. domestic coastwise chemical transportation trade, vessels carry chemicals, primarily from chemical manufacturing plants and storage facilities along the coast of the U.S. Gulf of Mexico to industrial users in and around U.S. Atlantic and Pacific coast ports. The chemicals transported consist primarily of caustic soda, paraxylene, alkylates, toluene and lubricating oils. Some of the chemicals must be carried in vessels with specially coated or stainless steel cargo tanks and many of them are sensitive to contamination and require special cargo-handling equipment.
Customers and Contractual Arrangements
The primary purchasers of petroleum product transportation services are multinational oil and gas companies, refining companies, oil trading companies and large industrial consumers of fuel with waterfront facilities. The primary purchasers of chemical transportation services are chemical and oil companies. Both services are generally contracted for on the basis of short-term or long-term time charters, voyage charters, and contracts of affreightment or other transportation agreements tailored to the shipper’s requirements. In 2009, no single customer was responsible for 10% or more of consolidated operating revenues. The ten largest customers of Marine Transportation Services accounted for approximately 99% of its operating revenues. The loss of one or a few of these customers could have a material adverse effect on Marine Transportation Services’ results of operations.
Under a time charter, Marine Transportation Services provides a vessel to a customer and is responsible for all operating expenses, typically excluding fuel and port charges. Under a bareboat charter, Marine Transportation
8
Table of Contents
Services provides a vessel to a customer and the customer assumes responsibility for all operating expenses and assumes all risk of operation. Vessel charters may range from several days to several years. Voyage contracts are contracts to carry cargos on a single voyage basis regardless of time to complete. Contracts of affreightment are contracts for cargos that are committed on a multi-voyage basis for various periods of time, with minimum and maximum cargo tonnages specified over the period at a fixed or escalating rate per ton.
Competitive Conditions
The markets in which the Marine Transportation Services fleet operates are highly competitive. Primary direct competitors are other operators of U.S.-flag ocean-going tank vessels and chemical carriers, operators of articulated tug and barge units and operators of refined product pipelines. The U.S. “Jones Act” shipping market is a trade that is not available to foreign-based competition. The most important competitive factors are pricing, vessel age and vessel availability to fit customer requirements as well as customer preference for double-hull vessels even though single hull vessels are still eligible to trade.
Business
Inland River Services owns, operates, invests in and markets inland river transportation equipment. The Company believes it operates one of the industry’s newest fleets of dry cargo and liquid tank barges transporting agricultural and industrial commodities, and chemical and petrochemical products on the U.S. Inland River Waterways, primarily the Mississippi River, Illinois River, Tennessee River, Ohio River and their tributaries, and the Gulf Intracoastal Waterways. Inland River Services also owns towboats used for moving barges, fleeting operations and deck barges. It also manages barges for third parties. Inland River Services contributed 9%, 9% and 9% of consolidated operating revenues in 2009, 2008 and 2007, respectively.
9
Table of Contents
Equipment and Services
The following tables identify the types of equipment that comprise Inland River Services fleet as of December 31 for the indicated years. “Owned” are those majority owned by the Company. “Joint Ventured” are those owned by entities in which the Company does not have a controlling interest. “Leased-in” are those leased-in under operating leases. “Pooled” are owned by entities not affiliated with Inland River Services with operating revenues and voyage expenses pooled with certain barges of similar type owned by Inland River Services and the net results allocated to participants based upon the number of days the barges participate in the pool. Each barge owner is responsible for the costs of insurance, maintenance and repair as well as for capital and financing costs of its own equipment in the pool. “Managed” are owned by entities not affiliated with the Company but operated by Inland River Services for a fee.
| Owned | Joint Ventured |
Leased-in | Pooled or Managed |
Total | ||||||
| 2009 |
||||||||||
| Inland river dry cargo barges |
581 | 262 | 2 | 550 | 1,395 | |||||
| Inland river liquid tank barges |
51 | 34 | 2 | — | 87 | |||||
| Inland river deck barges |
26 | — | — | — | 26 | |||||
| Inland river towboats |
17 | 12 | — | — | 29 | |||||
| Dry cargo vessel(1) |
— | 1 | — | — | 1 | |||||
| 675 | 309 | 4 | 550 | 1,538 | ||||||
| 2008 |
||||||||||
| Inland river dry cargo barges |
586 | 262 | 7 | 122 | 977 | |||||
| Inland river liquid tank barges |
51 | 33 | 2 | — | 86 | |||||
| Inland river deck barges |
26 | — | — | — | 26 | |||||
| Inland river towboats |
17 | 5 | — | — | 22 | |||||
| 680 | 300 | 9 | 122 | 1,111 | ||||||
| 2007 |
||||||||||
| Inland river dry cargo barges |
608 | 222 | 7 | 148 | 985 | |||||
| Inland river liquid tank barges |
49 | 22 | 2 | — | 73 | |||||
| Inland river deck barges |
26 | — | — | — | 26 | |||||
| Inland river towboats |
13 | 4 | — | — | 17 | |||||
| 696 | 248 | 9 | 148 | 1,101 | ||||||
| (1) | Argentine-flag. |
As of December 31, 2009, the average age (in years) of Inland River Services’ owned and joint ventured fleet was as follows:
| Dry cargo barges |
6 | |
| Liquid tank barges—10,000 barrel |
19 | |
| Liquid tank barges—30,000 barrel |
7 | |
| Deck barges |
2 | |
| Towboats(1) |
35 |
| (1) | Towboats have been upgraded and maintained to meet or exceed current industry standards. |
10
Table of Contents
Inland barges are unmanned and are moved on the U.S. Inland River Waterways by towboats. The combination of a towboat and dry cargo barges is commonly referred to as a “tow.” The Inland River Services dry cargo fleet consists of hopper barges, which can be open for the transport of commodities that are not sensitive to water such as coal, aggregate and scrap, or covered for the transport of water sensitive products, such as grain, ores, alloys, cements and fertilizer. Each dry cargo barge in the Inland River Services’ fleet is capable of transporting approximately 1,500 to 2,000 tons (1,350 to 1,800 metric tons) of cargo. The carrying capacity of a barge at any particular time is determined by water depth in the river channels and hull size of the barge. Adverse river conditions, such as high water resulting from excessive rainfall or low water caused by drought, can also impact operations by limiting the speed at which tows travel the U.S. Inland River Waterways, the number of barges included in tows and the quantity of cargo that is loaded in the barges.
Typical dry cargo voyage activity requires shifting a clean, empty barge from a fleeting location to a loading facility. The barge is then moved from the loading location and assembled into a tow before proceeding to its next destination. After unloading, it is shifted to a fleeting area for cleaning and repair, if needed, before being moved again into a load position. Typically, grain cargos move southbound and non-grain cargos move northbound. Generally, Inland River Services attempts to coordinate the logistical match-up of northbound and southbound movements of cargo to minimize repositioning costs.
Inland River Services’ fleet of 10,000 barrel liquid tank barges transports liquid bulk commodities such as lube oils, solvents and glycols. The operations of these barges are similar to those of the dry cargo barges described above. Inland River Services’ fleet of 30,000 barrel liquid tank barges transports refined petroleum products and black oil products and are normally chartered-out as “unit tows” consisting of two to three barges along with a towboat working in patterns prescribed by the customer. Inland River Services is responsible for providing manpower for the towboats working in such operations.
Inland River Services owns a “fleeting operation,” which is a staging area for grouping barges in preparation for movements up and down the river and a holding area for barges waiting to load and unload cargo. This fleeting operation is managed by a third party.
Inland River Services owns a tank farm and handling facility in Sauget, Illinois. The facility is multi-modal, supporting truck, rail, unit trains and barges, and commenced operations in May 2008.
Inland River Services has a 50% interest in a joint venture that owns a fleet of inland marine transportation assets with a view toward generating cash returns that may be enhanced by entering into strategic positions in marketable securities and commodity futures.
Inland River Services has a 50% interest in a joint venture that operates a grain and fertilizer storage and handling facility in McLeansboro, Illinois.
Inland River Services has a 50% interest in a joint venture with a third party in South America that, as of December 31, 2009, operates six towboats and 112 dry cargo barges on the Parana-Paraguay Rivers.
Inland River Services has a 50% interest in a joint venture that operates six inland river towboats on the U.S. Inland River Waterways.
Markets
The market for Inland River Services is driven by supply and demand economics, which impacts prices, margins achieved and utilization of Inland River Services’ assets. The relationship between supply and demand reflects many factors, including:
| • | the level of domestic and international production of the basic agricultural products to be transported (in particular the yields from grain harvests) |
11
Table of Contents
| • | the level of domestic and international consumption of agricultural products and the effect of these levels on the volumes of products that are physically moved into the export markets |
| • | domestic and worldwide demand for iron ore, steel, steel by-products, coal, ethanol, petroleum and other bulk commodities |
| • | strength or weakness of the U.S. dollar |
| • | the cost of ocean freight and the cost of fuel |
Within the United States, other local factors also have an effect on pricing and margins, including:
| • | the supply of barges available to move the products |
| • | the cost of qualified wheelhouse personnel |
| • | the ability to position the barges to maximize efficiencies and utility in moving cargos both northbound and southbound |
| • | the cost of alternative forms of transportation (primarily rail) |
| • | general operating logistics on the river network including size and operating status of locks and dams |
| • | the effect of river levels on the loading capacities of the barges in terms of draft restrictions |
Seasonality
During harsh winters the upper Mississippi River usually closes to barge traffic from mid-December to mid-March. Ice often hinders the navigation of barge traffic on the mid-Mississippi River, the Illinois River and the upper Ohio River during the same period. The volume of grain transported from the Midwest to the Gulf of Mexico, which is primarily for export, is greatest during the harvest season from mid-August through late November. The harvest season is particularly significant because pricing tends to peak during these months in response to higher demand for equipment.
Customers and Contractual Arrangements
The principal customers for Inland River Services are major agricultural companies, major integrated oil companies and industrial companies. In 2009, there was no single customer responsible for 10% or more of consolidated operating revenues. The ten largest customers of Inland River Services accounted for approximately 66% of Inland River Services’ revenues in 2009. The loss of one or a few of its customers would be unlikely to have a material adverse effect on Inland River Services’ results of operations.
Most of Inland River Services’ dry cargo barges are employed under contracts of affreightment that can vary in duration, ranging from one voyage to several years. For longer term contracts, base rates may be adjusted in response to changes in fuel prices and operating expenses. Some longer term contracts provide for the transport of a minimum number of tons of cargo or specific transportation requirements for a particular customer. Some barges are bareboat chartered-out to third parties for a fixed payment of hire per day for the duration of the charter. These contracts tend to be longer, ranging in term from one to five years.
Inland River Services generally charges a price per ton for point to point transportation of dry bulk commodities. Customers are permitted a specified number of days to load and discharge the cargo and thereafter pay a per diem demurrage rate for extra time. From time to time, dry cargo barges may be used for storage for a period prior to delivery.
Inland River Services’ 10,000 barrel liquid tank barges are either chartered-out on term contracts ranging from one to five years or marketed on the spot market.
12
Table of Contents
Inland River Services’ 30,000 barrel liquid tank barges are marketed primarily as unit tows under term contracts ranging from one to five years.
Inland River Services’ tank farm and handling facility is marketed on a tariff system driven by throughput volume.
Competitive Conditions
Generally, Inland River Services believes the primary barriers to effective competitive entry into the U.S. Inland River Waterways markets are the complexity of operations, the consolidation of the inland river towing industry and the difficulty in assembling a large enough fleet and an experienced staff to execute voyages efficiently and re-position barges effectively to optimize their use. The primary competitive factors among established operators are price, availability and reliability of barges and equipment of a suitable type and condition for a specific cargo.
Inland River Services’ main competitors are other barge lines. Railroads and liquid pipelines also compete for traffic that might otherwise move on the U.S. Inland River Waterways.
The Company believes that 67% of the domestic dry cargo fleet is controlled by five companies and 63% of the domestic liquid barge industry fleet is controlled by five companies.
Risks of Foreign Operations
Inland River Services foreign operations primarily consist of its joint ventures operating in foreign jurisdictions.
Foreign operations are subject to inherent risks, including, among others, political instability, asset seizures, blockades, blacklisting, nationalization of assets, terrorist attacks, piracy, kidnapping, fluctuating currency values, hard currency shortages, controls on currency exchange, the repatriation of income or capital, import-export quotas and other forms of public and governmental regulation, all of which are beyond the control of Inland River Services. It is difficult to predict whether or when any of these conditions or events may develop in the future. The occurrence of any one or more of these conditions or events could have a material adverse effect on Inland River Services’ financial position and its results of operations.
Business
Aviation Services is primarily engaged in transportation services to the offshore oil and gas exploration, development and production industry, aircraft leasing, transportation services to hospitals (“Air Medical Services”) and flightseeing tours in Alaska. In addition, Aviation Services sells fuel and provides other services to corporate aircraft at its fixed base operation (“FBO”) at Ted Stevens Anchorage International Airport. It also provides aircraft and flight crews under contracts, provides flight training services and manages customer-owned aircraft. Aviation Services operates a Federal Aviation Administration (“FAA”) approved maintenance repair station in Lake Charles, Louisiana. Aviation Services contributed 14%, 15% and 16% of consolidated operating revenues in 2009, 2008 and 2007, respectively.
13
Table of Contents
Equipment and Services
The following tables identify the types of aircraft that comprise Aviation Services’ fleet as of December 31 for the indicated years. “Owned” are those majority owned by the Company. “Joint Ventured” are those owned by entities in which the Company does not have a controlling interest. “Leased-in” are those leased-in under operating leases. “Managed” are those owned by entities not affiliated with the Company but operated by Aviation Services for a fee. As of December 31, 2009, 137 aircraft were located in the United States and 37 were located in foreign jurisdictions.
| Owned(1) | Joint Ventured |
Leased-in(2) | Managed | Total | ||||||
| 2009 |
||||||||||
| Light helicopters—single engine |
51 | 6 | 3 | — | 60 | |||||
| Light helicopters—twin engine |
33 | — | 6 | 8 | 47 | |||||
| Medium helicopters |
53 | — | 3 | 3 | 59 | |||||
| Heavy helicopters |
8 | — | — | — | 8 | |||||
| 145 | 6 | 12 | 11 | 174 | ||||||
| 2008 |
||||||||||
| Light helicopters—single engine |
51 | 6 | 6 | — | 63 | |||||
| Light helicopters—twin engine |
35 | — | 6 | 14 | 55 | |||||
| Medium helicopters |
52 | — | 3 | 7 | 62 | |||||
| Heavy helicopters |
7 | — | — | — | 7 | |||||
| 145 | 6 | 15 | 21 | 187 | ||||||
| 2007 |
||||||||||
| Light helicopters—single engine |
49 | 4 | 8 | — | 61 | |||||
| Light helicopters—twin engine |
31 | — | 7 | 15 | 53 | |||||
| Medium helicopters |
44 | — | 3 | 7 | 54 | |||||
| Heavy helicopters |
3 | — | — | — | 3 | |||||
| 127 | 4 | 18 | 22 | 171 | ||||||
| (1) | Excludes two and four helicopters removed from service as of December 31, 2009 and 2007, respectively. |
| (2) | Excludes three helicopters removed from service as of December 31, 2009. |
In typical configurations, Light helicopters are single or twin engine helicopters with a passenger capacity between five and seven, Medium helicopters are twin engine helicopters with a passenger capacity of up to 13 and Heavy helicopters are twin engine helicopters with a passenger capacity of up to 19.
Aviation Services has a 49% interest in an international sales, marketing and manufacturing organization focusing on after-market helicopter accessories.
Aviation Services has a 50% interest in a joint venture that provides instruction and flight simulator training to outside customers and Aviation Services’ employees.
Markets
Aviation Services’ current principal markets for its transportation services supporting the offshore oil and gas exploration, development and production industry are in the U.S. Gulf of Mexico and Alaska. In the U.S.
14
Table of Contents
Gulf of Mexico, the customers and locations are similar to those serviced by Offshore Marine Services and its market opportunities are subject to the same cycles and pressures as described in “Item 1. Business—Offshore Marine Services—Markets.” Other helicopter services to the oil and mining industries in Alaska are provided on a contract or charter basis from bases in Valdez, Anchorage, the Kenai area and Deadhorse.
Air Medical Services operations are primarily in the northeastern United States, Florida and Tennessee. Flightseeing services in Alaska are operated out of Juneau and from areas near Denali National Park. In addition, Aviation Services leases aircraft to other operators principally outside the United States.
Seasonality
A significant portion of Aviation Services’ operating revenues and profits related to oil and gas industry activity is dependent on actual flight hours. The fall and winter months have fewer hours of daylight and flight hours are generally lower at these times. In addition, prolonged periods of adverse weather in the fall and winter months coupled with the effect of fewer hours of daylight can adversely impact operating results. In general, the months of December through February in the U.S. Gulf of Mexico and October through April in Alaska have more days of adverse weather conditions than the other months of the year. In the U.S. Gulf of Mexico, June through November is tropical storm season. During tropical storms, Aviation Services is unable to operate in the area of a storm although flight activity may increase immediately prior to and after storms due to the evacuation and return of offshore workers. The Alaska flightseeing operation is also seasonal with activity generally occurring from late May until early September.
Customers and Contractual Arrangements
Aviation Services charters its helicopters to utility and oil and gas customers primarily through master service agreements, term contracts, day-to-day charter arrangements and leases. Master service agreements require incremental payments above a fixed rental fee based upon flight hours flown, have fixed terms ranging from one month to five years and generally are cancelable upon 30 days notice. Term contracts and day-to-day charter arrangements are generally non-cancelable without cause and call for a combination of a monthly or daily fixed rental fee plus a charge based on hours flown. Day-to-day charter arrangements are generally based on either an hourly or daily rate. Leases can be either “dry”, providing only the equipment, or “wet”, providing equipment, insurance and personnel. The rate structure, as it applies to Aviation Services’ utility and oil and gas contracts, typically contains terms that limit its exposure to increases in fuel costs over a pre-agreed level. Fuel costs in excess of these levels are passed through to customers. With respect to flightseeing aircraft, block space is allocated to cruise lines and seats sold directly to customers. Other markets for Aviation Services include international oil and gas industry support activities, agricultural support and general aviation activities. Aviation Services’ activities in these markets are limited.
Air Medical Services are provided under contracts with hospitals that typically include either a fixed monthly and hourly rate structure, similar to oil and gas, or a fee per completed flight. Most contracts with hospitals are longer term, but offer either party the ability to terminate with less than six months notice. Aviation Services operates some air medical contracts pursuant to which it collects a fee per flight, either from a hospital or an insurance company.
Aviation Services’ FBO in Alaska sells fuel and other services to a diverse group of general aviation companies and large corporations on an ad hoc basis. In addition, the FBO leases hangar space and provides fueling services for transient aircraft and the aviation assets of local companies.
Aviation Services’ principal customers in the U.S. Gulf of Mexico are oil companies of varying sizes and the U.S government. In Alaska, its principal customers for helicopter services are oil and mineral companies and cruise line passengers.
15
Table of Contents
In 2009, no one customer was responsible for 10% or more of consolidated operating revenues. The ten largest customers of Aviation Services accounted for approximately 48% of Aviation Services’ operating revenues. The loss of one or a few of its customers could have a material adverse effect on Aviation Services’ results of operations.
Competitive Conditions
The helicopter transportation business is highly competitive. Aviation Services is one of the largest helicopter companies operating in the U.S. Gulf of Mexico and one of the largest operating in Alaska. In the U.S. Gulf of Mexico, there are three major competitors: PHI, Inc., Bristow Group, Inc. and Rotorcraft Leasing Company LLC. In addition, several customers in the U.S. Gulf of Mexico operate their own helicopter fleets. In Air Medical Services, there are several major competitors with larger fleets than Aviation Services. In most instances, an operator must have an acceptable safety record, demonstrated reliability and suitable equipment to bid for work. Among bidders meeting these criteria, customers typically make their final choice based on price and aircraft preference.
Risks of Foreign Operations
Aviation Services operates worldwide. For the years ended December 31, 2009, 2008 and 2007, 15%, 10% and 8%, respectively, of Aviation Services’ operating revenues were derived from its foreign operations.
Foreign operations are subject to inherent risks, including, among others, political instability, asset seizures, blockades, blacklisting. nationalization of assets, terrorist attacks, piracy, kidnapping, fluctuating currency values, hard currency shortages, controls on currency exchange, the repatriation of income or capital, import-export quotas and other forms of public and governmental regulation, all of which are beyond the control of Aviation Services. It is difficult to predict whether or when any of these conditions or events may develop in the future. The occurrence of any one or more of these conditions or events could have a material adverse effect on Aviation Services’ financial condition and its results of operations.
Business
Environmental Services primarily provides emergency preparedness and response services to oil, chemical, industrial and marine transportation clients, and government agencies in the United States and abroad. In the United States, these services are generally rendered to those clients who store, transport, produce or handle petroleum and certain non-petroleum oils that are subject to the provisions of OPA 90 and various other federal, state and municipal regulations. Internationally, these services may be required by legislation and regulation of countries, international maritime conventions and environmental covenants placed on clients by their lending institutions. To a lesser extent, Environmental Services provides emergency preparedness and response services to governmental agencies arising from natural disasters and homeland security issues such as debris removal monitoring, public assistance projects, bio-terrorism, pandemic influenza and port security. Environmental Services also provides other services to oil, chemical, industrial and government clients including hazardous waste management, industrial and marine cleaning, salvage support, petroleum storage tank removal, pipeline repair and site remediation services. Business is conducted primarily through the Company’s wholly owned subsidiaries: National Response Corporation (“NRC”), O’Brien’s Response Management Inc. and SEACOR Environmental Services International Limited. Environmental Services contributed 8%, 10% and 12% of consolidated operating revenues in 2009, 2008 and 2007, respectively.
Products and Services
Emergency Response Services. Environmental Services employs trained personnel and maintains specialized equipment positioned in the United States and in certain locations outside the United States to respond to oil and chemical spills, other emergencies and customer projects. A fleet of specialized vessels and
16
Table of Contents
barges outfitted with oil spill equipment is positioned on the East, Gulf and West coasts of the United States as well as in the Caribbean and Hawaii. Oil and chemical spill response equipment are also stationed in certain international locations in Africa, the Caspian and Black Sea Region, the Far East and the Middle East. Environmental Services has established a network of approximately 180 independent oil spill response contractors that may assist it by providing equipment and personnel.
Retainer Services. Environmental Services offers retainer contracts to the maritime community, such as operators of tank and non-tank vessels and chemical carriers, and to owners of facilities, such as refineries, pipelines, exploration and production platforms, power plants and storage tank and transportation terminals. Retainer contracts provide customers with access to professional response management and specialized equipment necessary to respond to an oil or chemical spill emergency and facilitate compliance with regulations such as OPA 90.
Consultancy and Training Services. Environmental Services provides a range of prevention, business continuity, media, safety and security consultancy and training services around the world to assist oil, chemical, industrial, marine transportation, financial services and government customers in the prevention of, and response to, an extensive variety of environmental emergencies on both a retained and stand-alone basis. Environmental Services assists customers in the selection and training of personnel in the use of environmental equipment and products. In addition, Environmental Services provides a service to state, county and other local government agencies assisting them with claim reimbursement from the federal government, through agencies such as the Federal Emergency Management Agency (“FEMA”) and the Federal Highway Administration. Furthermore, it provides oversight of clean-up and debris management required after hurricanes, floods and other natural disasters.
Industrial and Remediation Services. Environmental Services provides industrial and remediation services to oil, chemical, industrial and government clients. These services include hazardous waste management, industrial and marine cleaning, salvage support, petroleum storage tank removal, pipeline repair and site remediation services.
Markets
The market for contractual oil spill preparedness, response and other related training and consulting services in the United States resulted from the enactment of OPA 90. OPA 90 and several subsequent regulations promulgated by the Department of Transportation, Environmental Protection Agency (“EPA”), the Minerals Management Service division of the U.S. Department of Interior (“MMS”) and the U.S. Coast Guard (“USCG”) require that all tank vessels operating within the 200-mile Exclusive Economic Zone of the United States and all facilities and pipelines handling oil that could have a spill affecting the navigable waters of the United States develop plans to respond to a “worst case” oil spill and ensure by contract or other approved means the ability to respond to such a spill.
The market for vessel security assessments, security plans, security training and exercises and other related services is for clients required to comply with the Maritime Transportation Security Act of 2002. Homeland Security services are marketed to government agencies to assist with efforts to improve emergency preparedness and response capabilities.
In the international market for oil spill response services, Environmental Services seeks to develop opportunities with governments, other agencies and international oil and gas exploration and production companies to establish and operate the necessary response capability. International crisis management and business continuity services focus on middle and senior management and are marketed to a broad range of industry sectors such as oil and gas, chemical, financial services, transportation and other industries.
The market for government services in the United States includes federal, state, county, city, and other subdivisions and agencies. Services are typically provided in association with specific funding sources, such as FEMA reimbursement, Homeland Security Grants, municipal budgets and other agency funding.
17
Table of Contents
Customers and Contractual Arrangements
Environmental Services offers its services primarily to the domestic and international shipping community, major oil companies, independent exploration and production companies, pipeline and transportation companies, power generating operators, industrial companies, airports and state and local government agencies. Services are provided pursuant to contracts generally ranging from one month to ten years. In 2009, there was no single customer responsible for 10% or more of consolidated operating revenues. The ten largest customers of Environmental Services accounted for approximately 28% of Environmental Services’ operating revenues. The loss of a single large client or a group of mid-size customers could have a material adverse effect on Environmental Services’ results of operations.
Competitive Conditions
The principal competitive factors in the environmental service business are price, customer service, reputation, experience, qualifications, availability of personnel and operating capabilities. In the United States, qualifications include USCG classification as an Oil Spill Removal Organization (“OSRO”). Environmental Services’ NRC is a USCG classified OSRO and it faces competition primarily from the Marine Spill Response Corporation, a non-profit OSRO funded by the major integrated oil companies. NRC also faces competition from other non-profit industry cooperatives and from those commercial contractors who target specific market niches in response, consulting and remediation. Internationally, competition for both oil spill response and emergency preparedness and management comes from a few private companies and regional oil industry cooperatives. Consulting and training service competitors range from small independent privately owned businesses to large engineering consulting groups and major defense contractors.
Risks of Foreign Operations
Environmental Services operates worldwide. For the years ended December 31, 2009, 2008 and 2007, 14%, 20% and 25%, respectively, of Environmental Services’ operating revenues were derived from its foreign operations.
Foreign operations are subject to inherent risks, including, among others, political instability, asset seizures, blockades, blacklisting, nationalization of assets, terrorist attacks, piracy, kidnapping, fluctuating currency values, hard currency shortages, controls on currency exchange, the repatriation of income or capital, import-export quotas and other forms of public and governmental regulation, all of which are beyond the control of Environmental Services. It is difficult to predict whether or when any of these conditions or events may develop in the future. The occurrence of any one or more of these conditions or events could have a material adverse effect on Environmental Services’ financial condition and its results of operations.
Commodity Trading and Logistics
Business
Commodity Trading and Logistics operates an integrated business involved in the purchase, storage, transportation and sale of agricultural and energy commodities. The principal commodities currently involved are rice, sugar, ethanol and clean blendstocks. Commodity Trading and Logistics contributed 28%, 13% and 1% of consolidated operating revenues in 2009, 2008 and 2007, respectively.
Products and Services
Agricultural. The agricultural group is primarily focused on the global origination, trading and merchandising of rough and milled rice and sugar. This group typically sources rice from various export countries and arranges for the bundling and transport of the product to various import countries for sale in bulk or through local distribution networks. The group’s involvement in sugar pairs producers and buyers and arranges for the transportation and logistics of the product.
18
Table of Contents
Energy. The energy group is primarily focused on the domestic trading and transportation of physical ethanol and clean blendstocks. The energy group also operates, through an investment in a joint venture, a food and fuel grade processing plant which produces alcohol and ethanol. The output of the plant is sold primarily to the energy group and its joint venture partner.
Commodity Trading and Logistics uses a variety of transportation modes to transport its products, including trucks, railcars, river barges and ocean going vessels, which are generally leased. The transportation services are typically provided by truck lines, railroads and barge and ocean freight companies. From time to time, Commodity Trading and Logistics leverages the asset base of SEACOR’s other business units, primarily Inland River Services, for the transportation and storage of product.
Markets
Commodity Trading and Logistics activities are global and dependent upon factors that Commodity Trading and Logistics cannot control, including macro and micro economic supply and demand factors, governmental intervention or mandates, weather patterns, and the price and availability of substitute products. With respect to rice and sugar, the primary markets in which Commodity Trading and Logistics operate are countries that are net importers of these agricultural products and include countries in South America, the Caribbean and Africa. Commodity Trading and Logistics produces, purchases, markets and sells ethanol to customers for blending into the U.S. gasoline pool and transports clean blendstocks for export.
The availability of agricultural commodities is affected by weather, plant diseases, governmental policies and agricultural growing patterns. Rice demand is affected by growth in worldwide consumption of food products, population growth, changes in per capita income, the relative prices of substitute agricultural products and demand generated by beer consumption as rice is a significant input in the brewing process. Sugar demand is affected by growth in worldwide consumption of food products as well as soft drinks and sweetened beverages, population growth, changes in per capita income and the relative prices of substitute sweeteners.
Ethanol demand is subject to overall gasoline demand and gasoline blending economics, governmental policies and mandates, the cost of the production of feedstock commodities such as corn and sugar, gasoline and oil prices, freight and handling costs. The demand for the clean blendstocks depends primarily on oil and natural gas liquids prices.
Customers and Contractual Arrangements
Commodity Trading and Logistics sells agricultural commodities and processed commodity products to domestic and export customers throughout the world. Commodity Trading and Logistics sells both milled and rough rice globally to private import companies and government agencies overseeing grain imports. Commodity Trading and Logistics also has the flexibility to import, store and sell rice in smaller quantities in certain areas where the local market is unable to purchase large quantities. The principal purchasers of Commodity Trading and Logistics’ sugar are private importers and distributors. Commodity Trading and Logistics sells ethanol and blendstocks primarily to end users (gasoline blenders and their suppliers) and other market participants and may also purchase, sell, or exchange product with other market participants to optimize logistics or hedge market exposure.
In 2009, there was no single customer responsible for 10% or more of consolidated operating revenues. The ten largest customers of Commodity Trading and Logistics accounted for approximately 63% of Commodity Trading and Logistics operating revenues. The loss of one or a few of these customers could have a material adverse effect on Commodity Trading and Logistics results of operations.
19
Table of Contents
Competitive Conditions
The commodity trading and logistics business is highly competitive. Major competitors for the agricultural group include large agribusiness, major and independent trading houses and regional or local grower cooperatives. Major competitors for the energy group include other marketers, traders and other product suppliers.
Risk of Foreign Operations
For the year ended December 31, 2009 and 2008, 21% and 59% of Commodity Trading and Logistics operating revenues were derived from foreign operations. In 2007, no operating revenues were derived from foreign operations.
Foreign operations are subject to inherent risks, including, among others, political instability, asset seizures, blockades, blacklisting, nationalization of assets, terrorist attacks, piracy, kidnapping, fluctuating currency values, hard currency shortages, controls on currency exchange, the repatriation of income or capital, import-export quotas and other forms of public and governmental regulation, all of which are beyond the control of Commodity Trading and Logistics. It is difficult to predict whether or when any of these conditions or events may develop in the future. The occurrence of any one or more of these conditions or events could have a material adverse effect on Commodity Trading and Logistics’ financial condition and its results of operations.
Harbor and Offshore Towing Services. As of December 31, 2009, Harbor and Offshore Towing Services operated a total of 6 ocean liquid tank barges and 31 vessels, of which 15 were conventional tugs, six were Azimuth Stern Drive tugs, three were Forward Azimuth Drive tugs, three were tractor tugs and four were Ship Docking Modules (“SDM™”). SDMs™ are innovative vessels designed and patented by the Company that are maneuverable, efficient and flexible and require fewer crew members than conventional harbor tugs. In 2009, no single customer was responsible for 10% or more of consolidated operating revenues. The ten largest customers of Harbor and Offshore Towing Services accounted for approximately 49% of Harbor and Offshore Towing Services’ operating revenues.
As of December 31, 2009, ten tugs were operating in Florida: four in Port Everglades, five in Tampa and one in Port Canaveral. Six tugs were operating in Port Arthur, Texas, three were operating in Mobile, Alabama and four were operating in Lake Charles, Louisiana. Three tugs were engaged in offshore towing operations. Five ocean liquid tank barges and five tugs were operating in St. Eustatius and one ocean liquid tank barge was available for charter.
Other Joint Ventures, Leasing and Other Activities. The Company has minority equity investments in various entities including a company that designs and manufactures water treatment systems for sale or lease, and two aviation service businesses in Asia. The Company also engages in lending and leasing activities.
Regulatory Matters
The Company’s operations are subject to significant United States federal, state and local regulations, as well as international conventions and the laws of foreign jurisdictions where the Company operates its equipment or where the equipment is registered. The Company’s domestically registered vessels are subject to the jurisdiction of the USCG, the National Transportation Safety Board (“NTSB”), the U.S. Customs Service and the U.S. Maritime Administration, as well as to the rules of private industry organizations such as the American Bureau of Shipping. These agencies and organizations establish safety standards and are authorized to investigate vessels and accidents and to recommend improved maritime safety standards. Aviation Services is subject to regulations pursuant to the Federal Aviation Act of 1958, as amended (“Federal Aviation Act”), and other
20
Table of Contents
statutes pursuant to Federal Aviation Regulations Part 135 Air Taxi Certificate granted by the FAA. The FAA regulates flight operations and, in this respect, has jurisdiction over Aviation Services personnel, aircraft, ground facilities and certain technical aspects of its operations. In addition to the FAA, the NTSB is authorized to investigate aircraft accidents and to recommend improved safety standards. The Company is also subject to the Communications Act of 1934, as amended, because of the use of radio facilities in Aviation Services operations.
Offshore Marine Services, Marine Transportation Services and Inland River Services are subject to the Shipping Act, 1916, as amended (“1916 Act”), and the Merchant Marine Act of 1920, as amended (“1920 Act,” or “Jones Act” and, together with the 1916 Act, “Shipping Acts”), which govern, among other things, the ownership and operation of vessels used to carry cargo between U.S. ports known as “U.S. coastwise trade.” The Shipping Acts require that vessels engaged in U.S. coastwise trade be owned by U.S. citizens and built in the United States. For a corporation engaged in the U.S. coastwise trade to be deemed a U.S. citizen: (i) the corporation must be organized under the laws of the United States or of a state, territory or possession thereof, (ii) each of the chief executive officer and the chairman of the board of directors of such corporation must be a U.S. citizen, (iii) no more than a minority of the number of directors of such corporation necessary to constitute a quorum for the transaction of business can be non-U.S. citizens and (iv) at least 75% of the interest in such corporation must be owned by U.S. “citizens” (as defined in the Shipping Acts). Should the Company fail to comply with the U.S. citizenship requirements of the Shipping Acts, it would be prohibited from operating its vessels in the U.S. coastwise trade during the period of such non-compliance.
To facilitate compliance with the Shipping Acts, SEACOR’s Restated Certificate of Incorporation: (i) limits the aggregate percentage ownership by non-U.S. citizens of any class of SEACOR’s capital stock (including Common Stock) to 22.5% of the outstanding shares of each such class to ensure that such foreign ownership will not exceed the maximum percentage permitted by applicable maritime law (presently 25%) but authorizes SEACOR’s Board of Directors, under certain circumstances, to increase the foregoing percentage to 24%, (ii) requires institution of a dual stock certification system to help determine such ownership and (iii) permits the Board of Directors to make such determinations as reasonably may be necessary to ascertain such ownership and implement such limitations. In addition, SEACOR’s by-laws provide that the number of non-U.S. citizen directors shall not exceed a minority of the number necessary to constitute a quorum for the transaction of business and restrict any non-U.S. citizen officer from acting in the absence or disability of the Chairman of the Board of Directors, the Chief Executive Officer or the President.
Aviation Services’ helicopters operating in the United States are subject to registration and citizenship requirements under the Federal Aviation Act. This Act requires that before an aircraft may be legally operated in the United States, it must be owned by “citizens of the United States,” which, in the case of a corporation, means a corporation: (i) organized under the laws of the United States or of a state, territory or possession thereof, (ii) of which at least 75% of its voting interests are owned or controlled by persons who are U.S. “citizens” (as defined in the Federal Aviation Act and regulations promulgated thereunder), and (iii) of which the president and at least two-thirds of the board of directors and managing officers are U.S. citizens.
Marine Transportation Services, Inland River Services, Harbor and Offshore Towing Services and Offshore Marine Services operate vessels that are registered in the United States. Offshore Marine Services, Harbor and Offshore Towing Services, and an Inland River Services joint venture operate vessels registered in a number of foreign jurisdictions. Vessels registered in these jurisdictions are subject to the laws of the applicable jurisdiction as to ownership, registration, manning and safety. In addition, the vessels are subject to the requirements of a number of international conventions that are applicable to vessels depending on their jurisdiction of registration. Among the more significant of these conventions are: (i) the 1978 Protocol Relating to the International Convention for the Prevention of Pollution from Ships, (ii) the International Convention on the Safety of Life at Sea, 1974 and 1978 Protocols, and (iii) the International Convention on Standards of Training, Certification and Watchkeeping for Seafarers, 1978. The Company believes that its vessels registered in foreign jurisdictions are in compliance with all applicable material regulations and have all licenses necessary to conduct their business. In addition, vessels operated as standby safety vessels in the North Sea are subject to the requirements of the Department of Transport of the United Kingdom pursuant to the United Kingdom Safety Act.
21
Table of Contents
All of Marine Transportation Services’, Harbor and Offshore Towing Services’, certain of Offshore Marine Services’ vessels and all of Inland River Services’ liquid tank barges are subject to periodic inspection and survey by, and drydocking and maintenance requirements of, the USCG and/or the American Bureau of Shipping and other marine classification societies. Moreover, to ensure compliance with applicable safety regulations, the USCG is authorized to inspect vessels at will.
NRC is classified by the USCG as an OSRO for every port in the continental United States, Hawaii and the Caribbean. The OSRO classification process is strictly voluntary. Vessel owners and other customers subject to OPA 90 who utilize classified OSROs are exempt from the requirement to list their response resources in their plans. The classification process permits the USCG and these customers to evaluate the ability of an OSRO to respond to and recover oil spills of various types and sizes in different operating environments and geographic locations.
In addition to the USCG, the EPA, the Office of Pipeline Safety, the MMS and certain individual states regulate vessels, facilities and pipelines in accordance with the requirements of OPA 90 or under analogous state law. There is currently little uniformity among the regulations issued by these agencies.
When responding to third-party oil spills, Environmental Services enjoys immunity from liability under federal law and some state laws for any spills arising from its response efforts, except in the event of death or personal injury as a result of its gross negligence or willful misconduct.
Environmental Compliance
As more fully described below, all of the Company’s businesses are, to some degree, subject to federal, state, local and international laws and regulations relating to environmental protection and occupational safety and health, including laws that govern the discharge of oil and pollutants into navigable waters. Violations of these laws may result in civil and criminal penalties, fines, injunctions or other sanctions.
The Company believes that its operations are currently in compliance with all material environmental laws and regulations. It does not expect that it will be required to make capital expenditures in the near future that are material to its financial position or operations to comply with environmental laws and regulations; however, because such laws and regulations are frequently changing and may impose increasingly strict requirements, the Company cannot predict the ultimate cost of complying with these laws and regulations. The recent trend in environmental legislation and regulation is generally toward stricter standards, and it is the Company’s view that this trend is likely to continue.
OPA 90 establishes a regulatory and liability regime for the protection of the environment from oil spills. OPA 90 applies to owners and operators of facilities operating near navigable waters and owners and operators of vessels operating in U.S. waters, which include the navigable waters of the United States and the 200-mile Exclusive Economic Zone of the United States. Although it appears to apply in general to all vessels, for purposes of its liability limits and financial responsibility and response planning requirements, OPA 90 differentiates between tank vessels (which include the Company’s chemical and petroleum product vessels and liquid tank barges) and “other vessels” (which include the Company’s tugs, offshore support vessels and dry cargo barges).
Under OPA 90, owners and operators of regulated facilities and owners and operators or certain charterers of vessels are “responsible parties” and are jointly, severally and strictly liable for removal costs and damages arising from facility and vessel oil spills unless the spill results solely from the act or omission of certain third parties under specified circumstances, an act of God or an act of war. Damages are defined broadly to include: (i) injury to natural resources and the costs of remediation thereof; (ii) injury to, or economic losses resulting from the destruction of, real and personal property; (iii) net loss by the United States government, a state or political subdivision thereof, of taxes, royalties, rents, fees and profits; (iv) lost profits or impairment of earning
22
Table of Contents
capacity due to property or natural resources damage; (v) net costs of providing increased or additional public services necessitated by a spill response, such as protection from fire, safety or other hazards; and (vi) loss of subsistence use of available natural resources.
The statutory liability of responsible parties for tank vessels is limited to the greater of $1,200 per gross ton or $10 million ($2 million for a vessel of 3,000 gross tons or less) per vessel; for any “other vessel,” such liability is limited to the greater of $600 per gross ton or $500,000 per vessel. These liability limits do not apply (a) if an incident is caused by the responsible party’s violation of federal safety, construction or operating regulations or by the responsible party’s gross negligence or willful misconduct, (b) if the responsible party fails to report the incident or to provide reasonable cooperation and assistance in connection with oil removal activities as required by a responsible official or (c) if the responsible party fails to comply with certain governmental orders.
Under OPA 90, with certain limited exceptions, all newly-built oil tankers carrying crude oil and petroleum products in U.S. waters must have double-hulls. Existing single-hull, double-side or double-bottom tank vessels, unless retrofitted with double-hulls, must be phased out of service by January 1, 2015, depending upon the vessel’s size, age and place of discharge.
OPA 90 expanded pre-existing financial responsibility requirements and requires tank vessel owners and operators to establish and maintain with the USCG evidence of insurance or qualification as a self-insurer or other evidence of financial responsibility sufficient to meet their potential liabilities under OPA 90. The Company has satisfied USCG regulations by providing evidence of financial responsibility demonstrated by commercial insurance and self-insurance. The regulations also implement the financial responsibility requirements of the Comprehensive Environmental Response, Compensation and Liability Act (“CERCLA”), described below, which imposes liability for discharges of hazardous substances such as chemicals, in an amount equal to $300 per gross ton, thus increasing the overall financial responsibility in the case of tank vessels from $1,200 to $1,500 per gross ton.
OPA 90 amended the Clean Water Act (“CWA”), described below, to require the owner or operator of certain facilities or of a tank vessel to prepare facility or vessel response plans and to contract with oil spill removal organizations to remove, to the maximum extent practicable, a worst-case discharge. The Company has complied with these requirements. The Company expects its pollution liability insurance to cover any cost of spill removal subject to overall coverage limitations of $1.0 billion; however, a failure or refusal of the insurance carrier to provide coverage in the event of a catastrophic spill could result in material liability in excess of available insurance coverage, resulting in a material adverse effect on the Company’s business, financial position or its results of operations.
OPA 90 allows states to impose their own liability regimes with respect to oil pollution incidents occurring within their boundaries and many states have enacted legislation providing for unlimited liability for oil spills. Some states have issued regulations addressing financial responsibility and vessel and facility response planning requirements. The Company does not anticipate that state legislation or regulations will have any material impact on its operations.
In addition to OPA 90, the following are examples of environmental laws that relate to the Company’s business and operations:
The federal CWA and comparable state and local laws impose restrictions on the discharge of pollutants into the navigable waters of the United States. These laws also provide for civil and criminal penalties, as well as injunctive relief, for violations. A related statute, the Coastal Zone Management Act, authorizes state development and implementation of programs to manage non-point source pollution to restore and protect coastal waters.
The federal Resource Conservation and Recovery Act and comparable state and local laws regulate the generation, transportation, treatment, storage and disposal of hazardous and certain non-hazardous wastes. These
23
Table of Contents
laws also provide for civil and criminal penalties, as well as injunctive relief, for violations. The Company’s operations may generate or, in some cases, result in the transportation of these regulated wastes.
CERCLA and comparable state laws establish strict and, under certain circumstances, joint and several liabilities for specified parties in connection with liability for the investigation and remediation of releases of hazardous materials into the environment and damages to natural resources.
The federal Clean Air Act and comparable state and local laws impose restrictions on the emission of air pollutants into the atmosphere. These laws also provide for civil and criminal penalties, as well as injunctive relief, for violations. The Company’s chemical and petroleum product carrier vessels are subject to vapor control and recovery requirements when loading, unloading, ballasting, cleaning and conducting other operations in certain ports and are equipped with vapor control systems that satisfy these requirements in all material respects.
The Company manages exposure to losses from the above-described laws through its efforts to use only well-maintained, well-managed and well-equipped facilities and vessels and its development of safety and environmental programs, including a maritime compliance program and its insurance program. The Company believes it will be able to accommodate reasonably foreseeable environmental regulatory changes. There can be no assurance, however, that any future regulations or requirements or that any discharge or emission of pollutants by the Company will not have a material adverse effect on the Company’s business, financial position or its results of operations.
Security
Heightened awareness of security needs brought about by the events of September 11, 2001 has caused the USCG, the IMO, states and local ports to adopt heightened security procedures relating to ports and vessels. The Company has updated its procedures in light of the new requirements.
In 2002, Congress passed the Maritime Transportation Security Act (“MTSA”), which together with the IMO’s recent security proposals (collectively known as the International Ship and Port Facility Security Code or “ISPS”), requires specific security plans for the Company’s vessels and rigorous crew identification requirements. The following vessels are subject to the requirements of the ISPS:
| • | U.S.-flag vessels operating in the Jones Act trade that are at least 100 gross registered tons |
| • | U.S.-flag vessels operating on an international voyage |
| • | Foreign flag vessels that are at least 500 gross tons under the International Tonnage Convention |
The Company has implemented security plans and procedures for each of its U.S.-flag vessels and its terminal operation in Sauget, Illinois pursuant to rules implementing the MTSA that have been issued by the USCG. The Company anticipates that the costs of security for its business will continue to increase. The Company’s U.S.-flag vessels subject to the requirements of ISPS, all foreign flag vessels, and U.S.-flag vessels operating on international voyages were in compliance with ISPS requirements effective July 1, 2004.
Industry Hazards and Insurance
Vessel operations involve inherent risks associated with carrying large volumes of cargo and rendering services in a marine environment. In addition, helicopter operations are potentially hazardous and may result in incidents or accidents. Hazards include adverse weather conditions, collisions, fire and mechanical failures, which may result in death or injury to personnel, damage to equipment, loss of operating revenues, contamination of cargo, pollution and other environmental damages and increased costs. The Company maintains marine and aviation hull, liability and war risk, general liability, workers compensation and other insurance customary in the industries in which the Company operates. The Company also conducts training and safety programs to promote a safe working environment and minimize hazards.
24
Table of Contents
As of December 31, 2009, the Company employed 4,956 individuals directly and indirectly through crewing or manning agreements. Substantially all indirect employees support Offshore Marine Services vessel operations.
As of December 31, 2009, Offshore Marine Services employed 692 seafarers in the North Sea, some of whom were members of a union under the terms of an ongoing agreement. In the United States, a total of 316 employees in Marine Transportation Services and Harbor and Offshore Towing Services are unionized under agreements that expire at varying times through December 31, 2012. Certain individuals in Environmental Services are also represented by unions.
Management considers relations with its employees to be satisfactory.
25
Table of Contents
| ITEM 1A. | RISK FACTORS |
Risks, Uncertainties and Other Factors That May Affect Future Results
The Company’s results of operations, financial condition and cash flow can be adversely affected by numerous risks. Carefully consider the risks described below, which represent some of the more critical risk factors that affect the Company, as well as the other information that has been provided in this Annual Report on Form 10-K. The risks described below are not the exclusive risks faced by the Company. Additional risks not presently known may also impair the Company’s business operations.
Difficult economic conditions could materially adversely affect the Company. The success of the Company’s business is both directly and indirectly dependent upon conditions in the global financial markets and economic conditions throughout the world that are outside its control and difficult to predict. Uncertainty about global economic conditions may lead businesses to postpone spending in response to tighter credit and reductions in income or asset values, which may lead many lenders and institutional investors to reduce, and in some cases, cease to provide funding to borrowers. These factors may also adversely affect the Company’s liquidity and financial condition (including the failure of lenders participating in the Company’s credit facility to fulfill their commitments and obligations), and the liquidity and financial condition of the Company’s customers. Tight credit conditions could limit the Company’s ability to secure additional financing, if required, due to difficulties accessing the capital markets. Factors such as interest rates, availability of credit, inflation rates, economic uncertainty, changes in laws (including laws relating to taxation), trade barriers, commodity prices, currency exchange rates and controls, and national and international political circumstances (including wars, terrorist acts or security operations) can have a material negative impact on the Company’s business and investments, which could reduce its revenues and profitability. Although the Company has some ongoing exposure to credit risks on its accounts receivable balances, these risks are heightened during periods when economic conditions worsen. The Company has procedures that are designed to monitor and limit exposure to credit risk on its receivables; however, there can be no assurance that such procedures will effectively limit its credit risk and avoid losses that could have a material adverse effect on the Company’s financial position and its results of operations. Unstable economic conditions may increase the volatility of the Company’s stock price.
There are risks associated with the Company’s debt structure. The Company’s ability to meet its debt service obligations is dependent upon its future operating results, which are subject to general economic conditions, industry cycles and financial, business and other factors, many of which are beyond its control. The Company’s debt levels and the terms of its indebtedness may limit its liquidity and flexibility in obtaining additional financing and pursuing other business opportunities. In addition, the Company’s overall debt level and/or market conditions could lead the credit rating agencies to lower the Company’s corporate credit ratings, which could limit its ability to issue additional debt in amounts and/or terms that it considers reasonable.
Demand for many of the Company’s services is impacted by the level of activity in the offshore oil and natural gas exploration, development and production industry. The level of offshore oil and natural gas exploration, development and production activity has historically been volatile and that volatility is likely to continue. The level of activity is subject to large fluctuations in response to relatively minor changes in a variety of factors that are beyond the Company’s control, including:
| • | prevailing oil and natural gas prices and expectations about future prices and price volatility |
| • | the cost of exploring for, producing and delivering oil and natural gas offshore |
| • | worldwide demand for energy, other petroleum products and chemical products |
| • | availability and rate of discovery of new oil and natural gas reserves in offshore areas |
| • | local and international political and economic conditions, and policies including cabotage and local content laws |
| • | technological advances affecting energy production and consumption |
26
Table of Contents
| • | weather conditions |
| • | environmental regulation |
| • | the ability of oil and natural gas companies to generate or otherwise obtain funds for capital projects |
A prolonged material downturn in oil and natural gas prices is likely to cause a substantial decline in expenditures for exploration, development and production activity, which would result in a decline in demand and lower rates for the Company’s offshore energy support services and tanker services. Moreover, for the year ended December 31, 2009, approximately 36% of Offshore Marine Services’ and 51% of Aviation Services’ operating revenues were earned in the U.S. Gulf of Mexico and are therefore dependent on levels of activity in that region, which may differ from levels of activity in other regions of the world.
Adverse results of legal proceedings could materially adversely affect the Company. The Company is subject to and may in the future be subject to a variety of legal proceedings and claims that arise out of the ordinary conduct of its business. Results of legal proceedings cannot be predicted with certainty. Irrespective of its merits, litigation may be both lengthy and disruptive to the Company’s operations and may cause significant expenditure and diversion of management attention. The Company may be faced with significant monetary damages or injunctive relief against it that could materially adversely affect a portion of its business operations or materially and adversely affect the Company’s financial position and its results of operations should the Company fail to prevail in certain matters.
The Company may undertake one or more significant corporate transactions that may not achieve their intended results, may adversely affect the Company’s financial condition and its results of operations and may result in additional risks to its businesses. The Company continuously evaluates the acquisition of operating businesses and assets and may in the future undertake significant transactions. Any such transaction could be material to the Company’s business and could take any number of forms, including mergers, joint ventures, investments in new lines of business and the purchase of equity interests or assets. The form of consideration for such transactions may include, among other things, cash, common stock or equity interests in the Company’s subsidiaries. The Company also evaluates the disposition of its operating businesses and assets, in whole or in part, which could take the form of asset sales, mergers or sales of equity interests in its subsidiaries (privately or through a public offering), or the spin-off of equity interests of the Company’s subsidiaries to its stockholders.
These types of significant transactions may present significant risks and uncertainties, including distraction of management from current operations, insufficient revenue to offset liabilities assumed, potential loss of significant revenue and income streams, unexpected expenses, inadequate return of capital, regulatory or compliance issues, the triggering of certain covenants in the Company’s debt instruments (including accelerated repayment) and other unidentified issues not discovered in due diligence. As a result of the risks inherent in such transactions, the Company cannot guaranty that any such transaction will ultimately result in the realization of the anticipated benefits of the transaction or that significant transactions will not have a material adverse impact on the Company’s financial condition or its results of operations. If the Company were to complete such an acquisition, disposition, investment or other strategic transaction, it may require additional debt or equity financing that could result in a significant increase in its amount of debt or the number of outstanding shares of its Common Stock.
Risks from the Company’s international operations. The Company operates vessels, leases helicopters, provides environmental services and transacts other business worldwide. Its ability to compete in the international offshore energy support market and environmental services market may be adversely affected by foreign government regulations that favor or require the awarding of contracts to local competitors, or that require foreign persons to employ citizens of, or purchase supplies from, a particular jurisdiction. Further, the Company’s foreign subsidiaries may face governmentally imposed restrictions on their ability to transfer funds to their parent company.
27
Table of Contents
Activity outside the United States involves additional risks, including the possibility of:
| • | United States embargoes, restrictive actions by foreign governments, including asset seizure |
| • | foreign taxation and changes in foreign tax laws |
| • | limitations on the repatriation of earnings |
| • | local cabotage and local ownership laws and requirements |
| • | nationalization and expropriation |
| • | loss of contract rights |
| • | political instability, war and civil disturbances or other risks that may limit or disrupt markets |
| • | changes in currency exchange rates |
Unstable political, military and economic conditions in foreign countries where a significant proportion of Offshore Marine Services’ operations are conducted could adversely impact the Company’s business. During the year ended December 31, 2009, approximately 63% of Offshore Marine Services’ operating revenues resulted from its foreign operations. These operations are subject to risks, including potential vessel seizure, terrorist attacks, piracy, kidnapping, and nationalization of assets, currency restrictions, import or export quotas and other forms of public and government regulation, all of which are beyond the Company’s control. Economic sanctions or an oil embargo, for example, could have significant impact on activity in the oil and gas industry and, correspondingly, on the Company should Offshore Marine Services operate vessels in a country subject to any sanctions or embargo, or in the surrounding region to the extent any sanctions or embargo disrupt its operations.
Offshore Marine Services, Marine Transportation Services and Aviation Services rely on several customers for a significant share of their revenues, the loss of any of which could adversely affect each of their businesses and operating results. Offshore Marine Services’, Marine Transportation Services’ and Aviation Services’ customers are primarily major oil companies and large independent oil and gas exploration and production companies. The portion of Offshore Marine Services’, Marine Transportation Services’ or Aviation Services’ revenues attributable to any single customer may change over time, depending on the level of relevant activity by any such customer, the segments ability to meet the customer’s needs and other factors, many of which are beyond the Company’s control. The loss of any large customer or several mid-size customers could have a material and adverse effect on such segment’s or the Company’s financial position or its results of operations.
Consolidation of the Company’s customer base could adversely affect demand for its services and reduce its revenues. In recent years, oil and natural gas companies, energy companies and drilling contractors have undergone substantial consolidation and additional consolidation is possible. Consolidation results in fewer companies to charter or contract for the Company’s services. Also, merger activity among both major and independent oil and natural gas companies affects exploration, development and production activity as the consolidated companies integrate operations to increase efficiency and reduce costs. Less promising exploration and development projects of a combined company may be dropped or delayed. Such activity may result in an exploration and development budget for a combined company that is lower than the total budget of both companies before consolidation, which could adversely affect demand for the Company’s Offshore Marine Services’ vessels, Marine Transportation Services’ tankers, Aviation Services’ helicopters and Environmental Services’ products and services, thereby reducing the Company’s revenues.
The Company may be unable to maintain or replace its offshore support vessels as they age. As of December 31, 2009, the average age of the Company’s Offshore Marine Services vessels, excluding its standby safety vessels, was approximately 10.6 years. The Company believes that after an offshore support vessel has been in service for approximately 20 years, the expense (which typically increases with age) necessary to satisfy
28
Table of Contents
required marine certification standards may not be economically justifiable. The Company may be unable to carry out drydockings of its vessels or may be limited by insufficient shipyard capacity, which could adversely affect its ability to maintain its vessels. In addition, market conditions may not justify these expenditures or enable the Company to operate its older vessels profitably during the remainder of their economic lives. There can be no assurance that the Company will be able to maintain its fleet by extending the economic life of existing vessels, or that its financial resources will be sufficient to enable it to make expenditures necessary for these purposes or to acquire or build replacement vessels.
An increase in the supply of offshore support vessels or tankers could have an adverse impact on the charter rates earned by the Company’s offshore support vessels and tankers. Expansion of the supply of the worldwide offshore support vessel fleet would increase competition in the markets which Offshore Marine Services’ operates. The refurbishment of disused or “mothballed” vessels, conversion of vessels from uses other than oil and gas exploration and production support and related activities or construction of new vessels could all add vessel capacity to current worldwide levels. A significant increase in vessel capacity could lower charter rates and result in lower operating revenues. Similarly, should competitors in the domestic petroleum and chemical product tanker industry construct a significant number of new tankers or large capacity integrated or articulated tug and barge units, demand for tanker assets could be adversely affected.
If the Company does not restrict the amount of foreign ownership of its Common Stock, it could be prohibited from operating offshore support vessels, inland river vessels and barges and tankers in parts of the United States and could be prohibited from operating helicopters, which would adversely impact its business and operating results. The Company is subject to the Shipping Acts, which govern, among other things, the ownership and operation of offshore support vessels, tankers and barges used to carry cargo between U.S. ports. The Shipping Acts require that vessels engaged in the “U.S. coastwise trade” be owned by U.S. citizens and built in the United States. The Company is also subject to regulations pursuant to the Federal Aviation Act and other statutes (“Aviation Acts”). Generally, aircraft operating in the United States must be registered in the United States. In order to register such aircraft under the Aviation Acts, the Company must be owned or controlled by U.S. citizens. Although the Company’s Certificate of Incorporation and by-laws contain provisions intended to assure compliance with these provisions of the Shipping Acts and the Aviation Acts, a failure to maintain compliance would adversely affect the Company’s financial position and its results of operations and the Company would be prohibited from operating vessels in the U.S. coastwise trade and helicopters in the United States during any period in which the Company did not comply with these regulations.
Repeal, Amendment, Suspension or Non-Enforcement of the Shipping Acts would result in additional competition for Offshore Marine Services, Marine Transportation Services and Inland River Services. A substantial portion of Offshore Marine Services’, Marine Transportation Services’ and Inland River Services’ operations are conducted in the U.S. coastwise trade. Under certain provisions of the Shipping Acts, this trade is restricted to vessels built in the United States, owned and manned by U.S. citizens and registered under United States law. There have been attempts to repeal or amend such provisions, and such attempts are expected to continue in the future. Repeal of such provisions would result in additional competition from vessels built in lower-cost foreign shipyards, owned and manned by foreign nationals with promotional foreign tax incentives and with lower wages and benefits than U.S. citizens, which could have a material adverse effect on the Company’s business, financial position and its results of operations.
The Outer Continental Shelf Lands Act, as amended, provides the federal government with broad discretion in regulating the leasing of offshore resources for the production of oil and gas. Because Offshore Marine Services’ and Aviation Services’ operations rely on offshore oil and gas exploration and production, the government’s exercise of authority under the provisions of the Outer Continental Shelf Lands Act to restrict the availability of offshore oil and gas leases could have a material adverse effect on the Company’s financial position and its results of operations.
29
Table of Contents
Failure to maintain an acceptable safety record may have an adverse impact on the Company’s ability to retain customers. The Company’s customers consider safety and reliability a primary concern in selecting a service provider. The Company must maintain a record of safety and reliability that is acceptable to its customers. Should this not be achieved, the ability to retain current customers and attract new customers may be adversely affected.
Operational risks could disrupt operations and expose the Company to liability. The operation of offshore support vessels, tankers, inland river towboats, tugs, helicopters, oil spill response vessels and barges is subject to various risks, including catastrophic disaster, adverse weather, mechanical failure and collision. Additional risks relating to the operation of helicopters include harsh weather and marine conditions, mechanical failures, crashes, and collisions, which may result in personal injury, loss of life, damage to property and equipment, and the suspension or reduction of operations. The Company’s aircraft have been involved in accidents in the past, some of which have included loss of life and property damage. The Company may experience similar accidents in the future. Additional risks to vessels include adverse sea conditions, capsizing, grounding, oil and hazardous substance spills and navigation errors. These risks could endanger the safety of the Company’s personnel, equipment, cargo and other property, as well as the environment. If any of these events were to occur, the Company could be held liable for resulting damages, including loss of revenues from or termination of charter contracts, higher insurance rates, and damage to the Company’s reputation and customer relationships. In addition, the affected vessels or helicopters could be removed from service and would then not be available to generate revenues.
Revenues from Aviation Services are dependent on flight hours, which are subject to adverse weather conditions and seasonality. A significant portion of the Company’s revenues from Aviation Services is dependent on actual flight hours. Prolonged periods of adverse weather, storms and the effect of fewer hours of daylight adversely impact Aviation Services. Winter months generally have more days of adverse weather conditions than the other months of the year, with poor visibility, high winds, and heavy precipitation and fewer daylight hours, all of which adversely affect helicopter operations. In addition, June through November is tropical storm season in the U.S. Gulf of Mexico; during tropical storms, helicopters are unable to operate in the area of a storm. In addition, many of Aviation Services’ facilities are located along the U.S. Gulf of Mexico coast, and tropical storms may cause damage to its property.
The helicopter industry is subject to intense competition. The helicopter industry is highly competitive and involves an aggressive bidding process among providers having the necessary equipment, operational experience and resources. The Company must provide safe and efficient service or risk losing customers or the termination of contracts, which could result in lost market share and have a material adverse effect on the Company’s financial position and its results of operations.
Consolidation in the aircraft parts industry could affect the service and operation of Aviation Services’ helicopters. A reduction in the number of approved parts suppliers or a consolidation in the spare parts redistribution market could interrupt or delay the supply of aircraft components, adversely affecting Aviation Services’ ability to meet service commitments to customers and could cause Aviation Services to lose opportunities with existing and future customers. Aviation Services might not be able to qualify or identify alternative suppliers in a timely fashion, or at all. Consolidations involving suppliers could further reduce the number of alternatives for Aviation Services and affect the cost of components. An increase in the cost of components could make Aviation Services less competitive and result in lower margins.
Revenues from Marine Transportation Services could be adversely affected by a decline in demand for domestic refined petroleum products, crude oil or chemical products, or a change in existing methods of delivery. A reduction in domestic consumption of refined petroleum products, crude oil or chemical products, the development of alternative methods of delivery of refined petroleum, crude oil, and a reduction in domestic refining capacity could reduce demand for the Company’s services.
30
Table of Contents
Construction of additional refined petroleum product, natural gas or crude oil pipelines could have a material adverse effect on Marine Transportation Services’ revenues. Long-haul transportation of refined petroleum products, crude oil and natural gas is generally less costly by pipeline than by tanker. Existing pipeline systems are either insufficient to meet demand in, or do not reach all of, the markets served by Marine Transportation Services’ tankers. The construction and operation of new pipeline segments to the Florida market could have a material and adverse effect on Marine Transportation Services’ business.
The Company may have to phase-out its double-bottom tanker from petroleum product transportation service in U.S. waters. The Oil Pollution Act of 1990 establishes a phase-out schedule, depending upon vessel size and age, for non-double-hull vessels carrying crude oil and petroleum products in the U.S. coastwise trade. The phase-out date for the Company’s non-double-hull tanker, the Seabulk America, is 2015 and, unless this vessel is modified with a double-hull, which would require substantial capital expenditure, it will be prohibited from transporting crude oil and petroleum products in the U.S. coastwise trade after this date. It would also be prohibited from transporting petroleum products in most foreign and international markets under a phase-out schedule established by the International Maritime Organization.
The Company may lose eligibility for two tankers retrofitted to a double-hull configuration to engage in U.S. coastwise trade. Two of Marine Transportation Services’ tankers that operate in the U.S. coastwise trade, which is restricted to vessels built or rebuilt in the United States, were retrofitted to a double-hull configuration in a foreign shipyard. The Company is party to litigation regarding the eligibility of such tankers following the retrofit to engage in the U.S. coastwise trade, the loss of which could adversely affect the Company’s financial condition and its results of operations. See Item 3. “Legal Proceedings” for a complete description of this litigation.
The Company is subject to complex laws and regulations, including environmental laws and regulations that can adversely affect the cost, manner or feasibility of doing business. Increasingly stringent federal, state, local and international laws and regulations governing worker safety and health and the manning, construction and operation of vessels significantly affect the Company’s operations. Many aspects of the marine industry are subject to extensive governmental regulation by the U.S. Coast Guard (“USCG”), Occupational Safety and Health Administration (“OSHA”), the National Transportation Safety Board (“NTSB”) and the U.S. Customs Service, and to regulation by port states and class society organizations, such as the American Bureau of Shipping, as well as to international regulations from international treaties, such as the Safety of Life at Sea convention administered by port states and class societies. The USCG, OSHA and NTSB set safety standards and are authorized to investigate vessel accidents and recommend improved safety standards. The U.S. Customs Service and USCG are authorized to inspect vessels at will.
The Company’s business and operations are also subject to federal, state, local and international laws and regulations that control the discharge of oil and hazardous materials into the environment or otherwise relate to environmental protection and occupational safety and health. Compliance with such laws and regulations may require installation of costly equipment or operational changes, and the phase-out of certain product tankers. Failure to comply with applicable laws and regulations may result in administrative and civil penalties, criminal sanctions or the suspension or termination of the Company’s operations. Some environmental laws impose strict and, under certain circumstances, joint and several liability for remediation of spills and releases of oil and hazardous materials and damage to natural resources, which could subject the Company to liability without regard to whether it was negligent or at fault. These laws and regulations may expose the Company to liability for the conduct of or conditions caused by others, including charterers. Moreover, these laws and regulations could change in ways that substantially increase the Company’s costs. The Company cannot be certain that existing laws, regulations or standards, as currently interpreted or reinterpreted in the future, or future laws and regulations will not have a material adverse effect on its business, results of operations and financial condition. For more information, see Item 1. “Government Regulation—Environmental Compliance.”
31
Table of Contents
Emergency response revenues are subject to significant volatility. Environmental Services’ response revenues and profitability are event driven and can vary greatly from quarter-to-quarter and year-to-year based on the number and magnitude of responses.
A relaxation of oil spill regulation or enforcement could reduce demand for Environmental Services’ emergency response services. Environmental Services is dependent upon the enforcement of regulations promulgated under OPA 90, international conventions and, to a lesser extent, local regulations. Less stringent emergency regulations or less aggressive enforcement of these regulations could decrease demand for Environmental Services’ emergency response services. There can be no assurance that oil spill regulation will not be relaxed or enforcement of existing or future regulation will not become less stringent. If this happens, the demand for Environmental Services’ emergency response services could be adversely impacted.
A change in, or revocation of, National Response Corporation’s classification as an Oil Spill Removal Organization could result in a loss of business. The National Response Corporation (“NRC”) is classified by the USCG as an Oil Spill Removal Organization (“OSRO”). The USCG classifies OSROs based on their overall ability to respond to various types and sizes of oil spills. USCG-classified OSROs have a competitive advantage over non-classified service providers because customers of a classified OSRO are exempt from regulations that would otherwise require them to list their oil spill response resources in filings with the USCG. A loss of NRC’s classification or changes in the requirements for classification could eliminate or diminish NRC’s ability to provide customers with this exemption. If this happens, Environmental Services could lose customers.
Environmental Services could incur liability in connection with providing spill response services. Although Environmental Services is generally exempt in the United States from liability under the Clean Water Act (“CWA”) for its own actions and omissions in providing spill response services, this exemption might not apply if it were found to have been grossly negligent or to have engaged in willful misconduct, or if it were to have failed to provide these services consistent with applicable regulations and directives under the CWA. In addition, the exemption under the federal CWA would not protect Environmental Services against liability for personal injury or wrongful death, or against prosecution under other federal or state laws. Although most of the states within the United States in which Environmental Services provides services have adopted similar exemptions, several states have not. If a court or other applicable authority were to determine that Environmental Services does not benefit from federal or state exemptions from liability in providing emergency response services, Environmental Services could be liable together with the local contractor and the responsible party for any resulting damages, including damages caused by others. In the international market, Environmental Services does not benefit from the spill response liability protection provided by the CWA and therefore is subject to the liability terms and conditions negotiated with its international clients.
Inland River Services could experience variation in freight rates. Freight transportation rates may fluctuate as the volume of cargo and availability of barges changes. The volume of freight transported on the Inland River Waterways may vary as a result of various factors, such as global economic conditions and business cycles, domestic and international agricultural production and demand, and foreign currency exchange rates. Barge participation in the industry can also vary year-to-year and is dependent on the number of barges built and retired from service. Extended periods of high barge availability and low cargo demand could adversely impact Inland River Services.
Inland River Services’ results of operations could be adversely affected by the decline in U.S. grain exports. Inland River Services’ business is significantly affected by the volume of grain exports handled through ports in the U.S. Gulf of Mexico. Grain exports can vary due to a number of factors including crop harvest yield levels in the United States and abroad, and the demand for grain in the United States. A shortage of available grain overseas can increase demand for U.S. grain. Conversely, an abundance of grain overseas can decrease demand for U.S. grain. A decline in exports could result in excess barge capacity, which would likely lower freight rates earned by Inland River Services.
32
Table of Contents
Inland River Services’ results of operations could be adversely affected by international economic and political factors. The actions of foreign governments could affect the import and export of the dry-bulk commodities typically transported by Inland River Services. Foreign trade agreements and each country’s adherence to the terms of such agreements can raise or lower demand for U.S. imports and exports of the dry-bulk commodities that Inland River Services transports. National and international boycotts and embargoes of other countries’ or U.S. imports or exports together with the raising or lowering of tariff rates could affect the demand for the transportation of cargos handled by Inland River Services. These actions or developments could have an adverse impact on Inland River Services.
Inland River Services’ results of operations are affected by seasonal activity. Inland River Services’ business is seasonal, and its quarterly revenues and profits have historically been lower in the first and second quarters of the year and higher in the third and fourth quarters, during the grain harvest.
Inland River Services’ results of operations are affected by adverse weather and river conditions. Weather patterns can affect river levels and cause ice conditions during winter months, which can hamper barge navigation. Locks and dams on river systems may be closed for maintenance or other causes, which may delay barge movements. These conditions could adversely impact Inland River Services.
The aging infrastructure on the U.S. Inland River Waterways may lead to increased costs and disruptions in Inland River Services’ operations. Many of the locks and dams on the U.S. Inland River Waterways were built early in the last century, and their age makes them costly to maintain and susceptible to unscheduled maintenance outages. Delays caused by malfunctioning locks and dams could increase Inland River Services’ operating costs and delay the delivery of cargos. Moreover, in the future, increased diesel fuel user taxes could be imposed to fund necessary infrastructure improvements, and such increases may not be recoverable by Inland River Services through pricing increases.
Inland River Services’ results of operations could be materially and adversely affected by fuel price fluctuations. For the most part, Inland River Services purchases towboat and fleeting services from third party vendors. The price of these services can rise when fuel prices escalate and could adversely impact Inland River Services’ results of operation.
The Company’s insurance coverage may be inadequate to protect it from the liabilities that could arise in its businesses. Although the Company maintains insurance coverage against the risks related to its businesses, risks may arise for which the Company may not be insured. Claims covered by insurance are subject to deductibles, the aggregate amount of which could be material. Insurance policies are also subject to compliance with certain conditions, the failure of which could lead to a denial of coverage as to a particular claim or the voiding of a particular insurance policy. There also can be no assurance that existing insurance coverage can be renewed at commercially reasonable rates or that available coverage will be adequate to cover future claims. If a loss occurs that is partially or completely uninsured, the Company could be exposed to substantial liability.
The Company’s global operations are subject to certain foreign currency, interest rate, fixed-income, equity and commodity price risks. The Company is exposed to certain foreign currency, interest rate, fixed-income, equity and commodity price risks. Some of these risks may be hedged, but fluctuations could impact the Company’s financial position and its results of operations. The Company has, and anticipates that it will continue to have, contracts denominated in foreign currencies. It is often not practicable for the Company to effectively hedge the entire risk of significant changes in currency rates during a contract period. The Company’s financial position and its results of operations have been negatively impacted for certain periods and positively impacted for other periods, and may continue to be affected to a material extent by the impact of foreign currency exchange rate fluctuations. The Company’s financial position and its results of operations may also be affected by the cost of hedging activities that the Company undertakes. The Company holds a large proportion of its net assets in cash equivalents and short-term investments, including a variety of public and private debt and equity instruments. Such investments subject the Company to risks generally inherent in the capital markets. Given the
33
Table of Contents
relatively high proportion of the Company’s liquid assets relative to its overall size, its financial position and its results of operations may be materially affected by the results of the Company’s capital management and investment activities and the risks associated with those activities. Volatility in the financial markets and overall economic uncertainty also increases the risk that the actual amounts realized in the future on the Company’s debt and equity instruments could differ significantly from the fair values currently assigned to them. In addition, changes in interest rates may have an adverse impact on the Company’s financial position and its results of operations.
Investment in new business strategies and initiatives present risks not originally contemplated. The Company has invested, and in the future may again invest, in new business plans or acquisitions. These activities may involve significant risks and uncertainties, including distraction of management from current operations, insufficient revenue to offset liabilities assumed and expenses associated with the plans or acquisitions, inadequate return of capital, and unidentified issues not discovered in due diligence. As a result of the risks inherent in new ventures, there can be no assurance that any such venture will be successful, or that new ventures will not have a material adverse impact on the Company’s financial position and its results of operations.
Commodity Trading and Logistics’ results of operations may be materially adversely affected by the availability, demand and price of agricultural commodities, weather, disease, government programs, and competition. The availability and price of agricultural commodities may fluctuate widely due to unpredictable factors such as weather, plantings, government programs and policies, changes in global demand resulting from population growth and changes in standards of living, and global production of similar and competitive crops. Reduced supply of agricultural commodities due to weather-related factors or other reasons could adversely affect Commodity Trading and Logistics’ profitability. Reduced supplies of agricultural commodities could limit Commodity Trading and Logistics’ ability to procure, transport, store, process, and merchandise agricultural commodities in an efficient manner. In addition, the availability and price of agricultural commodities can be affected by other factors, such as plant disease, which can result in crop failures and reduced harvests.
Commodity Trading and Logistics’ is subject to economic downturns, political instability and other risks of doing business globally, which could adversely affect operating results. Commodity Trading and Logistics conducts its business in many countries and geographic areas, and plans to expand its business in emerging market areas such as Asia, Africa and parts of the Caribbean. Both developed and emerging market areas are subject to economic downturns and emerging market areas could be subject to more volatile economic, political and market conditions. Such economic downturns and volatile conditions may have a negative impact on Commodity Trading and Logistics’ ability to execute its business strategies and on its financial position and its results of operations. Commodity Trading and Logistics’ results of operations could be affected by changes in trade, monetary and fiscal policies, laws and regulations, and other activities of governments, agencies, and similar organizations, including political conditions, trade regulations affecting production, pricing and marketing of products, local labor conditions and regulations, burdensome taxes and tariffs, enforceability of legal agreements and judgments, and other trade barriers.
Commodity Trading and Logistics is subject to government policies and regulations, in general, and specifically those affecting the agricultural sector and related industries, which could adversely affect its operating results. Agricultural production and trade flows are subject to government policies and regulations. Governmental policies affecting the agricultural industry, such as taxes, tariffs, duties, subsidies, incentives and import and export restrictions on agricultural commodities and commodity products, can influence the planting of certain crops, the location and size of crop production, whether unprocessed or processed commodity products are traded, the volume and types of imports and exports, the availability and competitiveness of feedstocks as raw materials, and industry profitability. In addition, international trade disputes can adversely affect agricultural commodity trade flows by limiting or disrupting trade between countries or regions. Future government policies may adversely affect the supply of, demand for, and prices of Commodity Trading and Logistics’ products, restrict its ability to do business in its existing and target markets, and negatively impact revenues and operating results.
34
Table of Contents
Commodity Trading and Logistics is subject to numerous laws and regulations globally that could adversely affect operating results. Commodity Trading and Logistics is required to comply with the numerous and broad reaching laws and regulations administered by United States federal, state, local, and foreign governmental agencies relating to, but not limited to, the sourcing, transporting, storing and merchandising of agricultural commodities and products. Any failure to comply with applicable laws and regulations could subject Commodity Trading and Logistics to administrative penalties and injunctive relief, civil remedies, including fines, injunctions, and recalls of its products.
Commodity Trading and Logistics’ risk management strategies may not be effective. Commodity Trading and Logistics business’ is affected by fluctuations in agricultural commodity prices, transportation costs, energy prices, interest rates, and foreign currency exchange rates. Although Commodity Trading and Logistics may engage in hedging transactions to manage these risks, such transactions may not be successful in mitigating its exposure to these fluctuations and may adversely affect operating results.
The Company’s inability to attract and retain qualified personnel could have an adverse effect on its business. Attracting and retaining skilled personnel across all of the Company’s business segments is an important factor in its future success. The market for the personnel employed is highly competitive and the Company cannot be certain that it will be successful in attracting and retaining qualified personnel in the future.
The failure to successfully complete construction or conversion of the Company’s vessels, repairs, maintenance or routine drydockings on schedule and on budget could adversely affect the Company’s financial position and its results of operations. From time to time, the Company may have a number of vessels under conversion and may plan to construct or convert other vessels in response to current and future market conditions. The Company also routinely engages shipyards to drydock vessels for regulatory compliance and to provide repair and maintenance. Construction and conversion projects and drydockings are subject to risks of delay and cost overruns, resulting from shortages of equipment, lack of shipyard availability, unforeseen engineering problems, work stoppages, weather interference, unanticipated cost increases, inability to obtain necessary certifications and approvals and shortages of materials or skilled labor. A significant delay in either construction or drydockings could have a material adverse effect on contract commitments and revenues with respect to vessels under construction, conversion or undergoing drydockings. Significant cost overruns or delays for vessels under construction, conversion or retrofit could also adversely affect the Company’s financial position and its results of operations.
A Violation of the Foreign Corrupt Practices Act may adversely affect the Company’s business and operations. In order to effectively compete in certain foreign jurisdictions, the Company seeks to establish joint ventures with local operators or strategic partners. As a U.S. corporation, the Company is subject to the regulations imposed by the Foreign Corrupt Practices Act (“FCPA”), which generally prohibits U.S. companies and their intermediaries from making improper payments to foreign officials for the purpose of obtaining or maintaining business. The Company has adopted stringent procedures to enforce compliance with the FCPA, but it may be held liable for actions taken by its strategic or local partners even though these partners may not be subject to the FCPA. Any determination that the Company has violated the FCPA could have a material adverse effect on its business and results of operations.
An outbreak of any contagious disease, such as H1N1 Flu, may adversely affect the Company’s business and operations. The outbreak of diseases, such as H1N1 Flu, commonly referred to as Swine Flu, has curtailed and may curtail travel to and from certain countries, or geographic regions. Restrictions on travel to and from these countries or other regions due to additional incidences for diseases, such as Swine Flu, could have a material adverse effect on the Company’s business, financial position or its results of operations.
There are risks associated with climate change and environmental regulations. Governments around the world have, in recent years, placed increasing attention on matters affecting the environment and this could lead to new laws or regulations pertaining to climate change, carbon emissions or energy use that in turn could result
35
Table of Contents
in a reduction in demand for hydrocarbon-based fuel. Governments could also pass laws or regulations encouraging or mandating the use of alternative energy sources such as wind power and solar energy, which may reduce demand for oil and natural gas and therefore the services provided by the Company. Such initiatives could have a material adverse effect on the Company’s financial position and its results of operations.
| ITEM 1B. | UNRESOLVED STAFF COMMENTS |
None.
| ITEM 2. | PROPERTIES |
Offshore support vessels, tankers, inland river towboats and barges, and helicopters are the principal physical properties owned by the Company and are more fully described in “Offshore Marine Services,” “Marine Transportation Services,” “Inland River Services” and “Aviation Services” in “Item 1. Business.”
| ITEM 3. | LEGAL PROCEEDINGS |
Under United States law, “United States persons” are prohibited from business activities and contracts in certain countries, including Sudan and Iran. Relating to these prohibitions, Seabulk International, Inc., (“Seabulk”) a subsidiary of SEACOR acquired in July 2005, filed three reports with and submitted documents to the Office of Foreign Asset Control (“OFAC”) of the U.S. Department of Treasury in December 1999 and January and May 2002. One of the reports was also filed with the Bureau of Export Administration of the U.S. Department of Commerce. The reports and documents related to certain limited charters with third parties involving three Seabulk vessels that called in Sudan for several months in 1999 and January 2000 and charters with third parties involving several of Seabulk’s vessels that called in Iran in 1998. In March 2003, Seabulk received notification from OFAC that the case has been referred to its Civil Penalties Division. Should OFAC determine that these activities constituted violations of the laws or regulations, civil penalties, including fines, could be assessed against Seabulk or certain individuals who knowingly participated in such activity. The Company cannot predict the extent of such penalties; however, management does not believe the outcome of these matters will have a material impact on its consolidated financial position or its results of operations.
During 2006 and 2007, Marine Transportation Services (“MTS”) had two of its tankers retrofitted to a double-hull configuration in a foreign shipyard to enable each of them to continue to transport crude oil and petroleum products beyond their OPA 90 mandated retirement dates in 2011. Both vessels operate in the U.S. coastwise trade that, under the Shipping Acts, is restricted to vessels built or rebuilt in the United States. In May 2005, MTS received a determination from the U.S. Coast Guard (“USCG”), which administers the United States build requirements of the Shipping Acts, concluding the retrofit work would not constitute a foreign rebuilding and therefore would not jeopardize the tankers’ eligibility to operate in the U.S. coastwise trade. MTS completed the retrofit work in the foreign shipyard in reliance upon the USCG’s determination, which MTS believes was correct and in accord with the USCG’s long-standing regulations and interpretations. On July 9, 2007, a U.S. shipbuilders trade association and two operators of tankers in the U.S. coastwise trade (“Shipbuilders”) commenced a civil action in the U.S. District Court for the Eastern District of Virginia, Shipbuilders Council of America, Inc., et al. v. U.S. Department of Homeland Security, et al. , No. 1:07cv665 (E.D. Va.) (the “SB Trader Litigation”), in which they sought to have the court set aside the USCG’s determination and direct the USCG to revoke the coastwise license of one of the two retrofitted tankers, the Seabulk Trader. MTS intervened in the action to assist the USCG in defending its determination. On April 24, 2008, the Court issued a Memorandum Opinion granting a motion for summary judgment by Shipbuilders setting aside the USCG’s determination and remanding the matter to the USCG for further proceedings with instructions to revoke the coastwise endorsement of the Seabulk Trader. On April 30, 2008, MTS appealed the decision to the U.S. Court of Appeals for the Fourth Circuit (the “Court of Appeals”), and the lower court’s decision was stayed pending appeal, subject to certain terms (which MTS has also separately appealed). Those terms require that MTS pay to the plaintiffs 12.5% of the revenue generated by the Seabulk Trader from November 7, 2008 in the event that the Court of Appeals affirms
36
Table of Contents
the lower court’s decision to revoke its coastwise endorsement (the “Undertaking”). On July 2, 2008, Shipbuilders commenced a second civil action in the U.S. District Court for the Eastern District of Virginia, entitled Shipbuilders Council of America, Inc., et al. v. U.S. Department of Homeland Security, et al., No. 1:08cv680 (E.D. Va.) (the “SB Challenge Litigation”), alleging essentially identical claims as those asserted in the SB Trader Litigation against MTS’s second retrofitted tanker, the Seabulk Challenge. MTS has intervened in the SB Challenge Litigation that was stayed pending the decision of the Court of Appeals in the SB Trader Litigation. In September 2009, the Court of Appeals reversed the District Court, holding that the USCG’s interpretation was correct and that the District Court erred in requiring MTS to provide the Undertaking. On January 19, 2010, the District Court: (i) vacated its April 24, 2008 Order to the extent it directed the USCG to revoke the coastwise endorsement for the Seabulk Trader; (ii) vacated its November 14, 2008 Order providing for the Undertaking; and (iii) remanded the matter to the USCG for further proceedings to reconsider the decision to grant a coastwise endorsement of the Seabulk Trader consistent with the opinion of the Court of Appeals. The loss of coastwise eligibility for its two retrofitted tankers could adversely affect the Company’s financial condition and its results of operations. The aggregate carrying value of the Company’s two retrofitted tankers was $53.1 million as of December 31, 2009 and such tankers contributed operating revenues of $20.2 million during the year ended December 31, 2009.
Certain subsidiaries of the Company are participating employers in an industry-wide, multi-employer, defined benefit pension fund, the United Kingdom Merchant Navy Officers Pension Fund (“MNOPF”). Under the direction of a court order, any deficit of the MNOPF is to be remedied through funding contributions from all participating employers. The Company’s participation relates to officers employed between 1978 and 2002 by SEACOR’s Stirling group of companies (which had been acquired by SEACOR in 2001) and its predecessors. Based on an actuarial valuation of the MNOPF in 2003, the Company was invoiced and expensed $4.4 million in 2005, representing the Company’s allocated share of a total funding deficit of $412.0 million. Subsequent to this invoice, the pension fund trustees determined that $49.0 million of the $412.0 million deficit was deemed uncollectible due to the non-existence or liquidation of certain participating employers and the Company was invoiced and expensed $0.6 million in March 2007 for its allocated share of the uncollectible deficit. Based on an actuarial valuation of the MNOPF in 2006, the Company was invoiced and expensed $3.9 million in September 2007, representing the Company’s allocated share of an additional funding deficit of $332.6 million. The preliminary results of the most recent actuarial valuation of the MNOPF in 2009 indicated that an additional net funding deficit of $720.0 million (£450.0 million) had developed since the previous actuarial valuation in 2006 and the Company estimates its allocated share of the deficit at $8.64 million (£5.4 million). When the Company is invoiced for its share, it will recognize payroll related operating expenses in the periods invoices are received. Depending on the results of the most recent and future actuarial valuations, it is possible that the MNOPF will experience further funding deficits, requiring the Company to recognize payroll related operating expenses in the periods invoices are received.
A subsidiary of the Company is a participating employer in an industry-wide, multi-employer, defined benefit pension fund, the United Kingdom Merchant Navy Ratings Pension Fund (“MNRPF”). The Company’s participation relates to ratings employed between 1978 and 2001 by SEACOR’s Stirling group of companies (which had been acquired by SEACOR in 2001) and its predecessors. Based on an actuarial valuation in March 2008, the MNRPF has an accumulated funding deficit of $284.2 million. No decision has yet been reached as to how the deficit will be recovered, but the Company expects it is likely that participating employers will be invoiced for their allocated share, at which time the Company would recognize payroll related operating expenses. The Company estimates its allocated share of the uninvoiced deficit to be approximately $1.0 million. Depending on the results of the most recent and future actuarial valuations, it is possible that the MNRPF will experience further funding deficits, requiring the Company to recognize payroll related operating expenses in the periods invoices are received.
On June 12, 2009, a purported civil class action was filed against SEACOR, Era Group Inc., Era Aviation, Inc., Era Helicopters LLC and two other defendants (collectively the “Defendants”) in the U.S. District Court for the District of Delaware, Superior Offshore International, Inc. v. Bristow Group Inc., et al., No. 09-CV-438 (D.Del.). SEACOR acquired Era Group Inc., Era Aviation, Inc., and Era Helicopters LLC in December 2004.
37
Table of Contents
The complaint alleges that the Defendants violated federal antitrust laws by conspiring with each other to raise, fix, maintain or stabilize prices for offshore helicopter services in the U.S. Gulf of Mexico during the period January 2001 to December 2005. The purported class of plaintiffs includes all direct purchasers of such services and the relief sought includes compensatory damages and treble damages. The Company is unable to estimate the potential exposure, if any, resulting from these claims but believes they are without merit and intends to vigorously defend the action. On September 4, 2009, the Defendants filed a motion to dismiss the complaint. The District Court has yet to rule on that motion.
SEACOR Marine, LLC, a subsidiary of the Company, has two pending actions against it for alleged breaches of the California Wage Act. Bailey v. SEACOR Marine, LLC, is a class action filed on behalf of the crew members (current and terminated) who worked on the Company’s vessels while they were based in California. Schoenfeld v. SEACOR Marine, LLC, is an individual claim filed by Mr. Schoenfeld, even though he himself is a member of the class described in the Bailey case. At this early stage, no definitive estimate can be made as to the probability or magnitude of exposure in the cases. Outside legal counsel’s initial investigation suggests that there is a substantial legal question as to whether federal maritime law preempts the application of state law to the SEACOR vessels in question. If the court decides California wage laws do apply, and a class is certified, there may be financial exposure. Mediation is scheduled for the end of February 2010, and the Company intends to vigorously defend against these claims.
In the normal course of its business, the Company becomes involved in various other litigation matters including, among other things, claims by third parties for alleged property damages and personal injuries. Management has used estimates in determining the Company’s potential exposure to these matters and has recorded reserves in its financial statements related thereto where appropriate. It is possible that a change in the Company’s estimates of that exposure could occur, but the Company does not expect such changes in estimated costs would have a material effect on the Company’s consolidated financial position or its results of operations.
| ITEM 4. | SUBMISSION OF MATTERS TO A VOTE OF SECURITY HOLDERS |
No matters were submitted to a vote of security holders during the fourth quarter of 2009.
38
Table of Contents
EXECUTIVE OFFICERS OF THE REGISTRANT
Officers of SEACOR serve at the pleasure of the Board of Directors. The name, age and offices held by each of the executive officers of SEACOR as of December 31, 2009 were as follows:
| Name |
Age |
Position | ||
| Charles Fabrikant |
65 | Chairman of the Board, President and Chief Executive Officer, and has been a director of SEACOR and several of its subsidiaries since 1989. Mr. Fabrikant is also a Director of Diamond Offshore Drilling, Inc., a contract oil and gas driller and MC Shipping Inc., a company engaged in transporting liquified petroleum gas. In addition, he is President of Fabrikant International Corporation, a privately owned corporation engaged in marine investments. Fabrikant International Corporation may be deemed an affiliate of SEACOR. | ||
| Randall Blank |
59 | Senior Vice President of SEACOR since September 2005 and Chairman, President and Chief Executive Officer of Environmental Services since October 1997. From December 1989 to September 2005, Mr. Blank was Executive Vice President and Chief Financial Officer of SEACOR and, from October 1992 to September 2005, he was Secretary of SEACOR. In addition, Mr. Blank has been an officer and director of certain SEACOR subsidiaries since 1989. | ||
| Dick Fagerstal |
49 | Senior Vice President, Corporate Development and Finance of SEACOR since February 2003. Mr. Fagerstal served as Treasurer from May 2000 to November 2008. From August 1997 to February 2003, he served as Vice President of Finance. Mr. Fagerstal has also served as a director of certain SEACOR subsidiaries since August 1997. | ||
| John Gellert |
39 | Senior Vice President since May 2004. Mr. Gellert’s primary responsibility since 2002 has been the operation of Offshore Marine Services. Mr. Gellert has been an employee of SEACOR since 1992. In addition, Mr. Gellert is an officer and director of certain SEACOR subsidiaries. | ||
| Alice Gran |
60 | Senior Vice President, Legal Affairs and Risk Management of SEACOR since November 2007. Ms. Gran was General Counsel from July 1998 to November 2007, Corporate Secretary from September 2005 to November 2007 and Senior Vice President since May 2004. Ms. Gran joined SEACOR in July 1998. Ms. Gran is a licensed attorney admitted to practice law in the District of Columbia. In addition, Ms. Gran is an officer and director of certain SEACOR subsidiaries. | ||
| Paul Robinson |
42 | Senior Vice President, General Counsel and Corporate Secretary of SEACOR since November 2007. From 1999 through June 2007, Mr. Robinson held various positions at Comverse Technology, Inc., including Chief Operating Officer, Executive Vice President, General Counsel and Corporate Secretary. | ||
| Richard Ryan |
55 | Senior Vice President of SEACOR since November 2005 and, from September 2005 to November 2005, was Vice President. Mr. Ryan has been Chief Financial Officer since September 2005. From December 1996, when he joined SEACOR, until June 2002, Mr. Ryan was International Controller and, from July 2002 until becoming Chief Financial Officer, served as Managing Director of SEACOR Marine (International) Ltd. In addition, Mr. Ryan is an officer and director of certain SEACOR subsidiaries. | ||
| Matthew Cenac |
44 | Vice President and Chief Accounting Officer of SEACOR since September 2005. From June 2003 to August 2005, Mr. Cenac was Corporate Controller of SEACOR. In addition, Mr. Cenac is an officer and director of certain SEACOR subsidiaries. |
39
Table of Contents
| ITEM 5. | MARKET FOR REGISTRANT’S COMMON EQUITY, RELATED STOCKHOLDER MATTERS AND ISSUER PURCHASES OF EQUITY SECURITIES |
Market for the Company’s Common Stock
SEACOR’s Common Stock trades on the New York Stock Exchange (“NYSE”) under the trading symbol “CKH.” Set forth in the table below for the periods presented are the high and low sale prices for SEACOR’s Common Stock.
| HIGH | LOW | |||||
| Fiscal Year Ending December 31, 2010: |
||||||
| First Quarter (through February 19, 2010) |
$ | 78.53 | $ | 69.88 | ||
| Fiscal Year Ending December 31, 2009: |
||||||
| First Quarter |
$ | 71.58 | $ | 52.95 | ||
| Second Quarter |
$ | 80.06 | $ | 57.60 | ||
| Third Quarter |
$ | 83.31 | $ | 72.21 | ||
| Fourth Quarter |
$ | 91.93 | $ | 73.50 | ||
| Fiscal Year Ending December 31, 2008: |
||||||
| First Quarter |
$ | 97.80 | $ | 81.95 | ||
| Second Quarter |
$ | 92.75 | $ | 82.82 | ||
| Third Quarter |
$ | 89.74 | $ | 75.51 | ||
| Fourth Quarter |
$ | 79.18 | $ | 51.60 | ||
As of February 19, 2010, there were 847 holders of record of Common Stock.
SEACOR has not paid any cash dividends in respect of its Common Stock since its inception in December 1989 and has no intention to pay any dividends in the foreseeable future. Any payment of future dividends will be at the discretion of SEACOR’s Board of Directors and will depend upon, among other factors, the Company’s earnings, financial condition, current and anticipated capital requirements, plans for expansion, level of indebtedness and contractual restrictions, including the provisions of the Company’s revolving credit facility or other then-existing indebtedness. The payment of future cash dividends, if any, would be made only from assets legally available.
40
Table of Contents
Set forth in the graph below is a comparison of the cumulative total return that a hypothetical investor would have earned assuming the investment of $100 over the five-year period commencing on December 31, 2004 in (i) the Common Stock of the Company, (ii) the Standard & Poor’s 500 Stock Index (“S&P 500”) and (iii) the Simmons Offshore Transportation Index, an index of oil service companies published by Simmons and Company, Inc. (the “Simmons Peer Index”).
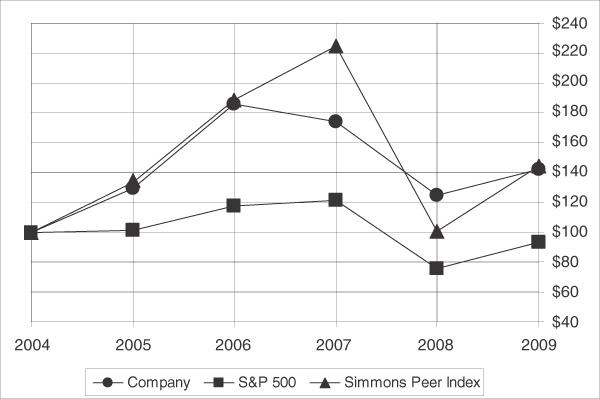
| December 31, | ||||||||||||
| 2004 | 2005 | 2006 | 2007 | 2008 | 2009 | |||||||
| Company |
100 | 128 | 186 | 174 | 125 | 143 | ||||||
| S&P 500 |
100 | 103 | 117 | 121 | 75 | 93 | ||||||
| Simmons Peer Index(1) |
100 | 133 | 187 | 225 | 99 | 144 | ||||||
| (1) | Simmons Peer Index includes the following companies: Bristow Group Inc., PHI, Inc., Tidewater Inc., GulfMark Offshore, Inc., Kirby Corporation, Hornbeck Offshore Services, Inc., Trico Marine Services, Inc., Solstad Offshore ASA, Farstad Shipping ASA, District Offshore, ASA |
41
Table of Contents
Issuer Repurchases of Equity Securities and Debt
From time to time, SEACOR’s Board of Directors grants authorization to repurchase shares of Common Stock and, up until their redemption in December 2009, its 2.875% Convertible Debentures. In 2009, 2008 and 2007, the Company acquired 606,576, 2,824,717 and 2,366,880 shares, respectively, of Common Stock for treasury for an aggregate purchase price of $45.9 million, $240.1 million and $213.3 million, respectively. In 2009, the Company repurchased $3.8 million, principal amount, of its 2.875% Convertible Debentures for an aggregate purchase price of $3.7 million. As of December 31, 2009, $102.2 million of the repurchase authority granted by SEACOR’s Board of Directors remained available and, on February 18, 2010, SEACOR’s Board of Directors increased the repurchase authority for a total expenditure of up to $250.0 million.
| Period |
Total Number Of Shares Purchased(1) |
Average Price Paid Per Share(2) |
Total Number of Shares Purchased as Part of Publicly Announced Plans or Programs |
Maximum Value of Shares that may Yet be Purchased under the Plans or Programs(3) | ||||||
| 10/01/09 – 10/31/09 |
— | $ | — | — | $ | 145,492,189 | ||||
| 11/01/09 – 11/30/09 |
— | $ | — | — | $ | 145,492,189 | ||||
| 12/01/09 – 12/31/09 |
572,700 | $ | 75.54 | — | $ | 102,232,558 | ||||
| (1) | The Company acquired 33,876 shares of Common Stock for $75.74 per share from Mr. Fabrikant as payment for payroll related tax obligations arising from his December 2009 exercise of 52,500 stock options that were due to expire in February 2010. These shares were purchased in accordance with the terms of the Company’s Share Incentive Plans and not pursuant to the repurchase authorizations granted by SEACOR’s Board of Directors. |
| (2) | Excludes commissions of $28,755 or $0.05 per share. |
| (3) | Since February 1997, SEACOR’s Board of Directors has authorized the repurchase of Common Stock, certain debt or a combination thereof. From time to time thereafter, and most recently on February 18, 2010, SEACOR’s Board of Directors increased the authority to repurchase Common Stock. |
Additionally, the Company may purchase, separate from such authorization noted above, any or all of its 5.875% Senior Notes and its 7.375% Senior Notes. Securities may be acquired through open market purchases, privately negotiated transactions or otherwise, depending on market conditions.
42
Table of Contents
| ITEM 6. | SELECTED FINANCIAL DATA |
SELECTED HISTORICAL FINANCIAL INFORMATION
The following table sets forth, for the periods indicated, selected historical consolidated financial data for the Company (in thousands, except per share data). Such financial data should be read in conjunction with “Item 7. Management’s Discussion and Analysis of Financial Condition and Results of Operations” and “Item 8. Financial Statements and Supplementary Data” included in Parts II and IV, respectively, of this Annual Report on Form 10-K. Certain prior period information has been retrospectively adjusted to reflect the adoption of new accounting rules established by the Financial Accounting Standards Board related to the Company’s convertible debt (see Part IV “Note 8. Long-Term Debt” of this Annual Report on Form 10-K).
| Years Ended December 31, | ||||||||||||||||||||
| 2009 | 2008 | 2007 | 2006 | 2005 | ||||||||||||||||
| Operating Revenues: |
||||||||||||||||||||
| Offshore Marine Services |
$ | 562,291 | $ | 708,728 | $ | 692,418 | $ | 682,577 | $ | 480,058 | ||||||||||
| Marine Transportation Services(1) |
92,866 | 114,028 | 116,037 | 145,195 | 72,348 | |||||||||||||||
| Inland River Services |
155,098 | 144,022 | 121,248 | 147,466 | 123,231 | |||||||||||||||
| Aviation Services |
235,667 | 248,627 | 215,039 | 156,014 | 137,555 | |||||||||||||||
| Environmental Services |
145,767 | 168,030 | 156,826 | 144,516 | 136,577 | |||||||||||||||
| Commodity Trading and Logistics(2) |
472,575 | 208,264 | 9,600 | — | — | |||||||||||||||
| Other(3) |
64,354 | 72,881 | 50,032 | 49,224 | 23,292 | |||||||||||||||
| Eliminations and Corporate |
(17,280 | ) | (8,624 | ) | (1,970 | ) | (1,547 | ) | (1,057 | ) | ||||||||||
| $ | 1,711,338 | $ | 1,655,956 | $ | 1,359,230 | $ | 1,323,445 | $ | 972,004 | |||||||||||
| Operating Income |
$ | 231,827 | $ | 342,689 | $ | 347,775 | $ | 360,748 | $ | 177,452 | ||||||||||
| Other Income (Expenses): |
||||||||||||||||||||
| Net interest expense |
$ | (54,577 | ) | $ | (40,028 | ) | $ | (11,813 | ) | $ | (22,895 | ) | $ | (35,506 | ) | |||||
| Other income(4) |
37,764 | 15,265 | 7,860 | 881 | 45,897 | |||||||||||||||
| $ | (16,813 | ) | $ | (24,763 | ) | $ | (3,953 | ) | $ | (22,014 | ) | $ | 10,391 | |||||||
| Income from Continuing Operations attributable to SEACOR Holdings Inc. |
$ | 143,810 | $ | 218,543 | $ | 236,819 | $ | 229,862 | $ | 166,084 | ||||||||||
| Earnings from Continuing Operations Per Share attributable to SEACOR Holdings Inc.: |
||||||||||||||||||||
| Basic |
$ | 7.21 | $ | 10.46 | $ | 10.06 | $ | 9.33 | $ | 7.69 | ||||||||||
| Diluted |
6.57 | 9.25 | 9.04 | 8.44 | 6.93 | |||||||||||||||
| Statement of Cash Flows Data: |
||||||||||||||||||||
| Cash provided by operating activities |
$ | 297,618 | $ | 291,624 | $ | 385,901 | $ | 366,107 | $ | 237,645 | ||||||||||
| Cash provided by (used in) investing activities |
(101,700 | ) | (246,424 | ) | (109,019 | ) | (281,495 | ) | 167,243 | |||||||||||
| Cash provided by (used in) financing activities |
(6,327 | ) | (298,460 | ) | (247,240 | ) | (64,230 | ) | (131,936 | ) | ||||||||||
| Effects of exchange rate changes on cash and cash equivalents |
871 | (8,603 | ) | 697 | 2,162 | (2,919 | ) | |||||||||||||
| Capital Expenditures |
180,024 | 428,478 | 537,608 | 381,710 | 250,459 | |||||||||||||||
| Balance Sheet Data (at period end): |
||||||||||||||||||||
| Cash and cash equivalents, restricted cash, marketable securities and Title XI and construction reserve funds |
$ | 857,807 | $ | 655,803 | $ | 1,001,721 | $ | 925,725 | $ | 674,409 | ||||||||||
| Total assets |
3,723,619 | 3,459,654 | 3,566,445 | 3,251,117 | 2,883,616 | |||||||||||||||
| Long-term debt and capital lease obligations |
755,328 | 903,374 | 904,595 | 920,754 | 930,753 | |||||||||||||||
| Total SEACOR Holdings Inc. stockholders’ equity |
1,957,262 | 1,630,150 | 1,641,940 | 1,582,028 | 1,390,787 | |||||||||||||||
| (1) | Marine Transportation Services commenced operations in July 2005 with the Company’s acquisition of Seabulk International, Inc. |
| (2) | Commodity Trading and Logistics commenced operations in March 2007. |
43
Table of Contents
| (3) | Other includes the operations of Harbor and Offshore Towing Services, which commenced operations in July 2005 with the Company’s acquisition of Seabulk International, Inc. |
| (4) | Other income principally includes gains and losses from debt extinguishment, marketable security, derivative and foreign currency transactions. Other income in 2005 included gains and losses from marketable security and foreign currency transactions as part of the repatriation of foreign earnings under the American Jobs Creation Act of 2004. |
FORWARD-LOOKING STATEMENTS
Management’s Discussion and Analysis of Financial Condition and Results of Operations below presents the Company’s operating results for each of the three years in the period ended December 31, 2009, and its financial condition as of December 31, 2009. Except for the historical information contained herein, this Annual Report on Form 10-K and other written and oral statements that the Company makes from time to time contain forward-looking statements, which involve substantial known and unknown risks, uncertainties and other important factors that could cause the actual results, performance or achievements of results to differ materially from any future results, performance or achievements expressed or implied by such forward-looking statements. The Company has tried, wherever possible, to identify such statements by using words such as “anticipate,” “estimate,” “expect,” “project,” “intend,” “believe,” “plan,” “target,” “forecast” and similar expressions in connection with any discussion of future operating or financial performance. Among the factors that could cause actual results to differ materially are those discussed in “Risks, Uncertainties and Other Factors That May Affect Future Results” in Item 1A of this Annual Report on Form 10-K. In addition, the following Management’s Discussion and Analysis of Financial Condition and Results of Operations should be read in connection with the information presented in the Company’s consolidated financial statements and the related notes to its consolidated financial statements.
44
Table of Contents
| ITEM 7. | MANAGEMENT’S DISCUSSION AND ANALYSIS OF FINANCIAL CONDITION AND RESULTS OF OPERATIONS |
SEACOR and its subsidiaries are in the business of owning, operating, investing in and marketing equipment, primarily in the offshore oil and gas, industrial aviation and marine transportation industries. The Company conducts its activities in six primary business segments:
Offshore Marine Services operates a diversified fleet of offshore support vessels primarily servicing offshore oil and gas exploration, development and production facilities worldwide.
Marine Transportation Services operates a fleet of U.S.-flag product tankers carrying petroleum, crude oil and chemical products in the U.S. coastwise trade.
Inland River Services is primarily engaged in dry and liquid cargo transportation on the U.S. Inland River Waterways and the Gulf Intracoastal Waterways for a range of agricultural and industrial products.
Aviation Services operates and leases helicopters that provide transportation services supporting offshore oil and gas activities primarily in the United States, air medical services to hospitals in the United States and industrial aviation services in South America, Europe, India and Asia.
Environmental Services is primarily engaged in the provision of emergency preparedness and response services to oil, chemical, industrial and marine transportation clients in the United States and abroad.
Commodity Trading and Logistics is an integrated business involved in the purchase, storage, transportation and sale of agricultural and energy commodities.
Other primarily includes Harbor and Offshore Towing Services, various other investments in joint ventures and lending and leasing activities.
The Company’s business segments, with the exception of Environmental Services and Commodity Trading and Logistics, are “asset related” and highly capital-intensive. Demand for the Company’s assets is cyclical in varying degrees due to fluctuations in the activity levels in the industries serviced by those assets, as well as availability of supply.
To manage capital successfully over time, the Company continually assesses its asset portfolio and pursues opportunities to realize value from its assets by shifting their operation to other markets or trading them when circumstances warrant. The Company actively leases out and leases in, and buys and sells equipment in the ordinary course of its business. It also designs, orders, builds, upgrades, operates or re-sells newly constructed equipment. The Company typically pursues a strategy of shedding older assets while adjusting its asset mix. The Company also leases assets to other operators and sells assets to financial lessors and leases them back for varying periods of time. The Company believes that maintaining significant liquidity is an important factor that will enable it to take advantage of opportunities as they arise.
In recent years, the Company has sought to create balance in its businesses and broaden its asset base by investing in barges, ships and tugs, and by looking for opportunities to engage in logistics support for movement of agricultural and energy commodities.
The Company is exploring opportunities to extend its aviation activities through investments in sales, marketing and distribution of aircraft and specialized parts and services, maintenance and repair facilities and fixed base operations. In addition, the Company is also looking to expand into the Chinese and Indian markets.
45
Table of Contents
The Company believes that demand for its barges, tankers and tugs is, in part, linked to different factors than those that drive demand for offshore oil and gas exploration and development. In addition, for barges and tankers, contracts can sometimes be secured with longer terms than those typically available for offshore marine and helicopter services. The expectation is that over time this strategy of diversification will provide better returns on capital than could be achieved by restricting investment to one specific, highly cyclical, asset class such as marine vessels supporting offshore oil and gas activity. The Company believes this strategy will afford more opportunities to use capital efficiently, create greater stability of earnings and allow improved margins due to operational synergies that in turn, should yield a lower cost of capital, more sustainable cash flows and increased profitability.
Consolidated Results of Operations
Consolidated financial data for segment and geographic areas is reported in Part IV “Note 15. Major Customers and Segment Data” of this Annual Report on Form 10-K.
Offshore Marine Services
The market for offshore oil and gas drilling has historically been cyclical. Demand tends to be linked to the price of oil and gas and those prices tend to fluctuate depending on many factors, including global economic activity and levels of inventory. Price levels for oil and gas can in themselves cause additional fluctuations by inducing changes in consumer behavior. The cyclicality of the market is further exacerbated by the tendency in the industry to order capital assets as demand grows, often resulting in new capacity becoming available just as demand for oil and gas is peaking and activity is about to decline.
The precipitous drop in oil and gas prices during the second half of 2008 reduced offshore activity to some degree and this continued during 2009. The Company responded to these market conditions by cold-stacking a number of vessels previously operating in the U.S. Gulf of Mexico. As of December 31, 2009, the Company had 19 vessels cold-stacked. The term ‘cold-stacked’ means unmanned and not working. The Company continues to monitor market conditions and will cold-stack additional vessels, or place vessels back into service, as it deems appropriate. The domestic order book is smaller than the international order book, but there continues to be over capacity in the U.S. market. In addition, deliveries of newly built vessels into the international market, in conjunction with reduced demand, has created a situation of oversupply in the North Sea, Asia, Middle East and West Africa regions. This situation is likely to worsen during 2010 as more newly built vessels are delivered, even if some orders are cancelled or vessel deliveries are delayed.
Reduced activity, combined with tighter capital and credit markets, has created uncertainty over new construction of offshore equipment. The order book for new equipment remains large but there are uncertainties as to if and when these assets will be delivered. Many of these assets were ordered without firm contractual commitments for employment and should these assets be delivered and placed into service there could be an adverse impact on market conditions.
Over the last several years, Offshore Marine Services has disposed of its old generation equipment while taking delivery of new vessels specifically designed to meet the changing requirements of the market. Since December 31, 2007, the average age of the fleet, excluding standby safety vessels, has been reduced from 12.8 years to 10.6 years. Offshore Marine Services enters 2010 with a limited order book for new equipment and believes its diverse fleet and broad geographical distribution of vessels will assist in weathering the effects of the industry downturn. The Company’s strong financial position should enable Offshore Marine Services to capitalize on opportunities as they develop for purchasing, mobilizing or upgrading vessels to meet changing market conditions. As of December 31, 2009, Offshore Marine Services had three Fast Support vessels under construction in the U.S. Gulf of Mexico.
46
Table of Contents
The number and type of vessels operated, their rates per day worked and their utilization levels are the key determinants of Offshore Marine Services’ operating results and cash flows. Unless a vessel is cold-stacked (removed from operational service), there is little reduction in daily running costs and, consequently, operating margins are most sensitive to changes in rates per day worked and utilization.
The aggregate cost of Offshore Marine Services’ operations depends primarily on the size and asset mix of the fleet. Offshore Marine Services’ costs and expenses include daily running costs and fixed costs. Daily running costs are primarily comprised of wages paid to marine personnel, maintenance and repairs and insurance, which vary depending on equipment type, location and activity. The most significant components of maintenance and repair expenses are drydock and main engine overhaul costs, which are expensed as incurred. Vessel drydockings are regularly performed in accordance with applicable regulations and main engine overhauls are performed in accordance with a planned maintenance program. If a disproportionately large number of drydockings or overhauls are undertaken in a particular fiscal year or calendar quarter, operating expenses may vary significantly when compared with the prior year or quarter. Inflationary pressure on all operating costs, which had been significant for a number of years, continued moderate during 2009.
Results of Operations
| 2009 | 2008 | 2007 | Percent Change | ||||||||||||||||||
| Amount | Percent | Amount | Percent | Amount | Percent | ’09/’08 | ’08/’07 | ||||||||||||||
| $ ’000 | % | $ ’000 | % | $ ’000 | % | % | % | ||||||||||||||
| Operating Revenues: |
|||||||||||||||||||||
| United States |
207,455 | 37 | 336,639 | 48 | 335,624 | 48 | |||||||||||||||
| Africa, primarily West Africa |
109,428 | 19 | 123,088 | 17 | 159,426 | 23 | |||||||||||||||
| United Kingdom, primarily North Sea |
66,956 | 12 | 74,169 | 10 | 73,190 | 11 | |||||||||||||||
| Middle East |
78,205 | 14 | 82,621 | 12 | 51,382 | 8 | |||||||||||||||
| Asia |
32,003 | 6 | 34,417 | 5 | 29,463 | 4 | |||||||||||||||
| Mexico, Central and South America |
68,244 | 12 | 57,794 | 8 | 43,333 | 6 | |||||||||||||||
| 562,291 | 100 | 708,728 | 100 | 692,418 | 100 | (21 | ) | 2 | |||||||||||||
| Costs and Expenses: |
|||||||||||||||||||||
| Operating |
309,635 | 55 | 390,102 | 55 | 374,474 | 54 | |||||||||||||||
| Administrative and general |
47,031 | 8 | 58,422 | 8 | 51,908 | 7 | |||||||||||||||
| Depreciation and amortization |
54,869 | 10 | 55,634 | 8 | 60,523 | 9 | |||||||||||||||
| 411,535 | 73 | 504,158 | 71 | 486,905 | 70 | ||||||||||||||||
| Gains on Asset Dispositions and Impairments, net |
22,490 | 4 | 69,206 | 10 | 82,534 | 12 | |||||||||||||||
| Operating Income |
173,246 | 31 | 273,776 | 39 | 288,047 | 42 | (37 | ) | (5 | ) | |||||||||||
| Other Income (Expense): |
|||||||||||||||||||||
| Derivative losses, net |
(175 | ) | — | — | — | — | — | ||||||||||||||
| Foreign currency gains (losses), net |
2,451 | — | (422 | ) | — | (760 | ) | — | |||||||||||||
| Other, net |
182 | — | (12 | ) | — | 10 | — | ||||||||||||||
| Equity in Earnings of 50% or Less Owned Companies |
9,867 | 2 | 11,068 | 2 | 14,221 | 2 | |||||||||||||||
| Segment Profit |
185,571 | 33 | 284,410 | 41 | 301,518 | 44 | (35 | ) | (6 | ) | |||||||||||
47
Table of Contents
Operating Revenues—2009 compared with 2008. Overall operating revenues decreased by $146.4 million in 2009 compared with 2008. Time charter revenues decreased by $155.2 million and other operating revenues, including third party brokered vessel activity, bareboat charter revenues and other marine services, increased by $8.8 million.
The number of days available for charter in 2009 was 55,516 compared with 63,227 in 2008, a 7,711 or 12% reduction due to net fleet dispositions. Overall fleet utilization was 73% in 2009 compared with 83% in 2008. Net fleet dispositions, the impact of vessels mobilizing between geographic regions, changes in utilization and other changes in fleet mix combined to reduce time charter revenues by $113.8 million.
Overall average day rates were $12,223 per day in 2009 compared with $12,396 in 2008, a decrease of $173 per day or 1%. In overall terms, there was a decrease in base average day rates which reduced time charter revenues by $29.6 million. In addition, the impact of unfavorable changes in currency exchange rates, primarily between the U.S. Dollar and the pound sterling, reduced time charter revenues by $11.8 million.
In the U.S. Gulf of Mexico, time charter revenues were $129.0 million lower in 2009 compared with 2008 primarily due to a reduction in rig moving activity and a 23% reduction in utilization attributable mainly to the cold-stacking of additional vessels during 2009.
Time charter revenues were lower in West Africa and the Middle East due to net fleet dispositions, and were lower in the North Sea due to unfavorable currency exchange rate movements between the U.S. dollar and the pound sterling. Time charter revenues increased in Asia primarily due to mobilizing vessels from other geographic regions, and in Mexico, Central and South America due to improved utilization and day rates.
Operating Income—2009 compared with 2008. Operating income in 2009 included $22.5 million of gains on asset dispositions compared with $69.2 million of gains in 2008. Excluding the impact of these gains, operating income decreased by $53.8 million. The decrease in operating revenues noted above was partially offset by an $80.5 million decrease in operating expenses primarily due to net fleet dispositions, a reduction in the number of scheduled drydockings and cold-stacking of additional vessels in the U.S. Gulf of Mexico. Administrative and general expenses were $11.4 million lower in 2009 compared with 2008 primarily due to the impact of restructuring the international group in late 2008.
Operating Revenues—2008 compared with 2007. Overall operating revenues increased by $16.3 million in 2008 compared with 2007. Overall average day rates increased from $11,519 per day in 2007 to $12,396 per day in 2008, resulting in additional operating revenues of $36.5 million. Overall utilization improved from 81% in 2007 to 83% in 2008, resulting in an increase in operating revenues of $6.5 million. Total days available for charter decreased in 2008 by 7,745, or 11%, due to net fleet dispositions which resulted in a decrease in operating revenues of $35.9 million. Operating revenues were $22.9 million higher in 2008 due to increased third party vessel brokerage activity in the Middle East, higher other marine services revenues and increased bareboat charter hire in South America and Asia. Operating revenues were $13.7 million lower due to the impact of downtime for vessel mobilizations and unfavorable exchange rate changes in the North Sea.
Operating Income—2008 compared with 2007. Operating income in 2008 included $69.2 million of gains on asset dispositions compared with $82.5 million of gains in 2007. Excluding the impact of these gains, operating income decreased by $0.9 million. The improvements in operating revenues noted above were offset by higher operating expenses, primarily due to higher crew wage expense, higher regulatory dry dock expense and an increase in third party charter-in expense as a result of increased third party vessel brokerage activity. Administrative and general expenses were $6.5 million higher in 2008 primarily due to higher provisions for doubtful accounts, costs incurred for international staff severance and expenses related to hurricane disruptions in the U.S. Gulf of Mexico. Depreciation expense was $4.9 million lower in 2008 due to net fleet dispositions.
Equity in Earnings of 50% or Less Owned Companies. Results in 2008 included a gain on the sale of a vessel in a Norwegian joint venture and results in 2007 included gains on the sale of its interests in joint ventures in Egypt and South America.
48
Table of Contents
Operating Statistics
The table below sets forth average rates per day worked, utilization and available days data for each group of Offshore Marine Services’ vessels operating under time charters for the periods indicated. The rate per day worked is the ratio of total time charter revenues to the aggregate number of days worked. Utilization is the ratio of aggregate number of days worked to total calendar days available for work. Available days represents the total calendar days during which owned and chartered-in vessels are operated by the Company.
| 2009 | 2008 | 2007 | Q4 2009 | Q4 2008 | ||||||||||||||||
| Rates Per Day Worked: |
||||||||||||||||||||
| Anchor handling towing supply |
$ | 37,904 | $ | 40,691 | $ | 32,782 | $ | 34,293 | $ | 43,558 | ||||||||||
| Crew |
7,366 | 6,934 | 6,584 | 6,881 | 7,228 | |||||||||||||||
| Mini-supply |
6,422 | 6,714 | 6,460 | 7,452 | 6,152 | |||||||||||||||
| Standby safety |
8,457 | 9,697 | 10,049 | 8,733 | 8,376 | |||||||||||||||
| Supply |
15,271 | 16,647 | 13,571 | 14,748 | 17,020 | |||||||||||||||
| Towing supply |
12,002 | 10,804 | 11,308 | 12,300 | 11,387 | |||||||||||||||
| Specialty |
13,185 | 11,801 | 11,046 | 9,861 | 11,480 | |||||||||||||||
| Overall Average Rates Per Day Worked |
12,223 | 12,396 | 11,519 | 12,093 | 12,402 | |||||||||||||||
| Utilization: |
||||||||||||||||||||
| Anchor handling towing supply |
63 | % | 80 | % | 89 | % | 58 | % | 83 | % | ||||||||||
| Crew |
67 | % | 81 | % | 76 | % | 59 | % | 90 | % | ||||||||||
| Mini-supply |
60 | % | 72 | % | 64 | % | 48 | % | 80 | % | ||||||||||
| Standby safety |
90 | % | 90 | % | 91 | % | 91 | % | 91 | % | ||||||||||
| Supply |
77 | % | 88 | % | 89 | % | 80 | % | 84 | % | ||||||||||
| Towing supply |
90 | % | 89 | % | 84 | % | 87 | % | 87 | % | ||||||||||
| Specialty |
87 | % | 92 | % | 85 | % | 75 | % | 95 | % | ||||||||||
| Overall Fleet Utilization |
73 | % | 83 | % | 81 | % | 68 | % | 88 | % | ||||||||||
| Available Days: |
||||||||||||||||||||
| Anchor handling towing supply |
6,474 | 6,252 | 6,744 | 1,748 | 1,540 | |||||||||||||||
| Crew |
23,391 | 25,774 | 27,776 | 5,499 | 6,383 | |||||||||||||||
| Mini-supply |
4,755 | 7,027 | 7,810 | 1,012 | 1,663 | |||||||||||||||
| Standby Safety |
8,760 | 8,449 | 7,933 | 2,208 | 2,147 | |||||||||||||||
| Supply |
7,202 | 8,049 | 8,322 | 1,748 | 1,885 | |||||||||||||||
| Towing supply |
3,346 | 4,795 | 8,564 | 828 | 1,091 | |||||||||||||||
| Specialty |
1,588 | 2,881 | 3,823 | 368 | 497 | |||||||||||||||
| Overall Fleet Available Days |
55,516 | 63,227 | 70,972 | 13,411 | 15,206 | |||||||||||||||
Marine Transportation Services
Demand for the Company’s tankers is dependent on several factors, including petroleum production and refining activity levels in the United States, domestic consumer and commercial consumption of petroleum products and chemicals and competition from foreign imports of oil products. During 2007 and 2006, orders placed for the construction of new double-hulled vessels qualified for operation in the U.S. coastwise trade created uncertainty as to whether the market would be able to absorb such additional capacity. In response to the uncertainty of both demand and supply factors and in order to secure a portion of the fleet’s future earnings,
49
Table of Contents
Marine Transportation Services entered into a firm nine year arrangement to bareboat charter-out four vessels with staggered delivery dates. The first vessel began its charter in March 2007, the second in September 2008, the third in January 2010 and the fourth is due to commence its charter in the third quarter of 2010.
As of December 31, 2009, the Company believes third parties had contracted to build approximately 20 U.S.-flag tank vessels that could compete with Marine Transportation Services’ equipment. Fifteen vessels are scheduled to be delivered in 2010, three vessels in 2011, and the remaining two in 2012 or 2013. It is anticipated that retirements of U.S.-flag tank vessels under OPA 90 regulations will be one in 2010, four in 2011 and another twelve between 2012 and January 1, 2015.
The following table presents, for the years indicated, the percentage of revenues Marine Transportation Services earned from its charter arrangements.
| 2009 | 2008 | 2007 | ||||||
| Time charters |
47 | % | 74 | % | 72% | |||
| Bareboat charters |
19 | % | 10 | % | 6% | |||
| Contracts of affreightment and voyage contracts |
34 | % | 16 | % | 22% | |||
| 100 | % | 100 | % | 100% | ||||
Marine Transportation Services’ costs and expenses include daily running costs and fixed costs. Daily running costs are primarily comprised of wages paid to marine personnel, maintenance and repairs and insurance, which vary depending on equipment type, location and activity. The most significant components of maintenance and repair expenses are drydocking costs, which are expensed as incurred. Vessel drydockings are regularly performed in accordance with applicable regulations and if a disproportionately large number of drydockings are undertaken in a particular fiscal year or calendar quarter, operating expenses may vary significantly when compared with a prior year or quarter.
Depreciation is Marine Transportation Services’ principal fixed cost. Depreciation depends on the acquisition costs of vessels and their related useful life and salvage value assumptions.
The Company believes the Seabulk America is one of six vessels designed and certified to carry complicated chemical cargos in the domestic coastwise trade. Given the overriding effects of the global economic slowdown, demand for the vessel’s specialized services was soft during 2009. The Company believes the chemical industry is undergoing a cyclical market down-turn that will gradually recover; however, the Seabulk America requires a regulatory dry-docking during the third quarter of 2010, a requirement for continued operation. A decision as to whether or not this expenditure should be incurred will be made against the then prevailing market conditions. A decision to cease vessel operations and lay-up the Seabulk America amid continued weak market conditions could potentially result in a significant impairment charge. The carrying value of the Seabulk America was $26.5 million as of December 31, 2009, with contributed operating revenues of $12.4 million during the year ended December 31, 2009.
50
Table of Contents
Results of Operations
| 2009 | 2008 | 2007 | Percent Change | ||||||||||||||||||
| Amount | Percent | Amount | Percent | Amount | Percent | ’09/’08 | ’08/’07 | ||||||||||||||
| $ ’000 | % | $ ’000 | % | $ ’000 | % | % | % | ||||||||||||||
| Operating Revenues: |
|||||||||||||||||||||
| United States |
92,866 | 100 | 111,497 | 98 | 116,037 | 100 | |||||||||||||||
| Foreign |
— | — | 2,531 | 2 | — | — | |||||||||||||||
| 92,866 | 100 | 114,028 | 100 | 116,037 | 100 | (19 | ) | (2 | ) | ||||||||||||
| Costs and Expenses: |
|||||||||||||||||||||
| Operating |
50,568 | 54 | 72,246 | 63 | 90,702 | 78 | |||||||||||||||
| Administrative and general |
4,122 | 4 | 6,302 | 6 | 5,309 | 5 | |||||||||||||||
| Depreciation and amortization |
32,006 | 35 | 32,013 | 28 | 38,248 | 33 | |||||||||||||||
| 86,696 | 93 | 110,561 | 97 | 134,259 | 116 | ||||||||||||||||
| Gains on Asset Dispositions and Impairments, net |
— | — | 3,629 | 3 | — | — | |||||||||||||||
| Operating Income (Loss) |
6,170 | 7 | 7,096 | 6 | (18,222 | ) | (16 | ) | (13 | ) | 139 | ||||||||||
| Other Income (Expense): |
|||||||||||||||||||||
| Foreign currency gains (losses), net |
(1 | ) | — | 55 | — | 43 | — | ||||||||||||||
| Segment Profit (Loss) |
6,169 | 7 | 7,151 | 6 | (18,179 | ) | (16 | ) | (14 | ) | 139 | ||||||||||
Operating Revenues—2009 compared with 2008. Operating revenues were $21.2 million lower in 2009 compared with 2008, primarily due to changes in the contract status of three vessels: one from time charter to long-term bareboat charter commencing in September 2008; a second from spot market to time charter commencing in April 2009; and a third from spot market to time charter commencing in August 2009. The third vessel was also off-hire for 28 days in 2009 while undergoing regulatory drydocking and repairs. Operating revenues for two other vessels decreased due to lower utilization, one of which was temporarily laid-up between August 2009 and the end of the year. Operating revenues were higher for two vessels that underwent regulatory drydockings in 2008.
Operating Income (Loss)—2009 compared with 2008. Operating income was $0.9 million lower in 2009 compared with 2008. Operating income in 2008 included gains of $3.6 million on the sale of the Seabulk Magnachem and Seabulk Power. Excluding the impact of these gains, operating income was $2.7 million higher in 2009 compared with 2008. The reductions in operating revenues noted above were offset by reductions in operating expenses for three vessels in line with the changes in contract status noted above. Operating income was higher for the two vessels that were drydocked in 2008 and lower for the vessel that was drydocked in 2009.
Operating Revenues—2008 compared with 2007. Operating revenues decreased by $2.0 million in 2008 compared with 2007. Operating revenues were lower due to the sale and subsequent scrapping of the Seabulk Power in January 2008 and the Seabulk Magnachem in March 2008, out-of-service time for two vessels while undergoing regulatory dockings in 2008, and the change in contract status of the Mississippi Voyager (formerly—Seabulk Mariner) and California Voyager (formerly—Brenton Reef) from time charter to long-term bareboat charter in March 2007 and September 2008, respectively. Operating revenues were higher for two vessels that incurred significant out-of-service time in 2007 while undergoing retrofits to double-hull configuration, and for another that operated at a higher average day rate in 2008.
51
Table of Contents
Operating Income (Loss)—2008 compared with 2007. Operating income increased by $25.3 million in 2008 compared with 2007 primarily due to lower costs and expenses. Operating expenses were lower primarily due to the sale and subsequent scrapping of the Seabulk Power and Seabulk Magnachem, lower drydocking expenses and the change in contract status of the Mississippi Voyager (formerly—Seabulk Mariner) and California Voyager (formerly—Brenton Reef) from time charter to long-term bareboat charters. In addition, depreciation charges were lower due to the sale of the Seabulk Power and the extension of the retrofitted tankers useful lives. Operating income in 2008 included $3.6 million in gains on asset dispositions.
Inland River Services
For the inland river industry, 2009 can best be summed up as a year that started and finished strongly but struggled in the middle. It was a year which, at its worst, saw 20 – 25% of the available barge fleet idled with spot freight rates falling to below breakeven levels.
Historically, activity levels for grain exports and non-grain imports are the key drivers in determining freight rates. When these activity levels are low, the barge industry must deal with an oversupply of equipment, inevitably leading to pressure on rates. During 2009, although grain export activity was positively impacted by an unprecedented demand for soybeans, principally destined for China, the market was dominated by weaker corn exports and a significant reduction in the level of coal exports compared with 2008. Imports were seriously impacted by the ongoing economic recession in the United States with reduced demand for construction related materials and other industrial cargos. The combination of these factors contributed to an oversupply of equipment and a market in which freight rates struggled to maintain reasonable values for much of the year. Barge operators responded to these difficult market conditions by idling equipment in an effort to support the rate structure.
Weather issues also plagued the industry during 2009. An unusually wet spring caused navigation problems that hindered barge operations and delayed the planting of crops. Then, in September, the rains returned as farmers were preparing to harvest. Despite the late rains and thousands of lost acres, the latest production estimates for the 2009/2010 season according to the U.S. Department of Agriculture, point to a record corn crop and one of the best soybean crops on record. As a result, harvest activity was compressed during the fourth quarter and the requirement to move a large crop in a shorter period brought previously idled equipment back into service as demand improved and freight rates moved higher.
At the end of 2009, the average age of the Inland River Services’ dry cargo barge fleet was six years old, which the Company believes is among the youngest fleets operating on the U.S. Inland River Waterways system. Inland River Services believes that approximately 30% of the dry cargo barge fleet operating on the U.S. Inland River Waterways is over 20 years old. Inland River Services expects the relatively young age of its dry cargo barge fleet to enhance its availability and reliability, reduce downtime for repairs and limit replacement capital expenditures required to maintain its fleet size and revenue generating capacity.
The following table presents, for the years indicated, the percentage of revenues Inland River Services earned from its various operations.
| 2009 | 2008 | 2007 | ||||
| Dry cargo barge pool participation(1) |
55% | 59% | 62% | |||
| Liquid unit tow operations |
19% | 15% | 9% | |||
| Charter-out of dry cargo barges |
6% | 7% | 12% | |||
| 10,000 barrel liquid tank barge operations |
5% | 7% | 8% | |||
| Inland river towboat operations and other activities |
15% | 12% | 9% | |||
| 100% | 100% | 100% | ||||
| (1) | Inland River Services’ manages the dry cargo barge pools in which it participates. |
52
Table of Contents
The following table presents, for the years indicated, Inland River Services’ interest in the tons hauled, percentage of tons moved and percentage of operating revenues derived from the movement of cargo and earned from its participation in dry cargo barge pools.
| 2009 | 2008 | 2007 | ||||||||||||||||||||||
| (in thousands) |
Tons | Percent of Tons |
Percent of Revenues |
Tons | Percent of Tons |
Percent of Revenues |
Tons | Percent of Tons |
Percent of Revenues |
|||||||||||||||
| Grain |
2,645 | 71 | % | 63 | % | 1,977 | 56 | % | 53 | % | 1,742 | 57 | % | 57 | % | |||||||||
| Non-Grain |
1,089 | 29 | % | 37 | % | 1,524 | 44 | % | 47 | % | 1,315 | 43 | % | 43 | % | |||||||||
| 3,734 | 100 | % | 100 | % | 3,501 | 100 | % | 100 | % | 3,057 | 100 | % | 100 | % | ||||||||||
Dry cargo barge expenses are typically differentiated between those directly related to voyages including towing, switching, fleeting and cleaning costs and non-voyage related expenses including repair costs, insurance and depreciation. For barges chartered-out, expense is limited to depreciation.
Results of Operations
| 2009 | 2008 | 2007 | Percent Change | |||||||||||||||
| Amount | Percent | Amount | Percent | Amount | Percent | ’09/’08 | ’08/’07 | |||||||||||
| $ ’000 | % | $ ’000 | % | $ ’000 | % | % | % | |||||||||||
| Operating Revenues: |
||||||||||||||||||
| United States |
154,991 | 100 | 144,022 | 100 | 121,248 | 100 | ||||||||||||
| Foreign |
107 | — | — | — | — | — | ||||||||||||
| 155,098 | 100 | 144,022 | 100 | 121,248 | 100 | 8 | 19 | |||||||||||
| Costs and Expenses: |
||||||||||||||||||
| Operating |
89,444 | 58 | 82,419 | 57 | 57,458 | 47 | ||||||||||||
| Administrative and general |
8,764 | 6 | 7,887 | 5 | 6,807 | 6 | ||||||||||||
| Depreciation and amortization |
19,357 | 12 | 16,582 | 12 | 16,307 | 13 | ||||||||||||
| 117,565 | 76 | 106,888 | 74 | 80,572 | 66 | |||||||||||||
| Gains on Asset Dispositions |
4,706 | 3 | 10,394 | 7 | 30,562 | 25 | ||||||||||||
| Operating Income |
42,239 | 27 | 47,528 | 33 | 71,238 | 59 | (11 | ) | (33 | ) | ||||||||
| Other Income (Expense): |
||||||||||||||||||
| Other, net |
— | — | 16 | — | 108 | — | ||||||||||||
| Equity in Earnings of 50% or Less Owned Companies |
3,882 | 3 | 388 | — | 7,650 | 6 | ||||||||||||
| Segment Profit |
46,121 | 30 | 47,932 | 33 | 78,996 | 65 | (4 | ) | (39 | ) | ||||||||
Operating Revenues—2009 compared with 2008. Operating revenues were $11.1 million higher in 2009 compared with 2008. Operating revenues were higher in the liquid unit tow operation, primarily due to additional equipment added throughout 2008 and 2009, and higher for terminal operations due to a full year of activity at the Sauget, Illinois terminal, which opened in May 2008. Operating revenues for the pooled hopper barge fleet were lower in 2009, primarily due to reductions in grain exports, reduced demand for imported construction related materials and decreased movements of other industrial cargos due to the economic recession in the United States.
53
Table of Contents
Operating Income—2009 compared with 2008. Operating income in 2009 included $4.7 million in gains on asset dispositions compared with gains of $10.4 million in 2008. Excluding the impact of these gains, operating income increased by $0.4 million. Operating income in the liquid unit tow operation and the Sauget terminal operations were higher in line with the improvements in operating revenues noted above. For the pooled hopper barge fleet, operating income was lower due to the reductions in operating revenues noted above combined with higher operating expenses, primarily towing, fleeting and switching costs.
Operating Revenues—2008 compared with 2007. Operating revenues increased in 2008, primarily due to the impact of new equipment placed into service in the liquid unit tow operation. Operating revenues were also favorably impacted by increased activity on the lower Mississippi River and higher rates. In addition, operating revenues were higher following the return of 68 dry cargo barges to the pooled operating fleet that were previously on a long term charter to a third party. The commencement of terminal operations in Sauget, Illinois also contributed to revenue growth.
Operating Income—2008 compared with 2007. Operating income in 2008 included $10.4 million in gains on asset dispositions compared with gains of $30.6 million in 2007. Excluding the impact of these gains, operating income decreased by $3.5 million. The improvements in operating revenues noted above were offset by higher operating expenses, primarily due to higher fuel, towing, fleeting and switching costs and higher repair and maintenance costs. In addition, wage and benefit costs were higher as a result of additional activity in the liquid unit tow operation.
Equity in Earnings of 50% or Less Owned Companies. Equity in earnings in 2009 consist primarily of results from Inland River Services’ joint venture that owns a fleet of inland river transportation assets and enters into strategic positions in marketable securities and commodity futures. Equity in earnings include losses from trading activities and the recognition of an impairment charge on prime brokerage exposure in 2008 and include gains on marketable securities and commodity futures in 2007. As of December 31, 2009 and 2008, this joint venture had no marketable security or commodity future positions.
Aviation Services
A significant portion of Aviation Services’ operations involves transportation services provided to offshore oil and gas customers and leasing aircraft to third parties. As with the Company’s Offshore Marine Services segment, the offshore oil and gas market is highly cyclical with demand linked to the price of oil and gas which tend to fluctuate depending on many factors, including global economic activity and levels of inventory. Alaska and the U.S. Gulf of Mexico represent Aviation Services’ major oil and gas markets. Demand for leased aircraft is influenced by the overall demand for aircraft and the availability of financing to potential customers. The recent difficulties in the credit market have increased demand for Aviation Services’ leased assets.
Aviation Services’ current revenue stream from the support of oil and gas activities is balanced between the exploration and production activities of its customers. Exploration and development activities generally require medium size and heavy aircraft, which typically earn higher margins. Production related activities are less sensitive to variations in commodity prices and accordingly provide a more stable demand for services. Aviation Services has concentrated its production support in deepwater areas and with pipeline companies. It performs very little shallow water production support.
In recent years, Aviation Services’ oil company customers have been seeking modern aircraft that offer enhanced safety features and greater performance. Some customers have also been moving from small single engine aircraft to small twin engine aircraft due to the additional safety afforded from two engines when flying extended range missions in deepwater areas.
Aviation Services, through one of its joint ventures, offer training services to third parties using a mix of classrooms, flight training devices and aircraft. The demand for these services has increased in line with customers efforts to improve safety.
54
Table of Contents
Maintenance and repair expenses, depreciation, employee compensation, insurance costs and fuel expenses represent a significant portion of Aviation Services’ overall operating costs. All maintenance and repair costs, including aircraft refurbishments and engine and major component overhauls, are expensed as incurred. Should a disproportionate number of refurbishments or overhauls be undertaken in a particular fiscal year or calendar quarter, comparative operating expenses may vary considerably.
Certain third party vendors maintain the engines and some components on some of Aviation Services’ helicopters under programs that require it to pay ratably for the service based on actual flight hours flown. The costs are normally billed on a monthly basis and expensed as incurred. In the event that Aviation Services places an aircraft in a program after a maintenance period has begun it may be necessary to pay an initial buy-in charge based on hours flown to date with such charge being amortized over the contract period. If a helicopter is sold before the scheduled maintenance work is carried out, Aviation Services may be able to recover part of the expenditure incurred up to that point. The impact of entry into and exit from these programs can have a significant impact on Aviation Services’ repair and maintenance costs.
In measuring and evaluating Aviation Services’ performance, management considers flight hours flown. Hours flown were 65,755, 74,203 and 74,766 for the years ended December 31, 2009, 2008 and 2007, respectively, and include hours flown for oil and gas support services, air medical services, flightseeing activities and certain leasing activities. These hours are not necessarily indicative of management’s expectations for future flight hours for the Aviation Services’ fleet.
Results of Operations
| 2009 | 2008 | 2007 | Percent Change | |||||||||||||||||||
| Amount | Percent | Amount | Percent | Amount | Percent | ’09/’08 | ’08/’07 | |||||||||||||||
| $ ’000 | % | $ ’000 | % | $ ’000 | % | % | % | |||||||||||||||
| Operating Revenues: |
||||||||||||||||||||||
| United States |
201,344 | 85 | 223,193 | 90 | 199,891 | 93 | ||||||||||||||||
| Foreign |
34,323 | 15 | 25,434 | 10 | 15,148 | 7 | ||||||||||||||||
| 235,667 | 100 | 248,627 | 100 | 215,039 | 100 | (5 | ) | 16 | ||||||||||||||
| Costs and Expenses: |
||||||||||||||||||||||
| Operating |
147,955 | 63 | 181,490 | 73 | 157,240 | 73 | ||||||||||||||||
| Administrative and general |
21,396 | 9 | 20,130 | 8 | 18,865 | 9 | ||||||||||||||||
| Depreciation and amortization |
37,358 | 16 | 36,411 | 15 | 27,561 | 13 | ||||||||||||||||
| 206,709 | 88 | 238,031 | 96 | 203,666 | 95 | |||||||||||||||||
| Gains on Asset Dispositions and Impairments, net |
316 | — | 4,883 | 2 | 8,032 | 4 | ||||||||||||||||
| Operating Income |
29,274 | 12 | 15,479 | 6 | 19,405 | 9 | 89 | (20 | ) | |||||||||||||
| Other Income (Expense): |
||||||||||||||||||||||
| Derivative gains (losses), net |
266 | — | 274 | — | (2,695 | ) | (1 | ) | ||||||||||||||
| Foreign currency gains, net |
1,439 | 1 | 271 | — | 44 | — | ||||||||||||||||
| Other, net |
— | — | 38 | — | 613 | — | ||||||||||||||||
| Equity in Losses of 50% or Less Owned Companies |
(487 | ) | — | (461 | ) | — | (8 | ) | — | |||||||||||||
| Segment Profit |
30,492 | 13 | 15,601 | 6 | 17,359 | 8 | 95 | (10 | ) | |||||||||||||
55
Table of Contents
Operating Revenues—2009 compared with 2008. Operating revenues decreased by $13.0 million in 2009 compared with 2008. Operating revenues were $13.3 million lower in the U.S. Gulf of Mexico primarily due to a slowdown in offshore oil and gas activity and a reduction in hurricane related activity compared with 2008. Operating revenues in Alaska decreased by $5.2 million, primarily due to lower fuel prices charged by the FBO, a reduction in activity at the FBO and fewer aircraft assigned to flightseeing operations, partially offset by additional contract revenues generated from oil and gas support activities. Operating revenues from air medical services decreased by $3.0 million, primarily due to contract terminations. Operating revenues from leasing activities increased by $8.5 million: as of December 31, 2009, excluding joint ventures, 35 aircraft were dedicated to the leasing market, primarily in international regions, compared with 24 as of December 31, 2008.
Operating Income—2009 compared with 2008. Operating income in 2009 included nominal gains on asset dispositions compared with gains of $4.9 million in 2008. Excluding the impact of these gains, operating income increased by $18.4 million primarily due to an $8.1 million improvement in operating income from flight operations. The decreases in operating revenues noted above were offset by reductions in operating expenses, including a reduction in fuel cost on non-rebillable flight hours and lower wages as a result of a reduction in workforce. Operating income from leasing activities was $5.9 million higher in 2009. In addition, operating income was $4.4 million higher due to the receipt of insurance proceeds related to hurricane damage incurred in 2008.
Operating Revenues—2008 compared with 2007. Operating revenues increased in 2008 due to several factors. Operating revenues from international leasing activities increased by $12.7 million as more aircraft were dedicated to the international leasing market. As of December 31, 2008, excluding joint ventures, 24 helicopters were operating in the international leasing market compared with 16 as of December 31, 2007. In the U.S. Gulf of Mexico, although flight hours decreased, operating revenues improved by $8.9 million primarily due to the replacement of older equipment with newer helicopters that earned generally higher contract rates and higher utilization of the heavy helicopter fleet. Operating revenues in Alaska increased by $7.8 million, primarily due to a higher volume of fuel sales and higher fuel prices at the FBO and an additional oil and gas support contract. Operating revenues from air medical services improved by $4.2 million due to additional contracts with hospitals.
Operating Income—2008 compared with 2007. Operating income in 2008 included $4.9 million of gains on asset dispositions compared with gains of $8.0 million in 2007. Excluding the impact of these gains, operating income from flight operations decreased by $0.8 million. The improvements in operating revenues noted above were offset by higher operating expenses, primarily for fuel, repairs and maintenance, expenses related to hurricane disruptions in the U.S. Gulf of Mexico and higher depreciation charges as a result of net aircraft additions.
Derivative Gains (Losses), net. Aviation Services has foreign currency forward contracts designated as a fair value hedges for the purchase of capital equipment. The reported gains and losses represent the ineffective portion of these hedges.
Environmental Services
Environmental Services charges fees for its consulting and industrial and remediation services on both a time and material basis and on a fixed fee bid basis. In both cases the total fees charged are dependent upon the scope of work to be accomplished and the labor and equipment required to carry it out. The margins on time and material services are more predictable and for the most part are larger than for fixed fee work. The margins on equipment intensive jobs are normally higher than labor-intensive jobs.
The principal components of Environmental Services’ operating expenses are salaries and related benefits for operating personnel, payments to subcontractors, equipment maintenance and depreciation. These expenses are primarily a function of regulatory requirements and the level of retainer, spill, consulting and other environmental business activities.
56
Table of Contents
During the year ended December 31, 2009, Environmental Services continued to build on its environmental and consulting base through acquisitions. On December 1, 2009, the Company acquired PIER Systems Inc., a provider of crisis communication consulting services and software in the United States and abroad.
Operating results and cash flows can be very dependent on the number of emergency responses in a given fiscal period, the magnitude of each emergency and the profit margin earned. Consequently, emergency response revenues and related income can vary materially between comparable periods. The revenues from any one period are not indicative of a trend or anticipated results in future periods.
Costs of emergency response activities can include payments to sub-contractors for labor, equipment and materials and/or the direct charge of labor, equipment and materials provided by Environmental Services. Profit margins vary based on the use of the Company’s personnel and equipment resources versus the use of third-party personnel and equipment.
Results of Operations
| 2009 | 2008 | 2007 | Percent Change | ||||||||||||||||||
| Amount | Percent | Amount | Percent | Amount | Percent | ’09/’08 | ’08/’07 | ||||||||||||||
| $ ’000 | % | $ ’000 | % | $ ’000 | % | % | % | ||||||||||||||
| Operating Revenues: |
|||||||||||||||||||||
| United States |
125,111 | 86 | 134,574 | 80 | 118,374 | 75 | |||||||||||||||
| Foreign |
20,656 | 14 | 33,456 | 20 | 38,452 | 25 | |||||||||||||||
| 145,767 | 100 | 168,030 | 100 | 156,826 | 100 | (13 | ) | 7 | |||||||||||||
| Costs and Expenses: |
|||||||||||||||||||||
| Operating Expenses |
103,761 | 71 | 117,326 | 70 | 111,297 | 71 | |||||||||||||||
| Administrative and general |
25,452 | 18 | 27,527 | 16 | 23,310 | 15 | |||||||||||||||
| Depreciation and amortization |
7,150 | 5 | 7,053 | 4 | 4,853 | 3 | |||||||||||||||
| 136,363 | 94 | 151,906 | 90 | 139,460 | 89 | ||||||||||||||||
| Gains (Losses) on Asset Dispositions |
(197 | ) | — | 124 | — | 175 | — | ||||||||||||||
| Operating Income |
9,207 | 6 | 16,248 | 10 | 17,541 | 11 | (43 | ) | (7 | ) | |||||||||||
| Other Income (Expense): |
|||||||||||||||||||||
| Foreign currency gains (losses), net |
9 | — | (318 | ) | — | (61 | ) | — | |||||||||||||
| Other, net |
— | — | — | — | (1 | ) | — | ||||||||||||||
| Equity in Earnings of 50% or Less Owned Companies |
225 | — | 616 | — | 237 | — | |||||||||||||||
| Segment Profit |
9,441 | 6 | 16,546 | 10 | 17,716 | 11 | (43 | ) | (7 | ) | |||||||||||
Operating Revenues—2009 compared with 2008. Operating revenues decreased by $22.3 million in 2009 compared with 2008 primarily due to lower project management, emergency response and professional services revenues, partially offset by higher retainer services revenues. The decrease in project management services revenues was primarily due to higher activity levels in 2008 for pipeline repair projects in Eastern Europe and the Caucasus, and industrial services projects, primarily on the U.S. West coast. The decrease in emergency response revenues was primarily due to higher debris monitoring activity in 2008 relating to Hurricane Gustav. Operating revenues from consulting services were lower in 2009 primarily due to a decrease in platform recovery, planning and public assistance recovery services. The increase in retainer services revenues was primarily due to more vessel activity and higher fees from shipowners. Emergency response revenues accounted for 28% and 26% of Environmental Services’ operating revenues in 2009 and 2008, respectively.
57
Table of Contents
Operating Income—2009 compared with 2008. Operating income decreased by $7.0 million in 2009 compared with 2008. Operating expenses decreased in line with lower activity levels noted above. Administrative and general expenses decreased primarily due to lower compensation costs.
Operating Revenues—2008 compared with 2007. Operating revenues increased by $11.2 million in 2008 compared with 2007 primarily due to an increase in retainer and project management revenues partially offset by a decrease in emergency response revenues. The increase in retainer revenues was primarily due to higher revenues from facility and ship owners through the expansion of Environmental Services’ customer base and greater vessel activity. The increase in project management revenues was primarily due to the impact of a full year of activity for acquisitions completed in late 2007. The decrease in emergency response revenues was primarily due to significant response events occurring in 2007. Emergency response activities accounted for 26% and 30% of Environmental Services’ operating revenues in 2008 and 2007, respectively.
Operating Income—2008 compared with 2007. Operating income decreased by $1.3 million in 2008 compared with 2007. Operating expenses increased consistent with higher activity levels. Administrative and general expenses increased primarily due to increased overhead costs associated with acquisitions completed in late 2007. Depreciation and amortization expenses increased primarily due to higher amortization expense for intangible assets related to the 2007 acquisitions.
Commodity Trading and Logistics
The profitability of Commodity Trading and Logistics is affected by the availability and market prices of agricultural and energy commodities and the availability and costs of transportation and logistics services, including truck, barge, rail and ocean freight.
Commodity Trading and Logistics expects that population growth, rising standards of living and rising global demand for renewable fuels will continue to increase global demand for agricultural and energy commodities. However, from time to time, imbalances may exist between capacity and demand for rice, sugar and energy-related products in certain markets, which impacts whether, when and where to purchase, store, transport or sell these commodities and whether to change the location of Commodity Trading and Logistics inventories.
58
Table of Contents
Results of Operations
| 2009 | 2008 | 2007 | Percent Change | |||||||||||||||||||
| Amount | Percent | Amount | Percent | Amount | Percent | ’09/’08 | ’08/’07 | |||||||||||||||
| $ ’000 | % | $ ’000 | % | $ ’000 | % | % | % | |||||||||||||||
| Operating Revenues: |
||||||||||||||||||||||
| United States |
372,349 | 79 | 85,304 | 41 | 9,600 | 100 | ||||||||||||||||
| Foreign |
100,226 | 21 | 122,960 | 59 | — | — | ||||||||||||||||
| 472,575 | 100 | 208,264 | 100 | 9,600 | 100 | 127 | 2069 | |||||||||||||||
| Costs and Expenses: |
||||||||||||||||||||||
| Operating |
460,713 | 97 | 189,905 | 91 | 9,731 | 101 | ||||||||||||||||
| Administrative and general |
12,644 | 3 | 8,960 | 4 | 855 | 9 | ||||||||||||||||
| Depreciation and amortization |
29 | — | — | — | — | — | ||||||||||||||||
| 473,386 | 100 | 198,865 | 95 | 10,586 | 110 | |||||||||||||||||
| Operating Income (Loss) |
(811 | ) | — | 9,399 | 5 | (986 | ) | (10 | ) | (109 | ) | 1053 | ||||||||||
| Other Income (Expense): |
||||||||||||||||||||||
| Derivative gains (losses), net |
4,028 | 1 | (429 | ) | (1 | ) | 736 | 8 | ||||||||||||||
| Foreign currency gains, net |
498 | — | 70 | — | — | — | ||||||||||||||||
| Other, net |
25 | — | 8 | — | — | — | ||||||||||||||||
| Equity in Earnings (Losses) of 50% or Less Owned Companies |
(95 | ) | — | 173 | — | — | — | |||||||||||||||
| Segment Profit (Loss) |
3,645 | 1 | 9,221 | 4 | (250 | ) | (2 | ) | (60 | ) | 3788 | |||||||||||
Segment Profit (Loss)—2009 compared with 2008. Operating results declined in 2009 compared with 2008 primarily due to the decline in gross margin on rice sales, partially offset by improved results from ethanol sales and derivative activities. General and administrative expenses were higher in 2009 primarily due to higher provisions for doubtful accounts.
Segment Profit (Loss)—2008 compared with 2007. Operating results improved in 2008 compared with 2007 due to the commencement of rice trading activities and a full year of ethanol trading activity and the expansion into freight and logistics management. During 2008, Commodity Trading and Logistics made an equity investment in a sugar trading business that generated equity in earnings of $0.2 million.
Other Segment Profit (Loss)
| Percent Change | |||||||||||||
| 2009 | 2008 | 2007 | ’09/’08 | ’08/’07 | |||||||||
| $ ’000 | $ ’000 | $ ’000 | % | % | |||||||||
| Harbor and Offshore Towing Services |
7,091 | 9,572 | 2,970 | (26 | ) | 222 | |||||||
| Other, net |
(1,458 | ) | 957 | 781 | (252 | ) | 23 | ||||||
| Equity in Earnings (Losses) of 50% or Less Owned Companies |
(811 | ) | 285 | (35 | ) | (385 | ) | 914 | |||||
| 4,822 | 10,814 | 3,716 | (55 | ) | 191 | ||||||||
Harbor and Offshore Towing Services. Segment profit decreased in 2009 compared with 2008 primarily due to the conclusion of several long-term outside harbor contracts and lower harbor tug activity as a result of reductions in shipping activities in the ports in which Harbor and Offshore Towing Services operates. Segment
59
Table of Contents
profit increased in 2008 compared with 2007 primarily due to tariff increases and the commencement of terminal operations in St. Eustatius. These increases were partially offset by higher fuel costs and the cost of providing third-party equipment to support the start-up of the St. Eustatius terminal operation.
Other, net. Segment loss in 2009 resulted primarily from reductions in lending and leasing activities and increased expenditures for business development.
Equity in Earnings (Losses) of 50% or Less Owned Companies. Losses in 2009 were primarily due to an impairment charge taken on one of the Company’s joint ventures.
Corporate and Eliminations
| Percent Change | |||||||||||||||
| 2009 | 2008 | 2007 | ’09/’08 | ’08/’07 | |||||||||||
| $ ’000 | $ ’000 | $ ’000 | % | % | |||||||||||
| Corporate Expenses |
(33,355 | ) | (37,217 | ) | (33,250 | ) | 10 | (12 | ) | ||||||
| Eliminations |
306 | (279 | ) | 21 | 210 | (1429 | ) | ||||||||
| Operating Loss |
(33,049 | ) | (37,496 | ) | (33,229 | ) | 12 | (13 | ) | ||||||
| Other Income (Expense): |
|||||||||||||||
| Derivative gains (losses), net |
6,842 | (13,448 | ) | 13,027 | 151 | (203 | ) | ||||||||
| Foreign currency gains (losses), net |
3,555 | (7,344 | ) | 1,079 | 148 | (781 | ) | ||||||||
| Other, net |
91 | 266 | (859 | ) | (66 | ) | 131 | ||||||||
Corporate Expenses. Corporate expenses in 2008 included higher wage and benefit costs and higher severance and relocation expenses.
Foreign currency gains (losses), net. Foreign currency gains, net in 2009 were primarily due to a weakening of the U.S. dollar against foreign currencies underlying certain of the Company’s intercompany notes receivable. Foreign currency losses, net in 2008 were primarily due to a strengthening of the U.S. dollar against foreign currencies underlying certain of the Company’s intercompany notes receivable.
Derivative gains (losses), net. Derivative gains, net in 2009 were primarily due to gains on forward currency exchange option and future contracts and equity options. Derivative losses, net in 2008 were primarily due to losses on U.S. treasury notes and bond future and option contracts and forward currency exchange, option and future contracts partially offset by gains on equity options. Derivative gains, net in 2007 were primarily due to net gains on forward currency exchange contracts, options and futures contracts.
Other Income (Expense) not included in Segment Profit (Loss)
| Percent Change | |||||||||||||||
| 2009 | 2008 | 2007 | ’09’08 | ’08/’07 | |||||||||||
| $ ’000 | $ ’000 | $’000 | % | % | |||||||||||
| Interest income |
4,466 | 19,788 | 45,173 | (77 | ) | (56 | ) | ||||||||
| Interest expense |
(59,043 | ) | (59,816 | ) | (56,789 | ) | (1 | ) | 5 | ||||||
| Debt extinguishment gains (losses), net |
(5,587 | ) | 6,265 | 197 | (189 | ) | 3080 | ||||||||
| Marketable security gains (losses), net |
24,059 | 30,105 | (3,391 | ) | (20 | ) | 988 | ||||||||
| (36,105 | ) | (3,658 | ) | (14,810 | ) | (887 | ) | 75 | |||||||
60
Table of Contents
Interest income. Interest income decreased in 2009 and 2008 compared with previous years primarily due to lower invested cash balances and lower interest rates.
Interest expense. Interest expense was consistent in 2009 and 2008 as lower interest expense resulting from payments on the Company’s outstanding debt was offset by lower capitalized interest. Interest expense increased in 2008 compared with 2007 primarily due to lower capitalized interest partially offset by lower overall interest rates.
Debt extinguishment gains, net. During 2009, the Company purchased or redeemed outstanding debt that resulted in net losses on debt extinguishments of $5.6 million. The net losses resulted primarily from the settlement of the Company’s 2.875% Convertible Debentures, partially offset by gains on the purchase and redemption of the 9.5% Senior Notes. During 2008, the Company settled outstanding debt securities that resulted in net gains on debt extinguishments of $6.3 million, primarily from open market purchases at average prices below their principal amount and the recognition of unamortized premiums.
Marketable security gains (losses), net. In 2009, marketable security gains, net were primarily due to gains on long marketable security positions, partially offset by losses on short sales of marketable securities. In 2008, marketable security gains, net were primarily due to gains on short sales of marketable securities, partially offset by losses on the Company’s long marketable security positions. In 2007, marketable security losses, net were primarily due to short sale activities.
Income Taxes
The Company’s effective income tax rate in 2009, 2008 and 2007 was 38.4%, 34.8% and 37.2%, respectively.
Liquidity and Capital Resources
General
The Company’s ongoing liquidity requirements arise primarily from working capital needs, meeting its capital commitments and the repayment of debt obligations. In addition, the Company may use its liquidity to fund acquisitions, repurchase shares of SEACOR common stock, par value $0.01 per share (“Common Stock”), for treasury or to make other investments. Sources of liquidity are cash balances, marketable securities, construction reserve funds, Title XI reserve funds, cash flows from operations and borrowings under the Company’s revolving credit facility. From time to time, the Company may secure additional liquidity through the issuance of debt, shares of Common Stock, preferred stock, or a combination thereof.
Summary of Cash Flows
| 2009 | 2008 | 2007 | |||||||
| $ ’000 | $ ’000 | $ ’000 | |||||||
| Cash provided by or (used in): |
|||||||||
| Operating Activities |
297,618 | 291,624 | 385,901 | ||||||
| Investing Activities |
(101,700 | ) | (246,424 | ) | (109,019 | ) | |||
| Financing Activities |
(6,327 | ) | (298,460 | ) | (247,240 | ) | |||
| Effect of Exchange Rate Changes on Cash and Cash Equivalents |
871 | (8,603 | ) | 697 | |||||
| Net Increase (Decrease) in Cash and Cash Equivalents |
190,462 | (261,863 | ) | 30,339 | |||||
61
Table of Contents
Operating Activities
Cash flows provided by operating activities increased by $6.0 million in 2009 compared with 2008 primarily due to net proceeds received on marketable security and derivative transactions and higher deferrals of income tax obligations, partially offset by increases in working capital. Cash flows provided by operating activities decreased by $94.3 million in 2008 compared with 2007 primarily due to lower deferrals of income tax obligations and net purchases of marketable securities, partially offset by improved operating results before depreciation and gains on asset dispositions in the Company’s business segments and declines in working capital.
Effective October 1, 2008, the Company designated its investments in marketable equity and debt securities as trading securities and transferred securities of $72.9 million with net unrealized holding losses of $4.6 million from their previous available-for-sale designation. Cash flows from trading securities are reported within operating activities. Prior to this transfer, cash flows relating to available-for-sale securities were reported within investing activities. During 2009, cash used to purchase marketable security long positions was $31.3 million and cash used to cover marketable security short positions was $4.2 million. During 2009, cash received from the sale of marketable security long positions was $45.0 million and cash received upon entering into marketable security short positions was $16.6 million. During the three months ended December 31, 2008, cash used to purchase marketable security long positions was $23.2 million and cash used to cover marketable security short positions was $37.1 million. During the three months ended December 31, 2008, cash received from the sale of marketable security long positions was $20.5 million and cash received upon entering into marketable security short positions was $3.7 million.
Investing Activities
During 2009, capital expenditures were $180.0 million. Equipment deliveries included three offshore support vessels, three inland river towboats, eight helicopters and three liquid ocean tank barges. During 2008, capital expenditures were $428.5 million. Equipment deliveries included ten offshore support vessels, 19 dry cargo barges, eight liquid tank barges, four towboats, 25 helicopters, three liquid tank barges and four harbor tugs. During 2007, capital expenditures were $537.6 million. Equipment deliveries included 18 offshore support vessels, 52 inland river dry cargo barges, four liquid tank barges, 19 deck barges, 26 helicopters and five harbor tugs.
During 2009, proceeds from dispositions of property and equipment were $103.7 million. The Company sold 19 offshore support vessels, five inland river dry cargo barges, three inland river towboats, two helicopters, four harbor tugs and other equipment. In addition, two helicopters were scrapped and two helicopters were declared a total loss. During 2008, proceeds from dispositions of property and equipment were $171.7 million. The Company sold 21 offshore support vessels, two tankers, 41 inland river dry cargo barges, six liquid tank barges, seven helicopters and one harbor tug. During 2007, proceeds from dispositions of property and equipment were $449.7 million. The Company sold 44 offshore support vessels, 185 inland river dry cargo barges, eight liquid tank barges, two towboats and eleven helicopters.
As of December 31, 2009 and 2008, construction reserve funds of $273.2 million and $287.9 million, respectively, are classified as non-current assets as the Company has the intent and ability to use the funds to acquire equipment. During 2009, construction reserve funds account transactions included withdrawals of $70.0 million and deposits of $55.3 million. During 2008, construction reserve funds account transactions included withdrawals of $215.5 million and deposits of $116.0 million. During 2007, construction reserve funds account transactions included withdrawals of $169.7 million and deposits of $207.2 million.
The Company’s unfunded capital commitments as of December 31, 2009 consisted primarily of offshore support vessels, helicopters, inland river dry cargo barges and totaled $96.2 million, of which $88.3 million is payable during 2010 and the balance payable in 2011. Of the total unfunded capital commitments, $0.8 million may be terminated without further liability. Subsequent to December 31, 2009, the Company committed to purchase additional equipment for $115.2 million.
62
Table of Contents
During the nine months ended September 30, 2008, cash used in investing activities included $155.6 million to purchase marketable security long positions and $57.0 million to cover marketable security short positions. During the nine months ended September 30, 2008, cash provided by investing activities included $106.3 million received from the sale of marketable security long positions and $35.6 million received upon entering into marketable security short positions. During 2007, cash used in investing activities included $34.1 million to purchase marketable security long position and $73.4 million to cover marketable security short positions. During 2007, cash provided by investing activities included $39.1 million received from the sale of marketable security long positions and $89.2 million received upon entering into marketable security short positions.
During 2009, 2008 and 2007, the Company made investments in 50% or less owned companies of $27.5 million, $35.4 million and $31.6 million, respectively.
During 2007, other significant investing activities included net cash proceeds received from derivative transactions of $35.8 million, cash proceeds on the sale of investments in 50% or less owned companies of $30.7 million, and cash used for business acquisitions, net of cash acquired, of $44.6 million.
Financing Activities
Payments, Purchases, Redemptions and Retirements of Long-Term Debt and Capital Lease Obligations.
During 2009, the Company made payments on, purchased, redeemed or retired at maturity long-term debt and capital lease obligations of $312.2 million, which included:
| • | $79.7 million for the purchase and redemption of 2.875% Convertible Debentures and Senior Notes (as discussed below) |
| • | $84.3 million for the redemption of the remaining outstanding principal amount of the 9.5% Senior Notes (as discussed below) |
| • | $32.8 million upon the maturity of its 7.2% Senior Notes |
| • | $32.9 million for the conversion or redemption of the 2.875% Convertible Debentures |
| • | $33.5 million outstanding under the Company’s revolving credit facility and $49.0 million in other secured debt |
During 2008, the Company made principal payments on or purchased long-term debt and capital lease obligations of $144.3 million, which included:
| • | $98.5 million for the purchase of Senior Notes (as discussed below) |
| • | $32.9 million for repayments of capital lease obligations and $12.9 million in other secured debt. |
During 2007, the Company made principal payments on long-term debt and capital lease obligations of $40.5 million.
SEACOR’s Board of Directors previously approved a securities repurchase plan that authorizes the Company to repurchase shares of Common Stock and, up until their redemption in December 2009, its 2.875% Convertible Debentures. As of December 31, 2009, $102.2 million of the repurchase authority granted by SEACOR’s Board of Directors remained available and, on February 18, 2010, SEACOR’s Board of Directors increased the repurchase authority for a total expenditure of up to $250.0 million. During 2009, the Company’s security repurchases and acquisitions included:
| • | $3.8 million, in principal amount, of its 2.875% Convertible Debentures for $3.7 million |
| • | 572,700 shares of Common Stock acquired for treasury for an aggregate purchase price of $43.3 million |
| • | 33,876 shares of Common Stock for treasury for $2.6 million from Mr. Fabrikant as payment for payroll related tax obligations arising from his December 2009 exercise of 52,500 stock options that were due to expire in February 2010. These shares were purchased in accordance with the terms of the Company’s Share Incentive Plans and not pursuant to the repurchase authorizations granted by SEACOR’s Board of Directors. |
63
Table of Contents
During 2008, the Company acquired for treasury 2,824,717 shares of Common Stock for an aggregate purchase price of $240.1 million.
During 2007, the Company acquired for treasury 2,366,880 shares of Common Stock for an aggregate purchase price of $213.3 million.
SEACOR’s Board of Directors previously authorized the Company to purchase, separate from such authorization noted above, any or all of its 7.2% Senior Notes, its 5.875% Senior Notes, the 9.5% Senior Notes and its 7.375% Senior Notes. During 2009, the Company purchased for an aggregate purchase price of $76.0 million, the following:
| • | $37.0 million, in principal amount, of its 7.2% Senior Notes |
| • | $18.4 million, in principal amount, of its 5.875% Senior Notes |
| • | $20.2 million, in principal amount, of its 9.5% Senior Notes |
In addition, during 2009, the Company purchased or redeemed for $84.3 million, the remaining $81.7 million, in principal amount, outstanding of the 9.5% Senior Notes for $84.3 million.
During 2008, the Company purchased for an aggregate purchase price $98.5 million, the following:
| • | $64.7 million, in principal amount, of its 7.2% Senior Notes |
| • | $0.5 million, in principal amount, of its 5.875% Senior Notes |
| • | $36.6 million, in principal amount, of the 9.5% Senior Notes |
There were no repurchases in 2007.
Borrowing Activities. During 2009 and 2008, the Company borrowed $58.5 million and $100.0 million, respectively, under its revolving credit facility. As of December 31, 2009, the remaining availability under this facility was $322.9 million, net of issued letters of credit of $2.1 million. In addition, the Company had other outstanding letters of credit totaling $46.8 million with various expiration dates through 2012.
During 2009, the Company issued $250.0 million aggregate principal amount of its 7.375% Senior Notes due October 1, 2019 and received proceeds of $245.9 million. During 2009 the Company entered into other secured debt totaling $45.2 million and received proceeds of $44.9 million.
Short and Long-Term Liquidity Requirements
The recent economic conditions have created an unprecedented disruption in the credit markets. To date, the Company’s liquidity has not been materially impacted by the current credit environment and management does not expect that it will be materially impacted in the near-future. The Company anticipates it will continue to generate positive cash flows from operations and that these cash flows will be adequate to meet the Company’s working capital requirements. In support of the Company’s capital expenditure program and/or other liquidity requirements, the Company may use cash balances, sell securities, utilize construction reserve funds, sell additional vessels or other equipment, enter into sale and leaseback transactions for equipment, borrow under its revolving credit facility, issue debt or a combination thereof.
The Company’s long-term liquidity is dependent upon its ability to generate operating profits sufficient to meet its requirements for working capital, capital expenditures and a reasonable return on shareholders’ investment. The Company believes that earning such operating profits will permit it to maintain its access to favorably priced debt, equity or off-balance sheet financing arrangements. Management will continue to closely monitor the Company’s liquidity and the credit markets.
64
Table of Contents
Off-Balance Sheet Arrangements
On occasion, the Company and its partners will guarantee certain obligations on behalf of their joint ventures. As of December 31, 2009, the Company had the following guarantees in place:
The Company is a guarantor of 50% of the outstanding debt for one of its domestic offshore marine joint ventures. The amount guaranteed by the Company declines as principal payments are made and will terminate when the debt is repaid. The debt matures in 2015. As of December 31, 2009, the amount of the Company’s guarantee was $14.4 million.
The Company is a party to an international offshore marine joint venture which obtained bank debt to finance the acquisition of four offshore support vessels from the Company. The debt is secured by, among other things, a first preferred mortgage on the vessels. The bank also has the authority to require the parties to the joint venture to fund the uncalled capital commitments, as defined in the joint venture’s partnership agreement. In such event, the Company would be required to contribute its allocable share of uncalled capital, which was $3.1 million as of December 31, 2009. The Company manages the vessels on behalf of the joint venture and guarantees the outstanding charter receivables of the joint venture if a customer defaults in payment and the Company either fails to take enforcement action against the defaulting customer or fails to assign its right of recovery against the defaulting customer. As of December 31, 2009, the Company’s contingent guarantee of the joint venture’s outstanding charter receivables was $7.4 million.
The Company guaranteed up to $2.4 million with respect to amounts owing pursuant to a vessel charter agreement between one of the Company’s domestic offshore marine joint ventures and the owner of the chartered vessel. The amount of the Company’s guarantee declines over the life of the charter and terminates in 2011.
The Company guaranteed up to $0.5 million as security for the performance of a contract between an Environmental Services joint venture, in which the Company has a 50% interest, for the provision of oil spill response and related services in Turkey to the Baku-Tblisi-Ceyhan Crude Oil Export Pipeline. Provision of this performance guaranty was a condition to the contract in Turkey.
Contractual Obligations and Commercial Commitments
The following table summarizes the Company’s contractual obligations and other commercial commitments and their aggregate maturities as of December 31, 2009 (in thousands):
| Payments Due By Period | ||||||||||
| Total | Less than 1 Year |
1-3 Years | 3-5 Years | After 5 Years | ||||||
| $ ’000 | $ ’000 | $ ’000 | $ ’000 | $ ’000 | ||||||
| Contractual Obligations: |
||||||||||
| Long-term Debt and Capital Lease Obligations(1) |
1,134,820 | 84,339 | 318,415 | 211,322 | 520,744 | |||||
| Capital Purchase Obligations(2) |
96,182 | 88,296 | 7,886 | — | — | |||||
| Operating Leases(3) |
103,648 | 34,726 | 50,117 | 10,028 | 8,777 | |||||
| Purchase Obligations(4) |
244,686 | 244,686 | — | — | — | |||||
| Other(5) |
4,819 | 2,214 | 914 | 763 | 928 | |||||
| 1,584,155 | 454,261 | 377,332 | 222,113 | 530,449 | ||||||
| Other Commercial Commitments: |
||||||||||
| Joint Venture Guarantees(6) |
27,351 | 2,300 | 2,475 | 12,176 | 10,400 | |||||
| Letters of Credit |
48,833 | 47,165 | 1,668 | — | — | |||||
| 76,184 | 49,465 | 4,143 | 12,176 | 10,400 | ||||||
| 1,660,339 | 503,726 | 381,475 | 234,289 | 540,849 | ||||||
65
Table of Contents
| (1) | Maturities of the Company’s borrowings and interest payments pursuant to such borrowings are based on contractual terms with the exception of the Company’s Revolving Credit Facility. The Company has entered into interest rate swap agreements related to borrowings under its Revolving Credit Facility whereby it has converted its variable rate borrowings into fixed rate borrowings. For purposes of this table, the Company has assumed the fixed rates of interest in calculating its obligations. |
| (2) | Capital purchase obligations represent commitments for the purchase of property and equipment. These commitments are not recorded as liabilities on the Company’s consolidated balance sheet as of December 31, 2009 as the Company has not yet received the goods or taken title to the property. |
| (3) | Operating leases primarily include leases of vessels, helicopters, barges and other property that have a remaining term in excess of one year. |
| (4) | Purchase obligations primarily include future commodity purchase commitments for Commodity Trading and Logistics as of December 31, 2009. These commitments are for goods and services to be acquired in the ordinary course of business and are fulfilled by the Company’s vendors within a short period of time. |
| (5) | Other primarily includes deferred compensation arrangements, refundable deposits and statutorily defined severance obligations. |
| (6) | Joint venture of guarantees include guarantees of amounts owing by entities in which the Company owns 50% or less under charter arrangements with vessel owners, a loan agreement for the construction of two vessels, an uncalled capital commitment and an oil spill response service contract. In addition, the Company has provided a contingent guarantee of outstanding charter receivables for one of its joint ventures. In the case of guarantees relating to the charter arrangements and the loan agreement, obligations thereunder decline over time. The guarantees terminate at various dates through 2015. |
The Company’s operations expose it to the effects of inflation. In the event that inflation becomes a significant factor in the world economy, inflationary pressures could result in increased operating and financing costs.
Under United States law, “United States persons” are prohibited from business activities and contracts in certain countries, including Sudan and Iran. Relating to these prohibitions, Seabulk International, Inc., (“Seabulk”) a subsidiary of SEACOR acquired in July 2005, filed three reports with and submitted documents to the Office of Foreign Asset Control (“OFAC”) of the U.S. Department of Treasury in December 1999 and January and May 2002. One of the reports was also filed with the Bureau of Export Administration of the U.S. Department of Commerce. The reports and documents related to certain limited charters with third parties involving three Seabulk vessels that called in Sudan for several months in 1999 and January 2000 and charters with third parties involving several of Seabulk’s vessels that called in Iran in 1998. In March 2003, Seabulk received notification from OFAC that the case has been referred to its Civil Penalties Division. Should OFAC determine that these activities constituted violations of the laws or regulations, civil penalties, including fines, could be assessed against Seabulk or certain individuals who knowingly participated in such activity. The Company cannot predict the extent of such penalties; however, management does not believe the outcome of these matters will have a material impact on its consolidated financial position or its results of operations.
During 2006 and 2007, Marine Transportation Services (“MTS”) had two of its tankers retrofitted to a double-hull configuration in a foreign shipyard to enable each of them to continue to transport crude oil and petroleum products beyond their OPA 90 mandated retirement dates in 2011. Both vessels operate in the U.S. coastwise trade that, under the Shipping Acts, is restricted to vessels built or rebuilt in the United States. In May 2005, MTS received a determination from the U.S. Coast Guard (“USCG”), which administers the United States build requirements of the Shipping Acts, concluding the retrofit work would not constitute a foreign rebuilding and therefore would not jeopardize the tankers’ eligibility to operate in the U.S. coastwise trade. MTS completed the retrofit work in the foreign shipyard in reliance upon the USCG’s determination, which MTS believes was correct and in accord with the USCG’s long-standing regulations and interpretations. On July 9, 2007, a U.S. shipbuilders trade association and two operators of tankers in the U.S. coastwise trade (“Shipbuilders”) commenced a civil action in the U.S. District Court for the Eastern District of Virginia, Shipbuilders Council of America, Inc., et al. v. U.S. Department of Homeland Security, et al. , No. 1:07cv665 (E.D. Va.) (the “SB Trader
66
Table of Contents
Litigation”), in which they sought to have the court set aside the USCG’s determination and direct the USCG to revoke the coastwise license of one of the two retrofitted tankers, the Seabulk Trader. MTS intervened in the action to assist the USCG in defending its determination. On April 24, 2008, the Court issued a Memorandum Opinion granting a motion for summary judgment by Shipbuilders setting aside the USCG’s determination and remanding the matter to the USCG for further proceedings with instructions to revoke the coastwise endorsement of the Seabulk Trader. On April 30, 2008, MTS appealed the decision to the U.S. Court of Appeals for the Fourth Circuit (the “Court of Appeals”), and the lower court’s decision was stayed pending appeal, subject to certain terms (which MTS has also separately appealed). Those terms require that MTS pay to the plaintiffs 12.5% of the revenue generated by the Seabulk Trader from November 7, 2008 in the event that the Court of Appeals affirms the lower court’s decision to revoke its coastwise endorsement (the “Undertaking”). On July 2, 2008, Shipbuilders commenced a second civil action in the U.S. District Court for the Eastern District of Virginia, entitled Shipbuilders Council of America, Inc., et al. v. U.S. Department of Homeland Security, et al., No. 1:08cv680 (E.D. Va.) (the “SB Challenge Litigation”), alleging essentially identical claims as those asserted in the SB Trader Litigation against MTS’s second retrofitted tanker, the Seabulk Challenge. MTS has intervened in the SB Challenge Litigation that was stayed pending the decision of the Court of Appeals in the SB Trader Litigation. In September 2009, the Court of Appeals reversed the District Court, holding that the USCG’s interpretation was correct and that the District Court erred in requiring MTS to provide the Undertaking. On January 19, 2010, the District Court: (i) vacated its April 24, 2008 Order to the extent it directed the USCG to revoke the coastwise endorsement for the Seabulk Trader; (ii) vacated its November 14, 2008 Order providing for the Undertaking; and (iii) remanded the matter to the USCG for further proceedings to reconsider the decision to grant a coastwise endorsement of the Seabulk Trader consistent with the opinion of the Court of Appeals. The loss of coastwise eligibility for its two retrofitted tankers could adversely affect the Company’s financial condition and its results of operations. The aggregate carrying value of the Company’s two retrofitted tankers was $53.1 million as of December 31, 2009 and such tankers contributed operating revenues of $20.2 million during the year ended December 31, 2009.
Certain subsidiaries of the Company are participating employers in an industry-wide, multi-employer, defined benefit pension fund, the United Kingdom Merchant Navy Officers Pension Fund (“MNOPF”). Under the direction of a court order, any deficit of the MNOPF is to be remedied through funding contributions from all participating employers. The Company’s participation relates to officers employed between 1978 and 2002 by SEACOR’s Stirling group of companies (which had been acquired by SEACOR in 2001) and its predecessors. Based on an actuarial valuation of the MNOPF in 2003, the Company was invoiced and expensed $4.4 million in 2005, representing the Company’s allocated share of a total funding deficit of $412.0 million. Subsequent to this invoice, the pension fund trustees determined that $49.0 million of the $412.0 million deficit was deemed uncollectible due to the non-existence or liquidation of certain participating employers and the Company was invoiced and expensed $0.6 million in March 2007 for its allocated share of the uncollectible deficit. Based on an actuarial valuation of the MNOPF in 2006, the Company was invoiced and expensed $3.9 million in September 2007, representing the Company’s allocated share of an additional funding deficit of $332.6 million. The preliminary results of the most recent actuarial valuation of the MNOPF in 2009 indicated that an additional net funding deficit of $720.0 million (£450.0 million) had developed since the previous actuarial valuation in 2006 and the Company estimates its allocated share of the deficit at $8.64 million (£5.4 million). When the Company is invoiced for its share, it will recognize payroll related operating expenses in the periods invoices are received. Depending on the results of the most recent and future actuarial valuations, it is possible that the MNOPF will experience further funding deficits, requiring the Company to recognize payroll related operating expenses in the periods invoices are received.
A subsidiary of the Company is a participating employer in an industry-wide, multi-employer, defined benefit pension fund, the United Kingdom Merchant Navy Ratings Pension Fund (“MNRPF”). The Company’s participation relates to ratings employed between 1978 and 2001 by SEACOR’s Stirling group of companies (which had been acquired by SEACOR in 2001) and its predecessors. Based on an actuarial valuation in March 2008, the MNRPF has an accumulated funding deficit of $284.2 million. No decision has yet been reached as to how the deficit will be recovered, but the Company expects it is likely that participating employers will be
67
Table of Contents
invoiced for their allocated share, at which time the Company would recognize payroll related operating expenses. The Company estimates its allocated share of the uninvoiced deficit to be approximately $1.0 million. Depending on the results of the most recent and future actuarial valuations, it is possible that the MNRPF will experience further funding deficits, requiring the Company to recognize payroll related operating expenses in the periods invoices are received.
On June 12, 2009, a purported civil class action was filed against SEACOR, Era Group Inc., Era Aviation, Inc., Era Helicopters LLC and two other defendants (collectively the “Defendants”) in the U.S. District Court for the District of Delaware, Superior Offshore International, Inc. v. Bristow Group Inc., et al., No. 09-CV-438 (D.Del.). SEACOR acquired Era Group Inc., Era Aviation, Inc., and Era Helicopters LLC in December 2004. The complaint alleges that the Defendants violated federal antitrust laws by conspiring with each other to raise, fix, maintain or stabilize prices for offshore helicopter services in the U.S. Gulf of Mexico during the period January 2001 to December 2005. The purported class of plaintiffs includes all direct purchasers of such services and the relief sought includes compensatory damages and treble damages. The Company is unable to estimate the potential exposure, if any, resulting from these claims but believes they are without merit and intends to vigorously defend the action. On September 4, 2009, the Defendants filed a motion to dismiss the complaint. The District Court has yet to rule on that motion.
SEACOR Marine, LLC, a subsidiary of the Company, has two pending actions against it for alleged breaches of the California Wage Act. Bailey v. SEACOR Marine, LLC, is a class action filed on behalf of the crew members (current and terminated) who worked on the Company’s vessels while they were based in California. Schoenfeld v. SEACOR Marine, LLC, is an individual claim filed by Mr. Schoenfeld, even though he himself is a member of the class described in the Bailey case. At this early stage, no definitive estimate can be made as to the probability or magnitude of exposure in the cases. Outside legal counsel’s initial investigation suggests that there is a substantial legal question as to whether federal maritime law preempts the application of state law to the SEACOR vessels in question. If the court decides California wage laws do apply, and a class is certified, there may be financial exposure. Mediation is scheduled for the end of February 2010, and the Company intends to vigorously defend against these claims.
In the normal course of its business, the Company becomes involved in various other litigation matters including, among other things, claims by third parties for alleged property damages and personal injuries. Management has used estimates in determining the Company’s potential exposure to these matters and has recorded reserves in its financial statements related thereto as appropriate. It is possible that a change in the Company’s estimates related to these exposures could occur, but the Company does not expect such changes in estimated costs would have a material effect on the Company’s consolidated financial position or its results of operations.
The Company manages barge pools as part of its Inland River Services segment. Pursuant to the pooling agreements, operating revenues and expenses of participating barges are combined and the net results are allocated on a pro-rata basis based on the number of barge days contributed by each participant. Mr. Charles Fabrikant, the Chief Executive Officer of SEACOR, companies controlled by Mr. Fabrikant and trusts for the benefit of Mr. Fabrikant’s two children, own barges that participate in the barge pools managed by the Company. Mr. Fabrikant and his affiliates were participants in the barge pools prior to the acquisition of SCF Marine Inc. by SEACOR. In the years ended December 31, 2009, 2008 and 2007, Mr. Fabrikant and his affiliates earned $1.0 million, $1.7 million and $1.7 million, respectively, of net barge pool results (after payment of $0.1 million, $0.1 million and $0.1 million, respectively, in management fees to the Company). As of December 31, 2009, 2008 and 2007, the Company owed Mr. Fabrikant and his affiliates $0.4 million, $0.7 million and $0.5 million, respectively, for undistributed net barge pool results. Mr. Fabrikant and his affiliates participate in the barge pools on the same terms and conditions as other pool participants who are unrelated to the Company.
During the year ended December 31, 2008, the Company purchased a barge from Mr. Fabrikant’s sister for $0.5 million and sold it to Inland River Services’ South American joint venture. The proceeds received by
68
Table of Contents
Mr. Fabrikant’s sister were deposited into a construction reserve fund established by her that is managed by the Company. Additionally, during the year ended December 31, 2008, the Company, on behalf of Mr. Fabrikant, sold three barges owned by him for scrap, for $0.3 million.
Critical Accounting Policies and Estimates
General. The preparation of financial statements in conformity with accounting principles generally accepted in the United States of America requires management to make estimates and assumptions that affect the reported amounts of assets and liabilities and disclosure of contingent assets and liabilities at the date of the financial statements and the reported amounts of revenues and expenses during the reporting period. Such estimates include those related to deferred revenues, allowance for doubtful accounts, useful lives of property and equipment, impairments, income tax provisions and certain accrued liabilities. Actual results could differ from those estimates and those differences may be material.
Revenue Recognition. The Company recognizes revenue when it is realized or realizable and earned. Revenue is realized or realizable and earned when persuasive evidence of an arrangement exists, delivery has occurred or services have been rendered, the price to the buyer is fixed or determinable, and collectability is reasonably assured. Revenue that does not meet this criteria is deferred until the criteria are met.
The Company’s Offshore Marine Services segment earns and recognizes revenues primarily from the time charter and bareboat charter of vessels to customers based upon daily rates of hire. Under a time charter, Offshore Marine Services provides a vessel to a customer and is responsible for all operating expenses, typically excluding fuel. Under a bareboat charter, Offshore Marine Services provides the vessel to the customer and the customer assumes responsibility for all operating expenses and risk of operation. Vessel charters may range from several days to several years. Revenues from time charter and bareboat charter are recorded and recognized as services are provided. In the U.S. Gulf of Mexico, time charter durations and rates are typically established in the context of master service agreements, which govern the terms and conditions of charter.
The Company’s Marine Transportation Services segment earns revenue from the time charter, bareboat charter and voyage charter of vessels and under contracts of affreightment. Under a time charter, Marine Transportation Services provides a vessel to a customer and is responsible for all operating expenses, typically excluding fuel. Under a bareboat charter, Marine Transportation Services provides the vessel to a customer and the customer assumes responsibility for all operating expenses and risk of operation. Revenues from time charter and bareboat charter are recognized as services are provided and are billed monthly in advance. Voyage contracts are contracts to carry cargos on a single voyage basis regardless of time to complete. Contracts of affreightment are contracts for cargos that are committed on a multi-voyage basis for various periods of time with minimum and maximum cargo tonnages specified over the period at a fixed or escalating rate per ton. Revenues for voyage contracts and contracts of affreightment are recognized over the progress of the voyage while the related costs are expensed as incurred.
The Company’s Inland River Services segment earns revenues primarily from voyage affreightment contracts whereby customers are charged an established rate per ton to transport cargo from point to point. Revenues from voyage affreightment contracts are generally recognized over the progress of the voyage while the related costs are expensed as incurred. Certain of Inland River Services’ barges are operated in barge pools with other barges owned by third parties from whom Inland River Services earns and recognizes a management fee as the services are rendered. Pursuant to the pooling agreements, operating revenues and expenses of participating barges are combined and the net results are allocated on a pro-rata basis based on the number of barge days contributed by each participant. In addition, revenues are earned from equipment chartered to third parties and from the storage and demurrage of cargos associated with affreightment activities. In both of these cases, revenues are recognized as services are rendered. Inland River Services’ tank farm and handling facility earns revenues through rental and throughput charges. Rental revenues are recognized ratably over the rental period while throughput charges are recognized as product volume moves through the facility.
69
Table of Contents
The Company’s Aviation Services segment charters its helicopters to utility and oil and gas customers primarily through master service agreements, term contracts, day-to-day charter arrangements and leases. Master service agreements require incremental payments above a fixed rental fee based upon flight hours flown, have fixed terms ranging from one month to five years, and generally are cancelable upon 30 days notice. Term contracts and day-to-day charter arrangements are generally non-cancelable without cause and call for a combination of a monthly or daily fixed rental fee plus a charge based on hours flown. Day-to-day charter arrangements are generally based on either an hourly or daily rate. Leases can be either dry, providing only the equipment, or wet, providing equipment and personnel. Fixed rental fee revenues are recognized ratably over the contract term. Usage or hourly based revenues are recognized as hours are flown. Aviation Services’ air medical activities are provided under contracts with hospitals that typically include either a fixed monthly and hourly rate structure or a fee per completed flight. Fixed monthly revenues are recognized ratably over the month while per hour or per flight based revenues are recognized as hours are flown or flights are completed. With respect to flightseeing activities, Aviation Services allocates block space to cruise lines and sells seats directly to customers with revenues for helicopter usage being recognized as the services are performed.
The Company’s Environmental Services segment earns revenues primarily from emergency response, retainer, consulting and training, project management and remediation services. Emergency response revenues are recognized as services are provided and are dependent on the magnitude and number of individual responses. Retainer agreements with vessel owners generally range from one to three years while retainer agreements with facility owners can be as long as ten years. Such retainer fees are generally recognized ratably over the term of the contract. Consulting and training services fees are recognized as the services are provided based on the contract terms. Project management and remediation services are provided on a time and material basis with revenues recognized as the services are provided or on a fixed fee bid basis with revenues and expenses recognized upon completion of the contract.
The Company’s Commodity Trading and Logistics segment earns revenues from the sale of rice, sugar and renewable fuels (primarily ethanol), the rental of tank storage, and through voyage affreightment contracts on leased-in liquid tank barges and towboats. Revenues from rice, sugar and renewable fuel sales are recorded when title transfers to the buyer, typically when cash is received. Revenues from the rental of tank storage are recognized ratably over the lease periods. Revenues from voyage affreightment contracts are generally recognized over the progress of the voyage while the related costs are expensed as incurred.
Trade Receivables. Customers of Offshore Marine Services, Marine Transportation Services and Aviation Services are primarily major independent oil and gas exploration and production companies. Customers of Inland River Services are primarily major agricultural and industrial companies based within the United States. Oil spill, emergency response and remediation services are provided by Environmental Services to domestic and international shippers, major oil companies, independent exploration and production companies, pipeline and transportation companies, power generating operators, industrial companies, airports and state and local government agencies. Customers of Commodity Trading and Logistics include major agricultural and industrial companies, major independent oil and gas production companies, foreign governments and local distributors. All customers are granted credit on a short-term basis and related credit risks are considered minimal. The Company routinely reviews its trade receivables and makes provisions for probable doubtful accounts; however, those provisions are estimates and actual results could differ from those estimates and those differences may be material. Trade receivables are deemed uncollectible and removed from accounts receivable and the allowance for doubtful accounts when collection efforts have been exhausted.
Derivative Instruments. The Company accounts for derivatives through the use of a fair value concept whereby all of the Company’s derivative positions are stated at fair value. Realized and unrealized gains and losses on derivatives not designated as hedges are reported in income as derivative gains (losses), net. Realized and unrealized gains and losses on derivatives designated as fair value hedges are recognized as corresponding increases or decreases in the fair value of the underlying hedged item to the extent they are effective, with any ineffective portion reported in income as derivative gains (losses), net. Realized and unrealized gains and losses on derivatives designated as cash flow hedges are reported as a component of other comprehensive income to the
70
Table of Contents
extent they are effective and reclassified into earnings on the same line item associated with the hedged transaction and in the same period the hedged transaction affects earnings. Any ineffective portion of cash flow hedges are reported in income as derivative gains (losses), net. Realized and unrealized gains and losses on derivatives designated as cash flow hedges that are entered into by the Company’s equity method investees are also reported as a component of the Company’s other comprehensive income in proportion to the Company’s ownership percentage in the investee, with reclassifications and ineffective portions being included in equity in earnings of 50% or less owned companies.
Inventories. Inventories, which consist primarily of fuel and fuel oil in the Company’s Offshore Marine Services, Marine Transportation Services and Inland River Services segments, spare parts and fuel in the Company’s Aviation Services segment, and ethanol and rice in the Company’s Commodity Trading and Logistics segment, are stated at the lower of cost (using the first-in, first-out or average cost methods) or market. The Company records write-downs, as needed, to adjust the carrying amount of inventories to the lower of cost or market.
Property and Equipment. Equipment, stated at cost, is depreciated using the straight line method over the estimated useful life of the asset to an estimated salvage value. With respect to each class of asset, the estimated useful life is typically based upon a newly built asset being placed into service and represents the point at which it is typically not justifiable for the Company to continue to operate the asset in the same or similar manner. From time to time, the Company may acquire older assets which have already exceeded the Company’s useful life policy, in which case the Company depreciates such assets based on its best estimate of remaining useful life, typically the next survey or certification date.
As of December 31, 2009, the estimated useful life (in years ) of each of the Company’s major classes of new equipment was as follows:
| Offshore support vessels |
20 | |
| U.S.-flag tankers(1) |
25 | |
| Inland river dry cargo and deck barges |
20 | |
| Inland river liquid tank barges |
25 | |
| Inland river towboats |
25 | |
| Helicopters |
12 | |
| Harbor and offshore tugs |
25 | |
| Ocean liquid tank barges |
25 |
| (1) | Subject to Oil Pollution Act of 1990 (“OPA 90”) requirements. |
Equipment maintenance and repair costs and the costs of routine drydock inspections performed on vessels are charged to operating expense as incurred. Expenditures that extend the useful life or improve the marketing and commercial characteristics of equipment as well as major improvements to other properties are capitalized. Certain interest costs incurred during the construction of equipment are capitalized as part of the assets’ carrying values and are amortized over such assets estimated useful lives.
Impairment of Long-Lived Assets. The Company performs an impairment analysis of long-lived assets used in operations, including intangible assets, when indicators of impairment are present. If the carrying value of the assets is not recoverable, as determined by the estimated undiscounted cash flows, the carrying value of the assets is reduced to fair value. Generally, fair value is determined using valuation techniques, such as expected discounted cash flows or appraisals, as appropriate.
Impairment of 50% or Less Owned Companies. The Company performs regular reviews of each investee’s financial condition, the business outlook for its products and services, and its present and projected results and cash flows. When an investee has experienced consistent declines in financial performance or difficulties in
71
Table of Contents
raising capital to continue operations, and when the Company expects the decline to be other-than-temporary, the investment is written down to fair value. Actual results may vary from estimates due to the uncertainty regarding the projected financial performance of investees, the severity and expected duration of declines in value, and the available liquidity in the capital markets to support the continuing operations of the investees in which the Company has investments.
Goodwill. Goodwill is recorded when the purchase price paid for an acquisition exceeds the fair value of net identified tangible and intangible assets acquired. The Company performs an annual impairment test of goodwill and further periodic tests to the extent indicators of impairment develop between annual impairment tests. The Company’s impairment review process compares the fair value of the reporting unit to its carrying value, including the goodwill related to the reporting unit. To determine the fair value of the reporting unit, the Company uses a discounted future cash flow approach that uses estimates for revenues, costs and appropriate discount rates, among others. These estimates are reviewed each time the Company tests goodwill for impairment and are typically developed as part of the Company’s routine business planning and forecasting process. While the Company believes its estimates and assumptions are reasonable, variations from those estimates could produce materially different results.
Self-insurance Liabilities. The Company maintains hull, liability and war risk, general liability, workers compensation and other insurance customary in the industries in which it operates. Most of the insurance is obtained through SEACOR sponsored programs, with premiums charged to participating businesses based on insured asset values. Both the marine hull and liability policies have significant annual aggregate deductibles. Marine hull annual aggregate deductibles are accrued as claims are incurred by participating businesses and proportionately shared among the participating businesses. Marine liability annual aggregate deductibles are accrued based on historical loss experience and actual claims incurred. The Company also maintains self-insured health benefit plans for its participating employees. Exposure to the health benefit plans are limited by maintaining stop-loss and aggregate liability coverage. To the extent that estimated self-insurance losses, including the accrual of annual aggregate deductibles, differ from actual losses realized, the Company’s insurance reserves could differ significantly and may result in either higher or lower insurance expense in future periods.
Income Taxes. Deferred income tax assets and liabilities have been provided in recognition of the income tax effect attributable to the book and tax basis differences of assets and liabilities reported in the accompanying consolidated financial statements. Deferred tax assets or liabilities are provided using the enacted tax rates expected to apply to taxable income in the periods in which they are expected to be settled or realized. Interest and penalties relating to uncertain tax positions are recognized in interest expense and administrative and general, respectively. The Company records a valuation allowance to reduce its deferred tax assets if it is more likely than not that some portion or all of the deferred tax assets will not be realized.
| Item 7A. | Quantitative and Qualitative Disclosures about Market Risk |
The Company has foreign currency exchange risks primarily related to its vessel operations that are conducted from ports located in the United Kingdom where its functional currency is the pound sterling. Net consolidated assets of £24.9 million ($39.6 million) and £18.6 million ($27.0 million) are included in the Company’s consolidated balance sheets as of December 31, 2009 and 2008, respectively. In addition, SEACOR has provided net cash advances and loans to these operations of £17.3 million ($27.5 million) and £15.6 million ($22.6 million) as of December 31, 2009 and 2008, respectively. SEACOR expects payment on these advances and loans in the foreseeable future. A 10% weakening in the exchange rate of the pound sterling against the U.S. dollar as of December 31, 2009 would reduce other comprehensive income by approximately $2.6 million, net of tax, due to translation and would reduce income by approximately $1.8 million, net of tax, due to foreign currency losses on the revaluing of intercompany advance and loan transactions.
As of December 31, 2009, the Company held marketable securities with a fair value of $68.1 million, including $48.0 million in fixed income investments consisting of corporate debt securities, municipal bonds, and foreign government bonds and $20.1 million in equity securities. As of December 31, 2008, the Company held
72
Table of Contents
marketable securities with a fair value of $53.8 million, including $31.1 million in fixed income investments consisting of corporate debt securities, municipal bonds, and foreign government bonds and $22.7 million in equity securities. From time to time, the Company may increase its level of investment in fixed income securities which have included U.S. government bonds, foreign government bonds, state and municipal bonds, and corporate notes with maturities ranging from a few months to many years. The fair value of such investments fluctuates based on market interest rates and the creditworthiness of the issuers of the securities. When making substantial investments in fixed income securities, the Company manages its risk associated with these investments by analyzing the creditworthiness of issuers and utilizing other techniques that may include maintaining a ladder of maturities. The Company’s investments in equity securities primarily include positions in energy, marine, transportation and other related businesses. As of December 31, 2009, a 10% decline in the value of marketable securities would reduce income by $4.4 million, net of tax.
The Company held positions in short sales of marketable equity securities with a fair value of $18.4 million and $2.9 million as of December 31, 2009 and 2008, respectively. The Company’s short sales of marketable equity securities primarily include positions in energy, marine, transportation and other related businesses. A 10% increase in the value of equity securities underlying the short sale positions of the Company as of December 31, 2009 would reduce income by $1.2 million, net of tax.
The Company held positions in publicly traded equity options that may convey to the Company a right or obligation to engage in a future transaction with respect to the underlying equity security. The Company’s investment in equity options primarily includes positions in energy, marine, transportation and other related businesses. These investments have short-term maturities and their market values fluctuate based on changes in the price and volatility of the underlying security, the strike price of the option and the time to expiration. The fair market value of the Company’s held positions in publicly traded equity options and equity indices was a recorded liability of $0.8 million as of December 31, 2009.
The Company’s outstanding debt is primarily in fixed interest rate instruments. Although the fair value of these debt instruments will vary with changes in interest rates, the Company’s operations are not significantly affected by interest rate fluctuations. As of December 31, 2009, the Company had $125.0 million of variable rate borrowings, based on LIBOR, under its revolving credit facility. During the year ended December 31, 2009, the Company entered into various interest rate swap agreements, designated as cash flow hedges, to fix the interest rate on these borrowings at an average rate of 3.1%. Additionally, as of December 31, 2009, the Company had other variable rate debt totaling $26.8 million due 2012 which calls for the Company to pay interest based on LIBOR plus a 300 basis point margin, subject to a floor of 4.5%, and resets quarterly. As of December 31, 2009, the interest rate was 4.5%.
During the year ended December 31, 2009, the Company entered into interest rate swap agreements, other than those designated as cash flow hedges mentioned above, with a notional value of $76.5 million. These agreements call for the Company to pay a fixed interest rate ranging from 1.79% to 2.59% and receive interest payments based on LIBOR. As of December 31, 2009, the fair market value of the Company’s held positions in these interest rate swap agreements was a recorded liability of $0.3 million.
The Company has entered into and settled various positions in forward currency exchange, option and future contracts with respect to the pound sterling, euro, yen, rupee, Singapore dollar, won, Taiwanese dollar, Thai baht, ringgit, dinar, Mexican peso, renminbi, dirham, Brazilian real and rand. These contracts enable the Company to buy these currencies in the future at fixed exchange rates, which could offset possible consequences of changes in foreign exchange rates with respect to the Company’s business conducted in Europe, Africa, Latin America, the Middle East and Asia. As of December 31, 2009, the outstanding forward currency exchange contract positions translate to a net purchase of foreign currencies with an aggregate U.S. dollar equivalent of $55.4 million. An adverse change of 10% in the underlying foreign currency exchange rates would reduce income by $1.0 million, net of tax. As of December 31, 2009, the Company had designated certain of its forward currency exchange contracts with notional values of €16.0 million as fair value hedges for capital commitments.
73
Table of Contents
The Company has entered into and settled positions in various commodity swap, option and future contracts (primarily natural gas, crude oil, ethanol, rice and sugar) pursuant to which the Company net settles its position based upon the difference between the contract price and the market price. The general purpose of these transactions is to provide value to the Company should there be a sustained decline in the price of commodities that over time could lead to a reduction in the market values and cash flows of the Company’s offshore, inland river and commodity trading and logistics businesses. As of December 31, 2009, the fair value of these exchange based commodity contracts was a recorded liability of $2.3 million.
The Company also enters into various future contracts with unrelated third parties to buy and sell commodities. These contracts are non-exchange traded and typically result in physical delivery of the underlying commodity. As of December 31, 2009, the fair value of these non-exchange based commodity contracts was a recorded asset of $2.6 million. Additionally, the Company carried inventory (primarily ethanol) relating to the physical delivery of product from these transactions with a fair value of $21.1 million as of December 31, 2009. The Company also carried rice inventory of $27.5 million as of December 31, 2009.
The Company has entered into and settled various positions in U.S. treasury notes and bonds via futures or options on futures and rate-lock agreements tied to U.S. treasury notes. The Company settles these positions based upon the difference between the contract price and the market price. The general purpose of these transactions is to provide value to the Company should the price of U.S. treasury notes and bonds decline, leading to generally higher interest rates that if sustained over time, might lead to higher interest costs for the Company. As of December 31, 2009, the fair value of these positions was a recorded liability of $0.1 million.
| ITEM 8. | FINANCIAL STATEMENTS AND SUPPLEMENTARY DATA |
The consolidated financial statements and related notes are included in Part IV of this Form 10-K and incorporated herein by reference.
| ITEM 9. | CHANGES IN AND DISAGREEMENTS WITH ACCOUNTANTS ON ACCOUNTING AND FINANCIAL DISCLOSURE |
None.
| ITEM 9A. | CONTROLS AND PROCEDURES |
Evaluation of Disclosure Controls and Procedures
With the participation of the Company’s principal executive officer and principal financial officer, management evaluated the effectiveness of the Company’s disclosure controls and procedures (as defined in Rules 13a-15(e) and 15d-15(e) under the Securities Exchange Act of 1934, as amended (the “Exchange Act”)), as of December 31, 2009. Based on their evaluation, the Company’s principal executive officer and principal financial officer concluded that the Company’s disclosure controls and procedures were effective as of December 31, 2009.
There have been no changes in the Company’s internal control over financial reporting (as defined in Rules 13a-15(f) and 15d-15(f) under the Exchange Act) that occurred during 2009 that has materially affected, or is reasonably likely to materially affect, the Company’s internal control over financial reporting.
Set forth in Part IV of this Annual Report and incorporated herein by reference are: Management’s Report on Internal Control over Financial Reporting and the Report of Independent Registered Public Accounting Firm on Internal Control over Financial Reporting.
| ITEM 9B. | OTHER INFORMATION |
None.
74
Table of Contents
| ITEM 10. | DIRECTORS AND EXECUTIVE OFFICERS OF THE REGISTRANT |
The information required to be disclosed pursuant to this Item 10 is incorporated in its entirety herein by reference to the Company’s definitive proxy statement to be filed with the Commission pursuant to Regulation 14A within 120 days after the end of the Company’s last fiscal year.
NYSE Annual Certification. The Chief Executive Officer of the Company has previously submitted to the NYSE the annual certification required by Section 303A.12(a) of the NYSE Listed Company Manual, and there were no qualifications to such certification. SEACOR Holdings Inc. has filed the certifications of its Chief Executive Officer and Chief Financial Officer required by Section 302 of the Sarbanes-Oxley Act of 2002 with the SEC as exhibits to this Form 10-K.
| ITEM 11. | EXECUTIVE COMPENSATION |
The information required to be disclosed pursuant to this Item 11 is incorporated in its entirety herein by reference to the Compensation Disclosure and Analysis portion of the Company’s definitive proxy statement to be filed with the Commission pursuant to Regulation 14A within 120 days after the end of the Company’s last fiscal year.
| ITEM 12. | SECURITY OWNERSHIP OF CERTAIN BENEFICIAL OWNERS AND MANAGEMENT AND RELATED STOCKHOLDER MATTERS |
The information required to be disclosed pursuant to this Item 12 is incorporated in its entirety herein by reference to the Security Ownership of Certain Beneficial Owners and Management portion of the Company’s definitive proxy statement to be filed with the Commission pursuant to Regulation 14A within 120 days after the end of the Company’s last fiscal year.
| ITEM 13. | CERTAIN RELATIONSHIPS AND RELATED TRANSACTIONS |
The information required to be disclosed pursuant to this Item 13 is incorporated in its entirety herein by reference to the Certain Relationships and Related Transactions portion of the Company’s definitive proxy statement to be filed with the Commission pursuant to Regulation 14A within 120 days after the end of the Company’s last fiscal year.
| ITEM 14. | PRINCIPAL ACCOUNTANT FEES AND SERVICES |
The information required to be disclosed pursuant to this Item 14 is incorporated in its entirety herein by reference to the Ratification or Appointment of Independent Auditors portion of the Company’s definitive proxy statement to be filed with the Commission pursuant to Regulation 14A within 120 days after the end of the Company’s last fiscal year.
75
Table of Contents
| ITEM 15. | EXHIBITS AND FINANCIAL STATEMENT SCHEDULES |
| (a) | Documents filed as part of this report: |
1. and 2. Financial Statements and Financial Statement Schedules – See Index to Consolidated Financial Statements and Financial Statement Schedule of this Form 10-K
3. Exhibits
| Exhibit |
Description | |
| 3.1* | Restated Certificate of Incorporation of SEACOR SMIT Inc. (incorporated herein by reference to Exhibit 3.1 (a) of the Company’s Quarterly Report on Form 10-Q for the fiscal quarter ended June 30, 1997 and filed with the Commission on August 14, 1997). | |
| 3.2* | Certificate of Amendment to the Restated Certificate of Incorporation of SEACOR SMIT Inc. (incorporated herein by reference to Exhibit 3.1(b) of the Company’s Quarterly Report on Form 10-Q for the fiscal quarter ended June 30, 1997 and filed with the Commission on August 14, 1997). | |
| 3.3* | Certificate of Amendment to the Restated Certificate of Incorporation of SEACOR Holdings Inc. (incorporated herein by reference to Exhibit 4.4 of the Company’s Registration Statement on Form S-8 (No. 333-126613) filed with the Commission on July 15, 2005). | |
| 3.4* | Second Amended and Restated Bylaws of SEACOR Holdings Inc. (incorporated herein by reference to Exhibit 4.3 of the Company’s Registration Statement on Form S-8 (No. 333-129356) filed with the Commission on November 1, 2005). | |
| 3.5* | Third Amended and Restated Bylaws of SEACOR Holdings Inc. (incorporated by reference to Exhibit 3.1 of the Company Current Report on Form 80K filed with the Commission on March 17, 2009). | |
| 4.1* | Indenture, dated as of September 22, 1997, between SEACOR SMIT Inc. and First Trust National Association, as trustee (including therein Form of Exchange Note 7.20% Senior Notes Due 2009) (incorporated herein by reference to Exhibit 4.1 of the Company’s Registration Statement on Form S-4 (No. 333-38841) filed with the Commission on October 27, 1997). | |
| 4.2* | Investment and Registration Rights Agreement, dated as of March 14, 1995, by and among SEACOR Holdings Inc., Miller Family Holdings, Inc., Charles Fabrikant, Mark Miller, Donald Toenshoff, Alvin Wood, Granville Conway and Michael Gellert (incorporated herein by reference to Exhibit 4.0 of the Company’s Current Report on Form 8-K filed with the Commission on March 14, 1995). | |
| 4.3* | Investment and Registration Rights Agreement, dated as of May 31, 1996, among SEACOR Holdings Inc. and the persons listed on the signature pages thereto (incorporated herein by reference to Exhibit 10.8 of the Company’s Current Report on Form 8-K filed with the Commission on June 7, 1996). | |
| 4.4* | Registration Rights Agreement, dated November 5, 1996, between SEACOR Holdings Inc. and Credit Suisse First Boston Corporation, Salomon Brothers Inc. and Wasserstein Perella Securities, Inc. (incorporated herein by reference to Exhibit 4.1 of the Company’s Quarterly Report on Form 10-Q for the fiscal quarter ended September 30, 1996 filed with the Commission on November 14, 1996). | |
| 4.5* | Investment and Registration Rights Agreement, dated as of December 19, 1996, by and between SEACOR Holdings Inc. and Smit International Overseas B.V. (incorporated herein by reference to Exhibit 4.0 of the Company’s Current Report on Form 8-K filed with the Commission on December 24, 1996). | |
76
Table of Contents
| Exhibit |
Description | |
| 4.6* | Investment and Registration Rights Agreement, dated as of January 3, 1997, among SEACOR Holdings Inc., Acadian Offshore Services, Inc., Galaxie Marine Service, Inc., Moonmaid Marine, Inc. and Triangle Marine, Inc. (incorporated herein by reference to Exhibit 4.6 of the Company’s Registration Statement on Form S-3 (No. 333-20921) filed with the Commission on January 31, 1997). | |
| 4.7* | Investment and Registration Rights Agreement, dated October 27, 1995, by and between SEACOR Holdings Inc. and Coastal Refining and Marketing, Inc. (incorporated herein by reference to Exhibit 4.2 of the Company’s Registration Statement on Form S-3 (No. 33-97868) filed with the Commission on November 17, 1995). | |
| 4.8* | Investment and Registration Rights Agreement, dated November 14, 1995, by and between SEACOR Holdings Inc. and Compagnie Nationale de Navigation (incorporated herein by reference to Exhibit 4.3 of the Company’s Registration Statement on Form S-3 (No. 33-97868) filed with the Commission on November 17, 1995). | |
| 4.9* | Registration Agreement, dated as of September 22, 1997, between SEACOR Holdings Inc. and the Initial Purchasers (as defined therein) (incorporated herein by reference to Exhibit 4.3 of the Company’s Registration Statement on Form S-4 (No. 333-38841) filed with the Commission on October 27, 1997). | |
| 4.10* | Investment and Registration Rights Agreement, dated as of April 19, 2000, among SEACOR SMIT Inc. and the other parties thereto (incorporated herein by reference to Exhibit 4.1 of the Company’s Registration Statement on Form S-3 (No. 333-37492) filed with the Commission on May 19, 2000). | |
| 4.11* | Investment and Registration Rights Agreement, dated as of December 19, 2000, among SEACOR SMIT Inc. and the other parties thereto (incorporated herein by reference to Exhibit 4.1 of the Company’s Registration Statement on Form S-3 (No. 333-56842) filed with the Commission on March 9, 2001). | |
| 4.12* | Investment and Registration Rights Agreement, dated as of January 9, 2001, among SEACOR SMIT Inc. and the other parties thereto (incorporated herein by reference to Exhibit 4.2 of the Company’s Registration Statement on Form S-3 (No. 333-56842) filed with the Commission on March 9, 2001). | |
| 4.13* | Form of Indenture, dated as of January 10, 2001, among SEACOR SMIT Inc. and U.S. Bank Trust National Association as trustee (incorporated herein by reference to Exhibit 4.2 to Amendment No. 1 of the Company’s Registration Statement on Form S-3/A (No. 333-53326) filed with the Commission on January 18, 2001). | |
| 4.14* | Form of Indenture, dated as of January 10, 2001, among SEACOR SMIT Inc. and U.S. Bank Trust National Association as trustee (incorporated herein by reference to Exhibit 4.3 to Amendment No. 1 of the Company’s Registration Statement on Form S-3/A (No. 333-53326) filed with the Commission on January 18, 2001). | |
| 4.15* | Indenture, dated as of December 17, 2004, between SEACOR Holdings Inc. and U.S. Bank National Association, as Trustee (incorporated herein by reference to Exhibit 4.1 of the Company’s Current Report on Form 8-K filed with the Commission on March 14, 2005). | |
| 4.16* | Registration Rights Agreement, dated December 17, 2004, between the Company and Credit Suisse-First Boston LLC (incorporated herein by reference to Exhibit 4.2 of the Company’s Current Report on Form 8-K filed with the Commission on March 14, 2005). | |
| 4.17* | Registration Rights Agreement, dated March 16, 2005, by and among SEACOR Holdings Inc. and the holders named therein (incorporated herein reference to Exhibit 4.1 of the Company’s Current Report on Form 8-K filed with the Commission on March 17, 2005). | |
77
Table of Contents
| Exhibit |
Description | |
| 4.18* | Stockholders’ Agreement, dated as of March 16, 2005, among SEACOR Holdings Inc., SBLK Acquisition Corp., CORBULK LLC and the stockholders named therein (incorporated herein reference to Exhibit 10.1 of the Company’s Current Report on Form 8-K filed with the Commission on March 17, 2005). | |
| 4.19* | Registration Rights Agreement dated as of August 5, 2003 between Seabulk International, Inc. and Credit Suisse First Boston LLC, Banc of America Securities LLC, RBC Dominion Securities Corporation and Merrill Lynch, Pierce, Fenner & Smith Incorporated (incorporated herein by reference to Exhibit 4.8 of Seabulk International, Inc.’s Registration Statement on Form S-4 (No. 333-110138) filed with the Commission on October 31, 2003). | |
| 4.20* | Indenture, dated as of August 5, 2003, among Seabulk International, Inc., the Guarantors named therein, and Wachovia Bank, National Association, as Trustee (including forms of notes) (incorporated herein by reference to Exhibit 4.7 of Seabulk International, Inc.’s Registration Statement on Form S-4 (No. 333-110138) filed with the Commission on October 31, 2003). | |
| 4.21* | Supplemental Indenture, dated as of October 3, 2003, among Seabulk International, Inc., the Guarantors named therein, and Wachovia Bank, National Association, as Trustee (incorporated herein by reference to Exhibit 4.9 of Seabulk International, Inc.’s Registration Statement on Form S-4 (No. 333-110-138) filed with the Commission on October 31, 2003). | |
| 4.22* | Second Supplemental Indenture, dated as of March 22, 2004, among Seabulk International, Inc., the Guarantors named therein, and Wachovia Bank, National Association, as Trustee (incorporated herein by reference to Exhibit 10.11 of Seabulk International, Inc.’s Annual Report on Form 10-K (No. 000-28732) for the year ended December 31, 2003 filed with the Commission on March 30, 2004). | |
| 4.23* | Third Supplemental Indenture, dated as of February 28, 2006, among Seabulk International, Inc., SEACOR Holdings Inc., the guarantors named therein and U.S. Bank National Association, as Trustee (incorporated herein reference to Exhibit 4.1 of the Company’s Current Report on Form 8-K filed with the Commission on March 1, 2006). | |
| 4.24* | Supplemental Indenture, dated September 24, 2009, between SEACOR Holdings Inc. and U.S. Bank National Association, as trustee (incorporated by reference to Exhibit 4.1 of the Company’s Current Report on Form 8-K filed with Commission on September 24, 2009). | |
| 4.25* | Form of Global Note representing the 7.375% Senior Notes due 2019 (incorporated by reference to Exhibit 4.2 of the Company’s Current Report on Form 8-K filed with the Commission on September 24, 2009). | |
| 10.1*+ | SEACOR Holdings Inc. 1996 Share Incentive Plan (incorporated herein by reference to Annex A of the Company’s Proxy Statement on DEF 14-A filed with the Commission on March 18, 1996). | |
| 10.2*+ | SEACOR SMIT Inc. 2000 Stock Option Plan for Non-Employee Directors (incorporated herein by reference to Exhibit 10.1 of the Company’s Quarterly Report on Form 10-Q for the period ended June 30, 2000 and filed with the Commission on August 14, 2000). | |
| 10.3* | Form of Management Agreement (incorporated herein by reference to Exhibit 10.4 of the Company’s Current Report on Form 8-K filed with the Commission on December 24, 1996). | |
| 10.4* | License Agreement, dated December 19, 1996, between SEACOR Holdings Inc., certain subsidiaries of SEACOR Holdings Inc. and Smit Intemationale N.V. (incorporated herein by reference to Exhibit 10.6 of the Company’s Current Report on Form 8-K filed with the Commission on December 24, 1996). | |
| 10.5*+ | Form of Type A Restricted Stock Grant Agreement (incorporated herein by reference to Exhibit 10.35 of the Company’s Annual Report on Form 10-K for the fiscal year ended December 31, 2000 filed with the Commission on March 30, 2000). | |
78
Table of Contents
| Exhibit |
Description | |
| 10.6*+ | Form of Type B Restricted Stock Grant Agreement (incorporated herein by reference to Exhibit 10.36 of the Company’s Annual Report on Form 10-K for the fiscal year ended December 31, 2000 filed with the Commission on March 30, 2000). | |
| 10.7*+ | Form of Option Agreement for Officers and Key Employees Pursuant to the SEACOR SMIT Inc. 1996 Share Incentive Plan (incorporated herein by reference to Exhibit 10.37 of the Company’s Annual Report on Form 10-K for the fiscal year ended December 31, 2000 filed with the Commission on March 30, 2000). | |
| 10.9*+ | SEACOR SMIT Inc. 2003 Non-Employee Director Share Incentive Plan (incorporated herein by reference to Exhibit 10.25 of the Company’s Annual Report on Form 10-K for the fiscal year ended December 31, 2003 filed with the Commission on March 15, 2004). | |
| 10.10*+ | SEACOR SMIT Inc. 2003 Share Incentive Plan (incorporated herein by reference to Exhibit 10.26 of the Company’s Current Report on Form 8-K filed with the Commission on March 15, 2004). | |
| 10.11*+ | Form of Option Agreement used under the Company’s 2003 Share Incentive Plan (incorporated herein by reference to Exhibit 10.1 of the Company’s Current Report on Form 8-K filed with the Commission on November 24, 2004). | |
| 10.12*+ | Form of Restricted Stock Grant Agreement used under the Company’s 2003 Share Incentive Plan (incorporated herein by reference to Exhibit 10.2 of the Company’s Current Report on Form 8-K filed with the Commission on November 24, 2004). | |
| 10.13* | Stock Purchase Agreement, among Rowan Companies, Inc., Era Aviation, Inc. and SEACOR Holdings Inc., dated as of October 14, 2004 (incorporated herein by reference to Exhibit 10.1 of the Company’s Current Report on Form 8-K filed with the Commission on October 14, 2004). | |
| 10.14* | Purchase Agreement, dated February 4, 2005, between Bell/Agusta Aerospace Company LLC and Offshore Aviation Inc. (portions of this Exhibit have been omitted pursuant to a request for confidential treatment on file with the Securities and Exchange Commission)(incorporated herein by reference to Exhibit 10.28 of the Company’s Annual Report on Form 10-K for the fiscal year ended December 31, 2004 filed with the Commission on March 14, 2005). | |
| 10.15* | Agreement and Plan of Merger, dated March 16, 2005, among SEACOR Holdings Inc., SBLK Acquisition Corp., CORBULK LLC and Seabulk International, Inc. (incorporated herein reference to Exhibit 2.1 of the Company’s Current Report on Form 8-K filed with the Commission on March 17, 2005). | |
| 10.16* | Form of Warrant Exchange Agreement (incorporated herein reference to Exhibit 10.32 of the Company’s Registration Statement (No. 333-124232) on Form S-4/A filed with the Commission on May 25, 2005). | |
| 10.17*+ | SEACOR Nonqualified Deferred Compensation Plan, dated as of October 15, 2005 (incorporated herein reference to Exhibit 99.1 of the Company’s Current Report on Form 8-K (No. 333-126613) filed with the Commission on October 28, 2005). | |
| 10.18+ | Compensation Arrangements for the Executive Officers. | |
| 10.19+ | Compensation of Non-Employee Directors. | |
| 10.20* | Amendment No. 3 to Revolving Credit Facility Agreement, dated as of December 21, 2005, by and among the Company (as successor in interest to SEACOR SMIT Inc.), the banks and financial institutions named therein, Fleet National Bank, DNB NOR Bank ASA (formerly Den norske Bank ASA), Nordea and The Governor and Company of the Bank of Scotland, as Agents (incorporated herein by reference to Exhibit 10.56 of the Company’s Annual Report on Form 10-K (No. 001-12289) for the fiscal year ended December 31, 2005 filed with the Commission on March 20, 2006). | |
79
Table of Contents
| Exhibit |
Description | |
| 10.21* | Revolving Credit Facility Agreement between SEACOR Holdings Inc. as Borrower, and DNB Nor, ASA, as Agent (incorporated herein by reference to Exhibit 10.1 of SEACOR’s Quarterly Report on Form 10-Q (No. 001-12289) for the fiscal quarter ended September 30, 2006 filed with the Commission on November 7, 2006). | |
| 10.22* | SEACOR SMIT Inc. 2000 Employee Stock Purchase Plan, as amended February 14, 2001 (incorporated herein by reference to Exhibit 4.4 of the Company’s Registration Statement on Form S-8 (No. 333-56714) filed with the Commission on March 8, 2001). | |
| 10.23* | SEACOR Holdings Inc. 2007 Share Incentive Plan (incorporated herein by reference to Exhibit 99.1 of the Company’s Current Report on Form 8-K filed with the Commission on May 10, 2007). | |
| 10.24* | Amendment No. 1 to SEACOR Holdings Inc.’s unsecured revolving credit facility agreement dated as of November 3, 2006 (incorporated herein by reference to Exhibit 10.1 of the Company’s Current Report on Form 8-K filed with the Commission on July 3, 2007). | |
| 10.25*+ | Form of Non-Employee Director Annual Share Incentive Grant Agreement (incorporated herein by reference to Exhibit 10.1 of the Company’s Current Report on Form 8-K filed with the Commission on May 8, 2008). | |
| 10.26*+ | Form of Stock Option Grant Agreement (incorporated herein by reference to Exhibit 10.2 of the Company’s Current Report on Form 8-K filed with the Commission on May 8, 2008). | |
| 10.27*+ | Form of Restricted Stock Grant Agreement (incorporated herein by reference to Exhibit 10.3 of the Company’s Current Report on Form 8-K filed with the Commission on May 8, 2008). | |
| 10.28* | Underwriting Agreement, dated September 21, 2009, between SEACOR Holdings Inc. and J.P. Morgan Securities Inc. and Deutsche Bank Securities Inc., as the representatives of the several underwriters named therein (incorporated herein by reference to Exhibit 1.1 of the Company’s Current report on Form 8-K filed with the Commission on September 24, 2009). | |
| 10.29* | SEACOR Holdings Inc. 2009 Employee Stock Purchase Plan effective March 11, 2009 (incorporated herein by reference to Appendix A of the Company’s Proxy Statement on DEF 14-A filed with the Commission on April 7, 2009). | |
| 10.30* | SEACOR Holdings Inc. 2007 Share Incentive Plan (as amended through March 11, 2009) (incorporated herein by reference to Appendix B of the Company’s Proxy Statement on DEF 14-A filed with the Commission on April 7, 2009). | |
| 10.31* | SEACOR Holdings Inc. Management Incentive Plan (incorporated herein by reference to Appendix C of the Company’s Proxy Statement on DEF 14-A filed with the Commission on April 7, 2009). | |
| 21.1 | List of Registrant’s Subsidiaries. | |
| 23.1 | Consent of Independent Registered Public Accounting Firm. | |
| 31.1 | Certification by the Chief Executive Officer Pursuant to Rule 13a-14(a) or Rule 15d-14(a) of the Exchange Act. | |
| 31.2 | Certification by the Chief Financial Officer Pursuant to Rule 13a-14(a) or Rule 15d-14(a) of the Exchange Act. | |
| 32.1 | Certification by the Chief Executive Officer Pursuant to 18 U.S.C. Section 1350, as adopted pursuant to Section 906 of the Sarbanes-Oxley Act of 2002. | |
| 32.2 | Certification by the Chief Financial Officer Pursuant to 18 U.S.C. Section 1350, as adopted pursuant to Section 906 of the Sarbanes-Oxley Act of 2002. | |
| * | Incorporated herein by reference as indicated. |
| + | Management contracts or compensatory plans or arrangements required to be filed as an Exhibit pursuant to Item 15 (b) of the rules governing the preparation of this report. |
80
Table of Contents
SIGNATURES
Pursuant to the requirements of Section 13 of the Securities Exchange Act of 1934, the registrant has duly caused this annual report on Form 10-K for the fiscal year ended December 31, 2009, to be signed on its behalf by the undersigned, and in the capacities indicated, thereunto duly authorized.
| SEACOR Holdings Inc. (Registrant) | ||
| By: | /S/ RICHARD RYAN | |
| Richard Ryan, Senior Vice President and Chief Financial Officer (Principal Financial Officer) | ||
Date: February 25, 2010
Pursuant to the requirements of the Securities Exchange Act of 1934, this report has been signed below by the following persons on behalf of the registrant and in the capacities and on the dates indicated.
| Signer |
Title |
Date | ||
| /S/ RICHARD RYAN Richard Ryan |
Senior Vice President and Chief Financial Officer (Principal Financial Officer) |
February 25, 2010 | ||
| /S/ MATTHEW CENAC Matthew Cenac |
Vice President and Chief Accounting Officer (Principal Accounting Officer) |
February 25, 2010 | ||
| /S/ CHARLES FABRIKANT Charles Fabrikant |
Chairman of the Board, President and Chief Executive Officer (Principal Executive Officer) |
February 25, 2010 | ||
| /S/ PIERRE DE DEMANDOLX Pierre De Demandolx |
Director | February 25, 2010 | ||
| /S/ RICHARD M. FAIRBANKS Richard M. Fairbanks |
Director | February 25, 2010 | ||
| /S/ MICHAEL E. GELLERT Michael E. Gellert |
Director | February 25, 2010 | ||
| /S/ JOHN C. HADJIPATERAS John C. Hadjipateras |
Director | February 25, 2010 | ||
| /S/ OIVIND LORENTZEN Oivind Lorentzen |
Director | February 25, 2010 | ||
| /S/ ANDREW R. MORSE Andrew R. Morse |
Director | February 25, 2010 | ||
81
Table of Contents
| Signer |
Title |
Date | ||
| /S/ CHRISTOPHER REGAN Christopher Regan |
Director | February 25, 2010 | ||
| /S/ STEPHEN STAMAS Stephen Stamas |
Director | February 25, 2010 | ||
| /S/ STEVEN WEBSTER Steven Webster |
Director | February 25, 2010 | ||
| /S/ STEVEN J. WISCH Steven J. Wisch |
Director | February 25, 2010 | ||
82
Table of Contents
INDEX TO CONSOLIDATED FINANCIAL STATEMENTS AND
FINANCIAL STATEMENT SCHEDULE
| Except for the Financial Statement Schedule set forth above, all other required schedules have been |
83
Table of Contents
MANAGEMENT’S REPORT ON INTERNAL CONTROL OVER FINANCIAL REPORTING
SEACOR Holdings Inc.’s (“SEACOR”) management is responsible for establishing and maintaining adequate internal control over financial reporting (as defined in Rule 13a-15(f) under the Securities Exchange Act of 1934).
Management conducted an evaluation of the effectiveness of its internal control over financial reporting as of December 31, 2009 based on the framework in Internal Control—Integrated Framework issued by the Committee of Sponsoring Organizations of the Treadway Commission. This evaluation included a review of the documentation surrounding SEACOR’s financial controls, an evaluation of the design effectiveness of these controls, testing of the operating effectiveness of these controls and a conclusion on this evaluation. Although there are inherent limitations in the effectiveness of any system of internal control over financial reporting—including the possibility of the circumvention or overriding of controls—based on management’s evaluation, management has concluded that SEACOR’s internal control over financial reporting was effective as of December 31, 2009. However, because of changes in conditions, it is important to note that internal control system effectiveness may vary over time.
SEACOR’s internal control over financial reporting as of December 31, 2009 has been audited by Ernst & Young LLP, the independent registered public accounting firm that has also audited SEACOR’s consolidated financial statements included in this Annual Report on Form 10-K. Ernst & Young LLP’s report on SEACOR’s internal control over financial reporting is included elsewhere herein.
84
Table of Contents
REPORT OF INDEPENDENT REGISTERED PUBLIC ACCOUNTING FIRM
ON INTERNAL CONTROL OVER FINANCIAL REPORTING
The Stockholders and Board of Directors of SEACOR Holdings Inc.
We have audited SEACOR Holdings Inc.’s internal control over financial reporting as of December 31, 2009, based on criteria established in Internal Control—Integrated Framework issued by the Committee of Sponsoring Organizations of the Treadway Commission (the COSO criteria). SEACOR Holdings Inc.’s management is responsible for maintaining effective internal control over financial reporting and for its assessment of the effectiveness of internal control over financial reporting included in the accompanying Management’s Report on Internal Control over Financial Reporting. Our responsibility is to express an opinion on the company’s internal control over financial reporting based on our audit.
We conducted our audit in accordance with the standards of the Public Company Accounting Oversight Board (United States). Those standards require that we plan and perform the audit to obtain reasonable assurance about whether effective internal control over financial reporting was maintained in all material respects. Our audit included obtaining an understanding of internal control over financial reporting, assessing the risk that a material weakness exists, testing and evaluating the design and operating effectiveness of internal control based on the assessed risk, and performing such other procedures as we considered necessary in the circumstances. We believe that our audit provides a reasonable basis for our opinion.
A company’s internal control over financial reporting is a process designed to provide reasonable assurance regarding the reliability of financial reporting and the preparation of financial statements for external purposes in accordance with generally accepted accounting principles. A company’s internal control over financial reporting includes those policies and procedures that (1) pertain to the maintenance of records that, in reasonable detail, accurately and fairly reflect the transactions and dispositions of the assets of the company; (2) provide reasonable assurance that transactions are recorded as necessary to permit preparation of financial statements in accordance with generally accepted accounting principles and that receipts and expenditures of the company are being made only in accordance with authorizations of management and directors of the company; and (3) provide reasonable assurance regarding prevention or timely detection of unauthorized acquisition, use, or disposition of the company’s assets that could have a material effect on the financial statements.
Because of its inherent limitations, internal control over financial reporting may not prevent or detect misstatements. Also, projections of any evaluation of effectiveness to future periods are subject to the risk that controls may become inadequate because of changes in conditions, or that the degree of compliance with the policies or procedures may deteriorate.
In our opinion, SEACOR Holdings Inc. maintained, in all material respects, effective internal control over financial reporting as of December 31, 2009, based on the COSO criteria.
We also have audited, in accordance with the standards of the Public Company Accounting Oversight Board (United States), the consolidated balance sheets of SEACOR Holdings Inc. as of December 31, 2009 and 2008, and the related consolidated statements of income, changes in equity and cash flows for each of the three years in the period ended December 31, 2009 and our report dated February 25, 2010 expressed an unqualified opinion thereon.
/s/ Ernst & Young LLP
Certified Public Accountants
Fort Lauderdale, Florida
February 25, 2010
85
Table of Contents
REPORT OF INDEPENDENT REGISTERED PUBLIC ACCOUNTING FIRM
The Stockholders and Board of Directors of SEACOR Holdings Inc.
We have audited the accompanying consolidated balance sheets of SEACOR Holdings Inc. (the Company) as of December 31, 2009 and 2008, and the related consolidated statements of income, changes in equity and cash flows for each of the three years in the period ended December 31, 2009. Our audits also included the financial statement schedule listed in the Index at Item 15(a). These financial statements and schedule are the responsibility of the Company’s management. Our responsibility is to express an opinion on these financial statements and schedule based on our audits.
We conducted our audits in accordance with the standards of the Public Company Accounting Oversight Board (United States). Those standards require that we plan and perform the audit to obtain reasonable assurance about whether the financial statements are free of material misstatement. An audit includes examining, on a test basis, evidence supporting the amounts and disclosures in the financial statements. An audit also includes assessing the accounting principles used and significant estimates made by management, as well as evaluating the overall financial statement presentation. We believe that our audits provide a reasonable basis for our opinion.
In our opinion, the consolidated financial statements referred to above present fairly, in all material respects, the consolidated financial position of SEACOR Holdings Inc. as of December 31, 2009 and 2008, and the consolidated results of its operations and its cash flows for each of the three years in the period ended December 31, 2009, in conformity with U.S. generally accepted accounting principles. Also, in our opinion, the related financial statement schedule, when considered in relation to the basic financial statements taken as a whole, present fairly in all material respects the information set forth therein.
We also have audited, in accordance with the standards of the Public Company Accounting Oversight Board (United States), SEACOR Holdings Inc.’s internal control over financial reporting as of December 31, 2009, based on criteria established in Internal Control—Integrated Framework issued by the Committee of Sponsoring Organizations of the Treadway Commission and our report dated February 25, 2010 expressed an unqualified opinion thereon.
/s/ Ernst & Young LLP
Certified Public Accountants
Fort Lauderdale, Florida
February 25, 2010
86
Table of Contents
CONSOLIDATED BALANCE SHEETS
(in thousands, except share data)
| December 31, | ||||||||
| 2009 | 2008 | |||||||
| ASSETS | ||||||||
| Current Assets: |
||||||||
| Cash and cash equivalents |
$ | 465,904 | $ | 275,442 | ||||
| Restricted cash |
34,014 | 20,787 | ||||||
| Marketable securities |
68,139 | 53,817 | ||||||
| Receivables: |
||||||||
| Trade, net of allowance for doubtful accounts of $3,608 and $5,730 in 2009 and 2008, respectively |
301,143 | 277,350 | ||||||
| Other |
78,689 | 40,141 | ||||||
| Inventories |
76,949 | 66,278 | ||||||
| Deferred income taxes |
3,354 | 5,164 | ||||||
| Prepaid expenses and other |
15,725 | 10,499 | ||||||
| Total current assets |
1,043,917 | 749,478 | ||||||
| Property and Equipment |
2,833,011 | 2,741,322 | ||||||
| Accumulated depreciation |
(754,263 | ) | (601,806 | ) | ||||
| Net property and equipment |
2,078,748 | 2,139,516 | ||||||
| Investments, at Equity, and Receivables from 50% or Less Owned Companies |
186,814 | 150,062 | ||||||
| Construction Reserve Funds & Title XI Reserve Funds |
289,750 | 305,757 | ||||||
| Goodwill |
54,571 | 51,496 | ||||||
| Intangible Assets |
23,554 | 28,478 | ||||||
| Other Assets, net of allowance for doubtful accounts of $2,301 and $888 in 2009 and 2008, respectively |
46,265 | 34,867 | ||||||
| $ | 3,723,619 | $ | 3,459,654 | |||||
| LIABILITIES AND EQUITY | ||||||||
| Current Liabilities: |
||||||||
| Current portion of long-term debt |
$ | 36,436 | $ | 33,671 | ||||
| Current portion of capital lease obligations |
966 | 907 | ||||||
| Accounts payable and accrued expenses |
135,425 | 102,798 | ||||||
| Accrued wages and benefits |
30,187 | 36,041 | ||||||
| Accrued interest |
8,364 | 9,938 | ||||||
| Accrued income taxes |
17,148 | 16,787 | ||||||
| Short sale of marketable securities |
18,442 | 2,938 | ||||||
| Accrued capital, repair and maintenance expenditures |
7,538 | 15,629 | ||||||
| Deferred revenues |
14,957 | 3,083 | ||||||
| Other current liabilities |
45,649 | 55,009 | ||||||
| Total current liabilities |
315,112 | 276,801 | ||||||
| Long-Term Debt |
748,704 | 895,689 | ||||||
| Capital Lease Obligations |
6,624 | 7,685 | ||||||
| Deferred Income Taxes |
575,440 | 515,455 | ||||||
| Deferred Gains and Other Liabilities |
111,848 | 121,796 | ||||||
| Total Liabilities |
1,757,728 | 1,817,426 | ||||||
| Equity: |
||||||||
| SEACOR Holdings Inc. stockholders’ equity: |
||||||||
| Preferred stock, $.01 par value, 10,000,000 shares authorized; none issued nor outstanding |
— | — | ||||||
| Common stock, $.01 par value, 60,000,000 shares authorized; 35,550,934 and 32,390,838 shares issued in 2009 and 2008, respectively |
356 | 324 | ||||||
| Additional paid-in capital |
1,182,023 | 956,457 | ||||||
| Retained earnings |
1,546,581 | 1,402,771 | ||||||
| Shares held in treasury of 12,938,108 and 12,373,291 in 2009 and 2008, respectively, at cost |
(768,438 | ) | (724,357 | ) | ||||
| Accumulated other comprehensive loss: |
||||||||
| Cumulative translation adjustments, net of tax |
(3,056 | ) | (5,045 | ) | ||||
| Derivative losses on cash flow hedges, net of tax |
(204 | ) | — | |||||
| 1,957,262 | 1,630,150 | |||||||
| Noncontrolling interests in subsidiaries |
8,629 | 12,078 | ||||||
| Total equity |
1,965,891 | 1,642,228 | ||||||
| $ | 3,723,619 | $ | 3,459,654 | |||||
The accompanying notes are an integral part of these consolidated financial statements
and should be read in conjunction herewith.
87
Table of Contents
CONSOLIDATED STATEMENTS OF INCOME
(in thousands, except share data)
| For the years ended December 31, | ||||||||||||
| 2009 | 2008 | 2007 | ||||||||||
| Operating Revenues |
$ | 1,711,338 | $ | 1,655,956 | $ | 1,359,230 | ||||||
| Costs and Expenses: |
||||||||||||
| Operating |
1,185,096 | 1,071,116 | 832,403 | |||||||||
| Administrative and general |
161,998 | 174,878 | 147,317 | |||||||||
| Depreciation and amortization |
160,092 | 156,426 | 154,307 | |||||||||
| 1,507,186 | 1,402,420 | 1,134,027 | ||||||||||
| Gains on Asset Dispositions and Impairments, Net |
27,675 | 89,153 | 122,572 | |||||||||
| Operating Income |
231,827 | 342,689 | 347,775 | |||||||||
| Other Income (Expense): |
||||||||||||
| Interest income |
4,466 | 19,788 | 45,173 | |||||||||
| Interest expense |
(59,043 | ) | (59,816 | ) | (56,986 | ) | ||||||
| Debt extinguishment gains (losses), net |
(5,587 | ) | 6,265 | 197 | ||||||||
| Marketable security gains (losses), net |
24,059 | 30,105 | (3,391 | ) | ||||||||
| Derivative gains (losses), net |
10,961 | (13,588 | ) | 10,835 | ||||||||
| Foreign currency gains (losses), net |
8,087 | (7,837 | ) | 230 | ||||||||
| Other, net |
244 | 320 | (11 | ) | ||||||||
| (16,813 | ) | (24,763 | ) | (3,953 | ) | |||||||
| Income Before Income Tax Expense and Equity in Earnings of 50% or Less Owned Companies |
215,014 | 317,926 | 343,822 | |||||||||
| Income Tax Expense: |
||||||||||||
| Current |
19,487 | 74,521 | 13,599 | |||||||||
| Deferred |
63,005 | 36,051 | 114,242 | |||||||||
| 82,492 | 110,572 | 127,841 | ||||||||||
| Income Before Equity in Earnings of 50% or Less Owned Companies |
132,522 | 207,354 | 215,981 | |||||||||
| Equity in Earnings of 50% or Less Owned Companies, Net of Tax |
12,581 | 12,069 | 22,065 | |||||||||
| Net Income |
145,103 | 219,423 | 238,046 | |||||||||
| Net Income attributable to Noncontrolling Interests in Subsidiaries |
1,293 | 880 | 1,227 | |||||||||
| Net Income attributable to SEACOR Holdings Inc. |
$ | 143,810 | $ | 218,543 | $ | 236,819 | ||||||
| Basic Earnings Per Common Share of SEACOR Holdings Inc. |
$ | 7.21 | $ | 10.46 | $ | 10.06 | ||||||
| Diluted Earnings Per Common Share of SEACOR Holdings Inc. |
$ | 6.57 | $ | 9.25 | $ | 9.04 | ||||||
| Weighted Average Common Shares Outstanding: |
||||||||||||
| Basic |
19,950,702 | 20,893,390 | 23,547,708 | |||||||||
| Diluted |
23,388,168 | 24,699,181 | 27,266,750 | |||||||||
The accompanying notes are an integral part of these consolidated financial statements
and should be read in conjunction herewith.
88
Table of Contents
CONSOLIDATED STATEMENTS OF CHANGES IN EQUITY (in thousands)
| SEACOR Holdings Inc. Stockholders’ Equity | Non - controlling Interests in Subsidiaries |
Total Equity |
Comprehensive Income |
||||||||||||||||||||||||||||
| Common Stock |
Additional Paid-in Capital |
Retained Earnings |
Treasury Stock |
Accumulated Other Comprehensive Income (Loss) |
|||||||||||||||||||||||||||
| December 31, 2006, previously reported |
$ | 317 | $ | 871,914 | $ | 956,376 | $ | (274,490 | ) | $ | 2,961 | $ | 6,894 | $ | 1,563,972 | ||||||||||||||||
| Adoption of new accounting rules related to the Company’s convertible debt (see Note 8) |
— | 33,917 | (8,967 | ) | — | — | — | 24,950 | |||||||||||||||||||||||
| December 31, 2006, as adjusted |
317 | 905,831 | 947,409 | (274,490 | ) | 2,961 | 6,894 | 1,588,922 | |||||||||||||||||||||||
| Issuance of common stock: |
|||||||||||||||||||||||||||||||
| Waxler acquisition |
2 | 19,108 | — | — | — | — | 19,110 | ||||||||||||||||||||||||
| Tex-Air acquisition |
— | 56 | — | — | — | — | 56 | ||||||||||||||||||||||||
| Employee Stock Purchase Plan |
— | — | — | 2,052 | — | — | 2,052 | ||||||||||||||||||||||||
| Exercise of stock options |
1 | 2,966 | — | — | — | — | 2,967 | ||||||||||||||||||||||||
| Director stock awards |
— | 475 | — | — | — | — | 475 | ||||||||||||||||||||||||
| Restricted stock and restricted stock units |
2 | 614 | — | 74 | — | — | 690 | ||||||||||||||||||||||||
| Purchase of treasury shares |
— | — | — | (213,284 | ) | — | — | (213,284 | ) | ||||||||||||||||||||||
| Amortization of share awards |
— | 9,712 | — | — | — | — | 9,712 | ||||||||||||||||||||||||
| Cancellation of restricted stock |
— | 857 | — | (857 | ) | — | — | — | |||||||||||||||||||||||
| Acquisition of a subsidiary with noncontrolling interests |
— | — | — | — | — | 836 | 836 | ||||||||||||||||||||||||
| Dividends paid to noncontrolling interests |
— | — | — | — | — | (2,216 | ) | (2,216 | ) | ||||||||||||||||||||||
| Cash received from noncontrolling interests |
— | — | — | — | — | 2,807 | 2,807 | ||||||||||||||||||||||||
| Net income |
— | — | 236,819 | — | — | 1,227 | 238,046 | $ | 238,046 | ||||||||||||||||||||||
| Other comprehensive income |
— | — | — | — | 1,315 | 10 | 1,325 | 1,325 | |||||||||||||||||||||||
| Year Ended December 31, 2007 |
322 | 939,619 | 1,184,228 | (486,505 | ) | 4,276 | 9,558 | 1,651,498 | $ | 239,371 | |||||||||||||||||||||
| Issuance of common stock: |
|||||||||||||||||||||||||||||||
| Employee Stock Purchase Plan |
— | — | — | 2,361 | — | — | 2,361 | ||||||||||||||||||||||||
| Exercise of stock options |
1 | 3,901 | — | — | — | — | 3,902 | ||||||||||||||||||||||||
| Director stock awards |
— | 433 | — | — | — | — | 433 | ||||||||||||||||||||||||
| Restricted stock and restricted stock units |
1 | 118 | — | 43 | — | — | 162 | ||||||||||||||||||||||||
| Purchase of treasury shares |
— | — | — | (240,069 | ) | — | — | (240,069 | ) | ||||||||||||||||||||||
| Amortization of share awards |
— | 12,199 | — | — | — | — | 12,199 | ||||||||||||||||||||||||
| Cancellation of restricted stock |
— | 187 | — | (187 | ) | — | — | — | |||||||||||||||||||||||
| Dividends paid to noncontrolling interests |
— | — | — | — | — | (810 | ) | (810 | ) | ||||||||||||||||||||||
| Cash received from noncontrolling interests |
— | — | — | — | — | 2,442 | 2,442 | ||||||||||||||||||||||||
| Net income |
— | — | 218,543 | — | — | 880 | 219,423 | $ | 219,423 | ||||||||||||||||||||||
| Other comprehensive loss |
— | — | — | — | (9,321 | ) | 8 | (9,313 | ) | (9,313 | ) | ||||||||||||||||||||
| Year Ended December 31, 2008 |
324 | 956,457 | 1,402,771 | (724,357 | ) | (5,045 | ) | 12,078 | 1,642,228 | $ | 210,110 | ||||||||||||||||||||
| Issuance of common stock: |
|||||||||||||||||||||||||||||||
| Conversion of debt |
27 | 205,631 | — | — | — | — | 205,658 | ||||||||||||||||||||||||
| Purchase of conversion option in convertible debt |
2 | 11,513 | — | — | — | — | 11,515 | ||||||||||||||||||||||||
| Employee Stock Purchase Plan |
— | — | — | 2,361 | — | — | 2,361 | ||||||||||||||||||||||||
| Exercise of stock options |
1 | 4,064 | — | — | — | — | 4,065 | ||||||||||||||||||||||||
| Director stock awards |
— | 374 | — | — | — | — | 374 | ||||||||||||||||||||||||
| Restricted stock and restricted stock units |
2 | (776 | ) | — | (17 | ) | — | — | (791 | ) | |||||||||||||||||||||
| Purchase of treasury shares |
— | — | — | (45,854 | ) | — | — | (45,854 | ) | ||||||||||||||||||||||
| Purchase of conversion option in convertible debt, net of tax |
— | (8,804 | ) | — | — | — | — | (8,804 | ) | ||||||||||||||||||||||
| Amortization of share awards |
— | 12,993 | — | — | — | — | 12,993 | ||||||||||||||||||||||||
| Cancellation of restricted stock |
— | 571 | — | (571 | ) | — | — | — | |||||||||||||||||||||||
| Purchase of subsidiary shares from noncontrolling interests |
— | — | — | — | — | (5,501 | ) | (5,501 | ) | ||||||||||||||||||||||
| Acquisition of a subsidiary with noncontrolling interests |
— | — | — | — | — | 3,043 | 3,043 | ||||||||||||||||||||||||
| Sale of subsidiary with noncontrolling interests |
— | — | — | — | — | (27 | ) | (27 | ) | ||||||||||||||||||||||
| Dividends paid to noncontrolling interests |
— | — | — | — | — | (2,257 | ) | (2,257 | ) | ||||||||||||||||||||||
| Net Income |
— | — | 143,810 | — | — | 1,293 | 145,103 | $ | 145,103 | ||||||||||||||||||||||
| Other comprehensive income |
— | — | — | — | 1,785 | — | 1,785 | 1,785 | |||||||||||||||||||||||
| Year Ended December 31, 2009 |
$ | 356 | $ | 1,182,023 | $ | 1,546,581 | $ | (768,438 | ) | $ | (3,260 | ) | $ | 8,629 | $ | 1,965,891 | $ | 146,888 | |||||||||||||
The accompanying notes are an integral part of these consolidated financial statements and should be read in conjunction herewith.
89
Table of Contents
CONSOLIDATED STATEMENTS OF CASH FLOWS
(in thousands)
| For the years ended December 31, | ||||||||||||
| 2009 | 2008 | 2007 | ||||||||||
| Cash Flows from Operating Activities: |
||||||||||||
| Net income |
$ | 145,103 | $ | 219,423 | $ | 238,046 | ||||||
| Adjustments to reconcile net income to net cash provided by operating activities: |
||||||||||||
| Depreciation and amortization |
160,092 | 156,426 | 154,307 | |||||||||
| Amortization of valuation adjustments on acquired leases |
— | 738 | 1,875 | |||||||||
| Amortization of deferred income on sale and leaseback transactions |
(16,960 | ) | (17,290 | ) | (12,196 | ) | ||||||
| Debt discount amortization, net |
7,448 | 5,852 | 5,600 | |||||||||
| Amortization of share awards |
12,993 | 12,199 | 9,712 | |||||||||
| Director stock awards |
380 | 450 | 482 | |||||||||
| Bad debt expense |
1,717 | 1,392 | 571 | |||||||||
| Gains on asset dispositions and impairments, net |
(27,675 | ) | (89,153 | ) | (122,572 | ) | ||||||
| (Gains) losses on debt extinguishment, net |
5,587 | (6,265 | ) | (197 | ) | |||||||
| Marketable security (gains) losses, net |
(24,059 | ) | (30,105 | ) | 3,391 | |||||||
| Purchases of marketable securities |
(35,523 | ) | (60,288 | ) | — | |||||||
| Proceeds from sale of marketable securities |
61,595 | 24,168 | — | |||||||||
| Derivative (gains) losses, net |
(10,961 | ) | 13,588 | (10,835 | ) | |||||||
| Cash settlements on derivative transactions, net |
3,786 | (11,310 | ) | — | ||||||||
| Foreign currency (gains) losses, net |
(8,087 | ) | 7,837 | (230 | ) | |||||||
| Deferred income tax expense |
63,005 | 36,051 | 114,242 | |||||||||
| Equity in earnings of 50% or less owned companies |
(12,581 | ) | (12,069 | ) | (22,065 | ) | ||||||
| Dividends received from 50% or less owned companies |
15,920 | 10,634 | 20,702 | |||||||||
| Other, net |
1,068 | 1,038 | 1,814 | |||||||||
| Changes in operating assets and liabilities: |
||||||||||||
| (Increase) decrease in receivables |
(50,742 | ) | 10,909 | (15,692 | ) | |||||||
| (Increase) decrease in prepaid expenses and other assets |
(12,183 | ) | 22,802 | (6,762 | ) | |||||||
| Increase (decrease) in accounts payable, accrued expenses and other liabilities |
17,695 | (5,403 | ) | 25,708 | ||||||||
| Net cash provided by operating activities |
297,618 | 291,624 | 385,901 | |||||||||
| Cash Flows from Investing Activities: |
||||||||||||
| Purchases of property and equipment |
(180,024 | ) | (428,478 | ) | (537,608 | ) | ||||||
| Proceeds from disposition of property and equipment |
103,739 | 171,722 | 449,745 | |||||||||
| Purchases of marketable securities |
— | (212,590 | ) | (107,464 | ) | |||||||
| Proceeds from sale of marketable securities |
— | 141,886 | 128,278 | |||||||||
| Cash settlements on derivative transactions, net |
(771 | ) | 7,772 | 35,782 | ||||||||
| Investments in and advances to 50% or less owned companies |
(27,453 | ) | (35,447 | ) | (31,566 | ) | ||||||
| Return of investments and advances from 50% or less owned companies |
2,790 | 2,229 | 7,487 | |||||||||
| Proceeds on sale of investments in 50% or less owned companies |
136 | — | 30,686 | |||||||||
| (Advances) principal payments on third party notes receivable, net |
3,009 | (5,607 | ) | 974 | ||||||||
| Net (increase) decrease in restricted cash |
(13,227 | ) | 9,837 | 11,327 | ||||||||
| Net (increase) decrease in construction reserve funds and title XI funds |
16,007 | 99,243 | (56,739 | ) | ||||||||
| Net (increase) decrease in escrow deposits on like kind exchanges |
— | 10,105 | (2,176 | ) | ||||||||
| Repayments on (investments in) leases, net |
(1,667 | ) | 59 | 6,846 | ||||||||
| Business acquisitions, net of cash acquired |
(4,085 | ) | (7,155 | ) | (44,591 | ) | ||||||
| Cash disposed on sale of subsidiary, net of cash proceeds on sale |
(154 | ) | — | — | ||||||||
| Net cash used in investing activities |
(101,700 | ) | (246,424 | ) | (109,019 | ) | ||||||
| Cash Flows from Financing Activities: |
||||||||||||
| Payments on long-term debt and capital lease obligations |
(312,215 | ) | (200,097 | ) | (40,462 | ) | ||||||
| Purchase of conversion option in convertible debt |
(2,030 | ) | — | — | ||||||||
| Net borrowings under inventory financing arrangements |
2,200 | 22,169 | — | |||||||||
| Proceeds from issuance of long-term debt, net of offering costs |
349,297 | 111,250 | (231 | ) | ||||||||
| Common stock acquired for treasury |
(45,854 | ) | (240,069 | ) | (213,284 | ) | ||||||
| Proceeds and tax benefits (expenses) from share award plans, net |
5,742 | 6,655 | 6,146 | |||||||||
| Purchase of subsidiary shares from noncontrolling interests |
(1,210 | ) | — | — | ||||||||
| Cash received from (dividends paid to) noncontrolling interests |
(2,257 | ) | 1,632 | 591 | ||||||||
| Net cash used in financing activities |
(6,327 | ) | (298,460 | ) | (247,240 | ) | ||||||
| Effects of Exchange Rate Changes on Cash and Cash Equivalents |
871 | (8,603 | ) | 697 | ||||||||
| Net Increase (Decrease) in Cash and Cash Equivalents |
190,462 | (261,863 | ) | 30,339 | ||||||||
| Cash and Cash Equivalents, Beginning of Year |
275,442 | 537,305 | 506,966 | |||||||||
| Cash and Cash Equivalents, End of Year |
$ | 465,904 | $ | 275,442 | $ | 537,305 | ||||||
The accompanying notes are an integral part of these consolidated financial statements
and should be read in conjunction herewith.
90
Table of Contents
NOTES TO CONSOLIDATED FINANCIAL STATEMENTS
| 1. | NATURE OF OPERATIONS AND ACCOUNTING POLICIES |
Nature of Operations. SEACOR Holdings Inc. (“SEACOR”) and its subsidiaries (collectively referred to as the “Company”) are in the business of owning, operating, investing in and marketing equipment, primarily in the offshore oil and gas, industrial aviation and marine transportation industries. The Company operates a diversified fleet of offshore support vessels and helicopters servicing oil and gas exploration, development and production facilities worldwide and a fleet of U.S.-flag product tankers that transport petroleum, chemicals and crude products primarily in the U.S. domestic or “coastwise” trade. In addition, the Company operates a fleet of inland river barges and towboats transporting grain, liquids and other bulk commodities on the U.S. Inland River Waterways. The Company’s environmental services segment primarily provides emergency preparedness and response services to oil, chemical, industrial and marine transportation clients, and government agencies in the United States and abroad. The Company’s commodity trading and logistics segment is an integrated business involved in the purchase, storage, transportation, processing and sale of agricultural and energy commodities.
Basis of Consolidation. The consolidated financial statements include the accounts of SEACOR and its majority-owned subsidiaries. All significant inter-company accounts and transactions are eliminated in consolidation.
Effective January 1, 2009, the Company adopted new accounting rules established by the Financial Accounting Standards Board (“FASB”) relating to the presentation of its noncontrolling interests. The new accounting rules establish accounting and reporting standards for noncontrolling interests in a subsidiary and for the deconsolidation of a subsidiary and define a noncontrolling interest, previously called a minority interest, as the portion of equity in a subsidiary not attributable, directly or indirectly, to the Company. The new accounting rules require, among other items, that a noncontrolling interest be included in the consolidated statement of financial position within equity separate from the Company’s equity; consolidated net income to be reported at amounts inclusive of both the Company’s and noncontrolling interest’s shares and, separately, the amounts of consolidated net income attributable to the Company and noncontrolling interest all on the consolidated statement of income; and if a subsidiary is deconsolidated, any retained noncontrolling equity investment in the former subsidiary be measured at fair value and a gain or loss be recognized in net income based on such fair value. The presentation and disclosure requirements of the new accounting rules were applied retrospectively. Other than the change in presentation of noncontrolling interests and its inclusion in comprehensive income, the adoption of the new accounting rules had no impact on the Company’s consolidated financial position or its results of operations.
The Company employs the equity method of accounting for investments in business ventures when it has the ability to exercise significant influence over the operating and financial policies of the ventures. Significant influence is generally deemed to exist if the Company has between 20% and 50% of the voting rights of an investee. The Company reports its investments in and advances to equity investees in the accompanying consolidated balance sheets as investments, at equity, and receivables from 50% or less owned companies. The Company reports its share of earnings or losses of equity investees in the accompanying consolidated statements of income as equity in earnings of 50% or less owned companies.
The Company employs the cost method of accounting for investments in other business ventures over which the Company does not have the ability to exercise significant influence. These investments in private companies are carried at cost and are adjusted only for capital distributions and other-than-temporary declines in fair value.
Use of Estimates. The preparation of financial statements in conformity with accounting principles generally accepted in the United States of America requires management to make estimates and assumptions that affect the reported amounts of assets and liabilities and disclosure of contingent assets and liabilities at the date of the financial statements and the reported amounts of revenues and expenses during the reporting period. Such
91
Table of Contents
estimates include those related to deferred revenues, allowance for doubtful accounts, useful lives of property and equipment, impairments, income tax provisions and certain accrued liabilities. Actual results could differ from those estimates and those differences may be material.
Subsequent Events. The Company has performed an evaluation of subsequent events through February 25, 2010.
Revenue Recognition. The Company recognizes revenue when it is realized or realizable and earned. Revenue is realized or realizable and earned when persuasive evidence of an arrangement exists, delivery has occurred or services have been rendered, the price to the buyer is fixed or determinable, and collectability is reasonably assured. Revenue that does not meet this criteria is deferred until the criteria are met. As of December 31, 2009, 2008 and 2007, the Company has deferred $15.0 million, $3.1 million and $1.3 million, respectively, of revenues that did not meet its recognition criteria. As of December 31, 2009, deferred revenues included $11.0 million relating to the time charter of several offshore support vessels operating in the U.S. Gulf of Mexico that are scheduled to be paid through the conveyance of a limited net profit interest in developmental oil-and-gas producing properties owned by a customer. Payments from the conveyance of the limited net profit interest, and the timing of such payments, are contingent upon production and energy sale prices. Based on the current production payout estimate, the first payment is expected in early 2010. The Company expects to provide an additional $6.0 million in charter hire under this arrangement through April 2010 and will recognize revenues when payments from the conveyance of the limited net profit interest are determinable. All costs and expenses related to these charters are being recognized as incurred.
The Company’s Offshore Marine Services segment earns and recognizes revenues primarily from the time charter and bareboat charter of vessels to customers based upon daily rates of hire. Under a time charter, Offshore Marine Services provides a vessel to a customer and is responsible for all operating expenses, typically excluding fuel. Under a bareboat charter, Offshore Marine Services provides the vessel to the customer and the customer assumes responsibility for all operating expenses and risk of operation. Vessel charters may range from several days to several years. Revenues from time charter and bareboat charter are recorded and recognized as services are provided. In the U.S. Gulf of Mexico, time charter durations and rates are typically established in the context of master service agreements, which govern the terms and conditions of charter.
The Company’s Marine Transportation Services segment earns revenue from the time charter, bareboat charter and voyage charter of vessels and under contracts of affreightment. Under a time charter, Marine Transportation Services provides a vessel to a customer and is responsible for all operating expenses, typically excluding fuel. Under a bareboat charter, Marine Transportation Services provides the vessel to a customer and the customer assumes responsibility for all operating expenses and risk of operation. Revenues from time charter and bareboat charter are recognized as services are provided and are billed monthly in advance. Voyage contracts are contracts to carry cargos on a single voyage basis regardless of time to complete. Contracts of affreightment are contracts for cargos that are committed on a multi-voyage basis for various periods of time with minimum and maximum cargo tonnages specified over the period at a fixed or escalating rate per ton. Revenues for voyage contracts and contracts of affreightment are recognized over the progress of the voyage while the related costs are expensed as incurred.
The Company’s Inland River Services segment earns revenues primarily from voyage affreightment contracts whereby customers are charged an established rate per ton to transport cargo from point to point. Revenues from voyage affreightment contracts are generally recognized over the progress of the voyage while the related costs are expensed as incurred. Certain of Inland River Services’ barges are operated in barge pools with other barges owned by third parties from whom Inland River Services earns and recognizes a management fee as the services are rendered. Pursuant to the pooling agreements, operating revenues and expenses of participating barges are combined and the net results are allocated on a pro-rata basis based on the number of barge days contributed by each participant. In addition, revenues are earned from equipment chartered to third parties and from the storage and demurrage of cargos associated with affreightment activities. In both of these
92
Table of Contents
cases, revenues are recognized as services are rendered. Inland River Services’ tank farm and handling facility earns revenues through rental and throughput charges. Rental revenues are recognized ratably over the rental period while throughput charges are recognized as product volume moves through the facility.
The Company’s Aviation Services segment charters its helicopters to utility and oil and gas customers primarily through master service agreements, term contracts, day-to-day charter arrangements and leases. Master service agreements require incremental payments above a fixed rental fee based upon flight hours flown, have fixed terms ranging from one month to five years, and generally are cancelable upon 30 days notice. Term contracts and day-to-day charter arrangements are generally non-cancelable without cause and call for a combination of a monthly or daily fixed rental fee plus a charge based on hours flown. Day-to-day charter arrangements are generally based on either an hourly or daily rate. Leases can be either dry, providing only the equipment, or wet, providing equipment and personnel. Fixed rental fee revenues are recognized ratably over the contract term. Usage or hourly based revenues are recognized as hours are flown. Aviation Services’ air medical activities are provided under contracts with hospitals that typically include either a fixed monthly and hourly rate structure or a fee per completed flight. Fixed monthly revenues are recognized ratably over the month while per hour or per flight based revenues are recognized as hours are flown or flights are completed. With respect to flightseeing activities, Aviation Services allocates block space to cruise lines and sells seats directly to customers with revenues for helicopter usage being recognized as the services are performed.
The Company’s Environmental Services segment earns revenues primarily from emergency response, retainer, consulting and training, project management and remediation services. Emergency response revenues are recognized as services are provided and are dependent on the magnitude and number of individual responses. Retainer agreements with vessel owners generally range from one to three years while retainer agreements with facility owners can be as long as ten years. Such retainer fees are generally recognized ratably over the term of the contract. Consulting and training services fees are recognized as the services are provided based on the contract terms. Project management and remediation services are provided on a time and material basis with revenues recognized as the services are provided or on a fixed fee bid basis with revenues and expenses recognized upon completion of the contract.
The Company’s Commodity Trading and Logistics segment earns revenues from the sale of rice, sugar and renewable fuels (primarily ethanol), the rental of tank storage, and through voyage affreightment contracts on leased-in liquid tank barges and towboats. Revenues from rice, sugar and renewable fuel sales are recorded when title transfers to the buyer, typically when cash is received. Revenues from the rental of tank storage are recognized ratably over the lease periods. Revenues from voyage affreightment contracts are generally recognized over the progress of the voyage while the related costs are expensed as incurred.
Cash Equivalents. The Company considers all highly liquid investments with an original maturity of three months or less to be cash equivalents. Cash equivalents consist of U.S treasury securities, money market instruments, time deposits and overnight investments.
Restricted Cash. Restricted cash consists primarily of U.S. treasury securities and cash which has been generated from the operations of five of Marine Transportation Services’ U.S.-flag double-hull product tankers (see Note 8).
Marketable Securities. Marketable equity securities with readily determinable fair values and debt securities are reported in the accompanying consolidated balance sheets as marketable securities. These investments are stated at fair value with, effective October 1, 2008 (see discussion below), both realized and unrealized gains and losses reported in the accompanying consolidated statements of income as marketable security gains (losses), net. Short sales of marketable securities are stated at fair value in the accompanying consolidated balance sheets with both realized and unrealized gains and losses reported in the accompanying consolidated statements of income as marketable security gains (losses), net.
93
Table of Contents
Effective October 1, 2008, the Company designated its investments in marketable equity and debt securities as trading securities and transferred securities of $72.9 million with net unrealized holding losses of $4.6 million from their previous available-for-sale designation. Prior to this transfer, unrealized gains and losses on available-for-sale marketable equity and debt securities were reported in other comprehensive income (loss) and realized gains and losses on available-for-sale marketable equity and debt securities were reported in the accompanying consolidated statements of income as marketable security gains (losses), net.
Trade Receivables. Customers of Offshore Marine Services, Marine Transportation Services and Aviation Services are primarily major and independent oil and gas exploration and production companies. Customers of Inland River Services are primarily major agricultural and industrial companies based within the United States. Oil spill, emergency response and remediation services are provided by Environmental Services to domestic and international shippers, major oil companies, independent exploration and production companies, pipeline and transportation companies, power generating operators, industrial companies, airports and state and local government agencies. Customers of Commodity Trading and Logistics include major agricultural and industrial companies, major and independent oil and gas production companies, foreign governments and local distributors. All customers are granted credit on a short-term basis and related credit risks are considered minimal. The Company routinely reviews its trade receivables and makes provisions for probable doubtful accounts; however, those provisions are estimates and actual results could differ from those estimates and those differences may be material. Trade receivables are deemed uncollectible and removed from accounts receivable and the allowance for doubtful accounts when collection efforts have been exhausted.
Derivative Instruments. Effective January 1, 2009, the Company adopted new accounting rules established by the FASB that require enhanced disclosures for derivative instruments and hedging activities. The new accounting rules require disclosure by the Company about how and why it uses derivative instruments and hedges, how derivative instruments and related hedged items are accounted for and how derivative instruments and related hedged items affect an entity’s financial position, financial performance and cash flows. The adoption of the new accounting rules had no material impact on the Company’s consolidated financial position or its results of operations.
The Company accounts for derivatives through the use of a fair value concept whereby all of the Company’s derivative positions are stated at fair value in the accompanying consolidated balance sheets. Realized and unrealized gains and losses on derivatives not designated as hedges are reported in the accompanying consolidated statements of income as derivative gains (losses), net. Realized and unrealized gains and losses on derivatives designated as fair value hedges are recognized as corresponding increases or decreases in the fair value of the underlying hedged item to the extent they are effective, with any ineffective portion reported in the accompanying consolidated statements of income as derivative gains (losses), net. Realized and unrealized gains and losses on derivatives designated as cash flow hedges are reported as a component of other comprehensive income in the accompanying consolidated statement of changes in equity to the extent they are effective and reclassified into earnings on the same line item associated with the hedged transaction and in the same period the hedged transaction affects earnings. Any ineffective portion of cash flow hedges are reported in the accompanying consolidated statements of income as derivative gains (losses), net. Realized and unrealized gains and losses on derivatives designated as cash flow hedges that are entered into by the Company’s equity method investees are also reported as a component of the Company’s other comprehensive income (loss) in proportion to the Company’s ownership percentage in the investee, with reclassifications and ineffective portions being included in equity in earnings of 50% or less owned companies in the accompanying consolidated statements of income.
Concentrations of Credit Risk. The Company is exposed to concentrations of credit risk associated with its cash and cash equivalents, marketable securities and derivative instruments. The Company minimizes its credit risk relating to these positions by monitoring the financial condition of the financial institutions and counterparties involved and by primarily conducting business with large, well-established financial institutions and diversifying its counterparties. The Company does not currently anticipate nonperformance by any of its
94
Table of Contents
significant counterparties. The Company is also exposed to concentrations of credit risk relating to its receivables due from customers in the industries described above. The Company does not generally require collateral or other security to support its outstanding receivables. The Company minimizes its credit risk relating to receivables by performing ongoing credit evaluations and, to date, credit losses have not been material.
Inventories. Inventories, which consist primarily of fuel and fuel oil in the Company’s Offshore Marine Services, Marine Transportation Services and Inland River Services segments, spare parts and fuel in the Company’s Aviation Services segment, and ethanol and rice in the Company’s Commodity Trading and Logistics segment, are stated at the lower of cost (using the first-in, first-out or average cost methods) or market. The Company records write-downs, as needed, to adjust the carrying amount of inventories to the lower of cost or market. During the year ended December 31, 2008, the Company recorded write-downs of $1.0 million related to Commodity Trading and Logistics’ rice inventory. There were no inventory write-downs during 2009 or 2007.
Property and Equipment. Equipment, stated at cost, is depreciated using the straight line method over the estimated useful life of the asset to an estimated salvage value. With respect to each class of asset, the estimated useful life is typically based upon a newly built asset being placed into service and represents the point at which it is typically not justifiable for the Company to continue to operate the asset in the same or similar manner. From time to time, the Company may acquire older assets that have already exceeded the Company’s useful life policy, in which case the Company depreciates such assets based on its best estimate of remaining useful life, typically the next survey or certification date.
As of December 31, 2009, the estimated useful life (in years) of each of the Company’s major classes of new equipment was as follows:
| Offshore support vessels |
20 | |
| U.S.-flag tankers(1) |
25 | |
| Inland river dry cargo and deck barges |
20 | |
| Inland river liquid tank barges |
25 | |
| Inland river towboats |
25 | |
| Helicopters |
12 | |
| Harbor and offshore tugs(2) |
25 | |
| Ocean liquid tank barges |
25 |
| (1) | Subject to Oil Pollution Act of 1990 (“OPA 90”) requirements. |
| (2) | Effective April 1, 2008, the Company changed its estimated useful life for newly built harbor and offshore tugs from 40 to 25 years and reduced the remaining useful life of certain vessels within its harbor and offshore tug fleet due to the more frequent occurrence of technological advancements in vessel design. These changes in estimates did not materially impact the comparability of financial information for the periods presented. |
95
Table of Contents
The Company’s major classes of property and equipment as of December 31 were as follows (in thousands):
| Historical Cost(1) |
Accumulated Depreciation |
Net Book Value | ||||||||
| 2009 |
||||||||||
| Offshore support vessels |
$ | 978,959 | $ | (316,981 | ) | $ | 661,978 | |||
| U.S.-flag tankers |
519,688 | (154,944 | ) | 364,744 | ||||||
| Inland river barges and towboats |
298,144 | (64,882 | ) | 233,262 | ||||||
| Helicopters |
585,404 | (111,788 | ) | 473,616 | ||||||
| Harbor and Offshore tugs and ocean liquid tank barges |
179,849 | (24,516 | ) | 155,333 | ||||||
| Equipment, furniture, fixtures, vehicles and other |
189,819 | (81,152 | ) | 108,667 | ||||||
| Construction in progress |
81,148 | — | 81,148 | |||||||
| $ | 2,833,011 | $ | (754,263 | ) | $ | 2,078,748 | ||||
| 2008 |
||||||||||
| Offshore support vessels |
$ | 957,017 | $ | (258,750 | ) | $ | 698,267 | |||
| U.S.-flag tankers |
519,564 | (123,322 | ) | 396,242 | ||||||
| Inland river barges and towboats |
288,170 | (52,766 | ) | 235,404 | ||||||
| Helicopters |
527,533 | (81,123 | ) | 446,410 | ||||||
| Harbor and Offshore tugs and ocean liquid tank barges |
159,442 | (19,641 | ) | 139,801 | ||||||
| Equipment, furniture, fixtures, vehicles and other |
165,617 | (66,204 | ) | 99,413 | ||||||
| Construction in progress |
123,979 | — | 123,979 | |||||||
| $ | 2,741,322 | $ | (601,806 | ) | $ | 2,139,516 | ||||
| (1) | Includes property and equipment acquired in business acquisitions and recorded at fair value as of the date of the acquisition. |
Depreciation expense totaled $155.1 million, $150.9 million and $147.7 million in 2009, 2008 and 2007, respectively.
Equipment maintenance and repair costs and the costs of routine drydock inspections performed on vessels are charged to operating expense as incurred. Expenditures that extend the useful life or improve the marketing and commercial characteristics of equipment as well as major improvements to other properties are capitalized. Certain interest costs incurred during the construction of equipment are capitalized as part of the assets’ carrying values and are amortized over such assets estimated useful lives. Capitalized interest totaled $2.3 million, $7.7 million and $10.7 million in 2009, 2008 and 2007, respectively.
Intangible Assets. The Company’s intangible assets primarily arose from business acquisitions (see Note 4) and consist of non-compete agreements, trademarks and tradenames, customer relationships, software and technology and acquired contractual rights. These intangible assets are amortized over their estimated useful lives ranging from two to ten years. During the years ended December 31, 2009, 2008 and 2007, the Company recognized amortization expense of $5.0 million, $5.5 million and $6.6 million, respectively.
96
Table of Contents
The Company’s intangible assets by type were as follows (in thousands):
| Non-Compete Agreements |
Trademark/ Tradenames |
Customer Relationships |
Software/ Technology |
Acquired Contractual Rights |
Total | |||||||||||||||||||
| Gross Carrying Value | ||||||||||||||||||||||||
| Year Ended December 31, 2007 |
$ | 300 | $ | 5,500 | $ | 31,542 | $ | 600 | $ | 4,772 | $ | 42,714 | ||||||||||||
| Purchase price adjustments to previously acquired intangible assets |
665 | 332 | 2,628 | — | — | 3,625 | ||||||||||||||||||
| Foreign currency translation |
(3 | ) | (25 | ) | (95 | ) | — | — | (123 | ) | ||||||||||||||
| Year Ended December 31, 2008 |
962 | 5,807 | 34,075 | 600 | 4,772 | 46,216 | ||||||||||||||||||
| Acquired intangible assets |
40 | — | — | — | — | 40 | ||||||||||||||||||
| Foreign currency translation |
— | (2 | ) | 32 | — | — | 30 | |||||||||||||||||
| Year ended December 31, 2009 |
$ | 1,002 | $ | 5,805 | $ | 34,107 | $ | 600 | $ | 4,772 | $ | 46,286 | ||||||||||||
| Accumulated Amortization | ||||||||||||||||||||||||
| Year Ended December 31, 2007 |
$ | (54 | ) | $ | (1,184 | ) | $ | (8,508 | ) | $ | (150 | ) | $ | (2,318 | ) | $ | (12,214 | ) | ||||||
| Amortization expense |
(201 | ) | (545 | ) | (3,992 | ) | (120 | ) | (666 | ) | (5,524 | ) | ||||||||||||
| Year Ended December 31, 2008 |
(255 | ) | (1,729 | ) | (12,500 | ) | (270 | ) | (2,984 | ) | (17,738 | ) | ||||||||||||
| Amortization expense |
(179 | ) | (552 | ) | (3,780 | ) | (120 | ) | (363 | ) | (4,994 | ) | ||||||||||||
| Year ended December 31, 2009 |
$ | (434 | ) | $ | (2,281 | ) | $ | (16,280 | ) | $ | (390 | ) | $ | (3,347 | ) | $ | (22,732 | ) | ||||||
| Weighted average remaining contractual life, in years |
3.28 | 5.70 | 6.14 | 3.50 | 1.75 | 5.79 | ||||||||||||||||||
Future amortization expense of intangible assets for each of the years ended December 31 was as follows (in thousands):
| 2010 |
$ | 4,726 | |
| 2011 |
4,502 | ||
| 2012 |
4,162 | ||
| 2013 |
3,813 | ||
| 2014 |
3,225 | ||
| 2015 to 2017 |
3,126 | ||
| $ | 23,554 | ||
Impairment of Long-Lived Assets. The Company performs an impairment analysis of long-lived assets used in operations, including intangible assets, when indicators of impairment are present. If the carrying value of the assets is not recoverable, as determined by the estimated undiscounted cash flows, the carrying value of the assets is reduced to fair value. Generally, fair value is determined using valuation techniques, such as expected discounted cash flows or appraisals, as appropriate. During the years ended 2009, 2008 and 2007, the Company recognized impairment charges of $2.3 million, $1.1 million and $0.1 million, respectively, related to long-lived assets held for use.
The Company believes the Seabulk America is one of six vessels designed and certified to carry complicated chemical cargos in the domestic coastwise trade. Given the overriding effects of the global economic slowdown,
97
Table of Contents
demand for the vessel’s specialized services was soft during 2009. The Company believes the chemical industry is undergoing a cyclical market down-turn that will gradually recover; however, the Seabulk America requires a regulatory dry-docking during the third quarter of 2010, a requirement for continued operation. A decision as to whether or not this expenditure should be incurred will be made against the then prevailing market conditions. A decision to cease vessel operations and lay-up the Seabulk America amid continued weak market conditions could potentially result in a significant impairment charge. The carrying value of the Seabulk America was $26.5 million as of December 31, 2009, with contributed operating revenues of $12.4 million during the year ended December 31, 2009.
Impairment of 50% or Less Owned Companies. The Company performs regular reviews of each investee’s financial condition, the business outlook for its products and services, and its present and projected results and cash flows. When an investee has experienced consistent declines in financial performance or difficulties in raising capital to continue operations, and when the Company expects the decline to be other-than-temporary, the investment is written down to fair value. Actual results may vary from estimates due to the uncertainty regarding the projected financial performance of investees, the severity and expected duration of declines in value, and the available liquidity in the capital markets to support the continuing operations of the investees in which the Company has investments. During the year ended December 31, 2009, the Company recognized impairment charges of $1.1 million related to 50% or less owned companies. The Company did not recognize any impairment charges in 2008 or 2007.
Goodwill. Goodwill is recorded when the purchase price paid for an acquisition exceeds the fair value of net identified tangible and intangible assets acquired. The Company performs an annual impairment test of goodwill and further periodic tests to the extent indicators of impairment develop between annual impairment tests. The Company’s impairment review process compares the fair value of the reporting unit to its carrying value, including the goodwill related to the reporting unit. To determine the fair value of the reporting unit, the Company uses a discounted future cash flow approach that uses estimates for revenues, costs and appropriate discount rates, among others. These estimates are reviewed each time the Company tests goodwill for impairment and are typically developed as part of the Company’s routine business planning and forecasting process. While the Company believes its estimates and assumptions are reasonable, variations from those estimates could produce materially different results. The Company did not recognize any goodwill impairments in 2009, 2008 or 2007. During the year ended December 31, 2008, the Company reduced goodwill by $11.0 million based on the expected future utilization of acquired foreign tax credit carryforwards and federal and state net operating loss carryforwards (see Note 7).
Business Combinations. Effective January 1, 2009, the Company adopted new accounting rules established by the FASB related to business combinations. The new accounting rules amended the Company’s accounting policy by requiring the Company to recognize on its future acquisitions, with certain exceptions, 100 percent of the fair value of assets acquired, liabilities assumed, and non-controlling interests when the acquisition constitutes a change in control of the acquired entity. The new accounting rules establish that shares issued in consideration for a business combination be at fair value on the acquisition date, requires the recognition of contingent consideration arrangements at their acquisition-date fair values with subsequent changes in fair value generally reflected in earnings, and requires recognition of pre-acquisition loss and gain contingencies at their acquisition-date fair values. The new accounting rules also provide for the capitalization of in-process research and development assets acquired, requires acquisition-related transaction costs to be expensed as incurred, allows for the capitalization of acquisition-related restructuring costs only if the criteria in the FASB rules related to exit or disposal cost obligations are met as of the acquisition date, and requires as an adjustment to income tax expense any changes in an acquirer’s existing income tax valuation allowances and tax uncertainty accruals. The operating results of entities acquired are included in the accompanying consolidated statements of income from the date of acquisition (see Note 4).
Deferred Financing Costs. Deferred financing costs incurred in connection with the issuance of debt are amortized over the life of the related debt using the effective interest rate method. Amortization expense for
98
Table of Contents
deferred financing costs totaled $1.0 million, $0.7 million and $0.7 million in 2009, 2008 and 2007, respectively, and is included in interest expense in the accompanying consolidated statements of income.
Self-insurance Liabilities. The Company maintains hull, liability and war risk, general liability, workers compensation and other insurance customary in the industries in which it operates. Most of the insurance is obtained through SEACOR sponsored programs, with premiums charged to participating businesses based on insured asset values. Both the marine hull and liability policies have significant annual aggregate deductibles. Marine hull annual aggregate deductibles are accrued as claims are incurred by participating businesses and proportionately shared among the participating businesses. Marine liability annual aggregate deductibles are accrued based on historical loss experience and actual claims incurred. The Company also maintains self-insured health benefit plans for its participating employees. Exposure to the health benefit plans are limited by maintaining stop-loss and aggregate liability coverage. To the extent that estimated self-insurance losses, including the accrual of annual aggregate deductibles, differ from actual losses realized, the Company’s insurance reserves could differ significantly and may result in either higher or lower insurance expense in future periods.
Income Taxes. Deferred income tax assets and liabilities have been provided in recognition of the income tax effect attributable to the book and tax basis differences of assets and liabilities reported in the accompanying consolidated financial statements. Deferred tax assets or liabilities are provided using the enacted tax rates expected to apply to taxable income in the periods in which they are expected to be settled or realized. Interest and penalties relating to uncertain tax positions are recognized in interest expense and administrative and general, respectively, in the accompanying consolidated statements of income. The Company records a valuation allowance to reduce its deferred tax assets if it is more likely than not that some portion or all of the deferred tax assets will not be realized.
Deferred Gains. From time to time, the Company enters into vessel sale and leaseback transactions and sells vessels to business ventures in which it holds an equity ownership interest. A portion of the gains realized from these transactions are not immediately recognized in income and have been recorded in the accompanying consolidated balance sheets in deferred gains and other liabilities. In sale and leaseback transactions, gains are deferred to the extent of the present value of future minimum lease payments and are amortized as reductions to rental expense over the applicable lease terms. In business venture sale transactions, gains are deferred and amortized based on the Company’s ownership interest, cash received from the business venture and the applicable vessels’ depreciable lives. Deferred gain activity for the years ended December 31 was as follows (in thousands):
| 2009 | 2008 | 2007 | ||||||||||
| Balance at beginning of year |
$ | 99,204 | $ | 109,284 | $ | 52,077 | ||||||
| Deferred income arising from vessel sales |
17,471 | 10,521 | 81,413 | |||||||||
| Amortization of deferred gains |
(22,815 | ) | (20,635 | ) | (13,689 | ) | ||||||
| Reduction of deferred gains on repurchased vessels |
(629 | ) | — | (10,357 | ) | |||||||
| Currency translation and other |
— | 34 | (160 | ) | ||||||||
| Balance at end of year |
$ | 93,231 | $ | 99,204 | $ | 109,284 | ||||||
Stock Based Compensation. Stock based compensation is amortized to compensation expense on a straight line basis over the requisite service period of the grants using the Black-Scholes valuation model. The Company will reconsider its use of this model if additional information becomes available in the future that indicates another model would be more appropriate, or if grants issued in future periods have characteristics that cannot be reasonably estimated using this model. The Company does not estimate forfeitures in its expense calculations as forfeiture history has been minor. The Company presents the excess tax benefits from the exercise of stock options as a financing cash flow in the accompanying consolidated statements of cash flows.
99
Table of Contents
Foreign Currency Translation. The assets, liabilities and results of operations of certain SEACOR subsidiaries are measured using their functional currency which is the currency of the primary foreign economic environment in which they operate. Upon consolidating these subsidiaries with SEACOR, their assets and liabilities are translated to U.S. dollars at currency exchange rates as of the balance sheet date and their revenues and expenses are translated at the weighted average currency exchange rates during the applicable reporting periods. Translation adjustments resulting from the process of translating these subsidiaries’ financial statements are reported in other comprehensive income (loss) in the accompanying consolidated statements of changes in equity.
Foreign Currency Transactions. Certain SEACOR subsidiaries enter into transactions denominated in currencies other than their functional currency. Changes in currency exchange rates between the functional currency and the currency in which a transaction is denominated are included in foreign currency gains (losses), net in the accompanying consolidated statements of income in the period in which the currency exchange rates change.
Earnings Per Share. Basic earnings per common share are computed based on the weighted average number of common shares issued and outstanding during the relevant periods. Diluted earnings per common share are computed based on the weighted average number of common shares issued and outstanding plus the effect of potentially dilutive securities. In determining dilutive securities for this purpose, the Company assumes, through the application of the treasury stock and if-converted methods, all restricted stock grants have vested, all common shares have been issued pursuant to the exercise of all outstanding stock options and all common shares have been issued pursuant to the conversion of all outstanding convertible notes. Diluted earnings per share for the years ended December 31, 2009, 2008 and 2007 excluded 810,260, 650,757 and 328,420, respectively, of certain share awards as the effect of their inclusion in the computation would have been antidilutive.
Computations of basic and diluted earnings per common share of SEACOR are included in the table below (in thousands, except per share data). Certain prior period information has been retrospectively adjusted to reflect the adoption of new accounting rules established by the FASB related to the Company’s convertible debt (see Note 8).
| Net Income | Average o/s Shares |
Per Share | ||||||
| 2009 |
||||||||
| Basic Earnings Per Common Share of SEACOR Holdings Inc. |
$ | 143,810 | 19,950,702 | $ | 7.21 | |||
| Effect of Dilutive Securities, net of tax: |
||||||||
| Options and Restricted Stock |
— | 189,545 | ||||||
| Convertible Securities |
9,870 | 3,247,921 | ||||||
| Diluted Earnings Per Common Share of SEACOR Holdings Inc. |
$ | 153,680 | 23,388,168 | $ | 6.57 | |||
| 2008 |
||||||||
| Basic Earnings Per Common Share of SEACOR Holdings Inc. |
$ | 218,543 | 20,893,390 | $ | 10.46 | |||
| Effect of Dilutive Securities: |
||||||||
| Options and Restricted Stock |
— | 388,221 | ||||||
| Convertible Securities |
9,995 | 3,417,570 | ||||||
| Diluted Earnings Per Common Share of SEACOR Holdings Inc |
$ | 228,538 | 24,699,181 | $ | 9.25 | |||
| 2007 |
||||||||
| Basic Earnings Per Common Share of SEACOR Holdings Inc. |
$ | 236,819 | 23,547,708 | $ | 10.06 | |||
| Effect of Dilutive Securities: |
||||||||
| Options and Restricted Stock |
— | 301,417 | ||||||
| Convertible Securities |
9,679 | 3,417,625 | ||||||
| Diluted Earnings Per Common Share of SEACOR Holdings Inc |
$ | 246,498 | 27,266,750 | $ | 9.04 | |||
100
Table of Contents
Comprehensive Income. Comprehensive income is the total of net income and all other changes in equity of an enterprise that result from transactions and other economic events of a reporting period other than transactions with owners. The Company has chosen to disclose comprehensive income in the accompanying consolidated statements of changes in equity. The Company’s other comprehensive income (loss) is comprised of net currency translation adjustments, net unrealized gains and losses on available-for-sale marketable securities and net derivative losses on cash flow hedges.
The components of other comprehensive income (loss) and allocated income tax (expense) benefit for the years ended December 31 were as follows (in thousands):
| Before-Tax Amount |
Tax (Expense) Benefit |
Net-of-Tax Amount |
||||||||||
| 2009 |
||||||||||||
| Foreign currency translation adjustments |
$ | 3,063 | $ | (1,074 | ) | $ | 1,989 | |||||
| Derivative losses on cash flow hedges (see Note 3) |
(314 | ) | 110 | (204 | ) | |||||||
| Other comprehensive income |
$ | 2,749 | $ | (964 | ) | $ | 1,785 | |||||
| 2008 |
||||||||||||
| Foreign currency translation adjustments |
$ | (10,743 | ) | $ | 3,760 | $ | (6,983 | ) | ||||
| Unrealized net gains and losses on available-for-sale securities: |
||||||||||||
| Unrealized net losses arising during the period |
(4,356 | ) | 1,525 | (2,831 | ) | |||||||
| Reclassification adjustment for net gains included in net income |
(3,863 | ) | 1,352 | (2,511 | ) | |||||||
| Transfer of unrealized net losses from available-for-sale to trading |
4,622 | (1,618 | ) | 3,004 | ||||||||
| (3,597 | ) | 1,259 | (2,338 | ) | ||||||||
| Other comprehensive loss |
$ | (14,340 | ) | $ | 5,019 | $ | (9,321 | ) | ||||
| 2007 |
||||||||||||
| Foreign currency translation adjustments |
$ | 1,429 | $ | (500 | ) | $ | 929 | |||||
| Unrealized net gains and losses on available-for-sale securities: |
||||||||||||
| Unrealized net gains arising during the period |
5,224 | (1,828 | ) | 3,396 | ||||||||
| Reclassification adjustment for net gains included in net income |
(4,631 | ) | 1,621 | (3,010 | ) | |||||||
| 593 | (207 | ) | 386 | |||||||||
| Other comprehensive income |
$ | 2,022 | $ | (707 | ) | $ | 1,315 | |||||
Reclassifications. Certain reclassifications of prior year information have been made to conform to the presentation of current year information.
| 2. | FINANCIAL INSTRUMENTS |
The fair value of an asset or liability is the price that would be received to sell an asset or transfer a liability (an exit price) in the principal or most advantageous market for the asset or liability in an orderly transaction between market participants on the measurement date. The Company utilizes a fair value hierarchy that maximizes the use of observable inputs and minimizes the use of unobservable inputs when measuring fair value and defines three levels of inputs that may be used to measure fair value. Level 1 inputs are quoted prices in active markets for identical assets or liabilities. Level 2 inputs are observable inputs other than quoted prices included in Level 1 that are observable for the asset or liability, either directly or indirectly, including quoted prices for similar assets or liabilities in active markets, quoted prices in markets that are not active, inputs other
101
Table of Contents
than quoted prices that are observable for the asset or liability, or inputs derived from observable market data. Level 3 inputs are unobservable inputs that are supported by little or no market activity and are significant to the fair value of the assets or liabilities.
The Company’s assets and liabilities as of December 31, 2009 that are measured at fair value on a recurring basis are summarized below (in thousands):
| Level 1 | Level 2 | Level 3 | |||||||
| ASSETS |
|||||||||
| Marketable securities |
$ | 42,909 | $ | 25,230 | $ | — | |||
| Derivative instruments (included in other receivables) |
1,316 | 8,362 | — | ||||||
| Construction reserve funds and Title XI reserve funds |
289,750 | — | — | ||||||
| LIABILITIES |
|||||||||
| Short sale of marketable securities |
18,442 | — | — | ||||||
| Derivative instruments (included in other current liabilities) |
5,807 | 4,022 | — | ||||||
Effective January 1, 2009, the Company adopted new accounting rules established by the FASB related to disclosure requirements of fair value measurements for certain nonfinancial assets and liabilities. The adoption of the new accounting rules had no material impact on the Company’s consolidated financial position or its results of operations.
The estimated fair value of the Company’s other financial assets and liabilities as of December 31 are included in the table below (in thousands). Certain prior period information has been retrospectively adjusted to reflect the adoption of new accounting rules established by the FASB related to the Company’s convertible debt (see Note 8).
| 2009 | 2008 | |||||||||||
| Carrying Amount |
Estimated Fair Value |
Carrying Amount |
Estimated Fair Value | |||||||||
| ASSETS |
||||||||||||
| Cash, cash equivalents and restricted cash |
$ | 499,918 | $ | 499,918 | $ | 296,229 | $ | 296,229 | ||||
| Collateral and escrow deposits (included in other assets) |
— | — | 2,198 | 2,198 | ||||||||
| Investments, at cost, in 50% or less owned companies (included in other assets) |
7,506 | see below | 8,219 | see below | ||||||||
| Notes receivable from other business ventures (included in other assets) |
11,343 | see below | 8,166 | see below | ||||||||
| LIABILITIES |
||||||||||||
| Long-term debt, including current portion |
785,140 | 783,423 | 929,360 | 926,470 | ||||||||
The carrying value of cash, cash equivalents, restricted cash and collateral and escrow deposits approximates fair value. The fair value of the Company’s long-term debt was estimated based upon quoted market prices or by using discounted cash flow analyses based on estimated current rates for similar types of arrangements. It was not practicable to estimate the fair value of the Company’s investments, at cost, in 50% or less owned companies because of the lack of quoted market prices and the inability to estimate fair value without incurring excessive costs. It was not practicable to estimate the fair value of the Company’s notes receivable from other business ventures because the timing of settlement of these notes is not certain. Considerable judgment was required in developing certain of the estimates of fair value and, accordingly, the estimates presented herein are not necessarily indicative of the amounts that the Company could realize in a current market exchange.
102
Table of Contents
Marketable Securities. Marketable securities gains (losses), net include gains of $15.8 million for the year ended December 31, 2009 and losses of $3.5 million for the three months ended December 31, 2008 (period subsequent to portfolio designation as trading securities – see Note 1) related to marketable security positions held by the Company as of December 31, 2009.
| 3. | DERIVATIVE INSTRUMENTS AND HEDGING STRATEGIES |
Derivative instruments are classified as either assets or liabilities based on their individual fair values. Derivative assets and liabilities are included in other receivables and other current liabilities, respectively, in the accompanying consolidated balance sheets. The fair values of the Company’s derivative instruments as of December 31 were as follows (in thousands):
| 2009 | 2008 | |||||||||||
| Derivative Asset |
Derivative Liability |
Derivative Asset |
Derivative Liability | |||||||||
| Derivatives designated as hedging instruments: |
||||||||||||
| Forward currency exchange contracts (fair value hedges) |
$ | 2,174 | $ | — | $ | 1,198 | $ | — | ||||
| Interest rate swap agreements (cash flow hedges) |
632 | 1,333 | — | — | ||||||||
| 2,806 | 1,333 | 1,198 | — | |||||||||
| Derivatives not designated as hedging instruments: |
||||||||||||
| Options on equities and equity indices |
5 | 789 | — | 2,527 | ||||||||
| Forward currency exchange, option and future contracts |
924 | 1,429 | 1 | 2,014 | ||||||||
| Interest rate swap agreements |
— | 478 | — | — | ||||||||
| Commodity swap, option and future contracts: |
||||||||||||
| Exchange traded |
1,290 | 3,637 | — | 163 | ||||||||
| Non-exchange traded |
4,645 | 2,085 | 151 | — | ||||||||
| U.S. treasury notes and bond future and option contracts |
8 | 78 | — | — | ||||||||
| 6,872 | 8,496 | 152 | 4,704 | |||||||||
| $ | 9,678 | $ | 9,829 | $ | 1,350 | $ | 4,704 | |||||
Fair Value Hedges. As of December 31, 2009 and 2008, the Company designated certain of its forward currency exchange contracts with notional values of €16.0 million and €20.0 million, respectively, as fair value hedges in respect of capital commitments denominated in euros for assets scheduled to be delivered in 2010. By entering into these forward currency exchange contracts, the Company has fixed a portion of its euro capital commitments in U.S. dollars to protect against currency fluctuations. During the year ended December 31, 2009, the Company dedesignated €19.0 million notional value of these contracts as fair value hedges. Subsequent to December 31, 2009, the Company dedesignated €8.0 million notional value of these contracts as fair value hedges.
The Company recognized gains (losses) on derivative instruments designated as fair value hedges for the years ended December 31 as follows (in thousands):
| Derivative gains (losses), net | |||||||||||
| 2009 | 2008 | 2007 | |||||||||
| Forward currency exchange contracts, effective and ineffective portions |
$ | 205 | $ | 10,900 | $ | 21,359 | |||||
| Increase in fair value of hedged items included in property and equipment corresponding to effective portion of derivative (gains) losses |
60 | (10,610 | ) | (18,431 | ) | ||||||
| $ | 265 | $ | 290 | $ | 2,928 | ||||||
103
Table of Contents
Cash Flow Hedges. As of December 31, 2009, the Company is a party to various interest rate swap agreements with maturities ranging from 2013 to 2014 that have been designated as cash flow hedges. These agreements call for the Company to pay fixed interest rates ranging from 2.25% to 2.85% on aggregate notional values of $125.0 million and receive a variable interest rate based on LIBOR on these notional values. During the year ended December 31, 2009, the Company dedesignated an interest rate swap due 2012 with a notional value of $18.0 million. One of the Company’s Offshore Marine Services joint ventures has also entered into an interest rate swap agreement maturing in 2014 that has been designated as a cash flow hedge. This instrument calls for the joint venture to pay a fixed interest rate of 3.05% on the notional value of $29.6 million and receive a variable interest rate based on LIBOR on the notional value. By entering into these interest rate swap agreements, the Company and its joint venture have converted the variable LIBOR component of certain of their outstanding borrowings to a fixed interest rate.
For the year December 31, 2009, the Company recognized gains (losses) on derivative instruments designated as cash flow hedges as follows (in thousands):
| Other comprehensive income (loss) |
Derivative gains (losses), net |
|||||||
| Interest rate swap agreements, effective portion |
$ | (1,507 | ) | $ | — | |||
| Interest rate swap agreements, ineffective portion |
— | (392 | ) | |||||
| Reclassification of derivative losses to interest expense or equity in earnings of 50% or less owned companies |
1,193 | — | ||||||
| $ | (314 | ) | $ | (392 | ) | |||
Other Derivative Instruments. The Company recognized gains (losses) on derivative instruments not designated as hedging instruments for the years ended December 31 as follows (in thousands):
| Derivative gains (losses), net | ||||||||||||
| 2009 | 2008 | 2007 | ||||||||||
| Options on equities and equity indices |
$ | 3,244 | $ | 9,527 | $ | 1,565 | ||||||
| Forward currency exchange, option and future contracts |
4,055 | (15,297 | ) | 5,160 | ||||||||
| Interest rate swap agreements |
(571 | ) | — | 186 | ||||||||
| Commodity swap, option and future contracts: |
||||||||||||
| Exchange traded |
(2,278 | ) | (33 | ) | 299 | |||||||
| Non-exchange traded |
6,123 | (335 | ) | 736 | ||||||||
| U.S. treasury notes and bond future and option contracts |
515 | (7,740 | ) | (39 | ) | |||||||
| $ | 11,088 | $ | (13,878 | ) | $ | 7,907 | ||||||
The Company holds positions in publicly traded equity options that convey the right or obligation to engage in a future transaction on the underlying equity security or index. The Company’s investment in equity options primarily includes positions in energy, marine, transportation and other related businesses. These contracts are typically entered into to mitigate the risk of changes in market value of marketable security positions that the Company is either about to acquire, has acquired or is about to dispose of.
The Company has entered into and settled forward currency exchange, option and future contracts with respect to various foreign currencies. As of December 31, 2009, the outstanding forward currency exchange contracts translated into a net purchase of foreign currencies with an aggregate U.S. dollar equivalent of $55.4 million. These contracts enable the Company to buy currencies in the future at fixed exchange rates, which could
104
Table of Contents
offset possible consequences of changes in foreign exchange rates with respect to the Company’s business conducted in Europe, Africa, Mexico, Central and South America, the Middle East and Asia. The Company generally does not enter into contracts with forward settlement dates beyond twelve months.
The Company has entered into various interest rate swap agreements maturing in 2012 and 2013 that call for the Company to pay fixed interest rates ranging from 1.79% to 2.59% on aggregate notional values of $76.5 million and receive a variable interest rate based on LIBOR on these notional values. The general purpose of these interest rate swap agreements is to provide protection against increases in interest rates, which might lead to higher interest costs for the Company.
The Company has entered into and settled positions in various commodity swap, option and future contracts (primarily natural gas, crude oil, gasoline, ethanol, sugar and rice). The general purpose of these transactions is to provide value to the Company should there be a sustained decline in the price of commodities that could lead to a reduction in the market values and cash flows of the Company’s offshore, inland river and commodity trading and logistics businesses.
The Company has also entered into various forward contracts with unrelated third parties to buy and sell commodities. These contracts are non-exchange traded and typically result in physical delivery of the underlying commodity upon settlement. As of December 31, 2009, the Company carried inventory (primarily ethanol) of $21.1 million relating to such settled transactions.
The Company has entered into and settled various positions in U.S. treasury notes and bonds through futures or options on futures tied to U.S. treasury notes. The general purpose of these transactions is to provide value to the Company should the price of U.S. treasury notes and bonds decline, leading to generally higher interest rates, which might lead to higher interest costs for the Company.
| 4. | ACQUISITIONS AND DISPOSITIONS |
PIER Acquisition. On December 1, 2009, the Company acquired all of the issued and outstanding shares of PIER Systems Inc. (“PIER”), a provider of crisis communication consulting services and software in the United States and abroad, for $1.6 million. The selling stockholders of PIER have the opportunity to receive additional consideration of up to $1.3 million based upon certain performance measures over the period from the date of acquisition through May 2011. The Company performed a preliminary fair value analysis and the purchase price was allocated to the acquired assets and liabilities based on their fair values resulting in no goodwill being recorded. The preliminary fair value analysis assumes no contingent consideration will be earned by the selling stockholders. The preliminary fair value analysis is pending the completion of a final valuation for the acquired assets and liabilities.
CBK Acquisition. On December 1, 2009, the Company acquired all of the assets of CBK, Inc., a liquid cargo servicing company, for $0.5 million in cash ($0.3 million in 2009 and $0.2 million in January 2010). The Company performed a preliminary fair value analysis and the purchase price was allocated to the acquired assets based on their fair values resulting in $0.3 million in goodwill being recorded. The preliminary fair value analysis is pending the completion of a final valuation for the acquired assets and liabilities.
SES-CHEM Acquisition. On August 3, 2009, the Company acquired its partner’s 51% interest in SES-CHEM Company Limited (“SES-CHEM”), a provider of environmental services in Thailand, for $0.1 million in cash. Subsequent to the transaction, the Company owns all of the issued and outstanding shares of SES-CHEM. The Company performed a fair value analysis and the purchase price was allocated to the acquired assets and liabilities based on their fair values resulting in no goodwill being recorded. The fair value analysis of assets and liabilities acquired was finalized in October 2009.
V & A Acquisition. On May 21, 2009, the Company acquired a controlling interest in V&A Commodity Traders, Inc. (“V&A”), a sugar trading business, for $4.0 million. The Company’s purchase price included cash consideration of $1.3 million and forgiveness of a note due from V&A of $2.7 million. The Company performed
105
Table of Contents
a fair value analysis and the purchase price was allocated to the acquired assets and liabilities based on their fair values resulting in no goodwill being recorded. The fair value analysis of assets and liabilities acquired was finalized in June 2009.
Trident Acquisition. On January 2, 2008, the Company acquired all of the issued and outstanding shares of Trident Port Services, Inc. (“Trident”), providers of environmental services in northern California, for $1.2 million. The Company’s purchase price included cash consideration of $0.7 million and the assumption of a note payable of $0.5 million. The Company performed a fair value analysis and the purchase price was allocated to the acquired assets and liabilities based on their fair values, with the excess of purchase price over fair value recorded as goodwill in the amount of $0.5 million. The fair value analysis of assets and liabilities acquired was finalized in December 2008.
Rivers Edge Acquisition. On November 15, 2007, the Company acquired all of the issued and outstanding shares of Rivers Edge Services, Inc. and Kemp’s Rivers Edge Vactor Services, Inc. (collectively referred to as “Rivers Edge”), providers of remediation, demolition, and environmental services in the pacific northwestern United States, for $4.2 million. The Company’s purchase price included $0.8 million paid in 2008 relating to working capital adjustments and settlement of tax obligations due to the selling stockholder. Consideration paid also included the settlement of certain of Rivers Edge’s outstanding debt obligations at the time of acquisition. The Company performed a fair value analysis and the purchase price was allocated to the acquired assets and liabilities based on their fair values, with the excess of purchase price over fair value recorded as goodwill in the amount of $0.9 million. The fair value of assets and liabilities acquired was finalized in November 2008. The selling stockholder of Rivers Edge has the opportunity to receive additional consideration of up to $4.8 million based upon certain performance measures over the period from the date of acquisition through December 31, 2011, which will be recognized by the Company as compensation expense in the period earned by the selling stockholder. No additional consideration has been earned by the selling stockholder through December 31, 2009.
ACI Acquisition. On September 30, 2007, the Company acquired all of the issued and outstanding shares of AC Industrial Services Corporation (“ACI”), providers of environmental services in northern California, for $1.2 million. The Company performed a fair value analysis and the purchase price was allocated to the acquired assets and liabilities based on their fair values, with the excess of purchase price over fair value recorded as goodwill in the amount of $0.6 million. The fair value analysis of assets and liabilities acquired was finalized in September 2008.
SRI Acquisition. On September 7, 2007, the Company acquired all of the issued and outstanding shares of Solid Resources, Inc. and Solid Resources, LLC (collectively referred to as “SRI”), providers of environmental services in the southeastern United States, for $10.5 million. The Company performed a fair value analysis and the purchase price was allocated to the acquired assets and liabilities based on their fair values, with the excess of purchase price over fair value recorded as goodwill in the amount of $7.1 million. The fair value analysis of assets and liabilities acquired was finalized in September 2008. The selling stockholder of SRI has the opportunity to receive additional consideration of up to $39.5 million based upon certain performance measures over the period from the date of acquisition through September 30, 2011, which will be recognized by the Company as additional cost of the acquisition when the contingency is resolved and when any additional consideration is distributable. During the years ended December 31, 2009 and 2008, the Company paid $2.1 million and $3.9 million, respectively, of additional consideration in accordance with the acquisition agreement. As of December 31, 2009, the Company has paid $6.0 million, in the aggregate, of additional consideration, which was recorded as additional goodwill.
Link Acquisition. On September 7, 2007, the Company acquired all of the issued and outstanding shares of Link Associates International Global Limited (“Link”), a provider of environmental consulting services in the United Kingdom, for £2.3 million ($4.5 million). The Company’s purchase price included $0.1 million paid in 2008 relating to working capital adjustments. Consideration paid also included the settlement of Link’s outstanding debt obligations at the time of the acquisition. The Company performed a fair value analysis and the
106
Table of Contents
purchase price was allocated to the acquired assets and liabilities based on their fair values, with the excess of purchase price over fair value recorded as goodwill in the amount of £1.5 million ($2.9 million). The fair value analysis of assets and liabilities acquired was finalized in September 2008. The selling stockholder of Link has the opportunity to receive additional consideration of up to £2.8 million based upon certain performance measures during the period from the date of acquisition through May 31, 2010, which will be recognized by the Company as additional cost of the acquisition when the contingency is resolved and when any additional consideration is distributable. During the year ended December 31, 2009, the Company paid £61,560 ($0.1 million) of additional consideration in accordance with the acquisition agreement. No additional consideration was deemed distributable through December 31, 2008. As of December 31, 2009, the Company has paid $0.1 million million, in the aggregate, of additional consideration, which was recorded as additional goodwill.
Waxler Acquisition. On March 13, 2007, the Company acquired all of the assets and certain liabilities of Waxler Transportation Company, Inc. and Waxler Towing Company, Incorporated (collectively referred to as “Waxler”), as well as certain assets from Waxler affiliates. The acquisition consideration was $32.0 million, including 202,972 shares of SEACOR common stock, par value $0.01 per share (“Common Stock”), valued at $19.1 million based upon the closing price of Common Stock on March 13, 2007 of $94.15 per share, plus additional cash consideration of $12.9 million. Acquired assets included 14 tank barges and eight towboats. In addition, the Company assumed leases on two other tank barges. The Company performed a fair value analysis and the purchase price was allocated to the acquired assets and liabilities based on their fair values resulting in no goodwill being recorded. The fair value analysis of assets and liabilities acquired was finalized in December 2007.
Vensea Acquisition. On January 31, 2007, the Company acquired its partner’s 50% interest in VENSEA Marine, SRL (“Vensea”), an owner of one offshore marine vessel in Latin America, for $0.7 million under the terms of a buyout option included in the joint venture’s operating agreement. Subsequent to the transaction, the Company owns all of the issued and outstanding shares of Vensea.
EraMED Acquisition. Effective January 5, 2007, a wholly owned subsidiary of the Company, Era Med LLC (“EraMED”), acquired the air medical business of Keystone Helicopter Corporation for $11.1 million. The Company’s purchase price includes cash consideration paid of $11.5 million in 2007 and $0.4 million received from Keystone Helicopter Corporation in 2008 for final working capital settlement. At the time of the acquisition, EraMED operated 33 light and medium twin engine helicopters, including four owned, ten leased-in and 19 managed, in support of hospital based air medical programs in the northeastern United States. The Company performed a fair value analysis and the purchase price was allocated to the acquired assets and liabilities based on their fair values resulting in no goodwill being recorded. The fair value analysis of assets and liabilities acquired was finalized in December 2007.
RMA Acquisition. On October 1, 2006, the Company acquired all of the issued and outstanding shares of Response Management Associates, Inc. (“RMA”), a provider of environmental consulting services, for $12.5 million. The Company’s purchase price included cash consideration of $9.0 million ($1.0 million in 2007 and $8.0 million in 2006) and a note payable of $3.5 million. The Company performed a fair value analysis and the purchase price was allocated to the acquired assets and liabilities based on their fair values, with the excess of purchase price over fair value recorded as goodwill in the amount of $5.0 million. The fair value analysis of the assets and liabilities acquired was finalized in September 2007. The selling stockholder of RMA has the opportunity to receive additional consideration of up to $8.5 million based upon certain performance measures over the period from the date of the acquisition through September 30, 2012, which will be recognized by the Company as additional cost of the acquisition when the contingency is resolved and when any additional consideration is distributable. During the years ended December 31, 2009 and 2008, the Company paid $0.5 million and $1.6 million, respectively, of additional consideration in accordance with the acquisition agreement. As of December 31, 2009, the Company has paid $2.1 million, in the aggregate, of additional consideration, which was recorded as additional goodwill.
107
Table of Contents
NRCES Acquisition. On October 31, 2003, the Company acquired all of the issued and outstanding shares of NRC Environmental Services, Inc. (“NRCES”) (formerly Foss Environmental Services, Inc.) for $7.8 million. The selling stockholder of NRCES had the opportunity to receive additional consideration of up to $41.0 million based upon certain performance measures over a period from the date of the acquisition through December 31, 2008, to be recognized by the Company as additional cost of the acquisition. During the years ended December 31, 2008 and 2007, the Company paid $0.4 million and $0.1 million, respectively, of additional consideration in accordance with the acquisition agreement. As of December 31, 2008, the Company had paid $0.5 million, in the aggregate, of additional consideration, which has been recorded as goodwill.
Tex-Air Acquisition. All contingent consideration associated with the acquisition of Tex-Air Helicopters, Inc. (“Tex-Air”) was previously settled with minimal impact to the Company’s initial purchase price allocation. Additional consideration of $0.2 million earned for operating performance was paid with Common Stock in three equal yearly installments beginning in 2005. During 2007, the Company issued 616 shares of Common Stock in settlement of this obligation.
Purchase Price Allocation. The following table summarizes for the years ended December 31 the allocation of the purchase price for the Company’s acquisitions (in thousands):
| 2009 | 2008 | 2007 | ||||||||||
| Trade and other receivables |
$ | 6,515 | $ | (375 | ) | $ | 13,931 | |||||
| Other current assets |
2,341 | 7 | 1,335 | |||||||||
| Investments in Equity, and Receivables from 50% or Less Owned Companies |
(5,187 | ) | — | (915 | ) | |||||||
| Property and equipment |
1,931 | 828 | 48,992 | |||||||||
| Goodwill |
2,858 | 3,086 | 18,312 | |||||||||
| Intangible Assets |
40 | 3,625 | (1,541 | ) | ||||||||
| Other Assets |
204 | — | 5,198 | |||||||||
| Accounts payable and other current liabilities |
(1,512 | ) | 2,002 | (12,920 | ) | |||||||
| Long-Term Debt |
— | (504 | ) | (1,202 | ) | |||||||
| Deferred Income Taxes |
(17 | ) | (1,514 | ) | (6,653 | ) | ||||||
| Other long-term liabilities |
(45 | ) | — | — | ||||||||
| Noncontrolling Interests in Subsidiaries |
(3,043 | ) | — | (836 | ) | |||||||
| Purchase price(1) |
$ | 4,085 | $ | 7,155 | $ | 63,701 | ||||||
| (1) | Purchase price is net of cash acquired (totaling $1.9 million in 2009 and $2.0 million in 2007), includes acquisition costs (totaling $1.2 million in 2007) and includes Common Stock issued (valued at $19.1 million in 2007). |
Acquisitions of Noncontrolling Interests. Effective January 1, 2009, the Company purchased the remaining noncontrolled subsidiary shares in a tank farm and handling facility in Sauget, Illinois and certain related leasehold improvements from a noncontrolling interest holder. The aggregate purchase price of $9.6 million included a note payable of $7.0 million, the forgiveness of a $2.3 million note receivable from the noncontrolling interest holder and cash consideration of $0.3 million. In addition, effective April 1, 2009, the Company purchased the remaining noncontrolled subsidiary shares in an offshore marine services company for $0.9 million.
Disposition of a Subsidiary. Effective April 1, 2009, the Company sold its shares in an offshore marine services company to noncontrolling interest holders for $0.2 million.
108
Table of Contents
Equipment Additions. The Company’s capital expenditures were $180.0 million, $428.5 million and $537.6 million in 2009, 2008 and 2007, respectively. Major equipment deliveries for the years ended December 31 were as follows (unaudited):
| 2009 | 2008 | 2007(1) | ||||
| Anchor handling towing supply |
1 | 4 | 2 | |||
| Crew |
1 | — | 3 | |||
| Standby safety |
— | 1 | 2 | |||
| Supply |
— | 3 | 6 | |||
| Towing supply |
— | 1 | 5 | |||
| Specialty |
1 | 1 | — | |||
| 3 | 10 | 18 | ||||
| Inland River dry cargo barges |
— | 19 | 52 | |||
| Inland River liquid tank barges |
— | 8 | 4 | |||
| Inland River deck barges |
— | — | 19 | |||
| Inland River towboats |
3 | 4 | — | |||
| Helicopters |
8 | 25 | 26 | |||
| Harbor Tugs |
— | 4 | 5 | |||
| Ocean liquid tank barges |
3 | 3 | — | |||
| (1) | Excludes 14 liquid tank barges and eight towboats associated with the Waxler acquisition, four helicopters associated with the EraMED acquisition and one mini-supply vessel associated with the Vensea acquisition. |
Equipment Dispositions. The Company sold property and equipment for $103.7 million, $171.7 million, and $449.7 million in 2009, 2008 and 2007, respectively. Major equipment dispositions for the years ended December 31 were as follows (unaudited):
| 2009(1) | 2008(2) | 2007(3) | ||||
| Anchor handling towing supply |
1 | 1 | 5 | |||
| Crew |
9 | 3 | 10 | |||
| Mini-supply |
4 | 4 | 3 | |||
| Supply |
1 | 4 | 5 | |||
| Towing supply |
2 | 5 | 19 | |||
| Specialty |
2 | 5 | 2 | |||
| 19 | 22 | 44 | ||||
| Tankers |
— | 2 | — | |||
| Inland River dry cargo barges |
5 | 41 | 185 | |||
| Inland River liquid tank barges |
— | 6 | 8 | |||
| Inland River towboats |
3 | — | 2 | |||
| Helicopters |
6 | 7 | 11 | |||
| Harbor tugs |
4 | 1 | — | |||
| (1) | Excludes one specialty vessel contributed to the Sea-Cat Crewzer joint venture (see Note 5) and one mini-supply vessel and two helicopters removed from service and includes the sale of one harbor tug previously removed from service. |
| (2) | Includes the sale of one offshore support vessel previously removed from service. |
| (3) | Excludes 61 dry cargo and three liquid tank barges contributed to the Seaspraie joint venture (see Note 5). |
109
Table of Contents
| 5. | INVESTMENTS, AT EQUITY, AND RECEIVABLES FROM 50% OR LESS OWNED COMPANIES |
Investments, carried at equity, and advances to 50% or less owned companies as of December 31 were as follows (in thousands):
| Ownership | 2009 | 2008 | ||||||
| Seaspraie |
50.0% | $ | 56,228 | $ | 57,898 | |||
| Dart |
49.0% | 19,973 | 20,593 | |||||
| Sea-Cat Crewzer |
50.0% | 17,532 | — | |||||
| Illinois Corn Processing |
50.0% | 16,574 | — | |||||
| SCFCo Holdings |
50.0% | 13,219 | 11,455 | |||||
| C-Lift |
50.0% | 8,829 | 9,260 | |||||
| Soylutions |
50.0% | 8,598 | 8,585 | |||||
| Nautical Power |
50.0% | 8,209 | 4,978 | |||||
| Avion |
39.1% | 8,097 | 9,681 | |||||
| Other |
30.0%-50.0% | 29,555 | 27,612 | |||||
| $ | 186,814 | $ | 150,062 | |||||
Combined Condensed Financials. Summarized financial information for the Company’s investments, at equity, as of and for the years ended December 31 was as follows (in thousands):
| 2009 | 2008 | |||||
| Current assets |
$ | 122,345 | $ | 93,862 | ||
| Noncurrent assets |
408,707 | 353,741 | ||||
| Current liabilities |
38,218 | 35,070 | ||||
| Noncurrent liabilities |
156,789 | 167,217 | ||||
| 2009 | 2008 | 2007 | |||||||
| Operating Revenues |
$ | 259,720 | $ | 200,326 | $ | 120,091 | |||
| Costs and Expenses: |
|||||||||
| Operating and administrative |
173,230 | 131,244 | 73,265 | ||||||
| Depreciation |
22,122 | 15,474 | 10,107 | ||||||
| 195,352 | 146,718 | 83,372 | |||||||
| Operating Income |
$ | 64,368 | $ | 53,608 | $ | 36,719 | |||
| Net Income |
$ | 43,631 | $ | 45,346 | $ | 43,260 | |||
As of December 31, 2009 and 2008, cumulative undistributed net earnings of 50% or less owned companies accounted for by the equity method included in the Company’s consolidated retained earnings were $49.8 million and $44.5 million, respectively.
Seaspraie. The Company and a financial investor created Seaspraie Holdings LLC (“Seaspraie”), to own inland marine transportation assets with a view toward generating cash returns, which may be enhanced by entering into strategic positions in marketable securities and commodity futures. During 2007, the Company contributed 61 dry cargo barges, three liquid tank barges and a fixed price construction contract with an
110
Table of Contents
aggregate value of $33.0 million to the joint venture. During the year ended December 31, 2008, the Company recorded a $1.3 million loss, net of tax primarily resulting from an impairment charge recognized by the joint venture on prime broker exposure. During the years ended 2009, 2008 and 2007, the Company received fees of $2.5 million, $2.7 million and $2.2 million, respectively, related to the management of Seaspraie’s barges.
Dart. On July 22, 2008, a wholly owned subsidiary of the Company, Era DHS LLC, acquired 49% of the capital stock of Dart Helicopter Services LLC (“Dart”) for cash consideration of $21.0 million. Dart is an international sales, marketing and manufacturing organization focusing on after-market helicopter accessories. The Company performed a fair value analysis and the purchase price was allocated to the acquired assets and liabilities based on their fair values resulting in goodwill of $3.2 million. The fair value analysis of the assets and liabilities acquired was finalized in September 2009.
Sea-Cat Crewzer. On July 27, 2009, the Company and another offshore support vessel operator formed Sea-Cat Crewzer LLC (“Sea-Cat Crewzer”), a 50-50 joint venture to own and operate two high speed offshore catamaran crew boats. Each partner contributed one high speed offshore catamaran crew boat and cash with a combined value of $17.3 million. The Company contributed one high speed offshore catamaran crew boat valued at $14.7 million and cash of $2.6 million. In addition, immediately prior to the formation of the joint venture, the Company sold one high speed offshore catamaran crew boat to its joint venture partner for $16.9 million, who then contributed the vessel to the joint venture along with $0.4 million in cash. During the year ended 2009, the Company received $0.3 million of vessel management fees from this joint venture. Subsequent to December 31, 2009, Sea-Cat Crewzer entered into a $22.0 million five year term loan secured by a first preferred mortgage on each of the two vessels owned by Sea-Cat Crewzer. The term loan has an interest rate of LIBOR plus 275 basis points and calls for quarterly principal and interest payments with a balloon payment due at maturity. The Company is a guarantor of 50% of Sea-Cat Crewzer’s debt. The amount of the guarantee declines as principal payments are made and will terminate when the debt is repaid. Upon funding of the term loan, Sea-Cat Crewzer distributed $9.0 million to each of its partners.
Illinois Corn Processing. On November 20, 2009, the Company and an ingredients and distillery product manufacturer formed Illinois Corn Processing LLC (“ICP”), a 50-50 joint venture to own and operate an alcohol manufacturing facility dedicated to the production of alcohol for beverage, industrial and fuel applications. The Company’s joint venture partner contributed a previously shuttered manufacturing plant and then immediately sold a 50% interest to the Company for $15.0 million in cash. The Company also provided a $10.0 million 5 year term loan and a $20.0 million three year revolving line of credit to ICP. As of December 31, 2009, ICP had drawn $2.0 million on the term loan and there was no outstanding balance on the revolving credit facility.
SCFCo Holdings. On February 20, 2007, the Company and a third party in South America formed SCFCo Holdings LLC (“SCFCo”), a 50-50 joint venture, to operate four towboats and 72 dry cargo barges on the Parana-Paraguay Rivers. Each party contributed $5.2 million to SCFCo and the joint venture secured bank financing to purchase the equipment. In 2008, SCFCo agreed to expand its operation to include two additional towboats and 40 dry cargo barges. In order to purchase the additional equipment, SCFCo expanded its bank financing and each partner contributed an additional $6.1 million in capital. During the year ended December 31, 2008, the Company sold 40 dry cargo barges to the joint venture for $22.0 million. During the year ended December 31, 2007, the Company sold four towboats and 67 dry cargo barges to the joint venture for $43.9 million.
C-Lift. C-Lift LLC (“C-Lift”) was established to construct and operate two lift boats which began operations in the fourth quarter of 2007. The Company is a guarantor of 50% of C-Lift’s outstanding debt and its guarantee declines as principal payments are made and will terminate when the debt is repaid. The debt matures in 2015. As of December 31, 2009, the Company’s guarantee was $14.4 million.
Soylutions. Soylutions LLC (“Soylutions”) operates a grain and liquid fertilizer storage and handling facility in McLeansboro, Illinois.
111
Table of Contents
Nautical Power. Nautical Power, LLC (“Nautical Power”) was established to operate one offshore support vessel. Nautical Power bareboat charters the vessel from a leasing company and that charter terminates in 2011. The Company is a guarantor of 50% of the charter payments and its guarantee reduces as payments are made. As of December 31, 2009, the Company’s guarantee was $2.4 million.
Avion. Avion Pacific Limited (“Avion”), is a distributor of aircraft and aircraft related parts. During the year ended December 31, 2008, the Company invested $1.0 million and increased its ownership to 39.1%. As of December 31, 2009 and 2008, the Company had outstanding loans to Avion totaling $3.6 million and $4.7 million, respectively.
Other. The Company’s other business ventures include offshore marine businesses that operate nine vessels, eight owned and one bareboat chartered-in, inland river services’ businesses that operate six inland river towboats and a fabrication facility, a business that operates a dry cargo vessel, environmental services businesses, aviation services’ businesses, including a flight training center and an environmental remediation equipment manufacturer.
One of these offshore marine businesses obtained bank debt to finance the acquisition of four offshore support vessels from the Company. The debt is secured by, among other things, a first preferred mortgage on the vessels. The bank also has the authority to require the parties of the joint venture to fund the uncalled capital commitments as defined in the joint venture’s partnership agreement. In such event, the Company would be required to contribute its allocable share of uncalled capital, which was $3.1 million as of December 31, 2009. The Company manages the vessels on behalf of the joint venture and guarantees the outstanding charter receivables of the joint venture if a customer defaults in payment and the Company either fails to take enforcement action against the defaulting customer or fails to assign its right of recovery against the defaulting customer. As of December 31, 2009, the Company’s contingent guarantee of outstanding charter receivables was $7.4 million. During the years ended 2009, 2008 and 2007, the Company received $0.5 million, $0.5 million and $0.4 million, respectively, of vessel management fees from this joint venture. Subsequent to December 31, 2009, the joint venture sold two offshore support vessels for $34.0 million resulting in a $3.2 million gain.
As of December 31, 2009, the Company had received net advances of $0.3 million from certain of these joint ventures. The Company is also a guarantor of up to $0.5 million as security for the contract performance by another joint venture of which the Company owns 50%.
| 6. | CONSTRUCTION RESERVE FUNDS |
The Company has established, pursuant to Section 511 of the Merchant Marine Act, 1936, as amended, joint depository construction reserve funds with the Maritime Administration. In accordance with this statute, the Company is permitted to deposit proceeds from the sale of certain vessels into the joint depository construction reserve fund accounts for the purpose of acquiring U.S.-flag vessels and qualifying for the temporary deferral of taxable gains realized from the sale of vessels. Withdrawals from the construction reserve fund accounts are only permitted with the consent of the Maritime Administration and the funds on deposit must be committed for expenditure within three years or be released for the Company’s general use.
As of December 31, 2009 and 2008, the Company’s construction reserve funds of $273.2 million and $287.9 million, respectively, are classified as non-current assets in the accompanying consolidated balance sheets as the Company has the intent and ability to use the funds to acquire equipment. During the year ended December 31, 2009, construction reserve fund account transactions included withdrawals of $70.0 million and deposits of $55.3 million. During the year ended December 31, 2008, construction reserve fund account transactions included withdrawals of $215.5 million and deposits of $116.0 million. During the year ended December 31, 2007, construction reserve fund account transactions included withdrawals of $169.7 million and deposits of $207.2 million.
112
Table of Contents
| 7. | INCOME TAXES |
Income before income tax expense and equity in earnings of 50% or less owned companies derived from U.S. and foreign companies for the years ended December 31 are included in the table below (in thousands). Certain prior period information has been retrospectively adjusted to reflect the adoption of new accounting rules established by the FASB related to the Company’s convertible debt (see Note 8).
| 2009 | 2008 | 2007 | |||||||||
| United States |
$ | 151,814 | $ | 295,763 | $ | 304,380 | |||||
| Foreign |
50,975 | 34,849 | 91,099 | ||||||||
| Eliminations |
12,225 | (12,686 | ) | (51,657 | ) | ||||||
| $ | 215,014 | $ | 317,926 | $ | 343,822 | ||||||
As of December 31, 2009, cumulative undistributed net earnings of foreign subsidiaries included in the Company’s consolidated retained earnings were $180.5 million.
The Company files a consolidated U.S. federal tax return. Income tax expense (benefit) consisted of the following components for the years ended December 31 and are included in the table below (in thousands). Certain prior period information has been retrospectively adjusted to reflect the adoption of new accounting rules established by the FASB related to the Company’s convertible debt (see Note 8).
| 2009 | 2008 | 2007 | ||||||||||
| Current: |
||||||||||||
| State |
$ | 3,278 | $ | 4,359 | $ | 1,552 | ||||||
| Federal |
5,723 | 45,143 | (548 | ) | ||||||||
| Foreign |
10,486 | 25,019 | 12,595 | |||||||||
| 19,487 | 74,521 | 13,599 | ||||||||||
| Deferred: |
||||||||||||
| State |
1,901 | (4,453 | ) | 5,019 | ||||||||
| Federal |
61,152 | 40,459 | 107,102 | |||||||||
| Foreign |
(48 | ) | 45 | 2,121 | ||||||||
| 63,005 | 36,051 | 114,242 | ||||||||||
| $ | 82,492 | $ | 110,572 | $ | 127,841 | |||||||
The following table reconciles the difference between the statutory federal income tax rate for the Company and the effective income tax rate for the years ended December 31:
| 2009 | 2008 | 2007 | |||||||
| Statutory rate |
35.0 | % | 35.0 | % | 35.0 | % | |||
| Non-deductible expenses |
1.5 | % | 1.3 | % | 1.0 | % | |||
| State effective tax rate changes |
1.0 | % | (1.2 | )% | — | % | |||
| State taxes |
0.9 | % | 0.7 | % | 1.7 | % | |||
| Other |
0.0 | % | (1.0 | )% | (0.5) | % | |||
| 38.4 | % | 34.8 | % | 37.2 | % | ||||
113
Table of Contents
During the years ended December 31, 2009 and 2008, the Company recognized an income tax expense of $2.2 million and an income tax benefit of $4.0 million, respectively, on adjustments to deferred tax liabilities resulting from changes in state tax apportionment factors.
The components of the net deferred income tax liabilities for the years ended December 31 are included in the table below (in thousands). Certain prior period information has been retrospectively adjusted to reflect the adoption of new accounting rules established by the FASB related to the Company’s convertible debt (see Note 8).
| 2009 | 2008 | |||||||
| Deferred tax liabilities: |
||||||||
| Property and Equipment |
$ | 523,025 | $ | 498,702 | ||||
| Unremitted earnings of foreign subsidiaries |
23,892 | 2,144 | ||||||
| Investments in 50% or Less Owned Companies |
23,835 | 21,182 | ||||||
| Long-term Debt |
15,627 | 22,656 | ||||||
| Intangible Assets |
5,465 | 6,534 | ||||||
| Other |
14,122 | 6,157 | ||||||
| Total deferred tax liabilities |
605,966 | 557,375 | ||||||
| Deferred tax assets: |
||||||||
| Foreign tax credit carryforwards |
13,352 | 18,211 | ||||||
| Share award plans |
6,545 | 5,337 | ||||||
| Deductible goodwill |
904 | 3,022 | ||||||
| Other |
20,150 | 27,114 | ||||||
| Total deferred tax assets |
40,951 | 53,684 | ||||||
| Valuation allowance |
(7,071 | ) | (6,600 | ) | ||||
| Net deferred tax assets |
33,880 | 47,084 | ||||||
| Net deferred tax liabilities |
$ | 572,086 | $ | 510,291 | ||||
The Company’s valuation allowance had included $17.4 million of reserves established as part of the Company’s July 1, 2005 acquisition of Seabulk International, Inc. (“Seabulk Merger”) relating to acquired foreign tax credit carryforwards and federal and state net operating loss carryforwards. During the year ended December 31, 2008, the Company reduced its valuation allowance by $2.0 million for acquired foreign tax credit carryforwards and federal net operating loss carryforwards that it was unable to utilize. Based on the expected future utilization of remaining acquired carryforwards as of December 31, 2008, the Company also reduced its valuation allowance by $11.0 million with a corresponding reduction in goodwill associated with the Seabulk Merger.
As of December 31, 2009, the Company has foreign tax credit carryforwards of $13.4 million that expire from 2011 through 2015. The Company believes it is more likely than not that the Company’s foreign tax credit carryforwards, with the exception of $3.1 million, will be utilized through the turnaround of existing temporary differences, future earnings, tax strategies or a combination thereof.
During the year ended December 31, 2009, the Company increased its valuation allowance for state net operating loss carryforwards by $0.5 million to $4.0 million.
The Company records an additional income tax benefit or expense based on the difference between the fair market value of share awards at the time of grant and the fair market value at the time of vesting or exercise. For
114
Table of Contents
the year ended December 31, 2009, an additional net income tax expense was recorded in stockholders’ equity of $0.3 million. For the years ended December 31, 2008 and 2007, an additional net income tax benefit was recorded in stockholders’ equity of $1.2 million and $1.4 million, respectively.
In November 2009, the Internal Revenue Service completed its audits of the Company’s tax returns for the years ended December 31, 2004 and 2005 and a subsidiary’s tax returns for the years ended December 31, 2003 and 2004. The results of the completed audits had no material impact on the Company’s consolidated financial position or its results of operations.
| 8. | LONG-TERM DEBT |
The Company’s borrowings as of December 31 are included in the table below (in thousands). Certain prior period information has been retrospectively adjusted to reflect the adoption of new accounting rules established by the FASB related to the Company’s convertible debt as discussed below.
| 2009 | 2008 | |||||||
| 7.375% Senior Notes (excluding unamortized discount of $1.6 million) |
$ | 250,000 | $ | — | ||||
| 2.875% Convertible Debentures |
— | 249,996 | ||||||
| 5.875% Senior Notes (excluding unamortized discount of $0.7 million) |
181,105 | 199,500 | ||||||
| Title XI Bonds (excluding unamortized discount of $10.3 million) |
167,177 | 176,781 | ||||||
| 9.5% Senior Notes |
— | 101,880 | ||||||
| 7.2% Senior Notes |
— | 69,777 | ||||||
| Revolving Credit Facility |
125,000 | 100,000 | ||||||
| Other (excluding unamortized discount of $1.2 million) |
75,633 | 61,811 | ||||||
| 798,915 | 959,745 | |||||||
| Portion due within one year |
(36,436 | ) | (33,671 | ) | ||||
| Debt discount, net |
(13,775 | ) | (30,385 | ) | ||||
| $ | 748,704 | $ | 895,689 | |||||
The Company’s long-term debt maturities for the years ended December 31 are as follows (in thousands):
| 2010 |
$ | 36,436 | |
| 2011 |
12,520 | ||
| 2012 |
214,126 | ||
| 2013 |
136,296 | ||
| 2014 |
11,943 | ||
| Years subsequent to 2014 |
387,594 | ||
| $ | 798,915 | ||
7.375% Senior Notes. On September 24, 2009, SEACOR issued $250.0 million aggregate principal amount of its 7.375% Senior Notes due October 1, 2019 (the “7.375% Senior Notes”) and received net proceeds of $245.9 million. The 7.375% Senior Notes were issued under a supplemental indenture dated as of September 24, 2009 (the “2009 Supplemental Indenture”) to the base indenture relating to SEACOR’s senior debt securities, dated as of January 10, 2001, between SEACOR and U.S. Bank National Association, as trustee. Interest on the 7.375% Senior Notes is payable semi-annually on April 1 and October 1 of each year. The 7.375% Senior Notes may be redeemed at any time, in whole or in part, at a price equal to 100% of the principal amount, plus accrued
115
Table of Contents
and unpaid interest to the date of redemption, plus a specified “make-whole” premium. The 2009 Supplemental Indenture contained covenants including, among others, limitations on liens and sale and leasebacks of certain Principal Properties, as defined, and certain restrictions on SEACOR consolidating with or merging into any other Person, as defined.
2.875% Convertible Debentures. On December 17, 2004, SEACOR completed the sale of $250.0 million aggregate principal amount of its 2.875% Convertible Debentures due December 15, 2024 (the “2.875% Convertible Debentures”). During 2009, the Company settled all of its outstanding 2.875% Convertible Debentures. Interest on the 2.875% Convertible Debentures was payable semi-annually on June 15 and December 15 of each year. The 2.875% Convertible Debentures were convertible into shares of Common Stock at any time at an initial conversion price of $73.15 per share of Common Stock. As of December 31, 2008, the Company had reserved 3,417,570 shares of Common Stock, the maximum number of shares needed upon conversion.
Effective January 1, 2009, the Company adopted new accounting rules established by the FASB related to its convertible debt that requires the Company to account separately for the liability and equity components in a manner that reflects the Company’s non-convertible debt borrowing rate. The resulting debt discount was being amortized over the period the debt was expected to be outstanding as additional non-cash interest expense. Upon adoption of the new accounting rules, the Company recorded the impact on a retrospective basis for all periods presented and adjusted previously reported equity as of December 31, 2006 by increasing additional paid-in capital $33.9 million and reducing retained earnings $9.0 million. For the years ended December 31, 2009, 2008 and 2007, the impact of adopting the new accounting rules on the Company’s consolidated statements of income was an additional $8.0 million, $7.9 million and $7.4 million of pre-tax, non-cash interest expense, respectively. For the years ended December 31, 2009, 2008 and 2007, the impact of the adopting the new accounting rules on basic earnings per common share of SEACOR Holdings Inc. was a reduction of $0.26, $0.25 and $0.20 per share, respectively. Previously reported diluted earnings per common share of SEACOR Holdings Inc. remained unchanged.
During 2009, the Company’s outstanding Convertible Debentures were purchased through open market transactions, converted into Common Stock by the debenture holders, or redeemed in cash. Total consideration paid by the Company on these settlements of the Convertible Debentures was $253.8 million, including 2,918,977 shares of Common Stock valued at $217.2 million and $36.6 million in cash. Consideration of $240.3 million, including Common Stock valued at $205.7 million and $34.6 million in cash, was allocated to the settlement of long-term debt resulting in a debt extinguishment loss of $9.4 million included in the accompanying consolidated statements of income. Consideration of $13.5 million, including Common Stock valued at $11.5 million and $2.0 million in cash, was allocated to the purchase of the conversion option embedded in the Convertible Debentures as included in the accompanying consolidated statements of changes in equity.
5.875% Senior Notes. In 2002, SEACOR sold $200.0 million aggregate principal amount of its 5.875% Senior Notes due October 1, 2012 (the “5.875% Senior Notes”). The 5.875% Senior Notes were issued under a supplemental indenture dated as of September 27, 2002 (the “2002 Supplemental Indenture”) to the base indenture relating to SEACOR’s senior debt securities, dated as of January 10, 2001, between SEACOR and U.S. Bank National Association, as trustee. Interest on the 5.875% Senior Notes is payable semi-annually on April 1 and October 1 of each year. The 5.875% Senior Notes may be redeemed at any time, in whole or in part, at a price equal to 100% of the principal amount, plus accrued and unpaid interest to the date of redemption, plus a specified “make-whole” premium. The 2002 Supplemental Indenture contained covenants including, among others, limitations on liens and sale and leasebacks of certain Principal Properties, as defined, and certain restrictions on SEACOR consolidating with or merging into any other Person, as defined. During the year ended December 31, 2009, the Company purchased $18.4 million, principal amount, of its 5.875% Senior Notes at a price of 100 percent of par without a material gain or loss. During the year ended December 31, 2008, the Company purchased $0.5 million, principal amount, of its 5.875% Senior Notes at a price of 86 percent of par without a material gain or loss.
116
Table of Contents
Title XI Bonds. Five double-hull product and chemical tankers (the “Title XI tankers”) owned by subsidiaries of the Company (the “Title XI companies”) were financed through the issuance of U.S. Government Guaranteed Ship Financing Bonds (the “Title XI Bonds” or “Title XI financing”). Seven series of bonds comprise the Title XI Bonds bearing interest at rates ranging from 6.50% to 7.54% with semi-annual principal and interest payments and maturing through June 2024. Beginning in June 2006, the Company was eligible to make additional principal payments equal to the regularly scheduled semi-annual principal payment on two of the Title XI Bonds which may be used to offset future principal payments at the Company’s discretion. During the years ended December 31, 2009, 2008 and 2007, the Company made $2.6 million, $1.2 million and $2.2 million, respectively, in additional principal payments in accordance with the terms of the Title XI financing. As of December 31, 2009, the Company had paid additional principal of $8.1 million in the aggregate in accordance with the terms of the Title XI financing.
A percentage of earnings attributable to each of the Title XI tankers’ operations is required to be deposited into Title XI reserve fund bank accounts. Cash held in these accounts is invested as prescribed by Title XI financing agreements. Withdrawals from these accounts are permitted for limited purposes, subject to the prior approval of the U.S. Maritime Administration. As of December 31, 2009 and 2008, the Title XI reserve fund account balances were $16.6 million and $17.9 million, respectively.
The Title XI financing agreements contain covenants restricting cash distributions subject to certain financial tests. Failure to meet these financial tests, among other things, restricts Title XI companies from (1) distributing capital; (2) paying dividends; (3) increasing employee compensation and paying other indebtedness; (4) incurring additional indebtedness; (5) making investments and (6) acquiring fixed assets. Cash distributions (as defined in the Title XI financing agreements) from a Title XI company are prohibited until such company achieves certain levels of working capital. As of December 31, 2009 and 2008, the Title XI companies held $34.0 million and $20.5 million in restricted cash that was limited in use for the operation of the tankers and cannot be used to fund the Company’s general working capital requirements.
In the event of default (as defined in the Title XI financing agreements), all of the Title XI tankers, in addition to the assignment of earnings relating to those vessels and the funds on deposit in the Title XI reserve fund accounts, serve as collateral for the repayment of the Title XI Bonds. The aggregate net book value as of December 31, 2009 of the Title XI tankers was $285.2 million.
9.5% Senior Notes. In 2003, Seabulk International Inc. issued $150.0 million of Senior Notes due 2013 (the “9.5% Senior Notes”). On September 14, 2009, the Company redeemed all of its then outstanding 9.5% Senior Notes. Interest on the 9.5% Senior Notes was payable semi-annually on February 15 and August 15 of each year. During the year ended December 31, 2009, the Company purchased $20.2 million, principal amount, of its 9.5% Senior Notes at an average price of 100 percent and redeemed $81.7 million of the remaining outstanding principal for $84.3 million. The purchases and redemption during the year ended December 31, 2009 resulted in gains of $4.7 million. During the year ended December 31, 2008, the Company purchased $36.6 million, principal amount, of its 9.5% Senior Notes at an average price of 91 percent of par and recognized a gain of $6.2 million on the purchase.
7.2% Senior Notes. In 1997, SEACOR sold $150.0 million aggregate principal amount of its 7.2% Senior Notes due 2009 (the “7.2% Senior Notes”). The offering was made to qualified institutional buyers, a limited number of institutional accredited investors, and in offshore transactions, exempt from registration under U.S. federal securities laws. The 7.2% Senior Notes were issued under an indenture (the “1997 Indenture”) between SEACOR and First Trust National Association, as trustee. Interest on the 7.2% Senior Notes was payable semi-annually on March 15 and September 15 of each year. During the year ended December 31, 2009, the Company purchased $37.0 million, principal amount, of its 7.2% Senior Notes at an average price of 101 percent of par and recognized a loss of $0.4 million on the purchase. On September 15, 2009, the Company settled the remaining $32.8 million of outstanding 7.2% Senior Notes upon maturity. During the year ended December 31, 2008, the Company purchased $64.7 million, principal amount, of its 7.2% Senior Notes at an average price of 100 percent of par and recognized a loss of $0.1 million on the purchase.
117
Table of Contents
SEACOR Revolving Credit Facility. The Company has a $450.0 million unsecured revolving credit facility that matures in November 2013. Advances under the facility are available for general corporate purposes. This facility will be reduced by 10% of the maximum committed amount during its term at the beginning of each of the final two years of the credit agreement. Interest on advances will be charged at a rate per annum of LIBOR plus an applicable margin of 60 basis points through the first five years and 67.5 basis points thereafter. A quarterly commitment fee is payable based on the average unfunded portion of the committed amount at the rate of 17.5 basis points through the first five years and at the rate of 22.5 basis points thereafter. The revolving credit facility contains various restrictive covenants including interest coverage, secured debt to total capitalization, funded debt to total capitalization ratios, as well as other customary covenants, representations and warranties, funding conditions and events of default, including a cross-default as defined in the credit agreement. As of December 31, 2009, the Company had $125.0 million outstanding borrowings under the revolving credit facility and the remaining availability under this facility was $322.9 million, net of issued letters of credit of $2.1 million. Subsequent to December 31, 2009, $1.0 million of the letters of credit issued under the revolving credit facility were cancelled.
Other. The Company has various other obligations including ship, equipment and facility mortgages, notes payable to prior owners of acquisitions and short term financing for certain Commodity Trading and Logistics inventories. These obligations have maturities ranging from several days through May 2021 and, as of December 31, 2009, have interest rates ranging from 3.0% to 8.5%, and require periodic payments of interest and principal.
As of December 31, 2009, the Company had other outstanding letters of credit, apart from the revolving credit facility, totaling $46.8 million with various expiration dates through 2010.
| 9. | CAPITAL LEASE OBLIGATIONS |
The Company operates certain vessels and other equipment under leases that are classified as capital leases. The future minimum lease payments under capital leases, together with the present value of the net minimum lease payments for the years ended December 31 are as follows (in thousands):
| 2010 |
$ | 1,402 | ||
| 2011 |
1,402 | |||
| 2012 |
2,657 | |||
| 2013 |
2,959 | |||
| Total minimum lease payments |
8,420 | |||
| Premium on capital leases |
343 | |||
| Less amounts representing interest |
(1,173 | ) | ||
| Present value of minimum lease payments (including current portion of $966) |
$ | 7,590 | ||
As of December 31, 2009 and 2008, the Company had $11.6 million and $12.1 million, respectively, of equipment subject to capital lease obligations. Amortization of assets under capital leases is included in depreciation and amortization in the accompanying consolidated statements of income.
| 10. | COMMON STOCK AND DEBT REPURCHASES |
From time to time, SEACOR’s Board of Directors grants authorization to purchase shares of Common Stock, and up until their redemption in December 2009, its 2.875% Convertible Debentures. During the years ended December 31, 2009, 2008 and 2007, the Company acquired for treasury 606,576, 2,824,717 and 2,366,880, respectively, shares of Common Stock for an aggregate purchase price of $45.9 million, $240.1 million and $213.3 million, respectively. During the year ended December 31, 2009, the Company
118
Table of Contents
repurchased $3.8 million, principal amount, of its 2.875% Convertible Debentures for an aggregate purchase price of $3.7 million. As of December 31, 2009, SEACOR had authorization to repurchase $102.2 million of Common Stock and on February 18, 2010, SEACOR’s Board of Directors increased the repurchase authority for a total expenditure of up to $250.0 million.
Additionally, the Company may purchase, separate from such authorization as noted above, any or all of its 5.875% Senior Notes and its 7.375% Senior Notes. Securities are acquired through open market purchases, privately negotiated transactions or otherwise, depending on market conditions.
| 11. | SAVINGS PLANS |
SEACOR Savings Plan. The Company provides a defined contribution plan to its employees (the “Savings Plan”). The Company’s contribution to the Savings Plan is limited to 50% of an employee’s first 6% of wages invested in the Savings Plan and is subject to annual review by the Board of Directors of SEACOR. The Company’s Savings Plan costs were $3.1 million, $3.2 million and $2.8 million for the years ended December 31, 2009, 2008 and 2007, respectively.
SEACOR Deferred Compensation Plan. In 2005, the Company established a non-qualified deferred compensation plan (the “Deferred Compensation Plan”) to provide a select group of highly compensated employees, as well as non-employee directors, with the ability to defer receipt of up to 75% of their cash base salary, up to 100% of their cash bonus and up to 100% of their vested restricted stock (deferred in the form of Restricted Stock Units, as defined in the plan) for each fiscal year. Each participant’s compensation deferrals are credited to a bookkeeping account and, subject to certain restrictions, each participant may elect to have their cash deferrals in such account indexed against one or more investment options, solely for purposes of determining amounts payable under the Deferred Compensation Plan (the Company is not obligated to actually invest any deferred amounts in the selected investment options).
Participants may receive a distribution of deferred amounts, plus any earnings thereon (or less any losses), on a date specified by the participant or, if earlier, upon a separation from service or upon a change of control. All distributions to participants following a separation from service shall be in the form of a lump sum, except if such separation qualifies as “retirement” under the terms of the plan, in which case it may be paid in installments if previously elected by the participant. Distributions to “Key Employees” upon a separation from service (other than due to death) will not commence until at least 6 months after the separation from service. Participants are always 100% vested in the amounts that participants contribute to their Deferred Compensation Plan accounts. The Company, at its option, may contribute amounts to participants’ accounts, which may be subject to vesting requirements.
The obligations of the Company to pay deferred compensation under the Deferred Compensation Plan are general unsecured obligations of the Company and rank equally with other unsecured indebtedness of the Company that is outstanding from time to time. As of December 31, 2009 and 2008, the Company had an obligation of $3.5 million and $4.7 million, respectively, related to the Deferred Compensation Plan and is included in the accompanying consolidated balance sheets as deferred gains and other liabilities. The total amount of the Company’s obligation under the Deferred Compensation Plan will vary depending upon the level of participation by participants and the amount of compensation that participants elect to defer under the plan. The duration of the Deferred Compensation Plan is indefinite (subject to the Board of Directors’ ability to amend or terminate the plan).
| 12. | SHARE BASED COMPENSATION |
Share Incentive Plans. SEACOR’s stockholders approved the 2007 Share Incentive Plan to provide for the grant of options to purchase shares of Common Stock, stock appreciation rights, restricted stock, stock awards, performance awards and restricted stock units to non-employee directors, key officers and employees of the Company. The 2007 Share Incentive Plan superseded the 1992 Non-Qualified Stock Option Plan, the 1996 Share
119
Table of Contents
Incentive Plan, the 2003 Non-Employee Director Share Incentive Plan and the 2003 Share Incentive Plan (collectively, the “Share Incentive Plans”). The Compensation Committee of the Board of Directors administers the Share Incentive Plans. A total of 4,650,000 shares of Common Stock have been authorized for grant under the Share Incentive Plans. All shares issued pursuant to such grants are newly issued shares of Common Stock. The exercise price per share of options granted cannot be less than 100% of the fair market value of Common Stock at the date of grant under the Share Incentive Plans. Grants to date have been limited to stock awards, restricted stock, restricted stock units and options to purchase shares of Common Stock.
Restricted stock and restricted stock units typically vest from one to five years after grant and options to purchase shares of Common Stock typically vest and become exercisable from one to five years after date of grant. Options to purchase shares of Common Stock granted under the Share Incentive Plans expire no later than the tenth anniversary of the date of grant. In the event of a participant’s death, retirement, termination by the Company without cause or a change in control of the Company, as defined in the Share Incentive Plans, restricted stock and restricted stock units vest immediately and options to purchase shares of Common Stock vest and become immediately exercisable.
Employee Stock Purchase Plans. SEACOR’s stockholders approved the 2009 Employee Stock Purchase Plan and the 2000 Employee Stock Purchase Plan (collectively, the “Employee Stock Purchase Plans”) to permit the Company to offer Common Stock for purchase by eligible employees at a price equal to 85% of the lesser of (i) the fair market value of Common Stock on the first day of the offering period or (ii) the fair market value of Common Stock on the last day of the offering period. Common Stock is made available for purchase under the Employee Stock Purchase Plans for six-month offering periods. The Employee Stock Purchase Plans are intended to comply with Section 423 of the Internal Revenue Code of 1986, as amended (the “Code”), but is not intended to be subject to Section 401(a) of the Code or the Employee Retirement Income Security Act of 1974. The Board of Directors of SEACOR may amend or terminate the Employee Stock Purchase Plans at any time; however, no increase in the number of shares of Common Stock reserved for issuance under the Employee Stock Purchase Plans may be made without stockholder approval. A total of 600,000 shares of Common Stock have been approved for purchase under the Employee Stock Purchase Plans with all shares issued from those held in treasury. Each of the Employee Stock Purchase Plans has a term of ten years.
120
Table of Contents
Share Award Transactions. The following transactions have occurred in connection with the Company’s share based compensation plans during the years ended December 31:
| 2009 | 2008 | 2007 | |||||||
| Restricted stock awards granted |
141,750 | 141,190 | 131,905 | ||||||
| Restricted stock awards forfeited |
(7,550 | ) | (2,320 | ) | (9,000 | ) | |||
| Director stock awards granted |
5,000 | 5,000 | 5,000 | ||||||
| Restricted Stock Unit Activities: |
|||||||||
| Outstanding as of the beginning of year |
1,445 | 1,820 | 5,102 | ||||||
| Granted |
600 | — | 1,600 | ||||||
| Converted to shares |
(975 | ) | (375 | ) | (4,882 | ) | |||
| Outstanding as of the end of year |
1,070 | 1,445 | 1,820 | ||||||
| Shares released from Deferred Compensation Plan |
(1,207 | ) | (1,207 | ) | (1,207 | ) | |||
| Stock Option Activities: |
|||||||||
| Outstanding as of the beginning of year |
1,129,685 | 1,017,031 | 877,025 | ||||||
| Granted |
223,850 | 203,138 | 210,250 | ||||||
| Exercised |
(93,394 | ) | (90,221 | ) | (63,094 | ) | |||
| Forfeited |
(23,070 | ) | (263 | ) | (7,150 | ) | |||
| Expired |
(16,470 | ) | — | — | |||||
| Outstanding as of the end of year |
1,220,601 | 1,129,685 | 1,017,031 | ||||||
| Employee Stock Purchase Plan shares issued |
49,077 | 31,703 | 27,550 | ||||||
| Shares available for issuance under Share Incentive and Employee Stock Purchase Plans as of the end of year |
1,624,172 | 722,699 | 1,102,867 | ||||||
During the years ended December 31, 2009, 2008 and 2007, the Company recognized $13.4 million, $12.7 million and $10.2 million, respectively, of compensation expense related to stock awards, stock options, employee stock purchase plan purchases, restricted stock and restricted stock units (collectively referred to as “share awards”). As of December 31, 2009, the Company had approximately $29.5 million in total unrecognized compensation costs of which $11.1 million and $8.9 million are expected to be recognized in 2010 and 2011, respectively, with the remaining balance recognized through 2014.
The weighted average values of grants under the Company’s Share Incentive Plans were $36.57, $51.65 and $55.28 for the years ended December 31, 2009, 2008 and 2007, respectively. The fair value of each option granted during the years ended December 31, 2009, 2008 and 2007 is estimated on the date of grant using the Black-Scholes option-pricing model with the following assumptions: (a) no dividend yield, (b) weighted average expected volatility of 31.5%, 23.5% and 22.3%, respectively, (c) weighted average discount rates of 2.04%, 2.49% and 4.43%, respectively, and (d) expected lives of 5.66 years, 5.55 years and 5.33 years, respectively.
121
Table of Contents
During the year ended December 31, 2009, the number of shares and the weighted average grant price of restricted stock and restricted stock unit transactions were as follows:
| Restricted Stock | Restricted Stock Units | |||||||||||
| Number of Shares |
Weighted Average Grant Price |
Number of Shares |
Weighted Average Grant Price | |||||||||
| Nonvested as of December 31, 2008 |
298,681 | $ | 89.72 | 1,445 | $ | 95.58 | ||||||
| Granted |
141,750 | $ | 56.71 | 600 | $ | 56.65 | ||||||
| Vested |
(92,263 | ) | $ | 85.25 | (975 | ) | $ | 97.04 | ||||
| Forfeited |
(7,550 | ) | $ | 77.36 | — | $ | — | |||||
| Nonvested as of December 31, 2009 |
340,618 | $ | 77.47 | 1,070 | $ | 72.42 | ||||||
During the years ended December 31, 2009, 2008 and 2007, the total grant date fair value of restricted stock and restricted stock units that vested was $8.0 million, $6.2 million and $4.3 million, respectively.
During the year ended December 31, 2009, the number of shares, the weighted average grant date fair value and the weighted average exercise price on stock option transactions were as follows:
| Nonvested Options | Vested/Exercisable Options |
Total Options | ||||||||||||||||
| Number of Shares |
Weighted Average Grant Date Fair Value |
Number of Shares |
Weighted Average Exercise Price |
Number of Shares |
Weighted Average Exercise Price | |||||||||||||
| Outstanding, as of December 31, 2008 |
496,350 | $ | 24.01 | 633,335 | $ | 55.09 | 1,129,685 | $ | 67.21 | |||||||||
| Granted |
223,850 | $ | 23.76 | — | $ | — | 223,850 | $ | 71.10 | |||||||||
| Vested |
(176,560 | ) | $ | 22.69 | 176,560 | $ | 79.50 | — | $ | — | ||||||||
| Exercised |
— | $ | — | (93,394 | ) | $ | 37.03 | (93,394 | ) | $ | 37.03 | |||||||
| Forfeited |
(23,070 | ) | $ | 24.61 | — | $ | — | (23,070 | ) | $ | 83.42 | |||||||
| Expired |
— | $ | — | (16,470 | ) | $ | 90.47 | (16,470 | ) | $ | 90.47 | |||||||
| Outstanding, as of December 31, 2009 |
520,570 | $ | 24.32 | 700,031 | $ | 62.80 | 1,220,601 | $ | 69.61 | |||||||||
During the years ended December 31, 2009, 2008 and 2007, the aggregate intrinsic value of exercised stock options was $3.8 million, $4.4 million and $3.9 million, respectively. As of December 31, 2009, the weighted average remaining contractual term for total outstanding stock options and vested/exercisable stock options was 6.21 and 4.82 years, respectively. As of December 31, 2009, the aggregate intrinsic value of all options outstanding and all vested/exercisable options outstanding was $14.6 million and $12.6 million, respectively.
| 13. | RELATED PARTY TRANSACTIONS |
The Company manages barge pools as part of its Inland River Services segment. Pursuant to the pooling agreements, operating revenues and expenses of participating barges are combined and the net results are allocated on a pro-rata basis based on the number of barge days contributed by each participant. Mr. Charles Fabrikant, the Chief Executive Officer of SEACOR, companies controlled by Mr. Fabrikant and trusts for the benefit of Mr. Fabrikant’s two children, own barges that participate in the barge pools managed by the Company. Mr. Fabrikant and his affiliates were participants in the barge pools prior to the acquisition of SCF Marine Inc. by SEACOR. In the years ended December 31, 2009, 2008 and 2007, Mr. Fabrikant and his affiliates earned $1.0 million, $1.7 million and $1.7 million, respectively, of net barge pool results (after payment of $0.1 million,
122
Table of Contents
$0.1 million and $0.1 million, respectively, in management fees to the Company). As of December 31, 2009, 2008 and 2007, the Company owed Mr. Fabrikant and his affiliates $0.4 million, $0.7 million and $0.5 million, respectively, for undistributed net barge pool results. Mr. Fabrikant and his affiliates participate in the barge pools on the same terms and conditions as other pool participants who are unrelated to the Company.
During the year ended December 31, 2008, the Company purchased a barge from Mr. Fabrikant’s sister for $0.5 million and sold it to Inland River Services’ South American joint venture. The proceeds received by Mr. Fabrikant’s sister were deposited into a construction reserve fund established by her that is managed by the Company. Additionally, during the year ended December 31, 2008, the Company, on behalf of Mr. Fabrikant, sold three barges owned by him for scrap, for $0.3 million.
| 14. | COMMITMENTS AND CONTINGENCIES |
The Company’s unfunded capital commitments as of December 31, 2009 consisted primarily of offshore support vessels, helicopters and inland river dry cargo barges and totaled $96.2 million, of which $88.3 million is payable during 2010 and the balance payable in 2011. Of the total unfunded capital commitments, $0.8 million may be terminated without further liability. Subsequent to December 31, 2009, the Company committed to purchase additional equipment for $115.2 million.
Under United States law, “United States persons” are prohibited from business activities and contracts in certain countries, including Sudan and Iran. Relating to these prohibitions, Seabulk International, Inc., (“Seabulk”) a subsidiary of SEACOR acquired in July 2005, filed three reports with and submitted documents to the Office of Foreign Asset Control (“OFAC”) of the U.S. Department of Treasury in December 1999 and January and May 2002. One of the reports was also filed with the Bureau of Export Administration of the U.S. Department of Commerce. The reports and documents related to certain limited charters with third parties involving three Seabulk vessels that called in Sudan for several months in 1999 and January 2000 and charters with third parties involving several of Seabulk’s vessels that called in Iran in 1998. In March 2003, Seabulk received notification from OFAC that the case has been referred to its Civil Penalties Division. Should OFAC determine that these activities constituted violations of the laws or regulations, civil penalties, including fines, could be assessed against Seabulk or certain individuals who knowingly participated in such activity. The Company cannot predict the extent of such penalties; however, management does not believe the outcome of these matters will have a material impact on its consolidated financial position or its results of operations.
During 2006 and 2007, Marine Transportation Services (“MTS”) had two of its tankers retrofitted to a double-hull configuration in a foreign shipyard to enable each of them to continue to transport crude oil and petroleum products beyond their OPA 90 mandated retirement dates in 2011. Both vessels operate in the U.S. coastwise trade that, under the Shipping Acts, is restricted to vessels built or rebuilt in the United States. In May 2005, MTS received a determination from the U.S. Coast Guard (“USCG”), which administers the United States build requirements of the Shipping Acts, concluding the retrofit work would not constitute a foreign rebuilding and therefore would not jeopardize the tankers’ eligibility to operate in the U.S. coastwise trade. MTS completed the retrofit work in the foreign shipyard in reliance upon the USCG’s determination, which MTS believes was correct and in accord with the USCG’s long-standing regulations and interpretations. On July 9, 2007, a U.S. shipbuilders trade association and two operators of tankers in the U.S. coastwise trade (“Shipbuilders”) commenced a civil action in the U.S. District Court for the Eastern District of Virginia, Shipbuilders Council of America, Inc., et al. v. U.S. Department of Homeland Security, et al. , No. 1:07cv665 (E.D. Va.) (the “SB Trader Litigation”), in which they sought to have the court set aside the USCG’s determination and direct the USCG to revoke the coastwise license of one of the two retrofitted tankers, the Seabulk Trader. MTS intervened in the action to assist the USCG in defending its determination. On April 24, 2008, the Court issued a Memorandum Opinion granting a motion for summary judgment by Shipbuilders setting aside the USCG’s determination and remanding the matter to the USCG for further proceedings with instructions to revoke the coastwise endorsement of the Seabulk Trader. On April 30, 2008, MTS appealed the decision to the U.S. Court of Appeals for the Fourth Circuit (the “Court of Appeals”), and the lower court’s decision was stayed pending appeal, subject to certain
123
Table of Contents
terms (which MTS has also separately appealed). Those terms require that MTS pay to the plaintiffs 12.5% of the revenue generated by the Seabulk Trader from November 7, 2008 in the event that the Court of Appeals affirms the lower court’s decision to revoke its coastwise endorsement (the “Undertaking”). On July 2, 2008, Shipbuilders commenced a second civil action in the U.S. District Court for the Eastern District of Virginia, entitled Shipbuilders Council of America, Inc., et al. v. U.S. Department of Homeland Security, et al., No. 1:08cv680 (E.D. Va.) (the “SB Challenge Litigation”), alleging essentially identical claims as those asserted in the SB Trader Litigation against MTS’s second retrofitted tanker, the Seabulk Challenge. MTS has intervened in the SB Challenge Litigation that was stayed pending the decision of the Court of Appeals in the SB Trader Litigation. In September 2009, the Court of Appeals reversed the District Court, holding that the USCG’s interpretation was correct and that the District Court erred in requiring MTS to provide the Undertaking. On January 19, 2010, the District Court: (i) vacated its April 24, 2008 Order to the extent it directed the USCG to revoke the coastwise endorsement for the Seabulk Trader; (ii) vacated its November 14, 2008 Order providing for the Undertaking; and (iii) remanded the matter to the USCG for further proceedings to reconsider the decision to grant a coastwise endorsement of the Seabulk Trader consistent with the opinion of the Court of Appeals. The loss of coastwise eligibility for its two retrofitted tankers could adversely affect the Company’s financial condition and its results of operations. The aggregate carrying value of the Company’s two retrofitted tankers was $53.1 million as of December 31, 2009 and such tankers contributed operating revenues of $20.2 million during the year ended December 31, 2009.
Certain subsidiaries of the Company are participating employers in an industry-wide, multi-employer, defined benefit pension fund, the United Kingdom Merchant Navy Officers Pension Fund (“MNOPF”). Under the direction of a court order, any deficit of the MNOPF is to be remedied through funding contributions from all participating employers. The Company’s participation relates to officers employed between 1978 and 2002 by SEACOR’s Stirling group of companies (which had been acquired by SEACOR in 2001) and its predecessors. Based on an actuarial valuation of the MNOPF in 2003, the Company was invoiced and expensed $4.4 million in 2005, representing the Company’s allocated share of a total funding deficit of $412.0 million. Subsequent to this invoice, the pension fund trustees determined that $49.0 million of the $412.0 million deficit was deemed uncollectible due to the non-existence or liquidation of certain participating employers and the Company was invoiced and expensed $0.6 million in March 2007 for its allocated share of the uncollectible deficit. Based on an actuarial valuation of the MNOPF in 2006, the Company was invoiced and expensed $3.9 million in September 2007, representing the Company’s allocated share of an additional funding deficit of $332.6 million. The preliminary results of the most recent actuarial valuation of the MNOPF in 2009 indicated that an additional net funding deficit of $720.0 million (£450.0 million) had developed since the previous actuarial valuation in 2006 and the Company estimates its allocated share of the deficit at $8.64 million (£5.4 million). When the Company is invoiced for its share, it will recognize payroll related operating expenses in the periods invoices are received. Depending on the results of the most recent and future actuarial valuations, it is possible that the MNOPF will experience further funding deficits, requiring the Company to recognize payroll related operating expenses in the periods invoices are received.
A subsidiary of the Company is a participating employer in an industry-wide, multi-employer, defined benefit pension fund, the United Kingdom Merchant Navy Ratings Pension Fund (“MNRPF”). The Company’s participation relates to ratings employed between 1978 and 2001 by SEACOR’s Stirling group of companies (which had been acquired by SEACOR in 2001) and its predecessors. Based on an actuarial valuation in March 2008, the MNRPF has an accumulated funding deficit of $284.2 million. No decision has yet been reached as to how the deficit will be recovered, but the Company expects it is likely that participating employers will be invoiced for their allocated share, at which time the Company would recognize payroll related operating expenses. The Company estimates its allocated share of the uninvoiced deficit to be approximately $1.0 million. Depending on the results of the most recent and future actuarial valuations, it is possible that the MNRPF will experience further funding deficits, requiring the Company to recognize payroll related operating expenses in the periods invoices are received.
124
Table of Contents
On June 12, 2009, a purported civil class action was filed against SEACOR, Era Group Inc., Era Aviation, Inc., Era Helicopters LLC and two other defendants (collectively the “Defendants”) in the U.S. District Court for the District of Delaware, Superior Offshore International, Inc. v. Bristow Group Inc., et al., No. 09-CV-438 (D.Del.). SEACOR acquired Era Group Inc., Era Aviation, Inc., and Era Helicopters LLC in December 2004. The complaint alleges that the Defendants violated federal antitrust laws by conspiring with each other to raise, fix, maintain or stabilize prices for offshore helicopter services in the U.S. Gulf of Mexico during the period January 2001 to December 2005. The purported class of plaintiffs includes all direct purchasers of such services and the relief sought includes compensatory damages and treble damages. The Company is unable to estimate the potential exposure, if any, resulting from these claims but believes they are without merit and intends to vigorously defend the action. On September 4, 2009, the Defendants filed a motion to dismiss the complaint. The District Court has yet to rule on that motion.
SEACOR Marine, LLC, a subsidiary of the Company, has two pending actions against it for alleged breaches of the California Wage Act. Bailey v. SEACOR Marine, LLC, is a class action filed on behalf of the crew members (current and terminated) who worked on the Company’s vessels while they were based in California. Schoenfeld v. SEACOR Marine, LLC, is an individual claim filed by Mr. Schoenfeld, even though he himself is a member of the class described in the Bailey case. At this early stage, no definitive estimate can be made as to the probability or magnitude of exposure in the cases. Outside legal counsel’s initial investigation suggests that there is a substantial legal question as to whether federal maritime law preempts the application of state law to the SEACOR vessels in question. If the court decides California wage laws do apply, and a class is certified, there may be financial exposure. Mediation is scheduled for the end of February 2010, and the Company intends to vigorously defend against these claims.
In the normal course of its business, the Company becomes involved in various other litigation matters including, among other things, claims by third parties for alleged property damages and personal injuries. Management has used estimates in determining the Company’s potential exposure to these matters and has recorded reserves in its financial statements related thereto where appropriate. It is possible that a change in the Company’s estimates of that exposure could occur, but the Company does not expect such changes in estimated costs would have a material effect on the Company’s consolidated financial position or its results of operations.
As of December 31, 2009, the Company leases 27 offshore support vessels, resulting primarily from sale-leaseback transactions, twelve helicopters, four barges, three harbor tugs and certain facilities and equipment. These leasing agreements have been classified as operating leases for financial reporting purposes and related rental fees are charged to expense over the lease term as they become payable. Leases generally contain purchase and lease renewal options at fair market value or rights of first refusal with respect to the sale or lease and range in duration from one to six years. Certain of the gains realized from various sale-leaseback transactions, totaling $0.7 million and $57.0 million in 2008 and 2007, respectively, have been deferred in the accompanying consolidated balance sheets and are being credited to income as reductions in rental expense over the lease terms. No gains were deferred in 2009. The total rental expense for the Company’s operating leases in 2009, 2008 and 2007 totaled $65.5 million, $66.4 million and $62.1 million, respectively.
Future minimum payments in the years ended December 31 under operating leases that have a remaining term in excess of one year as of December 31, 2009 were as follows (in thousands):
| Minimum Payment | |||
| 2010 |
$ | 34,726 | |
| 2011 |
31,170 | ||
| 2012 |
18,947 | ||
| 2013 |
5,617 | ||
| 2014 |
4,411 | ||
| Years subsequent to 2014 |
8,777 | ||
125
Table of Contents
| 15. | MAJOR CUSTOMERS AND SEGMENT DATA |
Accounting standards require public business enterprises to report information about each of their operating business segments that exceed certain quantitative thresholds or meet certain other reporting requirements. Operating business segments have been defined as a component of an enterprise about which separate financial information is available and is evaluated regularly by the chief operating decision maker in deciding how to allocate resources and in assessing performance. The Company has identified the following reporting segments:
Offshore Marine Services. Offshore Marine Services operates a diversified fleet of support vessels primarily servicing offshore oil and gas exploration, development and production facilities worldwide. Vessels in this service are employed to deliver cargo and personnel to offshore installations, handle anchors for drilling rigs and other marine equipment, support offshore construction and maintenance work, provide standby safety support and emergency response services. From time to time, Offshore Marine Services supports projects such as well stimulation, seismic data gathering and offshore accommodation. Offshore Marine Services also offers logistics services in support of offshore oil and gas exploration, development and production operations, including shorebased, marine transport and other supply chain management services. This segment contributed 33%, 43% and 51% of consolidated operating revenues in 2009, 2008 and 2007, respectively.
Marine Transportation Services. Marine Transportation Services operates a fleet of U.S.-flag product tankers, providing marine transportation services for petroleum products and chemicals moving in the U.S. domestic coastwise trade. This segment contributed 5%, 7% and 9% of consolidated operating revenues in 2009, 2008 and 2007, respectively.
Inland River Services. Inland River Services owns, operates, invests in and markets inland river transportation equipment. The Company believes it operates one of the industry’s newest fleets of dry cargo and liquid tank barges transporting agricultural, industrial, chemical and petrochemical products on the U.S. Inland River Waterways, primarily the Mississippi River, Illinois River, Tennessee River, Ohio River and their tributaries and the Gulf Intracoastal Waterways. Inland River Services also owns towboats used for moving barges, fleeting operations used in barge loading and unloading activities, and deck barges for specialized projects. It also manages barges for third parties. Inland River Services contributed 9%, 9% and 9% of consolidated operating revenues in 2009, 2008 and 2007, respectively.
Aviation Services. Aviation Services is primarily engaged in transportation services to the offshore oil and gas exploration, development and production industry, aircraft leasing, transportation services to hospitals, and flightseeing tours in Alaska. In addition, Aviation Services sells fuel and provides other services to corporate aircraft at its fixed base operation at Ted Stevens Anchorage International Airport. It also provides aircraft and flight crews under contracts, provides flight training services and manages customer-owned aircraft. Aviation Services operates a FAA approved maintenance repair station in Lake Charles, LA. Aviation Services contributed 14%, 15% and 16% of consolidated operating revenues in 2009, 2008 and 2007, respectively.
Environmental Services. Environmental Services primarily provides emergency preparedness and response services to oil, chemical, industrial and marine transportation clients, and government agencies in the United States and abroad. In the United States, these services are generally rendered to those clients who store, transport, produce or handle petroleum and certain non-petroleum oils that are subject to the provisions of OPA 90 and various other federal, state and municipal regulations. Internationally, these services may be required by legislation and regulation of countries, international maritime conventions and environmental covenants placed on clients by their lending institutions. To a lesser extent, Environmental Services provides emergency preparedness and response services to governmental agencies arising from natural disasters and homeland security issues such as debris removal monitoring, public assistance projects, bio-terrorism, pandemic influenza and port security. Environmental Services also provides other services to oil, chemical, industrial and government clients including hazardous waste management, industrial and marine cleaning, salvage support, petroleum storage tank removal, pipeline repair and site remediation services. Business is conducted primarily through the Company’s wholly owned subsidiaries:
126
Table of Contents
National Response Corporation (“NRC”), O’Brien’s Response Management Inc. and SEACOR Environmental Services International Limited. Environmental Services contributed 8%, 10% and 12% of consolidated operating revenues in 2009, 2008 and 2007, respectively.
Commodity Trading and Logistics. Commodity Trading and Logistics operates an integrated business involved in the purchase, storage, transportation and sale of agricultural and energy commodities. The principal commodities currently involved are rice, sugar, ethanol and clean blendstocks. Commodity Trading and Logistics contributed 28%, 13% and 1% of consolidated operating revenues in 2009, 2008 and 2007, respectively.
Other Activities.
Harbor and Offshore Towing Services. As of December 31, 2009, Harbor and Offshore Towing Services operated a total of six ocean liquid tank barges and 31 vessels, of which 15 were conventional tugs, six were Azimuth Stern Drive tugs, three were Forward Azimuth Drive tugs, three were tractor tugs and four were Ship Docking Modules (“SDM™”). SDMs™ are innovative vessels designed and patented by the Company that are maneuverable, efficient and flexible and require fewer crew members than conventional harbor tugs.
Other Joint Ventures, Leasing and Other Activities. The Company has minority equity investments in various entities which include a company that designs and manufactures water treatment systems for sale or lease, and two aviation services businesses in Asia. The Company also engages in lending and leasing activities.
127
Table of Contents
The following tables summarize the operating results, capital expenditures and assets of the Company’s reportable segments. Certain prior period information has been retrospectively adjusted to reflect the adoption of new accounting rules established by the FASB related to the Company’s convertible debt (see Note 8).
| Offshore Marine Services $’000 |
Marine Transportation Services $’000 |
Inland River Services $’000 |
Aviation Services $’000 |
Environmental Services $’000 |
Commodity Trading and Logistics $’000 |
Other $’000 |
Corporate and Eliminations $’000 |
Total $’000 |
||||||||||||||||||
| For the year ended December 31, 2009 |
||||||||||||||||||||||||||
| Operating Revenues: |
||||||||||||||||||||||||||
| External customers |
557,269 | 92,866 | 143,503 | 235,595 | 145,648 | 472,575 | 63,882 | — | 1,711,338 | |||||||||||||||||
| Intersegment |
5,022 | — | 11,595 | 72 | 119 | — | 472 | (17,280 | ) | — | ||||||||||||||||
| 562,291 | 92,866 | 155,098 | 235,667 | 145,767 | 472,575 | 64,354 | (17,280 | ) | 1,711,338 | |||||||||||||||||
| Costs and Expenses: |
||||||||||||||||||||||||||
| Operating |
309,635 | 50,568 | 89,444 | 147,955 | 103,761 | 460,713 | 40,572 | (17,552 | ) | 1,185,096 | ||||||||||||||||
| Administrative and general |
47,031 | 4,122 | 8,764 | 21,396 | 25,452 | 12,644 | 10,422 | 32,167 | 161,998 | |||||||||||||||||
| Depreciation and amortization |
54,869 | 32,006 | 19,357 | 37,358 | 7,150 | 29 | 8,172 | 1,151 | 160,092 | |||||||||||||||||
| 411,535 | 86,696 | 117,565 | 206,709 | 136,363 | 473,386 | 59,166 | 15,766 | 1,507,186 | ||||||||||||||||||
| Gains (Losses) on Asset Dispositions and Impairments, Net |
22,490 | — | 4,706 | 316 | (197 | ) | — | 363 | (3 | ) | 27,675 | |||||||||||||||
| Operating Income (Loss) |
173,246 | 6,170 | 42,239 | 29,274 | 9,207 | (811 | ) | 5,551 | (33,049 | ) | 231,827 | |||||||||||||||
| Other Income (Expense): |
||||||||||||||||||||||||||
| Derivative gains (losses), net |
(175 | ) | — | — | 266 | — | 4,028 | — | 6,842 | 10,961 | ||||||||||||||||
| Foreign currency gains (losses), net |
2,451 | (1 | ) | — | 1,439 | 9 | 498 | 136 | 3,555 | 8,087 | ||||||||||||||||
| Other, net |
182 | — | — | — | — | 25 | (54 | ) | 91 | 244 | ||||||||||||||||
| Equity in Earnings (Losses) of 50% or Less Owned Companies |
9,867 | — | 3,882 | (487 | ) | 225 | (95 | ) | (811 | ) | — | 12,581 | ||||||||||||||
| Segment Profit |
185,571 | 6,169 | 46,121 | 30,492 | 9,441 | 3,645 | 4,822 | |||||||||||||||||||
| Other Income (Expense) not included in Segment Profit |
(36,105 | ) | ||||||||||||||||||||||||
| Less Equity Earnings included in Segment Profit |
(12,581 | ) | ||||||||||||||||||||||||
| Income Before Taxes, Minority Interest and Equity Earnings |
215,014 | |||||||||||||||||||||||||
| Capital Expenditures |
39,135 | 124 | 14,711 | 90,762 | 7,336 | 120 | 23,076 | 4,760 | 180,024 | |||||||||||||||||
| As of December 31, 2009 |
||||||||||||||||||||||||||
| Property and Equipment |
727,256 | 364,745 | 267,971 | 523,195 | 35,728 | 228 | 155,599 | 4,026 | 2,078,748 | |||||||||||||||||
| Investments, at Equity, and Receivables from 50% or Less Owned Companies |
48,460 | — | 84,581 | 26,399 | 2,109 | 14,567 | 10,698 | — | 186,814 | |||||||||||||||||
| Goodwill |
13,367 | — | 1,743 | 353 | 37,806 | — | 1,302 | — | 54,571 | |||||||||||||||||
| Intangible Assets |
10,226 | 2,332 | 1,465 | — | 8,891 | — | 640 | — | 23,554 | |||||||||||||||||
| Other current and long-term assets, excluding cash and near cash assets(1) |
171,521 | 8,658 | 56,914 | 69,679 | 41,943 | 86,676 | 27,061 | 59,673 | 522,125 | |||||||||||||||||
| Segment Assets |
970,830 | 375,735 | 412,674 | 619,626 | 126,477 | 101,471 | 195,300 | |||||||||||||||||||
| Cash and near cash assets(1) |
857,807 | |||||||||||||||||||||||||
| Total Assets |
3,723,619 | |||||||||||||||||||||||||
| (1) | Cash and near cash assets includes cash, cash equivalents, restricted cash, marketable securities, construction reserve funds and Title XI reserve funds. |
128
Table of Contents
| Offshore Marine Services $’000 |
Marine Transportation Services $’000 |
Inland River Services $’000 |
Aviation Services $’000 |
Environmental Services $’000 |
Commodity Trading and Logistics $’000 |
Other $’000 |
Corporate and Eliminations $’000 |
Total $’000 |
|||||||||||||||||
| For the year ended December 31, 2008 |
|||||||||||||||||||||||||
| Operating Revenues: |
|||||||||||||||||||||||||
| External customers |
705,967 | 114,028 | 138,662 | 248,569 | 167,948 | 208,264 | 72,518 | — | 1,655,956 | ||||||||||||||||
| Intersegment |
2,761 | — | 5,360 | 58 | 82 | — | 363 | (8,624 | ) | — | |||||||||||||||
| 708,728 | 114,028 | 144,022 | 248,627 | 168,030 | 208,264 | 72,881 | (8,624 | ) | 1,655,956 | ||||||||||||||||
| Costs and Expenses: |
|||||||||||||||||||||||||
| Operating |
390,102 | 72,246 | 82,419 | 181,490 | 117,326 | 189,905 | 45,821 | (8,193 | ) | 1,071,116 | |||||||||||||||
| Administrative and general |
58,422 | 6,302 | 7,887 | 20,130 | 27,527 | 8,960 | 9,966 | 35,684 | 174,878 | ||||||||||||||||
| Depreciation and amortization |
55,634 | 32,013 | 16,582 | 36,411 | 7,053 | — | 7,750 | 983 | 156,426 | ||||||||||||||||
| 504,158 | 110,561 | 106,888 | 238,031 | 151,906 | 198,865 | 63,537 | 28,474 | 1,402,420 | |||||||||||||||||
| Gains (Losses) on Asset Dispositions and Impairments, Net |
69,206 | 3,629 | 10,394 | 4,883 | 124 | — | 1,315 | (398 | ) | 89,153 | |||||||||||||||
| Operating Income (Loss) |
273,776 | 7,096 | 47,528 | 15,479 | 16,248 | 9,399 | 10,659 | (37,496 | ) | 342,689 | |||||||||||||||
| Other Income (Expense): |
|||||||||||||||||||||||||
| Derivative gains (losses), net |
— | — | — | 274 | — | (429 | ) | 15 | (13,448 | ) | (13,588 | ) | |||||||||||||
| Foreign currency gains (losses), net |
(422 | ) | 55 | — | 271 | (318 | ) | 70 | (149 | ) | (7,344 | ) | (7,837 | ) | |||||||||||
| Other, net |
(12 | ) | — | 16 | 38 | — | 8 | 4 | 266 | 320 | |||||||||||||||
| Equity in Earnings (Losses) of 50% or Less Owned Companies |
11,068 | — | 388 | (461 | ) | 616 | 173 | 285 | — | 12,069 | |||||||||||||||
| Segment Profit |
284,410 | 7,151 | 47,932 | 15,601 | 16,546 | 9,221 | 10,814 | ||||||||||||||||||
| Other Income (Expense) not included in Segment Profit |
(3,658 | ) | |||||||||||||||||||||||
| Less Equity Earnings included in Segment Profit |
(12,069 | ) | |||||||||||||||||||||||
| Income Before Taxes, Minority Interest and Equity Earnings |
317,926 | ||||||||||||||||||||||||
| Capital Expenditures |
113,306 | 6,727 | 54,562 | 220,623 | 8,999 | — | 23,256 | 1,005 | 428,478 | ||||||||||||||||
| As of December 31, 2008 |
|||||||||||||||||||||||||
| Property and Equipment |
794,461 | 396,242 | 276,471 | 495,410 | 33,099 | — | 140,159 | 3,674 | 2,139,516 | ||||||||||||||||
| Investments, at Equity, and Receivables from 50% or Less Owned Companies |
27,674 | — | 77,938 | 27,415 | 1,839 | 2,186 | 13,010 | — | 150,062 | ||||||||||||||||
| Goodwill |
13,367 | — | 1,493 | 353 | 34,981 | — | 1,302 | — | 51,496 | ||||||||||||||||
| Intangible Assets |
12,623 | 2,717 | 1,788 | — | 10,603 | — | 747 | — | 28,478 | ||||||||||||||||
| Other current and long-term assets, excluding cash and near cash assets(1) |
165,746 | 11,838 | 40,561 | 63,154 | 58,039 | 47,037 | 25,759 | 22,165 | 434,299 | ||||||||||||||||
| Segment Assets |
1,013,871 | 410,797 | 398,251 | 586,332 | 138,561 | 49,223 | 180,977 | ||||||||||||||||||
| Cash and near cash assets(1) |
655,803 | ||||||||||||||||||||||||
| Total Assets |
3,459,654 | ||||||||||||||||||||||||
| (1) | Cash and near cash assets includes cash, cash equivalents, restricted cash, marketable securities, construction reserve funds and Title XI reserve funds. |
129
Table of Contents
| Offshore Marine Services $’000 |
Marine Transportation Services $’000 |
Inland River Services $’000 |
Aviation Services $’000 |
Environmental Services $’000 |
Commodity Trading and Logistics $’000 |
Other $’000 |
Corporate and Eliminations $’000 |
Total $’000 |
||||||||||||||||||
| For the year ended December 31, 2007 |
||||||||||||||||||||||||||
| Operating Revenues: |
||||||||||||||||||||||||||
| External customers |
692,245 | 116,037 | 121,248 | 215,039 | 155,375 | 9,600 | 49,686 | — | 1,359,230 | |||||||||||||||||
| Intersegment |
173 | — | — | — | 1,451 | — | 346 | (1,970 | ) | — | ||||||||||||||||
| 692,418 | 116,037 | 121,248 | 215,039 | 156,826 | 9,600 | 50,032 | (1,970 | ) | 1,359,230 | |||||||||||||||||
| Costs and Expenses: |
||||||||||||||||||||||||||
| Operating |
374,474 | 90,702 | 57,458 | 157,240 | 111,297 | 9,731 | 33,421 | (1,920 | ) | 832,403 | ||||||||||||||||
| Administrative and general |
51,908 | 5,309 | 6,807 | 18,865 | 23,310 | 855 | 8,394 | 31,869 | 147,317 | |||||||||||||||||
| Depreciation and amortization |
60,523 | 38,248 | 16,307 | 27,561 | 4,853 | — | 5,506 | 1,309 | 154,307 | |||||||||||||||||
| 486,905 | 134,259 | 80,572 | 203,666 | 139,460 | 10,586 | 47,321 | 31,258 | 1,134,027 | ||||||||||||||||||
| Gains (Losses) on Asset Dispositions and Impairments, Net |
82,534 | — | 30,562 | 8,032 | 175 | — | 1,270 | (1 | ) | 122,572 | ||||||||||||||||
| Operating Income (Loss) |
288,047 | (18,222 | ) | 71,238 | 19,405 | 17,541 | (986 | ) | 3,981 | (33,229 | ) | 347,775 | ||||||||||||||
| Other Income (Expense): |
||||||||||||||||||||||||||
| Derivative gains (losses), net |
— | — | — | (2,695 | ) | — | 736 | (233 | ) | 13,027 | 10,835 | |||||||||||||||
| Foreign currency gains (losses), net |
(760 | ) | 43 | — | 44 | (61 | ) | — | (115 | ) | 1,079 | 230 | ||||||||||||||
| Other, net |
10 | — | 108 | 613 | (1 | ) | — | 118 | (859 | ) | (11 | ) | ||||||||||||||
| Equity in Earnings (Losses) of 50% or Less Owned Companies |
14,221 | — | 7,650 | (8 | ) | 237 | — | (35 | ) | — | 22,065 | |||||||||||||||
| Segment Profit (Loss) |
301,518 | (18,179 | ) | 78,996 | 17,359 | 17,716 | (250 | ) | 3,716 | |||||||||||||||||
| Other Income (Expense) not included in Segment Profit (Loss) |
(15,007 | ) | ||||||||||||||||||||||||
| Less Equity Earnings included in Segment Profit |
(22,065 | ) | ||||||||||||||||||||||||
| Income Before Taxes, Minority Interest and Equity Earnings |
343,822 | |||||||||||||||||||||||||
| Capital Expenditures |
344,377 | 14,295 | 30,844 | 133,829 | 6,367 | — | 6,180 | 1,716 | 537,608 | |||||||||||||||||
| As of December 31, 2007 |
||||||||||||||||||||||||||
| Property and Equipment |
807,210 | 431,517 | 225,052 | 332,709 | 29,223 | — | 113,358 | 4,083 | 1,943,152 | |||||||||||||||||
| Investments, at Equity, and Receivables from 50% or Less Owned Companies |
21,023 | — | 71,426 | 6,016 | 884 | 9,939 | — | 109,288 | ||||||||||||||||||
| Goodwill |
21,421 | 178 | 1,492 | 352 | 32,666 | — | 4,117 | — | 60,226 | |||||||||||||||||
| Intangible Assets |
15,221 | 3,092 | 2,454 | — | 8,882 | — | 851 | — | 30,500 | |||||||||||||||||
| Other current and long-term assets, excluding cash and near cash assets(1) |
169,598 | 8,891 | 34,003 | 76,000 | 55,949 | 2,798 | 16,704 | 57,615 | 421,558 | |||||||||||||||||
| Segment Assets |
1,034,473 | 443,678 | 334,427 | 415,077 | 127,604 | 2,798 | 144,969 | |||||||||||||||||||
| Cash and near cash assets(1) |
1,001,721 | |||||||||||||||||||||||||
| Total Assets |
3,566,445 | |||||||||||||||||||||||||
| (1) | Cash and near cash assets includes cash, cash equivalents, restricted cash, marketable securities, construction reserve funds and Title XI reserve funds. |
130
Table of Contents
In 2009, 2008 and 2007, the Company did not earn revenues that were greater than or equal to 10% of total revenues from a single customer. For the years ended December 31, 2009, 2008 and 2007, approximately 30%, 32% and 30%, respectively, of the Company’s operating revenues were derived from its foreign operations. The Company’s foreign revenues are primarily derived from its Offshore Marine Services fleet. These vessels are highly mobile and regularly and routinely move between countries within a geographical region of the world. In addition, these vessels may be redeployed among the geographical regions as changes in market conditions dictate. Because of this asset mobility, revenues and long-lived assets, primarily property and equipment, in any one country are not considered material. The following represents the Company’s revenues attributed by geographical region in which services are provided to customers for the years ended December 31 (in thousands):
| 2009 | 2008 | 2007 | |||||||
| Operating Revenues: |
|||||||||
| United States |
$ | 1,190,218 | $ | 1,130,867 | $ | 946,298 | |||
| Africa, primarily West Africa |
191,360 | 162,998 | 160,046 | ||||||
| United Kingdom, primarily North Sea |
73,848 | 80,025 | 77,959 | ||||||
| Asia |
35,737 | 45,226 | 33,429 | ||||||
| Middle East |
81,970 | 88,421 | 55,684 | ||||||
| Mexico, Central and South America |
115,703 | 118,381 | 50,000 | ||||||
| Other |
22,502 | 30,038 | 35,814 | ||||||
| $ | 1,711,338 | $ | 1,655,956 | $ | 1,359,230 | ||||
The Company’s long-lived assets are primarily its property and equipment that are employed in various geographical regions of the world. The following represents the Company’s property and equipment based upon the assets’ physical location as of December 31 (in thousands):
| 2009 | 2008 | 2007 | |||||||
| Property and Equipment: |
|||||||||
| United States |
$ | 1,386,745 | $ | 1,512,645 | $ | 1,569,974 | |||
| Africa, primarily West Africa |
128,745 | 122,261 | 91,281 | ||||||
| United Kingdom, primarily North Sea |
69,893 | 47,297 | 39,099 | ||||||
| Asia |
49,550 | 46,586 | 46,660 | ||||||
| Middle East |
83,107 | 81,367 | 56,550 | ||||||
| Mexico, Central and South America |
306,265 | 273,169 | 101,548 | ||||||
| Other |
54,443 | 56,191 | 38,040 | ||||||
| $ | 2,078,748 | $ | 2,139,516 | $ | 1,943,152 | ||||
131
Table of Contents
| 16. | SUPPLEMENTAL INFORMATION FOR STATEMENTS OF CASH FLOWS |
Supplemental information for the years ended December 31 were as follows (in thousands):
| 2009 | 2008 | 2007 | |||||||
| Income taxes paid |
$ | 47,535 | $ | 31,560 | $ | 19,960 | |||
| Income taxes refunded |
7,534 | 6,991 | 40 | ||||||
| Interest paid |
49,041 | 54,649 | 50,241 | ||||||
| Schedule of Non-Cash Investing and Financing Activities: |
|||||||||
| Company financed purchase of vessels |
— | 33,381 | 16,489 | ||||||
| Company financed purchase of noncontrolling interests |
7,000 | — | — | ||||||
| Company financed sale of vessels |
7,603 | 1,500 | — | ||||||
| Contribution of assets to business ventures |
14,685 | 2,517 | 33,027 | ||||||
| Settlement of Convertible Debentures, including purchase of conversion option – Common Stock |
217,174 | — | — | ||||||
| Acquisition of Waxler – Common Stock |
— | — | 19,110 | ||||||
| Acquisitions of Trident and RMA – Notes payable |
— | 504 | — | ||||||
| 17. | QUARTERLY FINANCIAL INFORMATION (UNAUDITED) |
Selected financial information for interim quarterly periods is presented below (in thousands, except share data). Earnings per common share of SEACOR Holdings Inc. are computed independently for each of the quarters presented and the sum of the quarterly earnings per share may not necessarily equal the total for the year. Certain prior period information has been retrospectively adjusted to reflect the adoption of new accounting rules established by the FASB related to the Company’s convertible debt (see Note 8).
| Dec. 31, | Sept. 30, | June 30, | March 31, | |||||||||
| 2009 |
||||||||||||
| Operating Revenues |
$ | 476,510 | $ | 446,079 | $ | 389,233 | $ | 399,516 | ||||
| Operating Income |
46,646 | 42,062 | 53,201 | 89,918 | ||||||||
| Net Income |
22,429 | 26,240 | 42,641 | 53,793 | ||||||||
| Net Income attributable to SEACOR Holdings Inc. |
22,226 | 26,282 | 42,308 | 52,994 | ||||||||
| Basic Earnings Per Common Share of SEACOR Holdings Inc. |
$ | 1.09 | $ | 1.32 | $ | 2.13 | $ | 2.68 | ||||
| Diluted Earnings Per Common Share of SEACOR Holdings Inc. |
$ | 1.04 | $ | 1.23 | $ | 1.91 | $ | 2.36 | ||||
| 2008 |
||||||||||||
| Operating Revenues |
$ | 454,926 | $ | 437,608 | $ | 408,967 | $ | 354,455 | ||||
| Operating Income |
110,336 | 106,723 | 71,114 | 54,516 | ||||||||
| Net Income |
70,595 | 74,702 | 37,279 | 36,847 | ||||||||
| Net Income attributable to SEACOR Holdings Inc. |
70,741 | 74,339 | 37,088 | 36,645 | ||||||||
| Basic Earnings Per Common Share of SEACOR Holdings Inc. |
$ | 3.58 | $ | 3.68 | $ | 1.74 | $ | 1.64 | ||||
| Diluted Earnings Per Common Share of SEACOR Holdings Inc. |
$ | 3.11 | $ | 3.20 | $ | 1.57 | $ | 1.50 | ||||
132
Table of Contents
SCHEDULE II—VALUATION AND QUALIFYING ACCOUNTS
For the Years Ended December 31, 2009, 2008 and 2007
(in thousands)
| Description |
Balance Beginning of Year |
Charges (Reductions) to Cost and Expenses |
Deductions(1) | Balance End of Year | |||||||||
| Year Ended December 31, 2009 |
|||||||||||||
| Allowance for doubtful accounts (deducted from trade and notes receivable) |
$ | 6,618 | $ | 1,717 | $ | (2,426 | ) | $ | 5,909 | ||||
| Year Ended December 31, 2008 |
|||||||||||||
| Allowance for doubtful accounts (deducted from trade and notes receivable) |
$ | 6,172 | $ | 1,392 | $ | (946 | ) | $ | 6,618 | ||||
| Year Ended December 31, 2007 |
|||||||||||||
| Allowance for doubtful accounts (deducted from trade and notes receivable) |
$ | 6,903 | $ | 571 | $ | (1,302 | ) | $ | 6,172 | ||||
| (1) | Trade and notes receivable amounts deemed uncollectible are removed from accounts receivable and allowance for doubtful accounts. |
133
Table of Contents
EXHIBIT INDEX
| Exhibit |
Description | |
| 3.1* | Restated Certificate of Incorporation of SEACOR SMIT Inc. (incorporated herein by reference to Exhibit 3.1 (a) of the Company’s Quarterly Report on Form 10-Q for the fiscal quarter ended June 30, 1997 and filed with the Commission on August 14, 1997). | |
| 3.2* | Certificate of Amendment to the Restated Certificate of Incorporation of SEACOR SMIT Inc. (incorporated herein by reference to Exhibit 3.1(b) of the Company’s Quarterly Report on Form 10-Q for the fiscal quarter ended June 30, 1997 and filed with the Commission on August 14, 1997). | |
| 3.3* | Certificate of Amendment to the Restated Certificate of Incorporation of SEACOR Holdings Inc. (incorporated herein by reference to Exhibit 4.4 of the Company’s Registration Statement on Form S-8 (No. 333-126613) filed with the Commission on July 15, 2005). | |
| 3.4* | Second Amended and Restated Bylaws of SEACOR Holdings Inc. (incorporated herein by reference to Exhibit 4.3 of the Company’s Registration Statement on Form S-8 (No. 333-129356) filed with the Commission on November 1, 2005). | |
| 3.5* | Third Amended and Restated Bylaws of SEACOR Holdings Inc. (incorporated by reference to Exhibit 3.1 of the Company Current Report on Form 80K filed with the Commission on March 17, 2009). | |
| 4.1* | Indenture, dated as of September 22, 1997, between SEACOR SMIT Inc. and First Trust National Association, as trustee (including therein Form of Exchange Note 7.20% Senior Notes Due 2009) (incorporated herein by reference to Exhibit 4.1 of the Company’s Registration Statement on Form S-4 (No. 333-38841) filed with the Commission on October 27, 1997). | |
| 4.2* | Investment and Registration Rights Agreement, dated as of March 14, 1995, by and among SEACOR Holdings Inc., Miller Family Holdings, Inc., Charles Fabrikant, Mark Miller, Donald Toenshoff, Alvin Wood, Granville Conway and Michael Gellert (incorporated herein by reference to Exhibit 4.0 of the Company’s Current Report on Form 8-K filed with the Commission on March 14, 1995). | |
| 4.3* | Investment and Registration Rights Agreement, dated as of May 31, 1996, among SEACOR Holdings Inc. and the persons listed on the signature pages thereto (incorporated herein by reference to Exhibit 10.8 of the Company’s Current Report on Form 8-K filed with the Commission on June 7, 1996). | |
| 4.4* | Registration Rights Agreement, dated November 5, 1996, between SEACOR Holdings Inc. and Credit Suisse First Boston Corporation, Salomon Brothers Inc. and Wasserstein Perella Securities, Inc. (incorporated herein by reference to Exhibit 4.1 of the Company’s Quarterly Report on Form 10-Q for the fiscal quarter ended September 30, 1996 filed with the Commission on November 14, 1996). | |
| 4.5* | Investment and Registration Rights Agreement, dated as of December 19, 1996, by and between SEACOR Holdings Inc. and Smit International Overseas B.V. (incorporated herein by reference to Exhibit 4.0 of the Company’s Current Report on Form 8-K filed with the Commission on December 24, 1996). | |
| 4.6* | Investment and Registration Rights Agreement, dated as of January 3, 1997, among SEACOR Holdings Inc., Acadian Offshore Services, Inc., Galaxie Marine Service, Inc., Moonmaid Marine, Inc. and Triangle Marine, Inc. (incorporated herein by reference to Exhibit 4.6 of the Company’s Registration Statement on Form S-3 (No. 333-20921) filed with the Commission on January 31, 1997). | |
| 4.7* | Investment and Registration Rights Agreement, dated October 27, 1995, by and between SEACOR Holdings Inc. and Coastal Refining and Marketing, Inc. (incorporated herein by reference to Exhibit 4.2 of the Company’s Registration Statement on Form S-3 (No. 33-97868) filed with the Commission on November 17, 1995). | |
134
Table of Contents
| Exhibit |
Description | |
| 4.8* | Investment and Registration Rights Agreement, dated November 14, 1995, by and between SEACOR Holdings Inc. and Compagnie Nationale de Navigation (incorporated herein by reference to Exhibit 4.3 of the Company’s Registration Statement on Form S-3 (No. 33-97868) filed with the Commission on November 17, 1995). | |
| 4.9* | Registration Agreement, dated as of September 22, 1997, between SEACOR Holdings Inc. and the Initial Purchasers (as defined therein) (incorporated herein by reference to Exhibit 4.3 of the Company’s Registration Statement on Form S-4 (No. 333-38841) filed with the Commission on October 27, 1997). | |
| 4.10* | Investment and Registration Rights Agreement, dated as of April 19, 2000, among SEACOR SMIT Inc. and the other parties thereto (incorporated herein by reference to Exhibit 4.1 of the Company’s Registration Statement on Form S-3 (No. 333-37492) filed with the Commission on May 19, 2000). | |
| 4.11* | Investment and Registration Rights Agreement, dated as of December 19, 2000, among SEACOR SMIT Inc. and the other parties thereto (incorporated herein by reference to Exhibit 4.1 of the Company’s Registration Statement on Form S-3 (No. 333-56842) filed with the Commission on March 9, 2001). | |
| 4.12* | Investment and Registration Rights Agreement, dated as of January 9, 2001, among SEACOR SMIT Inc. and the other parties thereto (incorporated herein by reference to Exhibit 4.2 of the Company’s Registration Statement on Form S-3 (No. 333-56842) filed with the Commission on March 9, 2001). | |
| 4.13* | Form of Indenture, dated as of January 10, 2001, among SEACOR SMIT Inc. and U.S. Bank Trust National Association as trustee (incorporated herein by reference to Exhibit 4.2 to Amendment No. 1 of the Company’s Registration Statement on Form S-3/A (No. 333-53326) filed with the Commission on January 18, 2001). | |
| 4.14* | Form of Indenture, dated as of January 10, 2001, among SEACOR SMIT Inc. and U.S. Bank Trust National Association as trustee (incorporated herein by reference to Exhibit 4.3 to Amendment No. 1 of the Company’s Registration Statement on Form S-3/A (No. 333-53326) filed with the Commission on January 18, 2001). | |
| 4.15* | Indenture, dated as of December 17, 2004, between SEACOR Holdings Inc. and U.S. Bank National Association, as Trustee (incorporated herein by reference to Exhibit 4.1 of the Company’s Current Report on Form 8-K filed with the Commission on March 14, 2005). | |
| 4.16* | Registration Rights Agreement, dated December 17, 2004, between the Company and Credit Suisse-First Boston LLC (incorporated herein by reference to Exhibit 4.2 of the Company’s Current Report on Form 8-K filed with the Commission on March 14, 2005). | |
| 4.17* | Registration Rights Agreement, dated March 16, 2005, by and among SEACOR Holdings Inc. and the holders named therein (incorporated herein reference to Exhibit 4.1 of the Company’s Current Report on Form 8-K filed with the Commission on March 17, 2005). | |
| 4.18* | Stockholders’ Agreement, dated as of March 16, 2005, among SEACOR Holdings Inc., SBLK Acquisition Corp., CORBULK LLC and the stockholders named therein (incorporated herein reference to Exhibit 10.1 of the Company’s Current Report on Form 8-K filed with the Commission on March 17, 2005). | |
| 4.19* | Registration Rights Agreement dated as of August 5, 2003 between Seabulk International, Inc. and Credit Suisse First Boston LLC, Banc of America Securities LLC, RBC Dominion Securities Corporation and Merrill Lynch, Pierce, Fenner & Smith Incorporated (incorporated herein by reference to Exhibit 4.8 of Seabulk International, Inc.’s Registration Statement on Form S-4 (No. 333-110138) filed with the Commission on October 31, 2003). | |
135
Table of Contents
| Exhibit |
Description | |
| 4.20* | Indenture, dated as of August 5, 2003, among Seabulk International, Inc., the Guarantors named therein, and Wachovia Bank, National Association, as Trustee (including forms of notes) (incorporated herein by reference to Exhibit 4.7 of Seabulk International, Inc.’s Registration Statement on Form S-4 (No. 333-110138) filed with the Commission on October 31, 2003). | |
| 4.21* | Supplemental Indenture, dated as of October 3, 2003, among Seabulk International, Inc., the Guarantors named therein, and Wachovia Bank, National Association, as Trustee (incorporated herein by reference to Exhibit 4.9 of Seabulk International, Inc.’s Registration Statement on Form S-4 (No. 333-110-138) filed with the Commission on October 31, 2003). | |
| 4.22* | Second Supplemental Indenture, dated as of March 22, 2004, among Seabulk International, Inc., the Guarantors named therein, and Wachovia Bank, National Association, as Trustee (incorporated herein by reference to Exhibit 10.11 of Seabulk International, Inc.’s Annual Report on Form 10-K (No. 000-28732) for the year ended December 31, 2003 filed with the Commission on March 30, 2004). | |
| 4.23* | Third Supplemental Indenture, dated as of February 28, 2006, among Seabulk International, Inc., SEACOR Holdings Inc., the guarantors named therein and U.S. Bank National Association, as Trustee (incorporated herein reference to Exhibit 4.1 of the Company’s Current Report on Form 8-K filed with the Commission on March 1, 2006). | |
| 4.24* | Supplemental Indenture, dated September 24, 2009, between SEACOR Holdings Inc. and U.S. Bank National Association, as trustee (incorporated by reference to Exhibit 4.1 of the Company’s Current Report on Form 8-K filed with Commission on September 24, 2009). | |
| 4.25* | Form of Global Note representing the 7.375% Senior Notes due 2019 (incorporated by reference to Exhibit 4.2 of the Company’s Current Report on Form 8-K filed with the Commission on September 24, 2009). | |
| 10.1*+ | SEACOR Holdings Inc. 1996 Share Incentive Plan (incorporated herein by reference to Annex A of the Company’s Proxy Statement on DEF 14-A filed with the Commission on March 18, 1996). | |
| 10.2*+ | SEACOR SMIT Inc. 2000 Stock Option Plan for Non-Employee Directors (incorporated herein by reference to Exhibit 10.1 of the Company’s Quarterly Report on Form 10-Q for the period ended June 30, 2000 and filed with the Commission on August 14, 2000). | |
| 10.3* | Form of Management Agreement (incorporated herein by reference to Exhibit 10.4 of the Company’s Current Report on Form 8-K filed with the Commission on December 24, 1996). | |
| 10.4* | License Agreement, dated December 19, 1996, between SEACOR Holdings Inc., certain subsidiaries of SEACOR Holdings Inc. and Smit Intemationale N.V. (incorporated herein by reference to Exhibit 10.6 of the Company’s Current Report on Form 8-K filed with the Commission on December 24, 1996). | |
| 10.5*+ | Form of Type A Restricted Stock Grant Agreement (incorporated herein by reference to Exhibit 10.35 of the Company’s Annual Report on Form 10-K for the fiscal year ended December 31, 2000 filed with the Commission on March 30, 2000). | |
| 10.6*+ | Form of Type B Restricted Stock Grant Agreement (incorporated herein by reference to Exhibit 10.36 of the Company’s Annual Report on Form 10-K for the fiscal year ended December 31, 2000 filed with the Commission on March 30, 2000). | |
| 10.7*+ | Form of Option Agreement for Officers and Key Employees Pursuant to the SEACOR SMIT Inc. 1996 Share Incentive Plan (incorporated herein by reference to Exhibit 10.37 of the Company’s Annual Report on Form 10-K for the fiscal year ended December 31, 2000 filed with the Commission on March 30, 2000). | |
136
Table of Contents
| Exhibit |
Description | |
| 10.9*+ | SEACOR SMIT Inc. 2003 Non-Employee Director Share Incentive Plan (incorporated herein by reference to Exhibit 10.25 of the Company’s Annual Report on Form 10-K for the fiscal year ended December 31, 2003 filed with the Commission on March 15, 2004). | |
| 10.10*+ | SEACOR SMIT Inc. 2003 Share Incentive Plan (incorporated herein by reference to Exhibit 10.26 of the Company’s Current Report on Form 8-K filed with the Commission on March 15, 2004). | |
| 10.11*+ | Form of Option Agreement used under the Company’s 2003 Share Incentive Plan (incorporated herein by reference to Exhibit 10.1 of the Company’s Current Report on Form 8-K filed with the Commission on November 24, 2004). | |
| 10.12*+ | Form of Restricted Stock Grant Agreement used under the Company’s 2003 Share Incentive Plan (incorporated herein by reference to Exhibit 10.2 of the Company’s Current Report on Form 8-K filed with the Commission on November 24, 2004). | |
| 10.13* | Stock Purchase Agreement, among Rowan Companies, Inc., Era Aviation, Inc. and SEACOR Holdings Inc., dated as of October 14, 2004 (incorporated herein by reference to Exhibit 10.1 of the Company’s Current Report on Form 8-K filed with the Commission on October 14, 2004). | |
| 10.14* | Purchase Agreement, dated February 4, 2005, between Bell/Agusta Aerospace Company LLC and Offshore Aviation Inc. (portions of this Exhibit have been omitted pursuant to a request for confidential treatment on file with the Securities and Exchange Commission)(incorporated herein by reference to Exhibit 10.28 of the Company’s Annual Report on Form 10-K for the fiscal year ended December 31, 2004 filed with the Commission on March 14, 2005). | |
| 10.15* | Agreement and Plan of Merger, dated March 16, 2005, among SEACOR Holdings Inc., SBLK Acquisition Corp., CORBULK LLC and Seabulk International, Inc. (incorporated herein reference to Exhibit 2.1 of the Company’s Current Report on Form 8-K filed with the Commission on March 17, 2005). | |
| 10.16* | Form of Warrant Exchange Agreement (incorporated herein reference to Exhibit 10.32 of the Company’s Registration Statement (No. 333-124232) on Form S-4/A filed with the Commission on May 25, 2005). | |
| 10.17*+ | SEACOR Nonqualified Deferred Compensation Plan, dated as of October 15, 2005 (incorporated herein reference to Exhibit 99.1 of the Company’s Current Report on Form 8-K (No. 333-126613) filed with the Commission on October 28, 2005). | |
| 10.18+ | Compensation Arrangements for the Executive Officers. | |
| 10.19+ | Compensation of Non-Employee Directors. | |
| 10.20* | Amendment No. 3 to Revolving Credit Facility Agreement, dated as of December 21, 2005, by and among the Company (as successor in interest to SEACOR SMIT Inc.), the banks and financial institutions named therein, Fleet National Bank, DNB NOR Bank ASA (formerly Den norske Bank ASA), Nordea and The Governor and Company of the Bank of Scotland, as Agents (incorporated herein by reference to Exhibit 10.56 of the Company’s Annual Report on Form 10-K (No. 001-12289) for the fiscal year ended December 31, 2005 filed with the Commission on March 20, 2006). | |
| 10.21* | Revolving Credit Facility Agreement between SEACOR Holdings Inc. as Borrower, and DNB Nor, ASA, as Agent (incorporated herein by reference to Exhibit 10.1 of SEACOR’s Quarterly Report on Form 10-Q (No. 001-12289) for the fiscal quarter ended September 30, 2006 filed with the Commission on November 7, 2006). | |
| 10.22* | SEACOR SMIT Inc. 2000 Employee Stock Purchase Plan, as amended February 14, 2001 (incorporated herein by reference to Exhibit 4.4 of the Company’s Registration Statement on Form S-8 (No. 333-56714) filed with the Commission on March 8, 2001). | |
137
Table of Contents
| Exhibit |
Description | |
| 10.23* | SEACOR Holdings Inc. 2007 Share Incentive Plan (incorporated herein by reference to Exhibit 99.1 of the Company’s Current Report on Form 8-K filed with the Commission on May 10, 2007). | |
| 10.24* | Amendment No. 1 to SEACOR Holdings Inc.’s unsecured revolving credit facility agreement dated as of November 3, 2006 (incorporated herein by reference to Exhibit 10.1 of the Company’s Current Report on Form 8-K filed with the Commission on July 3, 2007). | |
| 10.25*+ | Form of Non-Employee Director Annual Share Incentive Grant Agreement (incorporated herein by reference to Exhibit 10.1 of the Company’s Current Report on Form 8-K filed with the Commission on May 8, 2008). | |
| 10.26*+ | Form of Stock Option Grant Agreement (incorporated herein by reference to Exhibit 10.2 of the Company’s Current Report on Form 8-K filed with the Commission on May 8, 2008). | |
| 10.27*+ | Form of Restricted Stock Grant Agreement (incorporated herein by reference to Exhibit 10.3 of the Company’s Current Report on Form 8-K filed with the Commission on May 8, 2008). | |
| 10.28* | Underwriting Agreement, dated September 21, 2009, between SEACOR Holdings Inc. and J.P. Morgan Securities Inc. and Deutsche Bank Securities Inc., as the representatives of the several underwriters named therein (incorporated herein by reference to Exhibit 1.1 of the Company’s Current report on Form 8-K filed with the Commission on September 24, 2009). | |
| 10.29* | SEACOR Holdings Inc. 2009 Employee Stock Purchase Plan effective March 11, 2009 (incorporated herein by reference to Appendix A of the Company’s Proxy Statement on DEF 14-A filed with the Commission on April 7, 2009). | |
| 10.30* | SEACOR Holdings Inc. 2007 Share Incentive Plan (as amended through March 11, 2009) (incorporated herein by reference to Appendix B of the Company’s Proxy Statement on DEF 14-A filed with the Commission on April 7, 2009). | |
| 10.31* | SEACOR Holdings Inc. Management Incentive Plan (incorporated herein by reference to Appendix C of the Company’s Proxy Statement on DEF 14-A filed with the Commission on April 7, 2009). | |
| 21.1 | List of Registrant’s Subsidiaries. | |
| 23.1 | Consent of Independent Registered Public Accounting Firm. | |
| 31.1 | Certification by the Chief Executive Officer Pursuant to Rule 13a-14(a) or Rule 15d-14(a) of the Exchange Act. | |
| 31.2 | Certification by the Chief Financial Officer Pursuant to Rule 13a-14(a) or Rule 15d-14(a) of the Exchange Act. | |
| 32.1 | Certification by the Chief Executive Officer Pursuant to 18 U.S.C. Section 1350, as adopted pursuant to Section 906 of the Sarbanes-Oxley Act of 2002. | |
| 32.2 | Certification by the Chief Financial Officer Pursuant to 18 U.S.C. Section 1350, as adopted pursuant to Section 906 of the Sarbanes-Oxley Act of 2002. | |
| * | Incorporated herein by reference as indicated. |
| + | Management contracts or compensatory plans or arrangements required to be filed as an Exhibit pursuant to Item 15 (b) of the rules governing the preparation of this report. |
138