Attached files
Table of Contents
UNITED STATES
SECURITIES AND EXCHANGE COMMISSION
Washington, D.C. 20549
FORM 10-K
FOR ANNUAL AND TRANSITION REPORTS PURSUANT TO SECTIONS 13 OR 15(d)
OF THE SECURITIES EXCHANGE ACT OF 1934
(Mark one)
| x | ANNUAL REPORT PURSUANT TO SECTION 13 OR 15(d) OF THE SECURITIES EXCHANGE ACT OF 1934 |
| For the fiscal year ended December 31, 2009 |
OR
| ¨ | TRANSITION REPORT PURSUANT TO SECTION 13 OR 15(d) OF THE SECURITIES EXCHANGE ACT OF 1934 FOR THE TRANSITION PERIOD FROM TO |
Commission File Number 0-19946
Lincare Holdings Inc.
(Exact name of registrant as specified in its charter)
| Delaware | 51-0331330 | |
| (State or other jurisdiction of incorporation or organization) |
(I.R.S. Employer Identification Number) | |
| 19387 US 19 North Clearwater, Florida | 33764 | |
| (Address of principal executive office) | (Zip Code) | |
Registrant’s telephone number, including area code:
(727) 530-7700
Securities registered pursuant to Section 12(b) of the Act:
| Title of each class |
Name of each exchange on which registered | |
| Common Stock, $.01 par value | NASDAQ Global Market |
Securities registered pursuant to Section 12(g) of the Act:
None
Indicate by check mark if the Registrant is a well-known seasoned issuer, as defined in Rule 405 of the Securities Act. Yes x No ¨
Indicate by check mark if the Registrant is not required to file reports pursuant to Section 13 or Section 15(d) of the Act. Yes ¨ No x
Indicate by check mark whether the registrant: (1) has filed all reports required to be filed by Section 13 or 15(d) of the Securities Exchange Act of 1934 during the preceding 12 months (or for such shorter period that the registrant was required to file such reports), and (2) has been subject to such filing requirements for the past 90 days. Yes x No ¨
Indicate by check mark whether the registrant has submitted electronically and posted on its corporate Web site, if any, every Interactive Data File required to be submitted and posted pursuant to Rule 405 of Regulation S-T (§232.405 of this chapter) during the preceding 12 months (or such shorter period that the registrant was required to submit and post such files). (Registrant is not subject to the requirements of Rule 405 of Regulation S-T at this time) Yes ¨ No ¨
Indicate by check mark if disclosure of delinquent filers pursuant to Item 405 of Regulation S-K is not contained herein, and will not be contained, to the best of registrant’s knowledge, in definitive proxy or information statements incorporated by reference in Part III of this Form 10-K or any amendment to this Form 10-K. x
Indicate by check mark whether the registrant is a large accelerated filer, an accelerated filer, a non-accelerated filer, or a smaller reporting company. See definitions of “large accelerated filer,” “accelerated filer,” and “smaller reporting company” in Rule 12b-2 of the Exchange Act. (Check one):
| Large accelerated filer x Accelerated filer ¨ Non-accelerated filer ¨ Smaller reporting company ¨ |
(Do not check if a smaller reporting company)
Indicate by check mark whether the registrant is a shell company (as defined in Exchange Act Rule 12b-2). Yes ¨ No x
The aggregate market value of the registrant’s common stock, $.01 par value, held by non-affiliates of the registrant, based on a $23.52 closing sale price of the common stock on June 30, 2009, as reported on the NASDAQ Global Market, was approximately $1,578,716,755.
As of January 29, 2010, there were 65,714,249 outstanding shares of the registrant’s common stock, par value $.01, which is the only class of capital stock of the registrant outstanding.
DOCUMENTS INCORPORATED BY REFERENCE
Certain information called for by Part III of this Form 10-K is incorporated by reference to the definitive Proxy Statement for the 2010 Annual Meeting of Stockholders of Lincare Holdings Inc., which will be filed with the Securities and Exchange Commission not later than 120 days after December 31, 2009.
Table of Contents
LINCARE HOLDINGS INC. AND SUBSIDIARIES
FORM 10-K
For The Year Ended December 31, 2009
INDEX
Table of Contents
General
Lincare Holdings Inc., together with its subsidiaries (“Lincare,” the “Company,” “we” or “our”), is one of the nation’s largest providers of oxygen and other respiratory therapy services to patients in the home. Our customers typically suffer from chronic obstructive pulmonary disease (“COPD”), such as emphysema, chronic bronchitis or asthma, and require supplemental oxygen or other respiratory therapy services in order to alleviate the symptoms and discomfort of respiratory dysfunction. Lincare currently serves approximately 750,000 customers in 48 states through 1,056 operating centers. Lincare Holdings Inc. was incorporated in Delaware in 1990. Our principal executive offices are located at 19387 US 19 North, Clearwater, Florida 33764, and our telephone number is (727)530-7700.
The Home Respiratory Market
We estimate that the home respiratory market (including home oxygen equipment and respiratory therapy services) represents approximately $6.0 billion in annual sales. Growth in the home respiratory market is driven by increases in the number of persons afflicted with COPD, demographic factors that contribute to an increase in the proportion of the U.S. population over the age of 65 years, and the continued trend toward treatment of patients in the home as a lower cost alternative to the acute care setting.
Business Strategy
Our strategy is to increase our market share through internal growth and strategic business acquisitions. Lincare achieves internal growth in existing geographic markets through the addition of new customers and referral sources to our network of local operating centers. In addition, we expand into new geographic markets on a selective basis, either through acquisitions or by opening new operating centers, when we believe such expansion will enhance our business. In 2009, Lincare acquired two local and regional companies with operations in multiple states.
Revenue growth is dependent upon the overall growth rate of the home respiratory market and on our ability to increase market share through effective delivery of high quality equipment and services and selective business acquisitions. Continued cost containment efforts by government and private insurance reimbursement programs have created an increasingly competitive environment, accelerating consolidation trends within the home health care industry.
We will continue our focus on providing oxygen and other respiratory therapy services to patients in the home and to provide home medical equipment and other services where we believe such services will enhance our primary business. In 2009, oxygen and other respiratory therapy services accounted for approximately 90% of Lincare’s net revenues.
Products and Services
Lincare primarily provides oxygen and other respiratory therapy services to patients in the home. We also provide a variety of durable medical equipment (“DME”) and home infusion therapies in certain geographic markets. When a physician, hospital discharge planner, or other source refers a patient to one of our operating centers, our customer representative obtains the necessary medical and insurance coverage information and assignment of benefits to Lincare, and coordinates the delivery of patient care. The prescribed therapy is delivered by one of our service representatives or clinicians at the customer’s home, where instruction and training are provided to the customer and the customer’s family regarding appropriate equipment use and maintenance and compliance with the prescribed therapy. Following the initial setup, our service representatives and/or clinicians make periodic visits to the customer’s home, the frequency of which is dictated by the type of
1
Table of Contents
therapy prescribed and physician orders. All services and equipment provided by Lincare are coordinated with the prescribing physician. During the period that we provide services and equipment for a customer, the customer remains under the physician’s care and medical supervision. We employ respiratory therapists, nurses and other qualified clinicians to perform certain training and other functions in connection with our services. Clinicians are licensed where required by applicable law.
The principal products and services provided by Lincare are:
Home Oxygen Equipment. The major types of oxygen delivery equipment are oxygen concentrators and liquid oxygen systems. Each method of delivery has different characteristics that make it more or less suitable to specific customer applications.
| • | Oxygen concentrators are stationary units that provide a continuous flow of oxygen by filtering ordinary room air. Customers most commonly use concentrators as their primary source of stationary oxygen. These systems are often supplemented with portable gaseous oxygen cylinders or liquid oxygen systems to meet the ambulatory or emergency needs of the customer. |
| • | Liquid oxygen systems are thermally insulated containers of liquid oxygen, generally consisting of a stationary unit and a portable unit, which are most commonly used by customers with significant ambulatory requirements. |
Other Respiratory Therapy. Other respiratory therapy services offered by Lincare include the following:
| • | Nebulizers and associated respiratory medications provide aerosol therapy for customers suffering from COPD and asthma. |
| • | Continuous positive airway pressure devices maintain open airways in customers suffering from obstructive sleep apnea by providing airflow at prescribed pressures during sleep. |
| • | Non-invasive ventilation provides nocturnal ventilatory support for customers with neuromuscular disease and COPD. This therapy improves daytime function and decreases incidence of acute illness. |
| • | Ventilators support respiratory function in severe cases of respiratory failure where the customer can no longer sustain the mechanics of breathing without the assistance of a machine. |
Home Infusion Therapy. In certain geographic markets, Lincare provides a variety of home infusion therapies, including parenteral nutrition, intravenous antibiotic therapy, enteral nutrition, chemotherapy, dobutamine infusions, immunoglobulin (IVIG) therapy, continuous pain management and central catheter management.
Lincare also supplies home medical equipment, such as hospital beds, wheelchairs and other supplies that may be required by our customers.
Company Operations
Management. We maintain a decentralized approach to management of our local business operations. Decentralization of managerial decision-making enables our operating centers to respond promptly and effectively to local market demands and opportunities. We believe that the personalized nature of customer requirements and referral relationships characteristic of the home health care business mandate that we maintain a localized operating structure.
Each of our operating centers is managed by a center manager who is responsible and accountable for the operating and financial performance of the center. Service and marketing functions are performed at the local operating level, while strategic development, financial control and operating policies are administered at the corporate level. Reporting mechanisms are in place at the operating center level to monitor performance and ensure field accountability.
2
Table of Contents
A team of area managers directly supervises individual operating center managers, serving as an additional mechanism for assessing and improving performance of our operations. Lincare’s operating centers are served by regional billing centers, which control all of our billing and reimbursement functions.
MIS Systems. We believe that our proprietary management information systems are one of our key competitive advantages. The systems provide management with critical information on a timely basis to measure and evaluate performance levels company-wide. Management reviews monthly reports, including revenues and profitability by individual center, accounts receivable and cash collection performance, equipment controls and utilization, customer activity and manpower trends. We have an in-house staff of computer programmers, which enables us to continually enhance our computer systems in order to provide timely financial and operational information and to respond promptly to changes in reimbursement regulations and policies.
Our billing system has both manual and computerized functions and processes that are designed to maintain the integrity of revenue and accounts receivable. Third-party payors, such as Medicare, that can accommodate electronic claims submission are billed electronically on a daily basis from our central computer system. Paper claims and invoices are generated and billed to various state Medicaid agencies, commercial payors and individual customers when electronic billing is unavailable. Electronic billing expedites the billing process and generally allows us to receive payment more quickly. The medical billing process requires the collection of various paper documents from customers and referral sources. Information such as customer demographics, insurance coverage and verification, prescriptions from physicians, delivery receipts, billing authorizations and assignments of benefits to Lincare, is gathered at the local operating centers and forwarded to our regional billing offices for review and manual input into our billing system. Item codes within the system representing specific products supplied to customers are matched against the Healthcare Common Procedure Coding System (“HCPCS”) for verification and accuracy of billing codes. Price tables within the system containing expected allowable payment amounts are maintained and updated by the regional billing offices based on published Medicare and Medicaid fee schedules and bulletins, as well as contracts and supplier notifications from private insurance companies.
Accounts Receivable Management. We derive a substantial majority of our revenue from reimbursement by third-party payors. We accept assignment of insurance benefits from customers and, in most instances, invoice and collect payments directly from Medicare, Medicaid and private insurance carriers, as well as from customers under co-insurance provisions. The following table sets forth, for the periods indicated, the percentage of our revenues derived from different types of payors.
| Year Ended December 31, | |||||||||
| Payors |
2009 | 2008 | 2007 | ||||||
| Medicare and Medicaid programs |
60 | % | 60 | % | 64 | % | |||
| Private insurance |
33 | 33 | 29 | ||||||
| Direct payment |
7 | 7 | 7 | ||||||
| 100 | % | 100 | % | 100 | % | ||||
Third-party reimbursement is a complicated process that involves submission of claims to multiple payors, each having its own specific claim requirements. To operate effectively in this environment, we have designed and implemented a proprietary computer system to decrease the time required for the submission and processing of third-party claims. Our systems are capable of tailoring the submission of claims to the specifications of individual payors. Our in-house information system capabilities also enable reimbursement or regulatory changes to be adjusted quickly. These features serve to decrease the processing time of claims for payment resulting in more rapid collection of accounts receivable.
It is our policy to verify insurance benefits with the responsible third-party payor before or within 48 hours of delivery of products to customers. Medicare beneficiaries provide our service representatives with a Medicare identification card containing the beneficiary’s Health Identification Control Number (“HICN”) at the time of
3
Table of Contents
customer setup and delivery. The existence of an HICN indicates the beneficiary’s eligibility to receive benefits under the Medicare program for covered services. Medicare benefits are verified with the applicable Medicare intermediaries.
Medicare and most other government and commercial payors that provide coverage to Lincare’s customers include a 20 percent co-payment provision in addition to a nominal deductible. Co-payments are generally not collected at the time of service and are invoiced to the customer or applicable secondary payor (supplemental providers of insurance coverage) on a monthly billing cycle as products are provided. A majority of our customers maintain, or are entitled to, secondary or supplemental insurance benefits providing “gap” coverage of this co-payment amount. In the event coverage is denied by the third-party payor, the customer may ultimately be responsible for all services rendered by Lincare.
Sales and Marketing
Favorable trends affecting the U.S. population and home health care have created an environment that has produced increasing demand for the services provided by Lincare. The average age of the American population is increasing and, as a person ages, more health care services are generally required. Further, well-documented changes occurring in the health care industry show a trend toward home care rather than institutional care as a matter of patient preference and cost containment.
Sales activities are generally carried out by our full-time sales representatives located at our local operating centers with assistance from our center managers. In addition to communicating the high quality of our equipment and services, our sales representatives are trained to provide information concerning the benefits of home respiratory care. Sales representatives are often licensed respiratory therapists who are highly knowledgeable in the provision of supplemental oxygen and other respiratory therapies.
Lincare primarily acquires new customers through referrals. Our principal sources of referrals are physicians, hospital discharge planners, prepaid health plans and clinical case managers. Our sales representatives maintain continual contact with these medical professionals.
Lincare’s referral sources recognize our reputation for providing high-quality equipment and service and have historically provided a steady flow of customers. While we view our referral sources as fundamental to our business, no single referral source accounts for more than one percent of our revenues. Lincare has approximately 750,000 active customers, and the loss of any single referral source, customer or group of customers would not materially impact our business.
Lincare has received accreditation from the Community Health Accreditation Program. Accreditation by a national accrediting body represents a marketing benefit to our operating centers and provides for a recognized quality assurance program. Home medical equipment providers are required to be accredited by an authorized accrediting organization in order to participate in Medicare and many private insurance plans.
Acquisitions
In 2009 and 2008, we acquired certain operating assets of two and three companies, respectively, with operations in multiple states. The aggregate purchase prices for these acquisitions were $11.7 million and $29.3 million in 2009 and 2008, respectively.
Quality Control
We are committed to consistently providing high-quality products and services. Our quality control procedures and training programs are designed to promote greater responsiveness and sensitivity to individual customer needs and to assure the highest level of quality and convenience to the customer and the referring physician. Licensed respiratory therapists, registered nurses and other employed clinicians provide professional health care support to our customers and enhance our efforts to provide effective disease management services.
4
Table of Contents
Suppliers
We purchase oxygen and other respiratory equipment from a variety of suppliers. We are not dependent upon any single supplier and believe that our product needs can be met by an adequate number of qualified manufacturers.
Competition
The home respiratory market is a fragmented and highly competitive industry that is served by Lincare, other national providers, and, by our estimates, over 2,000 regional and local providers.
Home respiratory companies compete primarily on the basis of service, not pricing, since uniform reimbursement levels are established by fee schedules promulgated by Medicare and Medicaid or by the individual determinations of private insurance companies. Furthermore, marketing efforts by home respiratory companies are typically directed toward referral sources that generally do not share financial responsibility for the payment of services provided to customers. The relationships between a home respiratory company and its customers and referral sources are highly personal. There is no compelling incentive for either physicians or the patients to alter the relationship, so long as the home respiratory company is providing responsive, professional and high-quality service.
Medicare Reimbursement
As a provider of home oxygen and other respiratory therapy services to the home health care market, we participate in Medicare Part B, the Supplementary Medical Insurance Program, which was established by the Social Security Act of 1965. Providers of home oxygen and other respiratory therapy services have historically been heavily dependent on Medicare reimbursement due to the high proportion of elderly persons suffering from respiratory disease. Durable medical equipment (“DME”), including oxygen equipment, is traditionally reimbursed by Medicare based on fixed fee schedules.
Recent legislation, including the Medicare Improvements for Patients and Providers Act of 2008 (“MIPPA”), the Medicare, Medicaid and SCHIP Extension Act of 2007 (“SCHIP Extension Act”), the Deficit Reduction Act of 2005 (“DRA”) and the Medicare Prescription Drug, Improvement, and Modernization Act of 2003 (“MMA”), contain provisions that directly impact reimbursement for the primary respiratory and other DME products provided by Lincare. MIPPA delayed the implementation of a Medicare competitive bidding program for oxygen equipment and certain other DME items that was scheduled to begin on July 1, 2008 and instituted a 9.5% price reduction nationwide for these items as of January 1, 2009. The SCHIP Extension Act reduced Medicare reimbursement amounts for covered Part B drugs, including inhalation drugs that we provide, beginning April 1, 2008. DRA provisions negatively impacted reimbursement for oxygen equipment beginning in 2009 and negatively impacted reimbursement for DME items subject to capped rental payments beginning in 2007. MMA significantly reduced reimbursement for inhalation drug therapies beginning in 2005, reduced payment amounts for five categories of DME, including oxygen, beginning in 2005, froze payment amounts for other covered DME items through 2007, established a competitive acquisition program for DME and implemented quality standards and accreditation requirements for DME suppliers. These legislative provisions, as currently in effect and when fully implemented, have had and will have a material adverse effect on our business, financial condition, operating results and cash flows.
The MIPPA legislation imposed a 9.5% reduction in Medicare payment rates for certain specified product categories, including oxygen, effective January 1, 2009. In addition to the 9.5% reduction, the Centers for Medicare and Medicaid Services (“CMS”), as required by statute, subjected the monthly payment amount for stationary oxygen equipment to additional cuts of 2.3%, thereby reducing the monthly payment rate from $199.28 in 2008 to $175.79 in 2009. We estimate that these price reductions, in aggregate, reduced our net revenues in 2009 by approximately $110.4 million. On November 13, 2009, CMS announced the revised national monthly payment amount for stationary oxygen equipment furnished to Medicare beneficiaries in 2010 of $173.17, a reduction of 1.5%. We estimate that this reduction will negatively impact our revenues in 2010 by approximately $9.0 million.
5
Table of Contents
The SCHIP Extension Act, which became law on December 29, 2007, required CMS to adjust the methodology used to determine Medicare payment amounts for inhalation drugs by using volume-weighted average selling prices (“ASP”) based on actual sales volumes rather than average sales prices. The SCHIP Extension Act also specifically lowered reimbursement for the inhalation drug albuterol. Based on the payment rates published quarterly by CMS for inhalation drugs dispensed in 2009 and 2008, we estimate that our reimbursement for such drugs was reduced by approximately $29.3 million in 2009 and approximately $72.6 million in 2008. We can not determine whether quarterly updates in ASP pricing data will continue to result in ongoing reductions in payment rates for inhalation drugs, or what impact such payment reductions could have on our business in the future.
On February 1, 2006, Congress passed the DRA legislation which changed the reimbursement methodology for oxygen equipment from continuous monthly payment for as long as the equipment is in use by a Medicare beneficiary, which includes payment for oxygen contents, related disposable supplies and accessories and maintenance of equipment, to a capped rental arrangement whereby payment for oxygen equipment may not extend over a period of continuous use of longer than 36 months. Separate payments for oxygen contents continue to be made for the period of medical need beyond the 36th month. Additionally, payment for routine maintenance and service of the oxygen equipment is made following each six-month period after the 36-month rental period ends. The oxygen provisions contained in DRA became effective on January 1, 2006. In the case of beneficiaries receiving oxygen equipment prior to the effective date, the 36-month period of continuous use began on January 1, 2006. Accordingly, the first month in which the new payment methodology impacted our net revenues was January 2009. We estimate that these regulations reduced our net revenues by approximately $135.0 million in 2009.
DRA also changed the reimbursement methodology for items of DME in the capped rental payment category, including but not limited to such items as continuous positive airway pressure (“CPAP”) devices, certain respiratory assist devices, nebulizers, hospital beds and wheelchairs. For such items of DME, payment may not extend over a period of continuous use of longer than 13 months. On the first day that begins after the 13th continuous month during which payment is made for the item, the supplier must transfer title of the item to the beneficiary. Additional payments for maintenance and service of the item are made for parts and labor not covered by a supplier’s or manufacturer’s warranty. The DME capped rental provisions contained in DRA applied to items furnished for which the first rental month occurred on or after January 1, 2006. Accordingly, the first month in which the new payment methodology impacted our net revenues was February 2007.
On December 8, 2003, MMA was signed into law. The MMA legislation directly impacted reimbursement for the primary respiratory and other DME products that we provide. Among other things, MMA:
| (1) | Significantly reduced reimbursement for inhalation drug therapies. Historically, prescription drug coverage under Medicare has been limited to drugs furnished incident to a physician’s services and certain self-administered drugs, including inhalation drug therapies. Prior to MMA, Medicare reimbursement for covered drugs, including the inhalation drugs that we provide, was limited to 95% of the published average wholesale price (“AWP”) for the drug. MMA established new payment limits and procedures for drugs reimbursed under Medicare Part B. Beginning in 2005, inhalation drugs furnished to Medicare beneficiaries are reimbursed at 106% of the volume-weighted average selling price (“ASP”) of the drug, as determined from data provided each quarter by drug manufacturers under a specific formula described in MMA. Implementation of the ASP-based reimbursement formula resulted in dramatic reductions in payment rates for inhalation drugs since 2005. |
| (2) | Established a competitive acquisition program for DME that was expected to commence in 2008, but was subsequently delayed by further legislation. MMA instructs CMS to establish and implement programs under which competitive acquisition areas will be established throughout the United States for contract award purposes for the furnishing of competitively priced items of DME, including oxygen equipment. The program was initially intended to be implemented in phases such that competition under the program would occur in ten of the largest metropolitan statistical areas (“MSAs”) in the first year, 80 of the largest MSAs in the following year, and additional areas thereafter. |
6
Table of Contents
For each competitive acquisition area, CMS is to conduct a competition under which providers will submit bids to supply certain covered items of DME. Successful bidders will be expected to meet certain program quality standards in order to be awarded a contract and only successful bidders can supply the covered items to Medicare beneficiaries in the acquisition area. The applicable contract award prices are expected to be less than would be paid under current Medicare fee schedules and contracts will be re-bid at least every three years. CMS will be required to award contracts to multiple entities submitting bids in each area for an item or service, but will have the authority to limit the number of contractors in a competitive acquisition area to the number needed to meet projected demand. CMS may use competitive bid pricing information to adjust the payment amounts otherwise in effect for an area that is not a competitive acquisition area.
CMS concluded the bidding process for the first round of MSAs in September 2007. On March 20, 2008, CMS completed the bid evaluation process and announced the payment amounts that would have taken effect in the ten competitive bidding areas beginning July 1, 2008. Contracts to provide products within the competitive bid areas were awarded to selected suppliers, including the Company, and took effect on July 1, 2008. On July 15, 2008, Congress enacted the MIPPA legislation which retroactively delayed the implementation of competitive bidding and reduced Medicare prices nationwide by 9.5% beginning in 2009 for the product categories, including oxygen, that were initially included in competitive bidding. As a result of the delay, CMS cancelled all contract awards retroactively to June 30, 2008.
On April 18, 2009, the interim final rule (“IFR”) for competitive bidding became effective. The IFR outlined the process for rebidding the first round of competitive bidding in 2009, including tentative timelines and bidding requirements. Bidder registration began August 17, 2009 and contract bidding occurred from October 21, 2009 through December 21, 2009. Reimbursement rates from the bidding process are expected to be announced by CMS in June 2010 and contract suppliers will be announced in September 2010. The reimbursement rates resulting from the bidding process will go into effect in each competitive acquisition area on January 1, 2011. An expanded bidding process to additional geographical areas is currently scheduled to begin in 2011. We will continue to monitor developments regarding the implementation of the competitive bidding program. We can not predict the outcome of the competitive bidding program on our business when fully implemented nor the Medicare payment rates that will be in effect in future years for the items subjected to competitive bidding.
The United States Congress is currently working on legislation as part of the fiscal budget process that could impact the amounts we are paid by Medicare for services provided to Medicare beneficiaries. As of the date of this filing, no such legislation has been finalized nor can we evaluate the impact of such potential changes on our business.
Federal and state budgetary and other cost-containment pressures will continue to impact the home respiratory care industry. We can not predict whether new federal and state budgetary proposals will be adopted or the effect, if any, such proposals would have on our business.
Government Regulation
The federal government and all states in which we currently operate regulate various aspects of our business. In particular, our operating centers are subject to federal laws that regulate the repackaging of drugs (including oxygen) and interstate motor-carrier transportation. Our operations also are subject to state laws governing, among other things, pharmacies, nursing services, distribution of medical equipment and certain types of home health activities. Certain of our employees are subject to state laws and regulations governing the ethics and professional practice of respiratory therapy, pharmacy and nursing.
As a health care supplier, we are subject to extensive government regulation, including numerous laws directed at preventing fraud and abuse and laws regulating reimbursement under various government programs.
7
Table of Contents
The marketing, billing, documenting and other practices of health care companies are all subject to government scrutiny. To ensure compliance with Medicare and other regulations, regional health insurance carriers often conduct audits and request customer records and other documents to support our claims submitted for payment of services rendered to customers. Similarly, government agencies periodically open investigations and obtain information from health care providers pursuant to the legal process. Violations of federal and state regulations can result in severe criminal, civil and administrative penalties and sanctions, including disqualification from Medicare and other reimbursement programs, which could have a material adverse effect on our business.
Numerous federal and state laws and regulations, including the Federal Health Insurance Portability And Accountability Act of 1996 (“HIPAA”) and the Health Information Technology For Economic And Clinical Health Act (“HITECH Act”), govern the collection, dissemination, security, use and confidentiality of patient-identifiable health information. As part of our provision of, and billing for, health care equipment and services, we are required to collect and maintain patient-identifiable health information. New health information standards, whether implemented pursuant to HIPAA, the HITECH Act, congressional action or otherwise, could have a significant effect on the manner in which we handle health care related data and communicate with payors, and the cost of complying with these standards could be significant. If we do not comply with existing or new laws and regulations related to patient health information, we could be subject to criminal or civil sanctions.
Health care is an area of rapid regulatory change. Changes in the laws and regulations and new interpretations of existing laws and regulations may affect permissible activities, the relative costs associated with doing business, and reimbursement amounts paid by federal, state and other third-party payors. We can not predict the future of federal, state and local regulation or legislation, including Medicare and Medicaid statutes and regulations, or possible changes in national health care policies. Future legislative and regulatory changes could have a material adverse effect on our business.
Employees
As of December 31, 2009, we had 9,867 employees. None of our employees are covered by collective bargaining agreements. We believe that the relations between our management and employees are good.
Environmental Matters
We believe that we are currently in compliance, in all material respects, with applicable federal, state and local statutes and ordinances regulating the discharge of hazardous materials into the environment. We do not believe we will be required to expend any material amounts in order to remain in compliance with these laws and regulations or that such compliance will materially affect our capital expenditures, earnings or competitive position.
Available Information
We maintain an Internet website at http://www.lincare.com. Information contained therein is not incorporated by reference into this annual report, and information contained in the website should not be considered part of this annual report. We make available free of charge through our website our annual report on Form 10-K, quarterly reports on Form 10-Q, current reports on Form 8-K and amendments to those reports filed or furnished pursuant to Sections 13(a) or 15(d) of the Securities Exchange Act of 1934, as amended. We make these reports available on our website as soon as reasonably practicable after such reports are filed with, or furnished to, the Securities and Exchange Commission (the “SEC”).
Materials filed by us with the SEC are also available to the public to read and copy at the SEC’s Public Reference Room at 100 F Street, NE, Washington, DC 20549. The public may obtain information on the operation of the Public Reference Room by calling the SEC at 1-800-SEC-0330. We are an electronic filer with the SEC. The SEC maintains an Internet site that contains reports, proxy and information statements, and other information regarding issuers that file electronically with the SEC, including us, at http://www.sec.gov.
8
Table of Contents
Forward-Looking Statements
Statements in this annual report concerning future results, performance or expectations are forward-looking statements within the meaning of the Private Securities Litigation Reform Act of 1995, as amended. All forward-looking statements included in this document are based upon information available to Lincare as of the date hereof and Lincare assumes no obligation to update any such forward-looking statements. These statements involve known and unknown risks, uncertainties and other factors that may cause Lincare’s actual results, levels of activity, performance or achievements to be materially different from any results, levels of activity, performance or achievements expressed or implied by any forward-looking statements. In some cases, forward-looking statements that involve risks and uncertainties contain terminology such as “may,” “will,” “should,” “could,” “expects,” “intends,” “plans,” “anticipates,” “believes,” “estimates,” “predicts,” “potential,” or “continue” or variations of these terms or other comparable terminology.
Key factors that have an impact on Lincare’s ability to attain these estimates include potential reductions in reimbursement rates by government and third-party payors, changes in reimbursement policies, the demand for Lincare’s products and services, the availability of appropriate acquisition candidates and Lincare’s ability to successfully complete and integrate acquisitions, efficient operations of Lincare’s existing and future operating facilities, regulation and/or regulatory action affecting Lincare or its business, economic and competitive conditions, access to borrowed and/or equity capital on favorable terms and other risks described below.
In developing our forward-looking statements, we have made certain assumptions relating to reimbursement rates and policies, internal growth and acquisitions and the outcome of various legal and regulatory proceedings. If the assumptions we use differ materially from what actually occurs, then actual results could vary significantly from the performance projected in the forward-looking statements. We are under no duty to update any of the forward-looking statements after the date of this report.
Certain Risk Factors Relating to the Company’s Business
We operate in a rapidly changing environment that involves a number of risks. The following discussion highlights some of these risks and others are discussed elsewhere in this report. These and other risks could materially and adversely affect our business, financial condition, operating results and cash flows.
A MAJORITY OF OUR CUSTOMERS HAVE PRIMARY HEALTH COVERAGE UNDER MEDICARE PART B, AND RECENTLY ENACTED AND FUTURE CHANGES IN THE REIMBURSEMENT RATES OR PAYMENT METHODOLOGIES UNDER THE MEDICARE PROGRAM COULD MATERIALLY AND ADVERSELY AFFECT OUR BUSINESS.
As a provider of home oxygen and other respiratory therapy services for the home health care market, we have historically depended heavily on Medicare reimbursement as a result of the high proportion of elderly persons suffering from respiratory disease. Medicare Part B, the Supplementary Medical Insurance Program, provides coverage to eligible beneficiaries for DME, such as oxygen equipment, respiratory assistance devices, continuous positive airway pressure devices, nebulizers and associated inhalation medications, hospital beds and wheelchairs for the home setting. Approximately 65% of our customers have primary coverage under Medicare Part B. There are increasing pressures on Medicare to control health care costs and to reduce or limit reimbursement rates for home medical equipment and services. Medicare reimbursement is subject to statutory and regulatory changes, retroactive rate adjustments, administrative and executive orders and governmental funding restrictions, all of which could materially decrease payments to us for the services and equipment we provide.
Recent legislation, including the Medicare Improvements for Patients and Providers Act of 2008 (“MIPPA”), the Medicare, Medicaid and SCHIP Extension Act of 2007 (“SCHIP Extension Act”), the Deficit
9
Table of Contents
Reduction Act of 2005 (“DRA”) and the Medicare Prescription Drug, Improvement, and Modernization Act of 2003 (“MMA”), contain provisions that directly impact reimbursement for the primary respiratory and other DME products provided by Lincare. MIPPA delayed the implementation of a Medicare competitive bidding program for oxygen equipment and certain other DME items that was scheduled to begin on July 1, 2008 and instituted a 9.5% price reduction nationwide for these items as of January 1, 2009. The SCHIP Extension Act reduced Medicare reimbursement amounts for covered Part B drugs, including inhalation drugs that we provide, beginning April 1, 2008. DRA provisions negatively impacted reimbursement for oxygen equipment beginning in 2009 and negatively impacted reimbursement for DME items subject to capped rental payments beginning in 2007. MMA significantly reduced reimbursement for inhalation drug therapies beginning in 2005, reduced payment amounts for five categories of DME, including oxygen, beginning in 2005, froze payment amounts for other covered DME items through 2007, established a competitive acquisition program for DME and implemented quality standards and accreditation requirements for DME suppliers. These legislative provisions, as currently in effect and when fully implemented, have had and will have a material adverse effect on our business, financial condition, operating results and cash flows. See “MEDICARE REIMBURSEMENT” for a full discussion of the MIPPA, SCHIP Extension Act, DRA and MMA provisions.
The United States Congress is currently working on legislation as part of the fiscal budget process that could impact the amounts we are paid by Medicare for services provided to Medicare beneficiaries. As of the date of this filing, no such legislation has been finalized nor can we evaluate the impact of such potential changes on our business.
A SIGNIFICANT PERCENTAGE OF OUR BUSINESS IS DERIVED FROM THE SALE AND RENTAL OF MEDICARE-COVERED OXYGEN AND DME ITEMS, AND RECENT LEGISLATIVE ACTS IMPOSE SUBSTANTIAL CHANGES IN THE MEDICARE PAYMENT METHODOLOGIES AND REDUCTIONS IN THE MEDICARE PAYMENT AMOUNTS FOR THESE ITEMS.
DRA changed the reimbursement methodology for oxygen equipment from continuous monthly payment for as long as the equipment is in use by a Medicare beneficiary, which includes payment for oxygen contents, related disposable supplies and accessories and maintenance of equipment, to a capped rental arrangement whereby payment for oxygen equipment may not extend over a period of continuous use of longer than 36 months. Separate payments for oxygen contents continue to be made for the period of medical need beyond the 36th month. Additionally, payment for routine maintenance and service of the oxygen equipment is made following each six-month period after the 36-month rental period ends. The oxygen provisions contained in DRA became effective on January 1, 2006. In the case of beneficiaries receiving oxygen equipment prior to the effective date, the 36-month period of continuous use began on January 1, 2006. Accordingly, the first month in which the new payment methodology impacted our net revenues was January 2009. We estimate that these regulations reduced our net revenues by approximately $135.0 million in 2009.
DRA also changed the reimbursement methodology for items of DME in the capped rental payment category, including but not limited to such items as continuous positive airway pressure (“CPAP”) devices, certain respiratory assist devices, nebulizers, hospital beds and wheelchairs. For such items of DME, payment may not extend over a period of continuous use of longer than 13 months. On the first day that begins after the 13th continuous month during which payment is made for the item, the supplier must transfer title of the item to the beneficiary. Additional payments for maintenance and service of the item are made for parts and labor not covered by a supplier’s or manufacturer’s warranty. The DME capped rental provisions contained in DRA applied to items furnished for which the first rental month occurred on or after January 1, 2006. Accordingly, the first month in which the new payment methodology impacted our net revenues was February 2007.
On July 15, 2008, Congress enacted the MIPPA legislation which reduced Medicare payment rates nationwide for certain DME items, including oxygen equipment, by 9.5% beginning in 2009. In addition to the 9.5% reduction, CMS subjected the monthly payment amount for stationary oxygen equipment to additional cuts of 2.3%, thereby reducing the monthly payment rate from $199.28 in 2008 to $175.79 in 2009. We estimate that
10
Table of Contents
these price reductions, in aggregate, reduced our net revenues by approximately $110.4 million in 2009. On November 13, 2009, CMS announced the revised national monthly payment amount for stationary oxygen equipment furnished to Medicare beneficiaries in 2010 of $173.17, a reduction of 1.5%. We estimate that this reduction will negatively impact our revenues in 2010 by approximately $9.0 million.
A SIGNIFICANT PERCENTAGE OF OUR BUSINESS IS DERIVED FROM THE SALE OF MEDICARE-COVERED RESPIRATORY MEDICATIONS, AND RECENT LEGISLATION AND MEDICARE POLICY REVISIONS IMPOSED SIGNIFICANT REDUCTIONS IN MEDICARE REIMBURSEMENT FOR SUCH INHALATION DRUGS.
Recently enacted legislation negatively affected Medicare reimbursement amounts for covered Part B drugs, including inhalation drugs that we provide, beginning April 1, 2008 (See “MEDICARE REIMBURSEMENT”). The SCHIP Extension Act required CMS to adjust the average sales price (“ASP”) calculation methodology used to determine Medicare payment amounts for inhalation drugs by using volume-weighted ASPs based on actual sales volume rather than average sales price. The SCHIP Extension Act also specifically lowered reimbursement for the inhalation drug albuterol. Based on the payment rates published quarterly by CMS for inhalation drugs dispensed in 2009 and 2008, we estimate that our reimbursement for such drugs was reduced by approximately $29.3 million in 2009 and by approximately $72.6 million in 2008. We can not determine whether quarterly updates in ASP pricing data will continue to result in ongoing reductions in payment rates for inhalation drugs, or what impact such payment reductions could have on our business in the future.
RECENT REGULATORY CHANGES SUBJECT THE MEDICARE REIMBURSEMENT RATES FOR OUR EQUIPMENT AND SERVICES TO ADDITIONAL REDUCTIONS AND TO POTENTIAL DISCRETIONARY ADJUSTMENT BY CMS, WHICH COULD REDUCE OUR REVENUES, NET INCOME AND CASH FLOWS.
In February 2006, a final rule governing CMS’ Inherent Reasonableness, or IR, authority became effective. The IR rule establishes a process for adjusting fee schedule amounts for Medicare Part B services when existing payment amounts are determined to be either grossly excessive or deficient. The rule describes the factors that CMS or its contractors will consider in making such determinations and the procedures that will be followed in establishing new payment amounts. To date, no payment adjustments have occurred or been proposed as a result of the IR rule.
The effectiveness of the IR rule itself did not trigger payment adjustments for any items or services. Nevertheless, the IR rule puts in place a process that could eventually have a significant impact on Medicare payments for our equipment and services. We can not predict whether or when CMS will exercise its IR authority with respect to payment for our equipment and services, or the effect that such payment adjustments would have on our financial position or operating results.
FUTURE IMPLEMENTATION OF A COMPETITIVE BIDDING PROCESS UNDER MEDICARE COULD REDUCE OUR REVENUES, NET INCOME AND CASH FLOWS.
CMS is required by law to establish and implement programs under which competitive acquisition areas will be established throughout the United States for contract award purposes for the furnishing of competitively priced items of DME, including oxygen equipment (See “MEDICARE REIMBURSEMENT”). The program was initially intended to be implemented in phases such that competition under the program would occur in ten of the largest MSAs in the first year, 80 of the largest MSAs in the following year, and additional areas thereafter.
For each competitive acquisition area, CMS is to conduct a competition under which providers will submit bids to supply certain covered items of DME. Successful bidders will be expected to meet certain program quality standards in order to be awarded a contract and only successful bidders can supply the covered items to Medicare beneficiaries in the acquisition area. The applicable contract award prices are expected to be less than
11
Table of Contents
would be paid under current Medicare fee schedules, and contracts will be re-bid at least every three years. CMS will be required to award contracts to multiple entities submitting bids in each area for an item or service, but will have the authority to limit the number of contractors in a competitive acquisition area to the number needed to meet projected demand. CMS may use competitive bid pricing information to adjust the payment amounts otherwise in effect for an area that is not a competitive acquisition area.
CMS concluded the bidding process for the first round of MSAs in September 2007. On March 20, 2008, CMS completed the bid evaluation process and announced the payment amounts that would have taken effect in the ten competitive bidding areas beginning July 1, 2008. Contracts to provide products within the competitive bid areas were awarded to selected suppliers, including the Company, and took effect on July 1, 2008. On July 15, 2008, Congress enacted the MIPPA legislation which retroactively delayed the implementation of competitive bidding and reduced Medicare prices nationwide by 9.5% beginning in 2009 for the product categories, including oxygen, that were initially included in competitive bidding. As a result of the delay, CMS cancelled all contract awards retroactively to June 30, 2008.
On April 18, 2009, the interim final rule (“IFR”) for competitive bidding became effective. The IFR outlined the process for rebidding the first round of competitive bidding in 2009, including tentative timelines and bidding requirements. Bidder registration began August 17, 2009 and contract bidding occurred from October 21, 2009 through December 21, 2009. Reimbursement rates from the bidding process are expected to be announced by CMS in June 2010 and contract suppliers will be announced in September 2010. The reimbursement rates resulting from the bidding process will go into effect in each competitive acquisition area on January 1, 2011. An expanded bidding process to additional geographical areas is currently scheduled to begin in 2011. We will continue to monitor developments regarding the implementation of the competitive bidding program. We can not predict the outcome of the competitive bidding program on our business when fully implemented nor the Medicare payment rates that will be in effect in future years for the items subjected to competitive bidding.
FUTURE REDUCTIONS IN REIMBURSEMENT RATES UNDER MEDICAID COULD REDUCE OUR REVENUES, NET INCOME AND CASH FLOWS.
Due to budgetary shortfalls, many states are considering, or have enacted, cuts to their Medicaid programs, including funding for our equipment and services. These cuts have included, or may include, elimination or reduction of coverage for some or all of our equipment and services, amounts eligible for payment under co-insurance arrangements, or payment rates for covered items. Approximately 7% of our customers are eligible for primary Medicaid benefits, and State Medicaid programs fund approximately 13% of our payments from primary and secondary insurance benefits. Continued state budgetary pressures could lead to further reductions in funding for the reimbursement for our equipment and services which, in turn, could have a material adverse effect on our financial position and operating results.
FUTURE REDUCTIONS IN REIMBURSEMENT RATES FROM PRIVATE PAYORS COULD HAVE A MATERIAL ADVERSE EFFECT ON OUR FINANCIAL CONDITION AND OPERATING RESULTS.
Payors such as private insurance companies and employers are under pressure to increase profitability and reduce costs. In response, certain payors are limiting coverage or reducing reimbursement rates for the equipment and services we provide. Approximately 27% of our customers and approximately 33% of our primary and secondary payments are derived from private payors. Continued financial pressures on these entities could lead to further reimbursement reductions for our equipment and services that could have a material adverse effect on our financial condition and operating results.
12
Table of Contents
WE DEPEND UPON REIMBURSEMENT FROM THIRD-PARTY PAYORS FOR A SIGNIFICANT MAJORITY OF OUR REVENUES, AND IF WE FAIL TO MANAGE THE COMPLEX AND LENGTHY REIMBURSEMENT PROCESS, OUR BUSINESS AND OPERATING RESULTS COULD SUFFER.
We derive a significant majority of our revenues from reimbursement by third-party payors. We accept assignment of insurance benefits from customers and, in most instances, invoice and collect payments directly from Medicare, Medicaid and private insurance carriers, as well as from customers under co-insurance provisions. Approximately 47% of our revenues are derived from Medicare, 33% from private insurance carriers, 13% from Medicaid and the balance directly from individual customers and commercial entities.
Our financial condition and results of operations may be affected by the reimbursement process, which in the health care industry is complex and can involve lengthy delays between the time that services are rendered and the time that the reimbursement amounts are settled. Depending on the payor, we may be required to obtain certain payor-specific documentation from physicians and other health care providers before submitting claims for reimbursement. Certain payors have filing deadlines and they will not pay claims submitted after such time. We can not ensure that we will be able to continue to effectively manage the reimbursement process and collect payments for our equipment and services promptly.
WE ARE SUBJECT TO EXTENSIVE FEDERAL AND STATE REGULATION, AND IF WE FAIL TO COMPLY WITH APPLICABLE REGULATIONS, WE COULD SUFFER SEVERE CRIMINAL OR CIVIL SANCTIONS OR BE REQUIRED TO MAKE SIGNIFICANT CHANGES TO OUR OPERATIONS THAT COULD HAVE A MATERIAL ADVERSE EFFECT ON OUR RESULTS OF OPERATIONS.
The federal government and all states in which we currently operate regulate various aspects of our business. In particular, our operating centers are subject to federal laws that regulate the repackaging of drugs (including oxygen) and interstate motor-carrier transportation. Our operations also are subject to state laws governing, among other things, pharmacies, nursing services, distribution of medical equipment and certain types of home health activities. Certain of our employees are subject to state laws and regulations governing the ethics and professional practices of respiratory therapy, pharmacy and nursing.
As a health care supplier, we are subject to extensive government regulation, including numerous laws directed at preventing fraud and abuse and laws regulating reimbursement under various government programs. The marketing, billing, documenting and other practices of health care companies are all subject to government scrutiny. To ensure compliance with Medicare and other regulations, regional health insurance carriers often conduct audits and request customer records and other documents to support our claims submitted for payment of services rendered to customers. Similarly, government agencies periodically open investigations and obtain information from health care providers pursuant to the legal process. Violations of federal and state regulations can result in severe criminal, civil and administrative penalties and sanctions, including disqualification from Medicare and other reimbursement programs, which could have a material adverse effect on our business.
Health care is an area of rapid regulatory change. Changes in the laws and regulations and new interpretations of existing laws and regulations may affect permissible activities, the relative costs associated with doing business, and reimbursement amounts paid by federal, state and other third-party payors. We can not predict the future of federal, state and local regulation or legislation, including Medicare and Medicaid statutes and regulations, or possible changes in national health care policies. Future legislation and regulatory changes could have a material adverse effect on our business.
13
Table of Contents
WE ARE SUBJECT TO A CORPORATE INTEGRITY AGREEMENT WITH THE OFFICE OF INSPECTOR GENERAL, AND IF WE FAIL TO COMPLY WITH THE TERMS OF THE CORPORATE INTEGRITY AGREEMENT, WE COULD SUFFER SEVERE CRIMINAL, CIVIL OR ADMINISTRATIVE SANCTIONS.
We are subject to a five-year corporate integrity agreement with the Office of Inspector General that began in May 2006. Violations of the terms of the corporate integrity agreement could result in severe criminal, civil and administrative penalties and sanctions, including disqualification from Medicare and other reimbursement programs.
COMPLIANCE WITH REGULATIONS UNDER THE FEDERAL HEALTH INSURANCE PORTABILITY AND ACCOUNTABILITY ACT OF 1996 (HIPAA), THE HEALTH INFORMATION TECHNOLOGY FOR ECONOMIC AND CLINICAL HEALTH ACT (HITECH ACT) AND RELATED RULES, RELATING TO THE TRANSMISSION, SECURITY AND PRIVACY OF HEALTH INFORMATION COULD IMPOSE ADDITIONAL SIGNIFICANT COSTS ON OUR OPERATIONS.
Numerous federal and state laws and regulations, including HIPAA and the HITECH Act, govern the collection, dissemination, security, use and confidentiality of patient-identifiable health information. HIPAA and the HITECH Act require us to comply with standards for the use and disclosure of health information within our company and with third parties. HIPAA and the HITECH Act also include standards for common health care electronic transactions and code sets, such as claims information, plan eligibility, payment information and the use of electronic signatures, and privacy and electronic security of individually identifiable health information. HIPAA requires health care providers, including us, in addition to health plans and clearinghouses, to develop and maintain policies and procedures with respect to protected health information that is used or disclosed. The HITECH Act expands the notification requirement for breaches of patient-identifiable health information, restricts certain disclosures and sales of patient-identifiable health information and provides a tiered system for civil monetary penalties for HIPAA violations.
If we do not comply with existing or new laws and regulations related to patient health information, we could be subject to criminal or civil sanctions. New health information standards, whether implemented pursuant to HIPAA, the HITECH Act, congressional action or otherwise, could have a significant effect on the manner in which we handle health care related data and communicate with payors, and the cost of complying with these standards could be significant.
WE MAY UNDERTAKE ACQUISITIONS THAT COULD SUBJECT US TO UNANTICIPATED LIABILITIES AND THAT COULD FAIL TO ACHIEVE EXPECTED BENEFITS.
Our strategy is to increase our market share through internal growth and strategic acquisitions. Consideration for the acquisitions has generally consisted of cash, unsecured non-interest bearing obligations and the assumption of certain liabilities.
The implementation of an acquisition strategy entails certain risks, including inaccurate assessment of disclosed liabilities, the existence of undisclosed liabilities, regulatory compliance issues associated with the acquired business, entry into markets in which we may have limited or no experience, diversion of management’s attention and human resources from our underlying business, difficulties in integrating the operations of an acquired business or in realizing anticipated efficiencies and cost savings, failure to retain key management or operating personnel of the acquired business, and an increase in indebtedness and a limitation in the ability to access additional capital on favorable terms. The successful integration of an acquired business may be dependent on the size of the acquired business, condition of the customer billing records, and complexity of system conversions and execution of the integration plan by local management. If we do not successfully integrate the acquired business, the acquisition could fail to achieve its expected revenue contribution or there could be delays in the billing and collection of claims for services rendered to customers, which may have a material adverse effect on our financial position and operating results.
14
Table of Contents
WE FACE INTENSE NATIONAL, REGIONAL AND LOCAL COMPETITION AND IF WE ARE UNABLE TO COMPETE SUCCESSFULLY, WE WILL LOSE REVENUES AND OUR BUSINESS WILL SUFFER.
The home respiratory market is a fragmented and highly competitive industry. We compete against other national providers and, by our estimate, more than 2,000 local and regional providers. Home respiratory companies compete primarily on the basis of service rather than price since reimbursement levels are established by Medicare and Medicaid or by the individual determinations of private health plans.
Our ability to compete successfully and to increase our referrals of new customers are highly dependent upon our reputation within each local health care market for providing responsive, professional and high-quality service and achieving strong customer satisfaction. Given the relatively low barriers to entry in the home respiratory market, we expect that the industry will become increasingly competitive in the future. Increased competition in the future could limit our ability to attract and retain key operating personnel and achieve continued growth in our core business.
INCREASES IN OUR COSTS COULD ERODE OUR PROFIT MARGINS AND SUBSTANTIALLY REDUCE OUR NET INCOME AND CASH FLOWS.
Cost containment in the health care industry, fueled, in part, by federal and state government budgetary shortfalls, is likely to result in constant or decreasing reimbursement amounts for our equipment and services. As a result, we must control our operating cost levels, particularly labor and related costs, which account for a significant component of our operating costs and expenditures. We compete with other health care providers to attract and retain qualified or skilled personnel. We also compete with various industries for administrative and service employees. Since reimbursement rates are established by fee schedules mandated by Medicare, Medicaid and private payors, we are not able to offset the effects of general inflation in labor and related cost components, if any, through increases in prices for our equipment and services. Consequently, such cost increases could erode our profit margins and reduce our net income.
Item 1B. Unresolved Staff Comments
None.
Lincare owns its headquarters facility located in Clearwater, Florida and two of its 1,056 operating center locations. Lincare’s remaining operating center locations are leased from unrelated third parties. Each operating center is a combination warehouse and office, with warehouse space generally comprising about half of the facility. Warehouse space is used for storage of adequate supplies of equipment and accessories necessary to conduct our business. We also lease 34 separate billing office locations from unrelated third parties.
As a health care provider, the Company is subject to extensive government regulation, including numerous laws directed at preventing fraud and abuse and laws regulating reimbursement under various government programs. The marketing, billing, documenting and other practices of health care companies are all subject to government scrutiny. To ensure compliance with Medicare and other regulations, regional carriers often conduct audits and request patient records and other documents to support claims submitted by Lincare for payment of services rendered to customers. Similarly, government agencies periodically open investigations and obtain information from health care providers pursuant to legal process.
Violations of federal and state regulations can result in severe criminal, civil and administrative penalties and sanctions, including disqualification from Medicare and other reimbursement programs.
15
Table of Contents
From time to time, the Company receives inquiries from various government agencies requesting customer records and other documents. It has been the Company’s policy to cooperate with all such requests for information. However, the Company can provide no assurances as to the duration or outcome of these inquiries.
Private litigants may also make claims against health care providers for violations of health care laws in actions known as qui tam suits. In these cases, the government has the opportunity to intervene in, and take control of, the litigation. From time to time we are named as a defendant in such qui tam proceedings. We vigorously defend these suits. The government has declined to intervene for purposes other than dismissal in all unsealed qui tam actions of which we are aware.
Our operating centers are also subject to federal and/or state laws regulating, among other things, interstate motor-carrier transportation, repackaging of oxygen, distribution of medical equipment, certain types of home health activities, pharmacy operations, nursing services and respiratory services and apply to those locations involved in such activities. Certain of our employees are subject to state laws and regulations governing the ethics and professional practice of respiratory therapy, pharmacy and nursing. From time to time, the Company receives inquiries and complaints from various government agencies related to its operations or personnel. It has been the Company’s policy to cooperate with all such inquiries and vigorously defend any administrative complaints. The Company can provide no assurances as to the duration or outcome of these inquiries and/or complaints.
We are also involved in certain other claims and legal actions arising in the ordinary course of our business. The ultimate disposition of all such matters is not currently expected to have a material adverse impact on our financial position, results of operations or liquidity.
The Company is subject to a five-year corporate integrity agreement with the Office of Inspector General that began in May 2006. Violations of the corporate integrity agreement can result in severe criminal, civil and administrative penalties and sanctions, including disqualification from Medicare and other reimbursement programs.
Item 4. Submission of Matters to a Vote of Security Holders
No matters were submitted to a vote of our stockholders during the fourth quarter of 2009.
16
Table of Contents
Item 5. Market for Registrant’s Common Equity, Related Stockholder Matters and Issuer Purchases of Equity Securities
Our common stock is traded on the NASDAQ Global Market under the symbol LNCR. The following table sets forth the high and low sales prices as reported by NASDAQ for the periods indicated.
| High | Low | |||||
| 2009 |
||||||
| First quarter |
$ | 28.12 | $ | 19.43 | ||
| Second quarter |
25.07 | 19.71 | ||||
| Third quarter |
33.98 | 21.88 | ||||
| Fourth quarter |
38.53 | 29.81 | ||||
| 2008 |
||||||
| First quarter |
$ | 35.36 | $ | 27.71 | ||
| Second quarter |
29.08 | 23.45 | ||||
| Third quarter |
34.68 | 27.10 | ||||
| Fourth quarter |
31.02 | 20.30 | ||||
As of January 29, 2010, there were approximately 387 holders of record of the 65,714,249 outstanding shares of Lincare common stock. The closing price of Lincare common stock on January 29, 2010, was $36.82 per share, as reported on the NASDAQ Global Market.
We have not paid any cash dividends on our capital stock and do not anticipate paying cash dividends in the foreseeable future. It is the present intention of our Board of Directors to retain all earnings in order to support the future growth of our business and, from time to time, when authorized by our Board of Directors, to repurchase our common stock on the open market.
17
Table of Contents
Performance Graph
The following graph shows changes over the last five years in the value of $100 invested in Lincare’s common stock, the NASDAQ Health Services Stocks Index, and the NASDAQ Stock Market (U.S.) Index. The value of each investment is based on share price appreciation, with reinvestment of all dividends. The investments are assumed to have occurred at the beginning of the period presented.
The performance graph shall not be deemed incorporated by reference by any general statement incorporating by reference this annual report into any filing under the Securities Act of 1933 or the Securities Exchange Act of 1934, except to the extent that we specifically incorporate this information by reference, and shall not otherwise be deemed filed under such acts.
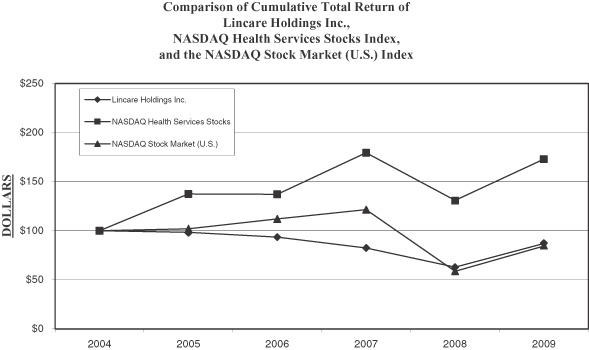
| Dec. 31, 2004 |
Dec. 31, 2005 |
Dec. 31, 2006 |
Dec. 31, 2007 |
Dec. 31, 2008 |
Dec. 31, 2009 | |||||||
| Lincare Holdings Inc. |
100.0 | 98.3 | 93.4 | 82.4 | 63.1 | 87.1 | ||||||
| NASDAQ Health Services Stocks |
100.0 | 137.5 | 137.3 | 179.5 | 131.0 | 173.2 | ||||||
| NASDAQ Stock Market (U.S.) |
100.0 | 102.1 | 112.2 | 121.7 | 58.6 | 84.3 |
18
Table of Contents
During the year ended December 31, 2009, the Company repurchased approximately 12.2 million shares of its common stock at a cost of approximately $343.3 million. The following table sets forth the purchases of our common stock during the fourth quarter of 2009.
ISSUER PURCHASES OF EQUITY SECURITIES
| Period |
Total Number of Shares Purchased |
Average Price | Total Number of Shares Purchased as Part of the Repurchase Program |
Approximate Dollar Value of Shares that May Yet Be Purchased Under the Repurchase Program | ||||||
| October 1, 2009 to October 31, 2009 |
1,050,927 | $ | 31.79 | 1,050,927 | $ | 312,287,000 | ||||
| November 1, 2009 to November 30, 2009 |
2,073,983 | 34.18 | 2,073,983 | $ | 255,232,000 | |||||
| December 1, 2009 to December 31, 2009 |
2,418,288 | 36.66 | 2,418,288 | $ | 213,029,000 | |||||
| Total |
5,543,198 | $ | 34.81 | 5,543,198 | ||||||
On February 14, 2006, our Board of Directors authorized a share repurchase plan whereby the Company may repurchase shares of the Company’s common stock in amounts determined pursuant to a formula that takes into account both the ratio of the Company’s net debt to cash flow and its available cash resources and borrowing availability. As of December 31, 2009, $213.0 million of common stock was eligible for repurchase in accordance with the plan’s formula.
The following table sets forth information as of the end of fiscal year 2009 with respect to compensation plans under which equity securities are authorized for issuance.
Securities Authorized for Issuance Under Equity Compensation Plans
| Plan Category |
Number of securities to be issued upon exercise of outstanding options, warrants and rights |
Weighted-average exercise price of outstanding options, warrants and rights |
Number of securities remaining available for future issuance under equity compensation plans (excluding securities reflected in column (a)) | |||||
| (a) | (b) | (c) | ||||||
| Equity compensation plans approved by security holders |
6,995,637 | (1) | $ | 35.60 | 2,832,702 | |||
| Equity compensation plans not approved by security holders |
None | N/A | None | |||||
| Total |
6,995,637 | (1) | $ | 35.60 | 2,832,702 | |||
| (1) | Includes 5,324,587 shares that are reserved for issuance under various stock option plans and 1,671,050 million shares that were issued under the Company’s Restricted Stock program. |
19
Table of Contents
Item 6. Selected Financial Data
The selected consolidated financial data presented below the caption “Statements of Operations Data” for the years ended December 31, 2009, 2008, 2007, 2006, and 2005, and the caption “Balance Sheet Data” as of December 31, 2009, 2008, 2007, 2006 and 2005 are derived from our consolidated financial statements audited by KPMG LLP, an independent registered public accounting firm.
The data set forth below are qualified by reference to, and should be read in conjunction with, the consolidated financial statements and accompanying notes, Management’s Discussion and Analysis of Financial Condition and Results of Operations and Certain Risk Factors Relating to the Company’s Business included in this report.
| Year Ended December 31, | ||||||||||||||||||||
| 2009 | 2008 | 2007 | 2006 | 2005 | ||||||||||||||||
| (In thousands, except per share data) | ||||||||||||||||||||
| Statements of Operations Data: |
|
(As adjusted Note 1) |
|
|
(As adjusted Note 1) |
|
||||||||||||||
| Net revenues |
$ | 1,550,477 | $ | 1,664,580 | $ | 1,595,990 | $ | 1,409,795 | $ | 1,266,627 | ||||||||||
| Cost of goods and services |
431,291 | 400,812 | 389,884 | 316,103 | 253,260 | |||||||||||||||
| Operating expenses |
389,759 | 395,706 | 365,016 | 331,897 | 295,807 | |||||||||||||||
| Selling, general and administrative expenses |
330,589 | 326,886 | 317,722 | 291,623 | 251,839 | |||||||||||||||
| Bad debt expense |
23,257 | 24,969 | 23,940 | 21,147 | 18,999 | |||||||||||||||
| Depreciation and amortization expense |
118,120 | 117,527 | 116,280 | 101,966 | 94,942 | |||||||||||||||
| Operating income |
257,461 | 398,680 | 383,148 | 347,059 | 351,780 | |||||||||||||||
| Interest income |
886 | 6,508 | 4,063 | 2,719 | 3,718 | |||||||||||||||
| Interest expense |
(34,960 | ) | (39,644 | ) | (29,056 | ) | (9,935 | ) | (12,432 | ) | ||||||||||
| Income before income taxes |
223,387 | 365,544 | 358,155 | 339,843 | 343,066 | |||||||||||||||
| Income tax expense |
87,291 | 138,278 | 133,666 | 126,862 | 129,370 | |||||||||||||||
| Net income |
$ | 136,096 | $ | 227,266 | $ | 224,489 | $ | 212,981 | $ | 213,696 | ||||||||||
| Income per common share: |
||||||||||||||||||||
| Basic |
$ | 2.00 | $ | 3.11 | $ | 2.69 | $ | 2.26 | $ | 2.16 | ||||||||||
| Diluted (1) |
$ | 1.99 | $ | 3.04 | $ | 2.56 | $ | 2.16 | $ | 2.06 | ||||||||||
| Weighted average number of common shares outstanding |
68,076 | 73,044 | 83,387 | 94,209 | 98,913 | |||||||||||||||
| Weighted average number of common shares and common share equivalents outstanding (1) |
68,497 | 75,616 | 89,688 | 101,106 | 106,306 | |||||||||||||||
| (1) | Figures in 2008, 2007, 2006 and 2005 reflect the application of the “if converted” method of accounting for our 3.0% convertible debentures, effective for reporting periods ending after December 15, 2004. The debentures were redeemed in full at par value in the amount of $275.0 million on June 15, 2008, pursuant to a notice of redemption. |
| At December 31, | |||||||||||||||
| 2009 | 2008 | 2007 | 2006 | 2005 | |||||||||||
| (In thousands) | |||||||||||||||
| Balance Sheet Data: |
|
(As adjusted Note 1) |
|
(As adjusted Note 1) |
|||||||||||
| Total assets |
$ | 1,877,194 | $ | 1,938,809 | $ | 1,926,274 | $ | 1,775,310 | $ | 1,681,236 | |||||
| Long-term obligations, including current installments |
484,871 | 460,947 | 726,157 | 346,047 | 289,141 | ||||||||||
| Stockholders’ equity |
901,915 | 1,028,326 | 802,507 | 1,110,577 | 1,137,876 | ||||||||||
20
Table of Contents
Item 7. Management’s Discussion and Analysis of Financial Condition and Results of Operations
General
We continue to pursue a strategy of increasing market share in existing and surrounding geographic markets through internal growth and selective acquisition of local and regional companies. In addition, we will continue to expand into new geographic markets and product lines on a selective basis, either through acquisition or by opening new operating centers, when we believe it will enhance our business. Our focus remains primarily on oxygen and other respiratory therapy services, which represent approximately 90% of our revenues.
Critical Accounting Policies
The consolidated financial statements include the accounts of Lincare Holdings Inc. and its subsidiaries. We have made a number of estimates and assumptions relating to the reporting of assets and liabilities and the disclosure of contingent assets and liabilities to prepare these financial statements in conformity with generally accepted accounting principles.
Critical accounting policies are those we believe are both most important to the portrayal of our financial condition and operating results and require our most difficult, subjective or complex judgments, often as a result of the need to make estimates about the effect of matters that are inherently uncertain. Judgments and uncertainties affecting the application of those policies may result in materially different amounts being reported under different conditions or using different assumptions. We consider the following policies to be most critical in understanding the judgments that are involved in preparing our consolidated financial statements.
Revenue Recognition and Accounts Receivable
Our revenues are recognized on an accrual basis in the period in which services and related products are provided to customers and are recorded at net realizable amounts estimated to be paid by customers and third-party payors. Insurance benefits are assigned to the Company and, accordingly, the Company bills on behalf of its customers. The Company’s billing system contains payor-specific price tables that reflect the fee schedule amounts in effect or contractually agreed upon by various government and commercial payors for services and each item of equipment or supply provided to a customer. The Company has established an allowance to account for sales adjustments that result from differences between the payment amount received and the expected realizable amount. Actual adjustments that result from differences between the payment amount received and the expected realizable amount are recorded against the allowance for sales adjustments and are typically identified and ultimately recorded at the point of cash application or when otherwise determined pursuant to the Company’s collection procedures. We report revenues in our financial statements net of such adjustments.
Certain items provided by the Company are reimbursed under rental arrangements that generally provide for fixed monthly payments established by fee schedules for as long as the patient is using the equipment and medical necessity continues (subject to capped rental arrangements which limit the rental payment periods in some instances and which may result in a transfer of title to the patient at the end of the rental payment period). Once initial delivery of rental equipment is made to the patient, a monthly billing cycle is established based on the initial date of delivery. The Company recognizes rental arrangement revenues ratably over the monthly service period and defers revenue for the portion of the monthly bill that is unearned. No separate payment is earned from the initial equipment delivery and setup process. During the rental period, we are responsible for servicing the equipment and providing routine maintenance, if necessary.
Our revenue recognition policy is consistent with the criteria set forth in Staff Accounting Bulletin 104—Revenue Recognition (“SAB 104”) for determining when revenue is realized or realizable and earned. We recognize revenue in accordance with the requirements of SAB 104 that:
| • | persuasive evidence of an arrangement exists; |
| • | delivery has occurred; |
21
Table of Contents
| • | the seller’s price to the buyer is fixed or determinable; and |
| • | collectibility is reasonably assured. |
Due to the nature of the industry and the reimbursement environment in which we operate, certain estimates are required to record net revenues and accounts receivable at their net realizable values at the time products and/or services are provided. Inherent in these estimates is the risk that they will have to be revised or updated as additional information becomes available. Specifically, the complexity of many third-party billing arrangements and the uncertainty of reimbursement amounts for certain services from certain payors may result in adjustments to amounts originally recorded. Such adjustments are typically identified and recorded by the Company at the point of cash application, claim denial or account review.
Included in accounts receivable are earned but unbilled receivables. Unbilled accounts receivable represent charges for equipment and supplies delivered to customers for which invoices have not yet been generated by the billing system. Prior to the delivery of equipment and supplies to customers, we perform certain certification and approval procedures to ensure collection is reasonably assured and that unbilled accounts receivable are recorded at net amounts expected to be paid by customers and third-party payors. Billing delays, generally ranging from several days to several weeks, can occur due to delays in obtaining certain required payor-specific documentation from internal and external sources, interim transactions occurring between cycle billing dates established for each customer within the billing system and business acquisitions awaiting assignment of new provider enrollment identification numbers. In the event that a third-party payor does not accept the claim for payment, the customer is ultimately responsible.
We perform analyses to evaluate the net realizable value of accounts receivable. Specifically, we consider historical realization data, accounts receivable aging trends, other operating trends and relevant business conditions. Because of continuing changes in the health care industry and third-party reimbursement, it is possible that our estimates could change, which could have a material impact on our operations and cash flows.
Bad Debt Expense, Sales Adjustments and Related Allowances for Uncollectible Accounts Receivable
Accounts receivable are reported net of allowances for sales adjustments and uncollectible accounts. The majority of our accounts receivable are due from Medicare, Medicaid and private insurance carriers, as well as from customers under co-insurance provisions. Third-party reimbursement is a complicated process that involves submission of claims to multiple payors, each having its own claims requirements. In some cases, the ultimate collection of accounts receivable subsequent to the service dates may not be known for several months. Bad debt is recorded as an operating expense and consists of billed charges that are ultimately deemed uncollectible due to the customer’s or third-party payor’s inability or refusal to pay. We record bad debt expense based on a percentage of revenue using historical Company-specific data. The percentage and amounts used to record bad debt expense and the allowance for doubtful accounts are supported by various methods, including current and historical cash collections, bad debt write-offs, and aging of accounts receivable. Our proprietary management information systems are utilized to provide this data in order to assess bad debts. In the event that collection results of existing accounts receivable are not consistent with historical experience, there may be a need to increase or decrease our allowances for doubtful accounts, which may materially impact our financial position or results of operations. The Company has established an allowance to account for sales adjustments that result from differences between the payment amounts received from customers and third-party payors and the expected realizable amounts. Actual adjustments that result from such differences are recorded against the allowance for sales adjustments and are typically identified and ultimately recorded at the point of cash application or when otherwise determined pursuant to the Company’s collection procedures. We report revenues in our financial statements net of such adjustments.
Business Acquisition Accounting
We apply the acquisition method of accounting for business acquisitions, and use available cash from operations, borrowings under our revolving credit agreement and the assumption of certain liabilities as the
22
Table of Contents
consideration for business acquisitions. We allocate the purchase price of our business acquisitions based on the fair value of identifiable tangible and intangible assets. The difference between the total cost of the acquisition and the sum of the fair values of acquired tangible and identifiable intangible assets less liabilities is recorded as goodwill.
Goodwill and Other Intangible Assets
We have recorded intangible assets, including goodwill, customer and contract relationships and technology, in connection with business acquisitions. Estimated useful lives of amortizable intangible assets are determined by management based on an assessment of the period over which the asset is expected to contribute to future cash flows. The allocation of amortizable intangible assets impacts the amounts allocable to goodwill.
We perform a goodwill impairment test using a two-step method on an annual basis or whenever events or circumstances indicate that the carrying value may not be recoverable. For the purposes of that assessment, we have determined that the Company has a single reporting unit.
The first step of the impairment analysis compares the Company’s fair value to its net book value to determine if there is an indicator of impairment. If the assessment in the first step indicates impairment then the Company performs step two. The second step compares the implied fair value of goodwill to its carrying amount in a manner similar to a purchase price allocation for a business combination. If the carrying amount of goodwill exceeds its implied fair value, an impairment loss is recognized equal to that excess.
The Company evaluates its fair value using two different approaches. The first approach utilizes the closing market price of its common stock at the annual impairment testing date and the number of shares of common stock outstanding on that date.
The second approach utilizes a discounted cash flow projection which is based on assumptions that are consistent with the Company’s best estimates of future growth and the strategic plan used to manage the underlying business. Factors requiring significant judgment include the future cash flows, growth rates, discount factors and tax rates, amongst other considerations. Changes in economic and operating conditions impacting these assumptions could result in goodwill impairment in future periods.
We completed the annual impairment test during the third quarter of 2009 and determined that no impairment existed as of the date of the impairment test. The Company based its goodwill impairment testing on reasonable estimates and assumptions. During the annual testing in the third quarter of 2009 the estimated fair value was substantially in excess of carrying value. No recent events or circumstances have occurred to indicate that impairment may exist.
Long-Lived Assets
We review property and equipment and amortizable intangible assets for impairment whenever events or changes in circumstances indicate that the carrying amount of an asset may not be recoverable. Recoverability of property and equipment is measured by comparing its carrying value to the undiscounted projected future cash flows that the asset(s) are expected to generate. If the carrying amount of an asset is not recoverable, we recognize an impairment loss based on the excess of the carrying amount of the long-lived asset over its respective fair value, which is generally determined as the present value of estimated future cash flows or at the appraised value. The impairment analysis is based on significant assumptions of future results made by management, including revenue and cash flow projections. Circumstances that may lead to impairment of property and equipment include a significant decrease in the market price of a long-lived asset, a significant adverse change in the extent or manner in which a long-lived asset is being used or in its physical condition and a significant adverse change in legal factors or in the business climate that could affect the value of a long-lived asset including an adverse action or assessment by a regulator. The Company considered the recent Medicare reimbursement changes and the circumstances noted above which may lead to impairment of property and equipment, and concluded there was no impairment.
23
Table of Contents
In addition to consideration of impairment upon the events or changes in circumstances described above, management regularly evaluates the remaining lives of its long-lived assets. If estimates are revised, the carrying value of affected assets is depreciated or amortized over the remaining lives.
Contingencies
We are involved in certain claims and legal matters arising in the ordinary course of business. We evaluate and record liabilities for contingencies based on known claims and legal actions when it is probable a liability has been incurred and the liability can be reasonably estimated.
Results of Operations
Net Revenues
The following table sets forth for the periods indicated a summary of our net revenues by product category:
| Year Ended December 31, | |||||||||
| 2009 | 2008 | 2007 | |||||||
| (In thousands) | |||||||||
| Oxygen and other respiratory therapy |
$ | 1,398,212 | $ | 1,526,737 | $ | 1,470,363 | |||
| Home medical equipment and other |
152,265 | 137,843 | 125,627 | ||||||
| Total |
$ | 1,550,477 | $ | 1,664,580 | $ | 1,595,990 | |||
Net revenues for the year ended December 31, 2009 decreased by $114.1 million, a decrease of 6.9%, compared to net revenues for 2008. The Company estimates that the 6.9% decrease in net revenues in 2009 was comprised of approximately 10% internal and acquisition growth offset by approximately 17% negative impact from $274.7 million of Medicare price reductions and payment changes taking effect in 2009 (see “Medicare Reimbursement”). Net revenues for the year ended December 31, 2008 increased by $68.6 million, an increase of 4.3% above net revenues for 2007. The 4.3% increase in net revenues in 2008 was comprised of approximately 9% internal growth and acquisition growth, partially offset by $80.9 million of Medicare price reductions taking effect in 2008. The internal growth in net revenues is attributable to underlying growth in the market for our products and increased market share, resulting primarily from our reputation for high quality equipment and customer service. Growth in net revenues from acquisitions is attributable to the effects of acquisitions of local and regional companies and is estimated based on the contribution to net revenues for the four quarters following such acquisitions. In 2009 and 2008, we completed the acquisitions of two and three businesses, respectively, with operations in multiple states.
The contribution of oxygen and other respiratory therapy products to our net revenues was 90.2%, 91.7% and 92.1%, respectively, for the years ended December 31, 2009, 2008 and 2007. Our strategy is to focus on the provision of oxygen and other respiratory therapy services to patients in the home and to provide home medical equipment and other services where we believe such services will enhance our core respiratory business.
Cost of Goods and Services
Cost of goods and services as a percentage of net revenues was 27.8% for the year ended December 31, 2009, 24.1% for the year ended December 31, 2008 and 24.4% for the year ended December 31, 2007. Cost of goods and services increased by $30.5 million, or 7.6%, in 2009 and $10.9 million, or 2.8% in 2008. The increase in cost of goods and services in 2009 is attributable to an increase in the number of oxygen customers served and higher volumes in our inhalation drug and sleep therapy product lines. We also experienced an increase in enteral nutrition and infusion therapy costs associated with higher customer volumes. The increase in cost of goods and services in 2008 is attributable primarily to higher oxygen costs related to an increase in the number of oxygen customers on service and higher costs of CPAP supplies and accessories due to growth in our sleep therapy product lines.
24
Table of Contents
Cost of goods and services includes the cost of equipment (excluding depreciation of $105.8 million, $104.4 million and $102.2 million in 2009, 2008 and 2007, respectively), drugs and supplies sold to patients and certain operating costs related to the Company’s respiratory drug product line. These costs include an allocation of customer service, distribution and administrative costs relating to the respiratory drug product line of approximately $51.3 million, $47.5 million and $48.8 million in 2009, 2008 and 2007, respectively. Included in cost of goods and services for the year ended December 31, 2009 are salary and related expenses of pharmacists and pharmacy technicians of $11.7 million. Such salary and related expenses for the years ended December 31, 2008 and 2007 were $11.7 million and $10.5 million, respectively.
Operating and Other Expenses
Operating expenses as a percentage of net revenues for the years ended December 31, 2009, 2008 and 2007 were 25.1%, 23.8% and 22.9%, respectively. Operating expenses in 2009 decreased $5.9 million, or 1.5%, when compared with the prior year period. Operating expenses in 2008 increased $30.7 million, or 8.4%, when compared with the prior year period. Contributing to the containment of growth in operating expenses during 2009 were lower fuel and other vehicle related expenses, lower purchases of supply items and controls over salary and related expenses, partially offset by higher employee health benefits costs. The increase in operating expenses in 2008 is attributable to higher payroll and related expenses from employee headcount increases, partially offset by gains in productivity, and significantly higher vehicle and related expenses caused primarily by higher fuel prices.
The Company manages over 1,000 operating centers from which customers are provided equipment, supplies and services. An operating center averages approximately seven to eight employees and is typically comprised of a center manager, two customer service representatives (referred to as “CSR’s”—telephone intake, scheduling, documentation), two or three service representatives (referred to as “Service Reps”—delivery, maintenance and retrieval of equipment and delivery of disposables), a respiratory therapist (non-reimbursable and discretionary clinical follow-up with the customer and communication to the prescribing physician) and a sales representative (marketing calls to local physicians and other referral sources).
The Company includes in operating expenses the costs incurred at the Company’s operating centers for certain service personnel (center manager, CSR’s and Service Reps), facilities (rent, utilities, communications, property taxes, etc.), vehicles (vehicle leases, gasoline, repair and maintenance), and general business supplies and miscellaneous expenses. Operating expenses for the years ended December 31, 2009, 2008 and 2007 within these major categories were as follows:
| Year Ended December 31, | |||||||||
| Operating Expenses | 2009 | 2008 | 2007 | ||||||
| (in thousands) | |||||||||
| Salary and related |
$ | 258,364 | $ | 250,970 | $ | 232,579 | |||
| Facilities |
58,187 | 57,605 | 55,617 | ||||||
| Vehicles |
42,850 | 52,678 | 45,120 | ||||||
| General supplies/miscellaneous |
30,358 | 34,453 | 31,700 | ||||||
| Total |
$ | 389,759 | $ | 395,706 | $ | 365,016 | |||
Included in operating expenses during the year ended December 31, 2009 are salary and related expenses for Service Reps in the amount of $104.6 million. Such salary and related expenses for the years ended December 31, 2008 and 2007 were $108.9 million and $100.0 million, respectively.
Selling, general and administrative expenses (“SG&A”) as a percentage of net revenues for the years ended December 31, 2009, 2008 and 2007, were 21.3%, 19.6%, and 19.9%, respectively. SG&A expenses in 2009 increased by $3.7 million, or 1.1%, compared with the prior year period. Contributing to the increase in SG&A expenses in 2009 were higher stock-based compensation expenses and an increase in employee benefit costs,
25
Table of Contents
partially offset by lower liability insurance costs and a reduction in advertising expense. SG&A expenses in 2008 increased by $9.2 million, or 2.9%, compared with the prior year period. Contributing to the increase in SG&A expenses in 2008 were higher payroll costs included in selling and field administration and higher stock-based compensation expense, partially offset by cost controls at our corporate administration and billing office locations and lower advertising expenses.
SG&A expenses include costs related to sales and marketing activities, clinical respiratory services, corporate overhead and other business support functions. Included in SG&A during the year ended December 31, 2009 are salary and related expenses of $257.4 million. These salary and related expenses include the cost of the Company’s respiratory therapists in the amount of $66.0 million during 2009. The Company’s respiratory therapists generally provide non-reimbursable and discretionary clinical follow-up with the customer and communication, as appropriate, to the prescribing physician with respect to the customer’s plan of care. The Company includes the salaries and related expenses of its respiratory therapist personnel (licensed respiratory therapists or, in some cases, registered nurses) in SG&A because it believes that these personnel enhance the Company’s business relative to its competitors that do not employ respiratory therapists. Included in SG&A during the years ended December 31, 2008 and 2007 are salary and related expenses of $238.4 million and $226.2 million, respectively. These salary and related expenses include the cost of the Company’s respiratory therapists in the amount of $66.4 million and $63.0 million during the respective years.
Bad debt expense as a percentage of net revenues was 1.5% for the years ended December 31, 2009, 2008 and 2007. Days sales outstanding (“DSO”) were 35 days at December 31, 2009, compared with 38 days and 43 days at December 31, 2008 and 2007, respectively. While we have achieved consistent results in managing bad debt expense over the past three years, the general economic climate and business acquisition activities may contribute to an increase in our bad debt expense in the future. The collection of deductible balances and co-payment amounts due directly from customers may be negatively affected by weakening economic conditions in the U.S. The integration of acquired companies into our regional billing and collections offices may temporarily disrupt collections, increasing the amount of accounts receivable written-off as uncollectible.
Depreciation and amortization expense as a percentage of net revenues was 7.6% for the year ended December 31, 2009 compared with 7.1% and 7.3% for the years ended December 31, 2008 and 2007, respectively. Included in depreciation and amortization expense in the year ended December 31, 2009 is depreciation of medical equipment of $105.8 million and depreciation of other property and equipment of $12.0 million. Included in depreciation and amortization expense in the years ended December 31, 2008 and 2007 is depreciation of medical equipment of $104.4 million and $102.2 million, respectively, and depreciation of other property and equipment of $12.9 million and $13.8 million, respectively.
During 2009, we amortized $0.3 million of intangible assets compared with $0.1 million in 2008 and $0.3 million in 2007. Our net intangible assets were $1.2 billion as of December 31, 2009. Of this total, $0.2 million (consisting of various covenants not-to-compete) is being amortized over periods of one to seven years, $1.8 million (consisting of customer contracts and relationships) is being amortized over a period of 11 years, $0.2 million (consisting of technology) is being amortized over a period of 9 years and the remainder represents goodwill.
26
Table of Contents
Operating Income
As shown in the table below, operating income for the year ended December 31, 2009 decreased $141.2 million when compared to the prior year period. Operating income in 2009 was negatively impacted by $274.7 million of Medicare price reductions and payment changes taking effect in 2009, partially offset by revenue growth from increases in customer volumes and our efforts to control operating costs. Operating income for the year ended December 31, 2008 increased $15.5 million, when compared to the prior year period. The increase in operating income in 2008 was attributable primarily to revenue growth from increases in customer volumes, partially offset by Medicare price reductions and by higher costs and expenses as noted above.
| Year Ended December 31, | ||||||||||||
| 2009 | 2008 | 2007 | ||||||||||
| (In thousands) | ||||||||||||
| Operating income |
$ | 257,461 | $ | 398,680 | $ | 383,148 | ||||||
| Percentage of net revenues |
16.6 | % | 24.0 | % | 24.0 | % | ||||||
Other Income (Expense)
Interest expense for the year ended December 31, 2009 was $35.0 million, compared to $39.6 million and $29.1 million for the years ended December 31, 2008 and 2007, respectively. Interest expense in 2009 was lower than interest expense in 2008 due to the redemption of our $275.0 million of 3.0% convertible debentures in June 2008. Interest expense in 2008 was higher than interest expense in 2007 due to the placement of $550.0 million of 2.75% convertible senior debentures in the fourth quarter of 2007, amortization of original issue discount associated with the 2.75% convertible senior debentures and lower average balances outstanding under our revolving credit facility. Included in interest expense is amortization of debt issuance costs of $1.8 million, $2.4 million and $5.6 million in 2009, 2008 and 2007, respectively.
Other income (expense) during the year ended December 31, 2009 included a loss of $6.4 million from the recognition of the UBS Put Option offset by an equivalent $6.4 million unrealized gain recorded on the auction rate securities purchased from UBS due to a reclassification of these securities from available-for-sale to trading (see “Liquidity and Capital Resources” and Note 2 to the Consolidated Financial Statements).
Income Taxes
The company’s effective income tax rate was 39.1% for the year ended December 31, 2009 compared with 37.8% and 37.3% for the years ended December 31, 2008 and 2007, respectively. The effective tax rate increased 1.3% from 2008 to 2009 because of an increase in the amount of permanent differences combined with a decrease in income before income taxes in 2009 of $142.2 million, partially offset by favorable discrete adjustments. The increase in the 2008 effective tax rate of 0.5% was not significant.
Our income tax expense, deferred tax assets and liabilities and reserves for uncertain tax positions reflect management’s best assessment of estimated future taxes to be paid. We are subject to income taxes at both the federal and numerous state and local jurisdictions.
Deferred income taxes reflect the net tax effects of temporary differences between carrying amounts of assets and liabilities for financial reporting purposes and tax purposes. Such amounts are classified in the consolidated statements of financial position as current or noncurrent assets or liabilities based upon the classification of the related assets and liabilities. In evaluating our ability to recover our deferred tax assets within the jurisdiction from which they arise, we consider all available positive and negative evidence.
As of December 31, 2009 we had net deferred tax assets, related to state income tax net operating loss carryforwards, of $2.9 million. We believe that it is more likely than not that the benefit from certain state net operating loss carryforwards will not be realized. In recognition of this risk, we have provided a valuation allowance of $0.1 million on the deferred tax assets relating to these state net operating loss carryforwards.
27
Table of Contents
The calculation of our tax liabilities involves dealing with uncertainties in the application of complex tax laws and regulations in a multitude of jurisdictions across our national operations. The tax benefit from an uncertain tax position may be recognized when it is more likely than not that the position will be sustained upon examination, including resolution of any related appeals or litigation processes, based on the technical merits.
We recognize tax liabilities and adjust these liabilities when our judgment changes as a result of the evaluation of new information not previously available. Due to the complexity of some of these uncertainties, the ultimate resolution may result in a payment that is materially different from our current estimate of the tax liabilities. These differences will be reflected as increases or decreases to income tax expense in the period in which they are determined.
Unrecognized tax benefits consist of the carrying value of the company’s recorded uncertain tax positions as well as the potential tax benefits that could result from other tax positions that have not been recognized in the financial statements under U.S. Generally Accepted Accounting Principles (“GAAP”).
Acquisitions
In 2009, the Company acquired certain operating assets of two companies with operations in multiple states. The aggregate cost of these acquisitions was $11.7 million and was allocated to acquired assets as follows: $0.1 million to property and equipment, $0.2 million to separately identifiable intangible assets and $11.4 million to goodwill.
In 2008, the Company acquired certain operating assets of three companies with operations in multiple states. The aggregate cost of these acquisitions was $29.3 million and was allocated to acquired assets as follows: $0.5 million to current assets, $1.3 million to property and equipment, $2.0 million to separately identifiable intangible assets and $25.5 million to goodwill.
Liquidity and Capital Resources
Our primary sources of liquidity have been internally generated funds from operations, borrowings under credit facilities and proceeds from equity and debt transactions. We have used these funds to meet our capital requirements, which consist primarily of operating costs, capital expenditures, acquisitions, debt service and share repurchases.
At December 31, 2009, our working capital was $121.5 million. At December 31, 2008, our working capital was $119.4 million. A significant portion of our assets consists of accounts receivable from third-party payors that are responsible for payment for the equipment and services we provide. Our DSO was 35 days as of December 31, 2009 and 38 days as of December 31, 2008. We measure our DSO by dividing our net accounts receivable at the balance sheet date by the product of our latest quarterly net revenues times four, multiplied by 360 days.
Net cash provided by operating activities was $353.1 million for the year ended December 31, 2009, compared with $439.1 million for the year ended December 31, 2008 and $406.2 million for the year ended December 31, 2007. Net cash used in investing and financing activities was $405.3 million, $418.1 million and $379.5 million for the years ended December 31, 2009, 2008 and 2007, respectively. Activity in the year ended December 31, 2009 included our investment of $5.1 million in business acquisitions, net investment in property and equipment of $110.0 million, payments of debt of $4.8 million and $343.3 million in payments to repurchase our common stock, offset by proceeds of $56.0 million from the exercise of stock options and issuance of common shares.
As of December 31, 2009, our principal sources of liquidity consisted of approximately $20.4 million of cash and cash equivalents and $356.4 million available under our revolving credit agreement. The revolving credit agreement, dated December 1, 2006, makes available to us up to $390.0 million over a five-year period,
28
Table of Contents
subject to certain terms and conditions set forth in the agreement. The Company is in compliance and expects to be in compliance with all covenants in the near and long term based on its ability to access its cash and cash equivalents and its expected operating cash flows. As of December 31, 2009, there were $33.6 million of standby letters of credit issued under the credit facility.
At December 31, 2009, the Company held $58.7 million of short term investments, including $54.2 million of auction rate securities and $4.4 million in a put option on those securities. The auction rate securities are variable-rate debt instruments with contractual maturities between the years 2020 and 2041 with interest rates that reset every seven or 35 days pursuant to a bidding process as determined by the underlying security indentures. The investments are classified as trading securities and are carried at fair value, with any realized and unrealized gains and losses included in other income and expense. The Company received partial redemptions of these securities, at par, in the amount of $3.1 million in January 2010. See Note 3 to the consolidated financial statements for a discussion of the auction rate securities and related put option.
The Company will continue to monitor credit market conditions to assess the liquidity of its investments. Due to the Company’s ability to access its cash and cash equivalents, amounts available under its revolving credit facility, and its expected operating cash flows, the Company believes that it has adequate liquidity available to meet its obligations.
On February 14, 2006, our Board of Directors authorized a share repurchase plan whereby the Company may repurchase from time to time, on the open market or in privately negotiated transactions, shares of the Company’s common stock in amounts determined pursuant to a formula (the “share repurchase formula”) that takes into account both the ratio of the Company’s net debt to cash flow and its available cash resources and borrowing availability. On January 23, 2007 and October 23, 2007, our Board of Directors approved modifications to the share repurchase formula to increase the ratio of debt to cash flow to allow additional share repurchases. During the year ended December 31, 2009, the Company repurchased and retired 12,164,462 shares for $343.3 million pursuant to the repurchase plan. As of December 31, 2009, $213.0 million of the Company’s common stock was eligible for repurchase in accordance with the amended formula.
On October 31, 2007, we completed the sale of $275.0 million principal amount (including exercise of a $25.0 million over-allotment option) of convertible senior debentures due 2037—Series A (the “Series A Debentures”) and $275.0 million principal amount (including exercise of a $25.0 million over-allotment option) of convertible senior debentures due 2037—Series B (the “Series B Debentures” and together with the Series A Debentures, the “Series Debentures”) in a private placement. The Series Debentures pay interest semi-annually at a rate of 2.75% per annum. The Series Debentures are unsecured and unsubordinated obligations and will be convertible under specified circumstances based upon a base conversion rate, which, under certain circumstances, will be increased pursuant to a formula that is subject to a maximum conversion rate. Upon conversion, holders of the Series Debentures will receive cash up to the principal amount, and any excess conversion value will be delivered in shares of our common stock or in a combination of cash and shares of common stock, at our option. The initial base conversion rate for the Debentures is 19.5044 shares of common stock per $1,000 principal amount of Series Debentures, equivalent to an initial base conversion price of approximately $51.27 per share. In addition, if at the time of conversion the applicable price of our common stock exceeds the base conversion price, holders of the Series A Debentures and Series B Debentures will receive an additional number of shares of common stock per $1,000 principal amount of the Debentures, as determined pursuant to a specified formula. We will have the right to redeem the Series A Debentures and the Series B Debentures at any time after November 1, 2012 and November 1, 2014, respectively. Holders of the Series Debentures will have the right to require us to repurchase for cash all or some of their Series Debentures upon the occurrence of certain fundamental change transactions or on November 1, 2012, 2017, 2022, 2027 and 2032 in the case of the Series A Debentures and November 1, 2014, 2017, 2022, 2027 and 2032 in the case of the Series B Debentures.
In June 2003, we completed the sale of $275.0 million aggregate principal amount of 3.0% Convertible Senior Debentures due 2033 (the “Debentures”) in a private placement. The Debentures were convertible into
29
Table of Contents
shares of our common stock based on a conversion rate of 18.7515 shares for each $1,000 principal amount of Debentures. Interest on the Debentures was payable at the rate of 3.0% per annum on June 15 and December 15 of each year. On June 15, 2008, we redeemed all of the outstanding Debentures at par pursuant to a notice of redemption.
Our future liquidity will continue to be dependent upon our operating cash flow and management of accounts receivable. We anticipate that funds generated from operations, together with our current cash on hand and funds available under our revolving credit facility, will be sufficient to finance our working capital requirements, fund anticipated acquisitions and capital expenditures, and meet our contractual obligations for the next year.
Accounts Receivable: The Company maintains payor-specific price tables in its billing system that reflect the fee schedule amounts statutorily in effect or contractually agreed upon by various government and commercial payors for each item of equipment or supply provided to a customer. Due to the nature of the health care industry and the reimbursement environment in which Lincare operates, situations can occur where expected payment amounts are not established by fee schedules or contracted rates, and estimates are required to record revenues and accounts receivable at their net realizable values. Inherent in these estimates is the risk that revenues and accounts receivable will have to be revised or updated as additional information becomes available. Sales adjustments to revenues and accounts receivable can result from price differences between allowed charges and amounts initially recognized as revenue due to incorrect price tables or subsequently negotiated payment rates. Actual adjustments that result from differences between the payment amount received and the expected realizable amount are recorded against the allowance for sales adjustments and are typically identified and ultimately recorded at the point of cash application or account review. We report revenues in our financial statements net of such adjustments. Accounts receivable are reported net of allowances for sales adjustments and uncollectible accounts. Bad debt is recorded as an operating expense and consists of billed charges that are ultimately deemed uncollectible due to the customer’s or third-party payor’s inability or refusal to pay.
The Company’s payor mix is highly concentrated among Medicare, Medicaid and other government third-party payors and contracted private insurance or commercial payors. Government payment rates are determined according to published fee schedules established pursuant to statute, law or other regulatory processes and commercial payment rates are based on contractual line item pricing as reflected in the respective contracts. Fee schedule updates have historically occurred on a prospective basis and have been made available to the Company in advance of the effective date of a change in reimbursement rates. The Company’s proprietary billing system has features that allow the Company to timely update payor price tables within the system as changes occur in order to accurately record revenues and accounts receivable at their expected realizable values. Additional systems and manual controls and processes are used by management to evaluate the accuracy of these recorded amounts. Based on the Company’s experience, it is unlikely that a change in estimate of unsettled amounts from third-party payors would have a material adverse impact on its financial position or results of operations.
Accounts receivable balance concentrations by major payor category as of December 31, 2009 and December 31, 2008 were as follows:
| Percentage of Accounts Receivable Outstanding: | December 31, 2009 |
December 31, 2008 |
||||
| Medicare |
34.0 | % | 35.5 | % | ||
| Medicaid/Other Government |
15.6 | % | 16.2 | % | ||
| Private Insurance |
38.8 | % | 39.0 | % | ||
| Customer Pay |
11.6 | % | 9.3 | % | ||
| Total |
100.0 | % | 100.0 | % | ||
30
Table of Contents
Aged accounts receivable balances by major payor category as of December 31, 2009 and December 31, 2008 were as follows:
| Percentage of Accounts Aged in Days: | December 31, 2009 | ||||||||
| 0-60 | 61-120 | Over 120 | |||||||
| Medicare |
81.0 | % | 10.2 | % | 8.8 | % | |||
| Medicaid/Other Government |
60.4 | % | 17.8 | % | 21.8 | % | |||
| Private Insurance |
65.9 | % | 13.3 | % | 20.8 | % | |||
| Customer Pay |
44.2 | % | 22.6 | % | 33.2 | % | |||
| All Payors |
67.6 | % | 14.1 | % | 18.3 | % | |||
| Percentage of Accounts Aged in Days: | December 31, 2008 | ||||||||
| 0-60 | 61-120 | Over 120 | |||||||
| Medicare |
82.5 | % | 8.8 | % | 8.7 | % | |||
| Medicaid/Other Government |
53.1 | % | 17.4 | % | 29.5 | % | |||
| Private Insurance |
59.7 | % | 14.3 | % | 26.0 | % | |||
| Customer Pay |
50.3 | % | 26.6 | % | 23.1 | % | |||
| All Payors |
65.9 | % | 14.0 | % | 20.1 | % | |||
The Company operates 34 regional billing and collection offices (“RBCOs”) that are responsible for the billing and collection of accounts receivable. The RBCOs are aligned geographically to support the accounts receivable activity of the operating centers within their assigned territories. As of December 31, 2009 and 2008, there were 1,358 and 1,361 full-time employees in the RBCOs. Accounts receivable collections are performed by designated collectors within each of the RBCOs. The collectors use various reporting tools available within the Company’s proprietary billing system to identify claims that have been denied or partially paid by the responsible party and claims that have not been processed by the third-party payor in a timely manner. Collections of accounts receivable are typically pursued using direct phone contact to determine the reason for non-payment and, if necessary, corrected claims are prepared for resubmission and further follow-up with the responsible party. In some cases, third-party payors have developed electronic inquiry methods that the Company can access to determine the status of individual claims. The Company has benefited from the increasing availability of electronic funds transfers from payors, which now account for approximately 70% of all payments received. The Company believes that its collection procedures contribute to its accounts receivable days sales outstanding (“DSO”) and bad debt expense being among the lowest in its industry, according to published industry data and public filings of some of its competitors.
The ultimate collection of accounts receivable may not be known for several months. We record bad debt expense based on a percentage of revenue using historical Company-specific data. The percentage and amounts used to record bad debt expense and the allowance for doubtful accounts are supported by various methods and analyses, including current and historical cash collections, bad debt write-offs, aged accounts receivable and consideration of any payor-specific concerns. The ultimate write-off of an accounts receivable occurs once collection procedures are determined to have been exhausted by the collector and after appropriate review of the specific account and approval by supervisory and/or management employees within the RBCOs. Management and RBCO supervisory and management employees also review accounts receivable write-off reports, correspondence from payors and individual account information to evaluate and correct processes that might have contributed to an unsuccessful collection effort.
The Company does not use an aging threshold for account receivable write-offs. However, the age of an account balance may provide an indication that collection procedures have been exhausted, and would be considered in the review and approval of an account balance write-off.
31
Table of Contents
Off-Balance Sheet Arrangements
We do not have any off-balance sheet arrangements that have a current or future material effect on our financial condition, results of operations, liquidity, capital expenditures or capital resources.
Future Minimum Obligations
In the normal course of business, we enter into obligations and commitments that require future contractual payments. The commitments primarily result from repayment obligations for borrowings under our revolving bank credit facility and Series Debentures, as well as contractual lease payments for facility, vehicle, and equipment leases and deferred acquisition obligations. The following table presents, in aggregate, scheduled payments under our contractual obligations (in thousands):
| Fiscal Years | |||||||||||||||||||||
| 2010 | 2011 | 2012 | 2013 | 2014 | Thereafter | Total | |||||||||||||||
| Unsecured deferred obligations |
$ | 2,478 | $ | — | $ | — | $ | — | $ | — | $ | — | $ | 2,478 | |||||||
| Capital lease commitments |
13 | — | — | — | — | — | 13 | ||||||||||||||
| Long-term debt (1) |
— | — | 275,000 | — | 275,000 | — | 550,000 | ||||||||||||||
| Interest expense |
15,953 | 15,661 | 15,125 | 7,563 | 7,563 | — | 61,865 | ||||||||||||||
| Operating leases |
49,677 | 34,860 | 19,278 | 5,773 | 1,503 | 499 | 111,590 | ||||||||||||||
| Employment Agreements |
1,996 | 1,996 | 1,996 | — | — | — | 5,988 | ||||||||||||||
| Taxes & related interest and penalties (2) |
3 | — | — | — | — | — | 3 | ||||||||||||||
| Total |
$ | 70,120 | $ | 52,517 | $ | 311,399 | $ | 13,336 | $ | 284,066 | $ | 499 | $ | 731,937 | |||||||
| (1) | Amounts include the Series Debentures due 2037. The Series A Debentures are redeemable by us on or after November 1, 2012, and may be put to us for repurchase on November 1, 2012, 2017, 2022, 2027 and 2032. The Series A Debentures are shown in the table as scheduled for repurchase in 2012 as a result of the put feature. The Series B Debentures are redeemable by us on or after November 1, 2014, and may be put to us for repurchase on November 1, 2014, 2017, 2022, 2027 and 2032. |
| (2) | The Company had gross unrecognized tax benefits, including interest and penalties, of $5.8 million of which we anticipate payment settlement of $3.0 thousand during 2010. We are unable to determine a reasonable estimate of the payment settlement date or the settlement amount for the remaining balance of $5.8 million in unrecognized tax benefits. |
New Accounting Standards
In June 2009, the Financial Accounting Standards Board (“FASB”) issued “Accounting Standards Codification” (“ASC”) 105-10, “Generally Accepted Accounting Principles—Overall” (“ASC 105-10”). ASC 105-10 establishes the FASB Accounting Standards Codification (the “Codification”) as the source of authoritative accounting principles recognized by the FASB to be applied by nongovernmental entities in the preparation of financial statements in conformity with U.S. Generally Accepted Accounting Principles (“GAAP”). Rules and interpretive releases of the SEC under authority of federal securities laws are also sources of authoritative U.S. GAAP for SEC registrants. All guidance contained in the Codification carries an equal level of authority. The Codification superseded all existing non-SEC accounting and reporting standards. All other non-grandfathered, non-SEC accounting literature not included in the Codification is non-authoritative. The FASB will not issue new standards in the form of Statements, FASB Staff Positions or Emerging Issues Task Force Abstracts. Instead, it will issue Accounting Standards Updates (“ASUs”). The FASB will not consider ASUs as authoritative in their own right. ASUs will serve only to update the Codification, provide background information about the guidance and provide the bases for conclusions on the change(s) in the Codification. References made to FASB guidance throughout this document have been updated for the Codification. The Codification is effective for all reporting periods that end after September 15, 2009. The adoption of ASC 105-10 did not have an impact on our financial condition, results of operations or cash flows.
32
Table of Contents
In December 2007, the FASB issued FASB ASC 805, “Business Combinations,” (“ASC 805”), which requires an acquirer in a business combination to recognize the assets acquired, liabilities assumed, and any non-controlling interest in the acquiree at the acquisition date, measured at their fair values as of that date, with limited exceptions. It also requires the recognition of assets acquired and liabilities assumed arising from certain contractual contingencies as of the acquisition date, measured at their acquisition-date fair values. The provisions of ASC 805 are effective as of the beginning of the 2009 calendar year. The adoption of ASC 805 did not have a material impact on our financial condition, results of operations or cash flows.
In February 2008, the FASB issued updated guidance related to fair value measurements, which is included in the Codification in ASC 820-10-55, “Fair Value Measurements and Disclosures—Overall—Implementation Guidance and Illustrations.” The updated guidance provided a one year deferral of the effective date of ASC 820-10 for non-financial assets and non-financial liabilities, except those that are recognized or disclosed in the financial statements at fair value at least annually. Therefore, the Company adopted the provisions of ASC 820-10 for non-financial assets and non-financial liabilities effective January 1, 2009, and such adoption did not have a material impact on our financial condition, results of operations or cash flows.
In May 2008, the FASB issued updated guidance for the accounting for convertible debt included in the Codification in ASC 470-20, “Debt with Conversion and Other Options,” which specifies that issuers of convertible debt instruments that may be settled in cash upon conversion should separately account for the liability and equity components in a manner that will reflect the entity’s nonconvertible debt borrowing rate when interest cost is recognized in subsequent periods. Upon adoption, the debt component of such instrument would be recognized by measuring the fair value of a similar liability that does not have an associated equity component. The equity component of such instrument would be recognized as the difference between the proceeds from the issuance of the note and the fair value of the liability component. ASC 470-20 requires accretion of the resultant debt discount (equal to the proceeds allocated to the equity component) over the expected life of the debt. The guidance is effective for financial statements issued for fiscal years beginning after December 15, 2008, and interim periods within those fiscal years. The Company adopted ASC 470-20 effective January 1, 2009, applied on a retrospective basis. For a full discussion of the impact to the Company’s condensed consolidated financial statements, refer to Note 7 to the consolidated financial statements.
In April 2009, the FASB issued updated guidance related to business combinations, which is included in the Codification in ASC 805-20, “Business Combinations—Identifiable Assets, Liabilities and Any Noncontrolling Interest” (“ASC 805-20”). ASC 805-20 amends and clarifies ASC 805 to address application issues regarding initial recognition and measurement, subsequent measurement and accounting and disclosure of assets and liabilities arising from contingencies in a business combination. In circumstances where the acquisition-date fair value for a contingency cannot be determined during the measurement period and it is concluded that it is probable that an asset or liability exists as of the acquisition date and the amount can be reasonably estimated, a contingency is recognized as of the acquisition date based on the estimated amount. The provisions of ASC 805-20 were effective for assets or liabilities arising from contingencies in business combinations for which the acquisition date is on or after January 1, 2009 and did not have an impact on our financial condition, results of operations or cash flows.
In April 2009, the FASB issued FASB ASC 820-10-65, “Fair Value Measurements and Disclosures—Overall—Transition and Open Effective Date Information” (“ASC 820-10-65”). ASC 820-10-65 provides additional guidance for estimating fair value in accordance with ASC 820-10 when the volume and level of activity for the asset or liability have significantly decreased. The guidance indicates if the reporting entity concludes there has been a significant decrease in the volume and level of activity for the asset or liability in relation to normal market activity for the asset or liability then transactions or quoted prices may not be determinative of fair value. In such a situation further analysis of the transactions or quoted prices is needed and a significant adjustment to the transactions or quoted prices may be necessary to estimate fair value in accordance with ASC 820. ASC 820-10-65 emphasizes that in identifying transactions that are not orderly an entity cannot assume that the observable transaction price is not orderly when the volume and level of activity for
33
Table of Contents
the asset or liability have significantly declined. Rather an entity must perform an analysis to determine whether the observable price is representative of a transaction that is not orderly. ASC 820-10-65 amends the disclosure provisions of ASC 820-10-50 to require entities to disclose in interim and annual periods the inputs and valuation technique(s) used to measure fair value. This requirement was previously limited to annual periods under ASC 820. Further, if an entity changes the valuation technique(s) or related assumptions in measuring fair value, the entity is required to qualitatively discuss the changes in valuation technique(s) and related assumptions in both interim and annual financial statements. Entities have alternatives for adopting ASC 820-10-65 including to not early adopt in which case adoption is required no later than periods ending after June 15, 2009 or to early adopt for periods ending after March 15, 2009. We adopted ASC 820-10-65 for the period ended June 30, 2009. The adoption of ASC 820-10-65 did not have a material impact on our financial condition, results of operations or cash flows.
In April 2009, the FASB issued FASB ASC 825-10-65, “Financial Instruments—Overall—Transition and Open Effective Date Information” (“ASC 825-10-65”), which increases the frequency of fair value disclosures from annual only to quarterly to provide financial statement users with more timely information about the effects of current market conditions on financial instruments. ASC 825-10-65 requires public entities to disclose in their interim financial statements the fair value of all financial instruments within the scope of ASC 825-10 as well as the method(s) and significant assumptions used to estimate the fair value of those financial instruments. Entities have alternatives for adopting the ASC 825-10-65 including to not early adopt in which case adoption is required no later than periods ending after June 15, 2009 or to early adopt for periods ending after March 15, 2009. We adopted ASC 825-10-65 for the period ended June 30, 2009. The adoption of ASC 825-10-65 did not have an impact on our financial condition, results of operations or cash flows.
In May 2009, the FASB issued FASB ASC 855-10, “Subsequent Events—Overall” (“ASC 855-10”), which provides guidance on management’s assessment of subsequent events. ASC 855-10 defines subsequent events as “events or transactions that occur after the balance sheet date but before financial statements are issued or are available to be issued.” Financial statements are considered “issued” when they are widely distributed to shareholders and other financial statement users for general use and reliance in a form and format that complies with generally accepted accounting principles. Financial statements are considered “available to be issued” when they are complete in a form and format that complies with GAAP and all approvals necessary for issuance have been obtained. Entities that have a current expectation of widely distributing their financial statements, such as public companies, are required to assess subsequent events through the date of issuance. All other entities are required to consider subsequent events until financial statements are available to be issued. ASC 855-10 requires the disclosure of the date through which subsequent events have been evaluated, as well as whether that date is the date the financial statements were issued. ASC 855-10 is effective for interim or annual financial periods ending after June 15, 2009 and should be applied prospectively. We adopted the provisions of ASC 855-10 for the period ended June 30, 2009. The adoption of ASC 855-10 did not have an impact on our financial condition, results of operations or cash flows.
34
Table of Contents
In August 2009, the FASB issued Accounting Standards Update 2009-05, “Measuring Liabilities at Fair Value,” which provides guidance on measuring the fair value of liabilities under FASB ASC 820, “Fair Value Measurements.” ASU 2009-05 reaffirms that fair value measurement of a liability assumes the transfer of a liability to a market participant as of the measurement date; that is, the liability is presumed to continue and is not settled with the counterparty. In addition, ASU 2009-05 reemphasizes that a fair value measurement of a liability includes nonperformance risk and that such risk does not change after transfer of the liability. In a manner consistent with this underlying premise (i.e., a transfer notion), the ASU requires that an entity should first determine whether a quoted price of an identical liability traded in an active market exists (i.e., a Level 1 fair value measurement). The ASU clarifies that the quoted price for the identical liability, when traded as an asset in an active market, is also a Level 1 measurement for that liability when no adjustment to the quoted price is required. In the absence of a Level 1 measurement, an entity must use one or more of the following valuation techniques to estimate fair value (in a manner consistent with the principles in ASC 820), which can be classified into two broad categories:
A valuation technique that uses a quoted price:
| • | Quoted price of an identical liability when traded as an asset. |
| • | Quoted price of a similar liability or of a similar liability when traded as an asset. |
Another valuation technique (e.g., a market approach or an income approach), including one of the following:
| • | A technique based on the amount an entity would pay to transfer the identical liability. |
| • | A technique based on the amount an entity would receive to enter into an identical liability. |
The ASU emphasizes that regardless of the technique(s) used, an entity should maximize the use of relevant observable inputs and minimize the use of unobservable inputs. The guidance in ASU 2009-05 is effective for the first reporting period (including interim periods) beginning after issuance. Entities may also elect to early adopt the ASU if financial statements have not been issued. In the period of adoption, an entity is required to disclose any change in valuation technique and related inputs and quantify the total effect, if practicable. We adopted this ASU effective October 1, 2009. The adoption of ASU 2009-05 did not have an impact on our financial condition, results of operations or cash flows.
In January 2010, the FASB issued Accounting Standards Update 2009-06, “Improving Disclosures about Fair Value Measurements,” which provides amendments to FASB ASC Subtopic 820-10, “Fair Value Measurements—Overall,” requiring new disclosures as follows:
| • | Transfers in and out of Levels 1 and 2. A reporting entity should disclose separately the amounts of significant transfers in and out of Level 1 and Level 2 fair value measurements and describe the reasons for the transfers. |
| • | Activity in Level 3 fair value measurements. In the reconciliation for fair value measurements using significant unobservable inputs (Level 3), a reporting entity should present separately information about purchases, sales, issuances, and settlements (that is, on a gross basis rather than as one net number). |
The Update provides amendments to ASC Subtopic 820-10 that clarify existing disclosures as follows:
| • | Level of disaggregation. A reporting entity should provide fair value measurement disclosures for each class of assets and liabilities. A class is often a subset of assets or liabilities within a line item in the statement of financial position. |
| • | Disclosures about inputs and valuation techniques. A reporting entity should provide disclosures about the valuation techniques and inputs used to measure fair value for both recurring and nonrecurring fair value measurements. Those disclosures are required for fair value measurements that fall in either Level 2 or Level 3. |
35
Table of Contents
The new disclosures and clarifications of existing disclosures are effective for interim and annual reporting periods beginning after December 15, 2009, except for the disclosures about purchases, sales, issuances, and settlements in the roll forward of activity in Level 3 fair value measurements. Those disclosures are effective for fiscal years beginning after December 15, 2010, and for interim periods within those fiscal years. We do not expect the adoption of ASU 2009-6 to have a material impact on our financial condition, results of operations or cash flows.
Inflation
We currently do not anticipate any material increases in the near term in either the cost of supplies or operating expenses due to inflation. With reductions in reimbursement by government and private medical insurance programs and pressure to contain the costs of such programs, we bear the risk that reimbursement rates set by such programs will not keep pace with inflation.
Segment Information
We utilize the “management” approach for determining reportable segments. The management approach designates the internal organization that is used by management for making operating decisions and assessing performance as the source of our reportable segments. We maintain a decentralized approach to management of our local business operations. Decentralization of managerial decision-making enables our operating centers to respond promptly and effectively to local market demands and opportunities. We provide home health care equipment and services through 1,056 operating centers in 48 states. We view each operating center as a distinct part of a single “operating segment,” as each operating center generally provides the same products to customers. As a result, all of our operating centers are aggregated into one reportable segment.
Item 7A. Quantitative and Qualitative Disclosures About Market Risk
The fair values of our borrowings under the five year credit facility and the Series Debentures are subject to change as a result of changes in market prices or interest rates. We estimate potential changes in the fair value of interest rate sensitive financial instruments based on a hypothetical increase in interest rates. Our use of this methodology to quantify the market risk of such instruments should not be construed as an endorsement of its accuracy or the accuracy of the related assumptions. The quantitative information about market risk is necessarily limited because it does not take into account anticipated operating and financial transactions.
Our borrowings under the five-year credit facility are subject to changes in market rates or prices. The borrowings bear interest at (1) British Bankers Association LIBOR Rate (“BBA Libor”) and (2) an applicable margin based on the Company’s consolidated leverage ratio. There were no outstanding borrowings under the credit facility at December 31, 2009.
The fair value of our Series Debentures are subject to changes in market rates or prices. Our Series Debentures bear interest at 2.75%. The outstanding principal balance of our Series Debentures was $550.0 million at December 31, 2009. The estimated fair values of the Series A and Series B Debentures at December 31, 2009 were $291,170,000 and $289,437,500, respectively. Considering the total outstanding balance of $550.0 million, a 10% change in interest rates would result in a net increase in the market value of our Series Debentures outstanding at December 31, 2009 of approximately $8.0 million.
Item 8. Financial Statements and Supplementary Data
The financial statements required by this item are listed in Item 15(a)(1) and are submitted at the end of this Annual Report on Form 10-K. The supplementary data required by this item is included on page S-1. The financial statements and supplementary data are herein incorporated by reference.
36
Table of Contents
Item 9. Changes in and Disagreements with Accountants on Accounting and Financial Disclosure
None.
Item 9A. Controls and Procedures
| (a) | Evaluation of Disclosure Controls and Procedures. |
The Company has conducted an evaluation, under the supervision and with the participation of its management, including its Chief Executive Officer and Chief Financial Officer, of the effectiveness of its disclosure controls and procedures (as defined in Rules 13a-15(e) and 15d-15(e) under the Securities Exchange Act of 1934, as amended). Based upon that evaluation, the Chief Executive Officer and Chief Financial Officer have concluded that the Company’s disclosure controls and procedures were effective as of the end of the period covered by this report.
| (b) | Management’s Annual Report on Internal Control Over Financial Reporting |
Lincare’s management is responsible for establishing and maintaining adequate internal control over financial reporting, as such term is defined in Exchange Act Rule 13a-15(f). The Company’s internal control system was designed to provide reasonable assurance to management and the board of directors regarding the preparation and fair presentation of published financial statements. The Company’s internal control over financial reporting includes those policies and procedures that (i) pertain to the maintenance of records that, in reasonable detail, accurately and fairly reflect the transactions and dispositions of the assets of the Company; (ii) provide reasonable assurance that transactions are recorded as necessary to permit preparation of financial statements in accordance with generally accepted accounting principles, and that receipts and expenditures of the Company are being made only in accordance with authorizations of management and directors of the Company; and (iii) provide reasonable assurance regarding the prevention or timely detection of unauthorized acquisition, use, or disposition of the Company’s assets that could have a material effect on the Company’s financial statements.
All internal control systems, no matter how well designed, have inherent limitations. Therefore, even those systems determined to be effective can provide only reasonable assurance with respect to financial statement preparation and presentation. Because of its inherent limitations, internal control over financial reporting may not prevent or detect misstatements. Projections of any evaluation of effectiveness to future periods are subject to the risk that controls may become inadequate because of changes in conditions, or that the degree of compliance with the underlying policies or procedures may deteriorate. Under the supervision and with the participation of management, including Lincare’s Chief Executive Officer and Chief Financial Officer, Lincare conducted an evaluation of the effectiveness of its internal control over financial reporting as of December 31, 2009 based on the framework in Internal Control—Integrated Framework issued by the Committee of Sponsoring Organizations of the Treadway Commission (“COSO”).
Based on Lincare’s evaluation under the framework in Internal Control—Integrated Framework, management concluded that internal control over financial reporting was effective as of December 31, 2009.
Lincare’s registered public accounting firm, KPMG LLP, has issued an attestation report on Lincare’s internal control over financial reporting as of December 31, 2009 as stated in their report which appears on page 38 of this Annual Report on Form 10-K.
| (c) | Changes in Internal Control Over Financial Reporting |
There has been no change in Lincare’s internal control over financial reporting during the fourth fiscal quarter ended December 31, 2009 that has materially affected, or is reasonably likely to materially affect, Lincare’s internal control over financial reporting.
37
Table of Contents
Report of Independent Registered Public Accounting Firm
The Board of Directors and Stockholders
Lincare Holdings Inc.:
We have audited Lincare Holdings Inc. and subsidiaries (Company) internal control over financial reporting as of December 31, 2009, based on criteria established in Internal Control—Integrated Framework issued by the Committee of Sponsoring Organizations of the Treadway Commission (COSO). The Company’s management is responsible for maintaining effective internal control over financial reporting and for its assessment of the effectiveness of internal control over financial reporting, included in the accompanying Management’s Annual Report on Internal Control Over Financial Reporting (Item 9A(b)). Our responsibility is to express an opinion on the Company’s internal control over financial reporting based on our audit.
We conducted our audit in accordance with the standards of the Public Company Accounting Oversight Board (United States). Those standards require that we plan and perform the audit to obtain reasonable assurance about whether effective internal control over financial reporting was maintained in all material respects. Our audit included obtaining an understanding of internal control over financial reporting, assessing the risk that a material weakness exists, and testing and evaluating the design and operating effectiveness of internal control based on the assessed risk. Our audit also included performing such other procedures as we considered necessary in the circumstances. We believe that our audit provides a reasonable basis for our opinion.
A company’s internal control over financial reporting is a process designed to provide reasonable assurance regarding the reliability of financial reporting and the preparation of financial statements for external purposes in accordance with generally accepted accounting principles. A company’s internal control over financial reporting includes those policies and procedures that (1) pertain to the maintenance of records that, in reasonable detail, accurately and fairly reflect the transactions and dispositions of the assets of the company; (2) provide reasonable assurance that transactions are recorded as necessary to permit preparation of financial statements in accordance with generally accepted accounting principles, and that receipts and expenditures of the company are being made only in accordance with authorizations of management and directors of the company; and (3) provide reasonable assurance regarding prevention or timely detection of unauthorized acquisition, use, or disposition of the company’s assets that could have a material effect on the financial statements.
Because of its inherent limitations, internal control over financial reporting may not prevent or detect misstatements. Also, projections of any evaluation of effectiveness to future periods are subject to the risk that controls may become inadequate because of changes in conditions, or that the degree of compliance with the policies or procedures may deteriorate.
In our opinion, the Company maintained, in all material respects, effective internal control over financial reporting as of December 31, 2009, based on criteria established in Internal Control—Integrated Framework issued by the Committee of Sponsoring Organizations of the Treadway Commission.
We also have audited, in accordance with the standards of the Public Company Accounting Oversight Board (United States), the consolidated balance sheets of the Company as of December 31, 2009 and 2008, and the related consolidated statements of operations, stockholders’ equity, and cash flows for each of the years in the three-year period ended December 31, 2009, and our report dated February 25, 2010 expressed an unqualified opinion on those consolidated financial statements.
/s/ KPMG LLP
Tampa, Florida
February 25, 2010
Certified Public Accountants
38
Table of Contents
None.
39
Table of Contents
Item 10. Directors, Executive Officers, and Corporate Governance
Directors, Executive Officers, Promoters and Control Persons
Information required to be furnished by Item 401 of Regulation S-K of the Securities Exchange Act of 1934, as amended (the “Exchange Act”), will be included in the definitive proxy statement for the Annual Meeting of Stockholders to be held on May 10, 2010, and is herein incorporated by reference.
Audit Committee
The Company has a standing Audit Committee established in accordance with Section 3(a)(58)(A) of the Exchange Act. Additional information regarding the Audit Committee will be included in the definitive proxy statement for the Annual Meeting of Stockholders to be held on May 10, 2010, and is herein incorporated by reference.
Audit Committee Financial Expert
The Board of Directors has designated William F. Miller, III as the “Audit Committee Financial Expert” as defined by Item 407(d)(5)(ii) of Regulation S-K of the Exchange Act and has determined that he is independent as defined in the listing standards applicable to the Company.
Compliance with Section 16(a) of the Exchange Act
Information required to be furnished by Item 405 of Regulation S-K will be included in the definitive proxy statement for the Annual Meeting of Stockholders to be held on May 10, 2010, and is herein incorporated by reference.
Code of Ethics
The Company has adopted a code of business conduct and ethics that applies to its directors and officers (including its principal executive officer, principal financial officer, principal accounting officer or controller, or persons performing similar functions) as well as its employees. Copies of the Company’s code of ethics are available without charge upon written request directed to Corporate Secretary, Lincare Holdings Inc., 19387 US 19 North, Clearwater, Florida 33764.
Nominating Committee
Information required to be furnished by Item 407(c)(3) of Regulation S-K will be included in the definitive proxy statement for the Annual Meeting of Stockholders to be held on May 10, 2010, and is herein incorporated by reference.
Item 11. Executive Compensation
Information required to be furnished by Item 402 of Regulation S-K and paragraphs (e)(4) and (e)(5) of Item 407 of Regulation S-K regarding executive compensation will be included in the definitive proxy statement for the Annual Meeting of Stockholders to be held on May 10, 2010, and is herein incorporated by reference.
| Item 12. Security | Ownership of Certain Beneficial Owners and Management and Related Stockholder Matters |
Information required to be furnished by Item 201(d) of Regulation S-K and by Item 403 of Regulation S-K will be included in the definitive proxy statement for the Annual Meeting of Stockholders to be held on May 10, 2010, and is herein incorporated by reference.
40
Table of Contents
Item 13. Certain Relationships and Related Transactions, and Director Independence
Information required to be furnished by Item 404 of Regulation S-K and Item 407(a) of Regulation S-K will be included in the definitive proxy statement for the Annual Meeting of Stockholders to be held on May 10, 2010, and is herein incorporated by reference.
Item 14. Principal Accountant Fees and Services
Information required to be furnished by Item 9(e) of Schedule 14A will be included in the definitive proxy statement for the Annual Meeting of Stockholders to be held on May 10, 2010, and is herein incorporated by reference.
41
Table of Contents
Item 15. Exhibits and Financial Statement Schedules
(a) (1) The following consolidated financial statements of Lincare Holdings Inc. and subsidiaries are filed as part of this Form 10-K starting at page F-1:
Report of Independent Registered Public Accounting Firm
Consolidated Balance Sheets—December 31, 2009 and 2008
Consolidated Statements of Operations—Years ended December 31, 2009, 2008 and 2007
Consolidated Statements of Stockholders’ Equity—Years ended December 31, 2009, 2008 and 2007
Consolidated Statements of Cash Flows—Years ended December 31, 2009, 2008 and 2007
Notes to Consolidated Financial Statements
(2) The following consolidated financial statement schedule of Lincare Holdings Inc. and subsidiaries is included in this Form 10-K at page S-1:
Schedule II—Valuation and Qualifying Accounts
All other schedules for which provision is made in the applicable accounting regulations of the SEC are not required under the related instructions or are inapplicable, and therefore have been omitted.
(3) Exhibits included or incorporated herein:
See Exhibit Index.
42
Table of Contents
Pursuant to the requirements of Section 13 or 15(d) of the Securities Exchange Act of 1934, the registrant has duly caused this report to be signed on its behalf by the undersigned, thereunto duly authorized.
| LINCARE HOLDINGS INC. | ||
| Date: February 25, 2010 | /S/ PAUL G. GABOS | |
| Paul G. Gabos | ||
| Secretary, Chief Financial Officer and Principal Accounting Officer | ||
Pursuant to the requirements of the Securities Exchange Act of 1934, this report has been signed below by the following persons on behalf of the registrant and in the capacities and on the dates indicated.
| Signature |
Position |
Date | ||||
| /s/ JOHN P. BYRNES John P. Byrnes |
Director, Chief Executive Officer and Principal Executive Officer |
February 25, 2010 | ||||
| /S/ PAUL G. GABOS Paul G. Gabos |
Secretary, Chief Financial Officer and Principal Accounting Officer |
February 25, 2010 | ||||
| * Chester B. Black |
Director | February 25, 2010 | ||||
| * William F. Miller, III |
Director | February 25, 2010 | ||||
| * Frank D. Byrne, M.D. |
Director | February 25, 2010 | ||||
| * Stuart H. Altman, Ph.D. |
Director | February 25, 2010 | ||||
| *BY: | /S/ PAUL G. GABOS | |
| Attorney in fact | ||
43
Table of Contents
[This Page Intentionally Left Blank.]
Table of Contents
Report of Independent Registered Public Accounting Firm
The Board of Directors and Stockholders
Lincare Holdings Inc.:
We have audited the accompanying consolidated balance sheets of Lincare Holdings Inc. and subsidiaries (the Company) as of December 31, 2009 and 2008, and the related consolidated statements of operations, stockholders’ equity, and cash flows for each of the years in the three-year period ended December 31, 2009. In connection with our audits of the consolidated financial statements, we also have audited the financial statement schedule on page S-1. These consolidated financial statements and financial statement schedule are the responsibility of the Company’s management. Our responsibility is to express an opinion on these consolidated financial statements and financial statement schedule based on our audits.
We conducted our audits in accordance with the standards of the Public Company Accounting Oversight Board (United States). Those standards require that we plan and perform the audit to obtain reasonable assurance about whether the financial statements are free of material misstatement. An audit includes examining, on a test basis, evidence supporting the amounts and disclosures in the financial statements. An audit also includes assessing the accounting principles used and significant estimates made by management, as well as evaluating the overall financial statement presentation. We believe that our audits provide a reasonable basis for our opinion.
In our opinion, the consolidated financial statements referred to above present fairly, in all material respects, the financial position of the Company as of December 31, 2009 and 2008, and the results of their operations and their cash flows for each of the years in the three-year period ended December 31, 2009, in conformity with U.S. generally accepted accounting principles. Also in our opinion, the related financial statement schedule, when considered in relation to the basic consolidated financial statements taken as a whole, presents fairly, in all material respects, the information set forth therein.
As discussed in Note 2 to the consolidated financial statements, the Company changed its method for measuring and disclosing the fair value of assets and liabilities due to the adoption of new accounting requirements issued by the FASB, effective January 1, 2008.
As discussed in Note 3 to the consolidated financial statements, the Company changed its method of valuing certain financial assets and liabilities due to the fair value option election related to the adoption of new accounting requirements issued by the FASB, effective January 1, 2008.
As discussed in Notes 1 and 7 to the consolidated financial statements, the Company changed its method of accounting for convertible debt instruments due to the adoption of new accounting requirements issued by the FASB, effective January 1, 2009, applied retrospectively.
We also have audited, in accordance with the standards of the Public Company Accounting Oversight Board (United States), the Company’s internal control over financial reporting as of December 31, 2009, based on criteria established in Internal Control—Integrated Framework issued by the Committee of Sponsoring Organizations of the Treadway Commission (COSO), and our report dated February 25, 2010 expressed an unqualified opinion on the effectiveness of the Company’s internal control over financial reporting.
/s/ KPMG LLP
Tampa, Florida
February 25, 2010
Certified Public Accountants
F-1
Table of Contents
LINCARE HOLDINGS INC. AND SUBSIDIARIES
CONSOLIDATED BALANCE SHEETS
December 31, 2009 and 2008
| 2009 | 2008 | |||||
| (In thousands, except share data) | ||||||
| (As adjusted Note 1) | ||||||
| ASSETS | ||||||
| Current assets: |
||||||
| Cash and cash equivalents |
$ | 20,428 | $ | 72,651 | ||
| Short-term investments (Note 3) |
58,650 | 0 | ||||
| Accounts receivable, net (Note 4) |
159,542 | 176,797 | ||||
| Income tax receivable |
3,325 | 2,863 | ||||
| Inventories |
13,617 | 9,468 | ||||
| Prepaid and other current assets |
3,742 | 3,057 | ||||
| Deferred income taxes (Note 8) |
25,646 | 22,286 | ||||
| Total current assets |
284,950 | 287,122 | ||||
| Property and equipment, net (Note 5) |
339,250 | 347,860 | ||||
| Long-term investments (Note 3) |
0 | 60,400 | ||||
| Goodwill |
1,243,404 | 1,232,178 | ||||
| Other |
9,590 | 11,249 | ||||
| Total assets |
$ | 1,877,194 | $ | 1,938,809 | ||
| LIABILITIES AND STOCKHOLDERS’ EQUITY | ||||||
| Current liabilities: |
||||||
| Current installments of long-term obligations (Note 7) |
$ | 2,767 | $ | 6,902 | ||
| Accounts payable |
49,959 | 60,472 | ||||
| Accrued expenses: |
||||||
| Compensation and benefits |
42,016 | 27,989 | ||||
| Liability insurance |
19,461 | 17,895 | ||||
| Other current liabilities (Note 9) |
49,264 | 54,484 | ||||
| Total current liabilities |
163,467 | 167,742 | ||||
| Long-term obligations, excluding current installments (Note 7) |
482,104 | 454,045 | ||||
| Deferred income taxes and other taxes (Note 8) |
329,708 | 288,696 | ||||
| Total liabilities |
975,279 | 910,483 | ||||
| Commitments and contingencies (Notes 6, 7 and 15) |
||||||
| Stockholders’ equity (Notes 7, 8, 10, 11 and 13): |
||||||
| Common stock, $.01 par value. Authorized 200,000,000 shares; |
654 | 744 | ||||
| Additional paid-in capital |
632,979 | 560,444 | ||||
| Retained earnings |
268,282 | 467,138 | ||||
| Total stockholders’ equity |
901,915 | 1,028,326 | ||||
| Total liabilities and stockholders’ equity |
$ | 1,877,194 | $ | 1,938,809 | ||
See accompanying notes to consolidated financial statements.
F-2
Table of Contents
LINCARE HOLDINGS INC. AND SUBSIDIARIES
CONSOLIDATED STATEMENTS OF OPERATIONS
Years Ended December 31, 2009, 2008 and 2007
| 2009 | 2008 | 2007 | ||||||||||
| (In thousands, except per share data) | ||||||||||||
| (As adjusted |
(As adjusted |
|||||||||||
| Net revenues (Note 12) |
$ | 1,550,477 | $ | 1,664,580 | $ | 1,595,990 | ||||||
| Costs and expenses: |
||||||||||||
| Cost of goods and services |
431,291 | 400,812 | 389,884 | |||||||||
| Operating expenses |
389,759 | 395,706 | 365,016 | |||||||||
| Selling, general and administrative expenses |
330,589 | 326,886 | 317,722 | |||||||||
| Bad debt expense |
23,257 | 24,969 | 23,940 | |||||||||
| Depreciation and amortization expense |
118,120 | 117,527 | 116,280 | |||||||||
| 1,293,016 | 1,265,900 | 1,212,842 | ||||||||||
| Operating income |
257,461 | 398,680 | 383,148 | |||||||||
| Other income (expenses): |
||||||||||||
| Interest income |
886 | 6,508 | 4,063 | |||||||||
| Interest expense |
(34,960 | ) | (39,644 | ) | (29,056 | ) | ||||||
| (34,074 | ) | (33,136 | ) | (24,993 | ) | |||||||
| Income before income taxes |
223,387 | 365,544 | 358,155 | |||||||||
| Income tax expense (Note 8) |
87,291 | 138,278 | 133,666 | |||||||||
| Net income |
$ | 136,096 | $ | 227,266 | $ | 224,489 | ||||||
| Income per common share (Note 13): |
||||||||||||
| Basic |
$ | 2.00 | $ | 3.11 | $ | 2.69 | ||||||
| Diluted |
$ | 1.99 | $ | 3.04 | $ | 2.56 | ||||||
| Weighted average number of common shares outstanding |
68,076 | 73,044 | 83,387 | |||||||||
| Weighted average number of common shares and common share equivalents outstanding |
68,497 | 75,616 | 89,688 | |||||||||
See accompanying notes to consolidated financial statements.
F-3
Table of Contents
LINCARE HOLDINGS INC. AND SUBSIDIARIES
CONSOLIDATED STATEMENTS OF STOCKHOLDERS’ EQUITY
Years Ended December 31, 2009, 2008 and 2007
| Common Shares Issued |
Common Stock |
Additional Paid-in Capital (1) |
Retained Earnings (1) |
Treasury Stock |
Total Stockholders’ Equity (1) |
||||||||||||||||||
| (In thousands) | |||||||||||||||||||||||
| Balances at December 31, 2006 |
90,299 | $ | 903 | $ | 386,201 | $ | 723,473 | — | $ | 1,110,577 | |||||||||||||
| Adoption of ASC 740-10 (formerly FIN 48) |
— | — | — | (643 | ) | — | (643 | ) | |||||||||||||||
| Exercise of stock options (Note 11) |
1,887 | 19 | 39,763 | — | — | 39,782 | |||||||||||||||||
| Shares issued through ESPP |
43 | — | 1,361 | — | — | 1,361 | |||||||||||||||||
| Issuance of restricted stock |
412 | 4 | — | — | — | 4 | |||||||||||||||||
| Forfeitures of restricted stock |
(23 | ) | — | — | — | — | — | ||||||||||||||||
| Common stock acquired |
— | — | — | — | (673,449 | ) | (673,449 | ) | |||||||||||||||
| Common stock retired |
(18,424 | ) | (184 | ) | (967 | ) | (672,298 | ) | 673,449 | — | |||||||||||||
| Stock-based compensation expense |
— | — | 18,039 | — | — | 18,039 | |||||||||||||||||
| Tax benefit for exercise of employee stock awards (Notes 8 and 11) |
— | — | 12,040 | — | — | 12,040 | |||||||||||||||||
| Effects of adoption of ASC 470-20 (Note 1) |
— | — | 70,308 | — | — | 70,308 | |||||||||||||||||
| Net income |
— | — | — | 224,489 | — | 224,489 | |||||||||||||||||
| Balances at December 31, 2007 |
74,194 | 742 | 526,745 | 275,021 | — | 802,508 | |||||||||||||||||
| Exercise of stock options (Note 11) |
612 | 6 | 10,077 | — | — | 10,083 | |||||||||||||||||
| Shares issued through ESPP |
56 | — | 1,285 | — | — | 1,285 | |||||||||||||||||
| Issuance of restricted stock |
561 | 6 | — | — | — | 6 | |||||||||||||||||
| Forfeitures of restricted stock |
(21 | ) | — | — | — | — | — | ||||||||||||||||
| Common stock acquired |
— | — | — | — | (35,211 | ) | (35,211 | ) | |||||||||||||||
| Common stock retired |
(1,009 | ) | (10 | ) | (52 | ) | (35,149 | ) | 35,211 | — | |||||||||||||
| Stock-based compensation expense |
— | — | 19,264 | — | — | 19,264 | |||||||||||||||||
| Tax benefit for exercise of employee stock awards (Notes 8 and 11) |
— | — | 3,098 | — | — | 3,098 | |||||||||||||||||
| Convertible debt permanent tax effect |
— | — | 27 | — | — | 27 | |||||||||||||||||
| Net income |
— | — | — | 227,266 | — | 227,266 | |||||||||||||||||
| Balances at December 31, 2008 |
74,393 | 744 | 560,444 | 467,138 | — | 1,028,326 | |||||||||||||||||
| Exercise of stock options (Note 11) |
1,935 | 19 | 54,814 | — | — | 54,833 | |||||||||||||||||
| Shares issued through ESPP |
62 | 1 | 1,181 | — | — | 1,182 | |||||||||||||||||
| Issuance of restricted stock |
1,142 | 11 | — | — | — | 11 | |||||||||||||||||
| Forfeitures of restricted stock |
(16 | ) | — | — | — | — | — | ||||||||||||||||
| Common stock acquired |
— | — | — | — | (343,250 | ) | (343,250 | ) | |||||||||||||||
| Common stock retired |
(12,164 | ) | (121 | ) | (8,177 | ) | (334,952 | ) | 343,250 | — | |||||||||||||
| Stock-based compensation expense |
— | — | 25,516 | — | — | 25,516 | |||||||||||||||||
| Tax benefit for exercise of employee stock awards (Notes 8 and 11) |
— | — | 4,448 | — | — | 4,448 | |||||||||||||||||
| Tax effect of cancelled options |
— | — | (5,273 | ) | — | — | (5,273 | ) | |||||||||||||||
| Convertible debt permanent tax effect |
— | — | 26 | — | — | 26 | |||||||||||||||||
| Net income |
— | — | — | 136,096 | — | 136,096 | |||||||||||||||||
| Balances at December 31, 2009 |
65,352 | $ | 654 | $ | 632,979 | $ | 268,282 | $ | — | $ | 901,915 | ||||||||||||
| (1) | As adjusted Note 1 |
See accompanying notes to consolidated financial statements.
F-4
Table of Contents
LINCARE HOLDINGS INC. AND SUBSIDIARIES
CONSOLIDATED STATEMENTS OF CASH FLOWS
Years Ended December 31, 2009, 2008 and 2007
| 2009 | 2008 | 2007 | ||||||||||
| (In thousands) | ||||||||||||
| (As adjusted |
(As adjusted |
|||||||||||
| Cash flows from operating activities: |
||||||||||||
| Net income |
$ | 136,096 | $ | 227,266 | $ | 224,489 | ||||||
| Adjustments to reconcile net income to net cash provided by operating activities: |
||||||||||||
| Bad debt expense |
23,257 | 24,969 | 23,940 | |||||||||
| Depreciation and amortization expense |
118,120 | 117,527 | 116,280 | |||||||||
| Net (gain) loss on disposal of property and equipment |
(58 | ) | (55 | ) | 160 | |||||||
| Amortization of debt issuance costs |
1,769 | 2,377 | 5,646 | |||||||||
| Amortization of discount on bonds payable |
17,247 | 16,082 | 2,573 | |||||||||
| Stock-based compensation expense |
25,516 | 19,264 | 18,039 | |||||||||
| Deferred income taxes |
37,745 | 25,879 | 23,655 | |||||||||
| Excess tax benefit from stock-based compensation |
(39 | ) | (1,234 | ) | (4,988 | ) | ||||||
| Change in assets and liabilities net of effects of acquired businesses: |
||||||||||||
| Accounts receivable |
(5,990 | ) | (2,300 | ) | (52,307 | ) | ||||||
| Inventories |
(4,146 | ) | (352 | ) | (541 | ) | ||||||
| Prepaid and other assets |
(807 | ) | 1,286 | 749 | ||||||||
| Accounts payable |
(627 | ) | 730 | 11,002 | ||||||||
| Accrued expenses |
1,028 | 4,013 | 15,355 | |||||||||
| Income taxes payable |
4,013 | 3,634 | 22,115 | |||||||||
| Net cash provided by operating activities |
353,124 | 439,086 | 406,167 | |||||||||
| Cash flows from investing activities: |
||||||||||||
| Proceeds from sale of property and equipment |
132 | 19,784 | 13,052 | |||||||||
| Capital expenditures |
(110,091 | ) | (143,976 | ) | (142,898 | ) | ||||||
| Purchases of investments |
0 | (31,450 | ) | (249,180 | ) | |||||||
| Sales and maturities of investments |
1,750 | 69,300 | 150,930 | |||||||||
| Business acquisitions, net of cash acquired and purchase price |
(5,077 | ) | (22,028 | ) | (4,775 | ) | ||||||
| Net cash used in investing activities |
(113,286 | ) | (108,370 | ) | (232,871 | ) | ||||||
| Cash flows from financing activities: |
||||||||||||
| Proceeds from revolving credit line |
0 | 70,000 | 205,000 | |||||||||
| Proceeds from issuance of debt |
0 | 0 | 550,435 | |||||||||
| Payments revolving credit line |
0 | (80,000 | ) | (255,000 | ) | |||||||
| Payments of principal on debt and long-term obligations |
(4,813 | ) | (276,967 | ) | (9,053 | ) | ||||||
| Payments of debt issuance costs |
(63 | ) | (202 | ) | (10,732 | ) | ||||||
| Proceeds from exercise of stock options and issuance of common shares |
56,026 | 11,374 | 41,147 | |||||||||
| Excess tax benefit from stock-based compensation |
39 | 1,234 | 4,988 | |||||||||
| Payments to acquire treasury stock |
(343,250 | ) | (35,211 | ) | (673,449 | ) | ||||||
| Net cash used in financing activities |
(292,061 | ) | (309,772 | ) | (146,664 | ) | ||||||
| Net (decrease) increase in cash and cash equivalents |
(52,223 | ) | 20,944 | 26,632 | ||||||||
| Cash and cash equivalents, beginning of year |
72,651 | 51,707 | 25,075 | |||||||||
| Cash and cash equivalents, end of year |
$ | 20,428 | $ | 72,651 | $ | 51,707 | ||||||
| Supplemental disclosure of cash flow information: |
||||||||||||
| Cash paid for interest |
$ | 15,148 | $ | 20,903 | $ | 18,319 | ||||||
| Cash paid for income taxes |
$ | 51,069 | $ | 114,870 | $ | 102,333 | ||||||
| Supplemental disclosure of non-cash financing activities: |
||||||||||||
| Assets acquired under capital lease |
$ | — | $ | — | $ | 435 | ||||||
See accompanying notes to consolidated financial statements.
F-5
Table of Contents
LINCARE HOLDINGS INC. AND SUBSIDIARIES
NOTES TO CONSOLIDATED FINANCIAL STATEMENTS
December 31, 2009, 2008 and 2007
| (1) | Description of Business and Summary of Significant Accounting Policies |
| (a) | Description of Business |
Lincare Holdings Inc. and subsidiaries (the “Company”) provides oxygen, respiratory therapy services, infusion therapy services and home medical equipment such as hospital beds, wheelchairs and other medical supplies to the home health care market. The Company’s customers are serviced from locations in 48 states. The Company’s equipment and supplies are readily available and the Company is not dependent on a single supplier or even a few suppliers.
| (b) | Use of Estimates |
Management of the Company has made a number of estimates and assumptions relating to the reporting of assets and liabilities and the disclosure of contingent assets and liabilities to prepare these financial statements in conformity with U.S. generally accepted accounting principles. Actual results could differ from those estimates. It is at least reasonably possible that a change in those estimates will occur in the near term. The Company evaluated subsequent events after the balance sheet date of December 31, 2009 through the financial statement issuance date.
| (c) | Basis of Presentation |
The consolidated financial statements include the accounts of Lincare Holdings Inc. and its wholly-owned subsidiaries. All significant intercompany balances and transactions have been eliminated in consolidation. Certain amounts in the prior years’ financial statements have been reclassified to conform to the current year presentation.
| (d) | Revenue Recognition |
The Company’s revenues are recognized on an accrual basis in the period in which services and related products are provided to customers and are recorded at net realizable amounts estimated to be paid by customers and third-party payors. The Company’s billing system contains payor-specific price tables that reflect the fee schedule amounts in effect or contractually agreed upon by various government and commercial payors for services and each item of equipment or supply provided to a customer. The Company has established an allowance to account for sales adjustments that result from differences between the payment amount received and the expected realizable amount. Actual adjustments that result from differences between the payment amount received and the expected realizable amount are recorded against the allowance for sales adjustments and are typically identified and ultimately recorded at the point of cash application or when otherwise determined pursuant to the Company’s collection procedures. The Company reports revenues in its financial statements net of such adjustments.
Certain items provided by the Company are reimbursed under rental arrangements that generally provide for fixed monthly payments established by fee schedules for as long as the patient is using the equipment and medical necessity continues (subject to capped rental arrangements which limit the rental payment periods in some instances and which may result in a transfer of title to the equipment at the end of the rental payment period). Once initial delivery of rental equipment is made to the patient, a monthly billing cycle is established based on the initial date of delivery. The Company recognizes rental arrangement revenues ratably over the monthly service period and defers revenue for the portion of the monthly bill that is unearned. No separate payment is earned from the initial equipment delivery and setup process. During the rental period the Company is responsible for servicing the equipment and providing routine maintenance, if necessary.
F-6
Table of Contents
LINCARE HOLDINGS INC. AND SUBSIDIARIES
NOTES TO CONSOLIDATED FINANCIAL STATEMENTS—(Continued)
December 31, 2009, 2008 and 2007
| (1) | Description of Business and Summary of Significant Accounting Policies (Continued) |
The Company’s revenue recognition policy is consistent with the criteria set forth in Staff Accounting Bulletin 104—Revenue Recognition (“SAB 104”) for determining when revenue is realized or realizable and earned. The Company recognizes revenue in accordance with the requirements of SAB 104 that:
| • | persuasive evidence of an arrangement exists; |
| • | delivery has occurred; |
| • | the seller’s price to the buyer is fixed or determinable; and |
| • | collectibility is reasonably assured. |
Due to the nature of the industry and the reimbursement environment in which the Company operates, certain estimates are required to record net revenues and accounts receivable at their net realizable values at the time products and/or services are provided. Inherent in these estimates is the risk that they will have to be revised or updated as additional information becomes available. Specifically, the complexity of many third-party billing arrangements and the uncertainty of reimbursement amounts for certain services from certain payors may result in adjustments to amounts originally recorded. Such adjustments are typically identified and recorded by the Company at the point of cash application, claim denial or account review. Included in accounts receivable are earned but unbilled accounts receivable from earned revenues. Unbilled accounts receivable represent charges for equipment and supplies delivered to customers for which invoices have not yet been generated by the Company’s billing system. Prior to the delivery of equipment and supplies to customers, the Company performs certain certification and approval procedures to ensure collection is reasonably assured. Once the items are delivered, unbilled accounts receivable are recorded at net amounts expected to be paid by customers and third-party payors. Billing delays, generally ranging from several days to several weeks, can occur due to delays in obtaining certain required payor-specific documentation from internal and external sources, as well as interim transactions occurring between cycle billing dates established for each customer within the billing system, and business acquisitions awaiting assignment of new provider enrollment identification numbers. In the event that a third-party payor does not accept the claim, the customer is ultimately responsible for payment of the products or services. Accounts receivable are reported net of allowances for sales adjustments and uncollectible accounts. Sales adjustments are recorded against revenues and result from differences between the payment amount received and the expected realizable amount. Bad debt is recorded as an operating expense and consists of billed charges that are ultimately deemed uncollectible due to the customer’s or third-party payor’s inability or refusal to pay.
The Company performs analyses to evaluate the net realizable value of accounts receivable. Specifically, the Company considers historical realization data, accounts receivable aging trends, other operating trends and relevant business conditions. Because of continuing changes in the health care industry and third-party reimbursement, it is possible that the Company’s estimates could change, which could have a material impact on the Company’s results of operations and cash flows.
The Company accounts for taxes imposed on revenue producing transactions by government authorities on a net basis.
| (e) | Fair Value |
The Company determines fair value of assets and liabilities using a fair value hierarchy that distinguishes between market participant assumptions developed based on market data obtained from sources independent of
F-7
Table of Contents
LINCARE HOLDINGS INC. AND SUBSIDIARIES
NOTES TO CONSOLIDATED FINANCIAL STATEMENTS—(Continued)
December 31, 2009, 2008 and 2007
| (1) | Description of Business and Summary of Significant Accounting Policies (Continued) |
the reporting entity, and the reporting entity’s own assumptions about market participant assumptions developed based on the best information available in the circumstances.
Fair value is defined as the price that would be received to sell an asset or paid to transfer a liability (i.e. “the exit price”) in an orderly transaction between market participants at the measurement date.
The fair value hierarchy is broken down into three levels based on the reliability of inputs as follows:
| • | Level 1—Valuations based on quoted prices in active markets for identical instruments that the Company is able to access. Since valuations are based on quoted prices that are readily and regularly available in an active market, valuation of these products does not entail a significant degree of judgment. |
| • | Level 2—Valuations based on quoted prices in active markets for instruments that are similar, or quoted prices in markets that are not active for identical or similar instruments, and model-derived valuations in which all significant inputs and significant value drivers are observable in active markets. |
| • | Level 3—Valuations based on inputs that are unobservable and significant to the overall fair value measurement. |
Refer to Note 2 for the Fair Value of Assets and Liabilities.
| (f) | Business Acquisition Accounting |
We apply the acquisition method of accounting for business acquisitions, and use available cash from operations, borrowings under our revolving credit agreement and the assumption of certain liabilities as the consideration for business acquisitions. We allocate the purchase price of our business acquisitions based on the fair value of identifiable tangible and intangible assets. The difference between the total cost of the acquisition and the sum of the fair values of acquired tangible and identifiable intangible assets less liabilities is recorded as goodwill.
| (g) | Cash and Cash Equivalents |
For purposes of the statements of cash flows, the Company considers all short-term investments with an original maturity of less than three months to be cash equivalents.
| (h) | Investments |
At December 31, 2009, the Company held $54.2 million of auction rate securities (“ARS”). These securities are variable-rate debt instruments with contractual maturities between the years 2020 and 2041 with interest rates that reset every seven or 35 days pursuant to a bidding process as determined by the underlying security indentures. The investments are classified as trading securities and are carried at fair value, with any realized and unrealized gains and losses included in other income and expense.
All of the auction rate securities held as of December 31, 2009, are secured by pools of student loans guaranteed by state-designated guaranty agencies or monoline insurers or reinsured by the United States government. The auction rate securities held by the Company are senior obligations under the applicable
F-8
Table of Contents
LINCARE HOLDINGS INC. AND SUBSIDIARIES
NOTES TO CONSOLIDATED FINANCIAL STATEMENTS—(Continued)
December 31, 2009, 2008 and 2007
| (1) | Description of Business and Summary of Significant Accounting Policies (Continued) |
indentures authorizing the issuance of such securities. Recent turmoil in the credit markets has resulted in widespread failures to attract demand for such securities at the periodic auction dates occurring subsequent to December 31, 2007. As of December 31, 2009, all of the securities held by the Company continued to experience auction failures, resulting in the Company continuing to hold such securities. The Company received partial redemptions of these securities, at par, in the amount of $3.1 million in January 2010.
The auction rate securities owned by the Company were purchased from UBS Financial Services, Inc., a subsidiary of UBS AG (“UBS”), and are held by UBS for the benefit of the Company. On August 8, 2008, UBS announced a settlement in principle with the Securities and Exchange Commission, the New York Attorney General and other state regulatory agencies to restore liquidity to remaining clients who hold auction rate securities. In November 2008, the Company accepted an offer (the “UBS Put Option”) from UBS to sell to it at par value all of the Company’s remaining auction rate securities in accordance with the terms of the settlement agreement. Under the settlement agreement, the Company will be able to redeem all of its auction rate securities at par during a two-year time period beginning June 30, 2010, while UBS may purchase all or some of the auction rate securities at par from the Company at any time through July 2, 2012. The Company elected to measure the UBS Put Option under the fair value option using a discounted cash flow approach that takes into account certain estimates for interest rates and the timing and amount of expected future cash flows, adjusted for any bearer risk associated with UBS’s financial ability to repurchase the ARS beginning June 30, 2010. These assumptions are volatile and subject to change as the underlying sources of these assumptions and market conditions change. The Company anticipates that any future changes in the fair value of the UBS Put Option will be offset by the changes in the fair value of the related auction rate securities with no material net impact to the consolidated statements of operations. The UBS Put Option will continue to be measured at fair value until the earlier of its maturity or exercise, with any realized and unrealized gains and losses included in other income and expense. At December 31, 2009, the estimated fair value of the UBS Put Option was $4.4 million.
| (i) | Financial Instruments |
The Company believes that the book values of its cash equivalents, investments, accounts receivable, income taxes receivable, accounts payable and accrued expenses approximate fair value due to the short-term maturities of these instruments.
| (j) | Inventories |
Inventories, consisting of equipment, supplies and replacement parts, are stated at the lower of cost or market value. Cost is determined using the first-in, first-out (FIFO) method. These finished goods are charged to cost of goods and services in the period in which products and related services are provided to customers.
| (k) | Property and Equipment |
Property and equipment is stated at cost. Depreciation on property and equipment is calculated using the straight-line method, over the estimated useful lives of the assets as set forth in the table below.
| Building and improvements |
1 year to 39 years | |
| Medical rental equipment |
1.5 years to 11 years | |
| Other equipment and furniture |
3 years to 25 years |
F-9
Table of Contents
LINCARE HOLDINGS INC. AND SUBSIDIARIES
NOTES TO CONSOLIDATED FINANCIAL STATEMENTS—(Continued)
December 31, 2009, 2008 and 2007
| (1) | Description of Business and Summary of Significant Accounting Policies (Continued) |
Leasehold improvements are amortized using the straight-line method over the lesser of the lease term or estimated useful life of the asset. Amortization of leasehold improvements is included with depreciation expense.
| (l) | Goodwill |
Goodwill results from the excess of cost over identifiable net assets of acquired businesses.
The Company performs a goodwill impairment test using a two-step method on an annual basis or whenever events or circumstances indicate that the carrying value may not be recoverable. For the purposes of that assessment, we have determined that the Company has a single reporting unit.
The first step of the impairment analysis compares the Company’s fair value to its net book value to determine if there is an indicator of impairment. If the assessment in the first step indicates impairment then the Company performs step two. The second step compares the implied fair value of goodwill to its carrying amount in a manner similar to a purchase price allocation for a business combination. If the carrying amount of goodwill exceeds its implied fair value, an impairment loss is recognized equal to that excess.
The Company evaluates its fair value using two different approaches. The first approach utilizes the closing market price of its common stock at the annual impairment testing date and the number of shares of common stock outstanding on that date.
The second approach utilizes a discounted cash flow projection which is based on assumptions that are consistent with the Company’s best estimates of future growth and the strategic plan used to manage the underlying business. Factors requiring significant judgment include the future cash flows, growth rates, discount factors and tax rates, amongst other considerations. Changes in economic and operating conditions impacting these assumptions could result in goodwill impairment in future periods.
The Company completed the annual impairment test during the third quarter of 2009 and determined that no impairment existed as of the date of the impairment test. No recent events or circumstances have occurred to indicate that impairment may exist.
| (m) | Other Assets |
Other assets principally include capitalized costs of borrowing which are being amortized over the term of the respective debt on the effective interest method.
| (n) | Impairment or Disposal of Long-Lived Assets |
Long-lived assets, such as property and equipment, and purchased intangibles subject to amortization, are reviewed for impairment whenever events or changes in circumstances indicate that the carrying amount of an asset may not be recoverable. Recoverability of assets to be held and used is measured by a comparison of the carrying amount of an asset to estimated undiscounted future cash flows expected to be generated by the asset. If the carrying amount of an asset exceeds its estimated undiscounted future cash flows, an impairment charge is recognized by the amount by which the carrying amount of the asset exceeds the fair value of the asset. Assets to
F-10
Table of Contents
LINCARE HOLDINGS INC. AND SUBSIDIARIES
NOTES TO CONSOLIDATED FINANCIAL STATEMENTS—(Continued)
December 31, 2009, 2008 and 2007
| (1) | Description of Business and Summary of Significant Accounting Policies (Continued) |
be disposed of would be separately presented in the balance sheet and reported at the lower of the carrying amount or fair value less costs to sell, and are no longer depreciated. The assets and liabilities of a disposal group classified as held for sale would be presented separately in the appropriate asset and liability sections of the balance sheet.
In addition to consideration of impairment upon the events or changes in circumstances described above, management regularly evaluates the remaining lives of its long-lived assets. If estimates are revised, the carrying value of affected assets is depreciated or amortized over the remaining lives. We did not recognize an impairment charge related to our long-lived assets during 2009, 2008 and 2007.
| (o) | Income Taxes |
Income taxes are accounted for under the asset and liability method. Deferred tax assets and liabilities are recognized for the future tax consequences attributable to differences between the financial statement carrying amounts of existing assets and liabilities and their respective tax bases and operating loss and credit carryforwards. Deferred tax assets and liabilities are measured using enacted tax rates expected to apply to taxable income in the years in which those temporary differences are expected to be recovered or settled. The effect on deferred tax assets and liabilities of a change in tax rate is recognized in income in the period that includes the enactment date.
Valuation allowances are established when necessary to reduce deferred tax assets to amounts that the Company believes are more likely than not to be recovered. The Company evaluates its deferred tax assets quarterly to determine whether adjustments to its valuation allowance are appropriate. In making its evaluation, the Company relies on its recent history of pre-tax earnings, estimated timing of future deductions and benefits represented by the deferred tax assets and its forecast of future earnings, the latter two of which involve the exercise of significant judgment.
The Company recognizes the effect of income tax positions only if those positions are more likely than not of being sustained. Recognized income tax positions are measured at the largest amount that is greater than 50% likely of being realized. Changes in recognition or measurement are reflected in the period in which the change in judgment occurs.
The Company recognizes interest and penalties related to unrecognized tax benefits within the income tax expense line in the accompanying consolidated statements of operations. Accrued interest and penalties are included within the related tax liability line in the consolidated balance sheet.
| (p) | Advertising Costs |
Advertising costs are charged to expense as incurred and are included in selling expenses.
| (q) | Cost of Goods and Services |
Cost of goods and services includes the cost of equipment (excluding depreciation of $105.8 million, $104.4 million and $102.2 million in 2009, 2008 and 2007, respectively), drugs and supplies sold to patients and certain operating costs related to the Company’s respiratory drug product line. These costs include an allocation of customer service, distribution and administrative costs relating to the respiratory drug product line of approximately $51.3 million, $47.5 million and $48.8 million in 2009, 2008 and 2007, respectively. Included in cost of goods and services are salary and related expenses of pharmacists and pharmacy technicians of $11.7 million, $11.7 million and $10.5 million in 2009, 2008 and 2007, respectively.
F-11
Table of Contents
LINCARE HOLDINGS INC. AND SUBSIDIARIES
NOTES TO CONSOLIDATED FINANCIAL STATEMENTS—(Continued)
December 31, 2009, 2008 and 2007
| (1) | Description of Business and Summary of Significant Accounting Policies (Continued) |
| (r) | Operating Expenses |
The Company manages over 1,000 operating centers from which customers are provided equipment, supplies and services. An operating center averages approximately seven to eight employees and is typically comprised of a center manager, two customer service representatives (referred to as “CSR’s”—telephone intake, scheduling, documentation), two or three service representatives (referred to as “Service Reps”—delivery, maintenance and retrieval of equipment and delivery of disposables), a respiratory therapist (non-reimbursable and discretionary clinical follow-up with the customer and communication to the prescribing physician) and a sales representative (marketing calls to local physicians and other referral sources).
The Company includes in operating expenses the costs incurred at the Company’s operating centers for certain service personnel (center manager, CSR’s and Service Reps), facilities (rent, utilities, communications, property taxes, etc.), vehicles (vehicle leases, gasoline, repair and maintenance), and general business supplies and miscellaneous expenses. Operating expenses for the years ended December 31, 2009, 2008 and 2007 within these major categories were as follows:
| Operating Expenses (in thousands) | Year Ended December 31, | ||||||||
| 2009 | 2008 | 2007 | |||||||
| Salary and related |
$ | 258,364 | $ | 250,970 | $ | 232,579 | |||
| Facilities |
58,187 | 57,605 | 55,617 | ||||||
| Vehicles |
42,850 | 52,678 | 45,120 | ||||||
| General supplies/miscellaneous |
30,358 | 34,453 | 31,700 | ||||||
| Total |
$ | 389,759 | $ | 395,706 | $ | 365,016 | |||
Included in operating expenses during the year ended December 31, 2009 are salary and related expenses for Service Reps in the amount of $104.6 million. Such salary and related expenses for the years ended December 31, 2008 and 2007 were $108.9 million and $100.0 million, respectively.
| (s) | Lease Commitments |
The Company leases office space, vehicles and equipment under non-cancelable operating leases, which expire at various dates through 2014. The Company’s operating leases generally have one to four year terms and may have renewal options. The Company records rent expense and amortization of leasehold improvements on a straight-line basis over the initial term of the lease and the Company does not negotiate rent holidays, rent concessions or leasehold improvements in its office leases.
The lease period is determined as the original lease term without renewals, unless and until the exercise of lease renewal options is reasonably assured.
| (t) | Selling, General and Administrative Expenses |
Selling, general and administrative expenses (“SG&A”) include costs related to sales and marketing activities, corporate overhead and other business support functions. Included in SG&A during the years ended December 31, 2009, 2008 and 2007 are salary and related expenses of $257.4 million, $238.4 million and $226.2 million, respectively. These salary and related expenses include the cost of the Company’s respiratory therapists
F-12
Table of Contents
LINCARE HOLDINGS INC. AND SUBSIDIARIES
NOTES TO CONSOLIDATED FINANCIAL STATEMENTS—(Continued)
December 31, 2009, 2008 and 2007
| (1) | Description of Business and Summary of Significant Accounting Policies (Continued) |
in the amount of $66.0 million, $66.4 million and $63.0 million during the respective periods. The Company’s respiratory therapists generally provide non-reimbursable and discretionary clinical follow-up with the customer and communication, as appropriate, to the prescribing physician with respect to the customer’s plan of care. The Company includes the salaries and related expenses of its respiratory therapist personnel (licensed respiratory therapists or, in some cases, registered nurses) in SG&A because it believes that these personnel enhance the Company’s business relative to its competitors that do not employ respiratory therapists.
| (u) | Employee Benefit Plans |
The Company has a defined contribution plan covering substantially all employees subject to specific plan requirements. The Company also sponsors an employee stock purchase plan that enables eligible employees to purchase shares of the Company’s common stock at the lower of 85 percent of the fair market value of the Company’s stock price on: (i) the last day of the offering period; or (ii) the last day of the prior offering period. Employees were able to elect to have up to 10% of their base salary withheld on an after-tax basis. Under the employee stock purchase plan, 1.2 million shares were authorized for issuance. To date, 605,420 shares have been issued under this authorization. During 2009, the Company issued 62,260 shares at an average price of $19.19; during 2008, the Company issued 56,508 shares at an average price of $23.07; and during 2007, the Company issued 43,767 shares at an average price of $31.22 per share.
| (v) | Stock Plans |
The Company has multiple stock-based employee compensation plans, which are described more fully in Note 11.
| (w) | Segment Information |
The Company provides home health care equipment and services through 1,056 operating centers in 48 states. The Company’s operating centers exhibit similar long-term financial performance and have similar economic characteristics, having similar products and services, types of customers and methods used to distribute their products and services. The Company believes it meets the criteria for aggregating its operating segments into a single reporting segment based on the provisions of ASC 280, “Segment Reporting.”
| (x) | Contingencies |
The Company is involved in certain claims and legal matters arising in the ordinary course of its business. The Company evaluates and records liabilities for contingencies based on known claims and legal actions when it is probable a liability has been incurred and the liability can be reasonably estimated.
| (y) | Concentration of Credit Risk |
The Company’s revenues are generated through 1,056 locations in 48 states. The Company generally does not require collateral or other security in extending credit to its customers; however, the Company routinely obtains assignment of (or is otherwise entitled to receive) benefits receivable under the health insurance programs, plans or policies covering its customers. Included in the Company’s net revenues is reimbursement from government sources under Medicare, Medicaid and other federally funded programs, which aggregated approximately 60% of net revenues in 2009 and 2008 and 64% of net revenues in 2007.
F-13
Table of Contents
LINCARE HOLDINGS INC. AND SUBSIDIARIES
NOTES TO CONSOLIDATED FINANCIAL STATEMENTS—(Continued)
December 31, 2009, 2008 and 2007
| (1) | Description of Business and Summary of Significant Accounting Policies (Continued) |
| (z) | Comprehensive Income |
The objective for the reporting and display of comprehensive income and its components in the Company’s consolidated financial statements is to report a measure (comprehensive income (loss)) of all changes in equity of an enterprise that result from transactions and other economic events in a period other than transactions with owners.
The Company’s comprehensive income is the same as reported net income for all periods presented.
| (aa) | Change in Accounting Principle |
In May 2008, the Financial Accounting Standards Board (“FASB”) issued updated guidance for the accounting of convertible debt included in the Codification in ASC 470-20, “Debt with Conversion and Other Options,” which specifies that issuers of convertible debt instruments that may be settled in cash upon conversion should separately account for the liability and equity components in a manner that will reflect the entity’s nonconvertible debt borrowing rate when interest cost is recognized in subsequent periods. Upon adoption, the debt component of such instrument would be recognized by measuring the fair value of a similar liability that does not have an associated equity component. The equity component of such instrument would be recognized as the difference between the proceeds from the issuance of the note and the fair value of the liability component. The resulting debt discount (equal to the proceeds allocated to the equity component) is accreted over the expected life of the debt. The guidance was effective for financial statements issued for fiscal years beginning after December 15, 2008, and interim periods within those fiscal years. The Company adopted ASC 470-20 effective January 1, 2009 on a retrospective basis to October 31, 2007, the issuance date of the convertible debt. Refer to Note 7 to the consolidated financial statements for further discussion of the convertible debentures to which the guidance applies.
The change in accounting principle has been applied retrospectively by adjusting the financial statement amounts for the prior periods presented to reflect liability and equity components in a manner that reflects Lincare’s nonconvertible debt borrowing rate when interest cost is recognized in periods subsequent to the issuance date of the convertible instruments. The cumulative effect of this change in accounting principle was a $1.6 million reduction to retained earnings at January 1, 2008.
The following table details the retrospective application impact on previously reported amounts:
CONSOLIDATED BALANCE SHEETS:
| December 31, 2008 | ||||||
| As reported | As adjusted | |||||
| (In thousands) | ||||||
| Other assets, noncurrent |
$ | 12,980 | $ | 11,249 | ||
| Long-term obligations, excluding current installments |
550,013 | 454,045 | ||||
| Deferred income taxes and other taxes |
253,267 | 288,696 | ||||
| Additional paid-in capital |
490,109 | 560,444 | ||||
| Retained earnings |
478,665 | 467,138 | ||||
F-14
Table of Contents
LINCARE HOLDINGS INC. AND SUBSIDIARIES
NOTES TO CONSOLIDATED FINANCIAL STATEMENTS—(Continued)
December 31, 2009, 2008 and 2007
| (1) | Description of Business and Summary of Significant Accounting Policies (Continued) |
CONSOLIDATED STATEMENTS OF OPERATIONS:
| For the year ended | For the year ended | |||||||||||
| December 31, 2008 As reported |
December 31, 2008 As adjusted |
December 31, 2007 As reported |
December 31, 2007 As adjusted | |||||||||
| (In thousands, except per share data) | ||||||||||||
| Interest expense |
$ | 23,920 | $ | 39,644 | $ | 26,543 | $ | 29,056 | ||||
| Income before income taxes |
381,268 | 365,544 | 360,668 | 358,155 | ||||||||
| Income tax expense |
144,063 | 138,278 | 134,591 | 133,666 | ||||||||
| Net income |
237,205 | 227,266 | 226,077 | 224,489 | ||||||||
| Basic—earnings per common share |
3.25 | 3.11 | 2.71 | 2.69 | ||||||||
| Diluted—earnings per common share |
3.17 | 3.04 | 2.58 | 2.56 | ||||||||
Cash flows from operating activities were not impacted by the retrospective application of ASC 470-20.
| (2) | Fair Value of Assets and Liabilities |
Fair value is defined as the price that would be received to sell an asset or paid to transfer a liability (i.e. “the exit price”) in an orderly transaction between market participants at the measurement date. In determining fair value, the Company uses various valuation approaches, including quoted market prices and discounted cash flows. A hierarchy for inputs used in measuring fair value that maximizes the use of observable inputs and minimizes the use of unobservable inputs by requiring that the most observable inputs be used when available. Observable inputs are inputs that market participants would use in pricing the asset or liability developed based on market data obtained from independent sources. Unobservable inputs are inputs that reflect a company’s judgment concerning the assumptions that market participants would use in pricing the asset or liability developed based on the best information available under the circumstances. The fair value hierarchy is broken down into three levels based on the reliability of inputs as follows:
— Level 1—Valuations based on quoted prices in active markets for identical instruments that the Company is able to access. Since valuations are based on quoted prices that are readily and regularly available in an active market, valuation of these products does not entail a significant degree of judgment.
— Level 2—Valuations based on quoted prices in active markets for instruments that are similar, or quoted prices in markets that are not active for identical or similar instruments, and model-derived valuations in which all significant inputs and significant value drivers are observable in active markets.
— Level 3—Valuations based on inputs that are unobservable and significant to the overall fair value measurement.
The Company utilizes Level 3 fair value measurements to value its investments in auction rate securities (“ARS”) consisting of securities collateralized by student loans, a related put option and acquisition related contingent consideration.
To the extent that valuation is based on models or inputs that are less observable or unobservable in the market, the determination of fair value requires more judgment. Accordingly, the Company’s degree of judgment exercised in determining fair value is greatest for instruments categorized in Level 3. In certain cases, the inputs used to measure fair value may fall into different levels of the fair value hierarchy. In such cases an asset or liability is classified in its entirety based on the lowest level of input that is significant to the measurement of fair value.
F-15
Table of Contents
LINCARE HOLDINGS INC. AND SUBSIDIARIES
NOTES TO CONSOLIDATED FINANCIAL STATEMENTS—(Continued)
December 31, 2009, 2008 and 2007
| (2) | Fair Value of Assets and Liabilities (Continued) |
Fair value is a market-based measure considered from the perspective of a market participant who holds the asset or owes the liability rather than an entity-specific measure. Therefore, even when market assumptions are not readily available, the Company’s own assumptions are set to reflect those that market participants would use in pricing the asset or liability at the measurement date. The Company uses prices and inputs that are current as of the measurement date, including periods of market dislocation, such as the recent illiquidity in the auction rate securities market. In periods of market dislocation, the observability of prices and inputs may be reduced for many instruments. This condition has caused, and in the future may cause, the Company’s financial instruments to be reclassified from Level 1 to Level 2 or from Level 2 to Level 3.
Valuation techniques used by the Company must be consistent with at least one of the three possible approaches: the market approach, income approach and/or cost approach. The Company’s Level 3 valuations of auction rate securities and acquisition-related contingent consideration are based on the income approach, specifically, discounted cash flow analyses which utilize significant inputs based on the Company’s estimates and assumptions. Inputs include current coupon rates and expected maturity dates. The Company’s Level 3 valuation of the UBS Put Option (see Note 3, Investments) uses a discounted cash flow approach that takes into account certain estimates for interest rates and the timing and amount of expected future cash flows, adjusted for any bearer risk associated with UBS’s financial ability to repurchase the ARS beginning June 30, 2010. These assumptions are volatile and subject to change as the underlying sources of these assumptions and market conditions change.
We estimated the fair value of the acquisition-related contingent consideration using a probability-weighted discounted cash flow model. This fair value measurement is based on significant inputs not observed in the market and thus represents a Level 3 measurement as defined by ASC 820, “Fair Value Measurements and Disclosures”. Level 3 instruments are valued based on unobservable inputs that are supported by little or no market activity and reflect our own assumptions in measuring fair value. The fair value of the contingent consideration arrangement was estimated by applying the income approach.
The contingent consideration arrangement requires Lincare to pay the former owners 30% of “adjusted EBITDA” during the measurement period. “Adjusted EBITDA” is defined in the asset purchase agreement as operating income less depreciation and amortization expenses subject to various adjustments. The potential undiscounted amount of all future payments that the Company could be required to make under the contingent consideration arrangement is between $0 and $10.0 million. Key assumptions to the valuation include (a) a discount rate range of 20 percent and (b) a probability adjusted level of “adjusted EBITDA” of between $21.9 million and $33.3 million during the measurement period.
The fair value of the acquisition-related contingent consideration to be distributed directly to the selling shareholders was originally estimated at the acquisition date to be $6.1 million. At December 31, 2009, the amount recognized for the contingent consideration arrangement, the range of outcomes, and the assumptions used to develop the estimates had not materially changed.
F-16
Table of Contents
LINCARE HOLDINGS INC. AND SUBSIDIARIES
NOTES TO CONSOLIDATED FINANCIAL STATEMENTS—(Continued)
December 31, 2009, 2008 and 2007
| (2) | Fair Value of Assets and Liabilities (Continued) |
The following tables present the valuation of the Company’s financial assets and financial liabilities as of December 31, 2009 and 2008, measured at fair value on a recurring basis using significant unobservable inputs (Level 3):
Fair value measurement at December 31, 2009:
| Significant Unobservable Inputs (Level 3) | |||
| (In thousands) | |||
| Assets |
|||
| Short-term investments—trading securities |
$ | 54,215 | |
| Short-term investments—UBS Put Option |
4,435 | ||
| Total |
$ | 58,650 | |
| Significant Unobservable Inputs (Level 3) |
||||
| (In thousands) | ||||
| Liabilities |
||||
| Acquisition-related contingent consideration—short-term |
$ | 276 | (1) | |
| Acquisition-related contingent consideration—long-term |
5,794 | (2) | ||
| Total |
$ | 6,070 | ||
| (1) | Included in current installments of long-term obligations on the accompanying condensed consolidated balance sheets. |
| (2) | Included in long-term obligations, excluding current installments on the accompanying condensed consolidated balance sheets. |
Fair value measurement at December 31, 2008:
| Significant Unobservable Inputs (Level 3) | |||
| (In thousands) | |||
| Assets |
|||
| Long-term investments—trading securities |
$ | 49,574 | |
| Long-term investments—UBS Put Option |
10,826 | ||
| Total |
$ | 60,400 | |
F-17
Table of Contents
LINCARE HOLDINGS INC. AND SUBSIDIARIES
NOTES TO CONSOLIDATED FINANCIAL STATEMENTS—(Continued)
December 31, 2009, 2008 and 2007
| (2) | Fair Value of Assets and Liabilities (Continued) |
The following table presents the changes in the estimated fair values of the Company’s financial assets and liabilities that are measured using significant unobservable inputs (Level 3) for the years ended December 31, 2009 and 2008:
| Significant Unobservable Inputs (Level 3) |
||||
| (In thousands) | ||||
| Assets |
||||
| Balance on December 31, 2007 |
$ | 98,250 | ||
| Unrealized loss—trading securities included in earnings |
(10,826 | ) | ||
| Recognition of UBS Put Option included in earnings |
10,826 | |||
| Redemptions at par |
(37,850 | ) | ||
| Balance on December 31, 2008 |
60,400 | |||
| Unrealized gain—trading securities included in earnings |
6,392 | |||
| Unrealized loss—UBS Put Option included in earnings |
(6,392 | ) | ||
| Redemptions at par |
(1,750 | ) | ||
| Balance on December 31, 2009 |
$ | 58,650 | ||
Fair Value of Financial Instruments
The Company believes that the book values of its cash equivalents, investments, accounts receivable, income taxes receivable, accounts payable and accrued expenses approximate fair value. The Company utilizes Level 3 fair value measurements to value its investments and acquisition-related contingent considerations. The book value of the Company’s revolving credit agreement and deferred acquisition obligations approximate their fair value as the applicable interest rates approximate rates at which similar types of borrowing arrangements could be currently obtained by the Company. The fair value of the Company’s 2.75% Series A Debentures due 2037 and 2.75% Series B Debentures due 2037 are estimated based on several standard market variables, including the Company’s stock price, yield to put/call through conversion and yield to maturity. The estimated fair values of the Series A and Series B Debentures at December 31, 2009 were $291,170,000 and $289,437,500, respectively, and $230,802,000 and $213,309,250, respectively, at December 31, 2008.
| (3) | Investments |
At December 31, 2009, the Company held $54.2 million of auction rate securities (“ARS”). These securities are variable-rate debt instruments with contractual maturities between the years 2020 and 2041 with interest rates that reset every seven or 35 days pursuant to a bidding process as determined by the underlying security indentures. The investments are classified as trading securities and are carried at fair value, with any realized and unrealized gains and losses included in other income and expense. The change in valuations for the ARS and UBS Put option had no effect on the Consolidated Statements of Operations for each of the two years ended December 31, 2009 and 2008.
All of the auction rate securities held as of December 31, 2009, are secured by pools of student loans guaranteed by state-designated guaranty agencies or monoline insurers or reinsured by the United States government. The auction rate securities held by the Company are senior obligations under the applicable
F-18
Table of Contents
LINCARE HOLDINGS INC. AND SUBSIDIARIES
NOTES TO CONSOLIDATED FINANCIAL STATEMENTS—(Continued)
December 31, 2009, 2008 and 2007
| (3) | Investments (Continued) |
indentures authorizing the issuance of such securities. Recent turmoil in the credit markets has resulted in widespread failures to attract demand for such securities at the periodic auction dates occurring subsequent to December 31, 2007. As of December 31, 2009, all of the securities held by the Company continued to experience auction failures, resulting in the Company continuing to hold such securities. The Company received partial redemptions of these securities, at par, in the amount of $3.1 million in January 2010.
The auction rate securities owned by the Company were purchased from UBS Financial Services, Inc., a subsidiary of UBS AG (“UBS”), and are held by UBS for the benefit of the Company. On August 8, 2008, UBS announced a settlement in principle with the Securities and Exchange Commission, the New York Attorney General and other state regulatory agencies to restore liquidity to remaining clients who hold auction rate securities. In November 2008, the Company accepted an offer (the “UBS Put Option”) from UBS to sell to it at par value all of the Company’s remaining auction rate securities in accordance with the terms of the settlement agreement. Under the settlement agreement, the Company will be able to redeem all of its auction rate securities at par during a two-year time period beginning June 30, 2010, while UBS may purchase all or some of the auction rate securities at par from the Company at any time through July 2, 2012. The Company elected to measure the UBS Put Option under the fair value option using a discounted cash flow approach that takes into account certain estimates for interest rates and the timing and amount of expected future cash flows, adjusted for any bearer risk associated with UBS’s financial ability to repurchase the ARS beginning June 30, 2010. These assumptions are volatile and subject to change as the underlying sources of these assumptions and market conditions change. The Company anticipates that any future changes in the fair value of the UBS Put Option will be offset by the changes in the fair value of the related auction rate securities with no material net impact to the consolidated statements of operations. The fair value option enables some companies to reduce the volatility in reported earnings caused by measuring related assets and liabilities differently without applying complex hedge accounting to achieve similar results. The UBS Put Option will continue to be measured at fair value until the earlier of its maturity or exercise, with any realized and unrealized gains and losses included in other income and expense. At December 31, 2009, the estimated fair value of the UBS Put Option was $4.4 million.
During the year ended December 31, 2009, the Company recognized a $6.4 million unrealized gain on the ARS recorded to other income, and recorded a corresponding increase to short-term investments. This was offset by recognizing a $6.4 million unrealized loss on the UBS Put Option recorded to other expense, and recorded a corresponding decrease to short-term investments.
| (4) | Accounts Receivable, Net |
Accounts receivable at December 31, 2009 and 2008 consist of:
| 2009 | 2008 | |||||||
| (In thousands) | ||||||||
| Trade Accounts Receivable |
$ | 201,102 | $ | 223,868 | ||||
| Less allowance for sales adjustments and uncollectible accounts |
(41,560 | ) | (47,071 | ) | ||||
| Accounts receivable, net |
$ | 159,542 | $ | 176,797 | ||||
F-19
Table of Contents
LINCARE HOLDINGS INC. AND SUBSIDIARIES
NOTES TO CONSOLIDATED FINANCIAL STATEMENTS—(Continued)
December 31, 2009, 2008 and 2007
| (5) | Property and Equipment, Net |
Property and equipment at December 31, 2009 and 2008 consist of:
| 2009 | 2008 | |||||||
| (In thousands) | ||||||||
| Land and improvements |
$ | 3,111 | $ | 3,111 | ||||
| Building and improvements |
23,384 | 22,879 | ||||||
| Medical rental equipment |
873,553 | 800,408 | ||||||
| Equipment, furniture and other |
180,358 | 176,105 | ||||||
| 1,080,406 | 1,002,503 | |||||||
| Less accumulated depreciation |
(741,156 | ) | (654,643 | ) | ||||
| Property and equipment, net |
$ | 339,250 | $ | 347,860 | ||||
Depreciation of medical rental equipment was approximately $105.8 million in 2009, $104.4 million in 2008 and $102.2 million in 2007. Accumulated depreciation of medical rental equipment at December 31, 2009 and 2008 was $622.9 million and $548.1 million, respectively.
| (6) | Leases |
The Company entered into a three-year capital lease in 2007 covering computer equipment with an outstanding balance of $12.7 thousand at December 31, 2009. The book value of the underlying equipment is included in Property and Equipment as follows:
| 2009 | 2008 | |||||||
| (In thousands) | ||||||||
| Equipment, furniture and other |
$ | 1,250 | $ | 1,250 | ||||
| Less accumulated depreciation |
(951 | ) | (701 | ) | ||||
| $ | 299 | $ | 549 | |||||
Amortization of assets held under capital leases of $0.2 million, $0.6 million and $1.0 million in 2009, 2008 and 2007, respectively, is included in depreciation and amortization expense in the accompanying consolidated statements of operations.
The Company has noncancelable lease obligations, primarily for buildings, office equipment and vehicles, that expire over the next six years and may provide for renewal options for periods ranging from one year to three years and that require the Company to pay ancillary costs such as maintenance and insurance. Operating lease expense was approximately $52.5 million in 2009, $52.0 million in 2008 and $51.7 million in 2007. Future minimum lease payments under capital leases and noncancelable operating leases as of December 31, 2009, are as follows:
| Capital leases |
Operating leases | |||||
| (In thousands) | ||||||
| 2010 |
$ | 13 | $ | 49,677 | ||
| 2011 |
— | 34,860 | ||||
| 2012 |
— | 19,278 | ||||
| 2013 |
— | 5,773 | ||||
| 2014 |
— | 1,503 | ||||
| Thereafter |
— | 499 | ||||
| Total minimum lease payments |
$ | 13 | $ | 111,590 | ||
F-20
Table of Contents
LINCARE HOLDINGS INC. AND SUBSIDIARIES
NOTES TO CONSOLIDATED FINANCIAL STATEMENTS—(Continued)
December 31, 2009, 2008 and 2007
| (7) | Long-Term Obligations |
Long-term obligations at December 31, 2009 and 2008 consist of:
| 2009 | 2008 | |||||||
| (In thousands) | ||||||||
| (As adjusted |
||||||||
| Convertible debt to mature in 2037, bearing fixed interest of 2.75%, with a put/call option in 2012 |
$ | 275,000 | $ | 275,000 | ||||
| Original issue discount |
(28,814 | ) | (37,728 | ) | ||||
| Convertible debt to mature in 2037, bearing fixed interest of 2.75%, with a put/call option in 2014 |
275,000 | 275,000 | ||||||
| Original issue discount |
(49,907 | ) | (58,240 | ) | ||||
| Other long-term liabilities |
5,031 | — | ||||||
| Capital lease obligations due through 2010 |
13 | 163 | ||||||
| Unsecured acquisition obligations and contingent consideration, net of imputed interest, payable in various installments through 2011 |
8,548 | 6,752 | ||||||
| Total long-term obligations |
484,871 | 460,947 | ||||||
| Less: current installments |
2,767 | 6,902 | ||||||
| Long-term obligations, excluding current installments |
$ | 482,104 | $ | 454,045 | ||||
The Company’s revolving credit agreement with several lenders and Bank of America N.A. as agent, dated December 1, 2006, permits the Company to borrow amounts up to $390.0 million under a five-year revolving credit facility. The five-year revolving credit facility contains a $60.0 million letter of credit sub-facility, which reduces the principal amount available under the five-year revolving credit facility by the amount of outstanding letters of credit on the sub-facility. As of December 31, 2009 and 2008, there were no borrowings outstanding on the five-year credit facility and $33.6 million and $27.0 million, respectively, in standby letters of credit were issued as of those dates. The revolving five-year credit agreement has a maturity date of December 1, 2011. Upon entering into the five-year credit agreement, origination and other upfront fees and expenses of $1.0 million were paid and are being amortized over five years. In addition to the upfront fees, the Company pays an annual administration agency fee along with a quarterly facility fee. The facility fee is based on the Company’s consolidated leverage ratio and ranges between 0.10% and 0.175% annually. The leverage ratio is calculated each quarter to determine the applicable interest rate on revolving loans, the letter of credit fee and the facility fee for the following quarter. The revolving credit agreement contains several financial and other negative and affirmative covenants customary in such agreements and is secured by a pledge of the stock of the wholly-owned subsidiaries of Lincare Holdings Inc. The financial covenants in the Company’s credit agreement include interest coverage and leverage ratios, as defined in the agreement. The Company’s credit agreement requires compliance with all covenants set forth in the agreement and the Company was in compliance with all covenants as of December 31, 2009 and 2008. The credit agreement defines the occurrence of certain specified events as events of default which, if not waived by or cured to the satisfaction of the requisite lenders, allow the lenders to take actions against the Company, including termination of commitments under the agreement, acceleration of any unpaid principal and accrued interest in respect of outstanding borrowings, payment of additional cash collateral to be held in escrow for the benefit of the lenders and enforcement of any and all rights and interests created and existing under the credit agreement. Under certain conditions, an event of default may result in an increase in the interest rate (the “Default Rate”) payable by the Company on loans outstanding under the credit facility. The Default Rate is equal to the interest rate (including any applicable percentage as set forth in the agreement)
F-21
Table of Contents
LINCARE HOLDINGS INC. AND SUBSIDIARIES
NOTES TO CONSOLIDATED FINANCIAL STATEMENTS—(Continued)
December 31, 2009, 2008 and 2007
| (7) | Long-Term Obligations (Continued) |
otherwise applicable to such loans plus 2% per annum. In the case of a bankruptcy event (as defined in the credit agreement) all commitments automatically terminate and all amounts outstanding under the credit facility become immediately due and payable.
On October 31, 2007, the Company completed the sale of $275.0 million principal amount (including exercise of a $25.0 million over-allotment option) of convertible senior debentures due 2037—Series A (the “Series A Debentures”) and $275.0 million principal amount (including exercise of a $25.0 million over-allotment option) of convertible senior debentures due 2037—Series B (the “Series B Debentures” and together with the Series A Debentures, the “Series Debentures”) in a private placement. The Series Debentures will pay interest semi-annually at a rate of 2.75% per annum. The Series Debentures are unsecured and unsubordinated obligations and will be convertible under specified circumstances based upon a base conversion rate, which, under certain circumstances, will be increased pursuant to a formula that is subject to a maximum conversion rate. Upon conversion, holders of the Series Debentures will receive cash up to the principal amount, and any excess conversion value will be delivered in shares of the Company’s common stock or in a combination of cash and shares of common stock, at the Company’s option. The initial base conversion rate for the Debentures is 19.5044 shares of common stock per $1,000 principal amount of Series Debentures, equivalent to an initial base conversion price of approximately $51.27 per share. In addition, if at the time of conversion the applicable price of the Company’s common stock exceeds the base conversion price, holders of the Series A Debentures and Series B Debentures will receive an additional number of shares of common stock per $1,000 principal amount of the Debentures, as determined pursuant to a specified formula. The Company will have the right to redeem the Series A Debentures and the Series B Debentures at any time after November 1, 2012 and November 1, 2014, respectively. Holders of the Series Debentures will have the right to require the Company to repurchase for cash all or some of their Series Debentures upon the occurrence of certain fundamental change transactions or on November 1, 2012, 2017, 2022, 2027 and 2032 in the case of the Series A Debentures and November 1, 2014, 2017, 2022, 2027 and 2032 in the case of the Series B Debentures.
In June 2003, the Company completed the sale of $275.0 million aggregate principal amount of 3.0% Convertible Senior Debentures due 2033 (the “Debentures”) in a private placement. The Debentures were convertible into shares of our common stock based on a conversion rate of 18.7515 shares for each $1,000 principal amount of Debentures. Interest on the Debentures was payable at the rate of 3.0% per annum on June 15 and December 15 of each year. On June 15, 2008, we redeemed all of the outstanding Debentures at par pursuant to a notice of redemption.
The aggregate maturities of long-term obligations for each of the five years subsequent to December 31, 2009 are as follows:
| (In thousands) | |||
| 2010 |
$ | 2,767 | |
| 2011 |
8,245 | ||
| 2012 |
276,808 | ||
| 2013 |
726 | ||
| 2014 |
275,046 | ||
| Thereafter |
— | ||
| $ | 563,592 | ||
F-22
Table of Contents
LINCARE HOLDINGS INC. AND SUBSIDIARIES
NOTES TO CONSOLIDATED FINANCIAL STATEMENTS—(Continued)
December 31, 2009, 2008 and 2007
| (7) | Long-Term Obligations (Continued) |
The Company has estimated the fair value of the liability components of the Series Debentures by calculating the present value of the cash flows of similar liabilities without associated equity components. In performing those calculations, the Company estimated that instruments similar to the Series A and B Debentures without a conversion feature as of the date of issuance would have had 7.0% and 7.4% rates of return (respectively) and expected lives of five and seven years (respectively). These estimated rates of return were based on the Company’s nonconvertible debt borrowing rate at the time of issuance and the expected lives were based on the holder’s put option features embedded in the notes. The initial proceeds from the instruments exceeded the estimated fair value of the liability components, and as a result, the Company reclassified $47.4 million and $67.2 million, respectively, of the carrying value of the Series A and B convertible debentures to equity as of the October 31, 2007 issuance date. These amounts represent the equity components of the proceeds from the debentures. The Company also recognized debt discounts equal to the equity components which will be accreted to interest expense over the respective 5 and 7-year terms of the first put option dates specified in the indentures underlying the debentures. The accreted interest plus the cash interest payments based on the stated coupon rates results in interest cost being recognized in the income statement that reflect the interest rates on similar instruments without a conversion feature.
The debt and equity components recognized for our Series A and Series B convertible debentures were as follows (in thousands):
| December 31, 2009 | December 31, 2008 | |||||||||||||||
| Series A | Series B | Series A | Series B | |||||||||||||
| Principal amount of convertible debentures |
$ | 275,000 | $ | 275,000 | $ | 275,000 | $ | 275,000 | ||||||||
| Unamortized discount |
(28,814 | ) | (49,907 | ) | (37,728 | ) | (58,240 | ) | ||||||||
| Net carrying amount |
246,186 | 225,093 | 237,272 | 216,760 | ||||||||||||
| Additional paid-in capital |
29,065 | 41,238 | 29,065 | 41,238 | ||||||||||||
At December 31, 2009, the remaining period over which the discount on the liability components will be amortized is 34 months and 58 months for the Series A and Series B convertible debentures, respectively.
The amount of interest expense recognized for the twelve months ended December 31, 2009 and 2008 was as follows (in thousands):
| December 31, 2009 | December 31, 2008 | |||||||||||
| Series A | Series B | Series A | Series B | |||||||||
| Contractual coupon interest |
$ | 7,562 | $ | 7,562 | $ | 7,562 | $ | 7,562 | ||||
| Amortization of discount on convertible debentures |
8,913 | 8,333 | 8,327 | 7,755 | ||||||||
| Interest expense |
$ | 16,475 | $ | 15,895 | $ | 15,889 | $ | 15,317 | ||||
F-23
Table of Contents
LINCARE HOLDINGS INC. AND SUBSIDIARIES
NOTES TO CONSOLIDATED FINANCIAL STATEMENTS—(Continued)
December 31, 2009, 2008 and 2007
| (8) | Income Taxes |
The tax effects of temporary differences that account for significant portions of the deferred tax assets and deferred tax liabilities at December 31, 2009 and 2008 are presented below:
| 2009 | 2008 | |||||||
| (In thousands) | ||||||||
| (As adjusted |
||||||||
| Deferred tax assets: |
||||||||
| Allowance for doubtful accounts |
$ | 8,196 | $ | 10,721 | ||||
| Accruals |
10,781 | 9,463 | ||||||
| Deferred revenue |
8,101 | 3,379 | ||||||
| Stock-based compensation |
18,400 | 19,247 | ||||||
| Other |
10,852 | 11,203 | ||||||
| 56,330 | 54,013 | |||||||
| Less: Valuation allowance |
(138 | ) | (104 | ) | ||||
| Total deferred tax assets |
56,192 | 53,909 | ||||||
| Deferred tax liabilities: |
||||||||
| Tax over book intangible asset amortization |
(227,518 | ) | (198,695 | ) | ||||
| Tax over book depreciation |
(68,135 | ) | (59,088 | ) | ||||
| Convertible debt interest |
(56,492 | ) | (49,542 | ) | ||||
| Other |
(2,333 | ) | (1,853 | ) | ||||
| Total deferred tax liabilities |
(354,478 | ) | (309,178 | ) | ||||
| Net deferred tax liabilities |
$ | (298,286 | ) | $ | (255,269 | ) | ||
At December 31, 2009 and December 31, 2008 the Company had state income tax net operating loss carryforwards of $2.9 million and $2.8 million, respectively. The Company believes that it is more likely than not that the benefit from certain state net operating loss carryforwards will not be realized. In recognition of this risk, the Company has provided a valuation allowance of $0.1 million at December 31, 2009 and 2008 on the deferred tax assets relating to these state net operating loss carryforwards. Such deferred tax assets expire between 2010 and 2029 as follows:
| (In thousands) | |||
| 2010 – 2015 |
$ | 90 | |
| 2020 – 2023 |
0 | ||
| 2024 – 2029 |
2,780 | ||
| $ | 2,870 | ||
F-24
Table of Contents
LINCARE HOLDINGS INC. AND SUBSIDIARIES
NOTES TO CONSOLIDATED FINANCIAL STATEMENTS—(Continued)
December 31, 2009, 2008 and 2007
| (8) | Income Taxes (Continued) |
Income tax expense attributable to operations consists of:
| Year Ended December 31, | ||||||||||||
| 2009 | 2008 | 2007 | ||||||||||
| (In thousands) | ||||||||||||
| (As adjusted |
(As adjusted |
|||||||||||
| Current: |
||||||||||||
| Federal |
$ | 44,923 | $ | 101,480 | $ | 101,570 | ||||||
| State |
4,623 | 10,919 | 8,441 | |||||||||
| Total current |
49,546 | 112,399 | 110,011 | |||||||||
| Deferred: |
||||||||||||
| Federal |
35,046 | 23,002 | 21,122 | |||||||||
| State |
2,699 | 2,877 | 2,533 | |||||||||
| Total deferred |
37,745 | 25,879 | 23,655 | |||||||||
| Total income tax expense |
$ | 87,291 | $ | 138,278 | $ | 133,666 | ||||||
| Total income tax expense allocation: |
||||||||||||
| Income from operations |
$ | 87,291 | $ | 138,278 | $ | 133,666 | ||||||
| Stockholders’ equity, for compensation expense for tax purposes in excess of amounts recognized for financial reporting purposes |
(4,448 | ) | (3,098 | ) | (12,040 | ) | ||||||
| $ | 82,843 | $ | 135,180 | $ | 121,626 | |||||||
Total income tax expense differs from the amounts computed by applying a U.S. federal income tax rate of 35% to income before income taxes as a result of the following:
| Year Ended December 31, | |||||||||||
| 2009 | 2008 | 2007 | |||||||||
| (In thousands) | |||||||||||
| (As adjusted Note 1) |
(As adjusted Note 1) |
||||||||||
| Computed “expected” tax expense |
$ | 78,185 | $ | 127,940 | $ | 125,354 | |||||
| State income taxes, net of federal income tax benefit |
4,760 | 8,967 | 7,133 | ||||||||
| Permanent differences |
6,180 | 1,247 | 3,541 | ||||||||
| Other |
(1,834 | ) | 124 | (2,362 | ) | ||||||
| Total income tax expense |
$ | 87,291 | $ | 138,278 | $ | 133,666 | |||||
The Company had gross unrecognized tax benefits, including interest and penalties as of December 31, 2009 and December 31, 2008, respectively, of $5.8 million and $11.9 million, of which $3.9 million and $8.3 million, net of federal tax benefit, if recognized, would favorably affect the effective tax rate. The Company recognizes accrued interest and penalties related to unrecognized tax benefits as a component of income tax expense. The gross amount provided for potential interest and penalties at December 31, 2009 totaled $1.3 million and $0.4 million, respectively.
F-25
Table of Contents
LINCARE HOLDINGS INC. AND SUBSIDIARIES
NOTES TO CONSOLIDATED FINANCIAL STATEMENTS—(Continued)
December 31, 2008, 2007 and 2006
| (8) | Income Taxes (Continued) |
A reconciliation of the beginning and ending balances of the Company’s gross liability for unrecognized tax benefits, excluding the related interest and penalties, at December 31, 2009 and December 31, 2008 is a follows:
| 2009 | 2008 | |||||||
| (In thousands) | ||||||||
| Total gross unrecognized tax benefits at beginning of period |
$ | 8,839 | $ | 12,960 | ||||
| Additions for tax positions related to the current year |
456 | 1,306 | ||||||
| Additions for tax positions related to prior years |
1,199 | 1,639 | ||||||
| Reductions for tax positions related to prior years |
(1,098 | ) | (321 | ) | ||||
| Settlements |
(4,677 | ) | (4,280 | ) | ||||
| Reductions due to lapse in statute of limitations |
(603 | ) | (2,465 | ) | ||||
| Total gross unrecognized tax benefits at end of period |
$ | 4,116 | $ | 8,839 | ||||
The Company conducts business nationally and, as a result, files U.S. federal income tax returns and returns in various state and local jurisdictions. In the normal course of business the Company is subject to examination by taxing authorities throughout the United States. With few exceptions, the Company is no longer subject to U.S. federal, state and local, income tax examinations for years before 2005.
The Company effectively settled examinations with various taxing jurisdictions for $5.7 million and $5.4 million for the years 2009 and 2008, respectively. The Company does not expect that the total amount of unrecognized tax positions will significantly increase or decrease in the next twelve months.
The Internal Revenue Service (“IRS”) has completed its examination of the Company’s U.S. income tax returns through 2008. The U.S. federal statute of limitations remains open for the years 2006 and forward. There are no material disputes for the open tax years. The year 2009 is currently under examination.
| (9) | Other Current Liabilities |
Other current liabilities at December 31, 2009 and 2008 consist of:
| 2009 | 2008 | |||||
| (In thousands) | ||||||
| Deferred revenue |
$ | 37,022 | $ | 44,244 | ||
| Other current liabilities |
12,242 | 10,240 | ||||
| $ | 49,264 | $ | 54,484 | |||
| (10) | Stockholders’ Equity |
The Company has 5,000,000 authorized shares of preferred stock, all of which are unissued. The Board of Directors has the authority to issue up to such number of shares of preferred stock in one or more series and to fix the rights, preferences, privileges, qualifications, limitations and restrictions thereof without any further vote or action by the stockholders but subject to restrictions imposed by the Company’s revolving credit agreement.
| (11) | Stock Plans |
The Company issues stock options and other stock-based awards to key employees and directors under stock-based compensation plans. The Company also sponsors an employee stock purchase plan.
F-26
Table of Contents
LINCARE HOLDINGS INC. AND SUBSIDIARIES
NOTES TO CONSOLIDATED FINANCIAL STATEMENTS—(Continued)
December 31, 2009, 2008 and 2007
| (11) | Stock Plans (Continued) |
The Company uses the fair value accounting for stock-based awards granted or modified, which requires cash flows resulting from excess tax benefits to be classified as a part of cash flows from financing activities. Excess tax benefits are realized tax benefits from tax deductions for exercised options in excess of the deferred tax asset attributable to stock compensation costs for such options. The Company realized excess tax benefits of $39.0 thousand, $1.2 million and $5.0 million for the years ended December 31, 2009, 2008 and 2007, respectively, and these amounts have been classified as a financing cash inflow as well as an operating cash outflow. Additionally, $6.0 million, $3.1 million and $12.4 million have been included in the change in income taxes payable as an operating cash inflow for the years ended December 31, 2009, 2008 and 2007, respectively.
For the years ended December 31, 2009, 2008 and 2007, the Company recognized total stock-based compensation expenses of $25.5 million, $19.3 million and $18.0 million, respectively, as well as related tax benefits of $6.0 million, $7.0 million and $6.4 million, respectively. All stock-based compensation expenses are recognized using a graded method approach and are either classified within operating or selling, general and administrative expenses on the consolidated statements of operations, with substantially all of the expense being in selling, general and administrative expenses.
Stock Options
The Company has five outstanding stock plans that provide for the grant of options and other stock-based awards to officers, employees and directors. To date, stock options have been granted with an exercise price equal to the fair value of the stock at the date of grant. Stock options generally have eight to ten year expiration terms and generally vest over one to five years depending on the particular grant. As of December 31, 2009, approximately 2.8 million shares are available for future grant under the Company’s shareholder-approved stock plans. See table below for summary of individual plans.
| Plan Year | ||||||||||||
| 1998 | 2000 | 2001 | 2004 | 2007 | Total | |||||||
| Reserved |
3,000,000 | 2,000,000 | 6,500,000 | 4,000,000 | 4,000,000 | 19,500,000 | ||||||
| Outstanding |
64,000 | 46,500 | 1,636,750 | 2,348,002 | 1,229,335 | 5,324,587 | ||||||
| Available for grant |
— | 500 | 906,500 | 297,037 | 1,628,665 | 2,832,702 | ||||||
The following table summarizes information about stock options outstanding under the plans at December 31, 2009:
| Stock Options Outstanding | Stock Options Exercisable | |||||||||||
| Range of Exercise Prices |
Number | Weighted Average Remaining Contractual Life |
Weighted Average Exercise Price |
Number | Weighted Average Exercise Price | |||||||
| $24.55 – $29.68 |
96,250 | 1.64 years | $ | 28.02 | 96,250 | $ | 28.02 | |||||
| $29.68 – $32.00 |
2,236,283 | 4.46 years | 31.08 | 1,340,283 | 31.43 | |||||||
| $32.00 – $38.51 |
616,069 | 4.41 years | 38.51 | 616,069 | 38.51 | |||||||
| $38.51 – $42.33 |
2,375,985 | 3.98 years | 41.73 | 2,146,476 | 41.67 | |||||||
| $24.55 – $42.33 |
5,324,587 | 4.19 years | $ | 36.64 | 4,199,078 | $ | 37.62 | |||||
F-27
Table of Contents
LINCARE HOLDINGS INC. AND SUBSIDIARIES
NOTES TO CONSOLIDATED FINANCIAL STATEMENTS—(Continued)
December 31, 2009, 2008 and 2007
| (11) | Stock Plans (Continued) |
The Company believes that the Black-Scholes valuation model provides a reasonable estimate of the fair value of the Company’s stock options, particularly in view of the absence of any market-based or performance-based vesting conditions attached to those stock options. The Black-Scholes option pricing model requires, among other things, an estimate of expected share price volatility. The Company considered the use of both historical and implied volatility assumptions in calculating the fair value of stock options issued in 2009 and 2007. The Company did not grant any stock options in 2008. The expected option term is based on historical exercise and post-vesting termination patterns. The expected dividend yield is 0% as the Company has not paid any cash dividends on its capital stock and does not anticipate it will pay cash dividends in the foreseeable future. The risk-free interest rate is based on the U.S. Treasury yield curve at the time of the grant based on the expected term.
Following are the specific weighted average valuation assumptions for the stock options, where applicable, used for each respective period:
| Year Ended December 31, | ||||||||
| 2009 | 2008 | 2007 | ||||||
| Expected dividend yield |
0.00 | % | N/A | 0.00 | % | |||
| Risk-free interest rate |
2.41 | % | N/A | 4.69 | % | |||
| Expected volatility |
32.72 | % | N/A | 23.28 | % | |||
| Expected term |
6 years | N/A | 5 years | |||||
Stock option activity for the years ended December 31, 2007 through 2009 is summarized below:
| Number of Options |
Weighted Average Exercise Price |
Weighted Average Remaining Contractual Life (Years) |
Aggregate Intrinsic Value | ||||||||
| Outstanding at December 31, 2006 |
9,671,910 | $ | 30.38 | 4.14 | $ | 96,637,784 | |||||
| Exercised in 2007 |
(1,886,688 | ) | 21.09 | ||||||||
| Forfeited in 2007 |
(102,606 | ) | 40.74 | ||||||||
| Options granted in 2007 |
1,288,000 | 39.03 | |||||||||
| Outstanding at December 31, 2007 |
8,970,616 | 33.46 | 4.24 | $ | 37,407,209 | ||||||
| Exercised in 2008 |
(612,000 | ) | 16.48 | ||||||||
| Forfeited in 2008 |
(34,350 | ) | 40.02 | ||||||||
| Options granted in 2008 |
0 | 0 | |||||||||
| Outstanding at December 31, 2008 |
8,324,266 | 34.68 | 3.50 | $ | 1,526,603 | ||||||
| Exercised in 2009 |
(1,935,333 | ) | 28.33 | ||||||||
| Forfeited in 2009 |
(1,118,346 | ) | 38.93 | ||||||||
| Expired in 2009 |
(842,000 | ) | 26.86 | ||||||||
| Options granted in 2009 |
896,000 | 30.57 | |||||||||
| Outstanding at December 31, 2009 |
5,324,587 | $ | 36.64 | 4.19 | $ | 14,398,360 | |||||
| Exercisable at December 31, 2009 |
4,199,078 | $ | 37.62 | 3.42 | $ | 8,520,600 | |||||
| Vested or expected to vest as of December 31, 2009 |
5,313,514 | $ | 36.64 | 4.19 | $ | 14,376,612 | |||||
F-28
Table of Contents
LINCARE HOLDINGS INC. AND SUBSIDIARIES
NOTES TO CONSOLIDATED FINANCIAL STATEMENTS—(Continued)
December 31, 2009, 2008 and 2007
| (11) | Stock Plans (Continued) |
Stock options outstanding at December 31, 2009, were 5,324,587. Of those stock options outstanding at December 31, 2009, 4,199,078 were exercisable at December 31, 2009 and 1,125,509 were unvested. Of the total stock options outstanding at December 31, 2009, 5,313,514 stock options are vested or expected to vest in the future, net of expected cancellations and forfeitures of 11,073. The intrinsic value of options exercised during the years ended December 31, 2009, 2008 and 2007, amounted to $12.5 million, $8.6 million and $33.0 million, respectively.
Restricted Stock
Under the 2004 and 2007 Stock Plans, certain key employees may be granted restricted stock at nominal cost to them. Restricted stock is measured at fair value on the date of the grant, based on the number of shares granted and the quoted price of the Company’s common stock. Restricted stock may vest upon the employees’ fulfillment of specified performance and/or service-based conditions. In October 2009, the Company granted 950,000 shares of restricted stock, which have service-based conditions, to certain key employees. The restrictions lapse after three years. In October 2009, the Company granted 192,000 shares of restricted stock, which have service-based conditions, to its non-employee directors. The restrictions will lapse in annual installments over three years. In September 2008, the Company granted 325,000 shares of restricted stock to certain key employees which will vest after two years, but may vest earlier if specific performance criteria are met. The performance criteria are based on achieving pre-determined EPS goals for a specific period. In September 2008, the Company granted 236,000 shares of restricted stock, which have service-based conditions, to certain other key employees. The restrictions lapse in from one to four year annual installments. In May and October 2007, the Company granted 383,500 and 5,800 shares, respectively, of restricted stock, which have service-based conditions, to certain employees. The restrictions lapse in annual installments over five years. During the years ended December 31, 2009, 2008 and 2007, the Company recognized $16.7 million, $6.4 million and $2.6 million, respectively, of stock-based compensation expense related to restricted stock.
A summary of the status of unvested restricted stock for the years ended December 31, 2007 through 2009 is presented below:
| Shares | Weighted-Average Grant Date Fair Value Per Share | |||||
| Unvested at December 31, 2006 |
94,666 | $ | 32.36 | |||
| Granted |
389,300 | 38.99 | ||||
| Vested |
(89,333 | ) | 31.95 | |||
| Forfeited |
(22,783 | ) | 39.09 | |||
| Unvested at December 31, 2007 |
371,850 | 38.99 | ||||
| Granted |
561,000 | 30.44 | ||||
| Vested |
0 | — | ||||
| Forfeited |
(21,000 | ) | 39.03 | |||
| Unvested at December 31, 2008 |
911,850 | 33.73 | ||||
| Granted |
1,142,000 | 30.56 | ||||
| Vested |
(365,500 | ) | 30.17 | |||
| Forfeited |
(17,300 | ) | 37.61 | |||
| Unvested at December 31, 2009 |
1,671,050 | $ | 32.29 | |||
F-29
Table of Contents
LINCARE HOLDINGS INC. AND SUBSIDIARIES
NOTES TO CONSOLIDATED FINANCIAL STATEMENTS—(Continued)
December 31, 2009, 2008 and 2007
| (11) | Stock Plans (Continued) |
Employee Stock Purchase Plan
The Company’s Employee Stock Purchase Plan (“Stock Purchase Plan”) provides a means to encourage and assist employees in acquiring a stock ownership interest in Lincare. Payroll deductions are accumulated during each quarter and applied toward the purchase of stock on the last trading day of each quarter. The Stock Purchase Plan defines purchase price per share as 85% of the lower of the fair value of a share of common stock on the last trading day of the previous plan quarter, or the last trading day of the current plan quarter.
During the years ended December 31, 2009, 2008 and 2007, 62,260 shares, 56,508 shares and 43,767 shares, respectively, of common stock were purchased under the Stock Purchase Plan resulting in compensation cost of $0.3 million, $0.4 million and $0.3 million, respectively.
Total Stock-Based Compensation
The following weighted-average per share fair values were determined for stock-based compensation grants or employee stock purchases occurring during the years ended December 31, 2009, 2008 and 2007:
| Year Ended December 31, | |||||||||
| 2009 | 2008 | 2007 | |||||||
| Options granted |
$ | 10.72 | N/A | $ | 12.23 | ||||
| Restricted stock and stock awards granted |
$ | 30.56 | $ | 30.44 | $ | 38.99 | |||
| Employee stock purchases |
$ | 5.13 | $ | 6.89 | $ | 7.38 | |||
During the years ended December 31, 2009, 2008 and 2007, the Company received cash of $56.0 million, $11.4 million and $41.1 million, respectively, from employee stock purchases, grants of restricted stock awards and exercises of stock options, and realized related tax benefits of $4.4 million, $3.1 million and $12.0 million, respectively. There were no stock options settled for cash during the years ended December 31, 2009, 2008 and 2007.
As of December 31, 2009, the total remaining unrecognized compensation cost related to unvested stock options and restricted stock amounted to $8.7 million and $38.2 million, respectively, which will be amortized over the weighted-average remaining requisite service periods of 1.6 years and 2.3 years, respectively.
The total estimated fair value of stock options vested during 2009, 2008 and 2007 was $3.7 million, $15.9 million and $11.0 million, respectively. The total estimated fair value of restricted stock vested during 2009, 2008 and 2007 was $11.0 million, $0.0 million and $2.9 million, respectively.
The Company issues new shares of common stock to satisfy stock-based awards upon exercise.
| (12) | Net Revenues |
Included in the Company’s net revenues is reimbursement from the federal government under Medicare, Medicaid and other federally funded programs, which aggregated approximately 60% of net revenues in 2009 and 2008 and 64% of net revenues in 2007.
F-30
Table of Contents
LINCARE HOLDINGS INC. AND SUBSIDIARIES
NOTES TO CONSOLIDATED FINANCIAL STATEMENTS—(Continued)
December 31, 2009, 2008 and 2007
| (12) | Net Revenues (Continued) |
The following table sets forth a summary of the Company’s net revenues by product category:
| Year Ended December 31, | |||||||||
| 2009 | 2008 | 2007 | |||||||
| (In thousands) | |||||||||
| Oxygen and other respiratory therapy |
$ | 1,398,212 | $ | 1,526,737 | $ | 1,470,363 | |||
| Home medical equipment and other |
152,265 | 137,843 | 125,627 | ||||||
| Total |
$ | 1,550,477 | $ | 1,664,580 | $ | 1,595,990 | |||
Included in net revenues are rental and sale items that comprise approximately 63.3% and 36.7% of total revenues in 2009, approximately 68.1% and 31.9% in 2008, and approximately 66.7% and 33.3% in 2007, respectively.
| (13) | Income Per Common Share |
Basic income per common share is computed by dividing earnings available to common stockholders by the weighted average number of common shares outstanding for the period. Diluted income per common share reflects the potential dilution of securities that could share in earnings, including stock options and outstanding convertible debt. When the exercise of stock options is anti-dilutive, they are excluded from the calculation. For the years ended December 31, 2009, 2008 and 2007 the number of excluded shares underlying anti-dilutive stock options and awards was 9,122,344, 7,387,416 and 4,128,650, respectively.
A reconciliation of the numerators and the denominators of the basic and diluted income per common share computations is as follows:
| Year Ended December 31, | |||||||||||
| 2009 | 2008 | 2007 | |||||||||
| (In thousands, except per share data) | |||||||||||
| (As adjusted |
(As adjusted |
||||||||||
| Numerator: |
|||||||||||
| Basic—Income available to common stockholders |
$ | 136,096 | $ | 227,266 | $ | 224,489 | |||||
| Adjustment for assumed dilution: |
|||||||||||
| Interest on 3% convertible debt, net of tax |
0 | 2,343 | (1) | 5,172 | (1) | ||||||
| Diluted—Income available to common stockholders and holders of dilutive securities |
$ | 136,096 | $ | 229,609 | $ | 229,661 | |||||
| Denominator: |
|||||||||||
| Weighted average shares |
68,076 | 73,044 | 83,387 | ||||||||
| Effect of dilutive securities: |
|||||||||||
| Stock options |
421 | 219 | 1,144 | ||||||||
| 3% convertible debt |
0 | 2,353 | 5,157 | ||||||||
| Adjusted weighted average shares |
68,497 | 75,616 | 89,688 | ||||||||
| Per share amount: |
|||||||||||
| Basic |
$ | 2.00 | $ | 3.11 | $ | 2.69 | |||||
| Diluted |
$ | 1.99 | $ | 3.04 | (1) | $ | 2.56 | (1) | |||
| (1) | Figures reflect the application of the “if converted” method of accounting for the Company’s 3.0% Convertible Senior Debentures due 2033 (see “Liquidity and Capital Resources”) in accordance with ASC 260-10-45-44. The debentures were redeemed in full on June 15, 2008, pursuant to a notice of redemption. |
F-31
Table of Contents
LINCARE HOLDINGS INC. AND SUBSIDIARIES
NOTES TO CONSOLIDATED FINANCIAL STATEMENTS—(Continued)
December 31, 2009, 2008 and 2007
| (14) | Business Combinations |
The Company’s strategy is to increase its market share through internal growth and strategic acquisitions. Lincare achieves internal growth in existing geographic markets through the addition of new customers through referral sources to its network of local operating centers. In addition, the Company expands into new geographic markets on a selective basis, either through acquisitions or by opening new operating centers, when it believes such expansion will enhance its business.
The Company acquired certain assets of two businesses in 2009 and three businesses in each of 2008 and 2007. Consideration for the acquisitions generally included cash, deferred acquisition payments (unsecured non-interest bearing) and the assumption of certain liabilities.
Each acquisition during 2009, 2008 and 2007 was accounted for as a purchase. The results of operations of the acquired companies are included in the accompanying consolidated statements of operations since the respective dates of acquisition. Each of the acquired companies conducted operations similar to that of the Company. These allocations are inclusive of amounts not yet paid.
The total aggregate cost of the acquisitions described above was as follows:
| 2009 | 2008 | 2007 | |||||||
| (In thousands) | |||||||||
| Cash |
$ | 5,077 | $ | 22,028 | $ | 4,775 | |||
| Contingent consideration |
6,070 | 0 | 0 | ||||||
| Deferred acquisition obligations |
563 | 7,162 | 1,210 | ||||||
| Assumption of liabilities |
34 | 126 | 23 | ||||||
| $ | 11,744 | $ | 29,316 | $ | 6,008 | ||||
The total aggregate purchase price of the acquisitions described above was allocated as follows:
| 2009 | 2008 | 2007 | |||||||
| (In thousands) | |||||||||
| Current assets |
$ | 3 | $ | 503 | $ | 258 | |||
| Property and equipment |
83 | 1,314 | 83 | ||||||
| Intangible assets |
260 | 2,045 | 40 | ||||||
| Goodwill |
11,398 | 25,454 | 5,627 | ||||||
| $ | 11,744 | $ | 29,316 | $ | 6,008 | ||||
The results of 2009 acquisitions have been included in the Company’s financial statements from the acquisition dates forward and were immaterial for 2009. Pro forma information for the comparable period of 2008 would not be materially different from amounts reported.
F-32
Table of Contents
LINCARE HOLDINGS INC. AND SUBSIDIARIES
NOTES TO CONSOLIDATED FINANCIAL STATEMENTS—(Continued)
December 31, 2009, 2008 and 2007
| (14) | Business Combinations (Continued) |
On February 1, 2010, Lincare acquired the respiratory therapy, home medical equipment and infusion therapy business of Gentiva Health Services, Inc. The Company is in the process of finalizing the accounting for this acquisition.
| (15) | Contingencies |
As a health care provider, the Company is subject to extensive government regulation, including numerous laws directed at preventing fraud and abuse and laws regulating reimbursement under various government programs. The marketing, billing, documenting and other practices of health care companies are all subject to government scrutiny. To ensure compliance with Medicare and other regulations, regional carriers often conduct audits and request patient records and other documents to support claims submitted by Lincare for payment of services rendered to customers. Similarly, government agencies periodically open investigations and obtain information from health care providers pursuant to legal process.
Violations of federal and state regulations can result in severe criminal, civil and administrative penalties and sanctions, including disqualification from Medicare and other reimbursement programs.
From time to time, the Company receives inquiries from various government agencies requesting customer records and other documents. It has been the Company’s policy to cooperate with all such requests for information. There are several pending government inquiries, but the government has not instituted any proceedings or served the Company with any complaints as a result of these inquiries. However, the Company can give no assurances as to the duration or outcome of these inquiries.
Private litigants may also make claims against health care providers for violations of health care laws in actions known as qui tam suits. In these cases, the government has the opportunity to intervene in, and take control of, the litigation. The Company is a defendant in certain qui tam proceedings. The government has declined to intervene in all unsealed qui tam actions of which the Company is aware and it is vigorously defending these suits.
The Company is also involved in certain other claims and legal actions in the ordinary course of its business. The ultimate disposition of all such matters is not expected to have a material adverse impact on its financial position, results of operations or liquidity.
F-33
Table of Contents
LINCARE HOLDINGS INC. AND SUBSIDIARIES
NOTES TO CONSOLIDATED FINANCIAL STATEMENTS—(Continued)
December 31, 2009, 2008 and 2007
| (16) | Quarterly Financial Data (Unaudited) |
The following is a summary of quarterly financial results for the years ended December 31, 2009 and 2008:
| First Quarter |
Second Quarter |
Third Quarter |
Fourth Quarter | |||||||||
| (In thousands, except per share data) | ||||||||||||
| 2009: |
||||||||||||
| Net revenues |
$ | 371,674 | $ | 380,359 | $ | 392,644 | $ | 405,800 | ||||
| Operating income |
$ | 51,814 | $ | 62,713 | $ | 66,111 | $ | 76,823 | ||||
| Net income |
$ | 25,984 | $ | 33,473 | $ | 36,028 | $ | 40,611 | ||||
| Income per common share: |
||||||||||||
| Basic |
$ | 0.36 | $ | 0.49 | $ | 0.54 | $ | 0.62 | ||||
| Diluted |
$ | 0.36 | $ | 0.49 | $ | 0.53 | $ | 0.61 | ||||
| (As adjusted Note 1) | ||||||||||||
| 2008: |
||||||||||||
| Net revenues |
$ | 415,420 | $ | 428,391 | $ | 405,677 | $ | 415,092 | ||||
| Operating income |
$ | 103,565 | $ | 105,116 | $ | 92,935 | $ | 97,064 | ||||
| Net income |
$ | 58,242 | $ | 60,130 | $ | 53,279 | $ | 55,615 | ||||
| Income per common share: |
||||||||||||
| Basic |
$ | 0.80 | $ | 0.83 | $ | 0.73 | $ | 0.76 | ||||
| Diluted |
$ | 0.76 | $ | 0.79 | $ | 0.73 | $ | 0.76 | ||||
F-34
Table of Contents
SCHEDULE II
LINCARE HOLDINGS INC. AND SUBSIDIARIES
FINANCIAL STATEMENT SCHEDULE
VALUATION AND QUALIFYING ACCOUNTS
| Description |
Balance at Beginning of Period |
Charged to Expenses |
Net Sales Adjustments and Other |
Deductions | Balance at End of Period | ||||||||||||
| (In thousands) | |||||||||||||||||
| Year Ended December 31, 2009 |
|||||||||||||||||
| Deducted from asset accounts: |
|||||||||||||||||
| Allowance for sales adjustments and uncollectible accounts |
$ | 47,071 | $ | 23,257 | $ | (5,894 | )(1) | $ | 22,874 | (2) | $ | 41,560 | |||||
| Year Ended December 31, 2008 |
|||||||||||||||||
| Deducted from asset accounts: |
|||||||||||||||||
| Allowance for sales adjustments and uncollectible accounts |
$ | 42,370 | $ | 24,969 | $ | 6,469 | (1) | $ | 26,737 | (2) | $ | 47,071 | |||||
| Year Ended December 31, 2007 |
|||||||||||||||||
| Deducted from asset accounts: |
|||||||||||||||||
| Allowance for sales adjustments and uncollectible accounts |
$ | 34,359 | $ | 23,940 | $ | 6,264 | (1) | $ | 22,193 | (2) | $ | 42,370 | |||||
| (1) | To record net sales adjustments and allowances on business combinations. |
| (2) | To record write-offs, net of recoveries. |
S-1
Table of Contents
| Exhibit |
Exhibit | |
| 3.10(C) | Amended and Restated Certificate of Incorporation of Lincare Holdings Inc. | |
| 3.11(C) | Certificate of Amendment to the Amended and Restated Certificate of Incorporation of Lincare Holdings Inc. | |
| 3.20(S) | Amended and Restated By-Laws of Lincare Holdings Inc. | |
| 4.1(H) | Lincare Holdings Inc. Indenture dated as of June 11, 2003 | |
| 4.2(H) | Lincare Holdings Inc. Registration Rights Agreement dated as of June 11, 2003 | |
| 10.1(A) | Non-Qualified Stock Option Plan of Registrant | |
| 10.2(A) | Lincare Holdings Inc. 1991 Stock Plan | |
| 10.3(E) | Lincare Holdings Inc. 1994 Stock Plan | |
| 10.4(E) | Lincare Holdings Inc. 1996 Stock Plan | |
| 10.5(E) | Lincare Holdings Inc. 1998 Stock Plan | |
| 10.6(E) | Lincare Holdings Inc. 2000 Stock Plan | |
| 10.7(I) | Amended Lincare Holdings Inc. 2001 Stock Plan | |
| 10.8(J) | Lincare Holdings Inc. 2004 Stock Plan | |
| 10.9(Q) | Lincare Holdings Inc. 2007 Stock Plan | |
| 10.10(G) | Lincare Inc. 401(k) Plan | |
| 10.11(B) | Employee Stock Purchase Plan | |
| 10.12(K) | Non-Qualified Stock Option Agreement between Lincare Holdings Inc. and John P. Byrnes dated July 1, 2004 | |
| 10.13(K) | Non-Qualified Stock Option Agreement between Lincare Holdings Inc. and Shawn S. Schabel dated July 1, 2004 | |
| 10.14(K) | Non-Qualified Stock Option Agreement between Lincare Holdings Inc. and Paul G. Gabos dated July 1, 2004 | |
| 10.15(V) | Non-Qualified Stock Option Agreement between Lincare Holdings Inc. and John P. Byrnes dated October 1, 2009 | |
| 10.16(V) | Non-Qualified Stock Option Agreement between Lincare Holdings Inc. and Shawn S. Schabel dated October 1, 2009 | |
| 10.17(V) | Non-Qualified Stock Option Agreement between Lincare Holdings Inc. and Paul G. Gabos dated October 1, 2009 | |
| 10.18(K) | Restricted Stock Agreement between Lincare Holdings Inc. and John P. Byrnes dated July 1, 2004 | |
| 10.19(K) | Restricted Stock Agreement between Lincare Holdings Inc. and Shawn S. Schabel dated July 1, 2004 | |
| 10.20(K) | Restricted Stock Agreement between Lincare Holdings Inc. and Paul G. Gabos dated July 1, 2004 | |
| 10.21(V) | Restricted Stock Agreement between Lincare Holdings Inc. and John P. Byrnes dated October 1, 2009 | |
| 10.22(V) | Restricted Stock Agreement between Lincare Holdings Inc. and Shawn S. Schabel dated October 1, 2009 | |
| 10.23(V) | Restricted Stock Agreement between Lincare Holdings Inc. and Paul G. Gabos dated October 1, 2009 | |
| 10.24(F) | Form of Executive Employment Agreement dated December 15, 2001 | |
| 10.25(L) | Executive Employment Agreements dated November 15, 2004 | |
| 10.26(T) | Second Amended Executive Employment Agreements dated December 28, 2007 | |
| 10.27(V) | Third Amended Executive Employment Agreements dated October 1, 2009 | |
| 10.28(B) | Form of Non-employee Director Stock Option Agreement | |
| 10.29(B) | Form of Non-qualified Stock Option Agreement | |
| 10.30(I) | First Amendment to Amended and Restated Credit Agreement dated June 4, 2003 | |
| 10.31(M) | Second Amendment to Amended and Restated Credit Agreement dated December 10, 2004 | |
| 10.32(O) | Third Amendment to Amended and Restated Credit Agreement dated April 26, 2005 |
S-2
Table of Contents
| Exhibit |
Exhibit | |
| 10.33(P) | Fourth Amendment to Amended and Restated Credit Agreement dated June 28, 2005 | |
| 10.34(N) | First Supplemental Indenture between Lincare Holdings and U.S. Bank Trust National Association dated December 17, 2004 | |
| 10.35(D) | Form of Series A Note | |
| 10.36(D) | Form of Series B Note | |
| 10.37(D) | Form of Series C Note | |
| 10.38(R) | First Amendment to Credit Agreement dated October 31, 2007 | |
| 10.39(R) | Registration Rights Agreement dated October 31, 2007 | |
| 10.40(R) | Indenture Between Lincare Holdings Inc. and U.S. Bank National Association dated October 31, 2007 | |
| 10.41(R) | Indenture Between Lincare Holdings Inc. and U.S. Bank National Association dated October 31, 2007 | |
| 10.42(U) | 2009 Employee Stock Purchase Plan | |
| 10.43 | Amended and Restated Credit Agreement dated as of April 25, 2002 | |
| 10.44 | Credit Agreement with Bank of America, N.A. as Agent and Calyon, New York Branch as Syndication Agent dated December 1, 2006 | |
| 10.45 | Senior Secured Note Purchase Agreement among Lincare Holdings Inc., as Borrower, and several note holders with Bank of America, N.A., as Agent | |
| 12.1 | Computation of Ratio of Earnings to Fixed Charges | |
| 21.1 | List of Subsidiaries of Lincare Holdings Inc. | |
| 23.1 | Consent of KPMG LLP | |
| 24.1 | Special Powers of Attorney | |
| 31.1 | Certification Pursuant to Rule 13a-14(a)/Rule 15d-14(a) of the Securities and Exchange Act of 1934, as adopted pursuant to Section 302 of the Sarbanes-Oxley Act of 2002, executed by John P. Byrnes, Chief Executive Officer | |
| 31.2 | Certification Pursuant to Rule 13a-14(a)/Rule 15d-14(a) of the Securities and Exchange Act of 1934, as adopted pursuant to Section 302 of the Sarbanes-Oxley Act of 2002, executed by Paul G. Gabos, Chief Financial Officer | |
| 32.1 | Certification Pursuant to 18 U.S.C. Section 1350, as adopted pursuant to Section 906 of the Sarbanes-Oxley Act of 2002, executed by John P. Byrnes, Chief Executive Officer | |
| 32.2 | Certification Pursuant to 18 U.S.C. Section 1350, as adopted pursuant to Section 906 of the Sarbanes-Oxley Act of 2002, executed by Paul G. Gabos, Chief Financial Officer |
| A | Incorporated by reference to the Corresponding exhibit to the Registrant’s Registration Statement on Form S-1 (No. 33-44672). |
| B | Incorporated by reference to the Registrant’s Form 10-K dated March 26, 1998. |
| C | Incorporated by reference to the Registrant’s Form 10-Q dated August 12, 1998. |
| D | Incorporated by reference to the Registrant’s Form 10-Q dated November 13, 2000. |
| E | Incorporated by reference to the Registrant’s Form 10-K dated March 29, 2001. |
| F | Incorporated by reference to the Registrant’s Form 10-K dated March 28, 2002. |
| G | Incorporated by reference to the Registrant’s Form 10-Q dated May 13, 2002. |
| H | Incorporated by reference to the Registrant’s Form 8-K dated June 12, 2003. |
| I | Incorporated by reference to the Registrant’s Form 10-Q dated August 14, 2003. |
| J | Incorporated by reference to the Registrant’s Form DEF 14-A dated April 22, 2004. |
| K | Incorporated by reference to the Registrant’s Form 10-Q dated November 9, 2004. |
| L | Incorporated by reference to the Registrant’s Form 8-K dated November 18, 2004. |
S-3
Table of Contents
| M | Incorporated by reference to the Registrant’s Form 8-K dated December 16, 2004. |
| N | Incorporated by reference to the Registrant’s Form 10-K dated March 16, 2005. |
| O | Incorporated by reference to the Registrant’s Form 8-K dated April 26, 2005. |
| P | Incorporated by reference to the Registrant’s Form 8-K dated June 28, 2005. |
| Q | Incorporated by reference to the Registrant’s Form DEF 14-A dated April 5, 2007. |
| R | Incorporated by reference to the Registrant’s Form 8-K dated November 6, 2007. |
| S | Incorporated by reference to the Registrant’s Form 8-K dated November 26, 2007. |
| T | Incorporated by reference to the Registrant’s Form 8-K dated January 3, 2008. |
| U | Incorporated by reference to the Registrant’s Form DEF 14-A dated April 1, 2009. |
| V | Incorporated by reference to the Registrant’s Form 8-K dated October 5, 2009. |
S-4
Table of Contents
[This Page Intentionally Left Blank.]
Table of Contents
[This Page Intentionally Left Blank.]