Attached files
UNITED STATES
SECURITIES AND EXCHANGE COMMISSION
Washington, DC 20549
Form 10-K
(Mark One)
| x | ANNUAL REPORT PURSUANT TO SECTION 13 OR 15(d) OF THE SECURITIES EXCHANGE ACT OF 1934 |
For the fiscal year ended December 31, 2009
| ¨ | TRANSITION REPORT PURSUANT TO SECTION 13 OR 15(d) OF THE SECURITIES EXCHANGE ACT OF 1934 |
For the transition period from to
Commission File No. 001-34521
HYATT HOTELS CORPORATION
(Exact name of registrant as specified in its charter)
| Delaware | 20-1480589 | |
| (State or other jurisdiction of incorporation or organization) |
(IRS Employer Identification No.) | |
| 71 South Wacker Drive, 12th Floor, Chicago, Illinois |
60606 | |
| (Address of Principal Executive Offices) | (Zip Code) | |
Registrant’s Telephone Number, Including Area Code: (312) 750-1234
Securities registered pursuant to Section 12(b) of the Act:
| Title of Each Class |
Name of Each Exchange on Which Registered | |
| Class A Common Stock, $0.01 par value | New York Stock Exchange |
Securities registered pursuant to Section 12(g) of the Act: None
Indicate by check mark if the registrant is a well-known seasoned issuer, as defined in Rule 405 of the Securities Act. Yes ¨ No þ
Indicate by check mark if the registrant is not required to file reports pursuant to Section 13 or Section 15(d) of the Act. Yes ¨ No þ
Indicate by check mark whether the registrant: (1) has filed all reports required to be filed by Section 13 or 15(d) of the Securities Exchange Act of 1934 during the preceding 12 months (or for such shorter period that the registrant was required to file such reports), and (2) has been subject to such filing requirements for the past 90 days. Yes þ No ¨
Indicate by check mark whether the registrant has submitted electronically and posted on its corporate Web site, if any, every Interactive Data File required to be submitted and posted pursuant to Rule 405 of Regulation S-T (§ 232.405 of this chapter) during the preceding 12 months (or for such shorter period that the registrant was required to submit and post such files). Yes ¨ No ¨
Indicate by check mark if disclosure of delinquent filers pursuant to Item 405 of Regulation S-K is not contained herein, and will not be contained, to the best of the registrant’s knowledge, in definitive proxy or information statements incorporated by reference in Part III of this Form 10-K or any amendment to this Form 10-K. þ
Indicate by check mark whether the registrant is a large accelerated filer, an accelerated file, a non-accelerated filer, or a smaller reporting company. See definitions of “large accelerated filer,” “accelerated filer” and “smaller reporting company” in Rule 12b-2 of the Exchange Act.
| Large accelerated filer ¨ | Accelerated filer ¨ | |
| Non-accelerated filer þ | Smaller reporting company ¨ |
Indicate by check mark whether the registrant is a shell company (as defined in Rule 12b-2 of the Exchange Act). Yes ¨ No þ
As of June 30, 2009, the last day of the registrant’s most recently completed second quarter, the registrant’s common stock was not publicly traded. As of January 31, 2010, the aggregate market value of the registrant’s Class A common stock, $0.01 par value, held by non-affiliates of the registrant was approximately $1,293.4 million (based upon the closing sale price of the Class A common stock on that date on The New York Stock Exchange).
As of January 31, 2010, there were 43,869,597 shares of the registrant’s Class A common stock, $0.01 par value, outstanding and 130,005,588 shares of the registrant’s Class B common stock, $0.01 par value, outstanding.
DOCUMENTS INCORPORATED BY REFERENCE
Part III of this Annual Report on Form 10-K incorporates by reference portions of the registrant’s Proxy Statement for its 2010 Annual Meeting of Stockholders to be held on June 10, 2010.
HYATT HOTELS CORPORATION
TABLE OF CONTENTS
FISCAL YEAR ENDED DECEMBER 31, 2009
Disclosure Regarding Forward-Looking Statements
This annual report contains “forward-looking statements” within the meaning of the Private Securities Litigation Reform Act of 1995. These statements include statements about the Company’s plans, strategies, financial performance, prospects or future events and involve known and unknown risks that are difficult to predict. As a result, our actual results, performance or achievements may differ materially from those expressed or implied by these forward-looking statements. In some cases, you can identify forward-looking statements by the use of words such as “may,” “could,” “expect,” “intend,” “plan,” “seek,” “anticipate,” “believe,” “estimate,” “predict,” “potential,” “continue,” “likely,” “will,” “would” and variations of these terms and similar expressions, or the negative of these terms or similar expressions. Such forward-looking statements are necessarily based upon estimates and assumptions that, while considered reasonable by us and our management, are inherently uncertain. Factors that may cause actual results to differ materially from current expectations include, but are not limited to:
| • | the factors discussed in this annual report set forth under the sections titled “Risk Factors” in Part I, Item 1A, and “Management’s Discussion and Analysis of Financial Condition and Results of Operations” in Part II, Item 7; |
| • | the depth and duration of the current economic downturn; |
| • | levels of spending in the business, travel and leisure industries as well as consumer confidence; |
| • | declines in occupancy and average daily rate; |
| • | hostilities, including future terrorist attacks, or fear of hostilities that affect travel; |
| • | travel-related accidents; |
| • | natural disasters, such as earthquakes, tsunamis, tornados, hurricanes or floods; |
| • | the seasonal and cyclical nature of the real estate and hospitality businesses; |
| • | changes in distribution arrangements, such as through internet travel intermediaries; |
| • | changes in the tastes and preferences of our customers; |
| • | relationships with associates and labor unions and changes in labor law; |
| • | financial condition of, and our relationships with, third-party property owners, franchisees and hospitality venture partners; |
| • | risk associated with potential acquisitions and dispositions and the introduction of new brand concepts; |
| • | changes in federal, state, local or foreign tax law; |
| • | increases in interest rates and operating costs; |
| • | fluctuations in currency exchange rates; |
| • | lack of acceptance of new brands or innovation; |
| • | general volatility of the capital markets and our ability to access the capital markets; |
| • | changes in the competitive environment in our industry and the markets where we operate; |
| • | outcomes of legal proceedings; and |
| • | violation of regulations or laws related to our franchising business. |
All forward-looking statements attributable to us or persons acting on our behalf are expressly qualified in their entirety by the cautionary statements set forth above. Forward-looking statements speak only as of the date they are made, and we do not undertake or assume any obligation to update publicly any of these forward-looking statements to reflect actual results, new information or future events, changes in assumptions or changes
1
in other factors affecting forward-looking statements, except to the extent required by applicable laws. If we update one or more forward-looking statements, no inference should be drawn that we will make additional updates with respect to those or other forward-looking statements.
Terms Used in this Annual Report
Unless otherwise specified or the context otherwise requires, references in this annual report to “we,” “our,” “us,” “Hyatt” and the “Company” refer to Hyatt Hotels Corporation and its consolidated subsidiaries.
As used in this annual report, the term “Pritzker family business interests” means (1) various lineal descendants of Nicholas J. Pritzker (deceased) and spouses and adopted children of such descendants; (2) various trusts for the benefit of the individuals described in clause (1) and trustees thereof; and (3) various entities owned and/or controlled, directly and/or indirectly, by the individuals and trusts described in (1) and (2).
As used in this annual report, the term “properties” refers to hotels that we manage, franchise, own or lease and our residential and vacation ownership units that we develop, sell and manage. “Hyatt-branded” refers to properties operated under our brands, including Park Hyatt, Grand Hyatt, Andaz, Hyatt Regency, Hyatt, Hyatt Place and Hyatt Summerfield Suites. Our Hyatt-branded property, room and unit counts exclude one non-Hyatt branded property that we own in California. Residential ownership units refers to Hyatt-branded residential units that we manage (such as serviced apartments), some of which we own, that are part of mixed-use projects and are often adjacent to a Hyatt-branded full service hotel. Vacation ownership units refers to the fractional and timeshare units that we develop, sell and manage that are part of the Hyatt Vacation Club. Hospitality ventures refers to entities in which we own less than a 100% equity interest.
As used in this annual report, the term “associates” refers to the over 80,000 individuals working at our corporate and regional offices and our managed, franchised and owned properties. Of these more than 80,000 associates, we directly employ approximately 45,000. The remaining associates are employed by certain third-party owners and franchisees of our hotels.
Hyatt®, Park Hyatt®, Grand Hyatt®, Hyatt Regency®, Hyatt Place®, Hyatt Summerfield Suites™, Hyatt Vacation Club®, Andaz®, Hyatt Gold Passport®, Hyatt Resorts™ and related trademarks, trade names and service marks of Hyatt appearing in this annual report are the property of Hyatt. Unless otherwise noted, all other trademarks, trade names or service marks appearing in this annual report are the property of their respective owners.
Reverse Stock Split and Reclassification of Common Stock
Except as otherwise indicated, information in this annual report:
| • | reflects the one-for-two reverse stock split of our common stock effected on October 14, 2009; and |
| • | reflects the reclassification of (i) 34,407 shares of common stock into 34,407 shares of Class A common stock and (ii) 168,005,588 shares of common stock into 168,005,588 shares of Class B common stock (and subsequent conversion of 38,000,000 of such shares into 38,000,000 shares of Class A common stock at the time such shares were sold by the selling stockholders in our initial public offering), effected on November 4, 2009 in connection with the filing of our amended and restated certificate of incorporation. |
2
| Item 1. | Business. |
Our History
Hyatt was founded by Jay Pritzker in 1957 when he purchased the Hyatt House motel adjacent to the Los Angeles International Airport. Over the following decade, Jay Pritzker and his brother Donald Pritzker, working together with other Pritzker family business interests, grew the company into a North American management and hotel ownership company, which became a public company in 1962. In 1968, Hyatt International was formed by Pritzker family business interests and subsequently became a separate public company. Hyatt Corporation and Hyatt International Corporation were taken private by the Pritzker family business interests in 1979 and 1982, respectively.
Prior to June 30, 2004, Hyatt Corporation, which primarily consisted of the North American hotel management and franchise companies, was owned by HG, Inc. (HG). H Group Holding, Inc. (H Group), which is owned by Pritzker family business interests, owns HG. In addition to owning Hyatt Corporation, HG owned various other North American hospitality related businesses (primarily consisting of hotel properties and the vacation ownership business) and on June 30, 2004 contributed these hospitality related businesses to Hyatt Corporation. Following such contribution, the stock of Hyatt Corporation was distributed to the Pritzker family business interests that owned H Group. We refer to this transaction as the “June 2004 Transaction.”
Following the June 2004 Transaction, substantially all of the hospitality assets owned by Pritzker family business interests, including Hyatt Corporation and Hyatt International Corporation, were consolidated under a single entity. On August 4, 2004, Global Hyatt, Inc. was incorporated in Delaware and subsequently changed its name to Global Hyatt Corporation. On December 31, 2004, pursuant to a Master Contribution Agreement, the stock of Hyatt Corporation and the stock of AIC Holding Co. (AIC), the owner of Hyatt International Corporation and other international hospitality related assets and operations, as well as hospitality related assets and operations held by certain other entities owned by Pritzker family business interests, were contributed to Global Hyatt Corporation by their respective owners in exchange for shares of Global Hyatt Corporation common stock. As a result of this transaction, Hyatt Corporation, AIC and Hyatt International Corporation became wholly-owned subsidiaries of Global Hyatt Corporation. The contribution was reflected as a transaction between entities under common control as of January 1, 2004. On June 30, 2009, Global Hyatt Corporation changed its name to Hyatt Hotels Corporation.
On November 10, 2009, we completed an initial public offering of 43,700,000 shares of our Class A common stock, of which selling stockholders sold 38,000,000 shares and we sold 5,700,000 in connection with the underwriters’ exercise of their option to purchase additional shares. In connection with the offering, our Class A common stock began trading publicly on the New York Stock Exchange under the symbol “H” on November 5, 2009.
Overview
Hyatt Hotels Corporation is a global hospitality company with widely recognized, industry leading brands and a tradition of innovation developed over our more than fifty-year history. Our mission is to provide authentic hospitality by making a difference in the lives of the people we touch every day. We focus on this mission in pursuit of our goal of becoming the most preferred brand in each segment that we serve for our associates, guests and owners. We support our mission and goal by adhering to a set of core values that characterize our culture. We believe that our mission, goal and values, together with the strength of our brands, strong capital and asset base and opportunities for expansion, provide us with a platform for long-term value creation.
3
We manage, franchise, own and develop Hyatt-branded hotels, resorts and residential and vacation ownership properties around the world. As of December 31, 2009, our worldwide portfolio consisted of 424 Hyatt-branded properties (122,317 rooms and units), including:
| • | 162 managed properties (63,062 rooms), all of which we operate under management agreements with third-party property owners; |
| • | 109 franchised properties (16,607 rooms), all of which are owned by third parties that have franchise agreements with us and are operated by third parties; |
| • | 96 owned properties (including 4 consolidated hospitality ventures) (25,765 rooms) and 6 leased properties (2,851 rooms), all of which we manage; |
| • | 26 managed properties owned or leased by unconsolidated hospitality ventures (11,746 rooms); |
| • | 15 vacation ownership properties (962 units), all of which we manage; and |
| • | 10 residential properties (1,324 units), all of which we manage and some of which we own. |
Our full service hotels operate under four world-recognized brands, Park Hyatt, Grand Hyatt, Hyatt Regency and Hyatt. We recently introduced our fifth full service brand, Andaz, where our guests experience a vibrant yet relaxed atmosphere, geared towards today’s individual business and leisure travelers. Our two select service brands are Hyatt Place and Hyatt Summerfield Suites (an extended stay brand), which have been well received in the United States and we believe have significant growth potential both in the United States and internationally. We develop, sell and manage vacation ownership properties in select locations as part of the Hyatt Vacation Club. We also manage Hyatt-branded residential properties that are often adjacent to Hyatt-branded full service hotels. We assist third parties in the design and development of such mixed-use projects based on our expertise as a manager and owner of vacation ownership properties, residential properties and hotels.
Our associates, whom we also refer to as members of the Hyatt family, consist of over 80,000 individuals working at our corporate and regional offices and our managed, franchised and owned properties in 45 countries around the world. Substantially all of our hotel general managers are trained professionals in the hospitality industry with extensive hospitality experience in their local markets and host countries. The general managers of our managed properties are empowered to manage their properties on an independent basis based on their market knowledge, management experience and understanding of our brands. Our divisional management teams located in cities around the world, such as Atlanta, Dubai, Hong Kong, Mexico City, New York, San Francisco and Zurich, support our general managers by providing corporate resources, mentorship, owner interaction and other assistance necessary to help them achieve their goals. Our Franchise and Owner Relations Group provides a single point of contact for our franchisees and offers resources to support franchised properties, including assistance with commercial contracts, distribution matters and brand standards as well as sales and marketing and reservations support. Our executive management team, headquartered in Chicago, supports our management teams and associates around the world, provides strategic direction and sets overall policies for our company.
We primarily derive our revenues from hotel operations, management and franchise fees, other revenues from managed properties and sales of vacation ownership properties. For the years ended December 31, 2009 and 2008, revenues totaled $3.3 billion and $3.8 billion, respectively, net income (loss) attributable to Hyatt Hotels Corporation totaled $(43) million and $168 million, respectively, and Adjusted EBITDA totaled $406 million and $687 million, respectively. See Part II, Item 7, “Management’s Discussion and Analysis of Financial Condition and Results of Operations – Key Business Metrics Evaluated by Management – Adjusted EBITDA” for our definition of Adjusted EBITDA, why we present it and for a reconciliation of our consolidated Adjusted EBITDA to net income attributable to Hyatt Hotels Corporation for the periods presented. For the years ended December 31, 2009 and 2008, 80.4% and 79.9% of our revenues were derived from operations in the United States, respectively. As of December 31, 2009, 76.7% of our long-lived assets were located in the United States. As of December 31, 2009, we had total debt of $852 million and cash and cash equivalents of $1.3 billion. As of December 31, 2009, we had undrawn borrowing capacity of $1.4 billion under our revolving credit facility. These sources provide us with significant liquidity and resources for future growth.
4
Our Mission, Goal and Values
Our Mission
Our mission is to provide authentic hospitality by making a difference in the lives of the people we touch every day, including our associates, guests and owners.
Our Goal
Our goal is to be the most preferred brand in each customer segment that we serve for our associates, guests and owners.
Our Values
We aim to foster a common purpose and culture within the Hyatt family through shared core values of mutual respect, intellectual honesty and integrity, humility, fun, creativity and innovation.
Our mission, goal and values are interdependent, and we refer to this interdependence as the “Hyatt value chain.” The Hyatt value chain begins with our associates. We believe that our efforts to engage our associates in planning for how we can better serve our fellow associates, guests and owners contributes to their commitment to genuine service, which is the first step to achieving high levels of guest satisfaction. In our view, motivating our associates to become personally involved in serving and demonstrating loyalty to our guests is central to fulfilling our mission. We rely upon the management teams at each of our managed properties to lead by example and we provide them with the appropriate autonomy to make operational decisions in the best interest of the hotel and brand. We believe the managers of our franchised properties are experienced operators with high standards and have demonstrated commitment to our values and our approach to guest service that is designed to enhance guest satisfaction. High levels of guest satisfaction lead to increased guest preference for our brands, which we believe results in a strengthened revenue base over the long term. We also believe that engaged associates will enhance efficient operation of our properties, resulting in improved financial results for our property owners. Sustained adherence to these principles is a basis for our brand reputation and is one of the principal factors behind the decisions by our diverse group of owners and developers to invest in Hyatt-branded properties around the world. We work with existing and prospective owners and developers to increase our presence around the world, which we expect will lead to new channels for professional growth for our associates, guest satisfaction and brand preference thus adding growth to our company and completing the Hyatt value chain.
Our Competitive Strengths
We have significant competitive strengths that support our goal of being the most preferred brand for our associates, guests and owners.
| • | World Class Brands. We believe that our widely recognized, industry leading brands provide us with a competitive advantage in attracting and driving preference for associates, guests and owners. We have consistently received top rankings, awards and accolades for service and guest experience from independent publications and surveys, including Condé Nast Traveler, Travel and Leisure, Mobil and AAA. As an example, 59 properties across our Park Hyatt, Grand Hyatt, Hyatt Regency, and Hyatt Vacation Ownership brands received the AAA four diamond lodging award in 2009. Our brand recognition and strength is key to our ability to drive preference for our brands among our associates, guests and owners. |
| • | Global Platform with Compelling Growth Potential. Our existing global presence is widely distributed and we operate in 21 of the 25 most populous urban centers around the globe based on demographic research. We believe that our existing hotels around the world provide us with a strong platform from which to selectively pursue new growth opportunities in markets where we are under- |
5
| represented. We have a long history of executing on growth opportunities. Our dedicated global development executives in offices around the world apply their experience, judgment and knowledge to ensure that new Hyatt branded hotels enhance preference for our brands. An important aspect of our compelling growth potential is our strong brand presence in higher growth markets around the world such as India, China, Russia, the Middle East and Brazil. The combination of our existing presence and brands, experienced development team, established third-party relationships and significant access to capital provides us with a strong foundation for future growth and long-term value creation. |
| • | Deep Culture and Experienced Management Teams. Hyatt has a strong culture rooted in values that have supported our past and form the foundation for our future. The members of the Hyatt family are united by shared values, a common mission and a common goal. The associates at our properties are led by an experienced group of general managers. For example, the general managers at our full service owned and managed hotels have an average tenure of more than 21 years at Hyatt. Regional and divisional management teams located around the world support our hotel general managers by providing corporate resources, mentorship and coaching, owner support and other assistance necessary to help them achieve their goals. Senior operating management has an average of 27 years of experience in the industry. Our experienced executive management team sets overall policies for our company, supports our regional and divisional teams and our associates around the world, provides strategic direction and leads our growth worldwide. |
| • | Strong Capital Base and Disciplined Financial Approach. Our approach is to maintain appropriate levels of financial leverage and liquidity through industry cycles and economic downturns such as the one we are currently experiencing. As of December 31, 2009, we had cash and cash equivalents of $1.3 billion and undrawn borrowing capacity of $1.4 billion under our revolving credit facility. We have a modest level of debt and no significant debt maturities through 2012. We believe that as a result of our balance sheet strength, we are uniquely positioned to take advantage of strategic opportunities to develop or acquire properties and brands even in economic downturns such as the one we are currently experiencing. We adhere to a formal investment process in evaluating such opportunities with input from various groups within our global organization. |
| • | Diverse Exposure to Hotel Management, Franchising and Ownership. We believe that our experience as a multi-brand manager, franchisor and owner of hotels makes us one of the best positioned lodging companies in the world. Our mix of managed, franchised and owned hotels provides a broad and diverse base of revenues, profits and cash flows. Our expertise and experience in each of these areas gives us the flexibility to evaluate growth opportunities across these three lines of business and enables us to achieve the best results for the given situation. |
| • | High Quality Owned Hotels Located in Desirable Markets. We own and operate a high quality portfolio of 96 owned properties and 26 managed properties owned or leased by unconsolidated hospitality ventures, consisting of luxury and upper-upscale full service and select service hotels. Our owned full service hotels are located primarily in key markets, including major business centers and leisure destinations, with strong growth potential, such as Chicago, London, New York, Paris, San Francisco, Seoul and Zurich. Our hospitality ventures include 50% ownership interests in properties in Mumbai and São Paulo. A number of these hotels are unique assets with high brand recognition and a strong position in their local markets. Substantially all of our owned select service hotels were newly renovated in 2006 and 2007 and are typically located near business districts, airports or attractions. As a significant owner of hotel assets, we believe we are well positioned for a recovery of demand as we expect earnings growth from owned properties to outpace growth in revenues due to their high fixed-cost structure. This benefit can be achieved either through increased earnings from our owned assets or through value realized from select asset sales. |
| • | A Track Record of Innovation. Successful innovation has been a hallmark of Hyatt since its founding. More than forty years ago, we opened the Hyatt Regency Atlanta, which was the first-ever large-scale atrium lobby hotel. This was both an architectural icon as well as a highly functional hotel |
6
| property that provided us an entry into the large-scale convention market. We also have a long track record of creative approaches to food and beverage outlets at our hotels throughout the world, which have led to highly profitable venues that create demand for our hotel properties, particularly in Asian markets. In addition, we successfully introduced new service models to the industry. We launched our Hyatt Place brand in 2006 and our Andaz brand in 2007, each of which features a unique internally developed service model that eliminates a number of de-personalized aspects of the hotel experience. We recently turned our focus to innovation in the area of guest communications. In May 2009, we launched Hyatt Concierge, making us the first hospitality company in the world to deploy a designed concierge site on Twitter, thereby enhancing the quality of hotel guest services. We believe that our commitment to fostering a culture of innovation throughout Hyatt positions us as an industry leader. |
Our Business Strategy
Our goal is to be the most preferred brand in each customer segment that we serve for our associates, guests and owners. In order to achieve this goal, we enhance brand preference by understanding who our customers are and by focusing on what our customers need and want and how we can deliver value to them. This understanding and focus informs our strategy for improving the performance of our existing hotels and expanding the presence of Hyatt brand in markets worldwide.
| • | Focus on Improvement in the Performance of Existing Hotels |
A key component of our strategy is to maximize revenues and manage costs at existing hotel properties. We strive to enhance revenues by focusing on increasing our share of hotel stays by our existing guests and increasing the number of new guests we serve on a regular basis, with the ultimate goal of establishing and increasing guest loyalty to our brands. We manage costs by setting performance goals for our hotel management teams, basing a portion of hotel management team compensation on whether performance goals are met, and granting our general managers operational autonomy. Managing costs is one way to improve hotel performance, and we believe that providing incentives to general managers to improve hotel performance leads to improved efficiency in ways appropriate for their respective properties. We support these efforts by assisting them with tools and analytics provided by our regional and corporate offices and by compensating our hotel management teams based on property performance.
| o | Increase Share of Hotel Stays. We intend to expand Hyatt’s share of hotel stays by continuously striving to provide genuine guest service and delivering value to our guests. Our existing customer base is diverse with different needs and preferences. We aim to provide differentiated service and product offerings targeted at each customer segment within each of our brands, such as meeting planners and convention guests, leisure guests and business travelers, in order to satisfy our customers’ specific needs. Our Hyatt Gold Passport guest loyalty program is designed to attract new guests and to demonstrate our loyalty to our best guests. In 2009, we launched an initiative called “The Big Welcome,” which was targeted at increasing enrollment in our Hyatt Gold Passport program. As part of The Big Welcome, we awarded more than 30,000 room nights to Gold Passport members and 365 free nights at any Hyatt in the world to three individual guests. In the twelve-month period ended December 31, 2009, new membership enrollment in our Hyatt Gold Passport program has increased by 12.5% compared to new members enrolled during the prior year. In addition, Gold Passport members represented 23.4% of total room nights during 2009. |
| o | Emphasize Associate Engagement. Our brands are defined, in large part, by the authentic hospitality that is delivered to our guests by our associates. We believe that while a great product is necessary for success, a service model that promotes genuine service for our guests and that is focused on our customers’ particular needs is the key to a sustainable long-term advantage. Therefore, we strive to involve our associates in deciding how we serve our guests and what we can do to improve guest satisfaction. We align our associates’ interests with our goal of becoming the most preferred brand in each segment that we serve. We rely on our hotel general managers to |
7
| lead by example and foster associate engagement. We believe that associate engagement results in higher levels of customer satisfaction and improves the performance of our properties. To assist in this process, we aim to ensure that talented management teams are in place worldwide and also reward those teams that achieve higher levels of employee engagement, guest satisfaction and hotel financial performance. |
| o | Enhance Operational Efficiency. We strive to align our staffing levels and expenses with demand without compromising our commitment to authentic hospitality and high levels of guest satisfaction. We have made significant changes in operations in response to the declines in demand for hospitality products and services (including staff reductions at many of our hotels, outsourcing of certain services, renegotiation of contracts to improve pricing and modification of certain product standards to lower costs without significantly impacting quality). Some of the primary changes we implemented to product standards included changing the brands, suppliers or the quantities of various supplies or services, including food and other amenities. For example, we changed the brand of our coffee served in certain areas of our operations and reduced the selection of some guest room amenities. We believe we have been able to implement these changes without impacting overall service and product quality. We will continue to incentivize and assist our hotel general managers as they proactively manage both the customer experience and the operating costs at each of their properties. |
| • | Expanding Our Presence in Attractive Markets |
We intend to drive brand preference by expanding the presence of all of our brands in attractive markets worldwide. We believe that the scale of our presence around the world is small relative to the recognition of our brands and our excellent reputation for service and, therefore, we have a unique opportunity to expand. We believe that our mission, goal and values, together with the strength of our brands, people, strong capital and asset base and opportunities for expansion provide us with a platform for long-term value creation.
| o | Increase Market Presence. We will focus our expansion efforts on under-penetrated markets where we already have an established presence and locations where our guests are traveling but where we do not have a presence. These locations include, but are not limited to, the United States, Brazil, Russia, India, China, the Middle East and Europe. We will expand our presence by increasing the number of hotels under Hyatt brand affiliation, primarily by entering into new management and franchising agreements. While under the terms of certain of our management agreements we have agreed to limitations on the expansion of one or more of our brands in certain geographic areas related to the location of a specific hotel, in agreeing to such limitations we have considered our development strategy and do not believe that such restrictions will materially impact our ability to pursue and execute on this strategy. We believe our extensive focus on the different customer groups that we serve and our understanding of how we can serve them in new locations will facilitate our growth. In addition, we plan to use our expertise in developing and managing residential and vacation ownership properties to participate in mixed-use developments that typically involve a combination of hotel and residential development in key urban and resort locations. |
| o | Expand our Select Service Presence. We intend to establish and expand Hyatt Place and Hyatt Summerfield Suites worldwide, which we believe will support our overall growth and enhance the performance of all of our brands. We intend to grow our select service presence through construction of new franchised properties by third-party developers, conversion and renovation of existing non-Hyatt properties, and, in certain cases participation in the development of properties that would be managed by us. To pursue this strategy, we have a dedicated select service development team. We believe that the opportunity for properties that provide a select offering of services at a lower price point is particularly compelling in certain emerging markets, such as Brazil, Russia, India, China and the Middle East where there is a large and growing middle class along with a meaningful number of local business travelers. |
8
| o | Increase Focus on Franchising. We intend to increase our franchised hotel presence, primarily in North America, for our select service brands and our Hyatt Regency brand. By increasing our focus on franchising, we believe that we will gain access to capital from developers and property owners that specifically target franchising business opportunities. To pursue this strategy, we have established an internal team dedicated to supporting our franchise owners and to driving the expansion of our franchised hotel presence. We plan to expand existing relationships and develop new relationships with franchise owners who demonstrate an ability to provide excellent customer service while maintaining our brand standards. |
| o | Utilize our Capital and Asset Base for Targeted Growth. The combination of our significant liquidity and strong capital position coupled with our large, high quality asset base provides a unique platform to support our growth strategy. We intend to use our liquidity and strong capital base along with select asset dispositions to redeploy capital to opportunities that will allow us to strengthen our management presence in key markets worldwide. In order to maximize long-term shareholder value we intend to selectively dispose of hotel properties and use the proceeds to expand our presence in markets as described above under “—Increase Market Presence” and “—Expand our Select Service Presence.” The form of our capital deployment will vary depending on the opportunity. We will assess and balance liquidity, value and strategic importance as we seek to expand our presence through investment. We also will continue to commit capital to fund the renovation of certain assets in our existing owned portfolio. While we may selectively dispose of hotel properties, given our focus and expertise as an owner, we expect to maintain significant ownership of hotel properties over time. |
| o | Pursue Strategic Acquisitions and Alliances. We expect to evaluate potential acquisitions of other brands or hospitality management or franchising companies as a part of our efforts to expand our presence. These acquisitions may include hotel real estate. We expect to focus on acquisitions that complement our ability to serve our existing customer base and enhance customer preference by providing a greater selection of locations, properties and services. Furthermore, we may pursue these opportunities in alliance with existing or prospective owners of managed or franchised properties to strengthen our brand presence. |
9
Description of Our Brands
| Brand |
Segment | Customer Base |
December 31, 2009 % of our Total Rooms/Units |
December 31, 2009 Rooms/Units |
Selected Competitors |
Key Locations | ||||||||
| North America |
Intl | |||||||||||||

|
Full Luxury |
Individual business and leisure travelers; small meetings | 4% | 1,122 | 3,779 | Four Seasons, Ritz-Carlton, |
Buenos Aires, Paris, Shanghai, Sydney, Washington | |||||||

|
Full Service/ Upper Upscale |
Individual business and leisure travelers; small meetings | <1%(1) | 238 | 267 | W, Mondrian, The Standard |
London, Los Angeles | |||||||

|
Full Service/ Upper Upscale |
Individual business and leisure travelers; large and small meetings, social events | 18% | 8,233 | 13,328 | Mandarin Oriental, Shangri-La, InterContinental, Fairmont |
Beijing, Berlin, Dubai, Hong Kong, New York, Tokyo | |||||||
|
|
Full Service/ Upper Upscale |
Conventions, business and leisure travelers; large and small meetings, social events; associations | 58% | 53,033 | 17,528 |
Marriott, Sheraton, Renaissance, |
Boston, Delhi, London, Los Angeles, San Francisco | |||||||

|
Select Service/ Upscale |
Individual business and leisure travelers; small meetings | 15% | 18,433 | 0 | Courtyard by Marriott, Hilton Garden Inn |
Atlanta, Dallas, Houston, Miami, Phoenix | |||||||

|
Select Service/ Extended Stay |
Extended stay guests; individual business and leisure travelers; small meetings/trainings | 3% | 4,070 | 0 | Residence Inn by
Marriott, Suites |
Austin, Boston, Dallas, Miami, San Francisco, | |||||||

|
Vacation Ownership |
Owners of vacation units |
1% | 962 | 0 | Hilton Vacation Club, Marriott Vacation Club, Starwood Vacation Ownership |
Aspen, Beaver Creek, Carmel, Key West, Siesta Key | |||||||

|
Residential | Repeat Hyatt business and leisure guests | 1% | 0 | 1,324 |
Branded and Luxury residential |
Dubai, Fukuoka, Mumbai | |||||||

| (1) | As of December 31, 2009, there were two Andaz properties in operation. |
Park Hyatt
Park Hyatt provides discerning, affluent individual business and leisure guests with elegant and luxurious accommodations. Guests of Park Hyatt receive highly attentive personal service in an intimate environment. Located in many of the world’s premier destinations, each Park Hyatt is custom designed to combine
10
sophistication with distinctive regional character. Park Hyatt features well-appointed guestrooms, meeting and special event spaces for smaller groups, critically acclaimed art programs and signature restaurants featuring award-winning chefs.
Andaz
Andaz is a hotel where our guests experience a vibrant yet relaxed atmosphere geared towards today’s individual business and leisure travelers. Each hotel is designed to reflect the unique cultural scene and spirit of the surrounding neighborhood. The hotels also feature a unique service model that removes a number of de-personalized aspects of a typical hotel experience. For example, each hotel allows guests to check-in to the hotel more efficiently through innovative techniques that include the use by our associates of a hand-held device for check-in. In addition, a laptop is available in the lobby area, known as the Andaz Lounge, upon arrival that allows the guest to check themselves into the hotel. During this check-in process and throughout a guest’s stay, complimentary beverages remain available in the Lounge. We have also simplified pricing for our guests as the room rate includes internet access, local phone calls and non-alcoholic beverages and snacks in the room.
Grand Hyatt
Grand Hyatt features large-scale, distinctive hotels in major gateway cities and resort destinations. With presence around the world and critical mass in Asia, Grand Hyatt hotels provide sophisticated global business and leisure travelers with upscale accommodations. Signature elements of the Grand Hyatt include dramatic architecture, innovative dining options, state of the art technology, spa and fitness centers and comprehensive business and meeting facilities appropriate for corporate meetings and social gatherings of all sizes.
Hyatt Regency
Hyatt Regency offers a full range of services and facilities tailored to serve the needs of conventions, business travelers and resort vacationers. Properties range in size from 200 to over 2,000 rooms and are conveniently located in urban, suburban, airport, convention and resort destinations around the world. Hyatt Regency’s convention hotels feature spacious meeting and conference facilities designed to provide a productive environment. Hyatt Regency hotels in resort locations cater to couples seeking a getaway, families enjoying a vacation together and corporate groups seeking a relaxed atmosphere in which to conduct business and meetings.
Hyatt
Hyatt hotels are smaller-sized properties conveniently located in secondary markets in the United States. With hotels ranging from 150 to 350 rooms, Hyatt hotels offer guests the opportunity to experience our signature service and hospitality even when traveling outside of major gateway markets. Customers include individual business and leisure travelers, and Hyatt hotels can accommodate business meetings and social gatherings.
Hyatt Place
Hyatt Place is designed for the busy lifestyle of today’s multi-tasking business traveler and features a selected range of services aimed at providing casual hospitality in a well-designed, high-tech and contemporary environment. Property sizes range from 125 to 200 rooms and are located in urban, airport and suburban areas. Signature features of Hyatt Place include The Gallery, which offers a coffee and wine bar, a 24 hours per day, seven days per week guest kitchen with freshly prepared snacks and entrees and daily complimentary continental breakfast. Hyatt Place guests are business travelers as well as families. Hyatt Place properties are also well suited to serve small corporate meetings.
11
Hyatt Summerfield Suites
Hyatt Summerfield Suites is an extended-stay, residential-style hotel that aims to provide individual travelers with the feel of a modern condominium. The 125 to 200 room, all-suite properties offer comforts of home such as fully equipped kitchens, flat panel HDTVs and free high-speed internet access. The public space features facilities such as a pool, a fitness center and a business center. A full breakfast every morning and an evening social on weekday evenings are complimentary to guests. Hyatt Summerfield Suites are located in urban, airport and suburban locations and can accommodate small corporate meetings and corporate clients seeking to place their employees on extended assignment.
Hyatt Vacation Club
Hyatt Vacation Club provides members with vacation ownership opportunities in regionally inspired and designed residential-style properties with the quality of the Hyatt brand. Members prepurchase time at a Hyatt Vacation Club and have the flexibility of usage, exchange and rental. Hyatt Vacation Club members can choose to occupy their vacation home, to exchange time among 15 Hyatt Vacation and Residence Clubs, to trade their time for Gold Passport points or to travel within the Hyatt system. Alternatively, members can exchange their time for time at properties participating within Interval International’s program, a third-party company with over 2,200 resorts in their exchange network worldwide.
Hyatt Resorts
Hyatt Resorts is a collection of vacation destination resorts, including beach, mountain, desert, golf and spa resorts across our Park Hyatt, Grand Hyatt and Hyatt Regency brands. Hyatt Resorts are marketed as a collection to enhance guest loyalty to our resort properties and to our hotel brands. Each Hyatt Resort retains the distinct characteristics, products, amenities and service delivery standards of its sub-brand and each hotel is tailored to provide a relaxed, comfortable vacation environment reflective of the local culture. Hyatt Resort properties are designed to accommodate individual and family vacations, while also offering a setting intended to enhance the success of corporate meetings.
Hyatt-Branded Residential Properties
Hyatt-branded residential properties consist of serviced apartments in, adjacent to, or near, certain of our Hyatt-branded full service hotels. These apartments are designed consistent with the brand standards of the Hyatt hotel with which they are associated or near which they are operated. Apartments typically feature a kitchenette and sitting area, and residents are provided with or can request various Hyatt hotel services. Hyatt-branded residential properties are marketed to repeat individual business and leisure travelers.
Our Community Commitment
At Hyatt, we are committed to making a positive and lasting impact in every community in which we operate. We do this by demonstrating a strong commitment to preserving our natural environment through Hyatt Earth, by giving back to the local communities in which we operate through Hyatt Community, and with the volunteer services of our associates through Hyatt’s Family of Responsible and Caring Employees (F.O.R.C.E.).
| • | Hyatt Earth—Our global sustainability program with measurable results that promotes a culture of environmental awareness and rewards initiatives with positive environmental impact. |
| • | Hyatt Community—a philanthropic program that awards grants to nonprofit groups that support youth development and education or improve the environment in which the Hyatt family lives and works. |
| • | F.O.R.C.E. (Family of Responsible and Caring Employees)—This volunteer program allows Hyatt associates worldwide to participate in local community outreach and volunteer efforts on paid company time. |
12
Management Agreements
Pursuant to management agreements, we manage hotels and residential properties worldwide.
Fees
Our management agreements typically provide for a two-tiered fee structure that compensates us both for the volume of business we generate for the property as well as for the profitability of hotel operations. In these two-tier fee structures, our base compensation is a base fee that is usually an agreed upon percentage of gross revenues from hotel operations. In addition, we are incentivized to improve hotel profitability through an incentive fee that is typically calculated as a percentage of a hotel profitability measure, such as gross operating profit, adjusted profit or the amount by which gross operating profit or adjusted profit exceeds a fixed threshold. Outside of the United States our fees are often more dependent on hotel profitability measures either through a single management fee structure where the entire fee is based on a profitability measure, or because our two-tier fee structure is more heavily weighted toward the incentive fee than the base fee.
Terms and Renewals
The average remaining term of our management agreements with third party owners and unconsolidated hospitality ventures for full service hotels (other than those in development) is approximately 12 years, assuming no renewal options are exercised by either party. The average remaining term of our management agreements with third-party owners and unconsolidated hospitality ventures for select service hotels (other than those in development) is approximately 21 years, assuming no renewal options are exercised by either party.
Certain of our management agreements allow for extensions of the contract term by mutual agreement, or at the discretion of one of the parties. Including exercise of extension options that are in Hyatt’s sole discretion and assuming in certain cases that specific performance tests have been met, the average remaining term of our management agreements is approximately 20 years for our full service hotels located in the United States, Canada and the Caribbean, approximately 18 years for our full service hotels located throughout the rest of the world and approximately 48 years for our select service hotels. Twenty-two select service hotels are governed under the same management agreement, which has a remaining base term of approximately 21 years. Hyatt may elect to extend the term of this agreement for two additional fifteen-year terms.
Some of our management agreements grant early termination rights to owners of the hotels we manage upon the occurrence of a stated event, such as the sale of the hotel or our failure to meet a specified performance test. Generally, termination rights under performance tests are based upon the property’s individual performance or its performance when compared to a specified set of competitive hotels branded by other hotel operators, or both. These termination rights are usually triggered if we do not meet the performance tests over multiple years. We generally have the option to cure performance failures by paying an amount equal to the short fall but in some cases our cure rights may be limited and the result of our failure to meet a performance test may be the termination of our management agreement.
Many of our management agreements are subordinated to mortgages or other secured indebtedness of the owners. In North America, in the event lenders take possession of the hotel property through foreclosure or similar means, most lenders have agreed to recognize our right to continue to manage the hotels under the terms set forth in the management agreements.
Franchise Agreements
Pursuant to franchise agreements, we grant our franchisees the limited right to use our name, marks and system in the operation of franchised Hyatt, Hyatt Regency, Hyatt Place and Hyatt Summerfield Suites hotels. We do not directly participate in the management of our franchised hotels. However, franchisees are required to
13
operate franchised hotels consistent with our brand standards. We approve the plans for, and the location of, franchised hotels and review the operation of these hotels to ensure that our standards are maintained. We provide support to and advice with respect to certain aspects of hotel operations for the benefit of our franchise owners and operators through our Franchise and Owner Relations Group.
Fees
In general, our franchisees pay us an initial application fee and ongoing royalty fees, the amount of which depends on whether the franchised property is a select or full service hotel. We franchise full service hotels under the Hyatt and Hyatt Regency brands. We franchise select service hotels under our Hyatt Place and Hyatt Summerfield Suites brands. Application fees are typically $60,000 for our Hyatt Place hotels, $50,000 for our Hyatt Summerfield Suites hotels and the greater of $100,000 and $300 per guest room for our full service hotels. Select service franchisees pay continuing royalty fees calculated as a percentage of gross room revenues which typically are 3% in the first year of operations, 4% in the second year and 5% through the remainder of the term. Our full service franchisees typically pay us royalty fees calculated as 6% of gross room revenues and 3% of gross food and beverage revenues, although in some circumstances we have negotiated other fee arrangements.
In addition to our franchise fees, we charge full service franchisees for certain services arranged and provided by us. These activities include centralized reservation functions, certain sales functions, information technology, national advertising, marketing and promotional services, as well as various accounting and insurance procurement services. We also charge select service franchisees for marketing, central reservations and technology services.
Terms and Renewals
The standard term of our franchise agreements is 20 years, with one 10 year renewal option exercisable by the franchisee, assuming the franchisee has complied with franchise agreement requirements and standards. We have the right to terminate franchise agreements upon specified events of default, including non-payment of fees and non-compliance with brand standards. In the event of early termination for any reason, our franchise agreements set forth liquidated damages that our franchisees must pay to us upon termination. The bankruptcy of a franchisee or lender foreclosure could result in the termination of the franchise agreement. The average remaining base term of our franchise agreements for our select service and full service hotels (other than those in development) is approximately 18 years.
Business Segment, Revenues and Geographical Information
For information regarding our three reportable business segments, revenues and geographical information, see Note 20 to our Consolidated Financial Statements included in this annual report.
Sales, Marketing and Reservations
Sales
Our global sales organization is focused on growing market share through key accounts, identifying new business opportunities and maximizing our local customer base.
Our worldwide customers consist of: major corporations; national, state and regional associations; specialty market accounts (social, military, educational, religious and fraternal); and travel organizations. Our worldwide sales force targets multiple brands to approximately 1,800 of these customers, which we consider to be key customer accounts. Its goal is to penetrate and expand business share among these key customers, which represent over 40% of our overall room revenue for full service hotels. The remaining portion of our room revenues at our full service hotels are generated from a broad and diverse group of customers. No one customer
14
is material to our business. Our team consists of over 100 associates focused on group business, business and leisure traveler accounts and travel agencies. We also deploy approximately 25 associates to target the acquisition of new business with the goal of establishing new worldwide accounts.
We also have regional sales offices throughout the world, including in New York, Chicago, Los Angeles, Washington D.C., London, Hong Kong, Mainz, Mumbai, Shanghai, Beijing and Tokyo.
Our associates in our worldwide sales force and in our North American full service hotels use Envision, our proprietary sales tool, to manage the group rooms forecast, maintain an inventory of definite and tentative group rooms booked each day, streamline the process of checking guest room availability and rate quotes and determine meeting room availability.
In conjunction with our worldwide sales force, each hotel has an in-house team of sales associates. The in-house sales associates are focused on local and regional business opportunities, as well as securing the business generated from our worldwide accounts.
Hyatt seeks to maximize revenues in each hotel through a team of revenue management professionals. The goal of revenue management is to secure the right customer, on the right date, at the right price. Business opportunities are reviewed and agreed upon by the hotel’s revenue management strategy team.
Marketing
Our marketing strategy is designed to maintain and build brand value and awareness while meeting the specific business needs of hotel operations. Building and differentiating each of our brands is critical to increasing Hyatt’s brand preference. We are focused on targeting the distinct guest segments that each of our brands serves and supporting the needs of the hotels by thorough analysis and application of data and analytics. Hyatt Gold Passport and Hyatt.com are the key components of our marketing strategy. Hyatt Gold Passport is a service and loyalty program with focus on driving guest satisfaction, recognition and differential services for our most loyal guests. Hyatt.com is our primary online distribution channel providing customers with an efficient source of information about our hotels and an effective booking experience.
Reservations
We have a central reservation system that provides a comprehensive view of inventory, while allowing for local management of rates based on demand. Through this system, we are able to allow bookings by hotels directly, via telephone through our call centers, by travel agents and online through Hyatt.com.
We have eight call centers that service our global guest base 24 hours per day, seven days per week and provide reservation services in over 25 languages. While we continue to provide full reservations services via telephone through our call centers, we have also invested significant amounts in internet booking capabilities on Hyatt.com and through online booking partners.
In addition, some of our hotel rooms at hotels and resorts we manage or franchise are booked through internet travel intermediaries and partners and online travel service providers. We also engage third-party intermediaries who collect fees by charging our hotels and resorts a commission on room revenues, including travel agencies and meeting and event management companies.
Hyatt Gold Passport
We operate a guest loyalty program, Hyatt Gold Passport. This program generates substantial repeat guest business by rewarding frequent stays with points toward free hotel nights and other rewards.
15
Hyatt Gold Passport members earn points based on their spending at our hotels. Hyatt Gold Passport points can be redeemed at all hotels across our brands and can also be converted into airline miles with any of more than 30 participating airlines.
The Hyatt Gold Passport program is funded through a contribution from eligible revenues generated from Hyatt Gold Passport members. These funds are applied to reimburse hotels for room nights where guests redeem Hyatt Gold Passport points and to administrative expenses and marketing initiatives to support the program.
As of December 31, 2009, the Hyatt Gold Passport program had over 9 million members, and during 2009, Hyatt Gold Passport members represented 23.4% of total room nights. We expect our Hyatt Gold Passport program to continue to have a positive impact on our brands.
Competition
There is intense competition in all areas of the hospitality industry in which we operate. Competition exists for hotel guests, management agreements and franchise agreements and sales of vacation ownership properties. Our principal competitors are other operators of full service, select service and extended stay properties, including other major hospitality chains with well established and recognized brands. We also compete against small chains and independent and local owners and operators.
We compete for guests based primarily on brand name recognition and reputation, location, customer satisfaction, room rates, quality of service, amenities, quality of accommodations and the ability to earn and redeem loyalty program points.
We compete for management agreements based primarily on the value and quality of our management services, our brand name recognition and reputation, our ability and willingness to invest our capital in third-party owned or hospitality venture projects, the level of our management fees and the economic advantages to the property owner of retaining our management services and using our brand name. We compete for franchise agreements based primarily on brand name recognition and reputation, the room rate that can be realized and total revenues we can deliver to the properties. Other competitive factors for management and franchise agreements include relationships with property owners and investors, including institutional owners of multiple properties, marketing support, reservation and e-commerce system capacity and efficiency and the ability to make investments that may be necessary to obtain management and franchise agreements.
We compete for sales of our vacation ownership properties based principally on location, quality of accommodations, price, financing terms, quality of service, flexibility of usage, opportunity to exchange into other vacation properties and brand name recognition and reputation. In addition to competing with other hotel and resort properties, our vacation ownership properties compete with national and independent vacation ownership club operators as well as with owners reselling their interests in these properties. Our ability to attract and retain purchasers of our vacation ownership properties depends on our success in distinguishing the quality and value of our vacation ownership products and services from those offered by others.
The universe of branded lodging operators with a global reach and depth of product and offerings similar to us is limited. We believe that our strong customer base, prominent brand recognition, strategic property locations and global development team will enable us to compete effectively. For additional information, see Part I, Item 1A, “Risk Factors—Risks Related to Our Business—We operate in a highly competitive industry and our success depends on our ability to compete effectively.”
Seasonality
The hospitality industry is seasonal in nature. The periods during which our lodging properties experience higher revenues vary from property to property, depending principally upon location and the customer base served. Based upon historical results, our North American properties typically generate the highest revenues in
16
the second quarter and our international properties generally experience the highest revenues during the fourth quarter of each year. We generally expect our revenues to be lower in the first quarter of each year than in each of the three subsequent quarters.
Cyclicality
The hospitality industry is cyclical and generally follows, on a lagged basis, the general economy. There is a history of increases and decreases in demand for hotel rooms, in occupancy levels and in rates realized by owners of hotels through economic cycles. Variability of results through some of the cycles in the past has been more severe due to changes in the supply of hotel rooms in given markets or in given categories of hotels. The combination of changes in economic conditions and in the supply of hotel rooms can result in significant volatility in results for owners and managers of hotel properties. The costs of running a hotel tend to be more fixed than variable. Because of this, in an environment of declining revenues the rate of decline in earnings will be higher than the rate of decline in revenues. The vacation ownership business is also cyclical. The demand for vacation ownership units is affected by the availability and cost of financing for purchases of vacation ownership units as well as general economic conditions and the relative health of the housing market.
Intellectual Property
In the highly competitive hospitality industry in which we operate, trademarks, service marks, trade names and logos are very important in the sales and marketing of our hotels, residential and vacation ownership properties and services. We have a significant number of trademarks, service marks, trade names, logos and pending registrations, and significant resources are expended each year on surveillance, registration and protection of our trademarks, service marks, trade names and logos, which we believe have become synonymous in the hospitality industry with a reputation for excellence in service and authentic hospitality.
We have entered into a license agreement with CC-Development Group, Inc. (Classic Residence) whereby we provide Classic Residence with a limited license to permit the Classic Residence companies to use the “Classic Residence by Hyatt” trademark and service mark (subject to maintaining agreed upon standards) and the “classichyatt.com”, “classichyatt.org”, “hyattclassic.com” and “hyattclassic.org” domain names for a transition period ending upon the earlier of December 31, 2010 and the consummation of a change of control of Classic Residence, to the extent necessary to permit the Classic Residence companies to comply with pre-existing contractual obligations to third parties and as required by applicable laws, regulations and governmental authorities.
Government Regulation
We are subject to numerous federal, foreign, state and local government laws and regulations, including those relating to the preparation and sale of food and beverages, building and zoning requirements, data privacy and general business license and permit requirements, in the various jurisdictions in which we manage, franchise and own hotels. Our ability to develop new hotel properties and to remodel, refurbish or add to existing properties is also dependent on obtaining permits from local authorities. We are also subject to laws governing our relationships with employees, including minimum wage requirements, overtime, working conditions, hiring and firing, non-discrimination for disabilities and other individual characteristics, work permits and benefit offerings. Federal, state and provincial laws and regulations also require certain registration, disclosure statements, compliance with specific standards of conduct and other practices with respect to the franchising of hotels. Additionally, the vacation ownership properties we operate are subject to local, state and federal requirements regarding the licensing of sales agents, compliance of marketing materials and numerous other requirements regarding the sale and management of vacation ownership properties. Compliance with these various laws and regulations can affect the revenues and profits of properties managed, franchised or owned and of our vacation ownership business and could adversely affect our operations. We believe that our businesses are conducted in substantial compliance with applicable laws and regulations.
17
We manage and own hotels with casino gaming operations as part of or adjacent to the hotels. However, with the exception of the Hyatt Regency Aruba, third parties manage and operate the casinos. We do hold and maintain the casino gaming license and manage the casino located at the Hyatt Regency Aruba. As a result, our business operations at the Hyatt Regency Aruba are subject to the licensing and regulatory control of the Departamento pa Asuntonan di Casino (D.A.C.), a newly formed regulatory agency responsible for gaming licenses and operations in Aruba. The gaming operations at the Hyatt Regency Aruba are also regulated by the Nevada Gaming Commission and the Nevada State Gaming Control Board because a provider of services at the Hyatt Regency Aruba also operates casinos in Nevada.
Employees
As of December 31, 2009, we had approximately 45,000 employees at our corporate offices, divisional offices, owned and managed hotels and residential and vacation ownership properties. Approximately 25% of those employees were either represented by a labor union or had terms of employment that were determined under a labor agreement. Some of our more than 80,000 associates are employed by certain third-party owners and franchisees of our hotels and are not included in the 45,000 figure above because we do not directly employ them. We believe relations with our employees and associates are good.
Environmental Matters
In connection with our ownership and management of hotels and development of other real properties, we are subject to various foreign, federal, state and local laws, ordinances and regulations relating to environmental protection. Under some of these laws, a current or former owner or operator of real property may be held liable for the costs of investigating or remediating hazardous or toxic substances or wastes on, under or in such real property, as well as third-party sites where the owner or operator sent wastes for disposal. Such laws may impose liability without regard to whether the owner or operator knew, or was at fault in connection with, the presence or release of such hazardous substances or wastes. Furthermore, a person who arranges for the disposal or treatment of a hazardous or toxic substance at a property owned by another, or who transports such substance to or from such property, may be liable for the costs of removal or remediation of such substance released into the environment at the disposal or treatment facility. Although we are not aware of any current material obligations for investigating or remediating hazardous substances or wastes at our owned properties, the future discovery of substances or wastes at any of our owned properties, or the failure to remediate such contaminated property properly, could adversely affect our ability to develop or sell such real estate, or to borrow using such real estate as collateral. In addition, the costs of investigating or remediating contamination, at our properties or at properties where we sent substances or wastes for disposal, may be substantial.
We are also subject to various requirements, including those contained in environmental permits required for our operations, governing air emissions, effluent discharges, the use, management and disposal of hazardous substances and wastes and health and safety. From time to time, we may be required to manage, abate or remove mold, lead or asbestos-containing materials at our properties. We believe that our properties and operations are in compliance, in all material respects, with all federal, state and local environmental laws and ordinances. However, additional operating costs and capital expenditures could be incurred if additional or more stringent requirements are enacted in the future.
Insurance
We maintain insurance coverage for general liability, property, workers’ compensation and other risks with respect to our business. Our general liability insurance provides coverage for any claim, including terrorism, resulting from our operations, goods and services and automobiles. All owned hotels are covered by Hyatt’s property insurance program. Hotels managed by Hyatt are permitted to participate in Hyatt’s insurance programs by mutual agreement with our hotel owners. If a managed hotel does not participate in our insurance programs, and for franchised locations, which do not currently participate in our insurance programs, our management and
18
franchise agreements require the hotels to be insured at coverage levels generally consistent with the coverage levels under our insurance programs, including liability, property coverage, business interruption coverage and workers’ compensation insurance. We are typically covered under these insurance policies to the extent necessary and reasonable. We believe our insurance policies are adequate for foreseeable losses and on terms and conditions that are reasonable and customary with solvent insurance carriers.
Stockholder Agreements
Amended and Restated Global Hyatt Agreement
Mr. Thomas J. Pritzker, Mr. Marshall E. Eisenberg and Mr. Karl J. Breyer, solely in their capacity as co-trustees of U.S. situs trusts for the benefit of certain lineal descendants of Nicholas J. Pritzker, deceased, that own, directly or indirectly, shares of our Class B common stock, and the adult beneficiaries of such trusts, including Mr. Thomas J. Pritzker, our executive chairman, and Ms. Penny Pritzker, one of our directors, have entered into the Amended and Restated Global Hyatt Agreement pursuant to which they have agreed to, among other things, certain voting agreements and limitations on the sale of shares of our common stock. Pritzker family U.S. situs trusts and entities own, directly or indirectly, 81,128,361 shares, or 46.7%, of our total outstanding common stock and control approximately 60.4% of our total voting power. Specifically, such parties have agreed that until the later to occur of (i) January 1, 2015 and (ii) the date upon which more than 75% of the Company’s fully diluted shares of common stock is owned by persons other than Pritzker family members and spouses (including any U.S. or non-U.S. situs trusts for the current or future, direct or indirect, vested or contingent, benefit of Pritzker family members and spouses), all Pritzkers (and their successors in interest, if applicable), but not the transferees by sale (other than Pritzkers who purchase directly from other Pritzkers), will vote all of their voting securities consistent with the recommendations of our board of directors with respect to all matters (assuming agreement as to any such matter by a majority of a minimum of three independent directors (excluding for such purposes any Pritzker) or, in the case of transactions involving us and an affiliate, assuming agreement of all of such minimum of three independent directors (excluding for such purposes any Pritzker). All Pritzkers have agreed to cast and submit by proxy to us their votes in a manner consistent with the foregoing voting agreement at least five business days prior to the scheduled date of any annual or special meeting of stockholders.
In addition, such parties have agreed that until the later to occur of (i) January 1, 2015 and (ii) the date upon which more than 75% of the Company’s fully diluted shares of common stock is owned by persons other than Pritzker family members and spouses (including any U.S. or non-U.S. situs trusts for the current or future, direct or indirect, vested or contingent, benefit of any Pritzker family members and spouses), all Pritzker family members and spouses (including U.S. and non-U.S. situs trusts for the current or future, direct or indirect, vested or contingent, benefit of any Pritzker family members and spouses or affiliates of any thereof) in a “beneficiary group” (including trusts only to the extent of the then current benefit of members of such beneficiary group) may sell up to 25% of their aggregate holdings of our common stock, measured as of November 4, 2009, the date of effectiveness of the registration statement on Form S-1 (File No. 333-161068) relating to our initial public offering of our Class A common stock, in each 12-month period following the date of effectiveness of such registration statement (without carry-overs), and shall not sell more than such amount during any such period. Upon the unanimous affirmative vote of our independent directors (excluding for such purposes any Pritzker), such 25% limitation may, with respect to each such 12 month period, be increased to a higher percentage or waived entirely. Sales of our common stock, including Class A common stock and Class B common stock, between and among Pritzkers is permitted without regard to the sale restrictions described above and such sales are not counted against the 25% sale limitation. All shares of our common stock owned by each beneficiary group (including trusts only to the extent of the then current benefit of members of such beneficiary group) are freely pledgeable to an institutional lender and such institutional lender will not be subject to the sale restrictions described above upon default and foreclosure. Pursuant to the terms of the Amended and Restated Global Hyatt Agreement, the co-trustees of the Pritzker family U.S. situs trusts have agreed that it is in the best interests of the adult beneficiaries of such trusts to distribute Hyatt stock from such trusts in consultation with the adult beneficiaries as soon as practicable following November 4, 2009, the date of effectiveness of the registration
19
statement relating to our initial public offering of our Class A common stock, subject to the 180-day lock-up period agreed to with the underwriters. After the co-trustees have notified the adult beneficiaries named below of their intention to distribute Hyatt common stock and have commenced consultation with them as to the structure of such distribution, none of such adult beneficiaries shall, until the earlier of (i) six months from the date of such notification and (ii) the date of distribution of such Hyatt common stock, acquire either directly or indirectly for his or her exclusive benefit, any “derivative securities” (as defined in Rule 16a-1(c) of the Securities Exchange Act of 1934, as amended (the “Exchange Act”)) with respect to such Hyatt common stock.
The Amended and Restated Global Hyatt Agreement may be amended, modified, supplemented or restated by the written agreement of the co-trustees of the Pritzker family U.S. situs trusts, 75% of the adult beneficiaries named below and a majority of the other adult beneficiaries party to the agreement. Each of Thomas J. Pritzker, Nicholas J. Pritzker, James N. Pritzker, John A. Pritzker, Linda Pritzker, Karen L. Pritzker, Penny Pritzker, Daniel F. Pritzker, Anthony N. Pritzker, Gigi Pritzker Pucker and Jay Robert Pritzker, and their respective lineal descendants and current spouse, if relevant, make up a “beneficiary group.”
Disputes that relate to the subject matter of the Amended and Restated Global Hyatt Agreement are subject to arbitration pursuant to the terms of the agreement. The exclusive requirement to arbitrate under the Amended and Restated Global Hyatt Agreement shall not apply with respect to the manner in which Hyatt’s operations are conducted to the extent the parties (in their capacities as stockholders) and non-Pritzker public stockholders are affected comparably; provided, however, that a party may participate in and benefit from any shareholder litigation initiated by a non-party to the agreement. A party to the agreement may not solicit others to initiate or be a named plaintiff in such litigation (i) unless two thirds of the independent directors (excluding for such purposes any Pritzker) on our board of directors (consisting of at least three independent directors) do not vote in favor of the matter that is the subject of the litigation or (ii) in the case of affiliated transactions reviewed by our board of directors, unless at least one independent director (excluding for such purposes any Pritzker) did not approve the transaction.
Amended and Restated Foreign Global Hyatt Agreement
The adult beneficiaries of the non-U.S. situs trusts for the benefit of certain lineal descendants of Nicholas J. Pritzker, deceased, including Mr. Thomas J. Pritzker and Ms. Penny Pritzker, have entered into the Amended and Restated Foreign Global Hyatt Agreement pursuant to which they have agreed to, among other things, certain voting agreements and limitations on the sale of shares of our common stock. The adult beneficiaries have informed CIBC Trust Company (Bahamas) Limited, in its capacity as trustee of such non-U.S. situs trusts, and the directors of IHE, INC. and its subsidiaries, of their agreement and expressed their desire that the trustee and the directors of IHE, INC. and its subsidiaries act in accordance with the provisions of the Amended and Restated Foreign Global Hyatt Agreement. CIBC, as trustee, IHE, INC. and its subsidiaries have joined the Amended and Restated Foreign Global Hyatt Agreement. IHE, INC. and its subsidiaries beneficially own 23,765,141 shares, or 13.7%, of our total outstanding common stock and control approximately 17.7% of our total voting power. Specifically, such parties have agreed that until the later to occur of (i) January 1, 2015 and (ii) the date upon which more than 75% of the Company’s fully diluted shares of common stock is owned by persons other than Pritzker family members and spouses (including any U.S. or non-U.S. situs trusts for the current or future, direct or indirect, vested or contingent, benefit of any Pritzker family members and spouses), all Pritzkers (and their successors in interest, if applicable), but not the transferees by sale (other than Pritzkers who purchase directly from other Pritzkers), will vote (or cause to be voted) all of the voting securities held directly or indirectly by them consistent with the recommendations of our board of directors with respect to all matters (assuming agreement as to any such matter by a majority of a minimum of three independent directors (excluding for such purposes any Pritzker) or, in the case of transactions involving us and an affiliate, assuming agreement of all of such minimum of three independent directors (excluding for such purposes any Pritzker). All Pritzkers have agreed to cast and submit by proxy to us their votes in a manner consistent with the foregoing voting agreement at least five business days prior to the scheduled date of any annual or special meeting of stockholders.
20
In addition, such parties have agreed that until the later to occur of (i) January 1, 2015 and (ii) the date upon which more than 75% of the Company’s fully diluted shares of common stock is owned by persons other than Pritzker family members and spouses (including any U.S. or non-U.S. situs trusts for the current or future, direct or indirect, vested or contingent, benefit of any Pritzker family members and spouses), all Pritzker family members and spouses (including U.S. and non-U.S. situs trusts for the current or future, direct or indirect, vested or contingent, benefit of any Pritzker family members and spouses and/or affiliates of any thereof) in a “beneficiary group” (including trusts only to the extent of the then current benefit of members of such beneficiary group) may sell up to 25% of their aggregate holdings of our common stock, measured as of November 4, 2009, the date of effectiveness of the registration statement on Form S-1 (File No. 333-161068) relating to our initial public offering of our Class A common stock, in each 12-month period following the date of effectiveness of such registration statement (without carry-overs), and shall not sell more than such amount during any such period. Upon the unanimous affirmative vote of our independent directors (excluding for such purposes any Pritzker), such 25% limitation may, with respect to each such 12 month period, be increased to a higher percentage or waived entirely. Sales of our common stock, including Class A common stock and Class B common stock, between and among Pritzkers is permitted without regard to the sale restrictions described above and such sales are not counted against the 25% sale limitation. All shares of our common stock owned directly or indirectly by each beneficiary group (including trusts only to the extent of the then current benefit of members of such beneficiary group) are freely pledgeable to an institutional lender and such institutional lender will not be subject to the sale restrictions described above upon default and foreclosure. Pursuant to the terms of the Foreign Amended and Restated Global Hyatt Agreement, the adult beneficiaries have agreed that it is in their best interests for, and have informed CIBC Trust Company (Bahamas) Limited, as trustee of the Pritzker family non-U.S. situs trusts, and the directors if IHE, INC. and its subsidiaries that it is the adult beneficiaries’ desire that CIBC and the directors of IHE, INC. and its subsidiaries distribute Hyatt stock from IHE, INC. and such non-U.S. situs trusts in consultation with the adult beneficiaries as soon as practicable following November 4, 2009, the date of effectiveness of the registration statement relating to our initial public offering of our Class A common stock, subject to the 180-day lock-up period agreed to with the underwriters. After the trustee has notified the adult beneficiaries named below of its intention to distribute Hyatt common stock and has commenced consultation with them as to the structure of such distribution, none of such adult beneficiaries shall, until the earlier of (i) six months from the date of such notification and (ii) the date of distribution of such Hyatt common stock, acquire either directly or indirectly for his or her exclusive benefit, any “derivative securities” (as defined in Rule 16a-1(c) of the Exchange Act) with respect to such Hyatt common stock.
The Amended and Restated Foreign Global Hyatt Agreement may be amended, modified, supplemented or restated by the written agreement of 75% of the adult beneficiaries named below and a majority of the other adult beneficiaries party to the agreement. Each of Thomas J. Pritzker, Nicholas J. Pritzker, James N. Pritzker, John A. Pritzker, Linda Pritzker, Karen L. Pritzker, Penny Pritzker, Daniel F. Pritzker, Anthony N. Pritzker, Gigi Pritzker Pucker and Jay Robert Pritzker, and their respective lineal descendants and current spouse, if relevant, make up a “beneficiary group.”
Disputes that relate to the subject matter of the Amended and Restated Foreign Global Hyatt Agreement are subject to arbitration pursuant to the terms of the agreement. The exclusive requirement to arbitrate under the Amended and Restated Foreign Global Hyatt Agreement shall not apply with respect to the manner in which Hyatt’s operations are conducted to the extent the parties (in their capacities as stockholders) and non-Pritzker public stockholders are affected comparably; provided, however, that a party may participate in and benefit from any shareholder litigation initiated by a non-party to the agreement. A party to the agreement may not solicit others to initiate or be a named plaintiff in such litigation (i) unless two thirds of the independent directors (excluding for such purposes any Pritzker) on our board of directors (consisting of at least three independent directors) do not vote in favor of the matter that is the subject of the litigation or (ii) in the case of affiliated transactions reviewed by our board of directors, unless at least one independent director (excluding for such purposes any Pritzker) did not approve the transaction.
21
Amended and Restated Agreement Relating to Stock
In addition to the Amended and Restated Global Hyatt Agreement, Mr. Thomas J. Pritzker, Mr. Marshall E. Eisenberg and Mr. Karl J. Breyer, solely in their capacity as co-trustees of U.S. situs trusts for the benefit of Mr. Thomas J. Pritzker, Ms. Penny Pritzker and Ms. Gigi Pritzker Pucker and their lineal descendants, that own, directly or indirectly, shares of our common stock and Mr. Thomas J. Pritzker, Ms. Penny Pritzker and Ms. Gigi Pritzker Pucker and their respective adult lineal descendants have entered into an Amended and Restated Agreement Relating to Stock whereby such parties have agreed to further restrict their ability to transfer an aggregate of 34,012,486 shares of our common stock. Subject to limited permitted transfers described in the agreement, and subject to the terms of the Amended and Restated Global Hyatt Agreement and Amended and Restated Foreign Global Hyatt Agreement described above, the parties have agreed that each stockholder party to the Amended and Restated Agreement Relating to Stock may transfer up to one-third of its common stock held as of August 28, 2007 (or deemed to be held as of such date) to unaffiliated third parties during each 365-day period beginning on the dates that are three and one-half, four and one-half and five and one-half years following the consummation of this offering; provided that such transfers are accomplished by way of a broad distribution sale. In addition, each of such stockholders may transfer up to one-third of its common stock held as of August 28, 2007 (or deemed to be held as of such date) to unaffiliated third parties (1) at any time following the end of the first calendar year during which the “existing stockholders” (as described below) owned less than 25% of our common stock at any time during such year or (2) at any time following both (a) August 28, 2007 and (b) the first date on which the applicable market value of our Class A common stock exceeds 165% of the gross price per share at which the Class A common stock was first traded in connection with our initial public offering; provided that such transfers are accomplished by way of an underwritten public offering or in an otherwise broad distribution sale. The term “existing stockholders” is defined in the agreement to mean (i) members of the Pritzker family who are lineal descendants of Nicholas J. Pritzker, deceased, and their spouses, (ii) trusts for the benefit of such persons, or (iii) affiliates of any such persons listed in clauses (i) and (ii). In addition, no stockholder party to the Amended and Restated Agreement Relating to Stock may transfer (1) the legal or beneficial ownership of any common stock held by such stockholder unless such acquiring person’s ownership of common stock is not reasonably likely to jeopardize any licensing from a governmental authority, (2) any common stock to a competitor of ours engaged in one or more of the hospitality, lodging or gaming industries, (3) any common stock to an aggregator (i.e., a person who is required to file a Schedule 13D (or successor form) under the Exchange Act, disclosing an intent other than for investment) or (4) any common stock that would cause a stockholder to violate any provision of the Amended and Restated Agreement Relating to Stock. Such restrictions are qualified by the “actual knowledge” of the transferring stockholder in the case of transfers pursuant to an underwritten public offering or a broad distribution sale.
The transfer restrictions set forth in the Amended and Restated Agreement Relating to Stock expire at 11:59 p.m. (Central time) on the earlier of the day after the date that is five and one-half years following November 10, 2009 (the closing date of our initial public offering) or the date on which the stockholders party to the 2007 Stockholders’ Agreement are released from the transfer restrictions set forth therein. The Amended and Restated Agreement Relating to Stock may be amended by the holders of a majority of the restricted stock held by the stockholders party to the agreement and each of Thomas J. Pritzker, Penny Pritzker and Gigi Pritzker Pucker, and may be terminated by the written agreement of each of the parties thereto. Disputes that relate to the subject matter of the Agreement Relating to Stock are subject to arbitration.
22
2007 Stockholders’ Agreement
In connection with the issuance and sale of 100,000 shares of our Series A Convertible Preferred Stock to GS Sunray Holdings, L.L.C. (GSSH) and GS Sunray Holdings Parallel, L.L.C. (GSSHP and collectively, the Goldman Sachs Funds), affiliates of Goldman Sachs & Co., and the execution of a Subscription Agreement in August 2007, we entered into the 2007 Stockholders’ Agreement with Madrone, the Goldman Sachs Funds and an additional investor that provides for certain rights and obligations of these stockholders, including the following:
Transfer Restrictions
Other than with respect to the 6,118,276 shares of common stock received by such stockholders in the May 2009 private placement transaction (which, upon the filing of our Amended and Restated Certificate of Incorporation on November 4, 2009, were reclassified into an equal number of shares of Class B common stock), these stockholders are restricted from transferring any shares of our common stock held by them, except to us, their affiliates (with the prior written consent of our board of directors), in limited amounts over specified time periods as described below and as otherwise permitted pursuant to the terms of the agreement. Subject to the rights of first refusal and “drag along” rights described below and provided that such transfers are accomplished by way of a broad distribution sale, following the consummation of our initial public offering on November 10, 2009, each stockholder party to the 2007 Stockholders’ Agreement may transfer up to one-third of its common stock acquired under the Subscription Agreement or upon conversion of Series A Convertible Preferred Stock to unaffiliated third parties during each 365-day period beginning on the three and one-half, four and one-half and five and one-half year anniversaries of November 10, 2009, the consummation of our initial public offering. In addition, subject to the rights of first refusal and “drag along” rights described below, each of such stockholders may transfer up to one-third of its common stock acquired under the Subscription Agreement or upon conversion of Series A Convertible Preferred Stock to unaffiliated third parties (1) at any time following the end of the first calendar year during which the “existing stockholders” (as described below) owned less than 25% of our common stock at any time during such year or (2) at any time following both (a) the second anniversary of the issuance of common stock to the relevant stockholders under the Subscription Agreement or the issuance of common stock upon conversion of the Series A Convertible Preferred Stock and (b) the first date on which the applicable market value exceeds 165% of the gross price per share at which the common stock was first traded in connection with our initial public offering; provided that such transfers are accomplished by way of an underwritten public offering or in an otherwise broad distribution sale. The term “existing stockholders” is defined in the agreement to mean (i) members of the Pritzker family who are lineal descendants of Nicholas J. Pritzker, deceased, and their spouses, (ii) trusts for the benefit of such persons and/or (iii) affiliates of any such persons listed in clauses (i) and (ii). Subject to the rights of first refusal and “drag along” rights described below, the transfer restrictions set forth in the 2007 Stockholders’ Agreement expire at 11:59 p.m. (Central time) on the day after the date that is five and one-half years following November 10, 2009, the closing date of our initial public offering.
Notwithstanding the foregoing, and subject to the rights of first refusal and “drag along” rights described below, in the event that any “initial holder” (as described below) transfers all or any portion of the shares of common stock held by such initial holder as of August 28, 2007 (other than pursuant to certain permitted transfers), each stockholder party to the 2007 Stockholders’ Agreement may transfer up to a pro rata portion of such stockholder’s common stock; provided, however, that in any 365-day period or calendar year in which such stockholder is permitted to transfer shares of common stock pursuant to the terms described in the preceding paragraph, such stockholder’s right to transfer a pro rata portion of its common stock shall apply only to the extent that the aggregate number of shares of common stock held by initial holders as of August 28, 2007 held at the commencement of such 365-day period or calendar year by initial holders and transferred by initial holders in such 365-day period or calendar year, as a percentage of the aggregate number of shares of common stock held by the initial holders as of August 28, 2007 at the commencement of such 365-day period or calendar year, exceeds the maximum percentage of such stockholder’s shares of common stock that such stockholder is
23
permitted to sell in such 365-day period or calendar year (as described in the preceding paragraph), with the result that only such excess number of shares of common stock held by the initial holders as of August 28, 2007 and transferred by the initial holders will be taken into account in determining such stockholder’s pro rata portion eligible for transfer. The rights described in this paragraph expire at 11:59 p.m. (Central time) on the day after the date that is five and one-half years following November 10, 2009, the closing date of our initial public offering. The term “initial holder” is defined in the agreement to mean (i) any of Mr. Thomas J. Pritzker, Ms. Penny Pritzker and/or Ms. Gigi Pritzker Pucker or (ii) trusts for the benefit of these individuals and/or for the benefit of their respective spouses and/or lineal descendants.
In addition, no stockholder party to the 2007 Stockholders’ Agreement may transfer (1) the legal or beneficial ownership of any common stock held by such stockholder unless such acquiring person’s ownership of common stock is not reasonably likely to jeopardize any licensing from a governmental authority, as determined by our board of directors in its reasonable discretion, (2) any common stock to an aggregator (meaning a person who is required to file a Schedule 13D under the Exchange Act disclosing an interest other than for investment), (3) any common stock to a competitor of ours engaged in one or more of the hospitality, lodging and/or gaming industries or (4) any common stock that would cause a stockholder to violate any provision of the agreement. Such restrictions are qualified by the “actual knowledge” of the transferring stockholder in the case of transfers pursuant to an underwritten public offering or a broad distribution sale.
Right of First Refusal
In the event that the number of shares of common stock proposed to be transferred by a stockholder party to the 2007 Stockholders’ Agreement and its affiliates together with any shares of common stock then proposed to be transferred by the other stockholders party to the 2007 Stockholders’ Agreement and their affiliates exceeds 2% of the then outstanding shares of common stock, then prior to consummating the sale of common stock to a third-party purchaser, such stockholder or stockholders shall offer to transfer the common stock to us at the applicable market value (as defined in the 2007 Stockholders’ Agreement). If we do not accept the offer within a specified period of time, such stockholder or stockholders may transfer the shares of common stock to the third-party purchaser as long as such transfer occurs within the time periods specified in the 2007 Stockholders’ Agreement and on terms and conditions no more favorable in the aggregate than offered to us.
“Drag-Along” Right
In connection with a “change of control” (as defined in the 2007 Stockholders’ Agreement) transaction, we have the right to require each stockholder party to the 2007 Stockholders’ Agreement to participate in such change of control transaction on the same terms, conditions and price per share of common stock as those applicable to the other holders of our common stock. In addition, upon our request, the stockholders party to the 2007 Stockholders’ Agreement have agreed to vote in favor of such change of control transaction or similar transaction, and we have the right to require each stockholder party to the 2007 Stockholders’ Agreement to vote for, consent to and raise no objection to any such transaction.
“Tag-Along” Right
Subject to the fiduciary duties of our board of directors, we have agreed that we will not agree to consummate a change of control transaction with respect to which the stockholders party to the 2007 Stockholders’ Agreement are not given the right to participate on the same terms, conditions and price per share of common stock as those applicable to the other holders of our common stock.
Preemptive Rights
Each stockholder party to the 2007 Stockholders’ Agreement has the right to purchase such stockholder’s pro rata share of any new shares of common stock, or any other equity securities, that we may propose to sell and issue on comparable terms by making an election within the time periods specified in the 2007 Stockholders’
24
Agreement, subject to certain excluded securities issuances described in the 2007 Stockholders’ Agreement, including shares issued pursuant to equity compensation plans adopted by our board of directors and the issuance of shares of our common stock in a public offering. If not all stockholders elect to purchase their full preemptive allocation of new securities, then we will notify the fully-participating stockholder of such and offer them the right to purchase the unsubscribed new securities.
Voting Agreement
Until the later of (1) December 31, 2013 and (2) the date that Mr. Thomas J. Pritzker is no longer our chairman, each stockholder party to the 2007 Stockholders’ Agreement has agreed to vote all of their shares of common stock consistent with the recommendations of a majority of our board of directors with respect to all matters. The stockholders party to the 2007 Stockholders’ Agreement own in the aggregate 25,112,086 shares of Class B common stock, or approximately 14.4% of the outstanding shares of our common stock and approximately 18.7% of the total voting power of our outstanding common stock.
Access to Information
For so long as GS Sunray Holdings Parallel, L.L.C. owns any shares of common stock, we have agreed that GS Capital Partners VI Parallel, L.P. or its representatives may examine our books and records and visit and inspect our facilities and may reasonably request information at reasonable time and intervals concerning the general status of our financial condition and operations. Additionally, on reasonable prior notice, GS Capital Partners VI Parallel, L.P. or its representatives may discuss our business operations, properties and financial and other conditions with our management, independent accountants and investment bankers. In no event shall we be required to provide access to any information that we reasonably believe would constitute attorney/client privileged communications or would violate any securities laws.
Standstill
Under the 2007 Stockholders’ Agreement, each stockholder party to the 2007 Stockholders’ Agreement agreed that, subject to certain limited exceptions, so long as such stockholder owns shares of common stock, neither such stockholder nor any of its related persons will in any manner, directly or indirectly:
| • | effect or seek, offer or propose (whether publicly or otherwise) to effect, or announce any intention to effect or cause or participate in or in any way assist, facilitate or encourage any other person to effect or seek, offer or propose (whether publicly or otherwise) to effect or participate in, (a) any acquisition of any of our or our subsidiaries’ securities (or beneficial ownership thereof) (except through the proper exercise of preemptive rights granted under the 2007 Stockholders’ Agreement), or rights or options to acquire any of our or our subsidiaries’ securities (or beneficial ownership thereof), or any of our or our subsidiaries’ or affiliates’ assets, indebtedness or businesses, (b) any tender or exchange offer, merger or other business combination involving us or any of our subsidiaries or affiliates or any assets constituting a significant portion of our consolidated assets, (c) any recapitalization, restructuring, liquidation, dissolution or other extraordinary transaction with respect to us or any of our subsidiaries or affiliates, or (d) any “solicitation” of “proxies” (as such terms are used in the proxy rules under the Exchange Act) or written consents with respect to any of our or our affiliates’ voting securities. For this purpose, the term “affiliates” means our affiliates primarily engaged in the hospitality, lodging and/or gaming industries; |
| • | form, join or in any way participate in a “group” (within the meaning of Section 13(d) of the Exchange Act) with respect to us where such group seeks to acquire any of our equity securities; |
| • | otherwise act, alone or in concert with others, to seek representation on or to control or influence our or our subsidiaries’ management, board of directors or policies; |
| • | take any action which would or would reasonably be expected to force us to make a public announcement regarding any of the types of matters set forth in the first bullet point above; |
25
| • | own more than 12% of the issued and outstanding common stock, unless such ownership arises as a result of any action not taken by or on behalf of such stockholder or a related person of such stockholder; or |
| • | request that we or any of our representatives, directly or indirectly, amend or waive any of the foregoing provisions. |
Each stockholder party to the 2007 Stockholders’ Agreement has also agreed that, if at any time during the period such stockholder is subject to the foregoing provisions, such stockholder is approached by any third party concerning its participation in any transaction or proposed transaction involving the acquisition of all or any portion of the assets, indebtedness or securities of, or any business of, ours or any of our subsidiaries, such stockholder will promptly inform us of the nature of such transaction and the parties involved.
Termination
The 2007 Stockholders’ Agreement terminates (1) with respect to any individual stockholder, on the first date when such stockholder no longer holds any shares of common stock and (2) in its entirety, upon the first to occur of all of our equity securities being owned by a single person or the agreement in writing by us and each stockholder party to the 2007 Stockholders’ Agreement.
Our Website and Availability of SEC Reports and Other Information
The Company maintains a website at the following address: www.hyatt.com. The information on the Company’s website is not incorporated by reference in this annual report.
We make available on or through our website certain reports and amendments to those reports that we file with or furnish to the Securities and Exchange Commission (“SEC”) pursuant to Section 13(a) or 15(d) of the Exchange Act. These include our annual reports on Form 10-K, our quarterly reports on Form 10-Q and our current reports on Form 8-K. We make this information available on our website free of charge as soon as reasonably practicable after we electronically file the information with, or furnish it to, the SEC.
| Item 1A. | Risk Factors. |
In addition to the other information set forth in this annual report, you should consider carefully the risks and uncertainties described below, which could materially adversely affect our business, financial condition and results of operations.
Risks Related to the Hospitality Industry
The hospitality industry is cyclical, and macroeconomic and other factors beyond our control can adversely affect and reduce demand for our hospitality products and services.
The hospitality industry is cyclical. For example, the last two business cycles in the hospitality industry, which we define as the period starting with the first calendar year of negative revenue per available room (RevPAR) growth and ending with the last calendar year of positive RevPAR growth, took place from 1991 to 2000 and 2001 to 2007. During the declining stages of these two business cycles, RevPAR growth was negative for one calendar year (1991) and two calendar years (2001 and 2002), respectively.
Macroeconomic and other factors beyond our control can reduce demand for hospitality products and services, including demand for rooms at properties that we manage, franchise, own and develop and for sales of vacation ownership properties. These factors include:
| • | changes and volatility in general economic conditions, including the severity and duration of any downturn in the U.S. or global economy and financial markets; |
26
| • | war, terrorist activities (such as the recent terrorist attacks in Jakarta, Indonesia and Mumbai, India) or threats and heightened travel security measures instituted in response to these events; |
| • | outbreaks of pandemic or contagious diseases, such as avian flu, severe acute respiratory syndrome (SARS) and H1N1 (swine) flu; |
| • | natural disasters, such as earthquakes, tsunamis, tornados, hurricanes and floods; |
| • | changes in the desirability of particular locations or travel patterns of customers; |
| • | decreased corporate budgets and spending and cancellations, deferrals or renegotiations of group business (e.g., industry conventions); |
| • | low consumer confidence; |
| • | depressed housing prices; |
| • | the financial condition of the airline, automotive and other transportation-related industries and its impact on travel; |
| • | decreased airline capacities and routes; |
| • | travel-related accidents; |
| • | oil prices and travel costs; |
| • | statements, actions or interventions by governmental officials related to travel and corporate travel-related activities and the resulting negative public perception of such travel and activities; |
| • | domestic and international political and geo-political conditions; |
| • | cyclical over-building in the hotel and vacation ownership industries; and |
| • | organized labor activities, which could cause a diversion of business from hotels involved in labor negotiations and loss of group business. |
These factors can adversely affect, and from time to time have adversely affected, individual properties, particular regions or our business as a whole. In particular, lower consumer demand resulting from the current industry downturn resulted in a decline in RevPAR for the fourth quarter of 2008 and some of the most significant RevPAR declines we have experienced in recent history during 2009. Our RevPAR declines in this business cycle have been more severe compared to those of the last two business cycles, and have had a greater negative impact on our profitability. See “—If the global economic downturn continues or worsens, our revenues and profitability could decline further” and Part II, Item 7, “Management’s Discussion and Analysis of Financial Condition and Results of Operations—Principal Factors Affecting Our Results of Operations—Revenues.” Any one or more of these factors could limit or reduce the demand, or the rates our properties are able to charge for rooms or services or the prices at which we are able to sell our vacation ownership properties, which could adversely affect our business, results of operations and financial condition.
If the global economic downturn continues or worsens, our revenues and profitability could decline further.
Consumer demand for our products and services is closely linked to the performance of the general economy and is sensitive to business and personal discretionary spending levels. Declines in consumer demand due to adverse general economic conditions, risks affecting or reducing travel patterns, lower consumer confidence or adverse political conditions can lower the revenues and profitability of our owned properties and the amount of management and franchising fee revenues we are able to generate from our managed and franchised properties. Declines in hotel profitability during an economic downturn directly impact the incentive portion of our management fees, which is based on hotel profit measures. Outside of the United States, our fees are often more dependent on hotel profitability measures, either through a single management fee that is based on a profitability measure, or because our two-tier fee structure is more heavily weighted toward the incentive fee than the base fee. Because RevPAR depends directly on average daily rate (ADR) and occupancy, declines in ADR and occupancy relating to declines in consumer demand will lower RevPAR. For additional information
27
regarding RevPAR and ADR, see Part II, Item 7, “Management’s Discussion and Analysis of Financial Condition and Results of Operations—Key Business Metrics Evaluated by Management.” Our vacation ownership business is also linked to cycles in the general economy and consumer discretionary spending. As a result, changes in consumer demand and general business cycles can subject and have subjected our revenues to significant volatility.
Accordingly, the current global economic downturn has led to a significant decline in demand for hospitality products and services, lower occupancy levels and significantly reduced room rates, all of which has lowered our revenues and negatively affected our profitability. For the year ended December 31, 2009, compared to the year ended December 31, 2008, our revenues decreased by $505 million, driven by a 18.7% decline in RevPAR at comparable systemwide properties. See Part II, Item 7, “Management’s Discussion and Analysis of Results of Operations—Principal Factors Affecting Our Results of Operations—Revenues.”
We anticipate that recovery of demand for hospitality products and services will lag an improvement in economic conditions. We cannot predict how severe or prolonged the global economic downturn will be. Furthermore, current global economic conditions have significantly impacted consumer confidence and behavior and, as a result, historical marketing information that we have collected may be less effective as a means of predicting future demand and operating results. We cannot assure you that we will be able to increase room rates and RevPAR at the same rate at which they have recently declined, even after the current downturn ends. An extended period of economic weakness would likely have a further adverse impact on our revenues and negatively affect our profitability.
We are subject to the business, financial and operating risks inherent to the hospitality industry, any of which could reduce our profits and limit our opportunities for growth.
Our business is subject to a number of business, financial and operating risks inherent to the hospitality industry, including:
| • | changes in taxes and governmental regulations that influence or set wages, prices, interest rates or construction and maintenance procedures and costs; |
| • | the costs and administrative burdens associated with complying with applicable laws and regulations; |
| • | the costs or desirability of complying with local practices and customs; |
| • | the availability and cost of capital necessary for us and potential hotel owners to fund investments, capital expenditures and service debt obligations; |
| • | delays in or cancellations of planned or future development projects; |
| • | foreign exchange rate fluctuations; |
| • | changes in operating costs, including, but not limited to, energy, food, workers’ compensation, benefits, insurance and unanticipated costs resulting from force majeure events; |
| • | significant increases in cost for healthcare coverage for employees and potential government regulation in respect of health coverage; |
| • | shortages of labor or labor disruptions; |
| • | shortages of desirable locations for development; |
| • | the financial condition of third-party property owners, franchisees, developers and hospitality venture partners, which may impact our ability to recover payments owed to us or their ability to fund operational costs, perform under management, franchise, development and hospitality venture agreements or satisfy other contractual commitments and obligations that may impact us; |
| • | relationships with our third-party property owners, franchisees and hospitality venture partners; and |
| • | the ability of third-party internet travel intermediaries to attract and retain customers. |
28
Any of these factors could limit or reduce the prices we charge for our hospitality products or services, including the rates our properties charge for rooms or the prices for which we are able to sell our vacation ownership properties. These factors can also increase our costs or affect our ability to develop new properties or maintain and operate our existing properties. As a result, any of these factors can reduce our profits and limit our opportunities for growth.
Risks Related to Our Business
Because we operate in a highly competitive industry, our revenues, profits or market share could be harmed if we are unable to compete effectively.
The segments of the hospitality industry in which we operate are subject to intense competition. Our principal competitors are other operators of full service and select service properties, including other major hospitality chains with well established and recognized brands. We also compete against smaller hotel chains and independent and local hotel owners and operators. If we are unable to compete successfully, our revenues or profits may decline or our ability to maintain or increase our market share may be diminished.
Competition for Guests
We compete for guests based primarily on brand name recognition and reputation, location, customer satisfaction, room rates, quality of service, amenities, quality of accommodations and the ability to earn and redeem loyalty program points. Some of our competitors are larger than we are based on the number of properties they manage, franchise or own or based on the number of rooms or geographic locations where they operate. Some of our competitors also have significantly more members participating in their guest loyalty programs which may enable them to attract more customers and more effectively retain such guests. Our competitors may also have greater financial and marketing resources than we do, which could allow them to improve their properties and expand and improve their marketing efforts in ways that could affect our ability to compete for guests effectively. In addition, industry consolidation may exacerbate these risks.
Competition for Management and Franchise Agreements
We compete for management agreements based primarily on the value and quality of our management services, our brand name recognition and reputation, our ability and willingness to invest our capital in third-party owned or hospitality venture projects, the level of our management fees, the terms of our management agreements and the economic advantages to the property owner of retaining our management services and using our brand name. We compete for franchise agreements based primarily on brand name recognition and reputation, the room rate that can be realized and royalty fees charged. Other competitive factors for management and franchise agreements include relationships with property owners and investors, including institutional owners of multiple properties, marketing support, reservation and e-commerce system capacity and efficiency and the ability to make investments that may be necessary to obtain management and franchise agreements.
We believe that our ability to compete for management and franchise agreements primarily depends on the success of the properties that we currently manage or franchise. The terms of any new management or franchise agreements that we obtain also depend on the terms that our competitors offer for those agreements. In addition, if the availability of suitable locations for new properties decreases, planning or other local regulations change or the availability or affordability of financing is limited, the supply of suitable properties for our management or franchising could be diminished. We may also be required to agree to limitations on the expansion of one or more of our brands in certain geographic areas in order to obtain a management agreement for a property under development. We may be prohibited from managing, franchising or owning properties in areas where opportunities exist due to these restrictions. If the properties that we manage or franchise perform less successfully than those of our competitors, if we are unable to offer terms as favorable as those offered by our competitors or if the availability of suitable properties is limited, our ability to compete effectively for new management or franchise agreements could be reduced.
29
Competition for Sales of Vacation Ownership Properties
We compete for sales of our vacation ownership properties based principally on location, quality of accommodations, price, financing terms, quality of service, terms of property use, opportunity to exchange into time at other vacation properties and brand name recognition and reputation. In addition to competing with other hotel and resort properties, our vacation ownership properties compete with national and independent vacation ownership club operators as well as with owners reselling their interests in these properties. Our ability to attract and retain purchasers of our vacation ownership properties depends on our success in distinguishing the quality and value of our vacation ownership products and services from those offered by others. If we are unable to do so, our ability to compete effectively for sales of vacation ownership properties could be adversely affected.
Our stock price is likely to be volatile, and you may not be able to resell shares of your Class A common stock at or above the price you paid.
The stock market in general, and hospitality companies in particular, have experienced extreme price and volume fluctuations that have often been unrelated or disproportionate to the operating performance of the underlying businesses. Given that we are a newly public company, these fluctuations may be even more pronounced in the trading market for our stock. In addition, the financial services industry recently experienced a period of significant disruption characterized by the bankruptcy, failure, collapse or sale of various financial institutions, which led to increased volatility in securities prices and a significant level of intervention from the U.S. and other governments in securities markets. These broad market and industry factors may seriously harm the market price of our Class A common stock, regardless of our actual operating performance.
In addition to the risks described in this section, several factors that could cause the price of our Class A common stock in the public market to fluctuate significantly include, among others, the following:
| • | quarterly variations in our operating results compared to market expectations; |
| • | announcements of new services or products or significant price reductions by us or our competitors; |
| • | size of the public float; |
| • | future sales of our Class A common stock in the public market, or the perception in the market that the holders of a large number of shares intend to sell shares; |
| • | stock price performance of our competitors; |
| • | fluctuations in stock market prices and volumes; |
| • | default on our indebtedness or foreclosure of our properties; |
| • | changes in senior management or key personnel; |
| • | changes in financial estimates by securities analysts; |
| • | negative earnings or other announcements by us or other hospitality companies; |
| • | downgrades in our credit ratings or the credit ratings of our competitors; |
| • | issuances of capital stock; and |
| • | global economic, legal and regulatory factors unrelated to our performance. |
Volatility in the market price of our Class A common stock may prevent investors from being able to sell their Class A common stock at or above the price at which you purchased the stock. As a result, you may suffer a loss on your investment.
Securities class action litigation has often been instituted against companies following periods of volatility in the overall market and in the market price of a company’s securities. This litigation, if instituted against us, could result in substantial costs, reduce our profits, divert our management’s attention and resources and harm our business.
30
If third-party property owners or franchisees of the properties we manage or franchise fail to make investments necessary to maintain or improve their properties, preference for our brands and our reputation could suffer or our management or franchise agreements with those parties could terminate.
We manage and franchise properties owned by third parties under the terms of management and franchise agreements. Substantially all of these agreements require third-party property owners to comply with standards that are essential to maintaining our brand integrity and reputation. We depend on third-party property owners to comply with these requirements by maintaining and improving properties through investments, including investments in furniture, fixtures, amenities and personnel.
Third-party property owners or franchisees may be unable to access capital or unwilling to spend available capital when necessary, even if required by the terms of our management or franchise agreements. If our third-party property owners or franchisees fail to make investments necessary to maintain or improve the properties we manage or franchise, our brand preference and reputation could suffer. In addition, if third-party property owners or franchisees breach the terms of our agreements with them, we may elect to exercise our termination rights, which would eliminate our revenues from these properties and cause us to incur expenses related to terminating these relationships. These risks become more pronounced during economic downturns.
If our management or franchise agreements terminate prematurely due to failures to meet performance tests, at the request of third parties or upon the occurrence of other stated events, our revenues could decrease and our costs could increase.
Our management and franchise agreements may terminate prematurely in certain cases. Some of our management agreements provide early termination rights to owners of the hotels we manage upon the occurrence of a stated event, such as the sale of the hotel or our failure to meet a specified performance test.
Generally, termination rights under performance tests are based upon the property’s individual performance, its performance when compared to a specified set of competitive hotels branded by other hotel operators, or both. Some agreements require a failure of one test, and other agreements require a failure of more than one test, before termination rights are triggered. These termination rights are usually triggered if we do not meet the performance tests over multiple years. Generally, we have the option to cure performance failures by making an agreed upon cure payment. However, our cure rights may be limited in some cases and the failure to meet the performance tests may result in the termination of our management agreement. In the past we have (1) failed performance tests, received notices of termination and elected to cure and (2) failed performance tests and negotiated an alternative resolution. When any termination notice is received, we evaluate all relevant facts and circumstances at the time in deciding whether to cure or allow termination.
In addition, some of our management agreements give third-party property owners the right to terminate upon payments of a termination fee to us after a certain period of time or upon sale of the property or another stated event. In some of those cases, hotel owners may be obligated to pay a termination fee to us upon termination of the management agreement. Our franchise agreements typically require franchisees to pay a fee to us before terminating. In addition, if an owner files for bankruptcy, our management and franchise agreements may be terminable under applicable law. If a management or franchise agreement terminates, we could lose the revenues we derive from that agreement or incur costs related to ending our relationship with the third party and exiting the related property.
If we are unable to maintain good relationships with third-party property owners and franchisees, our revenues could decrease and we may be unable to expand our presence.
We earn fees for managing and franchising hotels and other properties. Our management agreements typically provide a two-tiered fee structure that compensates us both for the volume of business we generate for the property as well as for the profitability of hotel operations. Our base compensation is a base fee that is usually an agreed upon percentage of gross revenues from hotel operations. We also earn an incentive fee that is
31
typically calculated as a percentage of a hotel profitability measure, such as gross operating profit, adjusted profit or the amount by which gross operating profit or adjusted profit exceeds a fixed threshold. Outside of the United States, our fees are often more dependent on hotel profitability measures, either through a single management fee that is based on a profitability measure or because our two-tier fee structure is more heavily weighted toward the incentive fee than the base fee. Our franchisees pay us an initial application fee and ongoing royalty and marketing fees.
The viability of our management and franchising business depends on our ability to establish and maintain good relationships with third-party property owners and franchisees. Third-party developers, property owners and franchisees are focused on maximizing the value of their investment and working with a management company or franchisor that can help them be successful. The effectiveness of our management, the value of our brands and the rapport that we maintain with our third-party property owners and franchisees impact renewals and are all important factors for new third-party property owners or franchisees considering doing business with us. Our relationships with these third parties generate additional property development opportunities that support our growth. If we are unable to maintain good relationships with our third-party property owners and franchisees, we may be unable to renew existing agreements or expand our relationships with these owners. Additionally, our opportunities for developing new relationships with additional third parties may be adversely impacted.
Contractual and other disagreements with third-party property owners or franchisees could make us liable to them or result in litigation costs or other expenses, which could lower our profits.
Our management and franchise agreements require us and third-party property owners or franchisees to comply with operational and performance conditions that are subject to interpretation and could result in disagreements. Additionally, some courts have applied principles of agency law and related fiduciary standards to managers of third-party hotel properties such as us, which means, among other things, that property owners may assert the right to terminate management agreements even where the agreements do not expressly provide for termination. In the event of any such termination, we may need to negotiate or enforce our right to a termination payment that may not equal expected profitability over the term of the agreement. These types of disagreements are more likely during an economic downturn.
We generally seek to resolve any disagreements with our third-party property owners or franchisees amicably. Formal dispute resolution occurs through arbitration, if provided under the applicable management or franchise agreement, or through litigation. Litigation often leads to higher expenses. We cannot predict the outcome of any such arbitration or litigation, the effect of any adverse judgment of a court or arbitrator against us or the amount of any settlement that we may be forced to enter into with any third party.
We are exposed to the risks resulting from significant investments in owned and leased real estate, which could increase our costs, reduce our profits, limit our ability to respond to market conditions or restrict our growth strategy.
Our proportion of owned properties, as compared to the number of properties that we manage or franchise for third-party owners, is larger than that of some of our competitors. Real estate ownership and leasing is subject to risks not applicable to managed or franchised properties, including:
| • | governmental regulations relating to real estate ownership; |
| • | real estate, insurance, zoning, tax, environmental and eminent domain laws; |
| • | the ongoing need for owner funded capital improvements and expenditures to maintain or upgrade properties; |
| • | risks associated with mortgage debt, including the possibility of default, fluctuating interest rate levels and the availability of replacement financing; |
| • | fluctuations in real estate values or potential impairments in the value of our assets; and |
| • | the relative illiquidity of real estate compared to other assets. |
32
The negative impact on profitability and cash flow generation from a decline in revenues is significant in owned properties due to their high fixed-cost structure. The need to maintain and renovate owned properties can present challenges, especially when cash generated from operations has declined. The effectiveness of any cost-cutting efforts is limited by the fixed-cost nature of our business. As a result, we may not be able to offset further revenue reductions through cost cutting, which could further reduce our margins. During times of economic distress, declining demand and declining earnings often result in declining asset values.
In an unfavorable market, we may not be able to sell properties in the short term. Accordingly, we may not be able to adjust our portfolio promptly in response to economic or other conditions. In addition, because our strategy to use proceeds from sales of real property to support our growth partly depends on our ability to sell properties, any inability to do so could impair our growth strategy.
We have a limited ability to manage third-party risks associated with our hospitality venture investments, which could reduce our revenues, increase our costs and lower our profits.
We participate in hospitality ventures with third parties. In the future, we may also buy and develop properties in hospitality ventures with the sellers of the properties, affiliates of the sellers, developers or other third parties. Our hospitality venture partners may have shared or majority control over the operations of our hospitality ventures. As a result, our investments in hospitality ventures involve risks that are different from the risks involved in investing in real estate independently. These risks include the possibility that our hospitality ventures or our partners:
| • | go bankrupt or otherwise are unable to meet their capital contribution obligations; |
| • | have economic or business interests or goals that are or become inconsistent with our business interests or goals; |
| • | are in a position to take action contrary to our instructions, requests, policies or objectives; |
| • | subject the property to liabilities exceeding those contemplated; |
| • | take actions that reduce our return on investment; or |
| • | take actions that harm our reputation or restrict our ability to run our business. |
For these and other reasons, it could be more difficult for us to sell our interest in any hospitality venture, which could reduce our ability to address any problems we may have with those properties or respond to market conditions in the future. As a result, our investments in hospitality ventures could lead to impasses or situations that could harm the hospitality venture, which could reduce our revenues, increase our costs and lower our profits.
If our hospitality ventures fail to provide information that is required to be included in our financial statements, we may be unable to accurately report our financial results.
Preparing our financial statements requires us to have access to information regarding the results of operations, financial position and cash flows of our hospitality ventures. Any deficiencies in our hospitality ventures’ internal controls over financial reporting may affect our ability to report our financial results accurately or prevent fraud. Such deficiencies could also result in restatements of, or other adjustments to, our previously reported or announced operating results, which could diminish investor confidence and reduce the market price for our shares. Additionally, if our hospitality ventures are unable to provide this information for any meaningful period or fail to meet expected deadlines, we may be unable to satisfy our financial reporting obligations or timely file our periodic reports.
33
Cash distributions from our hospitality ventures could be limited by factors outside our control that could reduce our return on investment and our ability to generate liquidity from these hospitality ventures.
Although our hospitality ventures may generate positive cash flow, in some cases these hospitality ventures may be unable to distribute that cash to the hospitality venture partners. Additionally, in some cases our hospitality venture partners control distributions, and may choose to leave capital in the hospitality venture rather than distribute it. Because our ability to generate liquidity from our hospitality ventures depends on the hospitality ventures’ ability to distribute capital to us, tax restrictions or decisions of our hospitality venture partners could reduce our return on these investments. We include our pro rata share of Adjusted EBITDA attributable to our unconsolidated hospitality ventures in our owned and leased hotels segment Adjusted EBITDA and our consolidated Adjusted EBITDA regardless of whether the cash flow of those ventures is, or can be, distributed to us.
We may seek to expand through acquisitions of and investments in other businesses and properties, or through alliances; and we may also seek to divest some of our properties and other assets, any of which may be unsuccessful or divert our management’s attention.
We intend to consider strategic and complementary acquisitions of and investments in other businesses, properties or other assets. Furthermore, we may pursue these opportunities in alliance with existing or prospective owners of managed or franchised properties. In many cases, we will be competing for these opportunities with third parties that may have substantially greater financial resources than we do. Acquisitions or investments in businesses, properties or assets as well as these alliances are subject to risks that could affect our business, including risks related to:
| • | issuing shares of stock that could dilute the interests of our existing stockholders; |
| • | spending cash and incurring debt; |
| • | assuming contingent liabilities; |
| • | creating additional expenses; or |
| • | high barriers to entry in many key markets and scarcity of available development and investment opportunities. |
We cannot assure you that we will be able to identify opportunities or complete transactions on commercially reasonable terms or at all, or that we will actually realize any anticipated benefits from such acquisitions, investments or alliances. Similarly, we cannot assure you that we will be able to obtain financing for acquisitions or investments on attractive terms or at all, or that the ability to obtain financing will not be restricted by the terms of our revolving credit facility or other indebtedness we may incur.
The success of any such acquisitions or investments will also depend, in part, on our ability to integrate the acquisition or investment with our existing operations. We may experience difficulty with integrating acquired businesses, properties or other assets, including difficulties relating to:
| • | coordinating sales, distribution and marketing functions; |
| • | integrating technology information systems; and |
| • | preserving the important licensing, distribution, marketing, customer, labor and other relationships of the acquired assets. |
Divestment of some of our properties or assets may yield returns below our investment criteria. In some circumstances, sales may result in investment losses.
In addition, any such acquisitions, investments, dispositions or alliances could demand significant attention from our management that would otherwise be available for our regular business operations, which could harm our business.
34
We may not be successful in executing our strategy of disposing of selected assets, which could hinder our ability to expand our presence in markets that will enhance and expand our brand preference.
We regularly review our business to identify properties or other assets that we believe are in markets or of a property type that may not benefit us as much as other markets or property types. One of our strategies is to selectively dispose of hotel properties and use sale proceeds to fund our growth in markets that will enhance and expand our brand presence. We cannot assure you that we will be able to consummate any such sales on commercially reasonable terms or at all, or that we will actually realize any anticipated benefits from such sales. Dispositions of real estate assets are particularly difficult during the current economic downturn, as financing alternatives are extremely limited for potential buyers. The current economic downturn and credit crisis have adversely affected the real estate market and caused a significant reduction in sales of hotel properties. Our inability to sell assets, or to sell such assets at attractive prices, could have an adverse impact on our ability to realize proceeds for reinvestment.
Timing, budgeting and other risks could delay our efforts to develop, redevelop or renovate the properties that we own, or make these activities more expensive, which could reduce our profits or impair our ability to compete effectively.
We must maintain and renovate the properties that we own in order to remain competitive, maintain the value and brand standards of our properties and comply with applicable laws and regulations. These efforts are subject to a number of risks, including:
| • | construction delays or cost overruns (including labor and materials) that may increase project costs; |
| • | obtaining zoning, occupancy and other required permits or authorizations; |
| • | governmental restrictions on the size or kind of development; |
| • | force majeure events, including earthquakes, tornados, hurricanes, floods or tsunamis; and |
| • | design defects that could increase costs. |
Developing new properties typically involves lengthy development periods during which significant amounts of capital must be funded before the properties can begin to operate. If the cost of funding these developments or renovations exceeds budgeted amounts, profits could be reduced.
Similarly, the timing of capital improvements can affect property performance, including occupancy and average daily rate, particularly if we need to close a significant number of rooms or other facilities, such as ballrooms, meeting spaces or restaurants. Moreover, the investments that we make may fail to improve the performance of the properties in the manner that we expect.
If we are not able to begin operating properties as scheduled, or if investments adversely affect or fail to improve performance, our ability to compete effectively would be diminished and our revenues could be reduced.
If we or our third-party property owners, including our hospitality venture partners, are unable to repay or refinance mortgages secured by the related properties, our revenues could be reduced and our business could be harmed.
Many of the properties that our third-party property owners and our hospitality venture partners own, and a small number of properties that we own, are pledged as collateral for mortgage loans entered into when the related properties were purchased or refinanced. If we, our third-party property owners or our hospitality venture partners are unable to repay or refinance maturing indebtedness on favorable terms or at all, the lenders could declare a default, accelerate the related debt and repossess the related property. In 2008, we made a $278 million loan to an entity in order to finance its purchase of the Hyatt Regency Waikiki Beach Resort and Spa. In the current economic environment, an increasing number of property owners are experiencing financial difficulties
35
and the properties they own are increasingly vulnerable to financial stress. Debt defaults could lead third-party property owners or our hospitality venture partners to sell the property on unfavorable terms or, in the case of secured debt, to convey the mortgaged property to the lender. Any such sales or repossessions could, in certain cases, result in the termination of our management agreements or eliminate any anticipated income and cash flows from, and, if applicable, our invested capital in, such property, which could significantly harm our business.
If we or our third-party owners, franchisees or development partners are unable to access the capital necessary to fund current operations or implement our plans for growth, our profits could be reduced and our ability to compete effectively could be diminished.
The hospitality industry is a capital intensive business that requires significant capital expenditures to develop, operate, maintain and renovate properties. Access to the capital that we or our third-party owners, franchisees or development partners need to finance the construction of new properties or to maintain and renovate existing properties is critical to the continued growth of our business and our revenues.
Over the past eighteen months, the credit markets and the financial services industry have experienced a period of significant disruption characterized by the bankruptcy, failure, collapse or sale of various financial institutions, increased volatility in securities prices, severely diminished liquidity and credit availability and a significant level of intervention by the governments of the United States and other countries. As a result of these market conditions, the cost and availability of capital has been and may continue to be adversely affected by illiquid credit markets and wider credit spreads. In particular, in the current environment, available capital for new development is extremely limited if available at all. The availability of capital or the conditions under which we or our third-party owners, franchisees or development partners can obtain capital can have a significant impact on the overall level and pace of future development and therefore the ability to grow our revenues. The recent disruption in the capital markets has diminished the ability and desire of existing and potential development partners to access capital necessary to develop properties actively. These disruptions could also result in reductions of our credit ratings, which would increase our cost of borrowing. Our ability to access additional capital could also be limited by the terms of our revolving credit facility, which restricts our ability to incur debt under certain circumstances. Additionally, if one or more of the financial institutions that support our revolving credit facility fails, we may not be able to find a replacement, which would reduce the availability of funds that we can borrow under the facility.
If we are forced to spend larger amounts of cash from operating activities than anticipated to operate, maintain or renovate existing properties, then our ability to use cash for other purposes, including acquisition or development of properties, could be limited and our profits could be reduced. Similarly, if we cannot access the capital we need to fund our operations or implement our growth strategy, we may need to postpone or cancel planned renovations or developments, which could impair our ability to compete effectively and harm our business.
If we fail to meet performance standards under a contractual performance obligation, our profits could be reduced.
In connection with the acquisition of the AmeriSuites brand in 2005, we assumed obligations under a management agreement with a third-party owner of multiple properties to make payments based on specified thresholds for those properties. As a result of the removal of rooms from inventory during renovation of the subject properties upon conversion to the Hyatt Place brand and due to the decline for lodging products and services as a result of the economic downturn, we have had to make payments under this agreement and may be obligated to make additional payments under this agreement up to a maximum of $50 million (including the $18 million paid through December 31, 2009). These payments could lower our profits and reduce our cash flows.
36
If we become liable for losses related to loans we have provided or guaranteed to third parties, our profits could be reduced.
When we enter into management or franchise agreements with third parties, including hospitality ventures, from time to time we make loans for hotel development expenditures, which may include selected pre-opening expenses. Weak performance of or delays in opening properties that we may invest in through loans to third parties, particularly as a result of the economic recession or the financial condition of third-party property owners or franchisees, could result in losses if third-party property owners or franchisees default on loans that we provide. In 2009, we recorded approximately $9 million in provisions against various loans of this type. In 2008 we wrote off a $61 million mezzanine loan that was fully reserved for in 2007.
To secure financing for three of our unconsolidated hospitality ventures, we have provided to third-party lenders financial guarantees related to the timely completion of the construction of the hotel or the timely repayment of the associated debt. The guarantees are limited to our portion of the underlying obligation. As of December 31, 2009 our maximum contingent liability was $17 million.
If we are liable for losses related to loans we have provided or guaranteed to third parties, our costs could increase and our profits could fall.
In any particular period, our expenses may not decrease at the same rate that our revenues may decrease, which could have an adverse effect on our net cash flows, margins and profits.
Many of the expenses associated with managing, franchising or owning hotels and residential and vacation ownership properties are relatively fixed. These expenses include:
| • | personnel costs; |
| • | interest; |
| • | rent; |
| • | property taxes; |
| • | insurance; and |
| • | utilities. |
If we are unable to decrease these costs significantly or rapidly when demand for our hotels and other properties decreases, the decline in our revenues can have a particularly adverse effect on our net cash flows and profits. This effect can be especially pronounced during periods of economic contraction or slow economic growth, such as the current economic recession. Economic downturns generally affect the results derived from owned property more significantly than those derived by managers and franchisors given the greater exposure that the owners have to the properties’ performance. During the recent economic downturn, our revenues have declined at a greater rate than our costs. During the year ended December 31, 2009, our consolidated revenues declined by 13.2% while our direct and selling, general and administrative expenses declined by 5.4%, compared to the same period in 2008. During the year ended December 31, 2009, the revenues of our owned and leased hotels declined by 16.7%, while corresponding owned and leased hotel expenses declined by 7.6%, compared to the same period in 2008. Where cost-cutting efforts are insufficient to offset declines in revenues, we could experience in a material decline in margins and potentially negative cash flows.
If we are unable to establish and maintain key distribution arrangements for our properties, the demand for our rooms and our revenues could fall.
Some of the rooms at hotels and resorts that we manage, franchise or own are booked through third-party internet travel intermediaries and online travel service providers. We also engage third-party intermediaries who collect fees by charging our hotels and resorts a commission on room revenues, including travel agencies and
37
meeting and event management companies. A failure by our distributors to attract or retain their customer bases would lower demand for hotel rooms and, in turn, reduce our revenues.
If bookings by these third-party intermediaries increase, these intermediaries may be able to obtain higher commissions or other significant contract concessions from us, increasing the overall cost of these third-party distribution channels. Some of our distribution agreements are not exclusive, have a short term, are terminable at will, or are subject to early termination provisions. The loss of distributors, increased distribution costs, or the renewal of distribution agreements on significantly less favorable terms could adversely impact our business.
If the amount of sales made through third-party internet travel intermediaries increases significantly, consumer loyalty to our brand could decrease and our revenues could fall.
We expect to derive most of our business from traditional channels of distribution and our website. However, consumers now use internet travel intermediaries regularly. Some of these intermediaries are attempting to increase the importance of price and general indicators of quality (such as “four-star downtown hotel”) at the expense of brand identification. These agencies hope that consumers will eventually develop brand loyalties to their reservation system rather than to our brands. If the amount of sales made through internet travel intermediaries increases significantly and consumers develop stronger loyalties to these intermediaries rather than to our brands, our business and revenues could be harmed.
If we are not able to develop new initiatives, including new brands, successfully, our business and profitability could be harmed.
We often develop and launch new initiatives, including new brands or marketing programs, which can be a time-consuming and expensive process. For example, we launched our Andaz brand in 2007. Since then, we have invested capital and resources in owned real estate, property development, brand development and brand promotion. If such initiatives are not well received by our associates, guests and owners, they may not have the intended effect. We may not be able to recover the costs incurred in developing Andaz or other development projects and initiatives or to realize their intended or projected benefits, which could lower our profits.
Labor shortages could restrict our ability to operate our properties or grow our business or result in increased labor costs that could reduce our profits.
Our success depends in large part on our ability to attract, retain, train, manage and engage our associates. Our properties are staffed 24 hours a day, seven days a week by approximately 80,000 associates around the world. If we and our franchisees are unable to attract, retain, train and engage skilled associates, our ability to manage and staff our properties adequately could be impaired, which could reduce customer satisfaction. Staffing shortages could also hinder our ability to grow and expand our business. Because payroll costs are a major component of the operating expenses at our properties, a shortage of skilled labor could also require higher wages that would increase our labor costs, which could reduce our profits and the profits of our third-party owners.
38
Negotiations of collective bargaining agreements, or changes in labor legislation, could disrupt our operations, increase our labor costs or interfere with the ability of our management to focus on executing our business strategies.
Certain of our properties are subject to collective bargaining agreements, similar agreements or regulations enforced by governmental authorities. If relationships with our associates, other field personnel or the unions that represent them become adverse, the properties we manage, franchise or own could experience labor disruptions such as strikes, lockouts and public demonstrations. Labor disruptions, which are generally more likely when collective bargaining agreements are being renegotiated, could harm our relationship with our associates or cause us to lose guests. Additionally, labor regulation could lead to higher wage and benefit costs, changes in work rules that raise operating expenses, legal costs and limitations on our ability or the ability of our third-party property owners and franchisees to take cost saving measures during economic downturns. We do not have the ability to control the negotiations of collective bargaining agreements covering unionized labor employed by third-party property owners and franchisees.
We and our third-party property owners and franchisees may also become subject to additional collective bargaining agreements in the future. Proposed legislation in Congress known as the Employee Free Choice Act could increase the likelihood of a union obtaining recognition by increasing the use of card check authorization and avoiding a secret ballot election. This legislation could also give third-party arbitrators the ability to impose collective bargaining agreement terms on us or our third-party property owners and franchisees, and our associates, if we, our third-party property owners or franchisees and a labor union are unable to agree upon a collective bargaining agreement. If this legislation or similar laws are passed, more of our associates or other field personnel could be subject to increased organizational efforts, which could potentially lead to disruptions or require more of our management’s time to address unionization issues. These or similar agreements or legislation could disrupt our operations, hinder our ability to cross-train and cross-promote our associates due to prescribed work rules and job classifications, reduce our profitability, or interfere with the ability of our management to focus on executing our business strategies.
The loss of our senior executives or key field personnel, such as our general managers, could significantly harm our business.
Our ability to maintain our competitive position is dependent to a large degree on the efforts and skills of our senior executives. We have entered into employment letter agreements with certain of our senior executives. However, we cannot guarantee that these individuals will remain with us. Finding suitable replacements for our senior executives could be difficult. We currently do not have a life insurance policy or key person insurance policy with respect to any of our senior executives. Losing the services of one or more of these senior executives could adversely affect our strategic relationships, including relationships with our third-party property owners, franchisees, hospitality venture partners and vendors, and limit our ability to execute our business strategies.
We also rely on the general managers at each of our owned and managed properties to run daily operations and oversee our associates. These general managers are trained professionals in the hospitality industry and have extensive experience in many markets worldwide. The failure to retain, train or successfully manage our general managers for our properties could negatively affect our operations.
Because we derive a portion of our revenues from operations outside the United States, the risks of doing business internationally could lower our revenues, increase our costs, reduce our profits or disrupt our business.
We currently manage, franchise or own hotels and resorts in 45 countries located on six continents around the world. Our operations outside the United States represented approximately 20% of our revenues for the year ended December 31, 2009. We expect that revenues from our international operations will continue to account for an increasing portion of our total revenues.
39
As a result, we are subject to the risks of doing business outside the United States, including:
| • | the laws, regulations and policies of foreign governments relating to investments and operations, as well as U.S. laws affecting the activities of U.S. companies abroad; |
| • | limitations/penalties on the repatriation of non-U.S. earnings; |
| • | changes in regulatory requirements, including imposition of tariffs or embargoes, export controls and other trade restrictions; |
| • | political and economic instability; |
| • | the difficulty of managing an organization doing business in many jurisdictions; |
| • | import and export licensing requirements and regulations, as well as unforeseen changes in export regulations; |
| • | potential negative consequences from changes in taxation policies and currency exchange rate fluctuations; |
| • | uncertainties as to local laws and enforcement of contract and intellectual property rights and occasional requirements for onerous contract clauses; and |
| • | rapid changes in government, economic and political policies, political or civil unrest, acts of terrorism or the threat of international boycotts or U.S. anti-boycott legislation. |
While these factors and the impact of these factors are difficult to predict, any one or more of them could lower our revenues, increase our costs, reduce our profits or disrupt our business.
Exchange rate fluctuations could result in significant foreign currency gains and losses or lead to costs and risks related to exchange rate hedging activities.
Conducting business in currencies other than U.S. dollars subjects us to fluctuations in currency exchange rates that could have a negative impact on our financial results. We translate the value of foreign currency-denominated amounts into U.S. dollars and we report our consolidated financial results of operations in U.S. dollars. Because the value of the U.S. dollar fluctuates relative to other currencies, revenues that we generate or expenses that we incur in other currencies could significantly increase or decrease our revenues or expenses as reported in U.S. dollars. Our exposure to foreign currency exchange rate fluctuations will continue to grow if the relative contribution of our operations outside the United States increases.
We enter into foreign exchange agreements with financial institutions to reduce our exposure to fluctuations in currency exchange rates referred to as hedging activities. However, these hedging activities may not eliminate foreign currency risk entirely and involve costs and risks of their own, such as ongoing management time and expertise and external costs related to executing hedging activities.
If purchasers default on the loans we provide to finance their purchases of our vacation ownership properties, the revenues and profits we derive from our vacation ownership business could be reduced.
We provide secured financing to some of the purchasers of our vacation ownership properties in respect of which we are subject to the risk of purchaser default. If a purchaser defaults under the financing we provide, we could be forced to write off the loan and reclaim ownership of the property. If the property has declined in value, we may incur impairment charges or losses as a result. In addition, we may be unable to resell the property in a timely manner or at the same price. As of December 31, 2009, we had $52 million of mortgage receivables, net of allowances associated with these activities. In addition, if a purchaser of a vacation ownership property defaults on the related loan during the early part of the amortization period, we may not have recovered the marketing, selling and general and administrative costs associated with the sale of such vacation ownership
40
property. If we are unable to recover any of the principal amount of the loan from a defaulting purchaser, or if our allowances for losses from such defaults are inadequate, the profits we derive from our vacation ownership business could be reduced.
Private resales of our vacation ownership interests could lower the demand or prices for our vacation ownership properties, which could reduce our revenues and our profits.
We develop, sell and manage vacation ownership properties in select locations as part of the Hyatt Vacation Club. Private resales by owners of these vacation ownership interests in the secondary market could reduce demand or prices for new vacation ownership interests, particularly if the owners sell their interests at a significant discount. Lower demand or prices for our vacation ownership interests could reduce our revenues and our profits.
Our failure to comply with applicable laws and regulations may increase our costs, reduce our profits or limit our growth.
Our business, properties and associates are subject to a variety of laws and regulations. Generally, these laws and regulations address our sales and marketing efforts, our handling of privacy issues and customer data, our ability to obtain licenses for business operations such as sales of food and liquor, immigration matters, environmental, health and safety, gaming, competition and trade laws, among other things.
Our franchising and vacation ownership businesses and our operations outside the United States are also subject to particular laws and regulation affecting those businesses:
Franchising
Our franchising business is subject to various state laws as well as to regulations enacted by the Federal Trade Commission (FTC). A number of states require franchisors to register with the state or to make extensive disclosures to potential franchisees in connection with offers and sales in those states. The FTC also regulates the manner and substance of our disclosures to prospective franchisees. In addition, several states have “franchise relationship laws” or “business opportunity laws” that limit the ability of franchisors to terminate franchise agreements or to withhold consent to the renewal or transfer of those agreements.
Vacation Ownership
Our vacation ownership properties are subject to extensive state regulation in both the state in which the property is located and the states in which the property is marketed and sold. Our marketing for these properties is also subject to federal regulation of certain marketing practices, including federal telemarketing regulations. In addition, the laws of most states in which we sell vacation ownership interests give the purchaser the right to rescind the purchase contract within a specified time period.
International Operations
Our business operations in countries outside the United States are subject to a number of U.S. federal laws and regulations, including restrictions imposed by the Foreign Corrupt Practices Act (FCPA) as well as trade sanctions administered by the Office of Foreign Assets Control (OFAC) and the Commerce Department. The FCPA is intended to prohibit bribery of foreign officials or parties and requires public companies in the United States to keep books and records that accurately and fairly reflect those companies’ transactions. OFAC and the Commerce Department administer and enforce economic and trade sanctions based on U.S. foreign policy and national security goals against targeted foreign states, organizations and individuals.
41
If we fail to comply with these laws and regulations, we could be exposed to claims for damages, financial penalties, reputational harm, incarceration of our employees or restrictions on our operation or ownership of hotels and other properties, including the termination of our management, franchising and ownership rights. These restrictions could increase our costs of operations, reduce our profits or cause us to forgo development opportunities that would otherwise support our growth.
The extensive environmental requirements to which we are subject could increase our environmental costs and liabilities, reduce our profits or limit our ability to run our business.
Our operations and the properties we manage, own and develop are subject to extensive environmental laws and regulations of various federal, state, local and foreign governments, including requirements addressing:
| • | health and safety; |
| • | the use, management and disposal of hazardous substances and wastes; |
| • | discharges of waste materials into the environment, such as refuse or sewage; and |
| • | air emissions. |
We could be subject to liability under some of these laws for the costs of investigating or remediating hazardous substances or wastes on, under, or in real property we currently or formerly manage, own or develop, or third-party sites where we sent hazardous substances or wastes for disposal. We could be held liable under these laws regardless of whether we knew of, or were at fault in connection with, the presence or release of any such hazardous or toxic substances or wastes. Some of these laws make each covered person responsible for all of the costs involved, even if more than one person may have been responsible for the contamination. Furthermore, a person who arranges for hazardous substances or wastes to be transported, disposed of or treated offsite, such as at disposal or treatment facilities, may be liable for the costs of removal or remediation if those substances are released into the environment by third parties at such disposal or treatment facilities. The presence or release of hazardous or toxic substances or wastes, or the failure to properly clean up such materials, could cause us to incur significant costs, or jeopardize our ability to develop, use, sell or rent real property we own or operate or to borrow using such property as collateral.
Other laws and regulations require us to manage, abate or remove materials containing hazardous substances such as mold, lead or asbestos during demolitions, renovations or remodeling at properties that we manage, own or develop or to obtain permits for certain of our equipment or operations. The costs of such management, abatement, removal or permitting could be substantial. Complying with these laws and regulations, or addressing violations arising under them, could increase our environmental costs and liabilities, reduce our profits or limit our ability to run our business. Existing environmental laws and regulations may be revised or new laws and regulations related to global climate change, air quality, or other environmental and health concerns may be adopted or become applicable to us. The identification of new areas of contamination, a change in the extent or known scope of contamination or changes in cleanup requirements, or the adoption of new requirements governing our operations could have a material adverse effect on our results or operations, financial condition and business.
If the insurance that we carry does not sufficiently cover damage or other potential losses involving properties that we manage or own, our profits could be reduced.
We carry insurance from solvent insurance carriers that we believe is adequate for foreseeable losses and with terms and conditions that are reasonable and customary. Nevertheless, market forces beyond our control could limit the scope of the insurance coverage that we can obtain or restrict our ability to buy insurance coverage at reasonable rates. In addition, the recent disruption in the financial markets makes it more difficult to evaluate the stability of insurance companies or their ability to meet their payment obligations. In the event of a substantial loss, the insurance coverage that we carry may not be sufficient to pay the full value of our financial
42
obligations or the replacement cost of any lost investment. Because certain types of losses are significantly uncertain, they can be uninsurable or too expensive to insure. In some cases, these factors could result in certain losses being completely uninsured. As a result, we could lose some or all of the capital we have invested in a property, as well as the anticipated future revenues from the property, we could remain obligated for performance guarantees in favor of third-party property owners or for their debt or other financial obligations and we may not have sufficient insurance to cover awards of damages resulting from our liabilities. If the insurance that we carry does not sufficiently cover damages or other losses, our profits could be adversely affected.
Any failure to protect our trademarks and intellectual property could reduce the value of our brand names and harm our business.
The reputation and perception of our brands is critical to our success in the hospitality industry. If our trademarks or intellectual property are copied or used without authorization, the value of our brands, their reputation, our competitive advantages and our goodwill could be harmed. We regularly apply to register our trademarks in the United States and other countries. However, we cannot assure you that those trademark registrations will be granted or that the steps we take to protect our trademarks or intellectual property in the United States and other countries will be adequate to prevent others, including third parties or former employees, from copying or using our trademarks or intellectual property without authorization. Our intellectual property is also vulnerable to unauthorized use in some countries outside the United States, where local law may not adequately protect it.
Monitoring the unauthorized use of our intellectual property is difficult. As we have in the past, we may need to resort to litigation to enforce our intellectual property rights. Litigation of this type could be costly, force us to divert our resources, lead to counterclaims or other claims against us or otherwise harm our business. Any failure to maintain and protect our trademarks and other intellectual property could reduce the value of our brands and harm our business.
Third-party claims that we infringe their intellectual property rights could subject us to damages and other costs and expenses.
Third parties may make claims against us for infringing their intellectual property rights. Any such claims, even those without merit, could:
| • | be expensive and time consuming to defend; |
| • | force us to stop providing products or services that use the intellectual property that is being challenged; |
| • | force us to redesign or rebrand our products or services; |
| • | divert our management’s attention and resources; |
| • | force us to enter into royalty or licensing agreements to obtain the right to use a third party’s intellectual property; or |
| • | force us to pay significant damages. |
In addition, we may be required to indemnify third-party owners of the hotels we manage or franchisees for any losses they incur as a result of any such infringement claims. Any necessary royalty or licensing agreements may not be available to us on acceptable terms. Any costs, lost revenues, changes to our business or management attention related to intellectual property claims against us, whether successful or not, could impact our business.
43
Adverse litigation judgments or settlements resulting from legal proceedings in which we may be involved in the normal course of our business could reduce our profits or limit our ability to operate our business.
In the normal course of our business, we are often involved in various legal proceedings. The outcome of these proceedings cannot be predicted. If any of these proceedings were to be determined adversely to us or a settlement involving a payment of a material sum of money were to occur, there could be a material adverse effect on our financial condition and results of operations. Additionally, we could become the subject of future claims by third parties, including current or former third-party property owners, guests who use our properties, our employees, our investors or regulators. Any significant adverse litigation judgments or settlements would reduce our profits and could limit our ability to operate our business.
Information technology system failures, delays in the operation of our information technology systems or system enhancement failures could reduce our revenues and profits and harm the reputation of our brands and our business.
Our success depends on the efficient and uninterrupted operation of our information technology systems. For example, we internally developed the technology for our central reservation system, which allows bookings by hotels directly, via telephone through our call centers, by travel agents, online through our website www.hyatt.com, and through our online reservations partners. In addition, we depend on information technology to run our day-to-day operations, including, among others, hotel services and amenities such as guest check-in and check-out, housekeeping and room service and systems for tracking and reporting financial results of our hotels and the Company.
Our information technology systems are vulnerable to damage or interruption from fire, floods, hurricanes, power loss, telecommunications failures, computer viruses, break-ins and similar events. The occurrence of any of these natural disasters or unanticipated problems at any of our information technology facilities or any of our call centers could cause interruptions or delays in our business or loss of data, or render us unable to process reservations.
In addition, if our information technology systems are unable to provide the information communications capacity that we need, or if our information technology systems suffer problems caused by installing system enhancements, we could experience similar failures or interruptions. If our information technology systems fail and our redundant systems or disaster recovery plans are not adequate to address such failures, or if our property and business interruption insurance does not sufficiently compensate us for any losses that we may incur, our revenues and profits could be reduced and the reputation of our brands and our business could be harmed.
Failure to maintain the integrity of internal or customer data could result in faulty business decisions, harm to our reputation or subject us to costs, fines or lawsuits.
We are required to collect and retain large volumes of internal and customer data, including credit card numbers and other personally identifiable information as our various information technology systems enter, process, summarize and report such data. We also maintain personally identifiable information about our employees. The integrity and protection of our customer, employee and company data is critical to our business. Our customers expect that we will adequately protect their personal information, and the regulations applicable to security and privacy is increasingly demanding, both in the United States and in other jurisdictions where we operate. A theft, loss, fraudulent or unlawful use of customer, employee or company data could harm our reputation or result in remedial and other costs, fines or lawsuits.
If we fail to stay current with developments in technology necessary for our business, our operations could be harmed and our ability to compete effectively could be diminished.
Sophisticated information technology and other systems are instrumental for the hospitality industry, including systems used for our central reservations, revenue management, property management and our Hyatt Gold Passport program, as well as technology systems that we make available to our guests. These information
44
technology and other systems must be refined, updated, or replaced with more advanced systems on a regular basis. Developing and maintaining these systems may require significant capital. If we are unable to replace or introduce information technology and other systems as quickly as our competitors or within budgeted costs or schedules when these systems become outdated or need replacing, or if we are unable to achieve the intended benefits of any new information technology or other systems, our operations could be harmed and our ability to compete effectively could be diminished.
We may be liable for proposed tax liabilities and the final amount of taxes paid may exceed the amount of applicable reserves, which could reduce our profits.
The Internal Revenue Service (IRS) recently completed its examinations of the consolidated federal income tax returns of Hyatt Hotels Corporation, Hyatt Corporation, AIC and H Group for the taxable years ended December 31, 2003, 2004 and 2005. Based on these examinations (and on examination adjustments for the taxable year ended January 31, 2001), we could be liable for up to $42 million of additional taxes and penalties (plus accrued interest). We and our affiliates have filed protests with the IRS Appeals Office contesting these proposed tax liabilities. We are also subject to ongoing tax audits and disputes in various state, local and foreign jurisdictions. We believe we have established adequate reserves for potential tax liabilities, but the final amount of taxes assessed and paid could exceed the amount of such reserves, which could reduce our profits.
Changes in federal, state, local or foreign tax law, interpretations of existing tax law or agreements with tax authorities could affect our profitability and financial condition by increasing our tax costs.
We are subject to taxation at the federal, state or provincial and local levels in the United States and various other countries and jurisdictions. Our future tax rates could be affected by changes in the composition of earnings in jurisdictions with differing tax rates, changes in the valuation of our deferred tax assets and liabilities, or changes in determinations regarding the jurisdictions in which we are subject to tax. From time to time the U.S. federal, state, local and foreign governments make substantive changes to tax rules and the application thereof, which could result in materially higher corporate taxes than would be incurred under existing tax law or interpretation and could adversely impact profitability. The current U.S. administration has put forth several revenue raising proposals, some of which target tax provisions that benefit us, including proposals to limit the ability of U.S. companies to continue to defer U.S. taxes on foreign income. State and local tax authorities have also increased their efforts to increase revenues through changes in tax law and audits. Such changes and proposals, if enacted, could increase our future effective income tax rates.
We are a party to certain agreements with foreign tax authorities that reduce or defer the amount of tax we pay. The expiration of such agreements, or changes in circumstances or in interpretation of such agreements, could increase our tax costs.
The terms of our revolving credit facility and the indenture governing our senior notes place restrictions on us and certain of our subsidiaries, reducing operational flexibility and creating default risks.
The terms of our revolving credit facility and the indenture governing our senior notes contain covenants that place restrictions on us and certain of our subsidiaries. The covenants under our revolving credit facility restrict, among other things, our ability to:
| • | incur additional debt, due to a requirement that we satisfy a maximum leverage ratio test, a minimum interest coverage ratio test and a maximum secured debt ratio test; |
| • | engage in other business activities or engage in certain transactions with affiliates; and |
| • | change our fiscal year or change our organizational documents. |
45
Similarly, the covenants under our revolving credit facility and the indenture governing our senior notes restrict, among other things, our ability to:
| • | create any liens on certain assets to secure debt; |
| • | enter into certain sale and leaseback transactions; or |
| • | enter into mergers or consolidations or transfer all or substantially all of our assets. |
Failure to comply with these restrictive covenants could result in an event of default that, if not waived or cured, if applicable, could result in the acceleration of all or a substantial portion of our outstanding debt under our revolving credit facility and our senior notes.
An increase in interest rates would increase interest costs on our revolving credit facility and any variable rate debt we incur, which could adversely impact our ability to refinance existing debt or acquire assets.
Borrowings under our revolving credit facility bear interest at the London Interbank Offered Rate (LIBOR) or an alternative base rate (defined as the greatest of (a) the federal funds rate plus 0.5%, (b) the prime rate and (c) one-month LIBOR plus 1.0%) plus an additional margin that is based on our credit ratings. To the extent we borrow under the revolving credit facility, any increase in the interest rate applicable to such borrowings will reduce our cash flows available for other corporate purposes including investments in our portfolio. Further, rising interest rates could limit our ability to refinance existing debt when it matures and increase interest costs on any debt that is refinanced. We may from time to time enter into agreements such as interest rate swaps or other interest rate hedging contracts. While these agreements may lessen the impact of rising interest rates, they also expose us to the risk that other parties to the agreements will not perform or that the agreements will be unenforceable. In addition, an increase in interest rates could decrease the amount third parties are willing to pay for our assets, thereby limiting our ability to dispose of assets as part of our business strategy. Our revolving credit facility also imposes an additional fee paid to revolving lenders whose loans mature on June 29, 2012 if the calculation of LIBOR falls below 1.00% in the case of LIBOR-based borrowings (including alternative base rate borrowings based on the one-month LIBOR).
Rating agency downgrades may increase our cost of capital.
The interest rate of borrowings and the facility fee under our revolving credit facility are determined by a pricing grid which is dependent on our credit ratings by Standard & Poor’s Rating Group and Moody’s Investors Service, Inc. Lower ratings result in a higher cost of funds. Therefore, if these independent rating agencies were to downgrade our credit ratings or if we no longer have a credit rating from either agency, the cost of our borrowing and the amount of the facility fee under our revolving credit facility will increase as specified in the pricing grid. Additionally, any future downgrade of our credit ratings by the rating agencies could reduce or limit our access to capital and increase our cost of capital. We and a number of our competitors have had either a rating or outlook downgrade by the rating agencies as a result of the economic downturn and decreased demand for hospitality products and services. Given the cyclical nature of the hospitality industry and its dependence on the underlying health of the economy, we could be subject to frequent changes in our credit rating. As the economic recovery is expected to be slow in the near term there is a heightened risk of our credit ratings being revised downward.
We have a large amount of cash and cash equivalents and are exposed to counterparty risk with respect to these deposits.
All of our cash that is not required to fund our daily operating activities is invested in interest bearing investments with a greater focus placed on capital preservation than on investment return. The majority of our cash balances are held on deposit with high quality financial institutions that hold long-term ratings of at least A or A2 from Standard & Poor’s Rating Group or Moody’s Investor Service, Inc., respectively, and in AAA-rated money market funds. As such, we are exposed to counterparty risk on our $1.3 billion of cash and cash equivalents as of December 31, 2009.
46
If we are unable to assess favorably the effectiveness of our internal control over financial reporting, or if our independent registered public accounting firm is unable to provide an unqualified attestation report on our internal controls, our stock price could be adversely affected.
Pursuant to Section 404 of the Sarbanes-Oxley Act of 2002 and beginning with our Annual Report on Form 10-K for the year ending December 31, 2010, our management will be required to report on, and our independent registered public accounting firm to attest to, the effectiveness of our internal control over financial reporting. The rules governing the standards that must be met for management to assess our internal control over financial reporting are complex and require significant documentation, testing and possible remediation. We are currently in the process of reviewing, documenting and testing our internal control over financial reporting. We may encounter problems or delays in completing the implementation of any changes necessary to make a favorable assessment of our internal control over financial reporting. In addition, in connection with the attestation process by our independent registered public accounting firm, we may encounter problems or delays in completing the implementation of any requested improvements and receiving a favorable attestation. If we cannot favorably assess the effectiveness of our internal control over financial reporting, or if our independent registered public accounting firm is unable to provide an unqualified attestation report on our internal controls, investor confidence and our stock price could be reduced.
We will incur increased costs and become subject to additional regulations and requirements as a result of becoming a public company, which could lower our profits or make it more difficult to run our business.
As a public company, we will incur significant legal, accounting and other expenses that we have not incurred as a private company, including costs associated with public company reporting requirements. We also have incurred and will incur costs associated with the Sarbanes-Oxley Act of 2002 and related rules implemented by the SEC and the New York Stock Exchange. The expenses incurred by public companies generally for reporting and corporate governance purposes have been increasing. We expect these rules and regulations to increase our legal and financial compliance costs and to make some activities more time-consuming and costly, although we are currently unable to estimate these costs with any degree of certainty. These laws and regulations could also make it more difficult or costly for us to obtain certain types of insurance, including director and officer liability insurance, and we may be forced to accept reduced policy limits and coverage or incur substantially higher costs to obtain the same or similar coverage. These laws and regulations could also make it more difficult for us to attract and retain qualified persons to serve on our board of directors, our board committees or as our executive officers. Furthermore, if we are unable to satisfy our obligations as a public company, we could be subject to delisting of our common stock, fines, sanctions and other regulatory action and potentially civil litigation.
Risks Related to Corporate Governance and Stockholder Matters
Pritzker family business interests have substantial control over us and have the ability to control the election of directors and other matters submitted to stockholders for approval, which will limit your ability to influence corporate matters or result in actions that you do not believe to be in our interests or your interests.
Our Class B common stock is entitled to ten votes per share and our Class A common stock is entitled to one vote per share. Pritzker family business interests beneficially own, in the aggregate, 104,893,502 shares, or approximately 80.68%, of our Class B common stock, representing approximately 60.33% of the outstanding shares of our common stock and approximately 78.05% of the total voting power of our outstanding common stock. As a result, consistent with the voting agreements contained in the Amended and Restated Global Hyatt Agreement and the Amended and Restated Foreign Global Hyatt Agreement, Pritzker family business interests will be able to exert a significant degree of influence or actual control over our management and affairs and over matters requiring stockholder approval, including the election of directors, a merger, consolidation or sale of all or substantially all of our assets and any other significant transaction. While the voting agreements are in effect, they may provide our board of directors with the effective control over matters requiring stockholder approval. Because of our dual class ownership structure, Pritzker family business interests will continue to exert a significant degree of influence or actual control over matters requiring stockholder approval, even if they own
47
less than 50% of the outstanding shares of our common stock. This concentrated control will limit your ability to influence corporate matters, and the interests of Pritzker family business interests may not coincide with our interests or your interests. As a result, we may take actions that you do not believe to be in our interests or your interests and that could depress our stock price. See also “ —Voting agreements entered into with or among our major stockholders, including Pritzker family business interests, will result in a substantial number of our shares being voted consistent with the recommendation of our board of directors, and may limit your ability to influence the election of directors and other matters submitted to stockholders for approval.”
In addition, the difference in the voting rights between our Class A common stock and Class B common stock could diminish the value of the Class A common stock to the extent that investors or any potential future purchasers of our common stock ascribe value to the superior voting rights of the Class B common stock.
Disputes among Pritzker family members and among Pritzker family members and the trustees of the Pritzker family trusts may result in significant distractions to our management, disrupt our business, have a negative effect on the trading price of our Class A common stock and/or generate negative publicity about Hyatt and the Pritzker family.
In the past, disputes have arisen between and among certain Pritzker family members, and between and among beneficiaries of the Pritzker family trusts and the trustees of such trusts, with respect to, among other things, the ownership, operation, governance, and management of certain Pritzker family business interests. In connection with certain of these disputes, claims were alleged, and in certain cases, proceedings were initiated, against certain Pritzker family members, including Thomas J. Pritzker, our executive chairman, and other Pritzker family members, some of whom have been or are our directors, and against the trustees, including Thomas J. Pritzker in his capacity as a co-trustee of the U.S. situs trusts. Such past allegations related to, among others, trust management and administration, and violations of certain trustee duties, including fiduciary duties. Some of these disputes led to significant negative publicity for the Pritzker family. These disputes have been resolved with no admissions or finding of any misconduct.
Recently, with respect to Hyatt, disputes arose between and among certain Pritzker family members and the trustees of trusts with respect to, among other things, our dual class structure, which became effective prior to the completion of our initial public offering. In particular, certain beneficiaries of Pritzker family trusts expressed concern that there could be a value differential between our Class A and Class B common stock based on the difference in voting rights between those two classes of stock. Additionally, certain beneficiaries of Pritzker family trusts noted that the dual class structure had the effect of extending the duration of the voting and lock-up restrictions under the Global Hyatt Agreement and Foreign Global Hyatt Agreement due to the fact that the duration of those restrictions, as originally drafted, was based, in part, on voting power of the outstanding shares of our stock owned by Pritzker family members and spouses (including any U.S. or non-U.S. situs trusts for the current or future, direct or indirect, vested or contingent, benefit of any Pritzker family members and spouses) rather than on the percentage of the outstanding shares of our stock owned by them.
In connection with these disputes, the Global Hyatt Agreement and the Foreign Global Hyatt Agreement were amended and restated in three important respects, as described under Part I, Item 1, “Business-Stockholder Agreements.” First, the agreements were amended and restated to measure the duration of the voting and lock-up restrictions under the Global Hyatt Agreement and Foreign Global Hyatt Agreement on the percentage of outstanding shares, not voting power of shares, of our stock owned by Pritzker family members and spouses (including any U.S. or non-U.S. situs trusts for the current or future, direct or indirect, vested or contingent, benefit of any Pritzker family members and spouses). Second, the agreements were amended and restated to permit Pritzker family members and spouses (including any U.S. or non-U.S. situs trusts for the current or future, direct or indirect, vested or contingent, benefit of any Pritzker family members and spouses) to sell up to 25% of their aggregate holdings of our common stock, measured as of November 4, 2009 (the date of effectiveness of our registration statement on Form S-1 (File No. 333-161068) relating to our initial public offering of our Class A common stock), during each 12-month period following the date of effectiveness of such registration
48
statement (without carry-overs), rather than 20% measured on a similar basis (though shares sold in the initial public offering counted toward the first 12-month period’s limit). Additionally, the prohibition on selling shares to any aggregator (i.e., a person who is required to file a Schedule 13D under the Exchange Act, disclosing an intent other than for investment) was removed. Third, the amended and restated agreements provide for the distribution of Hyatt stock from U.S. or non-U.S. situs trusts for the current or future, direct or indirect, vested or contingent, benefit of any Pritzker family members and spouses in consultation with the adult beneficiaries of such trusts as soon as practicable following November 4, 2009, the date of effectiveness of the registration statement relating to our initial public offering of our Class A common stock, subject to the 180-day lock-up period agreed to with the underwriters, the Amended and Restated Global Hyatt Agreement and the Amended and Restated Foreign Global Hyatt Agreement. As a result of such changes to the agreements, Pritzker family members and spouses (including any U.S. or non-U.S. situs trusts for the current or future, direct or indirect, vested or contingent, benefit of any Pritzker family members and spouses), other than those who are party to the Agreement Relating to Stock, may now sell up to 100% of their common stock over a shorter period of time. See Part I, Item 1, “Business-Stockholder Agreements” and “—A significant number of shares of our Class A common stock could be sold into the market, which could depress our stock price even if our business is doing well.” As part of these discussions, we agreed to provide, in the 2009 Registration Rights Agreement, for a shelf registration in order to facilitate sales of common stock by domestic and foreign Pritzker stockholders.
Disputes among Pritzker family members, and between and among beneficiaries of the Pritzker family trusts and the trustees of such trusts, including with respect to Hyatt, may arise or continue in the future. If such disputes occur, they may result in significant distractions to our management, disrupt our business, have a negative effect on the trading price of our Class A common stock and/or generate negative publicity about Hyatt and Pritzker family members, including Pritzker family members involved with Hyatt.
Voting agreements entered into with or among our major stockholders, including Pritzker family business interests, will result in a substantial number of our shares being voted consistent with the recommendation of our board of directors, and may limit your ability to influence the election of directors and other matters submitted to stockholders for approval.
Pritzker family business interests have entered into (or in the case of common stock owned indirectly by non-U.S. situs trusts, have expressed their desire that the trustee of such trusts and the directors of IHE, INC. and its subsidiaries act in accordance with) a voting agreement with respect to all shares of common stock beneficially owned by Pritzker family business interests. During the term of the voting agreement, which expires on the later to occur of January 1, 2015, and the date upon which more than 75% of the Company’s fully diluted shares of common stock is owned by non-Pritzker family business interests, Pritzker family business interests have agreed to vote (or in the case of common stock owned indirectly by non-U.S. situs trusts, have expressed their desire that the trustee of such trusts and the directors of IHE, INC. and its subsidiaries act in accordance with) their shares of our common stock consistent with the recommendation of our board of directors, assuming that a majority of our independent directors (excluding for such purposes any Pritzker) agree with the recommendation. In addition, other existing stockholders, including entities affiliated with Goldman Sachs & Co. and Madrone GHC, beneficially own, in the aggregate, approximately 19.3% of our outstanding Class B common stock, representing approximately 14.4% of the outstanding shares of our common stock and approximately 18.7% of the total voting power of our outstanding common stock. These entities have entered into a voting agreement with us, with respect to the shares of Class B common stock that they beneficially own, and have agreed to vote their shares of Class B common stock consistent with the recommendation of our board of directors, without any separate requirement that our independent directors agree with the recommendation. These voting agreements expire on the later to occur of December 31, 2013 and the date that Thomas J. Pritzker is no longer chairman of our board of directors. See Part I, Item 1, “Business-Stockholder Agreements.”
While the voting agreements are in effect, they may provide our board of directors with effective control over matters requiring stockholder approval, including the election of directors, a merger, consolidation or sale of all or substantially all of our assets and any other significant transaction. This is because the number of our shares
49
that are required by the voting agreements to be voted consistent with the recommendation of our board of directors will be sufficient to determine the outcome of the election of directors and other matters submitted to stockholders for approval. This will limit your ability to influence the election of directors and other matters submitted to stockholders for approval, even if you do not believe those actions to be in our interests or your interests. For instance, the voting agreements may have the effect of delaying or preventing a transaction that would result in a change of control, if our board of directors does not recommend that our stockholders vote in favor of the transaction, even if you or some or all of our major stockholders believe that the transaction is in our interests or your interests. On the other hand, the voting agreements may result in our stockholders approving a transaction that would result in a change of control, if our board of directors recommends that our stockholders vote in favor of the transaction, even if you or some or all of our major stockholders believe that the transaction is not in our interests or your interests.
A significant number of shares of our Class A common stock could be sold into the market, which could depress our stock price even if our business is doing well.
Future sales of our Class A common stock in the public market, or the perception in the market that the holders of a large number of shares intend to sell shares, could reduce the market price of our common stock. As of January 31, 2010, we had 43,869,597 shares of Class A common stock outstanding and 130,005,588 shares of Class B common stock outstanding.
Of the outstanding shares, 43,835,190 shares of Class A common stock are freely tradable in the public market without restriction or further registration under the Securities Act, unless these shares are held by any of our “affiliates,” as that term is defined in Rule 144 under the Securities Act. The remaining 34,407 outstanding shares of Class A common stock and 130,005,588 outstanding shares of Class B common stock are “restricted securities,” as that term is defined in Rule 144 under the Securities Act of 1933, as amended (the “Securities Act”). All of these restricted securities will be subject to the 180-day lock-up period agreed to with the underwriters in our initial public offering, which may be extended in specified circumstances. Restricted securities may be sold in the public market only if they are registered under the Securities Act or they qualify for an exemption from registration under Rule 144 or 701 under the Securities Act.
Substantially all of these restricted securities are subject to contractual lock-up restrictions contained in the Amended and Restated Global Hyatt Agreement, Amended and Restated Foreign Global Hyatt Agreement, Amended and Restated Agreement Relating to Stock and the 2007 Stockholders’ Agreement in addition to the 180-day lock-up period as described in Part I, Item 1, “Business-Stockholder Agreements” of this annual report. These additional restrictions may be amended, waived or terminated by the parties to those lock-up agreements in accordance with the terms of those agreements or, with respect to the Amended and Restated Global Hyatt Agreement and the Amended and Restated Foreign Global Hyatt Agreement, the 25% limitation on sales of our common stock may, with respect to each 12 month period, be increased to a higher percentage or waived entirely by the unanimous affirmative vote of our independent directors (excluding for such purposes any Pritzker), without the consent of the underwriters or us and without notice. As a result, following the expiration of the 180-day lock-up period agreed to with the underwriters, all shares of Class A common stock, including shares of Class A common stock that are required to be issued upon conversion of shares of Class B common stock, will be eligible for resale in compliance with Rule 144 or Rule 701 to the extent the lock-up restrictions contained in the Amended and Restated Global Hyatt Agreement, Amended and Restated Foreign Global Hyatt Agreement, Amended and Restated Agreement Relating to Stock or 2007 Stockholders’ Agreement, as applicable, are waived or terminated with respect to such shares.
50
Assuming the lock-up restrictions contained in the Amended and Restated Global Hyatt Agreement, Amended and Restated Foreign Global Hyatt Agreement, Amended and Restated Agreement Relating to Stock and the 2007 Stockholders’ Agreement are not amended, waived or terminated and assuming the parties to these agreements sell the maximum amount permitted to be sold during the first time period that such shares are eligible to be sold, following the expiration of the 180-day lock-up period, and subject to the provisions of Rules 144 and 701 under the Securities Act, these restricted securities will be available for sale in the public market as follows:
| Number of Shares |
Time Period | |
| 7,379,475 |
After 180 days and up to 12 months from November 4, 2009. | |
| 27,095,906 |
After 12 months and up to 24 months from November 4, 2009. | |
| 25,179,937 |
After 24 months and up to 36 months from November 4, 2009. | |
| 23,321,656 |
After 36 months and up to 42 months (3 1/ 2 years) from November 4, 2009. | |
| 16,567,913 |
After 42 months (3 1/2 years) and up to 48 months from November 4, 2009. | |
| 1,100,853 |
After 48 months and up to 54 months (4 1/ 2 years) from November 4, 2009. | |
| 15,467,060 |
After 54 months (4 1/2 years) and up to 60 months from November 4, 2009. | |
| 2,201,705 |
After 60 months and up to 66 months (5 1/ 2 years) from November 4, 2009. | |
| 11,725,490 |
After 66 months (5 1/2 years) from November 4, 2009. |
In addition, 9,250,039 shares of our Class A common stock are reserved for issuance under our LTIP, and an additional 28,006 shares of our Class A common stock are held in treasury and available for awards under our LTIP. Together, these 9,278,045 shares of Class A common stock will become eligible for sale in the public market once those shares are issued or awarded under our LTIP, subject to provisions of various award agreements, lock-up agreements and Rule 144, as applicable.
If any of these holders causes a large number of securities to be sold in the public market, the sales could reduce the trading price of our Class A common stock. These sales also could impede our ability to raise future capital.
We also may issue shares of our Class A common stock from time to time as consideration for future acquisitions and investments. If any such acquisition or investment is significant, the number of shares that we may issue may in turn be significant.
If holders of shares of our Class B common stock convert their shares of Class B common stock into shares of Class A common stock and exercise their registration rights, a significant number of shares of our Class A common stock could be sold into the market, which could reduce the trading price of our Class A common stock and impede our ability to raise future capital.
Holders of 130,005,588 shares of our Class B common stock (or 74.8% of our total outstanding shares of common stock), including Pritzker family business interests and entities affiliated with Goldman Sachs and Madrone GHC, will have rights, subject to certain conditions, to require us to file registration statements registering sales of shares of Class A common stock acquired upon conversion of such Class B common stock or to include sales of such shares of Class A common stock in registration statements that we may file for ourselves or other stockholders. In order to exercise such registration rights, the holder must be permitted to sell shares of its common stock under applicable lock-up restrictions. See Part I, Item 1, “Business-Stockholder Agreements” for additional information with respect to these lock-up provisions. Subject to compliance with applicable lock-up agreements, shares of Class A common stock sold under these registration statements can be freely sold in the public market. In the event such registration rights are exercised and a large number of shares of Class A common stock are sold in the public market, such sales could reduce the trading price of our Class A common stock. These sales also could impede our ability to raise future capital. Additionally, we will bear all expenses in connection with any such registrations (other than underwriting discounts).
51
Reports published by securities or industry analysts, including projections in those reports that exceed our actual results, could adversely affect our stock price and trading volume.
Securities research analysts have established and publish their own quarterly projections for our business. These projections may vary widely from one another and may not accurately predict the results we actually achieve. Our stock price may decline if our actual results do not match securities research analysts’ projections. Similarly, if one or more of the analysts who writes reports on us downgrades our stock or publishes inaccurate or unfavorable research about our business, our stock price could decline. If one or more of these analysts ceases coverage of our company or fails to publish reports on us regularly, our stock price or trading volume could decline.
Anti-takeover provisions in our organizational documents and Delaware law, as well as agreements with our major stockholders, may discourage or prevent a change of control, even if a sale of Hyatt would be beneficial to our stockholders, which could cause our stock price to decline and prevent attempts by our stockholders to replace or remove our current board of directors or management.
Our amended and restated certificate of incorporation and bylaws, as well as agreements with our major stockholders, contain provisions that may make it difficult to remove our board of directors and management and may discourage or delay “change of control” transactions that certain stockholders may view as beneficial or could involve the payment of a premium over prevailing market prices for our Class A common stock. These provisions include, among others:
| • | Our amended and restated certificate of incorporation provides for a dual class ownership structure, in which our Class B common stock is entitled to ten votes per share and our Class A common stock is entitled to one vote per share. As a result of this structure, our major stockholders have significant influence or actual control over matters requiring stockholder approval. |
| • | Voting agreements entered into with or among our major stockholders require these stockholders to vote their shares consistent with the recommendation of our board of directors, assuming in certain instances that a majority of our independent directors (excluding for such purposes any Pritzker) agree with the recommendation. While the voting agreements are in effect, they may provide our board of directors with effective control over matters requiring stockholder approval. |
| • | Lock-up agreements entered into with stockholders party to our 2007 Stockholders’ Agreement limit the ability of these stockholders to sell their shares to any person who would be required to file a Schedule 13D with the SEC disclosing an intent to acquire the shares other than for investment purposes and, in certain instances, to competitors of ours in the hospitality, lodging or gaming industries. |
| • | Stockholders party to our 2007 Stockholders’ Agreement have agreed, subject to certain limited exceptions, to “standstill” provisions that prevent the stockholders from acquiring additional shares of our common stock, making or participating in acquisition proposals for us or soliciting proxies in connection with meetings of our stockholders, unless the stockholders are invited to do so by our board of directors. |
| • | Our board of directors is divided into three classes, with each class serving for a staggered three-year term, which prevents stockholders from electing an entirely new board of directors at an annual meeting. |
| • | Our directors may be removed only for cause, which prevents stockholders from being able to remove directors without cause other than those directors who are being elected at an annual meeting. |
| • | Our amended and restated certificate of incorporation does not provide for cumulative voting in the election of directors. As a result, holders of our Class B common stock will control the election of directors and the ability of holders of our Class A common stock to elect director candidates will be limited. |
52
| • | Vacancies on our board of directors, and any newly created director positions created by the expansion of the board of directors, may be filled only by a majority of remaining directors then in office. |
| • | Actions to be taken by our stockholders may only be effected at an annual or special meeting of our stockholders and not by written consent. |
| • | Special meetings of our stockholders can be called only by the chairman of the board or by our corporate secretary at the direction of our board of directors. |
| • | Advance notice procedures that stockholders must comply with in order to nominate candidates to our board of directors and propose matters to be brought before an annual meeting of our stockholders may discourage or deter a potential acquirer from conducting a solicitation of proxies to elect the acquirer’s own slate of directors or otherwise attempting to obtain control of our company. |
| • | Our board of directors may, without stockholder approval, issue series of preferred stock, or rights to acquire preferred stock, that could dilute the interest of, or impair the voting power of, holders of our common stock or could also be used as a method of discouraging, delaying or preventing a change of control. |
| • | An affirmative vote of the holders of at least 80% of the voting power of our outstanding capital stock entitled to vote is required to amend any provision of our certificate of incorporation or bylaws. |
We do not intend to pay dividends on our Class A common stock for the foreseeable future and, consequently, your only opportunity to achieve a return on your investment is if the price of our Class A common stock appreciates.
We have never declared or paid cash dividends on our common stock. In addition, we must comply with the covenants in our revolving credit facility if we want to pay cash dividends. We currently intend to retain our future earnings, if any, to finance the further development and expansion of our business and do not intend to pay cash dividends in the foreseeable future. Any future determination to pay dividends will be at the discretion of our board of directors and will depend on our financial condition, results of operations, capital requirements, restrictions contained in current or future financing instruments and such other factors as our board of directors deems relevant.
Non-U.S. holders who own more than 5% of our Class A common stock may be subject to U.S. federal income tax on gain realized on the disposition of such stock.
Because we have significant U.S. real estate holdings, we may be a “United States real property holding corporation” (USRPHC) for U.S. federal income tax purposes, but we have made no determination to that effect. There can be no assurance that we do not currently constitute or will not become a USRPHC. As a result, a “non-U.S. holder” may be subject to U.S. federal income tax on gain realized on a disposition of our Class A common stock if such non-U.S. holder has owned, actually or constructively, more than 5% of our Class A common stock at any time during the shorter of (a) the five-year period ending on the date of disposition and (b) the non-U.S. holder’s holding period in such stock.
| Item 1B. | Unresolved Staff Comments. |
None.
53
| Item 2. | Properties. |
The following table sets forth a description of each owned or leased Hyatt-branded hotel property as of December 31, 2009
| Property (1) |
Location | Rooms | Ownership (2) | ||||
| Full Service: |
|||||||
| United States, Canada and the Caribbean: |
|||||||
| Park Hyatt Chicago |
Chicago, IL | 198 | 100 | % | |||
| Hyatt at The Bellevue (12) |
Philadelphia, PA | 172 | 50 | % | |||
| Park Hyatt Toronto |
Toronto, Ontario, Canada |
346 | 100 | % | |||
| Park Hyatt Washington |
Washington, DC | 216 | 100 | % | |||
| Andaz West Hollywood (3)(4) |
West Hollywood, CA | 238 | — | ||||
| Grand Hyatt New York (5) |
New York, NY | 1,311 | 100 | % | |||
| Grand Hyatt San Antonio (5) |
San Antonio, TX | 1,003 | 30 | % | |||
| Grand Hyatt San Francisco |
San Francisco, CA | 685 | 100 | % | |||
| Grand Hyatt Seattle |
Seattle, WA | 425 | 50 | % | |||
| Grand Hyatt Tampa Bay |
Tampa, FL | 445 | 100 | % | |||
| Hyatt Regency Aruba Resort & Casino (5) |
Palm Beach, Aruba, Dutch Caribbean |
357 | 100 | % | |||
| Hyatt Regency Atlanta |
Atlanta, GA | 1,260 | 100 | % | |||
| Hyatt Regency Baltimore (5) |
Baltimore, MD | 488 | 100 | % | |||
| Hyatt Regency Bellevue |
Bellevue, WA | 733 | 2 | % | |||
| Hyatt Regency Boston (6) |
Boston, MA | 498 | 100 | % | |||
| Hyatt Regency Buffalo |
Buffalo, NY | 396 | 14 | % | |||
| Hyatt Regency Cleveland at The Arcade (7) |
Cleveland, OH | 293 | 50 | % | |||
| Hyatt Regency Coconut Point Resort & Spa |
Bonita Springs, FL | 454 | 100 | % | |||
| Hyatt Regency Columbus (5) |
Columbus, OH | 631 | 24 | % | |||
| Hyatt Regency Crown Center (3) |
Kansas City, MO | 733 | — | ||||
| Hyatt Regency Crystal City at Reagan National Airport |
Arlington, VA | 686 | 50 | % | |||
| Hyatt Regency Denver Tech Center |
Denver, CO | 451 | 100 | % | |||
| Hyatt Regency DFW (5) |
DFW Airport, TX | 811 | 46 | % | |||
| Hyatt Regency Grand Cypress (3)(4) |
Orlando, FL | 750 | — | ||||
| Hyatt Regency Greenville |
Greenville, SC | 328 | 100 | % | |||
| Hyatt Regency Greenwich |
Old Greenwich, CT | 373 | 100 | % | |||
| Hyatt Regency Hill Country Resort and Spa |
San Antonio, TX | 500 | 16 | % | |||
| Hyatt Regency Huntington Beach Resort & Spa (5) |
Huntington Beach, CA | 517 | 40 | % | |||
| Hyatt Regency Indianapolis |
Indianapolis, IN | 497 | 100 | % | |||
| Hyatt Regency Jersey City on the Hudson |
Jersey City, NJ | 350 | 50 | % | |||
| Hyatt Regency Lake Tahoe Resort, Spa & Casino |
Incline Village, NV | 422 | 100 | % | |||
| Hyatt Regency Long Beach (5) |
Long Beach, CA | 528 | 100 | % | |||
| Hyatt Regency Lost Pines Resort and Spa |
Lost Pines, TX | 491 | 8 | % | |||
| Hyatt Regency Louisville (5)(8) |
Louisville, KY | 393 | 50 | % | |||
| Hyatt Regency Miami (5) |
Miami, FL | 612 | 100 | % | |||
| Hyatt Regency Minneapolis |
Minneapolis, MN | 533 | 100 | % | |||
| Hyatt Regency Monterey Resort & Spa on Del Monte Golf Course (5) |
Monterey, CA | 550 | 100 | % | |||
| Hyatt Regency O’Hare |
Rosemont, IL | 1,096 | 100 | % | |||
| Hyatt Regency Princeton (5) |
Princeton, NJ | 347 | 88 | % | |||
| Hyatt Regency San Antonio |
San Antonio, TX | 632 | 100 | % |
54
| Property (1) |
Location | Rooms | Ownership (2) | ||||
| Hyatt Regency San Francisco (3) |
San Francisco, CA | 802 | — | ||||
| Hyatt Regency Santa Clara (5) |
Santa Clara, CA | 501 | 100 | % | |||
| Hyatt Regency Scottsdale Resort and Spa at Gainey Ranch |
Scottsdale, AZ | 493 | 100 | % | |||
| Hyatt Regency Vancouver |
Vancouver, British Columbia, Canada |
644 | 100 | % | |||
| Hyatt Regency Waikiki Beach Resort and Spa (5) |
Honolulu, HI | 1,229 | 10 | % | |||
| Hyatt on Capitol Square (3) |
Columbus, OH | 400 | — | ||||
| Hyatt Deerfield |
Deerfield, IL | 301 | 100 | % | |||
| Hyatt at Fisherman’s Wharf |
San Francisco, CA | 313 | 100 | % | |||
| Hyatt Key West Resort and Spa |
Key West, FL | 118 | 100 | % | |||
| Hyatt Lisle |
Lisle, IL | 316 | 50 | % | |||
| Hyatt at Olive 8 |
Seattle, WA | 346 | 50 | % | |||
| Hyatt Rosemont (5) |
Rosemont, IL | 206 | 100 | % | |||
| Europe, Africa and the Middle East: |
|||||||
| Park Hyatt Baku |
Baku, Azerbaijan | 159 | 100 | % | |||
| Park Hyatt Hamburg (3)(9) |
Hamburg, Germany | 252 | — | ||||
| Park Hyatt Jeddah (5) |
Jeddah, Saudi Arabia | 142 | 8 | % | |||
| Park Hyatt Milan |
Milan, Italy | 112 | 30 | % | |||
| Park Hyatt Zurich (5) |
Zurich, Switzerland | 142 | 100 | % | |||
| Park Hyatt Paris-Vendôme |
Paris, France | 167 | 100 | % | |||
| Andaz Liverpool Street (5) |
London, England | 267 | 100 | % | |||
| Grand Hyatt Berlin (3)(10) |
Berlin, Germany | 342 | — | ||||
| Hyatt Regency Baku |
Baku, Azerbaijan | 182 | 100 | % | |||
| Hyatt Regency Bishkek (5) |
Bishkek, Kyrgyz Republic |
178 | 87 | % | |||
| Hyatt Regency Cologne (3) |
Cologne, Germany | 306 | — | ||||
| Hyatt Regency Mainz (3) |
Mainz, Germany | 268 | — | ||||
| Asia Pacific: |
|||||||
| Grand Hyatt Bali |
Bali, Indonesia | 648 | 10 | % | |||
| Grand Hyatt Mumbai |
Mumbai, India | 547 | 50 | % | |||
| Grand Hyatt Seoul |
Seoul, South Korea | 601 | 100 | % | |||
| Hyatt Regency Kyoto |
Kyoto, Japan | 189 | 20 | % | |||
| Bali Hyatt |
Bali, Indonesia | 386 | 10 | % | |||
| Latin America: |
|||||||
| Park Hyatt Mendoza, Hotel Casino & Spa |
Mendoza, Argentina | 186 | 50 | % | |||
| Grand Hyatt São Paulo |
São Paulo, Brazil | 466 | 50 | % | |||
| Select Service: |
|||||||
| United States: |
|||||||
| Hyatt Place Albuquerque Airport |
Albuquerque, NM | 127 | 100 | % | |||
| Hyatt Place Atlanta/Alpharetta/Windward Parkway |
Alpharetta, GA | 127 | 100 | % | |||
| Hyatt Place Atlanta/Buckhead (3)(4) |
Atlanta, GA | 171 | — | ||||
| Hyatt Place Atlanta/Norcross/Peachtree |
Norcross, GA | 126 | 100 | % | |||
| Hyatt Place Atlanta/Perimeter Center |
Atlanta, GA | 150 | 100 | % | |||
| Hyatt Place Baltimore/Owings Mills |
Owings Mills, MD | 123 | 100 | % | |||
| Hyatt Place Birmingham/Inverness |
Birmingham, AL | 126 | 100 | % | |||
| Hyatt Place Boise/Towne Square |
Boise, Idaho | 127 | 100 | % | |||
| Hyatt Place Charlotte Airport/Tyvola Road |
Charlotte, NC | 127 | 100 | % | |||
| Hyatt Place Chicago/Hoffman Estates |
Hoffman Estates, IL | 126 | 100 | % | |||
| Hyatt Place Chicago/Itasca |
Itasca, IL | 126 | 100 | % |
55
| Property (1) |
Location | Rooms | Ownership (2) | ||||
| Hyatt Place Chicago/Lombard/Oak Brook |
Lombard, IL | 151 | 100 | % | |||
| Hyatt Place Cincinnati – Northeast |
Mason, Ohio | 127 | 100 | % | |||
| Hyatt Place Cincinnati Airport/Florence |
Florence, KY | 127 | 100 | % | |||
| Hyatt Place Cleveland/Independence |
Independence, OH | 127 | 100 | % | |||
| Hyatt Place Coconut Point |
Estero, FL | 108 | 50 | % | |||
| Hyatt Place Columbia/Harbison |
Irmo, SC | 127 | 100 | % | |||
| Hyatt Place Dallas/Arlington |
Arlington, TX | 127 | 100 | % | |||
| Hyatt Place Dallas/Plano |
Plano, TX | 127 | 100 | % | |||
| Hyatt Place Denver – South/Park Meadows |
Lone Tree, CO | 127 | 100 | % | |||
| Hyatt Place Denver Airport |
Aurora, CO | 126 | 100 | % | |||
| Hyatt Place Denver Tech Center |
Englewood, CO | 126 | 100 | % | |||
| Hyatt Place Detroit/Auburn Hills |
Auburn Hills, MI | 127 | 100 | % | |||
| Hyatt Place Detroit/Livonia |
Livonia, MI | 127 | 100 | % | |||
| Hyatt Place Fair Lawn/Paramus |
Fair Lawn, NJ | 143 | 100 | % | |||
| Hyatt Place Fort Worth Cityview |
Fort Worth, TX | 127 | 100 | % | |||
| Hyatt Place Fort Worth/Hurst |
Hurst, TX | 127 | 100 | % | |||
| Hyatt Place Fremont/Silicon Valley |
Fremont, CA | 151 | 100 | % | |||
| Hyatt Place Gilbert |
Gilbert, AZ | 127 | 50 | % | |||
| Hyatt Place Greensboro |
Greensboro, NC | 124 | 100 | % | |||
| Hyatt Place Lakeland Center (5) |
Lakeland, FL | 127 | 100 | % | |||
| Hyatt Place Louisville – East |
Louisville, KY | 121 | 100 | % | |||
| Hyatt Place Memphis Primacy Parkway |
Memphis, TN | 126 | 100 | % | |||
| Hyatt Place Minneapolis/Eden Prairie |
Eden Prairie, MN | 126 | 100 | % | |||
| Hyatt Place Mystic |
Mystic, CT | 79 | 100 | % | |||
| Hyatt Place Nashville/Brentwood |
Brentwood, TN | 124 | 100 | % | |||
| Hyatt Place Nashville/Opryland |
Nashville, TN | 123 | 100 | % | |||
| Hyatt Place Oklahoma City Airport |
Oklahoma City, OK | 126 | 100 | % | |||
| Orlando Airport Northeast (11) |
Orlando, FL | 128 | 100 | % | |||
| Hyatt Place Orlando/Convention Center |
Orlando, FL | 149 | 100 | % | |||
| Hyatt Place Orlando/Universal |
Orlando, FL | 151 | 100 | % | |||
| Hyatt Place Phoenix – North |
Phoenix, AZ | 127 | 100 | % | |||
| Hyatt Place Pittsburgh Airport |
Pittsburgh, PA | 127 | 100 | % | |||
| Hyatt Place Pittsburgh/Cranberry |
Cranberry Township, PA | 127 | 100 | % | |||
| Hyatt Place Princeton |
Princeton, NJ | 122 | 100 | % | |||
| Hyatt Place Raleigh – North |
Raleigh, NC | 127 | 100 | % | |||
| Hyatt Place Richmond/Arboretum |
Richmond, VA | 127 | 100 | % | |||
| Hyatt Place Sacramento/Rancho Cordova |
Rancho Cordova, CA | 127 | 100 | % | |||
| Hyatt Place San Antonio – Northwest/Medical Center |
San Antonio, TX | 126 | 100 | % | |||
| Hyatt Place Scottsdale/Old Town |
Scottsdale, AZ | 127 | 100 | % | |||
| Hyatt Place Secaucus/Meadowlands (5) |
Secaucus, NJ | 159 | 100 | % | |||
| Hyatt Place Tampa/Busch Gardens |
Tampa, FL | 126 | 100 | % | |||
| Hyatt Summerfield Suites Boston/Waltham |
Waltham, MA | 135 | 100 | % | |||
| Hyatt Summerfield Suites Denver Tech Center |
Englewood, CO | 135 | 100 | % | |||
| Hyatt Summerfield Suites Miami Airport |
Miami, FL | 156 | 100 | % | |||
| Hyatt Summerfield Suites Parsippany/Whippany |
Parsippany, NJ | 135 | 100 | % | |||
| Hyatt Summerfield Suites Morristown |
Morristown, NJ | 132 | 100 | % |
| (1) | Does not include Hotel Mar Monte, Santa Barbara, CA, as this is not a Hyatt-branded property. |
| (2) | Unless otherwise indicated, ownership percentages include both the property and underlying land. |
| (3) | Property is accounted for as a capital or an operating lease. |
56
| (4) | Hotel is included in our portfolio of 96 owned hotels. |
| (5) | Our ownership interest in the property is subject to a third-party ground lease on the land. |
| (6) | We hold a deeded interest in this hotel property that is subject to certain restrictions, which could cause the interest to lapse as early as calendar year 2079. |
| (7) | A foreclosure action was initiated by the mortgage lender on this property in April 2009. The proceedings are pending. |
| (8) | We own an approximately 50% interest in a partnership and in May 2009 exercised our option to acquire an additional 43.0% interest in this partnership which brought our interest to approximately 93%. |
| (9) | We own a 50% interest in the entity that is the operating lessee. |
| (10) | We own an 82% interest in the entity that is the operating lessee. |
| (11) | Hotel is currently branded as an AmeriSuites hotel. |
| (12) | Effective January 1, 2010, Park Hyatt Philadelphia at Bellevue was renamed to Hyatt at The Bellevue. |
Below is a summary of our Hyatt managed, franchised and owned and leased hotels and residential and vacation ownership properties by segment for all periods presented.
| December 31, 2009 | December 31, 2008 | December 31, 2007 | December 31, 2006 | |||||||||||||
| Properties | Rooms | Properties | Rooms | Properties | Rooms | Properties | Rooms | |||||||||
| North America Management and Franchising |
||||||||||||||||
| Full Service Hotels |
||||||||||||||||
| Managed |
104 | 57,865 | 104 | 57,542 | 104 | 55,709 | 109 | 56,995 | ||||||||
| Franchised |
11 | 3,401 | 10 | 3,212 | 7 | 2,425 | 3 | 1,013 | ||||||||
| Full Service Managed and Franchised |
115 | 61,266 | 114 | 60,754 | 111 | 58,134 | 112 | 58,008 | ||||||||
| Select Service Hotels |
||||||||||||||||
| Managed |
80 | 10,285 | 94 | 12,064 | 99 | 12,651 | 107 | 13,773 | ||||||||
| Franchised |
96 | 12,218 | 65 | 8,014 | 48 | 5,885 | 49 | 6,186 | ||||||||
| Select Service Managed and Franchised |
176 | 22,503 | 159 | 20,078 | 147 | 18,536 | 156 | 19,959 | ||||||||
| International Management and Franchising |
||||||||||||||||
| Managed |
106 | 35,274 | 102 | 34,010 | 100 | 33,458 | 99 | 32,434 | ||||||||
| Franchised |
2 | 988 | 2 | 992 | 2 | 992 | 2 | 992 | ||||||||
| Managed and Franchised |
108 | 36,262 | 104 | 35,002 | 102 | 34,450 | 101 | 33,426 | ||||||||
| Total Managed and Franchised |
399 | 120,031 | 377 | 115,834 | 360 | 111,120 | 369 | 111,393 | ||||||||
| Vacation Ownership Properties |
15 | 962 | 14 | 918 | 13 | 885 | 13 | 885 | ||||||||
| Residences |
10 | 1,324 | 8 | 1,225 | 8 | 1,225 | 7 | 1,140 | ||||||||
| Grand Total Portfolio |
424 | 122,317 | 399 | 117,977 | 381 | 113,230 | 389 | 113,418 | ||||||||
57
Included in the summary above, are the following owned and leased properties:
| December 31, 2009 | December 31, 2008 | December 31, 2007 | December 31, 2006 | |||||||||||||
| Properties | Rooms | Properties | Rooms | Properties | Rooms | Properties | Rooms | |||||||||
| Owned and Leased |
||||||||||||||||
| Full Service Owned and Leased |
47 | 21,447 | 46 | 20,967 | 45 | 20,724 | 45 | 19,865 | ||||||||
| Select Service Owned and Leased |
55 | 7,169 | 55 | 7,169 | 55 | 7,169 | 64 | 8,398 | ||||||||
| Total Owned and Leased |
102 | 28,616 | 101 | 28,136 | 100 | 27,893 | 109 | 28,263 | ||||||||
Corporate Headquarters and Divisional Offices
Our corporate headquarters are located at 71 South Wacker Drive, 12th Floor, Chicago, Illinois. These offices consist of approximately 196,131 square feet (net of subleased space). The lease for this property initially expires on February 29, 2020, with an option to renew and increase the rentable square feet. We also lease 74,067 square feet of office space at 200 West Monroe Street, Chicago, Illinois. The lease for this property initially expires on March 31, 2016 with an option to renew and increase the rentable square feet.
In addition to our corporate headquarters, we lease space for our divisional offices, service centers and sales offices in multiple locations, including Beijing and Hong Kong, People’s Republic of China; Dubai, United Arab Emirates; Gurgaon (NCR) and Mumbai, India; London, United Kingdom; Mainz, Germany; Marion, Illinois; Melbourne, Australia; Mexico City, Mexico; Moore, Oklahoma; Omaha, Nebraska; St. Petersburg, Florida; Tokyo, Japan; and Zurich, Switzerland.
We believe that our existing office properties are in good condition and are sufficient and suitable for the conduct of our business. In the event we need to expand our operations, we believe that suitable space will be available on commercially reasonable terms.
| Item 3. | Legal Proceedings. |
We are involved in various claims and lawsuits arising in the normal course of business, including proceedings involving tort and other general liability claims, workers’ compensation and other employee claims, intellectual property claims and claims related to our management of certain hotel properties. Most occurrences involving liability, claims of negligence and employees are covered by insurance with solvent insurance carriers. For those matters not covered by insurance, which includes commercial matters, we recognize a liability when we believe the loss is probable and reasonably estimable. We currently believe that the ultimate outcome of such lawsuits and proceedings will not, individually or in the aggregate, have a material adverse effect on our consolidated financial position, results of operations or liquidity.
| Item 4. | Submission of Matters to a Vote of Security Holders. |
On October 12, 2009, in connection with the Company’s initial public offering, our stockholders approved the adoption of an Amended and Restated Certificate of Incorporation, to be effective prior to the consummation of the initial public offering, and which provided for, among other things, (i) the authorization of 1,000,000,000 shares of Class A common stock and 500,000,000 shares of Class B common stock, (ii) the reclassification of 34,407 outstanding shares of our common stock into 34,407 shares of Class A common stock, (iii) the reclassification of 168,005,588 outstanding shares of our common stock into 168,005,588 shares of Class B common stock (of which 38,000,000 shares converted into shares of Class A common stock at the time that they were sold by the selling stockholders in the initial public offering), and (iv) the division of our board of directors into three classes, with each class serving for a staggered three-year term. Such action was effected by written consent of our stockholders pursuant to Section 228 of the Delaware General Corporation Law. Out of a total of
58
168,039,995 shares of common stock then issued and outstanding, all 168,039,995 shares were voted in favor of this matter. These share numbers reflect the one-for-two reverse stock split of our common stock effected on October 14, 2009. They do not reflect our current dual class structure, in which our Class B common stock is entitled to ten votes per share and our Class A common stock is entitled to one vote per share, which became effective upon the filing of the Amended and Restated Certificate of Incorporation with the Delaware Secretary of State on November 4, 2009.
Executive Officers of the Registrant
The following chart names each of the Company’s executive officers and their ages and positions as of February 25, 2010. Also included below is biographical information relating to each of the Company’s executive officers. Each of the executive officers is elected by and serves at the pleasure of the board of directors.
| Name |
Age | Position | ||
| Thomas J. Pritzker |
59 | Executive Chairman of the board of directors | ||
| Mark S. Hoplamazian |
46 | President, Chief Executive Officer and Director | ||
| Harmit J. Singh |
46 | Chief Financial Officer | ||
| Stephen G. Haggerty |
42 | Global Head of Real Estate and Development | ||
| Rakesh Sarna |
52 | Chief Operating Officer—International | ||
| H. Charles Floyd |
50 | Chief Operating Officer—North America | ||
| Robert W. K. Webb |
53 | Chief Human Resources Officer | ||
| Susan T. Smith (1) |
59 | Senior Vice President, General Counsel, Secretary | ||
| John Wallis |
57 | Global Head of Marketing and Brand Strategy |
| (1) | Susan T. Smith intends to resign as General Counsel of the Company no later than March 31, 2010 and to retire as an employee of the Company on December 31, 2010. |
Thomas J. Pritzker has been a member of our board of directors since August 2004 and our Executive Chairman since August 2004. Mr. Pritzker served as our Chief Executive Officer from August 2004 to December 2006. Mr. Pritzker was appointed President of Hyatt Corporation in 1980 and served as Chairman and Chief Executive Officer of Hyatt Corporation from 1999 to December 2006. Mr. Pritzker is Chairman and Chief Executive Officer of The Pritzker Organization, LLC, the principal financial and investment advisor to various Pritzker family business interests, including Hyatt. Mr. Pritzker is Chairman of Marmon Holdings, Inc. and also serves as a Director of Royal Caribbean Cruises Ltd. and TransUnion Corp., a credit reporting service company. Mr. Pritzker is a Director and Vice President of The Pritzker Foundation, a charitable foundation; Director and President of the Pritzker Family Philanthropic Fund, a charitable organization; and Chairman and President of The Hyatt Foundation, a charitable foundation which established The Pritzker Architecture Prize. Mr. Pritzker is a first cousin of Ms. Penny Pritzker, who is also a member of our board of directors.
Mark S. Hoplamazian has been a member of our board of directors since November 2006. He has served as our President and Chief Executive Officer since December 2006, as interim President from July 2006 to December 2006 and Vice President from August 2004 to December 2004. Mr. Hoplamazian is a Vice President of The Pritzker Organization, LLC (TPO), the principal financial and investment advisor to various Pritzker family business interests, including Hyatt. From April 2004 to August 2009, Mr. Hoplamazian served as President and Director of TPO and has served in various capacities with TPO and its predecessors since its formation in 1997, including managing its merchant banking and investment activities. Mr. Hoplamazian currently serves on the Board of Trustees of The Latin School of Chicago. He is a member of the Discovery Class of the Henry Crown Fellowship at the Aspen Institute.
Harmit J. Singh has served as our Chief Financial Officer since August 2008. Mr. Singh leads the Company’s finance, accounting, treasury, strategic financial planning and analysis, tax, risk, investor relations and information technology functions worldwide. Mr. Singh has over 25 years of financial experience in the
59
travel, financial services, restaurant and hospitality industries. He joined Hyatt after spending 14 years at Yum! Brands, Inc., a restaurant company. Mr. Singh most recently served as Senior Vice President and Chief Financial Officer for Yum!, International from December 2005 to July 2008. Prior to this position, Mr. Singh served in several senior financial roles, including Senior Vice President and Chief Financial Officer for Pizza Hut—United States, Vice President Finance—Yum!, International, Chief Financial Officer—India and Chief Financial Officer—Asia. Prior to joining Yum! in 1994, Mr. Singh worked in various financial capacities for American Express India, a worldwide travel, financial and network services company. Mr. Singh serves on the board of directors of Avendra, LLC.
Stephen G. Haggerty has served as our Global Head of Real Estate and Development since August 2007 and our Executive Vice President—Real Estate and Development from June 2007 to August 2007. Mr. Haggerty has responsibility for our global development team, our global feasibility and development finance team, our global asset management team that oversees all of our owned hotel properties and development of hotels and vacation ownership properties in which we have ownership. Prior to joining us, Mr. Haggerty spent 13 years serving in several positions of increasing responsibility with Marriott International, Inc., a lodging company, most recently in London as Senior Vice President, International Project Finance and Asset Management for Europe, Africa and the Middle East from 2005 to 2007. Prior to this position, from 2003 to 2005, Mr. Haggerty served as Marriott’s Senior Vice President of Global Asset Management and Development Finance and previously lived in Asia for nine years holding a variety of roles relating to development at Marriott.
Rakesh Sarna has served as our Chief Operating Officer—International since August 2007. Mr. Sarna has been with us since 1979. Mr. Sarna is responsible for management of our full service hotels and resorts outside of the United States, Canada and the Caribbean. He also oversees the operations of our Divisional offices in Zurich, Switzerland, Hong Kong, Dubai, UAE and Mexico City and oversees various corporate functions in Chicago, IL. Since June 2007, Mr. Sarna has served as the Chief Operating Officer for Hyatt International Corporation. From September 2006 to June 2007, he served as Senior Vice President for Hyatt International Corporation. Prior to that, from April 2001 to September 2006, Mr. Sarna served as our Vice President of Operations for Europe, Africa and the Middle East, and from September 1999 to April 2001 as Director of Operations for Europe, Africa and the Middle East. Prior to that, from January 1997 to September 1999, he served as regional director for South Asia. Mr. Sarna joined Hyatt in 1979 and has held a variety of senior management Food and Beverage positions and served as General Manager for Hyatt Regency Belgrade, Park Hyatt UN Plaza, New York and Hyatt Regency Macau.
H. Charles Floyd has served as our Chief Operating Officer—North America since January 2006. Mr. Floyd has been with us since 1981. Mr. Floyd is responsible for management of our full service hotels and resorts as well as Hyatt Place and Summerfield Suites brands in the United States, Canada and the Caribbean. In addition, he oversees Hyatt Vacation Ownership, Inc. (HVOI) and the Franchise Owner Relations Group, which supports both full service and select service and extended stay franchisees. He also oversees various corporate functions for North America, including sales, human resources, product and design, rooms, food and beverage and engineering. Prior to assuming his current position, Mr. Floyd served in a number of senior positions at Hyatt, including Executive Vice President—North America Operations and Senior Vice President of Sales, as well as various managing director and general manager roles at Hyatt.
Robert W. K. Webb has served as our Chief Human Resources Officer since August 2007. Prior to joining Hyatt, Mr. Webb served as Head of Global Service Delivery for Citi Employee Services at Citigroup Inc., a global financial services company. During his 19-year tenure at Citigroup and two predecessor companies, Mr. Webb served as Chief Administrative Officer for a global business unit and held several senior human resources roles in North America and international operations. Mr. Webb serves as a Director of Chicago Children’s Museum and Junior Achievement of Chicago and is a member of the Advisory Board of the School of Hospitality at Boston University and the Hospitality Program at DePaul University.
Susan T. Smith has served as our Senior Vice President, General Counsel and Secretary since April 2005. She has been a licensed attorney since 1982. Prior to joining Hyatt, Ms. Smith served in a number of roles,
60
including as Vice President, General Counsel and Secretary for First Health Group Corp., a publicly traded company that provided health benefit services to self-funded national employers. First Health was acquired by Coventry Health Care, Inc. in January 2005. Before joining First Health in 1992, she was a shareholder at Pryor, Carney & Johnson, PC, a Denver law firm. Ms, Smith serves as a director on the Rosecrance Foundation Board of Directors – Chicago and is a member of the Executive Council of Women in Lodging, American Hotel and Lodging Association.
John Wallis has served as our Global Head of Marketing and Brand Strategy since November 2008. Mr. Wallis’ career with Hyatt began in 1981. Prior to his current role, Mr. Wallis served as Senior Vice President, Product and Brand Development since August 2007. From 2004 through 2007, Mr. Wallis served as our Senior Vice President, Global Asset Management, where he was responsible for the management of more than 40 Hyatt-owned properties across North America, Latin America, Europe and Asia. He has also served in a variety of other management positions, including Senior Vice President—Global Asset Management, Senior Vice President—Product and Brand Development, Senior Vice President of Marketing and Sales, and Vice President of Marketing for Hyatt International Corporation, General Manager and Regional Vice President-Gulf States for Hyatt Regency Dubai, Executive Assistant Manager Food and Beverage for Hyatt Regency Kuwait, Hyatt Regency Fiji and Hyatt Kingsgate Sydney and various other food and beverage management positions.
Pursuant to our employment letter with Mr. Thomas J. Pritzker, we have agreed that so long as he is a member of our board of directors we will use our commercially reasonable efforts to appoint him as our executive chairman as long as he is willing and able to serve in that office. If he is not re-appointed as executive chairman, he will be entitled to terminate his employment with the rights and entitlements available to him under our severance policies as if his employment was terminated by us without cause.
Pursuant to our employment letter with Mr. Mark S. Hoplamazian, we have agreed that so long as he is the president and chief executive officer of Hyatt, we will use our commercially reasonable efforts to nominate him for re-election as a director prior to the end of his term. If he is not re-elected to the board of directors, he will be entitled to terminate his employment with the rights and entitlements available to him under our severance policies as if his employment was terminated by us without cause.
61
| Item 5. | Market for Registrant’s Common Equity, Related Stockholder Matters and Issuer Purchases of Equity Securities. |
Market Information
Our Class A common stock began trading publicly on the New York Stock Exchange under the symbol “H” on November 5, 2009. Prior to that time, there was no public market for our Class A common stock. As of January 31, 2010, our Class A common stock was held by approximately 15 stockholders of record and there were 43,869,597 shares of Class A common stock outstanding. This figure does not include a substantially greater number of “street name” holders or beneficial holders of our Class A common stock whose shares are held of record by banks, brokers and other financial institutions. The following table sets forth, for the period indicated, the high and low sale prices of our Class A common stock as reported by the New York Stock Exchange since our initial public offering.
| Fiscal Year Ended December 31, 2009 |
High | Low | ||||
| Fourth Quarter (beginning November 5, 2009) |
$ | 30.70 | $ | 27.75 | ||
On February 24, 2010, the closing stock price of our Class A common stock was $31.15.
There is no established public trading market for our Class B common stock. As of January 31, 2010, our Class B common stock was held by 220 shareholders and there were 130,005,588 shares of Class B common stock outstanding.
Dividends
We have never declared or paid cash dividends on our common stock. In addition, we must comply with the covenants in our revolving credit facility if we want to pay cash dividends. We currently intend to retain our future earnings, if any, to finance the further development and expansion of our business and, therefore, do not intend to pay cash dividends in the foreseeable future. Any future determination to pay dividends will be at the discretion of our board of directors and will depend on our financial condition, capital requirements, restrictions contained in current or future financing instruments and such other factors as our board of directors deems relevant.
62
Performance Graph
The following performance graph and related information shall not be deemed “soliciting material” or to be “filed” with the SEC, nor shall such information be incorporated by reference into any future filing under the Securities Act or Exchange Act, except to the extent that we specifically incorporate it by reference into such filing.
The following graph compares the cumulative total stockholder return since November 5, 2009, the date our Class A common stock began trading on the New York Stock Exchange, with the S&P 500 Index (“S&P 500”) and the Russell 1000 Hotel/Motel Index (the “Russell 1000 Hotel”). The graph assumes that the value of the investment in our Class A common stock and each index was $100 on November 5, 2009 and that all dividends and other distributions were reinvested.
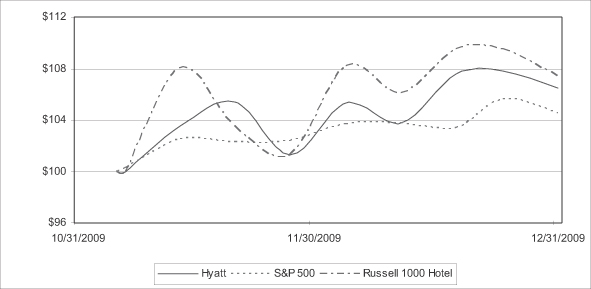
| 11/5/2009 | 12/31/2009 | |||
| Hyatt Hotels Corporation |
100.0 | 106.5 | ||
| S&P 500 |
100.0 | 104.5 | ||
| Russell 1000 Hotel |
100.0 | 107.4 |
Recent Sales of Unregistered Securities
The following is a summary of our issuances or sales of securities during the fiscal year ended December 31, 2009 that were not registered under the Securities Act:
Equity Securities
On October 1, 2009, we issued 61,121 stock appreciation rights and 28,565 restricted stock units to our president and chief executive officer under the Amended and Restated Hyatt Hotels Corporation Long-Term Incentive Plan, as amended (the “LTIP”).
On May 13, 2009, we issued 8,140,671 shares of common stock upon conversion of all 100,000 outstanding shares of Series A convertible preferred stock.
On June 9, 2009 and September 30, 2009, we issued an aggregate of 26,900 restricted stock units to five non-employee directors under our LTIP and pursuant to our Non-Employee Director Compensation Program.
63
On June 9, 2009 and September 30, 2009, we issued an aggregate of 20,874 fully vested shares of common stock to five non-employee directors and one former non-employee director under our LTIP and pursuant to our Non-Employee Director Compensation Program.
On June 9, 2009, we issued an aggregate of 572,337 stock appreciation rights and an aggregate of 276,722 restricted stock units to certain employees and non-employees under our LTIP.
In May 2009, we issued and sold an aggregate of 10,853,142 shares of our common stock to seven accredited investors in connection with the settlement of such investors’ and certain of their affiliates’ obligations under a subscription agreement entered into in August, October and December 2007. Such shares were sold at the purchase price negotiated under the subscription agreement of $55.28 per share for aggregate proceeds of $600,000,000.
In May 2009, we issued and sold an aggregate of 29,195,199 shares of our common stock to existing stockholders and certain of their affiliates, as well as certain non-employee directors, at $26.00 per share, for aggregate proceeds of $759,075,161.
The issuances of the above securities were deemed to be exempt from registration under the Securities Act in reliance on Section 4(2) of the Securities Act or Rule 701 promulgated under Section 3(b) of the Securities Act, as transactions by an issuer not involving a public offering or transactions pursuant to compensatory benefit plans and contracts relating to compensation as provided under Rule 701. The purchasers of securities in each such transaction represented their intention to acquire the securities for investment only and not with a view to offer or sell, in connection with any distribution of the securities, and appropriate legends were affixed to the share certificates and instruments issued in such transactions. All recipients either received adequate information about the registrant or had access, through their relationships with the Company, to such information.
There were no underwriters employed in connection with any of the transactions set forth above.
Debt Securities
On August 14, 2009, we issued and sold an aggregate of $250,000,000 principal amount of 5.750% Senior Notes due 2015 (the “2015 notes”) and $250,000,000 principal amount of 6.875% Senior Notes due 2019 (the “2019 notes” and, together with the 2015 notes, the “senior notes”) to certain initial purchasers represented by Banc of America Securities LLC, Deutsche Bank Securities Inc., J.P. Morgan Securities Inc. and UBS Securities LLC. We issued the senior notes to the initial purchasers in reliance on Section 4(2) of the Securities Act on the basis that each initial purchaser represented and warranted to the Company that it was (i) a qualified institutional buyer as defined in Rule 144A under the Securities Act and (ii) an “accredited investor” within the meaning of Rule 501(a) under the Securities Act. The initial purchasers then offered and resold the senior notes to qualified institutional buyers in reliance on Rule 144A under the Securities Act and to non-U.S. persons in transactions outside the United States in reliance on Regulation S under the Securities Act.
Use of Proceeds from Registered Securities
On November 4, 2009, a registration statement on Form S-1 (File No. 333-161068) relating to our initial public offering of our Class A common stock was declared effective by the SEC. An aggregate of 43,700,000 shares of our Class A common stock (including 5,700,000 shares of Class A common stock subject to the underwriters’ option to purchase additional shares) were registered under the registration statement, of which selling stockholders identified in the registration statement sold 38,000,000 shares and we sold 5,700,000 in connection with the underwriters’ exercise of their option to purchase additional shares, at an initial public offering price of $25.00 per share. The aggregate offering price for the shares registered and sold by the selling stockholders was $950 million and the aggregate offering price for the shares registered and sold by us was $142 million. The initial public offering closed on November 10, 2009 and, as a result, we received net proceeds of approximately $127 million, after deducting the underwriting discount of approximately $7 million and total
64
offering expenses of approximately $8 million, and the selling stockholders received net proceeds of approximately $901 million, after deducting the underwriting discount of approximately $49 million. The Company did not receive any proceeds from the sale of shares by the selling stockholders. The offering did not terminate until after the sale of all of the shares of Class A common stock registered on the registration statement. The sole bookrunning manager and lead managing representative of the offering was Goldman, Sachs & Co, with Deutsche Bank Securities Inc. and J.P. Morgan Securities Inc. acting as joint lead managers.
No offering expenses were paid directly or indirectly to any of our directors or officers (or their associates) or persons owning ten percent or more of any class of our equity securities or to any other affiliates.
We intend to use the net proceeds primarily for working capital and other general corporate purposes, including capital expenditures. Additionally, we may use a portion of the net proceeds for the acquisition of, or investment in, new properties or businesses that complement our business. Pending application of the net proceeds as described above, we have invested the net proceeds in short-term, investment grade, interest-bearing securities. There has been no material change in the planned use of proceeds from our initial public offering from that described in the final prospectus dated November 4, 2009 filed by us with the SEC pursuant to Rule 424(b).
Purchases of Equity Securities by the Issuer and Affiliated Purchasers
None.
| Item 6. | Selected Financial Data. |
We derived the selected consolidated statements of income (loss) data for the years ended December 31, 2009, 2008 and 2007 and the selected consolidated balance sheet data as of December 31, 2009 and 2008 from our audited consolidated financial statements included elsewhere in this annual report. We derived the selected consolidated statements of income data for the years ended December 31, 2006 and 2005 and the selected consolidated balance sheet data as of December 31, 2007, 2006 and 2005 from our audited consolidated financial statements which are not included in this annual report. Our historical results are not necessarily indicative of the results expected for any future period.
You should read the selected historical financial data together with the consolidated financial statements and related notes appearing elsewhere in this annual report, as well as Part II, Item 7, “Management’s Discussion and Analysis of Financial Condition and Results of Operations” and the other financial information included elsewhere in this annual report.
| (in millions, except per share data) | Year Ended December 31, | |||||||||||||||
| 2009 | 2008 | 2007 | 2006 | 2005 | ||||||||||||
| Consolidated statements of income (loss) data: |
||||||||||||||||
| Owned and leased hotel revenues |
$ | 1,782 | $ | 2,139 | $ | 2,039 | $ | 1,860 | $ | 1,748 | ||||||
| Management and franchise fee revenues |
223 | 290 | 315 | 294 | 227 | |||||||||||
| Other revenues |
49 | 83 | 103 | 110 | 112 | |||||||||||
| Other revenues from managed properties (1) |
1,278 | 1,325 | 1,281 | 1,207 | 1,080 | |||||||||||
| Total revenues |
3,332 | 3,837 | 3,738 | 3,471 | 3,167 | |||||||||||
| Direct and selling, general, and administrative expenses |
3,284 | 3,473 | 3,353 | 3,119 | 2,880 | |||||||||||
| Income (loss) from continuing operations |
(45 | ) | 114 | 266 | 331 | 278 | ||||||||||
| Net income (loss) attributable to Hyatt Hotels Corporation |
(43 | ) | 168 | 270 | 315 | 336 | ||||||||||
| Income (loss) from continuing operations per common share, basic and diluted (2) |
$ | (0.30 | ) | $ | 0.89 | $ | 1.98 | $ | 2.41 | $ | 2.40 | |||||
65
| (in millions) | As of December 31, | |||||||||
| 2009 | 2008 | 2007 | 2006 | 2005 | ||||||
| Consolidated balance sheet data: |
||||||||||
| Cash and cash equivalents |
1,327 | 428 | 409 | 801 | 960 | |||||
| Total current assets |
1,989 | 1,057 | 1,065 | 1,501 | 1,645 | |||||
| Property and equipment, net |
3,605 | 3,495 | 3,518 | 2,769 | 2,296 | |||||
| Intangibles, net |
284 | 256 | 359 | 154 | 102 | |||||
| Total assets |
7,155 | 6,119 | 6,248 | 5,522 | 5,081 | |||||
| Total current liabilities |
495 | 653 | 697 | 1,001 | 600 | |||||
| Long-term debt |
840 | 1,209 | 1,288 | 173 | 500 | |||||
| Other long-term liabilities |
780 | 665 | 794 | 588 | 519 | |||||
| Total liabilities |
2,115 | 2,527 | 2,779 | 1,762 | 1,619 | |||||
| Total stockholders’ equity |
5,016 | 3,564 | 3,434 | 3,731 | 3,430 | |||||
| Total liabilities and equity |
7,155 | 6,119 | 6,248 | 5,522 | 5,081 | |||||
| (1) | Represents revenues that we receive from third-party property owners who reimburse us for costs that we incur on their behalf, with no added margin. These costs relate primarily to payroll at managed properties where we are the employer. As a result, these revenues have no effect on our profit, although they do increase our total revenues and the corresponding costs increase our total expenses. See Part II, Item 7, “Management’s Discussion and Analysis of Financial Condition and Results of Operations—Principal Factors Affecting Our Results of Operations—Revenues.” |
| (2) | All per share amounts reflect a one-for-two reverse split of our common stock effected on October 14, 2009. |
| Item 7. | Management’s Discussion and Analysis of Financial Condition and Results of Operations. |
The following discussion and analysis of our financial condition and results of operations should be read in conjunction with Part II, Item 6, “Selected Financial Data” and our consolidated financial statements included elsewhere in this annual report. In addition to historical data, this discussion contains forward-looking statements about our business, operations and financial performance based on current expectations that involve risks, uncertainties and assumptions. Our actual results may differ materially from those discussed in the forward-looking statements as a result of various factors, including but not limited to those discussed in “Disclosure Regarding Forward-Looking Statements” and Item I, Part 1A, “Risk Factors” included elsewhere in this annual report.
Overview
We are a global hospitality company engaged in the management, franchising, ownership and development of Hyatt-branded hotels, resorts and residential and vacation ownership properties around the world. As of December 31, 2009, our worldwide property portfolio consisted of 424 Hyatt-branded properties (122,317 rooms and units), including:
| • | 162 managed properties (63,062 rooms), all of which we operate under management agreements with third-party property owners; |
| • | 109 franchised properties (16,607 rooms), all of which are owned by third parties that have franchise agreements with us and are operated by third parties; |
| • | 96 owned properties (including 4 consolidated hospitality ventures) (25,765 rooms) and 6 leased properties (2,851 rooms), all of which we manage; |
| • | 26 managed properties owned or leased by unconsolidated hospitality ventures (11,746 rooms); |
| • | 15 vacation ownership properties (962 units), all of which we manage; and |
| • | 10 residential properties (1,324 units), all of which we manage and some of which we own. |
66
Our full service hotels operate under four world-recognized brands, Park Hyatt, Grand Hyatt, Hyatt Regency and Hyatt. We recently introduced our fifth full service brand, Andaz, geared toward today’s individual business and leisure travelers. In addition, we own, operate and franchise hotels under two select service brands, Hyatt Place and Hyatt Summerfield Suites. Our select service hotels provide guests with many of the amenities available at full service hotels but on a smaller scale. Compared to our full service hotels, our select service hotels have limited food and beverage outlets and do not offer comprehensive business or banquet facilities but rather are suited to serve smaller business meetings. Hyatt Place and Hyatt Summerfield Suites have been well received in the United States and we believe have significant growth potential both in the United States and internationally. We develop, sell and manage vacation ownership properties in select locations as part of the Hyatt Vacation Club. We also manage Hyatt-branded residential properties that are often adjacent to Hyatt-branded full service hotels. We assist third parties in the design and development of such mixed-use projects based on our expertise as a manager and owner of vacation ownership properties, residential properties and hotels.
We have adopted a business model that entails both ownership of properties and management and franchising of third-party owned properties in order to pursue more diversified revenue and income streams that balance both the advantages and risks associated with these lines of business. Our expertise and experience in each of these areas gives us the flexibility to evaluate growth opportunities across these lines of business. Growth in the number of management and franchise agreements and earnings there from typically results in higher overall returns on invested capital because the capital investment under a typical management or franchise agreement is not significant. The capital required to build and maintain hotels that we manage for third-party owners, or franchise, is typically provided by the owner of the respective property with minimal capital required by us as the manager or franchisor. During periods of increasing demand we do not share fully in the incremental profits of hotel operations for hotels that we manage for third-party owners as our fee arrangements generally include a base amount calculated using the revenue from the subject hotel and an incentive fee that is, typically, a percentage of hotel profits that is usually less than 20%, with the actual level depending on the structure and terms of the management agreement. We do not share in the benefits of increases in profits from franchised properties because franchisees pay us an initial application fee and ongoing royalty fees that are calculated as a percentage of gross room revenues with no fees based on profits. Disputes or disruptions may arise with third-party owners of hotels we manage or franchise and these disputes can result in termination of the relevant agreement. With respect to property ownership, we believe that ownership of selected hotels in key markets enhances our ability to control our brand presence in these markets. Ownership of hotels allows us to capture the full benefit of increases in operating profits during periods of increasing demand and room rates. The cost structure of a typical hotel is more fixed than variable, so as demand and room rates increase over time, the pace of increase in operating profits typically is higher than the pace of increase of revenues. Hotel ownership is, however, more capital intensive than managing hotels for third-party owners, as we are responsible for the costs and all capital expenditures for our owned hotels. The profits realized in our owned and leased hotel segment are generally more significantly affected by economic downturns and declines in revenues than the results of our management and franchising segments. This is because we absorb the full impact of declining profits in our owned and leased hotels whereas our management and franchise fees do not have the same level of downside exposure to declining hotel profitability. See also “—Principal Factors Affecting Our Results of Operations—Factors Affecting Our Costs and Expenses—Fixed nature of expenses” and Part I, Item 1A, “Risk Factors—We are exposed to the risks resulting from significant investments in owned and leased real estate, which could increase our costs, reduce our profits, limit our ability to respond to market conditions or restrict our growth strategy.”
For the years ended December 31, 2009 and 2008, 80.4% and 79.9% of our revenues were derived from operations in the United States, respectively. As of December 31, 2009, 76.7% of our long-lived assets were located in the United States.
67
We report our consolidated operations in U.S. dollars and manage our business within three reportable segments as described below:
| • | Owned and leased hotels, which consists of our owned and leased full service and select service hotels and, for purposes of segment Adjusted EBITDA, our pro rata share of the Adjusted EBITDA of our unconsolidated hospitality ventures, based on our ownership percentage of each venture. |
| • | North American management and franchising, which consists of our management and franchising of properties located in the United States, Canada and the Caribbean, except for Park Hyatt and Andaz branded hotels. |
| • | International management and franchising, which consists of our management and franchising of properties located outside of the United States, Canada and the Caribbean. All of our Park Hyatt and Andaz branded hotels are managed by our international management and franchising segment and the management of these hotels is reported in this segment. |
In addition to our three reportable segments, our Corporate and other segment includes the results of our vacation ownership business and unallocated corporate expenses.
Key Business Metrics Evaluated by Management
Revenues
We primarily derive our revenues from hotel operations, management and franchise fees, other revenues from managed properties and vacation ownership properties. Management uses revenues to assess the overall performance of our business and analyze trends such as consumer demand, brand preference and competition. For a detailed discussion of the factors that affect our revenues, see “—Principal Factors Affecting Our Results of Operations.”
Net Income Attributable to Hyatt Hotels Corporation
Net income attributable to Hyatt Hotels Corporation represents the total earnings or profits generated by our business. Management uses net income to analyze the performance of our business on a consolidated basis.
Adjusted EBITDA
We use the term Adjusted EBITDA throughout this annual report. Adjusted EBITDA, as we define it, is a non-GAAP measure. We define consolidated Adjusted EBITDA as net income (loss) attributable to Hyatt Hotels Corporation plus our pro-rata share of unconsolidated hospitality ventures Adjusted EBITDA based on our ownership percentage of each venture, adjusted to exclude the following items:
| • | equity earnings (losses) from unconsolidated hospitality ventures; |
| • | gains on sales of real estate; |
| • | asset impairments; |
| • | other income (loss), net; |
| • | a 2008 charge resulting from the termination of our supplemental executive defined benefit plans; |
| • | discontinued operations and changes in accounting principles, net of tax; |
| • | net (income) loss attributable to noncontrolling interests; |
| • | depreciation and amortization; |
| • | interest expense; and |
| • | benefit (provision) for income taxes. |
68
We calculate consolidated Adjusted EBITDA by adding the Adjusted EBITDA of each of our reportable segments to corporate and other Adjusted EBITDA. See “—Results of Operations.”
Our board of directors and executive management team focus on Adjusted EBITDA as a key performance and compensation measure both on a segment and on a consolidated basis. Adjusted EBITDA assists us in comparing our performance over various reporting periods on a consistent basis because it removes from our operating results the impact of items that do not reflect our core operating performance both on a segment and on a consolidated basis. Our President and Chief Executive Officer, who is our chief operating decision maker, also evaluates the performance of each of our reportable segments and determines how to allocate resources to those segments, in significant part, by assessing the Adjusted EBITDA of each segment. In addition, the compensation committee of our board of directors determines the annual variable compensation for certain members of our management based in part on consolidated Adjusted EBITDA, segment Adjusted EBITDA or some combination of both.
We believe Adjusted EBITDA is useful to investors because it provides investors the same information that we use internally for purposes of assessing our operating performance and making compensation decisions.
Adjusted EBITDA is not a substitute for net income attributable to Hyatt Hotels Corporation, income from continuing operations, cash flows from operating activities or any other measure prescribed by GAAP. There are limitations to using non-GAAP measures such as Adjusted EBITDA. Although we believe that Adjusted EBITDA can make an evaluation of our operating performance more consistent because it removes items that do not reflect our core operations, other companies in our industry may define Adjusted EBITDA differently than we do. As a result, it may be difficult to use Adjusted EBITDA or similarly named non-GAAP measures that other companies may use to compare the performance of those companies to our performance. Because of these limitations, Adjusted EBITDA should not be considered as a measure of the income generated by our business or discretionary cash available to us to invest in the growth of our business. Our management compensates for these limitations by reference to our GAAP results and using Adjusted EBITDA supplementally. See our consolidated statements of income (loss) and consolidated statements of cash flows in our consolidated financial statements included elsewhere in this annual report.
For a reconciliation of consolidated Adjusted EBITDA to EBITDA and a reconciliation of EBITDA to its most directly comparable GAAP measure, net income (loss) attributable to Hyatt Hotels Corporation, see “—Results of Operations.”
Revenue per Available Room (RevPAR)
RevPAR is the product of the average daily rate and the average daily occupancy percentage. RevPAR does not include non-room revenues, which consist of ancillary revenues generated by a hotel property, such as food and beverage, parking, telephone and other guest service revenues. Our management uses RevPAR to identify trend information with respect to room revenues from comparable properties and to evaluate hotel performance on a regional and segment basis. RevPAR is a commonly used performance measure in the industry.
RevPAR changes that are driven predominately by changes in occupancy have different implications for overall revenue levels and incremental profitability than do changes that are driven predominately by changes in average room rates. For example, increases in occupancy at a hotel would lead to increases in room revenues and additional variable operating costs (including housekeeping services, utilities and room amenity costs), and could also result in increased ancillary revenues (including food and beverage). In contrast, changes in average room rates typically have a greater impact on margins and profitability as there is no substantial effect on variable costs.
69
Average Daily Rate (ADR)
ADR represents hotel room revenues, divided by total number of rooms sold in a given period. ADR measures average room price attained by a hotel and ADR trends provide useful information concerning the pricing environment and the nature of the customer base of a hotel or group of hotels. ADR is a commonly used performance measure in the industry, and we use ADR to assess the pricing levels that we are able to generate by customer group, as changes in rates have a different effect on overall revenues and incremental profitability than changes in occupancy, as described above.
Occupancy
Occupancy represents the total number of rooms sold divided by the total number of rooms available at a hotel or group of hotels. Occupancy measures the utilization of our hotels’ available capacity. Management uses occupancy to gauge demand at a specific hotel or group of hotels in a given period. Occupancy levels also help us determine achievable ADR levels as demand for hotel rooms increases or decreases.
Comparable Hotels
“Comparable systemwide hotels” represents all properties we manage or franchise (including owned and leased properties) and that are operated for the entirety of the periods being compared and that have not sustained substantial damage, business interruption or undergone large scale renovations during the periods being compared or for which comparable results are not available. We may use variations of comparable systemwide hotels to specifically refer to comparable systemwide North American full service or select service hotels or comparable systemwide international full service hotels for those properties that we manage or franchise within the North American and international management and franchising segments, respectively. “Comparable operated hotels” is defined the same as “Comparable systemwide hotels” with the exception that it is limited to only those hotels we manage or operate and excludes hotels we franchise. “Comparable owned and leased hotels” represents all properties we own or lease and that are operated and consolidated for the entirety of the periods being compared and have not sustained substantial damage, business interruption or undergone large scale renovations during the periods being compared or for which comparable results are not available. Comparable systemwide hotels and comparable owned and leased hotels are commonly used as a basis of measurement in the industry. “Non-comparable systemwide hotels” or “Non-comparable owned and leased hotels” represent all hotels that do not meet the respective definition of “comparable” as defined above.
Principal Factors Affecting Our Results of Operations
Revenues
Principal Components
We primarily derive our revenues from the following sources:
Revenues from hotel operations. Represents revenues derived from hotel operations, including room rentals and food and beverage sales and other ancillary revenues at our owned and leased properties. Revenues from the majority of our hotel operations depend heavily on demand from group and transient travelers, as discussed below. Revenues from our owned and leased hotels segment are primarily derived from hotel operations.
Revenues from room rentals and ancillary revenues are primarily derived from three categories of customers: transient, group and contract. Transient guests are individual travelers who are traveling for business or leisure. Our group guests are traveling for group events that reserve a minimum of 10 rooms for meetings or social functions sponsored by associations, corporate, social, military, educational, religious or other organizations. Group business usually includes a block of room accommodations as well as other ancillary services, such as catering and banquet services. Our contract guests are traveling under a contract negotiated for a block for rooms for more than 30 days in duration at agreed-upon rates. Airline crews are typical generators of contract demand for our hotels.
70
Management and franchise fees. Represents revenues derived from fees earned from hotels and residential properties managed worldwide (usually under long-term management agreements), franchise fees received in connection with the franchising of our brands (usually under long-term franchise agreements), termination fees and the amortization of deferred gains related to sold properties for which we have significant continuing involvement.
| • | Our management agreements typically provide for a two-tiered fee structure that compensates us both for the volume of business we generate for the property as well as for the profitability of hotel operations. In these two-tier fee structures, our base compensation is a base fee that is usually an agreed upon percentage of gross revenues from hotel operations. In addition, we are paid an incentive fee that is typically calculated as a percentage of a hotel profitability measure, as defined in the applicable agreement. Outside of the United States, our fees are often more dependent on hotel profitability measures, either through a single management fee structure where the entire fee is based on a profitability measure, or because our two-tier fee structure is more heavily weighted toward the incentive fee than the base fee. |
| • | Franchise fees generally consist of an initial application fee and continuing royalty fees calculated as a percentage of gross room revenues. Royalty fees for our full service brands also include a percentage of gross food and beverage revenues and gross spa revenues, where applicable. |
Other revenues from managed properties. Represents revenues related primarily to payroll costs at managed properties where we are the employer and are fully reimbursed by the third-party property owner based on the costs incurred, with no added margin. As a result, these revenues have no effect on our profit, although they do increase our total revenues and the corresponding costs increase our total expenses. We record these revenues in “Other revenues from managed properties” and the corresponding costs in “Other costs from managed properties” in our consolidated statements of income (loss).
Intersegment eliminations. We evaluate our reportable segments with intersegment revenues and expenses included in their results. These intersegment revenues and expenses represent management fees earned by our North American and international management and franchising segments for managing our owned and leased hotels. As presented throughout this annual report, the individual segment results for the management and franchising businesses include the intersegment fee revenues and our owned and leased hotels include the intersegment fee expenses. Both the fee revenues and expenses are eliminated in consolidation.
Factors Affecting Our Revenues
The following factors affect the revenues we derive from our operations. For other factors affecting our revenues, see Part I, Item 1A, “Risk Factors—Risks Related to Our Business.”
Consumer demand and global economic conditions. Consumer demand for our products and services is closely linked to the performance of the general economy and is sensitive to business and personal discretionary spending levels. Declines in consumer demand due to adverse general economic conditions, risks affecting or reducing travel patterns, lower consumer confidence and adverse political conditions can lower the revenues and profitability of our owned hotel operations and the amount of management and franchising fee revenues we are able to generate from our managed and franchised properties. Also, declines in hotel profitability during an economic downturn directly impact the incentive portion of our management fees, since it is based on hotel profit measures. Our vacation ownership business is also linked to cycles in the general economy and consumer discretionary spending. As a result, changes in consumer demand and general business cycles can subject and have subjected our revenues to significant volatility. See Part I, Item 1A, “Risk Factors—Risks Related to the Hospitality Industry.”
During the second half of 2008 and all of 2009, the ongoing global economic recession and its negative effect on demand by transient business and leisure travelers and associations and other group customers depressed demand throughout the hospitality industry. These conditions resulted in a decline in RevPAR for the
71
fourth quarter of 2008 and some of the most significant RevPAR declines we have experienced in recent history throughout 2009. This reduced demand has resulted in and may continue to result in decreases in occupancy levels and ADR.
We believe that the economic recession will continue to affect all of our customer segments. During 2009, our systemwide RevPAR declined by 19% compared to 2008. We have recently seen some stabilization in occupancy and a decline in group cancellations combined with recent improvements in group bookings for 2010. However, we expect that there will likely be continued pressure on average room rates for both transient and group business. We anticipate that recovery of demand for hospitality products and services will lag an improvement in current economic conditions.
The current economic environment makes it difficult for us to predict future demand for our hospitality products and services. We cannot predict how severe or prolonged the global economic downturn will be. Furthermore, current global economic conditions have significantly impacted consumer confidence and behavior and, as a result, historical marketing information that we have collected may be less effective as a means of predicting future demand and operating results.
Competition. The global lodging industry is highly competitive. As a result of the decreased demand for hospitality products and services in the current economic environment, competition in the industry has become increasingly fierce. While we generally try to maintain rates whenever possible, the overall reduction in business travel since the second half of 2008 has placed significant pressure on occupancy levels at our properties as well as those of our competitors. Accordingly, we have increased the number of promotional offers and expanded individual hotels’ use of internet distribution channels, which offer different customer price points, in an effort to expose more customers to our products and services and to attract guests. Internet distribution channels are online sites that sell hospitality related products and services of multiple brands. Major internet distribution channels used by Hyatt include Expedia.com, Hotels.com, Priceline.com, Orbitz.com, Hotwire.com and Travelocity.com. While declines in occupancy levels have recently begun to stabilize, room rates continue to be under pressure. Continued competition for a reduced pool of travelers will make it difficult to regain previous ADR levels in a short period of time even if demand and occupancy levels begin to rise. We believe that our brand strength and ability to manage our operations in an efficient manner will help us to compete successfully within the global hospitality industry.
Agreements with third-party owners and franchisees and relationships with developers. We depend on our long-term management and franchise agreements with third-party owners and franchisees for a significant portion of our management and franchising fee revenues. The success and sustainability of our management and franchising business depends on our ability to perform under our management and franchising agreements and maintain good relationships with third-party owners and franchisees. Our relationships with these third-parties also generate new relationships with developers and opportunities for property development that can support our growth. We believe that we have good relationships with our third-party owners, franchisees and developers and are committed to the continued growth and development of these relationships. These relationships exist with a diverse group of owners, franchisees and developers and are not heavily concentrated with any particular third-party.
Access to capital. The hospitality industry is a capital intensive business that requires significant amounts of capital expenditures to develop, maintain and renovate properties. Third-party owners are required to fund these capital expenditures for the properties they own in accordance with the terms of the applicable management or franchise agreement. Access to the capital that we or our third-party owners, franchisees or development partners need to finance the construction of new properties or to maintain and renovate existing properties is critical to the continued growth of our business and our revenues. Over the past eighteen months, the credit markets and the financial services industry have experienced a period of significant disruption characterized by the bankruptcy, failure, collapse or sale of various financial institutions, increased volatility in securities prices, severely diminished liquidity and credit availability and a significant level of intervention from the governments of the U.S. and other countries. As a result of these market conditions, the cost and availability of capital has been and may continue to be adversely affected by illiquid credit markets and wider credit spreads. In particular,
72
in the current environment, available capital for new development is extremely limited if available at all. The availability of capital or the conditions under which we or our third-party owners, franchisees or development partners can obtain capital can have a significant impact on the overall level and pace of future development and therefore the ability to grow our revenues. The disruption in the capital markets has diminished the ability and desire of existing and potential development partners to access capital necessary to develop properties actively. We believe that a continued normalization of credit markets as well as improvements in the global economy and overall business environment will be necessary before we see a material increase in development activity with third-parties.
Expenses
Principal Components
We primarily incur the following expenses:
Owned and leased hotel expenses. Owned and leased hotel expenses comprise the largest portion of our total direct and selling, general and administrative expenses and reflect the expenses of our consolidated owned and leased hotels. Expenses to operate our hotels include room expense, food and beverage costs, other support costs and property expenses. Room expense includes compensation costs for housekeeping, laundry and front desk staff and supply costs for guest room amenities and laundry. Food and beverage costs include costs for wait and kitchen staff and food and beverage products. Other support expenses consist of costs associated with property-level management (including deferred compensation plans for certain employees that are funded through contributions to rabbi trusts), utilities, sales and marketing, operating hotel spas, telephones, parking and other guest recreation, entertainment and services. Property expenses include property taxes, repairs and maintenance, rent and insurance.
Depreciation and amortization expense. These are non-cash expenses that primarily consist of depreciation of fixed assets such as buildings, furniture, fixtures and equipment at our consolidated owned and leased hotels. Amortization expense primarily consists of amortization of management agreement acquisition costs and franchise and brand intangibles, which are amortized over their estimated useful lives.
Selling, general and administrative expenses. Selling, general and administrative expenses consist primarily of compensation expense, including deferred compensation plans for certain employees that are funded through contributions to rabbi trusts, for our corporate staff and personnel supporting our business segments (including divisional offices that support our management and franchising segments), professional fees (including consulting, audit and legal fees), travel and entertainment expenses, bad debt expenses, contractual performance obligations and office administrative and related expenses.
Other costs from managed properties. Represents costs related primarily to payroll expenses at managed properties where we are the employer. These costs are reimbursed to us with no added margin. As a result, these costs have no effect on our profit, although they do increase our total expenses and the corresponding reimbursements increase our total revenues. We record these costs in “Other costs from managed properties” and the corresponding revenues in “Other revenues from managed properties” in our consolidated statements of income (loss).
Factors Affecting Our Costs and Expenses
The following are several principal factors that affect the costs and expenses we incur in the course of our operations. For other factors affecting our costs and expenses, see Part I, Item 1A, “Risk Factors—Risks Related to Our Business.”
Fixed nature of expenses. Many of the expenses associated with managing, franchising, owning and developing hotels and residential and vacation ownership properties are relatively fixed. These expenses include personnel costs, rent, property taxes, insurance and utilities. If we are unable to decrease these costs significantly
73
or rapidly when demand for our hotels and other properties decreases, the resulting decline in our revenues can have a particularly adverse effect on our net cash flow, margins and profits. This effect can be especially pronounced during periods of economic contraction or slow economic growth, such as the current economic recession. Economic downturns generally affect the results of our owned and leased hotel segment more significantly than the results of our management and franchising segments due to the high fixed costs associated with operating an owned or leased property. The effectiveness of any cost-cutting efforts is limited by the fixed-cost nature of our business. As a result, we may not be able to offset further revenue reductions through cost cutting. Employees at some of our owned hotels are parties to collective bargaining agreements that may also limit our ability to make timely staffing or labor changes in response to declining revenues. In addition, any of our efforts to reduce costs, or to defer or cancel capital improvements, could adversely affect the economic value of our properties and brands. During the past year, we have taken steps to reduce our cost base to levels we feel are appropriate to respond to declining revenues without jeopardizing the overall customer experience or the value of our properties or brands. While we intend to maintain our cost structure at appropriate levels while business at our hotels remains depressed, we expect to see the reduced margin levels we have been experiencing to continue until revenues improve. Additionally, we expect to see some increases in compensation expense in 2010.
Changes in depreciation expenses. Changes in depreciation expenses may be driven by renovations of existing properties, acquisition or development of new properties or the disposition of existing properties through sale or closure. We intend to consider strategic and complementary acquisitions of and investments in businesses, properties or other assets. If we consummate any asset acquisitions, we would likely add depreciable assets, which would result in an increase in depreciation expense.
Demand for vacation ownership properties. The ongoing economic downturn has severely reduced consumer demand for vacation ownership properties. A significant portion of our costs to support our vacation ownership business relates to direct sales and marketing of these properties. Accordingly, we have significantly reduced these costs as a response to lower demand. These reductions have allowed us to maintain our profit margins in our vacation ownership business but may not be sufficient to offset further reductions in revenues.
Other Items
Asset impairments
We hold significant amounts of goodwill, intangible assets, long-lived assets and equity method investments. We evaluate these assets on a quarterly basis for impairment as further discussed in “—Critical Accounting Policies and Estimates.” These evaluations have, in the past, resulted in impairment charges for certain of these assets based on the specific facts and circumstances surrounding those assets. Based on a continuation of the current economic conditions or other factors, we may be required to take additional impairment charges to reflect further declines in our asset and/or investment values.
Acquisitions, divestitures and significant renovations
We periodically acquire, divest of or undertake significant renovations in hotel properties. The results of operations derived from these properties do not, therefore, meet the definition of “comparable hotels” as defined in “—Key Business Metrics Evaluated by Management.” The results of operations from these properties, however, may have a material effect on changes in our results from period to period and are, therefore, discussed separately in our discussion on results of operations when material.
In the year ended December 31, 2009, we acquired our Hyatt Regency Boston property for a purchase price of $110 million. In 2007, we acquired three properties consisting of: (1) the remaining 50% interest in our Andaz Liverpool Street property (formerly the Great Eastern Hotel), for a purchase price of GBP 40 million ($83 million) and the assumption of GBP 55 million ($114 million) of debt, (2) our Hyatt Regency San Antonio property, for a purchase price of $161 million and the assumption of $67 million of debt, and (3) our Hyatt Regency Grand Cypress property, which we acquired through a capital lease.
74
In 2008, we sold US Franchise Systems, Inc., which franchised Microtel Inns & Suites and Hawthorn Suites, for a sale price of $131 million.
Effect of foreign currency exchange rate fluctuations
A significant portion of our operations are conducted in functional currencies other than our reporting currency which is the U.S. dollar. As a result, we are required to translate those results from the functional currency into U.S. dollars at market based average exchange rates during the period reported. When comparing our results of operations between periods, there may be material portions of the changes in our revenues or expense that are derived from fluctuations in exchange rates experienced between those periods.
Results of Operations
Year Ended December 31, 2009 Compared with Year Ended December 31, 2008
Consolidated Results
| (In millions, except percentages) | Year Ended December 31, | ||||||||||||||
| 2009 | 2008 | Variance | |||||||||||||
| REVENUES: |
|||||||||||||||
| Total revenues |
$ | 3,332 | $ | 3,837 | $ | (505 | ) | (13 | )% | ||||||
| DIRECT AND SELLING, GENERAL, AND ADMINISTRATIVE EXPENSES: |
|||||||||||||||
| Owned and leased hotels |
1,462 | 1,583 | (121 | ) | (8 | )% | |||||||||
| Depreciation and amortization |
270 | 249 | 21 | 8 | % | ||||||||||
| Other direct costs |
13 | 26 | (13 | ) | (50 | )% | |||||||||
| Selling, general, and administrative |
261 | 290 | (29 | ) | (10 | )% | |||||||||
| Other costs from managed properties |
1,278 | 1,325 | (47 | ) | (4 | )% | |||||||||
| Direct and selling, general, and administrative expenses |
3,284 | 3,473 | (189 | ) | (5 | )% | |||||||||
| Net gains (losses) and interest income from marketable securities held to fund operating programs |
29 | (36 | ) | 65 | 181 | % | |||||||||
| Equity earnings (losses) from unconsolidated hospitality ventures |
(13 | ) | 14 | (27 | ) | (193 | )% | ||||||||
| Interest expense |
(56 | ) | (75 | ) | 19 | 25 | % | ||||||||
| Asset impairments |
(15 | ) | (86 | ) | 71 | 83 | % | ||||||||
| Other income (loss), net |
(48 | ) | 23 | (71 | ) | (309 | )% | ||||||||
| INCOME (LOSS) BEFORE INCOME TAXES |
(55 | ) | 204 | (259 | ) | (127 | )% | ||||||||
| (PROVISION) BENEFIT FOR INCOME TAXES |
10 | (90 | ) | 100 | 111 | % | |||||||||
| INCOME (LOSS) FROM CONTINUING OPERATIONS |
(45 | ) | 114 | (159 | ) | (139 | )% | ||||||||
| DISCONTINUED OPERATIONS |
(1 | ) | 56 | (57 | ) | (102 | )% | ||||||||
| NET INCOME (LOSS) |
(46 | ) | 170 | (216 | ) | (127 | )% | ||||||||
| NET LOSS (INCOME) ATTRIBUTABLE TO NONCONTROLLING INTERESTS |
3 | (2 | ) | 5 | 250 | % | |||||||||
| NET INCOME (LOSS) ATTRIBUTABLE TO HYATT HOTELS CORPORATION |
$ | (43 | ) | $ | 168 | $ | (211 | ) | (126 | )% | |||||
Revenues. Consolidated revenues in the year ended December 31, 2009 decreased $505 million, or 13%, compared to the year ended December 31, 2008, including $45 million in net unfavorable currency effects and a $47 million decrease in other revenues from managed properties. The decrease in other revenues from managed properties was due to lower costs reimbursed by managed properties reflecting cost reductions implemented
75
during 2009. Included in other revenues from managed properties is an increase of $49 million in benefits costs resulting from improved performance of the underlying assets for benefit programs funded through rabbi trusts. These expenses are offset in other costs from managed properties, thus having no net impact to our earnings. Excluding this amount, other revenues from managed properties decreased $95 million, or 7%, in the year ended December 31, 2009 compared to the year ended December 31, 2008. Comparable owned and leased hotel revenue decreased $390 million over the same period, which includes net unfavorable currency effects of $35 million. The remaining decrease in revenues related primarily to reduced management fees in our management and franchising segments. Revenues for our owned and leased hotels and our management and franchising segments were negatively affected by widespread weakness in hotel results driven by sharply reduced demand. Included in consolidated management fees for the year ended December 31, 2009 were base management fees of $118 million, a 16% decrease from 2008, and incentive management fees of $79 million, a 37% decrease from 2008. This decrease in hotel revenue and management fees was primarily driven by a decline in demand which was reflected in lower ADR resulting from greater promotional pricing, and lower occupancy levels particularly from group business. While the decline in base management fees generally followed the decline in hotel revenues, the incentive fees were more negatively affected due to the greater declines in hotel profitability. Hotel profitability levels declined due to the impact of significantly reduced revenue levels and certain fixed costs associated with hotel operations. Corporate and other revenues represent the revenues of our vacation ownership business, which decreased $38 million or 36% as a result of the significant impact of the economic recession on sales of vacation ownership intervals. The table below provides a breakdown of revenues by segment for the years ended December 31, 2009 and 2008. For further discussion of segment revenues for the periods presented, please refer to “—Segment Results.”
| (in millions, except percentages) | Year Ended December 31, | ||||||||||||||
| 2009 | 2008 | Variance | |||||||||||||
| Owned and leased hotels |
$ | 1,782 | $ | 2,139 | $ | (357 | ) | (16.7 | )% | ||||||
| North American management and franchising |
1,382 | 1,475 | (93 | ) | (6.3 | )% | |||||||||
| International management and franchising |
181 | 225 | (44 | ) | (19.6 | )% | |||||||||
| Corporate and other |
67 | 105 | (38 | ) | (36.2 | )% | |||||||||
| Eliminations |
(80 | ) | (107 | ) | 27 | 25.2 | % | ||||||||
| Consolidated revenues |
$ | 3,332 | $ | 3,837 | $ | (505 | ) | (13.2 | )% | ||||||
Owned and leased hotels expense. Expenses for owned and leased hotels decreased by $121 million in the year ended December 31, 2009 compared to the year ended December 31, 2008. The decrease was driven primarily by $168 million of cost reductions at comparable owned and leased hotels primarily attributable to reductions in compensation-related costs and other variable operating expenses, as we reduced our costs in response to declining hotel revenues. The reduced compensation-related costs largely arose from the reductions in hotel staffing levels. Non-comparable owned and leased hotels drove $24 million of increased expenses, due primarily to the 2009 acquisition of our Hyatt Regency Boston property and the opening of a re-branded hotel. Additionally, expenses recognized with respect to our employee benefit programs funded through rabbi trusts increased $23 million as a result of improved performance of the underlying invested assets. These expenses are fully offset by corresponding net gains and interest income from marketable securities held to fund operating programs, thus having no net impact to our earnings.
Depreciation and amortization expense. Depreciation and amortization expense increased by $21 million in the year ended December 31, 2009 compared to the year ended December 31, 2008. This increase was driven by $12 million of accelerated depreciation on assets at properties undergoing renovations and by increased depreciation of $7 million related to the acquisition of our Hyatt Regency Boston property in 2009 and the opening of a re-branded hotel.
76
Other direct costs. Other direct costs represent costs associated with our vacation ownership operations. These costs decreased by $13 million in the year ended December 31, 2009 compared to the year ended December 31, 2008, due to reduced sales of vacation ownership interests, which have slowed significantly due to reductions in demand.
Selling, general and administrative expenses. Selling, general and administrative costs decreased by $29 million in the year ended December 31, 2009 compared to the year ended December 31, 2008. Included in selling, general and administrative expenses is an increase of $40 million in benefits costs resulting from improved performance of the underlying assets for benefit programs funded through rabbi trusts. These expenses are offset in net gains (losses) and interest income from marketable securities held to fund operating programs, thus having no net impact to our earnings. Excluding this amount, selling, general and administrative costs decreased $69 million, or 22%, in the year ended December 31, 2009 compared to the year ended December 31, 2008. The 2008 expenses included a $20 million charge resulting from the termination of our supplemental executive defined plans. Through our 2009 cost reduction initiatives, we decreased marketing costs, primarily for our vacation ownership business by $19 million, reduced compensation and related expenses by $11 million and travel and entertainment expenses by $6 million. Additionally, we achieved cost reductions of $7 million in 2009 as a result of the termination of our supplemental executive defined benefit plan in the fourth quarter of 2008. Bad debt expense also decreased $12 million in 2009. During 2009, we had $10 million of increased expenses under contractual performance obligations, primarily at our select service hotels.
Net gains (losses) and interest income from marketable securities held to fund operating programs. Marketable securities held to fund our benefit programs funded through rabbi trusts resulted in a net gain of $25 million in the year ended December 31, 2009, compared to the net loss of $38 million in the year ended December 31, 2008 due to improved performance of the underlying securities. The gains and losses on securities held in the rabbi trusts are offset by expenses in our owned and leased hotels expense and in selling, general and administrative expenses for our managed and franchised hotels, having no net impact on our earnings. Of the $63 million change in the underlying securities $40 million was offset in selling, general and administrative expenses and $23 million was offset in owned and leased hotel expenses. Marketable securities held to fund our Gold Passport program generated a net gain of $4 million in the year ended December 31, 2009, compared to a net gain of $2 million for the year ended December 31, 2008. The gains and losses on securities held to fund our Gold Passport program are offset by corresponding changes to our owned and leased hotel revenues, thus having no net impact on our earnings.
Equity earnings (losses) from unconsolidated hospitality ventures. Equity losses from unconsolidated hospitality ventures were $13 million in the year ended December 31, 2009, compared to income of $14 million for the year ended December 31, 2008. There was an $18 million decline attributable to lower earnings generated by the underlying hotels, of which $5 million related to newly opened hotels. Earnings in 2008 included the reversal of a previously recorded reserve for a non-refundable deposit of $9 million and $3 million in transaction costs related to the purchase of an equity interest in a hotel property in Hawaii, which had been reserved in full in 2007 due to uncertainty surrounding the transaction. In 2009, we also recorded impairment charges of $14 million, which included impairment of interests in hospitality venture properties of $11 million and a vacation ownership property of $3 million. In 2008, we recorded $19 million in impairment charges for three vacation ownership investments.
Interest expense. Interest expense decreased by $19 million in the year ended December 31, 2009 compared to the year ended December 31, 2008. There was a $23 million reduction in interest expense relating to the repayment of $600 million of senior subordinated notes in May of 2009. There was also a $13 million reduction in interest expense due to the repayment of two hotel loans during 2009. This reduction was partially offset by a $12 million increase in interest expense related to the issuance of the senior notes in August 2009, as well as a $4 million increase primarily related to amendment fees on our revolving credit facility. For further information on these transactions refer to Note 10 of the Consolidated Financial Statements.
77
Asset impairments. Asset impairments, which are recorded, as necessary, based on our regular evaluation of assets for impairment, were $15 million and $86 for the years ended December 31, 2009 and 2008, respectively. The $15 million in impairment charges in 2009 included a $7 million charge related to goodwill impairment on a hotel and a $3 million charge reflecting the impairment of property and equipment in our owned and leased hotel segment. Additionally, we had a $5 million charge for the full impairment of an intangible asset relating to a management agreement covering certain select service hotels in our North American management and franchising segment. The 2008 asset impairments of $86 million related to goodwill impairments for two hotels, one being a $79 million impairment charge for our Andaz Liverpool Street property.
Other income (loss), net. Other income (loss), net decreased by $71 million in the year ended December 31, 2009 compared to the year ended December 31, 2008, primarily due to $93 million of debt settlement costs. Further information on this transaction is discussed in “—Liquidity and Capital Resources.” Additionally, cash distributions from cost method investments decreased $42 million for the comparable periods. These declines were partially offset by improvements in gains (losses) on other marketable securities and foreign currency of $47 million and $28 million, respectively. The table below provides a breakdown of other income (loss), net for the years ended December 31, 2009 and 2008:
| (in millions except percentages) | Year Ended December 31, | ||||||||||||||
| 2009 | 2008 | Variance | |||||||||||||
| Interest income on interest-bearing cash and cash equivalents |
$ | 21 | $ | 23 | $ | (2 | ) | (8.7 | )% | ||||||
| Gains (losses) on other marketable securities |
10 | (37 | ) | 47 | 127.0 | % | |||||||||
| Income from cost method investments (1) |
22 | 64 | (42 | ) | (65.6 | )% | |||||||||
| Foreign currency gains (losses) |
5 | (23 | ) | 28 | 121.7 | % | |||||||||
| Debt settlement costs (2) |
(93 | ) | — | (93 | ) | (100.0 | )% | ||||||||
| Provisions on hotel loans (3) |
(9 | ) | — | (9 | ) | (100.0 | )% | ||||||||
| Other (4) |
(4 | ) | (4 | ) | — | — | |||||||||
| Other income (loss), net |
$ | (48 | ) | $ | 23 | $ | (71 | ) | (308.7 | )% | |||||
| (1) | Income from cost method investments for the year ended December 31, 2009 included $22 million in cash distributions related to non-hospitality real estate investment companies. The year ended December 31, 2008 included $62 million in cash distributions from indirect investments in certain life sciences technology companies. We do not expect material distributions from these investments in the future. See Note 3 of our consolidated financial statements. |
| (2) | Amount relates to costs associated with the repurchase of senior subordinated notes and early settlement of a subscription agreement as described in “-Liquidity and Capital Resources”. The costs include $88 million of make whole interest payments and early settlement premiums and a $5 million write-off of deferred financing costs. |
| (3) | During 2009 we recorded $9 million in loan loss provisions related to certain hotel loans provided to owners or developers of hotels that we manage or franchise based on our assessment of their collectability. |
| (4) | Includes gains (losses) on asset retirements for each period presented. |
(Provision) benefit for income taxes. Income taxes for the years ended December 31, 2009 and 2008 were a benefit of $10 million and a provision of $90 million, respectively, which resulted in effective income tax rates of 18.2 % for 2009 and 44.0% for 2008.
The effective tax rate for 2009 of 18.2% differed from the U.S statutory federal income tax rate of 35% primarily due to the mix of U.S. operating losses with earnings from our foreign-based operations. The tax benefit from U.S. losses and losses in certain foreign jurisdictions were partially offset by taxes against income earned by our foreign-based operations, an increase in unrecognized tax benefits totaling $11 million and valuation allowances primarily related to foreign losses of $31 million.
78
The effective tax rate for 2008 of 44.0% differed from the U.S statutory federal income tax rate of 35% due to nondeductibility of goodwill impairments of $28 million, an increase in unrecognized tax benefits of $17 million and valuation allowances primarily related to foreign losses of $13 million. These impacts were partially offset by tax benefits related to IRS settlements and valuation allowance reversals totaling $29 million and foreign tax rate benefits of $9 million.
Discontinued operations. During 2008, we sold US Franchise Systems, Inc., which franchised Microtel Inns & Suites and Hawthorn Suites, and recorded a pretax gain on sale of $78 million in discontinued operations and $1 million in earnings from discontinued operations. Additionally, we sold a hotel property and recorded a pretax gain of $4 million during 2008. Income tax expense related to these transactions was $28 million, resulting in a net gain of $55 million.
Net loss (income) attributable to noncontrolling interests. Net loss (income) attributable to noncontrolling interests decreased by $5 million compared to 2008, primarily due to operating losses generated at hotels, which are partially owned by noncontrolling partners.
Segment Results
We evaluate segment operating performance using segment revenue and segment Adjusted EBITDA, as described in Note 20 to our Consolidated Financial Statements. See “—Key Business Metrics Evaluated by Management” for a discussion of our definition of Adjusted EBITDA, how we use it, why we present it and material limitations on its usefulness. The segment results presented below are presented before intersegment eliminations.
Owned and Leased Hotels. Revenues decreased by $357 million in the year ended December 31, 2009 compared to the year ended December 31, 2008. Included in this decrease was $35 million of net unfavorable currency effects. Comparable owned and leased hotel revenues decreased $390 million, and were driven by a RevPAR decline of 18% largely due to reductions in occupancy and ADR across both group and transient business, as well as significant declines in food and beverage revenues. The decline in transient revenues was driven by lower rates as hotels have increased promotions to attract guests. The group revenue decline was primarily a result of significant decreases in occupancy from earlier cancellations and, more recently, the replacement of traditional larger corporate groups with smaller groups. Food and beverage revenues were down significantly as a result of both lower occupancy and reduced spending by guests compared to 2008. Traditional corporate travel, which drives higher room rates and banquet spend, has largely been replaced by transient leisure travelers and smaller groups who are spending less on food and other hotel services. Non-comparable owned and leased hotel revenues increased $33 million primarily due to the acquisition of our Hyatt Regency Boston property during the first quarter of 2009.
| (Comparable Owned and Leased Hotels) | Year Ended December 31, | ||||||||||||||||||||||||||
| RevPAR | Occupancy | ADR | |||||||||||||||||||||||||
| 2009 | 2008 | Variance | 2009 | 2008 | Change in Occ % pts |
2009 | 2008 | Variance | |||||||||||||||||||
| Full Service |
$ | 114 | $ | 140 | (18.8 | )% | 65.0 | % | 69.6 | % | (4.7 | )% | $ | 176 | $ | 202 | (12.9 | )% | |||||||||
| Select Service |
62 | 75 | (16.5 | )% | 67.1 | % | 69.6 | % | (2.6 | )% | 93 | 107 | (13.3 | )% | |||||||||||||
| Total Owned and Leased Hotels |
$ | 101 | $ | 124 | (18.4 | )% | 65.5 | % | 69.6 | % | (4.1 | )% | $ | 154 | $ | 178 | (13.3 | )% | |||||||||
| Year Ended December 31, | |||||||||||||
| (in millions except percentages) | 2009 | 2008 | Variance | ||||||||||
| Segment Revenues |
$ | 1,782 | $ | 2,139 | $ | (357 | ) | (16.7 | )% | ||||
| Segment Adjusted EBITDA |
$ | 302 | $ | 522 | $ | (220 | ) | (42.1 | )% | ||||
Adjusted EBITDA declined by $220 million in the year ended December 31, 2009 compared to the year ended December 31, 2008, including $10 million in unfavorable currency effects. Comparable owned and leased
79
hotel performance decreased by $197 million primarily due to revenue deterioration partially offset by cost-saving initiatives resulting in reductions in staffing and other hotel costs. Additionally, Adjusted EBITDA decreased $31 million due to declining operating performance at our unconsolidated hospitality ventures. These declines are partially offset by increases at our non-comparable owned and leased hotels of $8 million, which is largely due to the acquisition of the Hyatt Regency Boston property.
North American management and franchising. North American management and franchising revenues decreased by $93 million in the year ended December 31, 2009 compared to the year ended December 31, 2008. Other revenues from managed properties declined $40 million due to reduced property level staffing and other program costs reimbursed by managed properties. Management and franchise fees declined $53 million with declines in both base and incentive fees driven primarily by the effects of a 18% decrease in comparable systemwide North American full service RevPAR. Our full service hotels experienced significant rate pressure during 2009 due largely to competition for transient business. Promotions and limited time offers have been effective in bringing recent transient occupancy back to 2008 levels. However, as a result of these promotions, our ADR has significantly declined. We also experienced a significant decline in group business, largely reflected in lower occupancy. Although the pace of cancellations declined in the second half of the year, and the rate of decline in recent near term bookings has slowed, the impact of the previously high level of cancellations has significantly impacted our 2009 results. Starting in late 2008 and into 2009, we began implementing cost reduction initiatives throughout our system with property and corporate level programs to mitigate the impact of the economic downturn and revenue decline at both our full and select service hotels. As a result, hotel-level operating costs declined by 11.4% in the year ended December 31, 2009 compared to the year ended December 31, 2008. RevPAR at our select service hotels in the year ended December 31, 2009 declined by 13% compared to 2008.
| (Comparable Systemwide Hotels) | Year Ended December 31, | ||||||||||||||||||||||||||
| RevPAR | Occupancy | ADR | |||||||||||||||||||||||||
| 2009 | 2008 | Variance | 2009 | 2008 | Change in Occ % pts |
2009 | 2008 | Variance | |||||||||||||||||||
| North American Full Service |
$ | 104 | $ | 126 | (17.5 | )% | 66.6 | % | 71.5 | % | (4.9 | )% | $ | 156 | $ | 176 | (11.4 | )% | |||||||||
| North American Select Service |
63 | 73 | (12.5 | )% | 66.4 | % | 67.0 | % | (0.6 | )% | 96 | 108 | (11.8 | )% | |||||||||||||
| Year Ended December 31, | |||||||||||||
| (in millions except percentages) | 2009 | 2008 | Variance | ||||||||||
| Segment Revenues |
|||||||||||||
| Management, Franchise and Other Fees |
$ | 176 | $ | 229 | $ | (53 | ) | (23.1 | )% | ||||
| Other Revenues from Managed Properties |
1,206 | 1,246 | (40 | ) | (3.2 | )% | |||||||
| Total Segment Revenues |
$ | 1,382 | $ | 1,475 | $ | (93 | ) | (6.3 | )% | ||||
| Segment Adjusted EBITDA |
$ | 117 | $ | 162 | $ | (45 | ) | (27.8 | )% | ||||
Adjusted EBITDA declined by $45 million in the year ended December 31, 2009 compared to the year ended December 31, 2008, primarily due to $53 million reduction in management and franchise fees. For the year ended December 31, 2009, expenses under contractual performance obligations increased by $8 million as a result of the weakness in hotel performance. Additionally, sales and marketing spend increased $3 million and professional fees increased $2 million. These increases are largely offset by a $16 million decrease in bad debt expense. In addition, our cost saving initiatives have resulted in reduced compensation and related expenses of $7 million and travel and entertainment costs of $2 million.
International management and franchising. International management and franchising revenues decreased by $44 million in the year ended December 31, 2009 compared to the year ended December 31, 2008, and included $10 million in net unfavorable currency impact. The $41 million decrease in fees was driven by comparable systemwide international full service hotels due to a 22% decrease in RevPAR during the year ended
80
December 31, 2009 compared to the year ended December 31, 2008, resulting from both ADR and occupancy declines. As a result of the economic downturn and related reduction in revenues, we also have been taking steps to effectively manage costs, including reducing hotel staffing levels.
| (Comparable Systemwide Hotels) | Year Ended December 31, | ||||||||||||||||||||||||||
| RevPAR | Occupancy | ADR | |||||||||||||||||||||||||
| 2009 | 2008 | Variance | 2009 | 2008 | Change in Occ % pts |
2009 | 2008 | Variance | |||||||||||||||||||
| International Full Service |
$ | 124 | $ | 159 | (22.1 | )% | 59.6 | % | 64.2 | % | (4.6 | )% | $ | 208 | $ | 247 | (16.1 | )% | |||||||||
| Year Ended December 31, | |||||||||||||
| (in millions except percentages) | 2009 | 2008 | Variance | ||||||||||
| Segment Revenues |
|||||||||||||
| Management, Franchise and Other Fees |
$ | 126 | $ | 167 | $ | (41 | ) | (24.6 | )% | ||||
| Other Revenues from Managed Properties |
55 | 58 | (3 | ) | (5.2 | )% | |||||||
| Total Segment Revenues |
$ | 181 | $ | 225 | $ | (44 | ) | (19.6 | )% | ||||
| Segment Adjusted EBITDA |
$ | 66 | $ | 102 | $ | (36 | ) | (35.3 | )% | ||||
Adjusted EBITDA declined by $36 million in the year ended December 31, 2009 compared to the year ended December 31, 2008, primarily due to reduced management and franchise fees of $41 million, including $10 million in unfavorable currency impact. Additionally, increases in severance costs in 2009 combined with a reduction in bad debt recoveries in 2009 as compared to 2008 led to increased expenses of $4 million. These fee declines and cost increases were partially offset by a $7 million decrease in compensation expense as a result of the termination of our supplemental executive defined benefit plan in the fourth quarter of 2008. Our cost savings initiatives reduced travel and entertainment by $2 million and compensation and related expenses by $1 million.
Corporate and other. Corporate and other includes unallocated corporate expenses and the results of our vacation ownership business. Revenues declined by $38 million in the year ended December 31, 2009 compared to the year ended December 31, 2008 due to significant decreases in demand for vacation ownership units as a result of continued weak economic conditions.
| (in millions except percentages) | Year Ended December 31, | ||||||||||||||
| 2009 | 2008 | Variance | |||||||||||||
| Corporate and other Revenues |
$ | 67 | $ | 105 | $ | (38 | ) | (36.2 | )% | ||||||
| Corporate and other Adjusted EBITDA |
$ | (79 | ) | $ | (99 | ) | $ | 20 | 20.2 | % | |||||
Adjusted EBITDA improved $20 million in the year ended December 31, 2009 compared to the year ended December 31, 2008 from reductions in corporate expenses due to various cost reduction initiatives which included reduced compensation and related expenses of $11 million, lower professional fees of $3 million and reduced travel and entertainment costs of $2 million during this period over the same period in 2008. Lower vacation ownership revenues were offset by reduced vacation ownership expenses.
Eliminations. Eliminations of $80 million and $107 million for the year ended December 31, 2009 and 2008, respectively, primarily represent fees charged by our management and franchising segments to our owned and leased hotels for managing their operations.
81
Non-GAAP Measure Reconciliation
The following table sets forth Adjusted EBITDA by segment for the years ended December 31, 2009 and 2008. For a discussion of our definition of Adjusted EBITDA, how we use it, why we present it and material limitations on its usefulness, see “—Key Business Metrics Evaluated by Management.”
| (in millions, except percentages) | Year Ended December 31, | ||||||||||||||
| 2009 | 2008 | Variance | |||||||||||||
| Owned and leased hotels |
$ | 302 | $ | 522 | $ | (220 | ) | (42.1 | )% | ||||||
| North American management and franchising |
117 | 162 | (45 | ) | (27.8 | )% | |||||||||
| International management and franchising |
66 | 102 | (36 | ) | (35.3 | )% | |||||||||
| Corporate and other |
(79 | ) | (99 | ) | 20 | 20.2 | % | ||||||||
| Consolidated Adjusted EBITDA |
$ | 406 | $ | 687 | $ | (281 | ) | (40.9 | )% | ||||||
The table below provides a reconciliation of our consolidated Adjusted EBITDA to EBITDA and a reconciliation of EBITDA to net income (loss) attributable to Hyatt Hotels Corporation in the years ended December 31, 2009 and 2008:
| (in millions) | Year Ended December 31, | |||||||
| 2009 | 2008 | |||||||
| Adjusted EBITDA |
$ | 406 | $ | 687 | ||||
| Equity earnings (losses) from unconsolidated hospitality ventures |
(13 | ) | 14 | |||||
| Asset impairments |
(15 | ) | (86 | ) | ||||
| Other income (loss), net |
(48 | ) | 23 | |||||
| Charge resulting from the termination of our supplemental executive defined benefit plans |
— | (20 | ) | |||||
| Discontinued operations, net of tax |
(1 | ) | 56 | |||||
| Net (loss) income attributable to noncontrolling interests |
3 | (2 | ) | |||||
| Pro rata share of unconsolidated hospitality ventures Adjusted EBITDA |
(59 | ) | (90 | ) | ||||
| EBITDA |
273 | 582 | ||||||
| Depreciation and amortization |
(270 | ) | (249 | ) | ||||
| Interest expense |
(56 | ) | (75 | ) | ||||
| (Provision) benefit for income taxes |
10 | (90 | ) | |||||
| Net income (loss) attributable to Hyatt Hotels Corporation |
$ | (43 | ) | $ | 168 | |||
82
Year Ended December 31, 2008 Compared with Year Ended December 31, 2007
Consolidated Results
| (in millions, except percentages) | Years Ended December 31, | ||||||||||||||
| 2008 | 2007 | Variance | |||||||||||||
| Revenues: |
|||||||||||||||
| Total revenues |
$ | 3,837 | $ | 3,738 | $ | 99 | 2.6 | % | |||||||
| Direct and Selling, General, and Administrative Expenses: |
|||||||||||||||
| Owned and leased hotels |
1,583 | 1,524 | 59 | 3.9 | % | ||||||||||
| Depreciation and amortization |
249 | 214 | 35 | 16.4 | % | ||||||||||
| Other direct costs |
26 | 42 | (16 | ) | (38.1 | )% | |||||||||
| Selling, general, and administrative |
290 | 292 | (2 | ) | (0.7 | )% | |||||||||
| Other costs from managed properties |
1,325 | 1,281 | 44 | 3.4 | % | ||||||||||
| Direct and selling, general, and administrative expenses |
3,473 | 3,353 | 120 | 3.6 | % | ||||||||||
| Net gains (losses) and interest income from marketable securities held to fund operating programs |
(36 | ) | 15 | (51 | ) | (340.0 | )% | ||||||||
| Equity earnings from unconsolidated hospitality ventures |
14 | 11 | 3 | 27.3 | % | ||||||||||
| Interest expense |
(75 | ) | (43 | ) | (32 | ) | (74.4 | )% | |||||||
| Gains on sales of real estate |
— | 22 | (22 | ) | (100.0 | )% | |||||||||
| Asset impairments |
(86 | ) | — | (86 | ) | (100.0 | )% | ||||||||
| Other income, net |
23 | 84 | (61 | ) | (72.6 | )% | |||||||||
| Income before income taxes |
204 | 474 | (270 | ) | (57.0 | )% | |||||||||
| Provision for income taxes |
(90 | ) | (208 | ) | 118 | 56.7 | % | ||||||||
| Income from continuing operations |
114 | 266 | (152 | ) | (57.1 | )% | |||||||||
| Discontinued operations |
56 | 5 | 51 | 1020.0 | % | ||||||||||
| Net income |
170 | 271 | (101 | ) | (37.3 | )% | |||||||||
| Net (income) attributable to noncontrolling interests |
(2 | ) | (1 | ) | (1 | ) | (100.0 | )% | |||||||
| Net Income Attributable to Hyatt Hotels Corporation |
$ | 168 | $ | 270 | $ | (102 | ) | (37.8 | )% | ||||||
Revenues. Consolidated revenues increased by $99 million, or 2.6%, in 2008 compared to 2007, including $2 million in net unfavorable currency effects. Revenues from owned and leased hotels increased by $100 million, including $53 million of revenues from non-comparable owned and leased hotels and $51 million of revenues from comparable owned and leased hotels. Our North American management and franchising segment revenues increased by $35 million, all of which was attributable to an increase in other revenues from managed properties driven by increased costs reimbursed by managed properties due to growth in hotel operations primarily occurring during the first half of 2008. Consolidated base management fees in 2008 were $141 million, or a 9% decrease, however 2007 included an additional $10 million of termination and settlement fees. Excluding the incremental termination and settlement fees, base management fees decreased 3% versus 2007. Consolidated incentive management fees were $126 million, or a 6% decrease. The decrease in base management fees were primarily the result of fees for Hyatt branded hotels acquired during 2007 that we continued to manage and were therefore eliminated as intercompany fee revenue during the entirety of 2008. The decrease in incentive fees was due to declines in hotel profitability during the later half of 2008 driven by the economic downturn. Corporate and other revenues decreased by $14 million, primarily attributable to a decline in revenues from our vacation ownership business. The table below provides a breakdown of revenues by segment for the years ended December 31, 2008 and 2007. For further discussion of segment revenues for the periods presented, please refer to “—Segment Results.”
83
| (in millions, except percentages) | Year Ended December 31, | ||||||||||||||
| 2008 | 2007 | Variance | |||||||||||||
| Owned and leased hotels |
$ | 2,139 | $ | 2,039 | $ | 100 | 4.9 | % | |||||||
| North American management and franchising |
1,475 | 1,440 | 35 | 2.4 | % | ||||||||||
| International management and franchising |
225 | 226 | (1 | ) | (0.4 | )% | |||||||||
| Corporate and other |
105 | 119 | (14 | ) | (11.8 | )% | |||||||||
| Eliminations |
(107 | ) | (86 | ) | (21 | ) | (24.4 | )% | |||||||
| Consolidated revenues |
$ | 3,837 | $ | 3,738 | $ | 99 | 2.6 | % | |||||||
Owned and leased hotels expense. Owned and leased hotels expenses increased by $59 million, or 3.9%, in 2008 compared to 2007. Non-comparable owned and leased hotel expenses increased $41 million in 2008 due primarily to our hotel acquisitions in 2007. The remaining $18 million increase was primarily due to increased maintenance costs at comparable owned and leased hotels.
Depreciation and amortization expense. Depreciation and amortization expense increased $35 million, or 16.4%, in 2008 compared to 2007, primarily driven by depreciation and amortization expense associated with our hotel acquisitions in 2007.
Other direct costs. Other direct costs, which represent costs associated with the sales of our vacation ownership operations, decreased by $16 million, or 38.1%, in 2008 compared to 2007, consistent with the related decline in sales of vacation ownership properties in 2008.
Selling, general and administrative expenses. Selling, general and administrative expenses were relatively flat in 2008 compared to 2007. The 2008 expenses included a $20 million charge resulting from the termination of our supplemental executive defined benefit plans, which was offset by decreased expenses for our employee benefit programs funded through rabbi trusts.
Net (losses) gains and interest income from marketable securities held to fund operating programs. Market conditions resulted in net losses of $38 million in 2008 compared to a net gain of $10 million in 2007 from marketable securities held to fund our benefit programs funded through rabbi trusts and in a net gain of $2 million in 2008 compared to a net gain of $5 million in 2007 from marketable securities held for our Hyatt Gold Passport program.
Equity earnings from unconsolidated hospitality ventures. Earnings from unconsolidated hospitality ventures increased by $3 million in 2008 compared to 2007. This increase in earnings was primarily due to the reversal of a previously recorded reserve for a non-refundable deposit of $9 million to purchase an equity interest in a hotel property in Hawaii, which had been reserved in full in 2007 due to uncertainty surrounding the transaction. The reversal of this reserve was partially offset by increased impairment charges in 2008 compared to charges recorded in 2007. In 2008, we recorded $19 million in impairment charges for three vacation ownership investments based on our analysis of the expected future cash flows compared to $12 million in charges recorded in 2007.
Interest expense. Interest expense increased by $32 million in 2008 compared to 2007, due primarily to an increase of $25 million attributable to a full year of interest expense in respect of $600 million of senior subordinated notes issued in the second half of 2007 and an increase of $16 million attributable to a full year of interest expense associated with the debt acquired as part of the 2007 purchase of the Andaz Liverpool Street property (formerly the Great Eastern Hotel). The balance of the change over the same period related primarily to a decrease in interest expense of $11 million related to the retirement of debt in 2007.
Gains on sales of real estate. We did not complete any sales of real estate during 2008 other than those recorded as part of discontinued operations. We recorded $22 million in gains on sales of real estate in 2007 resulting from the sale of seven AmeriSuites hotels that we continued to manage or franchise after the sale and the Hyatt Regency Woodfield property.
84
Asset impairments. Asset impairments were $86 million in 2008, primarily due to goodwill impairments related to two hotels, including a $79 million impairment charge for our Andaz Liverpool Street property. We purchased the Andaz Liverpool Street property, which is located in London’s financial district, in 2007, before the inception of the global financial crisis. The value of this property at the time of purchase created goodwill that was fully impaired as of December 31, 2008. The goodwill impairments impacted segment results for the owned and leased hotel segment.
Other income, net. Other income, net decreased by $61 million in 2008 compared to 2007. The table below provides a breakdown of other income, net for 2008 and 2007:
| (in millions, except percentages) | Year Ended December 31, | ||||||||||||||
| 2008 | 2007 | Variance | |||||||||||||
| Interest income on interest-bearing cash and cash equivalents |
$ | 23 | $ | 43 | $ | (20 | ) | (46 | )% | ||||||
| Gains (losses) on other marketable securities |
(37 | ) | — | (37 | ) | (100 | )% | ||||||||
| Income from cost method investments (1) |
64 | 87 | (23 | ) | (26 | )% | |||||||||
| Foreign currency gains (losses) |
(23 | ) | 17 | (40 | ) | (235 | )% | ||||||||
| Provisions on hotel loans (2) |
— | (61 | ) | 61 | 100 | % | |||||||||
| Other |
(4 | ) | (2 | ) | (2 | ) | (100 | )% | |||||||
| Other income, net |
$ | 23 | $ | 84 | $ | (61 | ) | (73 | )% | ||||||
| (1) | Income from cost method investments in 2008 related primarily to distributions of $62 million from indirect investments in certain life science technology companies. We do not expect material distributions from these investments in the future. The majority of income from cost method investments in 2007 related to $62 million in distributions from funds that owned the Extended Stay America and the Homestead Studio Suites investments, primarily as a result of the sale of those businesses, $14 million related to distributions from certain non-hospitality real estate investment companies and $6 million related to distributions from indirect investments in certain life science technology companies. See Note 3 to our Consolidated Financial Statements. |
| (2) | In 2007, we recorded a loan loss provision of $61 million on a loan to a hotel developer as a result of the developer’s default. |
Provision for income taxes. The provision for income taxes was $90 million for 2008 and $208 million for 2007, which resulted in effective income tax rates of 44.0% for 2008 and 43.9% for 2007.
The effective rate for 2008 of 44.0% differed from the U.S. statutory rate of 35.0% due to the nondeductibility of goodwill impairment of $28 million, an increase in unrecognized tax benefits of $17 million and valuation allowances primarily related to foreign operating losses of $13 million. These impacts were partially offset by tax benefits related to IRS settlements and valuation allowance reversals totaling $29 million and foreign tax rate benefits of $9 million.
The effective rate for 2007 of 43.9% differed from the U.S. statutory rate of 35.0% due to an increase in state taxes, net of federal benefits, of $17 million, an increase in unrecognized tax benefits of $30 million and valuation allowances of $17 million, primarily related to foreign operating losses. These impacts were partially offset by foreign tax rate benefits totaling $26 million.
Discontinued operations. During 2008, we sold US Franchise Systems, Inc., which franchised Microtel Inns & Suites and Hawthorn Suites, and recorded a pretax gain on sale of $78 million in discontinued operations and $1 million in earnings from discontinued operations. Additionally, we sold a hotel property and recorded a pretax gain of $4 million during 2008. Income tax expense related to these transactions was $28 million, resulting in a net gain of $55 million.
During 2007, we sold an AmeriSuites hotel that was classified as a discontinued operation and with which we no longer have a management or franchise relationship, recognizing a net gain of $2 million and net earnings of $3 million from discontinued operations.
85
Segment Results
We evaluate segment operating performance using segment revenues and segment Adjusted EBITDA as described in Note 20 to our Consolidated Financial Statements. See “—Key Business Metrics Evaluated by Management” for a discussion of our definition of Adjusted EBITDA, how we use it, why we present it and material limitations on its usefulness. The segment results presented below are presented before intersegment eliminations.
Owned and leased hotels. Revenues increased by $100 million in 2008 compared to 2007, including $4 million in net unfavorable currency effects. Non-comparable owned and leased hotels accounted for $53 million of the increase in revenues over 2007, attributable to the inclusion of a full year of operations of our hotel acquisitions in 2007. Comparable owned and leased hotel revenues increased by $51 million in 2008 compared to 2007, primarily driven by performance improvements at newly converted Hyatt Place hotels and full service hotels.
| (Comparable Owned and Leased Hotels) | Year Ended December 31, | ||||||||||||||||||||||||||
| RevPAR | Occupancy | ADR | |||||||||||||||||||||||||
| 2008 | 2007 | Variance | 2008 | 2007 | Change in Occ % pts |
2008 | 2007 | Variance | |||||||||||||||||||
| Full Service |
$ | 139 | $ | 138 | 0.9 | % | 69.8 | % | 70.3 | % | (0.5 | )% | $ | 200 | $ | 197 | 1.5 | % | |||||||||
| Select Service |
75 | 61 | 22.3 | % | 69.6 | % | 60.9 | % | 8.7 | % | 107 | 100 | 6.9 | % | |||||||||||||
| Total Owned and Leased Hotels |
$ | 122 | $ | 117 | 3.9 | % | 69.8 | % | 67.7 | % | 2.1 | % | $ | 175 | $ | 173 | 0.9 | % | |||||||||
| Year Ended December 31, | ||||||||||||
| (in millions, except percentages) | 2008 | 2007 | Variance | |||||||||
| Revenues |
$ | 2,139 | $ | 2,039 | $ | 100 | 4.9 | % | ||||
| Adjusted EBITDA |
$ | 522 | $ | 518 | $ | 4 | 0.8 | % | ||||
Adjusted EBITDA improved by $4 million in 2008 compared to 2007, including $1 million in net unfavorable currency effects. Results of non-comparable owned and leased hotels improved $10 million largely due to our hotel acquisitions in 2007. Comparable owned and leased hotels declined by $1 million in 2008 compared to 2007. However, the 2007 period included the resolution of disputed rent charges that resulted in a gain of $13 million. Our pro rata share of unconsolidated hospitality ventures Adjusted EBITDA decreased by $4 million in 2008 compared to 2007 due to lower performance of the underlying properties.
North American management and franchising. North American management and franchising revenues increased by $35 million in 2008 compared to 2007, driven entirely by other revenues from managed properties resulting from increased costs reimbursed by managed properties due to growth in hotel operations primarily occurring during the first half of 2008. Base and incentive fees were flat.
| (Comparable Systemwide Hotels) | Year Ended December 31, | ||||||||||||||||||||||||||
| RevPAR | Occupancy | ADR | |||||||||||||||||||||||||
| 2008 | 2007 | Variance | 2008 | 2007 | Change in Occ % pts |
2008 | 2007 | Variance | |||||||||||||||||||
| Systemwide Hotel Results: |
|||||||||||||||||||||||||||
| North American Full Service |
$ | 128 | $ | 129 | (0.9 | )% | 72.1 | % | 73.0 | % | (0.9 | )% | $ | 177 | $ | 177 | 0.4 | % | |||||||||
| North American Select Service |
73 | 62 | 17.8 | % | 66.9 | % | 61.7 | % | 5.2 | % | 108 | 100 | 8.6 | % | |||||||||||||
86
| Year Ended December 31, | |||||||||||||
| (in millions, except percentages) | 2008 | 2007 | Variance | ||||||||||
| Revenues: |
|||||||||||||
| Management, Franchise and Other Fees |
$ | 229 | $ | 229 | $ | — | 0.0 | % | |||||
| Other Revenues from Managed Properties |
1,246 | 1,211 | 35 | 2.9 | % | ||||||||
| Total Revenues |
$ | 1,475 | $ | 1,440 | $ | 35 | 2.4 | % | |||||
| Adjusted EBITDA |
$ | 162 | $ | 164 | $ | (2 | ) | (1.2 | )% | ||||
Adjusted EBITDA declined by $2 million in 2008 compared to 2007. Adjusted EBITDA in 2008 included a $18 million increase in bad debt expense and a $4 million increase, primarily due to employee benefits costs, while 2007 Adjusted EBITDA primarily included $15 million in additional performance cure expenses and $7 million in brand launch costs associated with the conversion of our Hyatt Place hotels.
International management and franchising. International management and franchising revenues were essentially flat in 2008 compared to 2007. However, 2008 included $2 million in net favorable currency effects and an increase of $4 million in other revenues from managed properties driven by increased costs reimbursed by managed properties due primarily to higher centralized support costs for managed hotel operations. Offsetting these amounts was a $5 million decline in fee revenue primarily due to a $8 million fee received in 2007 in connection with the sale of a managed property by a third-party owner.
| (Comparable Systemwide Hotels) | Year Ended December 31, | ||||||||||||||||||||||||||
| RevPAR | Occupancy | ADR | |||||||||||||||||||||||||
| 2008 | 2007 | Variance | 2008 | 2007 | Change in Occ % pts |
2008 | 2007 | Variance | |||||||||||||||||||
| Systemwide Hotel Results: |
|||||||||||||||||||||||||||
| International Full Service |
$ | 154 | $ | 151 | 2.3 | % | 65.3 | % | 68.6 | % | (3.3 | )% | $ | 237 | $ | 220 | 7.4 | % | |||||||||
| Year Ended December 31, | |||||||||||||
| (in millions, except percentages) | 2008 | 2007 | Variance | ||||||||||
| Revenues: |
|||||||||||||
| Management, Franchise and Other Fees |
$ | 167 | $ | 172 | $ | (5 | ) | (2.9 | )% | ||||
| Other Revenues from Managed Properties |
58 | 54 | 4 | 7.4 | % | ||||||||
| Total Revenues |
$ | 225 | $ | 226 | $ | (1 | ) | (0.4 | )% | ||||
| Adjusted EBITDA |
$ | 102 | $ | 110 | $ | (8 | ) | (7.3 | )% | ||||
Adjusted EBITDA declined by $8 million in 2008 compared to 2007, including $1 million in favorable currency effects over the same period. The decline in 2008 was primarily driven by a $5 million decrease in fee revenues, as described above, combined with increased employment and professional service expenses.
Corporate and other. Corporate and other included unallocated corporate expenses and the results of our vacation ownership business. Vacation ownership revenues declined by $14 million due to significant decreases in demand for vacation ownership units due to weak economic conditions.
| (in millions, except percentages) | Year Ended December 31, | ||||||||||||||
| 2008 | 2007 | Variance | |||||||||||||
| Corporate and other Revenues |
$ | 105 | $ | 119 | $ | (14 | ) | (11.8 | )% | ||||||
| Corporate and other Adjusted EBITDA |
$ | (99 | ) | $ | (84 | ) | $ | (15 | ) | (17.9 | )% | ||||
Adjusted EBITDA declined by $15 million in 2008 compared to 2007, primarily due to higher corporate costs of $18 million, which includes $8 million of increased compensation and related costs and $6 million in increased legal and accounting fees. These increases were partially offset by a $3 million improvement in vacation ownership Adjusted EBITDA due to aggregate cost reductions.
87
Eliminations. Eliminations increased by $21 million in 2008 compared to 2007, primarily representing fees charged by our management and franchising segments to our owned and leased hotels segment.
Non-GAAP Measure Reconciliation
The following table sets forth Adjusted EBITDA by segment for 2008 and 2007. For a discussion of our definition of Adjusted EBITDA, how we use it, why we present it and material limitations on its usefulness, see “—Key Business Metrics Evaluated by Management.”
| (in millions, except percentages) | Year Ended December 31, | ||||||||||||||
| 2008 | 2007 | Variance | |||||||||||||
| Owned and leased hotels |
$ | 522 | $ | 518 | $ | 4 | 0.8 | % | |||||||
| North American management and franchising |
162 | 164 | (2 | ) | (1.2 | )% | |||||||||
| International management and franchising |
102 | 110 | (8 | ) | (7.3 | )% | |||||||||
| Corporate and other |
(99 | ) | (84 | ) | (15 | ) | (17.9 | )% | |||||||
| Consolidated Adjusted EBITDA |
$ | 687 | $ | 708 | $ | (21 | ) | (3.0 | )% | ||||||
The table below provides a reconciliation of our consolidated Adjusted EBITDA to EBITDA and a reconciliation of EBITDA to net income attributable to Hyatt Hotels Corporation for 2008 and 2007:
| Year Ended December 31, |
||||||||
| 2008 | 2007 | |||||||
| (in millions) | ||||||||
| Adjusted EBITDA |
$ | 687 | $ | 708 | ||||
| Equity earnings from unconsolidated hospitality ventures |
14 | 11 | ||||||
| Gains on sales of real estate |
— | 22 | ||||||
| Asset impairments |
(86 | ) | — | |||||
| Other income, net |
23 | 84 | ||||||
| Charge resulting from the termination of our supplemental executive defined benefit plans |
(20 | ) | — | |||||
| Discontinued operations and changes in accounting principles, net of tax |
56 | 5 | ||||||
| Net income attributable to noncontrolling interests |
(2 | ) | (1 | ) | ||||
| Pro rata share of unconsolidated hospitality ventures Adjusted EBITDA |
(90 | ) | (94 | ) | ||||
| EBITDA |
582 | 735 | ||||||
| Depreciation and amortization |
(249 | ) | (214 | ) | ||||
| Interest expense |
(75 | ) | (43 | ) | ||||
| Provision for income taxes |
(90 | ) | (208 | ) | ||||
| Net income attributable to Hyatt Hotels Corporation |
$ | 168 | $ | 270 | ||||
Inflation
We do not believe that inflation had a material effect on our business in 2009, 2008 or 2007.
Liquidity and Capital Resources
Overview
We finance our business primarily with existing cash, cash generated from our operations and net proceeds from dispositions. When appropriate, we also borrow cash under our revolving credit facility or from other third party sources, and may also raise funds by issuing debt or equity securities as necessary. We maintain a cash
88
investment policy that emphasizes preservation of capital. Starting in 2008, the global credit and economic crisis had a significant impact on the operations of, and the capital available to, the lodging industry. In response, we implemented the following initiatives:
| • | In May 2009, we repurchased and cancelled our senior subordinated notes; |
| • | In May 2009, we sold shares of common stock to the holders of the senior subordinated notes in settlement of their obligations under an equity subscription agreement; |
| • | In May 2009, we raised additional equity capital from our existing stockholders; |
| • | In July 2009, we extended the maturity of our revolving credit facility and increased borrowing capacity to $1.5 billion; |
| • | In August 2009, we issued $500 million aggregate principal amount of senior unsecured notes and repaid $249 million of outstanding secured debt and settled certain related swap agreements; |
| • | In November 2009, in connection with our initial public offering, we sold shares of our Class A common stock for aggregate net proceeds of approximately $127 million pursuant to the underwriters’ exercise of their option to purchase additional shares; and |
| • | We implemented a number of cost saving initiatives and reduced our capital expenditure plans for 2009. |
Accordingly, the economic crisis has not had a material impact on the balance of our cash and cash equivalents or our access to liquidity. We believe that our cash position and cash from operations, together with borrowing capacity under our revolving credit facility, will be adequate to meet all of our funding requirements and capital deployment objectives in the foreseeable future.
Recent Transactions Affecting Our Liquidity and Capital Resources
In May 2009, we repurchased and cancelled $600 million aggregate principal amount of senior subordinated notes from three third-party investors for an aggregate purchase price of $688 million, consisting of a $600 million repayment of principal and $88 million in make-whole interest and early settlement premiums. We also settled obligations of those third-party investors to subscribe for shares of our common stock and received $11 million for the balance due under the subscription agreement. In the settlement, we sold 10.9 million shares of our common stock to the investors for a purchase price of $600 million.
In May 2009, we issued and sold 29.2 million shares of our common stock for an aggregate purchase price of $759 million to our existing investors (including certain third-party investors) and their affiliates, including affiliates of the holders of our senior subordinated notes referred to above and certain of our non-employee directors.
In July 2009, we amended our revolving credit facility to extend its maturity and to increase borrowing capacity to $1.5 billion. As of December 31, 2009, after giving effect to this amendment and extension, we had undrawn capacity of $1.4 billion under our revolving credit facility, which reflects outstanding undrawn letters of credit. For a detailed discussion of the revolving credit facility, see “—Revolving Credit Facility.”
In August 2009, we issued $500 million aggregate principal amount of senior unsecured notes. See “—Senior Notes.” We used a portion of the net proceeds from the sale of the senior notes to repay $249 million of certain outstanding secured debt and settle $13 million of certain related swap agreements.
In November 2009, the Company completed an initial public offering in which the selling stockholders sold 38 million shares of Class A common stock and the Company sold 5.7 million shares of Class A common stock pursuant to the underwriters’ full exercise of their overallotment option. All shares were sold at an initial public
89
offering price of $25.00 per share. The net proceeds to the Company were approximately $127 million, after deducting the underwriters’ discount of $7 million and other offering expenses of $8 million. The Company did not receive any proceeds from the sales of shares by the selling stockholders.
Sources and Uses of Cash
At December 31, 2009, we had cash and cash equivalents of $1.3 billion, compared to cash and cash equivalents of $428 million at December 31, 2008 and $409 million at December 31, 2007.
| Year ended December 31, | ||||||||||||
| (in millions) | 2009 | 2008 | 2007 | |||||||||
| Cash provided by (used in): |
||||||||||||
| Operating activities |
$ | 276 | $ | 287 | $ | 362 | ||||||
| Investing activities |
(427 | ) | (423 | ) | (396 | ) | ||||||
| Financing activities |
1,056 | (20 | ) | (374 | ) | |||||||
| Cash provided by discontinued operations |
— | 143 | 31 | |||||||||
| Effects of changes in exchange rate on cash and cash equivalents |
(6 | ) | 25 | (14 | ) | |||||||
| Net change in cash and cash equivalents |
$ | 899 | $ | 12 | $ | (391 | ) | |||||
Cash Flows from Operating Activities
Cash flows provided by operating activities totaled $276 million in the year ended December 31, 2009, compared to $287 million in the same period last year. Cash flow generation decreased slightly due to the loss from continuing operations, which included the costs related to the repurchase of senior subordinated notes and early settlement of a Subscription Agreement described above, of which $77 million was a use of cash. Offsetting these decreases was a significant reduction in cash paid for taxes due to a substantial payment made in 2008 related to a distribution from indirect investments in certain life science technology companies that was not repeated in 2009, as well as the effect on income tax expense resulting from the shift from a net income position in 2008 to a net loss position in 2009. Additionally, cash used for compensation related expenses reduced significantly in 2009 compared to 2008 primarily due to cost containment measures and a large deferred compensation payment made in 2008.
In 2008, cash flows provided by operating activities totaled $287 million, compared to $362 million in 2007. The decrease was primarily driven by lower operating results and a 2008 cash payment of $42 million in connection with the termination of our supplemental executive defined benefit plans.
Cash Flows from Investing Activities
Cash flows used in investing activities totaled $427 million in the year ended December 31, 2009, compared to $423 million in the same period last year. During 2009, we invested $109 million, net of cash received, related to the acquisition of our Hyatt Regency Boston property, while our investing activities in 2008 included $31 million to acquire the remaining interest in our Andaz Liverpool Street property. In the year ended December 31, 2009, we contributed $132 million to marketable securities, short-term investments and unconsolidated hospitality ventures, compared to $87 million in the same period last year. The increase was due to the investment in an unconsolidated hospitality venture in Texas that owns a convention hotel. Also, our investing activities in 2009 included a reduction of $185 million of distributions of capital from unconsolidated entities. The majority of the decrease relates to the fact that 2008 benefited from the distributions from indirect investments in certain life science technology companies of $184 million. During 2008, we executed a $278 million senior loan to a joint venture that acquired the Hyatt Regency Waikiki property.
In 2008, cash flows used in investing activities totaled $423 million, compared to $396 million in 2007. The increase was driven by a $278 million senior secured loan that we provided to a hospitality venture that acquired the Hyatt Regency Waikiki and the absence of proceeds from sales of real estate in 2008 compared to $98 million
90
of such proceeds in 2007. The increase was partially offset by a $119 million decrease in capital expenditures in 2008, a $93 million increase in distributions from investments in 2008 and a $212 million decrease in funds used for acquisitions in 2008. The increased distributions from investments in 2008 were primarily attributable to distributions from indirect investments in certain life science technology companies in which we have a 5% residual interest.
Cash Flows from Financing Activities
Cash flows provided by financing activities totaled $1.1 billion in the year ended December 31, 2009, compared to $20 million of cash used in financing activities during the year ended December 31, 2008. In 2009, we repurchased $600 million in outstanding senior subordinated notes from investors and paid down the net balance of $30 million outstanding on our revolving credit facility as well as $23 million in capital lease obligations. In connection with the settlement of a subscription agreement in May 2009, we sold 10.9 million shares of common stock to existing investors for a purchase price of $600 million. In addition, we issued additional shares of common stock to investors in exchange for cash of $755 million, net of transaction costs of $4 million. On August 10, 2009, we issued $250 million of senior unsecured notes with a coupon rate of 5.750% due August 15, 2015, at a discount price of 99.460% (the “2015 Notes”), and $250 million of senior notes with a coupon rate of 6.875% due August 15, 2019, at a discount price of 99.864% (the “2019 Notes” and together with the 2015 Notes, the “Senior Notes”). The proceeds were used to repay $249 million of secured debt and settle $13 million of swap agreements. Additionally, we raised $127 million from our issuance of Class A common stock in our initial public offering in November 2009. The combination of these 2009 transactions caused our total debt to total capital ratio to decrease by 11.4%, and net debt to total capital ratio to decrease by 25.1%, as set forth in the following table:
The following is a summary of our debt to capital ratios as of December 31, 2009 and December 31, 2008:
| (in millions, except percentages) | December 31, 2009 |
December 31, 2008 |
||||||
| Consolidated debt (1) |
$ | 852 | $ | 1,247 | ||||
| Stockholders’ equity |
5,016 | 3,564 | ||||||
| Total capital |
5,868 | 4,811 | ||||||
| Total debt to total capital |
14.5 | % | 25.9 | % | ||||
| Consolidated debt (1) |
852 | 1,247 | ||||||
| Less: Cash and cash equivalents |
1,327 | 428 | ||||||
| Net consolidated debt (cash) |
(475 | ) | 819 | |||||
| Net debt to total capital |
(8.1 | )% | 17.0 | % | ||||
| (1) | Excludes approximately $517 million of our share of unconsolidated hospitality venture indebtedness as of December 31, 2009, substantially all of which is non-recourse to us. |
In 2008, cash flows used in financing activities totaled $20 million, compared to $374 million in 2007. The decrease was primarily attributable to the net use of cash in 2007 in connection with the retirement of $325 million of debt and the repurchase of 17.9 million shares of our common stock for $1.1 billion, partially offset by the issuance of 100,000 shares of Series A convertible preferred stock for $500 million and the issuance of unsecured senior subordinated notes for $600 million.
Cash Flows from Discontinued Operations
Cash flows provided by discontinued operations totaled $0 in the year ended December 31, 2009, compared to $143 million during the year ended December 31, 2008. In 2008, we completed the sale of US Franchise Systems, Inc., which owned the Microtel and Hawthorne Suites brands resulting in $131 million of gross proceeds.
91
In 2008, net cash provided by discontinued operations increased $112 million, which was attributable to the aforementioned sale of US Franchise Systems, Inc. resulting in $131 million of gross proceeds.
Capital Expenditures
We routinely make capital expenditures to enhance our business. We divide our capital expenditures into maintenance, enhancements to existing properties and investment in new facilities.
During the year ended December 31, 2009, we made total capital expenditures of $216 million, which included $69 million related to a new property in New York. During 2008, our total capital expenditures were $258 million, which included $28 million related to the aforementioned new property. Our total capital expenditures during 2007 were $377 million. We have been and will continue to be prudent with respect to our capital spending, taking into account our cash flow from operations.
Senior Notes
On August 10, 2009, we issued $500 million aggregate principal amount of senior notes. The table below sets forth the principal, maturity and interest rate of the senior notes. Interest on the senior notes is payable semi-annually.
| Description |
Principal Amount | ||
| 5.750% Senior Notes due 2015 |
$ | 250,000,000 | |
| 6.875% Senior Notes due 2019 |
$ | 250,000,000 | |
In the indenture that governs the senior notes, we agreed not to:
| • | create any liens on our principal properties, or on the capital stock or debt of our subsidiaries that own or lease principal properties, to secure debt without also effectively providing that the senior notes are secured equally and ratably with such debt for so long as such debt is so secured; or |
| • | enter into any sale and leaseback transactions with respect to our principal properties. |
These limitations are subject to significant exceptions.
The indenture also limits our ability to enter into mergers or consolidations or transfer all or substantially all of our assets unless certain conditions are satisfied.
If a change of control triggering event occurs, as defined in the indenture, we will be required to offer to purchase the senior notes at a price equal to 101% of their principal amount, together with accrued and unpaid interest, if any, to the date of purchase. We may also redeem some or all of the senior notes at any time prior to their maturity at a redemption price equal to 100% of the principal amount of the senior notes redeemed together with accrued and unpaid interest, plus a make-whole amount, if any.
We are in compliance with all applicable covenants as of December 31, 2009.
Revolving Credit Facility
In July 2009, we amended our five-year $1.0 billion unsecured revolving credit facility which was originally established in June 2005. The amended facility was completed with Wells Fargo Bank, National Association, as administrative agent and a lender, and various other lenders. Under the terms of the amended facility, $370 million of credit availability matures on June 29, 2010, with the remaining availability maturing on June 29, 2012. The amendment also increased our borrowing capacity under the revolving credit facility to $1.5 billion for all lenders. The revolving credit facility is intended to provide financing for working capital and general
92
corporate purposes, including commercial paper back-up and permitted investments and acquisitions. The overall availability will decrease by $370 million on June 29, 2010 with the maturity of the non-extending lenders. At that time, we have the option to increase our facility by an aggregate amount not to exceed $370 million, subject to certain conditions, including, without limitation, our ability to secure commitments from one or more new lenders to provide such increase. The revolving credit facility also contains (1) a $50 million sublimit for swingline loans, (2) a $300 million sublimit for letters of credit and (3) a $250 million sublimit for multi-currency loans that allows us to borrow (in addition to U.S. dollars) in Euros, JPY and GBP.
The average daily borrowings under the revolving credit facility were $41 million, $20 million and $4 million for the years ended December 31, 2009, December 31, 2008 and December 31, 2007, respectively. As of December 31, 2009, we had no borrowings outstanding under our revolving credit facility which compares to $30 million of borrowings outstanding at December 31, 2008. We do, however, have $79 million and $89 million in outstanding undrawn letters of credit that are issued under our revolving credit facility (and reduce the availability thereunder) as of December 31, 2009 and December 31, 2008, respectively.
All of our borrowings under our revolving credit facility are guaranteed by substantially all of our material domestic subsidiaries, as defined in the revolving credit facility. All guarantees are guarantees of payment and performance and not of collection.
Borrowings under our revolving credit facility that mature on June 29, 2010 bear interest, at our option, at either one-, two-, three- or six-month LIBOR plus a margin ranging from 0.27% to 0.80% per annum or an alternative base rate (defined as the greatest of (a) the federal funds rate plus 0.5%, (b) the prime rate and (c) one-month LIBOR plus 1.0%) plus a margin ranging from 0.00% to 0.25% per annum, in each case depending on our credit rating by Standard & Poor’s Ratings Group, a division of McGraw Hill, Inc. (S&P), and Moody’s Investors Service, Inc. (Moody’s). Borrowings under our revolving credit facility that mature on June 29, 2012 bear interest, at our option, at either one-, two-, three- or six-month LIBOR plus a margin ranging from 1.70% to 3.50% per annum or the alternative base rate referenced above plus a margin ranging from 0.70% to 2.50% per annum, in each case depending on our credit rating by S&P and Moody’s. Borrowings under our swingline subfacility will bear interest at a rate equal to the alternative base rate referenced above plus the applicable margin for alternative base rate loans. We are also required to pay letter of credit fees with respect to each letter of credit equal to the applicable margin for LIBOR on the face amount of each letter of credit. In addition, we must pay a fronting fee to the issuer of the letter of credit of 0.10% per annum on the face amount of the letter of credit.
The revolving credit facility also provides for a facility fee ranging from 0.08% to 0.20% of total availability (depending on our credit rating by S&P and Moody’s) for revolving loans maturing on June 29, 2010 and 0.30% to 1.00% of total availability (depending on our credit rating by S&P and Moody’s) for revolving loans maturing on June 29, 2012. The facility fee is charged regardless of the level of borrowings. In addition, if the calculation of LIBOR falls below 1.00% in the case of LIBOR-based borrowings (including alternative base rate borrowings based on the one-month LIBOR), we must pay a utilization fee to lenders whose loans mature on June 29, 2012 on applicable loans at a rate equal to 1.0% minus LIBOR in the case of LIBOR-based borrowings and 1.0% minus one-month LIBOR in the case of alternative base rate borrowings (where the alternative base rate is based on the one-month LIBOR).
In the event we no longer have a credit rating from either S&P or Moody’s or our rating falls below BBB-/Baa3, (i) with respect to borrowings under our revolving credit facility that mature on June 29, 2010, (a) such borrowings will bear interest at either LIBOR plus 0.80% per annum or the alternative base rate referenced above plus 0.25% per annum and (b) the related facility fee will be 0.20% and (ii) with respect to borrowings under our revolving credit facility that mature on June 29, 2012, (a) such borrowings will bear interest at either LIBOR plus 3.50% per annum or the alternative base rate referenced above plus 2.50% per annum and (b) the related facility fee will be 1.00%.
93
Our revolving credit facility contains a number of affirmative and restrictive covenants including limitations on the ability to place liens on our or our direct or indirect subsidiaries’ assets; to merge, consolidate and dissolve; to sell assets; to engage in transactions with affiliates; to change our or our direct or indirect subsidiaries’ fiscal year or organizational documents; and to make restricted payments.
Our revolving credit facility also requires us to meet the following financial covenants, each measured quarterly:
| • | a maximum leverage ratio based upon the ratio of (1) Consolidated Adjusted Funded Debt (as defined in the revolving credit facility) to (2) Consolidated EBITDA (as defined in the revolving credit facility) not to exceed 4.5 to 1.0; |
| • | an interest coverage ratio based upon the ratio of (1) Consolidated EBITDA (as defined in the revolving credit facility) to (2) Consolidated Interest Expense (as defined in the revolving credit facility) of at least 3.0 to 1.0; and |
| • | a secured funded debt ratio based upon the ratio of (1) the aggregate principal amount of any funded debt secured by a lien that is owed by us or our subsidiaries, excluding certain debt assumed in connection with an acquisition (a) not to exceed $250,000,000 and (b) to the extent in excess of $250,000,000, for a period of one year following such acquisition, to (2) the book value of all of our and our subsidiaries’ property and equipment (net of depreciation and amortization) of less than or equal to 0.3 to 1.0. |
We are in compliance with all applicable covenants as of December 31, 2009.
Letters of Credit
We issue letters of credit either under the revolving credit facility or directly with financial institutions. We had $91 million in letters of credit outstanding at December 31, 2009 and $110 million in letters of credit outstanding at December 31, 2008. We had $79 million in letters of credit issued under the revolving credit facility as of December 31, 2009 and $89 million in letters of credit issued under the revolving credit facility as of December 31, 2008. We had letters of credit issued directly with financial institutions of $12 million and $21 million at December 31, 2009 and at December 31, 2008, respectively.
We had letters of credit outstanding in the amount of $104 million at December 31, 2007. Letters of credit issued under the revolving credit facility totaled $83 million as of December 31, 2007. The letters of credit issued directly with banks totaled $21 million at December 31, 2007.
Other Indebtedness and Future Debt Maturities
We entered into a thirty-year capital lease for the Hyatt Regency Grand Cypress in 2007. Under this lease, we are obligated to make at least $30 million in capital improvements to the property within the first five years of the lease. As of December 31, 2009, the full $30 million had been spent. The aggregate amount outstanding under this lease was $200 million as of December 31, 2009. The aggregate amount of annual payments under the lease totals $14 million, and we have options to buy out the property in the eighth year of the lease for $200 million, in the tenth year of the lease for $220 million and in the fifteenth year of the lease for $255 million.
After excluding the $200 million lease obligation described above and $497 million of senior unsecured notes, all other third-party indebtedness as of December 31, 2009 totaled $155 million, consisting primarily of property-specific secured indebtedness on the following three properties:
| • | Hyatt Regency San Antonio ($57 million), which allows for early payment in 2011; |
| • | Hyatt Regency Princeton ($45 million), which matures in 2011; and |
| • | Hyatt Regency Aruba ($33 million), which allows for early payment in 2011. |
94
The interest rates on these mortgages are fixed, ranging from 6.00% to 10.07%.
At December 31, 2009, $12 million of our outstanding debt will mature in the following twelve months. We believe that we will have adequate liquidity to meet requirements for scheduled maturities. However, we cannot assure you that we will be able to refinance our indebtedness as it becomes due and, if refinanced, whether such refinancing will be available on favorable terms.
Contractual Obligations
The following table summarizes our contractual obligations as of December 31, 2009:
| (dollars in millions) | Payments Due by Period | ||||||||||||||||||||
| Total | 2010 | 2011 | 2012 | 2013 | 2014 | Thereafter | |||||||||||||||
| Debt (1) |
$ | 904 | $ | 51 | $ | 168 | $ | 32 | $ | 32 | $ | 32 | $ | 589 | |||||||
| Capital lease obligations (1) |
279 | 17 | 17 | 16 | 16 | 197 | 16 | ||||||||||||||
| Operating lease obligations |
400 | 33 | 29 | 26 | 25 | 24 | 263 | ||||||||||||||
| Purchase obligations |
32 | 32 | — | — | — | — | — | ||||||||||||||
| Other long-term liabilities (2) |
323 | 40 | 15 | 10 | 25 | 6 | 227 | ||||||||||||||
| Total contractual obligations |
$ | 1,938 | $ | 173 | $ | 229 | $ | 84 | $ | 98 | $ | 259 | $ | 1,095 | |||||||
| (1) | Includes principal as well as interest payments |
| (2) | Primarily consists of deferred compensation plan liabilities and obligations to fund contract acquisition costs, loans to hotel owners or other investments. Excludes $128 million in long-term tax positions due to the uncertainty related to the timing of the reversal of those positions. |
The total amount of debt and capital lease obligations as of December 31, 2009 are $904 million and $279 million, respectively, and the respective payments due by period are as follows:
| (dollars in millions) | Capital Lease Obligation | |||||||||||||||||
| Debt | Effective Principal |
Effective Interest |
Total | |||||||||||||||
| Principal | Interest | Total | ||||||||||||||||
| 2010 |
$ | 8 | $ | 43 | $ | 51 | $ | 4 | $ | 13 | $ | 17 | ||||||
| 2011 |
128 | 40 | 168 | 4 | 13 | 17 | ||||||||||||
| 2012 |
— | 32 | 32 | 3 | 13 | 16 | ||||||||||||
| 2013 |
— | 32 | 32 | 3 | 13 | 16 | ||||||||||||
| 2014 |
— | 32 | 32 | 191 | 6 | 197 | ||||||||||||
| Thereafter |
501 | 88 | 589 | 10 | 6 | 16 | ||||||||||||
| Total |
$ | 637 | $ | 267 | $ | 904 | $ | 215 | $ | 64 | $ | 279 | ||||||
Off-Balance Sheet Arrangements
Our off-balance sheet arrangements at December 31, 2009 included purchase obligations of $32 million, letters of credit of $91 million and surety bonds of $23 million. These amounts are more fully discussed in “—Sources and Uses of Cash—Revolving Credit Facility and—Letters of Credit”, “—Contractual Obligations” and Note 16 to our Consolidated Financial Statements.
Critical Accounting Policies and Estimates
Preparing financial statements in conformity with GAAP requires management to make estimates and assumptions that affect the reported amounts of assets and liabilities as of the date of the financial statements, the reported amounts of revenues and expenses during the reporting periods and the related disclosures in our consolidated financial statements and accompanying notes.
95
We believe that of our significant accounting policies, which are described in Note 2 to the Consolidated Financial Statements included in this annual report, the following accounting policies are critical due to the fact that they involve a higher degree of judgment and estimates about the effect of matters that are inherently uncertain. As a result, these accounting policies could materially affect our financial position and results of operations. While we have used our best estimates based on the facts and circumstances available to us at the time, different estimates reasonably could have been used in the current period. In addition, changes in the accounting estimates that we use are reasonably likely to occur from period to period, which may have a material impact on the presentation of our financial condition and results of operations. Although we believe that our estimates, assumptions and judgments are reasonable, they are based upon information presently available. Actual results may differ significantly from these estimates under different assumptions, judgments or conditions. Management has discussed the development and selection of these critical accounting policies and estimates with the audit committee of the board of directors.
Goodwill
We review the carrying value of all our goodwill by comparing the carrying value of our reporting units to their fair values in a two-step process. We define a reporting unit at the individual property or business level. We are required to perform this comparison at least annually or more frequently if circumstances indicate possible impairment. When determining fair value in step one, we utilize internally developed discounted future cash flow models, third-party appraisals and, if appropriate, current estimated net sales proceeds from pending offers. Under the discounted cash flow approach we utilize various assumptions, including projections of revenues based on assumed long-term growth rates, estimated costs and appropriate discount rates based on the weighted-average cost of capital. The principal factors used in the discounted cash flow analysis requiring judgment are the projected future operating cash flows, the weighted-average cost of capital and the terminal value growth rate assumptions. The weighted-average cost of capital takes into account the relative weights of each component of our consolidated capital structure (equity and long-term debt). Our estimates of long-term growth and costs are based on historical data, various internal estimates and a variety of external sources and are developed as part of our routine, long-term planning process. We then compare the estimated fair value to our carrying value. If the carrying value is in excess of the fair value, we must perform step two in order to determine our implied fair value of goodwill to measure if any impairment charge is necessary. The determination of our implied fair value requires the allocation of the reporting unit’s estimated fair value to the individual assets and liabilities of the reporting unit as if we had completed a business combination. We perform the allocation based on our knowledge of the reporting unit, the market in which they operate, and our overall knowledge of the hospitality industry. Changes in our allocation approach could result in different measures of implied fair value and impact the final impairment charge, if any.
Changes in economic and operating conditions impacting these assumptions could result in goodwill impairments in future periods. We had $113 million and $120 million of goodwill as of December 31, 2009, and 2008, respectively. An adverse change to our fair value estimates could result in an impairment charge, which could be material to our earnings. The Company has eight reporting units on which we have a goodwill balance as of December 31, 2009. A 10% change in our estimates of projected future operating cash flows, discount rates, or terminal value growth rates used in our calculations of the fair values of the reporting units would result in up to a $2 million impairment charge against the $9 million goodwill balance of one of our reporting units as of December 31, 2009. The Company will continue to monitor the impact of the current economic environment on the goodwill of our reporting units to ensure no further declines in value would result in impairment charges.
Goodwill is also reviewed for impairment upon the occurrence of a triggering event. If a triggering event is determined to occur, we then apply the two-step method described above. Determining whether or not a triggering event has occurred requires us to apply judgment. The final determination of the occurrence of a triggering event is based on our knowledge of the hospitality industry, historical experience, location of the property, market conditions and property-specific information available at the time of the assessment. We realize, however, that the results of our analysis could vary from period to period depending on how our judgment is applied and the facts and circumstances available at the time of the analysis.
96
Long-Lived Assets and Definite-Lived Intangibles
We evaluate the carrying value of our long-lived assets and definite-lived intangibles for impairment by comparing the expected undiscounted future cash flows of the assets to the net book value of the assets when certain triggering events occur. If the expected undiscounted future cash flows are less than the net book value of the assets, the excess of the net book value over the estimated fair value is charged to earnings. When determining fair value, we use internally developed discounted future cash flow models, third-party appraisals and, if appropriate, current estimated net sales proceeds from pending offers. Under the discounted cash flow approach we utilize various assumptions, including projections of revenues based on assumed long-term growth rates, estimated costs, terminal value growth rate and appropriate discount rates based on the weighted-average cost of capital.
As part of the process detailed above we use judgment to:
| • | determine whether or not a triggering event has occurred. The final determination of the occurrence of a triggering event is based on our knowledge of the hospitality industry, historical experience, location of the property, market conditions and property-specific information available at the time of the assessment. We realize, however, that the results of our analysis could vary from period to period depending on how our judgment is applied and the facts and circumstances available at the time of the analysis; |
| • | determine the projected undiscounted future operating cash flows when necessary. The principal factor used in the undiscounted cash flow analysis requiring judgment is our estimates regarding long-term growth and costs which are based on historical data, various internal estimates and a variety of external sources and are developed as part of our routine, long-term planning process; and |
| • | determine the estimated fair value of the respective long-lived asset when necessary. In determining the fair value of a long lived asset, we typically use internally developed discounted cash flow models. The principal factors used in the discounted cash flow analysis requiring judgment are the projected future operating cash flows, the weighted-average cost of capital and the terminal value growth rate assumptions. The weighted-average cost of capital takes into account the relative weights of each component of our capital structure (equity and long-term debt). Our estimates of long-term growth and costs are based on historical data, various internal estimates and a variety of external sources and are developed as part of our routine, long-range planning process. |
Changes in economic and operating conditions impacting these judgments could result in impairments to our long-lived assets in future periods, which could be material to our earnings. We had $3.9 billion and $3.8 billion of long-lived assets and definite-lived intangibles as of December 31, 2009 and 2008, respectively.
Unconsolidated Hospitality Ventures
We record a loss in the value of an unconsolidated hospitality venture that is determined to be an “other than temporary” decline in our consolidated statements of income as an impairment loss. We evaluate the carrying value of our unconsolidated hospitality ventures for impairment by comparing the estimated fair value of the venture to the book value when certain triggering events occur. If the fair value is less than the book value of the unconsolidated hospitality venture, we use our judgment to determine if the decline in value is temporary or other than temporary. The factors we consider when making this determination include, but are not limited to:
| • | length of time and extent of the decline; |
| • | loss of value as a percentage of the cost of the unconsolidated hospitality venture; |
| • | financial condition and near-term financial projections of the unconsolidated hospitality venture; |
| • | our intent and ability to retain the unconsolidated hospitality venture to allow for the recoverability of the lost value; and |
| • | current economic conditions. |
97
When determining fair value, we use internally developed discounted cash flow models, third-party appraisals and, if appropriate, current estimated net sales proceeds from pending offers. Under the discounted cash flow approach we use various assumptions, including projections of revenues based on assumed long-term growth rates, estimated costs and appropriate discount rates based on the weighted-average cost of capital.
As part of the process detailed above we use judgment to determine:
| • | whether or not a triggering event has occurred. The final determination of the occurrence of a triggering event is based on our knowledge of the hospitality industry, historical experience, location of the underlying venture property, market conditions and venture-specific information available at the time of the assessment. We realize, however, that the results of our analysis could vary from period to period depending on how our judgment is applied and the facts and circumstances available at the time of the analysis; |
| • | the estimated fair value of the unconsolidated hospitality venture when necessary. In determining the fair value of an unconsolidated hospitality venture we typically utilize internally developed discounted cash flow models. The principal factors used in the discounted cash flow analysis requiring judgment are the projected future cash flows of the venture, the weighted-average cost of capital and the terminal value growth rate assumptions. The weighted-average cost of capital takes into account the relative weights of each component of the unconsolidated hospitality venture’s capital structure (equity and long-term debt). Our estimates of long-term growth and costs are based on the unconsolidated hospitality venture’s historical data, various internal estimates and a variety of external sources and are developed as part of our routine, long-range planning process; and |
| • | whether a decline in value is deemed to be other than temporary. The final determination is based on our review of the consideration factors mentioned above, as well as our knowledge of the hospitality industry, historical experience, location of the underlying venture property, market conditions and venture-specific information available at the time of the assessment. We realize, however, that the results of our analysis could vary from period to period depending on how our judgment is applied and the facts and circumstances available at the time of the analysis. |
Changes in economic and operating conditions impacting these judgments could result in impairments to our unconsolidated hospitality ventures in future periods. We had investments of $213 million and $191 million of unconsolidated hospitality ventures accounted for under the equity method as of December 31, 2009 and 2008, respectively.
Income Taxes
The objectives of accounting for income taxes are to recognize the amount of taxes payable or refundable for the current year and deferred tax liabilities and assets for the future tax consequences of events that have been recognized in our financial statements or tax returns. Judgment is required in addressing the future tax consequences of events that have been recognized in our consolidated financial statements or tax returns (e.g., realization of deferred tax assets, changes in tax laws or interpretations thereof). In addition, we are subject to examination of our income tax returns by the Internal Revenue Service and other tax authorities. A change in the assessment of the outcomes of such matters could materially impact our consolidated financial statements. See “Risk Factors—Risks Related to Our Business—We may be liable for proposed tax liabilities and the final amount of taxes paid may exceed the amount of applicable reserves, which could reduce our profits.”
We adopted the FASB’s guidance on uncertain tax positions on January 1, 2007. The guidance prescribes a financial statement recognition threshold and measurement attribute for tax positions taken or expected to be taken in a tax return. Specifically, it clarifies that an entity’s tax benefits must be “more likely than not” of being sustained assuming that its tax reporting positions will be examined by taxing authorities with full knowledge of all relevant information prior to recording the related tax benefit in the financial statements. If the position drops
98
below the “more likely than not” standard, the benefit can no longer be recognized. Assumptions, judgment and the use of estimates are required in determining if the “more likely than not” standard has been met when developing the provision for income taxes. A change in the assessment of the “more likely than not” standard could materially impact our consolidated financial statements.
Stock Compensation
Overview
In February 2006, we adopted our LTIP as a means of attracting, retaining and incentivizing qualified executives, key employees and nonemployee directors to increase our value and continue our efforts to build and sustain growth. As of December 31, 2009, we have authorized 9,375,000 shares of Class A common stock to be issued under the LTIP.
We are required to determine the fair value of the underlying common stock in order to determine the fair value of our stock appreciation rights (SARs) and restricted stock units (RSUs) granted under the LTIP. Prior to November 5, 2009, the date our Class A common stock commenced trading on the New York Stock Exchange, the stock value was determined by the compensation committee of our board of directors according to the LTIP based on either an independent valuation or using the price paid for a share of common stock between a willing buyer and willing seller, excluding transactions between us and Pritzker family business interests. The compensation committee determined our per share price to be as follows for each of our award grants since January 1, 2008:
| Grant Date |
Common Stock Fair Value |
|||
| May 2, 2008 |
$ | 58.18 | (1) | |
| September 11, 2008 |
58.18 | (2) | ||
| May 11, 2009 |
26.00 | (3) | ||
| October 1, 2009 |
29.10 | (4) | ||
| December 14, 2009 |
29.51 | |||
| December 28, 2009 |
30.09 | |||
| (1) | In accordance with the LTIP, we determined the fair value of our common stock as of December 31, 2007 based on an independent valuation performed contemporaneously with the grant date. The valuation was reviewed and approved by the compensation committee. |
| (2) | In September 2008, approximately four months following the May grant, we made a single grant in connection with the hiring of a new executive. We continued to use the $58.18 per share value for our September 2008 grant of RSUs, as the total shares granted were immaterial and we did not have an updated valuation or an external transaction on which to base an updated share value, as stipulated by our LTIP. |
| (3) | In May 2009, we sold additional shares of our common stock to existing stockholders, including third-party stockholders, at $26.00 per share. The price paid per share was between a willing buyer and seller. As a result, and in accordance with the LTIP, the compensation committee used the $26.00 per share value as the basis for our May 11, 2009 grant. The difference between the $26.00 per share value at May 11, 2009 and the $58.18 per share value at September 11, 2008 was caused by a combination of factors, but was primarily driven by the decline in our operating performance resulting from the ongoing economic recession and the other financial and economic disruptions that occurred over the past twelve months, which adversely affected demand and equity valuations in the hospitality industry. |
| (4) | In accordance with the LTIP, we determined the fair value of our common stock based on an independent valuation performed contemporaneously with the grant date. The valuation was prepared in July 2009 as of June 30, 2009 and was reviewed and approved by the compensation committee. |
99
The following table summarizes by grant date the awards granted since January 1, 2008 under our LTIP, as well as the fair value at the date of grant.
| Grant Date |
Award Type |
Number Granted |
Fair Value | ||||
| May 2008 |
SARs | 284,637 | $ | 26.00 | |||
| May 2008 |
RSUs | 206,007 | 58.18 | ||||
| September 2008 |
RSUs | 20,335 | 58.18 | ||||
| May 2009 |
SARs | 492,210 | 14.40 | ||||
| May 2009 |
RSUs | 276,722 | 26.00 | ||||
| October 2009 |
SARs | 61,121 | 13.60 | ||||
| October 2009 |
RSUs | 28,565 | 29.10 | ||||
| December 2009 |
RSUs | 7,500 | 30.09 | ||||
The awards are determined to be classified as equity awards with the fair value being determined on the grant date. We recognize stock-based compensation expense over the requisite service period of the individual grantee, which generally equals the vesting period. We currently have only issued service condition awards, and have therefore elected to use the straight-line method of expense attribution. We recognize, however, that if we begin to issue performance-based awards, the graded vesting method will be required. This will result in an increase to stock-based compensation expense in the earlier years of the requisite service period and a decrease in the later years.
The process of estimating the fair value of stock-based compensation awards and recognizing the associated expense over the requisite service period involves significant management estimates and assumptions.
We use an estimated forfeiture rate of 0% because only a small group of executives has historically received these awards and we have limited historical data on which to base these estimates. We monitor the forfeiture activity to ensure that the current estimate continues to be appropriate. Any changes to this estimate will impact the amount of compensation expense we recognize with respect to any future grants.
We determine the fair value of our stock-settled SARs using the Black-Scholes-Merton (BSM) option-pricing model. Under the BSM option-pricing model, management is required to make certain assumptions, including assumptions relating to the following:
Expected volatility. Because there is limited trading history for our common stock, we do not have sufficient information available on which to base a reasonable and supportable estimate of the expected volatility of our share price. Consequently, prior to November 5, 2009 (the date our Class A common stock commenced trading on the New York Stock Exchange) the expected price volatility for our Class A common stock was estimated using the average implied volatility of exchange-traded options of our major publicly traded competitors. We evaluated the five-day trailing average implied volatility of exchange-traded options with a minimum term of two years. Using the five-day average, we applied linear interpolation to determine the implied volatility for an option with a strike price equal to the underlying stock’s current trading level. As of the fourth quarter of 2009, the Company changed its methodology for calculating expected volatility. For the October 2009 grant and forward, we are using an average historical volatility of our peer group over a time period consistent with our expected term assumption. Our peer group was determined based upon companies in our industry with similar business models and is consistent with those used to benchmark our executive compensation.
Expected term. The expected term assumption is estimated using the midpoint between the vesting period and the contractual life of each SAR, in accordance with the SEC’s Staff Accounting Bulletin Topic 14, Share-Based Payment.
Risk-free interest rate. The risk free interest rate is based on the yields of U.S. Treasury instruments with similar expected lives.
100
Dividend yield. We have never declared or paid any cash dividends and do not plan to pay cash dividends in the foreseeable future. Consequently, we use an expected dividend yield of zero.
Generally, the expected volatility and expected term assumptions are the main drivers of value under the BSM option-pricing model. Consequently, changes in these assumptions can have a significant impact on the resulting fair value. A 10% change in the expected volatility or the expected term assumption would result in an immaterial change to our overall compensation expense.
The fair value of our SARs granted since January 2008 was estimated using the BSM option pricing model with the following assumptions:
| October 1, 2009 Grant |
May 11, 2009 Grant |
May 2, 2008 Grant |
|||||||
| Expected Volatility |
44.75 | % | 56.50 | % | 40.00 | % | |||
| Expected Life in Years |
6.167 | 6.196 | 6.208 | ||||||
| Risk-free Interest Rate |
2.562 | % | 2.417 | % | 3.36 | % | |||
| Annual Dividend Yield |
0 | % | 0 | % | 0 | % |
If, in the future, we determine that another method is more reasonable, or, if another method for calculating these input assumptions is prescribed by authoritative guidance, and, therefore, should be used to estimate expected volatility or expected term, the fair value calculated for our stock-based compensation could change significantly. Higher volatility and longer expected term assumptions result in an increase to stock-based compensation expense determined at the date of grant. Stock-based compensation expense affects our selling, general and administrative expense.
We intend to expand the future pool of recipients of stock-based compensation in future periods. Accordingly, we will incur non-cash compensation expense related to the vesting of these future awards.
Our total unearned compensation under our LTIP program was $16 million and $17 million as of December 31, 2009 and 2008, respectively for SARs and $14 million and $13 million as of December 31, 2009 and 2008, respectively for RSUs. We will record these amounts to compensation expense over the next eleven years.
Recent Accounting Pronouncements
In May 2009, the FASB issued guidance addressing the accounting for and disclosure requirements of events or transactions that occur after the balance sheet date, but before the financial statements are issued. The Company adopted the guidance as of June 30, 2009, as it was effective for interim and annual periods ending after June 15, 2009. In February 2010, however, the FASB issued Accounting Standards Update No. 2010-09 (“ASU 2010-09), Subsequent Events (Topic 855): Amendments to Certain Recognition and Disclosure Requirements. The amendments (a) require an SEC filer to evaluate subsequent events through the date the financial statements are issued with the SEC, (b) add the definitions of an SEC filer and revised financial statements, (c) no longer require that an SEC filer disclose the date through which subsequent events have been reviewed, and (d) remove the definition of a public entity. We adopted the amendments upon issuance with no material impact to our consolidated financial statements.
In June 2009, the FASB amended the consolidation rules related to variable interest entities (VIEs). The new rules expand the primary beneficiary analysis to incorporate a qualitative review of which entity controls and directs the activities of the VIE. The amendments also modify the rules regarding the frequency of ongoing reassessments of whether a company is the primary beneficiary. Under the revised guidance, companies are required to perform ongoing reassessments as opposed to only when certain triggering events occur, as was previously required. The amendments are effective for the first annual reporting period that begins after November 15, 2009 and for interim periods therein. We have evaluated our existing ownership structures and related agreements under the new guidance and have concluded that no material changes will be required to our consolidated financial statements.
101
In January 2010, the FASB released Accounting Standards Update No. 2010-06 (“ASU 2010-06”), Fair Value Measurements and Disclosures (Topic 820): Improving Disclosures about Fair Value Measurement. The update requires the Company to (a) disclose transfers in and out of Levels One and Two, in addition to transfers in and out of Level Three and (b) separately disclose purchases, sales, issuances, and settlements of our Level Three securities. Additionally, ASU 2010-06 clarifies the information the Company currently discloses regarding our valuation techniques, inputs used in those valuation models, and at what level of detail fair value disclosures should be provided. ASU 2010-06 is effective for interim and annual reporting periods beginning after December 15, 2009, except for the disaggregation of the Level Three activity, which is effective for interim and annual periods beginning after December 15, 2010. ASU 2010-06 is not expected to materially impact the Company’s current fair value disclosures.
| Item 7A. | Quantitative and Qualitative Disclosures About Market Risk. |
We are exposed to market risk primarily from changes in interest rates and foreign currency exchange rates. In certain situations, we seek to reduce earnings and cash flow volatility associated with changes in interest rates and foreign currency exchange rates by entering into financial arrangements to provide a hedge against a portion of the risks associated with such volatility. We continue to have exposure to such risks to the extent they are not hedged. We enter into derivative financial arrangements to the extent they meet the objectives described above, and we do not use derivatives for trading or speculative purposes. At December 31, 2009, we were a party to hedging transactions including the use of derivative financial instruments, as discussed below.
Interest Rate Risk
In the normal course of business, we are exposed to the impact of interest rate changes due to our borrowing activities. Our objective is to manage the risk of interest rate changes on the results of operations, cash flows, and the market value of our debt by creating an appropriate balance between our fixed and floating-rate debt. Interest rate derivative transactions, including interest rate swaps, are entered into to maintain a level of exposure to interest rates which the Company deems acceptable.
The majority of our debt has a fixed rate requirement. On August 10, 2009, we issued the 2015 Notes in the amount of $250 million. Interest on these notes is payable semi-annually on February 15 and August 15, and commences February 15, 2010. We may redeem all or a portion of the 2015 Notes at any time at our option at a discount rate of Treasury plus 50 basis points. In December 2009, we entered into three $25 million interest rate swap contracts, each of which expires on August 15, 2015 and effectively converts a total of $75 million of the 2015 Notes to floating rate debt based on three-month LIBOR plus a fixed rate component. The fixed rate component of each swap varies by contract, with a range from 2.68% to 2.9675%. The fixed to floating interest rate swaps were designated as a fair value hedge as their objective is to protect the senior unsecured notes against changes in fair value due to changes in the three-month LIBOR interest rate. The swaps were designated as hedges at inception and at December 31, 2009 were highly effective in offsetting fluctuations in the fair value of the 2015 Notes. At December 31, 2009, the fixed to floating interest rate swaps were recorded within other long-term liabilities for $1 million, offset by a fair value adjustment to long-term debt of $1 million.
With the addition of the $75 million of interest rate swaps, our fixed percentage of total debt is roughly 91%. This percentage relates purely to our gross debt balance and does not include the effect of our floating rate cash investments. We will continue to evaluate our fixed debt as a percentage of total debt and it is likely that this percentage will decrease in the future. The fair value of the $75 million of interest rate swap contracts was ($1) million at December 31, 2009. However these hedges were deemed to be highly effective in offsetting fluctuations in the fair value of the 2015 Notes and as such, the impact to our consolidated statements of income (loss) was immaterial. A hypothetical 10 percent increase or decrease in average market interest rates would decrease or increase the fair value of our interest rate swap contracts by $1 million and $1 million, respectively.
102
Foreign Currency Exposures and Exchange Rate Instruments
We conduct business in various foreign currencies and use foreign currency forward contracts to offset our exposure associated with the fluctuations of certain foreign currencies. These foreign currency exposures typically arise from intercompany loans and other intercompany transactions. The net U.S. dollar equivalent of the notional amount of the forward contracts as of December 31, 2009 was $306 million, all of which expire within the next twelve months. We intend to offset the gains and losses related to our intercompany loans and transactions with gains or losses on our foreign currency forward contracts such that there is a negligible effect to net income (loss) attributable to Hyatt Hotels Corporation. We expect to continue this practice relating to our intercompany loans and transactions, and may also begin to manage the risks associated with other transactional and translational foreign currency volatility within our business.
| Item 8. | Financial Statements and Supplementary Data. |
The consolidated financial statements and supplementary data required by Item 8 are contained in Item 15 of this annual report and are incorporated herein by reference.
| Item 9. | Changes in and Disagreements with Accountants on Accounting and Financial Disclosure. |
None.
| Item 9A(T). | Controls and Procedures. |
Disclosure Controls and Procedures
The Company maintains a set of disclosure controls and procedures designed to ensure that information required to be disclosed by the Company in reports that it files or submits under the Exchange Act, is recorded, processed, summarized and reported within the time periods specified in SEC rules and forms. In accordance with Rule 13a-15(b) of the Exchange Act, as of the end of the period covered by this annual report, an evaluation was carried out under the supervision and with the participation of the Company’s management, including its Chief Executive Officer and Chief Financial Officer, of the effectiveness of its disclosure controls and procedures. Based on that evaluation, the Company’s Chief Executive Officer and Chief Financial Officer concluded that the Company’s disclosure controls and procedures, as of the end of the period covered by this annual report, were effective to provide reasonable assurance that information required to be disclosed by the Company in reports that it files or submits under the Exchange Act is recorded, processed, summarized and reported within the time periods specified in SEC rules and forms and is accumulated and communicated to the Company’s management, including the Chief Executive Officer and Chief Financial Officer, as appropriate to allow timely decisions regarding required disclosure.
Management’s Annual Report on Internal Control over Financial Reporting
This annual report does not include a report of management’s assessment regarding internal control over financial reporting or an attestation report of our registered public accounting firm due to a transition period established by the rules of the SEC for newly public companies.
Changes in Internal Control
There has been no change in the Company’s internal control over financial reporting during the Company’s most recent fiscal quarter that has materially affected, or is reasonably likely to materially affect, the Company’s internal control over financial reporting.
| Item 9B. | Other Information. |
None.
103
| Item 10. | Directors, Executive Officers and Corporate Governance. |
The information required by this Item 10 is incorporated by reference to the information set forth in the Company’s definitive proxy statement, to be filed with the SEC within 120 days after the end of the Company’s fiscal year ended December 31, 2009 pursuant to Regulation 14A under the Exchange Act in connection with our 2010 annual meeting of stockholders. Information required by this Item 10 appears under the captions: “CORPORATE GOVERNANCE – OUR BOARD OF DIRECTORS,” “CORPORATE GOVERNANCE,” “CORPORATE GOVERNANCE – COMMITTEES OF THE BOARD OF DIRECTORS – Nominating and Corporate Governance Committee,” “STOCK – SECTION 16(a) BENEFICIAL OWNERSHIP REPORTING COMPLIANCE” and “CORPORATE GOVERNANCE – COMMITTEES OF THE BOARD OF DIRECTORS – Audit Committee” in the definitive proxy statement. See Part I, “Executive Officers of the Registrant” of this annual report for information regarding executive officers of the Company.
Code of Business Conduct and Ethics
The Company has adopted the Hyatt Hotels Corporation Code of Business Conduct and Ethics (the “Code of Ethics”), which is applicable to all of the Hyatt directors, officers and associates, including the Company’s President and Chief Executive Officer, Chief Financial Officer, Principal Accounting Officer or Controller and other senior financial officers performing similar functions. The Code of Ethics is posted on the Company’s website at http://www.hyatt.com. The Company will furnish a copy of the Code of Ethics to any person, without charge, upon written request directed to: Senior Vice President – Investor Relations, Hyatt Hotels Corporation, 71 South Wacker Drive, Chicago, Illinois 60606. In the event that the Company amends or waives any of the provisions of the Code of Ethics that applies to the Company’s Chief Executive Officer, Chief Financial Officer, Principal Accounting Officer or Controller and other senior financial officers performing similar functions, the Company intends to disclose the subsequent information on its website.
| Item 11. | Executive Compensation. |
The information required by this Item 11 is incorporated by reference to the information set forth in the Company’s definitive proxy statement, to be filed with the SEC within 120 days after the end of the Company’s fiscal year ended December 31, 2009 pursuant to Regulation 14A under the Exchange Act in connection with our 2010 annual meeting of stockholders.
Information related to this Item 11 appears under the captions: “EXECUTIVE COMPENSATION,” “CORPORATE GOVERNANCE – COMPENSATION COMMITTEE INTERLOCKS AND INSIDER PARTICIPATION,” “CORPORATE GOVERNANCE – COMPENSATION OF DIRECTORS,” and “CORPORATE GOVERNANCE – COMPENSATION COMMITTEE REPORT” in the definitive proxy statement.
| Item 12. | Security Ownership of Certain Beneficial Owners and Management and Related Stockholder Matters. |
The information required by this Item 12 is incorporated by reference to the information set forth in the Company’s definitive proxy statement, to be filed with the SEC within 120 days after the end of the Company’s fiscal year ended December 31, 2009 pursuant to Regulation 14A under the Exchange Act in connection with our 2010 Annual Meeting of Stockholders.
Information related to this Item 12 appears under the captions: “STOCK – SECURITY OWNERSHIP OF CERTAIN BENEFICIAL OWNERS AND MANAGEMENT” and “EMPLOYEE STOCK PURCHASE PLAN – SECURITIES AUTHORIZED FOR ISSUANCE UNDER EQUITY COMPENSATION PLANS” in the definitive proxy statement.
104
| Item 13. | Certain Relationships and Related Transactions, and Director Independence. |
The information required by this Item 13 is incorporated by reference to the information set forth in the Company’s definitive proxy statement, to be filed with SEC within 120 days after the end of the Company’s fiscal year ended December 31, 2009 pursuant to Regulation 14A under the Exchange Act in connection with our 2010 Annual Meeting of Stockholders.
Information related to this Item 13 appears under the captions: “CERTAIN RELATIONSHIPS AND RELATED PARTY TRANSACTIONS” and “CORPORATE GOVERNANCE – DIRECTOR INDEPENDENCE” in the definitive proxy statement.
| Item 14. | Principal Accountant Fees and Services. |
The information required by this Item 14 is incorporated by reference to the information set forth in the Company’s definitive proxy statement, to be filed with the SEC within 120 days after the end of the Company’s fiscal year ended December 31, 2009 pursuant to Regulation 14A under the Exchange Act in connection with our 2010 Annual Meeting of Stockholders.
Information related to this Item 14 appears under the caption “INDEPENDENT REGISTERED PUBLIC ACCOUNTING FIRM” in the definitive proxy statement.
105
| Item 15. | Exhibits and Financial Statement Schedules. |
The following documents are filed as part of this annual report.
| (a) | Financial Statements: |
The following consolidated financial statements are included in this annual report on the pages indicated:
| (b) | Financial Statement Schedule: |
The following financial statement schedule is included in this annual report on the page indicated:
| Schedule II – Valuation and Qualifying Accounts for the Years Ended December 31, 2009, 2008 and 2007 |
SCHII-1 |
| (c) | Exhibits |
The Exhibit Index follows Schedule II – Valuation and Qualifying Accounts for the Years Ended December 31, 2009, 2008 and 2007 and is incorporated herein by reference.
106
Pursuant to the requirements of Section 13 or 15(d) of the Securities Exchange Act of 1934, the registrant has duly caused this annual report to be signed on its behalf by the undersigned, thereunto duly authorized.
| HYATT HOTELS CORPORATION | ||
| By: |
/s/ Mark S. Hoplamazian | |
| Mark S. Hoplamazian | ||
| President and Chief Executive Officer | ||
Date: February 25, 2010
Pursuant to the requirements of the Securities Exchange Act of 1934, this annual report has been signed below by the following persons, on behalf of the registrant in the capacities indicated.
| Signatures |
Titles |
Date | ||
| /s/ Mark S. Hoplamazian Mark S. Hoplamazian |
President, Chief Executive Officer and Director (Principal Executive Officer) | February 25, 2010 | ||
| /s/ Harmit J. Singh Harmit J. Singh |
Chief Financial Officer (Principal Accounting and Financial Officer) | February 25, 2010 | ||
| /s/ Thomas J. Pritzker Thomas J. Pritzker |
Executive Chairman of the Board of Directors | February 25, 2010 | ||
| /s/ Bernard W. Aronson Bernard W. Aronson |
Director | February 25, 2010 | ||
| /s/ Richard A. Friedman Richard A. Friedman |
Director | February 25, 2010 | ||
| /s/ Susan D. Kronick Susan D. Kronick |
Director | February 25, 2010 | ||
| /s/ Mackey J. McDonald Mackey J. McDonald |
Director | February 25, 2010 | ||
| /s/ John D. Nichols John D. Nichols |
Director | February 25, 2010 | ||
| /s/ Gregory B. Penner Gregory B. Penner |
Director | February 25, 2010 | ||
| /s/ Penny Pritzker Penny Pritzker |
Director | February 25, 2010 | ||
| /s/ Michael A. Rocca Michael A. Rocca |
Director | February 25, 2010 | ||
| /s/ Byron D. Trott Byron D. Trott |
Director | February 25, 2010 | ||
| /s/ Richard C. Tuttle Richard C. Tuttle |
Director | February 25, 2010 | ||
107
REPORT OF INDEPENDENT REGISTERED PUBLIC ACCOUNTING FIRM
To the Board of Directors and Stockholders of
Hyatt Hotels Corporation:
We have audited the accompanying consolidated balance sheets of Hyatt Hotels Corporation and subsidiaries (the “Company”) as of December 31, 2009 and 2008, and the related consolidated statements of income (loss), changes in stockholders’ equity, and cash flows for each of the three years in the period ended December 31, 2009. Our audits also included the financial statement schedule listed in the Index at Item 15. These consolidated financial statements and financial statement schedule are the responsibility of the Company’s management. Our responsibility is to express an opinion on the consolidated financial statements and financial statement schedule based on our audits.
We conducted our audits in accordance with the standards of the Public Company Accounting Oversight Board (United States). Those standards require that we plan and perform the audit to obtain reasonable assurance about whether the financial statements are free of material misstatement. The Company is not required to have, nor were we engaged to perform, an audit of its internal control over financial reporting. Our audits included consideration of internal control over financial reporting as a basis for designing audit procedures that are appropriate in the circumstances, but not for the purpose of expressing an opinion on the effectiveness of the Company’s internal control over financial reporting. Accordingly, we express no such opinion. An audit also includes examining, on a test basis, evidence supporting the amounts and disclosures in the financial statements, assessing the accounting principles used and significant estimates made by management, as well as evaluating the overall financial statement presentation. We believe that our audits provide a reasonable basis for our opinion.
In our opinion, such consolidated financial statements present fairly, in all material respects, the financial position of the Company as of December 31, 2009 and 2008, and the results of its operations and its cash flows for each of the three years in the period ended December 31, 2009, in conformity with accounting principles generally accepted in the United States of America. Also, in our opinion, such financial statement schedule, when considered in relation to the basic consolidated financial statements taken as a whole, presents fairly in all material respects the information set forth therein.
As discussed in Note 15 to the consolidated financial statements, on January 1, 2007, the Company adopted accounting guidance which clarifies the accounting for uncertainties in income taxes.
/s/ Deloitte & Touche
Chicago, Illinois
February 25, 2010
F-1
HYATT HOTELS CORPORATION AND SUBSIDIARIES
CONSOLIDATED STATEMENTS OF INCOME (LOSS)
For the Years Ended December 31, 2009, 2008, and 2007
(In millions of dollars, except per share amounts)
| 2009 | 2008 | 2007 | ||||||||||
| REVENUES: |
||||||||||||
| Owned and leased hotels |
$ | 1,782 | $ | 2,139 | $ | 2,039 | ||||||
| Management and franchise fees |
223 | 290 | 315 | |||||||||
| Other revenues |
49 | 83 | 103 | |||||||||
| Other revenues from managed properties |
1,278 | 1,325 | 1,281 | |||||||||
| Total revenues |
3,332 | 3,837 | 3,738 | |||||||||
| DIRECT AND SELLING, GENERAL, AND ADMINISTRATIVE EXPENSES: |
||||||||||||
| Owned and leased hotels |
1,462 | 1,583 | 1,524 | |||||||||
| Depreciation and amortization |
270 | 249 | 214 | |||||||||
| Other direct costs |
13 | 26 | 42 | |||||||||
| Selling, general, and administrative |
261 | 290 | 292 | |||||||||
| Other costs from managed properties |
1,278 | 1,325 | 1,281 | |||||||||
| Direct and selling, general, and administrative expenses |
3,284 | 3,473 | 3,353 | |||||||||
| Net gains (losses) and interest income from marketable securities held to fund operating programs |
29 | (36 | ) | 15 | ||||||||
| Equity earnings (losses) from unconsolidated hospitality ventures |
(13 | ) | 14 | 11 | ||||||||
| Interest expense |
(56 | ) | (75 | ) | (43 | ) | ||||||
| Gains on sales of real estate |
— | — | 22 | |||||||||
| Asset impairments |
(15 | ) | (86 | ) | — | |||||||
| Other income (loss), net |
(48 | ) | 23 | 84 | ||||||||
| INCOME (LOSS) BEFORE INCOME TAXES. |
(55 | ) | 204 | 474 | ||||||||
| (PROVISION) BENEFIT FOR INCOME TAXES |
10 | (90 | ) | (208 | ) | |||||||
| INCOME (LOSS) FROM CONTINUING OPERATIONS |
(45 | ) | 114 | 266 | ||||||||
| DISCONTINUED OPERATIONS: |
||||||||||||
| Income (loss) from discontinued operations, net of income tax expense (benefit) of $(1), $0 and $2 in 2009, 2008, and 2007, respectively |
(1 | ) | 1 | 3 | ||||||||
| Gain on sale of discontinued operations, net of income tax expense of $0, $28, and $1 in 2009, 2008, and 2007, respectively |
— | 55 | 2 | |||||||||
| NET INCOME (LOSS) |
(46 | ) | 170 | 271 | ||||||||
| NET LOSS (INCOME) ATTRIBUTABLE TO NONCONTROLLING INTERESTS |
3 | (2 | ) | (1 | ) | |||||||
| NET INCOME (LOSS) ATTRIBUTABLE TO HYATT HOTELS CORPORATION |
$ | (43 | ) | $ | 168 | $ | 270 | |||||
| EARNINGS PER SHARE—Basic |
||||||||||||
| Income (loss) from continuing operations |
$ | (0.30 | ) | $ | 0.89 | $ | 1.98 | |||||
| Net income (loss) attributable to Hyatt Hotels Corporation |
$ | (0.28 | ) | $ | 1.31 | $ | 2.01 | |||||
| EARNINGS PER SHARE—Diluted |
||||||||||||
| Income (loss) from continuing operations |
$ | (0.30 | ) | $ | 0.89 | $ | 1.98 | |||||
| Net income (loss) attributable to Hyatt Hotels Corporation |
$ | (0.28 | ) | $ | 1.31 | $ | 2.01 | |||||
See accompanying notes to consolidated financial statements.
F-2
HYATT HOTELS CORPORATION AND SUBSIDIARIES
CONSOLIDATED BALANCE SHEETS
As of December 31, 2009 and 2008
(In millions of dollars, except share and per share amounts)
| 2009 | 2008 | |||||||
| ASSETS |
||||||||
| CURRENT ASSETS: |
||||||||
| Cash and cash equivalents |
$ | 1,327 | $ | 428 | ||||
| Restricted cash. |
11 | 37 | ||||||
| Receivables, net of allowances of $12 and $24 at December 31, 2009 and 2008, respectively |
226 | 281 | ||||||
| Inventories |
133 | 170 | ||||||
| Prepaids and other assets |
184 | 72 | ||||||
| Prepaid income taxes |
85 | 18 | ||||||
| Deferred tax assets |
23 | 51 | ||||||
| Total current assets |
1,989 | 1,057 | ||||||
| Investments |
223 | 204 | ||||||
| Property and equipment, net |
3,605 | 3,495 | ||||||
| Notes receivable, net of allowances |
385 | 410 | ||||||
| Goodwill |
113 | 120 | ||||||
| Intangibles, net |
284 | 256 | ||||||
| Deferred tax assets |
74 | 126 | ||||||
| Other assets |
482 | 451 | ||||||
| TOTAL ASSETS |
$ | 7,155 | $ | 6,119 | ||||
| LIABILITIES AND EQUITY |
||||||||
| CURRENT LIABILITIES: |
||||||||
| Current maturities of long-term debt |
$ | 12 | $ | 38 | ||||
| Accounts payable |
196 | 318 | ||||||
| Accrued expenses |
183 | 177 | ||||||
| Accrued income taxes |
5 | 23 | ||||||
| Accrued compensation and benefits |
99 | 97 | ||||||
| Total current liabilities |
495 | 653 | ||||||
| Long-term debt |
840 | 1,209 | ||||||
| Other long-term liabilities |
780 | 665 | ||||||
| Total liabilities |
2,115 | 2,527 | ||||||
| Commitments and contingencies (see Note 16) |
||||||||
| EQUITY: |
||||||||
| Preferred stock, $0.01 par value per share, 10,000,000 shares authorized and none outstanding as of December 31, 2009 and 10,000,000 shares authorized, 100,000 issued and outstanding as of December 31, 2008 |
— | — | ||||||
| Class A common stock, $0.01 par value per share, 1,000,000,000 shares authorized, 43,869,597 outstanding and 43,936,675 issued at December 31, 2009, Class B common stock, $0.01 par value per share, 462,000,000 shares authorized, 130,005,588 shares issued and outstanding at December 31, 2009 and common stock, $0.01 par value per share, 400,000,000 shares authorized, 119,830,381 issued and outstanding at December 31, 2008 |
2 | 1 | ||||||
| Additional paid-in capital |
3,731 | 2,242 | ||||||
| Retained earnings |
1,338 | 1,381 | ||||||
| Treasury Stock at cost, 67,078 shares |
(2 | ) | — | |||||
| Accumulated other comprehensive loss |
(53 | ) | (60 | ) | ||||
| Total stockholders’ equity |
5,016 | 3,564 | ||||||
| Noncontrolling interests in consolidated subsidiaries |
24 | 28 | ||||||
| Total equity |
5,040 | 3,592 | ||||||
| TOTAL LIABILITIES AND EQUITY |
$ | 7,155 | $ | 6,119 | ||||
See accompanying notes to consolidated financial statements.
F-3
HYATT HOTELS CORPORATION AND SUBSIDIARIES
CONSOLIDATED STATEMENTS OF CASH FLOWS
For the Years Ended December 31, 2009, 2008, and 2007
(In millions of dollars)
| 2009 | 2008 | 2007 | ||||||||||
| CASH FLOWS FROM OPERATING ACTIVITIES: |
||||||||||||
| Net income (loss) |
$ | (46 | ) | $ | 170 | $ | 271 | |||||
| Gain on sale of discontinued operations |
— | (55 | ) | (2 | ) | |||||||
| (Income) loss from discontinued operations |
1 | (1 | ) | (3 | ) | |||||||
| Income (loss) from continuing operations |
(45 | ) | 114 | 266 | ||||||||
| Adjustments to reconcile net income (loss) to net cash provided by operating activities: |
||||||||||||
| Depreciation and amortization |
270 | 249 | 214 | |||||||||
| Deferred income taxes |
73 | 6 | (100 | ) | ||||||||
| Asset impairments |
15 | 86 | — | |||||||||
| Provisions on hotel loans |
9 | — | 61 | |||||||||
| Equity (earnings) losses from unconsolidated hospitality ventures, including distributions received |
28 | (5 | ) | 1 | ||||||||
| Income from cost method investments |
(22 | ) | (64 | ) | (87 | ) | ||||||
| Gain on sales of real estate |
— | — | (22 | ) | ||||||||
| Foreign currency (gains) losses |
(5 | ) | 23 | (17 | ) | |||||||
| Net realized losses from other marketable securities |
— | 14 | — | |||||||||
| Net unrealized (gains) losses from other marketable securities |
(10 | ) | 23 | (12 | ) | |||||||
| Other |
47 | 20 | 11 | |||||||||
| Increase (decrease) in cash attributable to changes in assets and liabilities: |
||||||||||||
| Receivables, net |
57 | 4 | (19 | ) | ||||||||
| Inventories |
(10 | ) | (21 | ) | 14 | |||||||
| Prepaid income taxes |
(67 | ) | (15 | ) | — | |||||||
| Accounts payable |
(19 | ) | (10 | ) | (19 | ) | ||||||
| Accrued compensation and benefits |
4 | (31 | ) | 5 | ||||||||
| Accrued expenses and other current liabilities |
(27 | ) | (95 | ) | 89 | |||||||
| Other, net |
(22 | ) | (11 | ) | (23 | ) | ||||||
| Net cash provided by operating activities of continuing operations |
276 | 287 | 362 | |||||||||
(Continued)
See accompanying notes to consolidated financial statements.
F-4
HYATT HOTELS CORPORATION AND SUBSIDIARIES
CONSOLIDATED STATEMENTS OF CASH FLOWS
For the Years Ended December 31, 2009, 2008, and 2007
(In millions of dollars)
| 2009 | 2008 | 2007 | ||||||||||
| CASH FLOWS FROM INVESTING ACTIVITIES: |
||||||||||||
| Contributions to investments and purchases of marketable securities |
(132 | ) | (87 | ) | (32 | ) | ||||||
| Distributions from investments |
24 | 209 | 116 | |||||||||
| Proceeds from sale of investments and marketable securities |
— | 8 | — | |||||||||
| Proceeds from notes receivable |
14 | 19 | 19 | |||||||||
| Issuance of notes receivable |
(7 | ) | (281 | ) | (23 | ) | ||||||
| Acquisitions, net of cash acquired |
(109 | ) | (28 | ) | (240 | ) | ||||||
| Capital expenditures |
(216 | ) | (258 | ) | (377 | ) | ||||||
| Contract acquisition costs |
(10 | ) | (8 | ) | (5 | ) | ||||||
| Proceeds from sales of real estate |
— | — | 98 | |||||||||
| Decrease in restricted cash - investing |
9 | 3 | 48 | |||||||||
| Net cash used in investing activities of continuing operations |
(427 | ) | (423 | ) | (396 | ) | ||||||
| CASH FLOWS FROM FINANCING ACTIVITIES: |
||||||||||||
| Proceeds from issuance of long-term debt |
498 | — | 601 | |||||||||
| Proceeds from revolver |
675 | 175 | 785 | |||||||||
| Payments on revolver |
(705 | ) | (145 | ) | (785 | ) | ||||||
| Proceeds from (repurchase of) senior subordinated notes |
(600 | ) | — | — | ||||||||
| Repayments of long-term debt |
(257 | ) | (13 | ) | (337 | ) | ||||||
| Other debt payments |
(24 | ) | (11 | ) | (13 | ) | ||||||
| Decrease (increase) in restricted cash—financing |
19 | (17 | ) | — | ||||||||
| Distributions to noncontrolling interests |
(1 | ) | (2 | ) | (1 | ) | ||||||
| Purchase of noncontrolling interests |
— | (7 | ) | — | ||||||||
| Costs related to issuance of debt, stock and amendment of revolver |
(18 | ) | — | (23 | ) | |||||||
| Settlement of interest rate swap agreements |
(13 | ) | — | — | ||||||||
| Issuance of convertible preferred stock |
— | — | 500 | |||||||||
| Issuance of common stock, net of related costs of $4 million |
1,355 | — | — | |||||||||
| Issuance of Class A common stock in IPO, net of underwriter fees of $7 million and other issuance costs of |
127 | — | — | |||||||||
| Purchase of treasury stock |
— | — | (1,101 | ) | ||||||||
| Net cash provided by (used in) financing activities of continuing operations |
1,056 | (20 | ) | (374 | ) | |||||||
| CASH PROVIDED BY DISCONTINUED OPERATIONS: |
||||||||||||
| Net cash provided by operating activities of discontinued operations |
— | 4 | 24 | |||||||||
| Net cash provided by investing activities of discontinued operations |
— | 139 | 7 | |||||||||
| Net cash provided by discontinued operations |
— | 143 | 31 | |||||||||
| EFFECT OF EXCHANGE RATE CHANGES ON CASH |
(6 | ) | 25 | (14 | ) | |||||||
| NET INCREASE (DECREASE) IN CASH AND CASH EQUIVALENTS |
899 | 12 | (391 | ) | ||||||||
| CASH AND CASH EQUIVALENTS—BEGINNING OF YEAR |
428 | 416 | 807 | |||||||||
| CASH AND CASH EQUIVALENTS—END OF PERIOD |
$ | 1,327 | $ | 428 | $ | 416 | ||||||
| LESS CASH AND CASH EQUIVALENTS DISCONTINUED OPERATIONS |
— | — | 7 | |||||||||
| CASH AND CASH EQUIVALENTS CONTINUING OPERATIONS—END OF PERIOD |
$ | 1,327 | $ | 428 | $ | 409 | ||||||
| SUPPLEMENTAL DISCLOSURE OF CASH FLOW INFORMATION: |
||||||||||||
| Cash paid during the period for interest |
$ | 50 | $ | 62 | $ | 48 | ||||||
| Cash paid during the period for income taxes |
$ | 60 | $ | 198 | $ | 224 | ||||||
| Non-cash investing and financing activities are as follows: |
||||||||||||
| Transfer of timeshare inventory to fixed assets (see Note 2) |
$ | 47 | $ | — | $ | — | ||||||
| Acquisitions of treasury stock |
$ | 2 | $ | — | $ | — | ||||||
| Capital lease |
$ | — | $ | 1 | $ | 248 | ||||||
| Stock subscription receivable |
$ | — | $ | — | $ | 18 | ||||||
(Concluded)
See accompanying notes to consolidated financial statements.
F-5
HYATT HOTELS CORPORATION AND SUBSIDIARIES
CONSOLIDATED STATEMENTS OF CHANGES IN STOCKHOLDERS’ EQUITY
FOR THE YEARS ENDED DECEMBER 31, 2009, 2008, AND 2007
(In millions of dollars)
| Total | Common Stock Amount |
Additional Paid-in Capital |
Retained Earnings |
Treasury Stock Amount |
Accumulated Other Comprehensive Loss |
Noncontrolling Interests in Consolidated Subsidiaries |
|||||||||||||||||||||
| BALANCE—January 1, 2007 |
3,760 | 1 | 2,801 | 952 | — | (22 | ) | 28 | |||||||||||||||||||
| Net income |
271 | — | — | 270 | — | — | 1 | ||||||||||||||||||||
| Foreign currency translation adjustments, net of income tax of $(0) |
16 | — | — | — | — | 16 | — | ||||||||||||||||||||
| Unrecognized pension cost, net of income tax of $2 |
2 | — | — | — | — | 2 | — | ||||||||||||||||||||
| Comprehensive Income |
289 | — | |||||||||||||||||||||||||
| Adjustment to initially apply new accounting pronouncements (see Note 15) |
(9 | ) | — | — | (9 | ) | — | — | — | ||||||||||||||||||
| Issuance of convertible preferred stock |
497 | — | 497 | — | — | — | — | ||||||||||||||||||||
| Purchase of treasury stock |
(1,101 | ) | — | — | — | (1,101 | ) | — | — | ||||||||||||||||||
| Stock subscription receivable |
18 | — | 18 | — | — | — | — | ||||||||||||||||||||
| Noncontrolling interest in acquired hotel property |
7 | — | — | — | — | — | 7 | ||||||||||||||||||||
| Distributions to noncotrolling interests |
(1 | ) | — | — | — | — | — | (1 | ) | ||||||||||||||||||
| Attribution of share based payments |
9 | — | 9 | — | — | — | — | ||||||||||||||||||||
| BALANCE—December 31, 2007 |
$ | 3,469 | $ | 1 | $ | 3,325 | $ | 1,213 | $ | (1,101 | ) | $ | (4 | ) | $ | 35 | |||||||||||
| Net income |
170 | — | — | 168 | — | — | 2 | ||||||||||||||||||||
| Foreign currency translation adjustments, net of income tax of $(13) |
(68 | ) | — | — | — | — | (68 | ) | — | ||||||||||||||||||
| Unrecognized pension cost, net of income tax of $8 |
14 | — | — | — | — | 14 | — | ||||||||||||||||||||
| Unrealized loss on hedge activity, net of income tax of $(1) |
(2 | ) | — | — | — | — | (2 | ) | — | ||||||||||||||||||
| Comprehensive Income |
114 | ||||||||||||||||||||||||||
| Capital contribution (see Note 19) |
5 | — | 5 | — | — | — | — | ||||||||||||||||||||
| Retirement of treasury stock |
— | — | (1,101 | ) | — | 1,101 | — | — | |||||||||||||||||||
| Distributions to noncontrolling interests |
(2 | ) | — | — | — | — | — | (2 | ) | ||||||||||||||||||
| Purchase of subsidiary shares from noncontrolling interests |
(7 | ) | — | — | — | — | — | (7 | ) | ||||||||||||||||||
| Attribution of share based payments |
13 | — | 13 | — | — | — | — | ||||||||||||||||||||
| BALANCE—December 31, 2008 |
$ | 3,592 | $ | 1 | $ | 2,242 | $ | 1,381 | $ | — | $ | (60 | ) | $ | 28 | ||||||||||||
| Net (loss) |
(46 | ) | — | — | (43 | ) | — | — | (3 | ) | |||||||||||||||||
| Foreign currency translation adjustments, net of income tax of $(17) |
6 | — | — | — | — | 6 | — | ||||||||||||||||||||
| Unrecognized pension cost, net of income tax of $1 |
(1 | ) | — | — | — | — | (1 | ) | — | ||||||||||||||||||
| Hedge losses reclassified to earnings, net of income tax of $(1) |
2 | — | — | — | — | 2 | — | ||||||||||||||||||||
| Comprehensive (loss) |
(39 | ) | |||||||||||||||||||||||||
| Issuance of common stock through rights offering, net of related costs of $4 million (See Note 17) |
755 | 1 | 754 | — | — | — | — | ||||||||||||||||||||
| Issuance of common stock through Subscription Agreement, net of related costs of $13 million (See Note 17) |
587 | — | 587 | — | — | — | — | ||||||||||||||||||||
| Issuance of Class A common stock in IPO, net of underwriter fees of $7 million and other issuance costs of $8 million (See Note 17) |
127 | — | 127 | — | — | — | — | ||||||||||||||||||||
| Distributions to noncontrolling interests |
(1 | ) | — | — | — | — | — | (1 | ) | ||||||||||||||||||
| Directors compensation |
2 | — | 2 | — | — | — | — | ||||||||||||||||||||
| Issuance of Class A common stock to employees, net of withholding taxes |
— | — | 2 | — | (2 | ) | — | — | |||||||||||||||||||
| Attribution of share based payments |
17 | — | 17 | — | — | — | — | ||||||||||||||||||||
| BALANCE—December 31, 2009 |
$ | 5,040 | $ | 2 | $ | 3,731 | $ | 1,338 | $ | (2 | ) | $ | (53 | ) | $ | 24 | |||||||||||
See accompanying notes to consolidated financial statements.
F-6
HYATT HOTELS CORPORATION AND SUBSIDIARIES
NOTES TO CONSOLIDATED FINANCIAL STATEMENTS
(amounts in millions, unless otherwise indicated)
| 1. | ORGANIZATION |
Hyatt Hotels Corporation, a Delaware corporation, and its consolidated subsidiaries (“Hyatt Hotels Corporation”), provide hospitality services on a worldwide basis through the management, franchising and ownership of hospitality related businesses. We operate or franchise 223 full-service, Hyatt-branded hotels, consisting of 97,528 rooms, in 45 countries throughout the world. We hold ownership interests in certain of these hotels. We operate or franchise 176 select-service, Hyatt-branded hotels with 22,503 rooms in the United States and Canada. We hold ownership interests in certain of these hotels. We develop and/or operate Hyatt-branded timeshare, fractional and other forms of residential or vacation properties.
Our North American management and hotel ownership company, Hyatt Corporation, was founded in 1957. Our international management and hotel ownership company, Hyatt International Corporation, was founded in 1968. On August 4, 2004, our predecessor, Global Hyatt, Inc., was incorporated in Delaware as a holding company to combine our North American and international hospitality operations and increase the scale and scope of our company. Effective October 13, 2004, the name Global Hyatt, Inc. was changed to Global Hyatt Corporation. Effective June 30, 2009, Global Hyatt Corporation changed its name to Hyatt Hotels Corporation. On November 10, 2009, we completed our initial public offering (“IPO”) of Class A common stock in which a total of 43.7 million shares were sold at an initial public offering price of $25.00 per share. This included the sale of 38 million shares by selling stockholders and 5.7 million shares sold by us pursuant to the underwriters’ full exercise of their over-allotment option. See Note 17.
As used in these Notes, the terms “Company,” “HHC,” “we,” “us,” or “our” mean Hyatt Hotels Corporation and its consolidated subsidiaries.
As used in these Notes, the term “Pritzker family business interests” means (1) various lineal descendants of Nicholas J. Pritzker (deceased) and spouses and adopted children of such descendants; (2) various trusts for the benefit of the individuals described in clause (1) and trustees thereof; and (3) various entities owned and/or controlled, directly and/or indirectly, by the individuals and trusts described in (1) and (2).
| 2. | SUMMARY OF SIGNIFICANT ACCOUNTING POLICIES |
Principles of Consolidation—The consolidated financial statements present the results of operations, financial position, and cash flows of Hyatt Hotels Corporation and its majority owned and controlled subsidiaries. All intercompany accounts and transactions have been eliminated in consolidation.
Use of Estimates—We are required to make estimates and assumptions that affect the amounts reported in the consolidated financial statements and accompanying notes. Actual results could differ materially from such estimated amounts.
Revenue Recognition—Our revenues are primarily derived from the following sources and are generally recognized when services have been rendered:
| • | Owned and leased hotel revenues are derived from room rentals and services provided at our owned, leased, and consolidated hospitality venture properties and are recorded when rooms are occupied and services have been rendered. Sales and occupancy taxes are recorded on a net basis in the consolidated statements of income (loss). |
F-7
| • | Management and franchise fees earned from hotels managed and franchised worldwide: |
| – | Management fees primarily consist of a base fee, which is generally computed as a percentage of gross revenues, and an incentive fee, which is generally computed based on a hotel profitability measure. Base fee revenues are recognized when earned in accordance with the terms of the contract. We recognize incentive fees that would be due as if the contract were to terminate at that date, exclusive of any termination fees payable or receivable by us. |
| – | Realized gains from the sale of hotel real estate assets where we maintain continuing involvement in the form of a long-term management contract are deferred and recognized as management fee revenue over the term of the underlying management contract. |
| – | Franchise fees are generally based on a percentage of hotel rooms’ revenues and are recognized as the fees are earned and become due from the franchisee when all material services or conditions relating to the sale have been substantially performed or satisfied by the franchisor. |
| • | Other revenues |
| – | Other revenues primarily include revenues from our vacation ownership business. We recognize vacation ownership revenue when a minimum of 10% of the purchase price for the interval has been received, the period of cancellation with refund has expired, and receivables are deemed collectible. For sales that do not qualify for full revenue recognition as the project has progressed beyond the preliminary stages but has not yet reached completion, all revenue and associated direct expenses are initially deferred and recognized in earnings through the percentage-of-completion method. |
| – | Other revenues from managed properties represent the reimbursement of costs incurred on behalf of the owners of hotel properties we manage. These costs relate primarily to payroll costs at managed properties where we are the employer. Since the reimbursements are made based upon the costs incurred with no added margin, these revenues and corresponding expenses have no effect on our net income. |
Cash Equivalents—We consider all highly liquid investments purchased with an original maturity of three months or less at the date of purchase to be cash equivalents.
Restricted Cash—We had restricted cash of $11 million and $37 million at December 31, 2009 and 2008, respectively. Of these amounts: (i) $0 and $17 million at December 31, 2009 and 2008, respectively, were funds deposited in an interest bearing account for security of long-term loans and satisfying debt covenant requirements; (ii) $2 million and $5 million at December 31, 2009 and 2008, respectively, were escrow deposits on purchases of our vacation ownership intervals; and (iii) $0 and $6 million at December 31, 2009 and 2008, respectively, were advance payments of certain taxes and fees related to vacation ownership units that are required to be held in escrow under statutory law. The remaining $9 million and $9 million in 2009 and 2008, respectively, relates to secured real estate taxes, property insurance, security deposits, property and equipment reserves, and long-term loans. These amounts are invested in interest-bearing accounts.
Investments—We consolidate entities under our control. Investments in unconsolidated affiliates over which we exercise significant influence, but do not control, are accounted for by the equity method. In addition, our limited partnership investments in which we hold more than a minimal investment are accounted for under the equity method of accounting. Investments in unconsolidated affiliates over which we are not able to exercise significant influence are accounted for under the cost method.
Marketable Securities—Our portfolio of marketable securities is accounted for as trading securities and consists of various types of U.S. Treasury securities, mutual funds, common stock, preferred stock and fixed income securities, including government and corporate bonds. Marketable securities are principally included
F-8
within other noncurrent assets in the consolidated balance sheets (see Note 4). Fair value is based on listed market prices or dealer price quotations where available. Marketable securities are recorded at fair value with unrealized gains and losses reflected in the consolidated statements of income (loss).
Other Income (Loss), Net—Other income (loss), net includes interest income on interest-bearing cash and cash equivalents, gains (losses) on other marketable securities (see Note 4), income from cost method investments (see Note 3), foreign currency gains (losses) including gains (losses) on foreign currency exchange rate instruments (see Note 12) and costs related to the repurchase of $600 million of 5.84% senior subordinated notes due 2013 and early settlement of a stock purchase forward agreement (the “Subscription Agreement”) (see Notes 10 and 17), and provisions on hotel loans (see Note 7). The table below provides a reconciliation of the components in other income (loss), net for the years ended December 31, 2009, 2008 and 2007, respectively:
| For the years ended December 31, | ||||||||||||
| 2009 | 2008 | 2007 | ||||||||||
| Interest income on interest-bearing cash and cash equivalents |
$ | 21 | $ | 23 | $ | 43 | ||||||
| Gains (losses) on other marketable securities |
10 | (37 | ) | — | ||||||||
| Income from cost method investments |
22 | 64 | 87 | |||||||||
| Foreign currency gains (losses) |
5 | (23 | ) | 17 | ||||||||
| Debt settlement costs |
(93 | ) | — | — | ||||||||
| Provisions on hotel loans |
(9 | ) | — | (61 | ) | |||||||
| Other |
(4 | ) | (4 | ) | (2 | ) | ||||||
| Other income (loss), net |
$ | (48 | ) | $ | 23 | $ | 84 | |||||
Foreign Currency—The functional currency of our consolidated and nonconsolidated entities located outside the United States of America is generally the local currency. The assets and liabilities of these entities are translated into U.S. dollars at year-end exchange rates, and the related gains and losses, net of applicable deferred income taxes, are reflected in stockholders’ equity. Gains and losses from foreign currency transactions are included in earnings. Income and expense accounts are translated at the average exchange rate for the period. Gains and losses from foreign exchange rate changes related to intercompany receivables and payables of a long-term nature are generally included in other comprehensive income. Gains and losses from foreign exchange rate movement related to intercompany receivables and payables that are not of a long-term nature are reported currently in income.
Notes Receivable—These receivables reflect the amounts due from our financing of vacation ownership interval sales, as well as receivables from certain franchisees and other hotel owners or developers. We carry mortgages receivable at amortized cost in current receivables and long-term receivables. We recognize interest income as earned and provide an allowance for cancellations and defaults. The adequacy of the allowance is determined by management through the analysis of several factors, such as economic conditions and industry trends, defaults, past-due aging, and historical write-offs of mortgages and notes receivable. The allowance is maintained at a level believed adequate by management based on a periodic analysis of the portfolio of receivables.
Inventories—Inventories are comprised principally of unsold vacation ownership intervals of $118 million and $154 million at December 31, 2009 and 2008, respectively, and food and beverage inventories at our owned and leased hotels. Vacation ownership inventory is carried at the lower of cost or market, based on relative sales value or net realizable value. Food and beverage inventories are generally valued at the lower of cost (first-in, first-out) or market. Vacation ownership interval products inventory, which has an operating cycle that exceeds 12 months, is classified as a current asset consistent with recognized industry practice. During the year ending December 31, 2009, we reclassified $47 million in vacation ownership inventory to property and equipment as we have changed our intended use with respect to certain of our vacation ownership units.
F-9
Property and Equipment—Property and equipment are stated at cost, including interest incurred during development and construction periods. Depreciation and amortization are provided over the estimated useful lives of the assets, primarily on the straight-line method. All repair and maintenance costs are expensed as incurred.
Useful lives assigned to property and equipment are as follows:
| Buildings and improvements | 15–50 years | |
| Leasehold improvements | The shorter of the lease term or useful life of asset | |
| Furniture and equipment | 2–21 years | |
| Computers | 3–6 years |
Long-Lived Assets and Definite-Lived Intangibles—We evaluate the carrying value of our long-lived assets and definite-lived intangibles for impairment by comparing the expected undiscounted future cash flows of the assets to the net book value of the assets when certain triggering events occur. If the expected undiscounted future cash flows are less than the net book value of the assets, the excess of the net book value over the estimated fair value is charged to earnings. Fair value is based upon discounted cash flows of the assets at a rate deemed reasonable for the type of asset and prevailing market conditions, appraisals, and, if appropriate, current estimated net sales proceeds from pending offers. We evaluate the carrying value of our long-lived assets and definite-lived intangibles based on our plans, at the time, for such assets and such qualitative factors as future development in the surrounding area and status of expected local competition. Changes to our plans, including a decision to dispose of or change the intended use of an asset, can have a material impact on the carrying value of the asset.
Goodwill—We evaluate goodwill for impairment on an annual basis during the fourth quarter of each year using balances as of the end of September and at an interim date if a triggering event occurs. Goodwill impairment is determined by comparing the fair value of a reporting unit to its carrying amount with an impairment being recognized only where the fair value is less than carrying value. See Note 9 for additional information about goodwill.
Income Taxes—We account for income taxes to recognize the amount of taxes payable or refundable for the current year and the amount of deferred tax assets and liabilities resulting from the future tax consequences of differences between the financial statements and tax basis of the respective assets and liabilities. We recognize the financial statement effect of a tax position when, based on the technical merits of the uncertain tax position, it is more likely than not to be sustained on a review by taxing authorities. These estimates are based on judgments made with currently available information. We review these estimates and make changes to recorded amounts of uncertain tax positions as facts and circumstances warrant. For additional information about income taxes, see Note 15.
Fair Value—We disclose the fair value of our financial assets and liabilities based on observable market information where available, or on market participant assumptions. These assumptions are subjective in nature, involve matters of judgment, and, therefore, fair values cannot always be determined with precision.
The carrying values of cash equivalents, accounts receivable, notes receivable – current, accounts payable, and current maturities of long-term debt approximate fair value due to the short-term nature of these items and their close proximity to maturity.
For additional information about fair value, see Note 5. The fair value of notes receivable is discussed in Note 7; the fair value of marketable securities is discussed in Note 4; and the fair value of long-term debt is discussed in Note 10.
F-10
Hyatt Gold Passport Fund—The Hyatt Gold Passport Program (the “Program”) is our loyalty program. We operate the Program for the benefit of Hyatt branded properties, whether owned, operated, managed, or franchised by us. The Program is operated through the Hyatt Gold Passport Fund, which is an entity that is owned collectively by the owners of Hyatt branded properties, whether owned, operated, managed or franchised by us. The Hyatt Gold Passport Fund (the “Fund”) has been established to provide for the payment of operating expenses and redemptions of member awards associated with the Program. The Fund is maintained and managed by us on behalf of and for the benefit of Hyatt branded properties. We have evaluated our investment in the Fund and have determined that the Fund qualifies as a variable interest entity (“VIE”) and, as a result of the Company being the primary beneficiary, we have consolidated the Fund.
The Program allows members to earn points based on their spending at Hyatt branded properties. Points earned by members can be redeemed for goods and services at Hyatt branded properties, and to a lesser degree, through other redemption opportunities with third parties, such as the conversion to airline miles. Points cannot be redeemed for cash. We charge the cost of operating the Program, including the estimated cost of award redemption, to the hotel properties based on members’ qualified expenditures. Due to the requirements under the Program that the hotel properties reimburse us for the Program’s operating costs as incurred, we recognize this revenue from properties at the time such costs are incurred and expensed. We defer revenue received from the hotel properties equal to the fair value of our future redemption obligation. Upon the redemption of points, we recognize as revenue the amounts previously deferred and recognize the corresponding expense relating to the costs of the awards redeemed. Revenue is recognized by the hotel properties when the points are redeemed, and expenses are recognized when the points are earned by the members.
We actuarially determine the expected fair value of the future redemption obligation based on statistical formulas that project the timing of future point redemption based on historical experience, including an estimate of the “breakage” for points that will never be redeemed, and an estimate of the points that will eventually be redeemed. Actual expenditures for the Program may differ from the actuarially determined liability.
The Fund is financed by payments from the properties and returns on marketable securities. The Fund invests amounts received from the properties in marketable securities (see Note 4). As of December 31, 2009 and 2008, total assets of the Fund were $293 million and $297 million, respectively, including $50 million and $47 million of current assets, respectively. Marketable securities held by the Fund and included in other noncurrent assets were $243 million and $250 million as of December 31, 2009 and 2008, respectively (see Note 4). As of December 31, 2009 and 2008, total liabilities of the Fund were $293 million and $297 million, respectively, including $50 million and $47 million of current liabilities, respectively. The non-current liabilities of the Fund are included in other long-term liabilities (see Note 14).
Recently Issued Accounting Pronouncements
Adopted Accounting Standards
In January 2010, the Financial Accounting Standards Board (“FASB”) issued Accounting Standards Update No. 2010-02 (“ASU 2010-02”), Consolidation (Topic 810): Accounting and Reporting for Decreases in Ownership of a Subsidiary—a Scope Clarification. The update clarifies the scope of transactions subject to the guidance to (a) a subsidiary or group of assets that is a business or nonprofit activity, (b) a subsidiary that is a business or nonprofit activity that is transferred to an equity method investee or joint venture, and (c) an exchange of a group of assets that constitute a business or nonprofit activity for a noncontrolling interest in an entity (including an equity method investee or joint venture). The deconsolidation provisions and gain/loss guidance do not apply to transactions that are in substance the sale or partial sale of real estate. The update also requires additional disclosures when a subsidiary is deconsolidated. ASU 2010-02 became effective for financial statements issued for interim or annual reporting periods ending on or after December 15, 2009. The adoption of ASU 2010-02 did not have a material impact on our consolidated financial statements.
F-11
In August 2009, the FASB issued Accounting Standards Update No. 2009-05 (“ASU 2009-05), Fair Value Measurements and Disclosures (Topic 820)—Measuring Liabilities at Fair Value, which provides additional application guidance in determining the fair value of liabilities. ASU 2009-05 allows companies to use one or more of the following techniques in determining the fair value of a liability: (a) quoted market price of an identical liability when traded as an asset, (b) quoted market price of a similar liability when traded as an asset, or (c) another valuation technique, such as the income approach, that is consistent with the fair value measurement principles issued by the FASB. The guidance was effective for the first reporting period beginning after issuance, or the fourth quarter 2009. We adopted ASU 2009-05 with no material impact on our consolidated financial statements.
In June 2009, the FASB issued Accounting Standards Update No. 2009-01 (“ASU 2009-01”), Generally Accepted Accounting Principles—amendments based on Statement of Financial Accounting Standards No. 168—The FASB Accounting Standards Codification and the Hierarchy of Generally Accepted Accounting Principles. ASU 2009-01 establishes the “FASB Accounting Standards Codification” as the source of authoritative GAAP for nongovernmental entities. Additionally, ASU 2009-01 modifies the Generally Accepted Accounting Principles (“GAAP”) Hierarchy to only include two levels of GAAP—authoritative and nonauthoritative. ASU 2009-01 became effective for financial statements issued for interim and annual periods ending after September 15, 2009. The adoption of ASU 2009-01 did not have a material impact on our consolidated financial statements.
In May 2009, the FASB issued guidance addressing the accounting for and disclosure requirements of events or transactions that occur after the balance sheet date, but before the financial statements are issued. The Company adopted the guidance as of June 30, 2009 as it was effective for interim and annual periods ending after June 15, 2009. In February 2010, however, the FASB issued Accounting Standards Update No. 2010-09 (“ASU 2010-09), Subsequent Events (Topic 855): Amendments to Certain Recognition and Disclosure Requirements. The amendments (a) require an SEC filer to evaluate subsequent events through the date the financial statements are issued with the SEC, (b) add the definitions of an SEC filer and revised financial statements, (c) no longer require that an SEC filer disclose the date through which subsequent events have been reviewed, and (d) remove the definition of a public entity. We adopted the amendments upon issuance with no material impact to our consolidated financial statements.
In September 2006, the FASB issued enhanced guidance for using fair value to measure assets and liabilities by establishing a common definition of fair value, providing a framework for measuring fair value under GAAP, and expanding the disclosure requirements about fair value measurements. In February 2008, the FASB deferred the adoption of such guidance for one year for nonfinancial assets and nonfinancial liabilities that are recognized or disclosed at fair value in the financial statements on a non-recurring basis. We adopted the fair value guidance for nonfinancial assets and nonfinancial liabilities on January 1, 2009 with no material impact to our consolidated financial statements.
In April 2009, the FASB issued additional guidance around fair value, which provided: (a) additional application guidance for estimating fair value when the volume and activity for the asset or liability have greatly decreased and (b) indicators for identifying transactions that are not considered orderly. The additional guidance was effective for interim periods ending after June 15, 2009, with early adoption permitted for periods ending after March 15, 2009. We adopted the provisions on January 1, 2009 with no material impact to our consolidated financial statements.
Additionally, in April 2009, the FASB issued guidance requiring companies to disclose in their interim financial statements the required annual disclosures for fair value of financial instruments. Furthermore, the FASB requires that the method and significant assumptions used to estimate fair value be disclosed. The guidance was effective for interim periods ending after June 15, 2009, with early adoption permitted for periods ending after March 15, 2009. We adopted the provisions on January 1, 2009 with no material impact to our consolidated financial statements.
F-12
In December 2007, the FASB issued accounting literature revising how entities will account for the acquisition of a business. The more significant changes are the (1) expanded definitions of a business and business combination, (2) increased use of fair value, (3) the expensing of acquisition costs, and (4) expanded financial statement disclosures. The guidance was to be applied prospectively to business combinations with acquisition dates on or after the beginning of the first annual reporting period beginning on or after December 15, 2008. We adopted the guidance effective January 1, 2009, and applied the provisions to all business combinations completed during the year ended December 31, 2009. See Note 8 for discussion of acquisitions.
In April 2009, the FASB issued guidance addressing the application of the recognition and measurement literature for assets acquired and liabilities assumed in a business combination that arise from contingencies. The guidance was effective for assets or liabilities arising from contingencies in business combinations for which the acquisition date is on or after the beginning of the first annual reporting period beginning on or after December 15, 2008. We adopted the guidance effective January 1, 2009, and applied the provisions to all business combinations completed during the twelve months ended December 31, 2009. See Note 8 for discussion of acquisitions.
In December 2007, the FASB amended the accounting and reporting requirements for minority interests by requiring that minority interests be labeled noncontrolling interests and recorded as a component of equity. The amended guidance was effective for fiscal years beginning on or after December 15, 2008. Effective January 1, 2009, we adopted the revised guidance, which defines a non-controlling interest in a subsidiary as “the portion of the equity (net assets) in a subsidiary not attributable, directly or indirectly, to a parent” and requires non-controlling interests to be presented as a separate component of equity in the consolidated balance sheet. The guidance also modifies the presentation of net income by requiring earnings and other comprehensive income to be attributed to controlling and noncontrolling interests.
In March 2008, the FASB required companies to enhance the transparency of their derivative disclosures by addressing (a) how and why an entity uses derivative instruments, (b) how derivative instruments and related hedged items are accounted for under US GAAP, and (c) how derivative instruments and related hedged items affect an entity’s financial position, financial performance, and cash flows. The guidance was effective for financial statements issued for fiscal years and interim periods beginning after November 15, 2008. Our adoption of the new requirements on January 1, 2009 did not have a material impact on our consolidated financial statements. See Note 12 for the disclosures around our derivative activity.
In April 2008, the FASB amended the factors that we should consider when developing renewal or extension assumptions used in the determination of useful lives of intangible assets. These assumptions should be consistent with the expected cash flow method used to measure the fair value of the intangible asset. The amended guidance was applicable prospectively to intangible assets acquired after January 1, 2009. We adopted this guidance on January 1, 2009 with no material impact on our consolidated financial statements. See Note 8 for discussion of acquisitions.
In November 2008, the FASB ratified guidance approved by the Emerging Issues Task Force addressing how the business combination and noncontrolling interest guidance issued by the FASB might impact the accounting for equity method investments. The guidance was effective prospectively for new investments acquired in fiscal years beginning on or after December 15, 2008. We adopted the guidance on January 1, 2009 with no material impact on our consolidated financial statements.
Future Adoption of Accounting Standards
In June 2009, the FASB amended the consolidation rules related to VIEs. The new rules expand the primary beneficiary analysis to incorporate a qualitative review of which entity controls and directs the activities of the VIE. The amendments also modify the rules regarding the frequency of ongoing reassessments of whether a company is the primary beneficiary. Under the revised guidance, companies are required to perform ongoing
F-13
reassessments as opposed to only when certain triggering events occur, as was previously required. The amendments are effective for the first annual reporting period that begins after November 15, 2009 and for interim periods therein. We have evaluated our existing ownership structures and related agreements under the new guidance and have concluded that no material changes will be required to our consolidated financial statements.
In January 2010, the FASB released Accounting Standards Update No. 2010-06 (“ASU 2010-06”), Fair Value Measurements and Disclosures (Topic 820): Improving Disclosures about Fair Value Measurement. The update requires the Company to (a) disclose transfers in and out of Levels One and Two, in addition to transfers in and out of Level Three and (b) separately disclose purchases, sales, issuances, and settlements of our Level Three securities. Additionally, ASU 2010-06 clarifies the information we currently disclose regarding our valuation techniques, inputs used in those valuation models, and at what level of detail fair value disclosures should be provided. ASU 2010-06 is effective for interim and annual reporting periods beginning after December 15, 2009, except for the disaggregation of the Level Three activity, which is effective for interim and annual periods beginning after December 15, 2010. ASU 2010-06 is not expected to materially impact our current fair value disclosures.
| 3. | INVESTMENTS |
We have investments that are recorded under both the equity and cost methods. Those investments categorized as hospitality ventures are primarily recorded under the equity method. These investments are considered to be an integral part of our business and are strategically and operationally important to our overall results. Our equity and cost method investment balances recorded at December 31, 2009 and 2008 are as follows:
| December 31, 2009 | December 31, 2008 | |||||
| Equity method investments |
$ | 213 | $ | 191 | ||
| Cost method investments |
10 | 13 | ||||
| Total investments |
$ | 223 | $ | 204 | ||
Our income (loss) from equity method investments included in the consolidated statements of income (loss) for the years ended December 31, 2009, 2008, and 2007, were $(13) million, $14 million, and $11 million, respectively. Income from cost method investments included in our consolidated statements of income (loss) for the years ended December 31, 2009, 2008, and 2007 were $22 million, $64 million, and $87 million, respectively, and are included in other income (loss), net.
The carrying value and ownership percentages of our unconsolidated investments in hotel and vacation properties accounted for under the equity method as of December 31, 2009 and 2008 are as follows:
| Ownership Interests |
Our Investment | ||||||||
| December 31, 2009 | December 31, 2008 | ||||||||
| Juniper Hotels Private Ltd |
50.0 | % | $ | 40 | $ | 37 | |||
| Hotel Investments, LP (see below) |
30.0 | % | 28 | — | |||||
| Hedreen Hotel Two, LLC |
50.0 | % | 22 | 21 | |||||
| Nuevo Plaza Hotel Mendoza Limited |
50.0 | % | 17 | 18 | |||||
| Hedreen Hotel, LLC |
50.0 | % | 17 | 17 | |||||
| East West Resort Development XII, LP, LLLP |
41.4 | % | 9 | 9 | |||||
| Sao Paulo Investment Co. |
50.0 | % | 9 | 12 | |||||
| Bear Creek DFW Associates, LTD |
46.1 | % | 7 | 9 | |||||
| Grand Aspen Holdings, LLC & Top of Mill Investors, LLC |
25.8 | % | 7 | 9 | |||||
| Coast Beach, LLC |
40.0 | % | 7 | 7 | |||||
| Other |
50 | 52 | |||||||
| Total |
$ | 213 | $ | 191 | |||||
F-14
The following tables present summarized financial information for all unconsolidated ventures in which we hold an investment that is accounted for under the equity method.
| For the Year Ended December 31, | ||||||||||
| 2009 | 2008 | 2007 | ||||||||
| Total revenues |
$ | 707 | $ | 572 | $ | 638 | ||||
| Gross operating profit |
234 | 212 | 239 | |||||||
| Income (loss) from continuing operations |
(49 | ) | 47 | 73 | ||||||
| Net income (loss) |
$ | (49 | ) | $ | 47 | $ | 73 | |||
| As of December 31, | ||||||
| 2009 | 2008 | |||||
| Current Assets |
$ | 281 | $ | 292 | ||
| Noncurrent Assets |
1,891 | 1,496 | ||||
| Total Assets |
2,172 | 1,788 | ||||
| Current Liabilities |
208 | 189 | ||||
| Noncurrent Liabilities |
1,651 | 1,282 | ||||
| Total Liabilities |
$ | 1,859 | $ | 1,471 | ||
In March 2009, we acquired a 30.0% equity interest in Hotel Investments, LP, a hospitality venture that owns an interest in a hotel property located in Texas for a cash contribution of $31 million.
In 2007, we entered into contract negotiations for the purchase of an equity interest in a hospitality venture, which would ultimately acquire a hotel property in Waikiki, Hawaii. We placed a nonrefundable deposit of $9 million to secure the purchase of the property. In addition, we incurred $3 million of transaction costs. Due to uncertainty surrounding the transaction, we reserved the full amount of the deposit and expensed the transaction costs. The charges related to this equity method investment were included in equity earnings from unconsolidated hospitality ventures during the year ended December 31, 2007. In July 2008, we paid $7 million for a 9.99% equity interest in the acquired hotel property in Waikiki, Hawaii. The hotel acquisition was financed from the equity interests in the venture, a third party mezzanine loan, as well as a senior loan from us for $278 million, which has been recorded as a note receivable (see Note 7) on our consolidated balance sheets. The senior loan matures in July 2010 with three, one-year options to extend through 2013 and earns interest at a 30-day London InterBank Offered Rate (“LIBOR”) plus 3.8%. As a result of the transactions in July 2008, we reversed the previously recorded reserve on the deposit and received reimbursement of the aforementioned transaction costs.
During 2009, 2008 and 2007 we recorded $14 million, $19 million and $0 in total impairment charges in equity earnings (losses) from unconsolidated hospitality ventures. In connection with the current economic downturn and certain other factors, we identified certain triggering events relative to our hospitality venture investments and as a result, reassessed the expected future cash flows of these ventures. In connection with this assessment, we determined that we had an other than temporary impairment for two of our hospitality ventures and during 2009, we recorded $11 million of impairment charges due to the carrying amount of the assets exceeding the fair value as calculated using discounted operating cash flows and a determination that the decline was other than temporary. These impairments related to interests in hospitality venture properties. In 2009 and 2008, we reviewed our vacation ownership projects held through equity method investments for potential impairment. This review was prompted by the current economic downturn, the related tightening of mortgage financing availability, and the resulting decrease in the pace of sales contracts written for our vacation ownership projects. We estimated the current fair value of these investments based on discounted future cash flow projections, which reflected decreases in annual sales pace and/or price. Based on the resulting fair value estimates, we recorded impairment charges for one vacation ownership equity method investment of $3 million in 2009 and for three vacation ownership equity method investments of $19 million in 2008. These impairment charges are included in equity earnings (losses) from unconsolidated hospitality ventures.
F-15
We have interests in certain non-hospitality related real estate investment companies from which we received $21 million, $0 and $14 million during 2009, 2008 and 2007, respectively, which are included in other income (loss), net in our consolidated statements of income (loss).
During the years ended December 31, 2009, 2008 and 2007, we recorded $1 million, $62 million and $6 million, respectively, of preferred returns and other returns of capital, which are included in other income (loss), net in our consolidated statements of income (loss), related to distributions from three privately held investment entities, which invest in life science technology companies and are managed by an affiliate. On January 24, 2008, we received distributions of $184 million from these investments, representing all of the preferred returns and return of capital of $122 million. We do not expect material distributions from these investments in the future.
During the years ended December 31, 2009, 2008 and 2007, we recognized as income total distributions of $0, $2 million and $62 million, respectively, from our investment in funds that owned Extended Stay America and the Homestead Studio Suites, primarily as a result of the sale of those businesses. Our investment was accounted for under the cost method, and these distributions are included in other income (loss), net in our consolidated statements of income (loss).
| 4. | OTHER ASSETS |
Other assets primarily consist of marketable securities and deferred financing charges. Marketable securities are primarily held for the Gold Passport Fund (see Note 2) and to fund certain deferred compensation plans (see Note 14).
Marketable Securities—At December 31, 2009 and 2008, total marketable securities carried at fair value and included in the consolidated balance sheets were as follows:
| December 31, 2009 |
December 31, 2008 |
|||||||
| Marketable securities held by the Gold Passport Fund |
$ | 270 | $ | 266 | ||||
| Marketable securities held to fund deferred compensation plans |
192 | 163 | ||||||
| Other marketable securities |
25 | 15 | ||||||
| Total marketable securities |
487 | 444 | ||||||
| Less current portion of marketable securities included in prepaids and other assets |
(51 | ) | (28 | ) | ||||
| Marketable securities included in other assets |
$ | 436 | $ | 416 | ||||
Included in net gains (losses) and interest income from marketable securities held to fund operating programs in the consolidated statements of income (loss) are $4 million, $2 million and $5 million of realized and unrealized (losses) gains and interest income, net related to marketable securities held by the Gold Passport Fund for the years ended December 31, 2009, 2008, and 2007, respectively. Also included are $25 million, $(38) million, and $10 million of net realized and unrealized gains (losses) related to marketable securities held to fund deferred compensation plans for the years ended December 31, 2009, 2008, and 2007, respectively. Gains (losses) on other marketable securities of $10 million, $(37) million and $0 for the years ended December 31, 2009, 2008 and 2007, respectively are included in other income (loss), net (see Note 2).
F-16
| 5. | FAIR VALUE MEASUREMENT |
Fair value is defined as the price that would be received to sell an asset or paid to transfer a liability in an orderly transaction between market participants at the measurement date (an exit price). GAAP establishes a valuation hierarchy for prioritizing the inputs and the hierarchy places greater emphasis on the use of observable market inputs and less emphasis on unobservable inputs. When determining fair value, an entity is required to maximize the use of observable inputs and minimize the use of unobservable inputs. The three levels of the hierarchy are as follows:
Level One— Fair values based on unadjusted quoted prices in active markets for identical assets and liabilities;
Level Two— Fair values based on quoted market prices for similar assets and liabilities in active markets, quoted prices in inactive markets for identical assets and liabilities, and inputs other than quoted market prices that are observable for the asset or liability;
Level Three— Fair values based on inputs that cannot be corroborated by observable market data and reflect the use of significant management judgment. Valuation techniques could include the use of discounted cash flow models and similar techniques.
We have various financial instruments that are measured at fair value including certain marketable securities and derivatives instruments. We currently do not have non-financial assets or non-financial liabilities that are required to be measured at fair value on a recurring basis.
We utilize the market approach and income approach for valuing our financial instruments. The market approach utilizes prices and information generated by market transactions involving identical or similar assets and liabilities and the income approach uses valuation techniques to convert future amounts (for example, cash flows or earnings) to a single present amount (discounted). For instances in which the inputs used to measure fair value fall into different levels of the fair value hierarchy, the fair value measurement has been determined based on the lowest level input that is significant to the fair value measurement in its entirety. Our assessment of the significance of a particular input to the fair value measurement requires judgment and may affect the classification of fair value assets and liabilities within the fair value hierarchy.
As of December 31, 2009 and 2008, we had the following financial assets and liabilities measured at fair value on a recurring basis:
| December 31, 2009 |
Quoted Prices
in Active Markets for Identical Assets (Level 1) |
Significant Other Observable Inputs (Level 2) |
Significant Unobservable Inputs (Level 3) | |||||||||||
| Marketable securities included in other current and long-term assets |
||||||||||||||
| Mutual funds |
$ | 194 | $ | 194 | $ | — | $ | — | ||||||
| Equity securities |
23 | 23 | ||||||||||||
| U.S. government obligations |
83 | — | 83 | — | ||||||||||
| U.S. government agencies |
56 | — | 56 | — | ||||||||||
| Corporate debt securities |
87 | — | 87 | — | ||||||||||
| Mortgage-backed securities |
23 | — | 21 | 2 | ||||||||||
| Asset-backed securities |
18 | — | 18 | — | ||||||||||
| Other |
3 | — | 3 | — | ||||||||||
| Interest bearing money market funds recorded in cash and cash equivalents |
1,140 | 1,140 | — | — | ||||||||||
| Derivative instruments |
||||||||||||||
| Interest rate swaps |
(1 | ) | — | (1 | ) | — | ||||||||
| Foreign currency forward contracts |
6 | — | 6 | — | ||||||||||
F-17
| December 31, 2008 |
Quoted Prices in Active Markets for Identical Assets (Level 1) |
Significant Other Observable Inputs (Level 2) |
Significant Unobservable Inputs (Level 3) | |||||||||||
| Marketable securities included in other current and long-term assets |
||||||||||||||
| Mutual funds |
$ | 163 | $ | 163 | $ | — | $ | — | ||||||
| Equity securities |
15 | 15 | — | |||||||||||
| U.S. government obligations |
88 | — | 88 | — | ||||||||||
| U.S. government agencies |
67 | — | 67 | — | ||||||||||
| Corporate debt securities |
65 | — | 65 | — | ||||||||||
| Mortgage-backed securities |
26 | — | 26 | — | ||||||||||
| Asset-backed securities |
18 | — | 18 | — | ||||||||||
| Other |
2 | — | 2 | — | ||||||||||
| Interest bearing money market funds recorded in cash and cash equivalents |
157 | 157 | — | — | ||||||||||
| Derivative instruments |
||||||||||||||
| Interest rate swaps |
(11 | ) | — | (11 | ) | — | ||||||||
| Foreign currency forward contracts |
(9 | ) | — | (9 | ) | — | ||||||||
Our portfolio of marketable securities consists of various types of U.S. Treasury securities, mutual funds, common stock, preferred stock, and fixed income securities, including government and corporate bonds. The fair value of our mutual funds were classified as level one as they trade with sufficient frequency and volume to enable us to obtain pricing information on an ongoing basis. The remaining securities, except for certain mortgage backed securities, were classified as level two due to the use and weighting of multiple market inputs being considered in the final price of the security. Market inputs include quoted market prices from active markets for identical securities, quoted market prices for identical securities in inactive markets, and quoted market prices in active and inactive markets for similar securities. See Note 4 for further details on our marketable securities.
Due to limited observability of market data and limited activity during the year ended December 31, 2009, we classified the fair value of certain of our mortgage-backed securities as Level Three. However, these securities are held within an investment-grade portfolio with many of these securities having a credit rating of AAA/Aaa. The following table summarizes the changes in fair value of our Level Three securities for the year ended December 31, 2009:
| Mortgage-Backed Securities |
||||
| Beginning Balance—January 1, 2009 |
$ | — | ||
| Transfers into (out of) Level 3 |
2 | |||
| Purchases, issuances and settlements |
(1 | ) | ||
| Total gains (losses) (realized or unrealized) |
1 | |||
| Ending Balance—December 31, 2009 |
$ | 2 | ||
| The amount of total gains (losses) for the period included in net gains due to the change in unrealized gains or losses relating to assets still held at the reporting date: |
$ | 1 | ||
We invest a portion of our cash balance into short-term interest bearing money market funds that have a maturity of less than ninety days. Consequently, the balances are recorded in cash and cash equivalents. The funds are held with open-ended registered investment companies and the fair value of the funds are classified as Level One as we are able to obtain market available pricing information on an ongoing basis.
F-18
Our derivative instruments are foreign currency exchange rate instruments and interest rate swaps. The instruments are valued using an income approach with factors such as interest rates and yield curves, which represent market observable inputs and are generally classified as Level Two. Credit valuation adjustments may be made to ensure that derivatives are recorded at fair value. These adjustments include amounts to reflect counterparty credit quality and our nonperformance risk. As of December 31, 2009, the credit valuation adjustments are not material. See Note 12 for further details on our derivative instruments.
| 6. | PROPERTY AND EQUIPMENT |
Property and equipment at cost as of December 31, 2009 and 2008, consist of the following:
| December 31, 2009 |
December 31, 2008 |
|||||||
| Land |
$ | 562 | $ | 560 | ||||
| Buildings |
3,331 | 3,158 | ||||||
| Leasehold improvements |
263 | 234 | ||||||
| Furniture, equipment and computers |
1,125 | 1,057 | ||||||
| Construction in progress |
246 | 202 | ||||||
| 5,527 | 5,211 | |||||||
| Less accumulated depreciation |
(1,922 | ) | (1,716 | ) | ||||
| Total |
$ | 3,605 | $ | 3,495 | ||||
Depreciation expense from continuing operations was $255 million, $233 million, and $201 million, for the years ended December 31, 2009, 2008, and 2007, respectively. The net book value of capital leased assets at December 31, 2009 and 2008, is $201 million and $242 million, respectively, which is net of accumulated depreciation of $31 million and $17 million, respectively. During 2009, we transferred $30 million in capital lease assets to buildings and furniture, equipment and computers after satisfying our commitment to spend $30 million on improvements to the Hyatt Regency Grand Cypress and placing those assets into service, see Note 11. Interest capitalized as a cost of property and equipment totaled $13 million, $16 million and $15 million for the years ended December 31, 2009, 2008, and 2007, respectively, and is recorded net in interest expense. During 2009 we recorded a $3 million charge to asset impairments in the consolidated statements of income (loss) reflecting the impairment of a building in our owned & leased hotel segment.
F-19
| 7. | NOTES RECEIVABLE |
Notes receivable at December 31, 2009 and 2008 are as follows:
| December 31, 2009 | December 31, 2008 | |||||||
| Mortgage loan receivable to provide acquisition financing to a hospitality venture investment in Hawaii, interest set at 30-day LIBOR + 3.8% due monthly, principal matures July 2010 (see below) |
$ | 278 | $ | 278 | ||||
| Vacation ownership mortgages receivable at various interest rates with varying payments through 2018 (see below) |
65 | 83 | ||||||
| Mortgage loans receivable from franchisees, interest rates between 5.5% and 7.5%, due 2011 and 2012 (see below) |
46 | 46 | ||||||
| Loans receviable from hotel developers, interest rates between 3.7% to 9.0% with various maturities through 2032 (see below) |
19 | 12 | ||||||
| Note receivable from a third party guarantor related to the operations of an Australian hotel, 6.6% interest, principal and interest payable as per agreement; amounts fully reserved |
17 | 13 | ||||||
| Note receivable from third party owned hotel in Poland, 6.82% effective interest, due quarterly, matures 2018; amounts fully reserved |
10 | 10 | ||||||
| Subscription receivable due annually through settlement |
— | 14 | ||||||
| Other |
34 | 23 | ||||||
| 469 | 479 | |||||||
| Less allowance for losses |
(74 | ) | (54 | ) | ||||
| Less current portion included in receivables |
(10 | ) | (15 | ) | ||||
| Total |
$ | 385 | $ | 410 | ||||
Mortgage Loan Receivable—On July 16, 2008, we provided financing to a subsidiary of W2007 Waikiki Holdings, LLC (W2007). W2007 is an unconsolidated hospitality venture, which is accounted for under the equity method (see Note 3), and was formed to acquire ownership of a hotel property in Hawaii. The loan is collateralized by the hotel property and there is a recorded mortgage consent by the ground lessors. The loan has a stated maturity date of July 2010 with three, one-year options to extend through 2013. We currently expect that the loan will be extended beyond 2010.
Vacation Ownership Mortgages Receivable—These receivables reflect the amounts due from our financing of vacation ownership interval sales. We carry mortgages receivable at amortized cost in current and long-term receivables. We recognize interest income as earned and provide an allowance for cancellations and defaults. As of December 31, 2009 and 2008, the allowance for such vacation ownership mortgages was $13 million and $16 million, respectively. As of December 31, 2009, the weighted-average interest rate on vacation ownership mortgages receivable was 14.1%. The adequacy of the allowance is determined by management through the analysis of several factors, such as current economic conditions and industry trends, defaults, past due aging, and historical write-offs of mortgages and contracts receivable. The allowance is maintained at a level believed adequate by management based on a periodic analysis of the mortgage portfolio.
F-20
Vacation ownership mortgages receivable held by us as of December 31, 2009, are scheduled to mature as follows:
| Year Ending December 31, |
Amount | |||
| 2010 |
7 | |||
| 2011 |
7 | |||
| 2012 |
8 | |||
| 2013 |
9 | |||
| 2014 |
9 | |||
| Thereafter |
25 | |||
| Total vacation ownership mortgages receivable |
65 | |||
| Less allowance |
(13 | ) | ||
| Net vacation ownership mortgages receivable |
$ | 52 | ||
Mortgages Receivable from Franchisees—These receivables reflect financing provided to certain franchisees for the renovations and conversion of certain franchised hotels. As of December 31, 2009, five mortgages have been provided to franchisees with a total loan commitment of $46 million, which have been fully funded. These mortgage receivables are collateralized by the underlying properties and all loans accrue interest at fixed rates ranging between 5.5% and 7.5%. We recorded a provision of $2 million in the year ended December 31, 2009 in other income (loss), net in the consolidated statements of income (loss) related to these mortgages based on our assessment of the future collectability of these loans of which $1 million was recorded as a partial impairment of one of the loans.
Mortgages receivable held by us as of December 31, 2009, are scheduled to mature as follows:
| Year Ending December 31, |
Amount | |||
| 2010 |
$ | 1 | ||
| 2011 |
28 | |||
| 2012 |
17 | |||
| 2013 |
— | |||
| 2014 |
— | |||
| Thereafter |
— | |||
| Total mortgages receivable |
46 | |||
| Less allowance |
(1 | ) | ||
| Net mortgages receivable |
$ | 45 | ||
Loans Receivable from Hotel Developers – From time to time, we provide financing to owners or developers of hotels that we manage. These loans have stated maturities and interest rates. The repayment terms vary and may be dependent on the future cash flows of the hotel after opening. We record interest income from these loans in other income (loss), net in the consolidated statements of income (loss). We recorded provisions of $7 million, $0 and $61 million in 2009, 2008 and 2007, respectively, based on the economic environment and our assessment of the future collectability of these loans. As of December 31, 2009, our net loans receivable from developers was $11 million after taking into consideration the loan provisions.
The provision for $61 million in 2007 related to a mezzanine loan (“Mezzanine Loan”) the Company provided on December 30, 2005, to Cosmo Mezz Borrower One LLC (“Cosmo”) in connection with the development of a hotel in Las Vegas. During December 2007, the entity that owned the hotel property defaulted on bank loans, which triggered a default on the Mezzanine Loan. Based on our assessment of the potential outcome, the Company recorded an allowance for the principal and interest receivable of $61 million, which was recorded in other income (loss), net in the consolidated statements of income for the year ended December 31, 2007. In the fourth quarter of 2008, the loan was fully written off.
F-21
Fair Value— We estimated the fair value of notes receivable to approximate $402 million and $413 million as of December 31, 2009 and December 31, 2008, respectively. We estimated the fair value of notes receivables using discounted cash flow analyses based on current market inputs for similar types of arrangements. The primary sensitivity in these calculations is based on the selection of appropriate interest and discount rates. Fluctuations in these assumptions will result in different estimates of fair value.
| 8. | ACQUISITIONS, DISPOSITIONS, AND DISCONTINUED OPERATIONS |
Acquisitions—We continually assesses strategic acquisitions to complement our current business. Assets acquired and liabilities assumed in business combinations were recorded on our consolidated balance sheets as of the respective acquisition dates based upon their estimated fair values at such dates. The results of operations of businesses acquired by us have been included in the consolidated statements of income (loss) since their respective dates of acquisition. In certain circumstances, the purchase price allocations are based upon preliminary estimates and assumptions. Accordingly, the allocations are subject to revision when we receive final information, including appraisals and other analyses. There were no contingent payments, options, or commitments specified in any of the following acquisition agreements except as otherwise disclosed below.
Hyatt Regency Boston—On February 17, 2009, one of our subsidiaries acquired the assets of the Hyatt Regency Boston, a 498-room hotel, for a total purchase price of $110 million.
The following table summarizes the estimated fair value of the assets acquired and liabilities assumed in the owned and leased hotels segment for the acquisition. Total consideration paid was $110 million.
| Receivables |
$ | 2 | ||
| Other current assets |
1 | |||
| Property and equipment |
96 | |||
| Acquired lease rights |
14 | |||
| Fair value of assets acquired |
113 | |||
| Fair value of liabilities assumed |
(3 | ) | ||
| Total purchase price |
110 | |||
| Less: cash acquired |
1 | |||
| Net purchase price |
$ | 109 | ||
Revenues included in owned and leased hotels revenues for the period from the date of acquisition to December 31, 2009 were $30 million.
The Great Eastern Hotel Holding Company—We previously held a 50% interest in the Great Eastern Hotel Holding Company (GEHHC) and, accordingly, accounted for its investment as an unconsolidated hospitality venture under the equity method. GEHHC, through its wholly owned subsidiary, owns the Great Eastern Hotel in London, which was converted to the Andaz Liverpool Street hotel. On November 30, 2007, the Company purchased the remaining 50% interest in this hotel for approximately GBP 40.0 million ($83 million), including the assumption of debt of which was GBP 55 million ($114 million) related to our 50% acquired interest (see Note 10), and an interest rate swap (see Note 12). The total purchase price of our interest at November 30, 2007 was $135 million, which includes our prior 50% ownership interest. As a result of the acquisition of GEHHC, the Company also assumed a 50% ownership interest in the Great Eastern Hotel Properties Limited (GEHP). We evaluated GEHHC’s investment in GEHP and determined that the investment qualified as a VIE. In addition, we concluded that GEHHC was the primary beneficiary of GEHP and, accordingly, consolidated the investment effective November 31, 2007. On February 6, 2008, the Great Eastern Hotel Company purchased the remaining 50% interest in the GEHP for GBP 16 million ($31 million), which included the settlement of shareholder loans and noncontrolling interest. The final purchase price allocation was completed as of December 31, 2008. Both companies’ results are recorded in the owned and leased hotels segment. Goodwill assumed through the acquisition of GEHHC was fully impaired as of December 31, 2008.
F-22
Hyatt Regency San Antonio – On June 1, 2007, we acquired the Hyatt Regency San Antonio Riverwalk for $161 million in cash, the assumption of debt with a fair value of $67 million (see Note 10) and net working capital of $3 million.
Dispositions:
AmeriSuites Hotels—On June 13, 2007, we sold six AmeriSuites hotels for $43 million, net of closing costs, to unrelated third parties, resulting in a pre-tax gain of $7 million. The Company secured long-term franchise contracts from the purchasers to franchise these hotels as Hyatt Place hotels once conversion to Hyatt Place is completed. Accordingly, the pre-tax gain of $7 million has been recognized and the operating results and financial position of these hotels have not been classified as part of discontinued operations, but are recorded within the owned and leased hotels segment.
Hyatt Regency Woodfield—On June 9, 2007, the Hyatt Regency Woodfield was sold for $48 million, net of closing costs, to an unrelated third party, resulting in a pre-tax gain on the sale in the amount of $14 million. The hotel continues to be operated as a Hyatt-branded hotel and we will continue to manage the hotel under a short-term management contract. On termination of such management contract, a long-term franchise contract was secured. Accordingly, the pre-tax gain of $14 million has been recognized and the operating results and financial position of this hotel have not been classified as discontinued operations, but are recorded within the owned and leased hotels segment.
AmeriSuites Hotels—On May 2, 2007, we sold an AmeriSuites hotel for $6 million, net of closing costs, to an unrelated third party, resulting in an immaterial pre-tax gain. We secured a long-term franchise contract from the purchaser to franchise the hotel as a Hyatt Place hotel. Accordingly, the immaterial pre-tax gain has been recognized and the operating results and financial position of this hotel have not been classified as part of discontinued operations, but are recorded within the owned and leased hotels segment.
Discontinued Operations—The operating results, assets, and liabilities of the following businesses have been reported separately by our as discontinued operations in the consolidated balance sheets and consolidated statements of income (loss). We do not have any continuing involvement in these operations.
2008 Transactions:
Hawthorne Suites—On August 18, 2008, we sold the property known as Hawthorne Suites Orlando for $8 million, to an unrelated third party, resulting in a pre-tax gain of $4 million.
US Franchise Systems—On July 18, 2008, we sold U.S. Franchise Systems, Inc. (“USFS”), our wholly owned subsidiary, to an unaffiliated third party for $131 million. We recorded a pre-tax gain of $78 million from the sale.
2007 Transactions:
AmeriSuites Hotel—On May 2, 2007, we sold an AmeriSuites hotel for $8 million to an unrelated third party. The Company recorded a pre-tax gain of $3 million from the sale.
Revenues for all discontinued operations for the years ended December 31, 2009, 2008 and 2007 were $0, $13 million and $32 million, respectively.
As a result of certain of the above-mentioned dispositions, we have agreed to provide indemnifications to third-party purchasers for certain liabilities incurred prior to sale and for breach of certain representations and warranties made during the sales process, such as representations of valid title, authority, and environmental issues that may not be limited by a contractual monetary amount. These indemnification agreements survive until the applicable statutes of limitation expire, or until the agreed upon contract terms expire. The assets and liabilities related to discontinued operations at December 31, 2009 and 2008 were immaterial.
F-23
| 9. | GOODWILL AND INTANGIBLE ASSETS |
We review the carrying value of all our goodwill by comparing the carrying value of our reporting units to their fair values in a two-step process. We define a reporting unit at the individual property or business level. We are required to perform this comparison at least annually or more frequently if circumstances indicate that a possible impairment exists. When determining fair value in step one, we utilize internally developed discounted future cash flow models, third party appraisals and, if appropriate, current estimated net sales proceeds from pending offers. Under the discounted cash flow approach we utilize various assumptions, including projections of revenues based on assumed long-term growth rates, estimated costs and appropriate discount rates based on the weighted-average cost of capital. The principal factors used in the discounted cash flow analysis requiring judgment are the projected future operating cash flow, the weighted-average cost of capital and the terminal value growth rate assumptions. The weighted-average cost of capital takes into account the relative weights of each component of our consolidated capital structure (equity and long-term debt). Our estimates of long-term growth and costs are based on historical data, various internal estimates and a variety of external sources, and are developed as part of our routine, long-term planning process. We then compare the estimated fair value to our carrying value. If the carrying value is in excess of the fair value, we must determine our implied fair value of goodwill to measure if any impairment charge is necessary. The determination of our implied fair value requires the allocation of the reporting unit’s estimated fair value to the individual assets and liabilities of the reporting unit as if we had completed a business combination. We perform the allocation based on our knowledge of the reporting unit, the market in which they operate, and our overall knowledge of the hospitality industry.
During the fourth quarters of 2009, 2008 and 2007, we performed our annual impairment review of goodwill. These reviews resulted in impairment charges of $7 million and $86 million, respectively, for the years ended December 31, 2009 and 2008 related to the owned and leased hotel segment. These charges are included in asset impairments in our consolidated statements of income (loss). The goodwill impairment charge recognized in 2009 related to one hotel. The 2008 goodwill impairment charges related to the Great Eastern Hotel Holding Company’s British Pounds 53 million ($79 million) of goodwill and one other hotel. It was determined that the forecasted future earnings and cash flows of these hotels no longer supported the carrying value of goodwill because of forecasted deterioration in revenues from these hotels. There were no goodwill impairments for the year ended December 31, 2007.
F-24
The following is a summary of changes in the carrying amount of goodwill for the years ended December 31, 2009 and 2008:
| Owned and Leased Hotels |
Management and Franchising - North America |
Management and Franchising - International |
Other | Total | |||||||||||||
| Balance as of January 1, 2008 |
|||||||||||||||||
| Goodwill |
$ | 166 | $ | 33 | $ | — | $ | 4 | $ | 203 | |||||||
| Accumulated impairment losses |
— | — | — | — | — | ||||||||||||
| Goodwill, net |
166 | 33 | — | 4 | 203 | ||||||||||||
| Activity during the year |
|||||||||||||||||
| Goodwill acquired |
— | — | — | — | — | ||||||||||||
| Impairment losses |
(86 | ) | — | — | — | (86 | ) | ||||||||||
| Foreign exchange* |
3 | — | — | — | 3 | ||||||||||||
| Balance as of December 31, 2008 |
|||||||||||||||||
| Goodwill |
169 | 33 | — | 4 | 206 | ||||||||||||
| Accumulated impairment losses |
(86 | ) | — | — | — | (86 | ) | ||||||||||
| Goodwill, net |
$ | 83 | $ | 33 | $ | — | $ | 4 | $ | 120 | |||||||
| Activity during the year |
|||||||||||||||||
| Goodwill acquired |
— | — | — | — | — | ||||||||||||
| Impairment losses |
(7 | ) | — | — | — | (7 | ) | ||||||||||
| Foreign exchange |
— | — | — | — | — | ||||||||||||
| Balance as of December 31, 2009 |
|||||||||||||||||
| Goodwill |
169 | 33 | — | 4 | 206 | ||||||||||||
| Accumulated impairment losses |
(93 | ) | — | — | — | (93 | ) | ||||||||||
| Goodwill, net |
$ | 76 | $ | 33 | $ | — | $ | 4 | $ | 113 | |||||||
| * | Relates to foreign exchange translation adjustments of $0 and ($3) million in 2009 and 2008, respectively. |
Definite lived intangible assets primarily include acquired management and franchise contracts, contract acquisition costs, and acquired lease rights. Franchise contracts are amortized on a straight-line basis over their contract terms, which are typically 20 years. Contract acquisition costs are generally amortized on a straight-line basis over the life of the management contracts, which range from approximately 10 to 40 years. Acquired lease rights are amortized on a straight-line basis over the lease term. Definite lived intangibles are tested for impairment whenever indicators of impairment arise. During the years ended December 31, 2009, 2008 and 2007, we recorded impairment charges of $5 million, $0 and $0 respectively, which are included in asset impairments on the consolidated statements of income (loss) and relate to intangible assets with definite lives. The $5 million charge recorded in 2009 related to the full amount of an intangible asset relating to a management agreement covering certain select service hotels in our North American management and franchising segment. During the year ended December 31, 2009, we determined a triggering event occurred indicating a possible impairment of the respective definite lived intangible asset described above. After comparing the projected undiscounted cash flows derived from the respective management agreement to the carrying value of the intangible asset we determined that an impairment existed. The impairment charge represents the difference between the fair value and the carrying value of the intangible asset. The fair value was estimated by utilizing discounted projected cash flows.
F-25
The following is a summary of intangible assets at December 31, 2009 and 2008:
| December 31, 2009 | Weighted Average Useful Lives |
December 31, 2008 | ||||||||
| Acquired lease rights |
$ | 147 | 110 | $ | 122 | |||||
| Contract acquisition costs |
146 | 20 | 124 | |||||||
| Franchise intangibles |
51 | 22 | 56 | |||||||
| Brand intangibles |
11 | 7 | 11 | |||||||
| Other |
4 | 6 | 3 | |||||||
| 359 | 316 | |||||||||
| Accumulated amortization |
(75 | ) | (60 | ) | ||||||
| Intangibles, net |
$ | 284 | $ | 256 | ||||||
Amortization expense relating to intangible assets for the years ended December 31, 2009, 2008, and 2007, was $15 million, $15 million, and $12 million, respectively.
We estimate amortization expense for the definite lived intangibles for the years 2010 through 2014 to be:
| Years Ending December 31, |
|||
| 2010 |
$ | 14 | |
| 2011 |
14 | ||
| 2012 |
12 | ||
| 2013 |
10 | ||
| 2014 |
10 | ||
| 10. | DEBT |
Debt as of December 31, 2009 and 2008 consists of the following:
| December 31, 2009 | December 31, 2008 | |||||||
| Senior subordinated notes—5.84% |
$ | — | $ | 600 | ||||
| $250 million senior unsecured notes maturing in 2015—5.75% |
248 | — | ||||||
| $250 million senior unsecured notes maturing in 2019—6.875% |
249 | — | ||||||
| 9.26% twenty-five year mortgage |
57 | 61 | ||||||
| British pound denominated hotel loans |
— | 159 | ||||||
| Euro denominated hotel loans |
— | 72 | ||||||
| Fixed rate mortgage—6.0%, collateralized by related land, buildings and improvements, and other related assets, payable in interest only installments, maturing through 2011 |
45 | 45 | ||||||
| Fixed rate mortgage—10.07%, collateralized by related land, buildings and improvements, and other related assets, payable in monthly, principal and interest installments, maturing through 2011 |
33 | 37 | ||||||
| Revolving credit facility |
— | 30 | ||||||
| Other (various, maturing through 2010) |
5 | 5 | ||||||
| Long-term debt before capital lease obligations |
637 | 1,009 | ||||||
| Capital lease obligations |
215 | 238 | ||||||
| Total long-term debt |
852 | 1,247 | ||||||
| Less current maturities |
(12 | ) | (38 | ) | ||||
| Total long-term debt, net of current maturities |
$ | 840 | $ | 1,209 | ||||
F-26
Under existing agreements, maturities of debt for the next five years and thereafter are as follows:
| 2010 |
12 | ||
| 2011 |
132 | ||
| 2012 |
3 | ||
| 2013 |
3 | ||
| 2014 |
191 | ||
| Thereafter |
511 | ||
| Total |
$ | 852 | |
5.84% Senior Subordinated Notes—On August 28, 2007, we issued $500 million of 5.84% senior subordinated notes due 2013 (the “2013 Notes”) to an independent third party, combined with the Subscription Agreement that requires the purchaser to acquire a variable number of shares of our common stock at a future date, as specified in the Subscription Agreement, for $500 million in cash. On October 25, 2007, we issued $100 million of additional 2013 Notes to an independent third party, and that independent third party joined the Subscription Agreement, agreeing to acquire a variable number of shares of our common stock at a future date, as specified in the Subscription Agreement, for $100 million in cash. The purchasers’ obligations under the Subscription Agreements were secured by a pledge of the Notes to us.
On May 13 and May 18, 2009, HHC repurchased and cancelled the outstanding 2013 Notes for $600 million plus $88 million in make whole interest and early settlement premiums. Other income (loss), net includes these costs plus the write off of $5 million in deferred financing costs associated with these 2013 Notes. In addition, we received $11 million due to us under the Subscription Agreement. See Note 17 for details of this transaction.
Senior Unsecured Notes—On August 10, 2009, we issued $250 million of senior unsecured notes with a coupon rate of 5.750% due August 15, 2015, at a discount price of 99.460% (the “2015 Notes”), and $250 million of senior notes with a coupon rate of 6.875% due August 15, 2019, at a discount price of 99.864% (the “2019 Notes” and together with the 2015 Notes, the “Senior Notes”). We received proceeds of approximately $498 million on the settlement date of August 14, 2009. The proceeds were used to reduce outstanding hotel loans and for general purposes. Interest on the Senior Notes is payable semi-annually on February 15 and August 15, and commences February 15, 2010. We may redeem all or a portion of the Senior Notes at any time at our option at a discount rate of Treasury plus 50 basis points. In December 2009, the Company entered into three $25 million interest rate swap contracts, each of which expires on August 15, 2015 and effectively converts a total of $75 million of the 2015 Notes to floating rate debt based on three-month LIBOR plus a fixed rate component. At December 31, 2009, the fixed to floating interest rate swaps were recorded within other long-term liabilities for $1 million, with an offset by a fair value adjustment to the 2015 Notes of $1 million. Refer to Note 12 for additional information related to the interest rate swaps.
9.26% Twenty Five Year Mortgage—On June 1, 2007, we acquired the Hyatt Regency San Antonio Riverwalk, which included the assumption of debt with a fair value of $67 million at the date of acquisition. The debt has a stated interest rate of 9.26% and a maturity date of 2021. Additionally, we may repay the debt at the optional prepayment date of September 11, 2011, without penalty.
Hotel Loans in British Pounds (GBP)—On November 30, 2007, we purchased the remaining interest in the Great Eastern Hotel Holding Company, which included the assumption of debt. The total balance of debt at December 31, 2008 was GBP 110 million ($159 million) and included a primary loan and a subordinated loan, both with original maturity of March 13, 2011. The loans were secured by the pledged shares of its wholly owned subsidiary and shareholder loans. The interest rate applicable to the primary loan was calculated at GBP LIBOR, plus 0.9%. The interest rate applicable to the subordinated loan was calculated at GBP LIBOR, plus 4%. As part of the acquisition, we also assumed an interest rate swap that converted this variable rate exposure to a fixed rate. The swap contained a floating rate option, which exchanged the variable GBP LIBOR rates on the primary and
F-27
subordinated notes described in Note 12 to a fixed rate of 4.91%. In September 2009, we paid off both loans in the total amount of GBP 109 million ($177 million), plus accrued interest. In connection with the payoff of the underlying debt in September 2009, we settled the swap for GBP 6 million ($11 million).
Hotel Loans in Euro (EUR)—On February 28, 2006, we purchased the remaining interest in the Park Hyatt Paris Vendome, which included the assumption of debt. The balance of debt at December 31, 2008, was EUR 51 million ($72 million) and included a primary loan and a subordinated loan. The primary loan had an original maturity of April 14, 2017, and the interest rate applicable to this loan was calculated at EURIBOR, plus 1.25%. The subordinated loan had original maturity of November 30, 2011, and the interest rate applicable to this loan was calculated at EURIBOR, plus 0.7%. As part of the acquisition, we also assumed an interest rate swap that converted a portion of this variable rate exposure to a fixed rate under most EURIBOR scenarios. In August 2009, we paid off both loans in the total amount of EUR 51 million ($72 million), plus accrued interest. In connection with the payoff of the underlying debt in August 2009, we settled the swap for EUR 2 million ($2 million).
Revolving Credit Facility—On June 29, 2005, we entered into a five-year, $1.0 billion revolving credit facility with a group of banks, which was set to expire on June 29, 2010. In July 2009, we extended the maturity and increased the borrowing availability under this revolving credit facility to $1.5 billion. Under the terms of the extension, approximately $370 million of credit availability matures on June 29, 2010, with the remaining availability maturing on June 29, 2012. Interest rates on outstanding borrowings are either LIBOR-based or based on an alternate base rate, with margins in each case based on our credit rating, and includes a facility fee. As of December 31, 2009, the applicable rate for a 30-day borrowing would have been LIBOR (subject to a floor of 1%) plus 2.5%, or 3.5%, inclusive of the facility fee, for banks extending their maturity to June 29, 2012, and LIBOR plus 0.5%, or 0.731%, inclusive of the facility fee, for banks with maturity to June 29, 2010. There was an outstanding balance of $0 and $30 million on this credit facility at December 31, 2009 and 2008, respectively. At December 31, 2009 and 2008, we had entered into various letter of credit agreements for $79 million and $89 million, respectively, which reduced its available capacity under this revolving credit facility. The available line of credit on our revolving credit facility at December 31, 2009 was $1.4 billion.
The Company also has a total of $12 million and $21 million of letters of credit issued through additional banks as of December 31, 2009 and 2008, respectively.
Certain of the long-term debt agreements and the revolving credit facility contain financial covenants requiring that certain financial measures be met such as not exceeding a maximum ratio of debt to earnings before interest, tax, depreciation and amortization (EBITDA), not to fall below a minimum ratio of EBITDA to interest expense, or adherence to a maximum secured debt to net property equipment ratio. We are in compliance with all covenants at December 31, 2009.
Fair Value—We estimated the fair value of long-term debt excluding capital lease obligations at approximately $614 million and $825 million as of December 31, 2009 and 2008, respectively. We estimated the fair value of our senior unsecured notes based on observable market data. We estimated the fair value of our mortgages, notes payable and other long-term debt instruments using discounted cash flow analysis based on current market inputs for similar types of arrangements. The primary sensitivity in these calculations is based on the selection of appropriate discount rates. Fluctuations in these assumptions will result in different estimates of fair value.
| 11. | LEASES |
We lease hotels and equipment under a combination of capital and operating leases, which generally require us to pay taxes, maintenance, and insurance. Most of the leases contain renewal options, which enable us to retain use of the facilities in desirable operating areas.
F-28
The operating leases for the majority of our leased hotels call for the calculation of rental payments to be based on a percentage of the operating profit of the hotel, as defined by contract. As a result, future lease payments related to these leases are contingent upon operating results and are not included in the table below.
The future minimum lease payments due in each of the next five years and thereafter are as follows:
| Years Ending December 31, |
Operating Leases |
Capital Leases |
|||||
| 2010 |
$ | 33 | $ | 17 | |||
| 2011 |
29 | 17 | |||||
| 2012 |
26 | 16 | |||||
| 2013 |
25 | 16 | |||||
| 2014 |
24 | 197 | |||||
| Thereafter |
263 | 16 | |||||
| Total minimum lease payments |
$ | 400 | $ | 279 | |||
| Less amount representing interest |
(64 | ) | |||||
| Present value of minimum lease payments |
$ | 215 | |||||
Hyatt Regency Grand Cypress—On April 9, 2007, we signed a 30-year lease agreement with the owners of the Hyatt Regency Grand Cypress to lease the hotel, including the land, as well as a parcel of land adjacent to the hotel. This lease agreement includes an option, at our discretion, to purchase the hotel, including the land, and the adjacent parcel of land for $200 million in the eighth lease year or in the tenth lease year for $220 million or in the fifteenth lease year for $255 million. Separately, the lease agreement includes an option, at our discretion, to purchase the land adjacent to the hotel for $10 million at any time through the fifteenth lease year, which would reduce the option price of the hotel and land accordingly. On August 28, 2007, we exercised this option and purchased the adjacent land. This lease qualifies as a capital lease, and accordingly, we have consolidated the operating results of the hotel as of April 9, 2007. The leased assets are included in property and equipment, net, in the amount of $187 million. The lease agreement included a commitment to spend $30 million on improvements to the property within the first five years, which has been satisfied. Total minimum lease payments were calculated over the seven years of the lease term assuming that we will exercise the option to purchase the hotel and land in the eighth year. We are responsible for all operating costs related to the property, including insurance, maintenance, and taxes.
Hyatt Center—We lease our corporate office space at the Hyatt Center in Chicago, Illinois, from a related party. Under our master lease for Hyatt Center, we have entered into sublease agreements with certain related parties. The total minimum rentals to be received in the future under these noncancelable operating subleases as of December 31, 2009, are $43 million through 2020.
A summary of rent expense from continuing operations for all operating leases is as follows:
| 2009 | 2008 | 2007 | |||||||
| Minimum rentals |
$ | 29 | $ | 23 | $ | 22 | |||
| Contingent rentals |
29 | 56 | 45 | ||||||
| Total |
$ | 58 | $ | 79 | $ | 67 | |||
F-29
The Company leases retail space at its owned hotel locations under operating leases. The future minimum lease receipts scheduled to be received in each of the next five years and thereafter are as follows:
| Years Ending December 31, |
Amount | ||
| 2010 |
$ | 24 | |
| 2011 |
22 | ||
| 2012 |
21 | ||
| 2013 |
20 | ||
| 2014 |
12 | ||
| Thereafter |
34 | ||
| Total minimum lease receipts |
$ | 133 | |
| 12. | DERIVATIVE INSTRUMENTS |
It is our policy that derivative transactions are executed only to manage exposures arising in the normal course of business and not for the purpose of creating speculative positions or trading. As a result of the use of derivative instruments, we are exposed to the risk that counterparties to derivative contracts will fail to meet their contractual obligations. To mitigate the counterparty credit risk, we have a policy of only entering into contracts with carefully selected major financial institutions based upon their credit rating and other factors. Our derivative instruments do not contain credit-risk related contingent features.
All derivatives are recognized on the balance sheet at fair value. On the date the derivative contract is entered, we designate the derivative as one of the following: a hedge of a forecasted transaction or the variability of cash flows to be paid (cash flow hedge), a hedge of the fair value of a recognized asset or liability (fair value hedge), or an undesignated hedge instrument. Changes in the fair value of a derivative that is qualified, designated and highly effective as a cash flow hedge are recorded in other comprehensive income on the balance sheet until they are reclassified into earnings in the same period or periods during which the hedged transaction affects earnings. Changes in the fair value of a derivative that is qualified, designated and highly effective as a fair value hedge, along with the gain or loss on the hedged liability that is attributable to the hedged risk are recorded in current earnings. Changes in the fair value of undesignated derivative instruments and the ineffective portion of designated derivative instruments are reported in current period earnings. Cash flows from designated derivative financial instruments are classified within the same category as the item being hedged on the statement of cash flows. Cash flows from undesignated derivative financial instruments are included in the operating category on the statements of cash flows.
At the designation date, we formally document all relationships between hedging activities, including the risk management objective and strategy for undertaking various hedge transactions. This process includes matching all derivatives that are designated as cash flow hedges to specific forecasted transactions and linking all derivatives designated as fair value hedges to specific assets and liabilities on the balance sheet.
We also formally assess both at the hedge’s inception and on an ongoing basis, whether the derivatives that are used in hedging transactions are highly effective in offsetting changes in fair value or cash flow of hedged items. We discontinue hedge accounting prospectively, when the derivative is not highly effective as a hedge, the underlying hedged transaction is no longer probable, or the hedging instrument expires, is sold, terminated, or exercised.
Interest Rate Swap Agreements—In the normal course of business, we are exposed to the impact of interest rate changes due to our borrowing activities. Our objective is to manage the risk of interest rate changes on the results of operations, cash flows, and the market value of our debt by creating an appropriate balance between our fixed and floating-rate debt. Interest rate derivative transactions, including interest rate swaps, are entered into to maintain a level of exposure to interest rates which the Company deems acceptable.
F-30
We use interest rate swaps in our hedging programs. On November 30, 2007, we assumed debt as part of our purchase of the remaining interest in the Great Eastern Hotel Holding Company. The debt included a primary loan and a subordinated loan, totaling GBP 109 million ($177 million), both maturing on March 13, 2011. The primary loan bore interest at GBP LIBOR, plus 0.9%. The subordinated loan bore interest at GBP LIBOR, plus 4.0%. As part of the acquisition, the Company also assumed an interest rate swap that converted this variable rate exposure to a fixed rate. This contract protected against the risk that the eventual cash flows resulting from such transactions would be adversely affected by changes in interest rates. The swap exchanged the variable GBP LIBOR rates on the primary and subordinated notes described in Note 10 for a fixed rate of 4.91%. The swap was designated as a cash flow hedge in November 2008 and was highly effective in offsetting fluctuations in GBP LIBOR rates until the related debt was paid off in full in September 2009. Changes in the fair value relating to the effective portion of the swap were recorded in other comprehensive loss and the corresponding fair value payables were included in other long-term liabilities in our consolidated balance sheet. In connection with the payoff of the related debt, the Company settled the interest rate swap. As a result of this settlement, we immediately reclassified a loss of $3 million ($2 million, net of tax) from accumulated other comprehensive loss to interest expense on the consolidated statements of income (loss) as the original forecasted transaction will not occur. Prior to the hedge designation date, the swap was marked to market through earnings.
On August 10, 2009, we issued the 2015 Notes in the amount of $250 million. Interest on these notes is payable semi-annually on February 15 and August 15, and commences February 15, 2010. We may redeem all or a portion of the 2015 Notes at any time at our option at a discount rate of Treasury plus 50 basis points. In December 2009, we entered into three $25 million interest rate swap contracts, each of which expires on August 15, 2015 and effectively converts a total of $75 million of the 2015 Notes to floating rate debt based on three-month LIBOR plus a fixed rate component. The fixed rate component of each swap varies by contract, ranging from 2.68% to 2.9675%. The fixed to floating interest rate swaps were designated as a fair value hedge as their objective is to protect the 2015 Notes against changes in fair value due to changes in the three-month LIBOR interest rate. The swaps were designated as hedges at inception and at December 31, 2009 were highly effective in offsetting fluctuations in the fair value of the senior unsecured notes. At December 31, 2009, the fixed to floating interest rate swaps were recorded within other long-term liabilities for $1 million, offset by a fair value adjustment to long-term debt of $1 million.
We had two other interest rate swaps that were not designated as hedges, and therefore have been marked-to-market each period through earnings. These derivatives were held as economic hedges to convert variable interest rate exposures to fixed rates. The balance sheet classification for the fair value of these interest rate swaps was to prepaids and other assets for unrealized gains and to other long-term liabilities for unrealized losses. In connection with the payoff of our Euro denominated loans in August 2009, we settled one of these swaps for $2 million. As a result of the settlement, we recognized an immaterial loss in other income (loss), net. The notional dollar amount of the remaining outstanding interest rate swap agreement at December 31, 2009 (in US dollars) is less than $1 million.
Foreign Currency Exchange Rate Instruments—We transact business in various foreign currencies and utilize foreign currency forward contracts to offset the risks associated with the effects of certain foreign currency exposures. Our strategy is to have increases or decreases in our foreign currency exposures offset by gains or losses on the foreign currency forward contracts to mitigate the risks and volatility associated with foreign currency transaction gains or losses. These foreign currency exposures typically arise from intercompany loans and other intercompany transactions. Our foreign currency forward contracts generally settle within 12 months. We do not use these forward contracts for trading purposes. We do not designate these forward contracts as hedging instruments. Accordingly, we record the fair value of these contracts as of the end of our reporting period to our consolidated balance sheet with changes in fair value recorded in our consolidated statement of income (loss). The balance sheet classification for the fair values of these forward contracts is to prepaids and other assets for unrealized gains and to accounts payable for unrealized losses. The statement of income (loss) classification for the fair values of these forward contracts is to other income (loss), net, for both realized and unrealized gains and losses.
F-31
The net U.S. dollar equivalent of the notional amount of the outstanding Pound Sterling, Euro, Korean Won, Swiss Franc and Japanese Yen forward contracts at December 31, 2009 is (in US dollars) $170 million, $90 million, $49 million, $(6) million and $3 million, respectively, with terms of less than one year.
Certain energy contracts at our hotel facilities include derivatives. However, we qualify and have elected the normal purchases or sales exemption for these derivatives.
The effects of derivative instruments on our consolidated financial statements were as follows as of December 31, 2009 and for the year the ended:
Fair Values of Derivative Instruments
| Asset Derivatives |
Liability Derivatives | |||||||||
| December 31, 2009 |
December 31, 2009 | |||||||||
| Balance Sheet Location |
Fair Value | Balance Sheet Location |
Fair Value | |||||||
| Derivatives designated as hedging instruments |
||||||||||
| Interest rate swaps |
Other long-term liabilities | $ | 1 | |||||||
| Total derivatives designated as hedging instruments under ASC 815 |
$ | — | $ | 1 | ||||||
| Derivatives not designated as hedging instruments |
||||||||||
| Foreign currency forward contracts |
Prepaids and other assets | $ | 8 | Account payables | $ | 2 | ||||
| Total derivatives not designated as hedging instruments under ASC 815 |
$ | 8 | $ | 2 | ||||||
| Total derivatives |
$ | 8 | $ | 3 | ||||||
Effect of Derivative Instruments on Income and Other Comprehensive Loss
| Location of Gain (Loss) | Gains (Losses) on Derivatives |
Gains (Losses) on Borrowings | |||||||
| Fair value hedges: |
|||||||||
| Interest rate swaps |
Other income | (loss), net* | $ | — | $ | — | |||
| Amount of Gain (Loss) Recongized in Accumulated Other Comprehensive Loss on Derivative (Effective Portion) |
Amount and Location of Gain (Loss) Reclassified from Accumulated Other Comprehensive Loss into Income (Effective Portion) |
Amount and Location of Gain (Loss) Recognized in Income on Derivative (Ineffective Portion and Amount Excluded from Effectiveness Testing) | |||||||||||
| Year Ended December 31, 2009 |
Year
Ended December 31, 2009 |
Year Ended December 31, 2009 | |||||||||||
| Cash flow hedges: |
|||||||||||||
| Interest rate swaps |
$ | — | $ | 3 | Interest expense | $ | — | Other income (loss), net* | |||||
F-32
| Amount and Location of Gain (Loss) Recognized in Income on Derivative | |||||
| Year Ended December 31, 2009 | |||||
| Derivatives not designated as hedges: |
|||||
| Foreign currency forward contracts |
$ | 4 | Other income (loss), net | ||
| * | For the year ended December 31, 2009 there was an immaterial gain recognized in income related to the ineffective portion of these hedges. No amounts were excluded from the assessment of hedge effectiveness for the year ended December 31, 2009. |
| 13. | EMPLOYEE BENEFIT PLANS |
Defined Benefit Plans—We sponsor supplemental executive retirement plans consisting of funded and unfunded defined benefit plans for certain executives. Retirement benefits are based primarily on the employees’ salary, as defined, and are payable upon achievement of certain service requirements as defined by the plans.
On October 31, 2008, we merged our foreign funded and domestic unfunded defined benefit plans for active participants into our deferred compensation plans. The merger was effected by contributing an amount based on the value of each active participant’s benefits based on services rendered to-date. As a result, for the year ended December 31, 2008, we recorded a net settlement charge of $21 million to selling, general and administrative expenses.
The following tables show the change in benefit obligation and the change in fair value of plan assets and the impact of the plan merger as of December 31, 2009 and 2008 (the measurement dates), for the unfunded U.S. plan and the funded foreign plan:
| Unfunded U.S. Plan | Funded Foreign Plan | ||||||||||||||
| 2009 | 2008 | 2009 | 2008 | ||||||||||||
| Change in benefit obligation: |
|||||||||||||||
| Benefit obligation—beginning of year |
$ | 17 | $ | 35 | $ | — | $ | 38 | |||||||
| Service cost |
— | 1 | — | — | |||||||||||
| Interest cost |
1 | 2 | — | 2 | |||||||||||
| Actuarial (gains) loss |
1 | 8 | — | 17 | |||||||||||
| Settlement payments |
— | (24 | ) | — | (36 | ) | |||||||||
| Curtailment (gain) |
— | (4 | ) | — | (19 | ) | |||||||||
| Benefits paid |
(1 | ) | (1 | ) | — | (2 | ) | ||||||||
| Benefit obligation—end of year |
$ | 18 | $ | 17 | $ | — | $ | — | |||||||
| Change in plan assets: |
|||||||||||||||
| Fair value of plan assets—beginning of year |
$ | — | $ | — | $ | — | $ | 11 | |||||||
| Actual return on plan assets |
— | — | — | (1 | ) | ||||||||||
| Benefits Paid |
— | — | — | (40 | ) | ||||||||||
| Employer contributions |
— | — | — | 30 | |||||||||||
| Fair value of plan assets—end of year |
$ | — | $ | — | $ | — | $ | — | |||||||
| Funded status at end of year |
$ | (18 | ) | $ | (17 | ) | $ | — | $ | — | |||||
| Accumulated benefit obligation |
$ | 18 | $ | 17 | $ | — | $ | — | |||||||
F-33
Amounts recognized in the consolidated balance sheets as of December 31, 2009 and 2008:
| Unfunded U.S. Plan | Funded Foreign Plan | |||||||||||||
| 2009 | 2008 | 2009 | 2008 | |||||||||||
| Accrued current benefit liability |
$ | (1 | ) | $ | (1 | ) | $ | — | $ | — | ||||
| Accrued long-term benefit liability |
(17 | ) | (16 | ) | — | — | ||||||||
| Funded status |
$ | (18 | ) | $ | (17 | ) | $ | — | $ | — | ||||
Amounts recognized in the accumulated other comprehensive loss of the domestic unfunded defined benefit plan at December 31, 2009 and 2008, consist entirely of unrecognized net losses of $6 million and $5 million, respectively. There were no amounts recognized in the accumulated other comprehensive loss of the foreign funded defined benefit plan at December 31, 2009 and 2008.
There are estimated to be immaterial amounts of unrecognized net losses or prior service costs that will be amortized into net periodic benefit cost over the next fiscal year on the domestic unfunded benefit plan at December 31, 2009 and 2008. There are no amounts of unrecognized net losses or prior service costs that will be amortized into net periodic benefit costs over the next fiscal year on the foreign funded defined benefit plan at December 31, 2009 and 2008.
The net periodic pension cost for the unfunded U.S. plan and the funded foreign plan for the three years ended December 31, 2009, 2008, and 2007, is as follows:
| Unfunded US Plan | Funded Foreign Plan | ||||||||||||||||||||
| 2009 | 2008 | 2007 | 2009 | 2008 | 2007 | ||||||||||||||||
| Service cost |
$ | — | $ | 1 | $ | 1 | $ | — | $ | — | $ | — | |||||||||
| Interest cost |
1 | 2 | 2 | — | 2 | 2 | |||||||||||||||
| Expected return on plan assets |
— | — | — | — | — | — | |||||||||||||||
| Amortization of transition obligation |
— | — | — | — | — | — | |||||||||||||||
| Amortization of prior service cost |
— | — | — | — | — | — | |||||||||||||||
| Amortization of net loss |
— | — | 1 | — | 1 | 3 | |||||||||||||||
| Reduction in benefit obligation |
— | — | — | — | — | — | |||||||||||||||
| Special termination benefits |
— | — | — | — | — | — | |||||||||||||||
| Net periodic pension cost |
$ | 1 | $ | 3 | $ | 4 | $ | — | $ | 3 | $ | 5 | |||||||||
| Settlement losses |
$ | — | $ | — | $ | — | $ | — | $ | 5 | $ | — | |||||||||
| Curtailment (gain) |
— | (4 | ) | — | — | (19 | ) | — | |||||||||||||
| Settlement loss related to plan merger |
— | 5 | — | — | 39 | — | |||||||||||||||
| Net pension cost |
$ | 1 | $ | 4 | $ | 4 | $ | — | $ | 28 | $ | 5 | |||||||||
| Other comprehensive loss (gain) loss—net of income tax |
$ | 1 | $ | 2 | $ | (3 | ) | $ | — | $ | (16 | ) | $ | 1 | |||||||
The weighted average assumptions used in the measurement of our benefit obligation as of December 31, 2009 and 2008 (the measurement dates), for the unfunded U.S. plan and the funded foreign plan are as follows:
| Unfunded US Plan | Funded Foreign Plan | |||||||||
| 2009 | 2008 | 2009 | 2008 | |||||||
| Discount rate |
5.60 | % | 6.25 | % | — | — | ||||
| Rate of compensation increase |
— | 6.25 | % | — | — | |||||
F-34
The weighted average assumptions used in the measurement of our net cost as of December 31, 2009 and 2008 (the measurement dates), for the unfunded U.S. plan and the funded foreign plan are as follows:
| Unfunded US Plan | Funded Foreign Plan | |||||||||||||||
| 2009 | 2008 | 2007 | 2009 | 2008 | 2007 | |||||||||||
| Discount rate |
6.25 | % | 6.35 | % | 5.80 | % | — | — | 5.60 | % | ||||||
| Rate of compensation increase |
— | 6.25 | % | 6.25 | % | — | — | 5.00 | % | |||||||
| Expected long-term rate of return on plan assets |
— | — | — | — | — | 6.10 | % | |||||||||
Our contributions for 2010 are expected to be $1 million for the unfunded U.S. plan. As of December 31, 2009, the benefits expected to be paid in each of the next five years, and in the aggregate for the five years thereafter, are disclosed below. The expected benefits are estimated based on the same assumptions used to measure our benefit obligation at the end of the year and include benefits attributable to estimated future employee service as follows:
| Year Ending December 31, |
Unfunded US Plan | ||
| 2010 |
$ | 1 | |
| 2011 |
2 | ||
| 2012 |
1 | ||
| 2013 |
1 | ||
| 2014 |
1 | ||
| 2015 - 2019 |
7 | ||
| Total |
$ | 13 | |
Defined Contribution Plans—We provide retirement benefits to certain qualified employees under the Retirement Savings Plan, the Field Retirement Plan, and other related plans. We record expenses related to the Retirement Savings Plan based on a percentage of qualified employee contributions on stipulated amounts; a substantial portion of these contributions are included in the “Other revenues from managed properties” and “Other costs from managed properties” lines in the consolidated statements of income (loss) as the costs of these programs are largely related to employees located at lodging properties managed by us and are therefore charged to the property owners. For the years ended December 31, 2009, 2008, and 2007 costs related to these contribution plans were $28 million, $30 million, and $28 million, respectively.
Deferred Compensation Plans—We provide nonqualified deferred compensation plans for certain employees. These plans are funded through contributions to rabbi trusts. Contributions and investment elections are determined by the employees. The Company also provides contributions according to a preapproved formula. A portion of these contributions relate to hotel property level employees, which are reimbursable to us and are included in the other revenues and costs from managed properties lines in the consolidated statements of income (loss). For the years ended December 31, 2009, 2008 and 2007, our contribution expense related to these compensation plans was $4 million, $4 million, and $4 million, respectively. As of December 31, 2009 and 2008, the plans are fully funded in rabbi trusts. The assets of the plans are invested in mutual funds, which are recorded in other noncurrent assets in the consolidated balance sheets (see Note 4). The related deferred compensation liability is recorded in other long-term liabilities (see Note 14). All investment earnings and contributions will be paid to the participating employees upon the earlier of either termination of employment or retirement pursuant to a designated payment date.
Deferred Incentive Compensation Plans—The deferred incentive compensation plans consist of funded and unfunded defined contribution plans for certain executives. Benefits are discretionary and are based primarily on achievement of certain operational goals and objectives. Participant benefits vest over time and are payable at either the later of retirement or upon termination of employment at age 55. All deferred incentive compensation amounts were issued in stock during the year ended December 31, 2009. For the years ended December 31, 2009, 2008, and 2007, costs related to these compensation plans were $2 million, $4 million, and $6 million, respectively.
F-35
| 14. | OTHER LONG-TERM LIABILITIES |
Other long-term liabilities at December 31, 2009 and 2008, consist of the following:
| December 31, 2009 | December 31, 2008 | |||||
| Hyatt Gold Passport Fund (see Note 2 and 4) |
$ | 243 | $ | 250 | ||
| Deferred compensation plans (see Note 13) |
192 | 163 | ||||
| Other accrued income taxes (see Note 15) |
128 | 91 | ||||
| Deferred incentive compensation plans (see Note 13) |
34 | 36 | ||||
| Deferred income taxes (see Note 15) |
30 | 31 | ||||
| Deferred gains on sale of hotel properties |
30 | 32 | ||||
| Defined benefit plans (see Note 13) |
17 | 16 | ||||
| Other |
106 | 46 | ||||
| Total |
$ | 780 | $ | 665 | ||
| 15. | INCOME TAXES |
Our tax provision includes federal, state, local, and foreign income taxes payable. The domestic and foreign components of income (loss) before income taxes for the three years ended December 31 are as follows:
| 2009 | 2008 | 2007 | ||||||||
| U.S. income (loss) before tax |
$ | (152 | ) | $ | 199 | $ | 333 | |||
| Foreign income before tax |
97 | 5 | 141 | |||||||
| Income (loss) before income taxes |
$ | (55 | ) | $ | 204 | $ | 474 | |||
The provision (benefit) for income taxes from continuing operations for the three years ended December 31 is comprised of the following:
| 2009 | 2008 | 2007 | ||||||||||
| Current: |
||||||||||||
| Federal |
$ | (122 | ) | $ | 45 | $ | 221 | |||||
| State |
2 | 7 | 44 | |||||||||
| Foreign |
37 | 32 | 43 | |||||||||
| Total Current |
$ | (83 | ) | $ | 84 | $ | 308 | |||||
| Deferred: |
||||||||||||
| Federal |
$ | 82 | $ | 11 | $ | (85 | ) | |||||
| State |
(3 | ) | 1 | (11 | ) | |||||||
| Foreign |
(6 | ) | (6 | ) | (4 | ) | ||||||
| Total Deferred |
$ | 73 | $ | 6 | $ | (100 | ) | |||||
| Total |
$ | (10 | ) | $ | 90 | $ | 208 | |||||
F-36
The following is a reconciliation of the statutory federal income tax rate to the effective tax rate from continuing operations reported in the financial statements:
| 2009 | 2008 | 2007 | |||||||
| Statutory U.S. federal income tax rate |
35.0 | % | 35.0 | % | 35.0 | % | |||
| State income taxes—net of federal tax benefit |
3.9 | 0.6 | 4.5 | ||||||
| Foreign and U.S. tax effects attributable to foreign operations |
61.0 | (4.3 | ) | (5.7 | ) | ||||
| Tax contingencies |
(19.2 | ) | 0.8 | 6.4 | |||||
| Change in valuation allowances |
(54.7 | ) | (0.5 | ) | 3.6 | ||||
| Nondeductible asset impairments |
— | 13.5 | — | ||||||
| General business credits |
3.6 | (0.8 | ) | (0.8 | ) | ||||
| Other |
(11.4 | ) | (0.3 | ) | 0.9 | ||||
| Effective income tax rate |
18.2 | % | 44.0 | % | 43.9 | % | |||
The mix of U.S. operating losses with earnings from our foreign-based operations significantly impacted the effective tax rate in 2009. In addition, the benefits from net operating losses in foreign jurisdictions were offset by increases in valuation allowances and unrecognized tax benefits during the year. For 2009, the Other amount includes approximately $4 million related to changes in deferred taxes.
The net change in valuation allowance between 2008 and 2007 primarily consists of a decrease in valuation allowance related to the settlement of an issue with the Internal Revenue Service (“IRS”) for $14 million partially offset by an increase in valuation allowance for foreign net operating losses of $9 million incurred in 2008. The other significant items affecting the tax rate in 2008 relate to the impairment of goodwill that is not deductible for tax purposes and a tax benefit resulting from a change in estimate from previously filed state returns.
F-37
The components of net deferred tax asset from continuing operations at December 31, 2009 and 2008 is comprised of the following:
| 2009 | 2008 | |||||||
| Deferred tax assets related to: |
||||||||
| Employee benefits |
$ | 127 | $ | 143 | ||||
| Foreign and state net operating losses |
107 | 68 | ||||||
| Nonconsolidated investments |
42 | 43 | ||||||
| Allowance for uncollectible assets |
31 | 28 | ||||||
| Intangibles |
25 | 23 | ||||||
| Future deductions pursuant to IRS settlement |
22 | 25 | ||||||
| Interest and state benefits |
20 | 21 | ||||||
| Unrealized investment losses |
4 | 8 | ||||||
| Other |
52 | 55 | ||||||
| Valuation allowance |
(100 | ) | (69 | ) | ||||
| Total deferred tax asset |
$ | 330 | $ | 345 | ||||
| Deferred tax liabilities related to: |
||||||||
| Installment sales |
$ | (23 | ) | $ | (22 | ) | ||
| Property and equipment |
(182 | ) | (116 | ) | ||||
| Nonconsolidated investments |
(24 | ) | (30 | ) | ||||
| Prepaid expenses |
(9 | ) | (8 | ) | ||||
| Other |
(25 | ) | (23 | ) | ||||
| Total deferred tax liability |
$ | (263 | ) | $ | (199 | ) | ||
| Net deferred tax asset |
$ | 67 | $ | 146 | ||||
| Recognized in the balance sheet as: |
||||||||
| Deferred tax assets—current |
$ | 23 | $ | 51 | ||||
| Deferred tax assets—noncurrent |
74 | 126 | ||||||
| Deferred tax liabilities—noncurrent |
(30 | ) | (31 | ) | ||||
| Total |
67 | 146 | ||||||
Deferred tax liabilities increased by $73 million as a result of a tax accounting method change that permits us to expense certain hotel renovation costs that were previously capitalized. Other significant changes include a decrease in deferred assets of $24 million for distributions made from deferred compensation plans and an increase for net operating losses that are primarily offset by valuation allowances.
We have evaluated the available evidence about future taxable income and other possible sources of realization of deferred tax assets. The valuation allowance reduces deferred tax assets to an amount that represents our best estimate of the amount of deferred tax assets that will be realized.
As of December 31, 2009, we have $107 million of state and foreign net operating losses. Some of these operating losses will begin to expire in 2010 and continue through 2029; however, a number of these operating losses have no expiration date and may be carried forward indefinitely. A valuation allowance of $91 million has been established for net operating losses, as we believe it is more likely than not that we will be unable to utilize these operating loss carry forwards. A valuation allowance has also been established against other foreign assets that are not expected to be realized.
As of December 31, 2009, we have determined that undistributed net earnings of $21 million of certain foreign subsidiaries would be indefinitely reinvested in operations outside the United States. These earnings could become subject to additional taxes if remitted as dividends, loaned to a U.S. affiliate, or if we sold our
F-38
interest in the affiliates; the resulting U.S. income tax liabilities could be offset, in whole or in part, by credits allowable for taxes paid to foreign jurisdictions. The actual tax costs would depend on the income tax laws and circumstances at the time of the realization events; determination of the potential net liability is not practicable due to the complexities of the hypothetical calculation. We continue to provide deferred taxes, as required, on the undistributed earnings of foreign subsidiaries and unconsolidated affiliates that are not indefinitely reinvested in operations outside the United States.
On January 1, 2007, the Company adopted accounting guidance which clarifies the accounting guidance for uncertainties in income taxes. As a result of the adoption, we provided for a $16 million increase in the liability for unrecognized tax benefits. Of this amount, $9 million was recorded as an adjustment to the opening balance of retained earnings. Total unrecognized tax benefits as of December 31, 2009 and 2008 were $83 million and $87 million respectively, of which $49 million and $62 million respectively, would impact the effective tax rate if recognized. It is reasonably possible that a reduction of up to $13 million of unrecognized tax benefits could occur within twelve months resulting from the resolution of audit examinations and the expiration of certain tax statutes.
A reconciliation of the beginning and ending amount of unrecognized tax benefits is as follows:
| 2009 | 2008 | 2007 | ||||||||||
| Unrecognized tax benefits—beginning balance |
$ | 87 | $ | 86 | $ | 71 | ||||||
| Total increases—current period tax positions |
5 | 3 | 5 | |||||||||
| Total increases—prior period tax positions |
5 | 13 | 18 | |||||||||
| Settlements |
(14 | ) | (15 | ) | (8 | ) | ||||||
| Lapse of statute of limitations |
— | — | — | |||||||||
| Unrecognized tax benefits—ending balance |
$ | 83 | $ | 87 | $ | 86 | ||||||
During 2009, we paid $9 million to the IRS to settle certain tax issues and related interest regarding the 2003 and 2004 examinations of AIC Holding Co., one of our subsidiaries. We also paid $11 million to H Group Holding, Inc. (the “Former Parent”) in accordance with a Tax Separation Agreement to settle tax issues and related interest due from IRS and State examinations that covered years 1980 through 2003.
During 2008, the IRS entered into a settlement agreement with the Former Parent that provided full concession for certain protested benefits related to the taxable years ended January 31, 2002 and 2003. The agreement also included the same benefits reported by Hyatt Corporation, a subsidiary of ours, and by us for taxable years after December 31, 2003. In connection with the resolution of these examinations, we reduced the liability for unrecognized tax benefits by $15 million and gross interest expense by $5 million.
In accordance with our accounting policy, we recognize accrued interest and penalties related to unrecognized tax benefits as a component of income tax expense. Total gross accrued interest and penalties were $65 million, $58 million and $50 million as of December 31, 2009, 2008 and 2007, respectively, of which $16 million, $8 million and $16 million was recognized as a component of income tax expense during the year ended December 31, 2009, 2008 and 2007, respectively.
Our 2006, 2007 and 2008 federal income tax returns are currently under IRS examination. The statute of limitations for the following federal income tax returns are still open: the Former Parent for the taxable years ended January 31, 2001 and 2003, and December 31, 2003 and 2004; Hyatt Corporation for the short-period ended December 31, 2004; AIC Holding Co. for the taxable years ended December 31, 2003 and 2004 and us for the taxable years ended December 31, 2004 and 2005. We have protested certain adjustments proposed by the IRS related to those taxable years, and the issues are currently under review by the Appeals.
F-39
We are under audit by various state and foreign tax authorities. State income tax returns are generally subject to examination for a period of three to five years after filing of the return. However, the state impact of any federal changes remains subject to examination by various states for a period generally of up to one year after formal notification to the states. The statute of limitations for the foreign jurisdictions ranges from three to ten years after filing the applicable tax return.
The Former Parent, Hyatt Corporation and another related party entered into a Tax Separation Agreement during 2004 in connection with our formation. As part of the Tax Separation Agreement, Hyatt Corporation agreed to indemnify the Former Parent for all pre-June 30, 2004 taxes attributable to Hyatt Corporation calculated as if it were a separate consolidated group. We have unrecognized tax benefits related to the various audits noted above, including those periods covered by the indemnification in the Tax Separation Agreement. The ultimate outcome and related liability for these matters cannot be fully determined at this time, however, we believe the payments made in prior years and the unrecognized tax benefits provided are adequate to cover any future liability.
During 2009, we made deposits totaling $14 million for tax and interest to the IRS that relate to examinations that cover taxable years ended December 31, 2003, 2004, and 2005. The deposits include $7 million paid on behalf of the Former Parent for the Company’s share of tax and interest due under the Tax Separation Agreement for years 2003 and 2004.
| 16. | COMMITMENTS AND CONTINGENCIES |
In the ordinary course of business, we enter into various commitments, guarantees, surety bonds, and letter of credit agreements, which are discussed below:
Guarantees and Commitments—As of December 31, 2009, we are committed, under certain conditions, to loan or invest up to $79 million in various business ventures.
Certain of our hotel lease or management agreements contain performance tests that stipulate certain minimum levels of operating performance. These performance test clauses provide us the option to fund a shortfall in profit performance. If we choose not to fund the shortfall the hotel owner has the option to terminate the management contract. As of December 31, 2009, $1 million was accrued in other long-term liabilities related to these performance test clauses.
Additionally, we guarantee certain of our hotel owners certain levels of hotel profitability based on various metrics. We have two management agreements where we are required to make payments based on specified thresholds and have recorded a $6 million reserve under one of these agreements in the year ended December 31, 2009. The remaining maximum potential payments related to these agreements are $47 million.
We have entered into various loan, lease, completion, and repayment guarantees related to investments held in hotel operations. Under certain of these agreements, the maximum exposure as of December 31, 2009 is $19 million. There was $3 million recorded as of December 31, 2009, related to these guarantees as the likelihood of performance under the remainder of the guarantees is determined to be remote.
Surety Bonds—Surety bonds issued on our behalf totaled $23 million at December 31, 2009, and primarily relate to workers’ compensation, taxes, licenses, and utilities related to our lodging operations.
Letters of Credit—Letters of credit outstanding on our behalf as of December 31, 2009, totaled $91 million, the majority of which relate to our ongoing operations. Of the $91 million letters of credit outstanding, $79 million reduces the available capacity under the revolving credit facility (see Note 10).
Capital Expenditures—As part of our ongoing business operations, significant expenditures are required to complete renovation projects that have been approved.
F-40
Other—We act as general partner in various partnerships owning hotel facilities that are subject to mortgage indebtedness. These mortgage agreements generally limit the lender’s recourse to security interests in assets financed and/or other assets of the partnership and/or the general partner(s) thereof.
We are subject from time to time to various claims and contingencies related to lawsuits, taxes, and environmental matters, as well as commitments under contractual obligations. Many of these claims are covered under the current insurance programs, subject to deductibles. For those matters not covered by insurance we reasonably recognize a liability associated with commitments and contingencies when a loss is probable and reasonably estimable. Although the ultimate liability for these matters cannot be determined at this point, based on information currently available, we do not expect that the ultimate resolution of such claims and litigation will have a material adverse effect on its consolidated financial statements.
| 17. | STOCKHOLDERS’ EQUITY AND COMPREHENSIVE LOSS |
Comprehensive Loss—Comprehensive loss primarily relates to reported earnings (losses), foreign currency translation, changes in unrecognized pension cost and changes in the value of the effective portion of cash flow hedges.
The following table summarizes components of accumulated other comprehensive income at December 31, 2009, 2008, and 2007:
| December 31, | December 31, | December 31, | |||||||||
| 2009 | 2008 | 2007 | |||||||||
| Foreign currency translation adjustments, net of income taxes of $(9) million, $8 million and $(5) million in 2009, 2008, and 2007, respectively |
$ | (48 | ) | $ | (54 | ) | 13 | ||||
| Unrecognized pension cost, net of income taxes of $3 million, $2 million and $11 million in 2009, 2008, and 2007, respectively |
(5 | ) | (4 | ) | (17 | ) | |||||
| Unrealized loss on hedge activity net of income taxes of $-, $1 million and $- in 2009, 2008 and 2007, respectively |
— | (2 | ) | — | |||||||
| Total accumulated other comprehensive loss |
$ | (53 | ) | $ | (60 | ) | (4 | ) | |||
Initial Public Offering—On November 10, 2009, we completed an IPO in which the selling stockholders sold 38,000,000 shares of Class A common stock and we sold 5,700,000 shares of Class A common stock pursuant to the underwriters’ full exercise of their overallotment option. All shares were sold at an initial public offering price of $25.00 per share. The net proceeds of the IPO to us were approximately $127 million, after deducting the underwriters’ discount of approximately $7 million and other offering expenses of approximately $8 million. On November 4, 2009, in connection with the effectiveness of our amended and restated certificate of incorporation, 34,407 shares of outstanding common stock were reclassified into 34,407 shares of Class A common stock, and 168,005,588 shares of outstanding common stock were reclassified into 168,005,588 shares of Class B common stock (of which, 38,000,000 shares were converted into 38,000,000 shares of Class A common stock at the time such shares were sold by the selling stockholders in the IPO).
Common Stock—In connection with the IPO, on November 4, 2009 the Company filed an amended and restated certificate of incorporation which, among other things, implemented a dual class common stock structure consisting of two classes of common stock: Class A common stock, which has one vote per share, and Class B common stock, which has ten votes per share. Our Class A common stock is the only class of stock which is publicly traded. Holders of Class A common stock and Class B common stock vote together as a single class on all matters (including the election of directors) submitted to a vote of stockholders, unless otherwise required by law. Any holder of Class B common stock may convert his or her shares at any time into shares of Class A common stock on a share-for-share basis. Each share of Class B common stock will convert automatically into one share of Class A common stock upon any transfer, whether or not for value, except for certain permitted transfers described in the Company’s amended and restated certificate of incorporation. All shares of Class B
F-41
common stock will convert automatically into shares of Class A common stock if, on any record date for determining the stockholders entitled to vote at an annual or special meeting of stockholders, the aggregate number of shares of our Class A common stock and Class B common stock owned, directly or indirectly, by the holders of our Class B common stock is less than 15% of the aggregate number of shares of our Class A common stock and Class B common stock then outstanding. Once converted into Class A common stock, the Class B common stock cannot be reissued. The holders of our Class A common stock and Class B common stock are entitled to share equally in any dividends that our board of directors may declare from time to time from legally available funds, subject to limitations under Delaware law and the preferential rights of holders of any outstanding shares of preferred stock. Upon any voluntary or involuntary liquidation, dissolution, distribution of assets or winding up of the Company, the holders of our Class A common stock and Class B common stock are entitled to share equally, on a per share basis, in all our assets available for distribution, after payment to creditors and subject to any prior distribution rights granted to holders of any outstanding shares of preferred stock.
At December 31, 2009, Pritzker family business interests beneficially owned, in the aggregate, approximately 80.68% of our Class B common stock, representing approximately 60.3% of the outstanding shares of our common stock and approximately 78.1% of the total voting power of our outstanding common stock. As a result, consistent with the voting agreements contained in the Amended and Restated Global Hyatt Agreement and Amended and Restated Foreign Global Hyatt Agreement, Pritzker family business interests are able to exert a significant degree of influence or actual control over our management and affairs and over matters requiring stockholder approval, including the election of directors and other significant corporate transactions. While the voting agreements are in effect, they may provide our board of directors with effective control over matters requiring stockholder approval. Because of our dual class ownership structure, Pritzker family business interests will continue to exert a significant degree of influence or actual control over matters requiring stockholder approval, even if they own less than 50% of the outstanding shares of our common stock. Pursuant to the Amended and Restated Global Hyatt Agreement and Amended and Restated Foreign Global Hyatt Agreement, the Pritzker family business interests have agreed to certain voting agreements and to certain limitations with respect to the sale of shares of our common stock. Pursuant to the Amended and Restated Agreement Relating to Stock, certain Pritzker family business interests have agreed to further restrict their ability to transfer shares of our common stock. In addition, other stockholders, including entities affiliated with Goldman, Sachs & Co. and Madrone GHC, LLC, beneficially own, in the aggregate, approximately 19.3% of our outstanding Class B common stock, representing approximately 14.4% of the outstanding shares of our common stock and approximately 18.7% of the total voting power of our outstanding common stock. Pursuant to the 2007 Stockholders’ Agreement, these entities have also agreed to certain voting agreements and to certain limitations with respect to the sale of shares of our common stock.
On May 14, 2009, we sold 29,195,199 shares of HHC common stock at $26 per share in exchange for $755 million in cash, net of $4 million in transaction costs in a private placement to certain of our existing investors and their affiliates.
Treasury Stock—During December 2009, we redeemed 67,078 shares of common stock for a total of $2 million from employees to satisfy statutory minimum tax-withholding requirements in connection with the vesting of restricted stock and the issuance of stock to employees. See Note 18.
On August 22, 2007, one of our subsidiaries acquired 12,135,904 shares of our common stock, from certain subsidiaries of Marmon Holdings, Inc., one of our affiliates, for $745 million in cash. These shares of common stock were substantially purchased with the proceeds from the issuance of a promissory note to a related party (see below). On September 14, 2007 and October 17, 2007, an additional 4,145,437 and 1,628,134 shares, respectively, of common stock were acquired from other stockholders for $255 million and $100 million in cash, respectively. The aggregate 17,909,476 shares of common stock purchased had been recorded as treasury stock under the cost method and are included as a separate component of stockholders’ equity. Our board of directors approved the retirement of the treasury stock and during 2008 we retired the shares. The book value was allocated to common stock and additional paid-in-capital at the time of retirement.
F-42
On August 22, 2007, we borrowed $730 million, in the form of a promissory note, from a related party. The promissory note was unsecured and had an interest rate of 5.5%, and was due on August 22, 2010. We repaid the promissory note in full along with all accrued interest on September 25, 2007.
Senior Subordinated Notes and Stock Purchase Forward Agreement—On August 28, 2007, we issued $500 million of 5.84% senior subordinated notes due 2013 (“2013 Notes”) to an independent third party. At the same time, we entered into a stock purchase forward agreement Subscription Agreement with that independent third party, which required such third party to acquire a variable number of shares of the Company’s common stock at a future date, as specified in the Settlement Agreement, for a total of $500 million in cash. This independent third party also received a seat on our board of directors. On October 25, 2007, we issued $100 million of additional 2013 Notes to, and executed an amendment to the Subscription Agreement with, a second independent third party that required such independent third party to acquire a variable number of shares of our common stock at a future date, as specified in the Settlement Agreement, for a total of $100 million in cash. On May 13 and May 18, 2009, HHC repurchased and cancelled the outstanding 2013 Notes for $600 million plus $88 million in make whole interest and early settlement premiums. Other income (loss), net includes these costs plus the write off of $5 million in deferred financing costs associated with these 2013 Notes.
Under the Subscription Agreement, the purchasers were required to pay us a subscription fee of 0.84% per year of the purchase price through the settlement date, as defined below. The fair value of the subscription receivable of $18 million was recorded as additional paid-in capital at the date the Subscription Agreement was executed. The purchase of shares of our common stock under the Subscription Agreement was mandatory on September 1, 2011, or earlier in the event of a change of control of the Company or an initial public offering of the Company’s common stock (the “Settlement Date”). The purchase of the shares of our common stock was to have been settled in cash in exchange for a variable number of our common stock based upon the fair value per share of our common stock on the Settlement Date. If the fair value per share of our common stock on the Settlement Date was less than or equal to $55.28, the purchasers would be obligated to purchase shares of common stock from the Company at a price of $55.28 per share. The purchasers’ obligations under the Subscription Agreements were secured by a pledge of the 2013 Notes to us. In connection with the repurchase of the 2013 Notes, on May 13 and May 18, 2009, the purchasers and we agreed to early settle their rights and obligations under the Subscription Agreement. Such settlement included a purchase of our common stock by the purchasers on the terms of the Subscription Agreement. Accordingly, the purchasers purchased 10,853,142 shares of common stock for $600 million, for a purchase price per share of $55.28. As part of this transaction the Company recognized $13 million of transaction costs as a reduction of additional paid in capital. These costs have been deferred from the date of the original Subscription Agreement. In addition, we received the remaining $11 million due to us under the Subscription Agreement.
Preferred Stock—On August 28, 2007, we issued 100,000 shares of newly designated stock (“Convertible Preferred Stock”) for $500 million to an independent third party investor. The Convertible Preferred Stock was convertible into approximately 8,140,671 shares of our common stock. The holder of the stock also received a seat on our Board of Directors. Conversion was at the option of the holder. The Convertible Preferred Stock participated in dividends and distributions equivalent to our common stock on an if-converted basis. In addition, the Convertible Preferred Stock also participated in any liquidation, dissolution, or winding up on an equivalent basis as the common stock. The Convertible Preferred Stock was non-voting. The Convertible Preferred Stock could have been sold or transferred only in accordance with the terms of the Stockholders’ Agreement. Pursuant to the Stockholders’ Agreement, the Company had the right but not the obligation to acquire the stock from any selling stockholder. In addition, the holder of the Convertible Preferred Stock could have requested that we register for issuance any of its common stock, subject to certain limitations. On May 13, 2009, the investor elected to convert its 100,000 shares of Convertible Preferred Stock to 8,140,671 shares of common stock.
F-43
| 18. | STOCK-BASED COMPENSATION |
As part of the our long-term incentive plan, we award Stock Appreciation Rights (“SARs”) and Restricted Stock Units (“RSUs”) to certain executives.
Stock Appreciation Rights—Each vested SAR gives the holder the right to the difference between the value of a Hyatt Hotels Corporation common share at the exercise date and the value of a common share at the grant date. Vested SARs can be exercised over their life, during the “exercise window” period as determined by the plan. All SARs have a 10-year contractual term. The plan requires settlement in Hyatt Hotels Corporation common shares. The Company is accounting for these SARs as equity instruments. We recognized $9 million, $8 million, and $7 million of total compensation expense for SARs in 2009, 2008, and 2007, respectively. The income tax benefit was $4 million, $3 million, and $2 million in 2009, 2008, and 2007, respectively.
The following table sets forth a summary of the SAR activity in 2009, 2008 and 2007:
| Grant Date |
SARs Granted | Per SAR Value | Vesting Period | Vesting Start Month | |||||
| October 2009 |
61,121 | $ | 13.60 | 25% annually | August 2010 | ||||
| May 2009 |
492,210 | 14.40 | 25% annually | April 2010 | |||||
| May 2008 |
284,637 | 26.00 | 25% annually | April 2009 | |||||
| November 2007 |
16,500 | 27.00 | 25% annually | August 2008 | |||||
| July 2007 |
315,000 | 24.50 | 25% annually | March 2008 | |||||
| July 2007 |
425,000 | 24.18 | 25% annually | December 2007 | |||||
The weighted average grant date fair value for the awards granted in 2009, 2008, and 2007 was $14.31, $26.00, and $24.38, respectively.
The fair value of each SAR was estimated based on the date of grant using the Black-Scholes-Merton option-valuation model with the following weighted-average assumptions:
| 2009 | 2008 | 2007 | ||||||||||
| Exercise Price |
$ | 26.34 | $ | 58.18 | $ | 62.77 | ||||||
| Expected Life in Years |
6.193 | 6.208 | 6.045 | |||||||||
| Risk-free Interest Rate |
2.44 | % | 3.36 | % | 4.90 | % | ||||||
| Expected Volatility |
55.20 | % | 40.00 | % | 28.71 | % | ||||||
| Annual Dividend Yield |
0 | % | 0 | % | 0 | % | ||||||
We used an estimated forfeiture rate of 0% because only a small group of executives received these grants and we have limited historical data on which to base these estimates. At December 31, 2009, the Company had $16 million of unearned compensation expense associated with SARs that will be earned over the next four years. We record the compensation expense earned for SARs on a straight-line basis from the date of grant. The exercise price of these SARs was the fair value of our common stock at the grant date, based on a valuation of the Company. Due to a lack of historical exercise information the expected life was estimated based on the midpoint between the vesting period and the contractual life of each SAR, per guidance from the SEC’s Staff Accounting Bulletin No. 107 and No. 110. The risk-free interest rate was based on U.S. Treasury instruments with similar expected life. The expected volatility was estimated using the average implied volatility of exchange-traded options of our major publicly traded competitors. As of the fourth quarter of 2009, the Company changed its methodology for calculating expected volatility from using the average implied volatility to using the average historical volatility of our peer group over a time period consistent with our expected term assumption.
F-44
A summary of SAR activity as of December 31, 2009, and changes during 2009 are presented below:
| SAR Units | Weighted Average Exercise Price (in whole dollars) |
Weighted Average Contractual Term | ||||||
| Outstanding at December 31, 2008: |
1,380,742 | $ | 57.98 | 8.44 | ||||
| Granted |
553,331 | 26.34 | 9.46 | |||||
| Exercised |
— | — | — | |||||
| Forfeited |
— | — | — | |||||
| Cancelled |
(70,186 | ) | 51.74 | 6.86 | ||||
| Outstanding at December 31, 2009: |
1,863,887 | $ | 48.83 | 8.06 | ||||
| Exercisable as of December 31, 2009: |
781,349 | $ | 58.03 | 7.33 | ||||
The total intrinsic value of SARs outstanding at December 31, 2009 was $2 million and the total intrinsic value for exercisable SARs was zero as of December 31, 2009.
Restricted Stock Units—We recognized $7 million, $4 million, and $2 million of total compensation expense for RSUs in 2009, 2008, and 2007, respectively. The income tax benefit was $3 million, $1 million, and $1 million 2009, 2008, and 2007, respectively.
Each vested RSU will be settled with a single share of our Class A common stock. The value of the RSUs was based on a valuation of our common stock as of the grant date.
The following table sets forth a summary of the RSU activity in 2009 and 2008:
| Grant Date |
RSUs |
Value |
Total Value |
Vesting Period | ||||||
| December 2009 |
7,500 | $ | 30.09 | $ | — | 4 years | ||||
| October 2009 |
28,565 | $ | 29.10 | $ | 1 | 4 years | ||||
| May 2009 |
160,378 | $ | 26.00 | $ | 4 | Immediately to 11 years | ||||
| May 2009 |
116,344 | $ | 26.00 | $ | 3 | 4 years | ||||
| September 2008 |
20,335 | $ | 58.18 | $ | 1 | 4 years & 10 years | ||||
| May 2008 |
206,007 | $ | 58.18 | $ | 12 | 4 years | ||||
In December 2008, 14,147 RSUs from the May 2008 grant were forfeited. The Company reversed compensation expense associated with the unvested, forfeited awards.
We record compensation expense earned for RSUs on a straight-line basis from the date of grant.
A summary of the status of the non-vested restricted stock unit awards outstanding under the plan as of December 31, 2009 is presented below:
| Restricted Stock Units |
Weighted Average Grant Date Fair Value (in whole dollars) | |||||
| Nonvested at December 31, 2008: |
245,945 | $ | 58.84 | |||
| Granted |
312,787 | 26.38 | ||||
| Vested |
(76,439 | ) | 53.13 | |||
| Forfeited or cancelled |
— | — | ||||
| Nonvested at December 31, 2009: |
482,293 | $ | 38.69 | |||
F-45
As of December 31, 2009 the total intrinsic value of RSUs that vested in 2009 is zero. The total intrinsic value of nonvested RSUs as of December 31, 2009 was $1 million.
Our total unearned compensation for our stock-based compensation programs as of December 31, 2009 was $16 million for SARs and $14 million for RSUs, which will be recorded to compensation expense over the next eleven years as follows:
| 2010 | 2011 | 2012 | 2013 | 2014 + | Total | |||||||||||||
| SARs |
$ | 9 | $ | 4 | $ | 2 | $ | 1 | $ | — | $ | 16 | ||||||
| RSUs |
5 | 5 | 2 | 1 | 1 | 14 | ||||||||||||
| Total |
$ | 14 | $ | 9 | $ | 4 | $ | 2 | $ | 1 | $ | 30 | ||||||
Other—In December 2009, we issued 65,494 shares of Series A common stock to certain employees. The shares are fully vested and no future service is required. As a result of the issuance, we recorded $2 million of compensation expense, see Note 11. The shares issued are net of 28,006 shares withheld to meet minimum statutory tax withholding requirements. Additionally, in December 2009 we issued 65,928 shares of series A common stock related to the vesting of RSUs. The shares issued are net of 39,072 shares withheld to meet the statutory tax withholding requirements. See Note 17 – Treasury Stock.
| 19. | RELATED-PARTY TRANSACTIONS |
In addition to those included elsewhere in the notes to the consolidated financial statements, related-party transactions entered into by us are summarized as follows:
Investments—We are an investor in certain real estate partnerships that are managed by an affiliate. Generally, we are entitled to a preferred return on these investments, and we retain a small residual ownership interest after our preferred capital balance is repaid. While the carrying value of these cost method investments at December 31, 2009 and 2008 is zero, we received distributions from the sale of underlying investments during the years ended December 31, 2009, 2008, and 2007 of $21 million, $0 and $14 million, respectively. The distributions are included in other income (loss), net in our consolidated statements of income (loss).
In addition, we own a 5% limited partnership interest and limited liability company interests in three privately held investment entities, which invest in life science technology companies and are managed by an affiliate. The carrying value of these cost method investments at December 31, 2009 and 2008 is $0 and $0.3 million, respectively. We received distributions during the years ended December 31, 2009, 2008, and 2007 of $1 million, $184 million, and $6 million, respectively, of which $122 million represented a return of capital in 2008. The distribution in 2008 was a result of the sale of one of the underlying investments. These distributions are included in other income (loss), net in our consolidated statements of income (loss).
Leases—Our corporate headquarters have been located at the Hyatt Center in Chicago, Illinois since 2005. A related party owns the Hyatt Center and a subsidiary of Hyatt Hotels Corporation has signed a master lease for a portion of this building and has entered into sublease agreements with certain related parties. The gross future operating lease payments for the entire term of this lease, ending January 31, 2020, is $110 million. Future sublease income for this space from related parties is $44 million. We recorded, in selling, general and administrative expenses, $9 million, $11 million and $10 million in 2009, 2008, and 2007, respectively, for rent, taxes and our share of operating expenses and shared facility costs under the lease. As of December 31, 2009 and 2008, the Company had recorded prepaid rent of $1 million and $1 million, respectively.
Property and Equipment—Through June 2009, a related party provided services for the operation and maintenance of our aircraft. We are charged for the cost of operating the aircraft. Subsequent to June 2009, we entered into an agreement with an unrelated third party to provide the operation and maintenance of our aircraft. However, the flight crew continues to be employed by a related party. Additionally, we have a timesharing
F-46
agreement with certain affiliates whereby the participating entities have use of a shared aircraft pool. Under the timeshare agreements, we are charged for its use of other aircrafts subject to the timeshare agreement and charges out the use of its aircraft by the participating entities. We recorded expenses of $2 million, $4 million, and $4 million for the years ended December 31, 2009, 2008, and 2007, respectively, associated with these aircraft operating and maintenance services, which are included in selling, general and administrative expenses. As of December 31, 2009 and December 31, 2008, we had immaterial payables due to the related party service provider.
Legal Services—A member of the Pritzker family is a partner in a law firm that provided services to us throughout years 2009, 2008, and 2007. We incurred legal fees of $9 million, $6 million, and $4 million, for the years ended December 31, 2009, 2008, and 2007, respectively. Legal fees when expensed are included in selling, general and administrative expenses. As of December 31, 2009 and 2008, we had immaterial amounts due to the law firm.
Gaming—We have a Gaming Space Lease Agreement with HCC Corporation (HCC), a related party, in relation to the Hyatt Regency Lake Tahoe Resort, Spa and Casino. In 2009, 2008, and 2007, we received $1 million, $4 million, and $4 million, respectively, under this lease.
Also related to the Hyatt Regency Lake Tahoe Resort, Spa and Casino, we have a Casino Facilities Agreement to provide certain sales, marketing, and other general and administrative services. In exchange for such services, HCC pays us fees based on the type of services being provided and for complimentary goods and services provided to casino customers. We received $3 million, $3 million, and $4 million for the years ended December 31, 2009, 2008, and 2007, respectively, under this agreement.
Other Transactions—Through a series of transactions with affiliates of Pritzker family business interests, in December 2008, the Company acquired the rights, interest, and title to a trademark and related domain names. The overall transaction was between entities under common control. As a result of these transactions, we recognized a deferred tax asset and a deemed capital contribution of $5 million.
Other Services—A member of our board of directors that was appointed in 2007 is a partner in a firm from which the Company receives financial advisory services. During the years ended December 31, 2009, 2008, and 2007, the Company paid $0, $2 million and $19 million, respectively in advisory fees to this firm. We also engaged this firm as lead underwriter associated with our initial public offering. Under this arrangement, the firm earned fees, along with other underwriters, of $49 million and $7 million from the selling stockholders and us, respectively. At December 31, 2009 and December 31, 2008, no amounts were owed to the firm. Additionally, affiliates of the financial advisory firm own hotels from which we received management and franchise fees of $4 million, $2 million, and $0 during the years ended December 31, 2009, 2008, and 2007, respectively. As of December 31, 2009 and 2008, we had immaterial receivables due from these properties.
Equity Method Investments—We have equity method investments in entities that own properties for which we provide management and/or franchise services and receive fees. The Company recorded fees of $29 million, $36 million, and $34 million for the years ended December 31, 2009, 2008, and 2007, respectively. As of December 31, 2009 and 2008, we had receivables due from these properties of $4 million and $2 million, respectively. In addition, in some cases we provide loans (see Note 7) or guarantees (see Note 16) to these entities. Our ownership interest in these equity method investments generally varies from 8 to 50 percent. See Note 3 for further details regarding our investments.
We have various cost sharing and advisory service agreements in place with businesses associated with Pritzker family business interests. We paid and received $1 million and $1 million, respectively, related to these services during the year ended December 31, 2009, while the amounts paid and received during the years ended December 31, 2008 and 2007 did not result in material amounts recorded in our consolidated financial statements.
F-47
| 20. | SEGMENT AND GEOGRAPHIC INFORMATION |
Our operating segments are components of the business which are managed discretely and for which discrete financial information is reviewed regularly by the chief operating decision maker to assess performance and make decisions regarding the allocation of resources. Our chief operating decision maker is the Chief Executive Officer. We define our reportable segments as follows:
Owned and Leased Hotels—This segment derives its earnings from owned and leased hotel properties located predominantly in North America but also from limited international locations.
North American Management and Franchising—This segment derives its earnings from services provided including hotel management and licensing of our family of brands to franchisees located in the U.S., Canada and the Caribbean. This segment’s revenues also include the reimbursement of costs incurred on behalf of managed hotel property owners and franchisees with no added margin and includes in costs and expenses these reimbursed costs. These costs relate primarily to payroll costs at managed properties where the Company is the employer. These revenues and costs are recorded on the lines “Other revenues from managed properties” and “Other costs from managed properties”, respectively. The intersegment revenues relate to management fees that are collected from the Company’s owned hotels, which are eliminated in consolidation.
International Management and Franchising—This segment derives its earnings from services provided including hotel management and licensing of our family of brands to franchisees located in countries outside of the U.S., Canada and the Caribbean. This segment’s revenues also include the reimbursement of costs incurred on behalf of managed hotel property owners and franchisees with no added margin and includes in costs and expenses these reimbursed costs. These costs relate primarily to reservations, marketing and IT costs. These revenues and costs are recorded on the lines “Other revenues from managed properties” and “Other costs from managed properties”, respectively. The intersegment revenues relate to management fees that are collected from the Company’s owned hotels, which are eliminated in consolidation.
Our chief operating decision maker evaluates performance based on each segment’s adjusted EBITDA. We define Adjusted EBITDA as net income (loss) attributable to Hyatt Hotels Corporation before interest expense; other income (loss), net; benefit (provision) for income taxes; depreciation and amortization; net gains on sales of real estate; asset impairments; charges resulting from the termination of our supplemental executive defined benefit plans; discontinued operations, net of tax; equity earnings (losses) from unconsolidated hospitality ventures; net loss (income) from noncontrolling interests; and to which we add our pro-rata share of unconsolidated hospitality ventures Adjusted EBITDA.
F-48
The table below shows summarized consolidated financial information by segment. Included within Corporate and other are unallocated corporate expenses and revenues and expenses on our vacation ownership properties, which are not material enough to warrant a separate segment.
| (in millions) | 2009 | 2008 | 2007 | |||||||||
| North American Management and Franchising |
||||||||||||
| Revenues |
$ | 1,382 | $ | 1,475 | $ | 1,440 | ||||||
| Intersegment Revenues (a) |
60 | 87 | 69 | |||||||||
| Adjusted EBITDA |
117 | 162 | 164 | |||||||||
| Depreciation and Amortization |
11 | 17 | 15 | |||||||||
| Capital Expenditures |
1 | 4 | 13 | |||||||||
| International Management and Franchising |
||||||||||||
| Revenues |
181 | 225 | 226 | |||||||||
| Intersegment Revenues (a) |
20 | 20 | 17 | |||||||||
| Adjusted EBITDA |
66 | 102 | 110 | |||||||||
| Depreciation and Amortization |
2 | 2 | 2 | |||||||||
| Capital Expenditures |
1 | 2 | 3 | |||||||||
| Owned and Leased Hotels |
||||||||||||
| Revenues |
1,782 | 2,139 | 2,039 | |||||||||
| Adjusted EBITDA |
302 | 522 | 518 | |||||||||
| Depreciation and Amortization |
248 | 226 | 192 | |||||||||
| Capital Expenditures |
213 | 250 | 360 | |||||||||
| Corporate and other |
||||||||||||
| Revenues |
67 | 105 | 119 | |||||||||
| Adjusted EBITDA |
(79 | ) | (99 | ) | (84 | ) | ||||||
| Depreciation and Amortization |
9 | 4 | 5 | |||||||||
| Capital Expenditures |
1 | 2 | 1 | |||||||||
| Eliminations (a) |
||||||||||||
| Revenues |
(80 | ) | (107 | ) | (86 | ) | ||||||
| Adjusted EBITDA |
— | — | ||||||||||
| Depreciation and Amortization |
— | — | ||||||||||
| Capital Expenditures |
— | — | ||||||||||
| TOTAL |
||||||||||||
| Revenues |
$ | 3,332 | $ | 3,837 | $ | 3,738 | ||||||
| Adjusted EBITDA |
406 | 687 | 708 | |||||||||
| Depreciation and Amortization |
270 | 249 | 214 | |||||||||
| Capital Expenditures |
216 | 258 | 377 | |||||||||
| (a) | Intersegment revenues are included in the segment revenue totals and eliminated in Eliminations |
F-49
The table below shows summarized consolidated balance sheet information by segment:
Total Assets
| December 31, 2009 | December 31, 2008 | |||||
| North American Management and Franchising |
$ | 300 | $ | 291 | ||
| International Management and Franchising |
180 | 165 | ||||
| Owned and Leased Hotels |
4,260 | 4,124 | ||||
| Corporate and other |
2,415 | 1,539 | ||||
| TOTAL |
$ | 7,155 | $ | 6,119 | ||
The following table presents revenues and long-lived assets by geographical region:
| 2009 | 2008 | 2007 | |||||||
| Revenues: |
|||||||||
| United States |
$ | 2,678 | $ | 3,065 | $ | 3,046 | |||
| All Foreign |
654 | 772 | 692 | ||||||
| Total |
$ | 3,332 | $ | 3,837 | $ | 3,738 | |||
| December 31, 2009 | December 31, 2008 | ||||||||
| Long-Lived Assets |
|||||||||
| United States |
$ | 3,069 | $ | 2,968 | |||||
| All Foreign |
933 | 903 | |||||||
| Total |
$ | 4,002 | $ | 3,871 | |||||
The table below provides a reconciliation of our Adjusted EBITDA to net income (loss) attributable to Hyatt Hotels Corporation for 2009, 2008 and 2007.
| Year Ended December 31, | |||||||||||
| 2009 | 2008 | 2007 | |||||||||
| Adjusted EBITDA |
$ | 406 | $ | 687 | 708 | ||||||
| Interest expense |
(56 | ) | (75 | ) | (43 | ) | |||||
| Other income (loss), net |
(48 | ) | 23 | 84 | |||||||
| (Provision) benefit for income taxes |
10 | (90 | ) | (208 | ) | ||||||
| Depreciation and amortization |
(270 | ) | (249 | ) | (214 | ) | |||||
| Gains on sales of real estate |
— | — | 22 | ||||||||
| Asset impairments |
(15 | ) | (86 | ) | — | ||||||
| Charge resulting from the termination of our supplemental executive defined benefit plans |
— | (20 | ) | — | |||||||
| Discontinued operations, net of tax |
(1 | ) | 56 | 5 | |||||||
| Equity earnings (losses) from unconsolidated hospitality ventures |
(13 | ) | 14 | 11 | |||||||
| Pro rata share of unconsolidated hospitality ventures Adjusted EBITDA |
(59 | ) | (90 | ) | (94 | ) | |||||
| Net loss (income) attributable to noncontrolling interests |
3 | (2 | ) | (1 | ) | ||||||
| Net Income (Loss) Attributable to Hyatt Hotels Corporation |
$ | (43 | ) | $ | 168 | 270 | |||||
F-50
| 21. | EARNINGS PER SHARE |
The calculation of basic and diluted earnings per share including a reconciliation of the numerator and denominator are as follows:
| Years Ended December 31, | ||||||||||||
| 2009 | 2008 | 2007 | ||||||||||
| Numerator: |
||||||||||||
| Income (loss) from continuing operations |
$ | (45 | ) | $ | 114 | $ | 266 | |||||
| Income from discontinued operations |
(1 | ) | 1 | 3 | ||||||||
| Gain (loss) on sale of discontinued operations |
— | 55 | 2 | |||||||||
| Net Income (Loss) |
$ | (46 | ) | $ | 170 | $ | 271 | |||||
| Net Loss (Income) Attributable to Noncontrolling Interests |
$ | 3 | $ | (2 | ) | $ | (1 | ) | ||||
| Net Income (Loss) Attributable to Hyatt Hotels Corporation |
$ | (43 | ) | $ | 168 | $ | 270 | |||||
| Denominator: |
||||||||||||
| Basic weighted average shares outstanding: |
151,486,490 | 128,037,015 | 134,585,314 | |||||||||
| Share-based compensation and subscription receivable |
— | 24,132 | 48,705 | |||||||||
| Diluted weighted average shares outstanding |
151,486,490 | 128,061,147 | 134,634,019 | |||||||||
| Basic Earnings Per Share: |
||||||||||||
| Income (loss) from continuing operations |
$ | (0.30 | ) | $ | 0.89 | $ | 1.98 | |||||
| Income from discontinued operations |
— | 0.01 | 0.02 | |||||||||
| Gain (loss) on sale of discontinued operations |
— | 0.43 | 0.01 | |||||||||
| Net Income (Loss) |
$ | (0.30 | ) | $ | 1.33 | $ | 2.01 | |||||
| Net Loss (Income) Attributable to Noncontrolling Interests |
0.02 | (0.02 | ) | — | ||||||||
| Net Income (Loss) Attributable to Hyatt Hotels Corporation |
$ | (0.28 | ) | $ | 1.31 | $ | 2.01 | |||||
| Diluted Earnings Per Share: |
||||||||||||
| Income (loss) from continuing operations |
$ | (0.30 | ) | $ | 0.89 | $ | 1.98 | |||||
| Income from discontinued operations |
— | 0.01 | 0.02 | |||||||||
| Gain (loss) on sale of discontinued operations |
— | 0.43 | 0.01 | |||||||||
| Net Income (Loss) |
$ | (0.30 | ) | $ | 1.33 | $ | 2.01 | |||||
| Net Loss (Income) Attributable to Noncontrolling Interests |
0.02 | (0.02 | ) | — | ||||||||
| Net Income (Loss) Attributable to Hyatt Hotels Corporation |
$ | (0.28 | ) | $ | 1.31 | $ | 2.01 | |||||
The computations of diluted net income (loss) per share for the years ended December 31, 2009, 2008, and 2007 do not include approximately 138,000, 27,500, and 90,000 of shares of stock assumed to be issued as stock-settled stock appreciation rights and approximately 482,500, 246,000, and 70,000 of restricted stock units, respectively, because the stock appreciation rights and restricted stock units are anti-dilutive. In 2008, the shares pursuant to the Subscription Agreement were anti-dilutive. The effect of their inclusion would have been anti-dilutive to earnings per share.
F-51
| 22. | QUARTERLY FINANCIAL INFORMATION (UNAUDITED) |
The following table sets forth the historical unaudited quarterly financial data for the periods indicated. The information for each of these periods has been prepared on the same basis as the audited consolidated financial statements and, in our opinion, reflects all adjustments necessary to present fairly our financial results. Operating results for previous periods do not necessarily indicate results that may be achieved in any future period. Amounts are in millions, except earnings per share information.
| (in millions, except per share data) |
For the three months ended | ||||||||||||||||||||||||||
| December 31, 2009 |
September 30, 2009 |
June 30, 2009 |
March 31, 2009 |
December 31, 2008 |
September 30, 2008 |
June 30, 2008 |
March 31, 2008 | ||||||||||||||||||||
| Consolidated statements of income data: |
|||||||||||||||||||||||||||
| Owned and leased hotel revenues |
$ | 468 | $ | 438 | $ | 460 | $ | 416 | $ | 491 | $ | 523 | $ | 589 | $ | 536 | |||||||||||
| Management and franchise fee revenues |
65 | 49 | 55 | 54 | 60 | 68 | 84 | 78 | |||||||||||||||||||
| Other revenues |
10 | 10 | 13 | 16 | 15 | 20 | 23 | 25 | |||||||||||||||||||
| Other revenues from managed properties (1) |
346 | 309 | 320 | 303 | 320 | 331 | 346 | 328 | |||||||||||||||||||
| Total revenues |
889 | 806 | 848 | 789 | 886 | 942 | 1,042 | 967 | |||||||||||||||||||
| Direct and selling, general, and administrative expenses |
879 | 812 | 824 | 769 | 872 | 842 | 901 | 858 | |||||||||||||||||||
| Income (loss) from continuing operations |
(14 | ) | 6 | (50 | ) | 12 | (143 | ) | 82 | 78 | 97 | ||||||||||||||||
| Net income (loss) attributable to Hyatt Hotels Corporation |
(12 | ) | 5 | (50 | ) | 14 | (142 | ) | 137 | 76 | 97 | ||||||||||||||||
| Income (loss) from continuing operations per common share, basic (2) |
$ | (0.08 | ) | $ | 0.04 | $ | (0.34 | ) | $ | 0.09 | $ | (1.12 | ) | $ | 0.64 | $ | 0.61 | $ | 0.76 | ||||||||
| Income (loss) from continuing operations per common share, diluted (2) |
$ | (0.08 | ) | $ | 0.04 | $ | (0.34 | ) | $ | 0.09 | $ | (1.12 | ) | $ | 0.64 | $ | 0.61 | $ | 0.76 | ||||||||
| (1) | Represents revenues that we receive from third-party property owners who reimburse us for costs that we incur on their behalf, with no added margin. These costs relate primarily to payroll at managed properties where we are the employer. As a result, these revenues have no effect on our profit, although they do increase our total revenues and the corresponding costs increase our total expenses. See Part II, Item 7 “Management’s Discussion and Analysis of Financial Condition and Results of Operations—Principal Factors Affecting our Results of Operations—Revenues.” |
| (2) | All per share amounts reflect a one-for-two reverse split of our common stock affected on October 14, 2009. |
F-52
HYATT HOTELS CORPORATION AND SUBSIDIARIES
SCHEDULE II—VALUATION AND QUALIFYING ACCOUNTS
FOR THE YEARS ENDED DECEMBER 31, 2009, 2008 AND 2007
(In millions)
| Column A | Column B | Column C | Column D | Column E | ||||||||||||||
| Description |
Balance at Beginning of Period |
Additions Charged to Revenues, Costs and Expenses |
Additions Charged to Other Accounts |
Deductions | Balance at End of Period | |||||||||||||
| Year Ended December 31, 2009: |
||||||||||||||||||
| Trade receivables—allowance for doubtful accounts |
$ | 24 | $ | 4 | $ | — | $ | (16 | ) | $ | 12 | |||||||
| Notes receivable—allowance for losses |
54 | 23 | 4 | A | (7 | ) | 74 | |||||||||||
| Deferred tax asset—valuation allowance |
69 | 31 | — | — | 100 | |||||||||||||
| Year Ended December 31, 2008: |
||||||||||||||||||
| Trade receivables—allowance for doubtful accounts |
21 | 18 | — | (15 | ) | 24 | ||||||||||||
| Notes receivable—allowance for losses |
109 | 20 | — | (75 | )B | 54 | ||||||||||||
| Deferred tax asset—valuation allowance |
70 | 13 | — | (14 | )C | 69 | ||||||||||||
| Year Ended December 31, 2007: |
||||||||||||||||||
| Trade receivables—allowance for doubtful accounts |
12 | 11 | — | (2 | ) | 21 | ||||||||||||
| Notes receivable—allowance for losses |
38 | 72 | B | — | (1 | ) | 109 | |||||||||||
| Deferred tax asset—valuation allowance |
52 | 17 | 1 | D | — | 70 | ||||||||||||
A—This amount represents currency translation on foreign currency denominated notes receivable.
B—The year ended December 31, 2008 included a $61 million write-off of a development loan, the related expense was recorded in the year ended December 31, 2007.
C—Amount includes a release of $14 million related to an IRS settlement.
D—This amount represents a valuation allowance recorded as a result of our acquisition of the Andaz Liverpool Street in 2007.
SCHII-1
EXHIBIT INDEX
| Exhibit |
Exhibit Description | |
| 3.1 | Amended and Restated Certificate of Incorporation of Hyatt Hotels Corporation (incorporated by reference to Exhibit 3.1 to the Company’s Registration Statement on Form S-1 (File No. 333-161068) filed with the Securities and Exchange Commission on November 2, 2009) | |
| 3.2 | Certificate of Retirement of 38,000,000 Shares of Class B Common Stock (incorporated by reference to Exhibit 3.1 to the Company’s Current Report on Form 8-K (File No. 001-34521) filed with the Securities and Exchange Commission on December 17, 2009) | |
| 3.3 | Amended and Restated Bylaws of Hyatt Hotels (incorporated by reference to Exhibit 3.2 to the Company’s Registration Statement on Form S-1 (File No. 333-161068) filed with the Securities and Exchange Commission on October 1, 2009) | |
| 4.1 | Specimen Class A Common Stock Certificate (incorporated by reference to Exhibit 4.1 to the Company’s Registration Statement on Form S-1 (File No. 333-161068) filed with the Securities and Exchange Commission on October 1, 2009) | |
| 4.2 | Registration Rights Agreement, dated as of August 28, 2007, as amended, by and among Global Hyatt Corporation, Madrone GHC, LLC, Lake GHC, LLC, Shimoda GHC, LLC, GS Sunray Holdings, L.L.C., GS Sunray Holdings Subco I, L.L.C., GS Sunray Holdings Subco II, L.L.C., GS Sunray Holdings Parallel, L.L.C., GS Sunray Holdings Parallel Subco, L.L.C., Mori Building Capital Investment LLC and others party thereto (incorporated by reference to Exhibit 4.2 to the Company’s Registration Statement on Form S-1 (File No. 333-161068) filed with the Securities and Exchange Commission on August 5, 2009) | |
| 4.3 | Joinder Agreement to Registration Rights Agreement, dated as of January 26, 2010, by and among Hyatt Hotels Corporation and Mori Building Co., Ltd. | |
| 4.4 | Indenture, dated as of August 14, 2009, as amended, between Hyatt Hotels Corporation and Wells Fargo Bank, National Association, as trustee (incorporated by reference to Exhibit 4.3 to the Company’s Registration Statement on Form S-1 (File No. 333-161068) filed with the Securities and Exchange Commission on September 9, 2009) | |
| 4.5 | First Supplemental Indenture, dated as of August 14, 2009, between Hyatt Hotels Corporation and Wells Fargo Bank, National Association, as trustee (incorporated by reference to Exhibit 4.4 to the Company’s Registration Statement on Form S-1 (File No. 333-161068) filed with the Securities and Exchange Commission on September 9, 2009) | |
| 4.6 | Registration Rights Agreement, dated as of October 12, 2009, by and among Hyatt Hotels Corporation and Thomas J. Pritzker, Marshall E. Eisenberg and Karl J. Breyer, solely in their capacity as co-trustees (incorporated by reference to Exhibit 4.5 to the Company’s Registration Statement on Form S-1 (File No. 333-161068) filed with the Securities and Exchange Commission on October 15, 2009) | |
| 10.1 | 2007 Stockholders’ Agreement, dated as of August 28, 2007, as amended, by and among Hyatt Hotels Corporation, Madrone GHC, LLC, Lake GHC, LLC, Shimoda GHC, LLC, GS Sunray Holdings, L.L.C., GS Sunray Holdings Subco I, L.L.C., GS Sunray Holdings Subco II, L.L.C., GS Sunray Holdings Parallel, L.L.C., GS Sunray Holdings Parallel Subco, L.L.C., Mori Building Capital Investment LLC and others party thereto (incorporated by reference to Exhibit 10.1 to the Company’s Registration Statement on Form S-1 (File No. 333-161068) filed with the Securities and Exchange Commission on August 5, 2009) | |
| 10.2 | Joinder Agreement to 2007 Stockholders’ Agreement, dated as of January 26, 2010, by and among Hyatt Hotels Corporation and Mori Building Co., Ltd. | |
| +10.3 | Amended and Restated Hyatt Hotels Corporation Long-Term Incentive Plan, dated as of March 11, 2008, as amended (incorporated by reference to Exhibit 10.2 to the Company’s Registration Statement on Form S-1 (File No. 333-161068) filed with the Securities and Exchange Commission on November 2, 2009) | |
| Exhibit |
Exhibit Description | |
| +10.4 | Form of Non-Employee Director Restricted Stock Unit Award Agreement (incorporated by reference to Exhibit 10.3 to the Company’s Registration Statement on Form S-1 (File No. 333-161068) filed with the Securities and Exchange Commission on August 5, 2009) | |
| +10.5 | Form of Non-Employee Director Restricted Stock Award Agreement (incorporated by reference to Exhibit 10.4 to the Company’s Registration Statement on Form S-1 (File No. 333-161068) filed with the Securities and Exchange Commission on August 5, 2009) | |
| +10.6 | Form of Special Cash Award Agreement under Long-Term Incentive Plan (incorporated by reference to Exhibit 10.5 to the Company’s Registration Statement on Form S-1 (File No. 333-161068) filed with the Securities and Exchange Commission on August 5, 2009) | |
| +10.7 | Form of Special Restricted Stock Unit Award Agreement under Long-Term Incentive Plan (incorporated by reference to Exhibit 10.6 to the Company’s Registration Statement on Form S-1 (File No. 333-161068) filed with the Securities and Exchange Commission on August 5, 2009) | |
| +10.8 | Form of 2008 Special Restricted Stock Unit Award Agreement under Long-Term Incentive Plan (incorporated by reference to Exhibit 10.7 to the Company’s Registration Statement on Form S-1 (File No. 333-161068) filed with the Securities and Exchange Commission on August 5, 2009) | |
| +10.9 | Form of 2009 Restricted Stock Unit Award Agreement under Long-Term Incentive Plan (incorporated by reference to Exhibit 10.8 to the Company’s Registration Statement on Form S-1 (File No. 333-161068) filed with the Securities and Exchange Commission on August 5, 2009) | |
| +10.10 | Form of 2008 Restricted Stock Unit Award Agreement under Long-Term Incentive Plan (incorporated by reference to Exhibit 10.9 to the Company’s Registration Statement on Form S-1 (File No. 333-161068) filed with the Securities and Exchange Commission on August 5, 2009) | |
| +10.11 | Form of 2008 Stock Appreciation Rights Award Agreement under Long-Term Incentive Plan (incorporated by reference to Exhibit 10.10 to the Company’s Registration Statement on Form S-1 (File No. 333-161068) filed with the Securities and Exchange Commission on August 5, 2009) | |
| +10.12 | Form of 2007 Stock Appreciation Rights Award Agreement under Long-Term Incentive Plan (incorporated by reference to Exhibit 10.11 to the Company’s Registration Statement on Form S-1 (File No. 333-161068) filed with the Securities and Exchange Commission on August 5, 2009) | |
| +10.13 | Form of 2006 Stock Appreciation Rights Award Agreement under Long-Term Incentive Plan (incorporated by reference to Exhibit 10.12 to the Company’s Registration Statement on Form S-1 (File No. 333-161068) filed with the Securities and Exchange Commission on August 5, 2009) | |
| +10.14 | Form of 2009 Stock Appreciation Rights Award Agreement under Long-Term Incentive Plan (incorporated by reference to Exhibit 10.13 to the Company’s Registration Statement on Form S-1 (File No. 333-161068) filed with the Securities and Exchange Commission on August 5, 2009) | |
| +10.15 | Amended and Restated Hyatt Hotels Corporation Deferred Compensation Plan for Directors, dated as of December 10, 2009 | |
| +10.16 | Hyatt Hotels Corporation Amended and Restated Summary of Non-Employee Director Compensation (December 2009) | |
| +10.17 | Restricted Stock Unit Agreement, dated as of December 18, 2006, between Global Hyatt Corporation and Mark S. Hoplamazian (incorporated by reference to Exhibit 10.16 to the Company’s Registration Statement on Form S-1 (File No. 333-161068) filed with the Securities and Exchange Commission on August 5, 2009) | |
| +10.18 | Employment Letter, dated as of July 30, 2009, between Hyatt Hotels Corporation and Mark S. Hoplamazian (incorporated by reference to Exhibit 10.17 to the Company’s Registration Statement on Form S-1 (File No. 333-161068) filed with the Securities and Exchange Commission on August 5, 2009) | |
| Exhibit |
Exhibit Description | |
| +10.19 | Employment Letter, dated as of June 9, 2008, between Hyatt Corporation and Harmit J. Singh (incorporated by reference to Exhibit 10.18 to the Company’s Registration Statement on Form S-1 (File No. 333-161068) filed with the Securities and Exchange Commission on August 5, 2009) | |
| +10.20 | Employment Letter, dated as of July 30, 2009, between Hyatt Corporation and Thomas J. Pritzker (incorporated by reference to Exhibit 10.19 to the Company’s Registration Statement on Form S-1 (File No. 333-161068) filed with the Securities and Exchange Commission on August 5, 2009) | |
| 10.21 | Amended and Restated Office Lease, dated as of June 15, 2004, as amended, between Hyatt Corporation and FrankMon LLC (incorporated by reference to Exhibit 10.21 to the Company’s Registration Statement on Form S-1 (File No. 333-161068) filed with the Securities and Exchange Commission on August 5, 2009) | |
| 10.22 | Sublease Agreement, dated as of June 15, 2004, as amended, between Hyatt Corporation and Pritzker Realty Group, L.P. (incorporated by reference to Exhibit 10.22 to the Company’s Registration Statement on Form S-1 (File No. 333-161068) filed with the Securities and Exchange Commission on August 5, 2009) | |
| 10.23 | Sublease Agreement, dated as of June 15, 2004, as amended, between Hyatt Corporation and The Pritzker Organization, L.L.C. (incorporated by reference to Exhibit 10.23 to the Company’s Registration Statement on Form S-1 (File No. 333-161068) filed with the Securities and Exchange Commission on August 5, 2009) | |
| 10.24 | Sublease Agreement, dated as of June 15, 2004, as amended, between Hyatt Corporation and H Group Holding, Inc. (incorporated by reference to Exhibit 10.24 to the Company’s Registration Statement on Form S-1 (File No. 333-161068) filed with the Securities and Exchange Commission on August 5, 2009) | |
| 10.25 | Sublease Agreement, dated as of June 15, 2004, as amended, between Hyatt Corporation and CC-Development Group, Inc. (incorporated by reference to Exhibit 10.25 to the Company’s Registration Statement on Form S-1 (File No. 333-161068) filed with the Securities and Exchange Commission on August 5, 2009) | |
| 10.26 | Allocation of Certain Office Costs Relating to Thomas J. Pritzker, dated as of December 8, 2006, between Global Hyatt Corporation and The Pritzker Organization, L.L.C. (incorporated by reference to Exhibit 10.26 to the Company’s Registration Statement on Form S-1 (File No. 333-161068) filed with the Securities and Exchange Commission on August 5, 2009) | |
| 10.27 | Omnibus Office Services Agreement, dated as of August 3, 2006, between Global Hyatt Corporation, Pritzker Realty Group, L.P., CC-Development Group, H Group Holding, Inc., The Pritzker Organization, L.L.C., Pritzker Family Office, L.L.C. and Pritzker Realty Group, L.P. and others party thereto (incorporated by reference to Exhibit 10.27 to the Company’s Registration Statement on Form S-1 (File No. 333-161068) filed with the Securities and Exchange Commission on August 5, 2009) | |
| 10.28 | Time Sharing Agreement, dated as of October 2, 2006, among Rosemont Project Management, L.L.C., Marmon Holdings, Inc., Global Hyatt Corporation, Pritzker Realty Group, L.P., CC-Development Group, Inc., The Pritzker Organization, L.L.C., U.S. Financial Advisors, Inc., Diversified Financial Management Corp., TransUnion Corp., H Group Holding, Inc., International Financial Advisors, Inc., Marshall E. Eisenberg, Thomas J. Pritzker and Karl J. Breyer, as co-trustees (incorporated by reference to Exhibit 10.28 to the Company’s Registration Statement on Form S-1 (File No. 333-161068) filed with the Securities and Exchange Commission on August 5, 2009) | |
| 10.29 | Time Sharing Agreement, dated as of January 1, 2008, between Rosemont Project Management, L.L.C. and Thomas J. Pritzker (incorporated by reference to Exhibit 10.29 to the Company’s Registration Statement on Form S-1 (File No. 333-161068) filed with the Securities and Exchange Commission on August 5, 2009) | |
| Exhibit |
Exhibit Description | |
| 10.30 | Aircraft Administrative and Flight Services Agreement, dated as of March 18, 2008, between Rosemont Project Management, L.L.C. and The Marmon Group LLC (incorporated by reference to Exhibit 10.30 to the Company’s Registration Statement on Form S-1 (File No. 333-161068) filed with the Securities and Exchange Commission on August 5, 2009) | |
| 10.31 | Time Sharing Agreement, dated as of July 1, 2009 among Navigator Investments, L.L.C. and Global Hyatt Corporation (incorporated by reference to Exhibit 10.31 to the Company’s Registration Statement on Form S-1 (File No. 333-161068) filed with the Securities and Exchange Commission on August 5, 2009) | |
| 10.32 | Amended and Restated Gaming Space Lease Agreement, dated as of December 21, 2009, between Hyatt Equities, L.L.C. and HCC Corporation | |
| 10.33 | Casino Facilities Agreement, dated as of June 30, 2004, between Hyatt Corporation and HCC Corporation (incorporated by reference to Exhibit 10.33 to the Company’s Registration Statement on Form S-1 (File No. 333-161068) filed with the Securities and Exchange Commission on September 9, 2009) | |
| 10.34 | Master (Permanent) Non-Gaming Services Agreement, dated as of July 19, 2002, between Hyatt Corporation and Falls Management Company (incorporated by reference to Exhibit 10.34 to the Company’s Registration Statement on Form S-1 (File No. 333-161068) filed with the Securities and Exchange Commission on September 9, 2009) | |
| 10.35 | Consulting Agreement, dated as of September 1, 1997, as amended, between Hyatt Aruba, N.V. and Hyatt Gaming Management, Inc. (incorporated by reference to Exhibit 10.35 to the Company’s Registration Statement on Form S-1 (File No. 333-161068) filed with the Securities and Exchange Commission on September 9, 2009) | |
| 10.36 | Hotel Management Agreement, dated as of July 1, 2000, between HDG Associates and Pritzker Realty Group, L.P. (incorporated by reference to Exhibit 10.36 to the Company’s Registration Statement on Form S-1 (File No. 333-161068) filed with the Securities and Exchange Commission on September 9, 2009) | |
| 10.37 | License Agreement, dated as of December 31, 2008, between Hyatt Corporation and CC-Development Group, Inc. (incorporated by reference to Exhibit 10.37 to the Company’s Registration Statement on Form S-1 (File No. 333-161068) filed with the Securities and Exchange Commission on August 5, 2009) | |
| 10.38 | Letter regarding employee benefit administration dated as of February 12, 2008, by Hyatt Gaming Management, Inc. (incorporated by reference to Exhibit 10.38 to the Company’s Registration Statement on Form S-1 (File No. 333-161068) filed with the Securities and Exchange Commission on August 5, 2009) | |
| 10.39 | Employee Benefits and Other Employment Matters Allocation and Separation Agreement, dated as of July 1, 2004, among Hyatt Corporation, Hyatt Gaming Management, Inc., H Group Holding, Inc., HCC Corporation and Grand Victoria Casino & Resort, L.P. (incorporated by reference to Exhibit 10.39 to the Company’s Registration Statement on Form S-1 (File No. 333-161068) filed with the Securities and Exchange Commission on August 5, 2009) | |
| 10.40 | Letter regarding indemnification of Hyatt Corporation by SMG, dated as of June 14, 2007 (incorporated by reference to Exhibit 10.40 to the Company’s Registration Statement on Form S-1 (File No. 333-161068) filed with the Securities and Exchange Commission on August 5, 2009) | |
| 10.41 | Letter regarding indemnification of Hyatt Corporation by Aramark Corporation, dated as of June 14, 2007 (incorporated by reference to Exhibit 10.41 to the Company’s Registration Statement on Form S-1 (File No. 333-161068) filed with the Securities and Exchange Commission on August 5, 2009) | |
| Exhibit |
Exhibit Description | |
| 10.42 | Tax Separation Agreement, dated as of June 30, 2004, as amended, among H Group Holding, Inc., Hyatt Corporation, CC-Development Group, Inc. and each of their respective direct and indirect Subsidiaries (incorporated by reference to Exhibit 10.42 to the Company’s Registration Statement on Form S-1 (File No. 333-161068) filed with the Securities and Exchange Commission on October 1, 2009) | |
| 10.43 | Second Amended and Restated Limited Liability Company Agreement of W2007 Waikiki Holdings, L.L.C., dated as of October 9, 2009 (incorporated by reference to Exhibit 10.43 to the Company’s Registration Statement on Form S-1 (File No. 333-161068) filed with the Securities and Exchange Commission on October 15, 2009) | |
| 10.44 | Senior Loan Agreement, dated as of July 16, 2008, between W2007 WKH Senior Borrower, LLC and SDI, Inc. (incorporated by reference to Exhibit 10.44 to the Company’s Registration Statement on Form S-1 (File No. 333-161068) filed with the Securities and Exchange Commission on October 15, 2009) | |
| 10.45 | Credit Agreement, dated as of June 29, 2005, as amended, among Hyatt Hotels Corporation, certain Material Domestic Subsidiaries of Hyatt Hotels Corporation from time to time party thereto, the lenders party thereto, Wachovia Bank, National Association, as administrative agent, The Royal Bank of Scotland plc, as syndication agent, and JPMorgan Chase Bank, N.A, Bank of America, N.A, Deutsche Bank AG New York Branch and BNP Paribas, as co-documentation agents, as amended by the First Amendment to Credit Agreement, dated as of July 10, 2009, between Hyatt Hotels Corporation, the Subsidiaries of Hyatt Hotels Corporation party thereto, the lenders party thereto, Wachovia Bank, National Association, as the prior issuing lender and as the administrative agent prior to the effectiveness of the amendment, and Wells Fargo Bank, National Association, as administrative agent (incorporated by reference to Exhibit 10.45 to the Company’s Registration Statement on Form S-1 (File No. 333-161068) filed with the Securities and Exchange Commission on August 5, 2009) | |
| 10.46 | Form of Franchise Agreement with Hyatt Place Franchising, L.L.C., as amended (incorporated by reference to Exhibit 10.46 to the Company’s Registration Statement on Form S-1 (File No. 333-161068) filed with the Securities and Exchange Commission on August 5, 2009) | |
| +10.47 | Hyatt Hotels Corporation Executive Officer Change in Control Plan and Summary Plan Description (incorporated by reference to Exhibit 10.47 to the Company’s Registration Statement on Form S-1 (File No. 333-161068) filed with the Securities and Exchange Commission on September 9, 2009) | |
| +10.48 | Hyatt Hotels Corporation Corporate Office Severance Plan and Summary Plan Description (incorporated by reference to Exhibit 10.48 to the Company’s Registration Statement on Form S-1 (File No. 333-161068) filed with the Securities and Exchange Commission on September 9, 2009) | |
| +10.49 | Hyatt Hotels Corporation Executive Incentive Plan (incorporated by reference to Exhibit 10.49 to the Company’s Registration Statement on Form S-1 (File No. 333-161068) filed with the Securities and Exchange Commission on September 9, 2009) | |
| +10.50 | Hyatt Corporation Restricted Deferred Incentive Compensation Plan, dated as of December 18, 2006 (incorporated by reference to Exhibit 10.50 to the Company’s Registration Statement on Form S-1 (File No. 333-161068) filed with the Securities and Exchange Commission on November 2, 2009) | |
| +10.51 | Hyatt Corporation Restricted Deferred Incentive Compensation Plan II, dated as of December 18, 2006 (incorporated by reference to Exhibit 10.51 to the Company’s Registration Statement on Form S-1 (File No. 333-161068) filed with the Securities and Exchange Commission on November 2, 2009) | |
| +10.52 | Hyatt International Hotels Restricted Deferred Incentive Compensation Plan (incorporated by reference to Exhibit 10.52 to the Company’s Registration Statement on Form S-1 (File No. 333-161068) filed with the Securities and Exchange Commission on November 2, 2009) | |
| Exhibit |
Exhibit Description | |
| +10.53 | Hyatt International Corporation Restricted Deferred Incentive Compensation Plan II, dated as of January 1, 2004 (incorporated by reference to Exhibit 10.53 to the Company’s Registration Statement on Form S-1 (File No. 333-161068) filed with the Securities and Exchange Commission on November 2, 2009) | |
| +10.54 | Hyatt Hotels Amended and Restated Deferred Incentive Plan, dated as of October 28, 2009 (incorporated by reference to Exhibit 10.54 to the Company’s Registration Statement on Form S-1 (File No. 333-161068) filed with the Securities and Exchange Commission on November 2, 2009) | |
| +10.55 | Hyatt International Hotels Retirement Plan (incorporated by reference to Exhibit 10.55 to the Company’s Registration Statement on Form S-1 (File No. 333-161068) filed with the Securities and Exchange Commission on November 2, 2009) | |
| +10.56 | Hyatt International Corporation U.S. Retirement Plan Nonqualified Deferred Compensation Plan Adoption Agreement, dated as of December 31, 2004 (incorporated by reference to Exhibit 10.56 to the Company’s Registration Statement on Form S-1 (File No. 333-161068) filed with the Securities and Exchange Commission on November 2, 2009) | |
| +10.57 | Form of Stock Appreciation Rights Award Agreement under Long-Term Incentive Plan | |
| +10.58 | Form of Restricted Stock Unit Award Agreement under Long-Term Incentive Plan | |
| 14.1 | Code of Business Conduct and Ethics (incorporated by reference to Exhibit 14.1 to the Company’s Registration Statement on Form S-1 (File No. 333-161068) filed with the Securities and Exchange Commission on October 1, 2009) | |
| 21.1 | List of Subsidiaries | |
| 23.1 | Consent of Deloitte & Touche LLP | |
| 31.1 | Certification of the Chief Executive Officer pursuant to Rules 13a-14(a) and 15d-14(a) of the Securities Exchange Act of 1934, as amended, as adopted pursuant to Section 302 of the Sarbanes-Oxley Act of 2002 | |
| 31.2 | Certification of the Chief Financial Officer pursuant to Rules 13a-14(a) and 15d-14(a) of the Securities Exchange Act of 1934, as amended, as adopted pursuant to Section 302 of the Sarbanes-Oxley Act of 2002 | |
| 32.1 | Certification of the Chief Executive Officer pursuant to 18 U.S.C. Section 1350, as adopted pursuant to Section 906 of the Sarbanes-Oxley Act of 2002 | |
| 32.2 | Certification of the Chief Financial Officer pursuant to 18 U.S.C. Section 1350, as adopted pursuant to Section 906 of the Sarbanes-Oxley Act of 2002 | |
| + | Management contracts and compensatory plans and arrangements required to be filed as exhibits pursuant to Item 15(c) of this annual report. |