Attached files
Table of Contents
UNITED STATES
SECURITIES AND EXCHANGE COMMISSION
Washington, D.C. 20549
FORM 10-K
(Mark One)
| þ | ANNUAL REPORT PURSUANT TO SECTION 13 OR 15(d) OF THE SECURITIES EXCHANGE ACT OF 1934 |
For the fiscal year ended December 31, 2009
or
| ¨ | TRANSITION REPORT PURSUANT TO SECTION 13 OR 15(d) OF THE SECURITIES EXCHANGE ACT OF 1934 |
For the transition period from to
Commission file number 001-33753
GENOPTIX, INC.
(Exact name of registrant as specified in its charter)
| Delaware |
33-0840570 | |
| State or other jurisdiction of incorporation or organization |
(I.R.S. Employer Identification No.) | |
| 1811 Aston Avenue, Carlsbad California |
92008 | |
| (Address of principal executive offices) |
(Zip Code) |
(760) 268-6200
(Registrant’s telephone number, including area code)
Securities registered pursuant to Section 12(b) of the Act:
| Title of each class |
Name of each exchange on which registered | |
| Common Stock, par value $0.001 per share |
The NASDAQ Global Select Market |
Securities registered pursuant to Section 12(g) of the Act: None
Indicate by check mark if the registrant is a well-known seasoned issuer, as defined in Rule 405 of the Securities Act. Yes ¨ No þ
Indicate by check mark if the registrant is not required to file reports pursuant to Section 13 or Section 15(d) of the Act. Yes ¨ No þ
Indicate by check mark whether the registrant (1) has filed all reports required to be filed by Section 13 or 15(d) of the Securities Exchange Act of 1934 during the preceding 12 months (or for such shorter period that the registrant was required to file such reports), and (2) has been subject to such filing requirements for the past 90 days. Yes þ No ¨
Indicate by check mark whether the registrant has submitted electronically and posted on its corporate Website, if any, every Interactive Data File required to be submitted and posted pursuant to Rule 405 of Regulation S-T (§232.405 of this chapter) during the preceding 12 months (or for such shorter period that the registrant was required to submit and post such files). Yes ¨ No ¨
Indicate by check mark if disclosure of delinquent filers pursuant to Item 405 of Regulation S-K (§229.405 of this chapter) is not contained herein, and will not be contained, to the best of registrant’s knowledge, in definitive proxy or information statements incorporated by reference in Part III of this Form 10-K or any amendment to this Form 10-K. þ
Indicate by check mark whether the registrant is a large accelerated filer, an accelerated filer, a non-accelerated filer, or a smaller reporting company. See the definitions of “large accelerated filer,” “accelerated filer” and “smaller reporting company” in Rule 12b-2 of the Exchange Act.
| Large accelerated filer | ¨ | Accelerated filer | þ | |||
| Non-accelerated filer | ¨ (Do not check if a smaller reporting company) | Smaller reporting company | ¨ | |||
Indicate by check mark whether the registrant is a shell company (as defined in Rule 12b-2 of the Act). Yes ¨ No þ
As of June 30, 2009, the aggregate market value of the registrant’s common stock held by non-affiliates of the registrant was approximately $542 million, based on the closing price of the registrant’s common stock on The NASDAQ Global Market of $31.99 per share on June 30, 2009.
The number of outstanding shares of the registrant’s common stock, par value $0.001 per share, was 17,360,097, as of February 18, 2010.
DOCUMENTS INCORPORATED BY REFERENCE
Portions of the registrant’s Definitive Proxy Statement to be filed with the Securities and Exchange Commission pursuant to Regulation 14A in connection with the registrant’s 2010 Annual Meeting of Stockholders to be held on June 1, 2010, are incorporated herein by reference into Part III of this Annual Report on Form 10-K. Such Definitive Proxy Statement will be filed with the Securities and Exchange Commission not later than 120 days after December 31, 2009.
Table of Contents
GENOPTIX, INC.
FORM 10-K—ANNUAL REPORT
For the Fiscal Year Ended December 31, 2009
i
Table of Contents
PART I
Forward-Looking Statements
The information in this Annual Report on Form 10-K contains forward-looking statements and information within the meaning of Section 27A of the Securities Act of 1933, as amended, or the Securities Act, and Section 21E of the Securities Exchange Act of 1934, as amended, or the Exchange Act, which are subject to the “safe harbor” created by those sections. These forward-looking statements include, but are not limited to, statements concerning our strategy, future operations, future financial position, future revenues, projected costs, prospects and plans and objectives of management. The words “anticipates,” “believes,” “estimates,” “expects,” “intends,” “may,” “plans,” “projects,” “will,” “would” and similar expressions are intended to identify forward-looking statements, although not all forward-looking statements contain these identifying words. We may not actually achieve the plans, intentions or expectations disclosed in our forward-looking statements and you should not place undue reliance on our forward-looking statements. These forward-looking statements involve known and unknown risks and uncertainties that could cause our actual results, performance or achievements to differ materially from those expressed or implied by the forward-looking statements, including, without limitation, the risks set forth in Part I, Item 1A, “Risk Factors” in this Annual Report on Form 10-K and in our other filings with the Securities and Exchange Commission, or SEC.
Forward-looking statements include, but are not limited to, statements about:
| • | the expected reimbursement levels from governmental payors and private insurers; |
| • | application of existing laws, rules and regulations, including without limitation, Medicare laws, anti-kickback laws, Health Insurance Portability and Accountability Act of 1996, or HIPAA, including amendments thereto by the Health Information Technology for Economic and Clinical Health Act, or the HITECH Act, regulations, state medical privacy laws, federal and state false claims laws and corporate practice of medicine laws, to our business and the services we provide; |
| • | regulatory developments in the United States; |
| • | our ability to maintain our license under Clinical Laboratory Improvement Amendments of 1988, or CLIA; |
| • | our ability to expand our operations and increase our market share; |
| • | our ability to expand our service offerings by adding new testing capabilities; |
| • | our ability to compete with other clinical diagnostic laboratories; |
| • | our expected growth in revenues and profitability; |
| • | the ability of Cartesian Medical Group, Inc., or Cartesian, to hire and retain an adequate number of highly trained hematopathologists; |
| • | our ability to hire and retain sufficient managerial, sales, clinical and other personnel to meet our needs; |
| • | our ability to successfully scale our business, including expanding our facilities, our backup systems and infrastructure; and |
| • | the accuracy of our estimates regarding reimbursement, expenses, future revenues and capital requirements. |
These forward-looking statements represent our management’s beliefs and assumptions only as of the date of this Annual Report on Form 10-K. You should read this Annual Report on Form 10-K, and the documents that we reference in this Annual Report on Form 10-K and have filed as exhibits, completely and with the understanding that our actual future results may be materially different from what we expect.
1
Table of Contents
Except as required by law, we assume no obligation to update these forward-looking statements publicly, or to update the reasons actual results could differ materially from those anticipated in these forward-looking statements, even if new information becomes available in the future.
Overview
We are a specialized laboratory service provider focused on delivering personalized and comprehensive diagnostic services to community-based hematologists and oncologists, or hem/oncs. Our highly trained group of hematopathologists, or hempaths, utilizes sophisticated diagnostic technologies to provide a differentiated, specialized and integrated assessment of a patient’s condition, aiding hem/oncs in making vital decisions concerning the treatment of malignancies of the blood and bone marrow, and other forms of cancer.
Our key service offerings, COMPASSSM and CHART®, are designed to meet the specific needs of community-based hem/oncs. Our COMPASS service offering includes the determination by our hempaths of the appropriate diagnostic tests to be conducted and the performance of these tests. We then evaluate, synthesize and summarize the results into an easy to read comprehensive report, and our hempaths are available to interpret these results jointly with the hem/onc, giving them the benefit of our expertise and analytical experience. Our CHART service offering combines multiple COMPASS assessments and analyses of disease progression after intervening clinical action, providing the hem/onc with a valuable diagnostic tool to track both a patient’s disease and response to the hem/onc’s prescribed treatment regimen over time.
Our revenue growth rate reflects the value of our differentiated service offerings to these community-based hem/oncs. Our revenues increased 59% to $184.4 million for the year ended December 31, 2009, up from $116.2 million for the year ended December 31, 2008. Income from operations increased 102% to $53.8 million for the year ended December 31, 2009 up from $26.6 million for the year ended December 31, 2008, despite our increased investment in personnel, associated employee related costs and facility expansion costs.
Management has continued efforts to ensure that office and laboratory space is appropriate to accommodate the necessary capacity requirements to meet our current and expanding business. Specifically, as of December 31, 2009, we occupied approximately 116,000 square feet of office and laboratory space in two separate facilities. In June 2009, we entered into a lease agreement for approximately 44,000 square feet of space in Carlsbad, California to be used for laboratory space. This facility is currently undergoing improvements and is expected to be ready for our use in the second quarter of 2010. In January 2010, we entered into a purchase agreement to acquire this facility and related land. Additionally, in January 2010 we entered into a lease agreement for approximately 33,000 square feet of space in Carlsbad, California to be used as a customer service and support facility. This facility will be undergoing tenant improvements and is expected to be ready for our use in the second quarter of 2010. When we complete the improvements for the additional space, we expect to have approximately 193,000 square feet of total available office and laboratory space in Carlsbad, California. See further discussion of these transactions within Note 10, Subsequent Events, in the accompanying notes to our consolidated financial statements included elsewhere in this Annual Report on Form 10-K.
We were incorporated in Delaware in January 1999. Our principal executive offices are located at 1811 Aston Avenue, Carlsbad, California 92008 and our telephone number is (760) 268-6200. Our corporate website address is www.genoptix.com to which we regularly post copies of our press releases, as well as additional information about us. We do not incorporate the information contained on, or accessible through, our website into this Annual Report on Form 10-K, and you should not consider it part of this Annual Report on Form 10-K. Unless the context indicates otherwise, as used in this Annual Report on Form 10-K, the terms “Genoptix,” “Genoptix Medical Laboratory,” “we,” “us” and “our” refer to Genoptix, Inc., a Delaware corporation, Cartesian and Genoptix, PR LLC, our wholly-owned subsidiary located in Puerto Rico. Genoptix, Inc. does business as Genoptix Medical Laboratory and Genoptix Clinical Laboratory.
2
Table of Contents
We file our annual reports on Form 10-K, quarterly reports on Form 10-Q, current reports on Form 8-K, amendments to those reports, and other information with the SEC. The public may also read and copy any document we file with the SEC at its public reference facilities at 100 F Street NE, Washington, D.C. 20549, by calling the SEC at 1-800-SEC-0330, or by accessing the SEC’s website at www.sec.gov, where the SEC maintains reports, proxy and information statements and other information regarding Genoptix and other issuers that file electronically with the SEC. In addition, as soon as reasonably practicable after such materials are filed with or furnished to the SEC, we make copies available to the public free of charge through our website at www.genoptix.com. We also regularly post on our corporate website copies of our press releases as well as additional information about us. Interested persons can subscribe on our website to email alerts that are sent automatically when we issue press releases, file our reports with the SEC or certain other information is available.
Segment and Geographic Information
We identify our operating segments based on business activities, management responsibility and geographical location. For all periods presented, we operated in a single business segment. For 2009, less than 1% of our revenue was generated outside of the United States and related territories.
Our Approach
Our customer-centric service model enables us to deliver what we believe is superior value to our hem/onc customers and distinguishes us from other diagnostic service providers.
Once a hem/onc notifies us about a blood or bone marrow specimen to be analyzed, we arrange for its prompt pick-up and transport to our laboratory for analysis. Samples are tracked real time throughout transport, substantially reducing the risk of sample loss. After receiving the specimen in our state-of-the-art laboratory, one of our hempaths conducts a detailed review of all documents and materials relating to the patient case. The hempath then determines the acuity and urgency of the patient case and whether immediate intervention may be required by the hem/onc, and confirms that the appropriate tests are ordered and conducted. We then assign the entire patient case to a single hempath, who interprets and integrates all test results.
By ordering our COMPASS service offering, the hem/onc authorizes our hempath to determine the appropriate diagnostic tests to be performed, and our hempath then integrates patient history and previous and current test results into a comprehensive diagnostic report. As part of our CHART service offering, the hem/onc also receives a detailed assessment of a patient’s disease progression over time.
Our clinical services coordinators, or CSCs, work with the hempath responsible for the patient case to ensure the quality, completeness and consistency of the report. A detailed report including results of all tests performed is delivered either through eCOMPASS, our secure web-based patient reporting system, by facsimile, courier or mail, direct interface into our customer’s information system or printer, or personally over the telephone, based upon the preference of the ordering hem/onc. In addition, our hempath responsible for the patient case is clearly identified and readily available to discuss any aspect of the patient case with the ordering hem/onc.
We believe this integrated approach provides a key service to community-based hem/oncs and enables us to capitalize on a large, unmet market opportunity.
Market Overview and Opportunity
We focus on marketing our specialized diagnostic services to community-based hem/oncs treating malignancies of the blood and bone marrow, and other forms of cancer. According to the National Cancer Institute, or NCI, and the Surveillance Epidemiology and End Results, or SEER, Cancer Statistics Review; there
3
Table of Contents
were more than 850,000 patients in the United States living with malignancies or pre-malignant diseases of the blood and bone marrow in 2009, with more than 150,000 new cases being diagnosed each year. A 2008 survey by the American Medical Association, or AMA, reports that these patients are served through approximately 12,500 practicing hem/oncs, and that approximately 76% of these hem/oncs practice in the community setting. According to the AMA, from 1998 to 2008, the number of practicing hem/oncs grew at an annual rate of approximately 3.7%, significantly outpacing the approximately 2.3% overall annual growth in physicians in the United States.
In order for hem/oncs to make the correct diagnosis, choose or modify appropriate therapeutic regimens and monitor the effectiveness of these regimens, they require highly specialized diagnostic services. Serial blood and bone marrow examinations are typically performed to follow the progress of the disease and the patient’s response to therapy. The typical bone marrow case consists of histopathology, flow cytometry, molecular testing and cytogenetic assessments. In 2009, approximately 50% of our patient cases consisted of bone marrow cases and the other 50% consisted primarily of peripheral blood-based cases. Based on our experience to-date and Medicare reimbursement rates that were effective as of January 1, 2009 for these procedures, the average bone marrow case generates service revenues of at least $3,000. The typical blood-based case does not require the same degree of complexity as a bone marrow case and generally consists of only one or more of the assessments typically performed in a bone marrow case, or a Circulating Tumor Cell, or CTC, test. Based on our experience to-date and Medicare reimbursement rates that were effective as of January 1, 2009 for these procedures, blood-based cases generate service revenues ranging from approximately $100 per case up to $3,000 per case or more, depending upon the tests included in each case. Based upon estimates from the Centers for Medicare and Medicaid Services, or CMS, we believe there are more than 375,000 bone marrow procedures performed annually in the United States, each of which includes at least one bone marrow test, and that the bone marrow testing market alone represents approximately $1.0 billion opportunity annually. In addition, based upon our patient case mix and the number of people diagnosed with malignancies and pre-malignancies of the blood and bone marrow each year, we believe there are more than 250,000 of our kind of blood-based tests performed annually in the United States.
The market for specialized laboratory services for both bone marrow and blood-based testing has historically been served by hospital pathologists, esoteric testing laboratories, national reference laboratories and academic laboratories, each of which has its own strengths, but none of which exclusively focuses on the specific needs of community-based hem/oncs. Our service offerings, which are based on a comprehensive assessment of a specific patient case by using sophisticated diagnostic technologies, have been specifically built around these unmet needs of the community-based hem/oncs, and, we believe, address their need for specialized diagnostic services of complex, individual patient cases.
Our Competitive Strengths
Personalized and Comprehensive Approach Focused on the Specific Diagnostic Needs of Community-Based Hem/Oncs
Our entire process from specimen collection to delivery of a comprehensive diagnostic report is tailored to the specific needs of the community-based hem/onc. Upon arrival of a specimen at our facilities, one of our hempaths conducts a detailed review of the patient case, determines its acuity and urgency and whether immediate intervention may be required, and ensures that the appropriate tests are ordered and conducted. We then assign the entire patient case to a single hempath, who interprets and integrates all test results. In our COMPASS and CHART service offerings, our hempath integrates patient history and current and previous test results into a comprehensive summary diagnosis. As part of our CHART service offering, the hem/onc also receives a detailed assessment of a patient’s disease progression over time. In addition, our hempath responsible for the patient case is clearly identified and readily available to the ordering hem/onc to personally discuss any aspect of the patient case. We believe that this approach better serves the specific needs of community-based hem/oncs by providing a differentiated, specialized and integrated service and key diagnostic tools that enable them to provide better patient care.
4
Table of Contents
Differentiated Value Proposition Through COMPASS and CHART Service Offerings
Our key service offerings, COMPASS and CHART, are specifically designed to address the unmet needs of community-based hem/oncs. Our COMPASS service offering involves the determination by our hempaths of the appropriate diagnostic tests to be conducted and the performance of these tests. We then evaluate, synthesize and summarize the results into an easy to read comprehensive report, and our hempaths are available to interpret these results jointly with the hem/onc, giving them the benefit of our expertise and analytical experience. Our CHART service offering combines multiple COMPASS assessments and analyses of disease progression after intervening clinical action, providing the hem/onc with a diagnostic tool to track both a patient’s disease and response to the hem/onc’s prescribed treatment regimen. We believe our COMPASS and CHART service offerings facilitate efficient and effective patient care by providing hem/oncs with a clear, concise and actionable diagnosis rather than just providing individual test results.
Highly Trained and Specialized Personnel
Our highly trained and specialized sales representatives, hempaths and CSCs are an important factor in providing our services and enabling our growth.
Our sales representatives are highly experienced, with strong technical knowledge and an extensive understanding of the community-based hem/onc’s practice. Each of our sales representatives typically has a four-year Bachelor of Science or Arts degree, preferably in the biological sciences, a three-to five-year history selling diagnostic services or specialty pharmaceuticals directly to hem/oncs, and has completed extensive in-house sales training programs, including training on applicable regulatory and compliance issues.
Our extensive staff of hempaths has over 210 years of combined hematopathology expertise. Their credentials and substantial experience with highly challenging diagnoses permits them to collaboratively discuss difficult cases in a manner typically found in an academic setting.
Our CSCs are an integral component of our focus on quality and are responsible for the review and quality of every test report before it is sent to the customer. All of our CSCs have a minimum of a Bachelor of Science or Arts degree in the biological sciences or substantial relevant industry experience.
We believe our highly trained and specialized national sales force focused exclusively on community-based hem/oncs, combined with the expertise of our hempaths and the quality assurance provided by our CSCs, results in a higher quality, customer-friendly service offering to community-based hem/oncs.
Experienced Management Team and Metric Driven Culture
We are led by Tina S. Nova, Ph.D., our president and chief executive officer. In addition to her work with us, Dr. Nova has been involved in the co-founding of three life science companies, two of which completed initial public offerings, or IPOs, and one of which was acquired. As our chief executive officer, Dr. Nova leads an experienced executive management team with an average of more than 22 years of healthcare industry, financial, legal or operational experience. Our management team has created a culture of accountability throughout the organization in which we track the performance of our services real time and use our extensive internal systems and processes to continuously measure the performance of our business operations. For example, we track and measure the daily average speed for answering calls, the percentage of calls answered live, the average turn around time for each of our services and general customer buying patterns, including cases per month, frequency of orders and tests per case. We believe that our metric driven culture results in higher quality services, increased customer satisfaction and improved productivity.
5
Table of Contents
Our Growth Strategy
Our objective is to become the leading specialized laboratory service provider focused on delivering personalized and comprehensive diagnostic services to community-based hem/oncs and to continue to capitalize on our diagnostic service offerings to increase our market share, revenues and profitability, while meeting the needs of our community-based hem/onc customers. In furtherance of this objective, our growth strategy has the following key elements:
Expand Our Organization and Infrastructure
Based on case volume and the estimated total number of blood and bone marrow procedures nationwide, we estimate our current market share for bone marrow procedures at approximately 7% and that the U.S. bone marrow testing market alone represents an approximately $1.0 billion opportunity. For the foreseeable future, we intend to continue to grow our market share by increasing our personnel, including sales personnel, hempaths, CSCs, scientists, laboratory technicians and administrative employees, as well as expanding our facility and information systems infrastructure. These continued investments will enable us to visit more hem/oncs more frequently and inform them more fully of our service offerings, while maintaining our existing relationships with hem/oncs and current high standards of customer service. As our name becomes more recognized and our existing sales force becomes more established in its markets, we believe that our sales force productivity should increase and the time it takes new field sales representatives to reach their full potential and the average cost per sale should decrease. Additionally, as we have grown and become a larger enterprise, we have continued efforts to strengthen our organizational structure through planned investment in key mid-level management personnel in the areas of laboratory operations, sales, marketing, business development, customer service and administration.
Management has continued efforts to ensure that office and laboratory space is appropriate to accommodate the necessary capacity requirements to meet our current and expanding business. Specifically, as of December 31, 2009, we occupied approximately 116,000 square feet of office and laboratory space in two separate facilities. In June 2009, we entered into a lease agreement for approximately 44,000 square feet of space in Carlsbad, California to be used for laboratory space. This facility is currently undergoing improvements and is expected to be ready for our use in the second quarter of 2010. In January 2010, we entered into a purchase agreement to acquire this facility and related land. Additionally, in January 2010 we entered into a lease agreement for approximately 33,000 square feet of space in Carlsbad, California to be used as a customer service and support facility. This facility will be undergoing tenant improvements and is expected to be ready for our use in the second quarter of 2010. See further discussion of these transactions within Note 10, Subsequent Events, in the accompanying notes to our consolidated financial statements included elsewhere in this Annual Report on Form 10-K. We believe that our current facilities, including those currently undergoing improvements, are adequate for our needs for the immediate future. When we complete the improvements for the additional space, we expect to have approximately 193,000 square feet of total available office and laboratory space in Carlsbad, California. We believe that, should it be needed, suitable additional space will be available to accommodate expansion of our operations on commercially reasonable terms.
Expand Service Offerings to Hem/Oncs
We intend to continue to be among the first to market with new technologies and innovations as the standard of care for the diagnosis and treatment of malignancies of the blood and bone marrow and other forms of cancer evolves. We believe that by continuously enhancing and supplementing our service offerings, we will further strengthen our relationships with hem/oncs and expand our revenue opportunities. For example, we believe we were the first commercial laboratory to offer a comprehensive assessment of a patient case through our COMPASS service offering; the first commercial laboratory to offer mutation testing for Janus Kinase 2, a new molecular diagnostic test for a subtype of leukemia; the first commercial laboratory to offer molecular testing for the MPL W515 L/K mutation used in characterizing another leukemia subtype. In addition, through our CHART service offering, we believe we are currently the only commercial laboratory with the capability of consistently
6
Table of Contents
offering a specific product which provides an analysis of disease progression over time after intervening clinical action. Over the next few years, we anticipate a number of additional blood-based assays for liquid and solid tumors will become available. We intend to pursue being one of the first laboratories to commercialize these new assays for the community-based hem/onc market segment.
In 2009, we launched three additional solid tumor assays, K-RAS Mutation Analysis, B-RAF Mutation Analysis and EGFR Amplification Analysis and solid tumor evaluation, to enable us to further benefit our hem/onc customers. K-RAS Mutation Analysis and EGFR Amplification Analysis are based upon formalin-fixed, paraffin-embedded, or FFPE, tissue blocks. These samples are blocks of tumor-containing tissue that remain from the original patient biopsy or other prior diagnostic work-up. They have a nearly perpetual shelf life as the cells are fixed and practically permanently preserved. FFPE tissue has therefore become useful as a tissue source for various modern, molecular–based testing technologies such as PCR and certain cytogenetic assays. The K-RAS Mutation Analysis assay assists hem/oncs with certain therapy choices for treatment of colorectal and non-small cell lung cancer. The EGFR Amplification Analysis assay assists hem/oncs in identifying patients who are likely candidates for certain epidermal growth factor receptor, or EGFR, targeted cancer therapies. B-RAF Mutation Analysis is helpful in the management of colorectal cancer. B-RAF Mutation Analysis identifies mutations in the B-RAF gene as an indicator of less than favorable prognosis.
In January 2010, we launched our newest service offering, NexCourse SM , a comprehensive molecular evaluation for colorectal carcinoma. NexCourse offers physician directed case management and expands our COMPASS and CHART service approaches to solid tumor indications. NexCourse provides a comprehensive diagnostic service for solid tumor testing and indicates whether or not a patient is likely to respond to certain treatments, and which treatments may be ineffective or toxic. NexCourse provides our hem/onc customers with a consultation report that provides actionable results in a concise, patient-specific and correlated report with clinically relevant information to assist them with treatment decisions.
These new offerings provide us the opportunity to enhance our service offerings to our hem/onc customers to serve a broader array of cancer patients. Although these assays are technically demanding, we believe these additional service offerings will provide our hem/onc customers with diagnostic tools that provide clearer direction on what were previously very difficult medical dilemmas.
Pursue Additional Collaborations and Acquisitions to Supplement Our Business
We intend to opportunistically pursue additional collaborations with pharmaceutical companies and acquisitions or in-licensing of businesses, products or technologies that will enable us to accelerate the implementation of our strategic plan and to increase the number of hem/onc customers we serve and/or expand the services we provide to them, including by way of investments in other companies, licensing of technology, co-development arrangements, collaborations, asset purchases and other similar transactions. For example, we currently provide specialized testing services and access to our hempaths through collaborations with select pharmaceutical companies. We expect these collaborations to continue to grow over time, which we believe will improve our financial performance and name recognition and reputation among hem/oncs, and potentially provide us with early access to new technologies available for commercialization. We expect annual revenues from these collaborations to remain at approximately 1% of our total annual revenues in 2010.
Our Services
Our key service offerings include COMPASS and CHART. Test requisitions for more than half of the patient samples we processed for the years ended December 31, 2009, 2008 and 2007 included our COMPASS or CHART service offerings. We introduced CHART in the first quarter of 2007 and believe that it provides significant value to hem/oncs in their efforts to evaluate the effectiveness of the prescribed treatment regimen
7
Table of Contents
over time. The following diagnostic services and non-proprietary technologies, each of which include professional interpretation by our hempaths and utilize complex and sophisticated instrumentation operated by highly trained personnel, can be ordered individually or, for hematomalignancies, as part of our COMPASS or CHART service offerings:
| • | Histopathology—expert microscopic evaluation of blood or bone marrow material in order to identify the nature and extent of disease; |
| • | Flow Cytometry—a quantitative method to characterize the maturation level of cells and measure the type and amount of leukemia/lymphoma via automated assessment of cellular surface characteristics; |
| • | Cytogenetics—a suite of methods designed to reveal changes and/or abnormalities at the level of the chromosome in order to identify malignant processes and to assist in the prognosis of a malignancy; |
| • | Molecular—a quantitative method to follow progression of disease and response to therapy at the genetic level (DNA and RNA); and |
| • | CTC—identification and enumeration of tumor cells circulating in the blood of metastatic breast, colon and prostate cancer patients. |
Sales and Marketing
We believe our sales and marketing approach distinguishes us from our competitors. Most of our sales representatives have a four-year Bachelor of Science or Arts degree, primarily in the biological sciences, and a three-to five-year history selling diagnostic services or niche pharmaceuticals directly to hem/oncs. Each of them has completed extensive in-house sales training programs, including training on applicable regulatory and compliance issues. We have organized our sales force and customer-facing commercial teams into regional business units, led by regional directors and district managers, all working together to coordinate the sales, service and support personnel for that particular region. We believe this regional business unit model allows us to add additional sales and support resources to a particular territory while maintaining our existing relationships with community-based hem/oncs and a high level of management control.
Each of our field sales representatives receives a base salary commensurate with his or her years of experience and sales commissions based upon actual sales performance against his or her territory-specific sales budget. We also offer periodic promotional sales contests in which each sales representative may receive various incentives.
We have an extensive field sales force that has increased to 80 and now operate out of 32 states nationwide as of February 18, 2010. They focus exclusively on community-based hem/oncs and their office staff. Our increased field sales representatives have enabled us to penetrate more accounts over a wider geographic area, increase our customer base and further focus our field sales representatives on in-person customer visits. Our sales force productivity has increased primarily as a result of enhanced recognition in the market, smaller geographies per sales representative, price increases, expanded service offerings and efficiencies realized from a more experienced sales force, which included expanding our sales management team to 19 as of February 18, 2010. We intend to hire additional field sales representatives throughout the United States and anticipate that we will eventually have field sales representatives in nearly all of the 48 contiguous states. Currently, there are several geographic regions in which one sales representative services community-based hem/onc customers in several states and we intend to hire additional field sales representatives in these areas. We expect to continue to focus our marketing and selling efforts on community-based hem/oncs and their office staff. Our sales representatives are highly experienced, with strong technical knowledge and an extensive understanding of the community-based hem/onc’s practice. They concentrate on a geographic area determined by the size and number of practicing community-based hem/oncs in that area. Selling efforts are conducted through visits to community-based hem/onc offices. Our field sales representatives inform the hem/oncs and their office staff of the value of our service offerings to assist them in making vital decisions concerning the treatment of malignancies of the
8
Table of Contents
blood and bone marrow, and other forms of cancer. Our field sales representatives are skilled in probing the unmet needs of the community-based hem/onc and their office staff with regard to specialized diagnostic services and discussing the features and benefits of our service offerings. Additionally, our field sales representatives provide follow-up sales and service calls to the community-based hem/onc office to ensure we are continuing to meet their needs and expectations for our service offerings, and to explore the possibility of other opportunities for the community-based hem/onc to use our specialized diagnostic services. This approach allows our field sales representatives to build and enhance relationships with our customers, helping us to better understand their needs and develop new service offerings. Further, we have grown our regionally based team of managed care account executives, who will continue to build relationships with our payors. We believe the expansion of our sales force in the future will enable us to visit more hem/oncs more frequently and inform them more fully of our service offerings, while maintaining our relationships with hem/oncs and current high standards of customer service.
We have developed an extensive library of sales and marketing materials to support our sales efforts. Our marketing materials are targeted at three distinct decision makers with respect to our services: community-based hem/oncs; office staff and medical assistants; and patients. Materials for hem/oncs focus on education and description of our differentiated and unique workflow as applied to the diagnosis of hematomalignancies. This includes detailed descriptions of how we manage patient cases as compared to traditional laboratory services providers, updates on new diagnostic technologies and synopses from recent medical meetings regarding malignancies of the blood and bone marrow, and other forms of cancer. Materials for office staff and medical assistants focus on practice workflow issues and highlight proper sample preparation, as well as basic information on new diagnostic technologies. We also offer field-based training for medical assistants advising them on the proper technique for making blood and bone marrow smears to ensure we receive optimal specimens. Our marketing materials for patients address, in simple terms, questions about the technologies used to diagnose disease and concerns about billing and insurance issues.
Competition
As a specialized diagnostic service provider, we rely extensively on our high quality of service to attract and retain community-based hem/oncs and other healthcare professionals as our customers. We compete primarily based on the quality of testing, reporting and information systems, reliability in patient sample transport, reputation in the medical community and access to our highly qualified hempaths and new technologies and tests as they become available. Our primary competitors include hospital pathologists, esoteric testing laboratories, national reference laboratories and academic laboratories.
Hospital Pathologists. Pathologists located within a hospital have traditionally provided most of the diagnostic services required by community-based hem/oncs. These pathologists typically rely on close interaction with the treating physician, including face-to-face contact if necessary. However, only very large hospitals tend to retain hempaths on staff, and most general pathologists do not have the expertise in hematology/oncology necessary to perform all the specialized services required by hem/oncs.
Esoteric Testing Laboratories. Esoteric testing laboratories typically are specialized regional centers focused on servicing hospitals and hospital-based pathologists, oftentimes maintaining a staff of hempaths on site that can provide support in the interpretation of certain results. The business models of these laboratories tend to be focused on the efficient delivery of individual tests rather than the comprehensive assessments of specific cases, and their target groups tend to be hospital pathologists as opposed to community-based hem/oncs.
National Reference Laboratories. National reference laboratories typically offer a full suite of tests for a variety of medical professionals including general practitioners, hospitals and pathologists. This emphasis on providing a broad product portfolio of commoditized tests at the lowest possible price tends to limit these laboratories’ ability to handle highly complex samples requiring special attention, such as bone marrow specimens. In addition, national reference laboratories tend not to provide ready access to a medical professional for interpretation of test results or a specialized focus on the needs of community-based hem/oncs.
9
Table of Contents
Academic Laboratories. Academic laboratories generally provide state-of-the-art technology and expertise. These laboratories are typically pursuing multiple activities and goals such as research and education or are committed to their own hospitals. This limits the attractiveness of academic laboratories to outside hem/oncs, who tend to have focused specialized needs.
Examples of our competitors include Genzyme Corporation, Quest Diagnostics Incorporated, Laboratory Corporation of America and Bio-Reference Laboratories, Inc. We believe that we can continue to effectively compete in our industry based on our differentiated services that offer community-based hem/oncs the technical expertise of an esoteric testing laboratory, the customer intimacy of a hospital pathologist and the state-of-the-art technology of an academic laboratory, while maintaining a specialized service focus that is not typically available from national reference laboratories that cover a broad range of medical specialties. We believe that our customer-focused and highly trained and knowledgeable sales force will continue to effectively differentiate our services from those of our competitors.
Quality Assurance
We consider the quality of our diagnostic services to be of critical importance, and we have established a comprehensive quality assurance program for our laboratory designed to drive accurate and timely test results and to ensure the consistent high quality of our testing services. In addition to the compulsory proficiency programs and external inspections required by CMS and other regulatory agencies, we have developed a variety of internal systems and procedures to emphasize, monitor and continuously improve the quality of our operations.
External Proficiency/Accreditations
We participate in numerous externally-administered quality surveillance programs, and our laboratory is accredited by the College of American Pathology, or CAP.
The CAP accreditation program involves both unannounced on-site inspections of the laboratory and participation in CAP’s ongoing proficiency testing program for all testing categories. CAP is an independent non-governmental organization of board-certified pathologists which accredits, on a voluntary basis, laboratories nationwide, and which has been accredited by CMS to inspect clinical laboratories to determine adherence to the CLIA standards. A laboratory’s receipt of accreditation by CAP satisfies the Medicare requirement for participation in proficiency testing programs administered by an external source, one of Medicare’s primary requirements for reimbursement eligibility. Our most recent CAP inspection was successfully completed in October 2008.
Internal Quality Control
We maintain internal quality controls by running samples with known diagnosis at the same time as patient samples are submitted for testing. We also have an extensive, internally administered program of blind sample proficiency testing (i.e., the testing laboratory does not know the sample being tested is a quality control sample). In addition, our CSCs are an integral component of our focus on quality—they are responsible for the review and quality of every test report before it is sent to the hem/onc customer and work with the hempath responsible for the report to ensure its quality, completeness and consistency. All of our CSCs have a minimum of a Bachelor of Science or Arts degree in the biological sciences or substantial relevant industry experience.
Information Systems
We have developed and implemented management information systems that support our operations as well as strategically position us for long-term growth in light of what we anticipate to be evolving market trends. We believe our information systems are secure and robust, and we maintain an off-site backup of all our data and
10
Table of Contents
e-mail systems on a regular basis. We track the performance of our services real time and provide our customers with progress reports upon request. We have also created extensive systems and processes to measure the performance of our business operations via daily monitoring of several hundred individual variables that provide insight on quality, productivity, profitability, performance-to-plan, customer buying patterns, customer communications, market share, suppliers and reimbursement. In addition, we provide our hem/onc customers with secure web-based patient reporting through eCOMPASS, which provides HIPAA compliant, encrypted notification of report availability via e-mail, remote access to reports, various search capabilities, the ability to print reports on demand, interfaces to electronic medical record systems, access to all previous patient reports for a particular patient and updates on testing services.
Billing and Reimbursement
Billing
Billing for diagnostic services is generally highly complex. We have implemented customer-friendly-billing processes that permit direct billing of third party payors and that accept all payor policies for “in-network” providers in those states where this type of treatment is permitted. Our billing system generates contractual adjustments for each case at the time it is billed, based on the applicable fee schedule associated with the patient’s insurance plan. This billing model is designed to reduce the complexity of billing arrangements that are typical in our industry and to minimize errors in processing and administrative burdens on our hem/onc customers. However, depending on our billing arrangement with each third party payor and applicable law, we are often obligated to bill in the specific manner prescribed by the various payors, such as private insurance companies, managed care companies, governmental payors such as Medicare and Medicaid, physicians, hospitals and employer groups, each of which may have different billing requirements. Additionally, the audit requirements we must meet to ensure compliance with applicable laws and regulations as well as our internal compliance policies and procedures add further complexity to the billing process. Other factors that complicate billing include:
| • | variability in coverage and information requirements among various payors; |
| • | missing, incomplete or inaccurate billing information provided by ordering physicians; |
| • | billings to payors with whom we do not have contracts; |
| • | disputes with payors as to which party is responsible for payment; |
| • | disputes with payors as to the appropriate level of reimbursement; and |
| • | collection of patient receivables from copays, coinsurance or deductibles. |
Billing for diagnostic services in connection with governmental payor programs is subject to numerous federal and state regulations and other requirements, resulting in additional costs to us. These additional costs include those related to: (1) increased complexity in our billing due to the additional procedures and processes required by governmental payor programs; (2) training and education of our employees and customers; (3) compliance and legal costs; and (4) costs related to, among other factors, medical necessity denials and the absence of advance beneficiary notices.
We are focused on carefully preparing claim submissions to minimize missing or incorrect information to facilitate billing and claims processing, and we have an internal billing and collections department that is devoted to mitigating unpaid claims. Our allowance for doubtful accounts has been provided for at the rate of approximately 2% and 3% of revenues for the years ended December 31, 2009 and 2008, respectively. Our days sales outstanding, or DSO, averaged 56 days in 2009, which was consistent with 56 days in 2008. As of December 31, 2009 and 2008, our DSO was 62 days and 53 days, respectively. The increase in our DSO as of December 31, 2009, pertains primarily to the timing of payments relating to certain contracted payors. We expect to maintain our average DSO levels into 2010 as we continue to pursue improvements to our collection procedures and work with our payors to ensure timely processing of reimbursement payments.
11
Table of Contents
Reimbursement
We provide diagnostic services primarily to community-based hem/oncs; however, our diagnostic service revenues may come from several sources. Depending on the billing arrangement and applicable law, the party that reimburses us for our services may be (1) the authorized party (such as a hospital, another laboratory or an employer) who ordered the testing service or otherwise referred the services to us, (2) a third party who provides coverage to the patient, such as an insurance company, managed care organization or a governmental payor program or (3) the patient. For the years ended December 31, 2009 and 2008, we derived approximately 59% and 60%, respectively, of our revenues from private insurance, including managed care organizations and other healthcare insurance providers, 40% and 38%, respectively, from Medicare and Medicaid and 1% and 2%, respectively, from other sources.
Because a large percentage of our revenue is derived from the Medicare program, the coverage and reimbursement rules are significant to our operations. As a Medicare-participating laboratory based in California, we bill the Medicare program’s California contractor and are subject to that contractor’s local coverage and reimbursement policies.
The Medicare Modernization Act of 2003, or MMA, mandated creation of Medicare Administrative Contractors, or MACs, replacing the current system of fiscal intermediary and carrier contractors who oversee fee-for-service claims for the Medicare Part A and Part B programs. In November 2007, CMS awarded the MAC Jurisdiction 1 (California, Hawaii, Nevada, American Samoa, Guam and the Northern Mariana Islands) to Palmetto GBA. The full transition to Palmetto GBA occurred effective September 2, 2008. Regulations became effective in 2003 which required MAC’s to issue local coverage determinations, or LCD’s, instead of local medical review policies, or LMRP’s. An LCD is a decision by a fiscal intermediary, or FI, carrier or MAC, on a local geographic basis (depending on the jurisdiction of the contractor), regarding whether an item or service is reasonable and necessary. The rules required MAC’s, over a 2-year period, to convert all existing LMRP’s into LCDs, placing only the “reasonable and necessary” provisions of the LMRP in the LCD. The remaining information (benefit category, statutory exclusion and coding provisions) was to be left in the LMRP or deleted. New LCD’s related to our specialized diagnostic services were introduced as a result of the consolidation of LCD’s and LMRP’s. In our experience with the current contractor, however, we have found their local coverage and reimbursement policies to be generally similar to those of its predecessor.
Reimbursement under the Medicare program for our specialized diagnostic services is subject to both the national Medicare clinical laboratory fee schedule and physician fee schedule. Both schedules are typically updated annually and subject to geographic adjustments. The physician fee schedule is designed to set compensation rates for those medical services provided to Medicare beneficiaries who require a degree of physician supervision. Outpatient clinical diagnostic laboratory tests are traditionally paid according to the clinical laboratory fee schedule. However, although the clinical laboratory fee schedule is generally the only basis of payment that can be made by the Medicare program with respect to most clinical laboratories, certain laboratory tests performed by physicians are exempt from the clinical laboratory fee schedule and are paid under the physician fee schedule. As a result, most of the services provided by us are reimbursed under the physician fee schedule.
The clinical laboratory fee schedule sets the maximum amount payable under Medicare for each specific laboratory billing code. We bill the program directly and must accept the scheduled amount as payment in full for covered tests performed on behalf of Medicare beneficiaries. Those services reimbursed under the clinical laboratory fee schedule generally do not result in coinsurance amounts but may result in beneficiary deductible responsibility. Payment under the clinical laboratory fee schedule has been limited from year-to-year by Congressional action such as imposition of national limitation amounts and freezes on the otherwise applicable annual consumer price index, or CPI, updates. Although the CPI update of the clinical laboratory fee schedule has been frozen since 2004 by the Medicare Prescription Drug Improvement and Modernization Act of 2003, after July 1, 2009, the freeze on the clinical laboratory fee schedule was updated using the percentage increase for the CPI from the previous 12-month (measured July through June) period minus 0.5%. On July 15, 2009, the
12
Table of Contents
CPI for 2009 was released and it showed a year over year decline of 1.4%. This implies that clinical laboratories will receive a 1.9% rate decrease from Medicare in 2010 as compared to the 4.5% rate increase that the laboratories experienced under the 2009 clinical laboratory fee schedule. The payment amounts under the Medicare clinical laboratory fee schedule are important not only for our reimbursement under Medicare, but also because the schedule often establishes the payment amounts set by other third party payors. For example, state Medicaid programs are prohibited from paying more than the Medicare fee schedule limit for clinical laboratory services furnished to Medicaid recipients. As a result, in light of the anticipated reduction in the clinical laboratory fee schedule, certain third party payors may also reduce reimbursement amounts.
For the many anatomic pathology services we provide, we are reimbursed separately under the Medicare physician fee schedule and beneficiaries are responsible for applicable coinsurance and deductible amounts. The amounts paid under the physician fee schedule are based on geographically adjusted relative value units, or RVUs, for each procedure or service, adjusted by a budget neutrality adjustor, and multiplied by an annually determined conversion factor. Historically, the formula used to calculate the fee schedule conversion factor resulted, or would have resulted, in significant decreases in payment levels. However, in every year from 2004 through 2009, Congress has intervened to freeze or increase the conversion factor. Additionally, the U.S. House of Representatives passed legislation in November 2009, which would have increased Medicare payment rates for physicians by 1.2% and implemented a new formula for determining the growth rate in fees payable under the physician fee schedule. The U.S. Senate did not pass similar legislation, however.
As published in the November 25, 2009 Physician Fee Schedule Final Rule, the update to the conversion factor would have resulted in a 21.2% reduction to the conversion factor for 2010 in the absence of Congressional intervention. Subsequently, on December 19, 2009, Congress enacted the Department of Defense Appropriations Act of 2010, which provided a two-month 0% update to the 2010 Medicare physician fee schedule effective only for dates of service from January 1, 2010 through February 28, 2010. It remains to be seen whether Congress will enact legislation to revise the formula which determines the annual update to the conversion factor and payment rates, or if, once again, it will pass additional legislation to delay the payment reductions, including an implementation of a short-term extension of the February 28, 2010 date.
The payment amounts under the Medicare fee schedules are important not only for our reimbursement under Medicare, but also because the schedules often establish the payment amounts set by other third party payors. For example, state Medicaid programs are prohibited from paying more than the Medicare fee schedule limit for laboratory services furnished to Medicaid recipients.
In any case, future Congressional action is uncertain and future methodological changes may result in reductions or increases to the Medicare physician fee schedule. Reductions in Medicare’s reimbursement rates for pathology services, for which we currently are paid under the Medicare physician fee schedule, would reduce the amount we receive for a substantial number of our specialized diagnostic tests. Because the vast majority of our diagnostic services currently are reimbursed under the physician fee schedule, changes to this fee schedule could result in a greater impact on our revenues than changes to the Medicare clinical laboratory fee schedule.
Governmental Regulation
Clinical Laboratory Improvement Amendments of 1988 and State Regulation
As a diagnostic service provider, we are required to hold certain federal, state and local licenses, certifications and permits to conduct our business. Under CLIA, we are required to hold a certificate applicable to the type of work we perform and to comply with certain CLIA-imposed standards. CLIA regulates virtually all clinical laboratories by requiring they be certified by the federal government and comply with various operational, personnel, facilities administration, quality and proficiency requirements intended to ensure that their clinical laboratory testing services are accurate, reliable and timely. CLIA does not preempt state laws that are more stringent than federal law.
13
Table of Contents
To renew our CLIA certificate, which expires February 3, 2011, we are subject to survey and inspection every two years to assess compliance with program standards, and may be subject to additional random inspections. Standards for testing under CLIA are based on the level of complexity of the tests performed by the laboratory. Laboratories performing high complexity testing are required to meet more stringent requirements than laboratories performing less complex tests. Our laboratory holds a CLIA certificate to perform high complexity testing. If a laboratory is certified as “high complexity” under CLIA, the laboratory may obtain analyte specific reagents, or ASRs, which are used to develop in-house diagnostic tests known as “home brews.”
CLIA compliance and certification is also a prerequisite to be eligible to bill for services provided to governmental payor program beneficiaries.
In addition to CLIA requirements, we are subject to various state laws. CLIA provides that a state may adopt laboratory regulations that are more stringent than those under federal law. As a result, a number of states, including California, have implemented their own more stringent laboratory regulatory schemes. State laws may require that laboratory personnel meet certain qualifications, specify certain quality controls or prescribe record maintenance requirements. Our laboratory is licensed and accredited by the appropriate state agencies in the states in which we do business.
Federal and State Laws Regarding Patient Information Privacy and Security
Federal Laws
Under the administrative simplification provisions of HIPAA, the U.S. Department of Health and Human Services has issued regulations which establish uniform standards governing the conduct of certain electronic healthcare transactions and protecting the privacy and security of protected health information, or PHI, used or disclosed by healthcare providers and other covered entities. Three principal regulations with which we are currently required to comply have been issued in final form under HIPAA: privacy regulations, security regulations and standards for electronic transactions.
The privacy regulations cover the use and disclosure of PHI by healthcare providers. These regulations also set forth certain rights that an individual has with respect to his or her PHI maintained by a healthcare provider, including the right to access or amend certain records containing PHI or to request restrictions on the use or disclosure of PHI. We have also implemented policies, procedures and standards to comply appropriately with the final HIPAA security regulations, which establish requirements for safeguarding the confidentiality, integrity and availability of PHI, which is electronically transmitted or electronically stored. The privacy regulations contain significant fines and other penalties for wrongful use or disclosure of PHI. We have implemented practices and procedures to meet the requirements of the HIPAA privacy regulations and state privacy laws.
In addition, we have taken necessary steps to comply with HIPAA’s standards for electronic transactions, which establish standards for common healthcare transactions. In particular, we have completed conversion of our electronic fee-for-service claim transactions and our electronic fee-for-service remittance transactions to the final HIPAA transaction standards for electronic transmissions, including electronic transactions and code sets used for billing claims, remittance advices, enrollment and eligibility.
We have also taken necessary steps to comply with HIPAA regulations on adoption of national provider identifiers, or NPIs. These regulations require the adoption of the national provider identifier as the standard unique health identifier for healthcare providers to use in filing and processing healthcare claims and other transactions. We were required either to comply with this standard by May 23, 2007, or to implement contingency plans for an additional twelve-month period through May 23, 2008. During this period, CMS did not impose penalties on covered entities who implemented contingency plans provided they made reasonable and diligent efforts to become compliant with the rule. We applied for and received our NPI number, as well as, updated our billing system with the NPIs of our customer hem/oncs to ensure compliance with these CMS filing and processing requirements.
14
Table of Contents
Further, the HITECH Act requires HIPAA covered entities, such as clinical laboratories, to provide notification to affected individuals and to the Secretary of Health and Human Services, or the Secretary, following discovery of a breach of unsecured PHI. Unsecured PHI is PHI that is not secured through the use of a technology or methodology specified by the Secretary in published guidance. In some cases, the HITECH Act requires covered entities to provide notification to the media of breaches. In the case of a breach of unsecured PHI at or by a business associate of a covered entity, the Act requires the business associate to notify the covered entity of the breach. The HITECH Act requires the Secretary to post on the Department of Health and Human Services’ website a list of covered entities that experience breaches of unsecured PHI involving more than 500 individuals. Regulations implementing these provisions of the HITECH Act became effective for covered entities on September 23, 2009, although the Secretary announced that it would forego issuing sanctions against any covered entity that discovers a breach prior to February 22, 2010 and fails to provide the required notification. The HITECH Act made other changes relating to the HIPAA privacy and security rules, including, among others, establishing that, effective February 17, 2010, the security and privacy rules apply directly to business associates and, consequently, that a business associate’s violation of the rules may result in government enforcement action directly against the business associate.
Another development concerns the Red Flags Rule, which the Federal Trade Commission issued on May 23, 2002 and requires financial institutions and creditors with covered accounts to have identity theft prevention programs in place to identify, detect and respond to patterns, practices or specific activities that could indicate identity theft. A creditor includes any entity that regularly extends, renews or continues credit or which defers payment for goods or services. Since we routinely extend credit by billing for our services after such services are provided, we meet the definition of a “creditor” under the Red Flags Rule. Accordingly, we developed a written program designed to identify and detect the relevant warning signs – or “red flags” – of identity theft and described appropriate responses to prevent and mitigate identity theft in order to comply with the Red Flags Rule. In accordance with the Red Flags Rule, our program is managed by senior employees and includes appropriate staff training and provides for appropriate oversight.
The Federal Trade Commission has delayed enforcement of the Red Flags Rule several times. Enforcement of the regulations are currently scheduled for June 1, 2010.
State Laws
The HIPAA privacy and security regulations establish a uniform federal “floor” and do not supersede state laws that are more stringent or provide individuals with greater rights with respect to the privacy or security of, and access to, their records containing PHI. As a result, we are required to comply with both HIPAA privacy regulations and varying state privacy and security laws. The Confidentiality of Medical Information Act, or CMIA, is California’s comprehensive statutory scheme governing the disclosure of medical information by providers of health care. Certain aspects of the CMIA are more stringent than the requirements of HIPAA, particularly with regard to the form used to obtain authorization to disclose a patient’s medical information and the disclosure of genetic test results. In addition, other provisions of California law require providers of health care to establish and implement appropriate administrative, technical and physical safeguards to protect the privacy of a patient’s medical information in order to reasonably safeguard confidential medical information from any unauthorized access or unlawful access, use or disclosure. Significant administrative penalties may be imposed for violation of any of these requirements. We have implemented policies and procedures to comply with all California laws governing the disclosure and protection of patient medical information and we utilize an authorization form that is compliant with California’s more stringent requirements, when necessary.
Massachusetts adopted Information Security, or InfoSec, Regulation on September 22, 2008, that require businesses, wherever located, that store or use information about Massachusetts residents, to implement comprehensive information security programs by January 1, 2010. The purposes of the Massachusetts regulations are to ensure the security and confidentiality of healthcare records, to protect against threats to the security or integrity of such records, and to prevent unauthorized access to and use of the records to prevent fraud and identity theft. The regulations require each covered business to “develop, implement, maintain and monitor a
15
Table of Contents
comprehensive written information security program” that applies to records that contain Massachusetts’ residents’ personal information. Before Massachusetts adopted its new regulations, only California had a statute or regulation that required all business to adopt information security practices. California’s information security mandate is vague. It states only that “a business that owns or licenses personal information about a California resident shall implement and maintain reasonable security procedures and practices appropriate to the nature of the information, to protect the personal information from unauthorized access, destruction, use, modification, or disclosure.” The Massachusetts regulations are detailed and specific. To comply with the Massachusetts regulations, businesses that own, license, store or maintain paper or electronic records that include personal information of Massachusetts residents have to implement comprehensive security measures. As a healthcare provider, we are obligated to comply with the above laws. We believe that we have created policies and procedures in compliance with the above laws including the encryption of patient information transmitted electronically.
Federal and State Fraud and Abuse Laws
The federal healthcare program Anti-Kickback Statute prohibits, among other things, knowingly and willfully offering, paying, soliciting or receiving remuneration to induce or in return for purchasing, leasing, ordering or arranging for the purchase, lease or order of any healthcare item or service reimbursable under a governmental payor program. The definition of “remuneration” has been broadly interpreted to include anything of value, including for example gifts, discounts, the furnishing of supplies or equipment, credit arrangements, payments of cash, waivers of payments, ownership interests, and providing anything at less than its fair market value. The Anti-Kickback Statute is broad, and it prohibits many arrangements and practices that are lawful in businesses outside of the healthcare industry. Recognizing that the Anti-Kickback Statute is broad and may technically prohibit many innocuous or beneficial arrangements within the healthcare industry, the U.S. Department of Health and Human Services has issued a series of regulatory “safe harbors.” These safe harbor regulations set forth certain provisions, which, if met, will assure healthcare providers and other parties that they will not be prosecuted under the federal Anti-Kickback Statute. Although full compliance with these provisions ensures against prosecution under the federal Anti-Kickback Statute, the failure of a transaction or arrangement to fit within a specific safe harbor does not necessarily mean that the transaction or arrangement is illegal or that prosecution under the federal Anti-Kickback Statute will be pursued. The penalties for violating the Anti-Kickback Statute can be severe. These sanctions include criminal penalties and civil sanctions, including fines, imprisonment and possible exclusion from the Medicare and Medicaid programs. Many states have also adopted statutes similar to the federal Anti-Kickback Statute, some of which apply to the referral of patients for healthcare items or services reimbursed by any source, not only governmental payor programs.
In addition to the administrative simplification regulations discussed above, HIPAA created two new federal crimes: healthcare fraud and false statements relating to healthcare matters. The healthcare fraud statute prohibits knowingly and willfully executing a scheme to defraud any healthcare benefit program, including private payors. A violation of this statute is a felony and may result in fines, imprisonment or exclusion from governmental payor programs such as the Medicare and Medicaid programs. The false statements statute prohibits knowingly and willfully falsifying, concealing or covering up a material fact or making any materially false, fictitious or fraudulent statement in connection with the delivery of or payment for healthcare benefits, items or services. A violation of this statute is a felony and may result in fines, imprisonment or exclusion from governmental payor programs.
Finally, another development affecting the healthcare industry is the increased use of the federal False Claims Act and, in particular, actions brought pursuant to the False Claims Act’s “whistleblower” or “qui tam” provisions. The False Claims Act imposes liability on any person or entity, who, among other things, knowingly presents, or causes to be presented, a false or fraudulent claim for payment by a federal governmental payor program. The qui tam provisions of the False Claims Act allow a private individual to bring actions on behalf of the federal government alleging that the defendant has defrauded the federal government by submitting a false claim to the federal government and permit such individuals to share in any amounts paid by the entity to the government in fines or settlement. In addition, various states have enacted false claim laws analogous to the
16
Table of Contents
federal False Claims Act, although many of these state laws apply where a claim is submitted to any third party payor and not merely a governmental payor program. When an entity is determined to have violated the False Claims Act, it may be required to pay up to three times the actual damages sustained by the government, plus civil penalties ranging from $5,500 to $11,000 for each separate false claim.
Physician Referral Prohibitions
Under a federal law directed at “self-referral,” commonly known as the “Stark Law,” there are prohibitions, with certain exceptions, on Medicare and Medicaid payments for laboratory tests referred by physicians who personally, or through a family member, have an investment interest in, or a compensation arrangement with, the clinical laboratory performing the tests. A person who engages in a scheme to circumvent the Stark Law’s referral prohibition may be fined up to $100,000 for each such arrangement or scheme. In addition, any person who presents or causes to be presented a claim to the Medicare or Medicaid programs in violation of the Stark Law is subject to civil monetary penalties of up to $15,000 per bill submission, an assessment of up to three times the amount claimed and possible exclusion from participation in federal governmental payor programs. Bills submitted in violation of the Stark Law may not be paid by Medicare or Medicaid, and any person collecting any amounts with respect to any such prohibited bill is obligated to refund such amounts. Many states, including California, also have anti- “self-referral” and other laws that are not limited to Medicare and Medicaid referrals.
Like the Anti-Kickback Statute, the Stark Law is broad in its application to health care transactions and arrangements. Accordingly, the Stark Law contains many exceptions, which protect certain arrangements and transactions from the Stark Law penalties. Unlike the Anti-Kickback Statute’s safe harbors, if an arrangement or transaction does not meet a Stark Law exception’s requirements, the arrangement or transaction at issue will be deemed to be out of compliance with the Stark Law and, in turn, will be subject to the Stark Law’s penalties.
Corporate Practice of Medicine
Numerous states, including California, have enacted laws prohibiting business corporations, such as us, from practicing medicine and employing or engaging physicians to practice medicine. These laws are designed to prevent interference in the medical decision-making process by anyone who is not a licensed physician. This prohibition is generally referred to as the prohibition against the corporate practice of medicine. Violation of this prohibition may result in civil or criminal fines, as well as sanctions imposed against us and/or the professional through licensing proceedings. All of the hempaths who we utilize in connection with providing our specialized diagnostic services are employed by Cartesian. Cartesian is a California professional corporation we formed in April 2005 for the purpose of providing professional medical services in conjunction with the diagnostic services that we provide. On December 31, 2005, we entered into the Clinical Laboratory Professional Services Agreement, or PSA, with Cartesian pursuant to which these hempaths provide professional services to us. See “Cartesian Medical Group, Inc.” for more information.
State Laboratory Licensing
In addition to our CLIA certification, licensure is required and maintained for our laboratory under certain state laws. Such laws establish standards for the day-to-day operation of a clinical laboratory, physical facilities requirements, equipment requirements, training and skills required of personnel and quality control. In addition, certain state laws mandate proficiency testing, which involves testing of specimens that have been specifically prepared for testing at our laboratory. We maintain a current license in good standing with each state that requires us to obtain licensure to accept specimens. We are in compliance with applicable licensing laws.
We may become aware from time to time of other states that require out of state laboratories to obtain licensure in order to accept specimens from the state, and it is possible that other states do have such requirements or will have such requirements in the future. If we identify any other state with such requirements or if we are contacted by any other state advising us of such requirements, we intend to follow instructions from the state regulators as to how we should comply with such requirements.
17
Table of Contents
Other Regulatory Requirements
Our laboratory is subject to federal, state and local regulations relating to the handling and disposal of regulated medical waste, hazardous waste and biohazardous waste, including chemical, biological agents and compounds, blood and bone marrow samples and other human tissue. Typically, we use outside vendors who are contractually obligated to comply with applicable laws and regulations to dispose of such waste. These vendors are licensed or otherwise qualified to handle and dispose of such waste. Historically, our costs associated with handling and disposal of such wastes have not been material.
The Occupational Safety and Health Administration, or OSHA, has established extensive requirements relating to workplace safety for healthcare employers, including requirements to develop and implement programs to protect workers from exposure to blood-borne pathogens by preventing or minimizing any exposure through needle stick or similar penetrating injuries.
Pursuant to its authority under the federal Food, Drug and Cosmetic Act, or FDCA, the U.S. Food and Drug Administration, or FDA, has regulatory responsibility over instruments, test kits, reagents and other devices used to perform diagnostic testing by laboratories such as ours. Specifically, the manufacturers and suppliers of ASRs, which we obtain for use in diagnostic tests, are subject to regulation by the FDA and are required to, among other things, register their establishments with the FDA, to conform manufacturing operations to the FDA’s Quality System Regulation, or QSR, and to comply with certain reporting and other record keeping requirements. The FDA also regulates the sale or distribution, in interstate commerce, of products classified as medical devices under the FDCA, including in vitro diagnostic test kits. Such devices must undergo premarket review by the FDA prior to commercialization unless the device is of a type exempted from such review by statute or pursuant to the FDA’s exercise of enforcement discretion. For instance, diagnostic tests that are developed and validated by a laboratory for use in examinations the laboratory performs itself are called “home brew” tests. The FDA maintains that it has authority to regulate the development and use of “home brews” as medical devices, but to date has decided not to exercise its authority with respect to most “home brew” tests as a matter of enforcement discretion. The FDA regularly considers the application of additional regulatory controls over the sale of ASRs and the development and use of “home brews” by laboratories such as ours.
Compliance Program
Because compliance with government rules and regulations is a significant concern throughout our industry, in part due to evolving interpretations of these rules and regulations, we have established a compliance program that is overseen by our Compliance Committee. Our Compliance Committee consists of certain members of our board of directors, and our management provides periodic reports on compliance operations to the Compliance Committee.
We seek to conduct our business in compliance with all statutes and regulations applicable to our operations. To this end, we conduct both internal and external in-depth reviews of procedures, personnel and facilities to ensure regulatory compliance throughout our operations. We provide periodic and comprehensive training programs to our personnel, which are intended to promote the strict observance of our policies designed to ensure compliance with the statutes and regulations applicable to our operations.
Intellectual Property Rights
Our intellectual property consists primarily of trademarks, service marks and trade secrets. The designations Genoptix, COMPASS, CHART, eCOMPASS and NexCourse are our principal marks. We have registered trademarks for Genoptix, CHART, eCOMPASS and NexCourse and have currently applied with the U.S. Patent and Trademark Office, or USPTO, for registration in our field of use for our other principal marks. We maintain a program to protect our marks and will institute legal action where necessary to prevent others from using and/or registering confusingly similar marks in our field of use.
18
Table of Contents
Insurance
We maintain liability insurance for our products and services. As a general matter, providers of diagnostic services may be subject to lawsuits alleging negligence or other similar legal claims. Some of these suits involve claims for substantial damages. Any professional liability litigation could also adversely impact our customer base and reputation. Although management cannot predict the outcome of any claims made against us, management does not anticipate that the ultimate outcome of any such proceedings or claims will have a material adverse effect on our financial condition but may be material to our results of operations and cash flows in the period in which the impact of such claims is determined or the claims are paid. Similarly, although we believe that we will be able to obtain adequate insurance coverage in the future at acceptable costs, we cannot assure you that we will be able to do so.
Employees
As of February 18, 2010, we employed 440 employees, including Cartesian employees and 7 part-time employees, all of whom are engaged in either specimen preparation, regulatory affairs, legal, development, business and corporate development, sales and marketing, quality assurance and control or administration. None of our employees are subject to a collective bargaining agreement. We consider our relationship with our employees to be good.
Our future success is highly dependent on our ability to attract and retain qualified employees, in particular, field sales representatives, key management and hempaths employed by Cartesian. We believe we offer competitive compensation and benefits.
Cartesian Medical Group, Inc.
California prohibits general corporations from engaging in the practice of medicine pursuant to both statutory and common-law principles commonly known as the corporate practice of medicine doctrine. Courts have interpreted this doctrine to prohibit non-professional corporations from employing physicians to who provide professional services. The hempaths who work with us at our laboratory are not our employees but are employees of Cartesian, a California professional corporation. Throughout this Annual Report on Form 10-K, when we refer to “our hempaths” or words of similar import, we are referring to the physicians employed by Cartesian and working at our facility as directed by Cartesian.
We have contracted with Cartesian to provide hematopathology and other pathology services to us as an independent contractor pursuant to the PSA between us and Cartesian. Pursuant to the PSA, Cartesian’s hempaths work in our Carlsbad laboratory where we provide all necessary equipment, supplies, space, non-physician staffing and other support services to those physicians. The physicians employed by Cartesian work exclusively for Cartesian, which exclusively contracts with us for the professional services we require to provide our specialized diagnostic services. Cartesian has not entered into any professional services agreement with any other party and may not use our laboratory facility to provide professional services to any other party without our prior consent. We formed Cartesian in April 2005. Cartesian has no other employees. We are highly dependent on these hempaths to provide our specialized diagnostic services and we would be unable to provide these services without them.
Pursuant to the PSA, Cartesian has assigned to us its rights to collect and receive all payments for its professional services. We, and not Cartesian, are the contracting party for all of our specialized diagnostic services. We bill for services on Cartesian’s behalf in accordance with a fee schedule set by Cartesian. Substantially all of our revenues result from our having been assigned the right to bill and collect for the professional services provided by the hempaths employed by Cartesian. Our revenues from services not performed by Cartesian were less than 5% of our revenues for the years ended December 31, 2009, 2008 and 2007. In turn, we pay Cartesian professional service fees equal to the monthly aggregate of all Cartesian
19
Table of Contents
physician salary and benefit costs. Additionally, we reimburse Cartesian for expenses incurred for payment of physician dues, subscriptions, medical licenses and continuing medical education. We also provide both general business and professional liability insurance coverage to Cartesian and its physicians. Each physician is entitled to standard Cartesian employee benefits and the opportunity to be granted awards of our common stock and options to purchase our common stock.
Our PSA with Cartesian provides for a one-year term that is automatically renewed on a yearly basis. During the term of the PSA, Cartesian is obligated to seek our approval before it provides similar medical services to other laboratories, hospitals or healthcare facilities. We are not obligated to approve the provision of services by Cartesian to others, and any such approval is subject to a good faith determination by us that Cartesian’s provision of such services does not interfere with Cartesian’s obligations under the PSA or interfere with or negatively impact our business.
Pursuant to the terms of the PSA, Cartesian is solely and exclusively in control of all aspects of the practice of medicine and the provision of medical services to us. The PSA requires that Cartesian and the physicians provide quality services to us. If the physicians fail to provide quality services, we have the ability to terminate the PSA for material breach by Cartesian. This mechanism allows us to ensure that Cartesian and the physicians provide services in accordance with our quality control program. Because we are not a California professional corporation, we are prohibited from exercising the control exerted by Cartesian over the physicians. To the best of our knowledge, none of the state medical boards or courts in jurisdictions in which we provide our specialized diagnostic services has taken the position that arrangements such as that which exists between Cartesian and us violate the corporate practice of medicine prohibitions. Any such determination would be fact-specific and based upon the facts and circumstances of the particular situation.
You should consider carefully the following information about the risks described below, together with the other information contained in this Annual Report on Form 10-K and in our other public filings in evaluating our business. If any of the following risks actually occurs, our business, financial condition, results of operations and future growth prospects would likely be materially and adversely affected. In these circumstances, the market price of our common stock would likely decline.
Risks Relating to Our Business Operations
Reimbursement levels for our specialized diagnostic services are subject to continuing change and any reductions in reimbursement levels would decrease our revenues and adversely affect our results of operations and financial condition.
Reimbursement to healthcare providers, such as specialized diagnostic service providers like us, is subject to continuing change in policies by governmental payors, such as Medicare and Medicaid, private insurers, including managed care organizations and other private payors, such as hospitals and private medical groups. Reimbursement from governmental payors is subject to statutory and regulatory changes, retroactive rate adjustments and administrative rulings and other policy changes, all of which could materially decrease the range of services for which we are reimbursed or the reimbursement rates we are paid.
Reimbursement under the Medicare program for our specialized diagnostic services is subject to both the national Medicare clinical laboratory fee schedule and physician fee schedule. Both schedules are typically updated annually and subject to geographic adjustments. The physician fee schedule is designed to set compensation rates for those medical services provided to Medicare beneficiaries who require a degree of physician supervision. Outpatient clinical diagnostic laboratory tests are traditionally paid according to the clinical laboratory fee schedule. However, although the clinical laboratory fee schedule is generally the only basis of payment that can be made by the Medicare program with respect to most clinical laboratories, certain
20
Table of Contents
laboratory tests performed by physicians are exempt from the clinical laboratory fee schedule and are paid under the physician fee schedule. As a result, most of the services provided by us are reimbursed under the physician fee schedule.
The clinical laboratory fee schedule sets the maximum amount payable under Medicare for each specific laboratory billing code. We bill the program directly and must accept the scheduled amount as payment in full for covered tests performed on behalf of Medicare beneficiaries. Those services reimbursed under the clinical laboratory fee schedule generally do not result in coinsurance amounts but may result in beneficiary deductible responsibility. Payment under the clinical laboratory fee schedule has been limited from year-to-year by Congressional action such as imposition of national limitation amounts and freezes on the otherwise applicable annual CPI updates. Although the CPI update of the clinical laboratory fee schedule has been frozen since 2004 by the MMA, after July 1, 2009, the freeze on the clinical laboratory fee schedule was updated using the percentage increase for the CPI from the previous 12-month period (measured July thru June) minus 0.5%. On July 15, 2009, the CPI for 2009 was released and it showed a year-over-year decline of 1.4%. This implies that clinical laboratories will receive a 1.9% rate decrease from Medicare in 2010 as compared to the 4.5% rate increase that the laboratories experienced under the 2009 clinical laboratory fee schedule. The payment amounts under the Medicare clinical laboratory fee schedule are important not only for our reimbursement under Medicare, but also because the schedule often establishes the payment amounts set by other third party payors. For example, state Medicaid programs are prohibited from paying more than the Medicare fee schedule limit for clinical laboratory services furnished to Medicaid recipients. As a result, in light of the anticipated reduction in the clinical laboratory fee schedule, certain third party payors may also reduce reimbursement amounts.
For the many anatomic pathology services we provide, we are reimbursed separately under the Medicare physician fee schedule and beneficiaries are responsible for applicable coinsurance and deductible amounts. The amounts paid under the physician fee schedule are based on geographically adjusted RVUs for each procedure or service, adjusted by a budget neutrality adjustor, and multiplied by an annually determined conversion factor. Historically, the formula used to calculate the fee schedule conversion factor resulted, or would have resulted, in significant decreases in payment levels. However, in every year from 2004 through 2009 Congress has intervened multiple times to freeze or increase the conversion factor. Additionally, the U.S. House of Representatives passed legislation in November 2009, which would have increased Medicare payment rates for physicians by 1.2% and implemented a new formula for determining the growth rate in fees payable under the physician fee schedule. The U.S. Senate did not pass similar legislation, however.
As published in the November 25, 2009 Physician Fee Schedule Final Rule, the update to the conversion factor would have resulted in a 21.2% reduction to the conversion factor for 2010 in the absence of Congressional intervention. Subsequently, on December 19, 2009, Congress enacted the Department of Defense Appropriations Act of 2010, which provided a two-month 0% update to the 2010 Medicare physician fee schedule effective only for dates of service from January 1, 2010 through February 28, 2010. It remains to be seen whether Congress will enact legislation to revise the formula which determines the annual update to the conversion factor and payment rates, or if, once again, it will pass additional legislation to delay the payment reductions, including an implementation of a short-term extension of the February 28, 2010 date. It is also possible that no action will be taken and the 21.2% reduction in payments will be implemented.
In any case, future Congressional action is uncertain and future methodological changes may result in reductions or increases to the Medicare physician fee schedule. Reductions in Medicare’s reimbursement rates for pathology services, for which we currently are paid under the Medicare physician fee schedule, would reduce the amount we receive for a substantial number of our specialized diagnostic tests. Because the vast majority of our diagnostic services currently are reimbursed under the physician fee schedule, changes to this fee schedule could result in a greater impact on our revenues than changes to the Medicare clinical laboratory fee schedule.
Additionally, as part of the final rule with comment period, CMS has implemented changes in the practice expense RVU amounts used to calculate reimbursement for procedures billed under the physician fee schedule, including many of the procedures we perform. The implementation of these proposed changes to the physician
21
Table of Contents
fee schedule (assuming the 21.2% reduction to the conversion factor discussed above is not implemented for 2010), in conjunction with the proposed clinical fee schedule rate decrease discussed above, are estimated to result in an approximate 1% reduction in the 2010 Medicare reimbursement per case.
The MMA mandated creation of Medicare Administrative Contractors, or MACs, replacing the system of fiscal intermediaries who oversee fee-for-service claims for the Medicare Part A and Part B programs. In November 2007, CMS awarded the MAC Jurisdiction 1 (California, Hawaii, Nevada, American Samoa, Guam and the Northern Mariana Islands) to Palmetto GBA. The full transition to Palmetto GBA occurred effective September 2, 2008. The MAC stated methodology for consolidation and transition of LCD, was based on the principal of “least restrictive.” New LCD’s related to our specialized diagnostic services were introduced as a result of the consolidation process, while others were retired, which may result in reductions to, delays in or denials for reimbursement for the services offered. Additionally, the transition from a fiscal intermediary to a MAC is in a very early stage and may result in delays in or denials for reimbursement that could have an adverse impact on us and our results of operations.
Effective January 1, 2009, CMS implemented Phase VIII Medically Unlikely Edits, or MUEs. CMS developed MUEs to place limits on certain Medicare billing codes in order to reduce the paid claims error rate for Medicare Part B claims. An MUE value is the maximum units of service that a provider may be paid for a single beneficiary on a single date of service.
Several of the MUEs pertain to procedures that we perform. In response to concerns from the laboratory industry, effective April 1, 2009, CMS temporarily suspended certain MUEs for pathology, cytopathology, and molecular diagnostics services. If in the future CMS implements these edits or some other MUEs related to our services, it could inhibit our ability to be reimbursed for services that we report. However, if it is medically reasonable and necessary to provide units of service in excess of an MUE, we may be able to modify such claims in order to be fully reimbursed.
Other policy changes may include competitive bidding by clinical laboratories for the provision of services to the Medicare program, which was the subject of a CMS demonstration project in Carlsbad, California, pursuant to the requirements of the MMA. The implementation of the demonstration project was delayed due to a federal preliminary injunction and The Medicare Improvements for Patients and Providers Act of 2008, or MIPPA, subsequently repealed the competitive bidding demonstration project. If later implemented, competitive bidding could decrease our reimbursement rates for clinical laboratory tests.
In addition, some private insurers and other third party payors link their rates to Medicare’s reimbursement rates and a reduction in Medicare reimbursement rates for clinical laboratory and pathology services could result in a corresponding reduction in the reimbursements we receive from such third party payors. Any reductions in reimbursement levels for our specialized diagnostic services would decrease our revenues and adversely affect our results of operations and financial condition.
Operating as a non-contracting provider with certain payors may adversely affect our results of operations and financial condition and contracting with those payors may be disadvantageous to us.
We are currently considered a “non-contracting provider” by a number of third party payors because we have not entered into a specific contract to provide our specialized diagnostic services to their insured patients at specified rates of reimbursement. We were generally subject to reimbursement as a non-contracting provider for approximately half of our revenues for the years ended December 31, 2009, 2008 and 2007. Use of a non-contracting provider typically results in greater coinsurance or copayment requirements for the patient, unless we elect to treat them as “in-network” in accordance with applicable law, which results in decreased revenues because we do not generally collect the full applicable “out-of-network” patient coinsurance or copayment obligations. In instances where we are prohibited by law from treating these patients as “in-network,” thus requiring them to pay additional costs or copayments, such patients may express concern about these
22
Table of Contents
additional costs to their hem/onc. As a result, that hem/onc may reduce or avoid prescribing our services for such patients, which would adversely affect our results of operations and financial condition.
Should any of the third party payors with whom we are not contracted insist that we enter into a contract for the specialized diagnostic services we provide, the resulting contract may contain pricing and other terms that are materially less favorable to us than the terms under which we currently operate. If reimbursement from a particular payor increases, there is heightened risk that such a third party payor will insist that we enter into contractual arrangements that contain less favorable terms. If we refuse to enter into a contract with such a third party payor, they may refuse to cover and reimburse us for our services, which may lead to a decrease in case volume and a corresponding decrease in our revenues. If we contract with such a third party payor, although our case volume may increase as a result of the contract, our revenues per case under the contractual agreement and our gross margins may decrease. We expect that over time we increasingly will enter into contractual arrangements with such third party payors. The overall net result of contracting with third party payors may adversely affect our business, results of operations and financial condition.
Changes in regulations, payor policies or contracting arrangements with payors or changes in other laws, regulations or policies may adversely affect coverage or reimbursement for our specialized diagnostic services, which may decrease our revenues and adversely affect our results of operations and financial condition.
Governmental payors, private insurers and other private payors have implemented and will continue to implement measures to control the cost, utilization and delivery of healthcare services, including clinical laboratory and pathology services. Congress has from time to time considered and implemented changes to laws and regulations governing healthcare service providers, including specialized diagnostic service providers. These changes have adversely affected and may in the future adversely affect coverage for clinical laboratory and pathology services, including the specialized diagnostic services we provide. In addition, as a result of the recent administration’s focus on healthcare reform, there is risk that the Federal government may implement changes in laws and regulations governing healthcare service providers, including measures to control costs or reductions in reimbursement levels, which may have an adverse impact on our business. We also believe that healthcare professionals, including hem/oncs, will not use our services, if as a result of these measures, third party payors do not provide adequate coverage and reimbursement for them is lacking. These changes in federal, state, local and third party payor regulations or policies may decrease our revenues and adversely affect our results of operations and financial condition.
For approximately half of our revenues for the years ended December 31, 2009, 2008 and 2007, we were generally subject to reimbursement as a non-contracting provider and payments to us as a non-contracting provider can be changed by third party payors at any time. We will continue to be a non-contracting provider until such time as we enter into contracts with third party payors for whom we are not currently contracted. We estimate contractual allowances with respect to revenues from third party payors with whom we are not currently contracted. During the years ended December 31, 2009, 2008, and 2007 we recorded positive changes in prior period accounting estimates to reduce contractual allowances, which increased our revenues by $7.4 million, $3.3 million, and $792,000, respectively. These favorable changes in accounting estimates related primarily to non-contracted payors and resulted from continued improvements to our collection processes, as well as increased hiring of personnel and management focused on the collection of accounts receivable for services rendered in prior periods and changes in reimbursement policies by certain payors. Because a substantial portion of our revenue is from third party payors with whom we are not currently contracted, it is likely that we will be required to make positive or negative adjustments to accounting estimates with respect to contractual allowances in the future (as we have made in each of the last several quarters and annual reporting periods), which, may adversely affect our results of operations, our credibility with financial analysts and investors and our stock price. Although, during the past several periods we have recorded favorable changes in accounting estimates resulting in net increases in our revenues, it is possible that future adjustments may be less favorable and may result in net decreases in our revenues, which would adversely affect our results of operations.
23
Table of Contents
Our inability to obtain and retain new customers, or increase the tests ordered or specimens submitted by existing customers, could adversely affect our business and financial condition.
To offset efforts by third party payors to control the cost, utilization and delivery of healthcare services, we need to obtain and retain new customers. In addition, a reduction in tests ordered or specimens submitted by existing customers, without offsetting growth in our customer base, would impact our ability to successfully grow and have a material adverse impact on our net revenues and profitability. We compete primarily on the basis of the quality of testing, reporting and information systems, reputation in the medical community, and ability to employ qualified personnel. Our inability to successfully compete in these areas could result in the loss of customers and could adversely impact our ability to obtain and retain new customers and successfully grow our business.
Increased competition, including from competitors replicating our key service offerings in the future and the failure to provide a higher quality of service than that of our competitors could adversely affect our revenues and profitability.
The laboratory services industry generally is intensely competitive both in terms of service and price and it continues to undergo significant consolidation, permitting larger clinical laboratory service providers to increase cost efficiencies and change service levels, resulting in more intense competition. Most of our existing competitors and many potential competitors have substantially greater financial, sales, marketing, logistical and laboratory resources, more experience in dealing with third party payors for the services we provide and greater market penetration, purchasing power and marketing budgets, as well as more experience in providing diagnostic services.
As a specialized diagnostic service provider, we rely extensively on our high quality of service to attract and retain community-based hem/oncs and other healthcare professionals as our customers at the expense of our larger competitors. We compete primarily on the basis of the quality of testing, reporting and information systems, reliability in patient sample transport, reputation in the medical community, access to our highly qualified hempaths and our ability to expand our service offerings to our core hem/onc customers. For example, we generally provide treating hem/oncs with telephonic access on an almost real-time basis to the specific hempath that generates a report and analysis on the specific patient. Our failure to provide services superior to the laboratories with which we compete could adversely affect our revenues and profitability.
Because we do not rely on our intellectual property portfolio to impede others from copying our business, there are no significant barriers to entry into our business and new or existing laboratories could replicate our key service offerings and business model and enter our market to compete with us with relatively low upfront investments, which could adversely affect our business and prospects.
We are highly dependent on Cartesian for the services of our hempaths and any significant difficulties in recruiting or retaining these highly trained hempaths could adversely affect our revenues and results of operations.
Our business is highly dependent on the availability of hempaths, who provide professional services to us through Cartesian and we would be unable to provide our specialized diagnostic services without them. Cartesian is actively recruiting additional hempaths to work with us as we continue to expand our business. There are currently approximately 1,500 hempaths licensed in the United States and only approximately 75 new hempaths receive board certification in the United States each year. Our PSA with Cartesian is automatically renewed on a yearly basis but may be terminated by us at any time on 60 days’ prior written notice and either party may terminate the PSA upon the other party’s uncured material breach. We have not used the services of any hempaths from any entity other than Cartesian and we do not believe there is another organization operating in our geographic region that would be able to provide us with comparable professional services. Should Cartesian be unable to retain the hempaths that provide professional services to us, or if Cartesian fails in its efforts to
24
Table of Contents
recruit additional hempaths to provide us professional services, our ability to maintain and grow our business may be impaired. In addition, Cartesian may be required to offer higher compensation to hempaths in connection with recruitment and retention efforts and these increased compensation expenses would be reflected in the amount we pay to Cartesian through the PSA. We may be unable to recover these increased expenses through price increases or reimbursements for our diagnostic services. In addition, if Cartesian were to experience significant turnover in hempaths, our ability to perform our specialized diagnostic services and our revenues and results of operations could be adversely affected.
We must hire and retain qualified sales representatives to grow our sales.
Our ability to retain existing customers for our specialized diagnostic services and attract new customers is dependent upon retaining existing field sales representatives and hiring new field sales representatives, which is an expensive and time-consuming process. We face intense competition for qualified sales personnel and our inability to hire or retain an adequate number of field sales representatives could limit our ability to maintain or expand our business and increase sales. Even if we are able to increase our sales force, our new sales personnel may not commit the necessary resources or provide sufficient high quality service and attention to hem/oncs to effectively market and sell our specialized diagnostic services. If we are unable to maintain and expand our marketing and sales networks or if our sales personnel do not perform to our high standards, we may be unable to maintain or grow our existing business and our results of operations and financial condition will likely suffer accordingly.
Our sales personnel have developed and maintain close relationships with a number of healthcare professionals. In particular, our sales force focuses its efforts on developing relationships with community-based hem/oncs and other healthcare professionals who are decision makers in their offices. Our sales depend on the use of our specialized diagnostic services by these community-based hem/oncs and other healthcare professionals and successful marketing of our services depends on educating these community-based hem/oncs and other healthcare professionals as to the distinctive characteristics, benefits, high quality and value of our specialized diagnostic services as compared to those of our competitors.
If a sales representative ceases employment, we risk the loss of customer goodwill based on the impairment of relationships developed between the sales representative and the healthcare professionals for whom the sales representative was responsible. This is particularly a risk if the representative goes to work for a competitor, as the healthcare professionals that are our customers may choose to use a competitor’s services based on their relationship with the departed sales representative.
If we fail to attract and retain key management and other personnel, we may be unable to successfully maintain or develop our business.
Our success depends on our continued ability to attract, retain and motivate highly qualified management, laboratory and other personnel. For example, we are highly dependent on the operational and financial expertise of our executive officers. The loss of the services of any of our executive officers, particularly Tina S. Nova, Ph.D., our president and chief executive officer, could impede our growth. In particular, our executive officers currently perform most of our policy-making functions, are in charge of our principal business units, divisions and functions and are solely responsible for most of our key decisions. We are also dependent on our key employees and consultants, who are important to our business and assist and support our executive officers in implementing and executing these officers’ key decisions. If we lose any of our executive officers or key employees and consultants, other of these individuals may be required to fulfill his or her duties and spend time finding a replacement. We may not be able to find suitable replacements and our business may be harmed as a result. We do not maintain “key woman” or “key man” insurance policies on the lives of these individuals or the lives of any of our other employees. We employ our executive officers and key employees on an at-will basis and their employment can be terminated by them or us at any time.
25
Table of Contents
Our industry has experienced a high rate of turnover of management personnel in recent years. In addition to the intense competition for qualified personnel in the healthcare industry, the San Diego area is characterized by a high cost of living, particularly for housing. As such, we could have difficulty attracting experienced personnel to our company and may be required to expend significant financial resources in our employee recruitment and retention efforts. If we are not able to attract and retain the necessary personnel to accomplish our business objectives, we may experience constraints that will impede significantly the achievement of our operational objectives, our revenue growth and our ability to implement our business strategy.
We may experience difficulties in managing our growth and our growth rate may decline.
Our revenues have grown to $184.4 million for the year ended December 31, 2009, up from $116.2 million and $59.3 million for the years ended December 31, 2008 and 2007, respectively. This growth has put significant pressure on our systems and operations. As of December 31, 2009, we employed 429 employees, including Cartesian employees and 7 part-time employees. Our current organization, and our systems and facilities currently in place, may not be adequate to support our future growth. In order to effectively manage our operations and any significant growth, we may need to:
| • | scale our internal infrastructure, including expansion of our laboratory facilities, while continuing to provide quality services on a timely basis to community-based hem/oncs and other customers; |
| • | maintain and strengthen our relationships with our hem/onc customers as we increase the number of our sales and marketing personnel and increase our presence in the various geographic markets we serve; |
| • | attract and retain sufficient numbers of talented employees and consultants, including sales personnel, hempaths, clinical service coordinators, scientists, laboratory technicians and administrative employees, to handle the increasing number of tests we are requested to conduct; |
| • | manage our relationship with Federal Express to ensure its ability to handle increasing sample transport and deliveries; |
| • | manage our relationships with third parties for the provision of certain services and the manufacture and supply of certain test kits, reagents and other laboratory materials; |
| • | continue to enhance our compliance and quality assurance systems; and |
| • | continue to improve our operational, financial and management controls and reporting systems and procedures. |
If we are not able to successfully implement the tasks necessary to further expand our operations, our business, including the quality of our services and our billing, reimbursement, compliance and quality assurance systems, our results of operations and our financial results could be adversely affected. In addition, as our revenues grow, our period over period growth rate will likely decline.
We are continuing to expand our infrastructure by establishing additional laboratory space and implementing additional backup systems, which, among other things, could divert our resources and may cause our margins to suffer.
As of December 31, 2009, we occupied approximately 116,000 square feet of office and laboratory space in two separate facilities in Carlsbad, California. In June 2009, we entered into a lease agreement for approximately 44,000 square feet of space in Carlsbad, California to be used for office and laboratory operations. This facility is currently undergoing improvements and is expected to ready for our use in the second quarter of 2010. In January 2010, we entered into a purchase agreement to acquire this facility and related land. The lease agreement related to this facility terminated upon the closing of this purchase. In January 2010, we entered into a lease agreement for approximately 33,000 square feet of space in Carlsbad, California to be used as a customer service and support facility. This facility will be undergoing improvements and is expected to be ready for our use in the
26
Table of Contents
second quarter of 2010. When we complete the tenant improvements for the additional space, we expect to have approximately 193,000 square feet of total available office and laboratory space in Carlsbad, California. For further discussion of these transactions see Note 10, Subsequent Events, in the accompanying notes to our consolidated financial statements included elsewhere in this Annual Report on Form 10-K. Although, we believe that our current facilities, including those currently undergoing improvements, are adequate for our needs for the immediate future and that suitable additional space will be available as needed to accommodate expansion of our operations on commercially reasonable terms there is no guarantee that adequate additional space will be available as needed on terms acceptable to us. In addition, although all our facilities are currently in close proximity, there may be logistical issues that arise by virtue of separating these departments from the rest of our operations, including issues related to information systems integration and connectivity speed.
Moreover, in order to better serve our expanding nationwide customer base, to create a backup to our current laboratory facility and to gain additional referrals for our specialized diagnostic services, we may replicate our current California-based operations in a geographically different location in the future. In order to perform improvements on the newly leased facilities in Carlsbad, California and to later establish a backup laboratory facility in another region, we will be required to spend considerable time and resources securing adequate space, constructing the facility, obtaining the federal, state and local certifications required by all applicable laws and regulations, recruiting and training employees and establishing the additional operational, logistical and administrative infrastructure necessary to support a facility. Even after the new laboratory facility is operational, it may take time for us to derive the same economies of scale as in our existing facility. Moreover, we may suffer reduced economies of scale in our existing laboratory facility as we seek to balance the amount of work allocated to each laboratory facility. Similarly, we may invest in new backup systems in order to prevent the interruption in our current systems, which may be costly and would take time and resources to implement. Each expansion of our facilities or systems could divert resources, including the focus of our management, away from our current business. As we expand into other locations, including limited international expansion, there will be enhanced potential for logistical or other issues, including regulatory compliance issues and issues that may be specific to particular foreign countries. In addition, each expansion of our facilities may increase our costs and potentially decrease operating margins, both of which would, individually or in the aggregate, negatively impact our business, financial condition and results of operations. We will need to continue to expand our managerial, operational, financial, sales, marketing and other infrastructure in order to adequately manage our business and provide support for our services. In addition, to the extent our service levels in our existing or new facilities suffer, this may adversely impact our business, financial condition and results of operations.
If our Carlsbad facilities become inoperable, we will be unable to perform our specialized diagnostic services and our business will be harmed.
We currently do not have redundant laboratory or administrative facilities. We perform all of our diagnostic testing in our laboratory facility located in Carlsbad, California. Carlsbad is situated on or near earthquake fault lines and is located in an area that has experienced severe wildfires during the past several years. In addition, we do not have redundant systems for all of our business processes. Our facilities, the equipment we use to perform our tests and services and our other business process systems would be costly to replace and could require substantial time to repair or replace. The facilities may be harmed or rendered inoperable by natural or people-made disasters, including earthquakes, wildfires, floods, acts of terrorism or other criminal activities, infectious disease outbreaks and power outages, which may render it difficult or impossible for us to perform our tests for some period. In addition, such events may temporarily interrupt our ability to receive specimens or materials from our suppliers and to have access to our various systems necessary to operate our business. For example, in late 2007 we experienced a power outage at our Carlsbad laboratory facility and the evacuation of our facilities as a result of severe wildfires. Although our backup generator and other backup procedures and systems allowed us to continue our operations without material interruption, we cannot assure you that similar incidents will not adversely affect our business in the future. The inability to perform our tests and services would result in the loss of customers and harm our reputation and we may be unable to regain those customers in the future. Our
27
Table of Contents
insurance carriers and insurance policies covering damage to our property and the disruption of our business may become financially unstable or may not be sufficient to cover all of our potential losses and may not continue to be available to us on acceptable terms, or at all.
In the event our current operating laboratory facility is damaged or destroyed, we would need to engage a third party to perform laboratory testing services on our behalf. In order to rely on a third party to perform these testing services, we could only use another facility with established state licensure and CLIA accreditation. We cannot assure you that we would be able to find another CLIA-certified facility, or that another laboratory would be willing to perform the necessary tests for us on commercially reasonable terms. Finding a new laboratory that meets the required state licensure and CLIA accreditation standards or developing new systems necessary to operate our business under these circumstances would be time-consuming and costly and result in delays in our ability to provide our specialized diagnostic services or to provide the same level of quality in our services as we currently provide, which would harm our reputation and adversely affect our business, results of operations and financial condition.
We incur financial risk related to collections.
Substantially all of our revenues are derived from specialized diagnostic services for which we bill on a fee-for-service basis. Billing for diagnostic services is a complex process and we bill many different payors such as insurance companies, governmental payor programs and patients, each of which has different billing requirements. Although we have experienced favorable trends in the collection of accounts receivable and related reductions to our provisions for doubtful accounts, we face risks in our collection efforts, including potential write-offs of doubtful accounts and long collection cycles for accounts receivable, including reimbursements by third party payors, such as Medicare, Medicaid and other governmental payor programs, hospitals, private insurance plans and managed care organizations. As a result of the current economic climate, we may face increased risks in our collection efforts, which could adversely affect our business. In addition, increases in write-offs of doubtful accounts (particularly in response to increases in personal bankruptcies), delays in receiving payments or potential retroactive adjustments and penalties resulting from audits by payors could adversely affect our business, results of operations and financial condition. As of December 31, 2009 and 2008, we had an allowance for doubtful accounts of $5.4 million and $4.1 million, respectively, which we reduced by $1.9 million and $664,000, respectively, for write-offs, net of recoveries.
We or our suppliers and/or manufacturers may be subject to litigation relating to, among other things, payor and customer disputes, regulatory actions, professional liability, intellectual property, employee-related matters, product liability and other potential claims, which could adversely affect our business.
We or our suppliers and/or manufacturers may become subject in the ordinary course of business to material litigation related to, among other things, payor or customer disputes, professional liability, regulatory actions, intellectual property, employee-related matters, product liability and other potential claims, as well as investigations and audits by governmental agencies and governmental payors relating to the specialized diagnostic services we provide or other aspects of our business. Responding to these types of claims, investigations or audits, regardless of their merit, could result in significant expense and divert the time, attention and resources of our management. Legal actions could result in substantial monetary damages, fines and penalties as well as significant harm to our reputation with community-based hem/oncs and other healthcare professionals and with payors, which could adversely affect our business, financial condition and results of operations.
We, Cartesian and/or our hempaths may be sued, or may be added as an additional party, under physician liability or other liability law for acts or omissions by our hempaths, laboratory personnel, CSCs, and other employees and consultants, including but not limited to being sued for misdiagnoses or liabilities arising from the professional interpretations of test results. We, Cartesian and/or our hempaths may periodically become involved as defendants in medical malpractice and other lawsuits and are subject to the attendant risk of substantial damage awards, in particular in connection with our COMPASS service offering. Our hempaths are insured for
28
Table of Contents
medical malpractice risks on a claims-made basis under traditional professional liability insurance policies. We also maintain general liability insurance that covers certain claims to which we may be subject. Our general insurance does not cover all potential liabilities that may arise, including governmental fines and penalties that we may be required to pay, liabilities we may incur under indemnification agreements and certain other uninsurable losses that we may suffer. It is possible that future claims will not be covered by or will exceed the limits of our insurance coverage.
We and the suppliers and manufacturers of the diagnostic tests we perform, which are critical to the performance of our specialized diagnostic services, may be exposed to, or threatened with, future litigation by third parties having patent or other intellectual property rights alleging that our diagnostic tests infringe the intellectual property rights of these third parties. In such event, we could no longer have access to, we may be prohibited from marketing or performing, or we may be subject to liabilities or litigations relating to such diagnostic tests unless we obtained a license from such third party. A license may not be available to us on acceptable terms, if at all. If we are unable to license diagnostic tests that are important to our specialized diagnostic services, our business, financial condition and results of operations may be adversely affected.
We rely on a limited number of third parties for manufacture and supply of all of our laboratory instruments, tests and materials, including consumables, and we may not be able to find replacement suppliers or manufacturers in a timely manner in the event of any disruption, which could adversely affect our business.
We rely on third parties for the manufacture and supply of all of our laboratory instruments, equipment and materials, including consumables such as reagents and disposable test kits, that we need to perform our specialized diagnostic services and rely on a limited number of suppliers for certain laboratory materials and some of the laboratory equipment with which we perform our diagnostic services. We do not have long-term contracts with our suppliers and manufacturers that commit them to supply equipment and materials to us. Certain of our suppliers provide us with analyte specific reagents, or ASRs, which serve as building blocks in the diagnostic tests we conduct in our laboratory. These suppliers are subject to regulation by the U.S. Food and Drug Administration, or FDA, and must comply with federal regulations related to the manufacture and distribution of ASR products. Because we cannot ensure the actual production or manufacture of such critical equipment and materials, or the ability of our suppliers to comply with applicable legal and regulatory requirements, we may be subject to significant delays caused by interruption in production or manufacturing. If any of our third party suppliers or manufacturers were to become unwilling or unable to provide this equipment or these materials in required quantities or on our required timelines, we would need to identify and acquire acceptable replacement sources on a timely basis. While we have developed alternate sourcing strategies for the equipment and materials we use, we cannot be certain that these strategies will be effective and even if we were to identify other suppliers and manufacturers for the majority of equipment and materials we need to perform our specialized diagnostic services, there can be no assurance that we will be able to enter into agreements with such suppliers and manufacturers or otherwise obtain such items on a timely basis or on acceptable terms, if at all. If we encounter delays or difficulties in securing necessary laboratory equipment or materials, including consumables, we would face an interruption in our ability to perform our specialized diagnostic services and experience other disruptions that would adversely affect our business, results of operations and financial condition.
Performance issues, service interruptions or price increases by our shipping carrier could adversely affect our business, results of operations and financial condition and harm our reputation and ability to provide our specialized diagnostic services on a timely basis.
Expedited, reliable shipping is essential to our operations. One of our marketing strategies entails highlighting the reliability of our point-to-point transport of patient samples.
We rely almost exclusively on a single carrier, Federal Express, for reliable and secure point-to-point transport of patient bone marrow and other samples to our laboratory and enhanced tracking of these patient
29
Table of Contents
samples. Federal Express has tailored some of its systems and processes to meet our specific needs in providing high quality services to our hem/onc customers. In our specialty diagnostic field, patient samples more often than not include bone marrow biopsies, which are both technically difficult for a physician to obtain and extremely uncomfortable for patients to endure. Should Federal Express encounter delivery performance issues such as loss, damage or destruction of a sample, it would be difficult to replace our patient samples in a timely manner and such occurrences may damage our reputation and lead to decreased referrals from physicians for our specialized diagnostic services and increased cost and expense to our business. In addition, any significant increase in shipping rates or fuel surcharges could adversely affect our operating margins and results of operations. Similarly, strikes, severe weather, natural disasters or other service interruptions by delivery services we use would adversely affect our ability to receive and process patient samples on a timely basis.
If Federal Express or we were to terminate our relationship, we would be required to find another party to provide expedited, reliable point-to-point transport of our patient samples. There are only a few other providers of such nationwide transport services and there can be no assurance that we will be able to enter into arrangements with such other providers on acceptable terms, if at all. Finding a new provider of transport services would be time-consuming and costly and result in delays in our ability to provide our specialized diagnostic services. Even if we were to enter into an arrangement with such provider, there can be no assurance that they will provide the same level of quality in transport services currently provided to us by Federal Express. If the new provider does not provide the required quality and reliable transport services, it could adversely affect our business, reputation, results of operations and financial condition.
Proprietary trademarks, service marks, trade secrets and unpatented expertise are very important to our business.
We use numerous trademarks and service marks to identify the products and services we offer, some of which have been registered with the U.S. Patent and Trademark Office, or USPTO, and others of which are undergoing USPTO review. In addition, we are seeking registration of the name Genoptix in additional fields of use. We cannot guarantee that any of the trademarks or service marks for which we have applied for registration will be granted. Moreover, should a third party challenge one or more of our trademarks or service marks, we cannot guarantee that we would prevail in that challenge. Despite the use of our trademarks or service marks in connection with our services, we are not the sole person entitled to use the names COMPASS or CHART in every category in the United States. For example, third parties have registered the name COMPASS in the United States in the medical field and other categories. None of these third parties has contacted us with a claim that our COMPASS trademark infringes their rights. We cannot guarantee that a third party with rights in a COMPASS or CHART trademark, or in another trademark we use, will not assert those rights against us in the future, by opposing one of our trademark applications, petitioning to cancel one of our trademark registrations, or filing suit against us for trademark infringement seeking damages and/or an injunction to stop us from using our mark.
Although we have taken steps to protect our trade secrets and unpatented expertise, including entering into confidentiality agreements with third parties and confidential information and inventions agreements with employees, consultants and advisors, third parties may still be able to obtain this information or we may be unable to protect our rights. There can be no assurance that binding agreements will not be breached, that we would have adequate remedies for any breach, or that our trade secrets will not otherwise become known or be independently discovered by our competitors. Enforcing a claim that a third party illegally obtained and is using our trade secrets or unpatented expertise is expensive and time-consuming and the outcome is unpredictable. Moreover, our competitors may independently develop equivalent knowledge, methods and expertise and we would not be able to prevent their use.
Guidelines, recommendations and studies published by various organizations can reduce the use of our diagnostic tests and may adversely affect our business.
Professional societies, practice management groups, private health and science foundations, and organizations involved with various malignancies of the blood and bone marrow, and other forms of cancer may publish guidelines, recommendations or studies to the healthcare and physician communities from time to time.
30
Table of Contents
Recommendations of government agencies or these other groups and organizations may discuss matters such as efficiency, quality, cost-effectiveness, reputation and the use of related testing. These organizations have made recommendations about our testing services and the testing services of our competitors in the past. Recommendations, guidelines or studies that are followed by community-based hem/oncs could lead to a reduction in the use of our diagnostic tests which would adversely affect our business, results of operations and financial condition. In addition, our success also depends on our ability to educate community-based hem-oncs and third party payors about the value of our highly specialized diagnostic services. If these education efforts are not effective, then we may not be able to increase the sales of our existing diagnostic tests or successfully introduce new testing services to the market.
If technological innovation or prophylactic treatments were to reduce the need to conduct diagnostic testing on blood and bone marrow samples or allow our customers or other third parties to perform specialized diagnostic services similar to ours, our business, prospects, results of operations and financial condition could be adversely affected.
In order for hem/oncs to arrive at the correct diagnosis, choose or modify appropriate therapeutic regimens and monitor the effectiveness of these regimens, they currently require highly specialized diagnostic services that analyze blood and bone marrow samples. We focus our diagnostic efforts primarily on specific malignancies of the blood and bone marrow. Serial blood and bone marrow examinations are often performed to follow the progress of the disease and the patient’s response to therapy. Technological innovations or other advances in medicine that result in the creation of enhanced diagnostic tools may enable other clinical laboratories, hospitals, physicians or other medical providers, or patients, to provide specialized diagnostic services similar to ours in a more patient-friendly, efficient or cost-effective manner than is currently possible such as point-of-care tests which physicians can perform in their offices or highly specialized tests that can be performed by hospitals in their own laboratories. Although the CLIA accreditation process and compliance costs make it difficult for many physicians to operate clinical laboratories in their offices, manufacturers of laboratory equipment and test kits could seek to increase their sales by marketing point-of-care tests and equipment to physicians. Advances in technology or medicine may also result in a cure or prophylactic treatment for some of the diseases on which we focus which could reduce or eliminate the need to obtain and analyze blood and bone marrow samples. This could substantially reduce or eliminate our market opportunity and adversely affect our business, prospects, results of operations and financial condition.
Failure in our information systems, or IS, telephone or other systems could significantly disrupt our operations and adversely affect our business and financial condition.
IS and telephone systems are used extensively in virtually all aspects of our business, including laboratory testing, sales, billing, customer service, logistics and management of medical data. The success of our business depends on the ability to obtain, process, analyze, maintain and manage this data and periodically enhance our IS, telephone and other systems to facilitate the continued growth of our business. Our management relies on our information systems because:
| • | patient samples must be received, tracked and processed on a timely basis; |
| • | test results must be monitored and reported on a timely basis; |
| • | billings and collections for all customers must be managed efficiently and accurately; |
| • | third party ancillary billing services require proper tracking and reporting; |
| • | pricing and other information related to our services is needed by our sales force and other personnel in a timely manner to conduct business; |
| • | centralized procurement and test inventory management systems are required for effective test inventory management; |
| • | regulatory compliance requires proper tracking and reporting; and |
31
Table of Contents
| • | proper recordkeeping is required for operating our business, regulatory compliance, managing employee compensation and other personnel matters. |
Our business, results of operations and financial condition may be adversely affected if, among other things:
| • | our IS, telephone or other systems are interrupted or fail for an extended length of time; |
| • | services relating to our IS, telephone or other systems are not kept current; |
| • | our IS, telephone or other systems become unable to support expanded operations and increased levels of business; |
| • | services provided by one or more of our vendors fail to operate within the expected technical parameters; |
| • | information is lost or unable to be restored or processed; or |
| • | information security is breached. |
Our success depends, in part, on the continued and uninterrupted performance of our IS, telephone and other systems, which are vulnerable to damage from a variety of sources, including telecommunications or network failures, computer viruses, natural disasters and physical or electronic break-ins. We are especially vulnerable to losses of patient information, which could result in violations of federal and state privacy laws. Despite the precautionary measures we have taken to prevent breakdowns in our IS and telephone systems, sustained or repeated system failures that interrupt our ability to process test orders, deliver test results or perform tests in a timely manner or that cause us to lose patient information could adversely affect our business, results of operations and financial condition.
We may experience difficulty in identifying, acquiring or in-licensing and integrating third parties’ products, services, businesses and technologies into our current infrastructure or otherwise expanding our service offerings and we may not be able to successfully execute on and integrate such products, services, businesses or technologies, which could disrupt our business and adversely affect our results of operations and financial condition.
An important part of our business strategy is to opportunistically expand our service offerings and pursue additional technologies, collaborations and acquisitions that will enable us to accelerate the implementation of our strategic plan and to increase the number of customers we serve and the specialized diagnostic services we provide to those customers, including by way of investments in other companies, expansion into new markets, licensing of technology, co-development arrangements, collaborations, asset purchases or other similar transactions. For example, we currently outsource select specialized services that we offer and we may in the future seek to acquire the necessary capabilities to provide these services internally. We may seek to expand our services and technologies, on an opportunistic basis and as resources allow, by acquiring or in-licensing products, services, businesses or technologies that we believe are a strategic fit with our business and growth plans. Future acquisitions or in-licensing of products, services, businesses or technologies, however, may entail numerous operational and financial risks including:
| • | exposure to unknown liabilities; |
| • | disruption of our business and diversion of our management’s time and attention; |
| • | the availability of financing to pay for these transactions; |
| • | incurrence of substantial debt or dilutive issuances of securities to pay for these transactions; |
| • | higher than expected acquisition, in-licensing and integration costs; |
| • | increased amortization expenses; |
32
Table of Contents
| • | difficulties in and costs of combining the operations and personnel of any acquired or in-licensed products, services, businesses or technologies with our operations and personnel; |
| • | increased regulatory, compliance and litigation risk; |
| • | expenses associated with maintaining, defending and enforcing, and other associated risks with, acquired or licensed intellectual properties or technologies; |
| • | impairment of relationships with key suppliers or customers of any acquired or in-licensed products, services, businesses or technologies due to changes in management and ownership; |
| • | inability to retain key employees of any acquired or in-licensed products, services, businesses or technologies; and |
| • | inability to obtain appropriate coverage and reimbursement for these new services and technologies. |
Finally, we may devote resources to potential acquisitions, expansion efforts, in-licensing or collaboration opportunities that are never completed, acquired by others, or fail to realize the anticipated benefits of such efforts. We may not be able to successfully expand our service offerings to our community-based hem/onc customers and successfully provide them with new technologies and innovations. If we are unable to acquire or in-license new products, services, business or technologies to expand our specialized laboratory services, our testing methods may become outdated when compared to our competitors and testing volume and revenue may be adversely affected. Any of these matters could disrupt our business and adversely affect our growth prospects, results of operations and financial condition, and reputation with our customers.
We may fail in our attempts to expand our service offerings by adding new testing capabilities.
We may commit substantial efforts, funds and other resources to developing commercially successful service offerings. A high rate of failure is inherent in the development of new specialized testing services. There is no assurance that our efforts to develop these new service offerings will be commercially successful. Failure can occur at any point in the development process, including after significant funds have been invested.
Promising new diagnostic tests may fail to reach the market or may have only limited commercial success because of the failure to achieve positive clinical outcomes, inability to obtain necessary regulatory approvals, excessive costs to manufacture, the failure to establish or maintain intellectual property rights, or the infringement of intellectual property rights of others. Even if we successfully develop new specialized testing services or enhancements or new generations of our existing diagnostic tests, they may be quickly rendered obsolete by changing customer preferences or changing industry standards. New developments may not be accepted quickly by community-based hem/oncs because of, among other things, entrenched patterns of clinical practice or uncertainty over third party payor reimbursement. We cannot state with certainty when or whether any of our new diagnostic tests under consideration will be launched, whether we will be able to develop, license or otherwise acquire new specialized tests, or whether any diagnostic tests will be commercially successful. Failure to launch successful new specialized testing services or new developments for existing tests may cause our diagnostic tests to become obsolete.
We use biological and hazardous materials that require considerable expertise and expense for handling, storage or disposal and may result in claims against us.
We work with hazardous materials, including chemicals, biological agents and compounds, blood and bone marrow samples and other human tissue, that could be dangerous to human health and safety or the environment. Our operations also produce hazardous and biohazardous waste products. Federal, state and local laws and regulations govern the use, generation, manufacture, storage, handling and disposal of these materials and wastes. Compliance with applicable environmental laws and regulations may be expensive and current or future environmental laws and regulations may impair business efforts. If we do not comply with applicable regulations, we may be subject to fines and penalties.
33
Table of Contents
In addition, we cannot entirely eliminate the risk of accidental injury or contamination from these materials or wastes. Our general liability insurance and/or workers’ compensation insurance policy may not cover damages and fines arising from biological or hazardous waste exposure or contamination. Accordingly, in the event of contamination or injury, we could be held liable for damages or penalized with fines in an amount exceeding our resources and our operations could be suspended or otherwise adversely affected.
We have a limited operating history and we are unable to predict with certainty whether we will be able to continue our revenue growth and become increasingly profitable.
We are a relatively early stage company with a limited operating history. We did not commence selling our specialized diagnostic services until the third quarter of 2004 and only became profitable in the first quarter of 2007. Consequently, any predictions about our future performance may not be as accurate as they could be if we had a longer history of successfully commercializing specialized diagnostic services.
We incurred losses in each full fiscal year from inception to 2006, and have recovered our maximum accumulated deficit as of December 31, 2006 of $55.3 million, resulting in accumulated earnings of $20.0 million as of December 31, 2009. This is compared to an accumulated deficit of $10.6 million as of December 31, 2008. Although we have continued to increase our revenues and profitability, there is no guarantee that we will be able to continue our revenue growth and maintain or increase our profitability. It is possible that we may incur operating losses in the future as we expand our infrastructure, increase selling expenses and general and administrative expenses or if we are unable to continue to maintain or increase our revenues or control expenses. Because of the numerous risks and uncertainties associated with our growth prospects, sales and marketing and other efforts and other factors, we are unable to predict with certainty whether we will be able to maintain our strong revenue growth and remain profitable or predict the extent of our future profitability or losses.
We may be subject to claims that our employees, consultants or independent contractors have wrongfully used or disclosed alleged trade secrets of their other clients or former employers to us.
In addition to our employees, we engage the services of consultants to assist us with certain aspects of our business. Many of these employees or consultants were previously employed at or may have previously been or are currently providing consulting services to, other clinical laboratories or diagnostics companies, including our competitors or potential competitors. Although no claims against us are currently pending, we may be subject to claims that we or these employees or consultants have inadvertently or otherwise used or disclosed trade secrets or other proprietary information of their former employers or their former or current customers. Litigation may be necessary to defend against these claims. Even if we are successful in defending against these claims, litigation could result in substantial costs and be a distraction to management.
Risks Relating to Regulatory and Compliance Matters
We conduct business in a heavily regulated industry and changes in regulations or violations of regulations may, directly or indirectly, reduce our revenues, adversely affect our results of operations and financial condition and harm our business.
The clinical laboratory testing industry is highly regulated and there can be no assurance that the regulatory environment in which we operate will not change significantly and adversely in the future. In particular, there is risk of healthcare reform or other legislative activity in the near term, which may result in changes in the regulatory or payor environment that may adversely affect our business. Areas of the regulatory environment that may affect our ability to conduct business include, without limitation:
| • | federal and state laws applicable to billing and claims payment and/or regulatory agencies enforcing those laws and regulations; |
| • | federal and state laboratory anti-mark-up laws; |
34
Table of Contents
| • | federal and state anti-kickback laws; |
| • | federal and state false claims laws; |
| • | federal and state self-referral and financial inducement laws, including the Stark Law; |
| • | coverage and reimbursement levels by Medicare, Medicaid, other governmental payors and private insurers; |
| • | restrictions on reimbursements for our services; |
| • | federal and state laws governing laboratory testing, including CLIA; |
| • | federal and state laws governing the development, use and distribution of diagnostic medical tests known as “home brews”; |
| • | HIPAA, including expansion and amendments thereto by the HITECH Act and analogous state laws; |
| • | federal and state regulation of privacy, security and electronic transactions; |
| • | state laws regarding prohibitions on the corporate practice of medicine; |
| • | state laws regarding prohibitions on fee-splitting; |
| • | federal, state and local laws governing the handling and disposal of medical and hazardous waste; |
| • | the Federal Trade Commission’s “Red Flags Rule,” which requires creditors to comply with regulations regarding the prevention of identity theft, and state laws relating to identity theft; |
| • | OSHA rules and regulations; and |
| • | changes to other federal, state and local laws, including tax laws. |
These laws and regulations are extremely complex and in many instances, there are no significant regulatory or judicial interpretations of these laws and regulations. While we believe that we are currently in material compliance with applicable laws and regulations, a determination that we have violated these laws or regulations, or the public announcement that we are being investigated or audited for possible violations of these laws or regulations, would adversely affect our business, prospects, results of operations and financial condition. In addition, a significant change in any of these laws or regulations may require us to change our business model in order to maintain compliance as a result of such change, which could reduce our revenues or increase our costs and adversely affect our business, prospects, results of operations and financial condition.
In August 2009, the Internal Revenue Service, or IRS, commenced an examination of our U.S. federal income tax return for the tax year ended December 31, 2007. To date, there have been no proposed adjustments communicated to management. While we believe we are adequately reserved, if the examination results in an unfavorable outcome, there could be a material impact on the financial results in the period the outcome is determined.
We are subject to U.S. federal income tax as well as income tax in jurisdictions of each state having an income tax. The tax years that remain subject to examination are 2006 for federal income taxes and 2004 for state income taxes, including years ending thereafter. However, to the extent allowed by law, the tax authorities may have the right to examine prior periods where net operating losses or tax credits were generated and carried forward, and make adjustments up to the amount of the net operating losses or credit carryforward amounts.
If we fail to comply with healthcare fraud and abuse laws that govern, among other things, sales and marketing, billing and claims processing practices, we could face substantial penalties and our business, results of operations and financial condition could be adversely affected.
We are subject to various state and federal healthcare fraud and abuse laws and regulations, including, but not limited to:
| • | the federal Anti-Kickback Statute, which prohibits persons from knowingly and willfully soliciting, receiving, offering or providing remuneration, directly or indirectly, in cash or in kind, in exchange for |
35
Table of Contents
| or to induce either the referral of an individual for, or the purchase, order or recommendation of, any good or service for which payment may be made under governmental payor programs such as Medicare and Medicaid; |
| • | the federal False Claims Act that prohibits individuals or entities from knowingly presenting, or causing to be presented to the federal government, claims for payment that are false or fraudulent and knowingly concealing or knowingly improperly avoiding or decreasing an obligation to pay or transmit money to the federal government; |
| • | HIPAA, which created federal criminal laws that prohibit executing a scheme to defraud any healthcare benefit program or making false statements relating to healthcare matters; |
| • | the HITECH Act, which requires covered entities, such as clinical laboratories, following discovery of a breach of unsecured PHI, to provide notification to affected individuals and the Secretary and other measures depending on the number of individuals, whose unsecured PHI has been breached; |
| • | the Stark Law, which prohibits a physician from making a referral to an entity for certain designated health services reimbursed by Medicare or Medicaid if the physician (or a member of the physician’s family) has a financial relationship with the entity and which also prohibits the submission of any claim for reimbursement for designated health services furnished pursuant to a prohibited referral; and |
| • | state law equivalents of each of the above federal laws, such as anti-kickback and false claims laws which may apply to items or services reimbursed by any third party payor, including commercial insurers. |
Sanctions under these federal and state laws may include civil monetary penalties, exclusion of a clinical laboratory’s participation in or reimbursement from governmental payor programs, criminal fines and imprisonment. Although we endeavor to comply in all material respects with these rules and regulations, our sales and marketing, billing and claims processing practices may not, in all cases, meet all of the criteria for safe harbor protection or exemptions from liability under these laws. For example, in most cases, patients who utilize service providers that are not participants in a preferred provider network are subject to increased financial obligations in the form of greater coinsurance or copayment requirements. For approximately half of our revenues for the years ended December 31, 2009, 2008 and 2007, we were generally subject to reimbursement as a non-contracting provider. In order to maintain our competitiveness with other clinical laboratories, except as required by applicable laws, we frequently accept third party insurance payment as payment in full and, in turn, waive all or a part of a patient’s coinsurance obligations such that the patient’s financial burden is no greater than if their physician would have selected an “in-network” provider to perform their laboratory services. A successful challenge to our practice of accepting third party insurance payments as payment in full under the laws discussed above could adversely affect our business, results of operations and financial condition.
In addition, certain federal Anti-Kickback Statute safe harbors and certain exceptions to the Stark Law exist to promote the adoption of electronic health records, or EHR Systems, by physician offices. These safe harbors/exceptions may be modified or eliminated and may not provide adequate protection for companies relying on such provisions. Should we choose to rely on these safe harbors/exceptions to assist any physician customers with the purchase of an EHR System, we may not, in all cases, meet all of the necessary criteria for protection. In addition to the added cost of providing EHR System assistance to physician practices, a successful challenge to any potential reliance on the safe harbors and exceptions could adversely affect our business, operations and reputation.
Our failure to comply with governmental payor regulations could result in our being excluded from participation in Medicare, Medicaid or other governmental payor programs, which would decrease our revenues and adversely affect our results of operations and financial condition.
Reimbursement from Medicare and Medicaid accounted for approximately 40%, 38%, and 38% of our revenues for the years ended December 31, 2009, 2008 and 2007, respectively. The Medicare program is administered by CMS, which, like the states that administer their respective state Medicaid programs, imposes
36
Table of Contents
extensive and detailed requirements on diagnostic services providers, including, but not limited to, rules that govern how we structure our relationships with physicians, how and when we submit reimbursement claims and how we provide our specialized diagnostic services. Our failure to comply with applicable Medicare, Medicaid and other governmental payor rules could result in our inability to participate in a governmental payor program, our returning funds already paid to us, civil monetary penalties, criminal penalties and/or limitations on the operational function of our laboratory. If we were unable to receive reimbursement under a governmental payor program, a substantial portion of our revenues would be lost, which would adversely affect our results of operations and financial condition.
Our business could be harmed by future interpretations of clinical laboratory mark-up prohibitions.
Our laboratory currently uses the services of outside reference laboratories to provide certain complementary laboratory services to those services provided directly by our laboratory. Although Medicare policies do not prohibit certain independent-laboratory-to-independent-laboratory referrals and subsequent mark-up for services, California and other states have rules and regulations that prohibit or limit the mark-up of these laboratory-to-laboratory services. A challenge to our charge-setting procedures under these rules and regulations could have a material adverse effect on our business, results of operations and financial condition.
Our business could be harmed from the loss or suspension of a license or imposition of a fine or penalties under, or future changes in, the law or regulations of CLIA or those of other state or local agencies.
We are subject to CLIA, which is administered by CMS and extends federal oversight to virtually all clinical laboratories by requiring that they be certified by the federal government or by a federally approved accreditation agency. CLIA is designed to ensure the quality and reliability of clinical laboratories by mandating specific standards in the areas of personnel qualifications, administration and participation in proficiency testing, patient test management, quality control, quality assurance and inspections. The sanction for failure to comply with CLIA requirements may be suspension, revocation or limitation of a laboratory’s CLIA certificate, which is necessary to conduct business, as well as significant fines and/or criminal penalties. If a laboratory is certified as “high complexity” under CLIA, the laboratory may obtain ASRs, which are used to develop in-house diagnostic tests known as “home brews.” We received our CLIA accreditation certificate as a “high complexity” laboratory in mid-2004. To renew this certificate, we are subject to survey and inspection every two years as well as the possibility of unannounced inspections at any time. Our CLIA accreditation was renewed in February 2009 and expires on February 3, 2011.
We are also subject to regulation of laboratory operations under state clinical laboratory laws. State clinical laboratory laws may require that laboratories and/or laboratory personnel meet certain qualifications, implement certain quality controls or require maintenance of certain records. For example, California requires that we maintain a license to conduct testing in California and California law establishes standards for our day-to-day laboratory operations, including the training and skill required of laboratory personnel and quality control. Potential sanctions for violation of these statutes and regulations include significant fines and the suspension or loss of various licenses, certificates and authorizations, which could adversely affect our business and results of operations.
Certain of our specialized diagnostic tests take advantage of the “home-brew” exception from the FDA review and any changes to the FDA’s policies with respect to this exception could adversely affect our business and results of operations.
Clinical laboratory diagnostic tests that are developed and validated by a laboratory for use in examinations the laboratory performs itself are called “home brew” tests. The FDA maintains that it has authority to regulate the development and use of “home brews” as diagnostic medical devices under the Federal Food, Drug and Cosmetic Act but to date has decided not to exercise its authority with respect to most “home brew” tests as a matter of enforcement discretion. A substantial portion of our specialized diagnostic tests are “home brew” tests
37
Table of Contents
for which we have not obtained the FDA premarket clearance or approval. In addition, manufacturers and suppliers of ASRs, which we obtain for use in our “home brews,” are required to register with the FDA, to conform manufacturing operations to the FDA’s Quality System Regulation and to comply with certain reporting and other recordkeeping requirements. The FDA regularly considers the application of additional regulatory controls over the sale of ASRs and the development and use of “home brews” by laboratories such as ours. As a result of recent industry events, it is possible the FDA may look at the sale and use of “home brew” tests with heightened scrutiny or modify their regulatory approach with respect to “home brew” tests. We cannot predict the extent of the FDA’s future regulation and policies with respect to “home brew” tests and there can be no assurance that the FDA will not require us to obtain premarket clearance or approval for certain diagnostic tests that we perform. Any such premarket clearance requirements could restrict or delay our ability to provide our specialized diagnostic services and may adversely affect our business and results of operations.
Failure to comply with the HIPAA security and privacy regulations and other state regulations may increase our operational costs.
The HIPAA privacy and security regulations establish comprehensive federal standards with respect to the uses and disclosures of protected health information, or PHI, by health plans and healthcare providers, in addition to setting standards to protect the confidentiality, integrity and availability of electronic PHI. The regulations establish a complex regulatory framework on a variety of subjects, including:
| • | the circumstances under which uses and disclosures of PHI are permitted or required without a specific authorization by the patient, including but not limited to treatment purposes, to obtain payments for services and healthcare operations activities; |
| • | a patient’s rights to access, amend and receive an accounting of certain disclosures of PHI; |
| • | the content of notices of privacy practices for PHI; and |
| • | administrative, technical and physical safeguards required of entities that use or receive PHI electronically. |
We have implemented policies and procedures related to compliance with the HIPAA privacy and security regulations, as required by law. The privacy regulations establish a uniform federal “floor” and do not supersede state laws that are more stringent. Therefore, we are required to comply with both federal privacy regulations and varying state privacy laws. The federal privacy regulations restrict our ability to use or disclose patient identifiable laboratory data, without patient authorization, for purposes other than payment, treatment or healthcare operations (as defined by HIPAA), except for disclosures for various public policy purposes and other permitted purposes outlined in the privacy regulations. The privacy and security regulations provide for significant fines and other penalties for wrongful use or disclosure of PHI, including potential civil and criminal fines and penalties. Although the HIPAA statute and regulations do not expressly provide for a private right of damages, we also could incur damages under state laws to private parties for the wrongful use or disclosure of confidential health information or other private personal information.
The HITECH Act was signed into law on February 17, 2009, as part of the American Recovery and Reinvestment Act of 2009. The HITECH Act imposes stiffer penalties for HIPAA privacy and security violations. The HITECH Act also mandates that the United States Department of Health and Human Services investigate any complaints that are preliminarily determined to involve potential willful neglect. The HITECH Act heightens HIPAA enforcement by authorizing state attorney generals to file suit on behalf of their residents. Courts will be able to award damages, costs and attorneys’ fees related to violations of HIPAA.
Our business could be materially harmed by future interpretation or implementation of state laws regarding prohibitions on the corporate practice of medicine.
The manner in which licensed physicians can be organized to perform and bill for medical services is governed by state laws and regulations. Under the laws of some states, including California, business corporations generally are not permitted to employ physicians or to own corporations that employ physicians or
38
Table of Contents
to otherwise exercise control over the medical judgments or decisions of physicians. All of the hempaths that we utilize in connection with providing our specialized diagnostic services are employed by Cartesian. Cartesian is a California professional corporation formed for the purpose of providing professional medical services in conjunction with the diagnostic services that we provide. On December 31, 2005, we entered into the PSA with Cartesian, pursuant to which these hempaths provide professional services to us. Prior to that time, we employed these hempaths, which could result in the potential assertion by regulatory authorities that we were engaged in the corporate practice of medicine.
We believe that we currently are in compliance in all material respects with the laws governing the corporate practice of medicine in California. If regulatory authorities or other parties were to assert that we were engaged in the corporate practice of medicine currently or prior to December 31, 2005, or if California laws governing the corporate practice of medicine were to change, we could be required to restructure our contractual and other arrangements and we and/or our hempaths could be subject to civil or criminal penalties. In addition, the provision of our specialized diagnostic services, which rely heavily on the professional services provided by our hempaths, could be interrupted or suspended, which would adversely affect our business, results of operations and financial condition.
Risks Relating to Our Finances and Capital Requirements
Negative conditions in the global credit markets and financial services and other industries may impair the liquidity of a portion of our investment portfolio or may otherwise adversely affect our business.
All of our investment securities are classified as available-for-sale and therefore reported on the balance sheet at market value. Our investment securities consist of municipal securities, government-sponsored enterprise securities, corporate debt securities, U.S. treasury securities, certificates of deposit and a single auction rate security, or ARS.
As of December 31, 2009, we held a single ARS with a cost basis of $4.9 million. The ARS is classified as a long-term investment security at fair value of $3.8 million, net of a temporary impairment of $1.1 million due to the illiquidity of the investment security (See Note 3, Fair Value Measurements, in the accompanying notes to our consolidated financial statements included elsewhere in this Annual Report on Form 10-K). ARS are collateralized debt instruments with long-term contractual maturities that are structured with short-term holding periods. They provide liquidity through a Dutch auction process that resets the applicable interest rate at pre-determined intervals, typically every 7 to 35 days. The length of each holding period is determined at the original issuance of the ARS. We can sell at each auction at par, assuming there are buyers for the ARS at such auction. In order for the auction to be successful, demand in the marketplace must meet or exceed the supply. If an auction is unsuccessful, the interest rate on the security resets at a predetermined auction failure rate. An investor can continue to hold the investment security until the next auction date or attempt to sell in the secondary market, usually at a sizable discount.
The ARS in our investment securities portfolio consists of debt issued by a municipality that is also underwritten by an insurance agency. The ARS auctions began failing in February 2008. As of December 31, 2009, the ARS was rated “BAA1” by Moody’s Investors Service and “A” by Standard & Poor’s based on the underwriter’s guarantee. Although unsuccessful, the last auction occurred on September 10, 2008, prior to the bankruptcy of the broker/dealer that managed the auction. The funds associated with this security will not be accessible until the issuer restructures the debt, a buyer is found outside of the auction process, or the ARS matures in 2038. As such, we have recorded a temporary impairment of approximately $1.1 million as of December 31, 2009. In the meantime, the issuer continues to pay the interest as scheduled and has had two partial redemptions and shows no indication that it will be unable to meet its current obligations. We do not need to access these funds for operational purposes for the foreseeable future. Based on our ability to access our cash and cash equivalents and short-term investment securities and our expected operating cash flows, we do not anticipate that the temporary illiquidity of this investment will affect our ability to execute our current business plan.
39
Table of Contents
In addition to the sustained weakness in the global credit markets, the financial services industry and the U.S. capital markets, the U.S. economy as a whole has been experiencing a period of substantial turmoil and uncertainty characterized by unprecedented intervention by the U.S. federal government and the failure, bankruptcy, or sale of various financial and other institutions. The impact of these events on our business and the severity of the current economic crisis are uncertain. It is possible that the state of the global credit markets, the U.S. capital markets, the financial services industry and the U.S. economy may adversely affect our business, vendors and prospects as well as our liquidity and financial condition. More specifically, our insurance carriers and insurance policies covering all aspects of our business may become financially unstable or may not be sufficient to cover any or all of our losses and may not continue to be available to us on acceptable terms, or at all. Governmental payors private insurers and other private payors, from which we receive a substantial portion of our revenue, may delay payment or be unable to satisfy their reimbursement obligations as a result of the current economic crisis. A decrease in reimbursement would likely have a negative impact on the use of our specialized laboratory services and our revenue. The current tightening of global credit may create a delay or disruption in the performance or satisfaction of commitments to us by the vendors we rely on for the manufacture and supply of our laboratory instruments, equipment and materials, which could adversely affect our business.
We may need to raise additional capital in the future, which may not be available on favorable terms or at all, which may cause dilution to our existing stockholders or require us to be subject to certain restrictions.
We may need to raise additional capital in the future to fund the continued expansion of our business. Although we have become profitable over the past several years, our operations have consumed substantial amounts of cash since inception. To date, our sources of cash have been primarily limited to our initial public offering, private placements of preferred stock and debt, and more recently cash flow from operations. We expect to continue to spend substantial amounts of capital to grow our business. To fund such growth, we may raise additional funds through public or private equity offerings or debt financings. We do not know if we will be able to continue to generate cash flow from operations or if we will be able to obtain additional financing on favorable terms, if at all (particularly in light of the difficult current financing environment and weak economic conditions). If we cannot raise funds on acceptable terms, if and when needed, we may not be able to maintain or grow our business at the rate that we currently anticipate and respond to competitive pressures or unanticipated capital requirements, or we may be required to reduce operating expenses, which could significantly harm our business, financial condition and results of operations. In addition, to the extent that we raise additional capital by issuing equity securities, our existing stockholders’ ownership in our company will be diluted.
We expect to continue to incur significant costs as a result of operating as a public company and our management expects to continue to devote substantial time to public company compliance programs.
As a public company, we incur significant legal, accounting and other expenses that we did not incur as a private company. In addition, the Sarbanes-Oxley Act of 2002, or the Sarbanes-Oxley Act, as well as rules subsequently implemented by the SEC and The NASDAQ Stock Market, or NASDAQ, in the past several years have imposed various requirements on public companies, including establishment and maintenance of effective disclosure and financial controls, changes in corporate governance practices and substantial changes in executive compensation disclosure. The SEC and other regulators have continued to adopt new rules and regulations and make additional changes to existing regulations that require our compliance. Stockholder activism, the current political environment and the current high level of government intervention and regulatory reform may lead to substantial new regulations and disclosure obligations, which may lead to additional compliance costs and impact (in ways we cannot currently anticipate) the manner in which we operate our business. Our management and other personnel continue to devote a substantial amount of time to these compliance programs and other programs related to being a public company, such as investor relations, risk management (including securing director and officer liability insurance) and monitoring of public company reporting obligations. These rules and regulations will continue to cause us to incur significant legal and financial compliance costs and will make some activities more time-consuming and costly.
40
Table of Contents
The Sarbanes-Oxley Act requires, among other things, that we maintain effective internal control over financial reporting. In particular, each year we must perform system and process evaluation and testing of our internal control over financial reporting to allow management and our independent registered public accounting firm to report on the effectiveness of our internal control over financial reporting, as required by Section 404 of the Sarbanes-Oxley Act, or Section 404. Our testing, or the subsequent testing by our independent registered public accounting firm, may reveal significant deficiencies or material weaknesses in our internal control over financial reporting. We incur significant expense and devote substantial management effort toward ensuring compliance with Section 404. If we are not able to comply with the ongoing requirements of Section 404, or if we or our independent registered public accounting firm identify deficiencies in our internal control over financial reporting that are deemed to be significant deficiencies or material weaknesses, the market price of our common stock could decline and we could be subject to sanctions or investigations by NASDAQ, the SEC or other regulatory authorities, which would entail expenditure of additional financial and management resources.
Future changes in financial accounting standards or practices, or existing taxation rules or practices, may cause adverse unexpected revenue or expense fluctuations and affect our reported results of operations.
A change in accounting standards or practices, or a change in existing taxation rules or practices, can have a significant effect on our reported results and may even affect our reporting of transactions completed before the change is effective. New accounting pronouncements, taxation rules and varying interpretations of accounting pronouncements and taxation practice have occurred and may occur in the future. For example, in September 2008, the State of California passed a law, effective January 1, 2008, to suspend California net operating losses for two-years pertaining to certain corporations doing business within California. This net operating loss suspension had no impact on our income tax benefit, as reported. However, this does require us to pay income tax associated with our taxable income for the tax years 2008 and 2009, which our California deferred net operating loss otherwise would have reduced. Changes to existing rules or the questioning of current practices may adversely affect our reported financial results or the way we conduct our business. Our effective tax rate can also be impacted by changes in estimates of prior year items, the outcome of audits by federal, state and foreign jurisdictions and changes in overall levels of income before income tax. Furthermore, changes in accounting rules, such as increased use of fair value measures, changes in accounting principles generally accepted in the U.S. and the potential requirement that U.S. registrants prepare financial statements in accordance with International Financial Reporting Standards could potentially have a significant effect on our reported results.
Risks Relating to the Securities Markets and Investment in Our Common Stock
There may not be a viable public market for our common stock.
We cannot predict the extent to which investor interest in our company will continue to sustain an active trading market for our stock on The NASDAQ Global Select Market or any other stock market or how liquid any such market might remain. If an active public market is not sustained, it may be difficult for our stockholders to sell their shares of common stock at a price that is attractive to them, or at all.
Fluctuations in our operating results and market volatility may affect our stock price.
The market price of our common stock is volatile and may fluctuate significantly in response to a number of factors, many of which we cannot control, including:
| • | changes in coverage and/or reimbursement guidelines and amounts; |
| • | variations in deductible and coinsurance amounts; |
| • | changes in regulations affecting the healthcare or diagnostic services industry; |
| • | failure to comply with applicable regulations; |
41
Table of Contents
| • | changes in the payor mix or the mix or cost of our specialized diagnostic services; |
| • | the timing and volume of patient orders and the timing and cost of our sales and marketing campaigns; |
| • | repurchase of shares or issuance of dividends; |
| • | changes in contracted status with third party payors; |
| • | changes in compensation expense and other expenses that result in changes in our operating results; |
| • | increased investigative or enforcement initiatives by governmental and other third party payors; |
| • | additions or departures of key personnel; |
| • | recommendations and studies published by various organizations with respect to our services or those offered by our competitors; |
| • | variations in our quarterly operating results, including the number of business days in each quarter; |
| • | seasonality and volume declines due to adverse weather conditions and holidays; |
| • | changes in our accounting estimates; |
| • | changes in our DSO level; |
| • | changes in securities analysts’ estimates of our financial performance; |
| • | announcements of acquisitions or other strategic transactions by us or our competitors; |
| • | announcements of new products or services offered by us or our competitors; |
| • | fluctuations in stock market prices and trading volumes of similar companies or in the broader markets generally; |
| • | changes in economic conditions, in the global credit markets and financial services and other industries and the U.S. federal government response to developments in the economy and such markets and industries; |
| • | sales of large blocks of our common stock, including sales by our executive officers, directors and significant stockholders; |
| • | the acquisition of our common stock and related public disclosure by certain stockholders, including those that have a reputation for engaging in stockholder activism; |
| • | uncertainty with respect to the reasons for changes in the trading volume or the market price of our common stock; |
| • | any litigation in which we become involved; |
| • | fluctuations in security market indices of which we may be included now or in the future; |
| • | discussion of us or our stock price by the general media, online investor communities, financial industry or medical press; |
| • | changes in federal or state tax laws; and |
| • | impairment of any of our assets, including our investment securities. |
Due to these factors, stockholders may not be able to sell their shares of our common stock at favorable prices or at all.
Anti-takeover provisions in our charter documents and under Delaware law could make an acquisition of us, which may be beneficial to our stockholders, more difficult and may prevent attempts by our stockholders to replace or remove our current management.
Provisions in our amended and restated certificate of incorporation and amended and restated bylaws, as amended, may delay or prevent an acquisition of us or a change in our management. These provisions include a
42
Table of Contents
classified board of directors, a prohibition on actions by written consent of our stockholders and the ability of our board of directors to issue preferred stock without stockholder approval. In addition, because we are incorporated in Delaware, we are governed by the provisions of Section 203 of the Delaware General Corporation Law, which, subject to certain exceptions, prohibits stockholders owning in excess of 15% of our outstanding voting stock from merging or combining with us. Although we believe these provisions collectively provide for an opportunity to receive higher bids by requiring potential acquirers to negotiate with our board of directors, they would apply even if the offer may be considered beneficial by some stockholders. In addition, these provisions may frustrate or prevent any attempts by our stockholders to replace or remove our current management by making it more difficult for stockholders to replace members of our board of directors, which is responsible for appointing the members of our management.
If our executive officers, directors and largest stockholders choose to act together, they may be able to control our operations and act in a manner that advances their interests and not necessarily those of other stockholders.
As of February 18, 2010, our executive officers, directors, and holders of 5% or more, based on available information, of our outstanding common stock beneficially owned approximately 45% of our common stock. As a result, these stockholders, acting together, may be able to exert control or influence over matters requiring approval by our stockholders, including the election of directors and the approval of mergers or other business combination transactions. The interests of this group of stockholders may not always coincide with our interests or the interests of other stockholders and they may act in a manner that advances their interests and not necessarily those of other stockholders.
Future sales of our common stock may depress our stock price.
Sales of a substantial number of shares of our common stock in the public market could occur at any time. These sales, or the perception in the market that the holders of a large number of shares intend to sell shares, could reduce the market price of our common stock. As a result of the provisions of Rule 144 under the Securities Act of 1933, as amended, or the Securities Act, and Rule 701 under the Securities Act, substantially all of the outstanding shares of our common stock are available for sale in the public market, subject, in the case of shares of our common stock held by affiliates, to volume limitations, manner of sale requirements and certain other requirements. We also registered all shares of common stock that we may issue under our equity compensation plans. As a result, approximately 1.2 million shares are eligible for sale upon the exercise of vested options and release of specific RSUs outstanding as of February 18, 2010. These shares can be freely sold in the public market upon issuance, subject to our window period and insider trading policies, if applicable.
We have never paid dividends on our capital stock and because we do not anticipate paying any cash dividends in the foreseeable future, capital appreciation, if any, of our common stock may be the sole source of gain on an investment in our stock.
We have paid no cash dividends on any of our classes of capital stock to date and we currently intend to retain our future earnings, if any, to fund the development and growth of our business. We do not anticipate paying any cash dividends on our common stock in the foreseeable future. Furthermore, to the extent we incur indebtedness in the future; the loan documents governing such indebtedness may restrict our ability to pay dividends. As a result, we anticipate that capital appreciation, if any, of our common stock may be our stockholders’ sole source of gain for the foreseeable future.
We may become involved in securities class action litigation that could divert management’s attention and harm our business.
The stock markets have from time to time experienced significant price and volume fluctuations that have affected the market prices for the common stock of diagnostic companies. These broad market fluctuations may cause the market price of our common stock to decline. In the past, securities class action litigation has often
43
Table of Contents
been brought against a company following a decline in the market price of its securities. This risk is especially relevant for us because clinical laboratory service companies have experienced significant stock price volatility in recent years. We may become involved in this type of litigation in the future. Litigation is often expensive and diverts management’s attention and resources, which could adversely affect our business.
If we are not the subject of securities analyst reports or if any securities analyst downgrades our common stock or our sector, the price of our common stock could be negatively affected.
Securities analysts may publish reports about us or our industry containing information about us that may affect the trading price of our common stock. There are many publicly traded companies active in the healthcare industry, which may mean it will be less likely that we receive analysts’ coverage, which in turn could affect the price of our common stock. In addition, if a securities or industry analyst downgrades the outlook for our stock or one of our competitors’ stocks or chooses to terminate coverage of our stock, the trading price of our common stock may also be negatively affected.
Item 1B. Unresolved Staff Comments.
None.
Our primary administrative offices and clinical laboratories are located in Carlsbad, California. As of December 31, 2009, we occupied approximately 116,000 square feet of office and laboratory space in two separate facilities. Our leases on these properties expire between 2012 and 2014, excluding one 60-month extension option on the lease for our administrative offices and one 30-month extension option on the lease for our laboratory facility. In June 2009, we entered into a lease agreement for approximately 44,000 square feet of space in Carlsbad, California to be used for office and laboratory operations. This facility is currently undergoing improvements and is expected to ready for our use in the second quarter of 2010. In January 2010, we entered into a purchase agreement to acquire this facility and related land.
In January 2010, we entered into a lease agreement for approximately 33,000 square feet of space in Carlsbad, California to be used as a customer service and support facility. The lease includes a 60-month term with an option for a 60-month extension. The facility will be undergoing improvements and is expected to be ready for our use in the second quarter of 2010. When we complete the improvements for the additional space, we expect to have approximately 193,000 square feet of total available office and laboratory space in Carlsbad, California. See further discussion of these transactions within Note 10, Subsequent Events, in the accompanying notes to our consolidated financial statements included elsewhere in this Annual Report on Form 10-K.
We believe that our current facilities, including those currently undergoing improvements, are adequate for our needs for the immediate future. We believe that, should it be needed, suitable additional space will be available to accommodate expansion of our operations on commercially reasonable terms.
None.
Item 4. Submission of Matters to a Vote of Security Holders.
None.
44
Table of Contents
PART II
| Item 5. | Market for Registrant’s Common Equity, Related Stockholder Matters and Issuer Purchases of Equity Securities. |
Market Information
Our common stock is traded on the NASDAQ Global Select Market under the symbol “GXDX.” During 2008 and 2009 our common stock was traded on the NASDAQ Global Market. On January 4, 2010, our common stock commenced trading on the NASDAQ Global Select Market. The following table sets forth the high and low sales prices for our common stock, as reported on the NASDAQ Global Market for the periods indicated. The closing price of our common stock on December 31, 2009 was $35.53.
| 2009 | ||||||
| Quarter Ended | High | Low | ||||
| December 31 |
$ | 38.13 | $ | 33.61 | ||
| September 30 |
35.35 | 26.13 | ||||
| June 30 |
33.37 | 24.58 | ||||
| March 31 |
35.89 | 24.15 | ||||
| 2008 | ||||||
| Quarter Ended |
High | Low | ||||
| December 31 |
$ | 41.71 | $ | 26.03 | ||
| September 30 |
39.79 | 25.28 | ||||
| June 30 |
32.49 | 22.76 | ||||
| March 31 |
37.88 | 20.41 | ||||
As of February 18, 2010, there were approximately 53 holders of record of our common stock. This number of record holders was determined based on our shareholder records and does not include beneficial owners whose shares are held in nominee accounts with brokers, dealers, banks and clearing agencies.
Dividend Policy
We have never declared or paid any cash dividends on our common stock and do not expect to pay cash dividends in the foreseeable future. Any future determination related to dividend policy will be made at the discretion of our board of directors. Furthermore, to the extent we incur additional indebtedness in the future, the loan documents governing such indebtedness may restrict our ability to pay dividends.
Recent Sales of Unregistered Securities
Issuer Purchases of Equity Securities
The following table provides information with respect to purchases made by us of shares of our common stock during the quarter ended December 31, 2009:
| Period |
Total Number of Shares Purchased(1) |
Average Price Paid per Share |
Total Value Paid by the Company |
Maximum Number of Shares that May Yet Be Purchased Under the Plan | ||||||
| December 1, 2009 through December 31, 2009 |
500 | $ | 30.23 | $ | 15,113 | — | ||||
| November 1, 2009 through November 30, 2009 |
— | — | — | — | ||||||
| October 1, 2009 through October 31, 2009 |
— | — | — | — | ||||||
| Total |
500 | $ | 30.23 | $ | 15,113 | — | ||||
| (1) | The shares repurchased by us during the months listed above represent 375 shares that were repurchased from our directors who elected, at the time of grant and pursuant to the terms of their Restricted Stock Unit Award Agreements under our 2007 Equity Incentive Plan, to sell us shares of our common stock underlying said RSUs, at a price per share equal to the fair market value of a share of our common stock on the vesting date, for the purpose of satisfying the tax obligation created by the vesting of such RSUs and 125 shares that were repurchased under our 2001 Equity Incentive Plan, with right to early exercise. |
45
Table of Contents
Performance Graph(1)
The following graph illustrates a comparison of the total cumulative stockholder return on our common stock since October 30, 2007, which is the date our common stock first began trading on the NASDAQ Global Market, to two indices: the NASDAQ Composite Index and NASDAQ Healthcare Index. The graph assumes an initial investment of $100 on October 30, 2007. The comparisons in the graph are required by the SEC and are not intended to forecast or be indicative of possible future performance of our common stock.
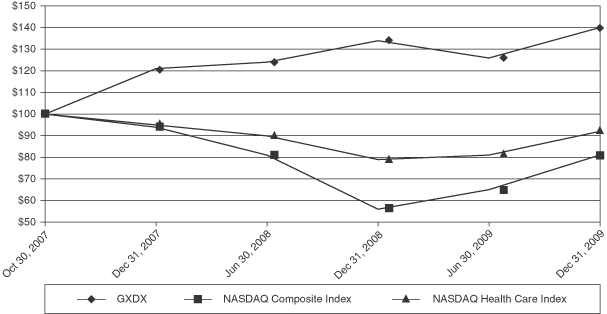
| Performance Graph Values | Closing Price | |||||||||||||||||
| GXDX | NASDAQ Composite Index |
NASDAQ Health Care Index |
GXDX | NASDAQ Composite Index |
NASDAQ Health Care Index | |||||||||||||
| 10/30/2007 |
$ | 100 | $ | 100 | $ | 100 | $ | 25.35 | $ | 2,816.71 | $ | 258.58 | ||||||
| 12/31/2007 |
121 | 94 | 95 | 30.70 | 2,652.28 | 245.92 | ||||||||||||
| 6/30/2008 |
124 | 81 | 90 | 31.55 | 2,292.98 | 231.77 | ||||||||||||
| 12/31/2008 |
134 | 56 | 79 | 34.08 | 1,577.03 | 204.13 | ||||||||||||
| 6/30/2009 |
126 | 65 | 81 | 31.99 | 1,835.04 | 209.68 | ||||||||||||
| 12/31/2009 |
140 | 81 | 92 | 35.53 | 2,269.15 | 237.87 | ||||||||||||
| (1) | This section is not “soliciting material,” is not deemed “filed” with the SEC, is not subject to the liabilities of Section 18 of the Exchange Act and is not to be incorporated by reference in any of our filings under the Securities Act or the Exchange Act, whether made before or after the date hereof and irrespective of any general incorporation language in any such filing. |
46
Table of Contents
Item 6. Selected Financial Data.
The selected financial data set forth below is derived from our audited consolidated financial statements for the five years ended December 31, 2009 and may not be indicative of future operating results. The following selected financial data should be read in conjunction with our consolidated financial statements and notes thereto and Item 7, “Management’s Discussion and Analysis of Financial Condition and Results of Operations,” included elsewhere in this Annual Report on Form 10-K.
| Years Ended December 31, | |||||||||||||||||||
| Statement of Operations Data | 2009(1) | 2008(1) | 2007(2) | 2006 | 2005 | ||||||||||||||
| (in thousands, except per share data) | |||||||||||||||||||
| Revenues |
$ | 184,378 | $ | 116,170 | $ | 59,332 | $ | 24,018 | $ | 5,193 | |||||||||
| Cost of revenues |
69,200 | 45,931 | 24,106 | 13,131 | 5,189 | ||||||||||||||
| Gross profit |
115,178 | 70,239 | 35,226 | 10,887 | 4 | ||||||||||||||
| Operating expenses: |
|||||||||||||||||||
| Sales and marketing |
31,296 | 20,065 | 11,649 | 6,264 | 4,225 | ||||||||||||||
| General and administrative |
28,710 | 22,313 | 9,976 | 6,930 | 3,782 | ||||||||||||||
| Research and development |
1,362 | 1,233 | 559 | 1,080 | 1,105 | ||||||||||||||
| Impairment and lease exit costs |
— | — | — | 542 | — | ||||||||||||||
| Total operating expenses |
61,368 | 43,611 | 22,184 | 14,816 | 9,112 | ||||||||||||||
| Income (loss) from operations |
53,810 | 26,628 | 13,042 | (3,929 | ) | (9,108 | ) | ||||||||||||
| Interest and other income |
1,554 | 3,038 | 1,103 | 554 | 227 | ||||||||||||||
| Interest expense |
— | — | (353 | ) | (384 | ) | (291 | ) | |||||||||||
| Income (loss) before income taxes |
55,364 | 29,666 | 13,792 | (3,759 | ) | (9,172 | ) | ||||||||||||
| Income tax expense (benefit)(3) |
24,730 | (1,690 | ) | 439 | — | — | |||||||||||||
| Net income (loss) |
$ | 30,634 | $ | 31,356 | $ | 13,353 | $ | (3,759 | ) | $ | (9,172 | ) | |||||||
| Net income (loss) per share(4): |
|||||||||||||||||||
| Basic |
$ | 1.80 | $ | 1.91 | $ | 1.20 | $ | (33.74 | ) | $ | (111.33 | ) | |||||||
| Diluted |
$ | 1.71 | $ | 1.78 | $ | 0.78 | $ | (33.74 | ) | $ | (111.33 | ) | |||||||
| Shares used to compute net income (loss) per share(4): |
|||||||||||||||||||
| Basic |
16,978 | 16,399 | 2,756 | 111 | 82 | ||||||||||||||
| Diluted |
17,954 | 17,653 | 4,246 | 111 | 82 | ||||||||||||||
| Dividends declared per share(5) |
$ | — | $ | — | $ | — | $ | — | $ | — | |||||||||
| December 31, | |||||||||||||||
| Balance Sheet Data | 2009 | 2008 | 2007 | 2006 | 2005 | ||||||||||
| (in thousands) | |||||||||||||||
| Cash, cash equivalents and short-term investments |
$ | 140,994 | $ | 102,938 | $ | 85,460 | $ | 3,865 | $ | 8,926 | |||||
| Working capital |
161,325 | 115,236 | 88,979 | 4,293 | 8,451 | ||||||||||
| Total assets |
197,455 | 144,445 | 97,832 | 10,202 | 12,714 | ||||||||||
| Long-term debt, net of current portion |
— | — | — | 1,262 | 2,136 | ||||||||||
| Total stockholders’ equity |
179,504 | 132,219 | 90,605 | 4,065 | 7,524 | ||||||||||
| (1) | During the years ended December 31, 2009 and 2008, we recorded positive changes in prior period accounting estimates to reduce contractual allowances, which increased our revenues by $7.4 million and $3.3 million, respectively. These favorable changes in accounting estimates related primarily to non-contracted payors and resulted from continued improvements to our collection processes, as well as increased hiring of personnel and management focused on the collection of accounts receivable for services rendered in prior periods and changes in reimbursement policies by certain payors. See Note 1, Revenue |
47
Table of Contents
| Recognition, and Allowance for Doubtful Accounts, in the accompanying notes to our consolidated financial statements included elsewhere in this Annual Report on Form 10-K. |
| (2) | During the year ended December 31, 2007, we recorded positive changes in prior period accounting estimates to reduce contractual allowances and allowance for doubtful accounts, which increased our revenues by $792,000 and decreased general and administrative expenses by $666,000, respectively. These positive changes in accounting estimates were the result of continued improvements to our collection processes, as well as favorable experience in the collection of previously reserved accounts receivable for services rendered in prior periods and changes in reimbursement policies by certain payors. See Note 1, Revenue Recognition, and Allowance for Doubtful Accounts, in the accompanying notes to our consolidated financial statements included elsewhere in this Annual Report on Form 10-K. |
| (3) | The income tax expense for the year ended December 31, 2009 was $24.7 million, as compared to the income tax benefit for the year ended December 31, 2008 of $1.7 million. As of December 31, 2007, we had $14.9 million in net deferred tax assets that were offset entirely by a valuation allowance, as we were unable to conclude, at that time, that it was “more likely than not” that such deferred tax assets would be realized. In 2008, although realization was not assured, we believed it was “more likely than not” that we would be able to realize our net deferred tax assets through the ordinary course of business and expected future taxable income. Therefore, during the year ended December 31, 2008, we recorded a $14.9 million tax benefit representing the release of the valuation allowance against the net deferred tax assets. For the year ended December 31, 2007, income tax expense was reduced by the usage of net operating losses and other credits, resulting primarily in alternative minimum taxes. During the years ended December 31, 2006 and 2005, there were no tax liabilities due to net losses during each period. |
| (4) | There is a lack of comparability in the basic and diluted net income (loss) per share amounts between the periods presented herein prior to 2008 and any future periods. See Note 1 in the accompanying notes to our consolidated financial statements included elsewhere in this Annual Report on Form 10-K for the pro forma basic and diluted net income (loss) per share calculations. For the year ended December 31, 2007, $10.0 million of our net income of $13.3 million was allocated to preferred stockholders for purposes of calculating net income per share pursuant to the terms of the preferred stock, resulting in $3.3 million of net income allocable to common stockholders. See Note 1 in the accompanying notes to our consolidated financial statements included elsewhere in this Annual Report on Form 10-K for an explanation of the method and amounts used in the computation of the per share amounts. In November 2007, our preferred stock converted into 11.0 million shares of our common stock upon completion of our initial public offering, or IPO. Prior to our IPO, net income (loss) per share was computed as required by ASC Topic 260, Earnings Per Share, which established standards regarding the computation of earnings per share, or EPS, by companies that have issued securities other than common stock that contractually entitle the holder to participate in our dividends and earnings. ASC Topic 260 requires earnings for the period, after deduction of preferred stock dividends, to be allocated between the common and preferred stockholders based on their respective rights to receive dividends, whether or not declared. Basic net income (loss) per share is then calculated by dividing income allocable to common stockholders (after the reduction for any preferred stock dividends assuming current income for the period had been distributed) by the weighted average number of shares of common stock outstanding, net of shares subject to repurchase by us. |
| (5) | We have never declared or paid any cash dividends on our common stock and do not expect to pay cash dividends in the foreseeable future. Any future determination related to dividend policy will be made at the discretion of our board of directors. Furthermore, to the extent we incur additional indebtedness in the future, the loan documents governing such indebtedness may restrict our ability to pay dividends. |
48
Table of Contents
Item 7. Management’s Discussion and Analysis of Financial Condition and Results of Operations.
The following discussion and analysis of our financial condition and results of operations should be read in conjunction with “Selected Financial Data” and our consolidated financial statements and related notes appearing elsewhere in this Annual Report on Form 10-K. In addition to historical information, this discussion and analysis contains forward-looking statements that involve risks, uncertainties and assumptions. Our actual results may differ materially from those anticipated in these forward-looking statements as a result of certain factors, including but not limited to those set forth under “Risk Factors” and elsewhere in this Annual Report on Form 10-K.
Overview
We are a specialized laboratory service provider focused on delivering personalized and comprehensive diagnostic services to community-based hem/oncs. Our highly trained group of hempaths utilizes sophisticated diagnostic technologies to provide a differentiated, specialized and integrated assessment of a patient’s condition, aiding physicians in making vital decisions concerning the treatment of malignancies of the blood and bone marrow, and other forms of cancer.
We were organized in 1999, and we began offering specialized diagnostic services in the third quarter of 2004. Our key service offerings include COMPASS and CHART. By ordering our COMPASS service offering, the hem/onc authorizes our hempath to determine the appropriate diagnostic tests to be performed, and our hempath then integrates patient history and previous and current test results into a comprehensive diagnostic report. As part of our CHART service offering, the hem/onc also receives a detailed assessment of a patient’s disease progression over time. Test requisitions for more than half of the patient samples we processed for the years ended December 31, 2009, 2008 and 2007, included our COMPASS or CHART service offerings.
We estimate that the U.S. bone marrow testing market alone represents approximately a $1.0 billion opportunity annually and that our current market share for bone marrow procedures is approximately 7%. Our objective is to continue to increase our market share, revenues and profits at a rate significantly faster than the overall growth rate market for blood and bone marrow testing services by continuing to provide and expand our high quality, community-based hem/onc focused specialized diagnostic services. In furtherance of this objective, our growth strategy has the following key elements:
| • | expand our organization and infrastructure by increasing our personnel, particularly in sales, to enable us to visit more hem/oncs on a more frequent basis and, in time, to expand into new markets; |
| • | hiring and retaining Cartesian hempaths and additional laboratory resources to continue to provide high-quality, specialized diagnostic services; |
| • | expand service offerings to hem/oncs by being first to market with new technologies and innovations; |
| • | leverage our existing infrastructure to increase operating efficiencies by taking advantage of economies of scale and volume discounts, where possible; and |
| • | pursue additional collaborations and acquisitions to supplement our business. |
As a specialized diagnostic service provider, we rely extensively on our high quality of service to promote and maintain our relationships with our community-based hem/oncs. We compete primarily based on the quality of testing, reporting and information systems, reliability in patient sample transport, reputation in the medical community and access to our highly qualified hempaths. Our primary competitors include hospital pathologists, esoteric testing laboratories, national reference laboratories and academic laboratories.
Our revenues consist primarily of payments or reimbursements received from governmental payors, such as Medicare and Medicaid; private insurers, including managed care organizations; and private payors, such as hospitals, patients, and others for the specialized diagnostic services rendered to our hem/onc customers. Our revenues are affected by changes in customer and case volume, case complexity, specimen type, payor mix, contractual allowances and reimbursement rates.
49
Table of Contents
Additionally, billing for diagnostic services is highly complex. Depending on our billing arrangement with each third party payor and applicable law, we are often obligated to bill in the specific manner prescribed by the various payors, each of which may have different billing requirements. Billing for diagnostic services in connection with governmental payor programs is subject to numerous federal and state regulations and other requirements, resulting in additional costs to us. We report revenues from contracted payors, including Medicare, certain insurance companies and certain healthcare institutions, based on the contractual rate, or in the case of Medicare, the published fee schedules. We report revenues from non-contracted payors, including certain insurance companies and individuals, based on the amount expected to be collected. We estimate amounts to be collected based on our historical collection experience.
We believe the key challenges in being able to continue to increase our market share, revenues and profits are our ability to continue to hire and retain qualified field sales representatives, key management and other personnel, Cartesian’s ability to hire and retain hempaths, changes in reimbursement levels for our specialized diagnostic services, changes in regulations, payor policies and contracting arrangements with payors, increased competition from competitors attempting to replicate our key service offerings or provide other services that compete with ours, our ability to scale our internal infrastructure, our ability to maintain and strengthen our relationships with our hem/onc customers and our ability to continue to improve our operational, financial and management controls, and reporting systems and procedures.
To address these challenges, our management is focused upon expanding our sales organization as the primary driver for our continued growth while maintaining our existing hem/onc customer relationships. Our management tracks and measures the general buying patterns of our hem/onc customers (including cases per month, revenues and cost of revenues per case and turn-around-time per case) and is focused on adding additional sales management and sales representatives in key markets to enhance our penetration in those markets. Our management is also engaged in ensuring Cartesian is focused on recruiting, hiring and retaining hempaths to provide the professional services component to support continued growth. Management measures the levels and timeliness of reimbursement from third party payors and reviews on a monthly basis the levels of receivables and average time for collections, as well as cost and margin trends to ensure that investments in our infrastructure and personnel are in line with current sales levels.
We intend to opportunistically pursue additional collaborations with pharmaceutical companies and acquisitions or in-licensing of businesses, products or technologies that will enable us to accelerate the implementation of our strategic plan and to increase the number of hem/onc customers we serve and/or expand the services we provide to them, by way of investments in other companies, licensing of technology, co-development arrangements, collaborations, asset purchases and other similar transactions. For example, we currently provide specialized testing services and access to our hempaths through collaborations with select pharmaceutical companies. We expect these collaborations to grow over time, which we believe will improve our financial performance and name recognition and reputation among hem/oncs, and potentially provide us with early access to new technologies available for commercialization. We expect annual revenues from these collaborations to remain at approximately 1% of our total revenues in 2010.
Management has continued efforts to ensure that office and laboratory space is adequate to accommodate the necessary capacity requirements to meet our current and expanding business needs. Specifically, during the year ended December 31, 2009, we entered new leases for a new facility with an additional approximately 44,000 square feet of space located in Carlsbad, California to be used for office and laboratory operations and an additional approximately 7,000 square feet of office space within our existing corporate headquarters to be used for administrative operations. Subsequent to the year ended December 31, 2009, we entered into a lease for a new facility with an additional approximately 33,000 square feet of office space in Carlsbad, California, into which we will relocate and expand our customer service and other support functions. Additionally, we entered into a purchase agreement to acquire the 44,000 square foot facility for which we had previously entered into a lease agreement in 2009. See further discussion of these transactions within Note 10, Subsequent Events, in the accompanying notes to our consolidated financial statements included elsewhere in this Annual Report on Form 10-K. We initiated improvements on the newly purchased facility in the fourth quarter of 2009. We will
50
Table of Contents
initiate tenant improvements on the new 33,000 square foot customer service and support facility in the first quarter of 2010. We expect improvements on both facilities to be complete and the facilities to be operational in the second quarter of 2010. Once complete, these new facility expansions will increase our laboratory and office space to approximately 193,000 square feet, increasing both cost of revenue and administrative expenses relating to incremental facilities costs. For the year ended December 31, 2009, total capital expenditures were $5.5 million. We expect total capital expenditures to be approximately $30.0 million for 2010 including approximately $22.0 million of costs associated with our newly acquired laboratory and customer service and support facilities and approximately $8.0 million for equipment, computers, furniture and the like, to support our growing operational needs. We believe our recent expansion efforts will be adequate to meet our needs for 2010. We are not currently anticipating the need to expand into a new facility located in a geographically different region in 2010, as previously contemplated.
Our most significant developments:
| • | Increased revenues by 59% to $184.4 million for the year ended December 31, 2009, up from $116.2 million for the year ended December 31, 2008. |
| • | Increased the number of cases processed by 48% to approximately 57,000 for the year ended December 31, 2009, up from approximately 39,000 for the year ended December 31, 2008. |
| • | Increased income from operations to $53.8 million for the year ended December 31, 2009, up from $26.6 million for the year ended December 31, 2008, despite our increased cost of sales, headcount and facility expense. |
| • | Continued expansion efforts by adding approximately 84,000 square feet of space to be used for office and laboratory operations. |
| • | Increased the number of Cartesian hempaths by 32% to 33 as of December 31, 2009, up from 25 as of December 31, 2008. |
| • | Increased the number of field sales representatives by 46% to 80 as of December 31, 2009, up from 55 as of December 31, 2008. |
| • | Increased total headcount by 53% to 429 employees, including Cartesian employees and 7 part-time employees, as of December 31, 2009, up from 281 employees, including 7 part-time employees, as of December 31, 2008. |
| • | Increased the number of ordering doctors to approximately 1,250 for the year ended December 31, 2009, up from approximately 1,000 for the year ended December 31, 2008. |
Consolidated Financial Statement Presentation
As of January 1, 2006, the date the PSA with Cartesian became effective, we determined we had a controlling financial interest in Cartesian and began to consolidate the results of Cartesian based on the criteria under Financial Accounting Standards Board, or FASB, Accounting Standards Codification, or ASC, Topic 810, Consolidations. All intercompany accounts have been eliminated in consolidation.
Seasonality
The majority of our testing volume is dependent on patient visits to hem/oncs’ offices and other healthcare providers. Volume of testing generally declines during the vacation seasons, year-end holiday periods and other major holidays, particularly when those holidays fall during the middle of the week. In addition, volume of testing tends to decline due to adverse weather conditions, such as excessively hot or cold spells or hurricanes or tornados in certain regions, consequently reducing revenues and cash flows in any affected period. Therefore, comparison of the results of successive periods may not accurately reflect trends for future periods.
51
Table of Contents
Critical Accounting Policies and Estimates
Our management’s discussion and analysis of our financial condition and results of operations is based on our consolidated financial statements, which have been prepared in conformity with accounting principles generally accepted in the United States. The preparation of these financial statements requires us to make estimates and judgments that affect the reported amounts of assets and liabilities and related disclosure of contingent assets and liabilities at the date of the condensed consolidated financial statements and the reported amounts of revenues and expenses during the reporting period. We continually evaluate our estimates and judgments, the most critical of which are those related to revenue recognition, allowance for doubtful accounts, valuation of investment securities, long-lived assets, income taxes and stock-based compensation expense. We base our estimates and judgments on historical experience and other factors that we believe to be reasonable under the circumstances. Materially different results can occur as circumstances change and additional information becomes known.
We believe the following accounting policies to be critical to the judgments and estimates used in the preparation of our consolidated financial statements. For a summary of all of our accounting policies, including the policies discussed below, see Note 1 in the accompanying notes to our consolidated financial statements included elsewhere in this Annual Report on Form 10-K.
Revenue Recognition
We recognize revenues as required by ASC Topic 605, Revenue Recognition, when the price is fixed or determinable, persuasive evidence of an arrangement exists, the service is performed and collectability of the resulting receivable is reasonably assured.
Our specialized diagnostic services are performed based on a written test requisition form and revenues are recognized once the diagnostic services have been performed, the results have been delivered to the ordering physician, the payor has been identified and eligibility and insurance have been verified. These diagnostic services are billed to various payors, including Medicare, commercial insurance companies, other directly billed healthcare institutions such as hospitals, and individuals. We report revenues from contracted payors, including Medicare, certain insurance companies and certain healthcare institutions, based on the contractual rate, or in the case of Medicare, the published fee schedules. We report revenues from non-contracted payors, including certain insurance companies and individuals, based on the amount expected to be collected. The difference between the amount billed and the amount expected to be collected from non-contracted payors is recorded as a contractual allowance to arrive at net revenues. The expected revenues from non-contracted payors are based on the historical collection experience of each payor or payor group, as appropriate. In each reporting period, we review our historical collection experience for non-contracted payors and adjust our expected revenues for current and subsequent periods accordingly. Because a substantial portion of our revenues is from third party payors with whom we are not currently contracted, it is likely that we will be required to make positive or negative adjustments to accounting estimates with respect to contractual allowances in the future, which may positively or adversely affect our results of operations. During the years ended December 31, 2009, 2008 and 2007, we recorded positive changes in prior year accounting estimates to reduce contractual allowances, which increased our revenues by $7.4 million, $3.3 million and $792,000, respectively. These favorable changes in accounting estimates related primarily to non-contracted payors and resulted from continued improvements to our collection processes, changes in reimbursement policies by certain payors and increased hiring of personnel and management focused on the collection of accounts receivable for services rendered in prior periods.
Allowance for Doubtful Accounts
At the same time revenues are recognized, an allowance for doubtful accounts is recorded for estimated uncollectible amounts due from our contracted payors. The process for estimating the collection of receivables associated with our specialized diagnostic services involves significant assumptions and judgments. Specifically,
52
Table of Contents
the allowance for doubtful accounts is adjusted periodically, based upon an evaluation of historical collection experience with specific payors and other relevant factors. The realization cycle for certain governmental and managed care payors can be lengthy, involving denial, appeal and adjudication processes, and are subject to periodic adjustments that may be significant. Provision for doubtful accounts is charged to general and administrative expense. Accounts receivable are written off as uncollectible and deducted from our allowance for doubtful accounts after appropriate collection efforts have been exhausted. As of December 31, 2009 and 2008, we had an allowance for doubtful accounts of $5.4 million and $4.1 million, respectively, which we reduced by $1.9 million and $664,000, respectively, for write-offs, net of recoveries.
Prior to writing off an account receivable and in accordance with applicable regulatory requirements, we make reasonable and appropriate efforts to collect our accounts receivable, including deductible and coinsurance amounts, in a consistent manner for all payor classes. We have established collection processes, which may include but are not limited to: (1) an automated process for identifying past due accounts; (2) specific follow-up activities at scheduled intervals; (3) monitoring of collection activities; and (4) forwarding significant past due accounts to collection agencies. Uncollectible account balances for all payor classes are generally written off after remaining unpaid for a period of 24 months. Occasionally, balances may be determined to be uncollectible prior to the passage of 24 months from the last billing date and are written off at the time of such determination.
Our allowance for doubtful accounts has been provided for at a rate of approximately 2% and 3% of revenues for the years ended December 31, 2009 and 2008, respectively.
The following tables present a summary of our outstanding accounts receivable balances:
| December 31, 2009 | ||||||||||||||||
| < 60 Days | 61-120 Days | 121-180 Days | > 180 Days | Total | ||||||||||||
| (in thousands) | ||||||||||||||||
| Commerical payors |
$ | 12,648 | $ | 4,691 | $ | 1,614 | $ | 932 | $ | 19,885 | ||||||
| Medicare/Medicaid |
7,455 | 1,433 | 752 | 2,217 | 11,857 | |||||||||||
| Self-pay |
111 | 100 | 90 | 319 | 620 | |||||||||||
| Other |
656 | 34 | 36 | 6 | 732 | |||||||||||
| Total accounts receivable |
$ | 20,870 | $ | 6,258 | $ | 2,492 | $ | 3,474 | 33,094 | |||||||
| Less: allowance for doubtful accounts |
(5,387 | ) | ||||||||||||||
| Accounts receivable, net |
$ | 27,707 | ||||||||||||||
| December 31, 2008 | ||||||||||||||||
| < 60 Days | 61-120 Days | 121-180 Days | > 180 Days | Total | ||||||||||||
| (in thousands) | ||||||||||||||||
| Commerical payors |
$ | 7,869 | $ | 2,008 | $ | 537 | $ | 493 | $ | 10,907 | ||||||
| Medicare/Medicaid |
4,566 | 942 | 579 | 1,720 | 7,807 | |||||||||||
| Self-pay |
106 | 111 | 62 | 218 | 497 | |||||||||||
| Other |
464 | 32 | 10 | 13 | 519 | |||||||||||
| Total accounts receivable |
$ | 13,005 | $ | 3,093 | $ | 1,188 | $ | 2,444 | 19,730 | |||||||
| Less: allowance for doubtful accounts |
(4,126 | ) | ||||||||||||||
| Accounts receivable, net |
$ | 15,604 | ||||||||||||||
We continually strive to improve our billing and collection systems and processes, which includes increasing the number of trained personnel dedicated to this effort. To assess our efforts, we continually monitor the DSO of our accounts receivable. Our DSO averaged 56 days in 2009, which was consistent with 56 days in 2008. As of December 31, 2009 and 2008, our DSO was 62 days and 53 days, respectively. The increase in our
53
Table of Contents
DSO as of December 31, 2009, pertains primarily to the timing of payments relating to certain contracted payors. We expect to maintain our average DSO levels into 2010 as we continue to pursue improvements to collection procedures and work with our payors to ensure timely processing of reimbursement payments.
Income Taxes
ASC Topic 740, Income Taxes, establishes a single model to address accounting for uncertain tax positions. ASC Topic 740 clarifies the accounting for income taxes by prescribing a minimum recognition threshold a tax position is required to meet before being recognized in the consolidated financial statements if that position is “more likely than not” to be sustained upon examination by taxing authorities, based on the technical merits of the position. ASC Topic 740 also provides guidance on derecognition, measurement, classification, interest and penalties, accounting in interim periods, disclosure and transition. We recognize interest and penalties related to unrecognized tax benefits as a component of income tax expense. We have recognized no significant interest or penalties since the adoption of provisions within ASC Topic 740 in 2007. We recognized no significant interest or penalties during the year ended December 31, 2009.
As required by provisions within ASC Topic 740, income taxes are accounted for under the asset and liability method. Deferred tax assets and liabilities are recognized for the expected future tax consequences attributable to differences between the financial statement carrying amounts of existing assets and liabilities and their respective tax bases and operating loss and tax credit carryforwards. We measure deferred tax assets and liabilities using the enacted tax rates expected to apply to taxable income in the years in which we expect to recover or settle those temporary differences. We recognize the effect of a change in tax rates on deferred tax assets and liabilities in income in the period that includes the enactment date. A valuation allowance is established when it is “more likely than not” that the future realization of all or some of the deferred tax assets will not be achieved. As of December 31, 2009 and 2008, we no longer maintained a valuation allowance against deferred tax assets, as we concluded it meets the “more likely than not” threshold required under ASC Topic 740.
Due to the adoption of provisions within ASC Topic 718, Compensation, we recognize excess tax benefits associated with share-based compensation to stockholders’ equity only when realized. When assessing whether excess tax benefits relating to share-based compensation have been realized, we followed the with-and-without approach excluding any indirect effects of the excess tax deductions. Under this approach, excess tax benefits related to share-based compensation are not deemed to be realized until after the utilization of all other tax benefits available to us.
Utilization of net operating loss carryforwards, credit carryforwards and certain deductions have been subject to substantial annual limitations due to ownership change limitations provided by the Internal Revenue Code of 1986, as amended, and similar state provisions. Under Sections 382 and 383 of the Internal Revenue Code of 1986, as amended, substantial changes in our ownership have required us to limit the amount of net operating loss and research and development credit carryforwards that were previously available to offset future taxable income. We have had three “change in ownership” events that limit the utilization of net operating loss and credit carryforwards. The “change in ownership” events occurred in March 2000, December 2001 and March 2008 and resulted in annual net operating loss carryforward limitations of $63,000, $96,000 and $16.1 million, respectively. As a result of a net unrealized built-in gain from the March 2008 change in ownership, our net operating loss carryforward annual limitation of $16.1 million was increased to $39.7 million for each of the five years starting after the change in ownership. Additional limitations on the use of these tax attributes could occur in the event of possible disputes arising in examination from various taxing authorities.
Stock-based Compensation
We record stock-based compensation expense as required by ASC Topic 718. We grant share-based awards of stock options and RSUs to employees, directors and Cartesian doctors. We adopted ASC Topic 718 using the prospective approach, which applies to new awards and to awards modified, repurchased or cancelled after the required effective date.
54
Table of Contents
In addition, we allow qualified employees, excluding directors and Cartesian doctors, to participate in our employee stock purchase plan, or ESPP, which provides employees the opportunity to purchase our common stock at a 15% discount. Generally, the ESPP consists of a two-year offering period with four six-month purchase periods and contains a look-back provision for determining the purchase price. We value and account for our ESPP as required by ASC Topic 718-50. The objective of the measurement process for ESPPs with a look-back option is to reasonably measure the fair value of the award at the grant date, the date at which there is a mutual understanding of the terms of the award in exchange for the services already rendered and the employee’s total contributions are known. At this time, we become contingently obligated to issue equity instruments to the employee. Typically, the grant date is the first business day of each offering period. Employee contributions are generally made through payroll deductions.
We previously granted equity instruments issued to non-employees, excluding Cartesian employees and directors, and recorded expense at the fair value over the related service period as required by ASC Topic 718 and periodically revalued the equity instruments as they vested. During the years ended December 31, 2009, 2008 and 2007, we recognized $12,000, $49,000 and $31,000, respectively, of non-employee stock-based compensation. We no longer grant these non-employee equity awards. All previously granted awards to these non-employees were fully vested, and all remaining expense was recognized during the year ended December 31, 2009.
We recognize stock-based compensation expense for options and RSUs over the vesting period using the straight-line method. The standard vesting period is four years for most stock option awards and three years for most RSU awards, but can range from one to four years in certain grants. We measure stock options and RSU equity awards based on fair value. In addition, we record stock-based compensation expense related to the ESPP as required by ASC Topic 718-50. The initial ESPP offering period extended from October 29, 2007 to June 30, 2008, with the first grant occurring in 2008 and continuing with new offerings each six months thereafter. We classify stock-based compensation expense amounts for all awards in the consolidated statements of operations based on the department to which the related employee reports.
We value RSU grants at their intrinsic value. In contrast, we use the Black-Scholes valuation model to estimate the grant date fair value of employee stock options and ESPP awards using the following weighted-average assumptions:
| Stock Options | ESPP | |||||||||||||||||||
| Years Ended December 31, | Years Ended December 31, | |||||||||||||||||||
| 2009 | 2008 | 2007 | 2009 | 2008 | ||||||||||||||||
| Grant date fair value (per share) |
$ | 15.64 | $ | 14.63 | $ | 10.78 | $ | 11.22 | $ | 14.61 | ||||||||||
| Assumptions used: |
||||||||||||||||||||
| Expected life of awards (years) |
6.04 | 6.02 | 6.08 | 1.32 | 1.20 | |||||||||||||||
| Risk-free interest rate |
2.16 | % | 2.92 | % | 4.48 | % | 0.68 | % | 2.79 | % | ||||||||||
| Volatility |
50.12 | % | 51.35 | % | 56.71 | % | 47.97 | % | 37.50 | % | ||||||||||
| Dividend yield |
— | — | — | — | — | |||||||||||||||
| Forfeitures |
7.00 | % | 7.00 | % | 7.00 | % | — | — | ||||||||||||
We calculated the weighted-average expected life of options using the simplified method as prescribed by ASC Topic 718. This decision was based on the lack of relevant historical data due to our limited operating experience as a public company. We derived the risk-free interest rate assumption from the U.S. Treasury rates for U.S. Treasury zero-coupon bonds with maturities equal to the expected term of the award being valued. In addition, due to our limited historical data, the estimated volatility incorporates the historical volatility of comparable companies within our peer group with publicly available share prices. We based the assumed dividend yield on its expectation of not paying dividends in the foreseeable future.
55
Table of Contents
We recognize stock-based compensation expense for options and RSUs over the vesting period using the straight-line method. The standard vesting period is four years for most stock option awards and three years for most RSU awards, but can range from one to four years in certain grants. We measure stock options and RSU equity awards based on fair value. In addition, we record stock-based compensation expense related to the ESPP as required by ASC Topic 718-50. The initial ESPP offering period extended from October 29, 2007 to June 30, 2008, with the first grant occurring in 2008 and continuing with new offerings each six months thereafter. We classify stock-based compensation expense amounts for all awards in the consolidated statements of operations based on the department to which the related employee reports.
The following tables present a summary of our stock-based compensation expense as recognized in the consolidated statements of operations:
| Year Ended December 31, 2009 | ||||||||||||
| Options | RSUs | ESPP | Total | |||||||||
| (in thousands) | ||||||||||||
| Cost of revenues |
$ | 2,073 | $ | 881 | $ | 282 | $ | 3,236 | ||||
| Sales and marketing |
1,150 | 78 | 502 | 1,730 | ||||||||
| General and administrative |
2,417 | 2,186 | 348 | 4,951 | ||||||||
| Research and development |
— | — | — | — | ||||||||
| $ | 5,640 | $ | 3,145 | $ | 1,132 | $ | 9,917 | |||||
| Year Ended December 31, 2008 | ||||||||||||
| Options | RSUs | ESPP | Total | |||||||||
| (in thousands) | ||||||||||||
| Cost of revenues |
$ | 1,058 | $ | 459 | $ | 770 | $ | 2,287 | ||||
| Sales and marketing |
465 | — | 1,260 | 1,725 | ||||||||
| General and administrative |
1,307 | 1,033 | 665 | 3,005 | ||||||||
| Research and development |
— | — | — | — | ||||||||
| $ | 2,830 | $ | 1,492 | $ | 2,695 | $ | 7,017 | |||||
| Year Ended December 31, 2007 | ||||||||||||
| Options | RSUs | ESPP | Total | |||||||||
| (in thousands) | ||||||||||||
| Cost of revenues |
$ | 164 | $ | 15 | $ | — | $ | 179 | ||||
| Sales and marketing |
81 | — | — | 81 | ||||||||
| General and administrative |
226 | — | — | 226 | ||||||||
| Research and development |
54 | — | — | 54 | ||||||||
| $ | 525 | $ | 15 | $ | — | $ | 540 | |||||
We expect stock-based compensation expense for 2010 to increase in absolute dollars but to decrease as a percentage of revenues based on new and additional stock option and RSU grants offset by increasing revenues.
Fair Value
The carrying value of certain of our financial instruments that are not measured at fair value on a recurring basis, including cash, cash equivalents, accounts receivable, accounts payable and accrued expenses and other assets and liabilities, are considered to be reasonable estimates of their respective fair values due to their short-term nature.
We value financial instruments that are measured at fair value on a recurring basis as required under ASC Topic 820, Fair Value Measurements and Disclosures, which defines fair value, establishes a framework for
56
Table of Contents
measuring fair value in accounting principles generally accepted in the U.S. and expands disclosures about fair value measurements. Furthermore, ASC Topic 825, Financial Instruments, permits entities the option to measure many financial instruments and certain other items at fair value. We have not specifically identified any financial instruments subject to measurement under ASC Topic 825.
As of December 31, 2009, we held a single ARS with a cost basis of $4.9 million. We have evaluated this security based on interest rate spreads, credit quality, underlying assets of the issuer and underwriter, likelihood of a successful auction or redemption in the near term and the ability of the issuer to restructure the debt in the current credit environment. We assumed that the issuer and underwriter would not be able to satisfy its debt obligation until the credit market would provide a debt restructuring opportunity (within the next 4 years) and applied a 1.0% liquidity discount. The issuer of the ARS continues to make interest payments as scheduled and has made two partial redemptions during the year ended December 31, 2009, of which we have benefited from one due to the lottery system used to distribute the redemption proceeds. This redemption resulted in cash proceeds to us of $75,000. As a result of our internal valuation, we have recorded a temporary impairment of approximately $1.1 million as of December 31, 2009 against a cost basis of $4.9 million, as compared to a temporary impairment of $1.2 million as of December 31, 2008 against a cost basis of $5.0 million. The unrealized loss, net of deferred tax, is included in accumulated other comprehensive loss. Due to the uncertainty related to the timing of liquidity in the ARS market in the near term, we classified this ARS investment security as a long-term asset on the balance sheet with a fair value of $3.8 million as of December 31, 2009 and 2008.
Results of Operations
The following table presents a summary of the consolidated statements of operations as a percentage of revenue:
| Years Ended December 31, | |||||||||
| 2009 | 2008 | 2007 | |||||||
| Revenues |
100 | % | 100 | % | 100 | % | |||
| Cost of revenues |
38 | % | 40 | % | 41 | % | |||
| Gross profit |
62 | % | 60 | % | 59 | % | |||
| Operating expenses: |
|||||||||
| Sales and marketing |
17 | % | 17 | % | 20 | % | |||
| General and administrative |
16 | % | 19 | % | 17 | % | |||
| Research and development |
1 | % | 1 | % | 1 | % | |||
| Total operating expenses |
34 | % | 37 | % | 38 | % | |||
| Income from operations |
28 | % | 23 | % | 21 | % | |||
| Interest income, net |
1 | % | 3 | % | 2 | % | |||
| Income before income taxes |
29 | % | 26 | % | 23 | % | |||
| Income tax expense (benefit) |
13 | % | (1 | %) | 1 | % | |||
| Net income |
16 | % | 27 | % | 22 | % | |||
Revenues
Revenues primarily consist of payments or reimbursements received from governmental payors, such as Medicare and Medicaid, private insurers, including managed care organizations, private payors, such as hospitals, patients and others for the specialized diagnostic services rendered to our hem/onc customers. Substantially all of our revenues result from our having been assigned the right to bill and collect for the professional services provided by the hempaths employed by Cartesian who work with us in our laboratory facility pursuant to our PSA with Cartesian. Our revenues from services not performed by Cartesian were less than 5% of our total revenues during each of the years ended December 31, 2009, 2008 and 2007.
57
Table of Contents
For the year ended December 31, 2009, we derived approximately 59% of our revenues from private insurance, including managed care organizations and other healthcare insurance providers; approximately 40% from Medicare and Medicaid; and the remaining approximate 1% from other sources. For the years ended December 31, 2008 and 2007, we derived approximately 60% of our revenues from private insurance, including managed care organizations and other healthcare insurance providers; 38% from Medicare and Medicaid; and the remaining 2% from other sources. Our revenues are affected by changes in customer and case volume, payor mix, contractual allowances and reimbursement rates. Billing and reimbursement for our specialized diagnostic services in connection with governmental payor programs are subject to numerous federal and state regulations and other billing requirements. Reimbursement under Medicare for our specialized diagnostic services is subject to a Medicare physician fee schedule, and to a lesser degree, a clinical laboratory fee schedule, both of which are typically updated annually. These billing and reimbursement arrangements are discussed more fully in the “Billing and Reimbursement” section contained in Item 1 of this Annual Report on Form 10-K.
| Years Ended December 31, | % Change | ||||||||||||||
| 2009 | 2008 | 2007 | 2009 | 2008 | |||||||||||
| Revenues(1) (in thousands) |
$ | 184,378 | $ | 116,170 | $ | 59,332 | 59 | % | 96 | % | |||||
| Number of cases |
56,896 | 38,567 | 22,513 | 48 | % | 71 | % | ||||||||
| Revenues per case |
$ | 3,241 | $ | 3,012 | $ | 2,635 | 8 | % | 14 | % | |||||
| (1) | During the years ended December 31, 2009, 2008 and 2007, we recorded positive changes in prior period accounting estimates to reduce contractual allowances, which increased our revenues by $7.4 million, $3.3 million and $792,000, respectively. These favorable changes in accounting estimates related primarily to non-contracted payors and resulted from continued improvements to our collection processes, changes in reimbursement policies by certain payors and increased hiring of personnel and management focused on the collection of accounts receivable for services rendered in prior periods. We intend to continue to seek opportunities to improve our billing and collections systems and processes, but these adjustments could fluctuate both favorably and unfavorably during future periods. |
Revenues increased to $184.4 million for the year ended December 31, 2009 up from $116.2 million and $59.3 million for the years ended December 31, 2008 and 2007, respectively (in each case inclusive of the changes in prior period accounting estimates noted above). The increases of $68.2 million, or 59%, and $56.8 million, or 96%, for the years ended December 31, 2009 and 2008, respectively, over each preceding year, were primarily due to case volume increases of 48% and 71%, respectively, and revenue per case increases of $229, or 8%, and $377, or 14%, respectively. These increases were in part due to a net increase in 2009 and 2008 Medicare reimbursement rates for our key service offerings and better than expected collections primarily on our non-contracted business, as reflected by the favorable changes in accounting estimates that increased our revenues, as discussed above.
Case volumes increased primarily as a result of the 46% increase in the number of our field sales representatives from 55 as of December 31, 2008 to 80 as of December 31, 2009. Similarly, the number of field sales representatives increased 62% for the year ended December 31, 2008 over 2007. These increases in the number of our field sales representatives have enabled us to penetrate more accounts over a wider geographic area, increase our customer base and further focus our field sales representatives on in-person customer visits. Sales force productivity during the years ended December 31, 2009 and 2008 also increased primarily as a result of enhanced recognition in the market, smaller geographies per sales representative, price increases, expanded service offerings and efficiencies realized from a more experienced sales force, which included expanding our sales management team to 15 as of December 31, 2009, as compared to 10 and 2 as of December 31, 2008 and 2007, respectively.
Gross Profit
Gross profit consists of our revenues less cost of revenues. Cost of revenues consists of employee-related costs (salaries, bonus, fringe benefits and stock-based compensation) of our Cartesian hempaths, licensed
58
Table of Contents
technicians, CSCs, and other support personnel, as well as outside laboratory costs, laboratory supplies, logistic costs, depreciation and administrative-related costs allocated to cost of revenues. Our cost of revenues generally increases as our case volumes increase.
| Years Ended December 31, | % Change | |||||||||||||||||
| 2009 | 2008 | 2007 | 2009 | 2008 | ||||||||||||||
| Gross profit(1) (in thousands) |
$ | 115,178 | $ | 70,239 | $ | 35,226 | 64 | % | 99 | % | ||||||||
| Gross profit % |
62 | % | 60 | % | 59 | % | ||||||||||||
| Number of cases |
56,896 | 38,567 | 22,513 | 48 | % | 71 | % | |||||||||||
| Gross profit per case |
$ | 2,024 | $ | 1,821 | $ | 1,565 | 11 | % | 16 | % | ||||||||
| (1) | During the years ended December 31, 2009, 2008 and 2007, we recorded positive changes in prior period accounting estimates to reduce contractual allowances, which increased our revenues by $7.4 million, $3.3 million and $792,000, respectively. These favorable changes in accounting estimates related primarily to non-contracted payors and resulted from continued improvements to our collection processes, changes in reimbursement policies by certain payors and increased hiring of personnel and management focused on the collection of accounts receivable for services rendered in prior periods. We intend to continue to seek opportunities to improve our billing and collections systems and processes, but these adjustments could fluctuate both favorably and unfavorably during future periods. |
Gross profit as a percent of revenue increased to 62% for the year ended December 31, 2009, as compared to 60% and 59% the years ended December 31, 2008 and 2007, respectively. The increase in gross profit as a percentage of revenue for the years ended December 31, 2009 and 2008 of 2% and 1%, respectively, over each preceding year, resulted primarily from positive changes in prior period accounting estimates to reduce contractual allowances (in each case inclusive of the changes in prior period accounting estimates noted above) and increases in reimbursement. Cost of revenues increased due to growth in case volumes and higher employee-related costs associated with the cost of laboratory personnel and Cartesian physicians, as well as increased overhead from facilities expansion efforts. Overall, this resulted in increased gross profit per case of $203 for 2009, as compared to 2008, and increased gross profit per case of $256 for 2008, as compared to 2007.
We expect to experience downward pressure on our gross profit as a percentage of revenue in 2010 as we complete improvements on our newly acquired laboratory facility and make capital expenditures to purchase new laboratory equipment and hire additional laboratory technicians, support personnel and hempaths for these facilities (see Liquidity and Capital Resources in this management’s discussion and analysis of financial condition and results). Additionally, we expect that our cost of revenues will continue to increase, due to increased laboratory supplies, personnel, and logistic costs to support growing case volumes. These costs are expected to be partially offset by further leveraging of our fixed costs and efficiencies gained for improvements in our processes. Overall, we expect gross profit as a percentage of revenues, or gross margins, to be in the high 50% range for 2010.
Sales and Marketing Expenses
Sales and marketing expenses consist primarily of employee-related costs (salaries, commissions, fringe benefits, stock-based compensation and related training and travel costs for our sales personnel in the field) and administrative-related costs allocated to sales and marketing functions. As part of our growth strategy, we expect our sales and marketing expenses to increase as we hire additional field sales representatives and strengthen our organization with the addition of mid-level management and training personnel to more fully develop our sales territories. We currently expect to grow our field sales representatives to approximately 120 over the next two to three years.
We increased hiring efforts to significantly increase the number of field sales representatives during the fourth quarter of 2009, from 67 at the end of the third quarter to 80 as of December 31, 2009. These field sales representatives will increase our geographic reach and enhance our relations with existing customers.
59
Table of Contents
| Years Ended December 31, | % Change | |||||||||||||||||
| 2009 | 2008 | 2007 | 2009 | 2008 | ||||||||||||||
| Sales and marketing expenses (in thousands) |
$ | 31,296 | $ | 20,065 | $ | 11,649 | 56 | % | 72 | % | ||||||||
| Sales and marketing expenses as a % of revenues |
17 | % | 17 | % | 20 | % | ||||||||||||
Sales and marketing expenses were $31.3 million for the year ended December 31, 2009, increasing 56% and 72% from $20.1 million and $11.6 million for the years ended December 31, 2008 and 2007, respectively. As a percentage of revenues, sales and marketing expenses for the years ended December 31, 2009 and 2008 remained consistent at 17%, as compared to a decrease from 20% for the year ended December 31, 2007, due to higher revenues and efficiencies that have been gained since 2007. The increases of $11.2 million and $8.4 million for the years ended December 31, 2009 and 2008, respectively, over each preceding year, were primarily due to incremental increases of $8.0 million and $7.4 million, respectively, for employee-related costs (including salaries, sales commissions, stock-based compensation expense and travel) and other cost increases due to the increased number of field sales representatives, sales managers and customer service personnel that we hired to drive and support our revenue growth. Facility and equipment costs related to sales and marketing increased incrementally by $1.6 million and $765,000 for the years ended December 31, 2009 and 2008, respectively, due to increased headcount and related facility allocations. Consulting costs increased incrementally by $1.0 million and $54,000, for the years ended December 31, 2009 and 2008, respectively, due to promotional activities during the year.
We anticipate sales and marketing expense will increase in 2010, both in total and as a percentage of revenues, due to additional headcount (including increases to salaries, sales commissions, stock-based compensation expense and travel) and additional marketing activities offset by increased revenues.
General and Administrative Expenses
General and administrative expenses relate to billing, finance, human resources and other administrative functions consisting of employee-related costs (including salaries, fringe benefits and stock-based compensation), professional services, depreciation and other costs allocated to general and administrative functions. In addition, the provision for doubtful accounts is included in general and administrative expenses. We anticipate increases in our general and administrative expenses as we add personnel; continue to comply with the reporting obligations applicable to publicly held companies; incur additional expenses associated with the expansion of our facilities into our newly leased office space and backup systems; and continue to build our corporate infrastructure to support our anticipated growth.
| Years Ended December 31, | % Change | |||||||||||||||||
| 2009 | 2008 | 2007(1) | 2009 | 2008 | ||||||||||||||
| General and administrative expenses (in thousands) |
$ | 28,710 | $ | 22,313 | $ | 9,976 | 29 | % | 124 | % | ||||||||
| General and administrative expenses as a % of revenues |
16 | % | 19 | % | 17 | % | ||||||||||||
| (1) | During the year ended December 31, 2007, we recorded positive changes in prior period accounting estimates to reduce the allowance for doubtful accounts, which decreased general and administrative expenses by $666,000. This positive change in accounting estimates was the result of continued improvements to our collection processes, as well as favorable experience in the collection of previously reserved accounts receivable for services rendered in prior periods and changes in reimbursement policies by certain payors. There were no similar changes in prior period accounting estimates during the years ended December 31, 2009 and 2008. |
General and administrative expenses increased to $28.7 million for the year ended December 31, 2009, increasing 29% and 124% from $22.3 million and $10.0 million for the years ended December 31, 2008 and 2007, respectively (inclusive of the change in prior period accounting estimates noted above). The increases of $6.4 million and $12.3 million for the years ended December 31, 2009 and 2008, respectively, over each
60
Table of Contents
preceding year, were primarily due to incremental increases of $6.0 million and $6.3 million, respectively, for employee-related costs (including salaries, bonuses, stock-based compensation expense and travel). Employee-related costs increased as a result of a 43% increase in total general and administrative headcount to 93 as of December 31, 2009, up from 65 as of December 31, 2008, and from 36 as of December 31, 2007, in support of overall company growth. In addition, we have expanded our infrastructure by enhancing our IS and implementing finance initiatives to improve billing and support for our continued overall growth. The provision for doubtful accounts incrementally increased $2.5 million from December 31, 2007 to 2008; however, it remained flat into 2009 due to stronger than expected collections, resulting in a lowered provision for doubtful accounts as a percentage of revenue in 2009. Going forward, we expect our provision for doubtful accounts to approximate 2% of revenues. Legal and consulting expenses increased as a result of regulatory initiatives, corporate and business development, increased contract management and ongoing development and maintenance of our compliance programs. These incremental increases were offset by $1.8 million for the year ended December 31, 2009, due to allocations to cost of revenues and sales and marketing associated with our facility and equipment improvements and deployment of previously undeveloped space within our existing facility, as compared to an increase of expense of $528,000 from 2007 to 2008.
As a percentage of revenues, general and administrative expenses decreased to 16% for the year ended December 31, 2009 as compared to 19% and 17% in 2008 and 2007, respectively. The increase in general and administrative expenses we experienced in 2008 pertains to costs related to our first full year as a public company and increased support personnel costs due to our growth and various corporate initiatives, which were offset by a 96% increase in revenues for the same year. In comparison, the decrease to 16% for the year ended December 31, 2009 from 19% in 2008, resulted from higher revenues, lower provision for doubtful accounts and increased leverage of costs as we continued to grow. Although we anticipate total general and administrative expenses to increase in 2010, we expect to see a slight decline in general administrative expenses as a percentage of revenues.
Interest and Other Income
| Years Ended December 31, | % Change | |||||||||||||||
| 2009 | 2008 | 2007 | 2009 | 2008 | ||||||||||||
| (in thousands) | ||||||||||||||||
| Interest and other income |
$ | 1,554 | $ | 3,038 | $ | 1,103 | (49 | %) | 175 | % | ||||||
| Interest expense |
$ | — | $ | — | $ | (353 | ) | 0 | % | (100 | %) | |||||
Interest and other income decreased to $1.6 million for the year ended December 31, 2009, down from $3.0 million and up from $1.1 million for the years ended December 31, 2008 and 2007, respectively. The 2009 decrease is primarily the result of lower investment returns and the partial shift in our investment portfolio into tax exempt municipal securities that will be beneficial in lowering our effective tax rate. The 2008 increase was primarily due to increased cash and cash equivalents and investment securities from our IPO proceeds and cash provided by operations. We intend to continue to manage our investments to maximize our returns while minimizing our risk.
The decrease in interest expense is a result of our repayment of borrowings during the year ended December 31, 2007, in connection with our IPO. No new borrowings or related interest expense are expected.
Income Tax Expense (Benefit)
Income tax expense for the year ended December 31, 2009 was $24.7 million. The income tax benefit for the year ended December 31, 2008 was $1.7 million and income tax expense for the year ended December 31, 2007 was $439,000. We had $14.9 million in net deferred tax assets as of December 31, 2007 that were offset entirely by a valuation allowance, as we were unable to conclude, at that time, that it was “more likely than not” that such deferred tax assets would be realized. As of December 31, 2008, although realization was not assured,
61
Table of Contents
we believed it was “more likely than not” that we would be able to realize our net deferred tax assets through the ordinary course of business and expected future taxable income. Therefore, during the year ended December 31, 2008, we recorded a $14.9 million tax benefit representing the release of the valuation allowance against the net deferred tax assets. As of December 31, 2009, we had $7.2 million in net deferred tax assets.
As of December 31, 2009, we had federal tax net operating loss carryforwards of approximately $1.2 million and state tax net operating loss carryforwards of approximately $27.0 million. The federal and state net operating losses will begin to expire in 2019 and 2010, respectively. As of December 31, 2009, we had no federal research tax credit carryforwards and state research credit carryforwards of approximately $104,000, which do not expire.
Our taxable income for 2009 significantly utilized the remaining available federal net operating losses with any remaining deferred tax assets to be utilized in subsequent years. Due to our sustained profitability, our future effective tax rate will be approximately 44% of income before taxes. This rate is subject to the impact of nondeductible stock-based compensation expense offset by any tax deductions from disqualifying dispositions.
Liquidity and Capital Resources
The following tables present a summary of our liquidity and cash flows:
| December 31, | ||||||||||||
| 2009 | 2008 | 2007 | ||||||||||
| (in thousands) | ||||||||||||
| Cash, cash equivalents and short-term investments |
$ | 140,994 | $ | 102,938 | $ | 85,460 | ||||||
| Working capital |
$ | 161,325 | $ | 115,236 | $ | 88,979 | ||||||
| Years Ended December 31, | ||||||||||||
| 2009 | 2008 | 2007 | ||||||||||
| (in thousands) | ||||||||||||
| Net cash provided by (used in): |
||||||||||||
| Operating activities |
$ | 37,670 | $ | 28,155 | $ | 13,105 | ||||||
| Investing activities |
(54,343 | ) | (44,739 | ) | (36,022 | ) | ||||||
| Financing activities |
6,510 | 4,068 | 69,676 | |||||||||
| Net (decrease) increase in cash and cash equivalents |
$ | (10,163 | ) | $ | (12,516 | ) | $ | 46,759 | ||||
As of December 31, 2009, we had $141.0 million in cash, cash equivalents and short-term investments consisting of municipal securities, government-sponsored enterprise securities, corporate debt securities, U.S. treasury securities and certificates of deposit. We have established a policy and guidelines relating to diversification and maturities of our investment securities to minimize overall risk with the objectives of preserving principal and maintaining liquidity while maximizing our returns. Our certificates of deposit are fully insured by the Federal Deposit Insurance Corporation, or FDIC.
Our primary sources of cash are from trade accounts receivable and proceeds from common stock issuances. Collections of accounts receivable are impacted by the efficiency of our cash collections process as measured by the change in DSO. DSO can vary from period to period depending on the payment cycles and the mix of our payors. Our DSO averaged 56 days in 2009, which was consistent with 56 days in 2008. As of December 31, 2009 and 2008, our DSO was 62 days and 53 days, respectively. The increase in our DSO as of December 31, 2009, pertains primarily to the timing of payments relating to certain contracted payors. The decrease in our DSO we experienced as of December 31, 2008 was the result of continued improvements to our billing and collection systems and processes. We expect to maintain our average DSO levels into 2010 as we continue to pursue improvements to collection procedures and work with our payors to ensure timely processing of reimbursement payments.
62
Table of Contents
Our primary uses of cash are to fund operating expenses, income taxes, and the acquisition of property and equipment. Cash used to fund operating expenses is impacted by the timing of payments as reflected in the change in our outstanding accounts payable and accrued expenses. Acquisitions of property and equipment generally consist of cash payments for facility improvements and purchases of laboratory equipment and computer hardware and software. Income tax payments consist of federal and state payments of an approximately 45% effective tax rate, since the majority of our net operating losses and other credits have been exhausted. We expect our future effective tax rate will be approximately 44% of income before taxes.
We expect our capital expenditures to increase significantly during 2010. Specifically, we expect capital expenditures to be approximately $30.0 million for 2010 including approximately $14.0 million for improvements to our new facilities and $7.6 million to purchase the new facility and land (see Note 10, Subsequent Events, in the accompanying notes to our consolidated financial statements included elsewhere in this Annual Report on Form 10-K). For the year ended December 31, 2009, capital expenditures totaled $5.5 million.
Cash Flows
Net cash provided by operating activities during the year ended December 31, 2009 was $37.7 million, as compared to $28.2 million and $13.1 million for the years ended December 31, 2008 and 2007, respectively. The increase was primarily due to changes in accounts receivable, accrued compensation and accrued income taxes. Our accounts receivable increased due to higher revenues from test volume increases and the increased selling price per test. The change in accrued compensation is due to additional headcount and the timing of our compensation payments. The increase in income taxes is due to our status as a fully taxable entity while sustaining continued profitability.
Net cash used in investing activities during the year ended December 31, 2009, was $54.3 million, as compared to $44.7 million and $36.0 million for the years ended December 31, 2008 and 2007, respectively. This was primarily due to the increase in the net purchases of investment securities of $13.7 million offset by a decrease in capital expenditures of $4.1 million.
Net cash provided by financing activities during the year ended December 31, 2009, was $6.5 million, as compared to $4.1 million and $69.7 million for the years ended December 31, 2008 and 2007, respectively. This was primarily due to net proceeds from the employee stock transactions and excess tax benefits related to disqualifying dispositions on stock-based compensation awards. The significant cash inflow from financing activities during the year ended December 31, 2007 represents proceeds from our initial public offering.
Liquidity Restrictions
As of December 31, 2009, we held a single ARS with a fair value of $3.8 million. The ARS had a cost basis of $4.9 million, which was net of a temporary impairment of $1.1 million as of December 31, 2009 due to the current illiquidity of the investment security. As such, we classified the ARS as a long-term investment security.
ARS are collateralized debt instruments with long-term contractual maturities that are structured with short-term holding periods. They provide liquidity through a Dutch auction process that resets the applicable interest rate at pre-determined intervals, typically every 7 to 35 days. The length of each holding period is determined at the original issuance of the ARS. We can sell at each auction at par, assuming there are buyers for the ARS at such auction. In order for the auction to be successful, demand in the marketplace must meet or exceed the supply. If an auction is unsuccessful, the interest rate on the security resets at a predetermined auction failure rate. An investor can continue to hold the investment security until the next auction date or attempt to sell in the secondary market, usually at a sizable discount.
The ARS in our investment securities portfolio consists of debt issued by a municipality that is also underwritten by an insurance agency. The ARS auctions began failing in February 2008. As of December 31, 2009, the ARS was rated “BAA1” by Moody’s Investors Service and “A” by Standard & Poor’s based on the
63
Table of Contents
underwriter’s guarantee. Although unsuccessful, the last auction occurred on September 10, 2008, prior to the bankruptcy of the broker/dealer that managed the auction. The funds associated with this security will not be accessible until the issuer restructures the debt, a buyer is found outside of the auction process, or the ARS matures in 2038. As such, we have recorded a temporary impairment of approximately $1.1 million as of December 31, 2009. The issuer continues to pay the interest as scheduled and shows no indication that it will be unable to meet its current obligations. We do not need to access these funds for operational purposes for the foreseeable future. Because we do not need the current liquidity, we will hold the security until the auctions begin occurring, the issuer restructures the debt or until the contractual maturity date. Based on our ability to access our cash and cash equivalents and short-term investment securities and our expected operating cash flows, we do not anticipate that the temporary illiquidity of this investment will affect our ability to execute our current business plan.
As of December 31, 2009, we had total restricted cash of $270,000. Restricted cash consists of amounts held in a certificate of deposit to collateralize a standby letter of credit per the terms of an operating lease agreement. The standby letter of credit requirement expires in 2012, allowing for $90,000 annual reductions on June 30 of each year through 2012.
Capital Resources
We believe that our internal cash flows along with our existing cash, cash equivalents and short-term investments should be adequate to fund our planned growth and operating activities through at least the next 24 months.
Our future capital uses and requirements depend on numerous factors. These factors include but are not limited to the following:
| • | the current economy and financial markets; |
| • | changes in regulations or payor policies, including reimbursement levels from governmental payors and private insurers, or contracting arrangements with payors or changes in other laws, regulations or policies; and |
| • | the extent to which we expand our operations and increase our market share. |
Over the next 12 months, we estimate the costs associated with expanding our operations to be approximately $30.0 million. This cost consists of the costs associated with our newly acquired laboratory facility and customer service and support facility of approximately $22.0 million and the costs associated with additional capital expenditures of approximately $8.0 million.
We may from time to time consider the acquisition of businesses and/or technologies complementary to our business. Such an acquisition could require significant additional capital resources. We could be required to raise additional equity or debt financing if we were to engage in a material acquisition in the future.
We may be required to or otherwise may (for strategic or other reasons) elect to raise additional funds through public or private equity offerings or debt financings. We do not know if we will be able to obtain additional financing on favorable terms, if at all (particularly in light of the difficult current financial environment and weak economic conditions). If we cannot raise funds on acceptable terms, if and when needed, we may not be able to maintain or grow our business at the rate that we currently anticipate and we may not be able to respond to competitive pressures or unanticipated capital requirements, or we may be required to reduce operating expenses, which would significantly harm our business, financial condition and results of operations.
As of December 31, 2009, we do not have any outstanding debt. We do not anticipate having to obtain any form of debt in the near future.
64
Table of Contents
Income Tax
As of December 31, 2009, most remaining and available federal and state income tax net operating losses and other credits have been utilized, which will result in increased income tax payments and decrease our cash flows from operations. As of December 31, 2009, we had federal and state tax net operating loss carryforwards of approximately $1.2 million and $27.0 million, respectively. However, California suspended the use of its state tax net operating loss carryforward until 2010, which will cause us to be fully taxed in California without the benefit of net operating losses in 2009. The federal and state net operating losses will begin to expire in 2019 and 2010, respectively. As of December 31, 2009, we had no federal research tax credit carryforwards and state research carryforwards of approximately $104,000, which do not expire.
Utilization of net operating loss carryforwards, credit carryforwards and certain deductions have been subject to substantial annual limitations due to ownership change limitations provided by the Internal Revenue Code of 1986, as amended, and similar state provisions. Under Sections 382 and 383 of the Internal Revenue Code of 1986, as amended, substantial changes in our ownership have required us to limit the amount of net operating loss and research and development credit carryforwards that were previously available to offset future taxable income. We have had three “change in ownership” events that limit the utilization of net operating loss and credit carryforwards. The “change in ownership” events occurred in March 2000, December 2001 and March 2008 and resulted in annual net operating loss carryforward limitations of $63,000, $96,000 and $16.1 million, respectively. As a result of a net unrealized built-in gain from the March 2008 change in ownership, our net operating loss carryforward annual limitation of $16.1 million was increased to $39.7 million for each of the five years starting after the change in ownership. Additional limitations on the use of these tax attributes could occur in the event of possible disputes arising in examination from various taxing authorities.
In August 2009, the IRS commenced an examination of our U.S. federal income tax return for the tax year ended December 31, 2007. To date, there have been no proposed adjustments communicated to management. While we believe we are adequately reserved, if the examination results in an unfavorable outcome, there could be a material impact on the financial results in the period the outcome is determined.
We are subject to U.S. federal income tax as well as income tax in jurisdictions of each state having an income tax. The tax years that remain subject to examination are 2006 for federal income taxes and 2004 for state income taxes, including years ending thereafter. However, to the extent allowed by law, the tax authorities may have the right to examine prior periods where net operating losses or tax credits were generated and carried forward, and make adjustments up to the amount of the net operating losses or credit carry forward amount.
Contractual Obligations and Commitments
The following table presents a summary of our long-term contractual obligations and commitments as of December 31, 2009:
| Payments Due By Period | |||||||||||||||||||||
| Total | 2010 | 2011 | 2012 | 2013 | 2014 | Thereafter | |||||||||||||||
| (in thousands) | |||||||||||||||||||||
| Purchase obligations |
$ | 557 | $ | 401 | $ | 79 | $ | 50 | $ | 27 | $ | — | $ | — | |||||||
| Operating leases |
15,764 | 3,694 | 3,736 | 3,090 | 2,410 | 2,578 | 256 | ||||||||||||||
| $ | 16,321 | $ | 4,095 | $ | 3,815 | $ | 3,140 | $ | 2,437 | $ | 2,578 | $ | 256 | ||||||||
From time to time, we may enter into contracts with suppliers, manufacturers and other third parties under which we may be required to make payments. The table above does not reflect any future obligations that may arise due to further expansion of our laboratory facilities, including facility leasing costs, tenant improvements and other facility startup and infrastructure costs.
65
Table of Contents
Recent Accounting Pronouncements
See Note 1 in the accompanying notes to our consolidated financial statements included elsewhere in this Annual Report on Form 10-K.
Off-Balance Sheet Arrangements
We have not engaged and do not expect to engage in any off-balance sheet activities.
Item 7A. Quantitative and Qualitative Disclosures about Market Risk.
Market Risk
Market risk represents the risk of loss that may impact our financial position, results of operations or cash flows due to adverse changes in financial and commodity market prices and rates. We are exposed to market risk primarily in the area of changes in U.S. interest rates. We do not have any material foreign currency or other derivative financial instruments. Under our current policies, we do not use interest rate derivative instruments to manage exposure to interest rate changes. We attempt to increase the safety and preservation of our invested principal funds by limiting default risk, market risk and reinvestment risk. We mitigate default risk by investing in investment grade securities.
Interest Rate Risk
All of our investment securities are classified as available-for-sale and therefore reported on the balance sheet at fair value. Changes in the overall level of interest rates affect our interest income that is generated from our cash, cash equivalents and investment securities. If a 100 basis point change in overall interest rates were to occur in 2010, our interest income would change by approximately $723,000 in relation to amounts we would expect to earn assuming investment securities balances and types of investment securities are consistent with those as of December 31, 2009.
Concentration of Credit Risk
Financial instruments which potentially subject us to concentration of credit risk consist principally of cash and cash equivalents with three financial institutions. Such cash balances, at times, may exceed FDIC limits. To date, we have not experienced any losses in such accounts.
66
Table of Contents
Item 8. Financial Statements and Supplementary Data.
Report of Independent Registered Public Accounting Firm
The Board of Directors and Stockholders
Genoptix, Inc.
We have audited the accompanying consolidated balance sheets of Genoptix, Inc. as of December 31, 2009 and 2008 and the related consolidated statements of operations, stockholders’ equity, and cash flows for each of the three years in the period ended December 31, 2009. Our audits also included the financial statement schedule listed in the Index at Item 15(a). These financial statements and schedule are the responsibility of the Company’s management. Our responsibility is to express an opinion on these financial statements and schedule based on our audits.
We conducted our audits in accordance with the standards of the Public Company Accounting Oversight Board (United States). Those standards require that we plan and perform the audit to obtain reasonable assurance about whether the financial statements are free of material misstatement. An audit also includes examining, on a test basis, evidence supporting the amounts and disclosures in the financial statements. An audit also includes assessing the accounting principles used and significant estimates made by management, as well as evaluating the overall financial statement presentation. We believe our audits provide a reasonable basis for our opinion.
In our opinion, the financial statements referred to above present fairly, in all material respects, the consolidated financial position of Genoptix, Inc. at December 31, 2009 and 2008, and the consolidated results of its operations and its cash flows for each of the three years in the period ended December 31, 2009, in conformity with U.S. generally accepted accounting principles. Also, in our opinion, the related financial statement schedule, when considered in relation to the basic financial statements taken as a whole, presents fairly in all material respects the information set forth therein.
We also have audited, in accordance with the standards of the Public Company Accounting Oversight Board (United States), Genoptix Inc.’s internal control over financial reporting as of December 31, 2009, based on criteria established in Internal Control-Integrated Framework issued by the Committee of Sponsoring Organizations of the Treadway Commission and our report dated February 25, 2010 expressed an unqualified opinion thereon.
/s/ Ernst & Young LLP
San Diego, California
February 25, 2010
67
Table of Contents
GENOPTIX, INC.
(in thousands, except par values)
| December 31, | ||||||||
| 2009 | 2008 | |||||||
| Assets |
||||||||
| Current assets: |
||||||||
| Cash and cash equivalents |
$ | 27,945 | $ | 38,108 | ||||
| Short-term investment securities |
113,049 | 64,830 | ||||||
| Accounts receivable, net of allowance for doubtful accounts of $5,387 and $4,126 at December 31, 2009 and 2008, respectively |
27,707 | 15,604 | ||||||
| Deferred tax asset |
5,406 | 4,707 | ||||||
| Other current assets |
3,320 | 2,179 | ||||||
| Total current assets |
177,427 | 125,428 | ||||||
| Property and equipment, net |
13,826 | 12,189 | ||||||
| Restricted cash |
270 | 360 | ||||||
| Long-term investment security |
3,786 | 3,775 | ||||||
| Long-term deferred tax asset |
1,800 | 2,510 | ||||||
| Other long-term assets |
346 | 183 | ||||||
| Total assets |
$ | 197,455 | $ | 144,445 | ||||
| Liabilities and Stockholders’ Equity |
||||||||
| Current liabilities: |
||||||||
| Accounts payable and accrued expenses |
$ | 8,322 | $ | 6,580 | ||||
| Accrued compensation |
4,667 | 3,006 | ||||||
| Income tax payable |
1,557 | — | ||||||
| Deferred revenues |
1,225 | 365 | ||||||
| Deferred rent |
331 | 241 | ||||||
| Total current liabilities |
16,102 | 10,192 | ||||||
| Long-term deferred rent |
1,732 | 1,955 | ||||||
| Other long-term liabilities |
117 | 79 | ||||||
| Commitments and contingencies |
||||||||
| Stockholders’ equity: |
||||||||
| Preferred stock, $0.001 par value; 5,000 shares authorized; no shares issued and outstanding at December 31, 2009 and 2008, respectively |
— | — | ||||||
| Common stock, $0.001 par value; 100,000 shares authorized; 17,276 and 16,682 shares issued and outstanding at December 31, 2009 and 2008, respectively |
17 | 17 | ||||||
| Additional paid-in capital |
160,064 | 143,616 | ||||||
| Treasury stock, at cost; 1 and no shares held at December 31, 2009 and 2008, respectively |
(25 | ) | — | |||||
| Accumulated other comprehensive loss |
(546 | ) | (774 | ) | ||||
| Accumulated earnings (deficit) |
19,994 | (10,640 | ) | |||||
| Total stockholders’ equity |
179,504 | 132,219 | ||||||
| Total liabilities and stockholders’ equity |
$ | 197,455 | $ | 144,445 | ||||
See accompanying notes to consolidated financial statements.
68
Table of Contents
GENOPTIX, INC.
CONSOLIDATED STATEMENTS OF OPERATIONS
(in thousands, except per share data)
| Years Ended December 31, | |||||||||||
| 2009 | 2008 | 2007 | |||||||||
| Revenues |
$ | 184,378 | $ | 116,170 | $ | 59,332 | |||||
| Cost of revenues |
69,200 | 45,931 | 24,106 | ||||||||
| Gross profit |
115,178 | 70,239 | 35,226 | ||||||||
| Operating expenses: |
|||||||||||
| Sales and marketing |
31,296 | 20,065 | 11,649 | ||||||||
| General and administrative |
28,710 | 22,313 | 9,976 | ||||||||
| Research and development |
1,362 | 1,233 | 559 | ||||||||
| Total operating expenses |
61,368 | 43,611 | 22,184 | ||||||||
| Income from operations |
53,810 | 26,628 | 13,042 | ||||||||
| Interest and other income |
1,554 | 3,038 | 1,103 | ||||||||
| Interest expense |
— | — | (353 | ) | |||||||
| Income before income taxes |
55,364 | 29,666 | 13,792 | ||||||||
| Income tax expense (benefit) |
24,730 | (1,690 | ) | 439 | |||||||
| Net income |
$ | 30,634 | $ | 31,356 | $ | 13,353 | |||||
| Net income per share:(1)(2) |
|||||||||||
| Basic |
$ | 1.80 | $ | 1.91 | $ | 1.20 | |||||
| Diluted |
$ | 1.71 | $ | 1.78 | $ | 0.78 | |||||
| Shares used to compute net income per share:(1)(2) |
|||||||||||
| Basic |
16,978 | 16,399 | 2,756 | ||||||||
| Diluted |
17,954 | 17,653 | 4,246 | ||||||||
| (1) | As a result of the conversion of the Company’s preferred stock into 11,032 shares of common stock upon completion of the Company’s initial public offering in November 2007, there is a lack of comparability in the basic and diluted net income per share amounts for the periods presented above. For calculations of the pro forma net income per share for the periods presented, see Note 1 in the accompanying notes to consolidated financial statements. |
| (2) | For the year ended December 31, 2007, $10,036 of the Company’s net income of $13,353 was allocated to preferred stockholders for purposes of calculating net income per share pursuant to the terms of the preferred stock, resulting in $3,317 of net income allocable to common stockholders. See Note 1 in the accompanying notes to consolidated financial statements for an explanation of the method and amounts used in the computation of the per share amounts. |
See accompanying notes to consolidated financial statements.
69
Table of Contents
GENOPTIX, INC.
CONSOLIDATED STATEMENTS OF STOCKHOLDERS’ EQUITY
(in thousands)
| Convertible Preferred Stock |
Common Stock | Additional Paid-In Capital |
Treasury Stock | Accumulated Other Comprehensive Income (Loss) |
Accumulated (Deficit) Earnings |
Total Stockholders’ Equity |
Comprehensive (Loss) Income |
|||||||||||||||||||||||||||||||
| Shares | Amount | Shares | Amount | Shares | Amount | |||||||||||||||||||||||||||||||||
| Balance at December 31, 2006 |
52,401 | $ | 52 | 197 | $ | — | $ | 59,362 | — | $ | — | $ | — | $ | (55,349 | ) | $ | 4,065 | $ | (3,759 | ) | |||||||||||||||||
| Conversion of preferred stock in connection with initial public offering |
(52,401 | ) | (52 | ) | 11,032 | 11 | 41 | — | — | — | — | — | — | |||||||||||||||||||||||||
| Initial public offering of common stock, net of $7,969 of offering costs |
— | — | 4,736 | 5 | 72,533 | — | — | — | — | 72,538 | — | |||||||||||||||||||||||||||
| Stock-based compensation |
— | — | — | — | 540 | — | — | — | — | 540 | — | |||||||||||||||||||||||||||
| Issuance of common stock, net |
— | — | 130 | — | 56 | — | — | — | — | 56 | — | |||||||||||||||||||||||||||
| Net income |
— | — | — | — | — | — | — | — | 13,353 | 13,353 | 13,353 | |||||||||||||||||||||||||||
| Unrealized gain on investment securities |
— | — | — | — | — | — | — | 53 | — | 53 | 53 | |||||||||||||||||||||||||||
| Balance at December 31, 2007 |
— | — | 16,095 | 16 | 132,532 | — | — | 53 | (41,996 | ) | 90,605 | $ | 13,406 | |||||||||||||||||||||||||
| Issuance of common stock, net |
— | — | 587 | 1 | 1,863 | — | — | — | — | 1,864 | — | |||||||||||||||||||||||||||
| Stock-based compensation |
— | — | — | — | 7,017 | — | — | — | — | 7,017 | — | |||||||||||||||||||||||||||
| Excess tax benefits from stock-based compensation awards |
— | — | — | — | 2,968 | — | — | — | — | 2,968 | — | |||||||||||||||||||||||||||
| Costs paid in connection with public offering |
— | — | — | — | (764 | ) | — | — | — | — | (764 | ) | — | |||||||||||||||||||||||||
| Net income |
— | — | — | — | — | — | — | — | 31,356 | 31,356 | 31,356 | |||||||||||||||||||||||||||
| Unrealized loss on investment securities |
— | — | — | — | — | — | — | (1,365 | ) | — | (1,365 | ) | (1,365 | ) | ||||||||||||||||||||||||
| Deferred tax |
— | — | — | — | — | — | — | 538 | — | 538 | 538 | |||||||||||||||||||||||||||
| Balance at December 31, 2008 |
— | — | 16,682 | 17 | 143,616 | — | — | (774 | ) | (10,640 | ) | 132,219 | $ | 30,529 | ||||||||||||||||||||||||
| Issuance of common stock, net |
— | — | 594 | — | 2,779 | — | — | — | — | 2,779 | — | |||||||||||||||||||||||||||
| Repurchase of common stock |
— | — | — | — | (5 | ) | 1 | (25 | ) | — | — | (30 | ) | — | ||||||||||||||||||||||||
| Stock-based compensation |
— | — | — | — | 9,917 | — | — | — | — | 9,917 | — | |||||||||||||||||||||||||||
| Excess tax benefits from stock-based compensation awards |
— | — | — | — | 3,757 | — | — | — | — | 3,757 | — | |||||||||||||||||||||||||||
| Net income |
— | — | — | — | — | — | — | — | 30,634 | 30,634 | 30,634 | |||||||||||||||||||||||||||
| Unrealized gain on investment securities |
— | — | — | — | — | — | — | 454 | — | 454 | 454 | |||||||||||||||||||||||||||
| Deferred tax |
— | — | — | — | — | — | — | (226 | ) | — | (226 | ) | (226 | ) | ||||||||||||||||||||||||
| Balance at December 31, 2009 |
— | $ | — | 17,276 | $ | 17 | $ | 160,064 | 1 | $ | (25 | ) | $ | (546 | ) | $ | 19,994 | $ | 179,504 | $ | 30,862 | |||||||||||||||||
See accompanying notes to consolidated financial statements.
70
Table of Contents
GENOPTIX, INC.
CONSOLIDATED STATEMENTS OF CASH FLOWS
(in thousands)
| Years Ended December 31, | ||||||||||||
| 2009 | 2008 | 2007 | ||||||||||
| Operating activities |
||||||||||||
| Net income |
$ | 30,634 | $ | 31,356 | $ | 13,353 | ||||||
| Adjustments to reconcile net income to net cash provided by operating activities: |
||||||||||||
| Depreciation and amortization |
3,569 | 1,388 | 580 | |||||||||
| Provision for doubtful accounts |
3,150 | 3,196 | 1,093 | |||||||||
| Stock-based compensation expense |
9,917 | 7,017 | 540 | |||||||||
| Amortization of premium/discount on investments securities |
1,033 | (417 | ) | (4 | ) | |||||||
| Excess tax benefits from stock-based compensation awards |
(3,757 | ) | (2,968 | ) | — | |||||||
| Deferred taxes |
(215 | ) | (6,680 | ) | — | |||||||
| Loss on sale of property and equipment |
6 | — | — | |||||||||
| Realized loss on sale of investment securities |
— | 66 | — | |||||||||
| Non-cash interest expense |
— | — | 166 | |||||||||
| Changes in operating assets and liabilities: |
||||||||||||
| Accounts receivable |
(15,253 | ) | (9,787 | ) | (5,340 | ) | ||||||
| Other current and long-term assets |
(1,283 | ) | (823 | ) | (1,159 | ) | ||||||
| Accounts payable and accrued expenses |
1,848 | 1,641 | 2,325 | |||||||||
| Accrued compensation |
1,661 | 510 | 1,438 | |||||||||
| Income taxes |
5,404 | 2,908 | — | |||||||||
| Deferred revenues |
860 | 270 | 56 | |||||||||
| Deferred rent |
96 | 478 | 57 | |||||||||
| Net cash provided by operating activities |
37,670 | 28,155 | 13,105 | |||||||||
| Investing activities |
||||||||||||
| Purchase of property and equipment |
(5,474 | ) | (9,567 | ) | (1,243 | ) | ||||||
| Proceeds from sales of property and equipment |
— | 21 | — | |||||||||
| Purchase of investment securities |
(142,326 | ) | (114,946 | ) | (42,779 | ) | ||||||
| Proceeds from sales and maturities of investment securities |
93,517 | 79,803 | 8,000 | |||||||||
| Purchase of intangibles |
(150 | ) | (50 | ) | — | |||||||
| Change in restricted cash |
90 | — | — | |||||||||
| Net cash used in investing activities |
(54,343 | ) | (44,739 | ) | (36,022 | ) | ||||||
| Financing activities |
||||||||||||
| Proceeds from issuance of common stock, net |
2,779 | 1,864 | 56 | |||||||||
| Excess tax benefits from stock-based compensation awards |
3,757 | 2,968 | — | |||||||||
| Repurchase of common stock |
(26 | ) | — | — | ||||||||
| Net (costs) proceeds from public offerings |
— | (764 | ) | 72,538 | ||||||||
| Principal payments on notes payable |
— | — | (3,183 | ) | ||||||||
| Proceeds from issuance of notes payable |
— | — | 284 | |||||||||
| Principal payments on capital lease obligations |
— | — | (19 | ) | ||||||||
| Net cash provided by financing activities |
6,510 | 4,068 | 69,676 | |||||||||
| Net (decrease) increase in cash and cash equivalents |
(10,163 | ) | (12,516 | ) | 46,759 | |||||||
| Cash and cash equivalents at beginning of year |
38,108 | 50,624 | 3,865 | |||||||||
| Cash and cash equivalents at end of year |
$ | 27,945 | $ | 38,108 | $ | 50,624 | ||||||
| Supplemental information: |
||||||||||||
| Income taxes paid, net |
$ | 19,568 | $ | 2,128 | $ | 365 | ||||||
| Interest paid |
$ | — | $ | — | $ | 187 | ||||||
| Non-cash investing and financing activities: |
||||||||||||
| Unrealized gain (loss) on investment securities, net |
$ | 454 | $ | (1,365 | ) | $ | 53 | |||||
| Capitalized tenant improvement allowance |
$ | — | $ | 1,470 | $ | — | ||||||
| Change in accrued purchases of property and equipment |
$ | (63 | ) | $ | 690 | $ | — | |||||
See accompanying notes to consolidated financial statements.
71
Table of Contents
GENOPTIX, INC.
NOTES TO CONSOLIDATED FINANCIAL STATEMENTS
1. Organization and Summary of Significant Accounting Policies
Organization
Genoptix, Inc., or the Company, was incorporated in Delaware on January 20, 1999 and does business as Genoptix Medical Laboratory and Genoptix Clinical Laboratory. The Company operates as a certified “high complexity” clinical laboratory in accordance with the federal government’s Clinical Laboratory Improvement Amendments of 1988, or CLIA, and is dedicated to the delivery of clinical diagnostic services to hematologist/oncologist physician customers.
Basis of Presentation and Principles of Consolidation
The Company’s industry is highly regulated. The manner in which licensed physicians can organize to perform and bill for medical services is governed by state laws and regulations. Business corporations, like the Company, often are not permitted to employ physicians to practice medicine or to own corporations that employ physicians to practice medicine or to otherwise exercise control over the medical judgments or decisions of physicians.
In California, where the Company’s clinical diagnostic services are provided, the Company is not permitted to directly own a medical operation. As a result, it performs only non-medical administrative and support services and does not exercise influence or control over the practice of medicine. The Company provides its medical services through Cartesian Medical Group, Inc. or Cartesian, an entity that it manages, and it is this entity that employs the physicians who provide medical services on behalf of the Company. The relationship between the Company and Cartesian is governed by the Clinical Laboratory Professional Services Agreement, or PSA, entered into by the Company and Cartesian on December 31, 2005 and which became effective on January 1, 2006. Under the PSA, Cartesian provides all medical services and the Company exclusively manages all non-medical aspects, including entering into all non-employment related contracts. All claims, demands and rights to charge, bill and collect for medical services rendered are assigned from Cartesian to the Company. The Company is specifically responsible for billing and collections of all charges for the medical services rendered and provides Cartesian certain services, including payroll, laboratory and medical office space and non-medical business functions, such as supplies, utilities and insurance. In addition, any changes in the number of physicians or physician compensation are subject to the Company’s approval. Under the provisions of the PSA, the Company records the revenue assigned to it and expenses the cost of the services provided by it. The PSA is automatically renewed on a yearly basis but may be terminated by the Company at any time on 60 days’ prior notice, and either party may terminate the PSA upon an uncured material breach by the other party. Cartesian has no operating assets. The Company has also entered into a Succession Agreement that limits the ability of Cartesian’s owner to only transfer his ownership interest in Cartesian to an entity or person designated by the Company. As of January 1, 2006, the date the PSA became effective, the Company determined it had a controlling financial interest in Cartesian and began to consolidate the results of Cartesian based on the criteria as required by ASC Topic 810, Consolidations.
The consolidated financial statements of the Company include the accounts of the Company, Cartesian and Genoptix, PR LLC, a wholly-owned subsidiary of the Company located in Puerto Rico. All intercompany transactions and balances have been eliminated in consolidation.
Financial Statement Preparation
The consolidated financial statements and accompanying notes are prepared in accordance with accounting principles generally accepted in the U.S. The consolidated financial statements of the Company include the accounts of the Company, Cartesian and Genoptix, PR LLC, a wholly-owned subsidiary of the Company located in Puerto Rico. All intercompany transactions and balances have been eliminated in consolidation.
72
Table of Contents
GENOPTIX, INC.
NOTES TO CONSOLIDATED FINANCIAL STATEMENTS (CONTINUED)
The Company evaluated subsequent events occurring up to the time this annual report on Form 10-K was filed with the SEC on February 25, 2010. See Note 10 in these notes to consolidated financial statements for discussion of subsequent events.
Use of Estimates
The preparation of consolidated financial statements in conformity with accounting principles generally accepted in the U.S. requires management to make estimates and assumptions that affect the amounts reported in the consolidated financial statements and these notes to consolidated financial statements. The most significant estimates in the Company’s consolidated financial statements relate to revenue recognition, allowance for doubtful accounts, valuation of investment securities, stock-based compensation and income tax. Actual results could differ from those estimates.
Segment and Geographic Information
The Company identifies its operating segments based on business activities, management responsibility and geographical location. For all periods presented, the Company operated in a single business segment. Less than 1% of the Company’s revenue is generated outside of the United States and related territories.
Cash and Cash Equivalents
The Company considers all liquid investments with a maturity of 90 days or less when purchased to be cash equivalents. Cash and cash equivalents primarily represent funds invested in money market funds whose cost equals fair market value.
Investment Securities
As required by ASC Topic 320, Investments-Debt and Equity Securities, the Company classifies all investment securities as available-for-sale at the time of purchase, as the sale of such investment securities may be required prior to maturity in order to implement management strategies. The Company generally reports all investment securities as short-term based on its intent to fund current operations and its ability to convert the investment securities into cash. Investment securities with maturities beyond one year may be classified as short-term based on their highly liquid nature and because such marketable securities represent the investment of cash that is available for current operations. All securities are carried at fair value, with unrealized gains and losses reported as a separate component of accumulated other comprehensive loss, net of deferred tax, until realized. Amortization of premiums, accretion of discounts to maturity and interest earned are included in interest income. Realized gains and losses from the sale of available-for-sale investment securities, if any, are determined on a specific identification basis and included in interest income on the consolidated statements of operations.
Property and Equipment
Property and equipment is stated at cost and depreciated over the estimated useful lives of the assets, ranging from three to five years, using the straight-line method. Leasehold improvements are stated at cost and amortized over the lesser of the related remaining lease term or useful life. Depreciation expense, inclusive of tenant improvement amortization and offset by tenant improvement allowances, is reported in the statements of operations based on the nature of the underlying assets and the functional area to which the assets have been assigned.
73
Table of Contents
GENOPTIX, INC.
NOTES TO CONSOLIDATED FINANCIAL STATEMENTS (CONTINUED)
Restricted Cash
Restricted cash consists of amounts held in a certificate of deposit to collateralize a standby letter of credit per the terms of an operating lease agreement. The standby letter of credit requirement expires on August 31, 2012, allowing for $90,000 annual reductions on June 30 of each year through 2012. As of December 31, 2009, the Company had total restricted cash of $270,000. The Company classified the restricted cash as long-term due to the nature of the agreement which requires a standby letter of credit per the terms of an operating lease agreement.
Deferred Rent
As of December 31, 2009, the Company had leased all of its facilities under non-cancellable operating leases (see Note 10 in these notes to consolidated financial statements for discussion of subsequent events). Some of these lease agreements contain tenant improvement allowances funded by the landlord, rent holidays and rent escalation clauses. Rent expense is recognized on a straight-line basis over the lease term. The difference between the rent due under the stated periods of the leases compared to that of the straight-line basis is recorded as deferred rent. The Company uses the date that it obtains the legal right to use and control the leased space to begin recording rent expense and amortizing deferred rent on a straight-line basis over the term of the lease. The Company classifies deferred rent to be recognized after 12 months as long-term on the consolidated balance sheet.
The Company capitalizes tenant improvements related to landlord lease incentives as property and equipment with an offsetting credit to deferred rent. During the year ended December 31, 2008, the Company capitalized $1.5 million of these landlord-funded tenant improvements. These capitalized tenant improvements were placed into service in December 2008 and are being amortized over the remaining lease term of 60 months. The Company is amortizing the lease incentives, recorded as deferred rent, on a straight-line basis over the term of the lease. There were no additional landlord-funded tenant improvements during the year ended December 31, 2009.
Revenue Recognition
The Company recognizes revenues as required by ASC Topic 605, Revenue Recognition, when the price is fixed or determinable, persuasive evidence of an arrangement exists, the service is performed and collectibility of the resulting receivable is reasonably assured.
The Company’s specialized diagnostic services are performed based on a written test requisition form and revenues are recognized once the diagnostic services have been performed, the results have been delivered to the ordering physician, the payor has been identified and eligibility and insurance have been verified. These diagnostic services are billed to various payors, including Medicare, commercial insurance companies and other directly billed healthcare institutions such as hospitals and individuals. The Company reports revenues from contracted payors, including Medicare, certain insurance companies and certain healthcare institutions, based on the contractual rate, or in the case of Medicare, the published fee schedules. The Company reports revenues from non-contracted payors, including certain insurance companies and individuals, based on the amount expected to be collected. The difference between the amount billed and the amount expected to be collected is recorded as a contractual allowance to arrive at the reported revenues. The expected revenues from non-contracted payors are based on the historical collection experience of each payor or payor group, as appropriate. In each reporting period, the Company reviews its historical collection experience for non-contracted payors and adjusts its expected revenues for current and subsequent periods accordingly. During the years ended December 31, 2009, 2008 and 2007, the Company recorded positive changes in prior period accounting estimates to reduce contractual allowances, which increased its revenues by $7.4 million, $3.3 million and $792,000, respectively.
74
Table of Contents
GENOPTIX, INC.
NOTES TO CONSOLIDATED FINANCIAL STATEMENTS (CONTINUED)
These favorable changes in accounting estimates related primarily to non-contracted payors and resulted from continued improvements to the Company’s collection processes, changes in reimbursement policies by certain payors and increased hiring of personnel and management focused on the collection of accounts receivable for services rendered in prior periods. As of December 31, 2009 and 2008, the Company had uncollected accounts receivable from non-contracted payors of approximately $17.0 million and $9.1 million, respectively.
Allowance for Doubtful Accounts
An allowance for doubtful accounts is recorded for estimated uncollectible amounts due from the Company’s contracted payors. The process for estimating the collection of receivables associated with the Company’s specialized diagnostic services involves significant assumptions and judgments. Specifically, the allowance for doubtful accounts is adjusted periodically, based upon an evaluation of historical collection experience with specific payors and other relevant factors. The realization cycle for certain governmental and managed care payors can be lengthy involving denial, appeal and adjudication processes, and is subject to periodic adjustments that may be significant. The provision for doubtful accounts is charged to general and administrative expenses. Accounts receivable are written off as uncollectible and deducted from the allowance after appropriate collection efforts have been exhausted. As of December 31, 2009 and 2008, the Company had an allowance for doubtful accounts of $5.4 million and $4.1 million, respectively, which it reduced by $1.9 million and $664,000, respectively, for write-offs, net of recoveries.
The Company recorded a provision for doubtful accounts at a rate of approximately 2% of revenues for the year ended December 31, 2009, as compared to 3% for the year ended December 31, 2008. During the year ended December 31, 2009, the Company recorded $3.2 million of provision for doubtful accounts, which was consistent with the $3.2 million of provision for doubtful accounts for the comparable period in 2008.
Research and Development Costs
Costs incurred in connection with research and development activities are charged to operations as incurred.
Shipping Costs
Shipping costs are included in cost of revenues on the consolidated statements of operations.
Impairment of Long-Lived Assets
The Company reviews the carrying amount of its long-lived assets, as well as the useful lives, to determine whether indicators of impairment exist which warrant adjustments to carrying values or estimated useful lives whenever events or changes in circumstances indicate that the carrying amounts may not be recoverable. As required by ASC Topic 360, Property, Plant, and Equipment, if indications of impairment exist, projected future undiscounted cash flows associated with the asset are compared to the carrying amount to determine whether the asset’s value is recoverable. If the carrying value of the asset exceeds such projected undiscounted cash flows, the asset will be written down to its estimated fair value.
Fair Value of Financial Instruments
The carrying value of certain of the Company’s financial instruments that are not measured at fair value on a recurring basis, including cash, cash equivalents, accounts receivable, accounts payable and accrued expenses and other assets and liabilities, are considered to be reasonable estimates of their respective fair values due to their short-term nature.
75
Table of Contents
GENOPTIX, INC.
NOTES TO CONSOLIDATED FINANCIAL STATEMENTS (CONTINUED)
The Company values financial instruments that are measured at fair value on a recurring basis as required under ASC Topic 820, Fair Value Measurements and Disclosures, which defines fair value, establishes a framework for measuring fair value in accounting principles generally accepted in the U.S. and expands disclosures about fair value measurements. Furthermore, ASC Topic 825, Financial Instruments, permits entities the option to measure many financial instruments and certain other items at fair value. The Company has not specifically identified any financial instruments subject to measurement under ASC Topic 825.
Concentrations of Risk
Financial instruments which potentially subject the Company to significant concentrations of credit risk consist primarily of cash, cash equivalents, investment securities and accounts receivable.
The Company maintains deposits in federally insured financial institutions in excess of federally insured limits. The Company believes the financial positions of the depository institutions holding the Company’s deposits significantly reduce the exposure to credit risk. Additionally, the Company has established guidelines regarding diversification of its investment securities and their maturities, which are designed to maintain safety and liquidity.
Substantially all of the Company’s accounts receivable is with entities in the healthcare industry. However, concentrations of credit risk are limited due to the number of the Company’s customers as well as their dispersion across many different geographic regions in the United States. The Company has significant accounts receivable balances whose collectibility is dependent on the availability of funds from certain governmental programs, primarily Medicare, and compliance with the regulations of that agency. Upon audit by a Medicare intermediary, a condition of non-compliance could result in the Company having to refund amounts previously collected. The Company does not believe there is a significant credit risk associated with these governmental programs and believes an adequate allowance has been recorded for the possibility of these receivables proving uncollectible. The Company does not require collateral or other security to support accounts receivable. As of December 31, 2009 and 2008, other than Medicare, no other single payor’s accounts receivable balance resulted in any significant concentration of risk for contracted or non-contracted payors. Accounts receivable balances from Medicare were approximately $11.7 million and $7.7 million, as of December 31, 2009 and 2008, respectively.
For the years ended December 31, 2009, 2008 and 2007, approximately 40%, 38% and 38%, respectively, of the Company’s revenues were derived from tests performed for the beneficiaries of the Medicare and Medicaid programs. For the years ended 2009, 2008 and 2007, other than Medicare, no other single contracted or non-contracted payor’s revenue was individually significant.
Stock-Based Compensation
The Company records stock-based compensation expense as required by ASC Topic 718, Compensation. The Company grants share-based awards of stock options and restricted stock units, or RSUs, to employees, directors and Cartesian doctors. The Company adopted ASC Topic 718 using the prospective approach, which applies to new awards and to awards modified, repurchased or cancelled after the required effective date.
In addition, the Company allows qualified employees, excluding directors and Cartesian doctors, to participate in a Company employee stock purchase plan, or ESPP, which provides employees the opportunity to purchase Company common stock at a 15% discount. Generally, the ESPP consists of a two-year offering period with four six-month purchase periods and contains a look-back provision for determining the purchase price. The
76
Table of Contents
GENOPTIX, INC.
NOTES TO CONSOLIDATED FINANCIAL STATEMENTS (CONTINUED)
Company values and accounts for its ESPP as required by ASC Topic 718-50. The objective of the measurement process for the ESPPs with a look-back option is to reasonably measure the fair value of the award at the grant date, the date at which there is a mutual understanding of the terms of the award in exchange for the services already rendered and the employee’s total contributions are known. On that date, the Company becomes contingently obligated to issue equity instruments to the employee. Typically, the grant date is the first business day of each offering period. Employee contributions were generally made through payroll deductions.
The Company previously granted equity instruments to non-employees, excluding Cartesian employees and directors, and recorded expense at the fair value over the related service period as required by ASC Topic 718 and periodically revalued the equity instruments as they vested. During the years ended December 31, 2009, 2008 and 2007, the Company recognized $12,000, $49,000 and $31,000, respectively, of non-employee stock-based compensation. The Company no longer grants these non-employees equity awards. All previously granted awards to these non-employees were fully vested as of December 31, 2009, and all remaining expense was recognized during the year ended December 31, 2009.
The Company recognizes stock-based compensation expense for options and RSUs over the vesting period using the straight-line method. The standard vesting period is four years for most stock option awards and ranges from one to four years for RSU awards. The Company measures stock options and RSU equity awards based on fair value. In addition, the Company records stock-based compensation expense related to the ESPP as required by ASC Topic 718-50. The initial ESPP offering period extended from October 29, 2007 to June 30, 2008, with the first grant occurring in 2008 and continuing with new offerings each six months thereafter. The Company classifies stock-based compensation expense amounts for all awards in the consolidated statements of operations based on the department to which the related employee reports.
The Company values RSU grants at their intrinsic value. In contrast, the Company uses the Black-Scholes valuation model to estimate the grant date fair value of employee stock options and ESPP awards using the following weighted-average assumptions:
| Stock Options | ESPP | |||||||||||||||||||
| Years Ended December 31, | Years Ended December 31, | |||||||||||||||||||
| 2009 | 2008 | 2007 | 2009 | 2008 | ||||||||||||||||
| Grant date fair value (per share) |
$ | 15.64 | $ | 14.63 | $ | 10.78 | $ | 11.22 | $ | 14.61 | ||||||||||
| Assumptions used: |
||||||||||||||||||||
| Expected life of awards (years) |
6.04 | 6.02 | 6.08 | 1.32 | 1.20 | |||||||||||||||
| Risk-free interest rate |
2.16 | % | 2.92 | % | 4.48 | % | 0.68 | % | 2.79 | % | ||||||||||
| Volatility |
50.12 | % | 51.35 | % | 56.71 | % | 47.97 | % | 37.50 | % | ||||||||||
| Dividend yield |
— | — | — | — | — | |||||||||||||||
| Forfeitures |
7.00 | % | 7.00 | % | 7.00 | % | — | — | ||||||||||||
The Company calculated the weighted-average expected life of options using the simplified method as prescribed by ASC Topic 718. This decision was based on the lack of relevant historical data due to the Company’s limited operating experience as a public company. The Company derived the risk-free interest rate assumption from the U.S. Treasury rates for U.S. Treasury zero-coupon bonds with maturities equal to the expected term of the award being valued. In addition, due to the Company’s limited historical data, the estimated volatility incorporates the historical volatility of comparable companies within the Company’s peer group with publicly available share prices. The Company based the assumed dividend yield on its expectation of not paying dividends in the foreseeable future.
77
Table of Contents
GENOPTIX, INC.
NOTES TO CONSOLIDATED FINANCIAL STATEMENTS (CONTINUED)
ASC Topic 718 requires forfeitures to be estimated at the time of grant and revised, if necessary, in subsequent periods if actual forfeitures differ from those estimates. Stock-based compensation expense recognized during the period is based on the value of the portion of awards that is ultimately expected to vest and thus the gross expense is reduced for estimated forfeitures. For the ESPP, the Company does not utilize a separate forfeiture rate since it adjusts ESPP stock-based compensation expense to the greater of the actual employee contributions or original estimate of employee contributions for the remaining participants at the end of each respective purchase period.
The following tables present a summary of the Company’s stock-based compensation as recognized in the consolidated statements of operations:
| Year Ended December 31, 2009 | ||||||||||||
| Options | RSUs | ESPP | Total | |||||||||
| (in thousands) | ||||||||||||
| Cost of revenues |
$ | 2,073 | $ | 881 | $ | 282 | $ | 3,236 | ||||
| Sales and marketing |
1,150 | 78 | 502 | 1,730 | ||||||||
| General and administrative |
2,417 | 2,186 | 348 | 4,951 | ||||||||
| Research and development |
— | — | — | — | ||||||||
| $ | 5,640 | $ | 3,145 | $ | 1,132 | $ | 9,917 | |||||
| Year Ended December 31, 2008 | ||||||||||||
| Options | RSUs | ESPP | Total | |||||||||
| (in thousands) | ||||||||||||
| Cost of revenues |
$ | 1,058 | $ | 459 | $ | 770 | $ | 2,287 | ||||
| Sales and marketing |
465 | — | 1,260 | 1,725 | ||||||||
| General and administrative |
1,307 | 1,033 | 665 | 3,005 | ||||||||
| Research and development |
— | — | — | — | ||||||||
| $ | 2,830 | $ | 1,492 | $ | 2,695 | $ | 7,017 | |||||
| Year Ended December 31, 2007 | ||||||||||||
| Options | RSUs | ESPP | Total | |||||||||
| (in thousands) | ||||||||||||
| Cost of revenues |
$ | 164 | $ | 15 | $ | — | $ | 179 | ||||
| Sales and marketing |
81 | — | — | 81 | ||||||||
| General and administrative |
226 | — | — | 226 | ||||||||
| Research and development |
54 | — | — | 54 | ||||||||
| $ | 525 | $ | 15 | $ | — | $ | 540 | |||||
Income Taxes
ASC Topic 740, Income Taxes, establishes a single model to address accounting for uncertain tax positions. ASC Topic 740 clarifies the accounting for income taxes by prescribing a minimum recognition threshold a tax position is required to meet before being recognized in the consolidated financial statements if that position is “more likely than not” of being sustained upon examination by taxing authorities, based on the technical merits of the position. ASC Topic 740 also provides guidance on derecognition, measurement, classification, interest and penalties, accounting in interim periods, disclosure and transition. The Company will recognize interest and penalties related to unrecognized tax benefits as a component of income tax expense (benefit). The Company has recognized no significant interest or penalties since adoption of ASC Topic 740.
78
Table of Contents
GENOPTIX, INC.
NOTES TO CONSOLIDATED FINANCIAL STATEMENTS (CONTINUED)
As required by ASC Topic 740, income taxes are accounted for under the asset and liability method. Deferred tax assets and liabilities are recognized based on the expected future tax consequences attributable to differences between the financial statement carrying amounts of existing assets and liabilities and their respective tax bases and operating loss and tax credit carryforwards. The Company measures deferred tax assets and liabilities using the enacted tax rates expected to apply to taxable income in the years in which the Company expects to recover or settle those temporary differences. The Company recognizes the effect of a change in tax rates on deferred tax assets and liabilities in income in the period that includes the enactment date. A valuation allowance is established when it is “more likely than not” that the future realization of all or some of the deferred tax assets will not be achieved. As of December 31, 2009, the Company no longer maintained a valuation allowance against deferred tax assets, as the Company concluded it met the “more likely than not” threshold.
Due to the adoption of provisions within ASC Topic 718, the Company recognizes excess tax benefits associated with share-based compensation to stockholders’ equity only when realized. When assessing whether excess tax benefits relating to share-based compensation have been realized, the Company follows the with-and-without approach excluding any indirect effects of the excess tax deductions. Under this approach, excess tax benefits related to share-based compensation are not deemed to be realized until after the utilization of all other tax benefits available to the Company.
Accumulated Other Comprehensive Loss
As required by ASC Topic 220, Comprehensive Income, all components of comprehensive income are reported in the financial statements in the period in which they are recognized. Comprehensive income is defined as the change in equity during a period from transactions and other events and circumstances from non-owner sources. Net income and other comprehensive loss, including unrealized gains and losses on investment securities, shall be reported net of their related tax effect to arrive at accumulated other comprehensive loss.
Net Income Per Share
Prior to the Company’s initial public offering, or IPO, net income per share was computed as required by provisions within ASC Topic 260, Earnings per share, which established standards regarding the computation of earnings per share, or EPS, by companies that have issued securities other than common stock that contractually entitle the holder to participate in dividends and earnings of the Company. ASC Topic 260 requires earnings for the period, after deduction of preferred stock dividends, to be allocated between the common and preferred stockholders based on their respective rights to receive dividends, whether or not declared. Basic net income per share is then calculated by dividing income allocable to common stockholders (after the reduction for any preferred stock dividends assuming current income for the period had been distributed) by the weighted-average number of shares of common stock outstanding for the period, net of shares subject to repurchase by the Company. ASC Topic 260 does not require the presentation of basic and diluted net income per share for securities other than common stock; therefore, the following net income per share amounts only pertain to the Company’s common stock. The Company calculated diluted net income per share under the as-if-converted method unless the conversion of the preferred stock was anti-dilutive to basic net income per share. To the extent preferred stock was anti-dilutive; the Company calculated diluted net income per share under the two-class method.
Subsequent to the Company’s IPO, net income per share continued to be computed as required by provisions within ASC Topic 260. Basic EPS is calculated by dividing the net income or loss allocable to common stockholders by the weighted-average number of common shares outstanding for the period, net of shares subject to repurchase by the Company and treasury stock, without consideration for common stock equivalents. Diluted EPS is computed by dividing the net income allocable to common stockholders by the
79
Table of Contents
GENOPTIX, INC.
NOTES TO CONSOLIDATED FINANCIAL STATEMENTS (CONTINUED)
weighted-average number of common shares outstanding for the period and the weighted-average number of dilutive common stock equivalents outstanding for the period determined using the treasury-stock method. For purposes of this calculation, common stock subject to repurchase by the Company, options, RSUs and ESPP shares are considered to be common stock equivalents and are only included in the calculation of diluted earnings per share when their effect is dilutive.
As a result of the completion of the Company’s IPO during the fourth quarter of 2007, the Company allocated income between the preferred and common stockholders on a pro-rata basis over the number of days of the respective periods presented for purposes of determining the income allocable to common stockholders under each of the methods noted above.
The net income per share amounts presented below are based on share and net income amounts that are not rounded and, as such, may result in minor differences from the amounts computed based on the equivalent information presented in thousands.
| Years Ended December 31, | ||||||||||
| 2009 | 2008 | 2007 | ||||||||
| (in thousands, except per share data) | ||||||||||
| Numerator: |
||||||||||
| Net income |
$ | 30,634 | $ | 31,356 | $ | 13,353 | ||||
| Income allocable to preferred stockholders |
— | — | (10,036 | ) | ||||||
| Net income allocable to common stockholders |
$ | 30,634 | $ | 31,356 | $ | 3,317 | ||||
| Denominator: |
||||||||||
| Weighted average shares of common stock outstanding, net—basic |
16,978 | 16,399 | 2,756 | |||||||
| Dilutive effect of common equivalent shares |
976 | 1,254 | 1,490 | |||||||
| Weighted average shares of common stock outstanding, net—diluted |
17,954 | 17,653 | 4,246 | |||||||
| Net income per share: |
||||||||||
| Basic |
$ | 1.80 | $ | 1.91 | $ | 1.20 | ||||
| Diluted |
$ | 1.71 | $ | 1.78 | $ | 0.78 | ||||
The following table presents a summary of the Company’s weighted-average, common equivalent shares of potentially dilutive securities not included in the calculation of diluted net income per share due to its anti-dilutive nature:
| Years Ended December 31, | ||||||
| 2009 | 2008 | 2007 | ||||
| (in thousands) | ||||||
| Preferred stock |
— | — | 9,249 | |||
| Common stock options and restricted stock units |
408 | 129 | — | |||
80
Table of Contents
GENOPTIX, INC.
NOTES TO CONSOLIDATED FINANCIAL STATEMENTS (CONTINUED)
Pro Forma Net Income Per Share
Upon the completion of the Company’s IPO on November 2, 2007, all of the Company’s previously outstanding preferred shares converted into approximately 11.0 million shares of common stock. As a result of the issuance of these shares of common stock, there is a lack of comparability in both the basic and diluted net income per share amounts for the periods presented above. In order to provide a more relevant measure of the Company’s operating results, a pro forma net income per share calculation has been included below. The shares used to compute pro forma basic and diluted net income per share include the assumed conversion of all outstanding shares of preferred stock into shares of common stock using the as-if converted method as of the beginning of each period presented or the date of issuance, if later.
| Years Ended December 31, | |||||||||
| 2009 | 2008 | Pro Forma 2007 | |||||||
| (in thousands, except per share data) | |||||||||
| Numerator: |
|||||||||
| Pro forma net income allocable to common stockholders |
$ | 30,634 | $ | 31,356 | $ | 13,353 | |||
| Denominator: |
|||||||||
| Weighted average shares of common stock outstanding, net |
16,978 | 16,399 | 2,756 | ||||||
| Adjustments to reflect the weighted average effect of the assumed conversion of convertible preferred stock |
— | — | 9,249 | ||||||
| Pro forma weighted average shares of common stock outstanding, net—basic |
16,978 | 16,399 | 12,005 | ||||||
| Dilutive effect of common equivalent shares |
976 | 1,254 | 1,549 | ||||||
| Pro forma weighted average shares of common stock outstanding, net—diluted |
17,954 | 17,653 | 13,554 | ||||||
| Pro forma net income per share: |
|||||||||
| Basic |
$ | 1.80 | $ | 1.91 | $ | 1.11 | |||
| Diluted |
$ | 1.71 | $ | 1.78 | $ | 0.99 | |||
Recent Accounting Pronouncements
In October 2009, the Financial Accounting Standards Board, or FASB, issued ASU No. 2009-13, Multiple-Deliverable Revenue Arrangements, (amendments to ASC Topic 605), or ASU No. 2009-13. ASU No. 2009-13 establishes a selling price hierarchy for determining the selling price of a deliverable. The selling price used for a deliverable will be based on vender-specific objective evidence if available, third party evidence if vendor-specific objective evidence is not available, or estimated selling price if neither vendor-specific objective evidence nor third party evidence is available. This standard eliminates the residual method of revenue allocation and requires revenue to be allocated using the relative selling price method. This standard is effective for fiscal years beginning after June 15, 2010 and may be applied retrospectively or prospectively for new or materially modified arrangements. Early adoption of ASU No. 2009-13 is permitted. The Company is currently evaluating the potential impact of ASU No. 2009-13 on its consolidated results of operations and financial position.
In August 2009, the Company adopted ASU No. 2009-05, Measuring Liabilities at Fair Value, which provides clarification for circumstances where a quoted market price in an active market for an identical liability is not available. In such circumstances, a reporting entity must measure fair value of the liability using one of the
81
Table of Contents
GENOPTIX, INC.
NOTES TO CONSOLIDATED FINANCIAL STATEMENTS (CONTINUED)
following techniques: 1) the quoted price of the identical liability when traded as an asset; 2) quoted prices for similar liabilities or similar liabilities when traded as assets; or 3) another valuation technique, such as a present value technique or the amount that the reporting entity would pay to transfer the identical liability or would receive to enter into the identical liability that is consistent with the provisions of ASC Topic 820. The adoption of this new standard did not have a material impact on the Company’s consolidated results of operations and financial position.
In June 2009, the Company adopted FASB guidance establishing only two levels of U.S. Generally Accepted Accounting Principles, or GAAP, authoritative and non-authoritative. The FASB Accounting Standards Codification, or the Codification, became the source of authoritative, non-governmental GAAP, except for rules and interpretive releases of the SEC, which are sources of authoritative GAAP for SEC registrants. All other non-grandfathered, non-SEC accounting literature not included in the Codification will become non-authoritative. This standard was effective for financial statements issued for interim and annual financial periods ending after September 15, 2009. As the Codification was not intended to change or alter existing GAAP, the adoption of this guidance did not have a material impact on the Company’s consolidated results of operations and financial position.
In May 2009, the Company adopted FASB issued guidance for the accounting for and disclosures of subsequent events that occur after the balance sheet date but before financial statements are issued or are available to be issued. The guidance is included in FASB ASC 855, Subsequent Events, and was effective for interim or annual financial periods ending after June 15, 2009. This guidance applies to both interim financial statements and annual financial statements. The adoption of this guidance did not have a material impact on the Company’s consolidated results of operations and financial position.
In April 2009, the Company adopted FASB issued guidance requiring disclosure about the fair value of financial instruments for interim reporting periods of publicly traded companies as well as in annual financial statements. This guidance is included in ASC Topic 825, Financial Instruments, and was effective for interim reporting periods ending after June 15, 2009 with early adoption permitted. The adoption of this guidance did not have a material impact on the Company’s consolidated results of operations and financial position.
In April 2009, the Company adopted FASB issued guidance amending the other-than-temporary impairment guidance for debt securities to make the guidance more operational and to improve the presentation and disclosure of other-than-temporary impairments on debt and equity securities in the financial statements. This guidance did not amend existing recognition and measurement guidance related to other-than-temporary impairments of equity securities. This guidance became effective for interim and annual reporting periods ending after June 15, 2009. The adoption of this guidance did not have a material impact on the Company’s consolidated results of operations and financial position.
In April 2009, the Company adopted FASB issued guidance for estimating fair value when the volume and level of activity for the asset or liability have significantly decreased. The guidance is included in ASC Topic 820 and also includes guidance on identifying circumstances that indicate a transaction is not orderly. This guidance became effective for interim and annual reporting periods ending after June 15, 2009 and was applied prospectively. The adoption of this guidance did not have a material impact on the Company’s consolidated results of operations and financial position.
2. Balance Sheet Detail
Investment Securities
Short-term investment securities consist of municipal securities, government-sponsored enterprise securities, corporate debt securities, U.S. treasury securities and certificates of deposit. As of December 31, 2009, the Company held one remaining auction rate security, or ARS, with a fair value of $3.8 million. The ARS had a
82
Table of Contents
GENOPTIX, INC.
NOTES TO CONSOLIDATED FINANCIAL STATEMENTS (CONTINUED)
cost basis of $4.9 million, which is net of a temporary impairment of $1.1 million as of December 31, 2009, due to the illiquidity of the investment security (see Note 3 in these notes to consolidated financial statements). As such, the Company has classified the ARS as a long-term investment security. ARS are collateralized debt instruments with long-term contractual maturities that are structured with short-term holding periods. They provide liquidity through a Dutch auction process that resets the applicable interest rate at pre-determined intervals, typically every 7 to 35 days. The length of each holding period is determined at the original issuance of the ARS. The Company can sell at each auction at par, assuming there are buyers for the ARS at such auction. In order for the auction to be successful, demand in the marketplace must meet or exceed the supply. If an auction is unsuccessful, the interest rate on the security resets at a predetermined auction failure rate. An investor can continue to hold the investment security until the next auction date or attempt to sell in the secondary market, usually at a sizable discount. The ARS has a contractual maturity in 2038, with a 35-day holding period between scheduled auctions. The last auction occurred on September 10, 2008, prior to the bankruptcy of the broker/dealer that managed the auction.
The following tables present a summary of the Company’s available-for-sale investment securities as reported on the consolidated balance sheets:
| December 31, 2009 | |||||||||||||
| Amortized Cost |
Gross Unrealized | Aggregate Fair Value | |||||||||||
| Gains | Losses | ||||||||||||
| (in thousands) | |||||||||||||
| Short-term investment securities: |
|||||||||||||
| Municipal securities |
$ | 52,619 | $ | 212 | $ | — | $ | 52,831 | |||||
| Government-sponsored enterprise securities |
45,677 | 39 | (12 | ) | 45,704 | ||||||||
| Corporate debt securities |
7,100 | 43 | (1 | ) | 7,142 | ||||||||
| U.S. treasury securities |
6,842 | — | (3 | ) | 6,839 | ||||||||
| Certificates of deposit |
530 | 3 | — | 533 | |||||||||
| $ | 112,768 | $ | 297 | $ | (16 | ) | $ | 113,049 | |||||
| Long-term investment security: |
|||||||||||||
| Auction rate security |
$ | 4,925 | $ | — | $ | (1,139 | ) | $ | 3,786 | ||||
| December 31, 2008 | |||||||||||||
| Amortized Cost |
Gross Unrealized | Aggregate Fair Value | |||||||||||
| Gains | Losses | ||||||||||||
| (in thousands) | |||||||||||||
| Short-term investment securities: |
|||||||||||||
| Government-sponsored enterprise securities |
$ | 38,999 | $ | 279 | $ | (2 | ) | $ | 39,276 | ||||
| Corporate debt securities |
25,918 | 55 | (419 | ) | 25,554 | ||||||||
| $ | 64,917 | $ | 334 | $ | (421 | ) | $ | 64,830 | |||||
| Long-term investment security: |
|||||||||||||
| Auction rate security |
$ | 5,000 | $ | — | $ | (1,225 | ) | $ | 3,775 | ||||
As of December 31, 2009, the gross unrealized losses of $16,000 on short-term investment securities represents temporary impairments on debt securities of multiple issuers, including one corporate debt security that has been in a loss position for more than 12 consecutive months. The gross unrealized loss related to this one security amounted to $1,000 as of December 31, 2009, which represented a decrease from the unrealized loss of $138,000 recorded as of December 31, 2008. The loss related to this security was due to the interest rate
83
Table of Contents
GENOPTIX, INC.
NOTES TO CONSOLIDATED FINANCIAL STATEMENTS (CONTINUED)
environment for this security, which the Company believes is improving based on increases in the fair market value of the security over the previous 12 months as it nears maturity in the first quarter of 2010. The Company believes it does not need to sell nor intends to sell before recovery of par value upon maturity. The Company’s remaining 18 investment securities in loss positions have been in such positions for less than 12 consecutive months and were primarily caused by negative changes in the overall economic environment. These investment securities all have contractual maturities of less than 36 months and are expected to mature at par value. The Company recorded a temporary impairment relating to its single ARS of approximately $1.1 million as of December 31, 2009 against a cost basis of $4.9 million, as compared to a temporary impairment of $1.2 million as of December 31, 2008 against a cost basis of $5.0 million. The unrealized loss, net of deferred tax, is included in accumulated other comprehensive loss. See Note 3 in these notes to consolidated financial statements for discussion of fair value measurements. The Company had no realized losses on sales of investment securities for the year ended December 31, 2009, as compared to a realized loss of $66,000 for the year ended December 31, 2008 and no realized loss for the year ended December 31, 2007.
The following table presents a summary of the Company’s value of available-for-sale investment securities by contractual maturity:
| December 31, 2009 | ||||||
| Amortized Cost |
Aggregate Fair Value | |||||
| (in thousands) | ||||||
| Contractual maturity: |
||||||
| One year or less |
$ | 69,696 | $ | 69,796 | ||
| One to two years |
24,013 | 24,189 | ||||
| Two to three years |
5,514 | 5,519 | ||||
| Greater than three years |
18,470 | 17,331 | ||||
| $ | 117,693 | $ | 116,835 | |||
Although certain municipal securities and ARS have contractual maturities up to 40 years, the effective maturities for the Company’s available-for-sale investment securities do not exceed 35 months.
Property and Equipment
The following table presents a summary of the Company’s property and equipment as reported on the consolidated balance sheets:
| Estimated Useful Life |
December 31, | |||||||||
| 2009 | 2008 | |||||||||
| (in thousands) | ||||||||||
| Machinery and equipment |
5 | $ | 5,770 | $ | 3,817 | |||||
| Computers |
3 | 4,996 | 3,668 | |||||||
| Furniture and fixtures |
5 | 1,868 | 1,712 | |||||||
| Leasehold improvements |
Lesser of remaining lease |
6,568 | 5,821 | |||||||
| Construction in process |
— | 1,186 | 599 | |||||||
| Total property and equipment |
20,388 | 15,617 | ||||||||
| Accumulated depreciation | (6,562 | ) | (3,428 | ) | ||||||
| Total property and equipment, net |
$ | 13,826 | $ | 12,189 | ||||||
84
Table of Contents
GENOPTIX, INC.
NOTES TO CONSOLIDATED FINANCIAL STATEMENTS (CONTINUED)
Depreciation expense was $3.8 million, $1.4 million and $580,000 for the years ended December 31, 2009, 2008 and 2007, respectively.
3. Fair Value Measurements
Valuation techniques used to measure fair value under ASC Topic 820 must maximize the use of observable inputs and minimize the use of unobservable inputs. The standard describes a fair value hierarchy based on three levels of inputs, of which the first two are considered observable and the last unobservable, which may be used to measure fair value, as follows:
| Level 1 | Real-time quoted prices in active exchange markets for identical assets or liabilities |
| Level 2 | Other significant and readily available observable inputs for comparable instruments, either directly or indirectly, such as quoted prices for similar assets or liabilities; quoted prices in markets that are not active; or other inputs that are observable or can be corroborated by observable market data for substantially the full term of the assets or liabilities |
| Level 3 | Unobservable inputs that are supported by little or no market activity and that are significant to the fair value of the assets or liabilities |
The following table presents a summary of the Company’s financial instruments subject to ASC Topic 820 measured on a recurring basis:
| Balance at December 31, 2009 |
Fair Value Measurements | |||||||||||
| Quoted Prices in Active Markets for Identical Assets (Level 1) |
Significant Other Observable Inputs (Level 2) |
Significant Unobservable Inputs (Level 3) | ||||||||||
| (in thousands) | ||||||||||||
| Short-term investment securities: |
||||||||||||
| Municipal securities |
$ | 52,831 | $ | — | $ | 52,831 | $ | — | ||||
| Government-sponsored enterprise securities |
45,704 | — | 45,704 | — | ||||||||
| Corporate debt securities |
7,142 | — | 7,142 | — | ||||||||
| U.S. treasury securities |
6,839 | 6,839 | — | — | ||||||||
| Certificates of deposit |
533 | 533 | — | — | ||||||||
| $ | 113,049 | $ | 7,372 | $ | 105,677 | $ | — | |||||
| Long-term investment security: |
||||||||||||
| Auction rate security |
$ | 3,786 | $ | — | $ | — | $ | 3,786 | ||||
The Company’s level 1 financial instruments consist of a certificate of deposit that matures in greater than 90 days from date of purchase and is fully insured by the Federal Deposit Insurance Corporation and U.S. treasury securities.
The Company’s level 2 financial instruments are valued using market prices on less active markets. These valuations use pricing models that vary by asset class, incorporating such data as available trade information for similar securities, expected cash flows and credit information.
The Company’s level 3 financial instruments consist of an ARS issued by a municipality, which is underwritten by an insurance agency. ARS are collateralized debt instruments with long-term contractual maturities that are structured with short-term holding periods. They provide liquidity through a Dutch auction
85
Table of Contents
GENOPTIX, INC.
NOTES TO CONSOLIDATED FINANCIAL STATEMENTS (CONTINUED)
process that resets the applicable interest rate at pre-determined intervals, typically every 7 to 35 days. The length of each holding period is determined at the original issuance of the ARS. The Company can sell at each auction at par, assuming there are buyers for the ARS at such auction. In order for the auction to be successful, demand in the marketplace must meet or exceed the supply. If an auction is unsuccessful, the interest rate on the security resets at a predetermined auction failure rate. An investor can continue to hold the investment security until the next auction date or attempt to sell in the secondary market, usually at a sizable discount. The ARS has a contractual maturity in 2038, with a 35-day holding period between scheduled auctions. Although unsuccessful, the last auction occurred on September 10, 2008, prior to the filing of bankruptcy by the broker/dealer that managed the auction. This investment security has been valued as level 3 with unobservable inputs since its auctions began failing in February 2008. As of December 31, 2009, the ARS was rated “BAA1” by Moody’s Investors Service and “A” by Standard & Poor’s based on the underwriter’s guarantee. The funds associated with this security will not be accessible until the issuer redeems the ARS through a debt restructure, a buyer is found outside of the auction process, or the ARS matures in 2038.
The Company has evaluated this ARS based on interest rate spreads, credit quality, underlying assets of the issuer and underwriter, likelihood of a successful auction or redemption in the near term and the ability of the issuer to restructure the debt in the current credit environment. The Company assumed that the issuer and underwriter would not be able to satisfy its debt obligation until the credit market would provide a debt restructuring opportunity (within the next 4 years) and applied a 1.0% liquidity discount. The issuer of the ARS continues to make interest payments as scheduled and has made two partial redemptions during the year ended December 31, 2009, of which the Company benefited from one due to the lottery system used to distribute the redemption proceeds. This redemption resulted in cash proceeds to the Company of $75,000 during the year ended December 31, 2009. As a result of the internal valuation, the Company has recorded a temporary impairment of approximately $1.1 million as of December 31, 2009, against a cost basis of $4.9 million, as compared to a temporary impairment of $1.2 million as of December 31, 2008, against a cost basis of $5.0 million.
The following table presents a summary of the Company’s changes in fair value of level 3 financial assets:
| Level 3 Auction Rate Security |
||||
| (in thousands) | ||||
| Balance at December 31, 2008 |
$ | 3,775 | ||
| Transfers in (out) of level 3 |
— | |||
| Earned income |
— | |||
| Total realized/unrealized losses: |
||||
| Included in earnings |
— | |||
| Included in accumulated other comprehensive loss |
86 | |||
| Purchases, (sales), issuances, (settlements), (redemptions), net |
(75 | ) | ||
| Balance at December 31, 2009 |
$ | 3,786 | ||
4. Stockholders’ Equity
Equity Incentive Plans
In connection with the Company’s IPO, the 2007 Equity Incentive Plan, or the 2007 Plan, the 2007 Non-Employee Directors’ Stock Option Plan, or 2007 Directors’ Plan, and the 2007 ESPP became effective. Prior to the IPO, all options outstanding were governed by the Company’s 2001 Equity Incentive Plan, as amended, or 2001 Plan. The 2001 Plan, 2007 Plan and 2007 Directors’ Plan are collectively referred to as the
86
Table of Contents
GENOPTIX, INC.
NOTES TO CONSOLIDATED FINANCIAL STATEMENTS (CONTINUED)
“Equity Incentive Plans, or EIP.” During the year ended December 31, 2009, all issued shares of common stock were new shares from the Equity Incentive Plans from either stock exercises or releases of RSUs, or were from ESPP purchases through employee contributions.
2001 Equity Incentive Plan
Under the 2001 Plan, options are generally exercisable for up to 10 years from the date of grant and vest over a four-year period, with 25% of the grant vesting on the first anniversary of the vesting base date and the remaining 75% vesting in equal monthly installments over the remaining three years. Since adoption of the 2007 Plan in October 2007, the Company has made no further grants from the 2001 Plan.
2007 Equity Incentive Plan
The 2007 Plan provides for the grant of incentive stock options, nonstatutory stock options, RSU awards, restricted stock unit awards, stock appreciation rights, performance-based stock awards, and other forms of equity compensation, or collectively, stock awards. In addition, the 2007 Plan provides for the grant of performance cash awards. Options are generally exercisable for up to 10 years from the date of grant and generally vest over a four-year period, with 25% of the grant vesting on the first anniversary of the vesting base date and the remaining 75% vesting in equal monthly installments over the remaining three years. RSUs are granted requiring no cash payments from employees, directors or Cartesian doctors and generally vest over a one to four year period. Upon vesting of RSUs, the RSU issuance of the underlying shares of common stock can be delayed under certain circumstances. The aggregate number of shares of common stock that was initially authorized for issuance pursuant to stock awards under the 2007 Plan was 1.5 million shares, plus the 75,000 shares that remained available for future issuance under the 2001 Plan as of the effective date of the 2007 Plan. In addition, the number of shares of common stock reserved for issuance automatically increases (i) on January 1 of each calendar year, from January 1, 2008 through January 1, 2017, by the least of (a) 3% of the total number of shares of the Company’s common stock outstanding on December 31 of the preceding calendar year, (b) 750 shares, or (c) a number determined by the Company’s board of directors that is less than (a) or (b) and (ii) from time to time by shares that are issuable pursuant to options under the 2001 Plan that are forfeited or expire. The exercise price for an incentive or a nonstatutory stock option cannot be less than 100% of the fair market value of the Company’s common stock on the date of grant.
2007 Non-Employee Directors’ Stock Option Plan
The 2007 Directors’ Plan provides for the automatic grant of nonstatutory stock options to purchase shares of the Company’s common stock to the Company’s non-employee directors and will terminate at the discretion of the Company’s board of directors. An aggregate of 250,000 shares of the Company’s common stock was initially reserved for issuance under the 2007 Directors’ Plan. This amount increases automatically annually on January 1, from 2008 until 2017, by an aggregate number of shares of the Company’s common stock equal to the number of shares subject to options granted as initial grants and annual grants under the 2007 Directors’ Plan during the immediately preceding year or a lesser amount as determined by the Company’s board of directors. The exercise price of the options granted under the 2007 Directors’ Plan will be equal to 100% of the fair market value of the Company’s common stock on the date of grant with initial grants vesting in equal monthly installments over three years after the date of grant and annual grants vesting in equal monthly installments over 12 months after the date of grant. The term of these stock options is ten years.
87
Table of Contents
GENOPTIX, INC.
NOTES TO CONSOLIDATED FINANCIAL STATEMENTS (CONTINUED)
The following table presents a summary of the Company’s RSU and stock option activity under the Equity Incentive Plans:
| Equity Incentive Plans |
RSUs Outstanding |
Options Outstanding | ||||||||||
| Shares Available for Issuance |
Number of Shares |
Number of Shares |
Weighted- Average Exercise Price (Per Share) | |||||||||
| (in thousands, except per share amounts) | ||||||||||||
| Balance at December 31, 2008 |
1,389 | 145 | 1,991 | $ | 12.23 | |||||||
| Additional shares authorized |
547 | — | — | — | ||||||||
| Granted/issued |
(826 | ) | 131 | 695 | 31.52 | |||||||
| Exercised/released |
— | (74 | ) | (425 | ) | 4.01 | ||||||
| Shares withheld for payment of taxes |
17 | (17 | ) | — | — | |||||||
| Forfeited/cancelled |
135 | (9 | ) | (126 | ) | 29.18 | ||||||
| Repurchases |
— | — | — | — | ||||||||
| Balance at December 31, 2009 |
1,262 | 176 | 2,135 | $ | 19.14 | |||||||
The following tables present a summary of the Company’s stock-based compensation expense disclosures:
| Year Ended December 31, 2009 | |||||||||
| Options | RSUs | ESPP | |||||||
| (in thousands, except per share amounts) | |||||||||
| Weighted-average grant date fair value |
$ | 19.14 | $ | 32.22 | $ | 17.14 | |||
| Total intrinsic value of shares exercised/released/purchased |
$ | 13,034 | $ | 2,889 | $ | 3,187 | |||
| Total fair value of shares vested during the year |
$ | 6,031 | $ | 2,889 | $ | 2,204 | |||
| Year Ended December 31, 2008 | |||||||||
| Options | RSUs | ESPP | |||||||
| (in thousands, except per share amounts) | |||||||||
| Weighted-average grant date fair value |
$ | 12.23 | $ | 29.29 | $ | 15.22 | |||
| Total intrinsic value of shares exercised/released/purchased |
$ | 11,084 | $ | 744 | $ | 3,123 | |||
| Total fair value of shares vested during the year |
$ | 1,267 | $ | 744 | $ | 1,945 | |||
| Year Ended December 31, 2007 | |||||||||
| Options | RSUs | ESPP | |||||||
| (in thousands, except per share amounts) | |||||||||
| Weighted-average grant date fair value |
$ | 28.46 | $ | 29.33 | $ | — | |||
| Total intrinsic value of shares exercised/released/purchased |
$ | 1,068 | $ | — | $ | — | |||
| Total fair value of shares vested during the year |
$ | 497 | $ | — | $ | — | |||
88
Table of Contents
GENOPTIX, INC.
NOTES TO CONSOLIDATED FINANCIAL STATEMENTS (CONTINUED)
The following table presents a summary of the Company’s EIP option and RSU disclosures as of December 31, 2009:
| Options | RSUs | ||||||||||||||||
| Number of Shares |
Weighted Average Exercise Price (Per Share) |
Weighted Average Remaining Contractual Term (Years) |
Aggregate Intrinsic Value |
Number of Shares |
Weighted Average Remaining Contractual Term (Years) |
Aggregate Intrinsic Value | |||||||||||
| (in thousands, except per share amounts) | |||||||||||||||||
| Outstanding |
2,135 | $ | 19.14 | 7.52 | $ | 35,075 | 176 | 1.17 | $ | 6,263 | |||||||
| Fully vested and expected to vest |
1,967 | $ | 18.39 | 7.42 | $ | 33,793 | 152 | 0.83 | $ | 5,400 | |||||||
| Exercisable |
1,089 | $ | 9.91 | 6.27 | $ | 27,915 | — | — | — | ||||||||
The following table presents a summary of the Company’s nonvested stock options and activity:
| Number of Shares |
Weighted-Average Grant Date Fair Value | |||||
| (in thousands) | ||||||
| Nonvested at December 31, 2008 |
1,034 | $ | 12.28 | |||
| Granted |
695 | 31.52 | ||||
| Vested |
(550 | ) | 10.97 | |||
| Forfeited/cancelled |
(126 | ) | 29.18 | |||
| Nonvested at December 31, 2009 |
1,053 | $ | 14.88 | |||
As of December 31, 2009, 2008 and 2007, the Company had repurchasable stock options of 2,000 shares, 25,000 shares and 64,000 shares, respectively, subject to repurchase for an aggregate exercise price of approximately $16,000, $33,000 and $34,000, respectively.
The following table presents a summary of the Company’s unrecognized compensation expense related to outstanding unvested stock-based awards, adjusted for estimated forfeitures but before income taxes:
| December 31, 2009 | |||||||||
| Options | RSUs | ESPP | |||||||
| Average remaining expense life (years) |
2.67 | 1.92 | 1.44 | ||||||
| Unrecognized compensation expense (in thousands) |
$ | 13,444 | $ | 3,665 | $ | 245 | |||
Employee Stock Purchase Plan
The ESPP initially authorized the issuance of 500,000 shares of the Company’s common stock pursuant to purchase rights granted to the Company’s employees. The number of shares of the Company’s common stock reserved for issuance automatically increases on January 1 of each calendar year, from January 1, 2008 through January 1, 2017, by the least of (a) 1% of the total number of shares of the Company’s common stock outstanding on December 31 of the preceding calendar year, (b) 250,000 shares or (c) a number determined by the Company’s board of directors that is less than (a) or (b). The ESPP is implemented through a series of offerings of purchase rights to eligible employees. Under the ESPP, the Company may specify offerings with duration of not more than 27 months, and may specify shorter purchase periods within each offering. Each offering has one or more purchase dates on which shares of the Company’s common stock will be purchased for employees participating in the offering. An offering may be terminated under certain circumstances. Generally,
89
Table of Contents
GENOPTIX, INC.
NOTES TO CONSOLIDATED FINANCIAL STATEMENTS (CONTINUED)
all regular employees, including executive officers, employed by the Company may participate in the ESPP and may contribute up to 15% of their earnings, subject to certain limitations, for the purchase of the Company’s common stock under the ESPP. Unless otherwise determined by the Company’s board of directors, common stock will be purchased for accounts of employees participating in the ESPP at a price per share equal to the lower of (a) 85% of the fair market value of a share of the Company’s common stock on the first date of an offering or (b) 85% of the fair market value of a share of the Company’s common stock on the date of purchase. During the first purchase period, employees were permitted to contribute via cash payment up to the end of the purchase period. Employees can withdraw from a purchase period at any time excluding the 10 days prior to the purchase date. For the year ended December 31, 2009, utilizing employee withheld funds, the Company purchased approximately 95,000 shares of common stock for $1.6 million as compared to 96,000 shares of common stock for $1.5 million for the year ended December 31, 2008.
The following table presents a summary of the Company’s activity under the ESPP:
| ESPP | ||||||
| Shares Available for Issuance |
Weighted Average Purchase Price Per Share | |||||
| (in thousands, except per share amounts) | ||||||
| Balance at December 31, 2008 |
565 | |||||
| Additional shares reserved |
167 | |||||
| Purchased |
(95 | ) | $ | 17.14 | ||
| Balance at December 31, 2009 |
637 | |||||
Initial Public Offering
On November 2, 2007, the Company completed its IPO whereby it sold 4.7 million shares of common stock at $17.00 per share and received net proceeds of $72.5 million (after underwriting discounts and commissions and offering costs). The sale of these shares included the underwriter’s exercise in full of their option to purchase 450,000 additional shares from the Company. In connection with the closing of the IPO, the 52.4 million then outstanding shares of convertible preferred stock automatically converted into an aggregate of approximately 11.0 million shares of common stock.
Warrants
During the year ended December 31, 2008, warrants to purchase an aggregate of 86,000 shares of common stock were exercised in exchange for 77,000 shares of common stock in conjunction with net share settlements and cash payments of $35,000. As of December 31, 2009 and 2008, respectively, no warrants were outstanding.
5. Commitments and Contingencies
Operating Leases
As of December 31, 2009, the Company leased office and laboratory space and certain equipment under various non-cancellable operating leases. Rent expense under the Company’s operating leases totaled $3.2 million, $2.1 million and $1.3 million for years ended December 31, 2009, 2008 and 2007, respectively. The Company recognizes operating lease rent expense on a straight-line basis over the lease term. See Note 10 accompanying these notes to the consolidated financial statements for discussion of the operating lease agreement entered into in January 2010.
90
Table of Contents
GENOPTIX, INC.
NOTES TO CONSOLIDATED FINANCIAL STATEMENTS (CONTINUED)
In June 2009, the Company entered into a six-year operating lease beginning June 1, 2009 for an additional 44,000 square feet of laboratory space in Carlsbad, California, into which the Company will expand current laboratory facilities following the substantial completion of improvements, estimated to occur during the second quarter 2010. The lease contains one four-year extension option and is subject to annual rent increases. The non-cancellable future minimum payments under the lease total approximately $451,000, $465,000, $479,000, $493,000, $608,000, and $256,000 in 2010, 2011, 2012, 2013, 2014, and thereafter, respectively. See Note 10 in these notes to consolidated financial statements for discussion of subsequent events.
The following table presents a summary of the Company’s future minimum lease payments under non-cancellable leases as of December 31, 2009:
| Operating Leases | |||
| (in thousands) | |||
| 2010 |
$ | 3,694 | |
| 2011 |
3,736 | ||
| 2012 |
3,090 | ||
| 2013 |
2,410 | ||
| 2014 |
2,578 | ||
| Thereafter |
256 | ||
| Total future minimum lease payments |
$ | 15,764 | |
Contingencies
The Company is reimbursed for services provided to patients under certain programs administered by governmental agencies. Laws and regulations governing the Medicare and Medicaid programs are complex and subject to interpretation. The Company believes that it is in compliance in all material respects with all applicable laws and regulations and it is not aware of any significant pending or threatened claims involving allegations of potential wrongdoing. While no such regulatory inquiries have been made, compliance with such laws and regulations can be subject to future government review and interpretation as well as significant regulatory action including fines, penalties and exclusion from the Medicare and Medicaid programs.
The Company is insured for medical malpractice risks on a claims-made basis under certain professional liability insurance policies. No malpractice claims were made against the Company as of December 31, 2009.
6. Income Taxes
The following table presents a summary of the Company’s provision for income taxes:
| Years Ended December 31, | |||||||||||
| 2009 | 2008 | 2007 | |||||||||
| (in thousands) | |||||||||||
| Current: |
|||||||||||
| Federal |
$ | 19,339 | $ | 3,419 | $ | 263 | |||||
| State |
5,590 | 1,570 | 176 | ||||||||
| Foreign |
16 | — | — | ||||||||
| 24,945 | 4,989 | 439 | |||||||||
| Deferred: |
|||||||||||
| Federal |
(849 | ) | (4,102 | ) | — | ||||||
| State |
634 | (2,577 | ) | — | |||||||
| (215 | ) | (6,679 | ) | — | |||||||
| Income tax expense (benefit) |
$ | 24,730 | $ | (1,690 | ) | $ | 439 | ||||
91
Table of Contents
GENOPTIX, INC.
NOTES TO CONSOLIDATED FINANCIAL STATEMENTS (CONTINUED)
The following table presents a summary of the Company’s effective tax rate on income taxes reconciled to the statutory federal income tax:
| Years Ended December 31, | |||||||||
| 2009 | 2008 | 2007 | |||||||
| Tax computed at the federal statutory rate |
35.0 | % | 35.0 | % | 35.0 | % | |||
| State income tax, net of federal benefit |
6.7 | % | 7.1 | % | 6.4 | % | |||
| Stock-based compensation |
1.1 | % | 4.0 | % | 0.9 | % | |||
| Tax attribute adjustment |
0.0 | % | (2.1 | %) | 19.2 | % | |||
| Permanent differences and other |
1.8 | % | 0.6 | % | 0.3 | % | |||
| Change in valuation allowance |
0.0 | % | (50.3 | %) | (58.6 | %) | |||
| Actual effective tax rate |
44.6 | % | (5.7 | %) | 3.2 | % | |||
As of December 31, 2009, the Company had $7.2 million in net deferred tax assets. As of December 31, 2008, although realization was not assured, the Company believed it was “more likely than not” that it would be able to realize its net deferred tax assets through the ordinary course of business and expected future taxable income. Therefore, the Company recorded a $14.9 million tax benefit representing the release of the valuation allowance against the net deferred tax assets during the year ended December 31, 2008. Similarly, the Company had $14.9 million in net deferred tax assets as of December 31, 2007 that were offset entirely by a valuation allowance, as the Company was unable to conclude that it was “more likely than not” that such deferred tax assets would be realized.
Deferred tax assets and liabilities are determined based on differences between financial reporting and tax bases of assets and liabilities, and are measured using the enacted tax rates and laws that will be in effect when the differences are expected to reverse. Significant components of the deferred tax assets are as follows:
| December 31, | ||||||||
| 2009 | 2008 | |||||||
| (in thousands) | ||||||||
| Deferred tax assets: |
||||||||
| Net operating loss carryforwards |
$ | 473 | $ | 1,053 | ||||
| Credit carryforwards |
16 | 1,633 | ||||||
| Accrued expenses |
3,835 | 3,230 | ||||||
| Intangible assets |
712 | 1,051 | ||||||
| Stock-based compensation |
2,361 | 849 | ||||||
| State taxes |
1,637 | 406 | ||||||
| Tax benefit on other comprehensive loss |
312 | 538 | ||||||
| Total deferred tax assets |
9,346 | 8,760 | ||||||
| Deferred tax liabilities: |
||||||||
| Fixed assets |
(2,140 | ) | (1,543 | ) | ||||
| Total deferred tax assets |
7,206 | 7,217 | ||||||
| Less: current deferred tax asset |
5,406 | 4,707 | ||||||
| Long-term deferred tax asset |
$ | 1,800 | $ | 2,510 | ||||
The Company had recorded $312,000 of deferred tax benefit in accumulated other comprehensive loss as of December 31, 2009, related to net unrealized losses on investment securities.
92
Table of Contents
GENOPTIX, INC.
NOTES TO CONSOLIDATED FINANCIAL STATEMENTS (CONTINUED)
As of December 31, 2009, the Company had federal tax net operating loss carryforwards of approximately $1.2 million and state tax net operating loss carryforwards of approximately $27.0 million. The federal and state net operating losses will begin to expire in 2019 and 2013, respectively. As of December 31, 2009, the Company had no federal research tax credit carryforwards and state research credit carryforwards of approximately $104,000, which do not expire.
Utilization of net operating loss carryforwards, credit carryforwards and certain deductions have been subject to substantial annual limitations due to ownership change limitations provided by the Internal Revenue Code of 1986, as amended, and similar state provisions. Under Sections 382 and 383 of the Internal Revenue Code of 1986, as amended, substantial changes in the Company’s ownership have required the Company to limit the amount of net operating loss and research and development credit carryforwards that were previously available to offset future taxable income. The Company has three “change in ownership” events that limit the utilization of net operating loss and credit carryforwards. The “change in ownership” events occurred in March 2000, December 2001 and March 2008 and resulted in annual net operating loss carryforward limitations of $63,000, $96,000 and $16.1 million, respectively. As a result of a net unrealized built-in gain from the March 2008 change in ownership, the Company’s net operating loss carryforward annual limitation of $16.1 million was increased to $39.7 million for each of the five years starting after the change in ownership. Additional limitations on the use of these tax attributes could occur in the event of possible disputes arising in examination from various taxing authorities.
The following table presents a summary of the Company’s unrecognized tax benefit:
| Years Ended December 31, | |||||||||||
| 2009 | 2008 | 2007 | |||||||||
| (in thousands) | |||||||||||
| Beginning balance |
$ | 249 | $ | 677 | $ | 840 | |||||
| Additions based on tax positions related to current year |
— | — | — | ||||||||
| Additions for tax positions of prior years |
— | — | — | ||||||||
| Reductions for tax positions of prior years |
— | (428 | ) | (163 | ) | ||||||
| Settlements |
— | — | — | ||||||||
| Ending balance |
$ | 249 | $ | 249 | $ | 677 | |||||
At December 31, 2009, the Company’s unrecognized tax benefit associated with uncertain tax positions was $249,000, of which $195,000, if recognized, would impact the effective tax rate. The Company recognized no material interest or penalties during the year ended December 31, 2009, 2008 or 2007. The Company does not expect any significant increases or decreases to its unrecognized tax benefits within 12 months of this reporting date.
In August 2009, the Internal Revenue Service commenced an examination of the Company’s U.S. federal income tax return for the tax year ended December 31, 2007. To date, there have been no proposed adjustments communicated to the Company. While the Company believes it is adequately reserved, if the examination results in an unfavorable outcome, there could be a material impact on the financial results in the period the outcome is determined.
The Company is subject to U.S. federal income tax as well as income tax in jurisdictions of each state having an income tax. The tax years that remain subject to examination are 2006 for federal income taxes and 2005 for state income taxes, including years ending thereafter. However, to the extent allowed by law, the tax authorities may have the right to examine prior periods where net operating losses or tax credits were generated and carried forward, and make adjustments up to the amount of the net operating losses or credit carry-forward amounts.
93
Table of Contents
GENOPTIX, INC.
NOTES TO CONSOLIDATED FINANCIAL STATEMENTS (CONTINUED)
7. Employee Savings Plan
The Company has a 401(k) program, which allows participating employees to contribute up to 100% of their salary, subject to annual limits. In 2009, the Company amended its 401(k) program to provide that the Company will match employee contributions made to their 401(k) account of up to 3% of their salary beginning in January 2010. No such matching contributions were made as of or for the year ended December 31, 2009.
8. Treasury Stock
The Company repurchased shares of common stock issued to certain of its directors under their RSU agreement for the purpose of satisfying the director’s tax obligations created by the vesting of their RSUs. For the year ended December 31, 2009, the Company repurchased 749 shares representing a total value of $25,000. No repurchase of shares occurred during the year ended December 31, 2008. The Company accounted for these share purchases as treasury stock transactions using the cost method. The value of the repurchased shares was classified as treasury stock as a reduction in stockholders’ equity on the consolidated balance sheets.
9. Selected Quarterly Financial Data (Unaudited)
The following tables present unaudited selected quarterly financial data and reflects all normal recurring adjustments, which are, in the opinion of management, necessary for a fair statement of the results of the interim periods:
| Year Ended December 31, 2009 | |||||||||||||||
| 1st Quarter |
2nd Quarter |
3rd Quarter |
4th Quarter |
Year | |||||||||||
| (in thousands, except per share data) | |||||||||||||||
| Selected quarterly financial data: |
|||||||||||||||
| Revenues(1) |
$ | 39,189 | $ | 45,298 | $ | 50,807 | $ | 49,084 | $ | 184,378 | |||||
| Gross profit |
23,760 | 28,526 | 32,405 | 30,487 | 115,178 | ||||||||||
| Total operating expenses |
13,620 | 15,109 | 16,026 | 16,613 | 61,368 | ||||||||||
| Net income(3) |
5,942 | 7,874 | 9,462 | 7,356 | 30,634 | ||||||||||
| Net income per common share—basic(4) |
$ | 0.35 | $ | 0.47 | $ | 0.55 | $ | 0.43 | $ | 1.80 | |||||
| Net income per common share—diluted(4) |
$ | 0.33 | $ | 0.44 | $ | 0.53 | $ | 0.41 | $ | 1.71 | |||||
| Year Ended December 31, 2008 | |||||||||||||||
| 1st Quarter |
2nd Quarter |
3rd Quarter |
4th Quarter |
Year | |||||||||||
| (in thousands, except per share data) | |||||||||||||||
| Selected quarterly financial data: |
|||||||||||||||
| Revenues(2) |
$ | 22,298 | $ | 27,825 | $ | 32,087 | $ | 33,960 | $ | 116,170 | |||||
| Gross profit |
13,123 | 16,619 | 19,805 | 20,692 | 70,239 | ||||||||||
| Total operating expenses |
8,966 | 11,442 | 11,217 | 11,986 | 43,611 | ||||||||||
| Net income(3) |
5,007 | 5,571 | 15,428 | 5,350 | 31,356 | ||||||||||
| Net income per common share—basic(4) |
$ | 0.31 | $ | 0.34 | $ | 0.93 | $ | 0.32 | $ | 1.91 | |||||
| Net income per common share—diluted(4) |
$ | 0.29 | $ | 0.32 | $ | 0.87 | $ | 0.30 | $ | 1.78 | |||||
| (1) | During the quarters ended March 31, 2009, June 30, 2009, September 30, 2009 and December 31, 2009, the Company recorded positive changes in accounting estimates to reduce contractual allowances by $2.0 million, $3.7 million, $4.4 million and $2.0 million respectively, of which $7.4 million related to revenues |
94
Table of Contents
GENOPTIX, INC.
NOTES TO CONSOLIDATED FINANCIAL STATEMENTS (CONTINUED)
| originally recorded in prior periods. These favorable changes in accounting estimates related primarily to non-contracted payors and resulted from continued improvements to the Company’s collection processes, changes in reimbursement policies by certain payors and increased hiring of personnel and management focused on the collection of accounts receivable for services rendered in prior periods. In the consolidated statements of operations, the reduction in contractual allowances resulted in an increase to revenues. |
| (2) | During the quarters ended March 31, 2008, June 30, 2008, September 30, 2008 and December 31, 2008, the Company recorded positive changes in accounting estimates to reduce contractual allowances by $651,000, $864,000, $2.5 million and $2.2 million respectively, of which $3.3 million related to revenues originally recorded in prior periods. These favorable changes in accounting estimates related primarily to non-contracted payors and resulted from continued improvements to the Company’s collection processes, as well as increased hiring of personnel and management focused on the collection of accounts receivable for services rendered in prior periods and changes in reimbursement policies by certain payors. In the consolidated statements of operations, the reduction in contractual allowances resulted in an increase to revenues. |
| (3) | The income tax expense for the year ended December 31, 2009 was $24.7 million, as compared to the income tax benefit for the year ended December 31, 2008 of $1.7 million. As of December 31, 2007, the Company had $14.9 million in net deferred tax assets that were offset entirely by a valuation allowance, as the Company was unable to conclude, at that time, that it was “more likely than not” that such deferred tax assets would be realized. In 2008, although realization was not assured, we believed it was “more likely than not” that we would be able to realize net deferred tax assets through the ordinary course of business and expected future taxable income. Therefore, during the year ended December 31, 2008, we recorded a $14.9 million tax benefit representing the release of the valuation allowance against the net deferred tax assets. |
| (4) | Net income per share is computed independently for each of the quarters presented. Therefore, the sum of the quarterly net income per share amounts will not necessarily equal the total for the year. |
10. Subsequent Events
On January 4, 2010, the Company entered into a six-year operating lease, with lease payments commencing on May 1, 2010, for an additional 33,000 square feet of space in Carlsbad, California, into which the Company will expand the Company’s current customer service and support operations following the substantial completion of improvements, estimated to occur in the second quarter of 2010. Building improvements and related capital expenditures are expected to cost approximately $3.0 million. The lease contains one five-year extension option and is subject to annual rent increases. The annual noncancellable future minimum payments under the lease total approximately $256,000, $392,000, $404,000, $416,000 and $428,000 in 2010, 2011, 2012, 2013 and 2014, respectively.
On January 12, 2010, the Company entered into a purchase agreement to acquire the property in Carlsbad, California, that was originally leased by the Company in June 2009 (see Note 5 in these notes to consolidated financial statements for discussion of the lease), which consisted of land and a building with approximately 44,000 square feet of space to be used for laboratory operations. The total purchase price of the facility and related land was $7.6 million and was purchased using existing cash derived from operations. Building improvements and related capital expenditures are expected to cost approximately $11.0 million and are expected to be substantially complete during the second quarter of 2010. As a result of this purchase, the lease agreement entered into by the Company for the leasing of the property was terminated.
95
Table of Contents
Item 9. Changes in and Disagreements with Accountants on Accounting and Financial Disclosure.
None.
Item 9A. Controls and Procedures.
Evaluation of Disclosure Controls and Procedures
We maintain disclosure controls and procedures that are designed to ensure that information required to be disclosed in our periodic reports filed with the SEC are recorded, processed, summarized and reported within the time periods specified in the SEC’s rules and forms and that such information is accumulated and communicated to our management, including our chief executive officer and chief financial officer, as appropriate, to allow for timely decisions regarding required disclosure. In designing and evaluating the disclosure controls and procedures, our management recognizes that any controls and procedures, no matter how well designed and operated, can provide only reasonable assurance of achieving the desired control objectives, and no evaluation of controls and procedures can provide absolute assurance that all control issues and instances of fraud, if any, within a company have been detected. Management is required to apply its judgment in evaluating the cost-benefit relationship of possible controls and procedures.
As required by SEC Rule 13a-15(b) of the Exchange Act, prior to filing this Annual Report on Form 10-K, we carried out an evaluation, under the supervision and with the participation of our management, including our chief executive officer and chief financial officer, of the effectiveness of the design and operation of our disclosure controls and procedures (as defined in Rules 13a-15(e) and 15d-15(e) of the Exchange Act) as of the end of the period covered by this Annual Report on Form 10-K. Based on their evaluation, our chief executive officer and chief financial officer concluded that our disclosure controls and procedures were effective as of the end of the period covered by this Annual Report on Form 10-K.
Changes in Internal Control Over Financial Reporting
An evaluation was also performed under the supervision and with the participation of our management, including our chief executive officer and chief financial officer, of any change in our internal control over financial reporting that occurred during our last fiscal quarter and that has materially affected, or is reasonably likely to materially affect, our internal control over financial reporting. That evaluation did not identify any change in our internal control over financial reporting that occurred during our latest fiscal quarter that has materially affected, or is reasonably likely to materially affect, our internal control over financial reporting.
Management’s Report on Internal Control Over Financial Reporting
Our management is responsible for establishing and maintaining adequate internal control over financial reporting, as such term is defined in Rule 13a-15(f) of the Exchange Act. Under the supervision and with the participation of our management, including our chief executive officer and chief financial officer, we conducted an evaluation of the effectiveness of our internal control over financial reporting based on the framework set forth in Internal Control—Integrated Framework issued by the Committee of Sponsoring Organizations of the Treadway Commission. Based on our evaluation under the framework set forth in Internal Control—Integrated Framework, our management concluded that our internal control over financial reporting was effective as of December 31, 2009. Ernst & Young LLP, the independent registered public accounting firm that audited the financial statements included in this Annual Report on Form 10-K, has issued an attestation report on the effectiveness of our internal control over financial reporting as of December 31, 2009, which is included herein.
96
Table of Contents
Report of Independent Registered Public Accounting Firm on Internal Control Over Financial Reporting
REPORT OF INDEPENDENT REGISTERED PUBLIC ACCOUNTING FIRM
The Board of Directors and Stockholders of Genoptix, Inc.
We have audited Genoptix, Inc.’s internal control over financial reporting as of December 31, 2009, based on criteria established in Internal Control—Integrated Framework issued by the Committee of Sponsoring Organizations of the Treadway Commission (the COSO criteria). Genoptix, Inc.’s management is responsible for maintaining effective internal control over financial reporting, and for its assessment of the effectiveness of internal control over financial reporting included in the accompanying Management’s Report on Internal Control Over Financial Reporting. Our responsibility is to express an opinion on the company’s internal control over financial reporting based on our audit.
We conducted our audit in accordance with the standards of the Public Company Accounting Oversight Board (United States). Those standards require that we plan and perform the audit to obtain reasonable assurance about whether effective internal control over financial reporting was maintained in all material respects. Our audit included obtaining an understanding of internal control over financial reporting, assessing the risk that a material weakness exists, testing and evaluating the design and operating effectiveness of internal control based on the assessed risk, and performing such other procedures as we considered necessary in the circumstances. We believe that our audit provides a reasonable basis for our opinion.
A company’s internal control over financial reporting is a process designed to provide reasonable assurance regarding the reliability of financial reporting and the preparation of financial statements for external purposes in accordance with generally accepted accounting principles. A company’s internal control over financial reporting includes those policies and procedures that (1) pertain to the maintenance of records that, in reasonable detail, accurately and fairly reflect the transactions and dispositions of the assets of the company; (2) provide reasonable assurance that transactions are recorded as necessary to permit preparation of financial statements in accordance with generally accepted accounting principles, and that receipts and expenditures of the company are being made only in accordance with authorizations of management and directors of the company; and (3) provide reasonable assurance regarding prevention or timely detection of unauthorized acquisition, use, or disposition of the company’s assets that could have a material effect on the consolidated financial statements.
Because of its inherent limitations, internal control over financial reporting may not prevent or detect misstatements. Also, projections of any evaluation of effectiveness to future periods are subject to the risk that controls may become inadequate because of changes in conditions, or that the degree of compliance with the policies or procedures may deteriorate.
In our opinion, Genoptix, Inc. maintained in all material respects, effective internal control over financial reporting as of December 31, 2009 based on the COSO criteria.
We also have audited, in accordance with the standards of the Public Company Accounting Oversight Board (United States), the consolidated balance sheets of Genoptix, Inc. as of December 31, 2009 and 2008, and the related consolidated statements of operations, stockholders’ equity, and cash flows for each of the three years in the period ended December 31, 2009 and our report dated February 25, 2010 expressed an unqualified opinion thereon.
/s/ Ernst & Young LLP
San Diego, California
February 25, 2010
97
Table of Contents
None.
98
Table of Contents
PART III
Item 10. Directors, Executive Officers and Corporate Governance.
The information required by this item with respect to executive officers and directors is incorporated by reference from the information under the captions “Election of Directors,” “Section 16(a) Beneficial Ownership Reporting Compliance,” and “Code of Business Conduct and Ethics” contained in the proxy statement to be filed with the SEC pursuant to Regulation 14A in connection with our 2010 annual meeting of stockholders.
Item 11. Executive Compensation.
The information required by this item is incorporated by reference to the information under the captions “Non-Employee Director Compensation,” “Executive Compensation,” “Compensation Committee Report,” and “Compensation Committee Interlocks and Insider Participation” contained in the proxy statement to be filed with the SEC pursuant to Regulation 14A in connection with our 2010 annual meeting of stockholders.
Item 12. Security Ownership of Certain Beneficial Owners and Management and Related Stockholder Matters.
The information required by this item is incorporated by reference to the information under the captions “Security Ownership of Certain Beneficial Owners and Management” and “Securities Authorized for Issuance under Equity Compensation Plans” contained in the proxy statement to be filed with the SEC pursuant to Regulation 14A in connection with our 2010 annual meeting of stockholders.
Item 13. Certain Relationships and Related Transactions, and Director Independence.
The information required by this item is incorporated by reference to the information under the captions “Elections of Directors” and “Transactions with Related Persons” contained in the proxy statement to be filed with the SEC pursuant to Regulation 14A in connection with our 2010 annual meeting of stockholders.
Item 14. Principal Accounting Fees and Services.
The information required by this item is incorporated by reference to the information under the captions contained in “Ratification of Selection of Independent Auditors” contained in the proxy statement to be filed with the SEC pursuant to Regulation 14A in connection with our 2010 annual meeting of stockholders.
99
Table of Contents
PART IV
Item 15. Exhibits, Financial Statement Schedules.
| (a) | Documents filed as part of this Annual Report on Form 10-K. |
| (1) | Consolidated Financial Statements: |
| Page | ||
| 67 | ||
| 68 | ||
| 69 | ||
| 70 | ||
| 71 | ||
| 72 |
| (2) | Consolidated Financial Statements Schedules: |
| Page | ||
| 103 |
All other consolidated financial statement schedules have been omitted because they are not applicable, not required or the information required is shown in the consolidated financial statements or the notes thereto.
| (3) | List of exhibits required by Item 601 of Regulation S-K. See part (b) below. |
| (b) | Exhibits filed as part of this Annual Report on Form 10-K. |
The following exhibits are filed as part of this Annual Report on Form 10-K:
| Exhibit |
Description | |
| 3.1(1) | Amended and Restated Certificate of Incorporation of the Registrant | |
| 3.2(10) | Amended and Restated Bylaws of the Registrant | |
| 4.1(2) | Form of the Registrant’s Common Stock Certificate | |
| 10.1†(2) | Form of Indemnity Agreement by and between the Registrant and its directors and executive officers | |
| 10.2†(2) | 2001 Equity Incentive Plan and Form of Option Agreement (Employees), Form of Option Agreement (Executive Officers), Form of Stock Option Grant Notice, Notice of Exercise and Early Exercise Stock Purchase Agreement and Notice of Exercise and other exhibits thereto | |
| 10.3†(2) | 2007 Equity Incentive Plan and Form of Stock Option Agreement, Form of Stock Option Grant Notice and Notice of Exercise thereunder | |
| 10.4†(13) | Form of Restricted Stock Unit Award Agreement for Executives and Form of Restricted Stock Unit Award Grant Notice for Executives under 2007 Equity Incentive Plan | |
| 10.5†(12) | Form of Restricted Stock Unit Award Agreement for Directors and Form of Restricted Stock Unit Award Grant Notice for Directors under 2007 Equity Incentive Plan | |
| 10.6†(11) | Form of Restricted Stock Unit Award Agreement for Non-Executives and Form of Restricted Stock Unit Award Grant Notice for Non-Executives under 2007 Equity Incentive Plan | |
| 10.7†(2) | 2007 Employee Stock Purchase Plan and Form of Offering Document thereunder | |
100
Table of Contents
| Exhibit |
Description | |
| 10.8†(6) | 2007 Non-Employee Directors’ Stock Option Plan, as amended | |
| 10.9†(11) | Form of Stock Option Agreement, Form of Initial and Annual Stock Option Grant Notice and Notice of Exercise under 2007 Non-Employee Directors’ Stock Option Plan | |
| 10.10†(6) | Non-Employee Director Compensation Policy | |
| 10.11†(9) | 2009 Annual Executive Bonus Plan | |
| 10.12†(13) | 2010 Annual Executive Bonus Plan | |
| 10.13†(11) | Amended and Restated Employment Agreement, dated November 5, 2008, between Registrant and Tina S. Nova, Ph.D. | |
| 10.14†(11) | Amended and Restated Employment Agreement, dated November 25, 2008, between Registrant and Samuel D. Riccitelli | |
| 10.15†(11) | Amended and Restated Employment Agreement, dated November 25, 2008, between Registrant and Douglas A. Schuling | |
| 10.16†(9) | Amended and Restated Employment Agreement, dated December 22, 2008, between Registrant and Christian V. Kuhlen, M.D., Esq. | |
| 10.17(2) | Amended and Restated Sublease Agreement, dated May 1, 2006, by and between the Registrant and CancerVax Corporation | |
| 10.18(2) | Amendment No. 1 to Sublease, dated April 2, 2007, by and between the Registrant and Micromet, Inc. | |
| 10.26(2) | Clinical Laboratory Professional Services Agreement, dated December 31, 2005, between Registrant and Cartesian Medical Group, Inc. | |
| 10.27(2) | Succession Agreement, dated December 31, 2005, between Registrant, Bashar Dabbas, M.D. and Cartesian Medical Group, Inc. | |
| 10.28(11) | Amended and Restated Medical Director Agreement, dated October 31, 2008, between Registrant and Pacific Medical Consultants, Inc. and Bashar Dabbas, M.D. | |
| 10.29(3) | Standard Multi-Tenant Office Lease, dated February 4, 2008, by and between the Registrant and Blackmore Signal Hill | |
| 10.30(8) | Termination of Lease, dated August 8, 2008, by and between Blackmore Signal Hill, L.P. and the Registrant | |
| 10.31(5) | Standard Multi-Tenant Office Lease dated April 14, 2008, by and between the Registrant and Allen Joseph Blackmore, Trustee of the Blackmore Family Trust, Restated 1995 | |
| 10.32(7) | First Amendment to Standard Multi-Tenant Office Lease dated September 15, 2008 by and between the Registrant and Allen Joseph Blackmore, Trustee of the Blackmore Family Trust, Restated 1995 | |
| 10.33(12) | Standard Single-Tenant Office Lease, dated June 1, 2009, by and between the Registrant and Reynolds Family Trust | |
| 10.34(12) | Second Amendment to Standard Multi-Tenant Office Lease – Gross, dated July 1, 2009, by and between the Registrant and Allen Joseph Blackmore, Trustee | |
| 10.35 | Standard Single-Tenant Office Lease, dated January 5, 2010, by and between the Registrant and Allen Joseph Blackmore, Trustee | |
| 10.36 | Purchase Agreement and Joint Escrow Instructions, dated January 12, 2010, by and between the Registrant and Roman B. Cham, Trustee of the Roman B. Cham, M.D. Profit Sharing Plan, Ronald Reynolds and Jacqueline S. Reynolds, Co-Trustees of the Ronald L. Reynolds and Jacqueline S. Reynolds Trust dated June 21, 2001, and RM-USE, LLC, a California limited liability company | |
101
Table of Contents
| Exhibit |
Description | |
| 23.1 | Consent of independent registered public accounting firm | |
| 31.1 | Certification of Chief Executive Officer pursuant to Rule 13a-14 and Rule 15d-14 of the Securities Exchange Act of 1934, as amended | |
| 31.2 | Certification of Chief Financial Officer pursuant to Rule 13a-14 and Rule 15d-14 of the Securities Exchange Act of 1934, as amended | |
| 32.1 | Certifications of Chief Executive Officer and Chief Financial Officer pursuant to 18 U.S.C. 1350, as adopted pursuant to Section 906 of the Sarbanes-Oxley Act of 2002 | |
| † | Indicates management contract or compensatory plan. |
| (1) | Incorporated herein by reference to the corresponding exhibit to the Registrant’s Current Report on Form 8-K (File No. 001-33753), filed with the Securities and Exchange Commission on November 2, 2007. |
| (2) | Incorporated herein by reference to the Registrant’s Registration Statement on Form S-1 (No. 333-144997), as amended, filed with the Securities and Exchange Commission. |
| (3) | Incorporated herein by reference to the Registrant’s Current Report on Form 8-K (File No. 001-33753), filed with the Securities and Exchange Commission on February 7, 2008. |
| (4) | Incorporated herein by reference to the Registrant’s Current Report on Form 8-K (File No. 001-33753), filed with the Securities and Exchange Commission on April 16, 2008. |
| (5) | Incorporated herein by reference to the Registrant’s Quarterly Report on Form 10-Q (No. 001-33753), filed with the Securities and Exchange Commission on May 8, 2008. |
| (6) | Incorporated herein by reference to the Registrant’s Current Report on Form 8-K (File No. 001-33753), filed with the Securities and Exchange Commission on May 13, 2008. |
| (7) | Incorporated herein by reference to the Registrant’s Current Report on Form 8-K (File No. 001-33753), filed with the Securities and Exchange Commission on September 17, 2008. |
| (8) | Incorporated herein by reference to the Registrant’s Quarterly Report on Form 10-Q (No. 001-33753), filed with the Securities and Exchange Commission on November 6, 2008. |
| (9) | Incorporated herein by reference to the Registrant’s Current Report on Form 8-K (File No. 001-33753), filed with the Securities and Exchange Commission on December 22, 2008. |
| (10) | Incorporated herein by reference to the Registrant’s Current Report on Form 8-K (File No. 001-33753), filed with the Securities and Exchange Commission on January 8, 2009. |
| (11) | Incorporated herein by reference to the Registrant’s Annual Report on Form 10-K (File No. 001-33753), filed with the Securities and Exchange Commission on February 26, 2009. |
| (12) | Incorporated herein by reference to the Registrant’s Quarterly Report on Form 10-Q (File No. 001-33753), filed with the Securities and Exchange Commission on July 30, 2009. |
| (13) | Incorporated herein by reference to the Registrant’s Current Report on Form 8-K (File No. 001-33753), filed with the Securities and Exchange Commission on December 22, 2009. |
102
Table of Contents
GENOPTIX, INC.
SCHEDULE II—Valuation and Qualifying Accounts
| Allowance for Doubtful Accounts(1) | ||||||||||||
| December 31, | ||||||||||||
| 2009 | 2008 | 2007 | ||||||||||
| (in thousands) | ||||||||||||
| Beginning Balance |
$ | 4,126 | $ | 1,594 | $ | 1,360 | ||||||
| Provision for doubtful accounts |
3,150 | 3,196 | 1,093 | |||||||||
| Write-offs, net of recoveries |
(1,889 | ) | (664 | ) | (859 | ) | ||||||
| Ending Balance |
$ | 5,387 | $ | 4,126 | $ | 1,594 | ||||||
| (1) | The provision was charged against general and administrative expenses on the consolidated statements of operations for each respective year. |
103
Table of Contents
Pursuant to the requirements of Section 13 or 15(d) of the Securities Exchange Act of 1934, as amended, the registrant has duly caused this Annual Report on Form 10-K to be signed on its behalf by the undersigned, thereunto duly authorized.
| GENOPTIX, INC. | ||||||
| Date: February 25, 2010 | By: | /s/ TINA S. NOVA | ||||
| Tina S. Nova, Ph.D. | ||||||
| President and Chief Executive Officer | ||||||
POWER OF ATTORNEY
KNOW ALL PERSONS BY THESE PRESENTS, that each person whose signature appears below constitutes and appoints Tina S. Nova, Ph.D. and Douglas A. Schuling, and each of them, acting individually, as his or her attorney-in-fact, each with full power of substitution and resubstitution, for him or her and in his or her name, place and stead, in any and all capacities, to sign any and all amendments to this Annual Report on Form 10-K, and to file the same, with all exhibits thereto, and other documents in connection therewith, with the Securities and Exchange Commission, granting unto said attorneys-in-fact and agents, and each of them, full power and authority to do and perform each and every act and thing requisite and necessary to be done in connection therewith and about the premises, as fully to all intents and purposes as he or she might or could do in person, hereby ratifying and confirming all that said attorneys-in-fact and agents, or any of them, or their or his substitute or substitutes, may lawfully do or cause to be done by virtue hereof.
Pursuant to the requirements of the Securities Exchange Act of 1934, as amended, this report has been signed below by the following persons on behalf of the registrant and in the capacities and on the dates indicated.
| Name |
Title |
Date | ||
| /s/ TINA S. NOVA Tina S. Nova, Ph.D. |
President, Chief Executive Officer and Member of the Board of Directors (Principal Executive Officer) |
February 25, 2010 | ||
| /s/ DOUGLAS A. SCHULING Douglas A. Schuling |
Executive Vice President and Chief Financial Officer (Principal Financial and Accounting Officer) |
February 25, 2010 | ||
| /S/ ANDREW E. SENYEI Andrew E. Senyei, M.D. |
Chairman of the Board of Directors | February 25, 2010 | ||
| /S/ TIMOTHY M. BUONO Timothy M. Buono |
Member of the Board of Directors | February 25, 2010 | ||
| /S/ ROBERT E. CURRY Robert E. Curry, Ph.D. |
Member of the Board of Directors | February 25, 2010 | ||
| /S/ MICHAEL A. HENOS Michael A. Henos |
Member of the Board of Directors | February 25, 2010 | ||
104
Table of Contents
| Name |
Title |
Date | ||
| /S/ LAURENCE R. MCCARTHY Laurence R. McCarthy, Ph.D. |
Member of the Board of Directors | February 25, 2010 | ||
| /S/ KARIN EASTHAM Karin Eastham |
Member of the Board of Directors | February 25, 2010 | ||
| /s/ CHRISTINE A. WHITE Christine A. White, M.D. |
Member of the Board of Directors | February 25, 2010 | ||
105