Attached files
| file | filename |
|---|---|
| 8-K - FORM 8-K - JONES LANG LASALLE INC | d8k.htm |
 Investor Presentation February 2010 Exhibit 99.1 |
 2 Forward looking statements Statements in this presentation regarding, among other things, future financial results and
performance, achievements, plans and objectives and dividend payments may be
considered forward-looking statements within the meaning of the Private
Securities Litigation Reform Act of 1995. Such statements involve known and
unknown risks, uncertainties and other factors which may cause actual results, performance, achievements, plans and objectives of Jones Lang LaSalle to be materially different from those expressed or
implied by such forward-looking statements. Factors that could cause actual
results to differ materially include those discussed under
“Business,” “Risk Factors,” “Management’s Discussion and Analysis of Financial Condition and Results of Operations,” “Quantitative and Qualitative Disclosures about Market Risk,”
“Cautionary Note Regarding Forward- Looking Statements” and elsewhere
in Jones Lang LaSalle’s Annual Report on Form 10-K for the year ended December 31, 2008 and in the Quarterly Report on Form 10-Q for the quarter ended September
30, 2009 and in other reports filed with the Securities and Exchange Commission.
There can be no assurance that future dividends will be declared since the actual
declaration of future dividends, and the establishment of record and payment dates, remains subject to final determination by the Company’s Board of Directors.
Statements speak only as of the date of this presentation. Jones Lang LaSalle
expressly disclaims any obligation or undertaking to update or revise any
forward-looking statements contained herein to reflect any change in Jones Lang LaSalle’s expectations or results, or any change in events. |
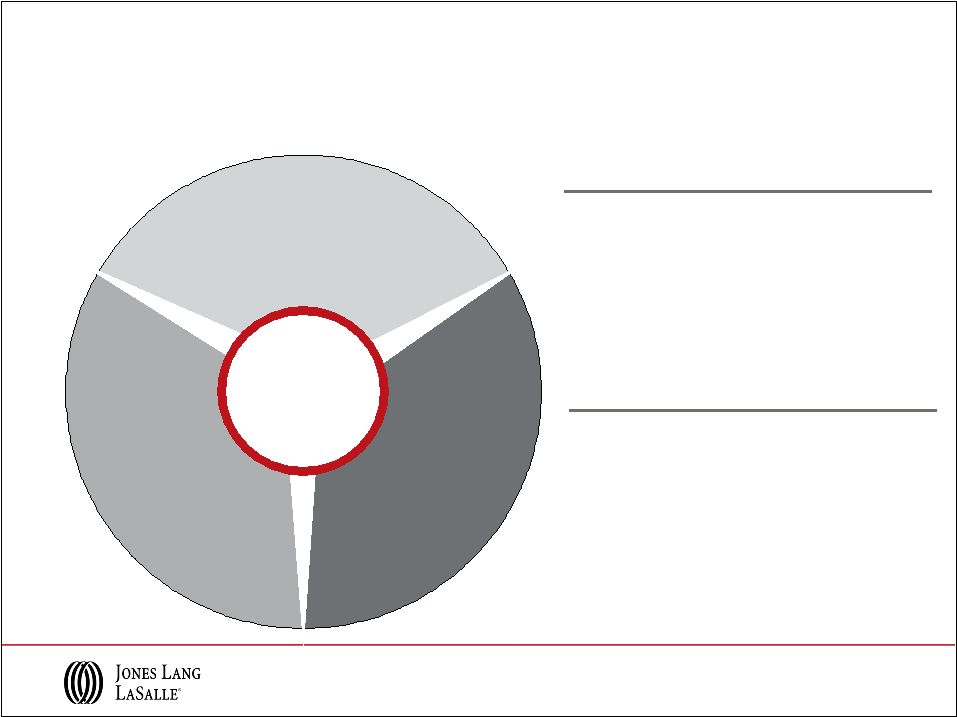
 3 Property & Facility Management 25% Project & Development Services 13% LaSalle Inv. Mgmt. 10% Advisory Consulting & Other 12% Leasing 31% Capital Markets 8% United States 43% United Kingdom 10% Continental Europe 17% Greater China 6% Developing & Other Countries 10% Japan 4% India 3% Australia 7% Jones Lang LaSalle (1) Excludes equity losses (2) Includes Staubach revenue commencing July 11, 2008 2009 Revenue = $2.5 billion Leading integrated services and investment management firm … And Global Market Reach Diversified Service Lines… • Leading global market positions bolstered by over 30 mergers and acquisitions since 2005 • Corporate Outsourcing drives growth and provides annuity revenue • LaSalle Investment Management - a value differentiator with profitable Advisory fees and dry investment powder • Cash generating business model with low leverage balance sheet 2009 2008 (2) Americas 42% 35% EMEA 26% 32% Asia Pacific 22% 20% LaSalle Investment Mgmt. 10% 13% Consolidated 100% 100% Revenue by Segment (1) |
 4 2009 Financial Scorecard • Over 75 new Corporate Solutions wins and expansions • Over $70 million actual vs. $50 million projected in discretionary cost savings • $100 million in annualized compensation savings from 2009 actions • Maintained adjusted operating margin of 6.6% vs. 2008 • Financially strong: maintained investment grade ratings and reduced net bank debt by $334 million Performance Highlights A year of action and performance $239M Adjusted EBITDA (1) $1.75 Adjusted EPS (1) $70M Adjusted Net Income (1) $2.5B Revenue $2.5B Market Capitalization $129M Net Bank Debt 2009 Financial Summary (1) Adjusted for restructuring and non-cash co-investment charges
|
 5 2009 Scorecard Strong Balance Sheet Position (1) 2009 and 2008 capital expenditures net of tenant improvement allowances received were $36
million and $102 million, respectively Financial strength and powerful cash generation ($498) (10) (521) (26) (42) (349) (104) $33 2008 $334 Net Debt Repayment / (Borrowing) (8) Dividends (118) Net Cash Outflows 201 Net Share Issuance & Other Financing ($ in millions) Primary Uses of Cash Net Cash from Operations Cash Flow Summary (39) Co-investments $251 2009 (27) Acquisitions & Def. Business Obligations (44) Capital Expenses (1) 2010 Priorities • Continue debt repayment focus with selective investments • Capital Expenditures to remain consistent with 2009 • Deferred Business Obligations of approx. $100 million, including 1 st deferred Staubach payment • Net Co-investments of approx. $65-75 million • Successful equity raise, strong cash generation and reduced spend • Reduced net bank debt to $129 million; total debt of $523 million, including Deferred Business Obligations • Maintained investment grade ratings and bank covenant compliance |
 6 Beijing, Hong Kong, Moscow Synchronized global crash becomes variable speed recovery Capital Markets Leading Real Estate Fundamentals Capital Value growth slowing Capital Value growth accelerating Capital Value bottoming out Capital Value falling Asia Pacific EMEA Americas Paris, Sydney, Seoul London, Shanghai Atlanta, Detroit, Singapore Berlin, Los
Angeles, New York, Stockholm Brussels, Milan, Mumbai, Tokyo Rental growth slowing Rental growth accelerating Rents bottoming out Rental growth falling London, Sydney, Hong Kong Beijing Moscow, Mumbai, Tokyo Shanghai Berlin, Paris, Washington DC Amsterdam, Brussels, Seoul Chicago, Milan, Los
Angeles, Toronto Singapore, Stockholm Amsterdam, Washington DC Atlanta, Detroit Dallas, New York, San Francisco Chicago, Dallas San Francisco, Toronto Source: Jones Lang LaSalle As of Q4 2009 |
 7 Jones Lang LaSalle Global strategy for renewed growth G5 G1 G2 G4 G3 Build our leading local and regional market positions Grow our leading positions in Corporate Solutions Capture the leading share of global capital flows for investment sales Strengthen LaSalle Investment Management’s leadership position Connections: Differentiate by connecting across the firm, and with clients
|
 8 Full productivity revenue of over $750 million Acquisitions Since 2005 Growing Market Share EMEA Americas Asia Pacific RL Davis Leechiu Creer NSC Sallmanns Shore Industrial Meghraj Rogers Chapman Littman Partnership RSP Group Area Zero Hargreaves Goswell Troostwijk Makelaars KHK Group Camilli & Veiel GVA Upstream Tetris Creevy LLH Ltd. Brune Alkas Kemper’s Churston Heard Staubach Spaulding & Slye Zietsman Klatskin CRA Standard Group ECD HIA TCF Strengthening our platform and connecting our people Asset Realty Managers G1 • Middle Market Corporate Solutions • Leasing • Capital Markets • Property Management • Project & Development Services • Retail • Industrial • Energy & Sustainability Services • Infrastructure Market share growth Product and services expansion |
 9 Full year revenue comparison Local and Regional Services Asia Pacific EMEA Americas Leasing Capital Markets $500 $227 $247 $173 $125 $133 $108 $373 $241 2007 2008 2009 $38 $339 $196 $107 $104 $60 $58 $114 $61 2007 2008 2009 $593 $781 $753 $557 $317 $203 G1 ($ in millions) ($ in millions) Growth with market share Stabilizing after severe downturn |
 10 Growth slowing Falling market Growth returns Decline slowing 2009 Americas Scorecard Advisory & Other 11% CM 4% Project & Development Services 15% Property & Facility Mgmt. 22% Leasing 48% 2009 Americas Revenue = $1,032 million Market Fundamentals Capital Markets • Property & Facilities Management annuity revenue up 15% to $227 million for the year • Staubach integration successful, Leasing revenue was up 34% versus 2008 • Transitioned to commission model for cost flexibility; net new add of 35 brokers 2010 Americas Priorities • Two primary objectives: grow market share and middle market presence • Targeted investments in middle market teams and product expertise • Innovative product offerings: Healthcare, Mobile Engineering • Cost containment G1 Source: Jones Lang LaSalle As of Q4 2009 |
 11 Growth slowing Falling market Growth returns Decline slowing Advisory & Other 18% Leasing 27% Capital Markets 17% Project & Development Services 17% Property & Facility Mgmt. 21% 2009 EMEA Revenue = $644 million Capital Markets • Stabilized businesses in developing markets (e.g. Russia, Dubai) • Nearly $60 million of annualized base compensation savings with 7 month payback • U.K. & France: market share gains in first recovering markets Market Fundamentals 2009 EMEA Scorecard • Drive loss making businesses to improved profitability • Grow Retail business • Penetrate EMEA middle market corporates • Support success in global corporate mandates 2010 EMEA Priorities G1 Source: Jones Lang LaSalle As of Q4 2009 |
 12 Growth slowing Falling market Growth returns Decline slowing Advisory & Other 12% Leasing 20% Capital Markets 11% PD&S 8% Property & Facility Mgmt. 49% 2009 Asia Pacific Revenue = $539 million Capital Markets • Successfully achieved 50% annuity revenue in region • 7% full-year revenue growth in Property & Facility Management; 16% growth in Q4 • Leveraged China investment: 20% revenue growth • Fourth-quarter transaction activity improvement Market Fundamentals 2009 Asia Pacific Scorecard 2010 Asia Pacific Priorities • Protect and grow annuity; reduce cyclicality • Maximize recovering market opportunities • Penetrate domestic corporates with tailored local services • Leverage infrastructure to increase margin G1 Source: Jones Lang LaSalle As of Q4 2009 |
 13 Leading position with unique expertise across services & geographies • Accelerate new client wins and innovate for existing clients to broaden relationship
- 47 new wins in 2009 vs. 43 in 2008 - 31 expansions and 44 renewals in 2009 - 170 million sq ft added; 34% increase from December 31, 2008 • Target new industry segments for continued market share growth - Replicate Financial/Pharma/IT success • Tailor regional solutions in EMEA and Asia Pacific; support global client needs Global Corporate Solutions Integrated Facility Management Transaction Management Project Management Lease Administration Mobile Engineering Energy & Sustainable Services Strategic Consulting Retail Outsourcing Corporate Finance / CMG Client Relationship Management New Client Wins Accelerate 0 10 20 30 40 50 2008 2009 G2 |
 14 Leasing Receivership Services Development & Construction Management Property & Asset Management Loan Restructuring & Debt Advisory Research on Local Martkets Planning & Developing Strategic Review Investment Sales Leasing Receivership Services Development & Construction Management Property & Asset Management Loan Restructuring & Debt Advisory Research on Local Martkets Planning & Developing Strategic Review Leasing Receivership Services Development & Construction Management Property & Asset Management Loan Restructuring & Debt Advisory Research on Local Martkets Planning & Developing Strategic Review Leasing Receivership Services Development & Construction Management Property & Asset Management Loan Restructuring & Debt Advisory Research on Local Martkets Planning & Developing Strategic Review Investment Sales Connecting clients to innovative solutions Connecting clients to innovative solutions Direct Commercial Real Estate Investment 2010 Priorities • Wide geographical coverage and on the ground strength • Cross-border teams connecting JLL clients with capital and opportunities • JLL Hotels leveraging leading global markets position Capture Global Capital Flows for Investment Sales Positioned to leverage leading share as markets recover G3 0 50 100 150 200 250 300 350 Americas Europe Asia Pacific 2005 2006 2007 2008 2009 2010 Forecast +50-60% +20-30% +30-50% ($ in billions) Source: Jones Lang LaSalle |
 15 • Advisory fees deliver stable margins • Over $4 billion net equity raised despite challenging real estate markets • Limited investments given market uncertainties LaSalle Investment Management Note: AUM data reported on a one quarter lag Advisory fees NOI, contractual or equity-based; typically more stable than Assets Under Management which are impacted at least quarterly by market fluctuations Premier global investment manager with profitable Advisory Fees $101.4 $127.9 $178.1 $245.1 $277.9 $242.2 Advisory Fees (in millions) Year Ending AUM (in billions) Annuity Fees as % of AUM 2009 $39.9 0.61% 2008 $46.2 0.60% 2007 $49.7 0.49% 2006 $40.6 0.44% 2005 $29.8 0.43% 2004 $24.1 0.42% • Leverage scale and major market presence to gain share • Strong financial partner for clients supported by JLL balance sheet 2009 Scorecard 2010 Priorities G4 |
 16 Connecting JLL to add value for clients JLL Brand Market Knowledge & Experience Thought Leadership & Research Colleagues Sharing Relationships Extensive Capabilities & Products Client First www.joneslanglasalle.com G5 Technology JLL OneView Connecting Across the Firm and With Clients Technology enabling value added connections |
 17 Energy and Sustainability Services Energy conservation and cost savings a growing priority “I chose Ray Quartararo and Jones Lang LaSalle because of our successful history together taking on and figuring out difficult projects and the company’s deep sustainability expertise and track record.” --Anthony E. Malkin, Building Owner, Empire State Building Company • Over 540 LEED Accredited Professionals • 116 LEED projects globally, including • 1st LEED Platinum high-rise; One Bryant Park, New York • 1st LEED building registered in India; Sohrabji Godrej Green • Documented over $100M in energy savings for clients • Reduced 465,000 tons of greenhouse gas emissions • Equivalent to the emissions of nearly 70 million gallons of gasoline consumed Making an Impact in 2009 G5 |
 18 Jones Lang LaSalle Setting the industry standard for real estate service companies Premier Leading Global Platform - Approximately 180 offices in over 60 countries worldwide - Research-driven global investment management business - Client demands for global expertise satisfied by few providers Positioned for Short and Long Term Success - Premier and expanding position in the corporate outsourcing space - Expand share in local markets - Leading global investment management business Solid Financial Strength and Position - Diversified revenues by service line and geography - Solid balance sheet with investment-grade ratings - Strong global platform positioned for opportunity & market recovery
|
 19 Appendix |
 20 1st and 2nd payments can be deferred an additional 12 months each based
on performance (1) • Jones Lang LaSalle and The Staubach Company closed the transaction to merge operations on July 11, 2008 - Staubach to receive guaranteed payments of $613 million, plus additional earn out
opportunities of up to $114 million based on performance milestones - $223 million consideration at close - $123 million paid in cash, $100 million paid in Jones Lang LaSalle stock - $390 million of deferred payments (present value $339 million) - 1 st payment = $78m (August 2010), 2 nd payment = $156m (August 2011) , 3 rd payment = $156m (August 2013) (1) - Approximately $8 million of intangible asset amortization remaining - Less than $2 million anticipated in 2010 - Approximately $2 million of P&L integration expense expected in 2010 Staubach Acquisition - Transaction Overview |
 21 Quarterly service line revenue by region 2009 Revenue Detail Asia Pacific EMEA Americas Leasing Capital Markets ($ in millions) ($ in millions) $112 $176 $30 $37 $36 $70 $17 $24 $26 $42 $90 $121 Q1 Q2 Q3 Q4 $10 $14 $16 $23 $30 $39 $5 $10 $15 $28 $8 $6 Q1 Q2 Q3 Q4 $137 $182 $174 $288 $28 $39 $55 $81 Full Year = $781 Full Year = $203 |
 22 Asia Pacific EMEA Americas Property & Facility Management Project & Development Services ($ in millions) ($ in millions) $52 $80 $30 $29 $33 $44 $61 $63 $68 $74 $43 $51 Q1 Q2 Q3 Q4 $134 $143 $153 $198 $35 $44 $21 $26 $27 $35 $11 $10 $11 $12 $39 $41 Q1 Q2 Q3 Q4 $71 $77 $73 $91 Full Year = $628 Full Year = $312 2009 Revenue Detail Quarterly service line revenue by region |
 23 Asia Pacific EMEA Americas Advisory, Consulting & Other ($ in millions) $29 $31 $24 $29 $29 $40 $12 $15 $17 $21 $21 $29 Q1 Q2 Q3 Q4 $57 $73 $75 $92 Full Year = $297 2009 Revenue Detail Quarterly service line revenue by region |
 24 100% $39.9 Total AUM 17.7% $7.1 Total Public Securities 82.3% $32.8 Total Private Equity 19.1% $7.6 Asia Pacific Private Equity 31.2% $12.4 North American Private Equity 32.0% $12.8 European Private Equity % Assets Under Management Product • Advisory fees • $7.1 billion of assets under management (51% growth over 2008) Public Securities (Firm’s co-investment = $0.1MM) • Advisory fees • Incentive fees • Equity earnings • $16.2 billion of assets under management (11% decline from 2008) Fund Management (Firm’s co-investment = $146.2MM) • Advisory fees • Transaction fees • Incentive fees • Equity earnings • $16.7 billion of assets under management (29% decline from 2008) Separate Account Management (Firm’s co-investment = $21.3MM) Typical Fee Structure Q4 2009 Statistics (1) Description A global business and differentiator LaSalle Investment Management (1) AUM data reported on a one quarter lag |
 25 2009 2008 2007 2009 2008 2007 GAAP Net income (loss) 52.0 $ 41.2 $ 104.7 $ (4.1) $ 83.5 $ 256.5 $ Shares (in 000's) 43,671 35,060 33,102 38,543 34,205 33,578 GAAP Earnings (loss) per share 1.19 $ 1.17 $ 3.16 $ (0.11) $ 2.44 $ 7.64 $ GAAP Net income (loss) 52.0 $ 41.2 $ 104.7 $ (4.1) $ 83.5 $ 256.5 $ Restructuring, net of tax 8.1 15.1 - 35.6 22.8 - Non-cash co-investment charges, net of tax 2.8 3.7 - 38.5 4.4 - Adjusted Net income 62.9 $ 60.0 $ 104.7 $ 70.0 $ 110.7 $ 256.5 $ Shares (in 000's) 43,671 35,060 33,102 40,106 34,205 33,578 Adjusted Earnings per share 1.44 $ 1.71 $ 3.16 $ 1.75 $ 3.24 $ 7.64 $ Three Months Ended Twelve Months Ended December 31, December 31, ($ in millions) Reconciliation of GAAP Net Income (Loss) to Adjusted Net Income Note: Basic shares outstanding are used in the calculation of full-year 2009 GAAP EPS as
the use of dilutive shares outstanding would cause that EPS calculation to be anti-dilutive. |
 26 ($ in millions) Reconciliation of GAAP Net Income (Loss) to EBITDA and Adjusted EBITDA 2009 2008 2007 2009 2008 2007 Net income (loss) 52.0 $ 41.2 $ 104.7 $ (4.1) $ 83.5 $ 256.4 $ Add: Interest expense, net of interest income 11.5 13.3 3.0 55.0 30.6 13.1 Provision for income taxes 15.5 13.5 31.7 5.7 28.7 87.6 Depreciation and amortization 18.7 26.7 16.7 83.3 90.6 55.6 EBITDA 97.7 $ 94.7 $ 156.1 $ 139.9 $ 233.4 $ 412.7 $ Non-cash co-investment charges 3.6 4.9 - 51.3 5.8 - Restructuring 10.8 20.1 - 47.4 30.4 - Adjusted EBITDA 112.1 $ 119.7 $ 156.1 $ 238.6 $ 269.6 $ 412.7 $ Three Months Ended December 31, December 31, Twelve Months Ended |
 27 Chicago, Dallas, Denver, Philadelphia London, Milan, Tokyo New York, San Francisco Beijing, Hong Kong, Moscow Capital Value growth slowing Capital Value growth accelerating Capital Value bottoming out Capital Value falling Asia Pacific EMEA Americas Paris, Sydney, Seoul London, Shanghai Atlanta, Detroit, Singapore Berlin, Los
Angeles, New York, Stockholm Brussels, Milan, Mumbai, Tokyo Amsterdam, Washington DC Chicago, Dallas San Francisco, Toronto Capital Values Investment sales ahead of fundamentals Q4 2008 Q4 2009 Capital Value growth slowing Capital Value falling Capital Value growth accelerating Capital Value bottoming out Amsterdam, Seoul, Stockholm Boston, Brussels, Paris, Toronto Hong Kong, Moscow, Mumbai, Singapore, Shanghai Atlanta, Berlin, Detroit Beijing Sydney Washington DC |
 28 Asia Pacific EMEA Americas Rental growth slowing Rental growth accelerating Rents bottoming out Rental growth falling London, Sydney, Hong Kong Beijing Moscow, Mumbai, Tokyo Shanghai Berlin, Paris, Washington DC Amsterdam, Brussels, Seoul Chicago, Milan, Los
Angeles, Toronto Singapore, Stockholm Atlanta, Detroit Dallas, New York, San Francisco Dallas Seoul Rental growth slowing Rental growth falling Rental growth accelerating Rents bottoming out Detroit Amsterdam, Edinburgh, Frankfurt, Paris, Rome Dublin, Moscow, Shanghai, Stockholm Brussels, Hong Kong, London, Sydney Atlanta, Beijing, Boston, Chicago, Denver, Los Angeles, Madrid, New York, San Francisco Berlin, Toronto Mumbai, Philadelphia Milan, Singapore, Washington DC Tokyo Local and Regional Services Occupier position strengthened in shifting market Q4 2008 Q4 2009 |